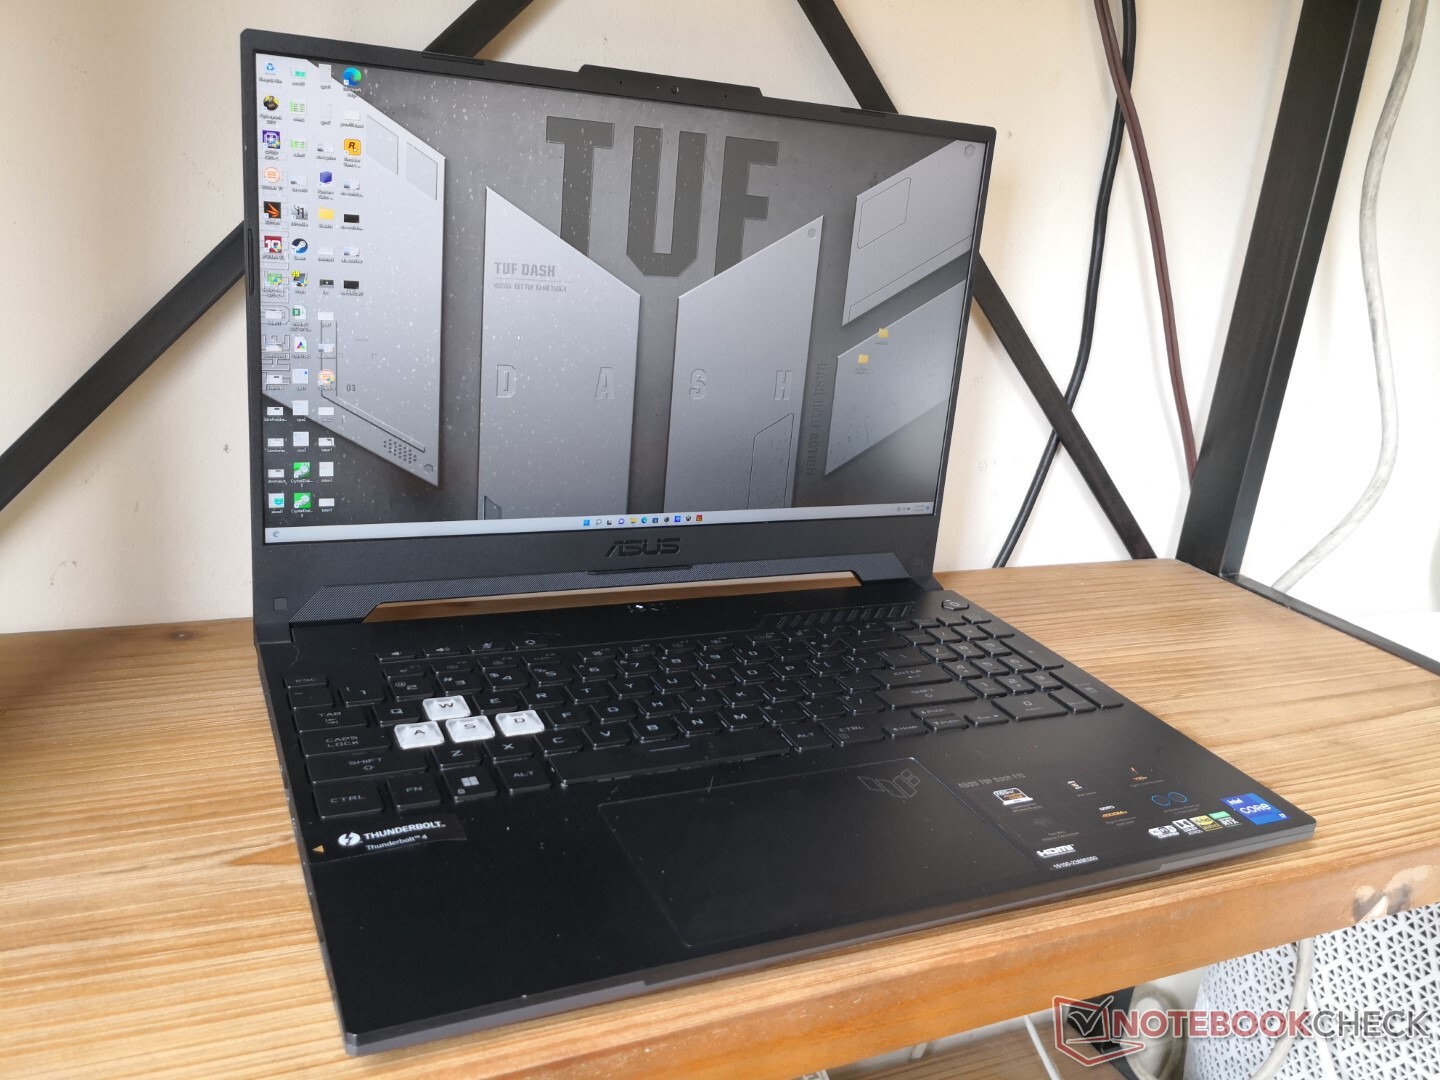
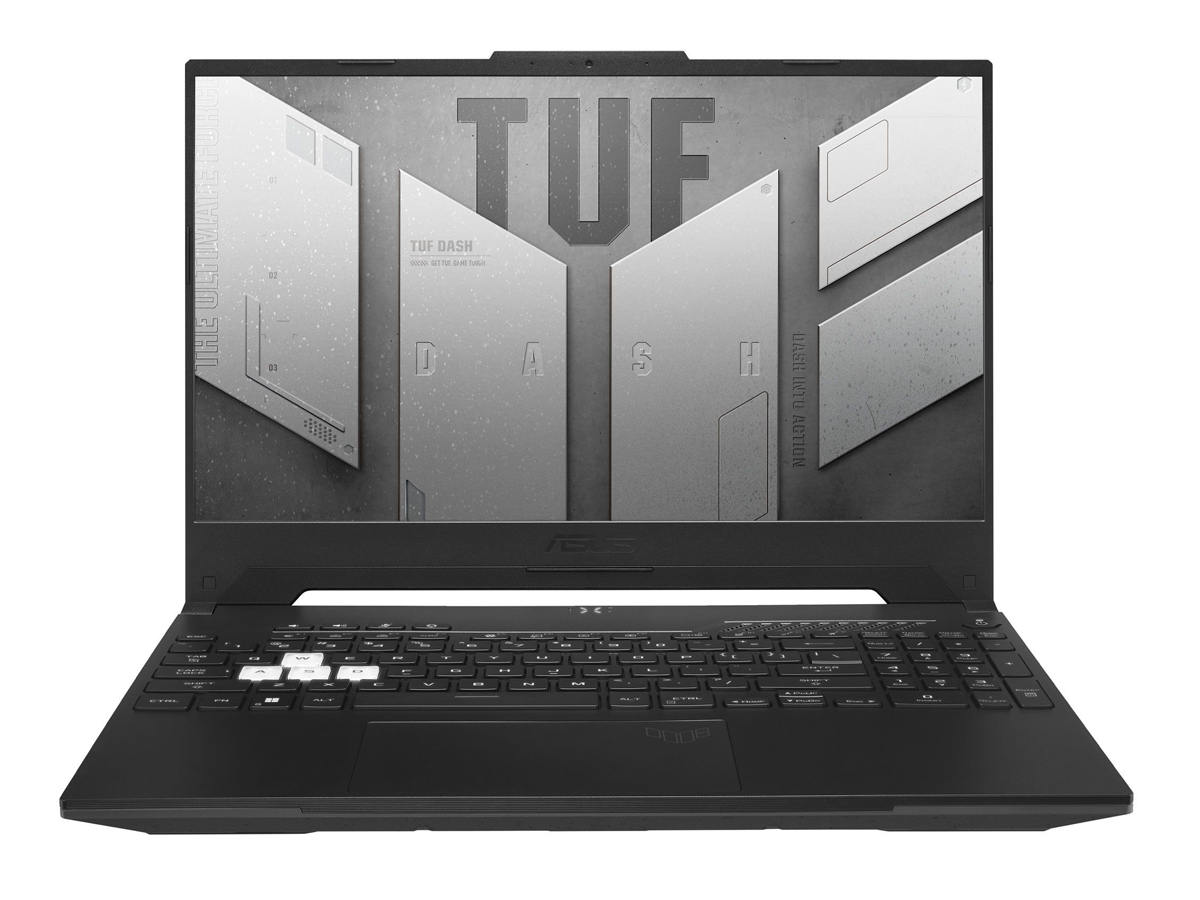
Asus TUF Dash F15 FX517ZC Laptop im Test: 1440p, 165 Hz und der volle P3-Farbraum

Im Gegensatz zur Flaggschiff-Reihe Asus ROG sind Asus-TUF-Geräte für die Einsteiger- bis Mittelklasse gedacht. Luxuriöse Features wie eine RGB-Beleuchtung oder Asus Keystone fehlen hier meist zugunsten erschwinglicheren Preisen. Die Konfigurationsmöglichkeiten des TUF Dash F15 FX517 reichen von der preiswerten GeForce-RTX-3050-GPU (FX517ZC) bis hin zur deutlich besseren RTX 3070 (FX517ZR). In diesem Testbericht beschäftigen wir uns mit der preiswerteren Option mit RTX 3050.
Wir empfehlen Ihnen auch einen Blick auf unseren Testbericht der RTX-3070-Konfiguration, da beide Geräte mit dem gleichen 1.440p-165-Hz-Displaymodell, der gleichen Core i7-12650H-CPU und großteils den gleichen physischen Features ausgestattet sind. Mitstreiter in diesem Bereich sind andere preiswerte Gaming-Laptops wie das Dell G15 5510, das MSI Bravo 15, das Lenovo IdeaPad Gaming 3 15 oder das Gigabyte G5.
Weitere Asus-Testberichte:
Mögliche Mitstreiter im Vergleich
Bew. | Datum | Modell | Gewicht | Dicke | Größe | Auflösung | Preis ab |
|---|---|---|---|---|---|---|---|
| 84.9 % v7 (old) | 08 / 2022 | Asus TUF Dash F15 FX517ZC i7-12650H, GeForce RTX 3050 4GB Laptop GPU | 1.9 kg | 20.7 mm | 15.60" | 2560x1440 | |
| 85.8 % v7 (old) | 07 / 2022 | Asus TUF Dash F15 FX517ZR i7-12650H, GeForce RTX 3070 Laptop GPU | 2 kg | 20.7 mm | 15.60" | 2560x1440 | |
| 81 % v7 (old) | 06 / 2022 | Dell G15 5510 i5-10500H, GeForce RTX 3050 4GB Laptop GPU | 2.5 kg | 23 mm | 15.60" | 1920x1080 | |
| 78.2 % v7 (old) | 04 / 2022 | MSI Bravo 15 B5DD-010US R5 5600H, Radeon RX 5500M | 2.3 kg | 24.95 mm | 15.60" | 1920x1080 | |
| 79.7 % v7 (old) | 03 / 2022 | Lenovo Ideapad Gaming 3 15IHU-82K1002RGE i5-11300H, GeForce RTX 3050 Ti Laptop GPU | 2 kg | 24.2 mm | 15.60" | 1920x1080 | |
| 81.7 % v7 (old) | 11 / 2021 | Gigabyte G5 GD i5-11400H, GeForce RTX 3050 4GB Laptop GPU | 2.1 kg | 31.6 mm | 15.60" | 1920x1080 |
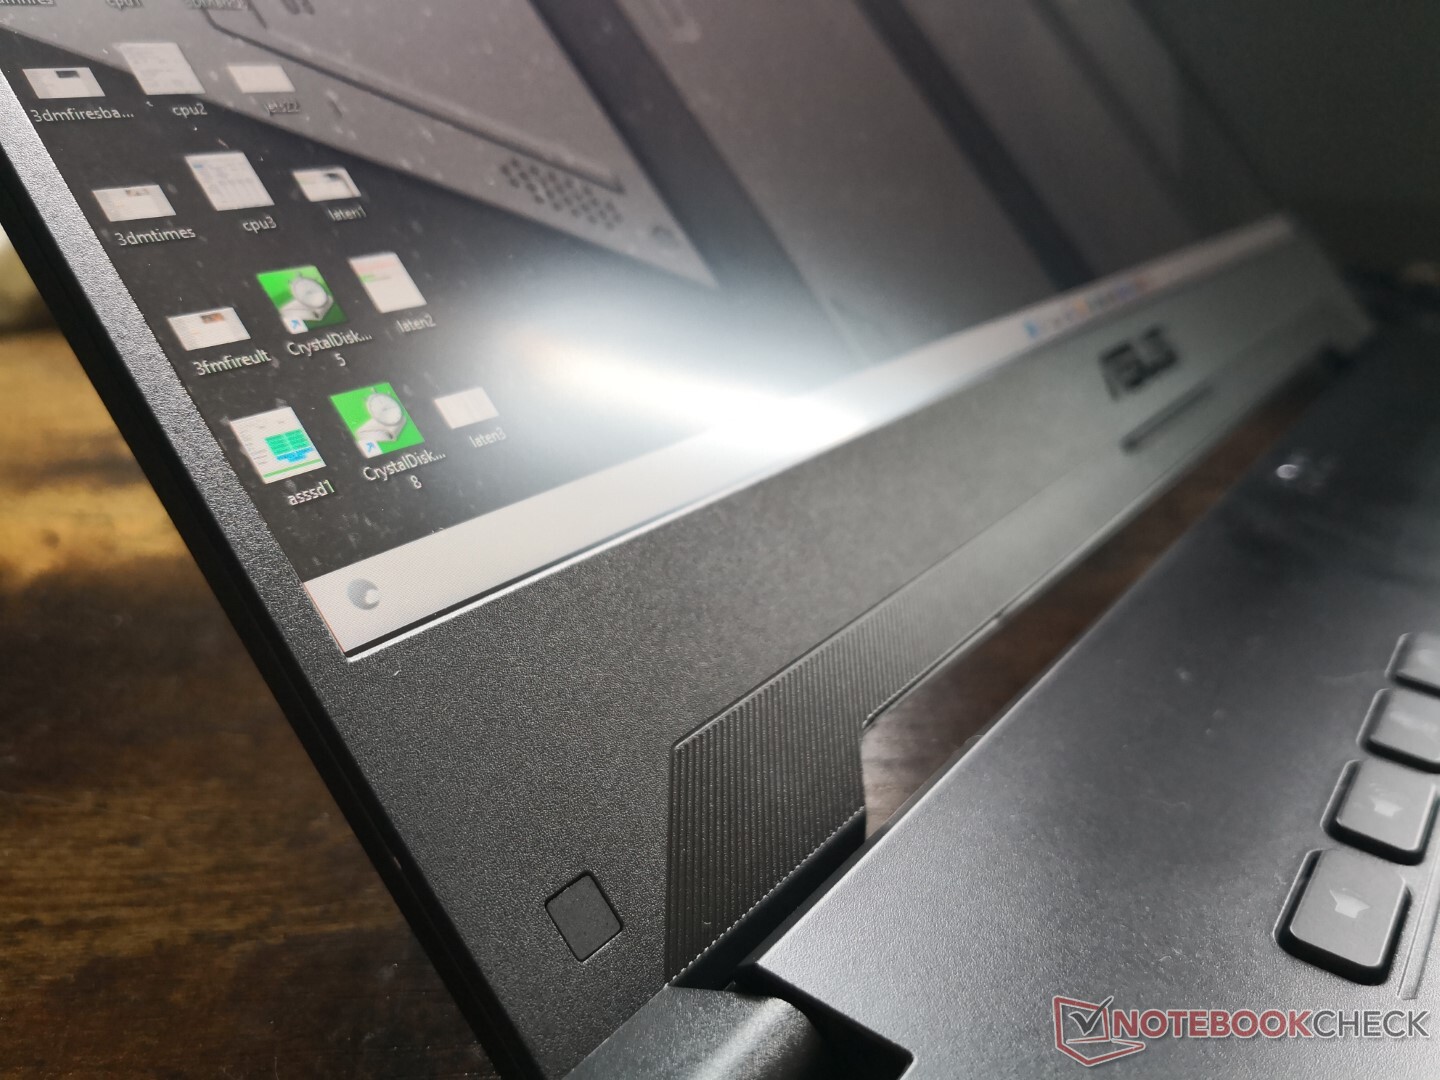
Gehäuse
Ausstattung
Obwohl es zwei USB-C-Anschlüsse gibt, unterstützt nur der vordere das Laden über USB-C. Beide Anschlüsse unterstützen DisplayPort per USB-C.
Kommunikation
Dieses Modell ist nicht mit Wi-Fi 6E ausgestattet, vermutlich aus Kostengründen. Die Leistung ist dennoch für das Zielpublikum (Budget-Gamer) angemessen und ist ausreichend stabil.
| Networking | |
| iperf3 transmit AX12 | |
| Gigabyte G5 GD | |
| Lenovo Ideapad Gaming 3 15IHU-82K1002RGE | |
| MSI Bravo 15 B5DD-010US | |
| iperf3 receive AX12 | |
| Lenovo Ideapad Gaming 3 15IHU-82K1002RGE | |
| Gigabyte G5 GD | |
| MSI Bravo 15 B5DD-010US | |
| iperf3 receive AXE11000 | |
| Dell G15 5510 | |
| Asus TUF Dash F15 FX517ZR | |
| Asus TUF Dash F15 FX517ZC | |
| iperf3 transmit AXE11000 | |
| Asus TUF Dash F15 FX517ZR | |
| Asus TUF Dash F15 FX517ZC | |
Webcam
Die integrierte Webcam bietet die standardmäßigen 1 MP und hat weder einen Privacy Shutter noch IR-Features.


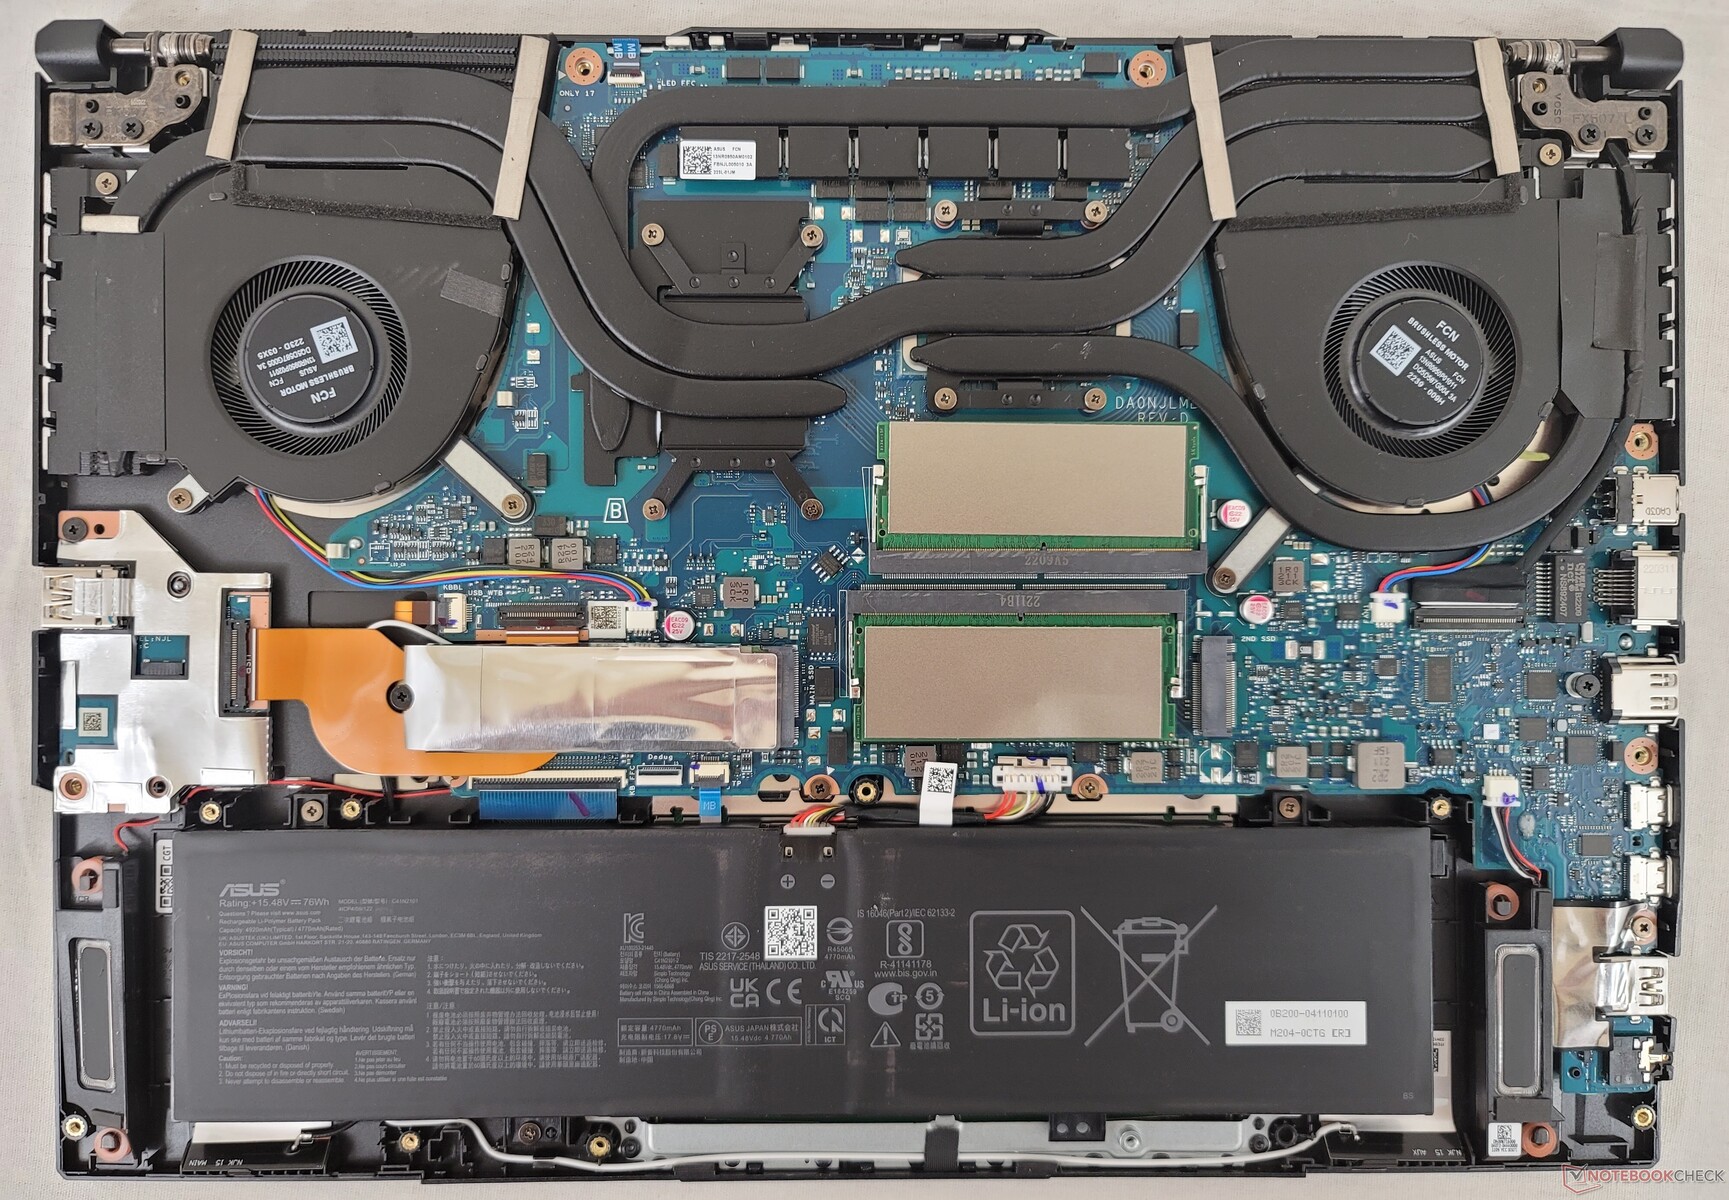
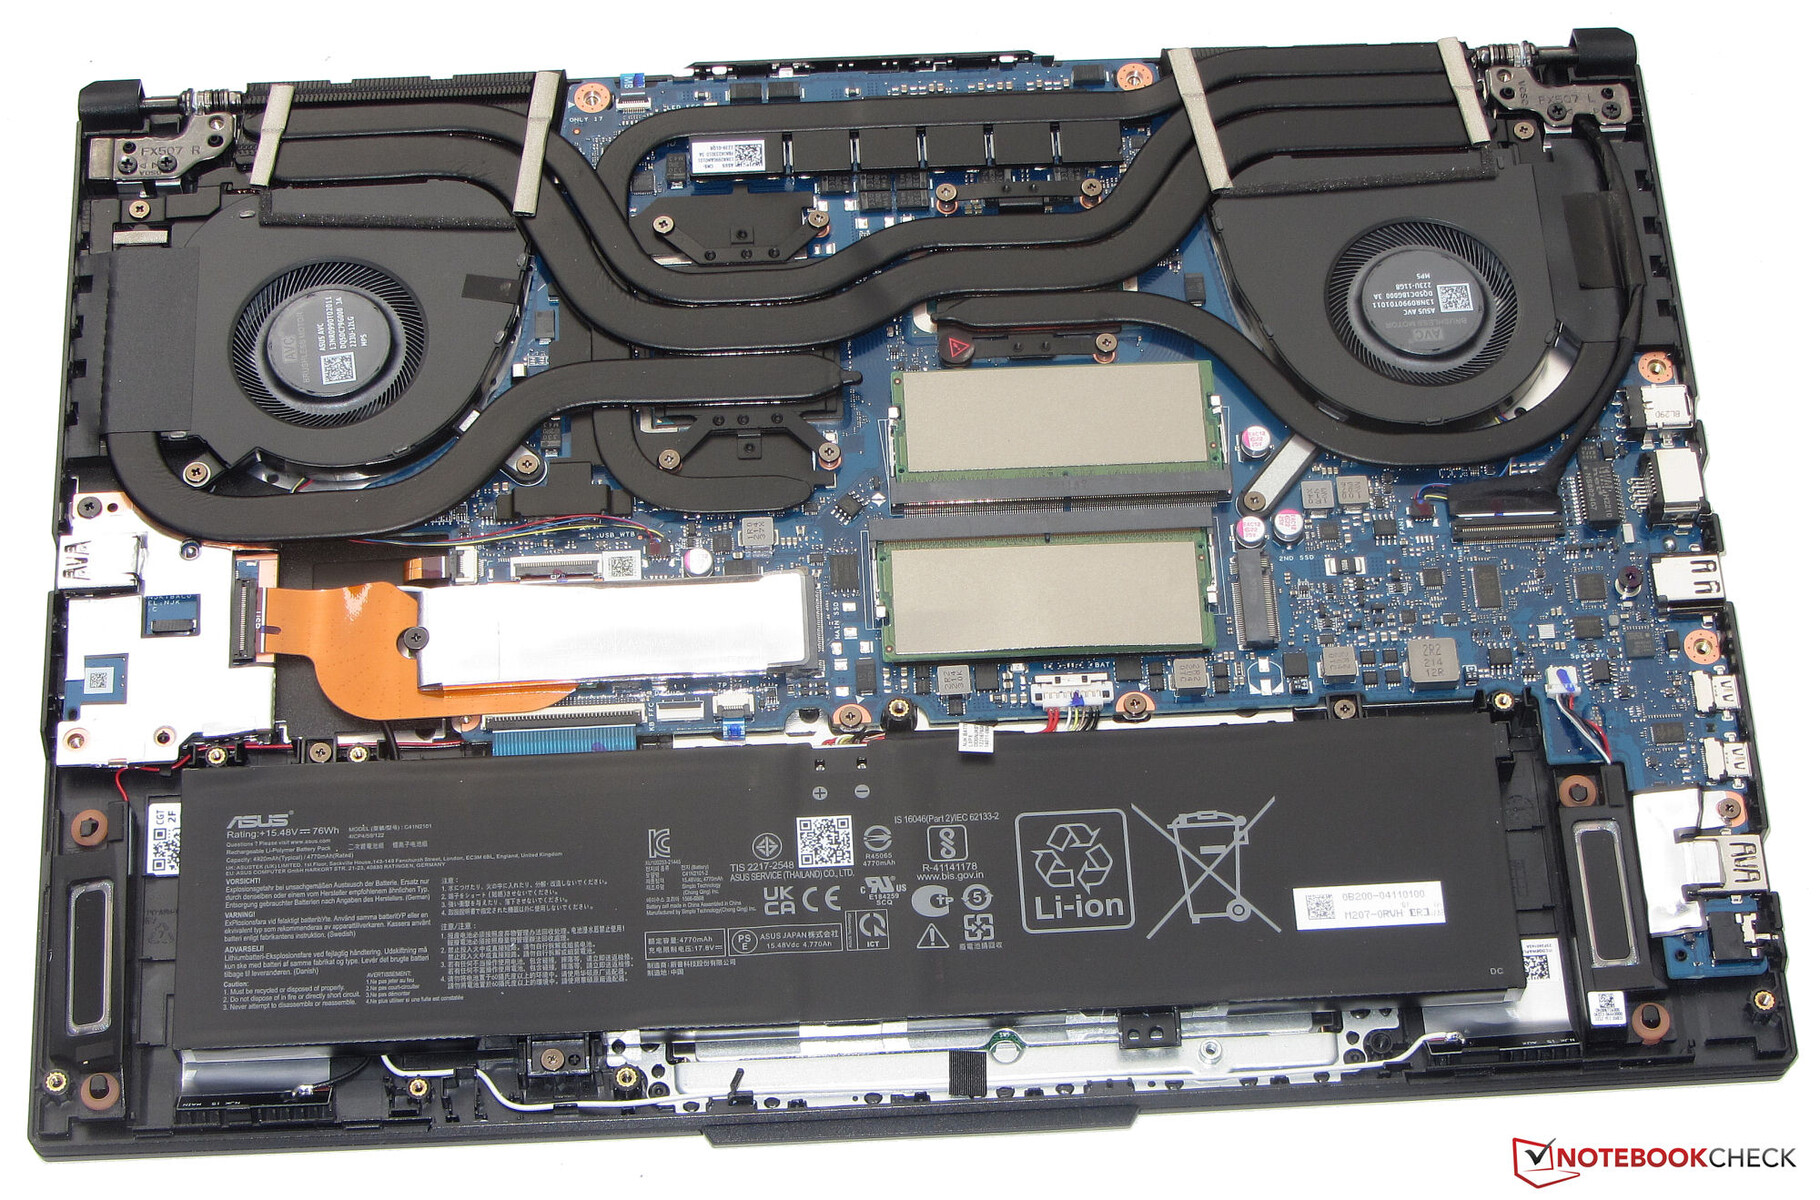
Wartung
Die Abdeckung der Basiseinheit lässt sich sehr einfach mit einem Kreuzschraubenzieher öffnen. Dadurch hat man Zugang zu zwei M.2 Speicherplätzen, 2 SODIMM-Slots und dem WLAN-Modul, das sich unter der ersten M.2 SSD befindet. Im Vergleich zum FX517ZR verwendet unser FX517ZC weniger Kupfer-Heatpipes auf der GPU (siehe unten), was das Gewicht leicht reduziert.
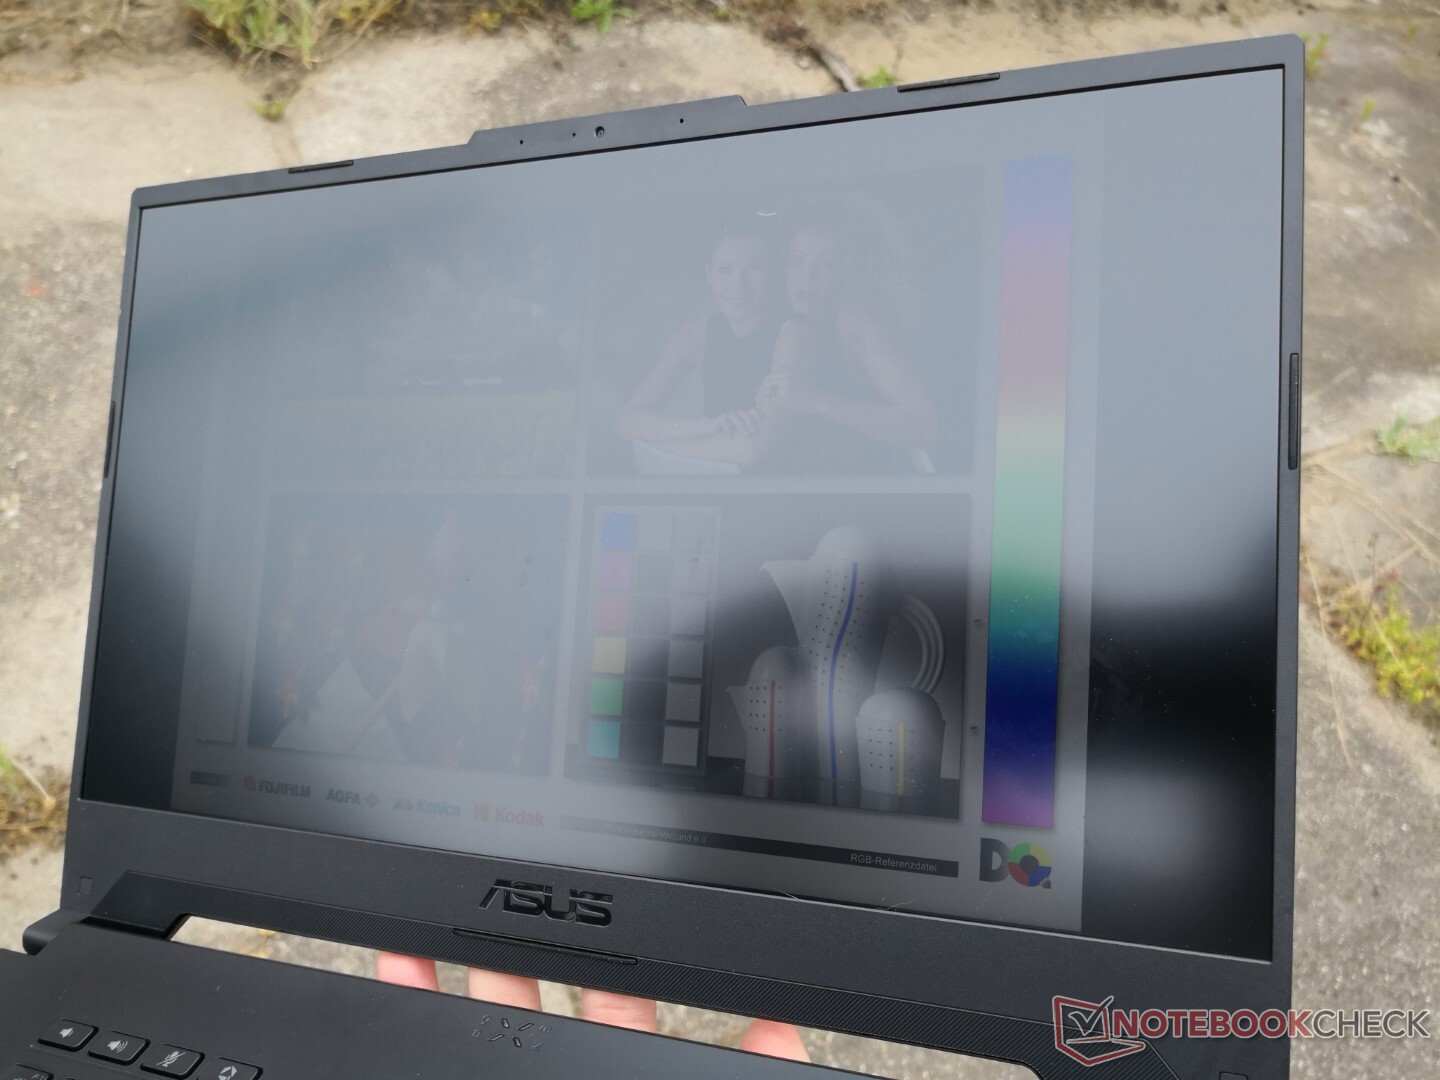
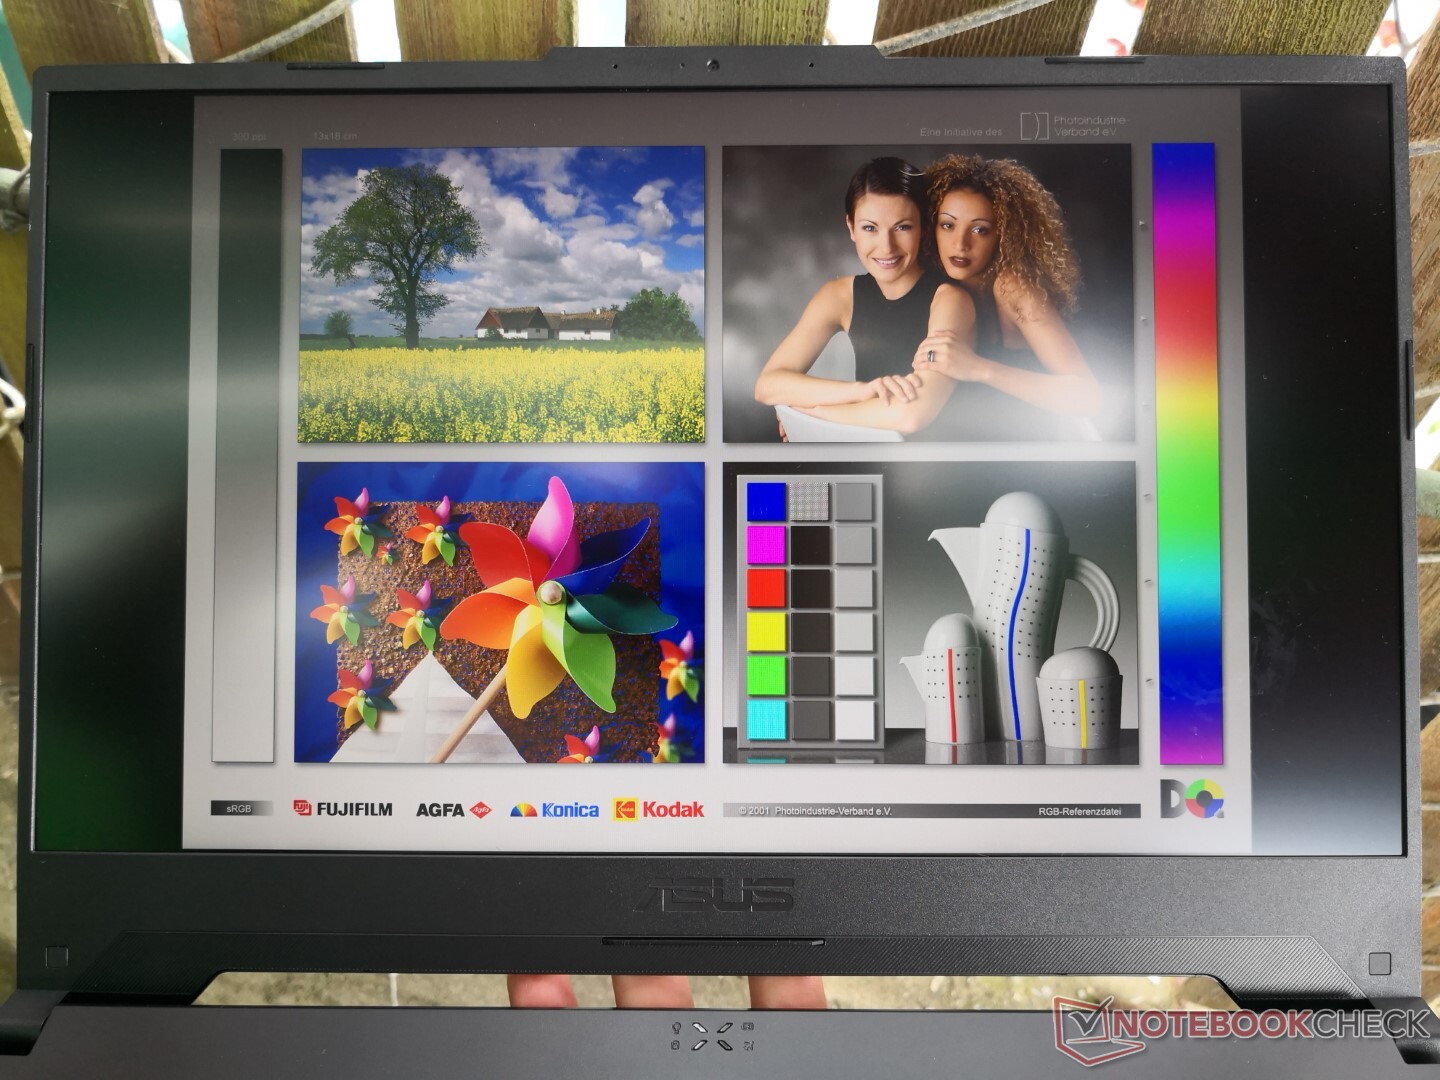
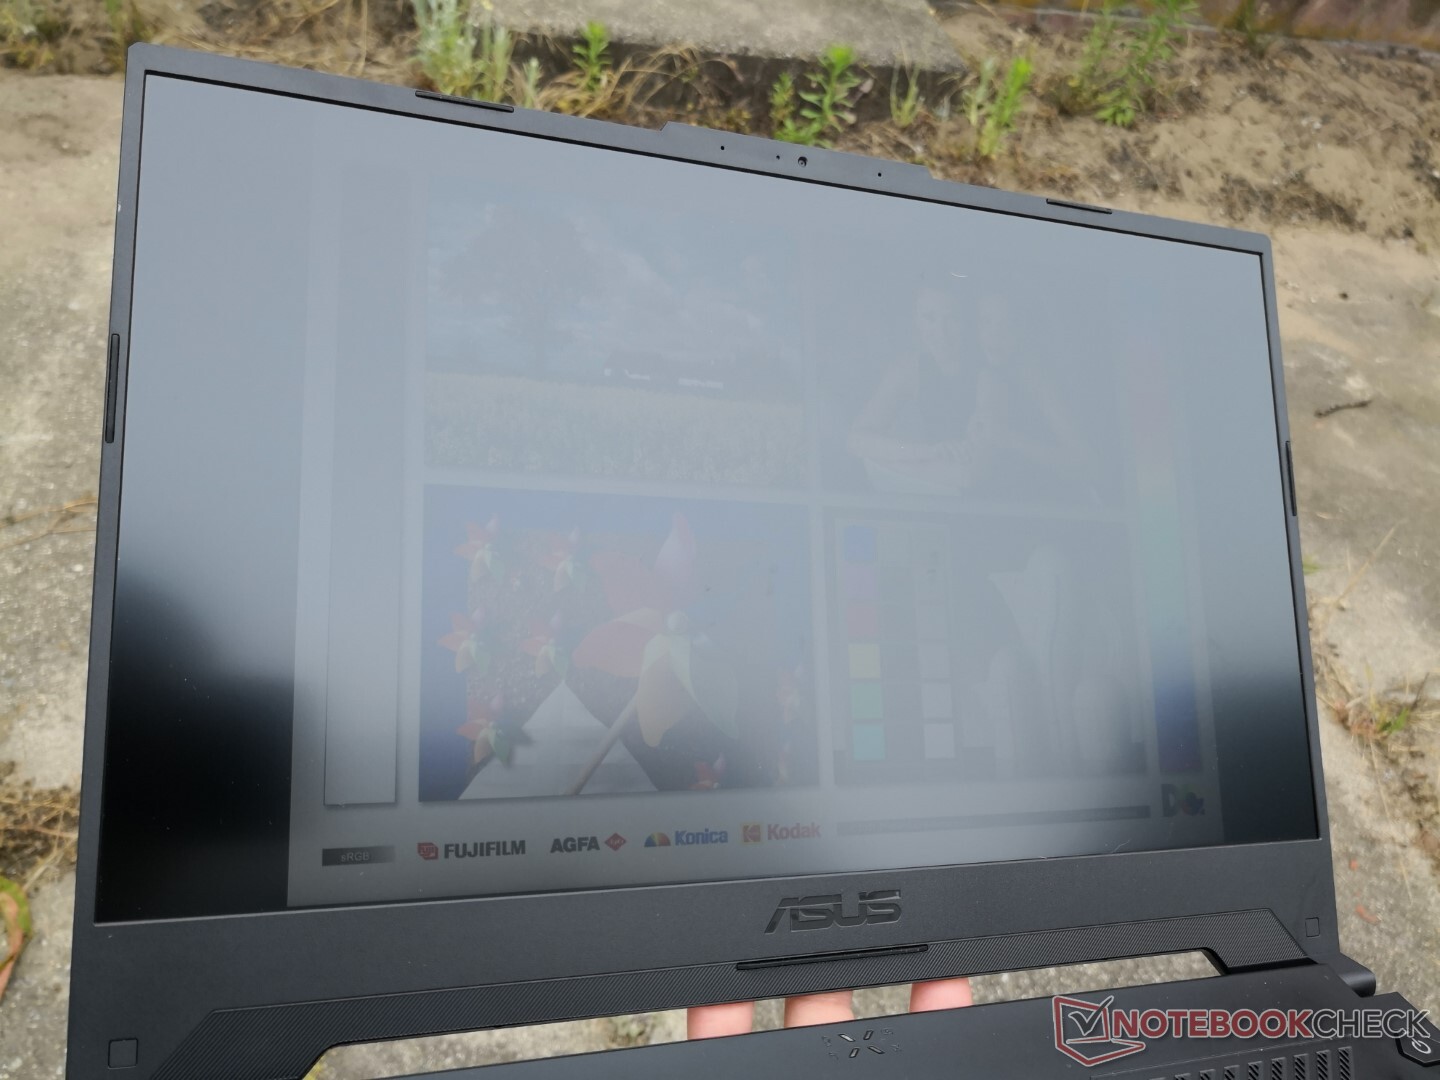
Display


| |||||||||||||||||||||||||
Ausleuchtung: 88 %
Helligkeit Akku: 354.2 cd/m²
Kontrast: 1107:1 (Schwarzwert: 0.32 cd/m²)
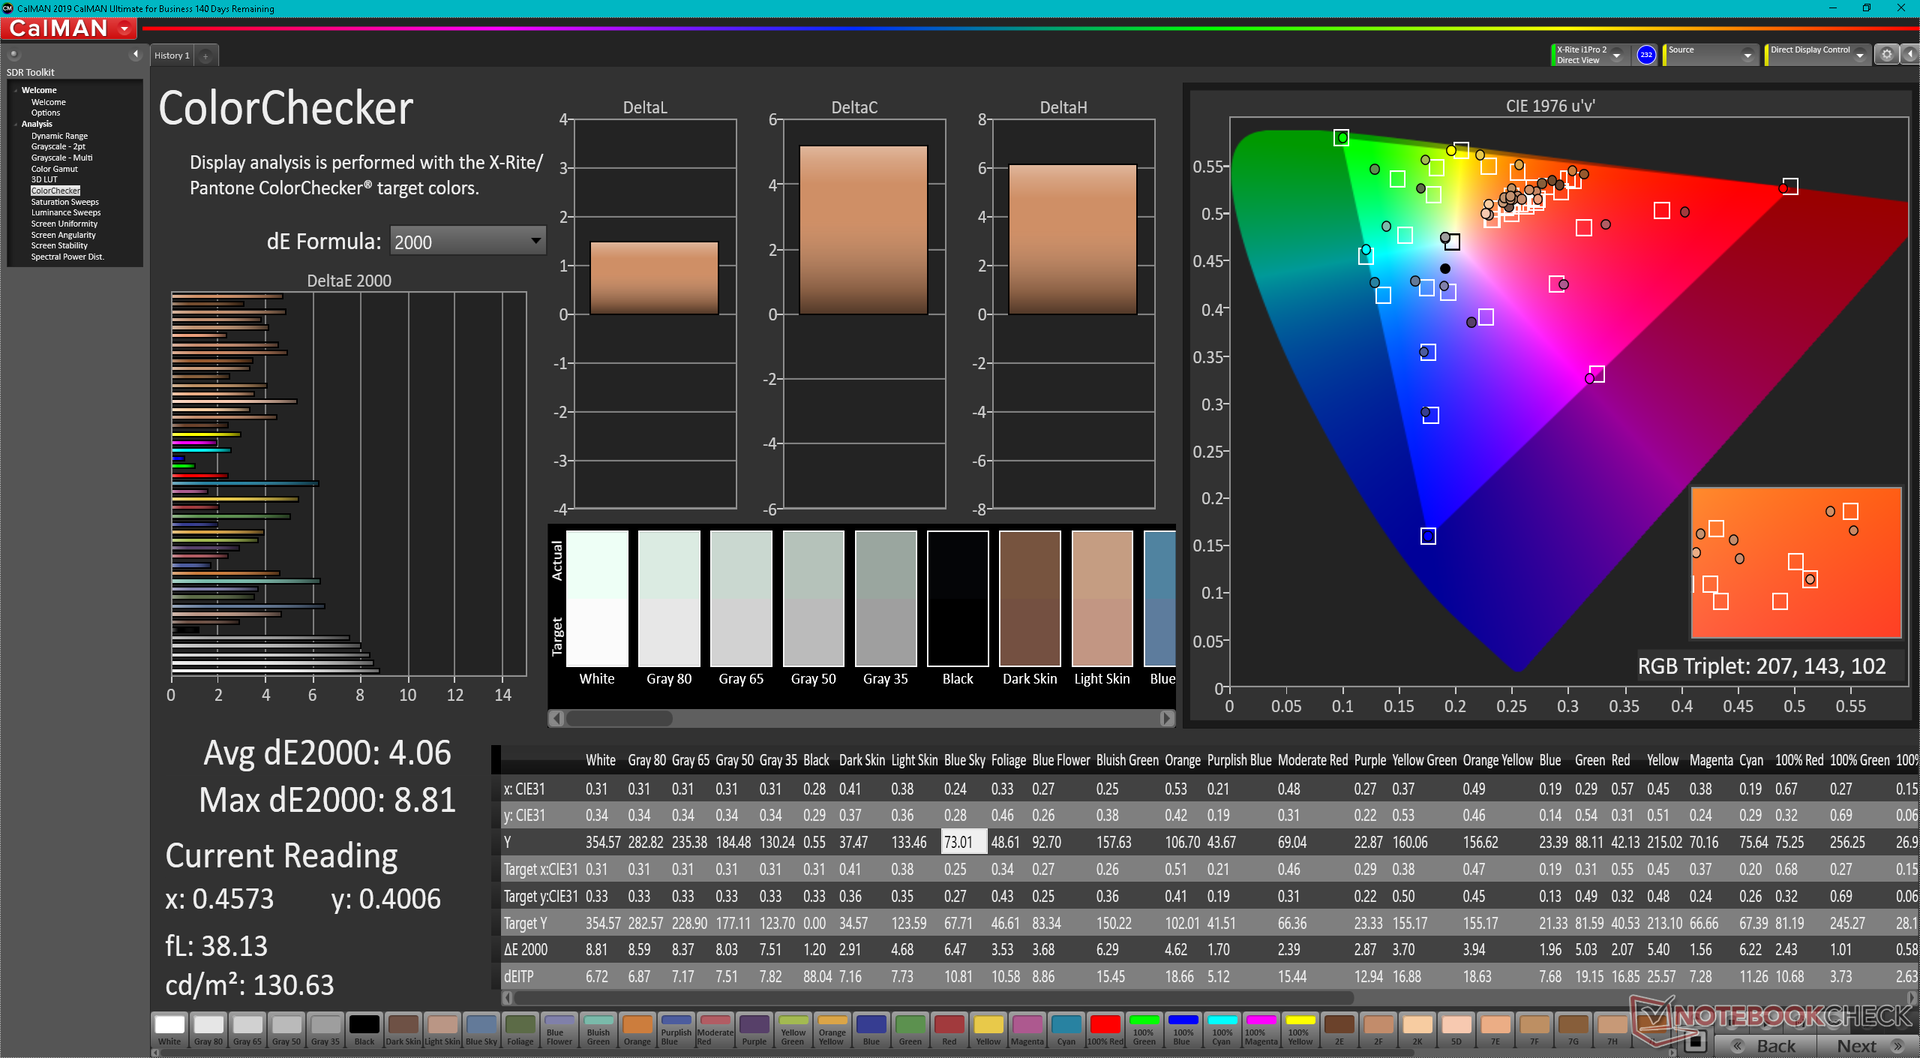
ΔE ColorChecker Calman: 4.06 | ∀{0.5-29.43 Ø4.72}
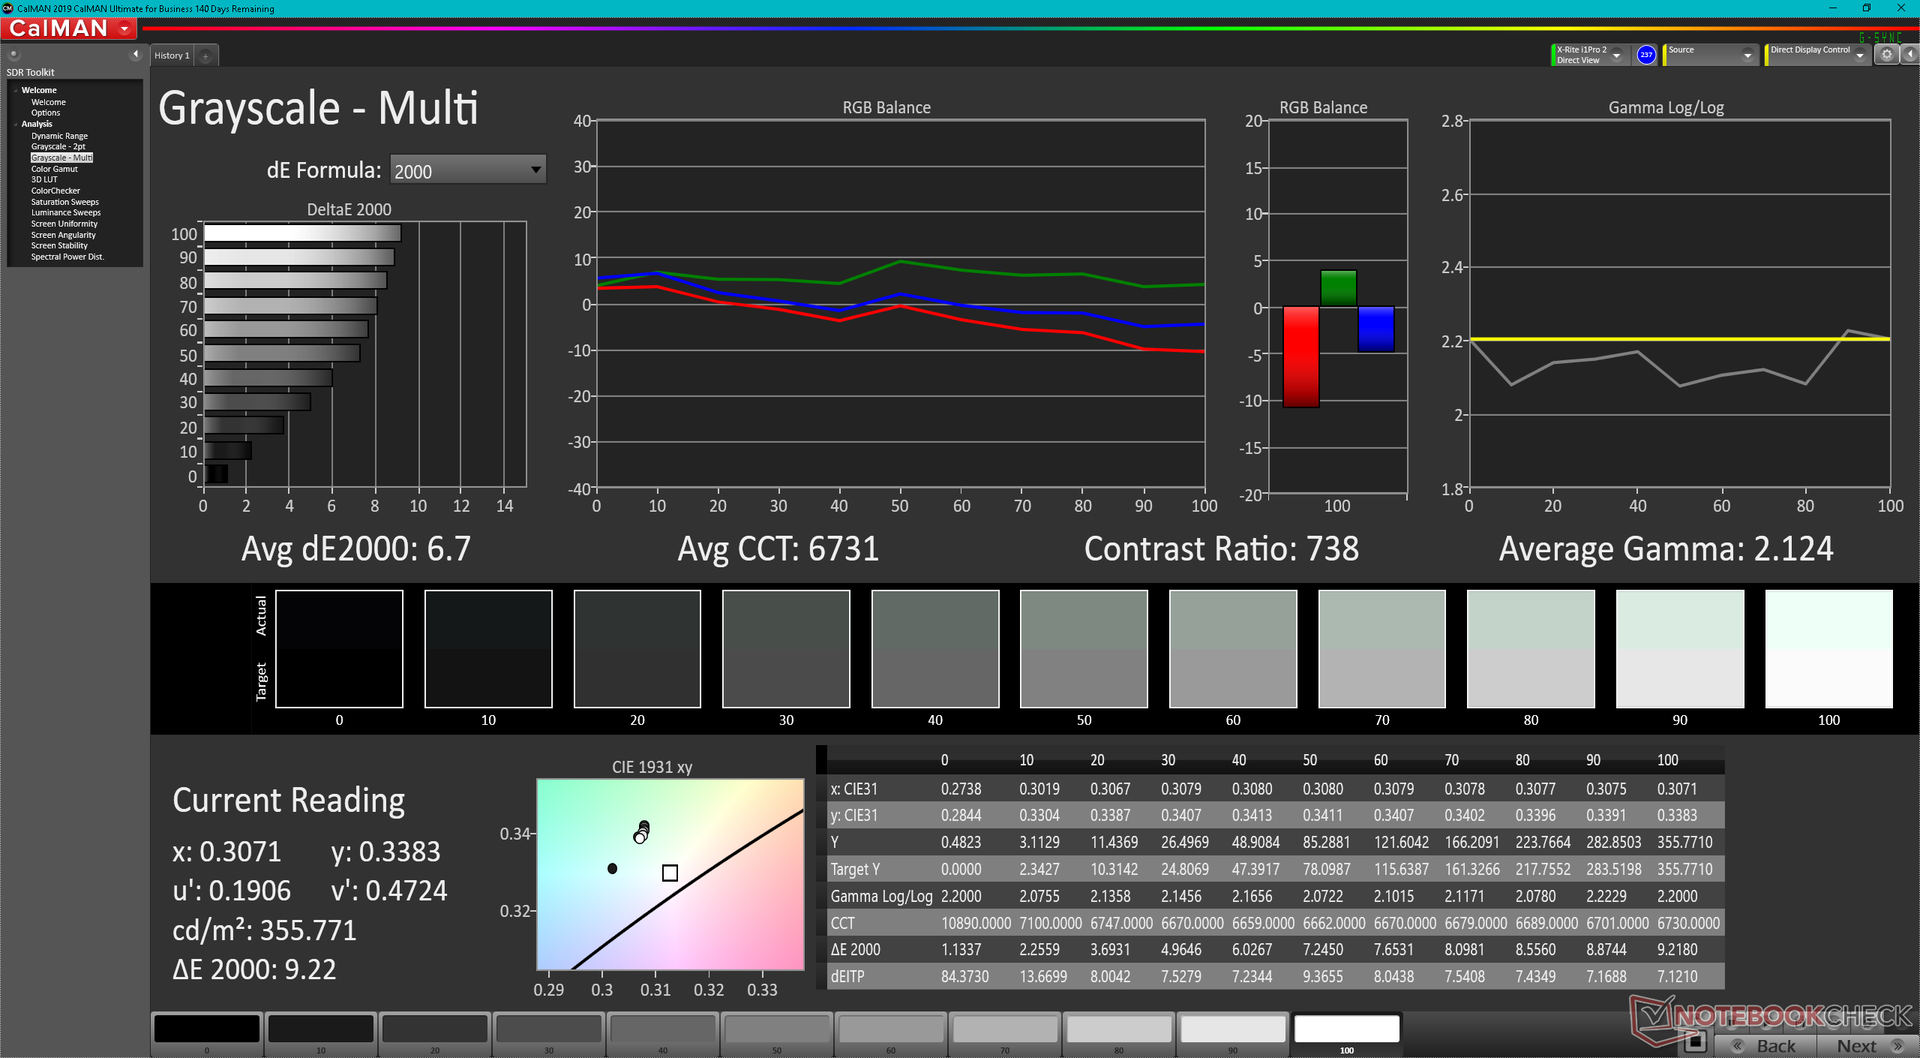
ΔE Greyscale Calman: 6.7 | ∀{0.09-98 Ø4.97}
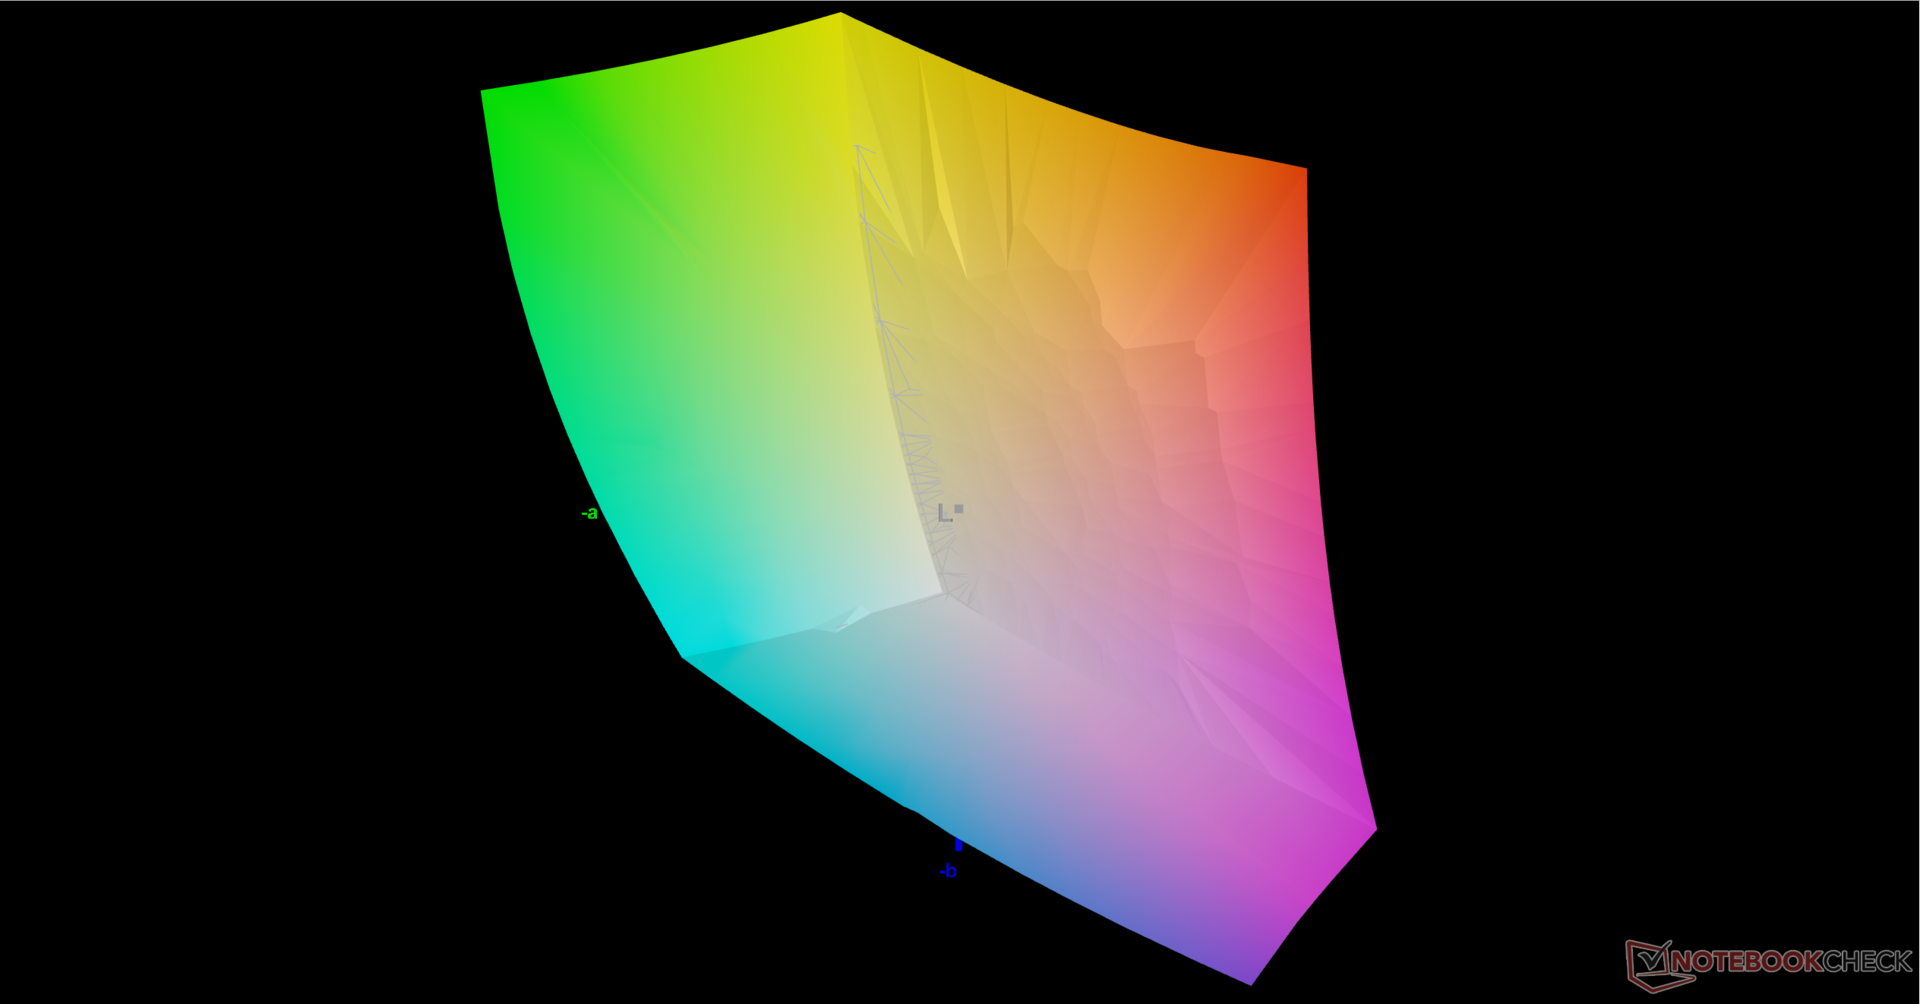
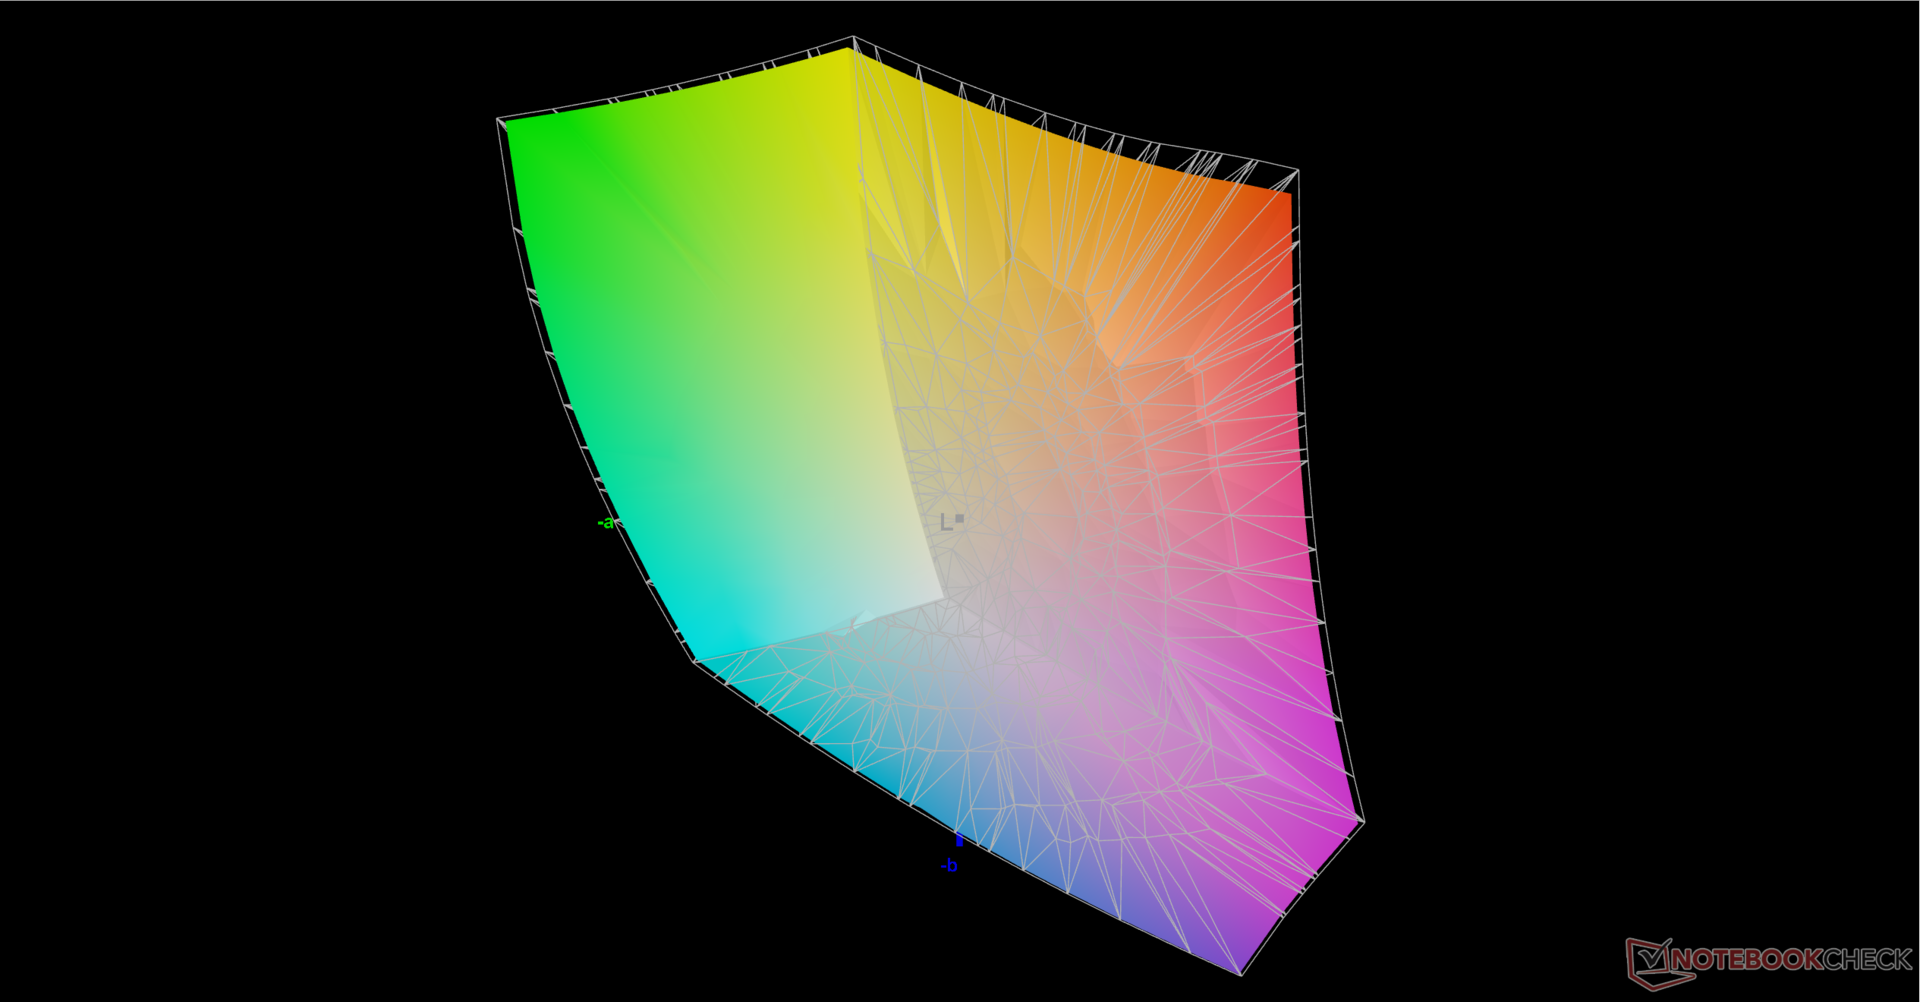
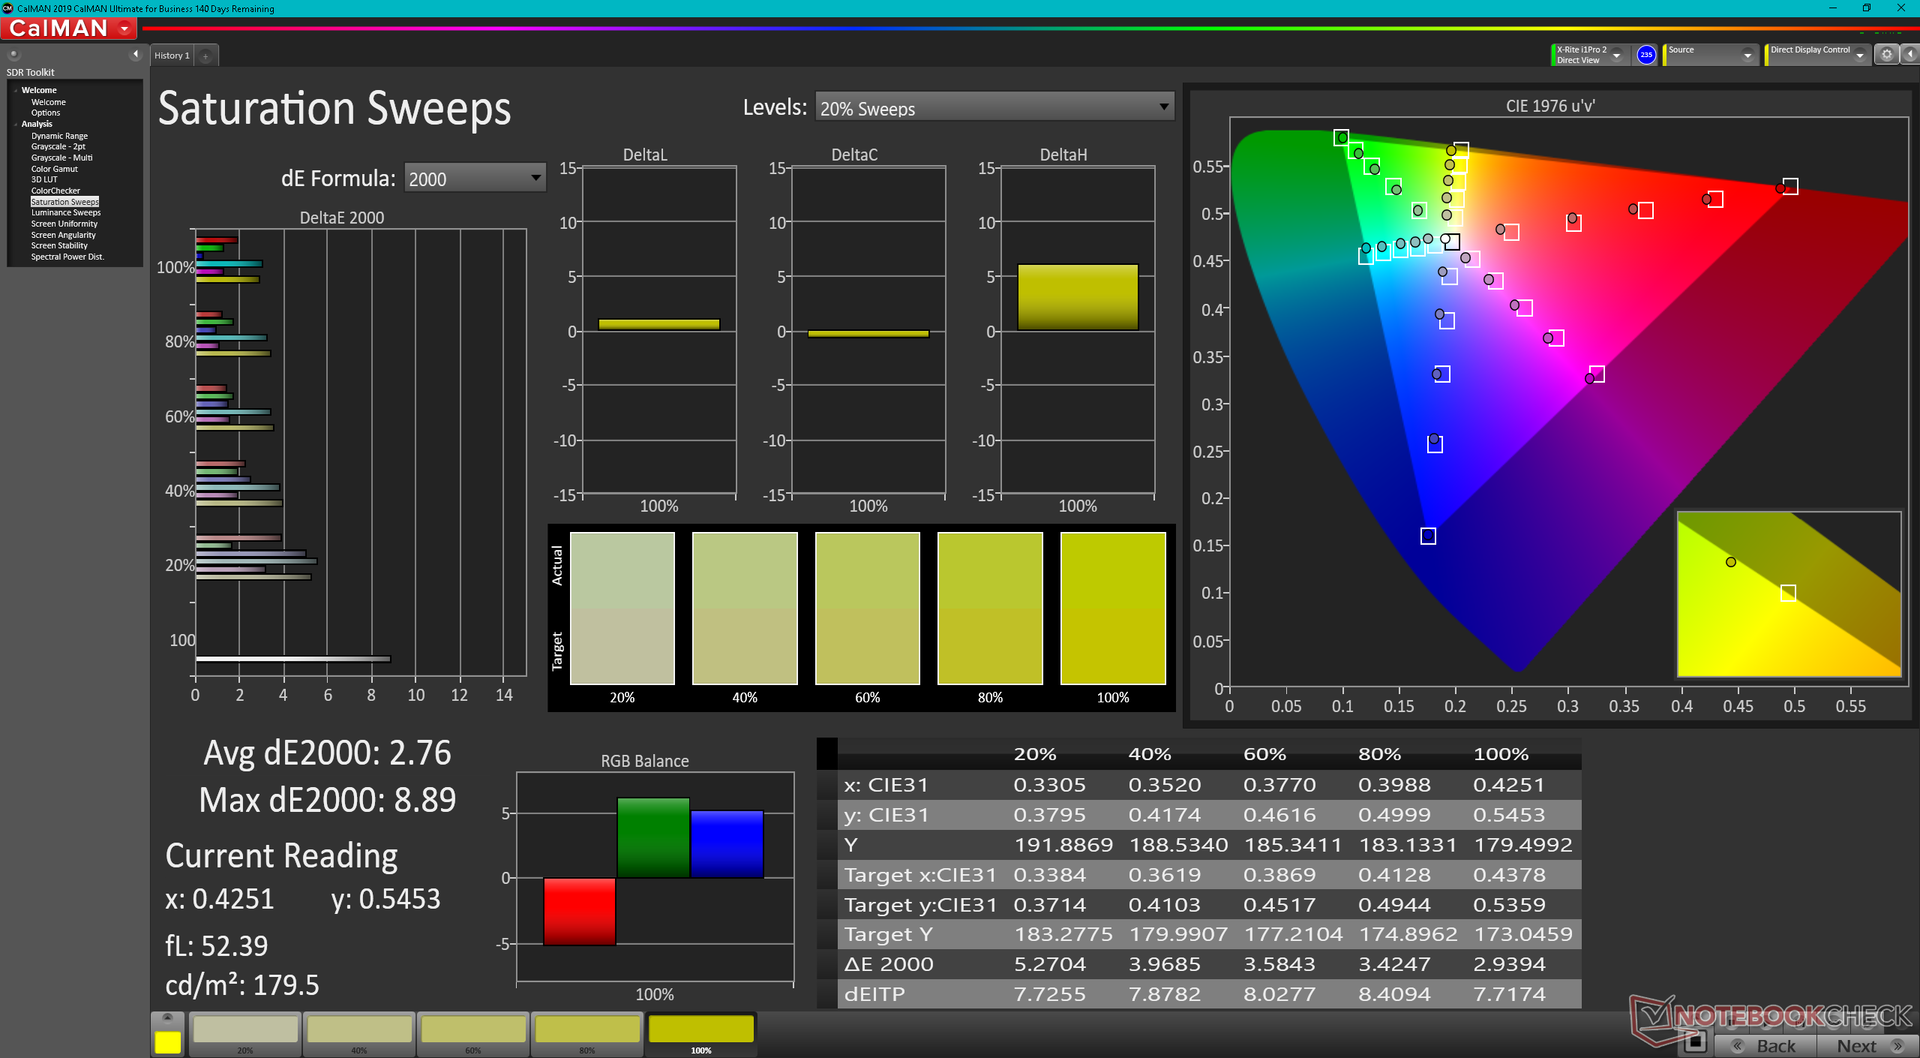
85.1% AdobeRGB 1998 (Argyll 3D)
99.9% sRGB (Argyll 3D)
95.8% Display P3 (Argyll 3D)
Gamma: 2.12
CCT: 6731 K
| Asus TUF Dash F15 FX517ZC BOE CQ NE156QHM-NY1, IPS, 2560x1440, 15.6" | Asus TUF Dash F15 FX517ZR BOE CQ NE156QHM-NY1, IPS, 2560x1440, 15.6" | Dell G15 5510 YMHWH_156HRA (CMN1522), IPS, 1920x1080, 15.6" | MSI Bravo 15 B5DD-010US Chi Mei N156HRA-EA1, IPS, 1920x1080, 15.6" | Lenovo Ideapad Gaming 3 15IHU-82K1002RGE LEN156FHD, IPS, 1920x1080, 15.6" | Gigabyte G5 GD Chi Mei N156HRA-EA1, IPS, 1920x1080, 15.6" | |
|---|---|---|---|---|---|---|
| Display | 1% | -48% | -47% | -50% | -48% | |
| Display P3 Coverage (%) | 95.8 | 98.4 3% | 41.6 -57% | 42.1 -56% | 39.7 -59% | 41.8 -56% |
| sRGB Coverage (%) | 99.9 | 99.9 0% | 62.2 -38% | 62.8 -37% | 59.6 -40% | 62.3 -38% |
| AdobeRGB 1998 Coverage (%) | 85.1 | 85.9 1% | 43 -49% | 43.6 -49% | 41.1 -52% | 43.2 -49% |
| Response Times | 22% | -198% | -162% | -345% | -217% | |
| Response Time Grey 50% / Grey 80% * (ms) | 8.4 ? | 5.6 ? 33% | 33.3 ? -296% | 25.6 ? -205% | 46.4 ? -452% | 34.4 ? -310% |
| Response Time Black / White * (ms) | 10.4 ? | 9.4 ? 10% | 20.7 ? -99% | 22.8 ? -119% | 35.2 ? -238% | 23.2 ? -123% |
| PWM Frequency (Hz) | ||||||
| Bildschirm | 17% | -5% | -25% | -15% | -5% | |
| Helligkeit Bildmitte (cd/m²) | 354.2 | 286 -19% | 288 -19% | 265.1 -25% | 307 -13% | 261 -26% |
| Brightness (cd/m²) | 330 | 266 -19% | 264 -20% | 245 -26% | 292 -12% | 246 -25% |
| Brightness Distribution (%) | 88 | 87 -1% | 88 0% | 87 -1% | 88 0% | 87 -1% |
| Schwarzwert * (cd/m²) | 0.32 | 0.25 22% | 0.24 25% | 0.35 -9% | 0.21 34% | 0.19 41% |
| Kontrast (:1) | 1107 | 1144 3% | 1200 8% | 757 -32% | 1462 32% | 1374 24% |
| Delta E Colorchecker * | 4.06 | 2.14 47% | 3.67 10% | 4.68 -15% | 5.9 -45% | 3.9 4% |
| Colorchecker dE 2000 max. * | 8.81 | 5.22 41% | 18.12 -106% | 19.96 -127% | 21.6 -145% | 19.26 -119% |
| Delta E Graustufen * | 6.7 | 2.8 58% | 2.6 61% | 4.5 33% | 4.9 27% | 2.7 60% |
| Gamma | 2.12 104% | 2.23 99% | 2.187 101% | 2.22 99% | 2.26 97% | 2.248 98% |
| CCT | 6731 97% | 7092 92% | 6971 93% | 6632 98% | 6504 100% | 6828 95% |
| Colorchecker dE 2000 calibrated * | 0.67 | 3.22 | 3.7 | 4.8 | 3.24 | |
| Durchschnitt gesamt (Programm / Settings) | 13% /
14% | -84% /
-45% | -78% /
-51% | -137% /
-74% | -90% /
-48% |
* ... kleinere Werte sind besser
Reaktionszeiten (Response Times) des Displays
| ↔ Reaktionszeiten Schwarz zu Weiß | ||
|---|---|---|
| 10.4 ms ... steigend ↗ und fallend ↘ kombiniert | ↗ 6.4 ms steigend | 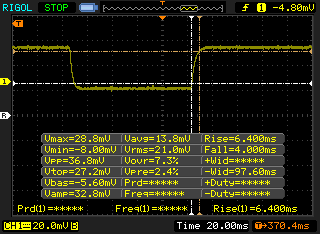 |
| ↘ 4 ms fallend | ||
| Die gemessenen Reaktionszeiten sind gut, für anspruchsvolle Spieler könnten der Bildschirm jedoch zu langsam sein. Im Vergleich rangierten die bei uns getesteten Geräte von 0.1 (Minimum) zu 240 (Maximum) ms. » 28 % aller Screens waren schneller als der getestete. Daher sind die gemessenen Reaktionszeiten besser als der Durchschnitt aller vermessenen Geräte (19.8 ms). | ||
| ↔ Reaktionszeiten 50% Grau zu 80% Grau | ||
| 8.4 ms ... steigend ↗ und fallend ↘ kombiniert | ↗ 4.4 ms steigend | 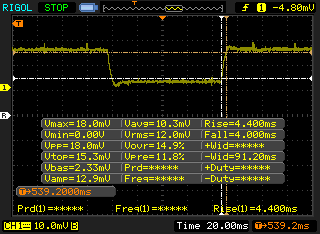 |
| ↘ 4 ms fallend | ||
| Die gemessenen Reaktionszeiten sind kurz wodurch sich der Bildschirm auch für Spiele gut eignen sollte. Im Vergleich rangierten die bei uns getesteten Geräte von 0.165 (Minimum) zu 636 (Maximum) ms. » 22 % aller Screens waren schneller als der getestete. Daher sind die gemessenen Reaktionszeiten besser als der Durchschnitt aller vermessenen Geräte (31 ms). | ||
Bildschirm-Flackern / PWM (Pulse-Width Modulation)
| Flackern / PWM nicht festgestellt |  | ||
Im Vergleich: 52 % aller getesteten Geräte nutzten kein PWM um die Helligkeit zu reduzieren. Wenn PWM eingesetzt wurde, dann bei einer Frequenz von durchschnittlich 7763 (Minimum 5, Maximum 343500) Hz. | |||

Leistung

Testbedingungen
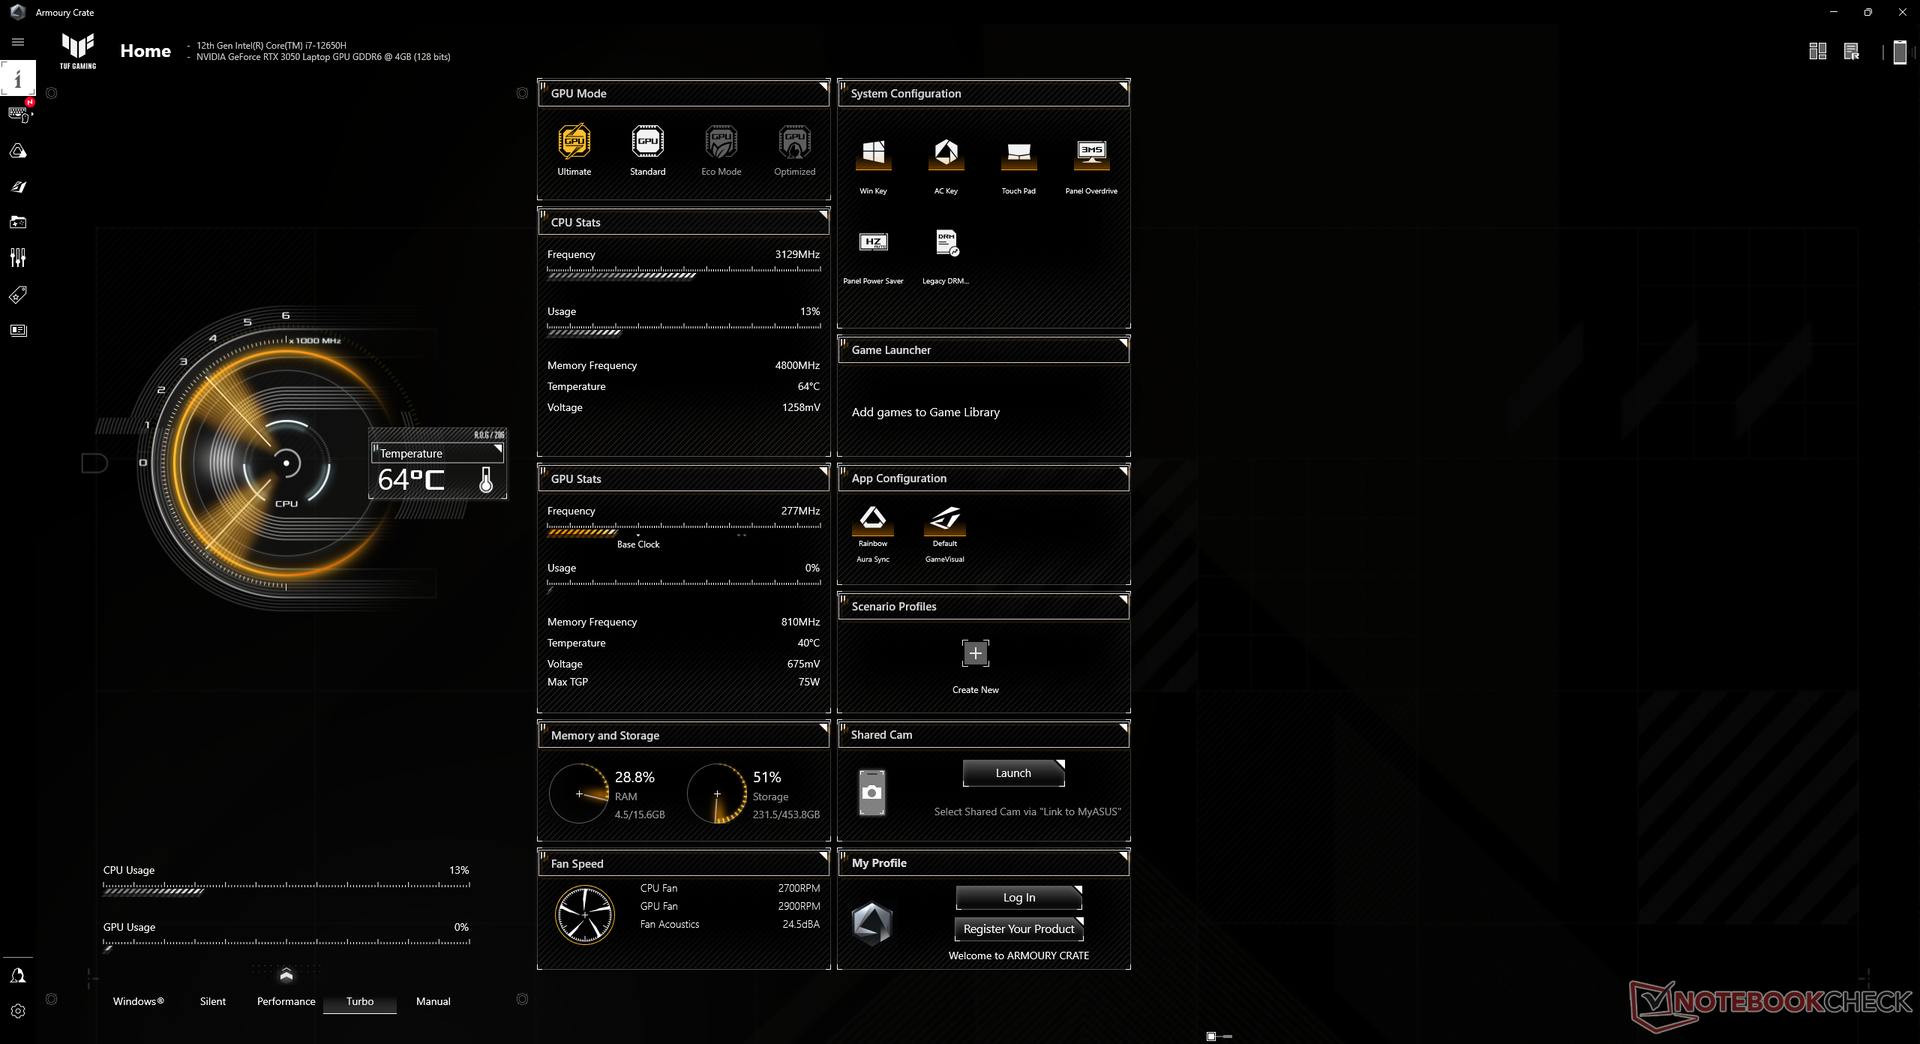
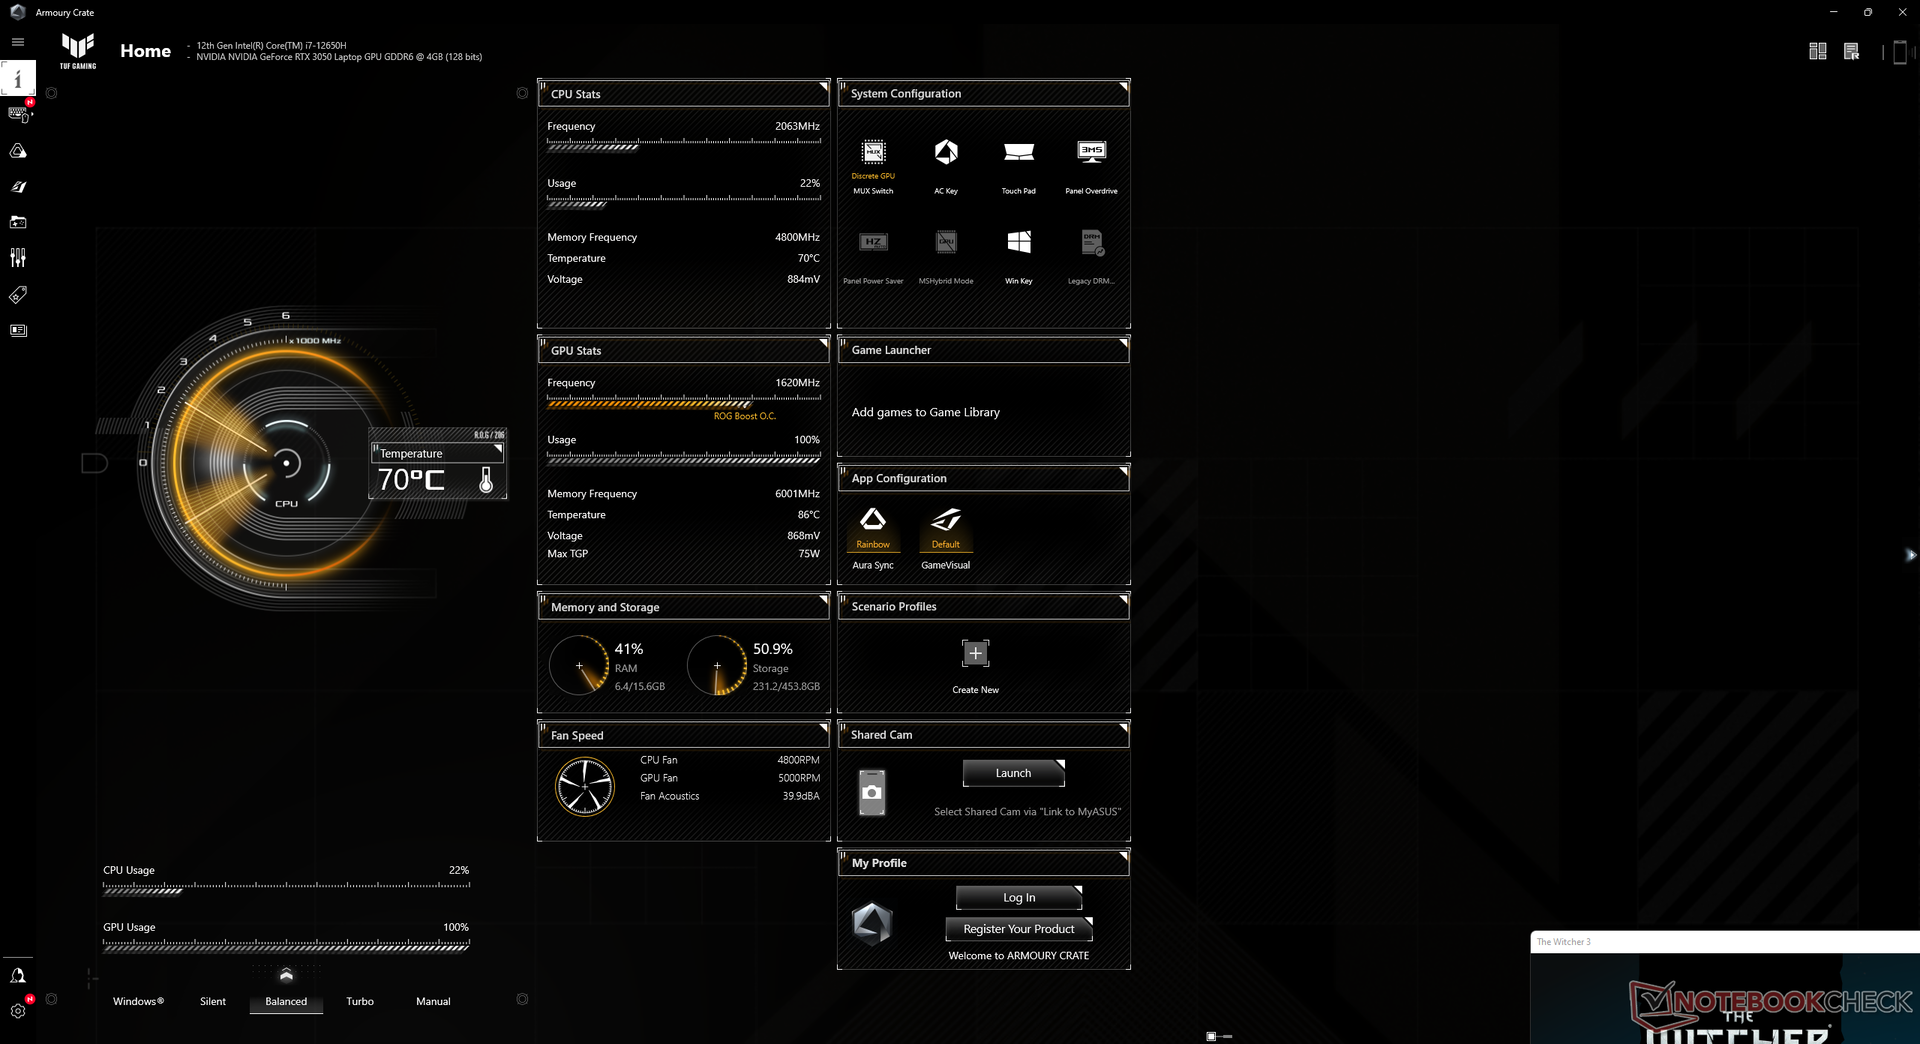
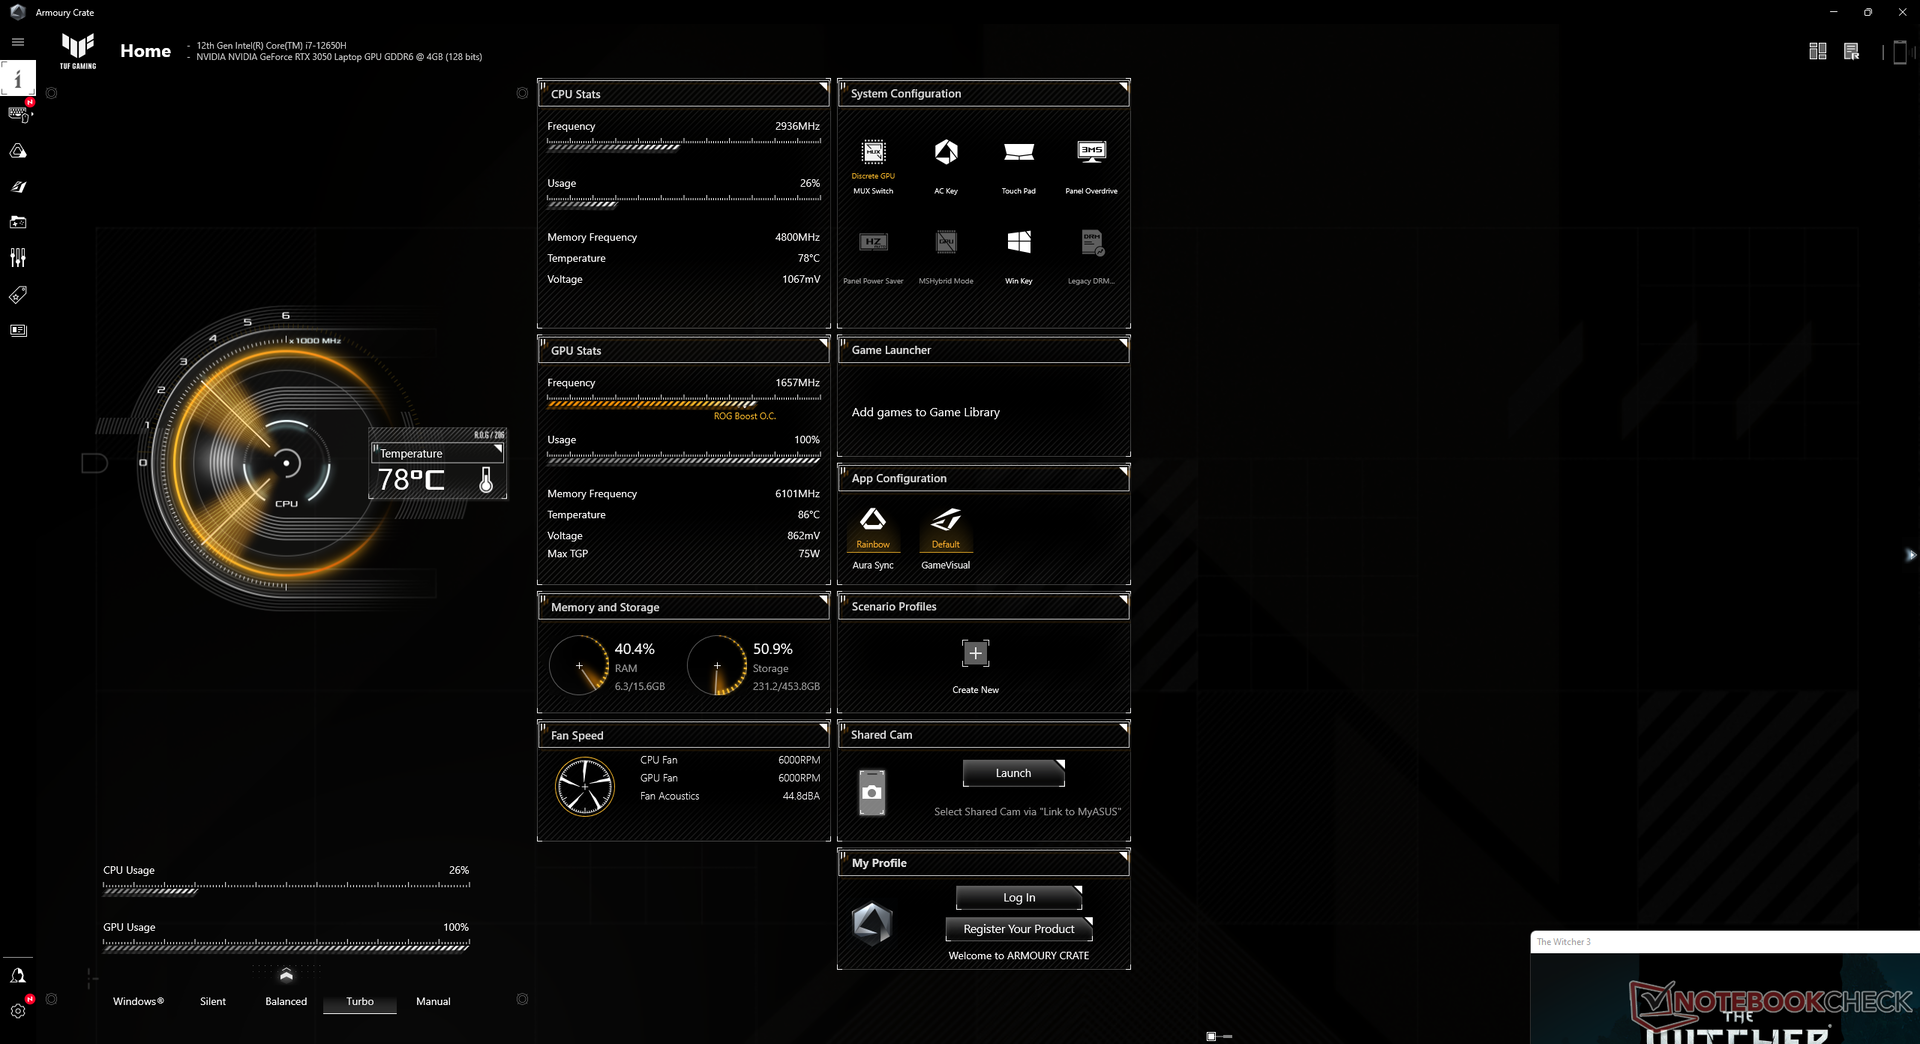
Das Gerät befand sich während der Benchmark-Tests im Turbo-Modus und im Modus "Dedizierte GPU". Nutzer können über die Armoury-Crate-Software zwischen den Grafikmodi MXHybrid/MUX umschalten. Wir empfehlen Nutzern, sich gut mit den Software Armoury Crate vertraut zu machen, da sie als Kommandozentrale für das gesamte Gerät dient. Das Modell hat sogar eine nützliche dedizierte Taste, mit der das Programm gestartet werden kann.

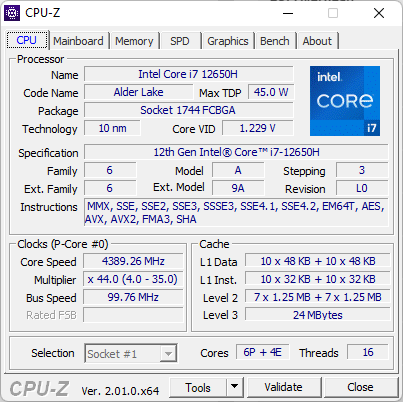
Prozessor
Die CPU-Leistung entspricht in Multi-Thread-Anwendungen der Leistung des Core i7-11800H. Bei Single-Thread-Anwendungen ist unser Gerät 15 bis 20 Prozent schneller unterwegs.
Cinebench R15 Multi-Schleife
Cinebench R23: Multi Core | Single Core
Cinebench R15: CPU Multi 64Bit | CPU Single 64Bit
Blender: v2.79 BMW27 CPU
7-Zip 18.03: 7z b 4 | 7z b 4 -mmt1
Geekbench 5.5: Multi-Core | Single-Core
HWBOT x265 Benchmark v2.2: 4k Preset
LibreOffice : 20 Documents To PDF
R Benchmark 2.5: Overall mean
| Cinebench R20 / CPU (Multi Core) | |
| MSI GE67 HX 12UGS | |
| MSI Vector GP66 12UGS | |
| Acer Nitro 5 AN515-58-72QR | |
| MSI Raider GE66 12UHS | |
| Gigabyte A5 X1 | |
| MSI GP66 Leopard 11UH-028 | |
| Asus TUF Dash F15 FX517ZC | |
| Dell G15 5515 | |
| Durchschnittliche Intel Core i7-12650H (2106 - 6009, n=14) | |
| MSI GS66 Stealth 10UG | |
| MSI Bravo 15 B5DD-010US | |
| Gigabyte G5 GD | |
| Cinebench R20 / CPU (Single Core) | |
| MSI Vector GP66 12UGS | |
| MSI Raider GE66 12UHS | |
| Acer Nitro 5 AN515-58-72QR | |
| Asus TUF Dash F15 FX517ZC | |
| MSI GE67 HX 12UGS | |
| Durchschnittliche Intel Core i7-12650H (552 - 696, n=14) | |
| MSI GP66 Leopard 11UH-028 | |
| Gigabyte A5 X1 | |
| Gigabyte G5 GD | |
| Dell G15 5515 | |
| MSI Bravo 15 B5DD-010US | |
| MSI GS66 Stealth 10UG | |
| Cinebench R23 / Multi Core | |
| MSI GE67 HX 12UGS | |
| MSI Vector GP66 12UGS | |
| Acer Nitro 5 AN515-58-72QR | |
| MSI Raider GE66 12UHS | |
| Gigabyte A5 X1 | |
| MSI GP66 Leopard 11UH-028 | |
| Asus TUF Dash F15 FX517ZC | |
| Dell G15 5515 | |
| Durchschnittliche Intel Core i7-12650H (5362 - 15537, n=14) | |
| MSI GS66 Stealth 10UG | |
| MSI Bravo 15 B5DD-010US | |
| Gigabyte G5 GD | |
| Cinebench R23 / Single Core | |
| MSI Vector GP66 12UGS | |
| MSI Raider GE66 12UHS | |
| Acer Nitro 5 AN515-58-72QR | |
| MSI GE67 HX 12UGS | |
| Asus TUF Dash F15 FX517ZC | |
| Durchschnittliche Intel Core i7-12650H (1428 - 1808, n=14) | |
| MSI GP66 Leopard 11UH-028 | |
| Gigabyte A5 X1 | |
| Gigabyte G5 GD | |
| Dell G15 5515 | |
| MSI Bravo 15 B5DD-010US | |
| MSI GS66 Stealth 10UG | |
| Cinebench R15 / CPU Multi 64Bit | |
| MSI GE67 HX 12UGS | |
| Acer Nitro 5 AN515-58-72QR | |
| MSI Raider GE66 12UHS | |
| MSI Vector GP66 12UGS | |
| Gigabyte A5 X1 | |
| MSI GP66 Leopard 11UH-028 | |
| Dell G15 5515 | |
| Asus TUF Dash F15 FX517ZC | |
| Durchschnittliche Intel Core i7-12650H (753 - 2253, n=14) | |
| MSI GS66 Stealth 10UG | |
| Gigabyte G5 GD | |
| MSI Bravo 15 B5DD-010US | |
| Cinebench R15 / CPU Single 64Bit | |
| MSI Vector GP66 12UGS | |
| MSI Raider GE66 12UHS | |
| Acer Nitro 5 AN515-58-72QR | |
| MSI GE67 HX 12UGS | |
| Asus TUF Dash F15 FX517ZC | |
| Durchschnittliche Intel Core i7-12650H (206 - 261, n=14) | |
| Gigabyte A5 X1 | |
| Dell G15 5515 | |
| MSI GP66 Leopard 11UH-028 | |
| MSI Bravo 15 B5DD-010US | |
| Gigabyte G5 GD | |
| MSI GS66 Stealth 10UG | |
| Blender / v2.79 BMW27 CPU | |
| Gigabyte G5 GD | |
| MSI Bravo 15 B5DD-010US | |
| Durchschnittliche Intel Core i7-12650H (222 - 553, n=15) | |
| MSI GS66 Stealth 10UG | |
| Asus TUF Dash F15 FX517ZC | |
| Dell G15 5515 | |
| MSI GP66 Leopard 11UH-028 | |
| Gigabyte A5 X1 | |
| Acer Nitro 5 AN515-58-72QR | |
| MSI Vector GP66 12UGS | |
| MSI Raider GE66 12UHS | |
| MSI GE67 HX 12UGS | |
| 7-Zip 18.03 / 7z b 4 | |
| MSI GE67 HX 12UGS | |
| MSI Raider GE66 12UHS | |
| MSI Vector GP66 12UGS | |
| Gigabyte A5 X1 | |
| Acer Nitro 5 AN515-58-72QR | |
| Dell G15 5515 | |
| MSI GP66 Leopard 11UH-028 | |
| Asus TUF Dash F15 FX517ZC | |
| Durchschnittliche Intel Core i7-12650H (27053 - 59034, n=14) | |
| MSI Bravo 15 B5DD-010US | |
| MSI GS66 Stealth 10UG | |
| Gigabyte G5 GD | |
| 7-Zip 18.03 / 7z b 4 -mmt1 | |
| MSI Vector GP66 12UGS | |
| MSI Raider GE66 12UHS | |
| Acer Nitro 5 AN515-58-72QR | |
| Gigabyte A5 X1 | |
| Durchschnittliche Intel Core i7-12650H (5265 - 6116, n=14) | |
| MSI GE67 HX 12UGS | |
| MSI GP66 Leopard 11UH-028 | |
| Dell G15 5515 | |
| Asus TUF Dash F15 FX517ZC | |
| MSI Bravo 15 B5DD-010US | |
| MSI GS66 Stealth 10UG | |
| Gigabyte G5 GD | |
| Geekbench 5.5 / Multi-Core | |
| MSI GE67 HX 12UGS | |
| MSI Raider GE66 12UHS | |
| MSI Vector GP66 12UGS | |
| Acer Nitro 5 AN515-58-72QR | |
| Durchschnittliche Intel Core i7-12650H (6478 - 11284, n=16) | |
| Asus TUF Dash F15 FX517ZC | |
| MSI GP66 Leopard 11UH-028 | |
| Gigabyte A5 X1 | |
| MSI GS66 Stealth 10UG | |
| Dell G15 5515 | |
| Gigabyte G5 GD | |
| MSI Bravo 15 B5DD-010US | |
| Geekbench 5.5 / Single-Core | |
| MSI Vector GP66 12UGS | |
| MSI Raider GE66 12UHS | |
| Acer Nitro 5 AN515-58-72QR | |
| MSI GE67 HX 12UGS | |
| Durchschnittliche Intel Core i7-12650H (1590 - 1797, n=16) | |
| Asus TUF Dash F15 FX517ZC | |
| MSI GP66 Leopard 11UH-028 | |
| Gigabyte A5 X1 | |
| Gigabyte G5 GD | |
| Dell G15 5515 | |
| MSI Bravo 15 B5DD-010US | |
| MSI GS66 Stealth 10UG | |
| HWBOT x265 Benchmark v2.2 / 4k Preset | |
| MSI GE67 HX 12UGS | |
| MSI Vector GP66 12UGS | |
| MSI Raider GE66 12UHS | |
| Acer Nitro 5 AN515-58-72QR | |
| Gigabyte A5 X1 | |
| MSI GP66 Leopard 11UH-028 | |
| Dell G15 5515 | |
| Asus TUF Dash F15 FX517ZC | |
| Durchschnittliche Intel Core i7-12650H (6.62 - 17.4, n=16) | |
| MSI GS66 Stealth 10UG | |
| MSI Bravo 15 B5DD-010US | |
| Gigabyte G5 GD | |
| LibreOffice / 20 Documents To PDF | |
| Dell G15 5515 | |
| Gigabyte A5 X1 | |
| MSI Bravo 15 B5DD-010US | |
| Asus TUF Dash F15 FX517ZC | |
| MSI GP66 Leopard 11UH-028 | |
| MSI GS66 Stealth 10UG | |
| Durchschnittliche Intel Core i7-12650H (35.1 - 58.5, n=14) | |
| Gigabyte G5 GD | |
| MSI GE67 HX 12UGS | |
| Acer Nitro 5 AN515-58-72QR | |
| MSI Vector GP66 12UGS | |
| MSI Raider GE66 12UHS | |
| R Benchmark 2.5 / Overall mean | |
| MSI GS66 Stealth 10UG | |
| Gigabyte G5 GD | |
| MSI GP66 Leopard 11UH-028 | |
| MSI Bravo 15 B5DD-010US | |
| Dell G15 5515 | |
| Gigabyte A5 X1 | |
| Asus TUF Dash F15 FX517ZC | |
| Durchschnittliche Intel Core i7-12650H (0.4584 - 0.515, n=14) | |
| MSI GE67 HX 12UGS | |
| Acer Nitro 5 AN515-58-72QR | |
| MSI Raider GE66 12UHS | |
| MSI Vector GP66 12UGS | |
* ... kleinere Werte sind besser
AIDA64: FP32 Ray-Trace | FPU Julia | CPU SHA3 | CPU Queen | FPU SinJulia | FPU Mandel | CPU AES | CPU ZLib | FP64 Ray-Trace | CPU PhotoWorxx
| Performance Rating | |
| Asus TUF Dash F15 FX517ZR | |
| MSI Bravo 15 B5DD-010US | |
| Durchschnittliche Intel Core i7-12650H | |
| Gigabyte G5 GD | |
| Dell G15 5510 | |
| Asus TUF Dash F15 FX517ZC | |
| Lenovo Ideapad Gaming 3 15IHU-82K1002RGE | |
| AIDA64 / FP32 Ray-Trace | |
| Asus TUF Dash F15 FX517ZR | |
| Durchschnittliche Intel Core i7-12650H (5422 - 15620, n=14) | |
| MSI Bravo 15 B5DD-010US | |
| Gigabyte G5 GD | |
| Dell G15 5510 | |
| Lenovo Ideapad Gaming 3 15IHU-82K1002RGE | |
| Asus TUF Dash F15 FX517ZC | |
| AIDA64 / FPU Julia | |
| Asus TUF Dash F15 FX517ZR | |
| MSI Bravo 15 B5DD-010US | |
| Durchschnittliche Intel Core i7-12650H (26386 - 76434, n=14) | |
| Dell G15 5510 | |
| Gigabyte G5 GD | |
| Lenovo Ideapad Gaming 3 15IHU-82K1002RGE | |
| Asus TUF Dash F15 FX517ZC | |
| AIDA64 / CPU SHA3 | |
| Asus TUF Dash F15 FX517ZR | |
| Gigabyte G5 GD | |
| Durchschnittliche Intel Core i7-12650H (1479 - 3244, n=14) | |
| MSI Bravo 15 B5DD-010US | |
| Lenovo Ideapad Gaming 3 15IHU-82K1002RGE | |
| Dell G15 5510 | |
| Asus TUF Dash F15 FX517ZC | |
| AIDA64 / CPU Queen | |
| Asus TUF Dash F15 FX517ZR | |
| Durchschnittliche Intel Core i7-12650H (59278 - 89537, n=14) | |
| MSI Bravo 15 B5DD-010US | |
| Asus TUF Dash F15 FX517ZC | |
| Dell G15 5510 | |
| Gigabyte G5 GD | |
| Lenovo Ideapad Gaming 3 15IHU-82K1002RGE | |
| AIDA64 / FPU SinJulia | |
| MSI Bravo 15 B5DD-010US | |
| Asus TUF Dash F15 FX517ZR | |
| Dell G15 5510 | |
| Durchschnittliche Intel Core i7-12650H (4690 - 8726, n=14) | |
| Gigabyte G5 GD | |
| Asus TUF Dash F15 FX517ZC | |
| Lenovo Ideapad Gaming 3 15IHU-82K1002RGE | |
| AIDA64 / FPU Mandel | |
| MSI Bravo 15 B5DD-010US | |
| Asus TUF Dash F15 FX517ZR | |
| Durchschnittliche Intel Core i7-12650H (15001 - 37738, n=14) | |
| Gigabyte G5 GD | |
| Dell G15 5510 | |
| Lenovo Ideapad Gaming 3 15IHU-82K1002RGE | |
| Asus TUF Dash F15 FX517ZC | |
| AIDA64 / CPU AES | |
| Gigabyte G5 GD | |
| MSI Bravo 15 B5DD-010US | |
| Lenovo Ideapad Gaming 3 15IHU-82K1002RGE | |
| Asus TUF Dash F15 FX517ZR | |
| Durchschnittliche Intel Core i7-12650H (32702 - 92530, n=14) | |
| Asus TUF Dash F15 FX517ZC | |
| Dell G15 5510 | |
| AIDA64 / CPU ZLib | |
| Asus TUF Dash F15 FX517ZR | |
| Durchschnittliche Intel Core i7-12650H (443 - 891, n=14) | |
| Asus TUF Dash F15 FX517ZC | |
| MSI Bravo 15 B5DD-010US | |
| Gigabyte G5 GD | |
| Dell G15 5510 | |
| Lenovo Ideapad Gaming 3 15IHU-82K1002RGE | |
| AIDA64 / FP64 Ray-Trace | |
| Asus TUF Dash F15 FX517ZR | |
| Durchschnittliche Intel Core i7-12650H (3096 - 8448, n=14) | |
| Gigabyte G5 GD | |
| MSI Bravo 15 B5DD-010US | |
| Dell G15 5510 | |
| Lenovo Ideapad Gaming 3 15IHU-82K1002RGE | |
| Asus TUF Dash F15 FX517ZC | |
| AIDA64 / CPU PhotoWorxx | |
| Asus TUF Dash F15 FX517ZR | |
| Durchschnittliche Intel Core i7-12650H (22046 - 44164, n=14) | |
| Asus TUF Dash F15 FX517ZC | |
| Gigabyte G5 GD | |
| MSI Bravo 15 B5DD-010US | |
| Dell G15 5510 | |
| Lenovo Ideapad Gaming 3 15IHU-82K1002RGE | |
Systemleistung
CrossMark: Overall | Productivity | Creativity | Responsiveness
| PCMark 10 / Score | |
| Asus TUF Dash F15 FX517ZC | |
| Durchschnittliche Intel Core i7-12650H, NVIDIA GeForce RTX 3050 4GB Laptop GPU (n=1) | |
| Asus TUF Dash F15 FX517ZR | |
| MSI Bravo 15 B5DD-010US | |
| Gigabyte G5 GD | |
| Lenovo Ideapad Gaming 3 15IHU-82K1002RGE | |
| Dell G15 5510 | |
| PCMark 10 / Essentials | |
| Asus TUF Dash F15 FX517ZC | |
| Durchschnittliche Intel Core i7-12650H, NVIDIA GeForce RTX 3050 4GB Laptop GPU (n=1) | |
| Asus TUF Dash F15 FX517ZR | |
| MSI Bravo 15 B5DD-010US | |
| Gigabyte G5 GD | |
| Lenovo Ideapad Gaming 3 15IHU-82K1002RGE | |
| Dell G15 5510 | |
| PCMark 10 / Productivity | |
| Asus TUF Dash F15 FX517ZR | |
| Asus TUF Dash F15 FX517ZC | |
| Durchschnittliche Intel Core i7-12650H, NVIDIA GeForce RTX 3050 4GB Laptop GPU (n=1) | |
| Lenovo Ideapad Gaming 3 15IHU-82K1002RGE | |
| MSI Bravo 15 B5DD-010US | |
| Gigabyte G5 GD | |
| Dell G15 5510 | |
| PCMark 10 / Digital Content Creation | |
| Asus TUF Dash F15 FX517ZC | |
| Durchschnittliche Intel Core i7-12650H, NVIDIA GeForce RTX 3050 4GB Laptop GPU (n=1) | |
| Asus TUF Dash F15 FX517ZR | |
| MSI Bravo 15 B5DD-010US | |
| Gigabyte G5 GD | |
| Dell G15 5510 | |
| Lenovo Ideapad Gaming 3 15IHU-82K1002RGE | |
| CrossMark / Overall | |
| Asus TUF Dash F15 FX517ZR | |
| Asus TUF Dash F15 FX517ZC | |
| Durchschnittliche Intel Core i7-12650H, NVIDIA GeForce RTX 3050 4GB Laptop GPU (n=1) | |
| Lenovo Ideapad Gaming 3 15IHU-82K1002RGE | |
| CrossMark / Productivity | |
| Asus TUF Dash F15 FX517ZC | |
| Durchschnittliche Intel Core i7-12650H, NVIDIA GeForce RTX 3050 4GB Laptop GPU (n=1) | |
| Asus TUF Dash F15 FX517ZR | |
| Lenovo Ideapad Gaming 3 15IHU-82K1002RGE | |
| CrossMark / Creativity | |
| Asus TUF Dash F15 FX517ZR | |
| Asus TUF Dash F15 FX517ZC | |
| Durchschnittliche Intel Core i7-12650H, NVIDIA GeForce RTX 3050 4GB Laptop GPU (n=1) | |
| Lenovo Ideapad Gaming 3 15IHU-82K1002RGE | |
| CrossMark / Responsiveness | |
| Asus TUF Dash F15 FX517ZC | |
| Durchschnittliche Intel Core i7-12650H, NVIDIA GeForce RTX 3050 4GB Laptop GPU (n=1) | |
| Asus TUF Dash F15 FX517ZR | |
| Lenovo Ideapad Gaming 3 15IHU-82K1002RGE | |
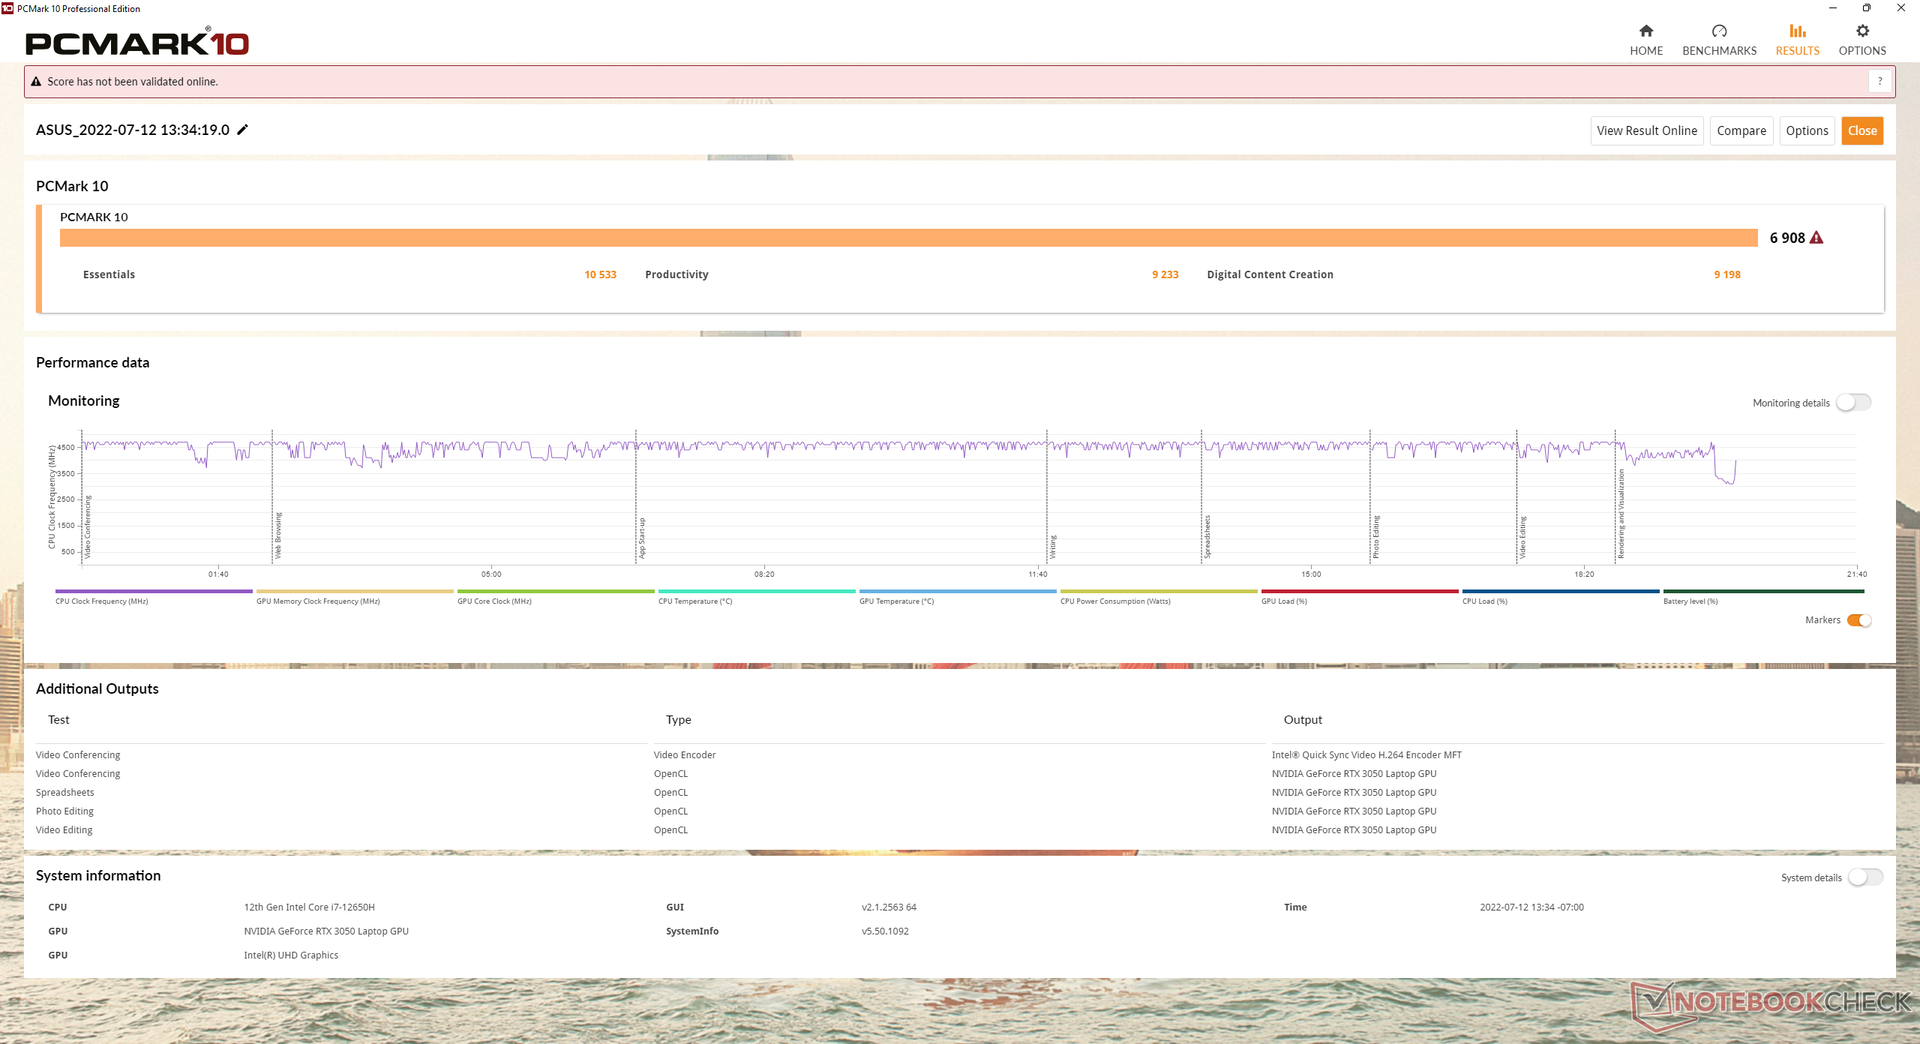
| PCMark 10 Score | 6908 Punkte | |
Hilfe | ||
| AIDA64 / Memory Copy | |
| Asus TUF Dash F15 FX517ZR | |
| Durchschnittliche Intel Core i7-12650H (43261 - 69735, n=14) | |
| Asus TUF Dash F15 FX517ZC | |
| Gigabyte G5 GD | |
| MSI Bravo 15 B5DD-010US | |
| Dell G15 5510 | |
| Lenovo Ideapad Gaming 3 15IHU-82K1002RGE | |
| AIDA64 / Memory Read | |
| Asus TUF Dash F15 FX517ZR | |
| Durchschnittliche Intel Core i7-12650H (47313 - 67412, n=14) | |
| Asus TUF Dash F15 FX517ZC | |
| Gigabyte G5 GD | |
| MSI Bravo 15 B5DD-010US | |
| Dell G15 5510 | |
| Lenovo Ideapad Gaming 3 15IHU-82K1002RGE | |
| AIDA64 / Memory Write | |
| Asus TUF Dash F15 FX517ZR | |
| Durchschnittliche Intel Core i7-12650H (45617 - 59361, n=14) | |
| Asus TUF Dash F15 FX517ZC | |
| Gigabyte G5 GD | |
| Dell G15 5510 | |
| MSI Bravo 15 B5DD-010US | |
| Lenovo Ideapad Gaming 3 15IHU-82K1002RGE | |
| AIDA64 / Memory Latency | |
| Asus TUF Dash F15 FX517ZR | |
| Gigabyte G5 GD | |
| Lenovo Ideapad Gaming 3 15IHU-82K1002RGE | |
| Durchschnittliche Intel Core i7-12650H (71.6 - 103.9, n=14) | |
| Dell G15 5510 | |
| MSI Bravo 15 B5DD-010US | |
| Asus TUF Dash F15 FX517ZC | |
* ... kleinere Werte sind besser
DPC-Latenzen
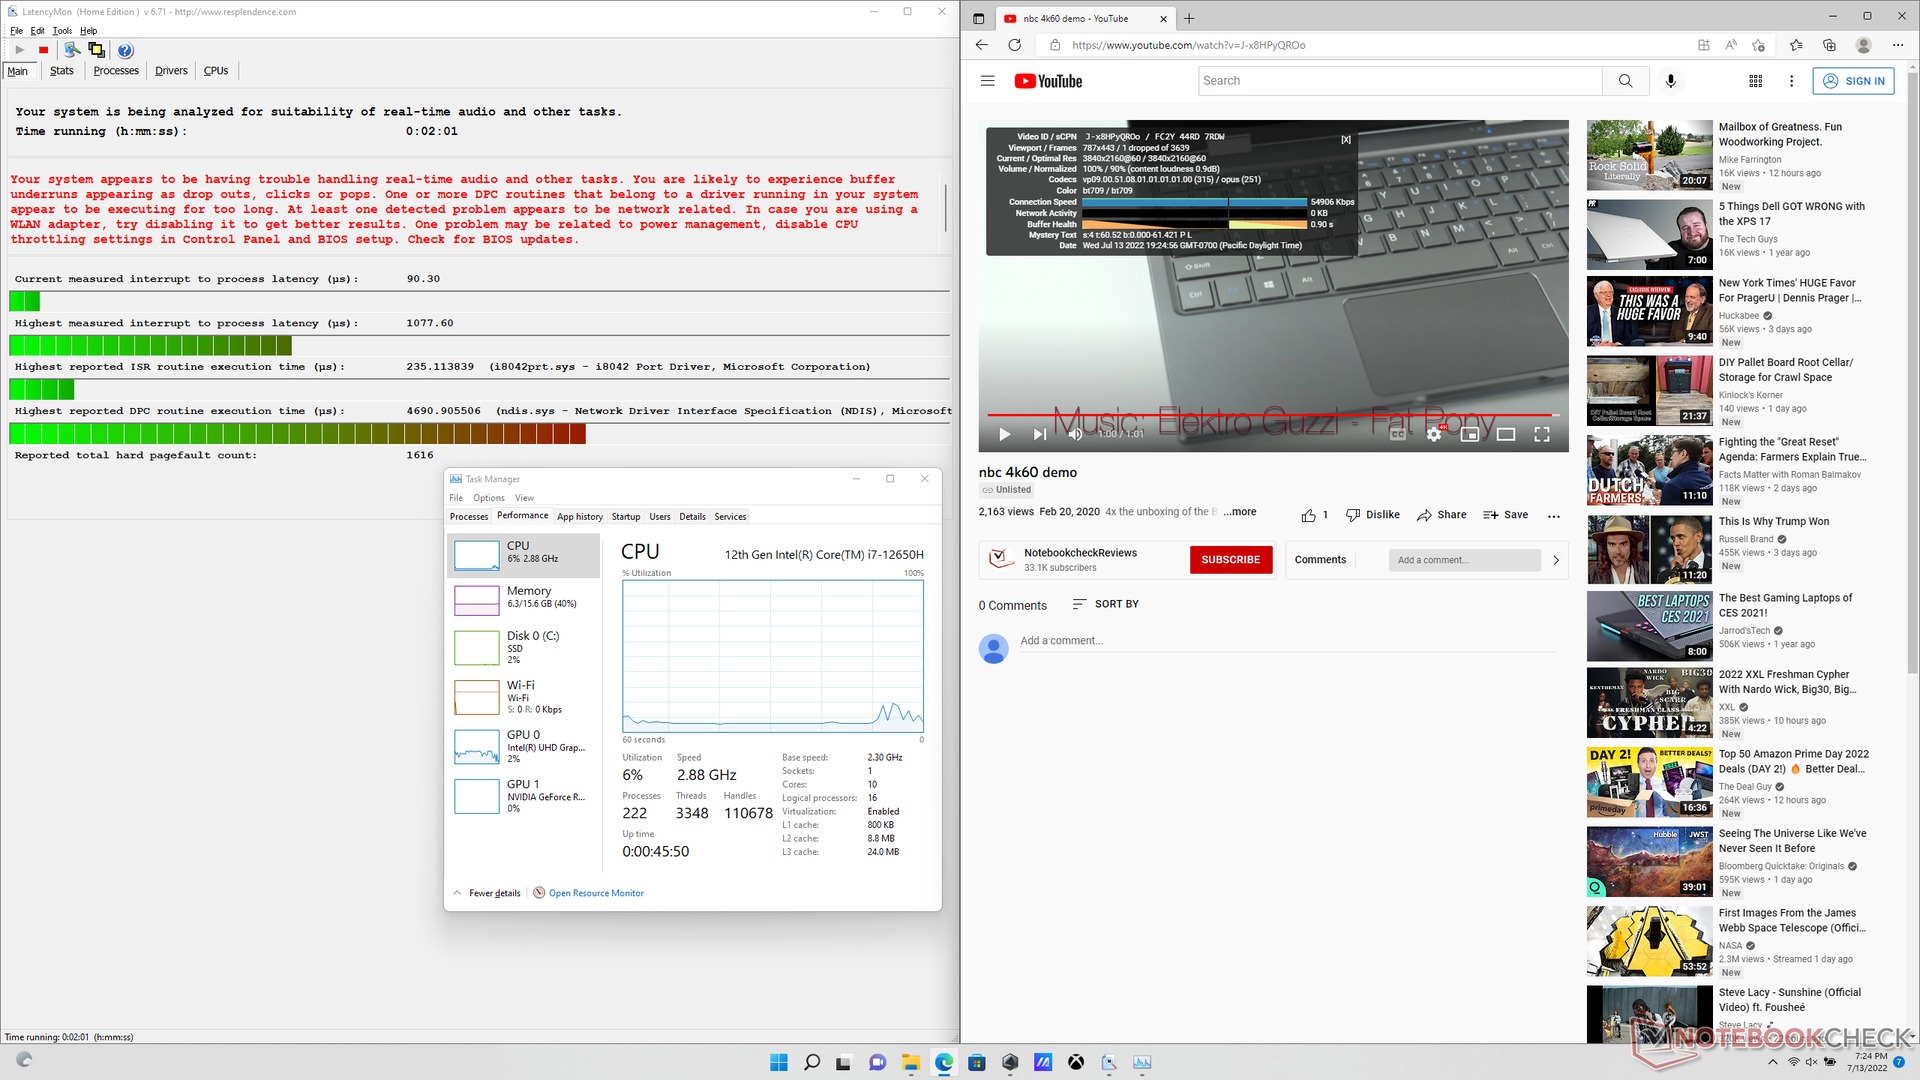
Beim Öffnen mehrerer Browser-Tabs auf unsere Homepage kam es zu Problemen mit DPC-Latenzen. Das Abspielen von 4K-Video mit 60 FPS verlief hingegen nahezu reibungslos. Während des einminütigen Videos kam es zu nur einem Dropped Frame.

| DPC Latencies / LatencyMon - interrupt to process latency (max), Web, Youtube, Prime95 | |
| Dell G15 5510 | |
| MSI Bravo 15 B5DD-010US | |
| Asus TUF Dash F15 FX517ZC | |
| Lenovo Ideapad Gaming 3 15IHU-82K1002RGE | |
| Asus TUF Dash F15 FX517ZR | |
| Gigabyte G5 GD | |
* ... kleinere Werte sind besser
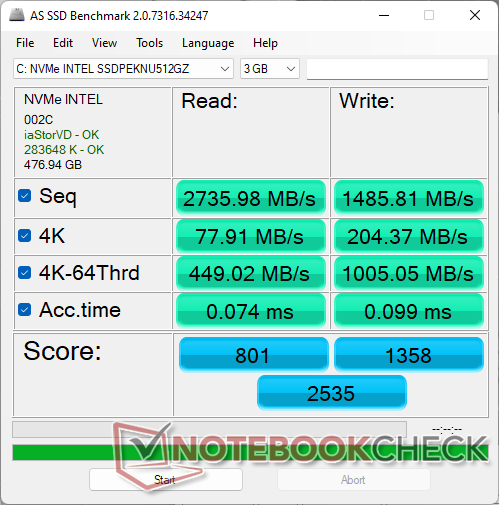
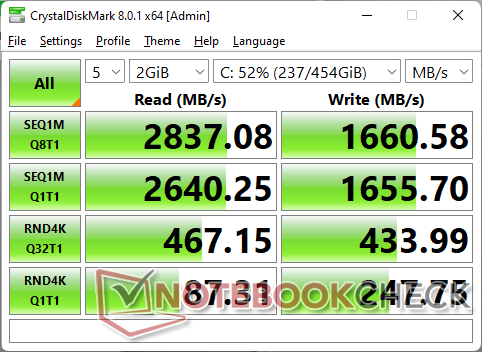
Massenspeicher — Unterstützt bis zu 2x M.2 SSDs
Unser Testmodell ist mit der Mittelklasse-SSD Intel 670p ausgestattet und liefert eine langfristige sequenzielle Leserate von rund 2.300 MB/s. Das System unterstützt bis zu zwei interne M.2-2280-SSDs gleichzeitig.

| Drive Performance Rating - Percent | |
| Gigabyte G5 GD | |
| Asus TUF Dash F15 FX517ZR | |
| Dell G15 5510 | |
| Asus TUF Dash F15 FX517ZC | |
| Lenovo Ideapad Gaming 3 15IHU-82K1002RGE | |
| MSI Bravo 15 B5DD-010US | |
* ... kleinere Werte sind besser
Dauerleistung Lesen: DiskSpd Read Loop, Queue Depth 8
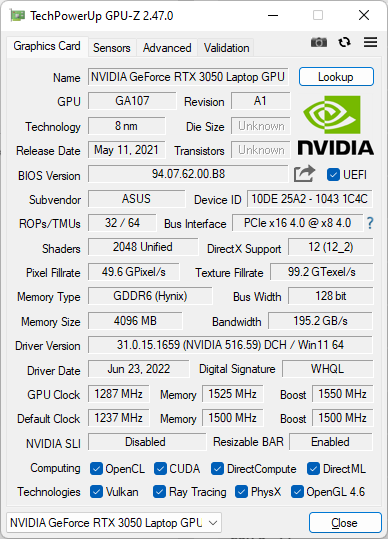
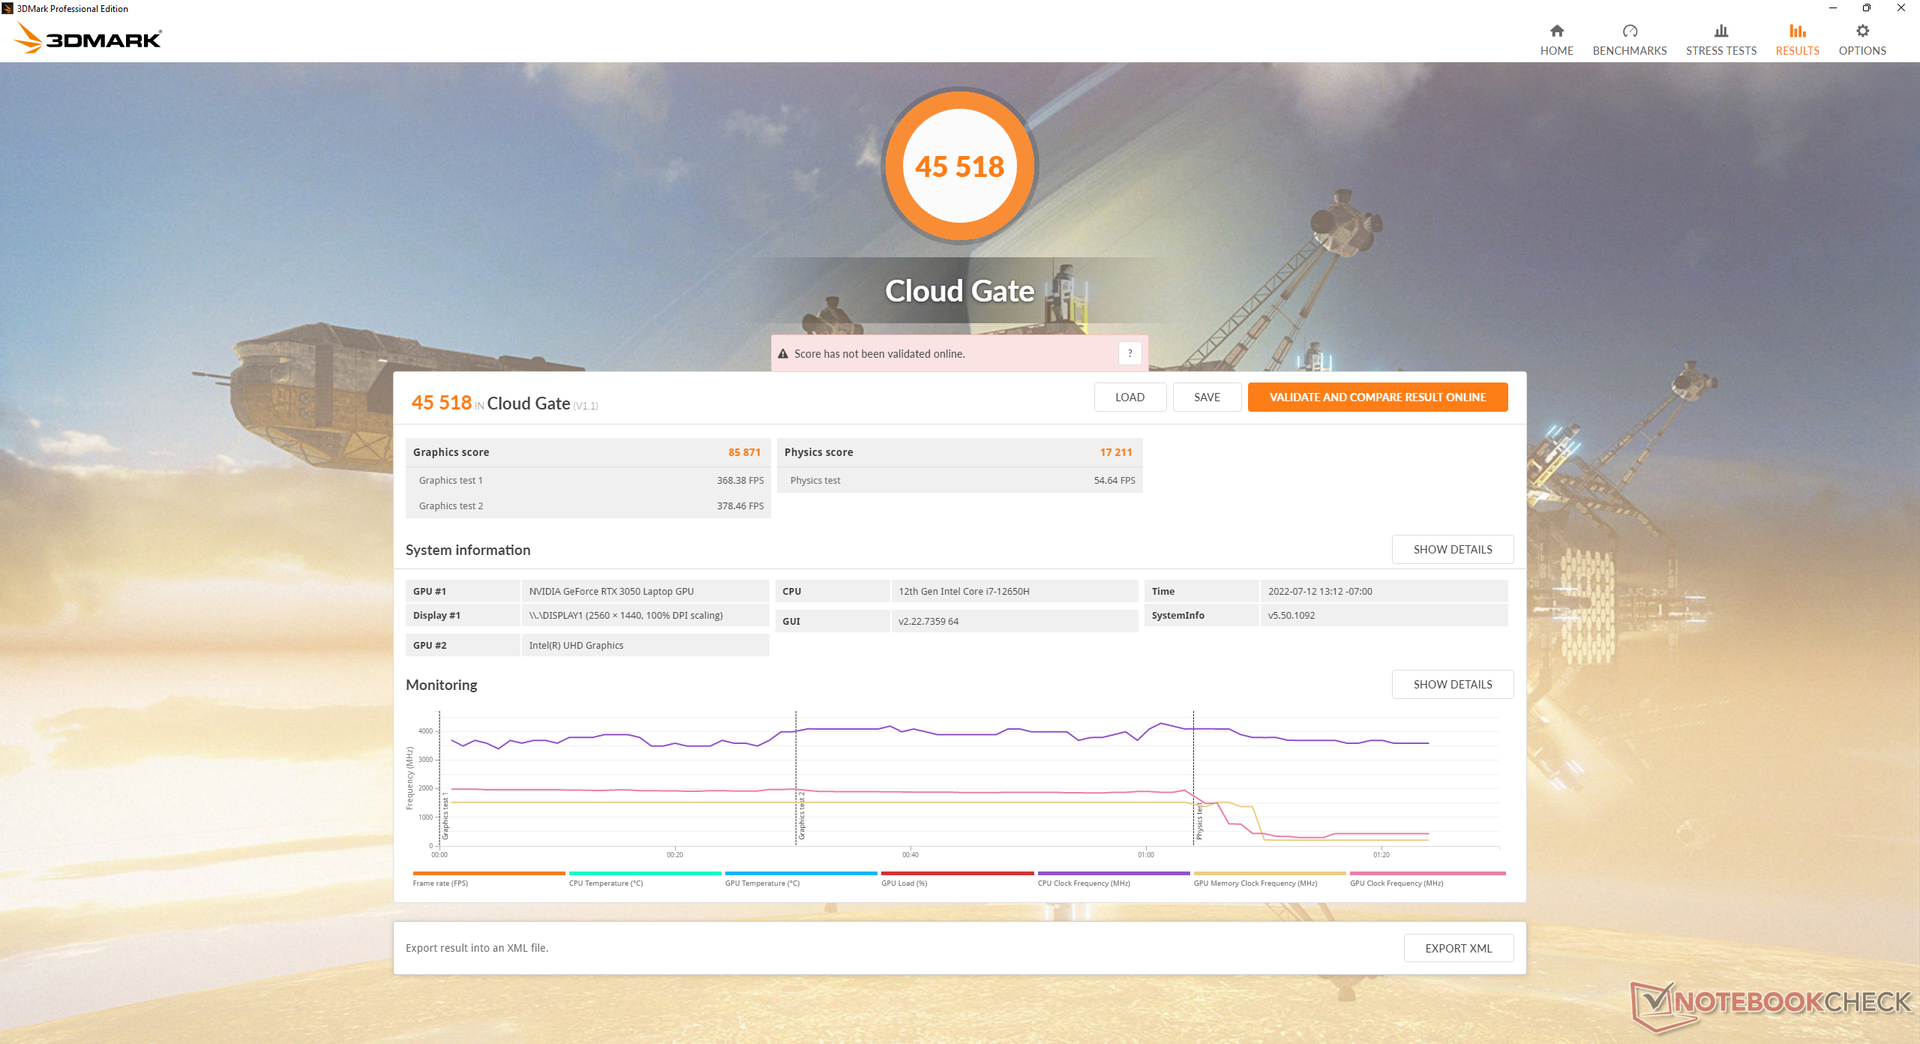
Grafikkarte
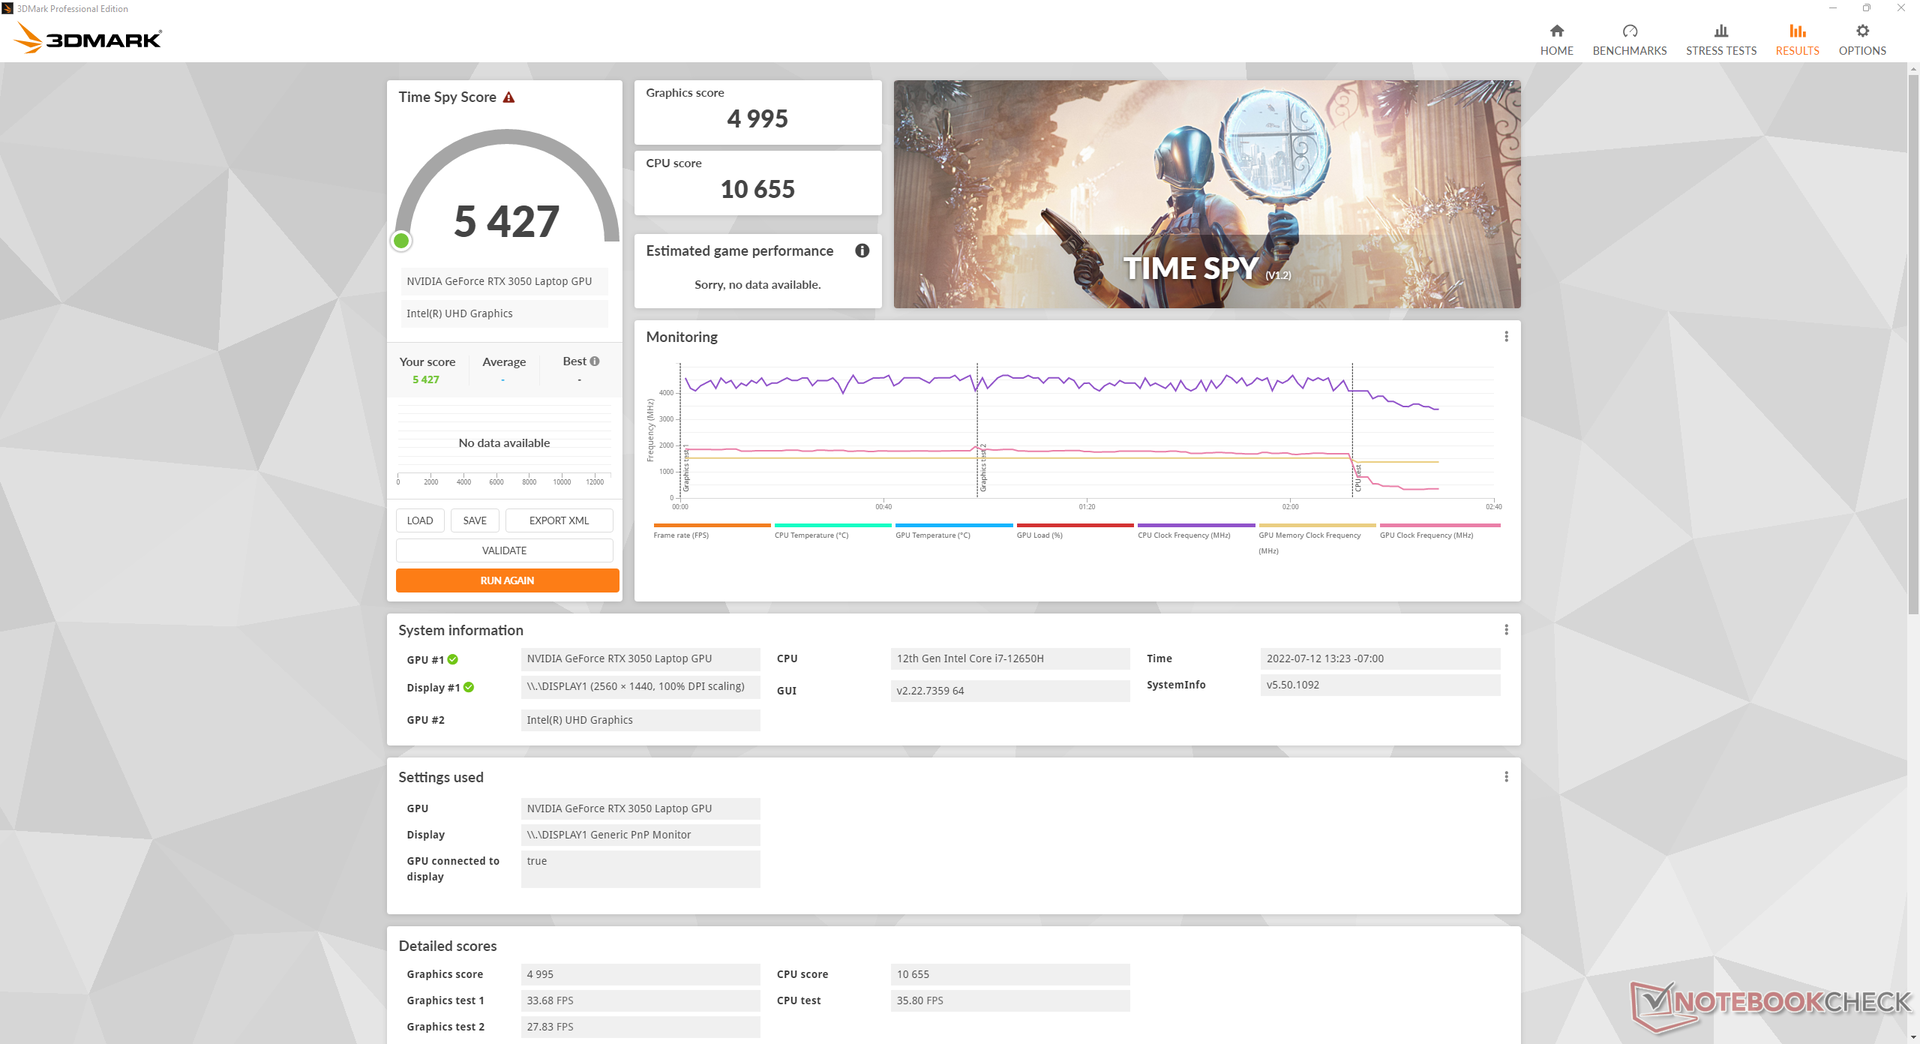
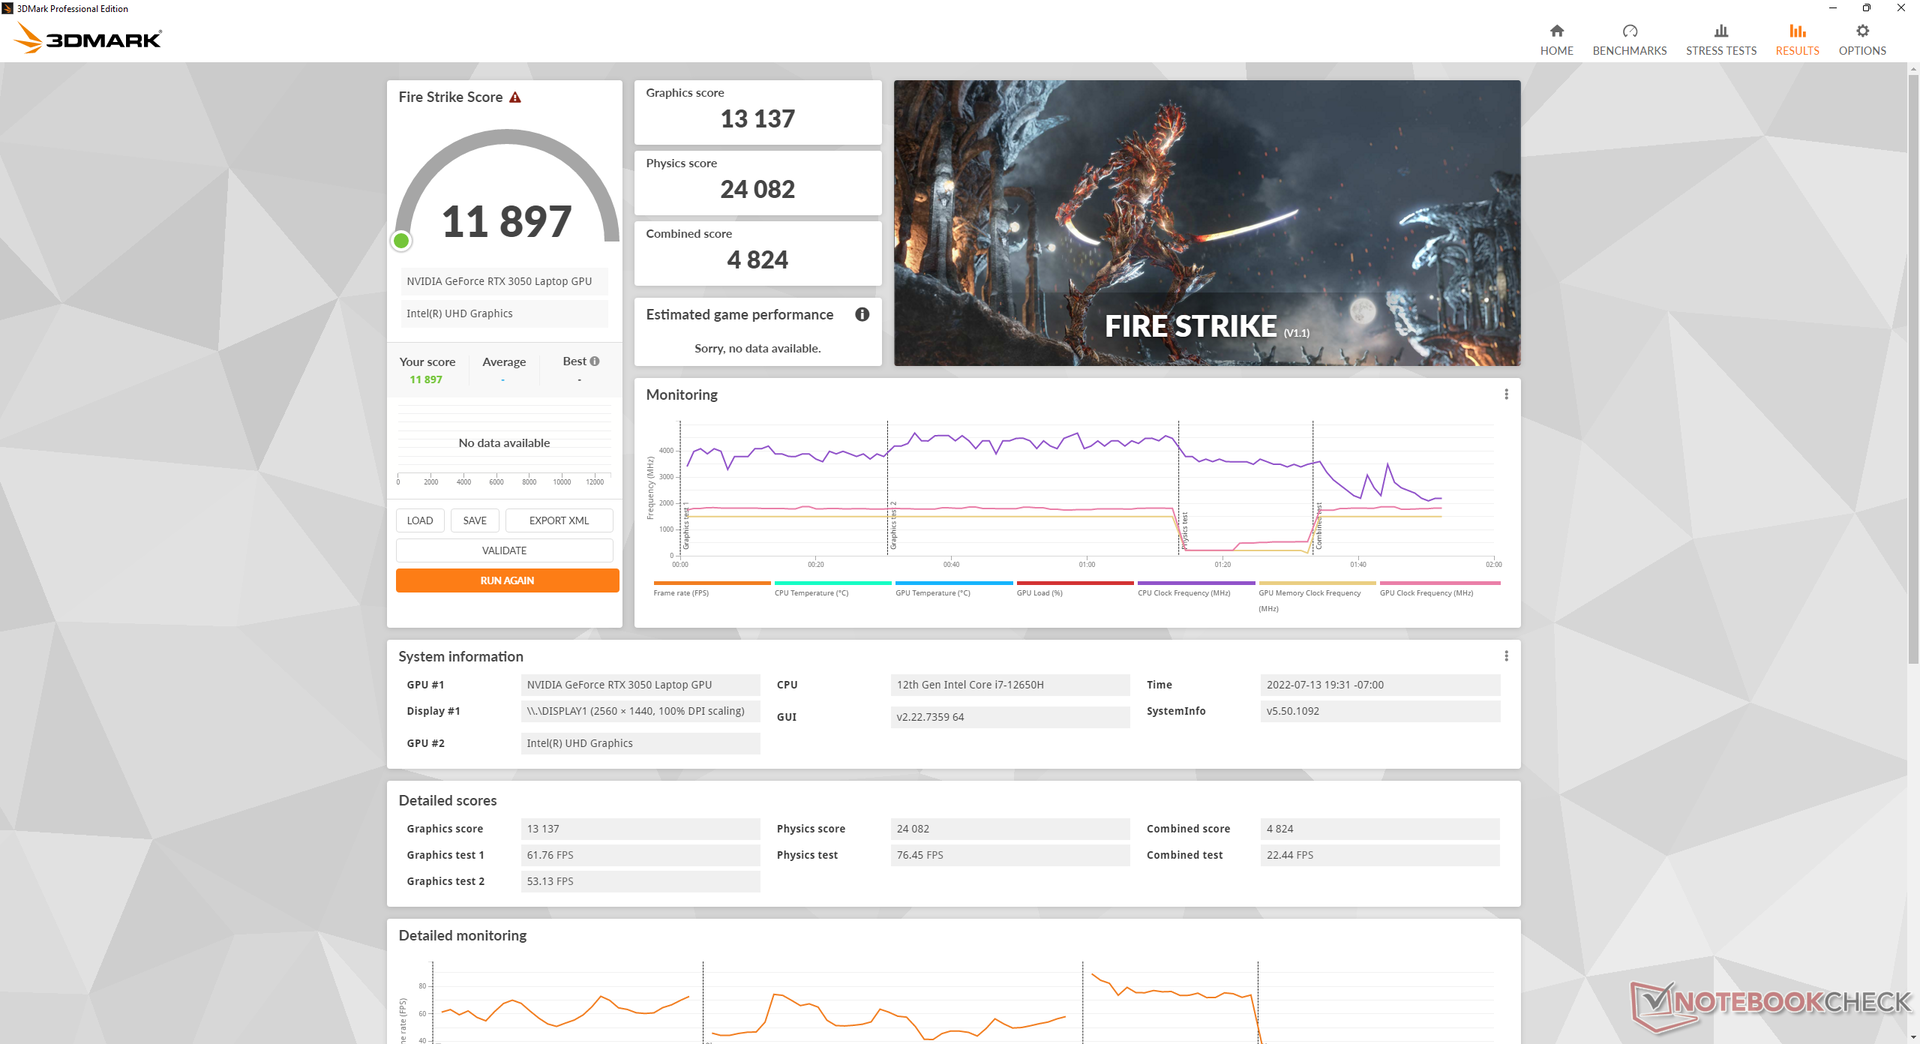
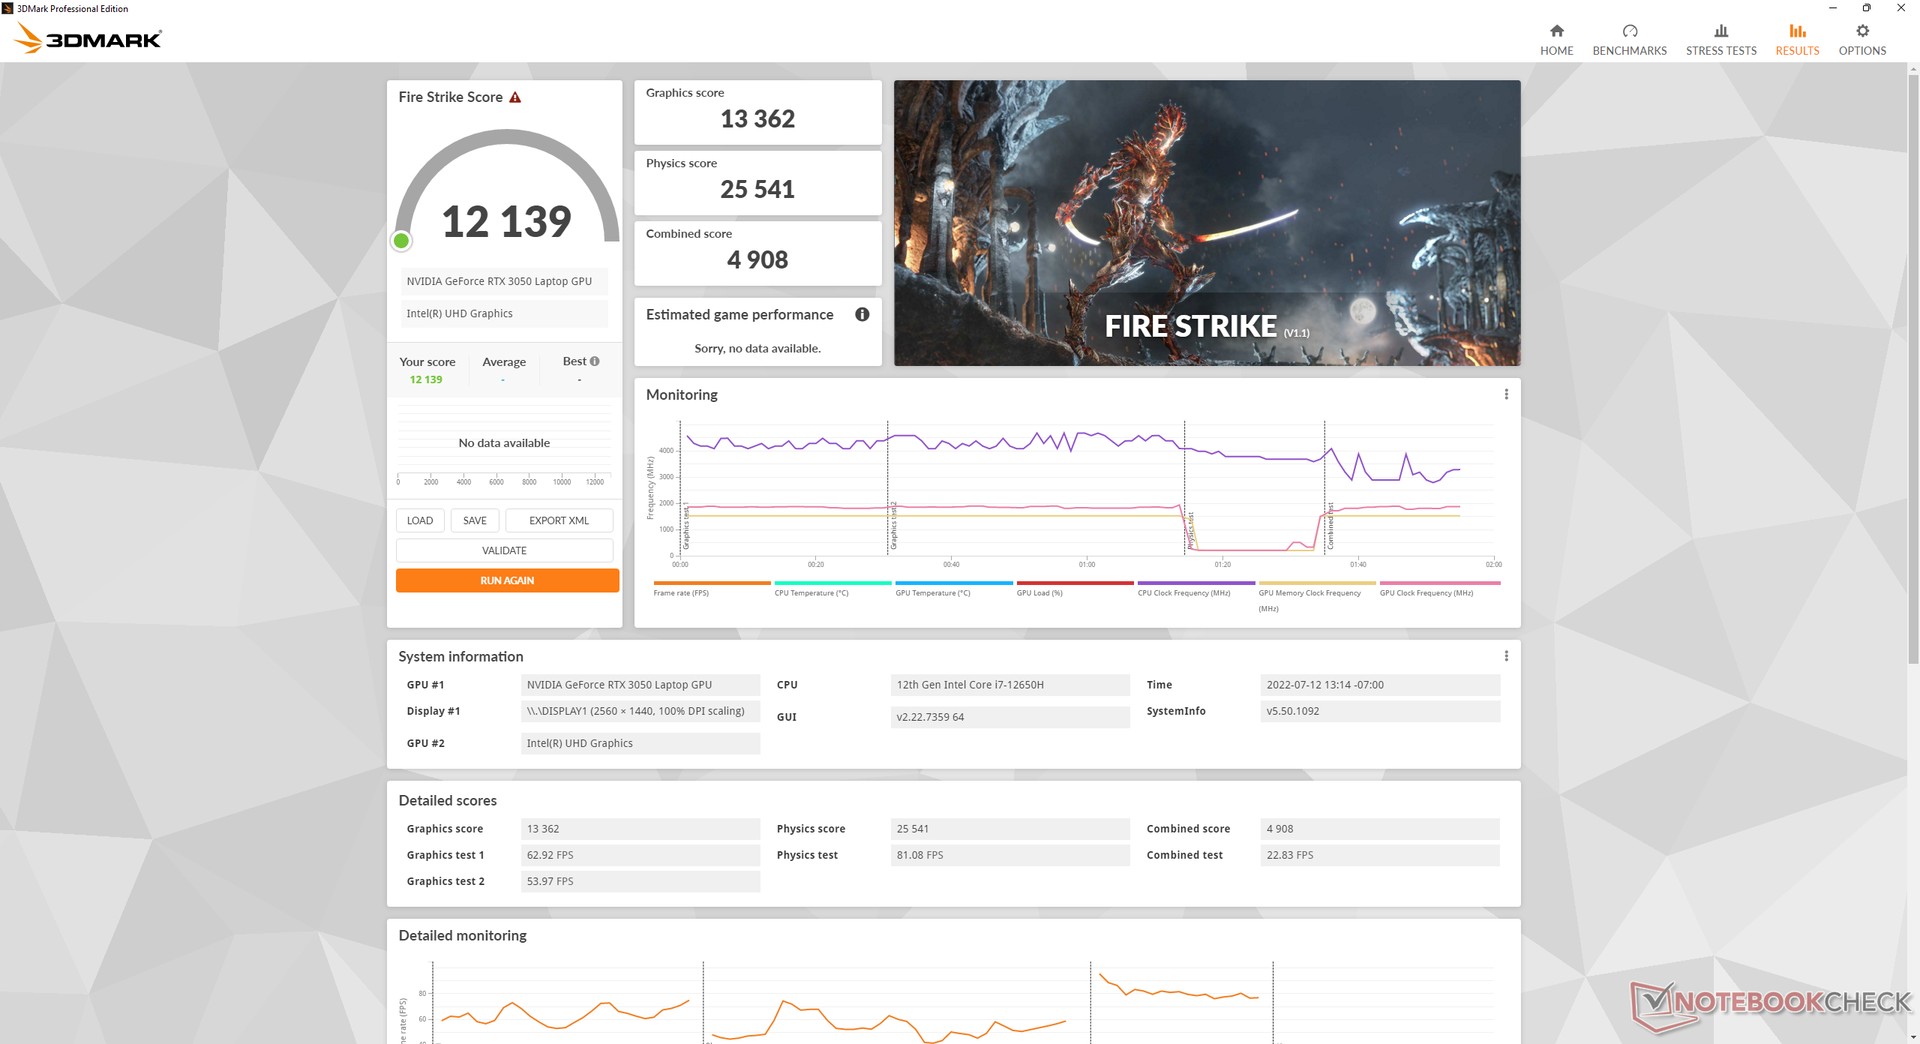
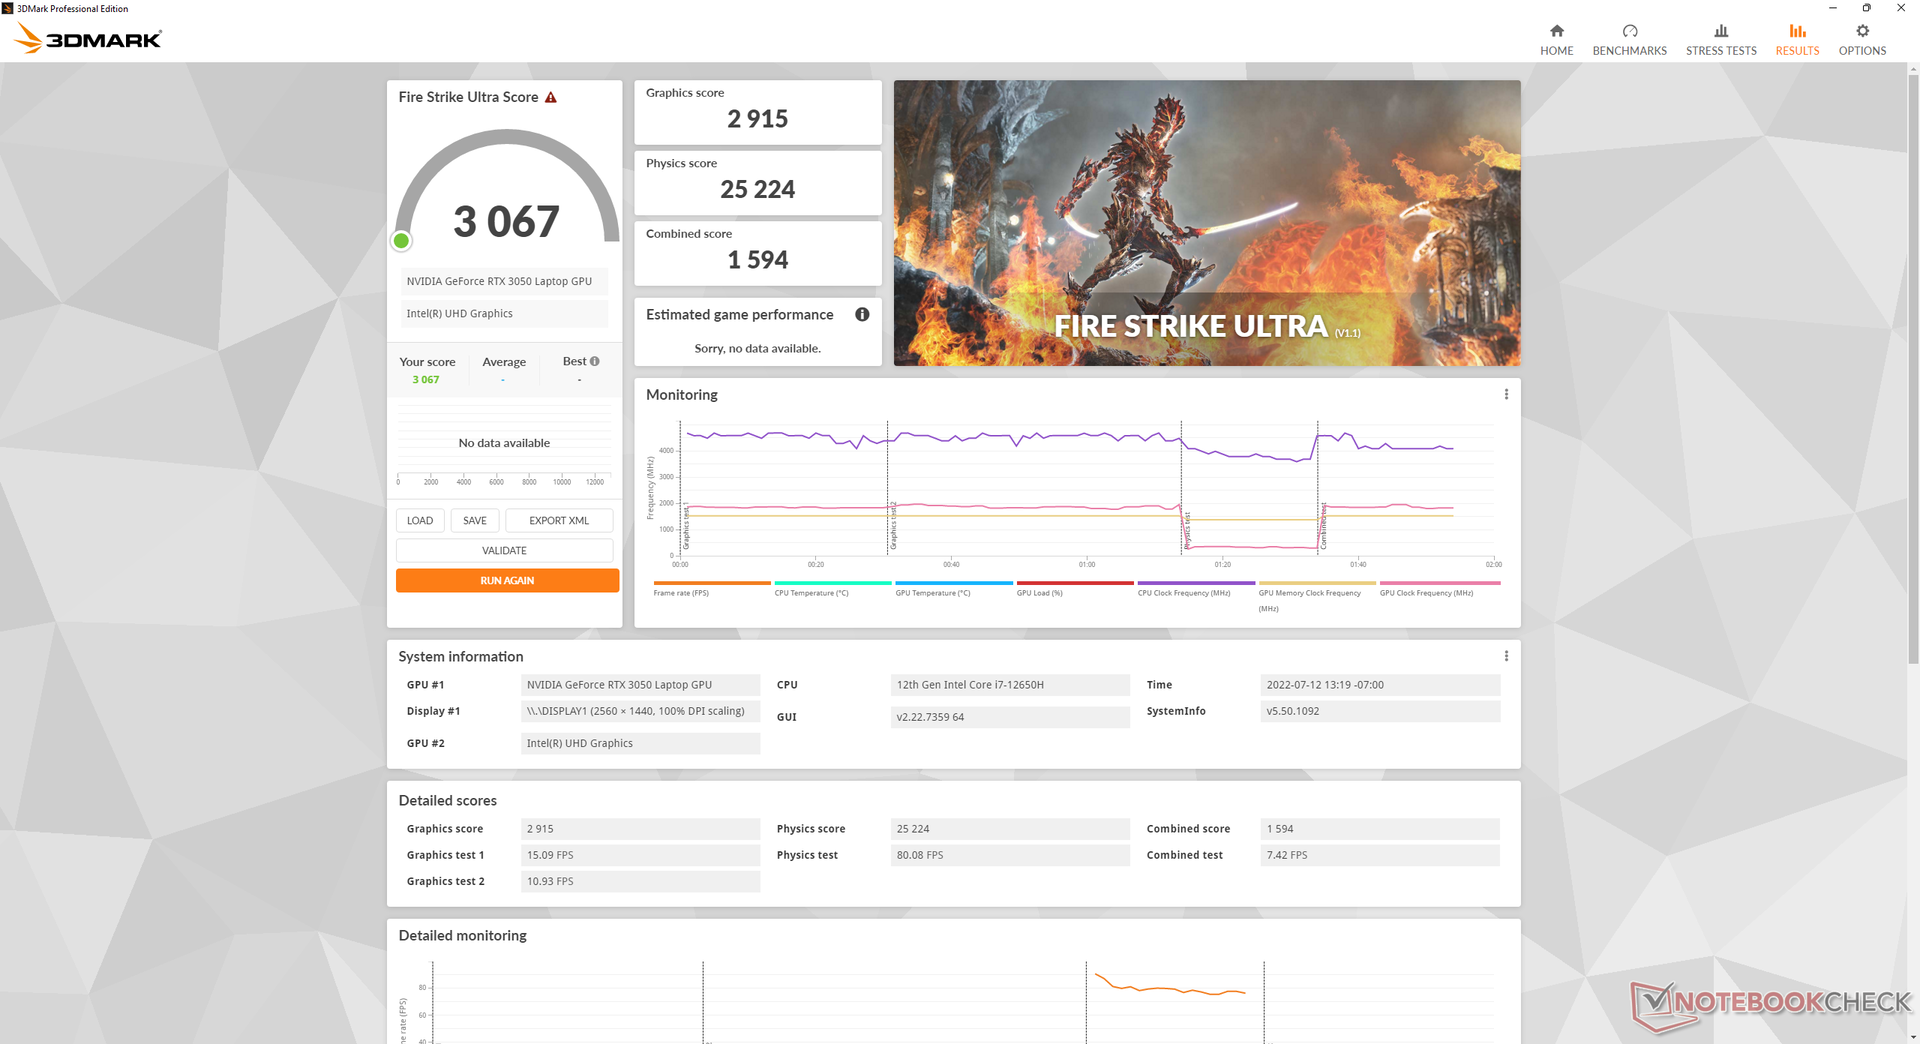
Unsere 75-W-GeForce RTX 3050 ist um etwa 40 Prozent langsamer als die 105-W-GeForce RTX 3070 im FX517ZR. Der Unterschied wird noch deutlicher, wenn GPU-lastige Titel wie Cyberpunk 2077 gespielt werden. Hier bleibt unsere RTX 3050 mit fast 50 Prozent weniger Leistung zurück. Laptop-Gamer, die immer noch mit der älteren RTX 2060 gamen, verpassen hier nichts. Die Turing-GPU ist immer noch um rund 25 Prozent schneller als die RTX 3050.
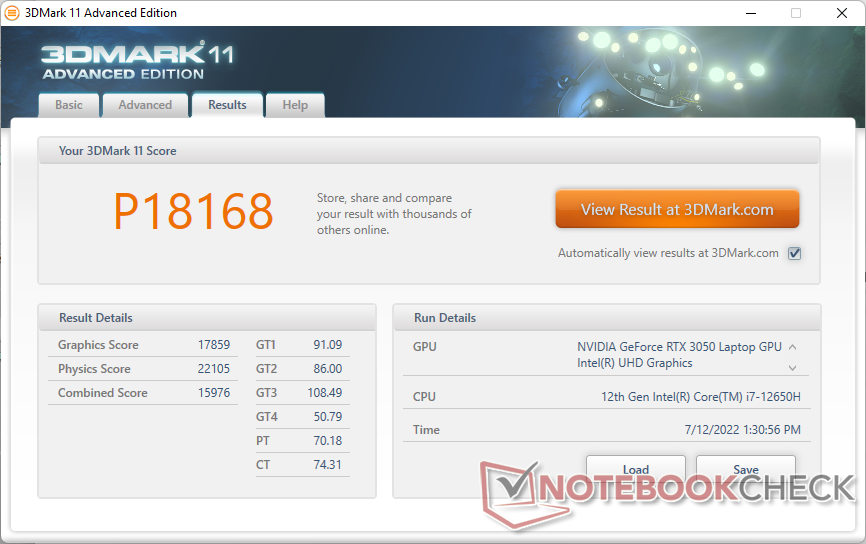
| 3DMark 11 Performance | 18168 Punkte | |
| 3DMark Cloud Gate Standard Score | 45518 Punkte | |
| 3DMark Fire Strike Score | 12139 Punkte | |
| 3DMark Time Spy Score | 5427 Punkte | |
Hilfe | ||
Witcher 3 FPS-Verlauf
| min. | mittel | hoch | max. | |
|---|---|---|---|---|
| GTA V (2015) | 184 | 179 | 148.2 | 70.9 |
| The Witcher 3 (2015) | 282.1 | 171.6 | 98.7 | 51.9 |
| Dota 2 Reborn (2015) | 176.5 | 163.2 | 156.3 | 147.7 |
| Final Fantasy XV Benchmark (2018) | 143.4 | 74 | 51 | |
| X-Plane 11.11 (2018) | 148.1 | 129.9 | 103.1 | |
| Strange Brigade (2018) | 320 | 135.8 | 108.1 | 90.8 |
| Cyberpunk 2077 1.6 (2022) | 77.9 | 62.1 | 44 | 36.1 |
Emissionen
Geräuschemissionen — Über 50 dB(A) beim Gamen
Das Lüftergeräusch hängt stark von den Einstellungen in der Armoury-Crate-Software ab. Zur Auswahl stehen: Windows, Leise, Ausgeglichen, Turbo und Manuell. Wir empfehlen fürs Internetsurfen oder beim Streamen den Modus "Leise", da die Lüfter ansonsten recht laut sein können. Im ausgeglichenen Modus steigt die Drehzahl der Lüfter bei einem ruhigen Hintergrundgeräuschpegel von 24 dB(A) allein beim Surfen regelmäßig auf 32 dB(A).
Das Lüftergeräusch stabilisiert sich beim Gamen im Modus "Ausgeglichen" bei 48,7 dB(A) und im Modus "Turbo" bei 53,4 dB(A). Im Abschnitt zum Stresstest etwas weiter unten zeigt sich, dass höhere TDP und TGP nur im Turbo-Modus möglich sind, sodass Nutzer die lauteren Lüfter in Kauf nehmen müssen, wenn sie die volle Leistung des Laptops ausschöpfen möchten. Ein Geräuschpegel von über 50 dB(A) ist im Vergleich zu den meisten anderen Gaming-Laptops, wie etwa den beiden ebenfalls mit der RTX 3050 ausgestatteten Modellen Dell G15 5510 oder Lenovo Ideapad Gaming 3 15, hoch.
Lautstärkediagramm
| Idle |
| 24 / 24 / 32.3 dB(A) |
| Last |
| 43.7 / 53.6 dB(A) |
 | ||
30 dB leise 40 dB(A) deutlich hörbar 50 dB(A) störend |
||
min: | ||
| Asus TUF Dash F15 FX517ZC GeForce RTX 3050 4GB Laptop GPU, i7-12650H, Intel SSD 670p SSDPEKNU512GZ | Asus TUF Dash F15 FX517ZR GeForce RTX 3070 Laptop GPU, i7-12650H, Samsung PM991a MZVLQ1T0HBLB | Dell G15 5510 GeForce RTX 3050 4GB Laptop GPU, i5-10500H, SK Hynix BC711 HFM512GD3HX015N | MSI Bravo 15 B5DD-010US Radeon RX 5500M, R5 5600H, Kingston OM8PCP3512F-AB | Lenovo Ideapad Gaming 3 15IHU-82K1002RGE GeForce RTX 3050 Ti Laptop GPU, i5-11300H, Micron 2210 MTFDHBA512QFD | Gigabyte G5 GD GeForce RTX 3050 4GB Laptop GPU, i5-11400H, ESR512GTLG-E6GBTNB4 | |
|---|---|---|---|---|---|---|
| Geräuschentwicklung | -6% | -1% | -2% | 4% | -9% | |
| aus / Umgebung * (dB) | 23.9 | 26 -9% | 26 -9% | 24.5 -3% | 23.9 -0% | 24 -0% |
| Idle min * (dB) | 24 | 26 -8% | 26 -8% | 24.5 -2% | 23.9 -0% | 29 -21% |
| Idle avg * (dB) | 24 | 32 -33% | 27 -13% | 32.8 -37% | 26.8 -12% | 30 -25% |
| Idle max * (dB) | 32.3 | 33 -2% | 33 -2% | 32.8 -2% | 26.8 17% | 32 1% |
| Last avg * (dB) | 43.7 | 48 -10% | 45 -3% | 34.5 21% | 43.5 -0% | 53 -21% |
| Witcher 3 ultra * (dB) | 53.4 | 47 12% | 45 16% | 42.5 20% | 43.5 19% | 52 3% |
| Last max * (dB) | 53.6 | 49 9% | 47 12% | 58.5 -9% | 53.1 1% | 54 -1% |
* ... kleinere Werte sind besser
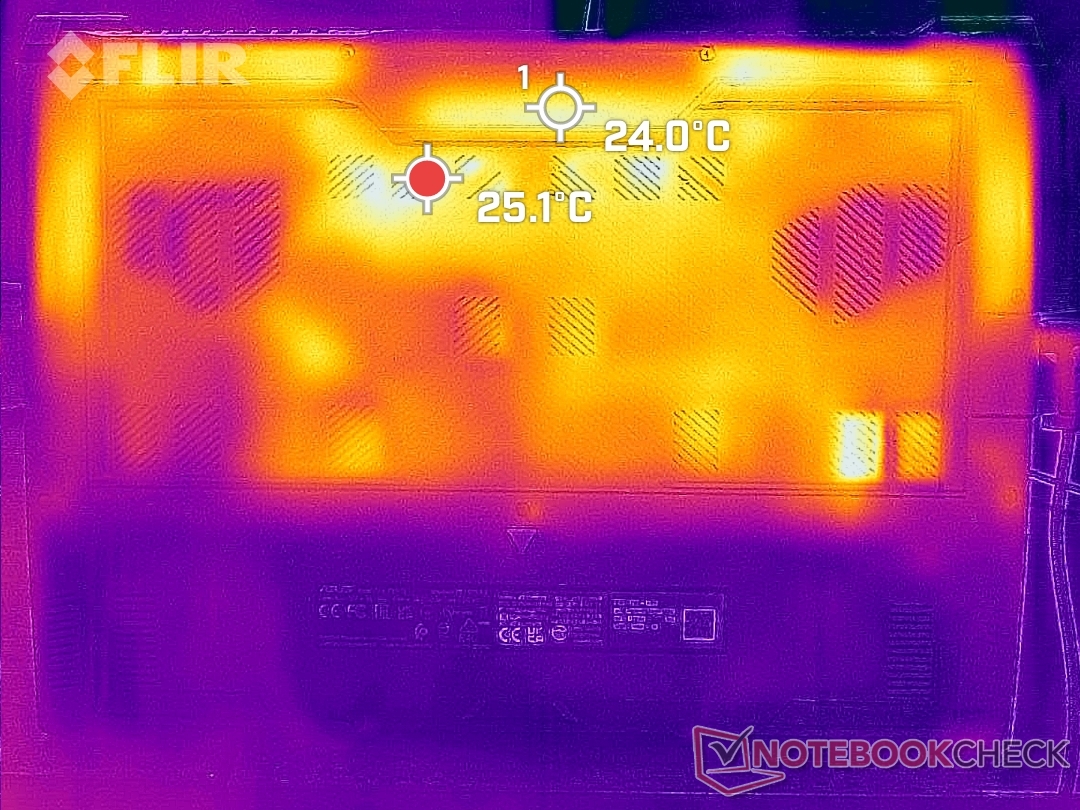
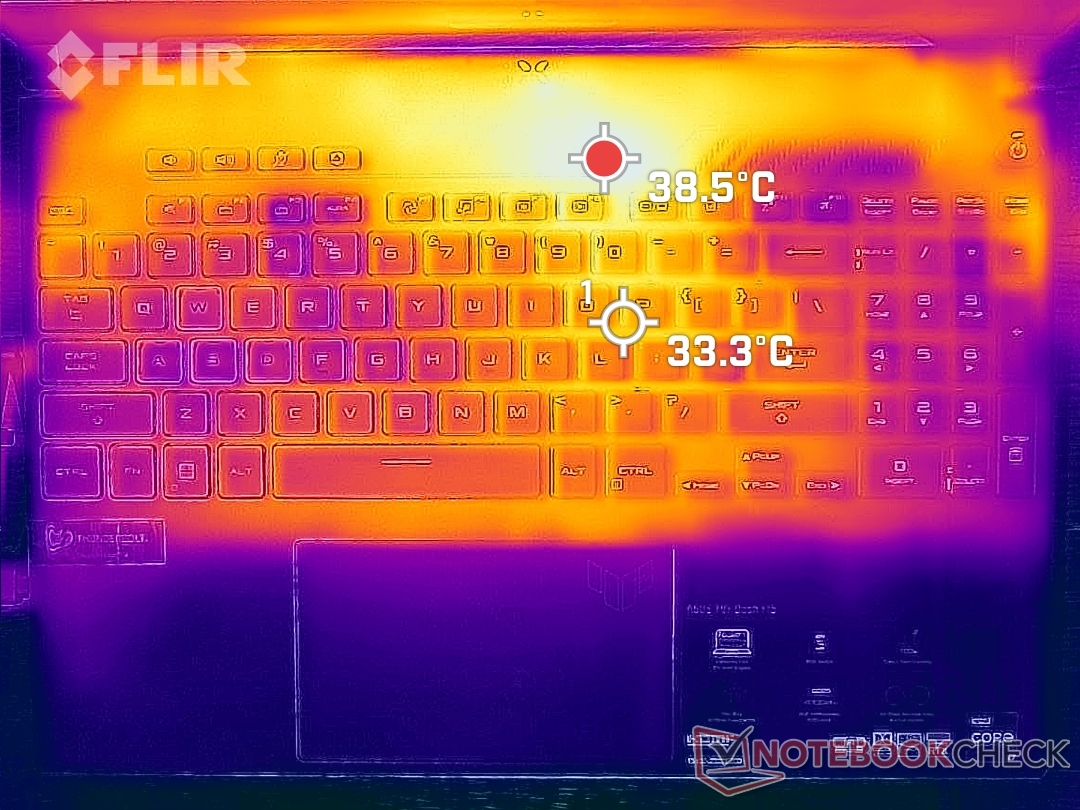
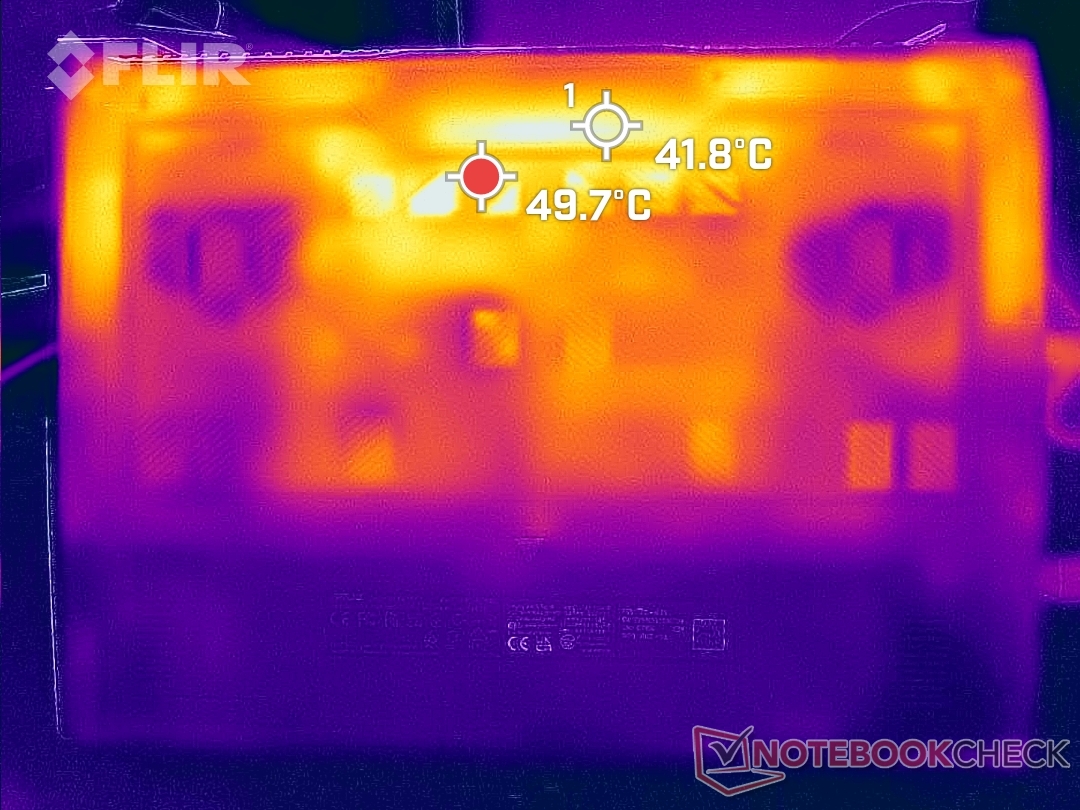
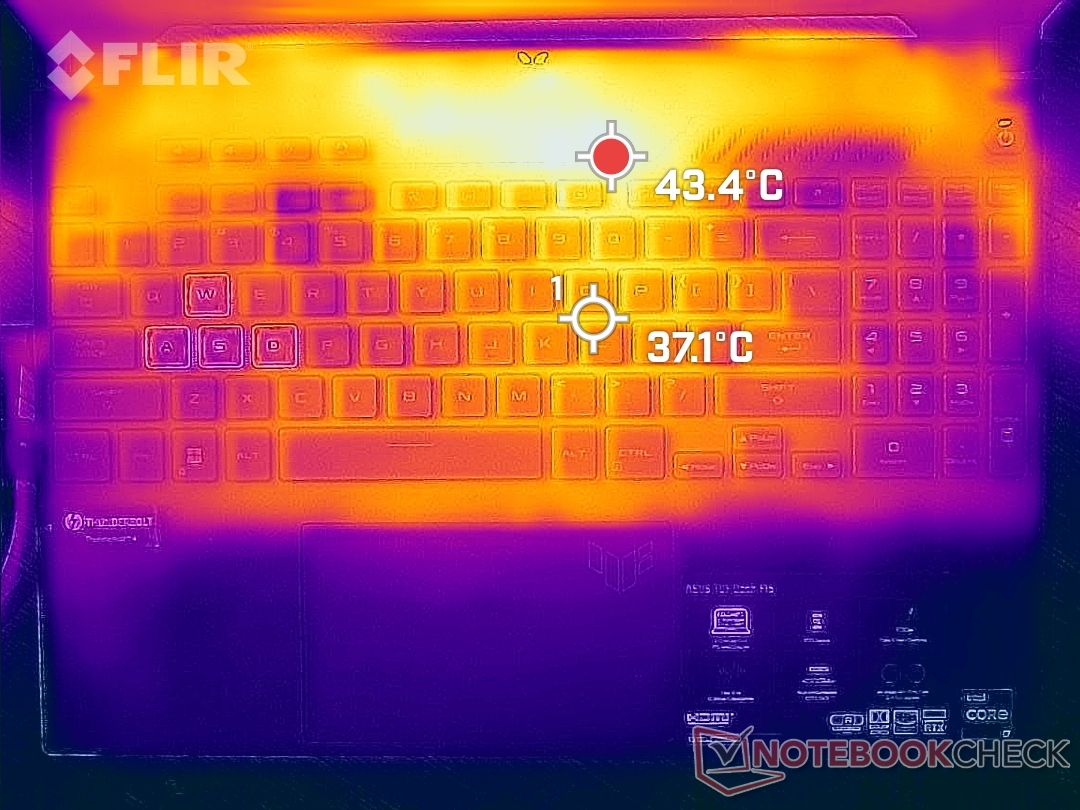
Temperatur
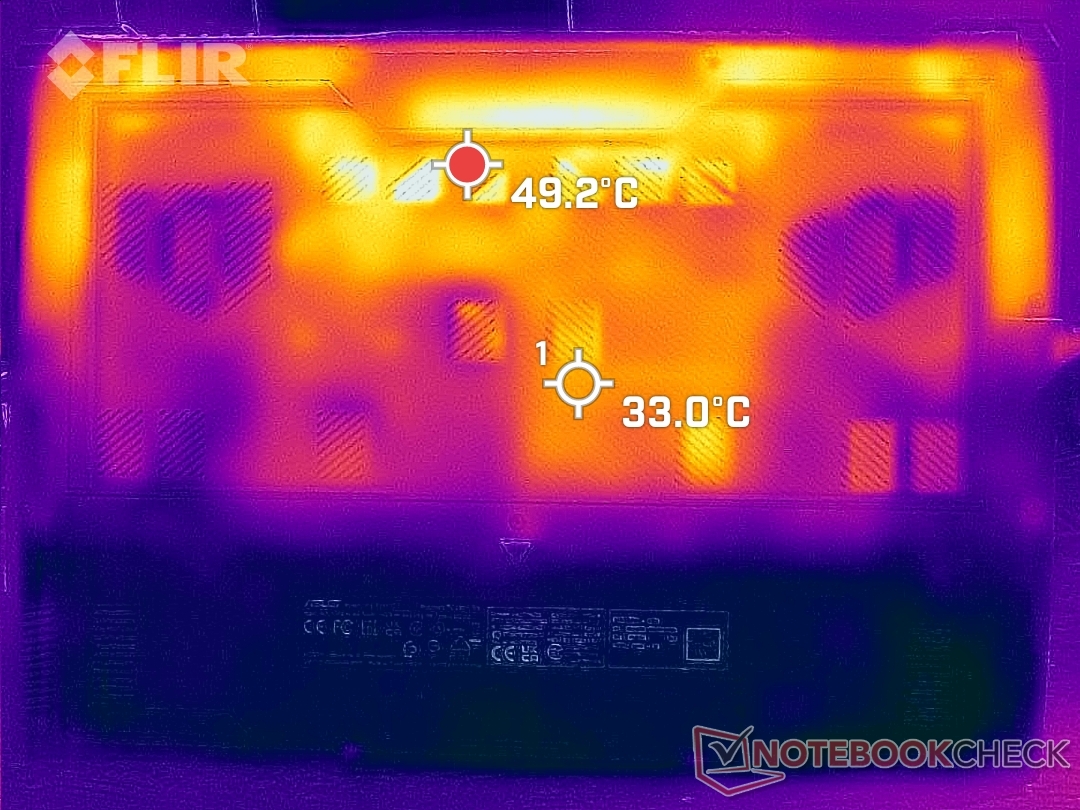
Die Oberflächentemperatur kann in der Mitte der Tastatur beim Gamen 33 bis 37 °C erreichen und bleibt somit einige Grade kühler als das Acer Swift X 16, welches mit der gleichen RTX-3050-GPU ausgestattet ist. Der Hotspot auf unserem Asus erreicht über 43 °C. Zum Glück befindet er sich über der ersten Tastenreihe (siehe Heatmaps), sodass Nutzer beim Gamen ziemlich sicher nicht damit in Berührung kommen werden.
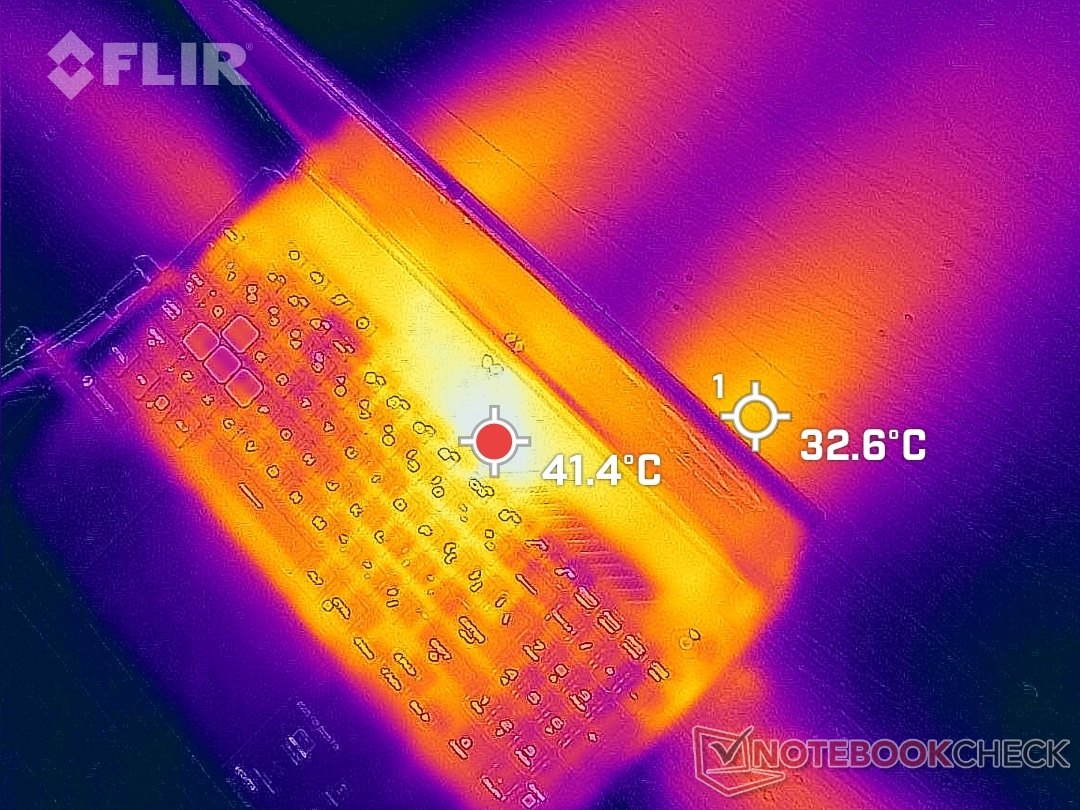
(±) Die maximale Temperatur auf der Oberseite ist 43.4 °C. Im Vergleich liegt der Klassendurchschnitt bei 40.4 °C (von 21.2 bis 68.8 °C für die Klasse Gaming).
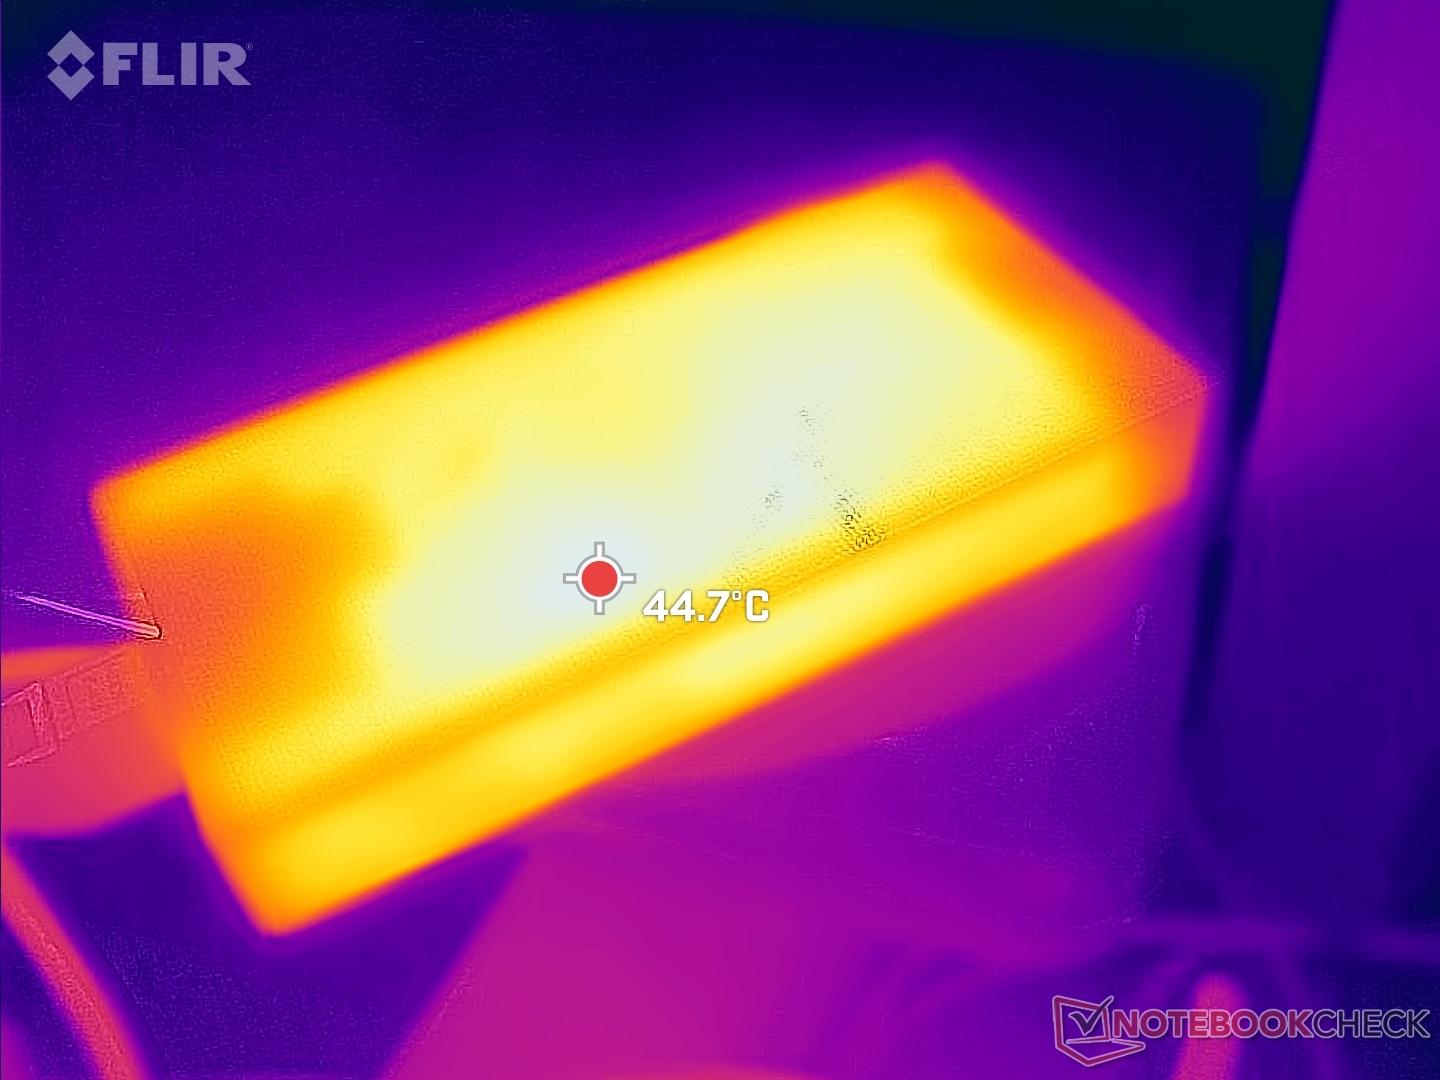
(±) Auf der Unterseite messen wir eine maximalen Wert von 44.4 °C (im Vergleich zum Durchschnitt von 43.2 °C).
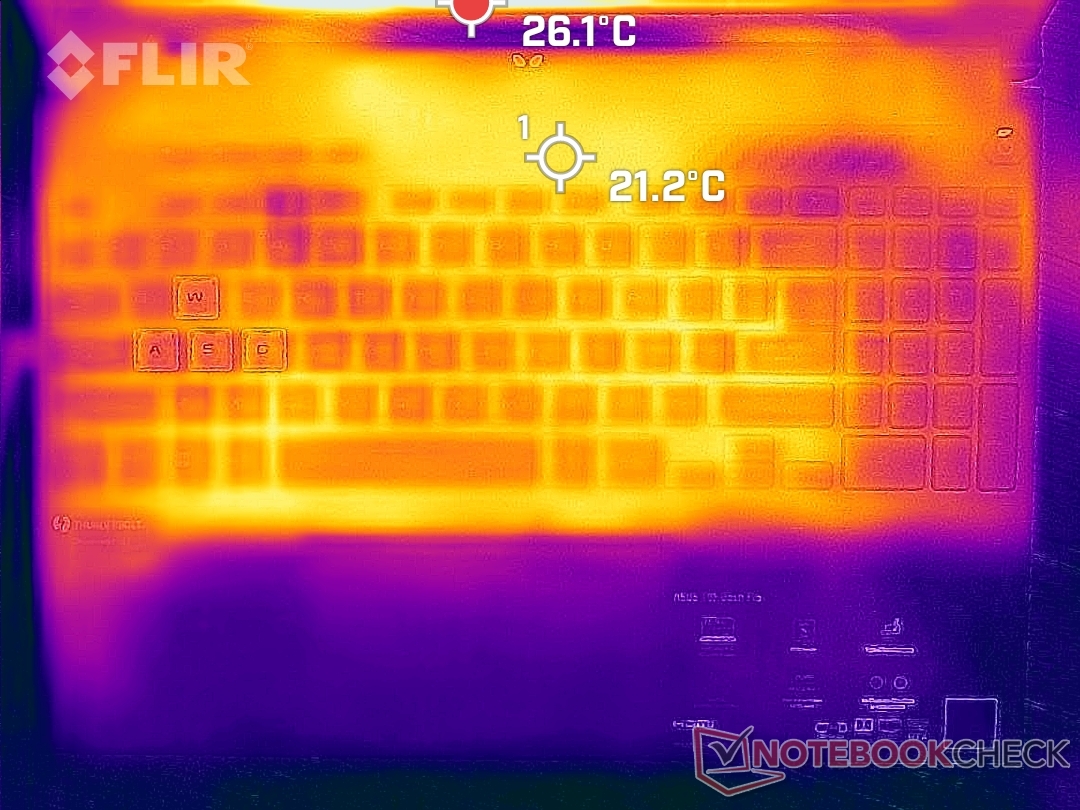
(+) Ohne Last messen wir eine durchschnittliche Temperatur von 19.2 °C auf der Oberseite. Der Klassendurchschnitt erreicht 33.9 °C.
(+) Beim längeren Spielen von The Witcher 3 erhitzt sich das Gerät durchschnittlich auf 26.3 °C. Der Durchschnitt der Klasse ist derzeit 33.9 °C.
(+) Die Handballen und der Touchpad-Bereich sind mit gemessenen 19.4 °C kühler als die typische Hauttemperatur und fühlen sich dadurch kühl an.
(+) Die durchschnittliche Handballen-Temperatur anderer getesteter Geräte war 28.8 °C (+9.4 °C).
| Asus TUF Dash F15 FX517ZC Intel Core i7-12650H, NVIDIA GeForce RTX 3050 4GB Laptop GPU | Asus TUF Dash F15 FX517ZR Intel Core i7-12650H, NVIDIA GeForce RTX 3070 Laptop GPU | Dell G15 5510 Intel Core i5-10500H, NVIDIA GeForce RTX 3050 4GB Laptop GPU | MSI Bravo 15 B5DD-010US AMD Ryzen 5 5600H, AMD Radeon RX 5500M | Lenovo Ideapad Gaming 3 15IHU-82K1002RGE Intel Core i5-11300H, NVIDIA GeForce RTX 3050 Ti Laptop GPU | Gigabyte G5 GD Intel Core i5-11400H, NVIDIA GeForce RTX 3050 4GB Laptop GPU | |
|---|---|---|---|---|---|---|
| Hitze | -36% | -15% | -32% | -10% | -20% | |
| Last oben max * (°C) | 43.4 | 52 -20% | 52 -20% | 52.2 -20% | 43.2 -0% | 45 -4% |
| Last unten max * (°C) | 44.4 | 52 -17% | 49 -10% | 48.6 -9% | 47.9 -8% | 50 -13% |
| Idle oben max * (°C) | 21.2 | 33 -56% | 26 -23% | 38 -79% | 24.9 -17% | 28 -32% |
| Idle unten max * (°C) | 24 | 36 -50% | 26 -8% | 28.4 -18% | 27 -13% | 31 -29% |
* ... kleinere Werte sind besser
Stresstest
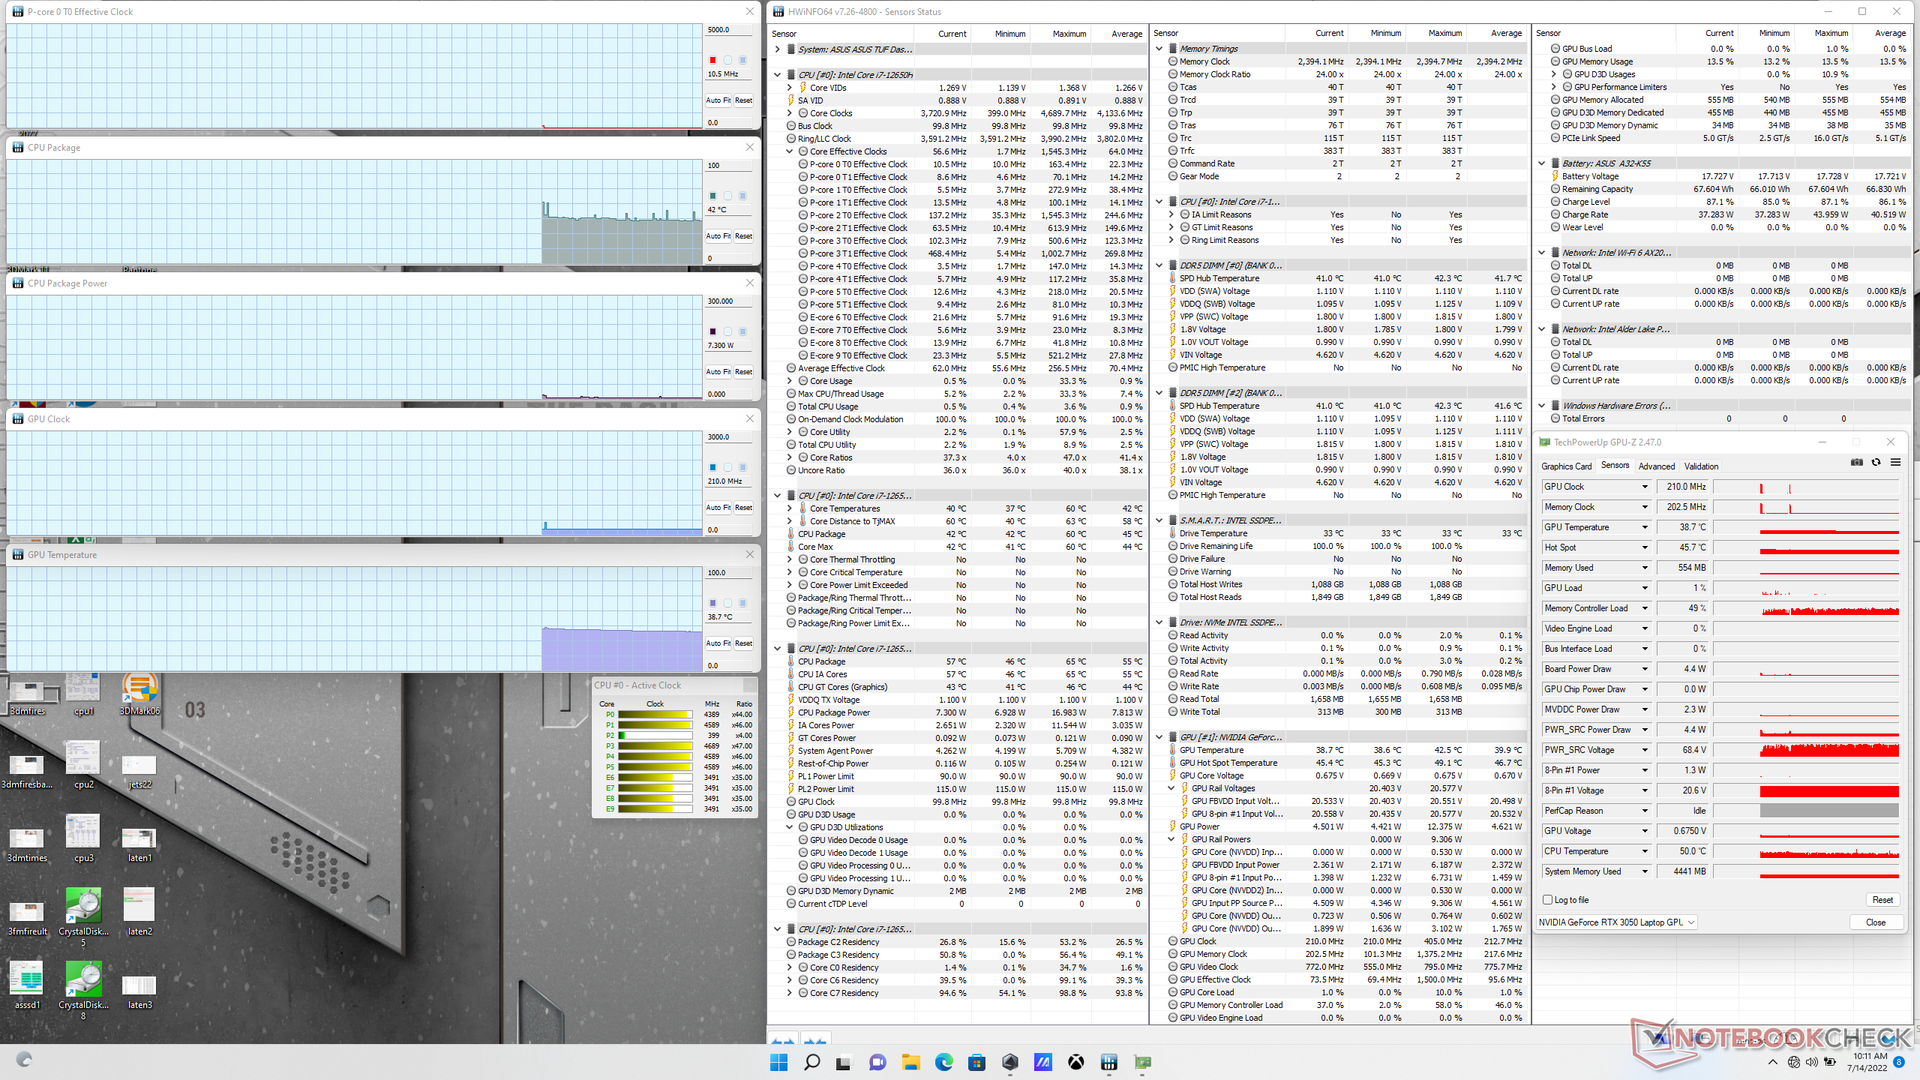
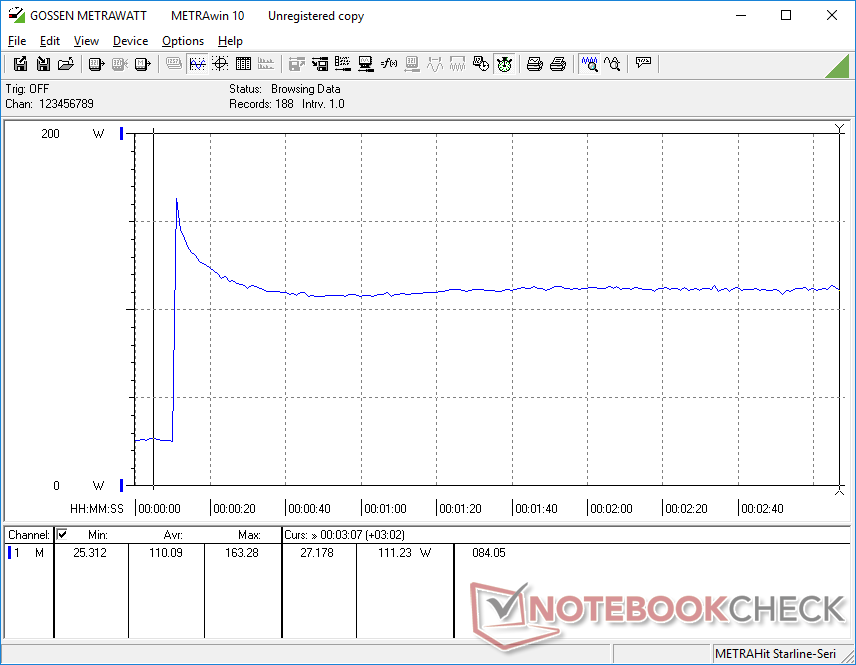
Die CPU-Taktrate, Kerntemperatur und Energieaufnahme steigt beim Starten des Prime95-Stresstests auf 3,7 GHz, 95 °C bzw. 93 W. Allerdings beginnt die Taktrate sofort wieder zu fallen und stabilisiert sich schließlich bei 2,9 GHz. Auch die Energieaufnahme sinkt auf 57 W, um eine weitere Steigerung der Kerntemperaturen zu vermeiden. Das Kühlsystem schränkt die CPU-Leistung eindeutig ein.
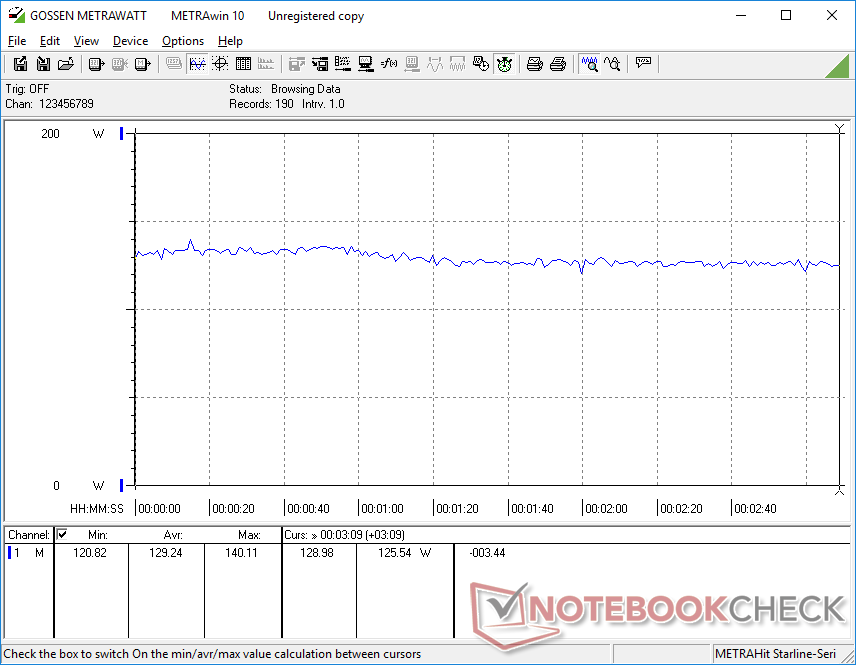
Läuft Witcher 3 im Energieprofil "Ausgeglichen", stabilisiert sich die GPU-Taktrate, Speichertaktrate und Kerntemperatur bei 1.612 MHz, 1.500 MHz bzw. 86 °C. Die GPU-Taktrate und Speichertaktrate steigt im Turbo-Modus leicht an, wobei die GPU-Temperatur aufgrund des lauteren Lüftergeräusches im Turbo-Modus gleich bleibt. Bei Witcher 3 im Turbo-Modus steigt die Energieaufnahme sowohl der GPU als auch der CPU von 50 W auf 65 W bzw. von 19 W auf 28 W.
Die GPU-Temperatur beim Gamen entspricht der GPU-Temperatur im FX517ZR, dabei ist die GPU hier deutlich langsamer.
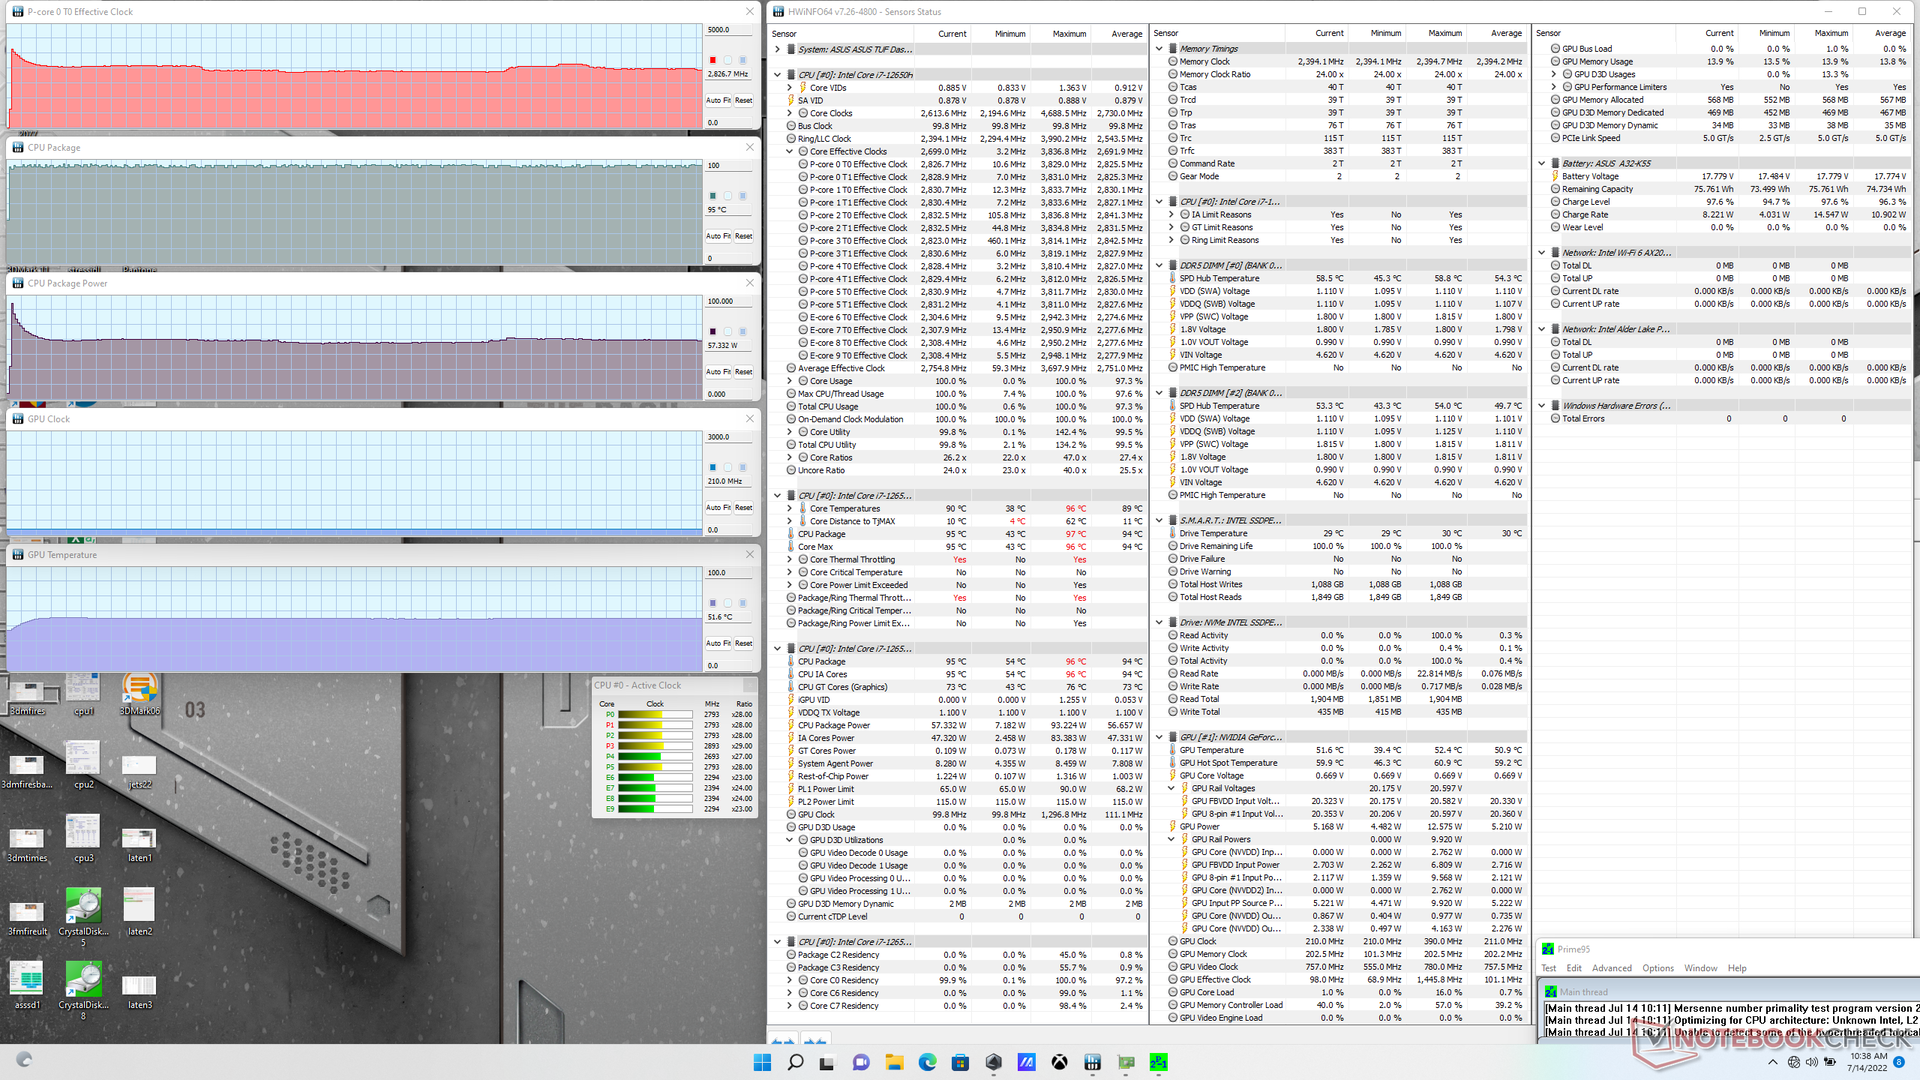
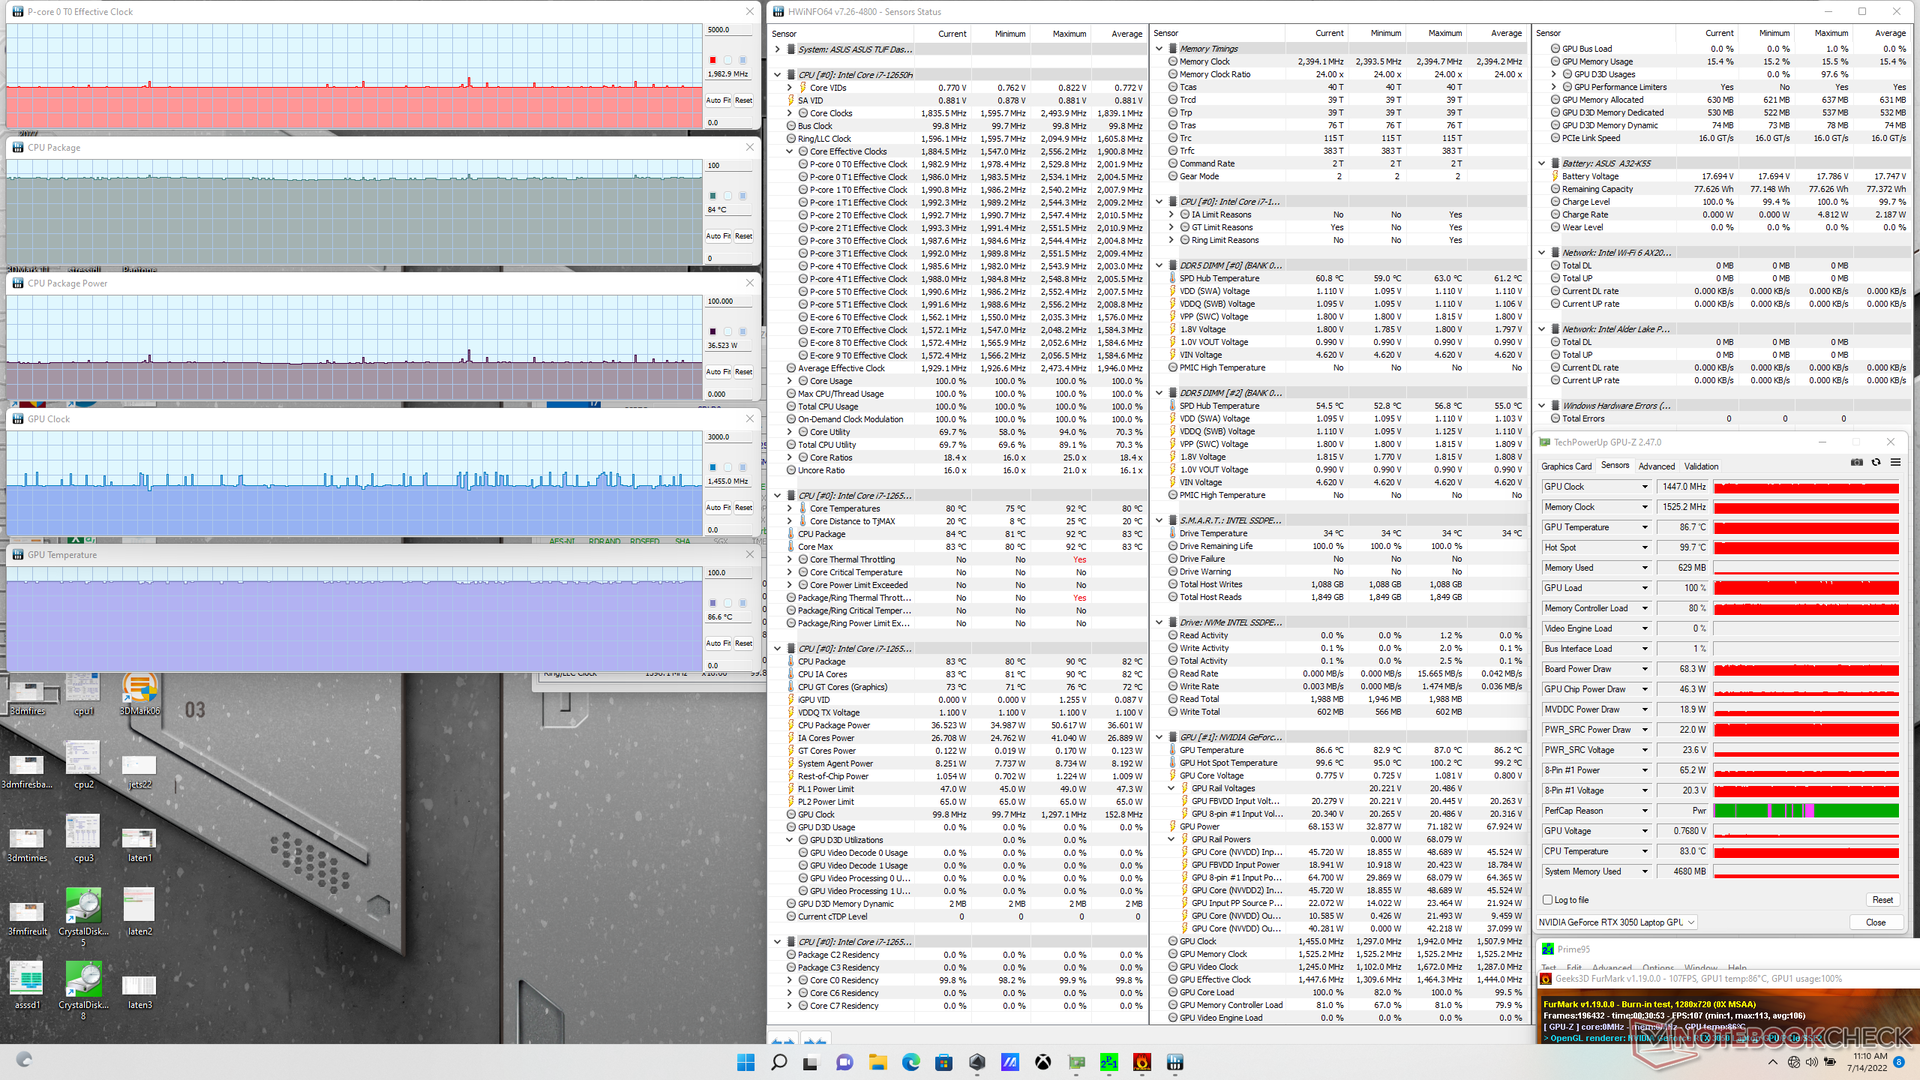
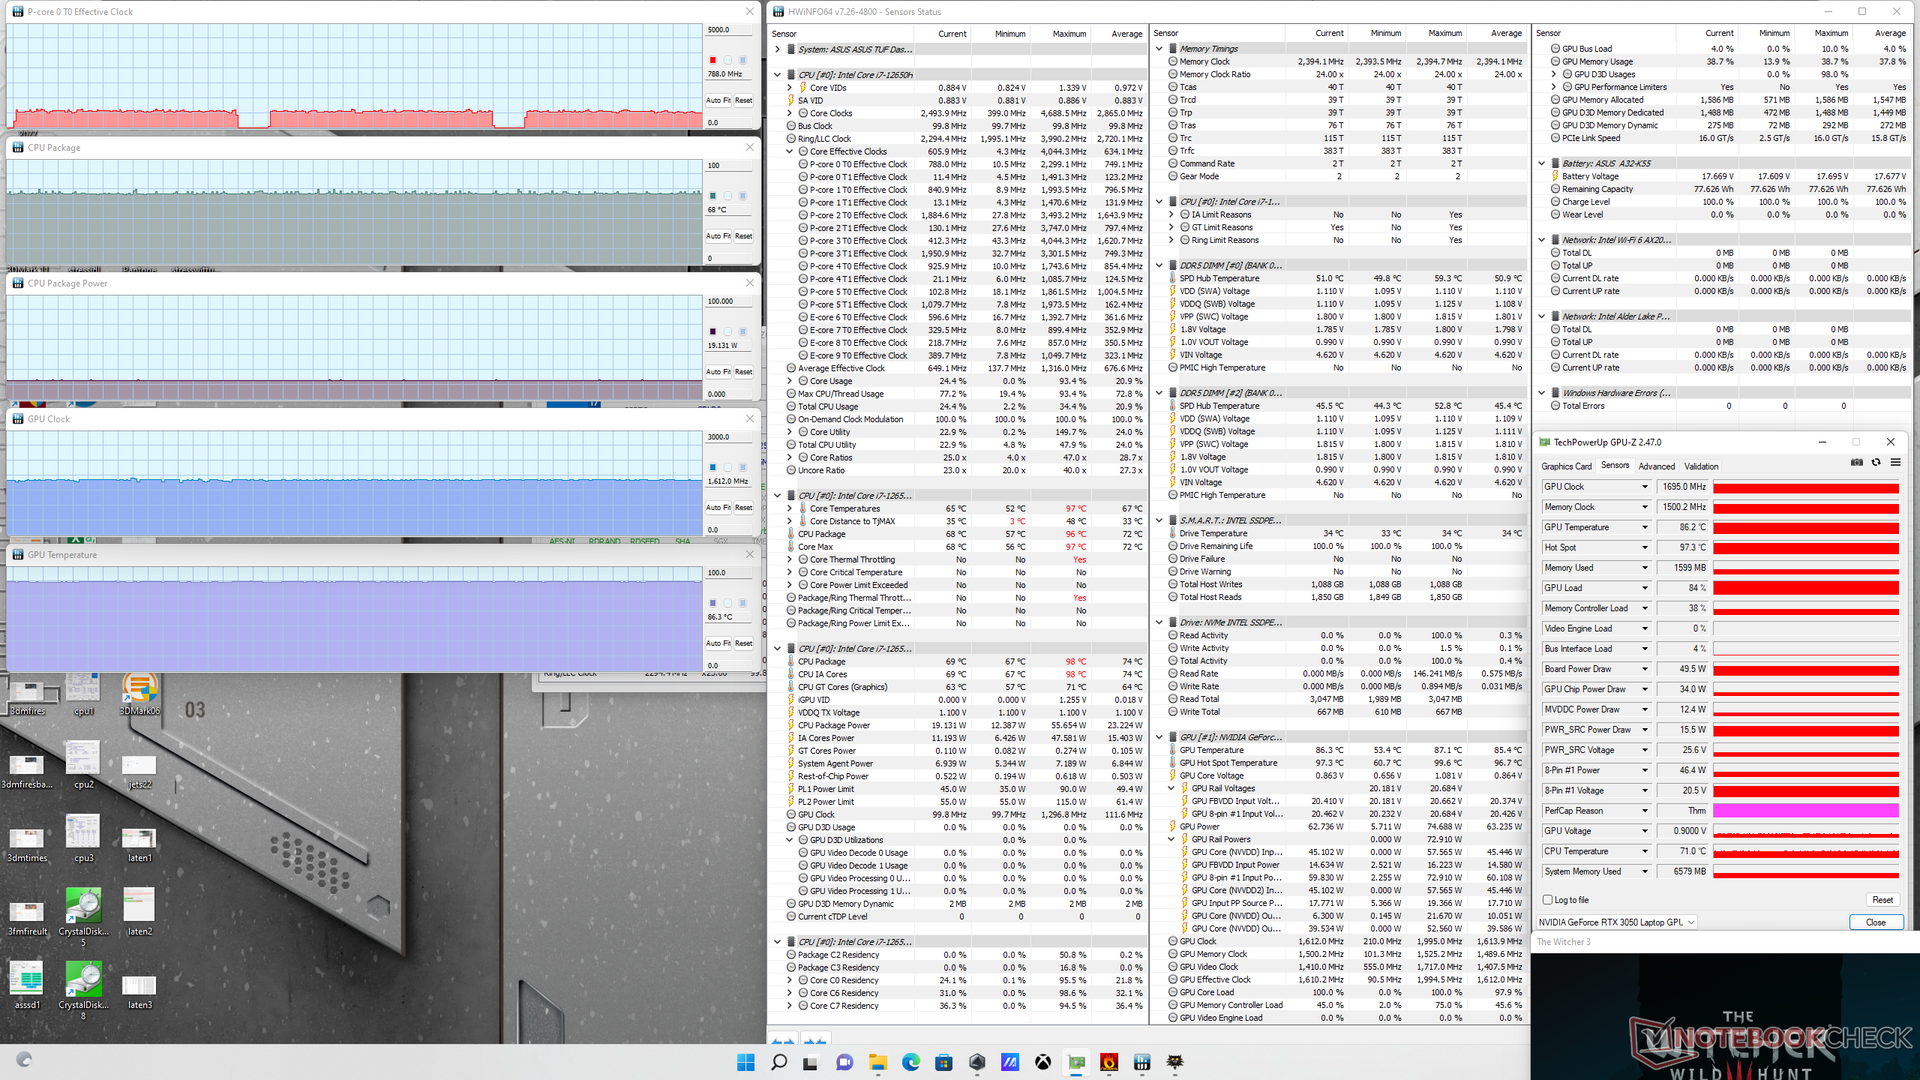
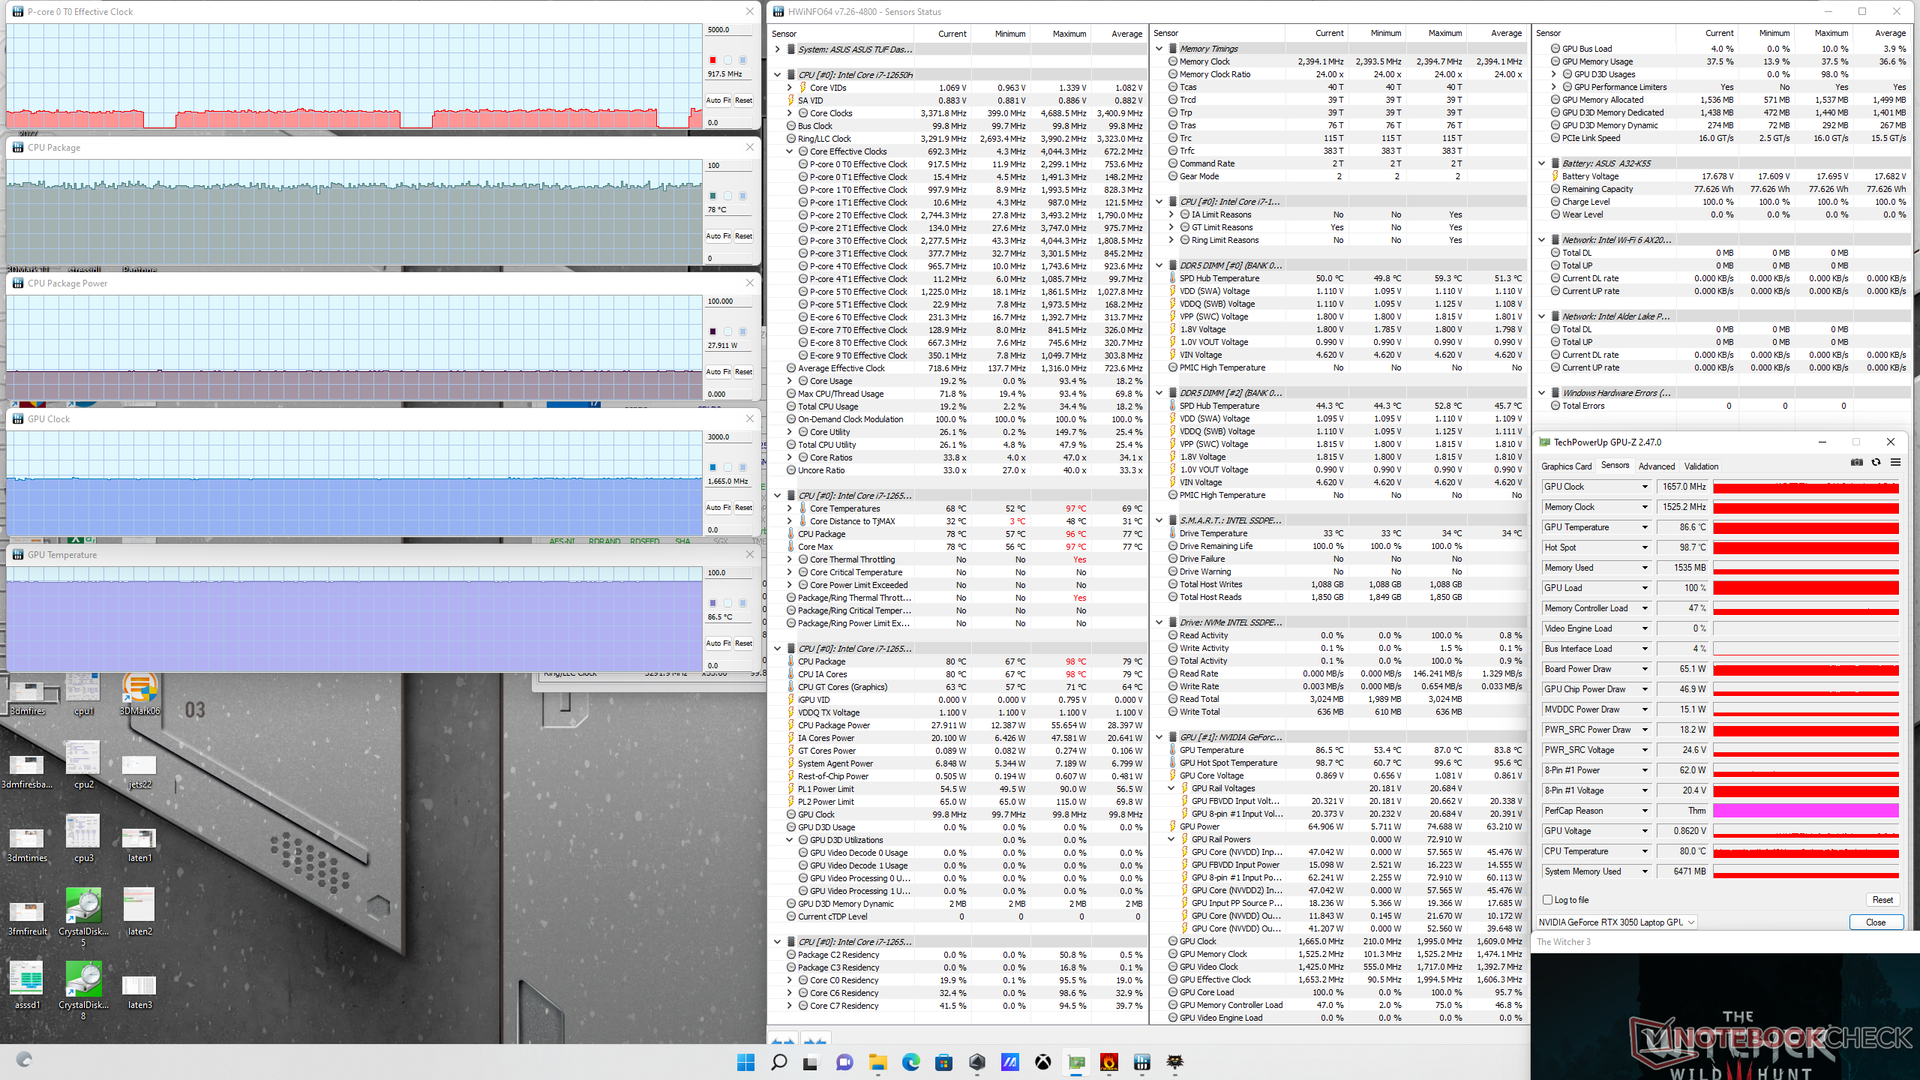
| CPU-Takt (GHz) | GPU-Takt (MHz) | Durchschnittliche CPU-Temperatur (°C) | Durchschnittliche GPU-Temperatur (°C) | |
| Leerlauf | -- | -- | 42 | 39 |
| Prime95-Stress | ~2,9 | -- | 95 | 52 |
| Prime95- + FurMark-Stress | 2,0 | 1455 | 84 | 87 |
| Witcher-3-Stress (Ausgeglichen) | ~0,8 | 1612 | 68 | 86 |
| Witcher-3-Stress (Turbo-Modus) | ~0,9 | 1665 | 78 | 86 |
Lautsprecher
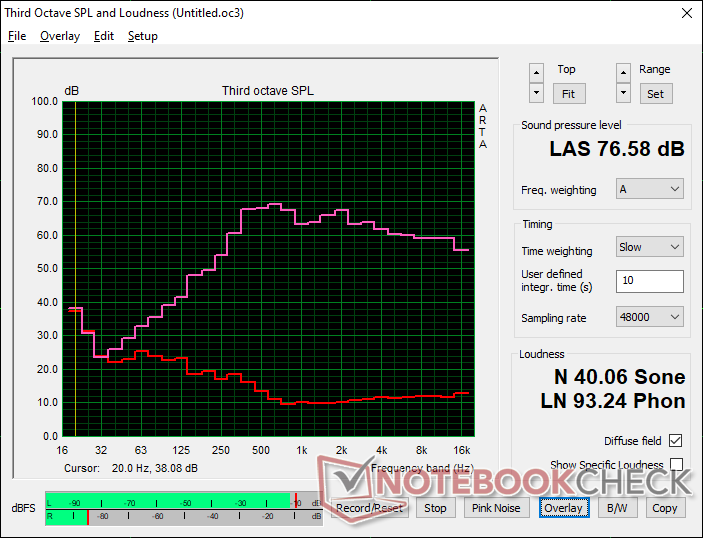
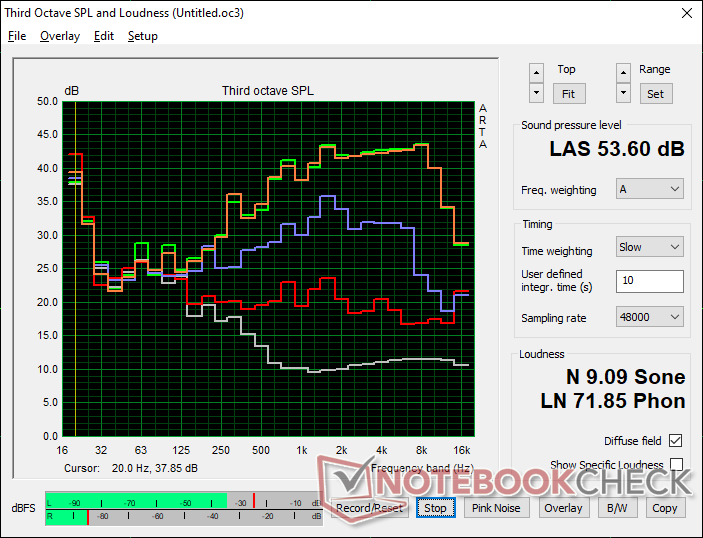
Asus TUF Dash F15 FX517ZC Audio Analyse
(±) | Mittelmäßig laut spielende Lautsprecher (76.6 dB)
Bass 100 - 315 Hz
(±) | abgesenkter Bass - 11.8% geringer als der Median
(±) | durchschnittlich lineare Bass-Wiedergabe (8.6% Delta zum Vorgänger)
Mitteltöne 400 - 2000 Hz
(±) | zu hohe Mitten, vom Median 6.1% abweichend
(+) | lineare Mitten (4.9% Delta zum Vorgänger)
Hochtöne 2 - 16 kHz
(+) | ausgeglichene Hochtöne, vom Median nur 1.6% abweichend
(+) | sehr lineare Hochtöne (2.8% Delta zum Vorgänger)
Gesamt im hörbaren Bereich 100 - 16.000 Hz
(+) | hörbarer Bereich ist sehr linear (14.2% Abstand zum Median
Im Vergleich zu allen Geräten derselben Klasse
» 25% aller getesteten Geräte dieser Klasse waren besser, 7% vergleichbar, 68% schlechter
» Das beste Gerät hat einen Delta-Wert von 6%, durchschnittlich ist 18%, das schlechteste Gerät hat 132%
Im Vergleich zu allen Geräten im Test
» 17% aller getesteten Geräte waren besser, 4% vergleichbar, 79% schlechter
» Das beste Gerät hat einen Delta-Wert von 4%, durchschnittlich ist 23%, das schlechteste Gerät hat 134%
Apple MacBook Pro 16 2021 M1 Pro Audio Analyse
(+) | Die Lautsprecher können relativ laut spielen (84.7 dB)
Bass 100 - 315 Hz
(+) | guter Bass - nur 3.8% Abweichung vom Median
(+) | lineare Bass-Wiedergabe (5.2% Delta zum Vorgänger)
Mitteltöne 400 - 2000 Hz
(+) | ausgeglichene Mitten, vom Median nur 1.3% abweichend
(+) | lineare Mitten (2.1% Delta zum Vorgänger)
Hochtöne 2 - 16 kHz
(+) | ausgeglichene Hochtöne, vom Median nur 1.9% abweichend
(+) | sehr lineare Hochtöne (2.7% Delta zum Vorgänger)
Gesamt im hörbaren Bereich 100 - 16.000 Hz
(+) | hörbarer Bereich ist sehr linear (4.6% Abstand zum Median
Im Vergleich zu allen Geräten derselben Klasse
» 0% aller getesteten Geräte dieser Klasse waren besser, 0% vergleichbar, 100% schlechter
» Das beste Gerät hat einen Delta-Wert von 5%, durchschnittlich ist 17%, das schlechteste Gerät hat 45%
Im Vergleich zu allen Geräten im Test
» 0% aller getesteten Geräte waren besser, 0% vergleichbar, 100% schlechter
» Das beste Gerät hat einen Delta-Wert von 4%, durchschnittlich ist 23%, das schlechteste Gerät hat 134%
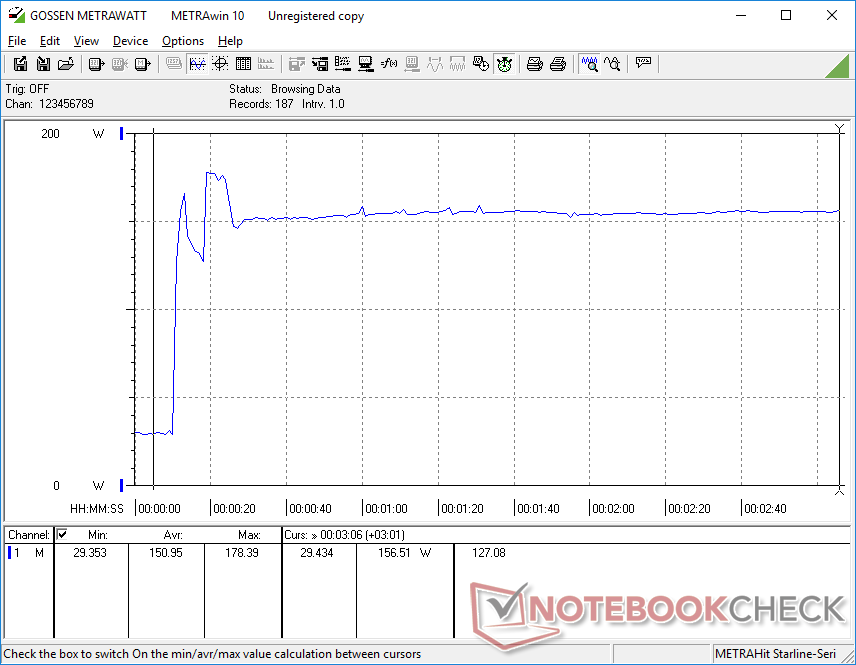
Energieverwaltung — Immer noch energiebedürftig
Energieaufnahme
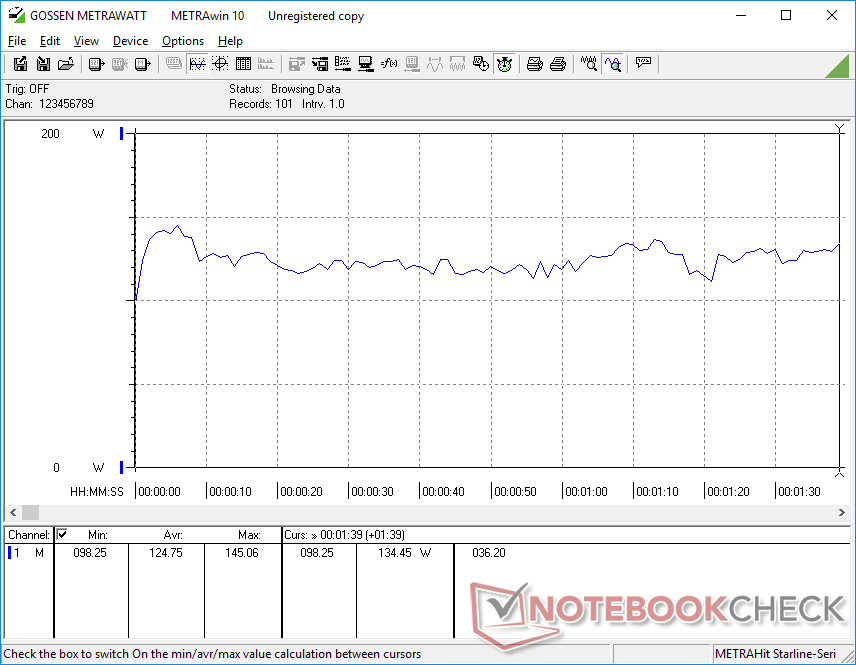
Die RTX 3050 ist um 40 Prozent langsamer als die RTX 3070. Heißt das also, dass die Energieaufnahme auch um 40 Prozent zurückgeht? Leider nicht. Unser FX517ZC benötigt nur 7 Prozent weniger Strom als das FX517ZR, wenn die gleichen Spiele bei den gleichen Grafikeinstellungen gespielt werden.
Hinweis: Das FX517ZC ist mit einem 180-W-Netzgerät (~15 x 7,2 x 2,3 cm) ausgestattet. Das FX517ZR wird hingegen mit einem etwas größeren 200-W-Netzgerät geliefert.
| Aus / Standby | |
| Idle | |
| Last |
|
Legende:
min: | |
| Asus TUF Dash F15 FX517ZC i7-12650H, GeForce RTX 3050 4GB Laptop GPU, Intel SSD 670p SSDPEKNU512GZ, IPS, 2560x1440, 15.6" | Asus TUF Dash F15 FX517ZR i7-12650H, GeForce RTX 3070 Laptop GPU, Samsung PM991a MZVLQ1T0HBLB, IPS, 2560x1440, 15.6" | Dell G15 5510 i5-10500H, GeForce RTX 3050 4GB Laptop GPU, SK Hynix BC711 HFM512GD3HX015N, IPS, 1920x1080, 15.6" | MSI Bravo 15 B5DD-010US R5 5600H, Radeon RX 5500M, Kingston OM8PCP3512F-AB, IPS, 1920x1080, 15.6" | Lenovo Ideapad Gaming 3 15IHU-82K1002RGE i5-11300H, GeForce RTX 3050 Ti Laptop GPU, Micron 2210 MTFDHBA512QFD, IPS, 1920x1080, 15.6" | Gigabyte G5 GD i5-11400H, GeForce RTX 3050 4GB Laptop GPU, ESR512GTLG-E6GBTNB4, IPS, 1920x1080, 15.6" | |
|---|---|---|---|---|---|---|
| Stromverbrauch | 4% | 28% | 33% | 35% | 6% | |
| Idle min * (Watt) | 9.2 | 10 -9% | 3 67% | 6.6 28% | 4.9 47% | 13 -41% |
| Idle avg * (Watt) | 15.9 | 14 12% | 8 50% | 9.8 38% | 8.3 48% | 15 6% |
| Idle max * (Watt) | 29.5 | 20 32% | 13 56% | 10.8 63% | 8.9 70% | 20 32% |
| Last avg * (Watt) | 124.8 | 122 2% | 103 17% | 70.5 44% | 81 35% | 102 18% |
| Witcher 3 ultra * (Watt) | 129.2 | 138.6 -7% | 139.5 -8% | 103.2 20% | 119 8% | 124 4% |
| Last max * (Watt) | 178.4 | 189 -6% | 204 -14% | 175 2% | 172 4% | 148 17% |
* ... kleinere Werte sind besser
Verbrauch Witcher 3 / Stresstest
Verbrauch external Monitor
Akkulaufzeit — Gar nicht so lang
Die Akkulaufzeit ist kürzer als erwartet. Wir vermuten, dass das an einem Fehler. Im Energieprofil "Ausgeglichen" mit der integrierten GPU (MSHybrid) konnten wir im Test nur eine Laufzeit von knapp 4 Stunden erreichen, während das FX517ZR 7 Stunden durchgehalten hat. Die Ergebnisse haben sich auch bei wiederholten Durchgängen des Tests nicht gebessert.
| Asus TUF Dash F15 FX517ZC i7-12650H, GeForce RTX 3050 4GB Laptop GPU, 76 Wh | Asus TUF Dash F15 FX517ZR i7-12650H, GeForce RTX 3070 Laptop GPU, 76 Wh | Dell G15 5510 i5-10500H, GeForce RTX 3050 4GB Laptop GPU, 56 Wh | MSI Bravo 15 B5DD-010US R5 5600H, Radeon RX 5500M, 53 Wh | Lenovo Ideapad Gaming 3 15IHU-82K1002RGE i5-11300H, GeForce RTX 3050 Ti Laptop GPU, 45 Wh | Gigabyte G5 GD i5-11400H, GeForce RTX 3050 4GB Laptop GPU, 41 Wh | |
|---|---|---|---|---|---|---|
| Akkulaufzeit | 75% | 50% | 58% | 65% | -22% | |
| WLAN (h) | 4 | 7 75% | 6 50% | 6.3 58% | 6.6 65% | 3.1 -22% |
| Idle (h) | 10.8 | 11.3 | 9.2 | 5.7 | ||
| H.264 (h) | 5.8 | 7.7 | 3.6 | |||
| Last (h) | 2.3 | 1 | 1 | 1.1 | 1.1 |
Pro
Contra
Fazit — Einstiegsbepreisung mit ausgezeichnetem, hochwertigem Display
Abgesehen von dem offensichtlichen Preisvorteil könnten Nutzer Gaming-Modelle aus dem Einsteigerbereich alleine aufgrund der ruhigeren Lüfter, der kühleren Temperaturen, der längeren Akkulaufzeit und der niedrigeren Energieaufnahme bevorzugen. Wir hätten daher erwartet, dass das Asus TUF Dash F15 FX517ZC mit dem RTX 3050 leiser und kühler ist, eine längere Akkulaufzeit hat und weniger Strom benötigt als das TUF Dash F15 FX517ZR mit RTX 3070. In Wahrheit sind die Unterschiede zwischen dem FX517ZC und dem FX517ZR, was die Temperatur, Energieaufnahme und Lautstärke betrifft, leider relativ gering, insbesondere wenn man den sehr großen Unterschied in der GPU-Leistung betrachtet. Nutzer, die sich vom FX517ZC einen deutlich leiseren, kühleren und langlebigeren Notebook erwartet haben, könnten enttäuscht sein.
Das Asus TUF Dash F15 FX517ZC ist mit einem besseren 1.440p-165-Hz-IPS-Display ausgestattet, als dies für diese Preiskategorie üblich ist. Die Energieaufnahme, das Lüftergeräusch und die Akkulaufzeit sind allerdings kaum besser als bei leistungsstärkeren Konfigurationen.
Für einen Gaming-Laptop aus dem Einsteigerbereich ist das FX517ZC dennoch ein ziemlich gutes Gerät, das weder beim Display, beim RAM-Modul noch bei der CPU Abstriche macht - das kann man über viele andere Gaming-Laptops in dieser Preisklasse nicht sagen. Das 1.440p-Panel deckt den P3-Farbraum vollständig hab, bietet schnelle Reaktionszeiten, unterstützt Adaptive Sync und hat 165 Hz - eine Rarität unter Budget-Modellen. Die CPU der 12. Generation Core i7-12650H unterscheidet sich zwar nicht maßgeblich von der Core i7-11800H der 11. Generation, passt in diesem Fall aber gut zur preiswerten GPU RTX 3050.
Preis und Verfügbarkeit
Die Reihe Asus TUF Dash F15 FX517 ist ab sofort online erhältlich. Die getestete Konfiguration mit RTX 3050 ist aktuell allerdings noch selten zu finden. Ein Modell mit RTX 3060 ist zum Beispiel direkt auf der Herstellerwebsite Asus erhältlich.
Asus TUF Dash F15 FX517ZC
- 08.08.2022 v7 (old)
Allen Ngo
Preisvergleich

