Intels Core i7-12800HX ist der Wahnsinn: Test MSI Raider GE67 HX 12UGS Laptop
Das MSI GE67 gehört zur Hochleistungs-Gaming-Serie, die über den günstigeren Katana-GF- und Vector-GP-Serien, jedoch unter der Flaggschiff-Titan-GT-Reihe angesiedelt ist. Unser GE67-Testgerät ist der direkte Nachfolger des GE66 aus 2020. Statt der Comet-Lake-H-CPU aus Intels 10. Generation und Nvidia-GeForce-Super-GPUs ist das GE67 mit Alder-Lake-HX-CPUs und mobilen GeForce-Ti-GPUs ausgestattet.
Wir empfehlen einen Blick auf unsere beiden bestehenden Test MSI GE66 Raider 10SFS Laptop: Premiere für die RTX 2070 SuperTests zum GE66, da das neue Modell größtenteils das gleiche Gehäusedesign nutzt und ähnliche Ausstattungsmerkmale bietet. Trotzdem gibt es einige optische Unterschiede, auf die wir unten im Detail eingehen.
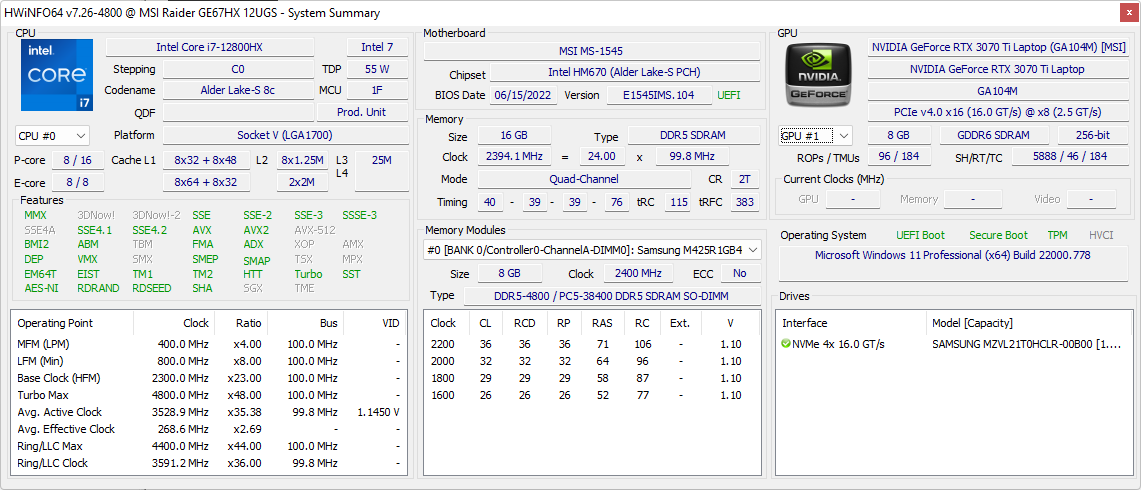
Unser Testgerät ist mit dem 16-Kernprozessor Core i7-12800HX, einer GeForce RTX 3070 Ti und einem 240-Hz-QHD-OLED-Panel mit einer laut MSI vollständigen DCI-P3-Farbraumabdeckung ausgestattet und kostet in dieser Konfiguration ca. 3000 Euro. Zu den direkten Konkurrenten in diesem Bereich zählen andere High-End-15,6-Zoll-Gaming-Laptops wie das Asus ROG Strix Scar 15, Razer Blade 15 und das Alienware m15 R6.
Weitere MSI-Tests:
Mögliche Konkurrenten im Vergleich
Bew. | Datum | Modell | Gewicht | Dicke | Größe | Auflösung | Preis ab |
|---|---|---|---|---|---|---|---|
| 87.7 % v7 (old) | 07 / 2022 | MSI GE67 HX 12UGS i7-12800HX, GeForce RTX 3070 Ti Laptop GPU | 2.5 kg | 23.4 mm | 15.60" | 1920x1080 | |
| 87.4 % v7 (old) | 06 / 2022 | MSI Raider GE66 12UHS i9-12900HK, GeForce RTX 3080 Ti Laptop GPU | 2.4 kg | 23.4 mm | 15.60" | 3840x2160 | |
| 86.9 % v7 (old) | 03 / 2022 | MSI Vector GP66 12UGS i9-12900H, GeForce RTX 3070 Ti Laptop GPU | 2.3 kg | 23.4 mm | 15.60" | 1920x1080 | |
| 86.3 % v7 (old) | 06 / 2022 | Asus ROG Strix Scar 15 G533ZW-LN106WS i9-12900H, GeForce RTX 3070 Ti Laptop GPU | 2.3 kg | 27.2 mm | 15.60" | 2560x1440 | |
| 86.1 % v7 (old) | 11 / 2021 | Alienware m15 R6, i7-11800H RTX 3080 i7-11800H, GeForce RTX 3080 Laptop GPU | 2.5 kg | 22.85 mm | 15.60" | 1920x1080 | |
| 89.1 % v7 (old) | 03 / 2022 | Razer Blade 15 2022 i7-12800H, GeForce RTX 3080 Ti Laptop GPU | 2.1 kg | 16.99 mm | 15.60" | 2560x1440 |
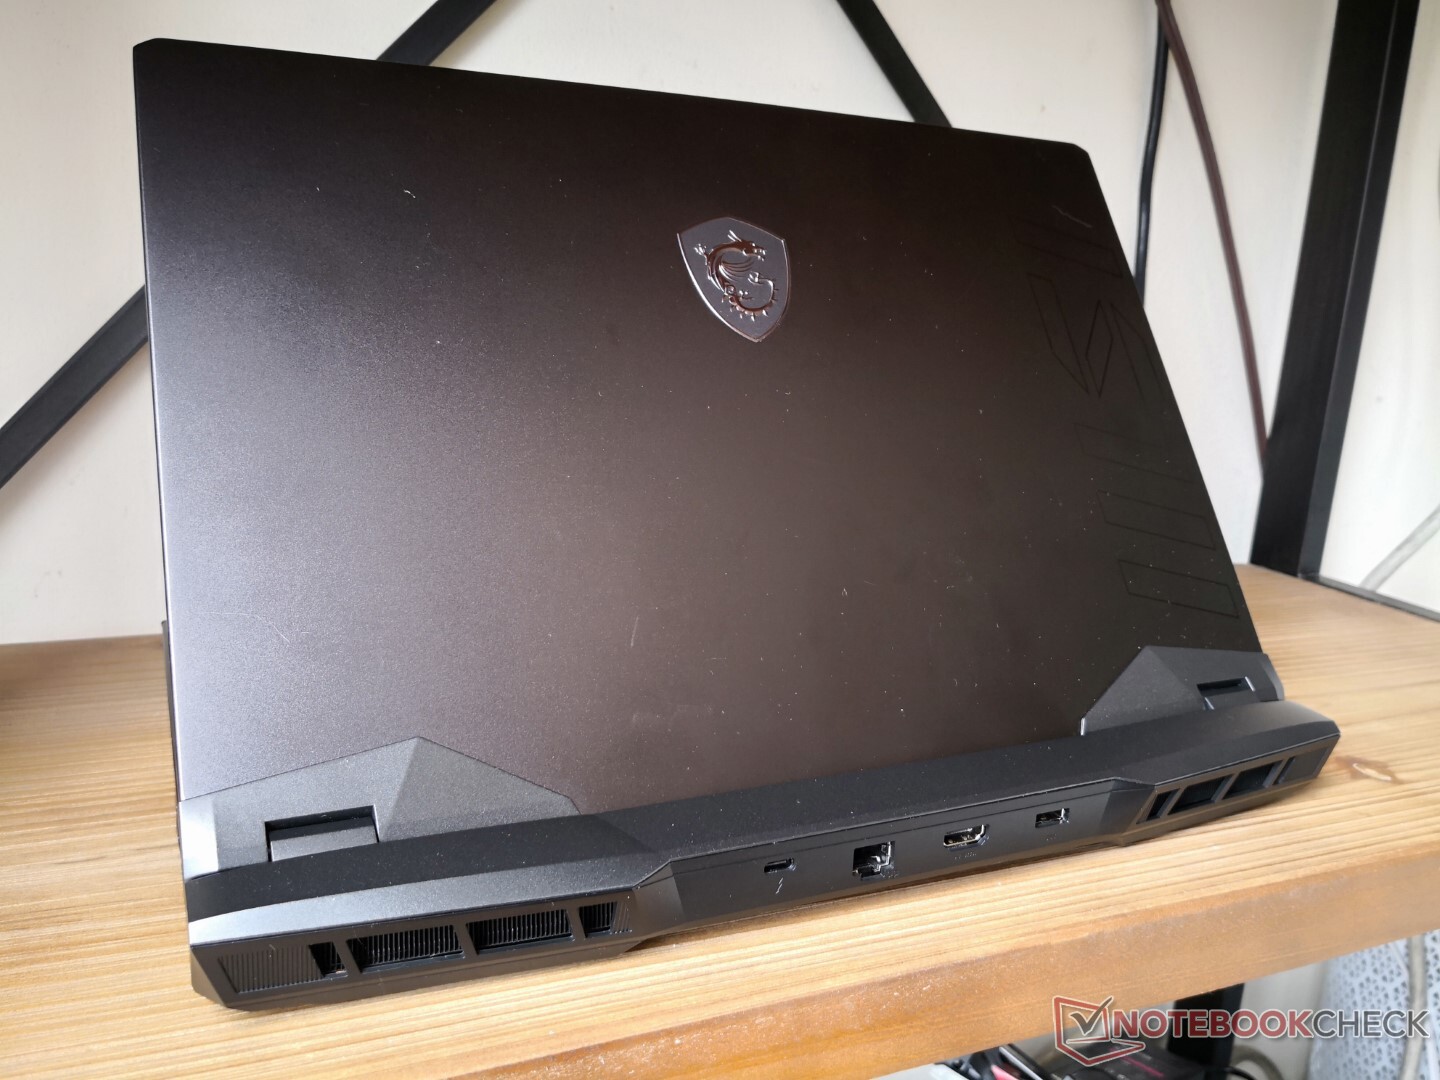
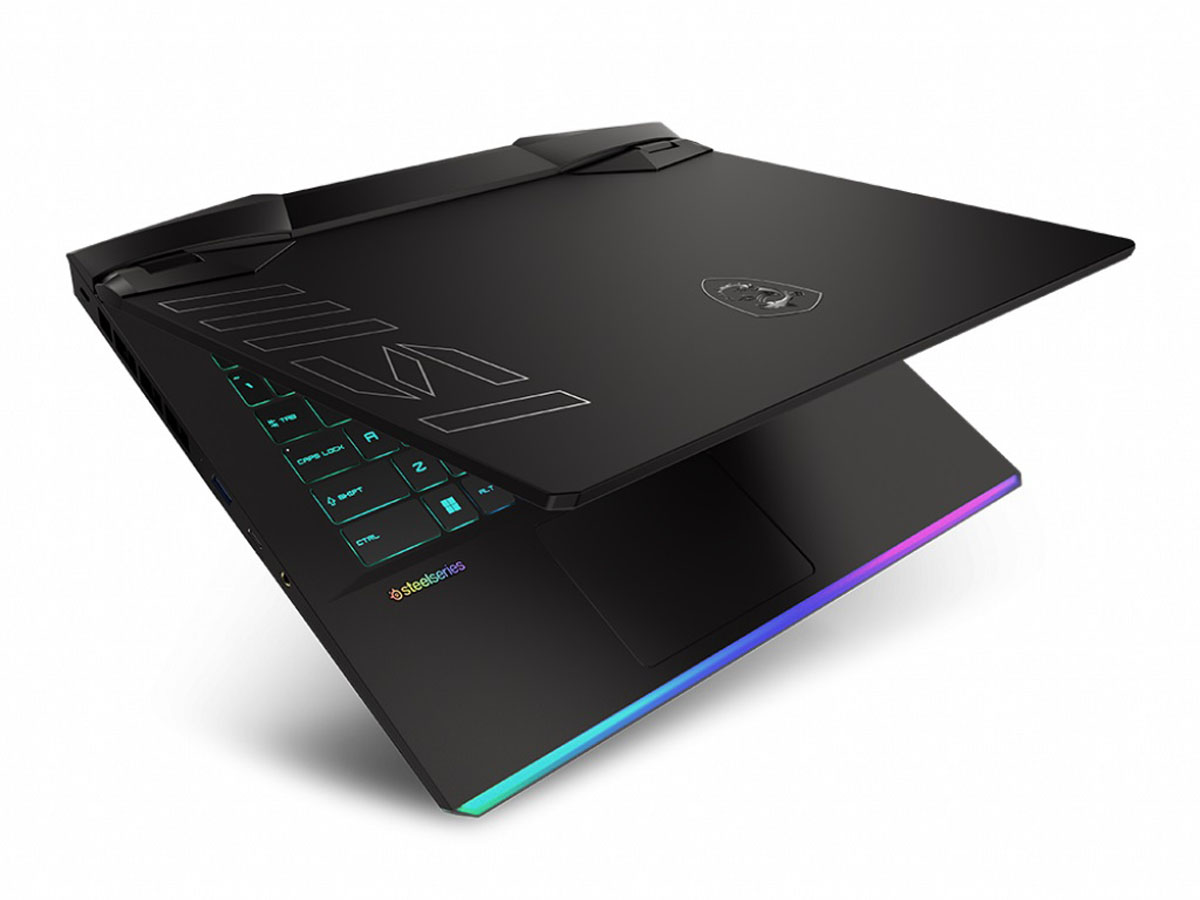
Gehäuse — Oben gleich, unten nicht
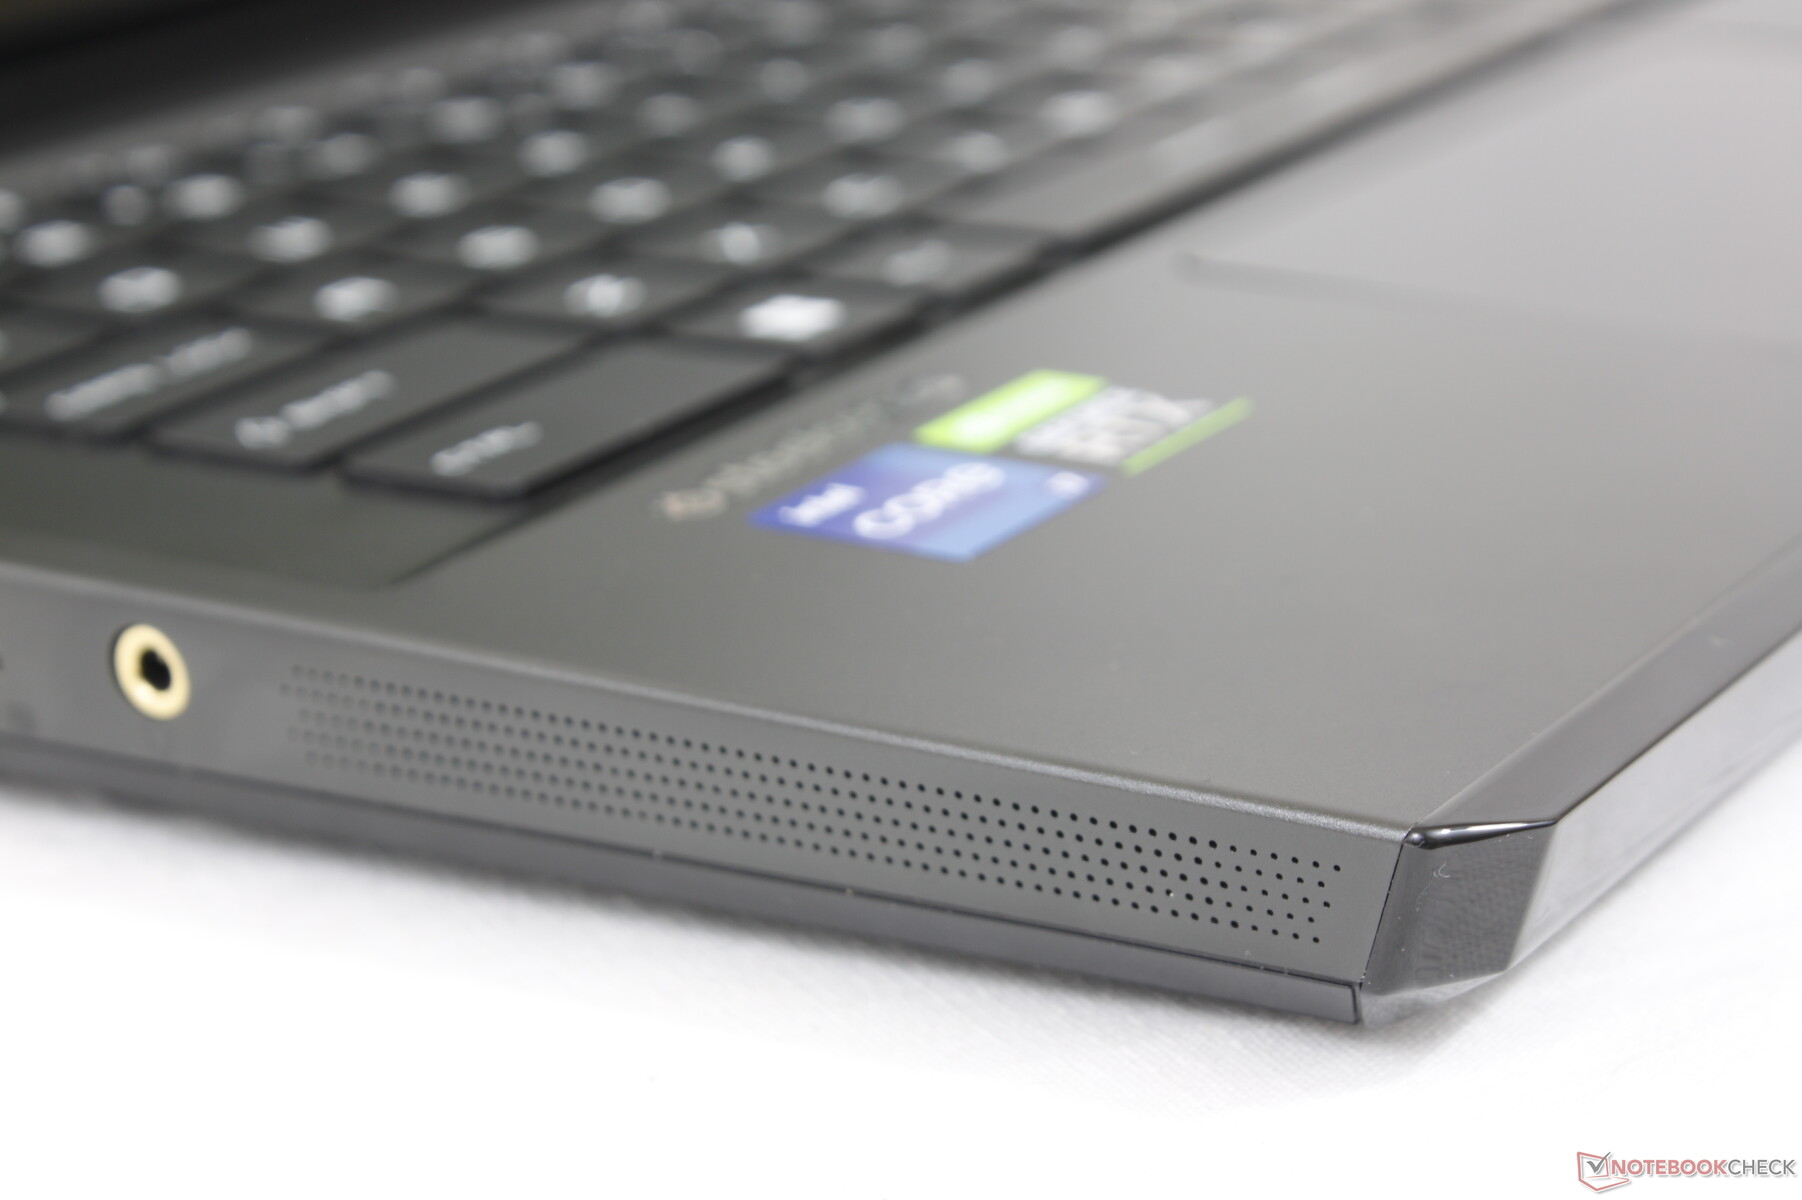
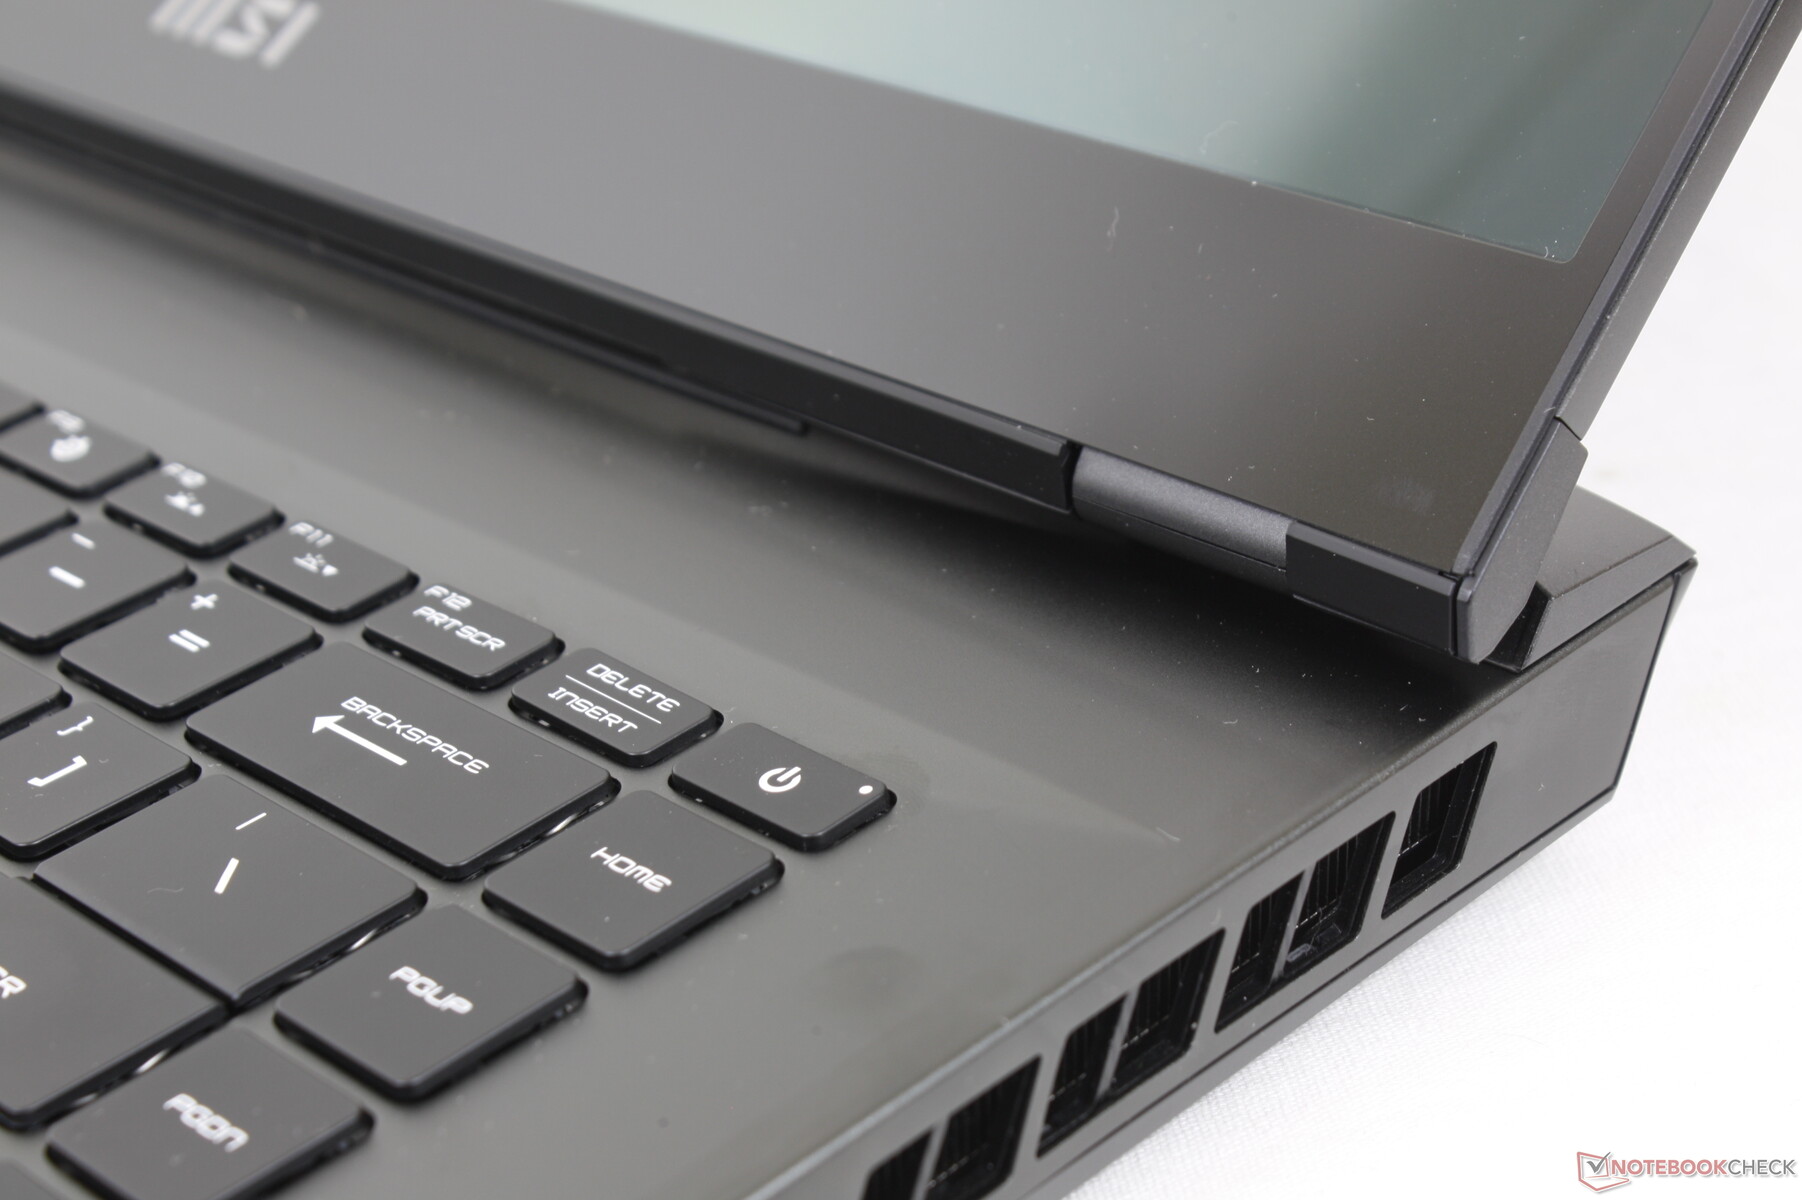
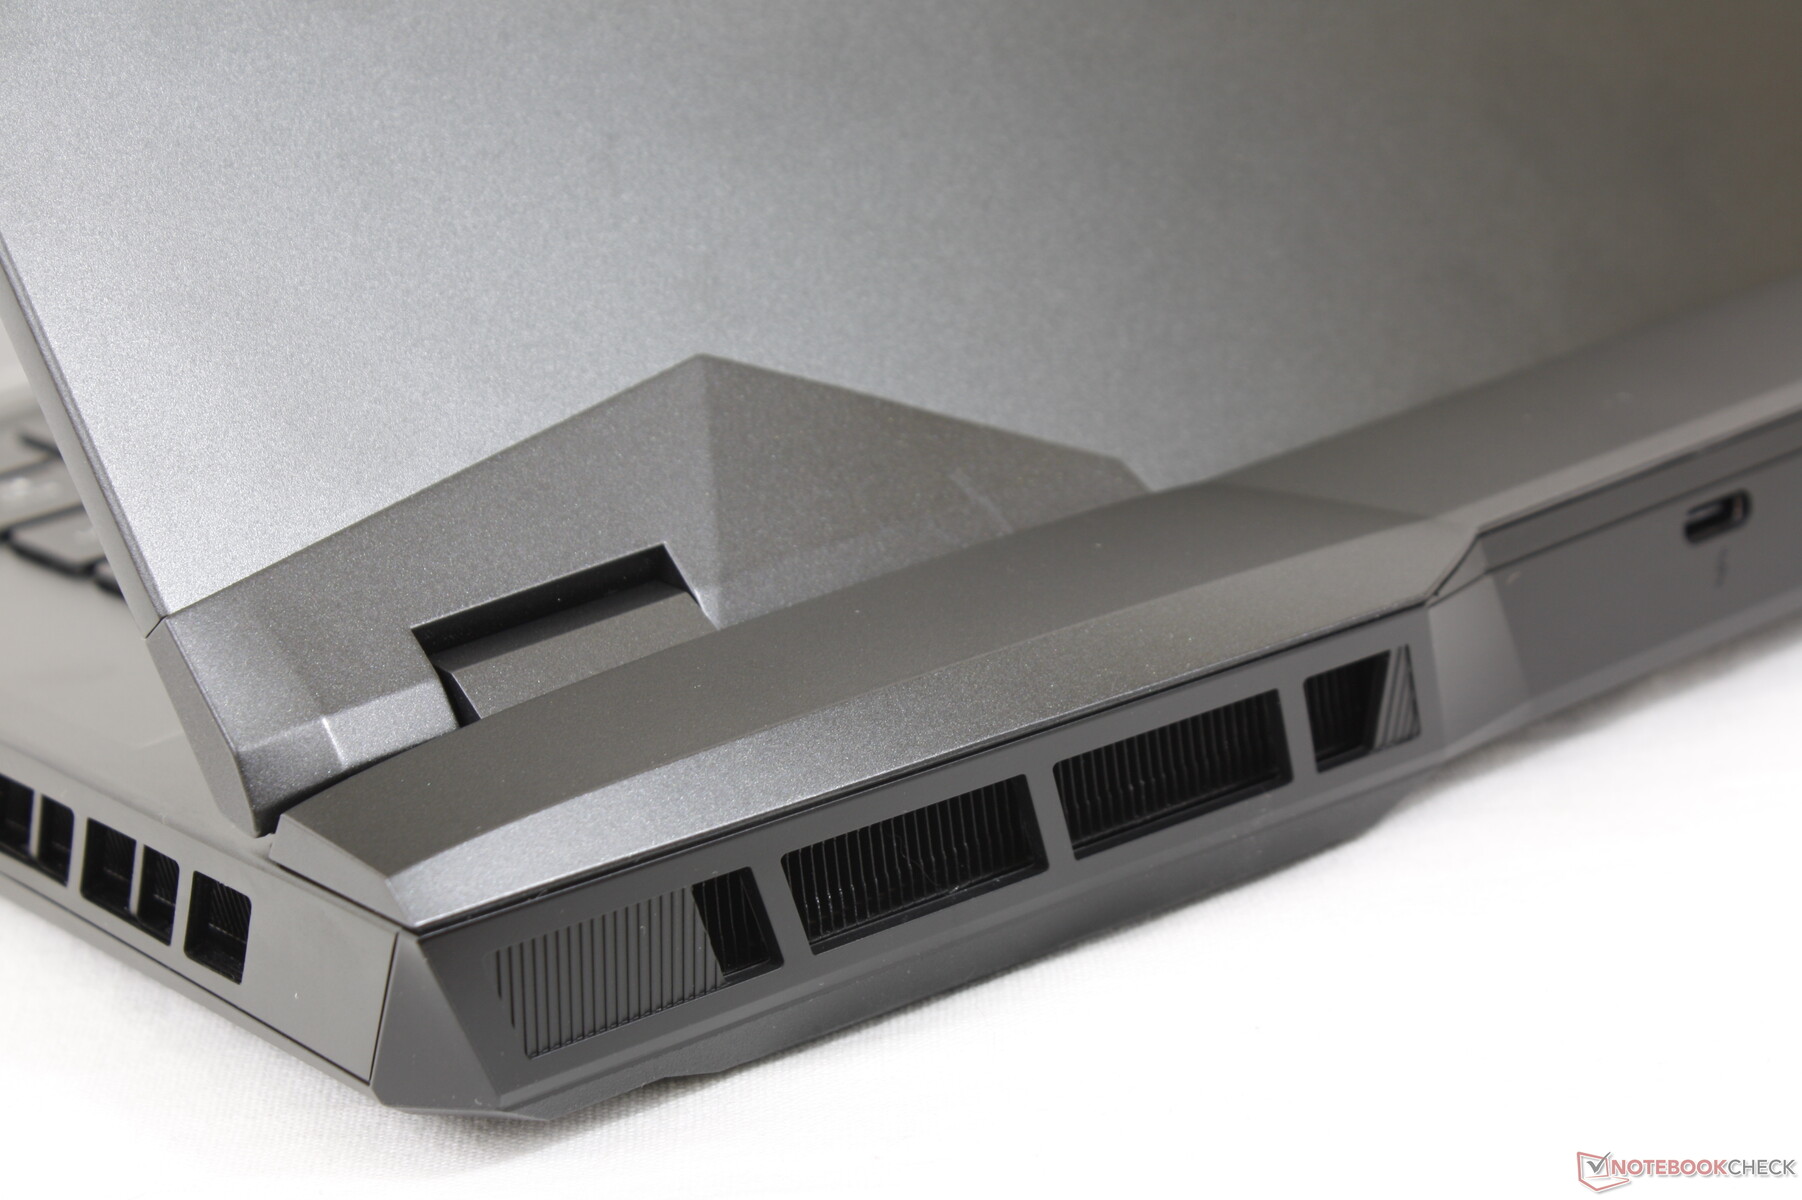
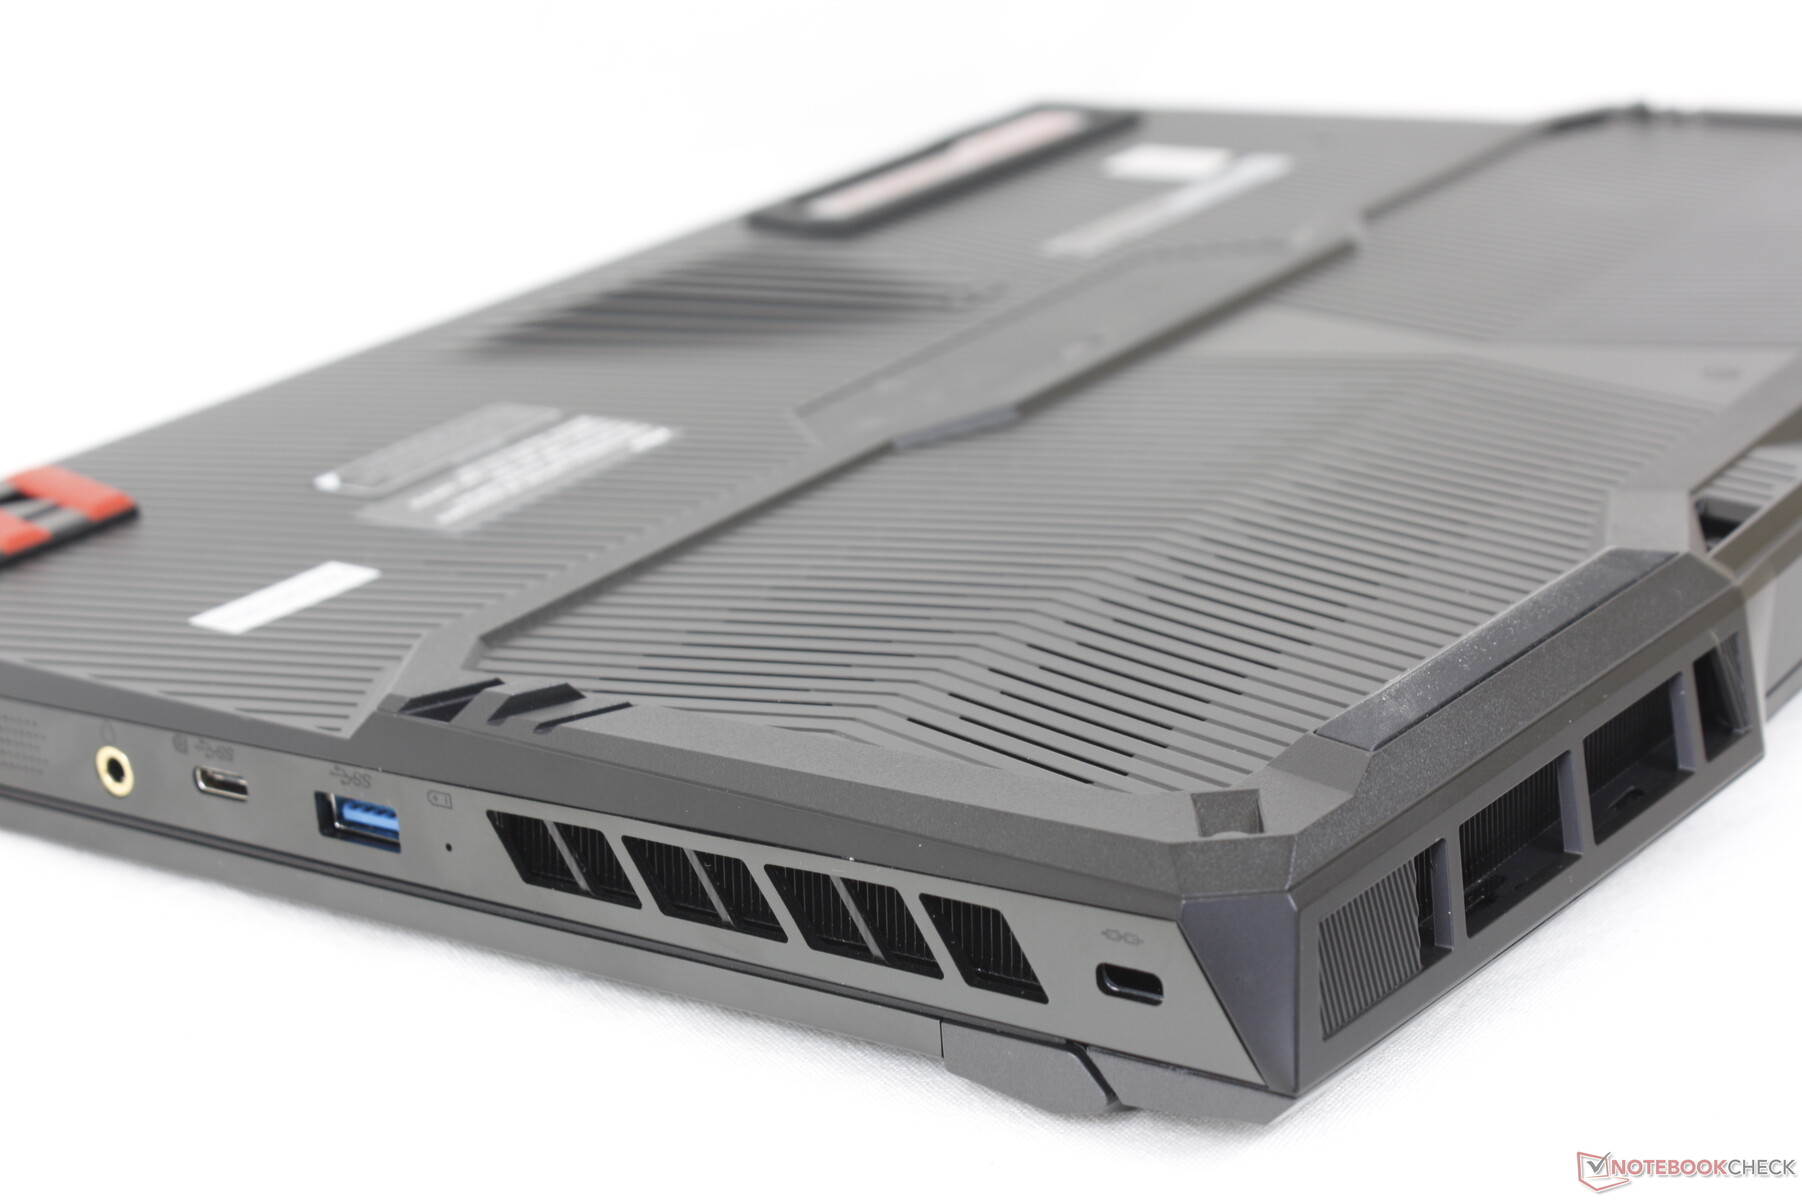
Obwohl die Gehäuseabmessungen mit denen des GE66 identisch sind, gibt es einige optischen Unterschiede. Erstens ziert beim GE67 ein großes MSI-Logo die linke Kante der Außenseite des Deckels, wodurch man das GE67 einfacher vom GE66 unterscheiden kann. Zweitens hat MSI die Unterseite des GE67 vollständig überarbeitet, was vermutlich der potenziellen Kühlleistung des neuen Modells zugute kommen soll. Davon abgesehen setzen das GE66 und das GE67 auf ähnliche Materialien für den Deckel und die Tastaturgrundfläche und auf eine Plastikbodenplatte. Die MSI-typische LED-Leiste an der Vorderkante bleibt unberührt.
Das neue Modell ist mit ca. 100 g mehr etwas schwerer als seine Vorgänger, was vermutlich auf die kleinen Änderungen zurückzuführen ist.
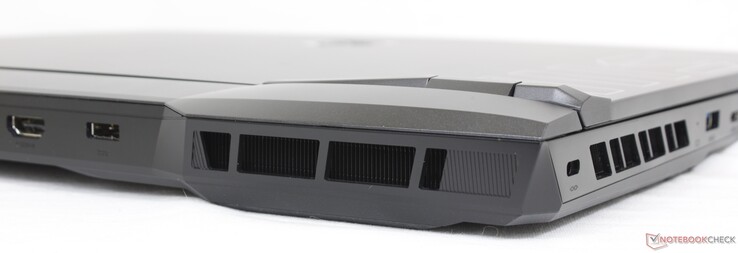
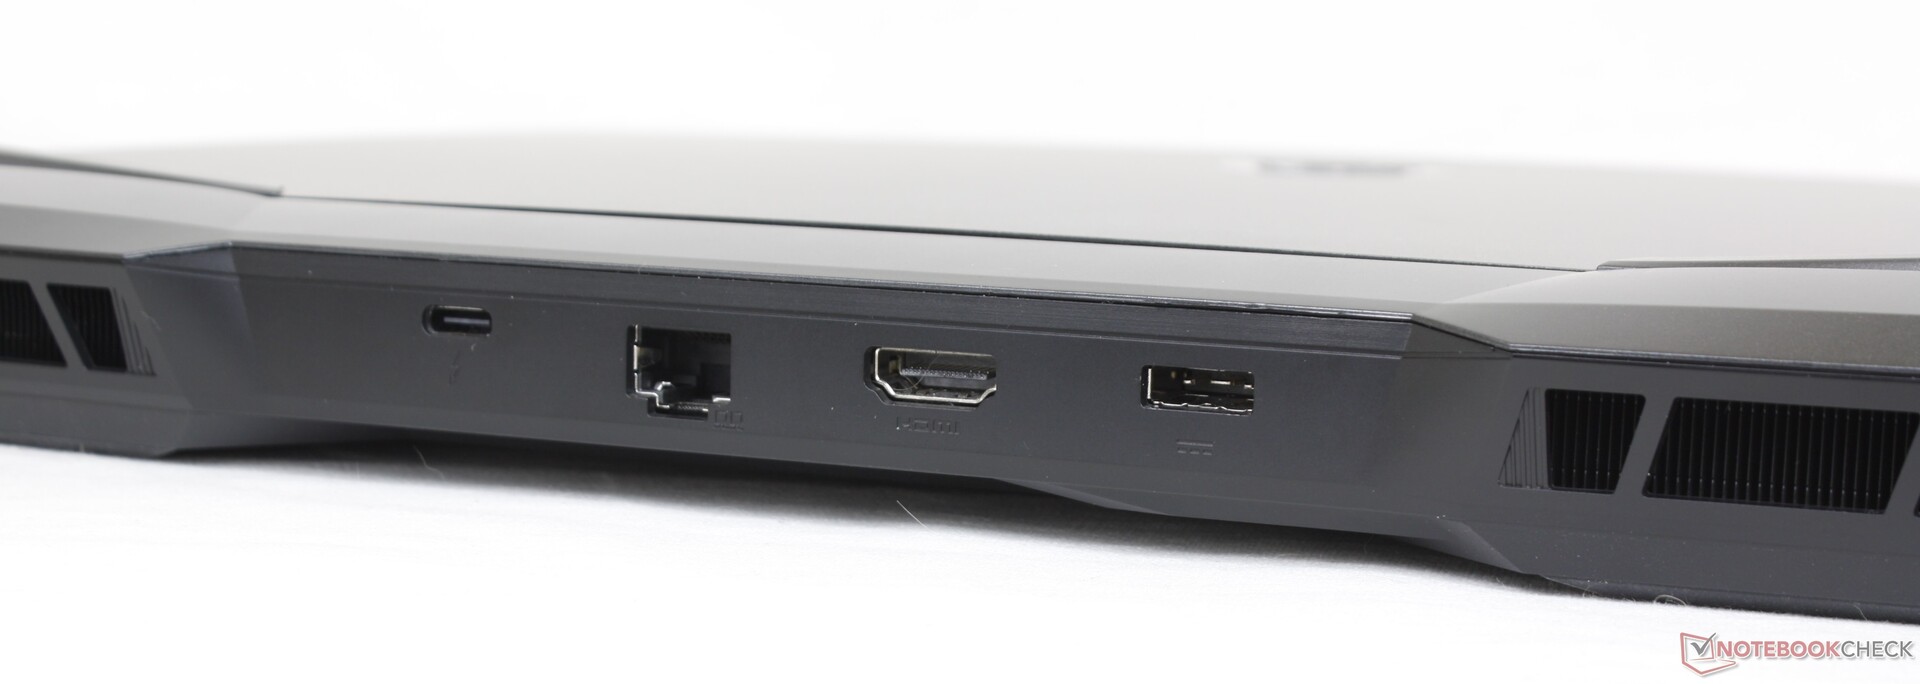
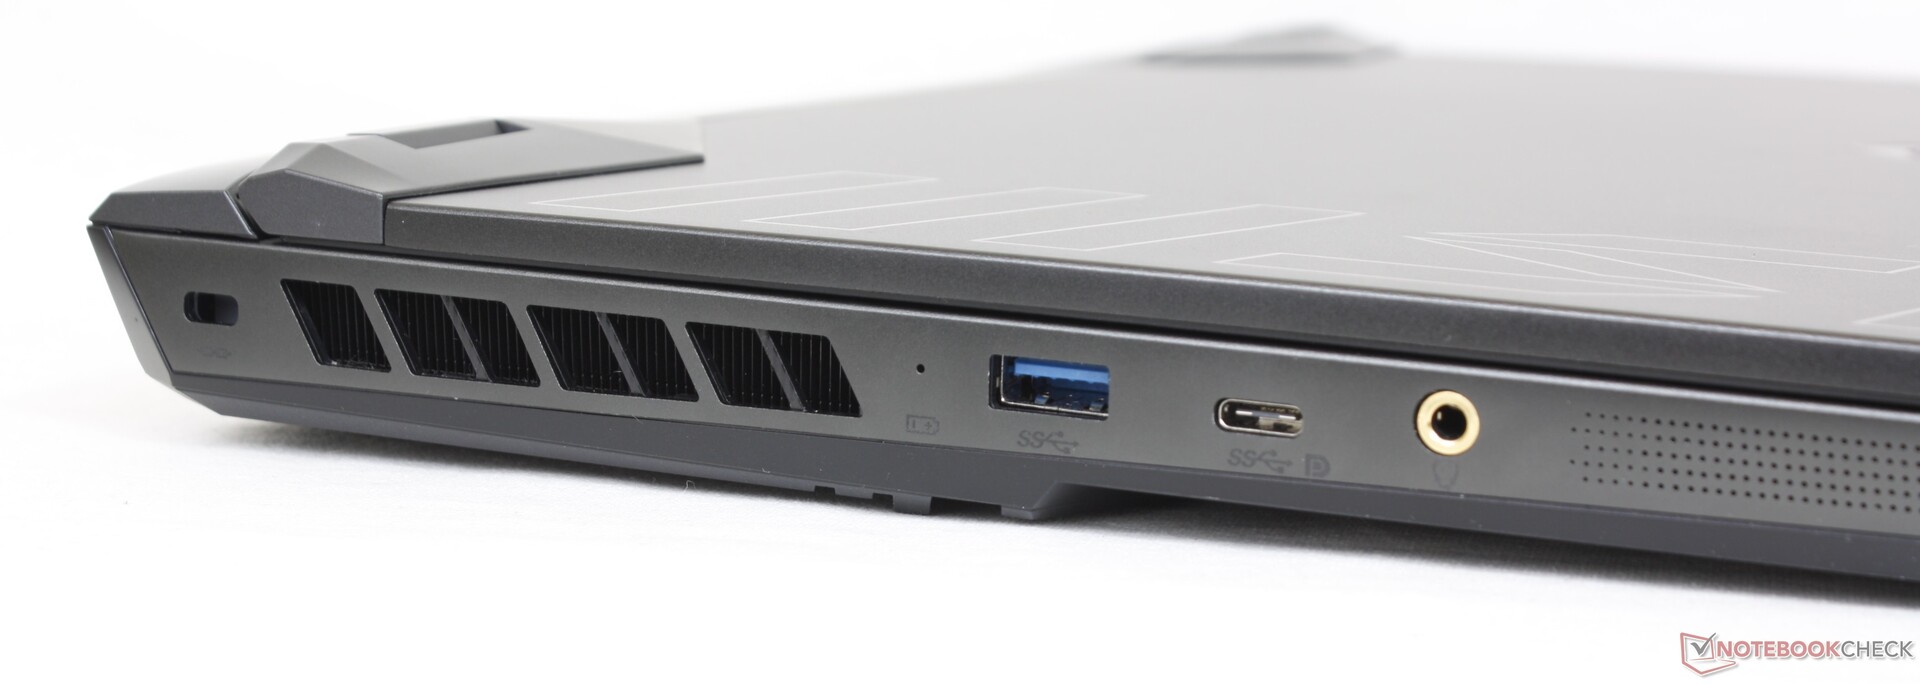
Ausstattung — Kein Mini-DisplayPort mehr
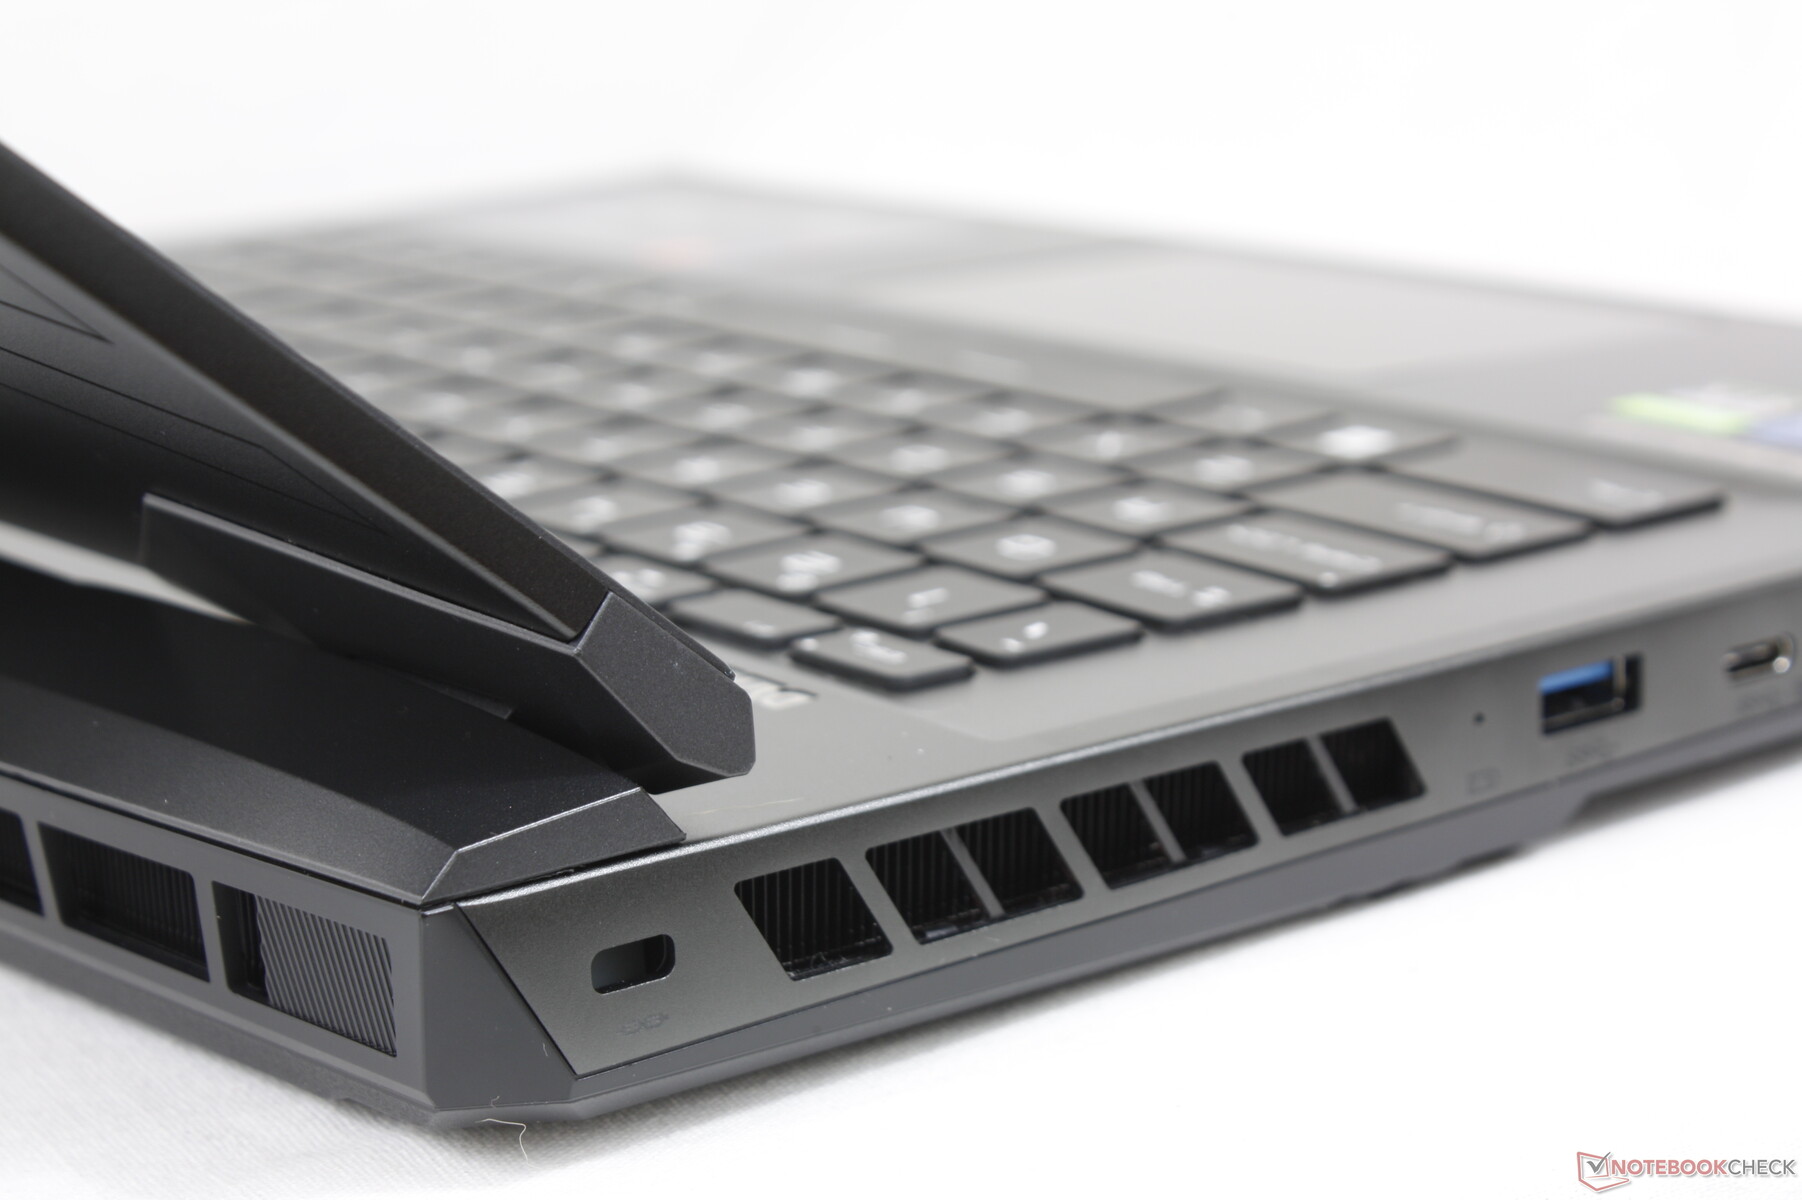
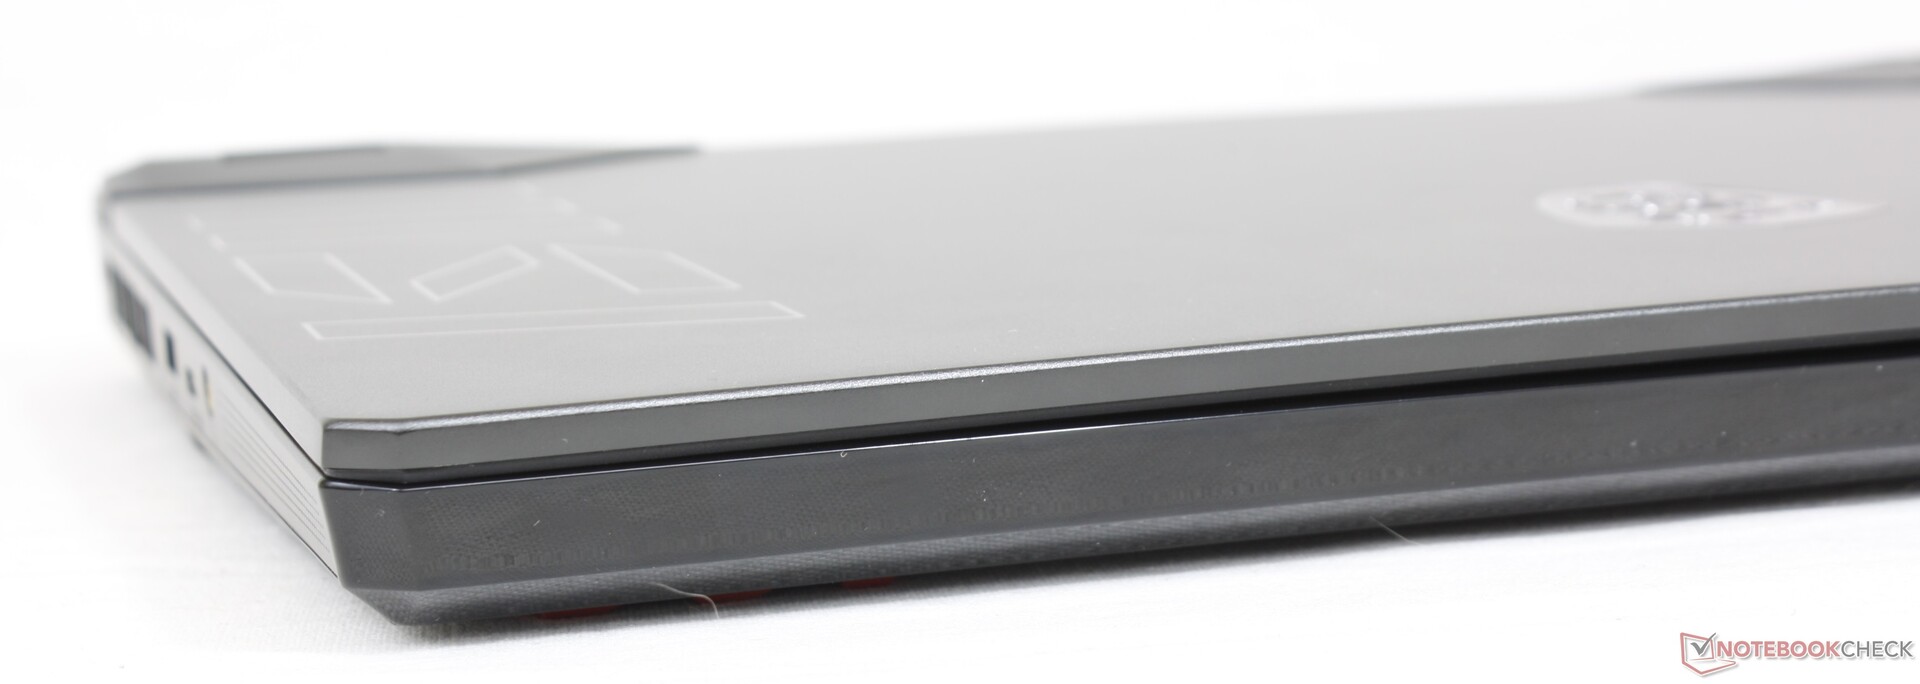
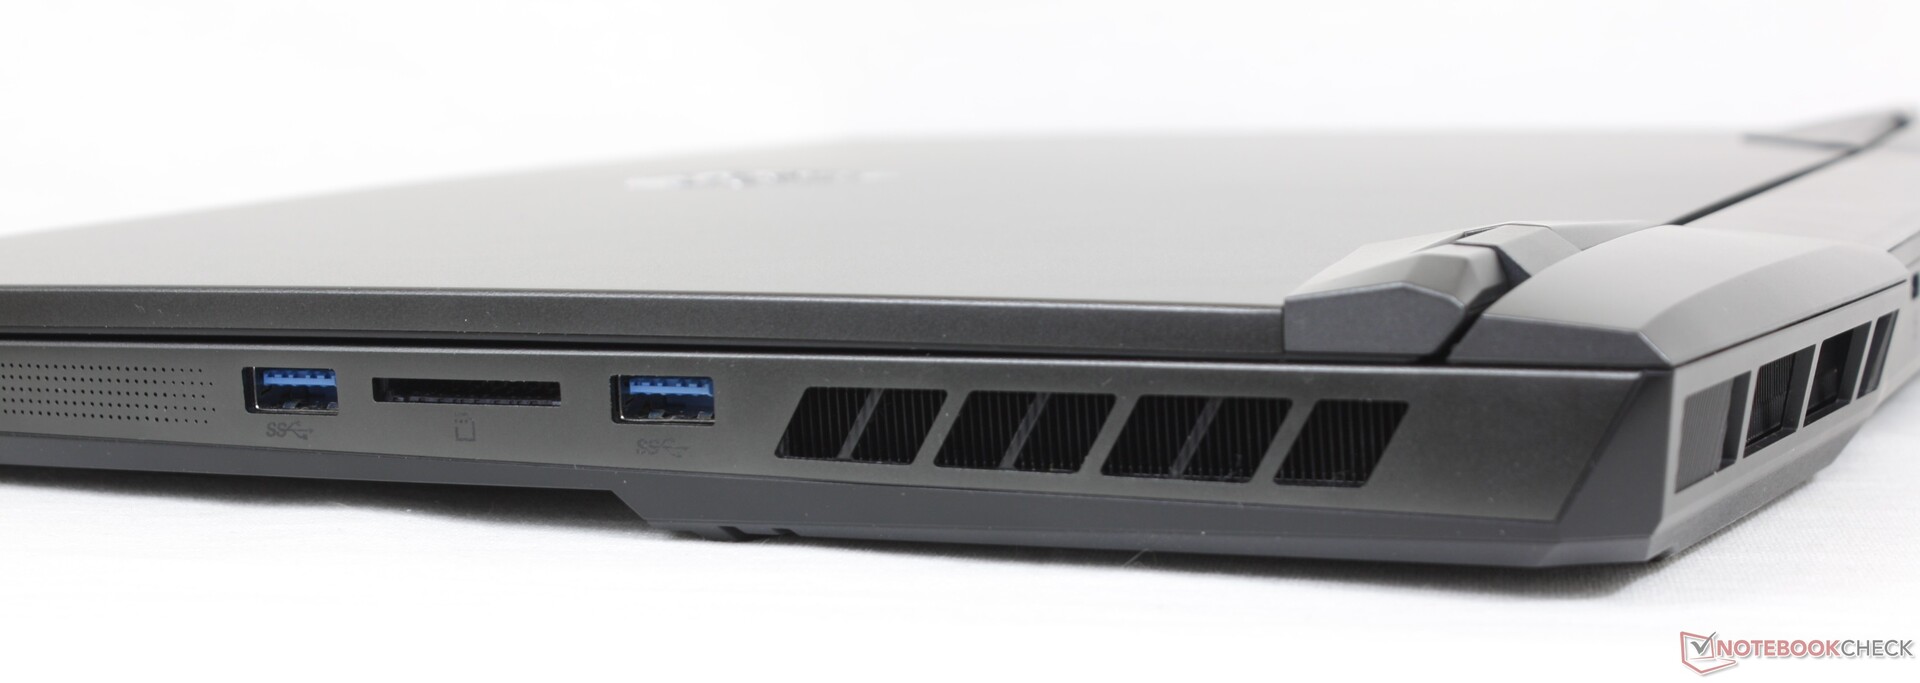
Beim GE67 fällt der dedizierte Mini-DisplayPort, der beim GE66 noch vorhanden war, weg. DisplayPort wird immer noch von den zwei USB-C-Ports unterstützt.
Wie bei anderen, auf der Alder-Lake-H-Plattform basierenden Laptops und insbesondere zum Beispiel dem Asus TUF Gaming F15 FX507ZM, steht Thunderbolt 4 im dedizierten Grafikmodus nicht zur Verfügung.
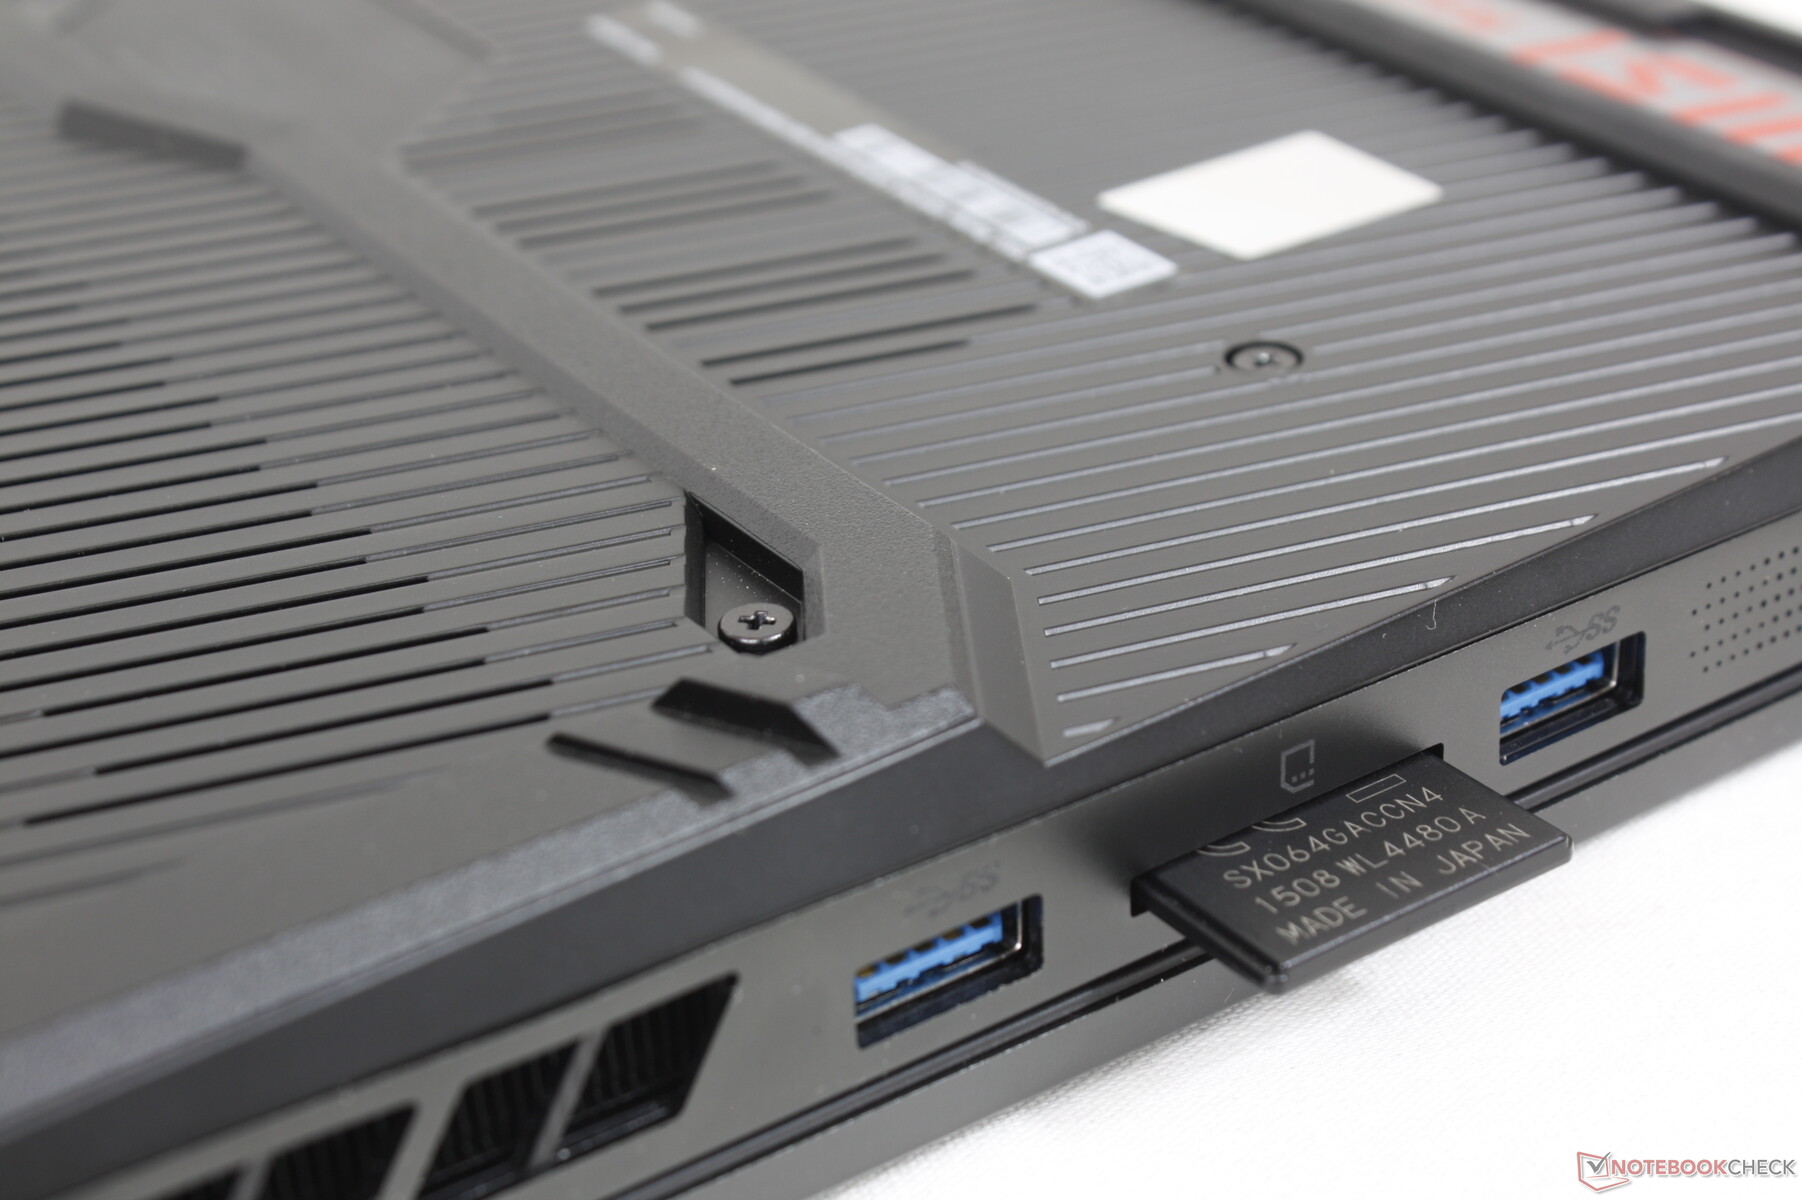
SD-Kartenleser
Die Übertragungsraten des eingebauten SD-Kartenlesers sind in Anbetracht der vorliegenden Preisklasse langsam. Hier bieten konkurrierende Modelle wie das Razer Blade 15 oder das Asus ROG Zephyrus Duo 16 die doppelte SD-Leseleistung.
| SD Card Reader | |
| average JPG Copy Test (av. of 3 runs) | |
| Razer Blade 15 2022 (Toshiba Exceria Pro SDXC 64 GB UHS-II) | |
| MSI GE67 HX 12UGS (Toshiba Exceria Pro SDXC 64 GB UHS-II) | |
| MSI Raider GE66 12UHS (AV PRO microSD 128 GB V60) | |
| maximum AS SSD Seq Read Test (1GB) | |
| Razer Blade 15 2022 (Toshiba Exceria Pro SDXC 64 GB UHS-II) | |
| MSI GE67 HX 12UGS (Toshiba Exceria Pro SDXC 64 GB UHS-II) | |
Kommunikation
| Networking | |
| iperf3 transmit AX12 | |
| Razer Blade 15 2022 | |
| MSI Vector GP66 12UGS | |
| Alienware m15 R6, i7-11800H RTX 3080 | |
| iperf3 receive AX12 | |
| Razer Blade 15 2022 | |
| MSI Vector GP66 12UGS | |
| Alienware m15 R6, i7-11800H RTX 3080 | |
| iperf3 receive AXE11000 6GHz | |
| Asus ROG Strix Scar 15 G533ZW-LN106WS | |
| MSI GE67 HX 12UGS | |
| iperf3 transmit AXE11000 6GHz | |
| Asus ROG Strix Scar 15 G533ZW-LN106WS | |
| MSI GE67 HX 12UGS | |
Webcam
Bei der 2-MP-Webcam gab es keine Änderungen, was bedeutet, dass eine physische Abdeckung oder Windows-Hello-Unterstützung weiterhin fehlen. Immerhin kann die Webcam elektronisch über die F4-Taste deaktiviert werden.
Eine LED, die Nutzer über die aktive Webcam informiert, blinkt ständig, wenn die Webcam genutzt wird. Vor allem während Videoanrufen ist das störend und wir konnten auch keine Option finden, die das blinkende Licht deaktiviert.


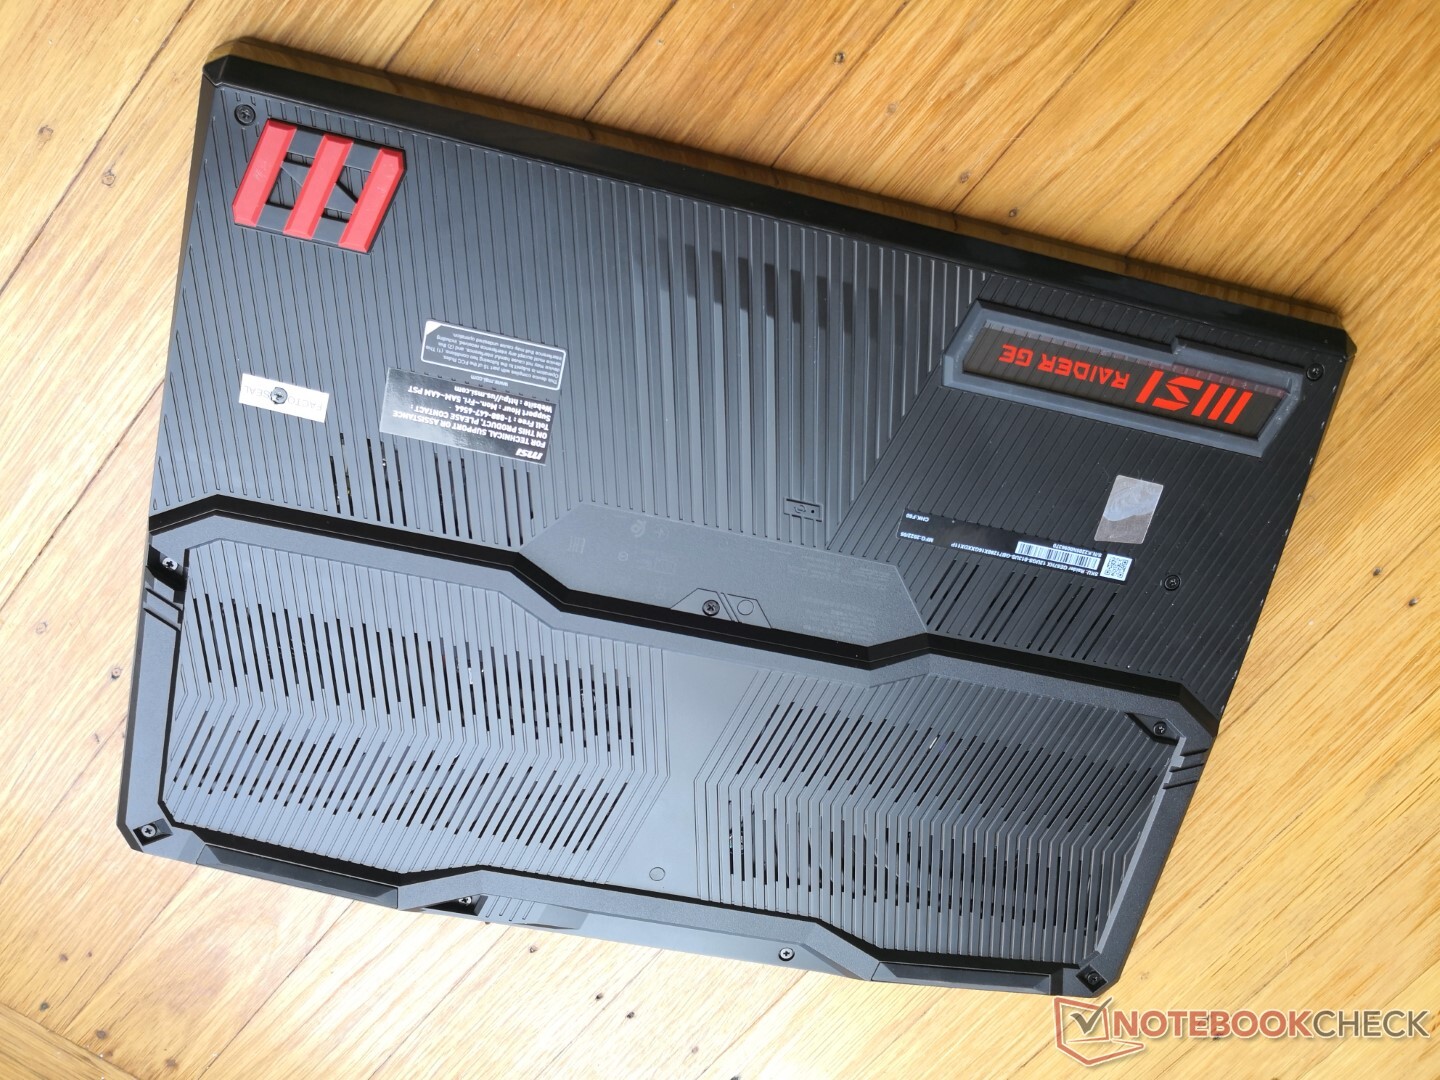
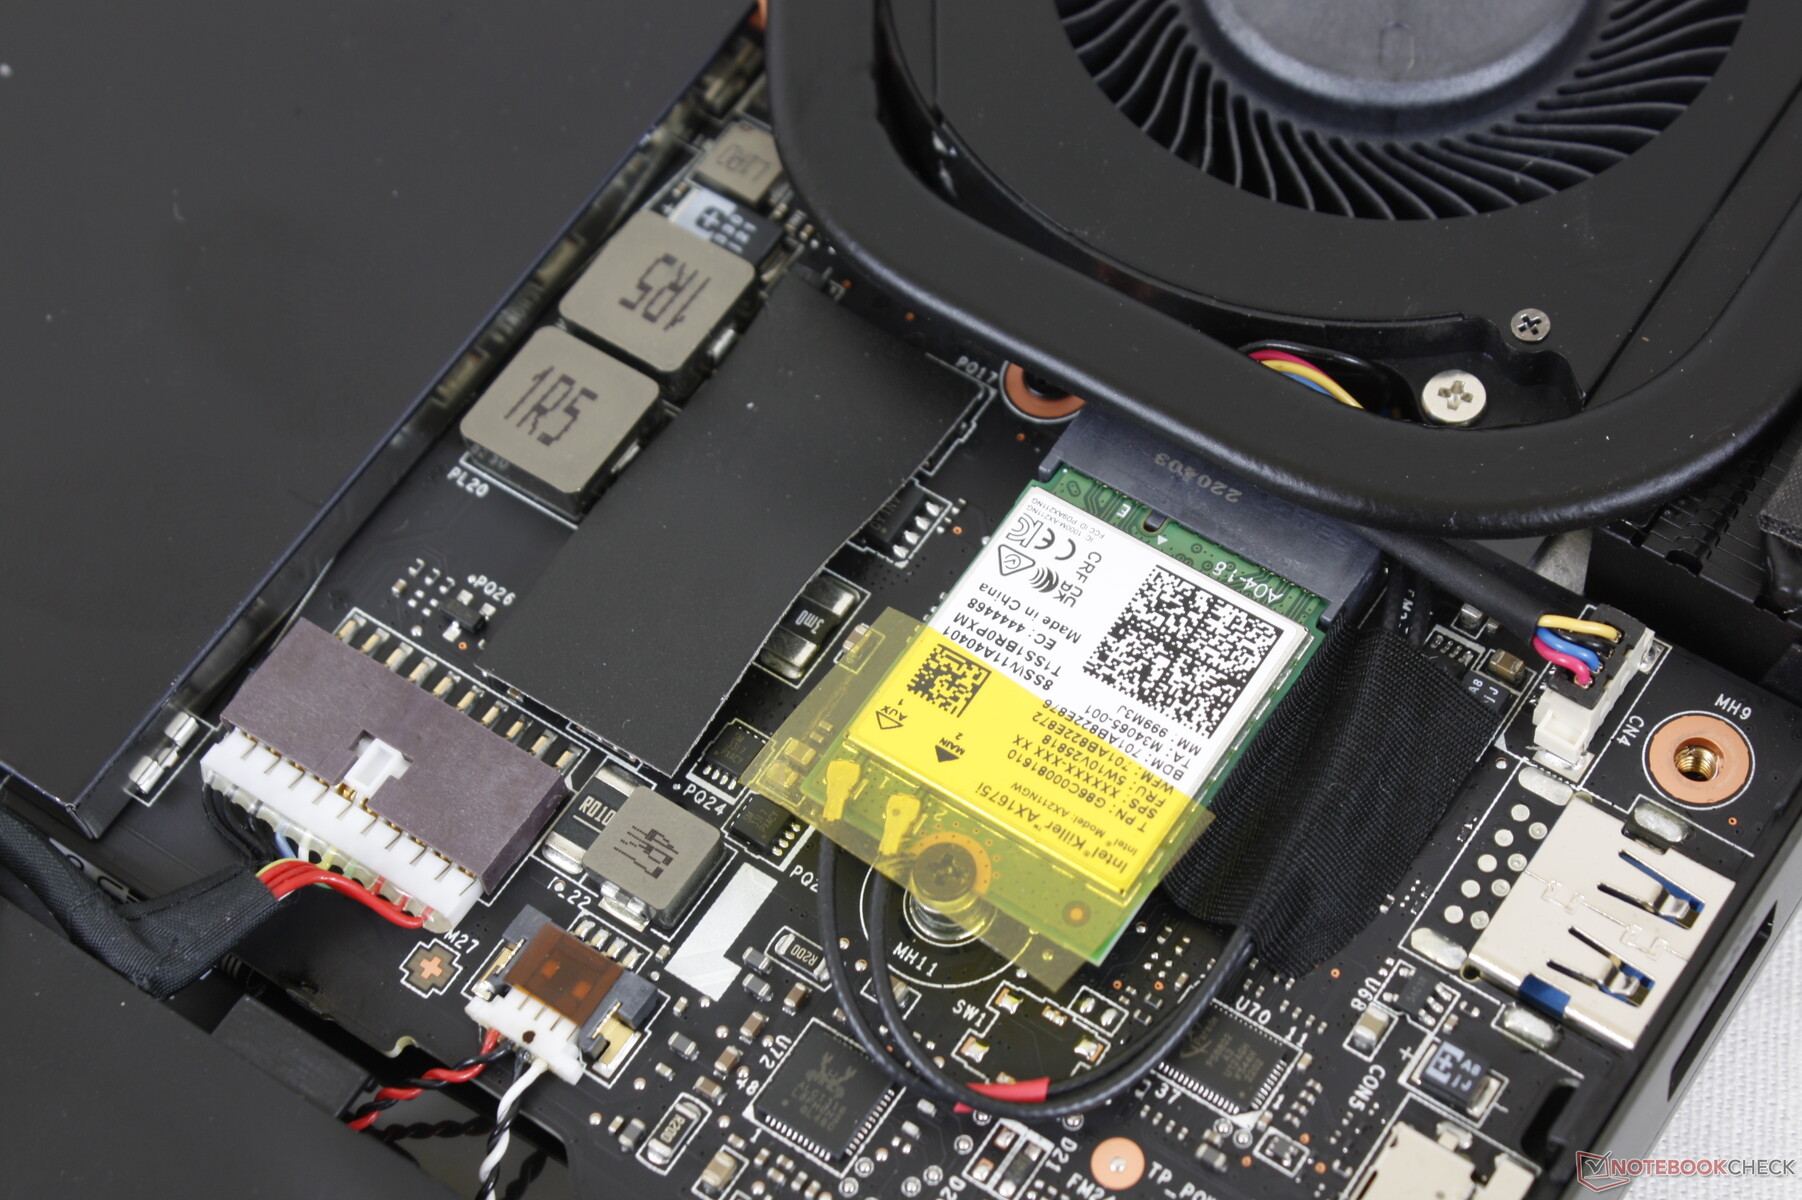
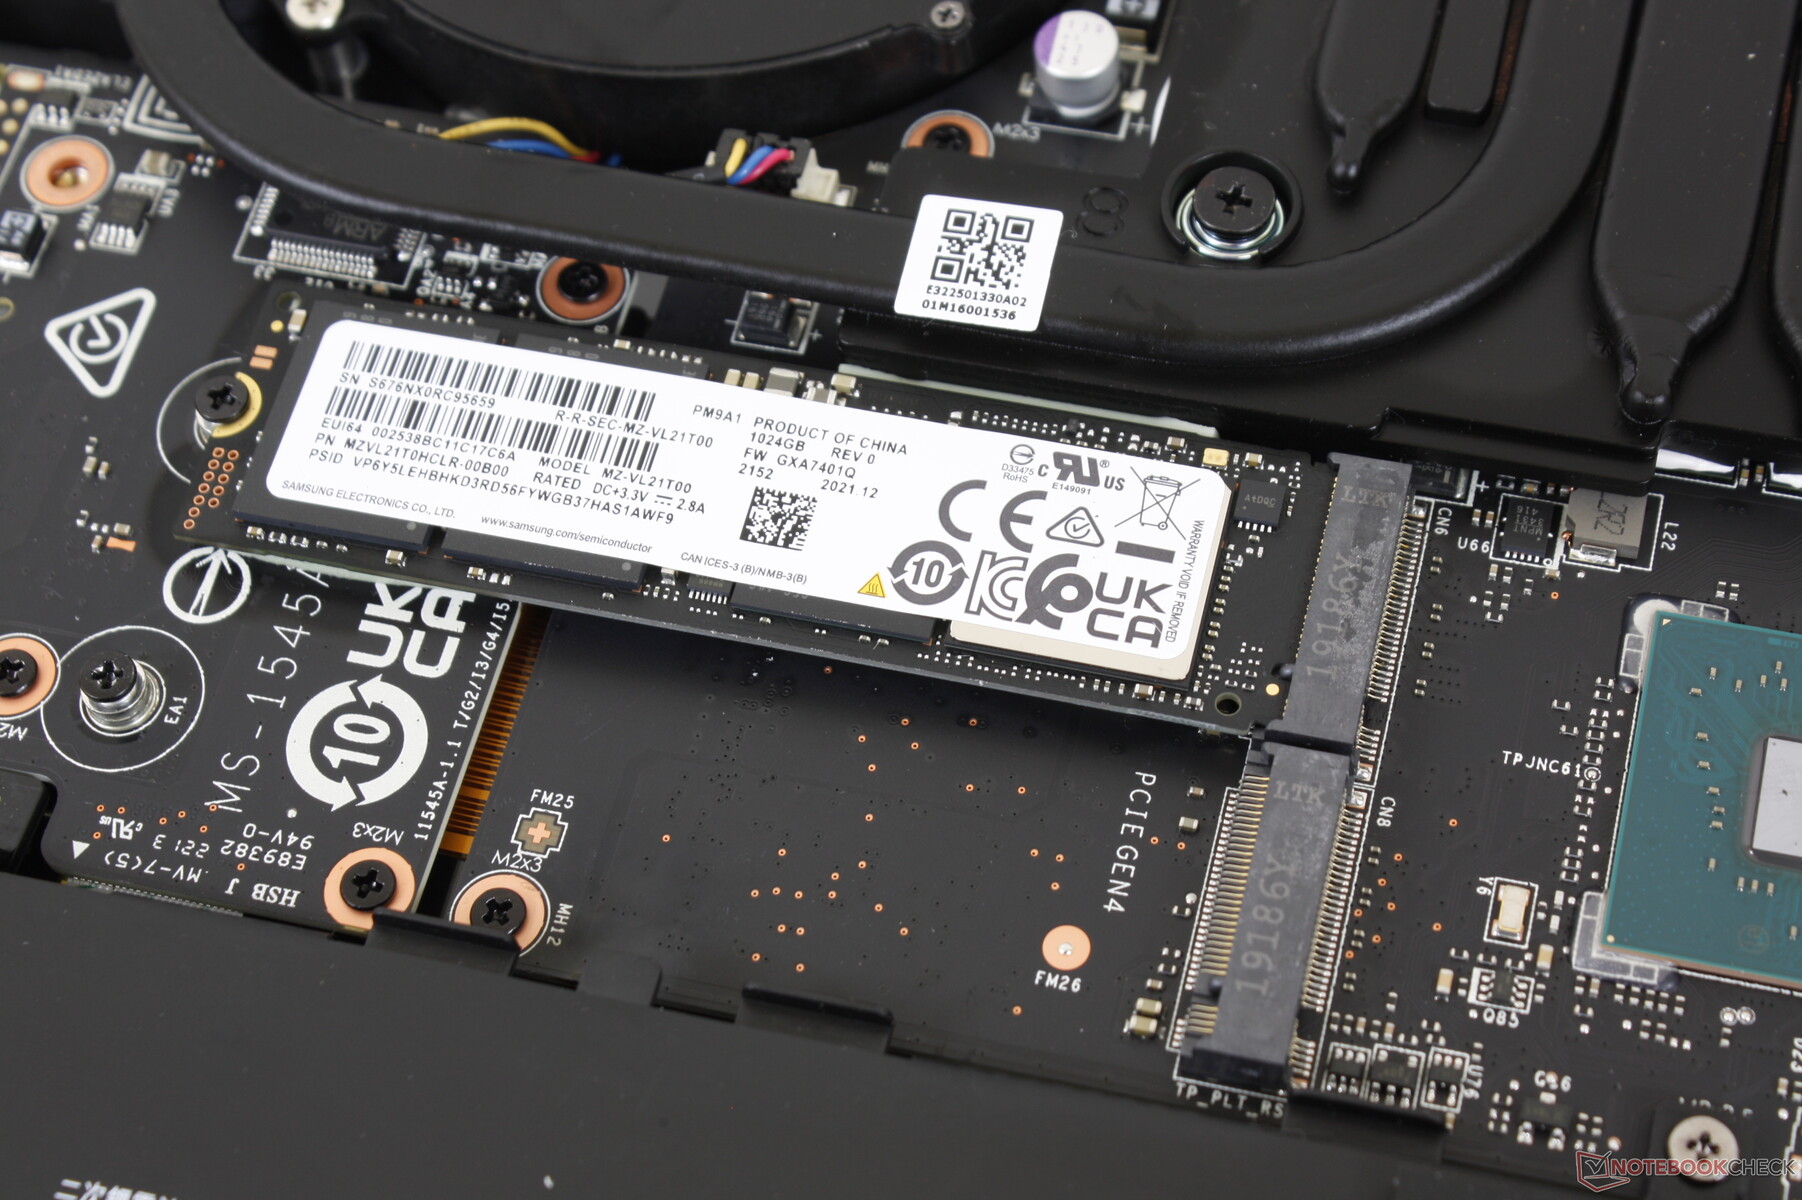
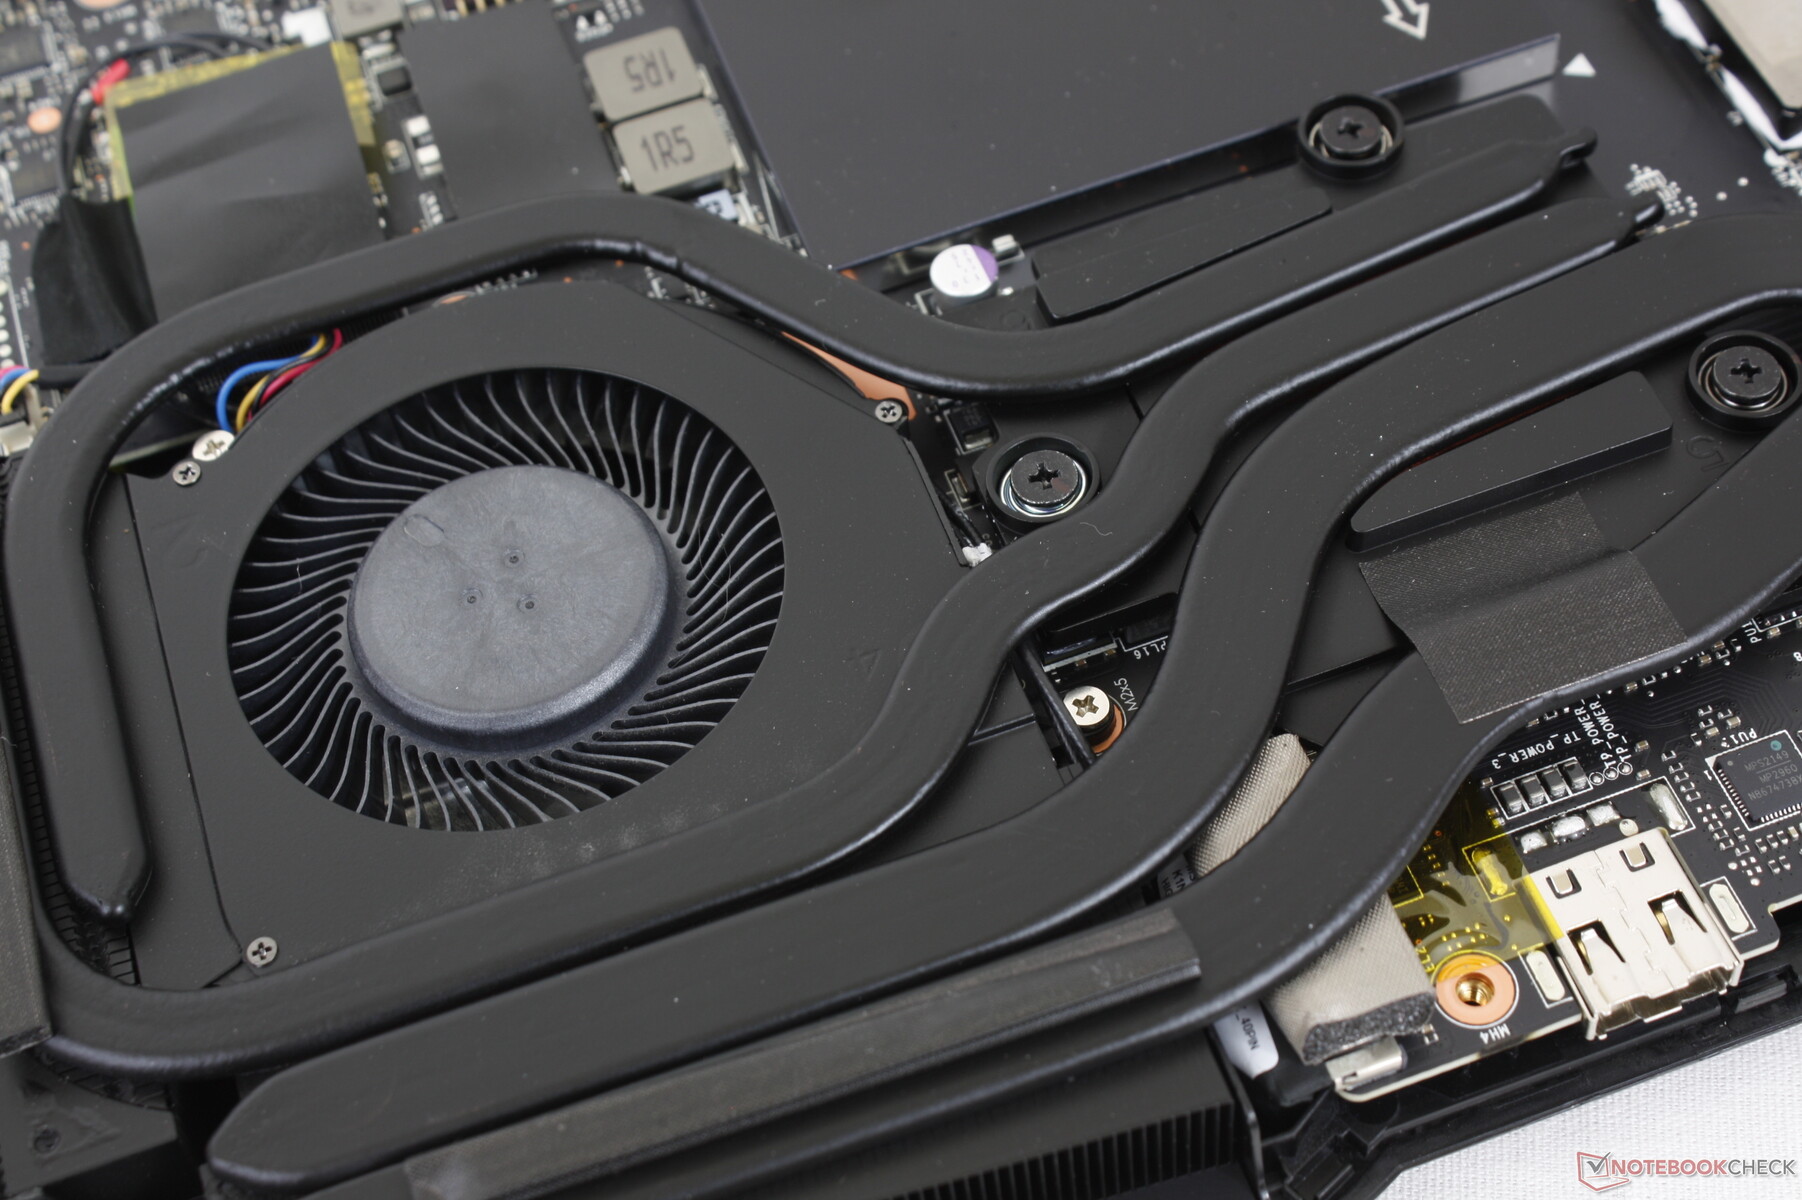
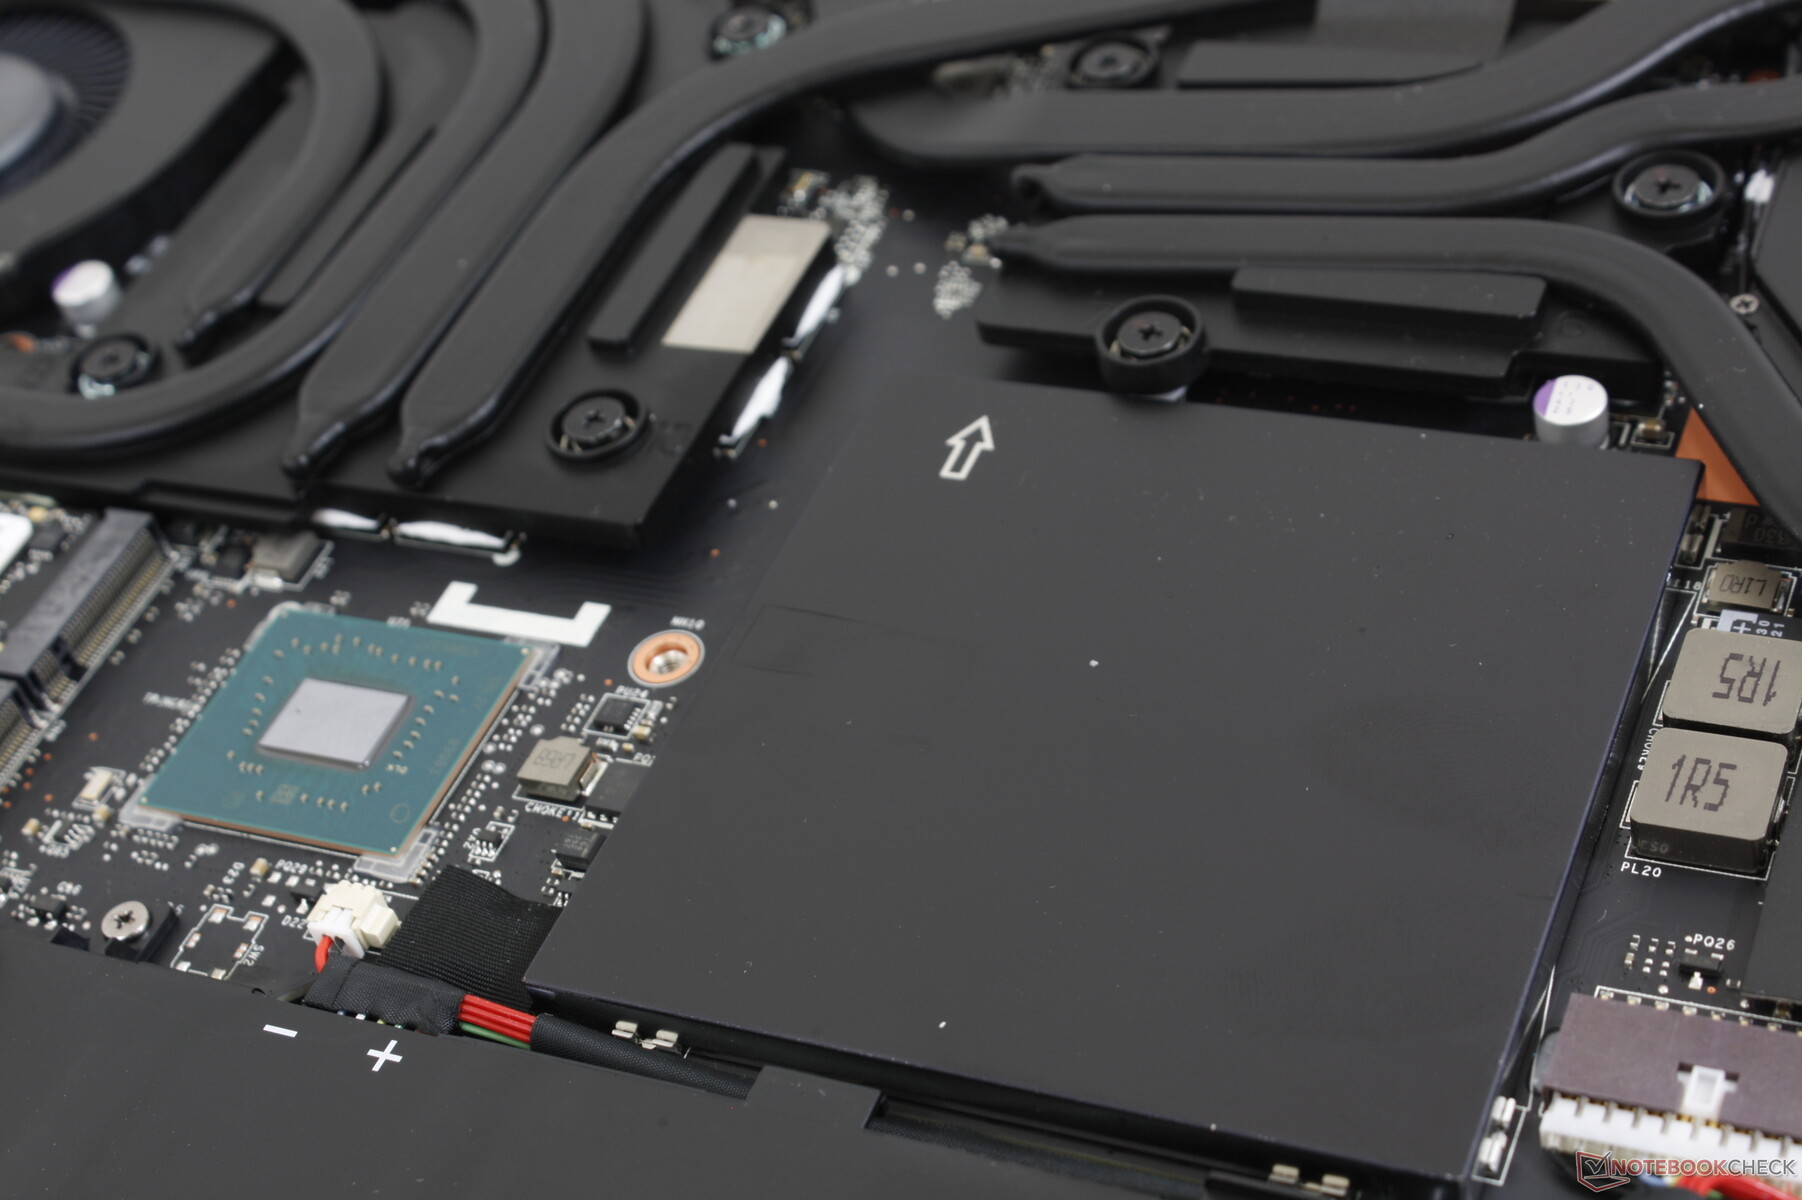
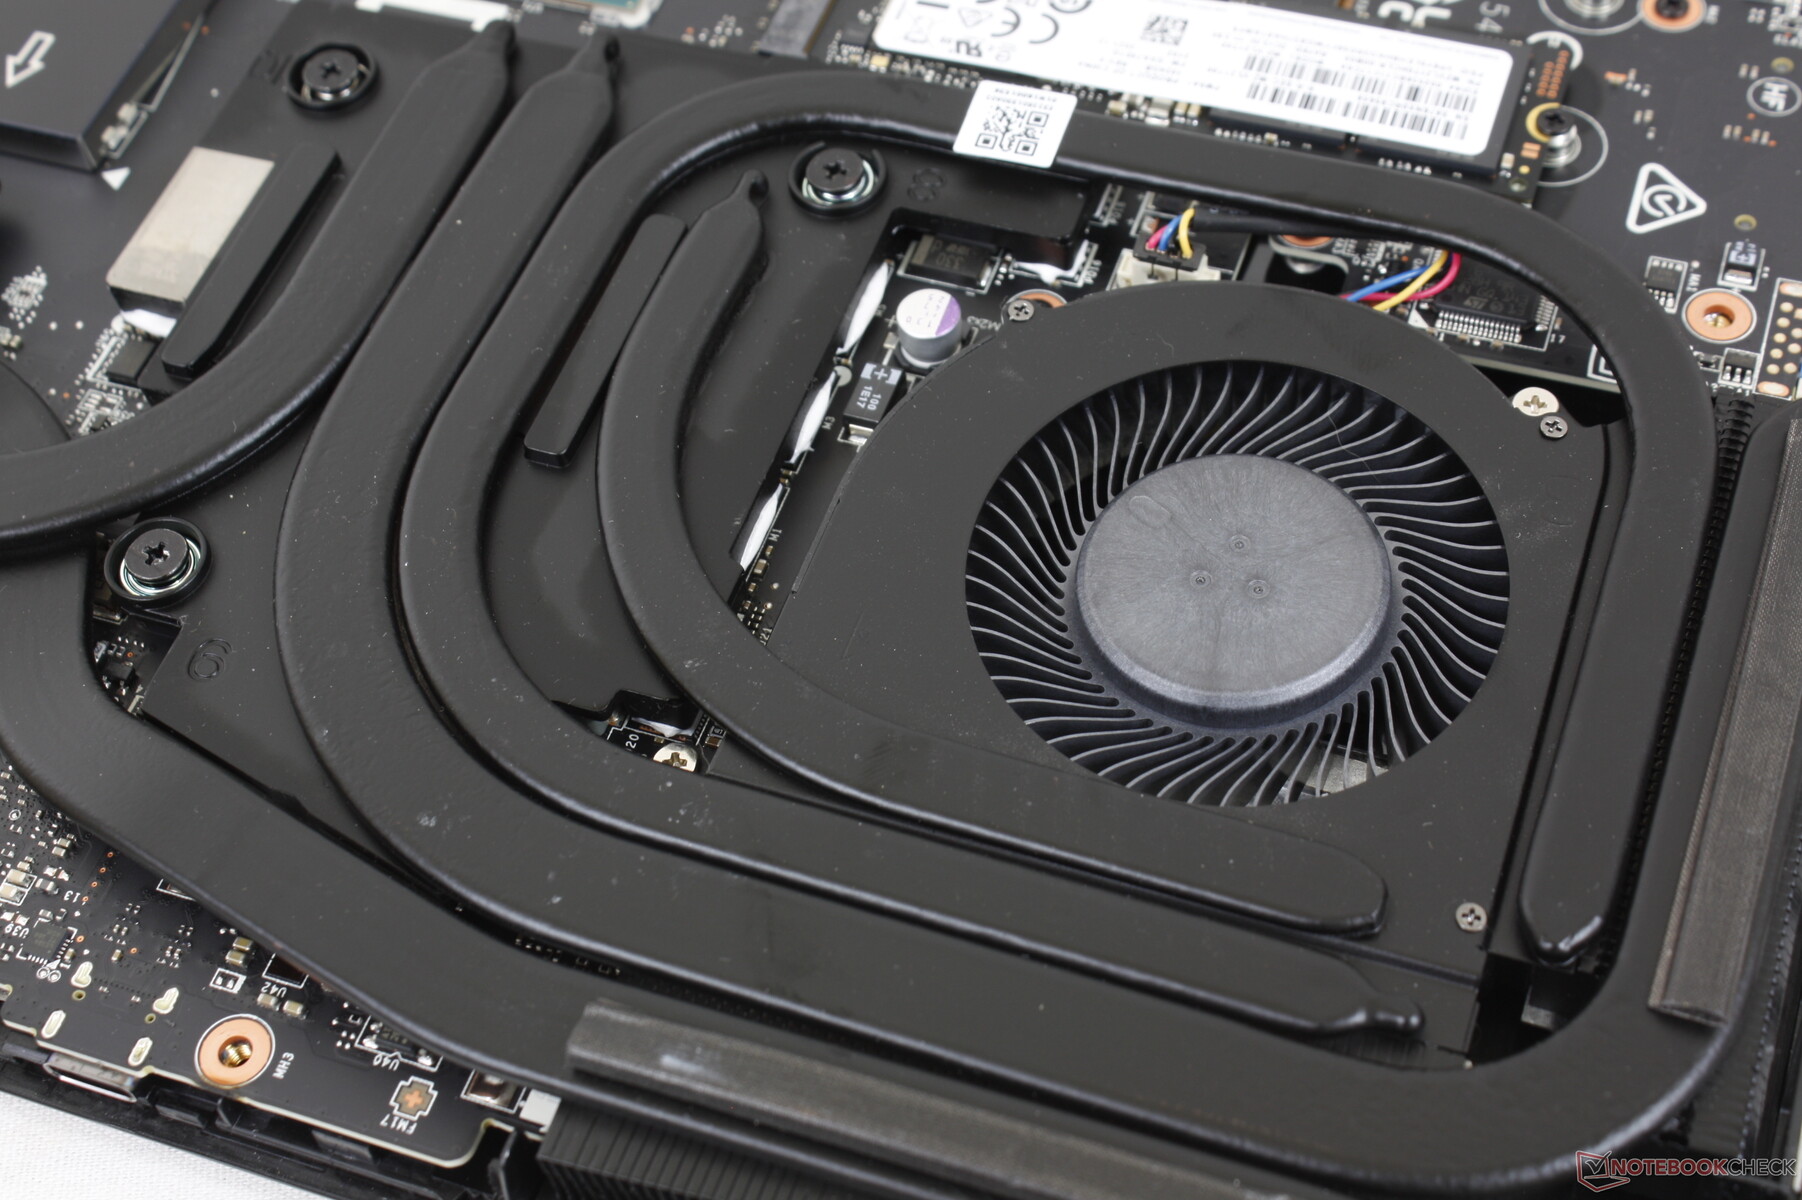
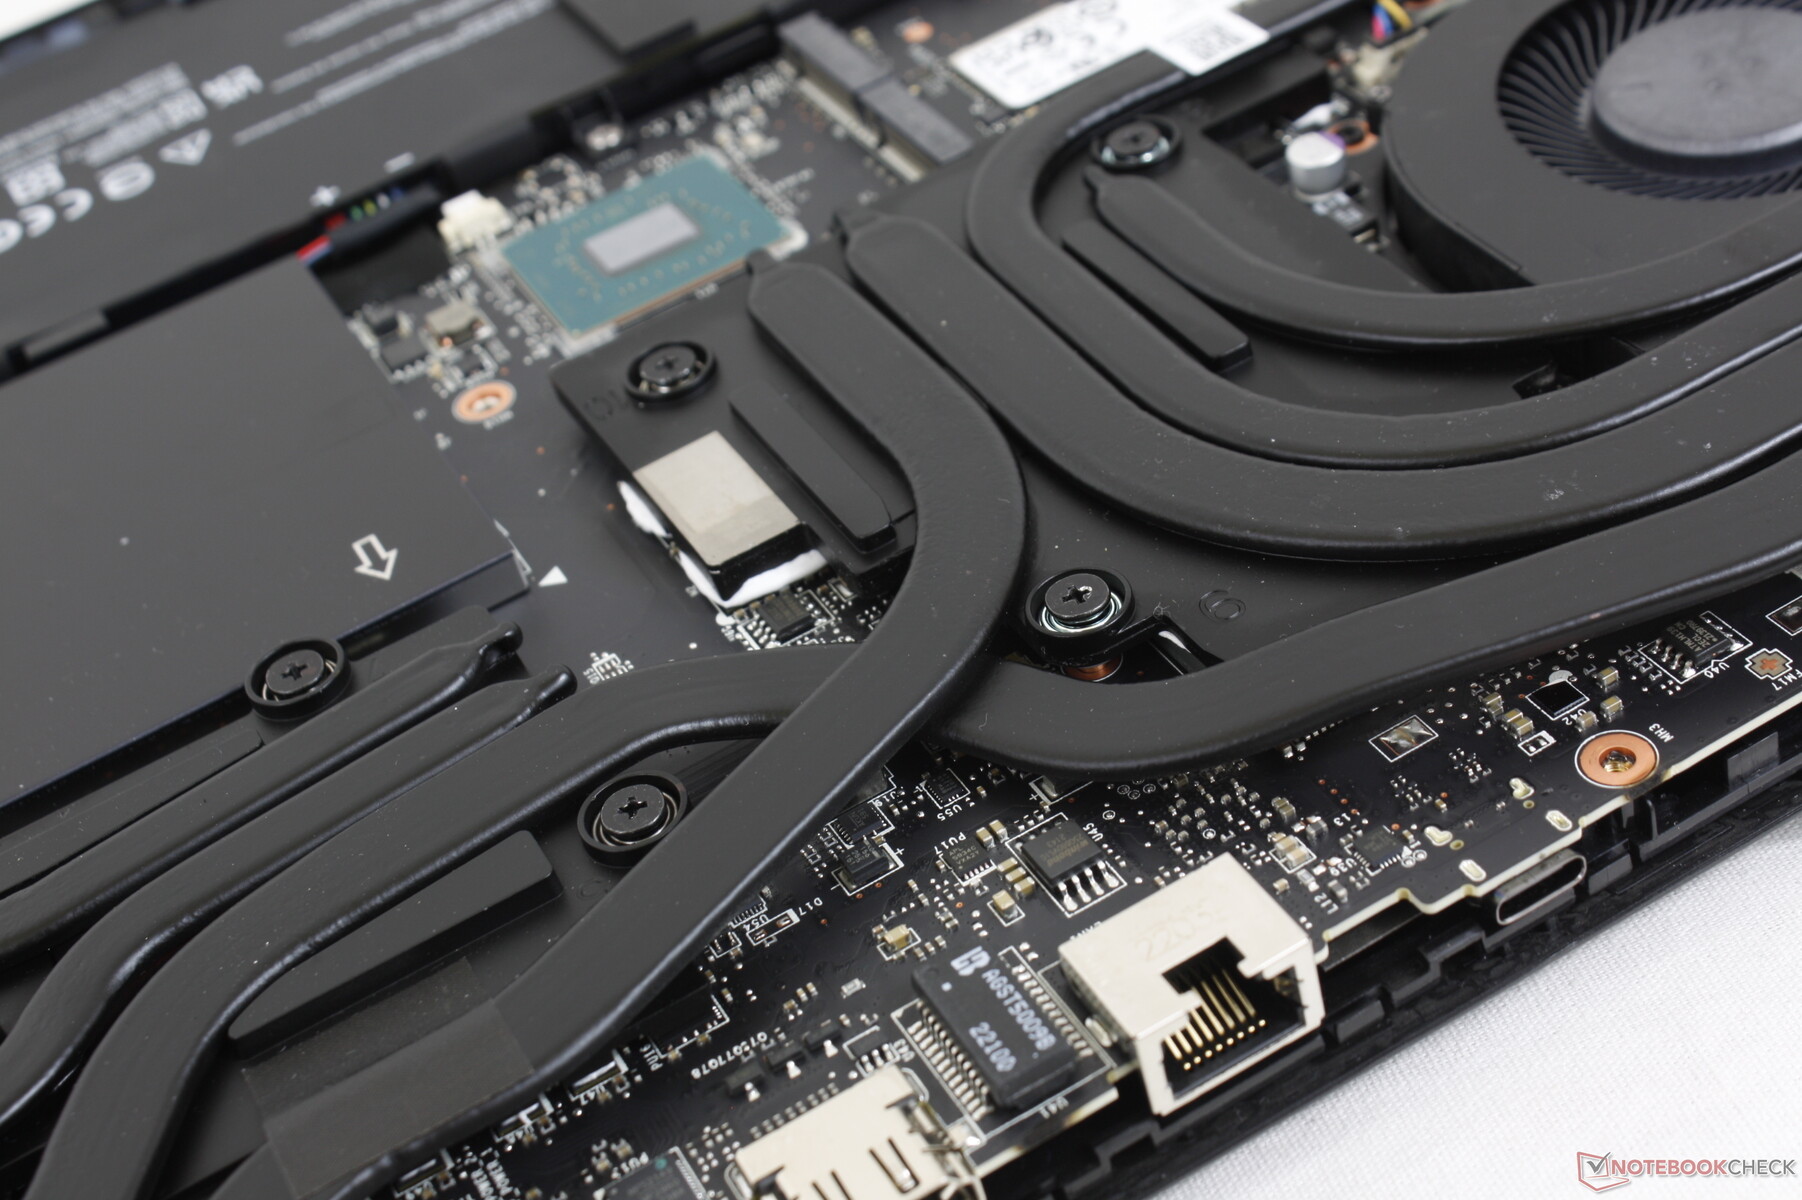
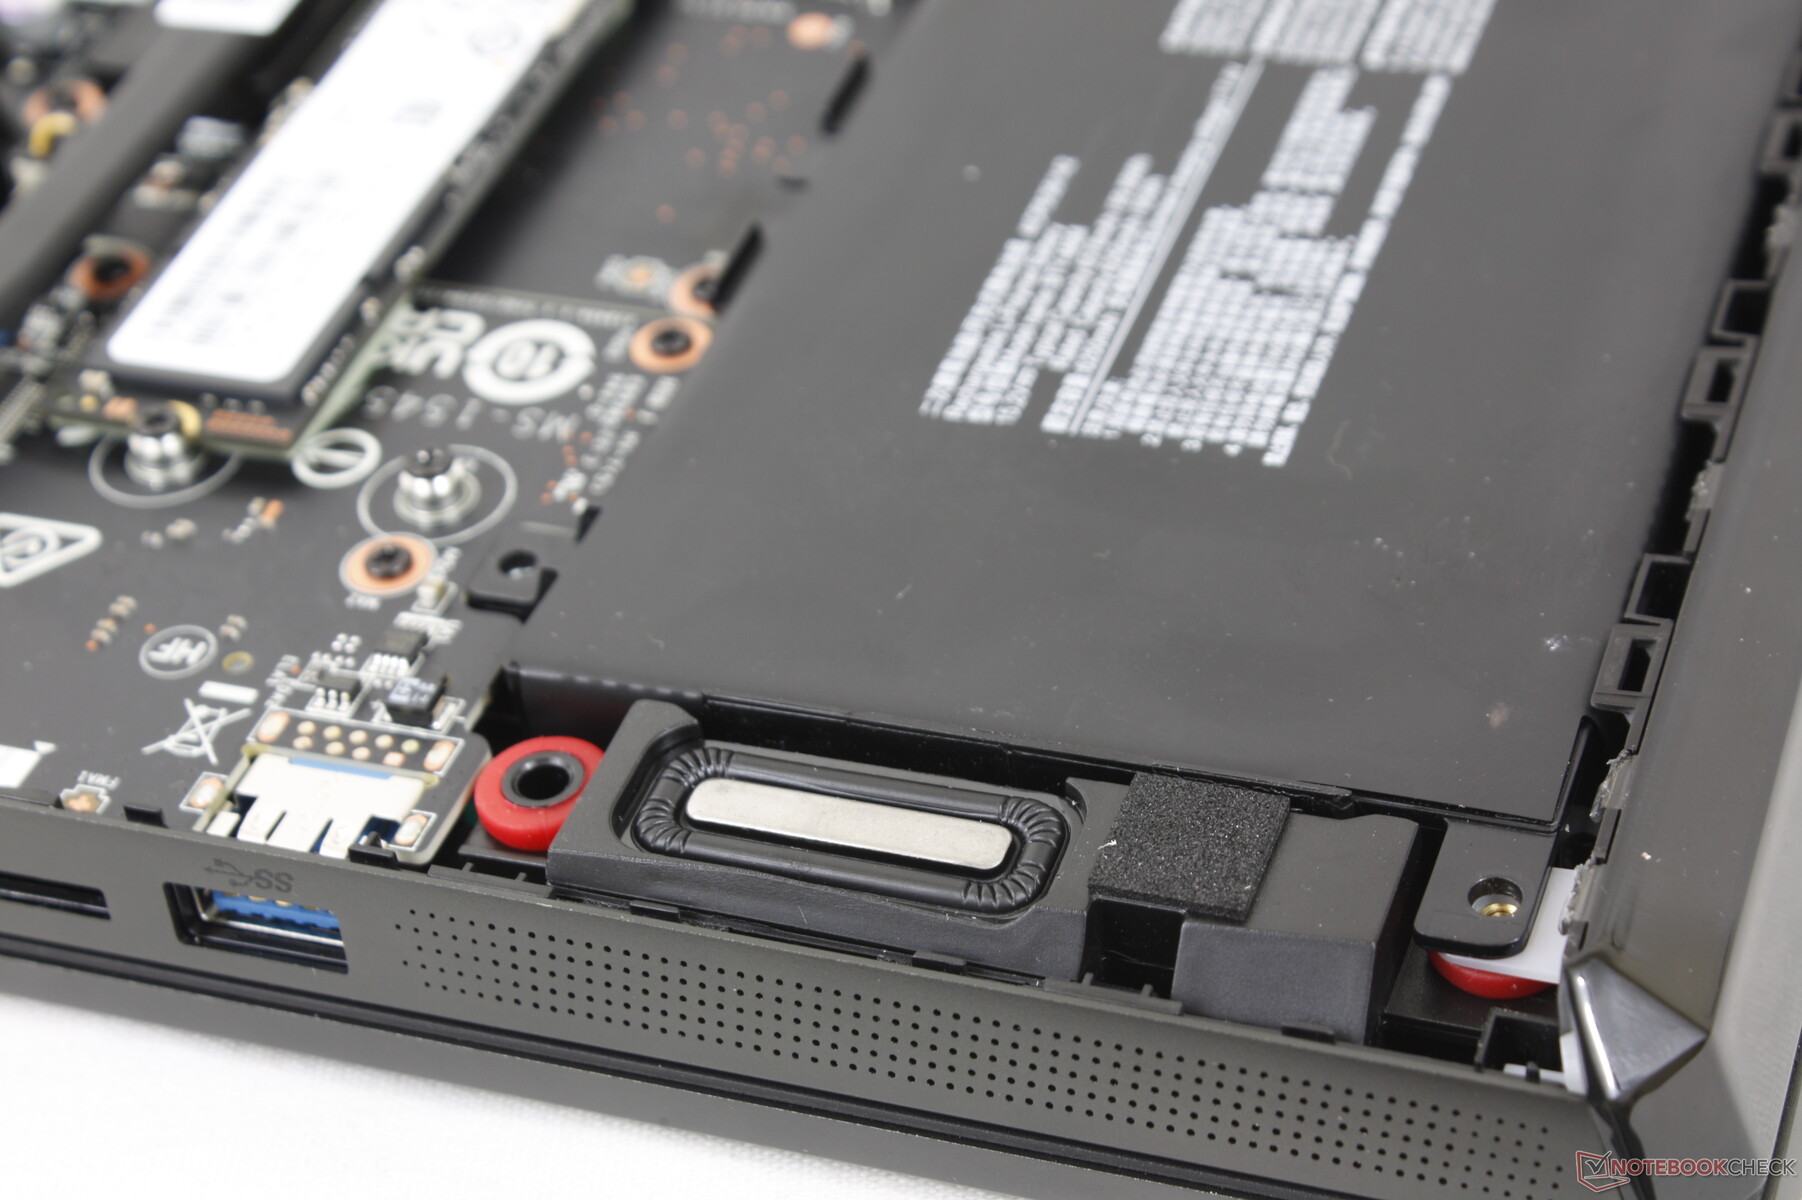
Wartung
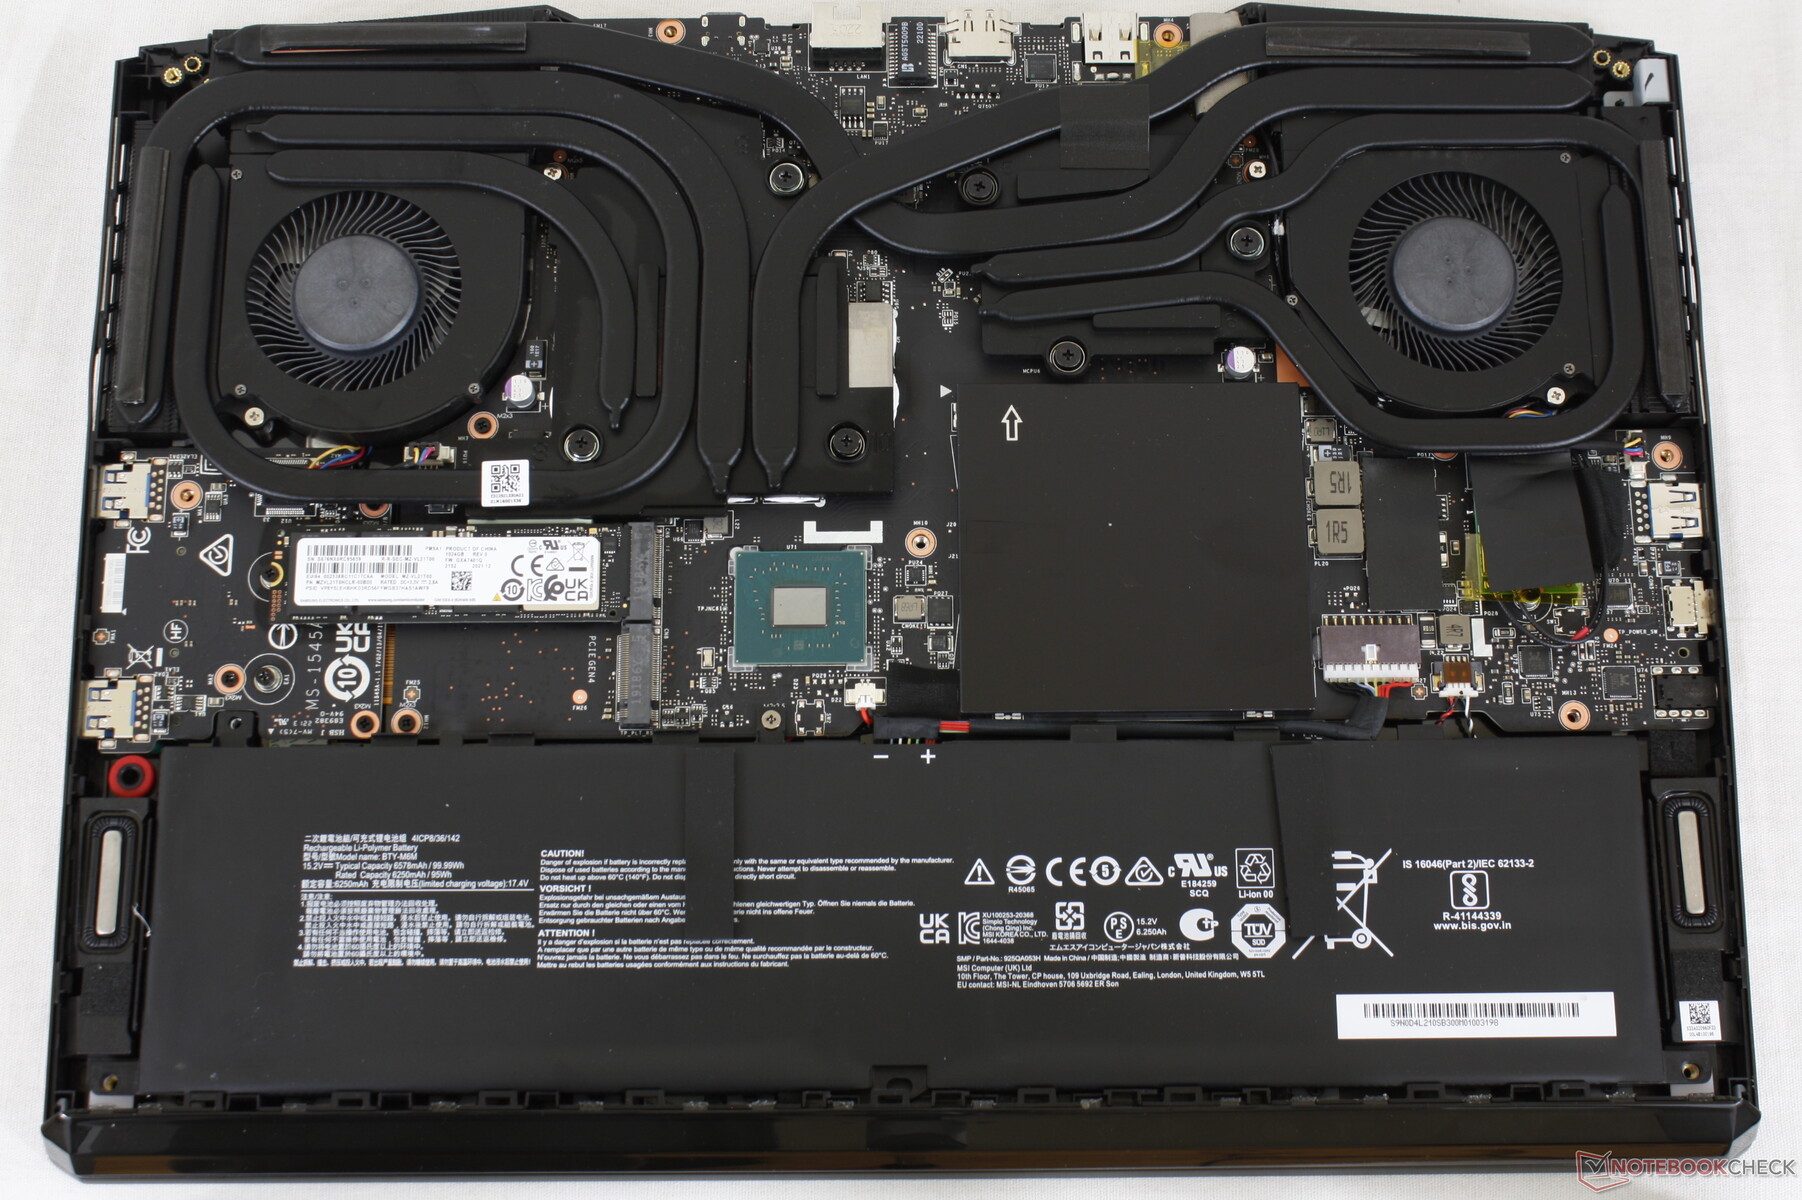
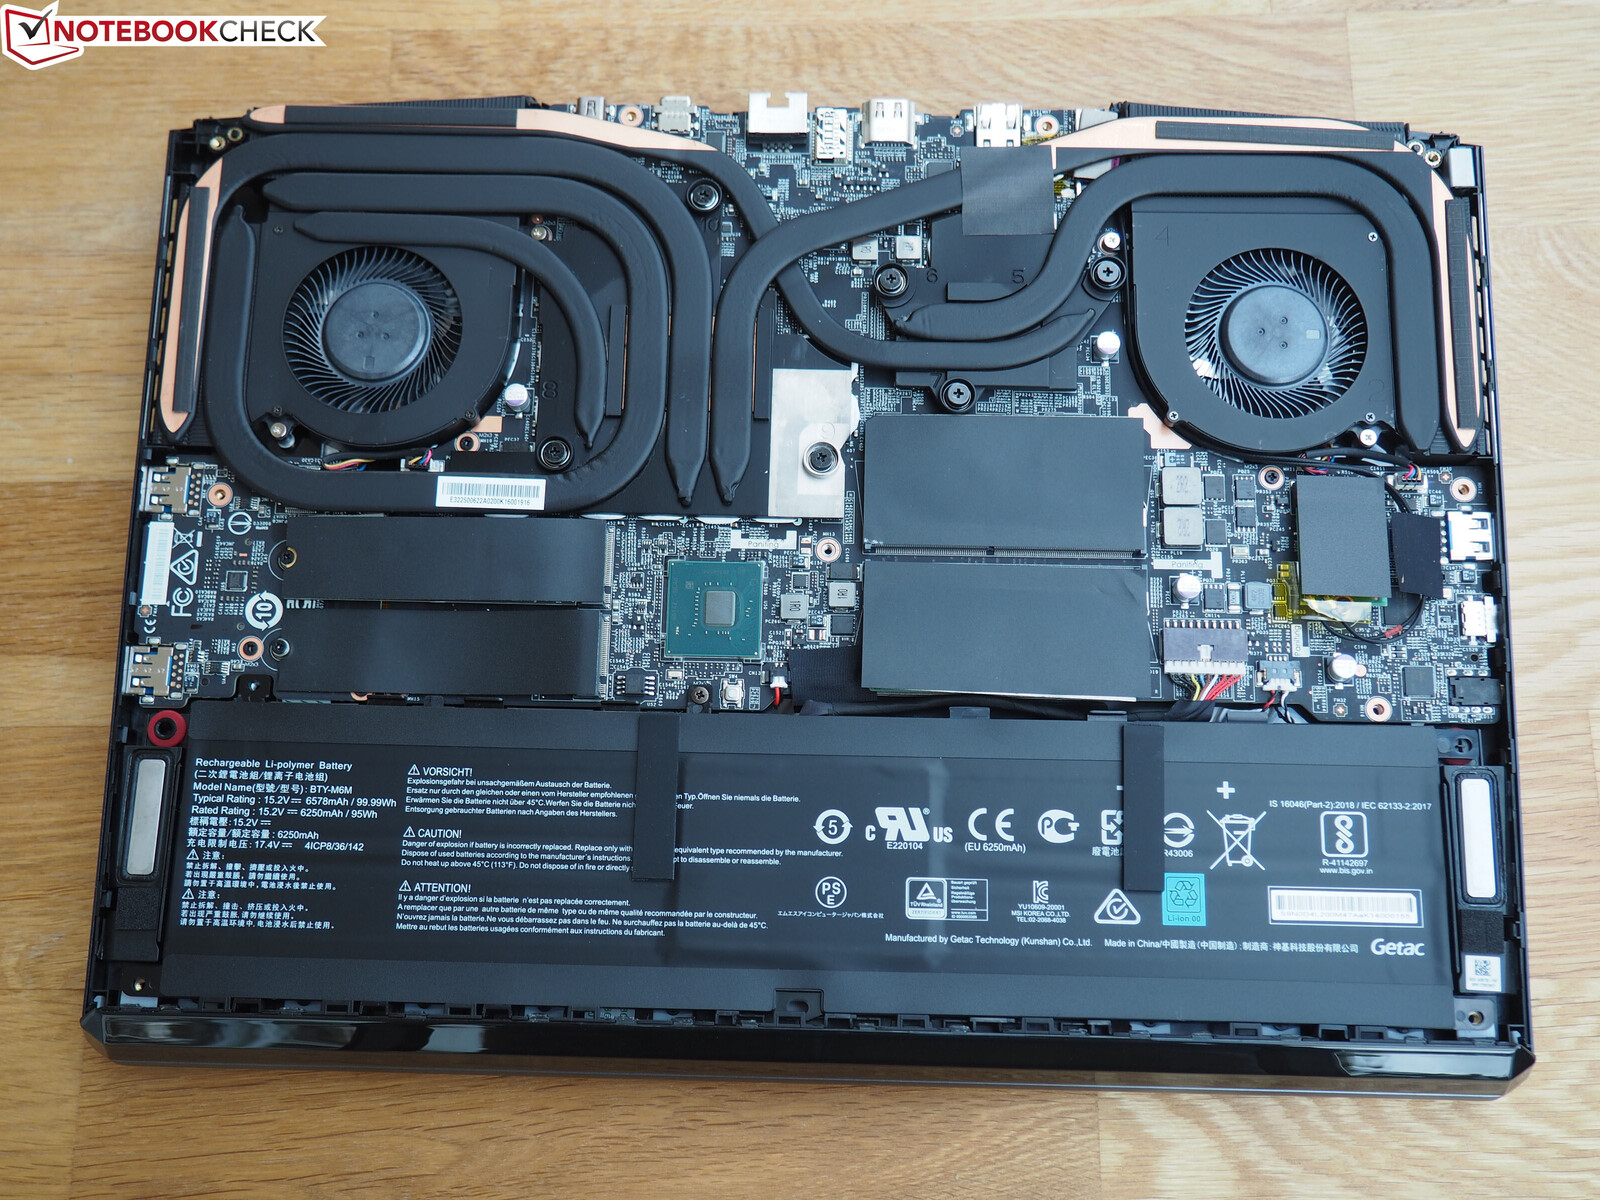
Das Entfernen der Bodenplatte erfordert einen Kreuzschraubenzieher und einen Gegenstand mit einer flachen Kante. Im Vergleich zum GE66 verfügt das GE67 zur Verbesserung der Kühlleistung über eine zusätzliche Heatpipe auf der CPU, wie man unten sieht.
Garantie und Zubehör
Der Lieferumfang beinhaltet ein großes Samttuch, das Netzteil und Informationsunterlagen. Innerhalb der EU gilt eine zweijährige Garantie mit Pick-up- & Return-Service.
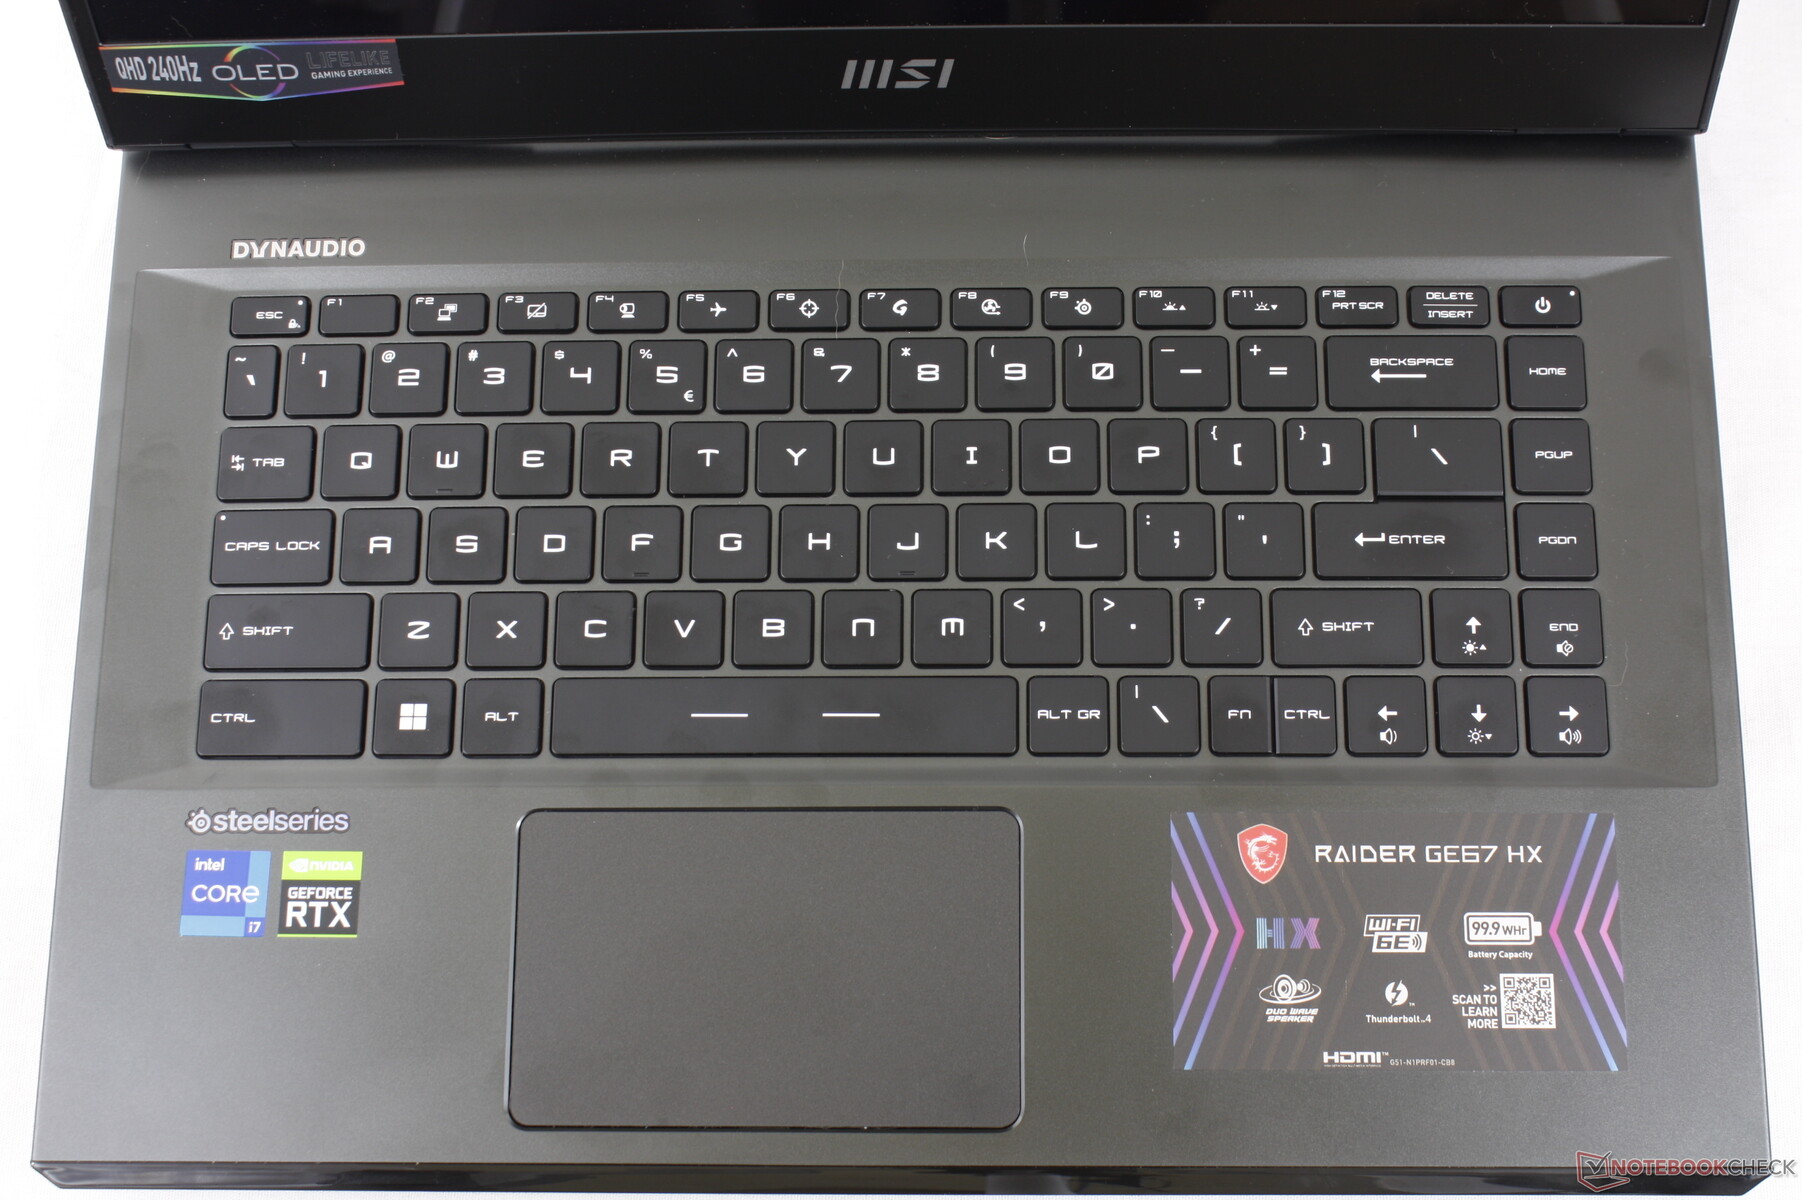
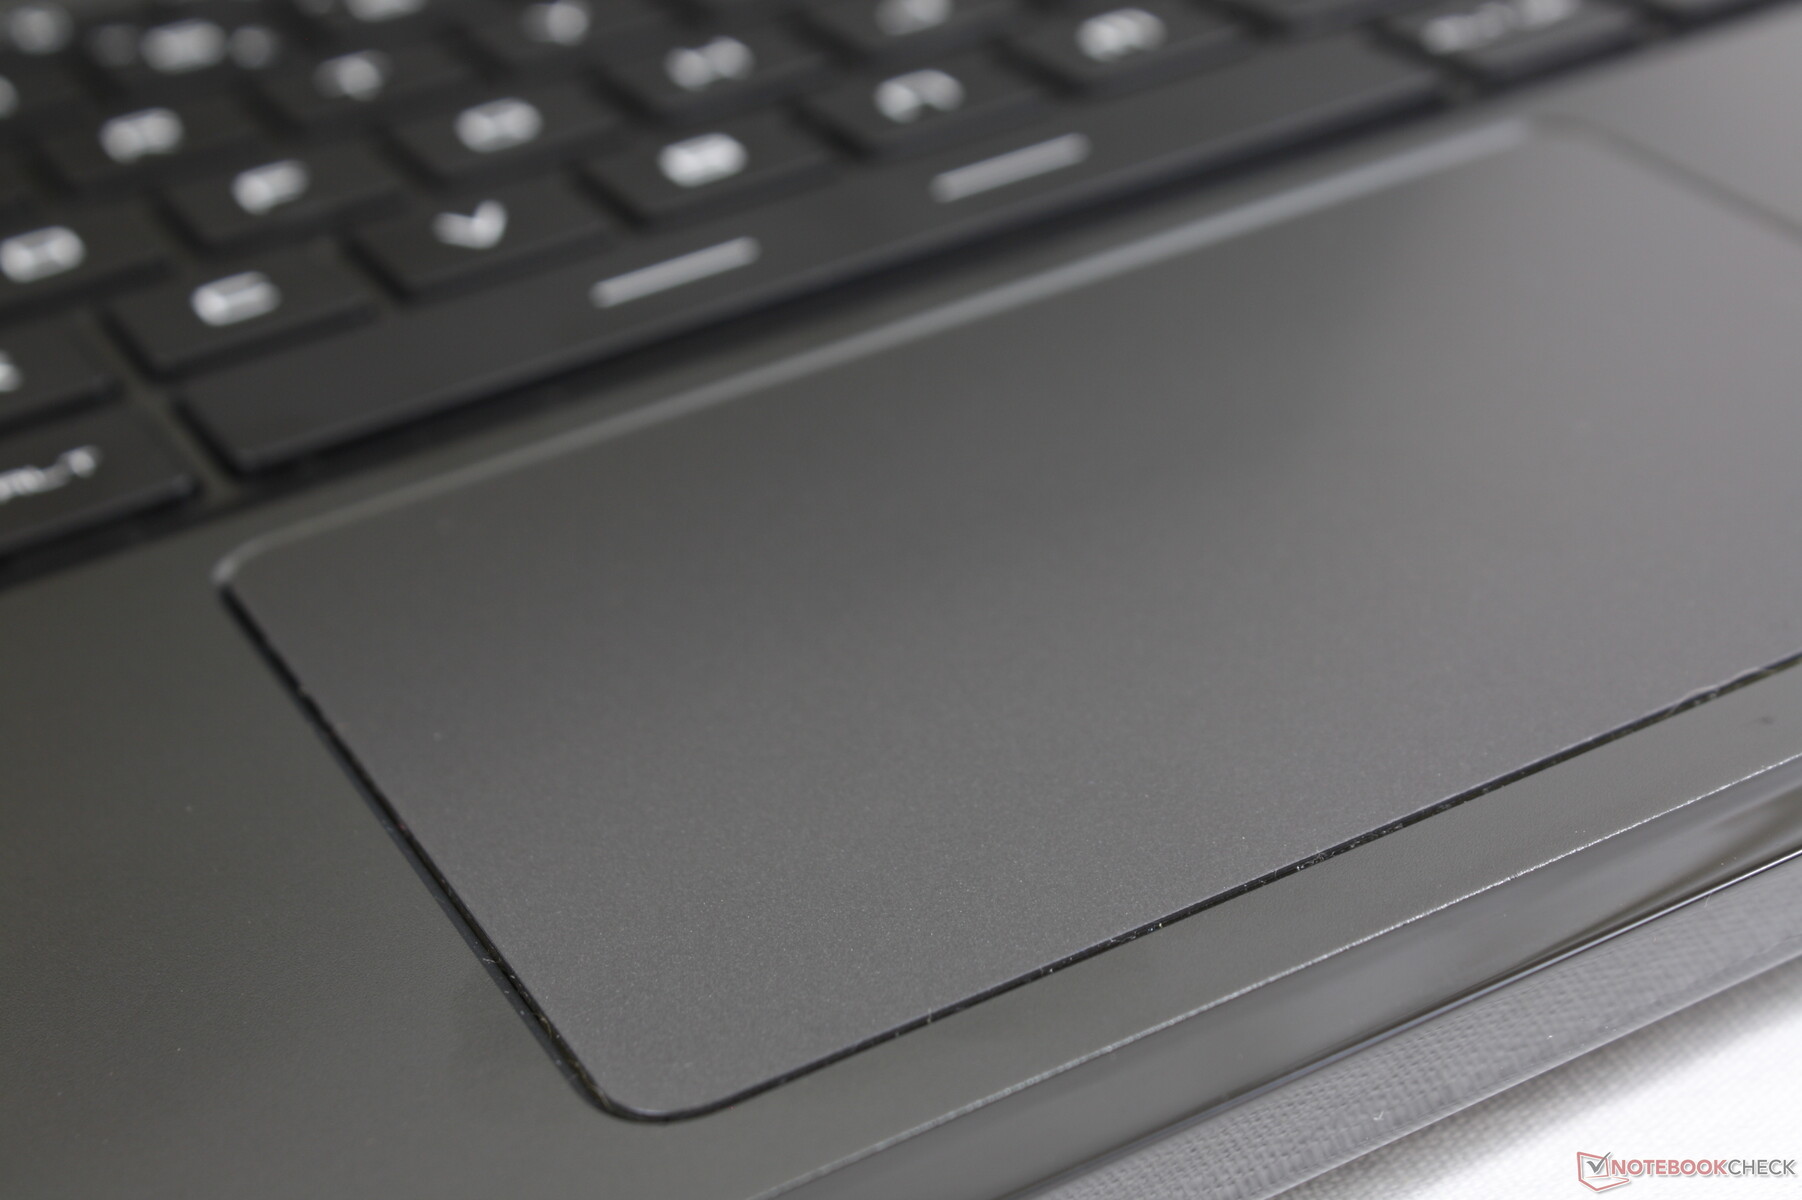
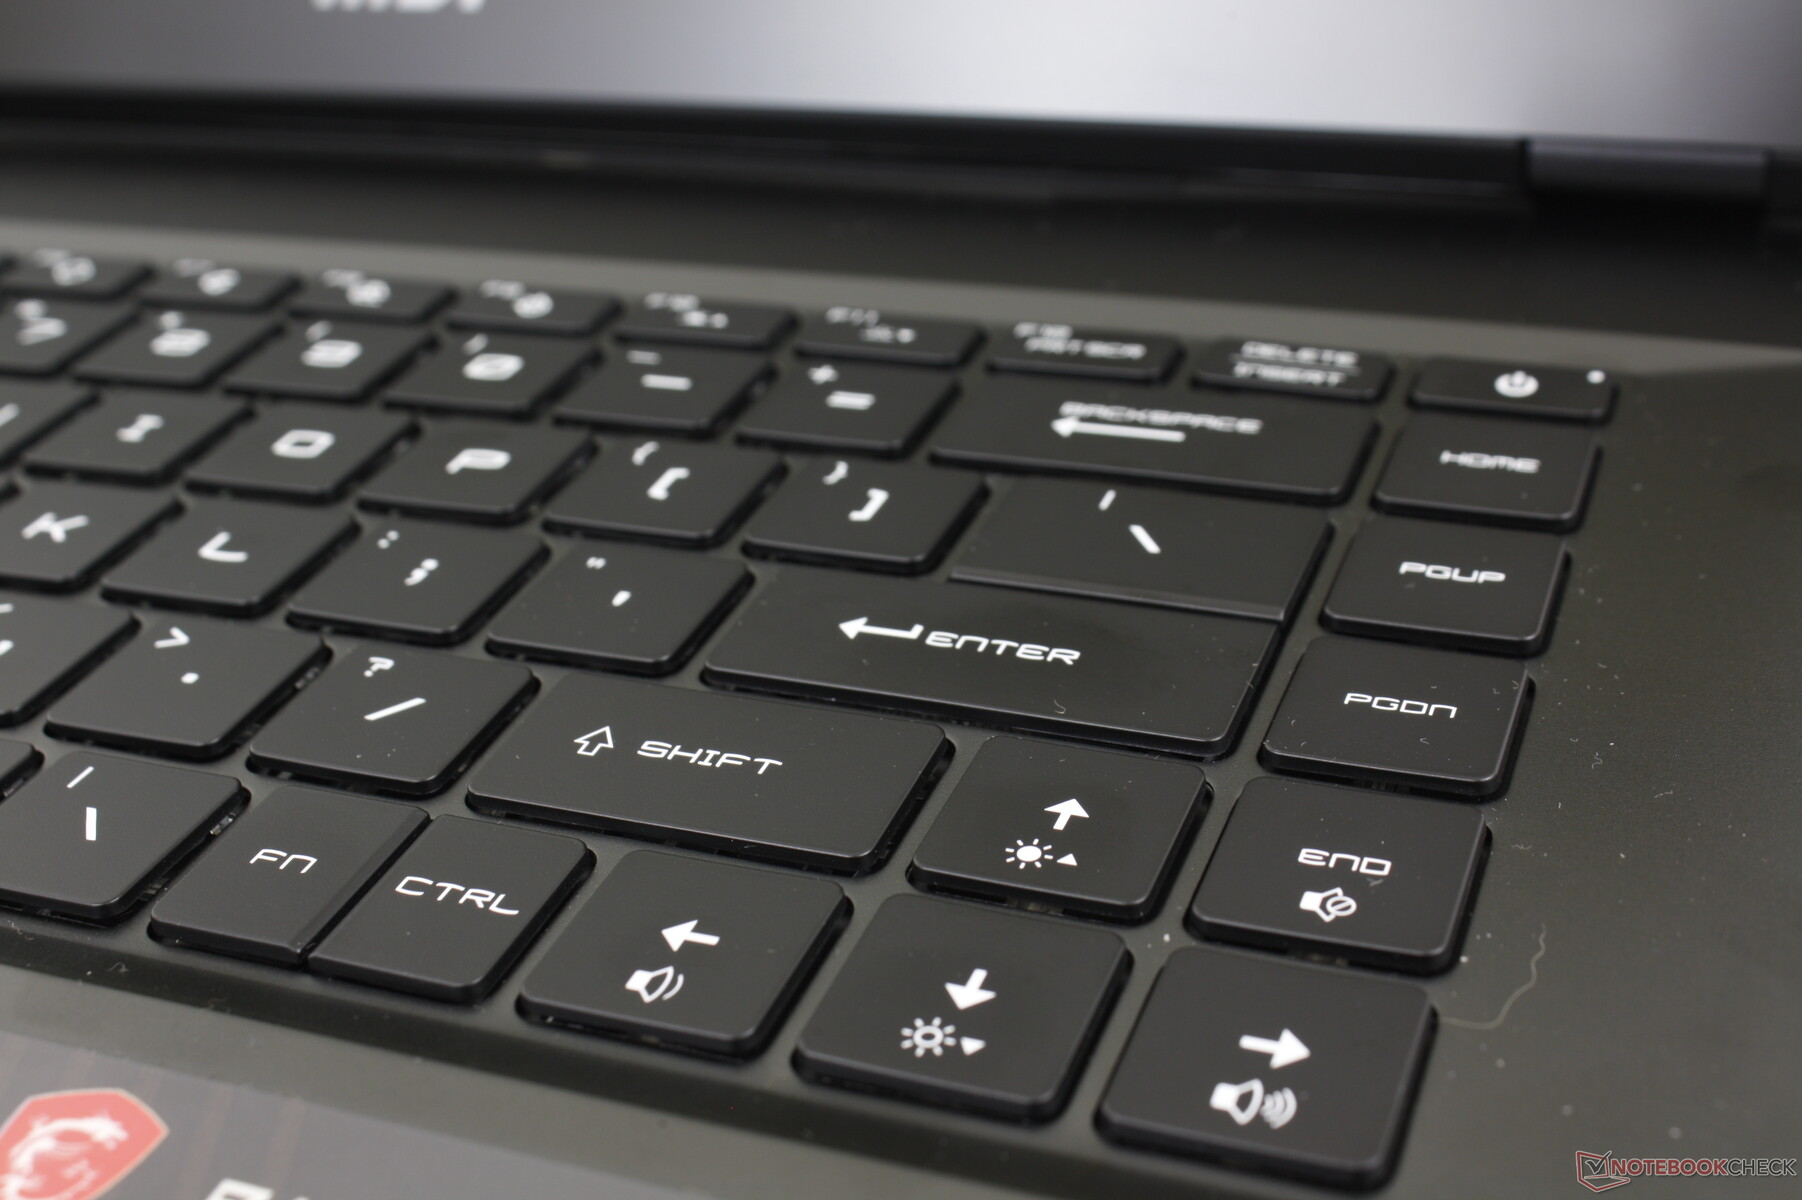
Eingabegeräte — Keine großen Änderungen gegenüber dem GE66
Tastatur und Touchpad

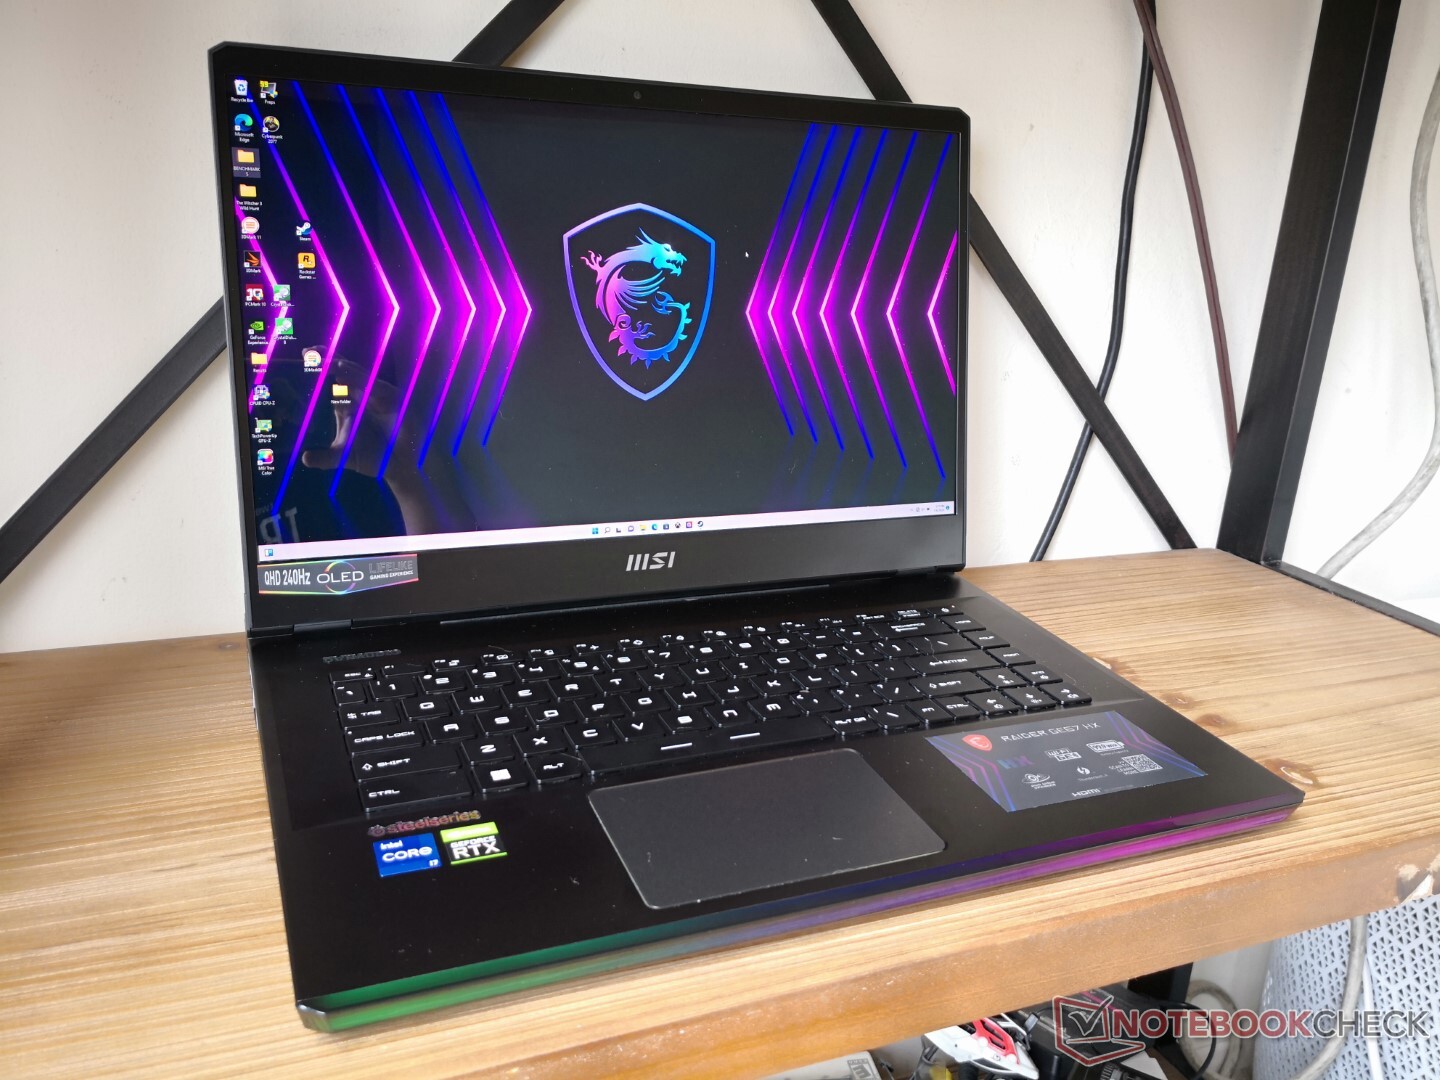
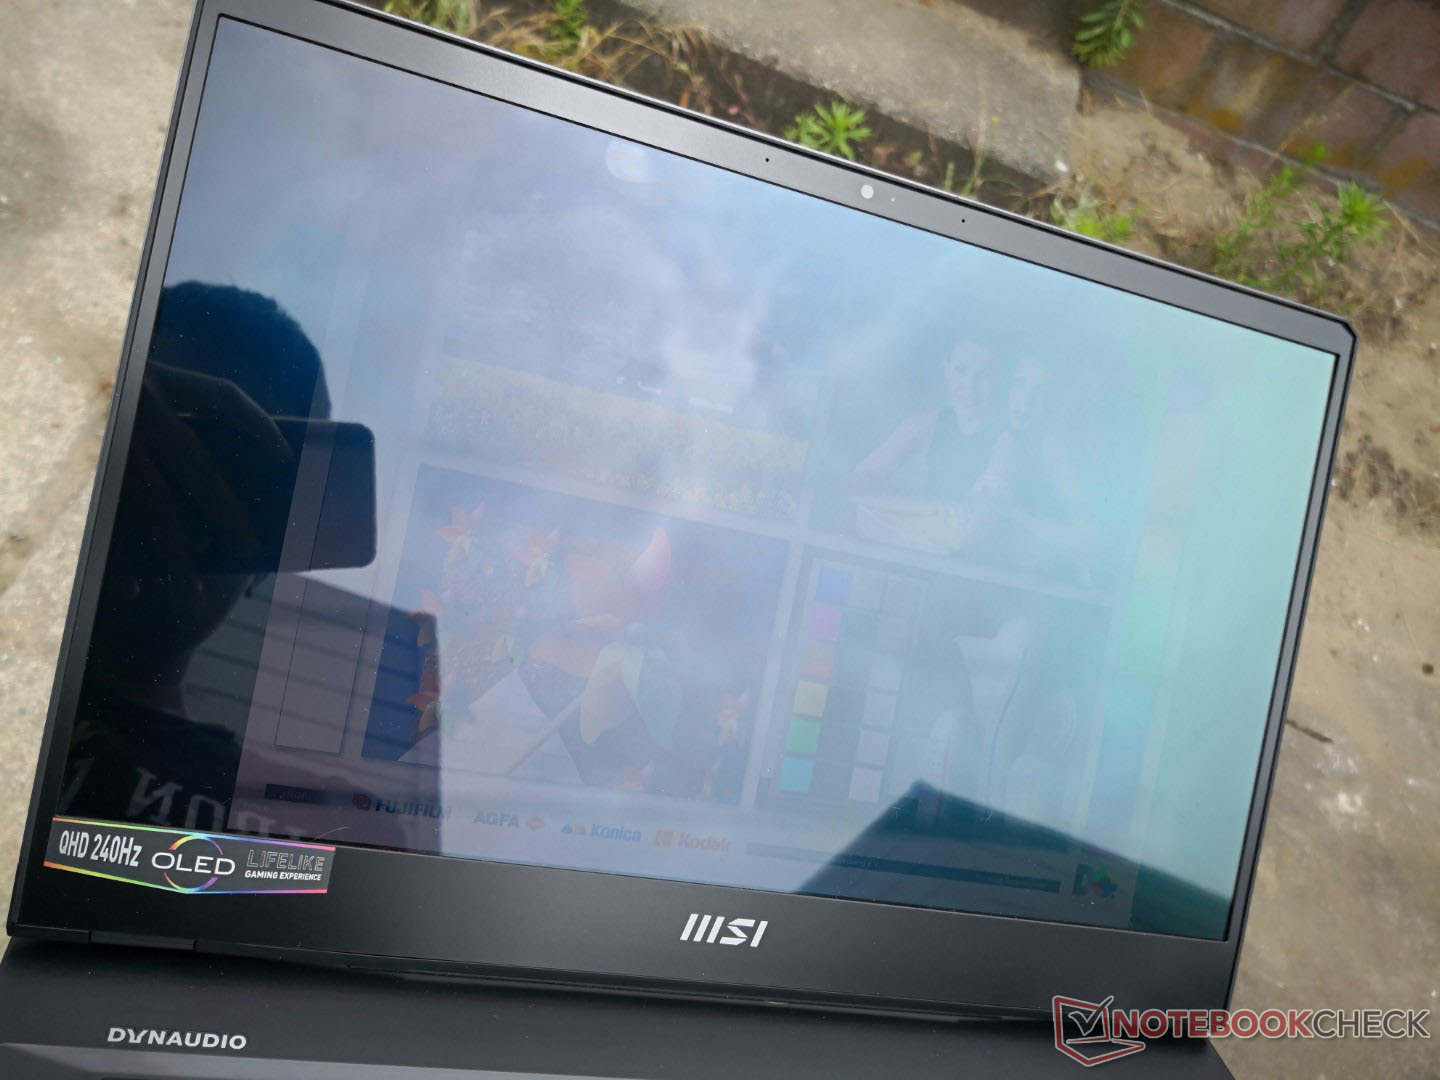
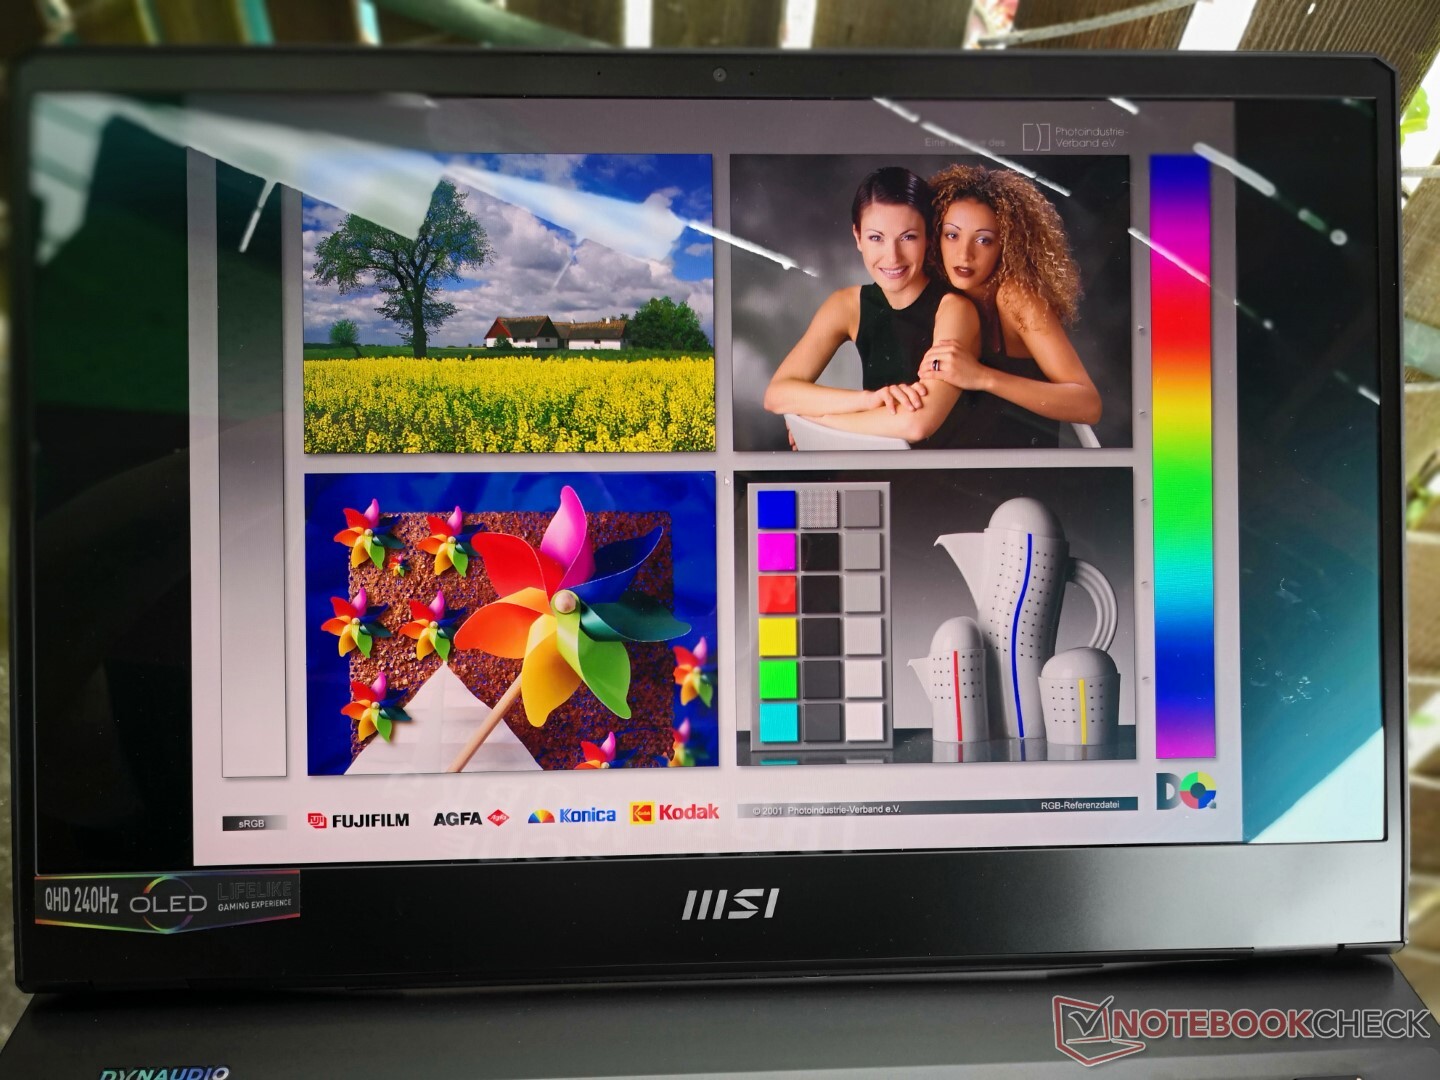
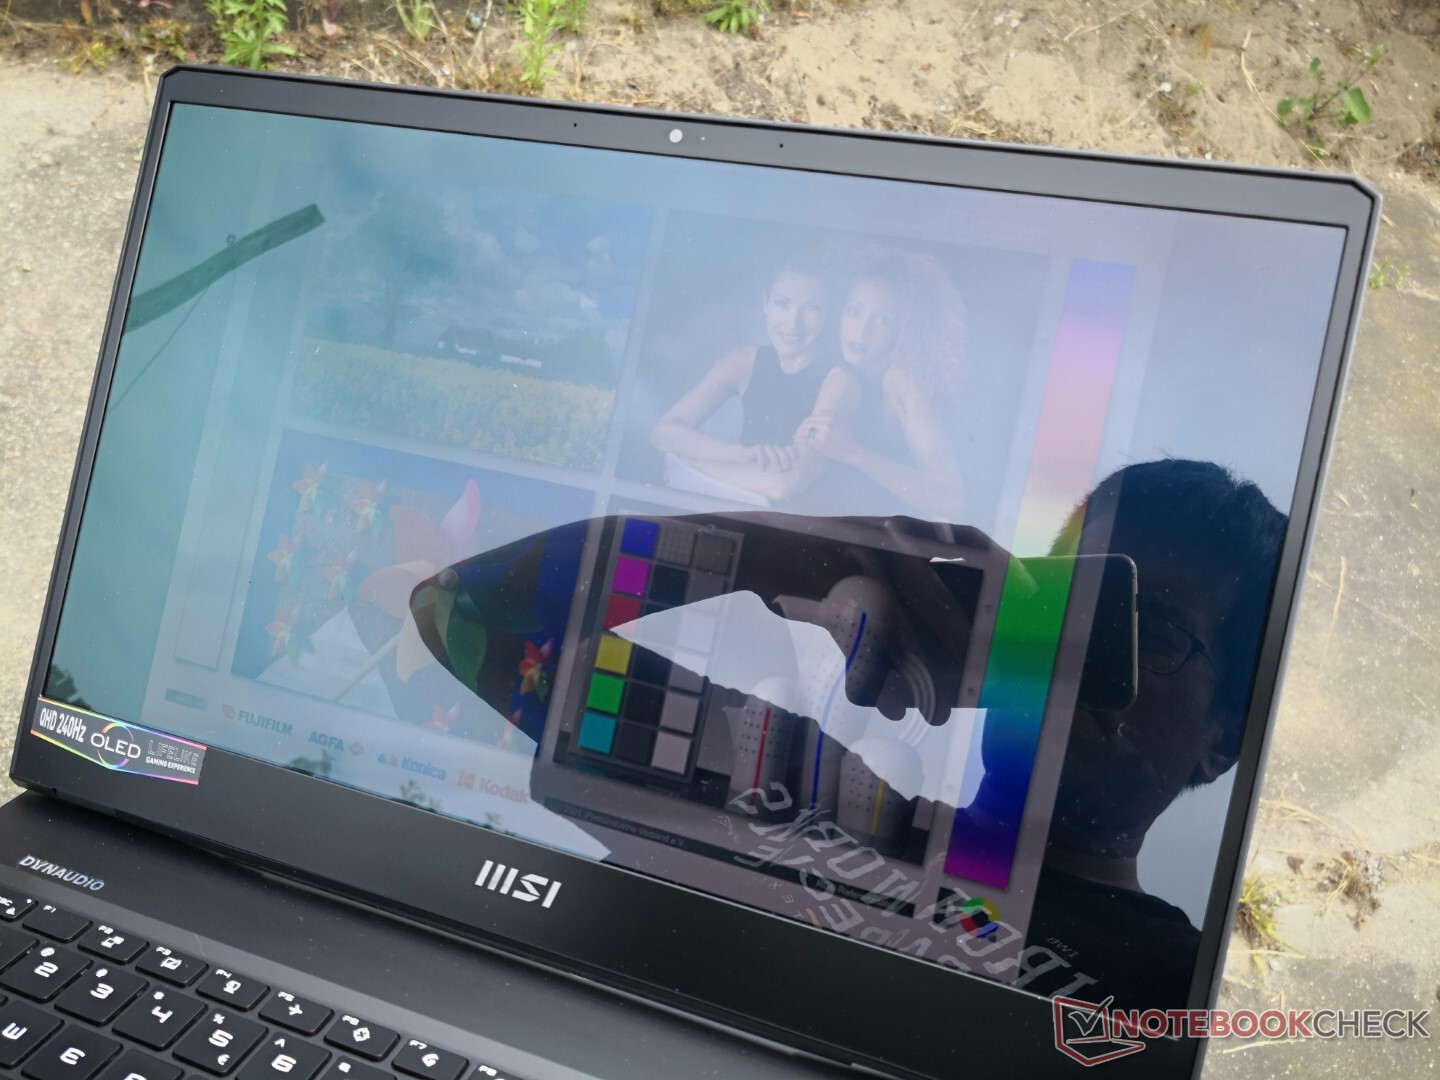
Display — Nahezu Perfekt für Spiele
Das MSI GE67 und das Razer Blade 15 sind die zwei ersten Laptops mit einem QHD-OLED-240-Hz-Display. Das klingt zwar erstmal fantastisch, allerdings gibt es ein paar Dinge zu beachten.
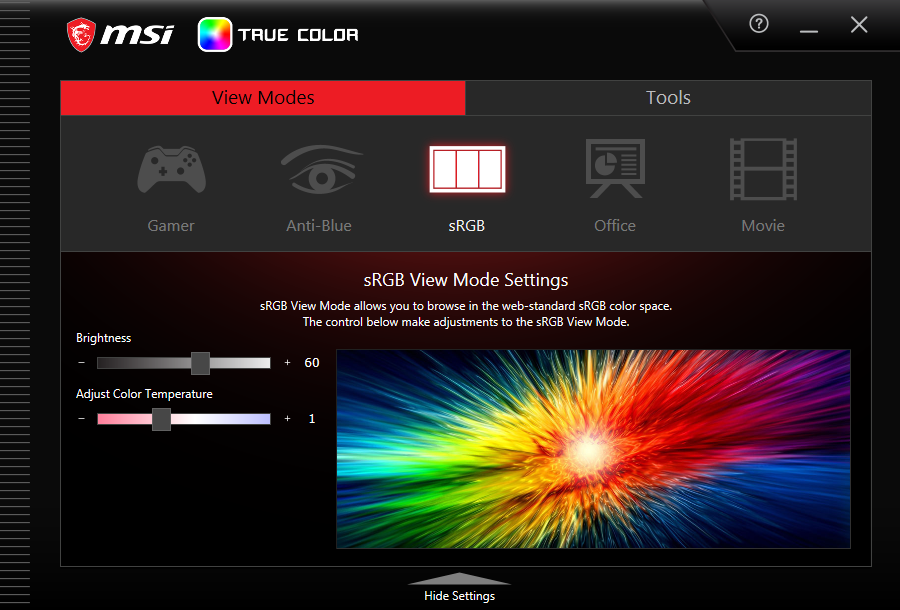
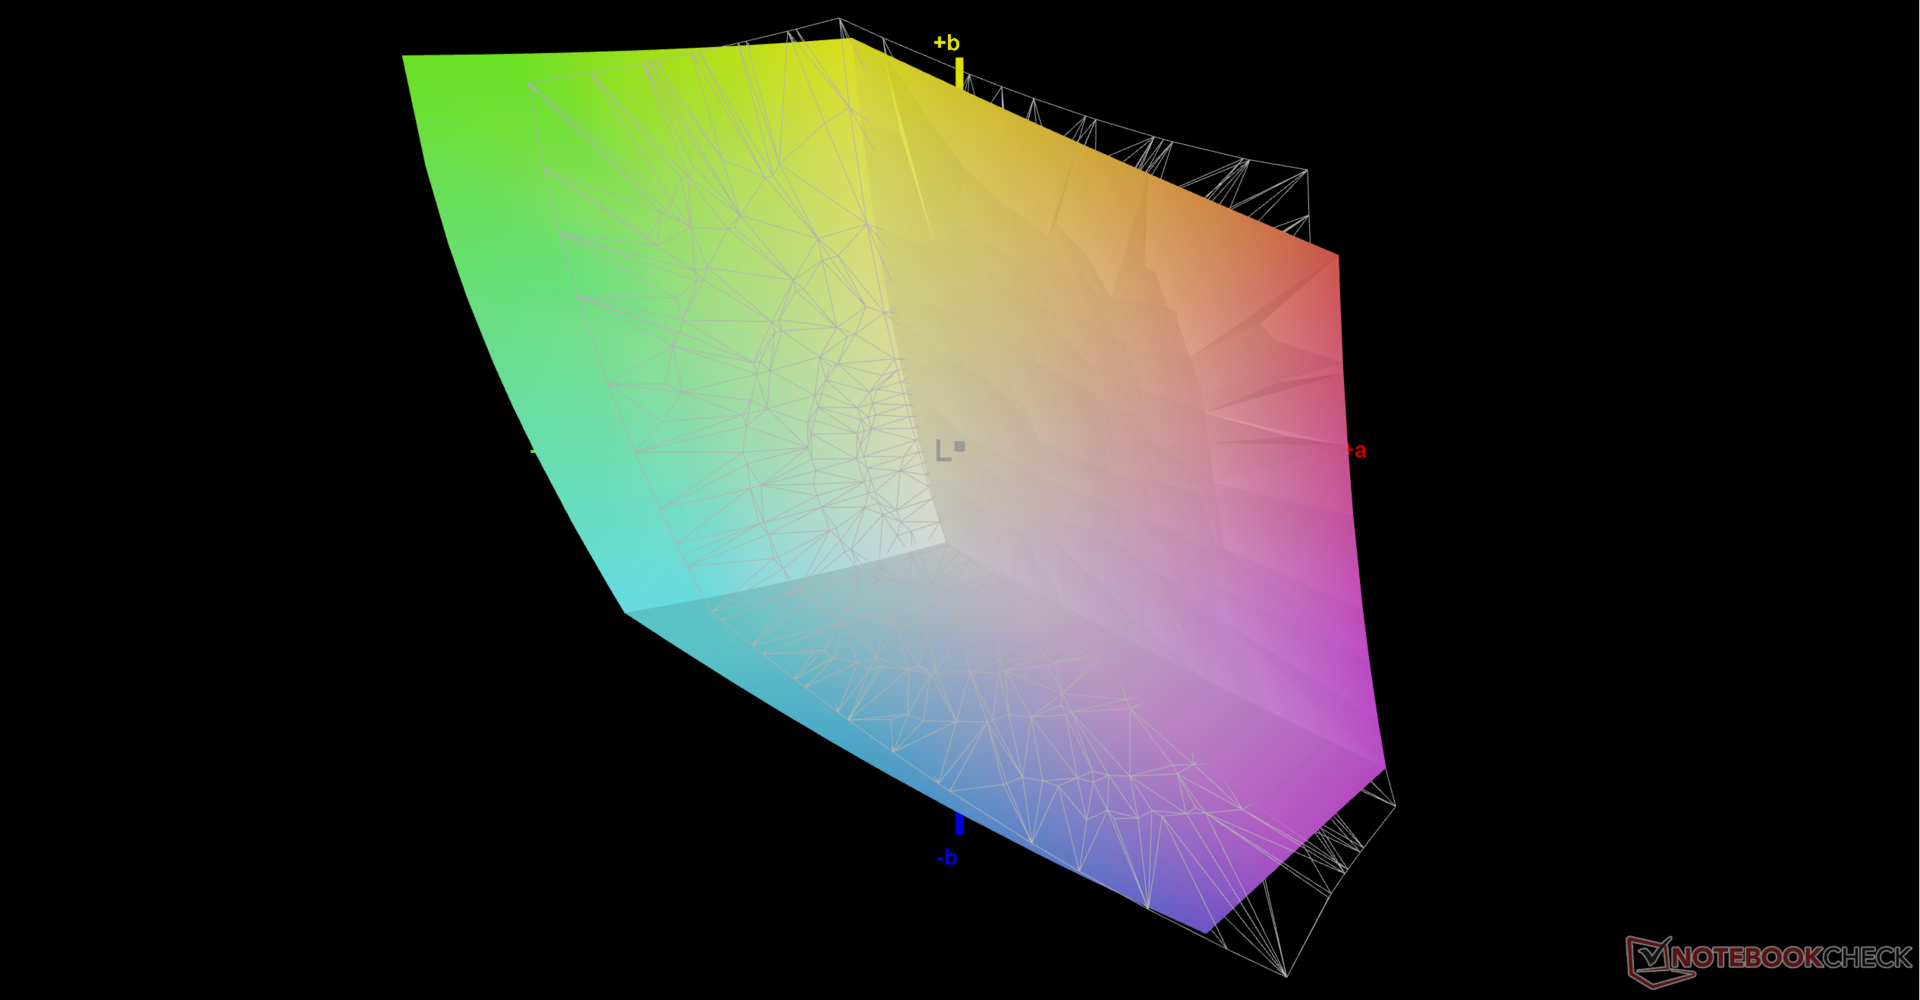
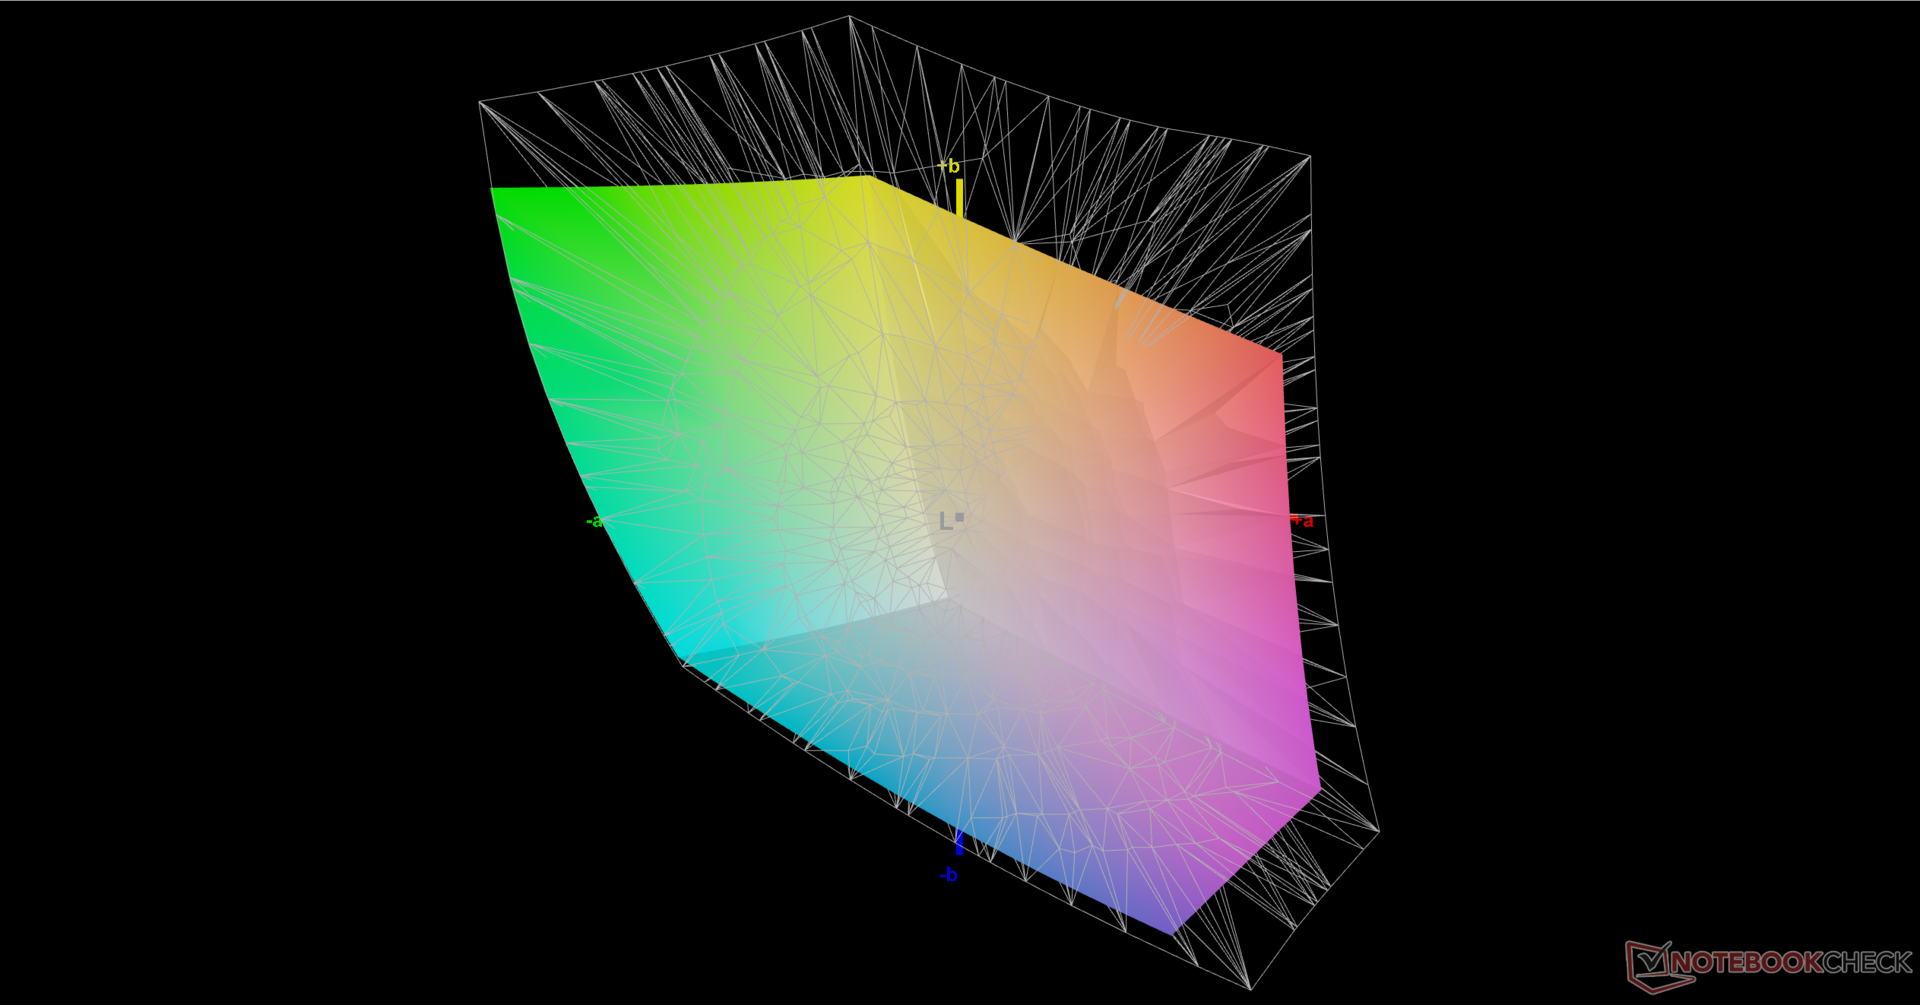
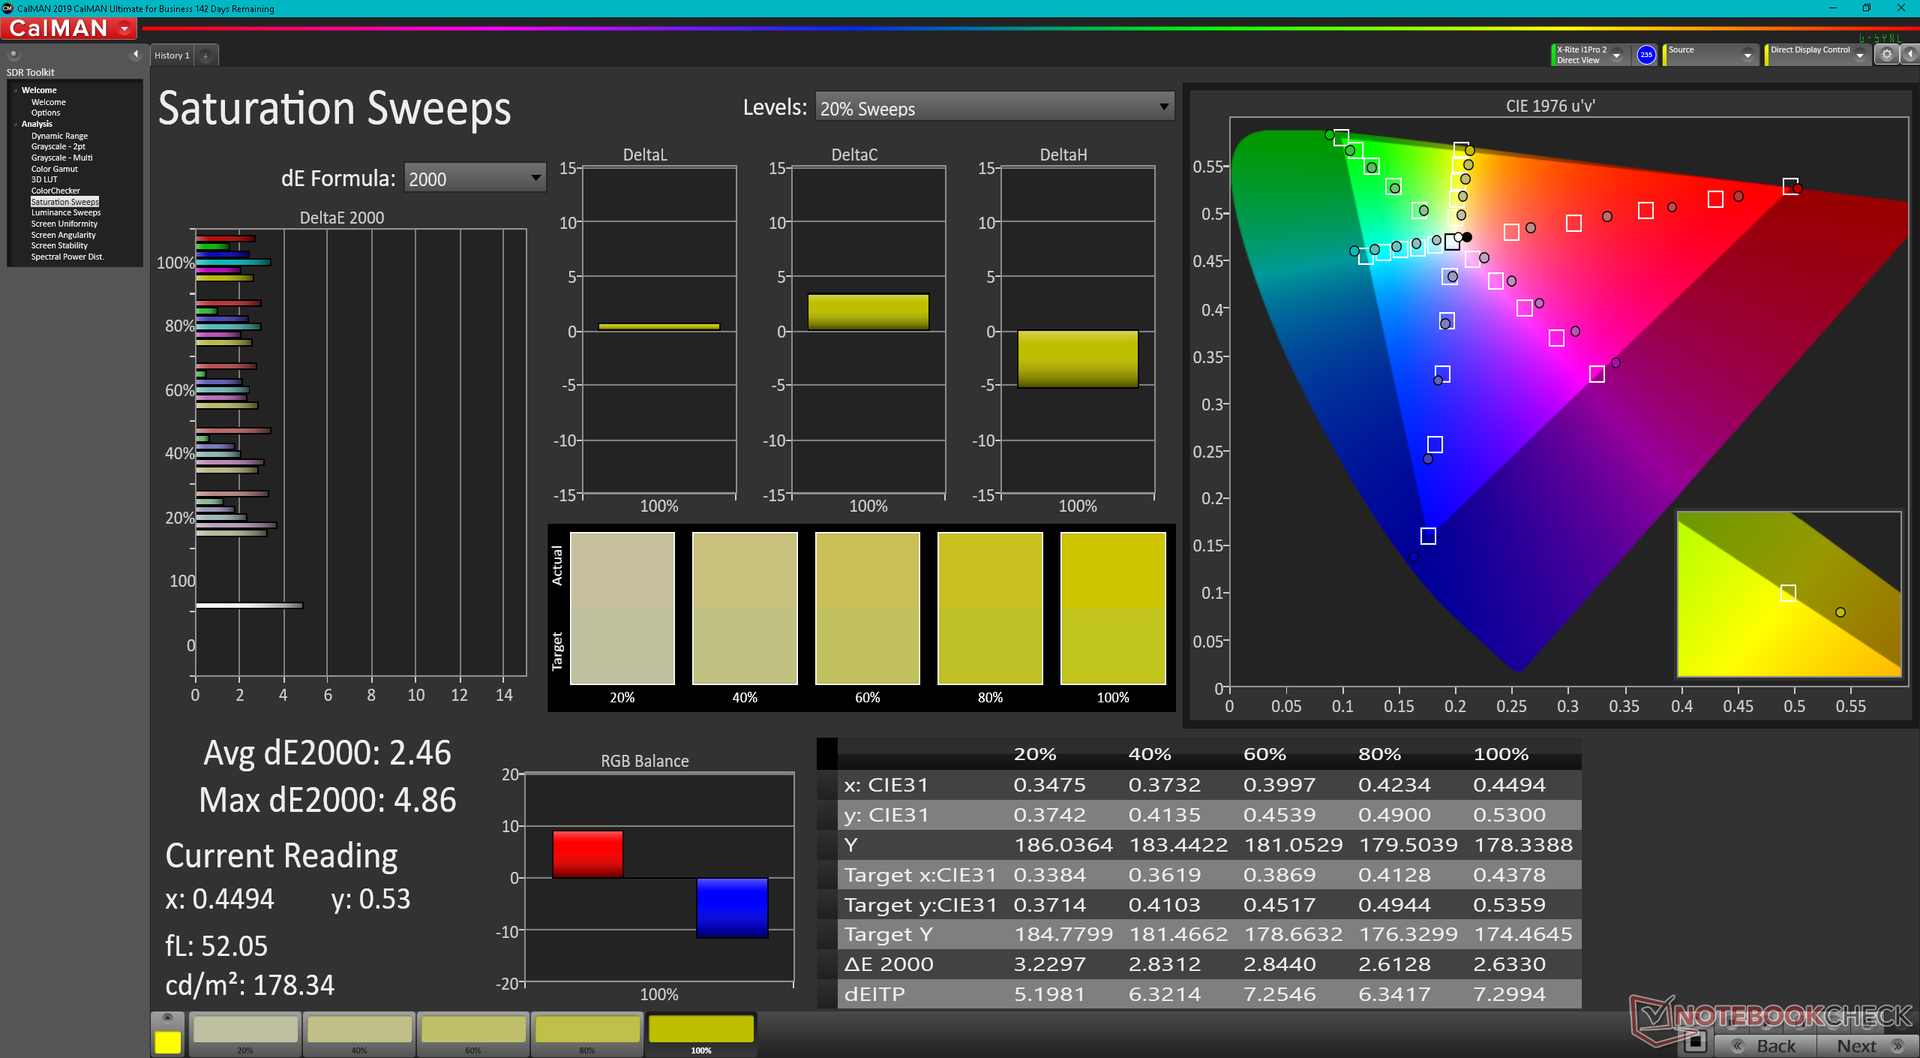
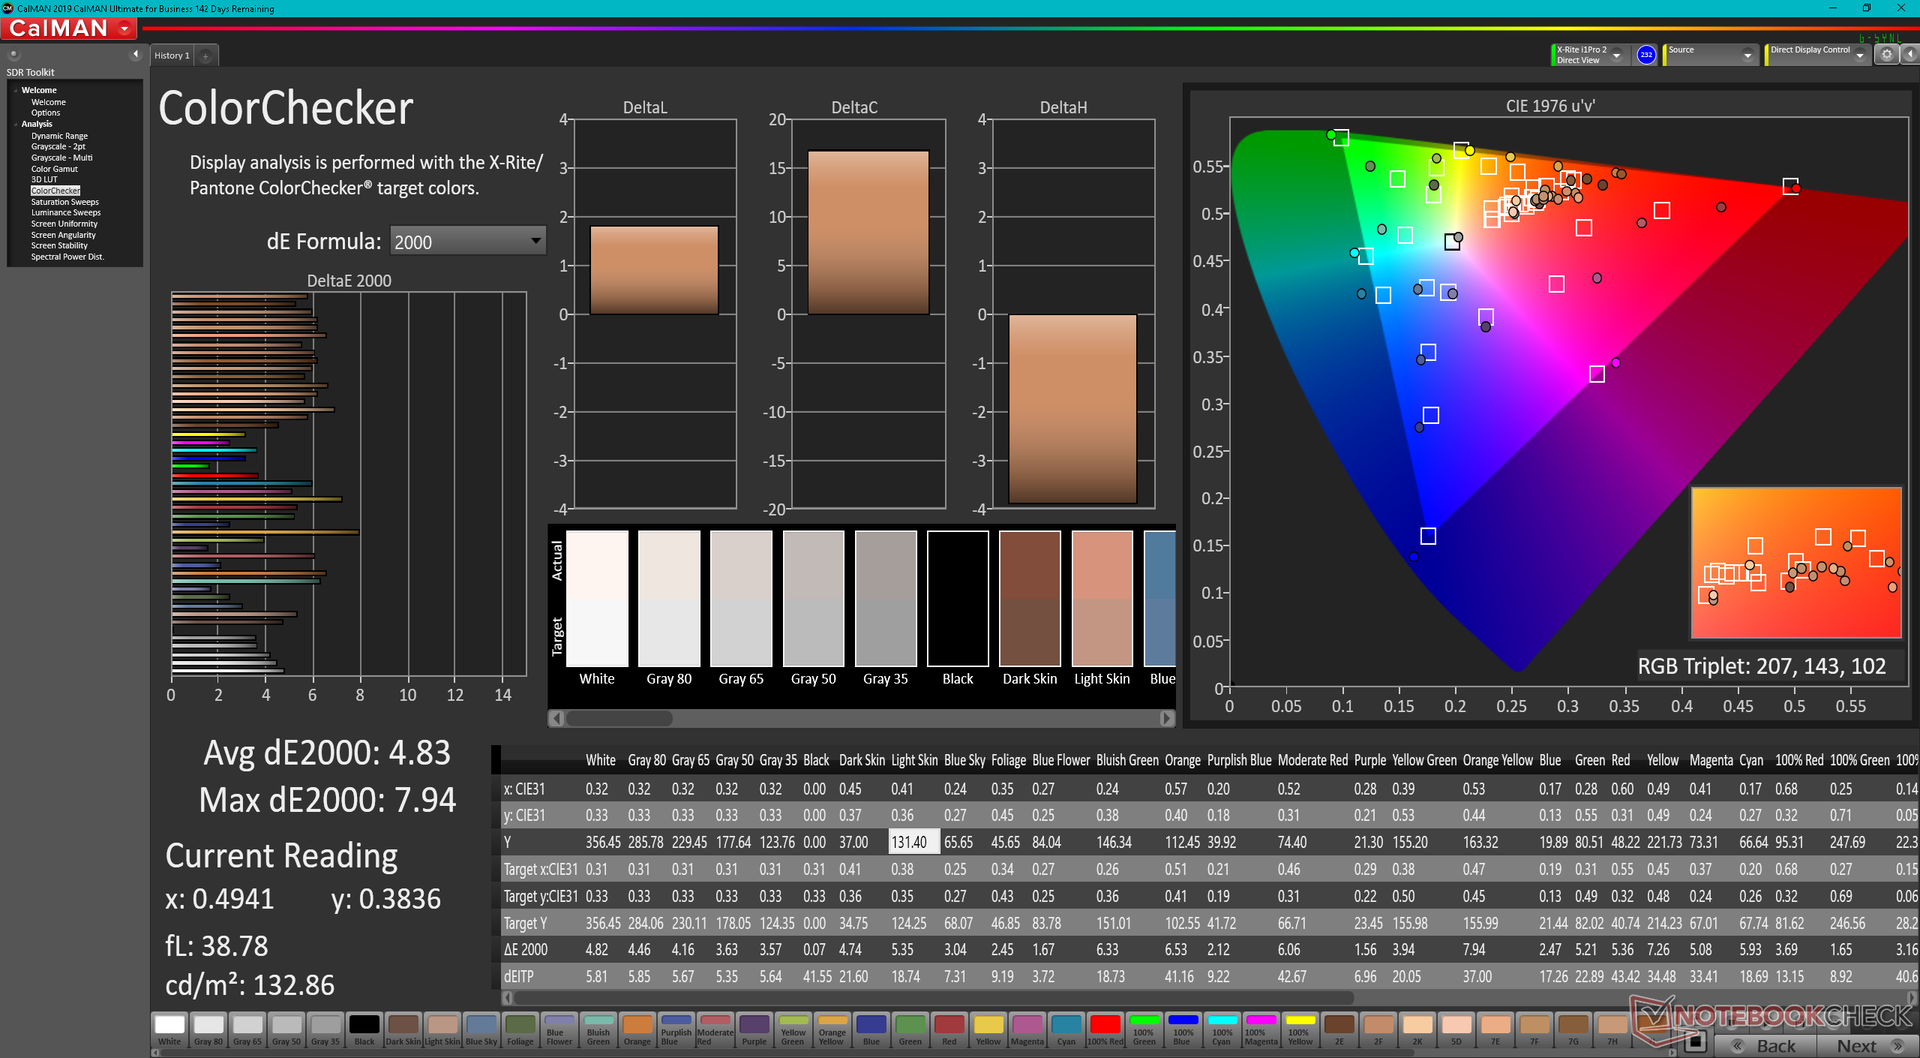
Erstens ist das Display des GE67 nicht vorkalibriert, obwohl das OLED-Panel mit einer vollständigen DCI-P3-Farbraumabdeckung beworben wird. Tatsächlich sehen wir in unserer Messung nur 72 % des DCI-P3-Farbraums und MSIs True-Color-Software bietet auch keinen DCI-P3-Modus. Auf Nachfrage hat MSI geantwortet, dass der DCI-P3-Modus eher für die Videobearbeitung und Creator-Laptops sinnvoll ist und das GE67 stattdessen einen Display-P3-Modus bietet.
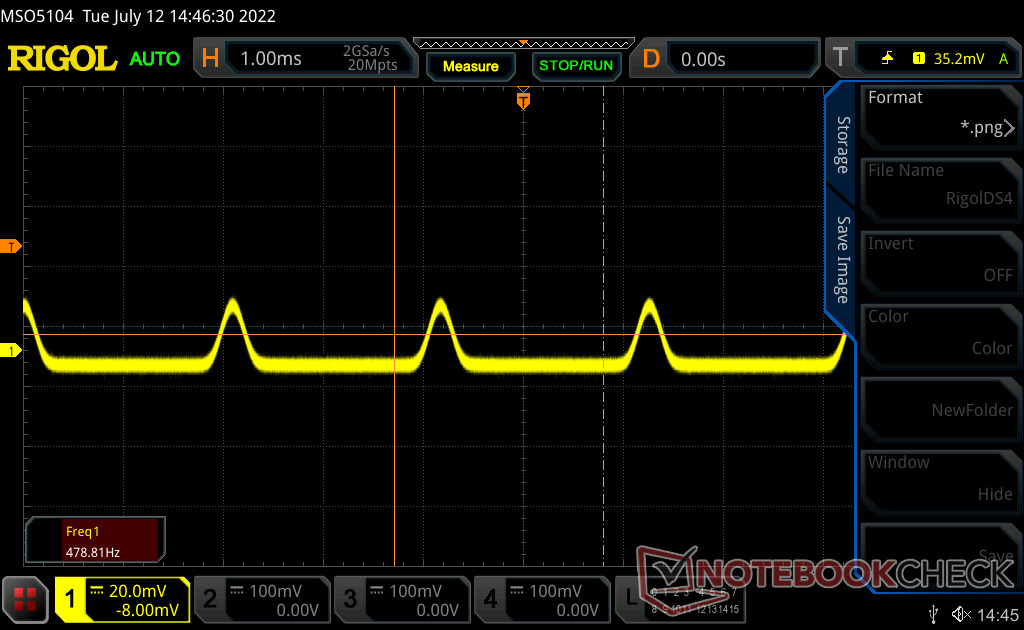
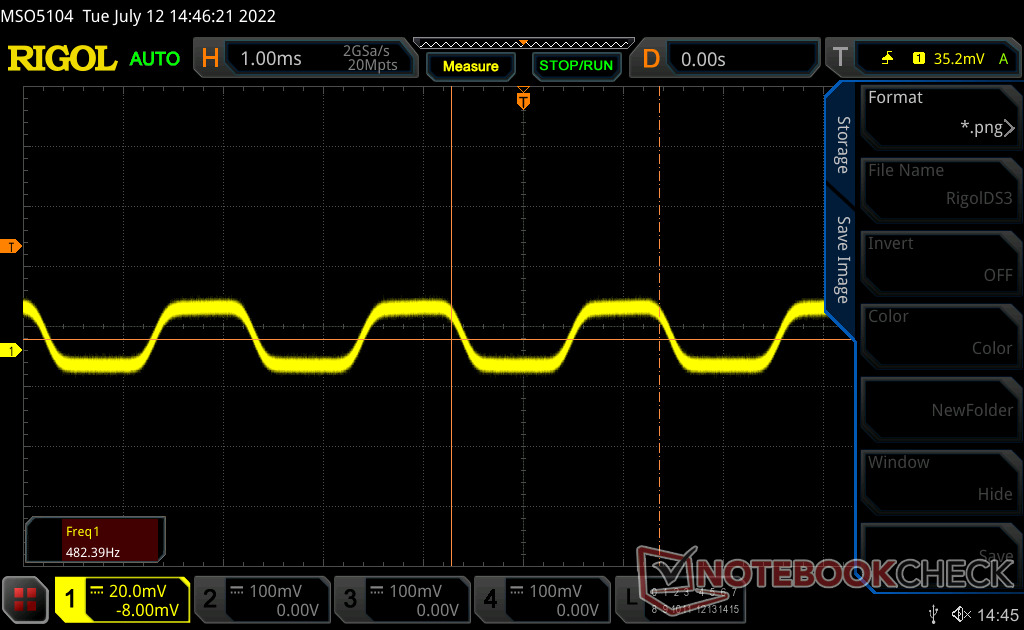
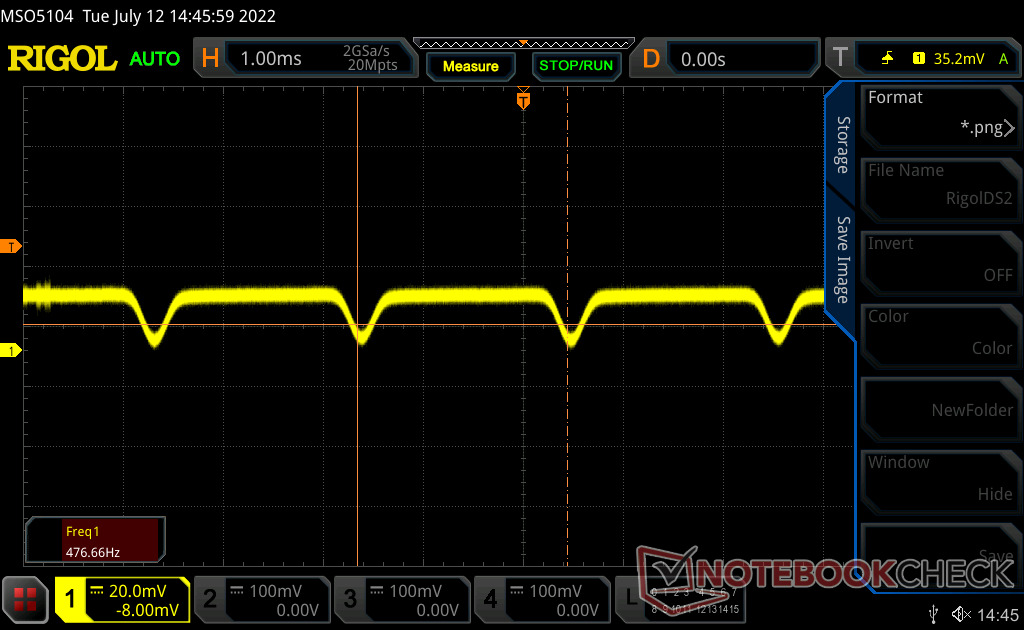
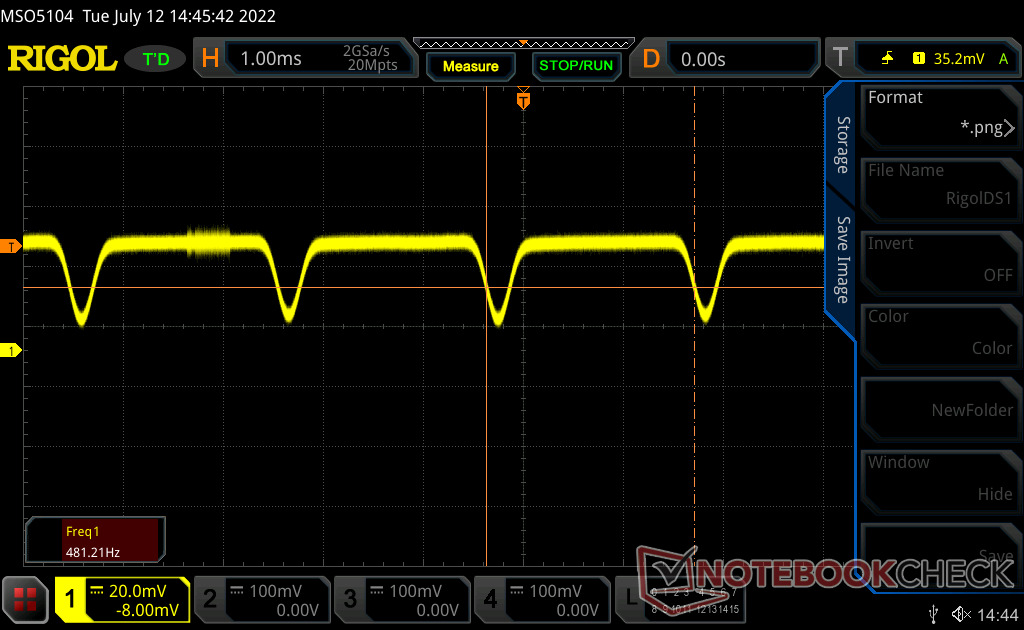
Zweitens flackert das Panel mit einer Frequenz von 480 Hz auf allen Helligkeitsstufen einschließlich 100 %. Ein ähnliches Verhalten haben wir auch bei vielen aktuellen Asus-Vivobook- und Zenbook-OLED-Modellen beobachtet. Wer empfindlich gegenüber Bildschirmflackern ist, sollte eventuell die Helligkeit senken oder das GE67 nicht zu lange am Stück nutzen.
Schließlich unterstützt das verbaute Display auch weder G-Sync noch Adaptive Sync.
Davon abgesehen bietet das QHD-OLED-240-Hz-Panel jedoch das flüssigste OLED-Gaming-Erlebnis, das wir bisher gesehen haben. Frühere OLED-Panels waren hingegen auf 60 Hz beschränkt und damit zwar für die digitale Medienbearbeitung gut geeignet, für Spiele-Zwecke jedoch eher uninteressant. Dieses Display wurde von MSI hingegen für Spiele und weniger für kreative oder professionelle Anwendungsfälle konzipiert.

| |||||||||||||||||||||||||
Ausleuchtung: 99 %
Helligkeit Akku: 356.1 cd/m²
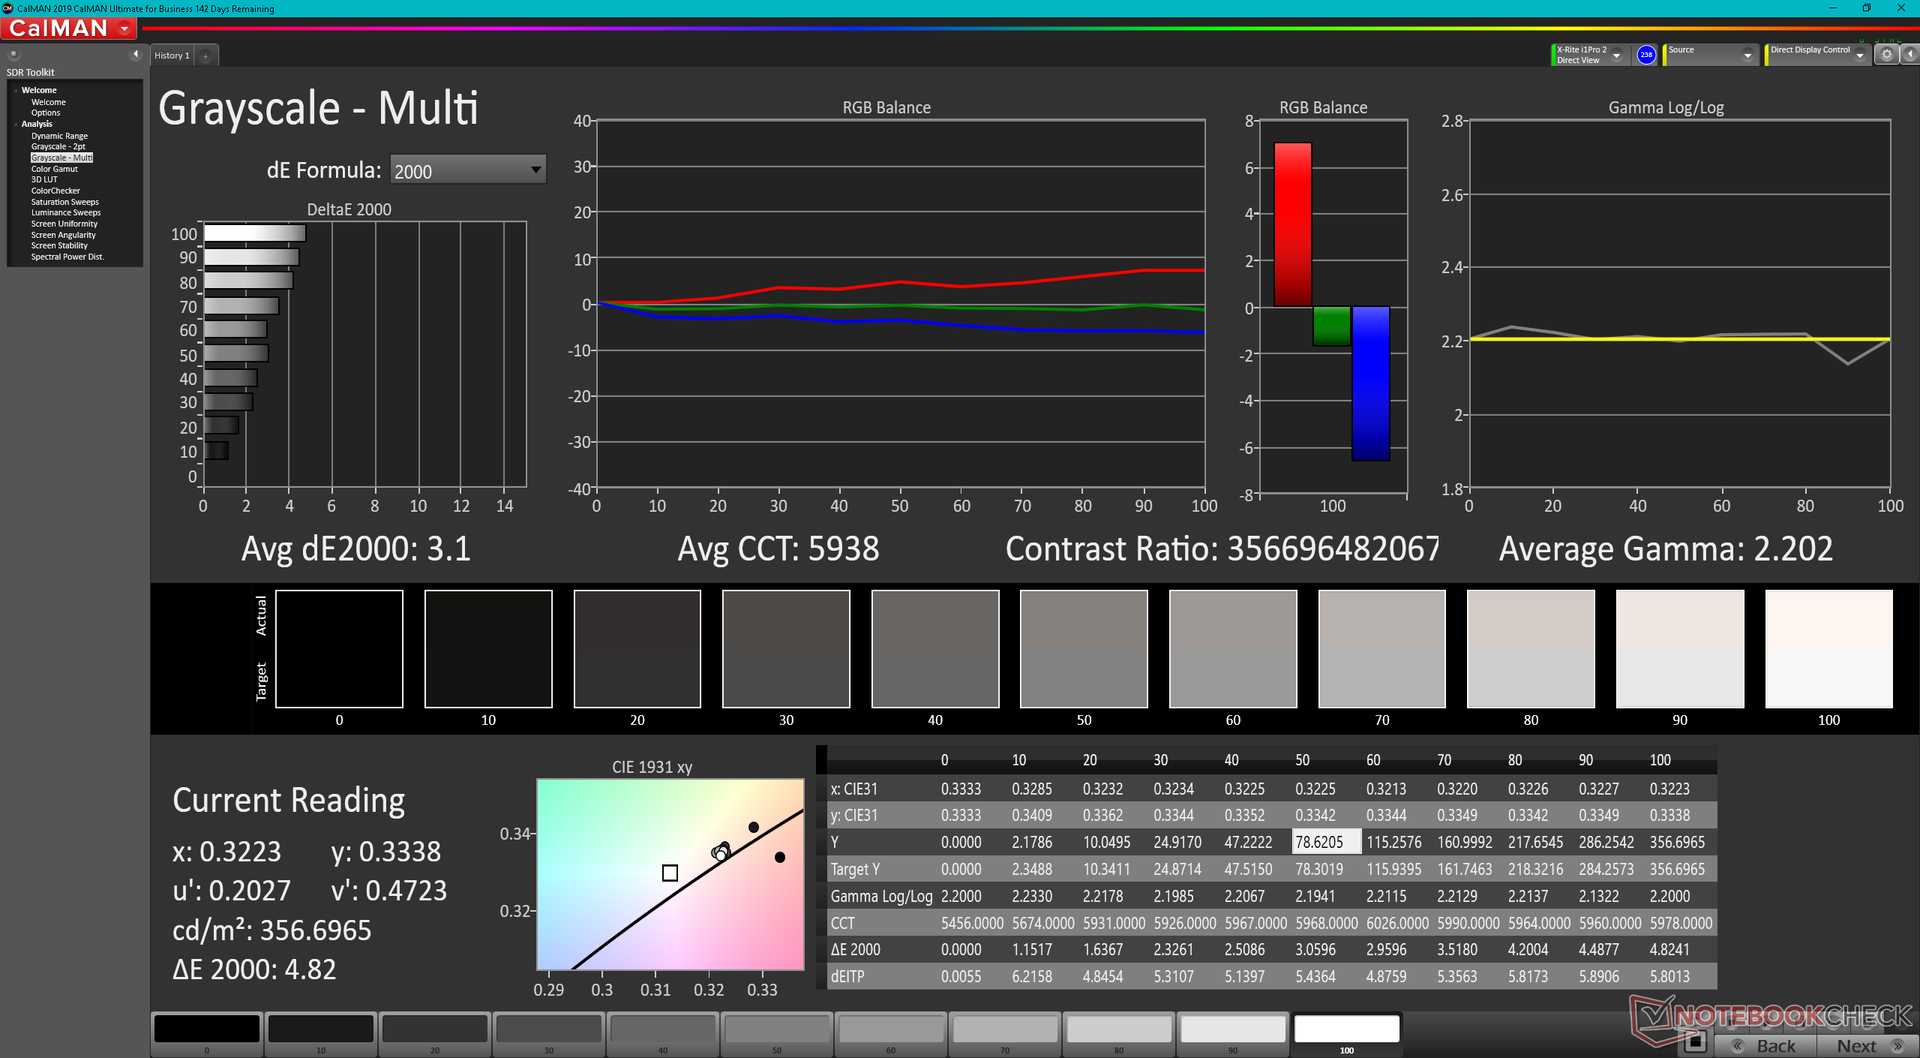
Kontrast: ∞:1 (Schwarzwert: 0 cd/m²)
ΔE ColorChecker Calman: 4.83 | ∀{0.5-29.43 Ø4.72}
ΔE Greyscale Calman: 3.1 | ∀{0.09-98 Ø4.97}
75.2% AdobeRGB 1998 (Argyll 3D)
89.7% sRGB (Argyll 3D)
71.7% Display P3 (Argyll 3D)
Gamma: 2.2
CCT: 5938 K
| MSI GE67 HX 12UGS Samsung ATNA562P02-0, OLED, 1920x1080, 15.6" | MSI Raider GE66 12UHS AUO51EB, IPS, 3840x2160, 15.6" | MSI Vector GP66 12UGS BOE NE156FHM-NZ3, IPS, 1920x1080, 15.6" | Asus ROG Strix Scar 15 G533ZW-LN106WS BOE CQ NE156QHM-NZ2, IPS-level, 2560x1440, 15.6" | Alienware m15 R6, i7-11800H RTX 3080 AU Optronics AUO9092 (B156HAN), IPS, 1920x1080, 15.6" | Razer Blade 15 2022 Sharp LQ156T1JW03, IPS, 2560x1440, 15.6" | |
|---|---|---|---|---|---|---|
| Display | 16% | 2% | 19% | 5% | 21% | |
| Display P3 Coverage (%) | 71.7 | 80.4 12% | 70.1 -2% | 96.2 34% | 74.1 3% | 99.1 38% |
| sRGB Coverage (%) | 89.7 | 98.4 10% | 99.5 11% | 99.9 11% | 99.5 11% | 99.9 11% |
| AdobeRGB 1998 Coverage (%) | 75.2 | 94.7 26% | 72.1 -4% | 84.5 12% | 75.7 1% | 86.8 15% |
| Response Times | -5260% | -2260% | -2134% | -1160% | -4230% | |
| Response Time Grey 50% / Grey 80% * (ms) | 0.25 ? | 18.8 ? -7420% | 5.8 ? -2220% | 7.86 ? -3044% 4.21 ? -1584% | 2.8 -1020% | 14.4 ? -5660% |
| Response Time Black / White * (ms) | 0.4 ? | 12.8 ? -3100% | 9.6 ? -2300% | 7.5 ? -1775% | 5.6 -1300% | 11.6 ? -2800% |
| PWM Frequency (Hz) | 480.4 ? | |||||
| Bildschirm | -1% | 6% | 9% | 6% | 15% | |
| Helligkeit Bildmitte (cd/m²) | 356.1 | 351 -1% | 353.1 -1% | 346 -3% | 359 1% | 286 -20% |
| Brightness (cd/m²) | 358 | 347 -3% | 325 -9% | 329 -8% | 344 -4% | 271 -24% |
| Brightness Distribution (%) | 99 | 90 -9% | 85 -14% | 91 -8% | 85 -14% | 89 -10% |
| Schwarzwert * (cd/m²) | 0.35 | 0.38 | 0.59 | 0.35 | 0.25 | |
| Delta E Colorchecker * | 4.83 | 2.54 47% | 2.24 54% | 3.06 37% | 3.3 32% | 2.74 43% |
| Colorchecker dE 2000 max. * | 7.94 | 8.36 -5% | 5 37% | 5.81 27% | 4.84 39% | 5.21 34% |
| Delta E Graustufen * | 3.1 | 4.1 -32% | 4 -29% | 3.66 -18% | 1.1 65% | |
| Gamma | 2.2 100% | 2.089 105% | 2.24 98% | 2.12 104% | 2.43 91% | 2.2 100% |
| CCT | 5938 109% | 7036 92% | 6864 95% | 7021 93% | 5896 110% | 6408 101% |
| Kontrast (:1) | 1003 | 929 | 586 | 1026 | 1144 | |
| Colorchecker dE 2000 calibrated * | 0.67 | 1.02 | 2.57 | 3.28 | 2.52 | |
| Durchschnitt gesamt (Programm / Settings) | -1748% /
-952% | -751% /
-407% | -702% /
-573% | -383% /
-206% | -1398% /
-755% |
* ... kleinere Werte sind besser
Reaktionszeiten (Response Times) des Displays
| ↔ Reaktionszeiten Schwarz zu Weiß | ||
|---|---|---|
| 0.4 ms ... steigend ↗ und fallend ↘ kombiniert | ↗ 0.2 ms steigend | 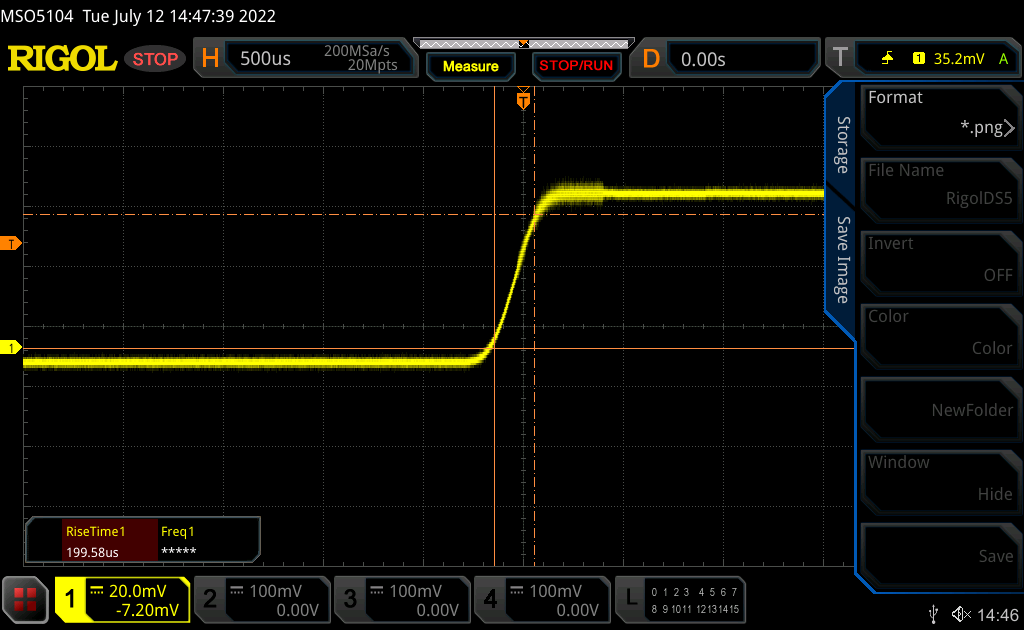 |
| ↘ 0.2 ms fallend | ||
| Die gemessenen Reaktionszeiten sind sehr kurz, wodurch sich der Bildschirm auch für schnelle 3D Spiele eignen sollte. Im Vergleich rangierten die bei uns getesteten Geräte von 0.1 (Minimum) zu 240 (Maximum) ms. » 0 % aller Screens waren schneller als der getestete. Daher sind die gemessenen Reaktionszeiten besser als der Durchschnitt aller vermessenen Geräte (19.8 ms). | ||
| ↔ Reaktionszeiten 50% Grau zu 80% Grau | ||
| 0.25 ms ... steigend ↗ und fallend ↘ kombiniert | ↗ 0.13 ms steigend | 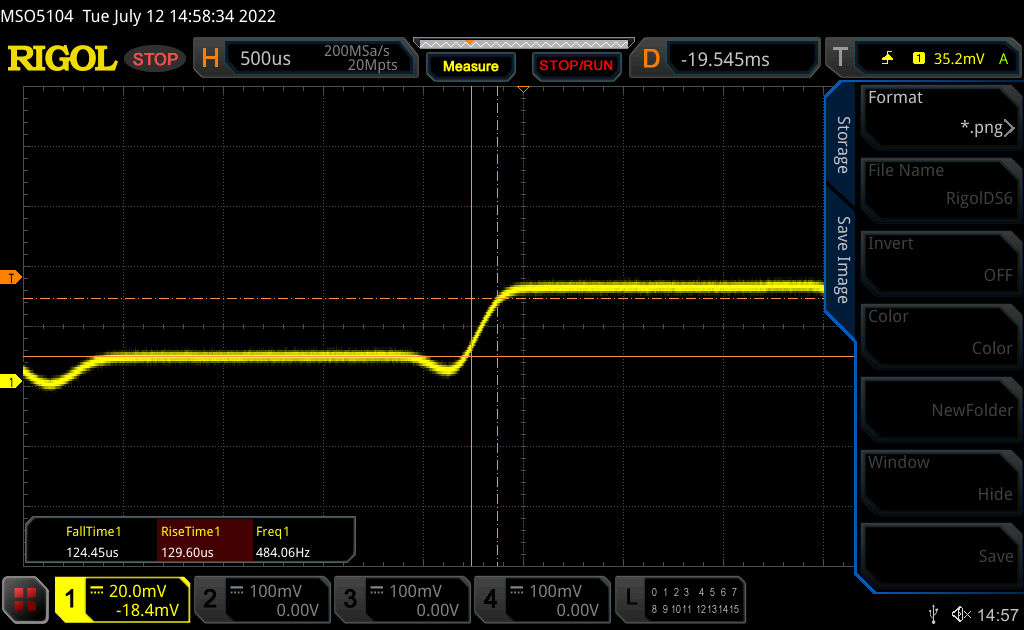 |
| ↘ 0.12 ms fallend | ||
| Die gemessenen Reaktionszeiten sind sehr kurz, wodurch sich der Bildschirm auch für schnelle 3D Spiele eignen sollte. Im Vergleich rangierten die bei uns getesteten Geräte von 0.165 (Minimum) zu 636 (Maximum) ms. » 0 % aller Screens waren schneller als der getestete. Daher sind die gemessenen Reaktionszeiten besser als der Durchschnitt aller vermessenen Geräte (31 ms). | ||
Bildschirm-Flackern / PWM (Pulse-Width Modulation)
| Flackern / PWM festgestellt | 480.4 Hz | ≤ 100 % Helligkeit | 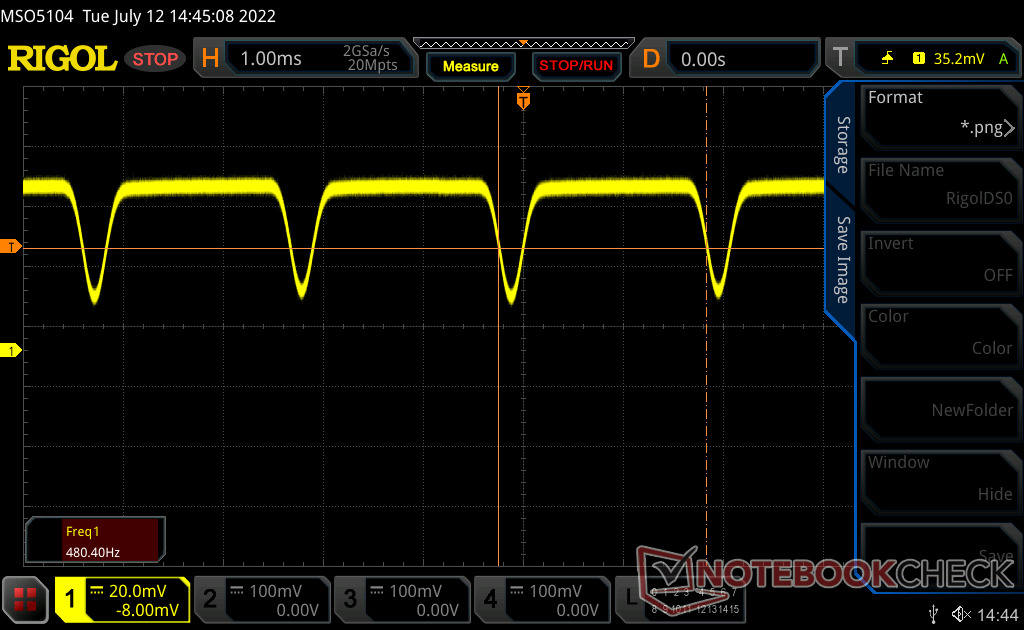 |
Das Display flackert mit 480.4 Hz (im schlimmsten Fall, eventuell durch Pulsweitenmodulation PWM) bei einer eingestellten Helligkeit von 100 % und darunter. Darüber sollte es zu keinem Flackern kommen. Die Frequenz von 480.4 Hz ist relativ hoch und sollte daher auch bei den meisten Personen zu keinen Problemen führen. Empfindliche User sollen laut Berichten aber sogar noch bei 500 Hz und darüber ein Flackern wahrnehmen. Im Vergleich: 52 % aller getesteten Geräte nutzten kein PWM um die Helligkeit zu reduzieren. Wenn PWM eingesetzt wurde, dann bei einer Frequenz von durchschnittlich 7769 (Minimum 5, Maximum 343500) Hz. | |||


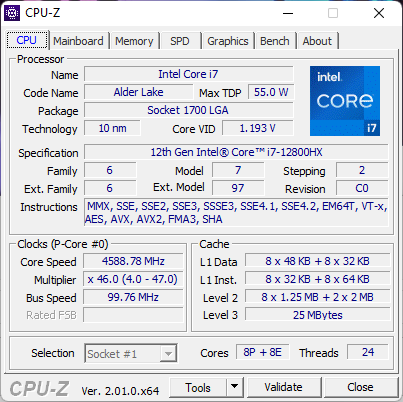
Leistung — 16 Kerne und 24 Threads
Testbedingungen
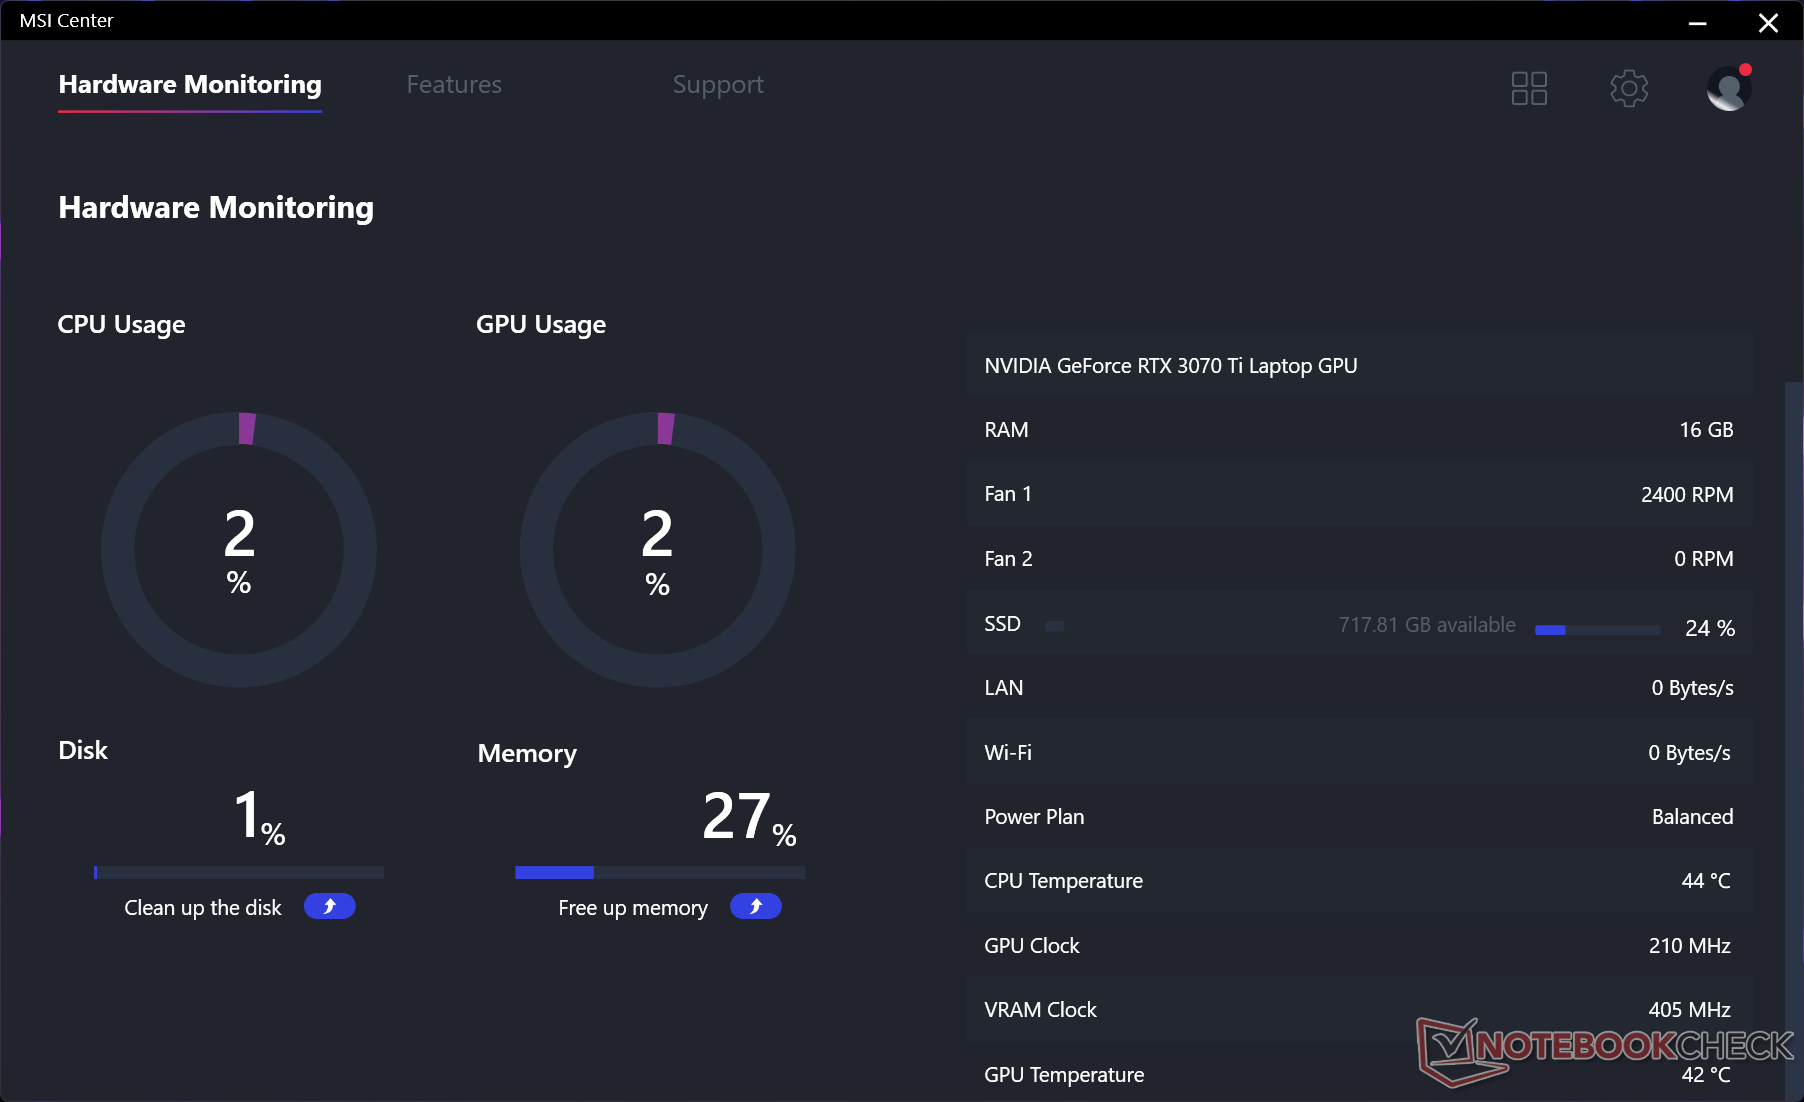
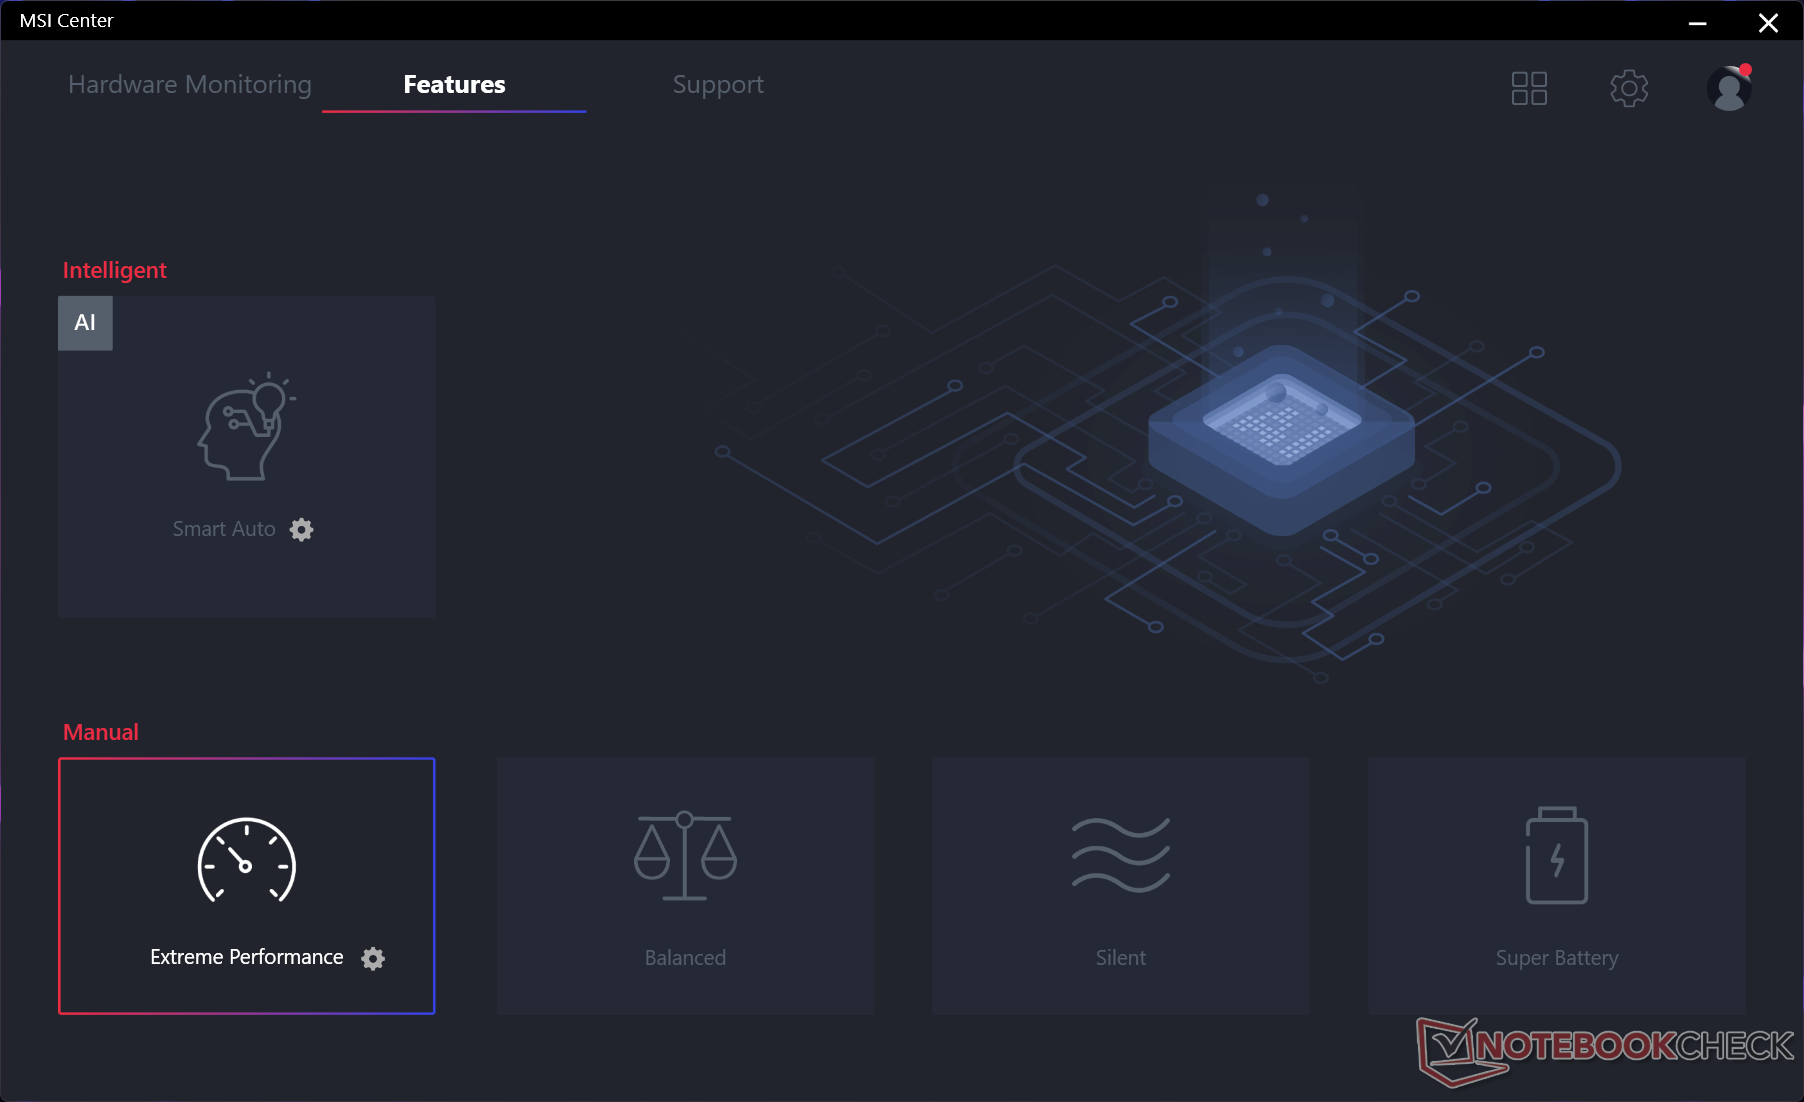
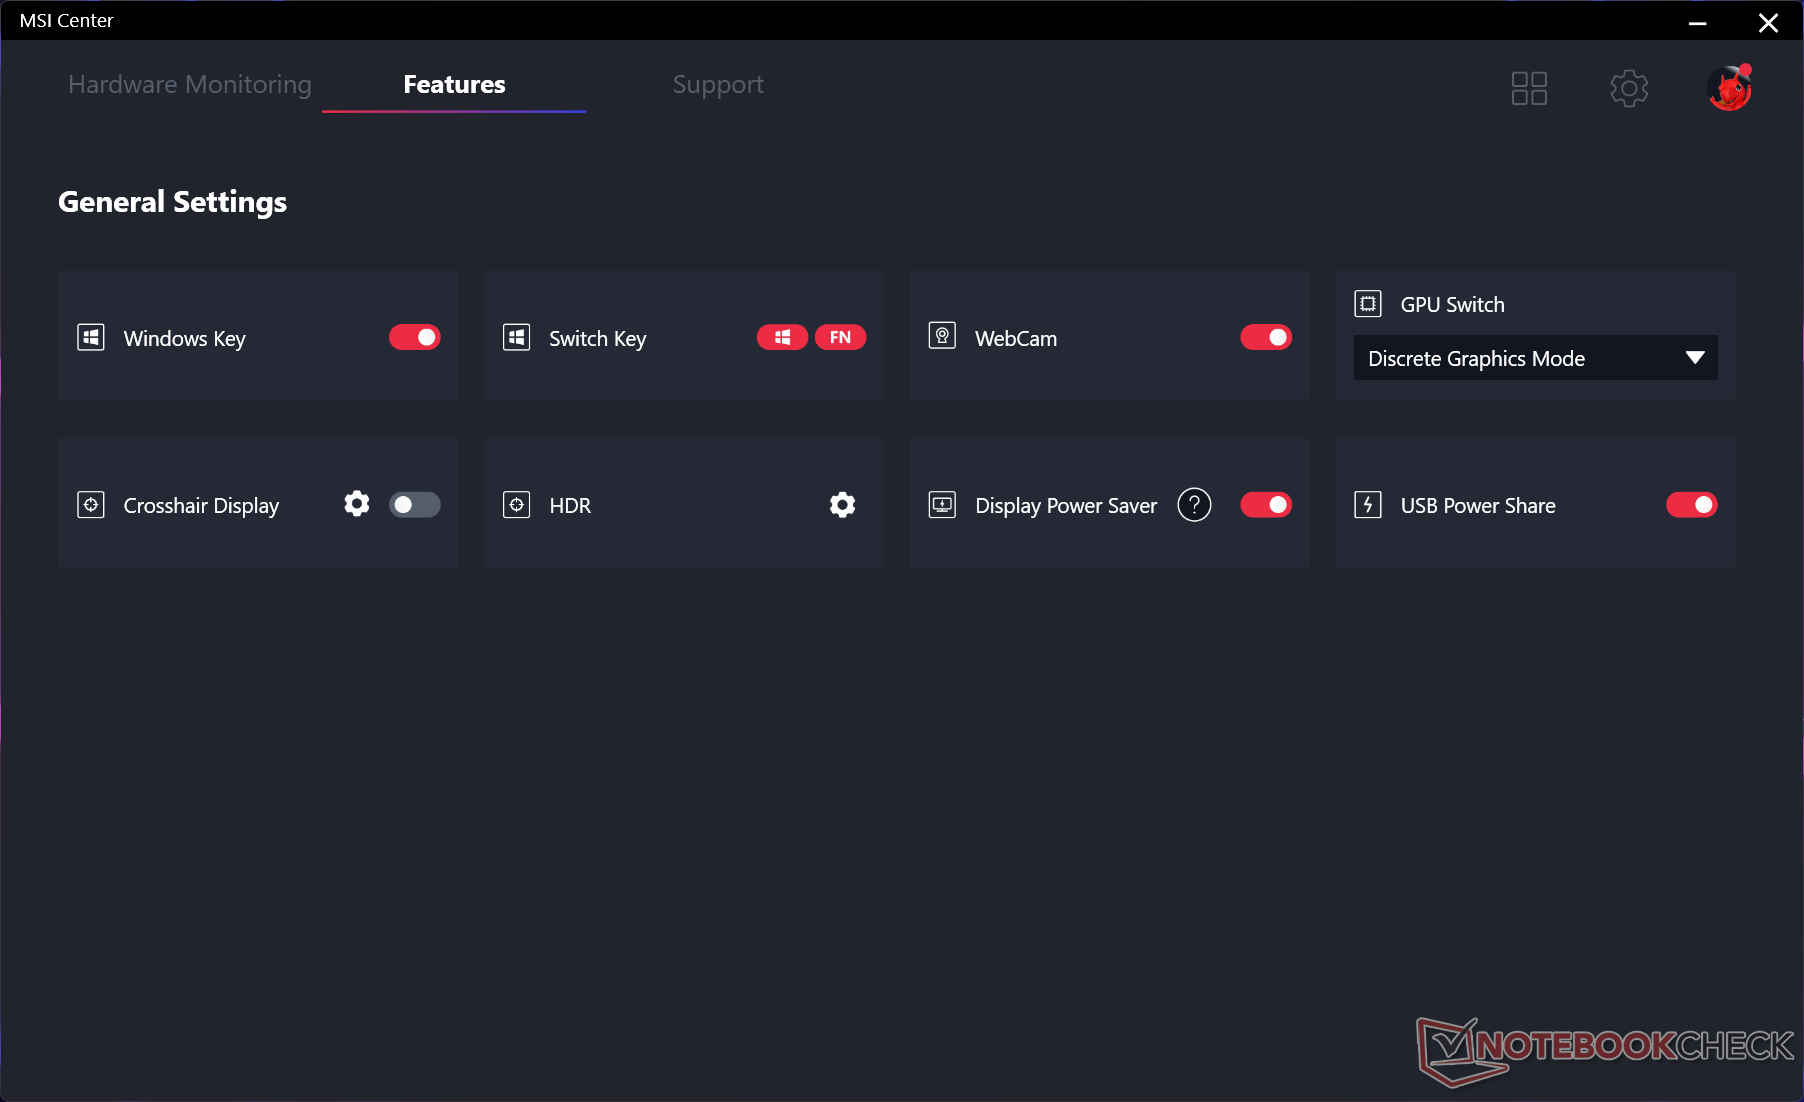
Wir haben vor dem Durchführen der unten aufgelisteten Benchmarks in Windows den Hochleistungsmodus, in MSI Center den Extremleistungsmodus und statt dem MSHybrid-Modus den Modus "Dedizierte GPU" aktiviert. Wir empfehlen Nutzern, sich mit der vorinstallierten MSI-Center-Software auseinanderzusetzen, da über diese wichtige Leistungs- und Hilfsfunktionen gesteuert werden.
Prozessor
Der Core i7-12800HX ist eindeutig ein Ass im Ärmel des GE67 HX. Die reine Multi-Thread-Leistung ist um ungefähr 25 % höher als beim Core i9-12900HK im GE66 aus Q1 2022 und im Vergleich zum Urmodell des GE66 aus 2020 mit dem Core i9-10980HK aus Intels 10. Generation sogar noch größer. Der Prozessor schlägt mühelos jeden mobilen Chip aus AMDs Zen-3-Reihe. Insbesondere der Ryzen 9 5900HX ist in Multi-Thread-Aufgaben um 40 bis 45 % langsamer.
Die Leistung wird hervorragend aufrechterhalten und auch nach längerer Auslastung fällt die Taktfrequenz nicht drastisch ab.
Die Single-Thread-Leistung ist mit der des Core i9-12900HK trotz der verschiedenen Anzahl an Kernen (16 vs. 14) und Threads (24 vs. 20) vergleichbar.
Dauertest: Cinebench R15 Multi
Cinebench R23: Multi Core | Single Core
Cinebench R15: CPU Multi 64Bit | CPU Single 64Bit
Blender: v2.79 BMW27 CPU
7-Zip 18.03: 7z b 4 | 7z b 4 -mmt1
Geekbench 5.5: Multi-Core | Single-Core
HWBOT x265 Benchmark v2.2: 4k Preset
LibreOffice : 20 Documents To PDF
R Benchmark 2.5: Overall mean
| Cinebench R23 / Multi Core | |
| Intel Core i9-12900K | |
| MSI GE67 HX 12UGS | |
| Durchschnittliche Intel Core i7-12800HX (n=1) | |
| MSI GE76 Raider | |
| Schenker XMG Neo 15 (i7-12700H, RTX 3080 Ti) | |
| Eurocom Raptor X15 | |
| Asus ROG Strix Scar 15 G533zm | |
| MSI Raider GE66 12UHS | |
| Schenker XMG Apex 15 NH57E PS | |
| MSI Delta 15 A5EFK | |
| Cinebench R23 / Single Core | |
| Intel Core i9-12900K | |
| MSI GE76 Raider | |
| MSI Raider GE66 12UHS | |
| MSI GE67 HX 12UGS | |
| Durchschnittliche Intel Core i7-12800HX (n=1) | |
| Schenker XMG Neo 15 (i7-12700H, RTX 3080 Ti) | |
| Eurocom Raptor X15 | |
| Asus ROG Strix Scar 15 G533zm | |
| MSI Delta 15 A5EFK | |
| Schenker XMG Apex 15 NH57E PS | |
| Cinebench R15 / CPU Multi 64Bit | |
| Intel Core i9-12900K | |
| MSI GE67 HX 12UGS | |
| Durchschnittliche Intel Core i7-12800HX (n=1) | |
| Asus ROG Strix Scar 15 G533zm | |
| MSI GE76 Raider | |
| Schenker XMG Neo 15 (i7-12700H, RTX 3080 Ti) | |
| MSI Raider GE66 12UHS | |
| MSI Delta 15 A5EFK | |
| Schenker XMG Apex 15 NH57E PS | |
| Dell G5 15 SE 5505 P89F | |
| Eurocom Sky X4C i9-9900KS | |
| MSI GE66 Raider 10SFS | |
| Asus Zephyrus S15 GX502L | |
| Cinebench R15 / CPU Single 64Bit | |
| Intel Core i9-12900K | |
| Asus ROG Strix Scar 15 G533zm | |
| MSI GE76 Raider | |
| MSI Raider GE66 12UHS | |
| Schenker XMG Neo 15 (i7-12700H, RTX 3080 Ti) | |
| MSI GE67 HX 12UGS | |
| Durchschnittliche Intel Core i7-12800HX (n=1) | |
| MSI Delta 15 A5EFK | |
| Schenker XMG Apex 15 NH57E PS | |
| Eurocom Sky X4C i9-9900KS | |
| MSI GE66 Raider 10SFS | |
| Asus Zephyrus S15 GX502L | |
| Dell G5 15 SE 5505 P89F | |
| HWBOT x265 Benchmark v2.2 / 4k Preset | |
| Intel Core i9-12900K | |
| MSI GE67 HX 12UGS | |
| Durchschnittliche Intel Core i7-12800HX (n=1) | |
| Asus ROG Strix Scar 15 G533zm | |
| Schenker XMG Neo 15 (i7-12700H, RTX 3080 Ti) | |
| MSI GE76 Raider | |
| MSI Raider GE66 12UHS | |
| MSI Delta 15 A5EFK | |
| Schenker XMG Apex 15 NH57E PS | |
| Eurocom Sky X4C i9-9900KS | |
| Eurocom Raptor X15 | |
| Asus Zephyrus S15 GX502L | |
| MSI GE66 Raider 10SFS | |
| Dell G5 15 SE 5505 P89F | |
| LibreOffice / 20 Documents To PDF | |
| Dell G5 15 SE 5505 P89F | |
| Schenker XMG Apex 15 NH57E PS | |
| MSI GE66 Raider 10SFS | |
| MSI Delta 15 A5EFK | |
| Schenker XMG Neo 15 (i7-12700H, RTX 3080 Ti) | |
| Asus Zephyrus S15 GX502L | |
| MSI GE67 HX 12UGS | |
| Durchschnittliche Intel Core i7-12800HX (n=1) | |
| Intel Core i9-12900K | |
| Asus ROG Strix Scar 15 G533zm | |
| MSI GE76 Raider | |
| Eurocom Raptor X15 | |
| MSI Raider GE66 12UHS | |
| R Benchmark 2.5 / Overall mean | |
| Asus Zephyrus S15 GX502L | |
| Dell G5 15 SE 5505 P89F | |
| MSI GE66 Raider 10SFS | |
| Schenker XMG Apex 15 NH57E PS | |
| MSI Delta 15 A5EFK | |
| MSI GE67 HX 12UGS | |
| Durchschnittliche Intel Core i7-12800HX (n=1) | |
| Schenker XMG Neo 15 (i7-12700H, RTX 3080 Ti) | |
| MSI Raider GE66 12UHS | |
| Asus ROG Strix Scar 15 G533zm | |
| MSI GE76 Raider | |
| Intel Core i9-12900K | |
| Eurocom Raptor X15 | |
Cinebench R23: Multi Core | Single Core
Cinebench R15: CPU Multi 64Bit | CPU Single 64Bit
Blender: v2.79 BMW27 CPU
7-Zip 18.03: 7z b 4 | 7z b 4 -mmt1
Geekbench 5.5: Multi-Core | Single-Core
HWBOT x265 Benchmark v2.2: 4k Preset
LibreOffice : 20 Documents To PDF
R Benchmark 2.5: Overall mean
* ... kleinere Werte sind besser
AIDA64: FP32 Ray-Trace | FPU Julia | CPU SHA3 | CPU Queen | FPU SinJulia | FPU Mandel | CPU AES | CPU ZLib | FP64 Ray-Trace | CPU PhotoWorxx
| Performance Rating | |
| Alienware m15 R6, i7-11800H RTX 3080 | |
| MSI GE67 HX 12UGS | |
| Durchschnittliche Intel Core i7-12800HX | |
| Asus ROG Strix Scar 15 G533ZW-LN106WS | |
| MSI Raider GE66 12UHS | |
| MSI Vector GP66 12UGS | |
| Razer Blade 15 2022 | |
| AIDA64 / FP32 Ray-Trace | |
| Alienware m15 R6, i7-11800H RTX 3080 | |
| MSI GE67 HX 12UGS | |
| Durchschnittliche Intel Core i7-12800HX (n=1) | |
| Asus ROG Strix Scar 15 G533ZW-LN106WS | |
| MSI Raider GE66 12UHS | |
| MSI Vector GP66 12UGS | |
| Razer Blade 15 2022 | |
| AIDA64 / FPU Julia | |
| Alienware m15 R6, i7-11800H RTX 3080 | |
| MSI GE67 HX 12UGS | |
| Durchschnittliche Intel Core i7-12800HX (n=1) | |
| Asus ROG Strix Scar 15 G533ZW-LN106WS | |
| MSI Raider GE66 12UHS | |
| MSI Vector GP66 12UGS | |
| Razer Blade 15 2022 | |
| AIDA64 / CPU SHA3 | |
| Alienware m15 R6, i7-11800H RTX 3080 | |
| MSI GE67 HX 12UGS | |
| Durchschnittliche Intel Core i7-12800HX (n=1) | |
| Asus ROG Strix Scar 15 G533ZW-LN106WS | |
| MSI Vector GP66 12UGS | |
| MSI Raider GE66 12UHS | |
| Razer Blade 15 2022 | |
| AIDA64 / CPU Queen | |
| MSI Vector GP66 12UGS | |
| MSI Raider GE66 12UHS | |
| Asus ROG Strix Scar 15 G533ZW-LN106WS | |
| Razer Blade 15 2022 | |
| Alienware m15 R6, i7-11800H RTX 3080 | |
| MSI GE67 HX 12UGS | |
| Durchschnittliche Intel Core i7-12800HX (n=1) | |
| AIDA64 / FPU SinJulia | |
| MSI GE67 HX 12UGS | |
| Durchschnittliche Intel Core i7-12800HX (n=1) | |
| Asus ROG Strix Scar 15 G533ZW-LN106WS | |
| Alienware m15 R6, i7-11800H RTX 3080 | |
| MSI Vector GP66 12UGS | |
| MSI Raider GE66 12UHS | |
| Razer Blade 15 2022 | |
| AIDA64 / FPU Mandel | |
| Alienware m15 R6, i7-11800H RTX 3080 | |
| MSI GE67 HX 12UGS | |
| Durchschnittliche Intel Core i7-12800HX (n=1) | |
| Asus ROG Strix Scar 15 G533ZW-LN106WS | |
| MSI Raider GE66 12UHS | |
| MSI Vector GP66 12UGS | |
| Razer Blade 15 2022 | |
| AIDA64 / CPU AES | |
| Alienware m15 R6, i7-11800H RTX 3080 | |
| MSI GE67 HX 12UGS | |
| Durchschnittliche Intel Core i7-12800HX (n=1) | |
| Asus ROG Strix Scar 15 G533ZW-LN106WS | |
| MSI Vector GP66 12UGS | |
| MSI Raider GE66 12UHS | |
| Razer Blade 15 2022 | |
| AIDA64 / CPU ZLib | |
| MSI GE67 HX 12UGS | |
| Durchschnittliche Intel Core i7-12800HX (n=1) | |
| Asus ROG Strix Scar 15 G533ZW-LN106WS | |
| MSI Vector GP66 12UGS | |
| MSI Raider GE66 12UHS | |
| Razer Blade 15 2022 | |
| Alienware m15 R6, i7-11800H RTX 3080 | |
| AIDA64 / FP64 Ray-Trace | |
| Alienware m15 R6, i7-11800H RTX 3080 | |
| MSI GE67 HX 12UGS | |
| Durchschnittliche Intel Core i7-12800HX (n=1) | |
| Asus ROG Strix Scar 15 G533ZW-LN106WS | |
| MSI Raider GE66 12UHS | |
| MSI Vector GP66 12UGS | |
| Razer Blade 15 2022 | |
| AIDA64 / CPU PhotoWorxx | |
| Razer Blade 15 2022 | |
| MSI Raider GE66 12UHS | |
| Asus ROG Strix Scar 15 G533ZW-LN106WS | |
| MSI GE67 HX 12UGS | |
| Durchschnittliche Intel Core i7-12800HX (n=1) | |
| MSI Vector GP66 12UGS | |
| Alienware m15 R6, i7-11800H RTX 3080 | |
Systemleistung
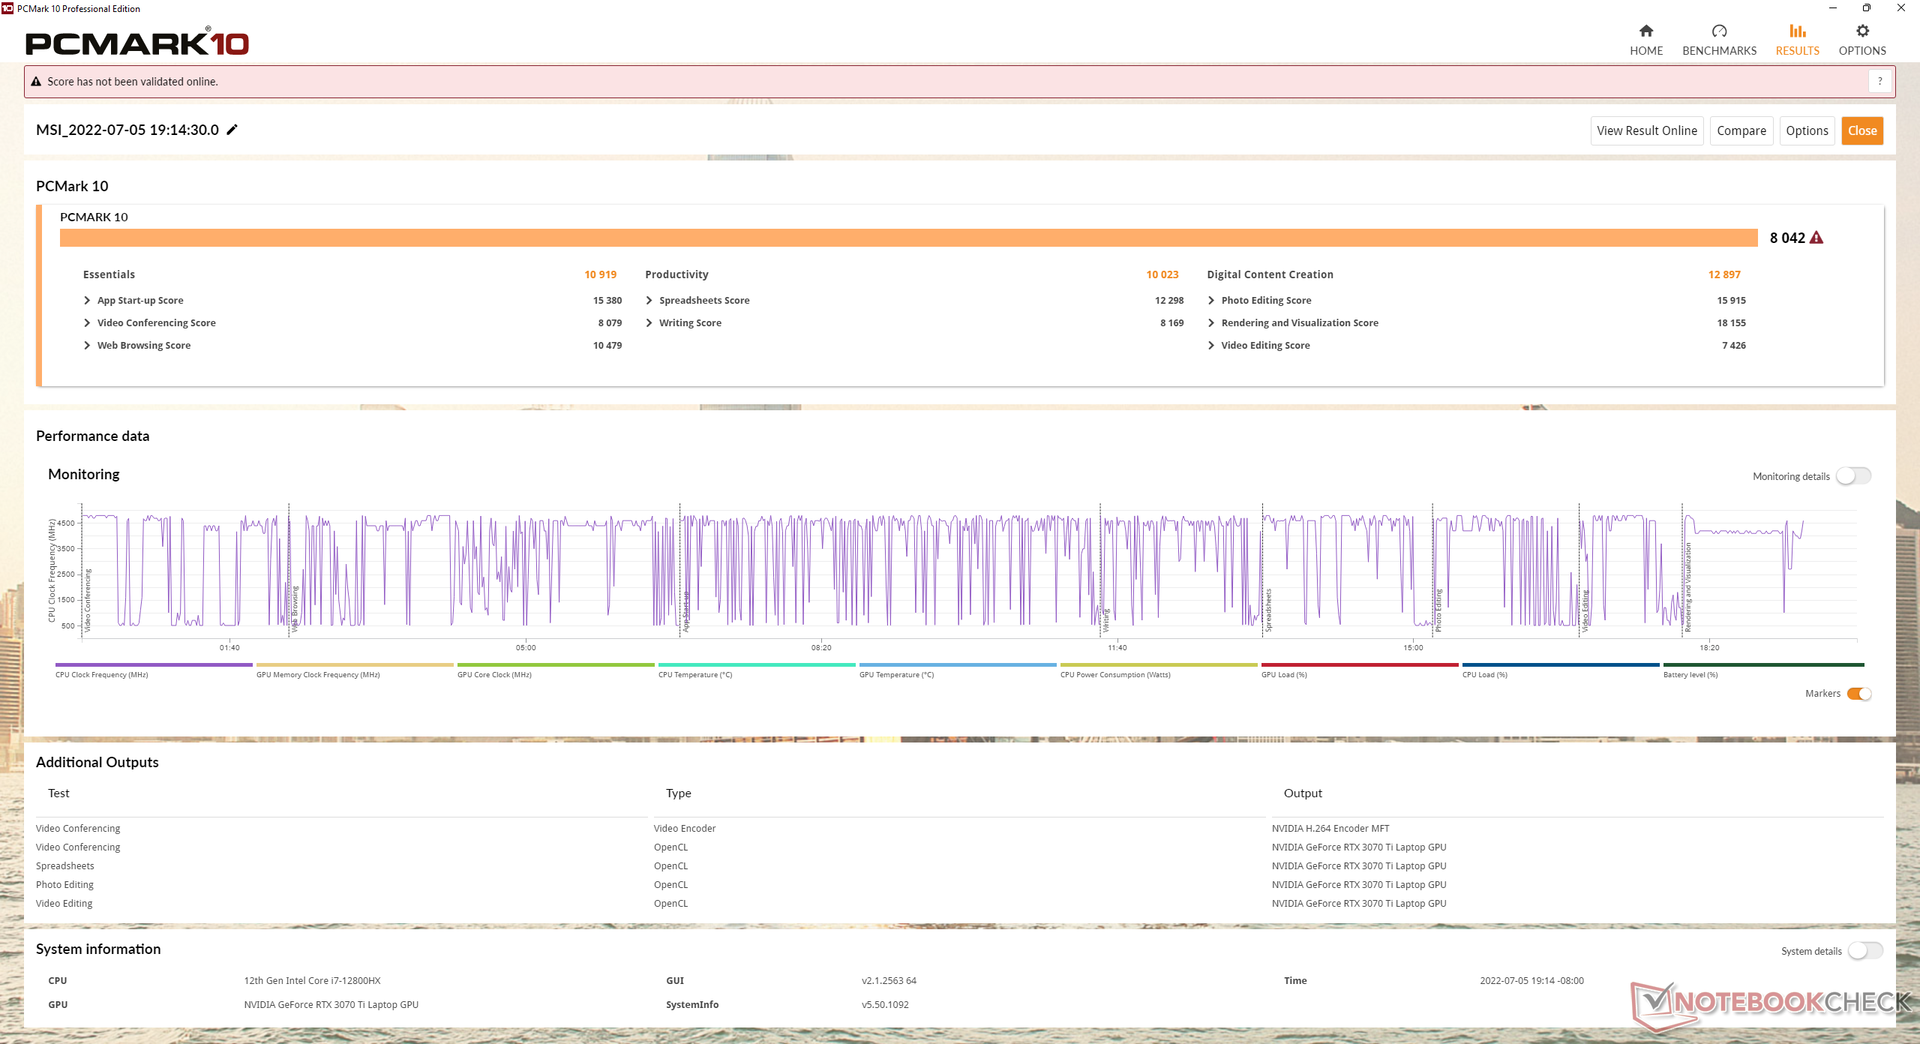
Die PCMark-10-Ergebnisse gehören mit zu den höchsten in unserer Datenbank und mit denen des älteren GE66, das mit dem langsameren Core i9-12900HK und der schnelleren GeForce RTX 3080 Ti ausgestattet ist, vergleichbar.
Interessant ist, dass die Digital-Content-Creation-Punktzahl im MSHybrid-Modus von 12.897 auf nur 9.568 Punkte fällt.
CrossMark: Overall | Productivity | Creativity | Responsiveness
| PCMark 10 / Score | |
| MSI Raider GE66 12UHS | |
| MSI GE67 HX 12UGS | |
| Durchschnittliche Intel Core i7-12800HX, NVIDIA GeForce RTX 3070 Ti Laptop GPU (n=1) | |
| MSI Vector GP66 12UGS | |
| Asus ROG Strix Scar 15 G533ZW-LN106WS | |
| Razer Blade 15 2022 | |
| Alienware m15 R6, i7-11800H RTX 3080 | |
| PCMark 10 / Essentials | |
| MSI Raider GE66 12UHS | |
| MSI Vector GP66 12UGS | |
| MSI GE67 HX 12UGS | |
| Durchschnittliche Intel Core i7-12800HX, NVIDIA GeForce RTX 3070 Ti Laptop GPU (n=1) | |
| Razer Blade 15 2022 | |
| Asus ROG Strix Scar 15 G533ZW-LN106WS | |
| Alienware m15 R6, i7-11800H RTX 3080 | |
| PCMark 10 / Productivity | |
| Asus ROG Strix Scar 15 G533ZW-LN106WS | |
| MSI Raider GE66 12UHS | |
| MSI Vector GP66 12UGS | |
| MSI GE67 HX 12UGS | |
| Durchschnittliche Intel Core i7-12800HX, NVIDIA GeForce RTX 3070 Ti Laptop GPU (n=1) | |
| Razer Blade 15 2022 | |
| Alienware m15 R6, i7-11800H RTX 3080 | |
| PCMark 10 / Digital Content Creation | |
| MSI GE67 HX 12UGS | |
| Durchschnittliche Intel Core i7-12800HX, NVIDIA GeForce RTX 3070 Ti Laptop GPU (n=1) | |
| MSI Raider GE66 12UHS | |
| MSI Vector GP66 12UGS | |
| Razer Blade 15 2022 | |
| Asus ROG Strix Scar 15 G533ZW-LN106WS | |
| Alienware m15 R6, i7-11800H RTX 3080 | |
| CrossMark / Overall | |
| Asus ROG Strix Scar 15 G533ZW-LN106WS | |
| MSI GE67 HX 12UGS | |
| Durchschnittliche Intel Core i7-12800HX, NVIDIA GeForce RTX 3070 Ti Laptop GPU (n=1) | |
| CrossMark / Productivity | |
| Asus ROG Strix Scar 15 G533ZW-LN106WS | |
| MSI GE67 HX 12UGS | |
| Durchschnittliche Intel Core i7-12800HX, NVIDIA GeForce RTX 3070 Ti Laptop GPU (n=1) | |
| CrossMark / Creativity | |
| Asus ROG Strix Scar 15 G533ZW-LN106WS | |
| MSI GE67 HX 12UGS | |
| Durchschnittliche Intel Core i7-12800HX, NVIDIA GeForce RTX 3070 Ti Laptop GPU (n=1) | |
| CrossMark / Responsiveness | |
| Asus ROG Strix Scar 15 G533ZW-LN106WS | |
| MSI GE67 HX 12UGS | |
| Durchschnittliche Intel Core i7-12800HX, NVIDIA GeForce RTX 3070 Ti Laptop GPU (n=1) | |
| PCMark 10 Score | 8042 Punkte | |
Hilfe | ||
| AIDA64 / Memory Copy | |
| MSI Raider GE66 12UHS | |
| Razer Blade 15 2022 | |
| Asus ROG Strix Scar 15 G533ZW-LN106WS | |
| MSI GE67 HX 12UGS | |
| Durchschnittliche Intel Core i7-12800HX (n=1) | |
| MSI Vector GP66 12UGS | |
| Alienware m15 R6, i7-11800H RTX 3080 | |
| AIDA64 / Memory Read | |
| MSI Raider GE66 12UHS | |
| Razer Blade 15 2022 | |
| Asus ROG Strix Scar 15 G533ZW-LN106WS | |
| MSI GE67 HX 12UGS | |
| Durchschnittliche Intel Core i7-12800HX (n=1) | |
| Alienware m15 R6, i7-11800H RTX 3080 | |
| MSI Vector GP66 12UGS | |
| AIDA64 / Memory Write | |
| Razer Blade 15 2022 | |
| MSI Raider GE66 12UHS | |
| Asus ROG Strix Scar 15 G533ZW-LN106WS | |
| MSI GE67 HX 12UGS | |
| Durchschnittliche Intel Core i7-12800HX (n=1) | |
| MSI Vector GP66 12UGS | |
| Alienware m15 R6, i7-11800H RTX 3080 | |
| AIDA64 / Memory Latency | |
| Asus ROG Strix Scar 15 G533ZW-LN106WS | |
| Alienware m15 R6, i7-11800H RTX 3080 | |
| MSI GE67 HX 12UGS | |
| Durchschnittliche Intel Core i7-12800HX (n=1) | |
| MSI Raider GE66 12UHS | |
| MSI Vector GP66 12UGS | |
| Razer Blade 15 2022 | |
* ... kleinere Werte sind besser
DPC-Latenzen
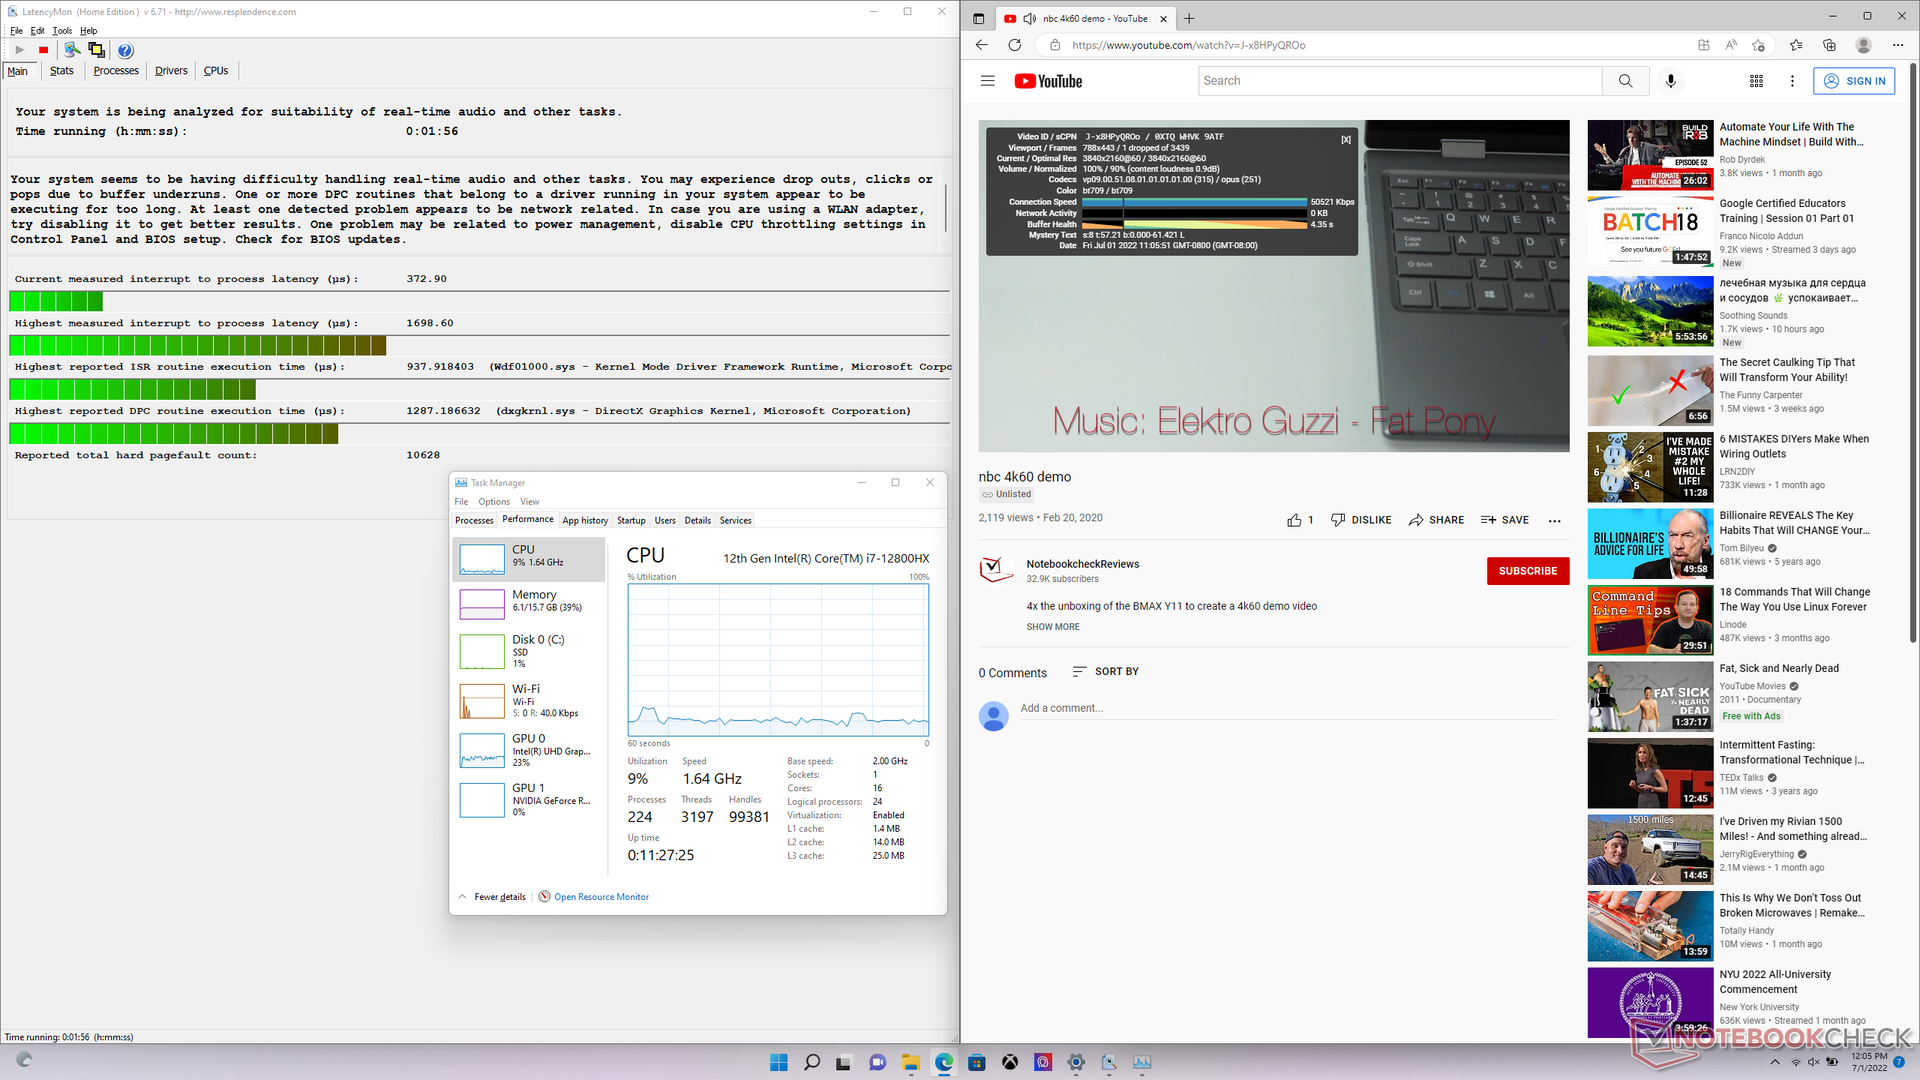
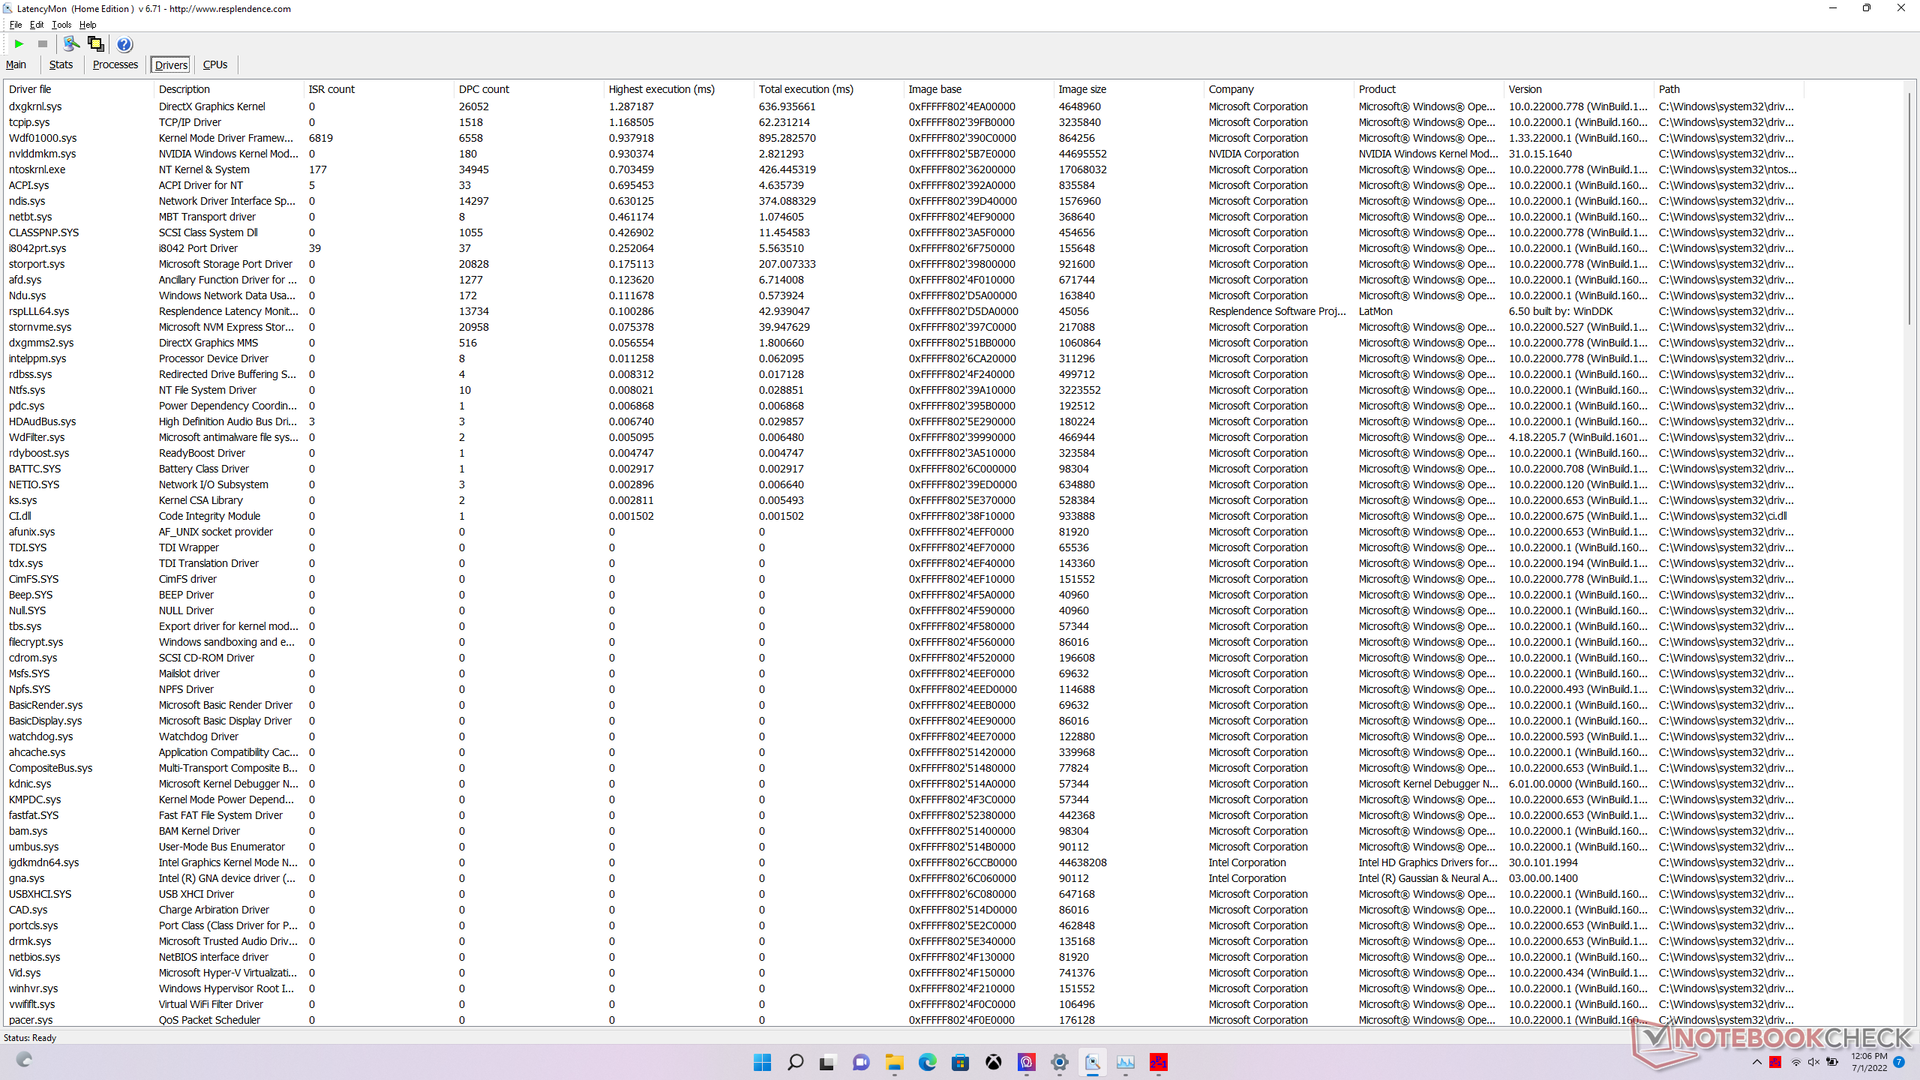
LatencyMon meldet geringfügig problematische DPC-Latenzen beim Öffnen unserer Homepage in mehreren Browser-Tabs. Die Wiedergabe von 4K-Videos mit 60 Fps gelingt flüssig und während des einminütigen Testvideos geht nur 1 Frame verloren.
| DPC Latencies / LatencyMon - interrupt to process latency (max), Web, Youtube, Prime95 | |
| MSI Raider GE66 12UHS | |
| MSI Vector GP66 12UGS | |
| MSI GE67 HX 12UGS | |
| Razer Blade 15 2022 | |
| Alienware m15 R6, i7-11800H RTX 3080 | |
| Asus ROG Strix Scar 15 G533ZW-LN106WS | |
* ... kleinere Werte sind besser
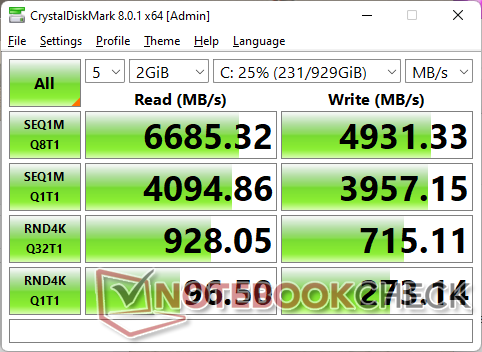
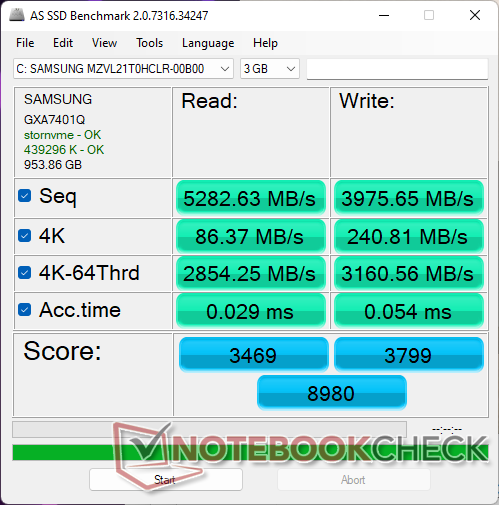
Massenspeicher — Standardmäßig mit PCIe4 x4
Unser Testgerät ist mit der 1 TB großen PCIe4-x4-NVMe-SSD Samsung PM9A1 ausgestattet und erreicht sequenzielle Lese- und Schreibraten von 7.000 MB/s bzw. 5.100 MB/s. Leider hatte unser Laufwerk Schwierigkeiten dabei, die maximale Leserate langfristig aufrechtzuerhalten, wie unser DiskSpd-Schleifentest unten zeigt. Die Leserate fällt im Laufe der Zeit auf bis zu 1.500 MB/s, was vermutlich auf das Erreichen von Temperaturgrenzwerten und den fehlenden SSD-Kühler zurückzuführen ist.

* ... kleinere Werte sind besser
Laufwerksdrosseln: DiskSpd-Leseschleife, Warteschlangentiefe 8
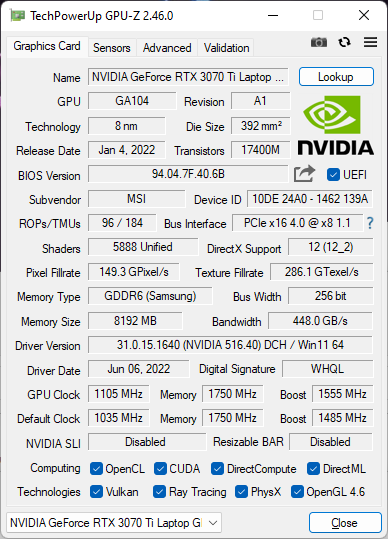
Grafikkarte — 150 W und 25 W Dynamic Boost
Die 3DMark-Ergebnisse sind um ca. 12 % höher als bei einem durchschnittlichen Laptop mit der mobilen GeForce RTX 3070 Ti aus unserer Datenbank. Die überdurchschnittlichen Werte stammen vermutlich von der hohen 150-W-Ziel-TGP und dem schnellen DDR5-RAM, da die meisten Gaming-Laptops stattdessen noch GPUs mit maximal 130 W und/oder langsameren DDR4-RAM nutzen. Die Unterschiede sind jedenfalls groß genug, um die Leistung unserer mobilen RTX 3070 Ti auf ein ähnliches Niveau anzuheben wie die mobile RTX 3080 Ti im GE66 aus dem Q1 2022.
In Spielen ist die Leistung der Nvidia-GPU im MSHybrid und im dedizierten Modus nahezu identisch.
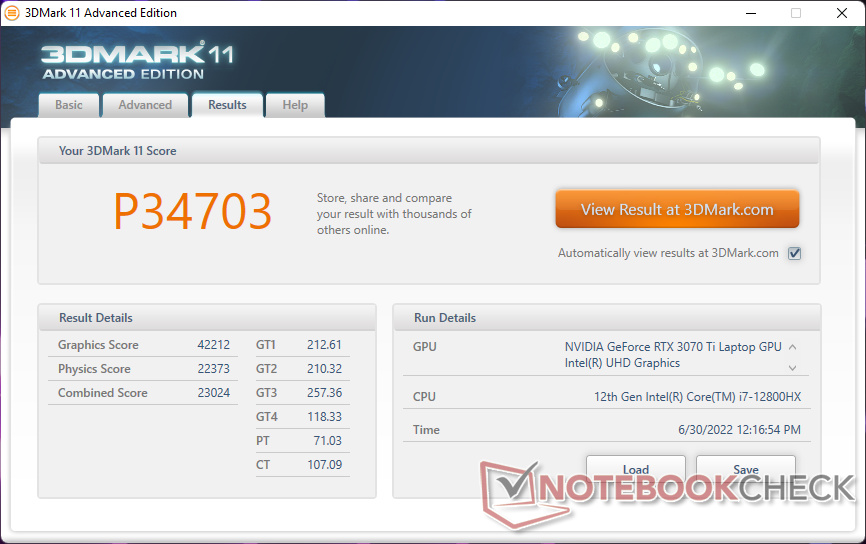
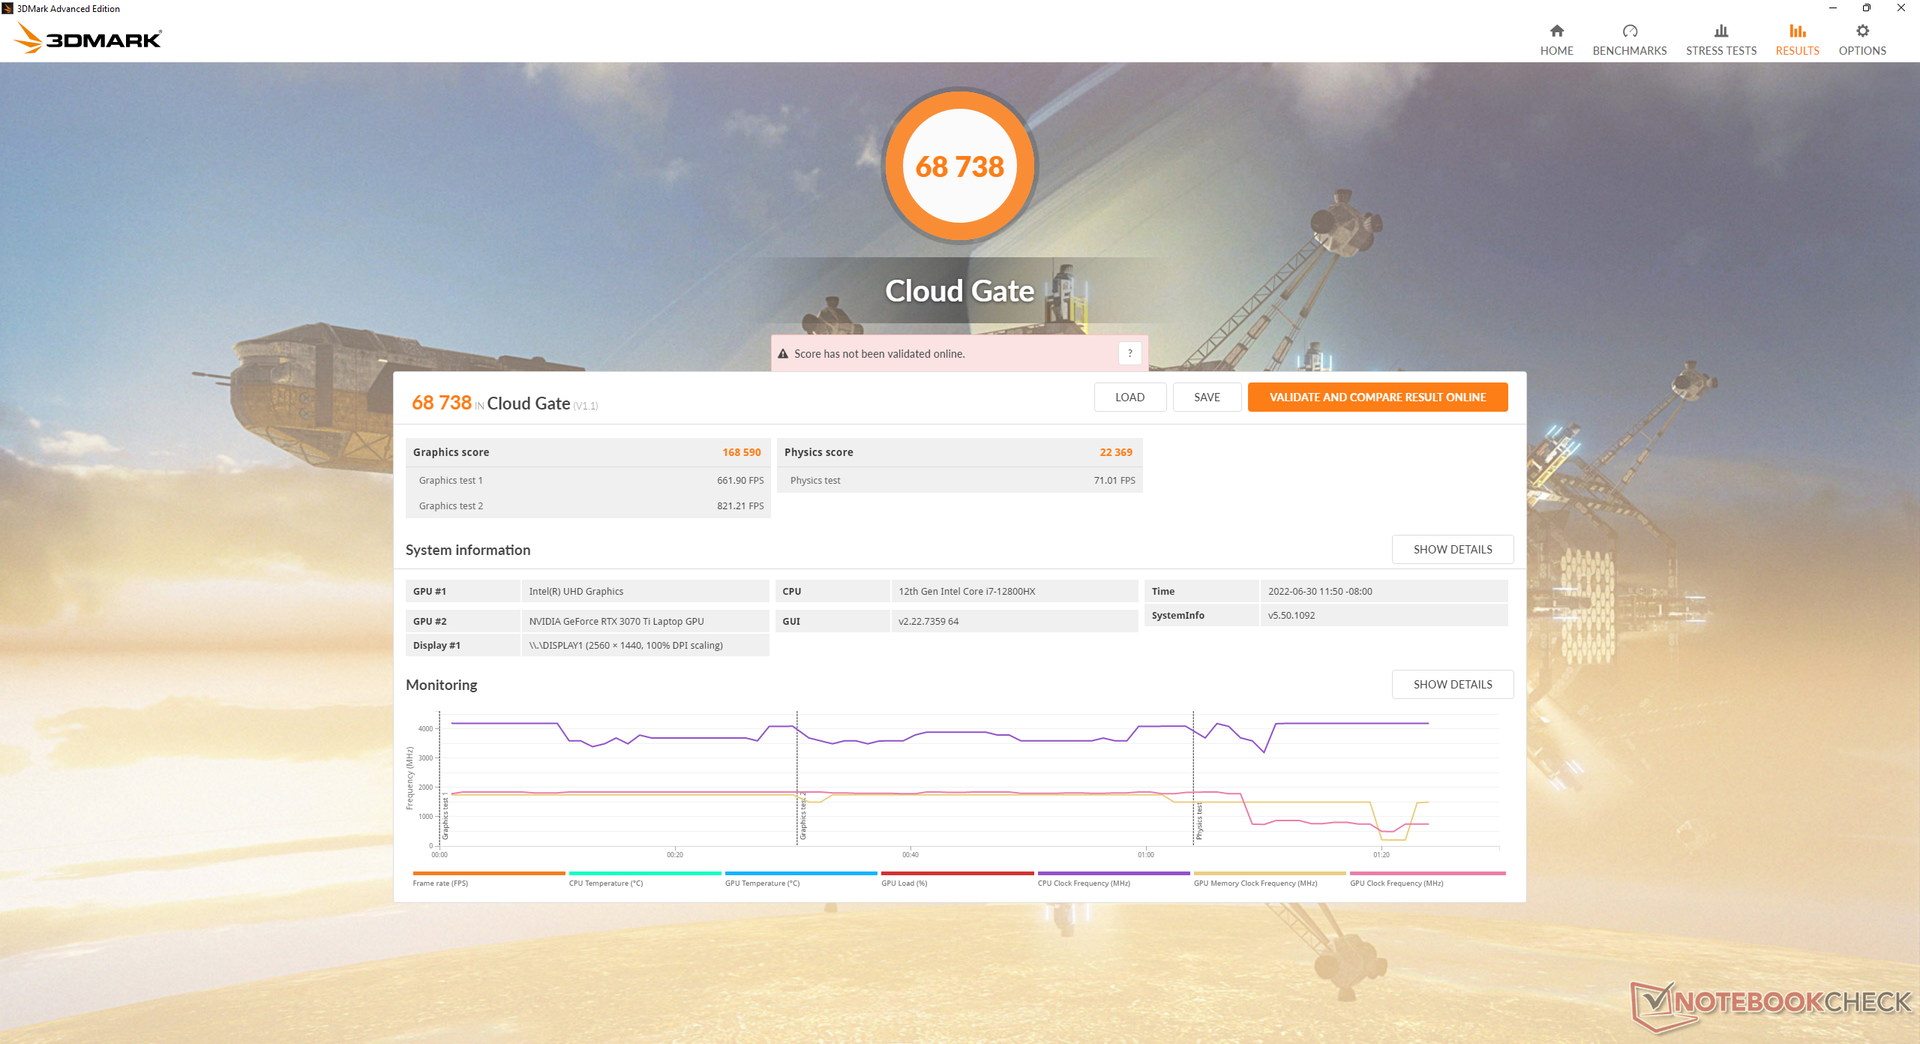
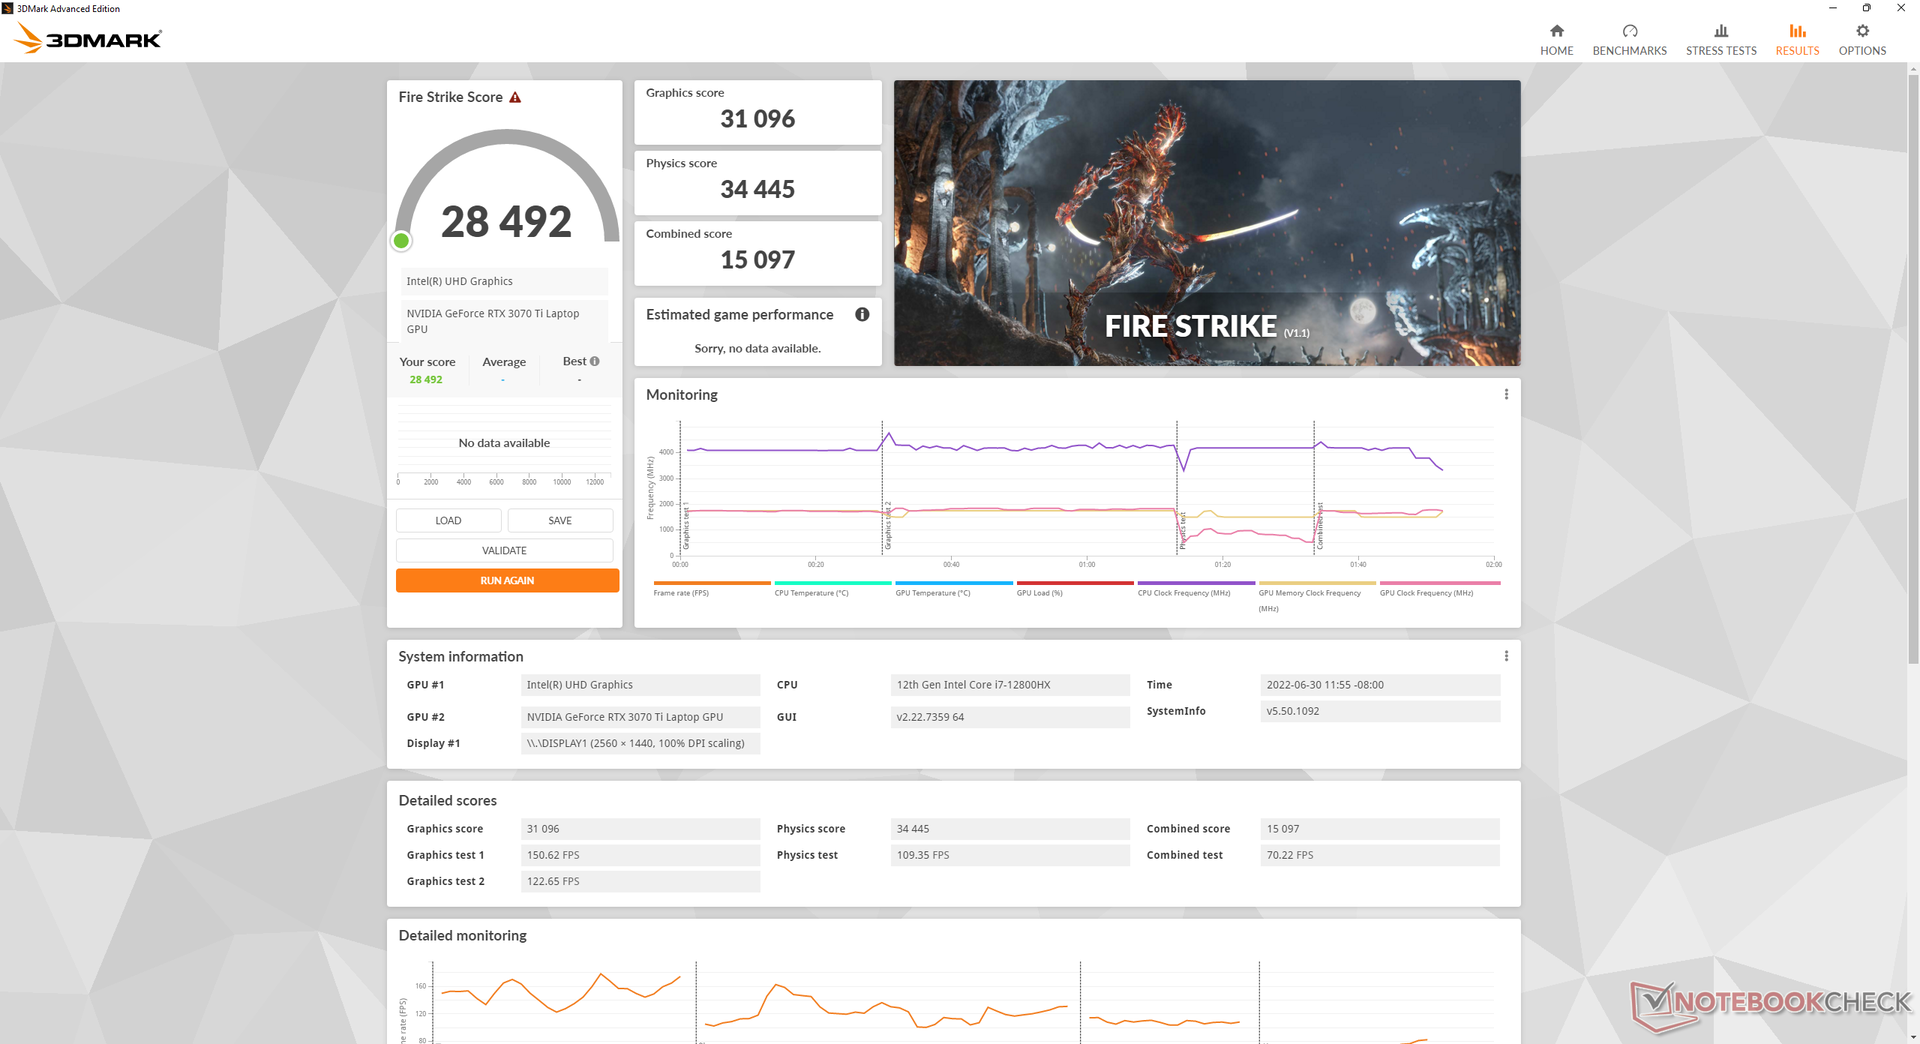
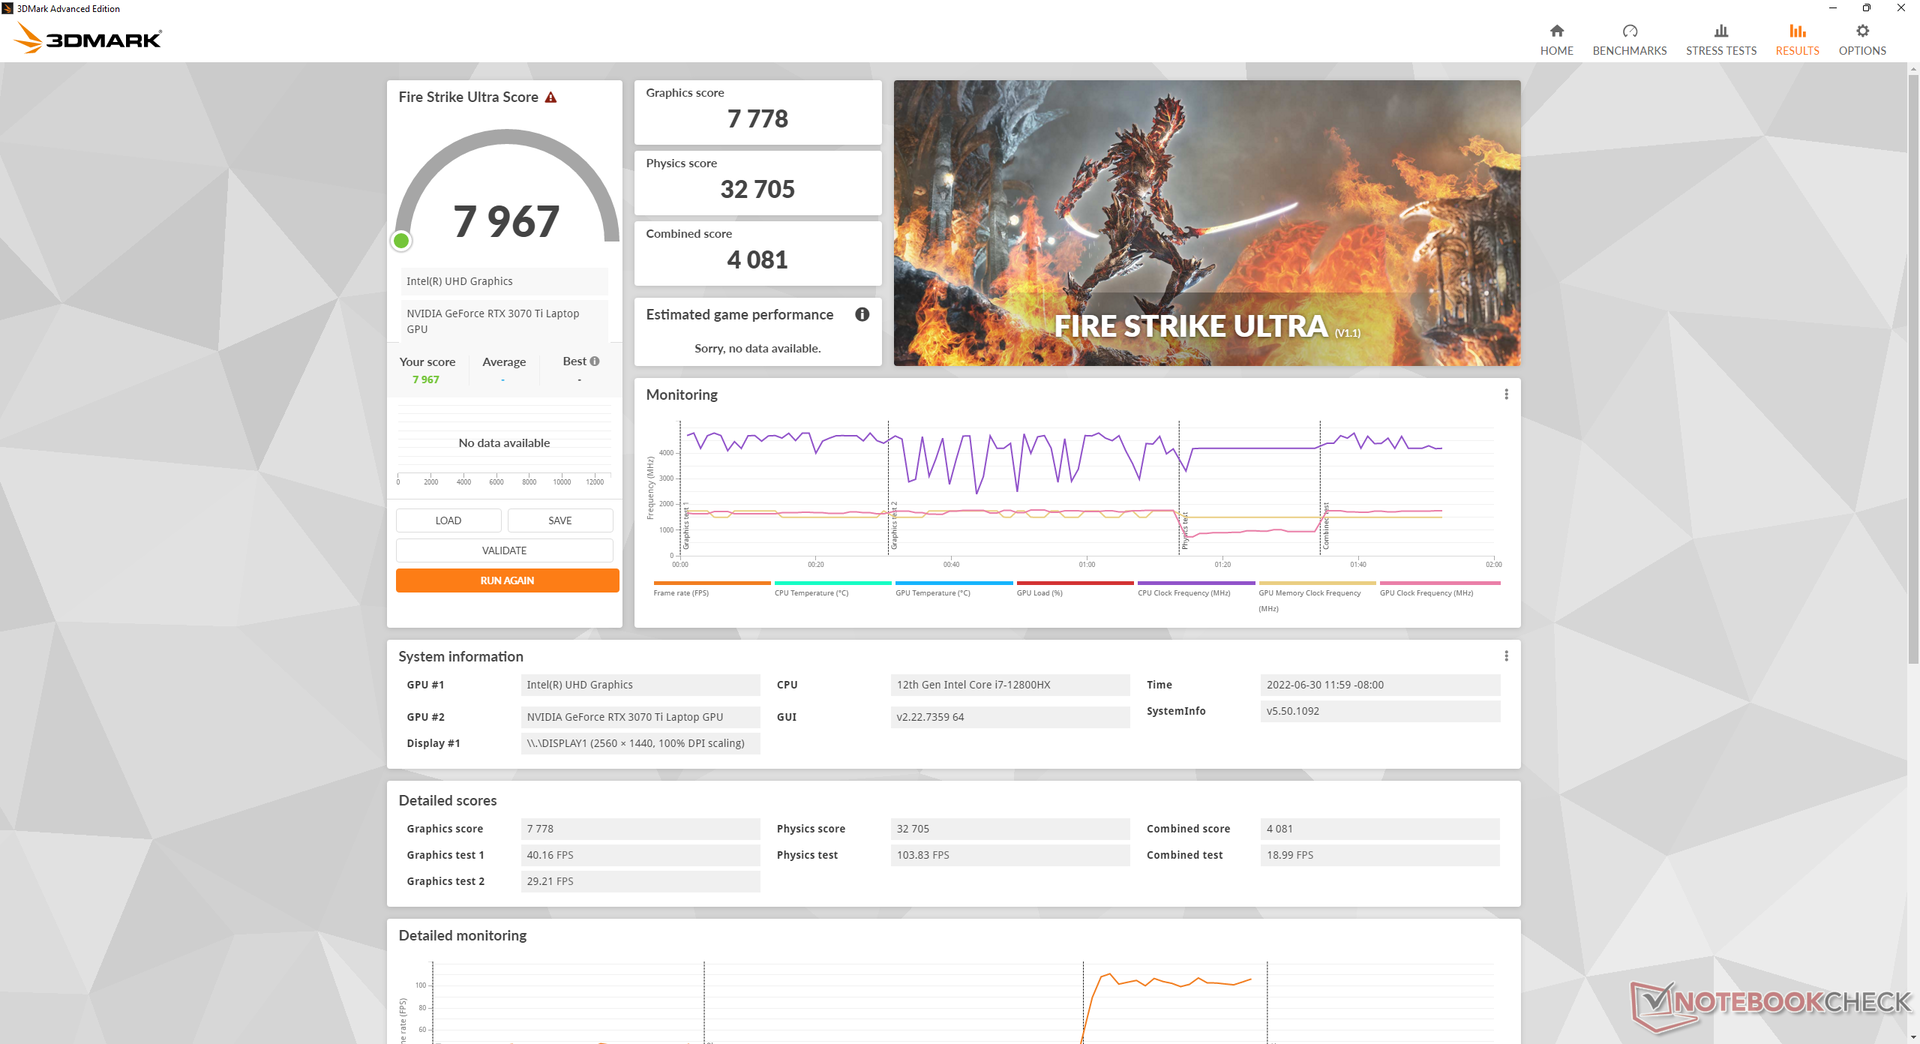
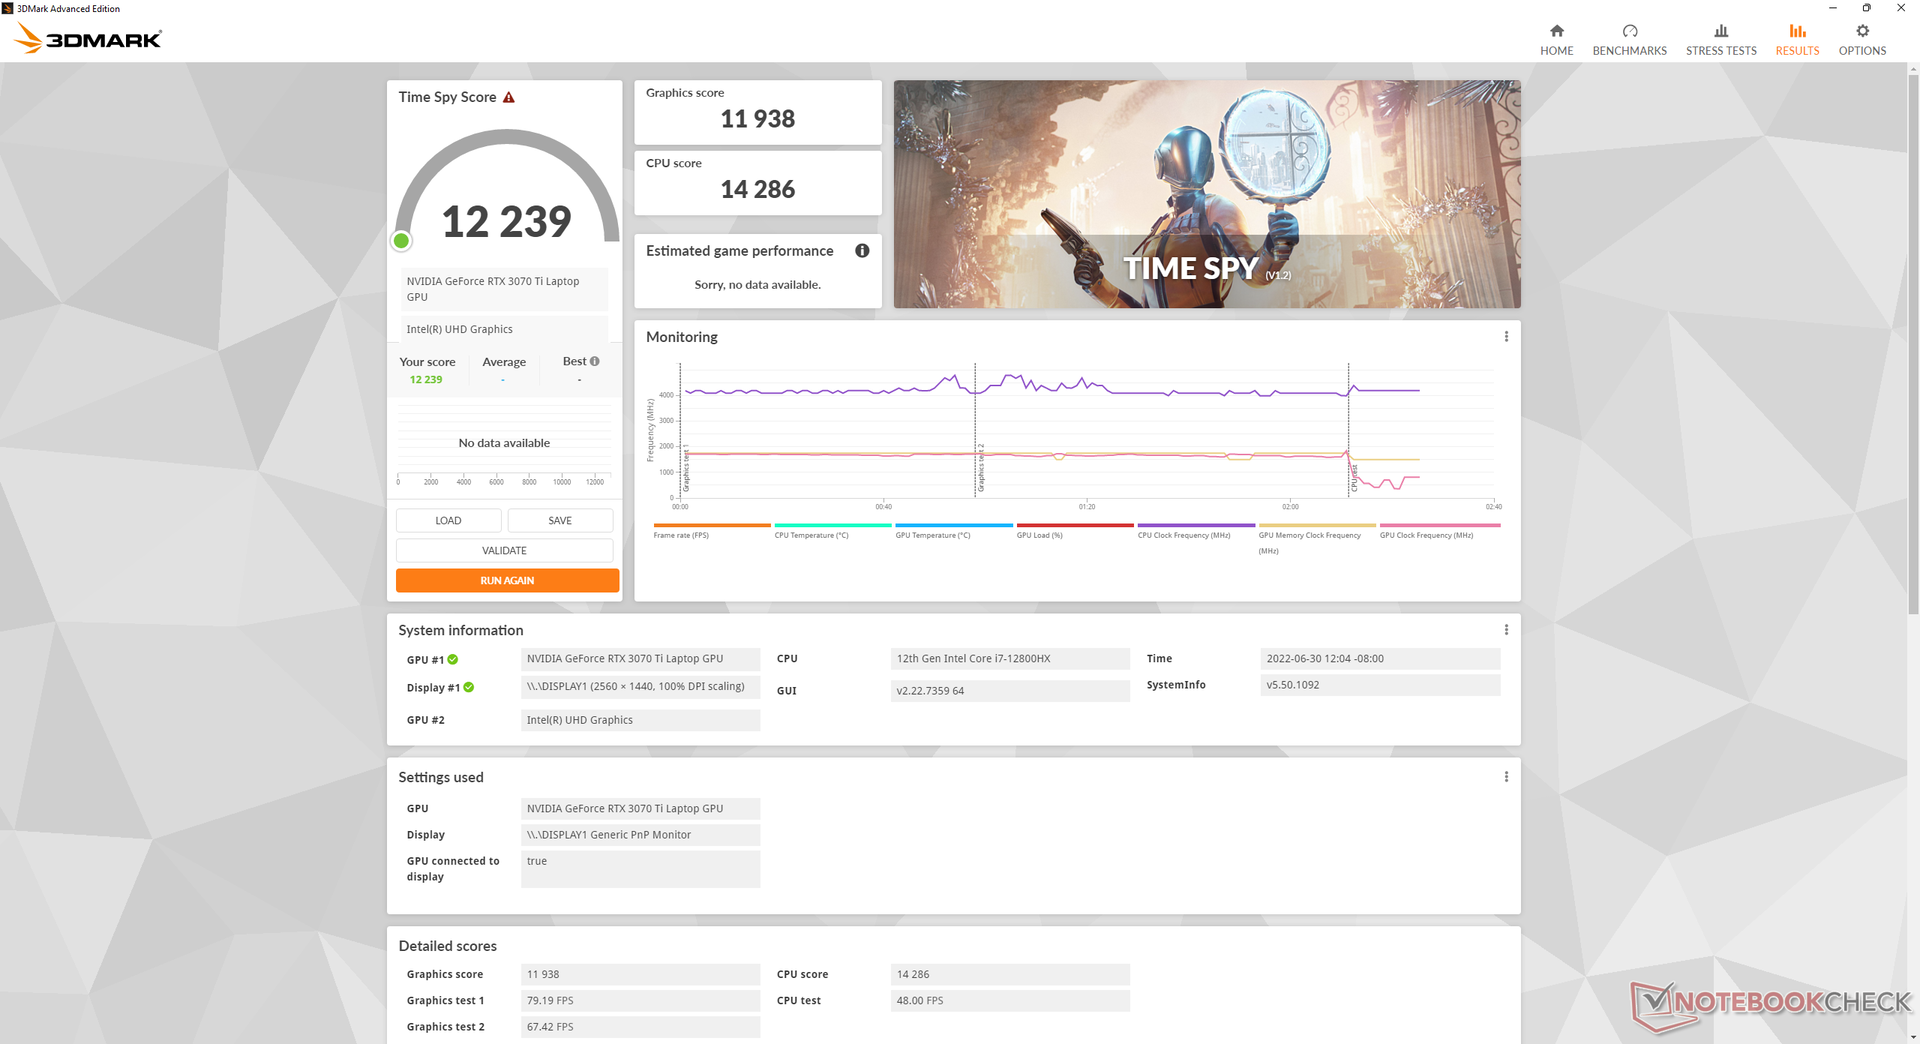
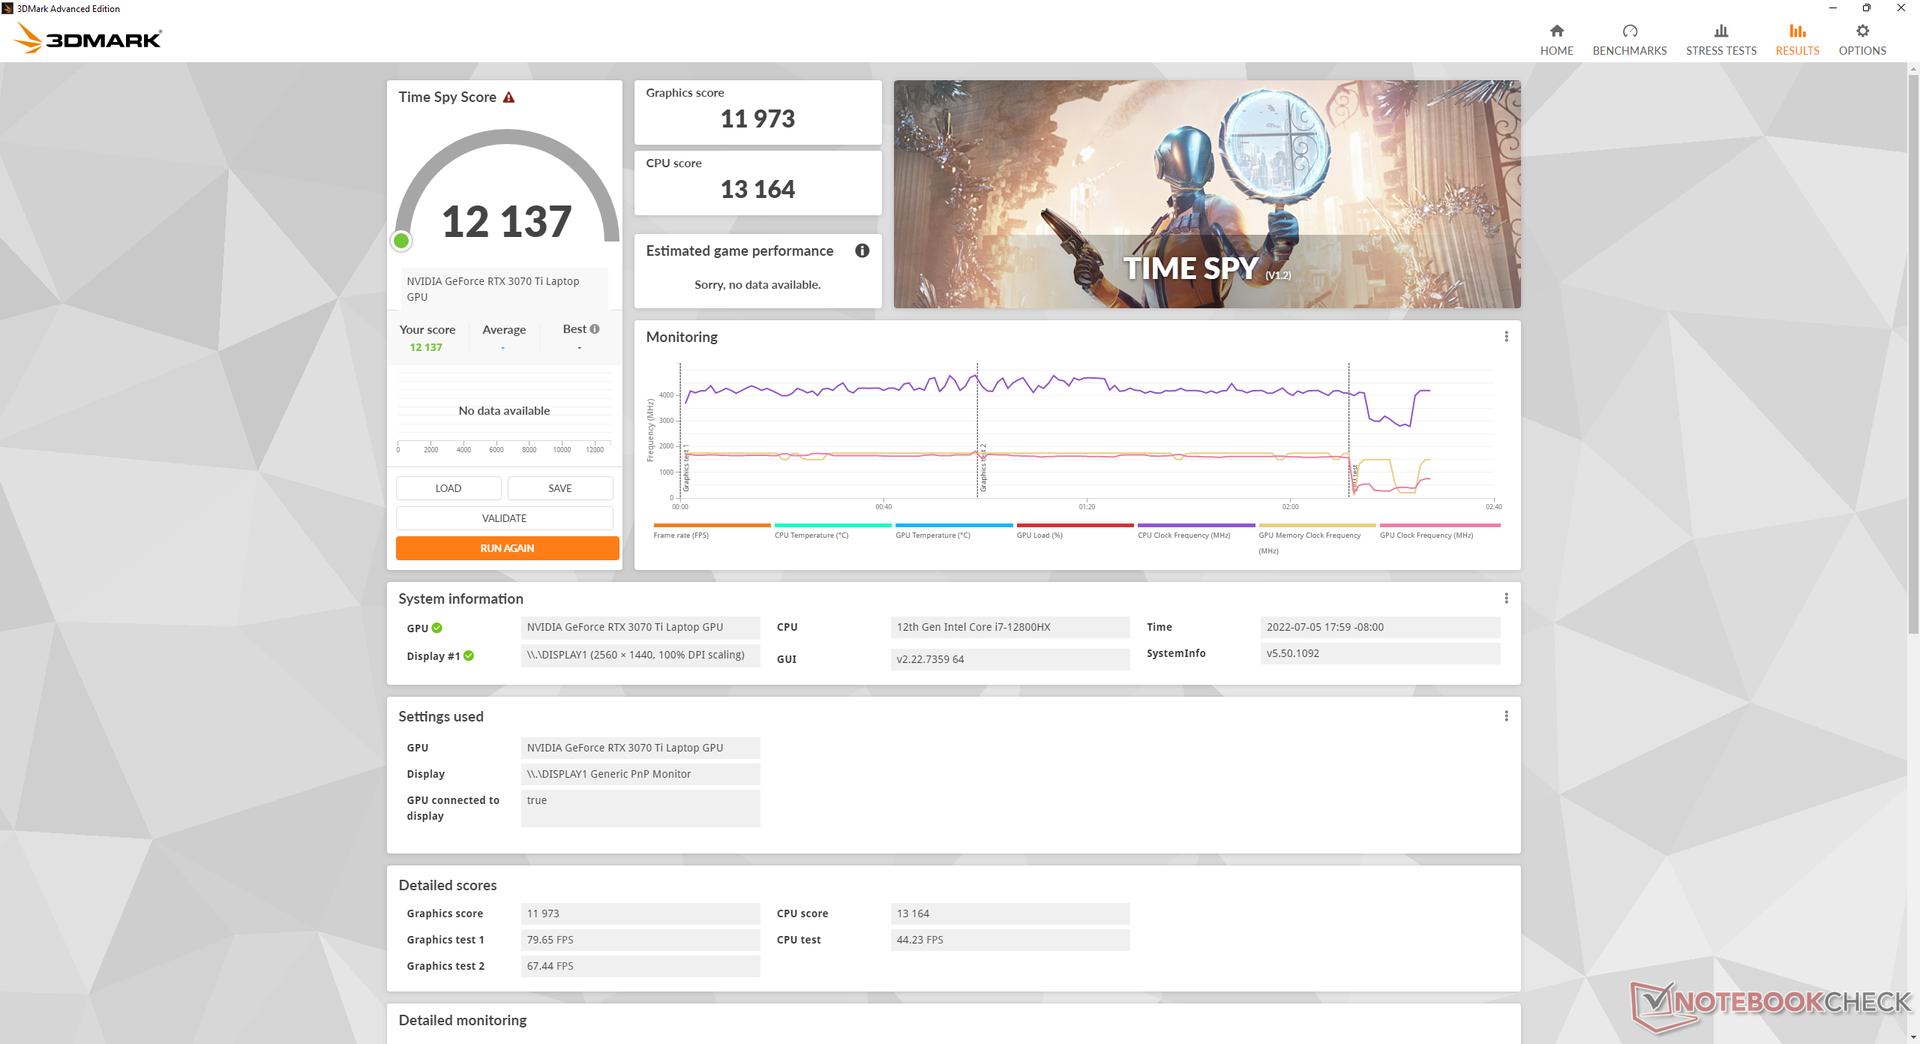
| 3DMark 11 Performance | 34703 Punkte | |
| 3DMark Cloud Gate Standard Score | 68738 Punkte | |
| 3DMark Fire Strike Score | 28492 Punkte | |
| 3DMark Time Spy Score | 12239 Punkte | |
Hilfe | ||
Witcher 3 FPS-Verlauf
| min. | mittel | hoch | max. | QHD | 4K | |
|---|---|---|---|---|---|---|
| GTA V (2015) | 186.8 | 184.7 | 178.1 | 122 | 108.7 | |
| The Witcher 3 (2015) | 426.4 | 329 | 223.3 | 112.7 | ||
| Dota 2 Reborn (2015) | 181.2 | 165.6 | 155.3 | 147.7 | 148.9 | |
| Final Fantasy XV Benchmark (2018) | 201 | 162.6 | 122.4 | 93 | ||
| X-Plane 11.11 (2018) | 145.5 | 133.4 | 105.9 | |||
| Strange Brigade (2018) | 453 | 288 | 235 | 207 | 154.1 | |
| Cyberpunk 2077 1.6 (2022) | 141.2 | 133.2 | 106 | 88.1 | 56.4 |
Emissionen
Geräuschemissionen
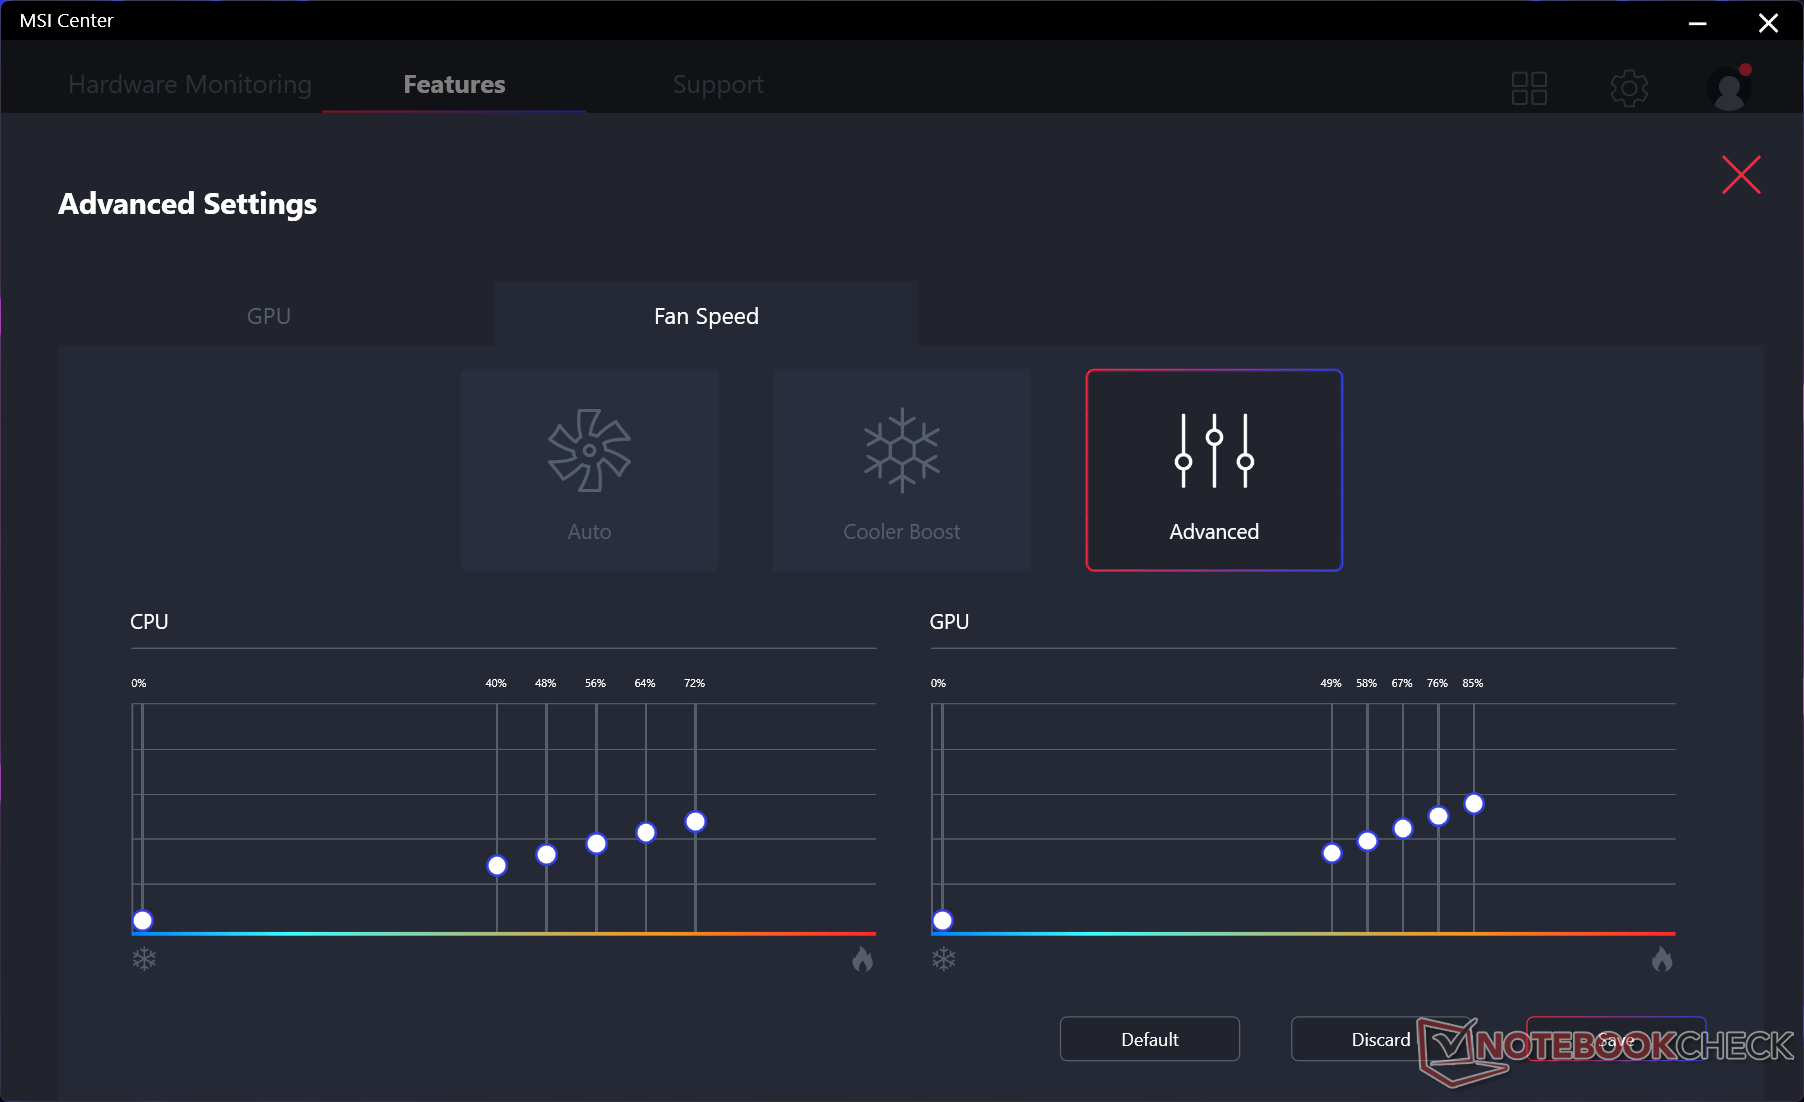
Die Lüftergeräusche hängen von den fünf voreingestellten Leistungsprofilen ab, die wir im Abschnitt zu den Testbedingungen oben erwähnt haben. Im Leerlauf auf dem Desktop, bleibt der Laptop, solange keine Anwendungen ausgeführt werden, mit 22,9 dB(A) lautlos und zwar auch dann, wenn man das Extremleistungsprofil auswählt. Schon unter niedriger Last wie zum Beispiel beim Surfen oder Videostreaming gesellen sich jedoch unabhängig vom Profil hörbare Lüftergeräusche im 30-bis-34-dB(A)-Bereich hinzu. Während der ersten Benchmarkszene von 3DMark 06 werden im ausbalancierten Modus ca. 44 dB(A) und damit eine ähnliche Geräuschkulisse wie beim GE66 und dem Razer Blade 15 erzeugt.
Beim Ausführen von The Witcher 3 im ausbalancierten bzw. Extremleistungsmodus produzieren die Lüfter jeweils 49,8 dB(A) und 55,7 dB(A). Wir erachten werte im 50-dB(A)-Bereich als so laut, dass man beim Spielen lieber Kopfhörer verwenden sollte. Trotzdem ist dieser Bereich unter Hochleistungs-Gaming-Laptops wie dem Vector GP66, Asus ROG Strix Scar 15 und dem Alienware m15 R6 leider keine Seltenheit. Beim Aktivieren des "Cooler Boost" (maximale Lüftergeschwindigkeit) werden die Lüfter mit 57,4 dB(A) sogar noch lauter. Wie unser Stresstestparagraph unten zeigt, muss man den Extremleistungsmodus des GE67 aktivieren, um die maximale TGP freizuschalten. Das GE66 war unter ähnlichen Bedingung weniger laut.
Lautstärkediagramm
| Idle |
| 22.9 / 22.9 / 22.9 dB(A) |
| Last |
| 44.4 / 57.4 dB(A) |
 | ||
30 dB leise 40 dB(A) deutlich hörbar 50 dB(A) störend |
||
min: | ||
| MSI GE67 HX 12UGS GeForce RTX 3070 Ti Laptop GPU, i7-12800HX, Samsung PM9A1 MZVL21T0HCLR | MSI Raider GE66 12UHS GeForce RTX 3080 Ti Laptop GPU, i9-12900HK, Samsung PM9A1 MZVL22T0HBLB | MSI Vector GP66 12UGS GeForce RTX 3070 Ti Laptop GPU, i9-12900H | Asus ROG Strix Scar 15 G533ZW-LN106WS GeForce RTX 3070 Ti Laptop GPU, i9-12900H, Samsung PM9A1 MZVL22T0HBLB | Alienware m15 R6, i7-11800H RTX 3080 GeForce RTX 3080 Laptop GPU, i7-11800H, Samsung PM9A1 MZVL21T0HCLR | Razer Blade 15 2022 GeForce RTX 3080 Ti Laptop GPU, i7-12800H, SSSTC CA6-8D1024 | |
|---|---|---|---|---|---|---|
| Geräuschentwicklung | -14% | -2% | -36% | -2% | -5% | |
| aus / Umgebung * (dB) | 22.7 | 26 -15% | 22.9 -1% | 26.86 -18% | 23 -1% | 25.4 -12% |
| Idle min * (dB) | 22.9 | 27 -18% | 23.4 -2% | 39.07 -71% | 23 -0% | 26.2 -14% |
| Idle avg * (dB) | 22.9 | 30 -31% | 23.4 -2% | 39.07 -71% | 23 -0% | 26.2 -14% |
| Idle max * (dB) | 22.9 | 39 -70% | 27.4 -20% | 39.07 -71% | 30 -31% | 28.4 -24% |
| Last avg * (dB) | 44.4 | 45 -1% | 36 19% | 53.34 -20% | 41.26 7% | 44.7 -1% |
| Witcher 3 ultra * (dB) | 55.7 | 45 19% | 58.2 -4% | 56.6 -2% | 53.4 4% | 44.7 20% |
| Last max * (dB) | 57.4 | 47 18% | 58 -1% | 56.6 1% | 53.37 7% | 51.9 10% |
* ... kleinere Werte sind besser
Temperatur
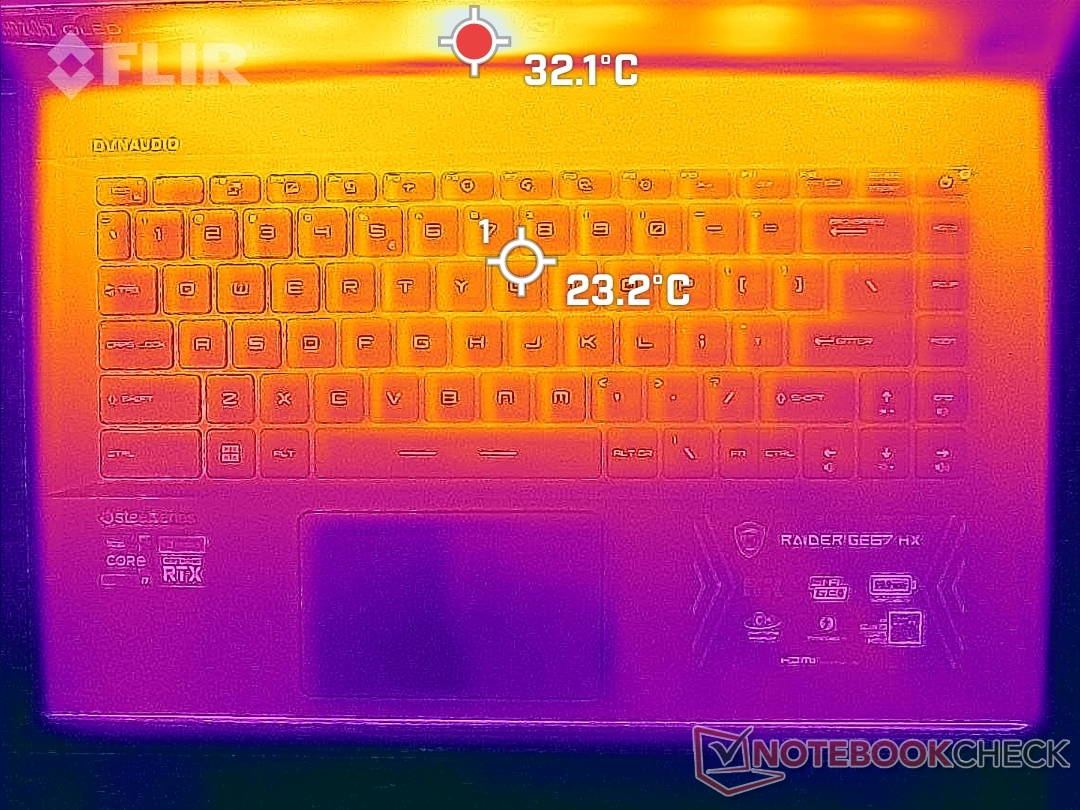
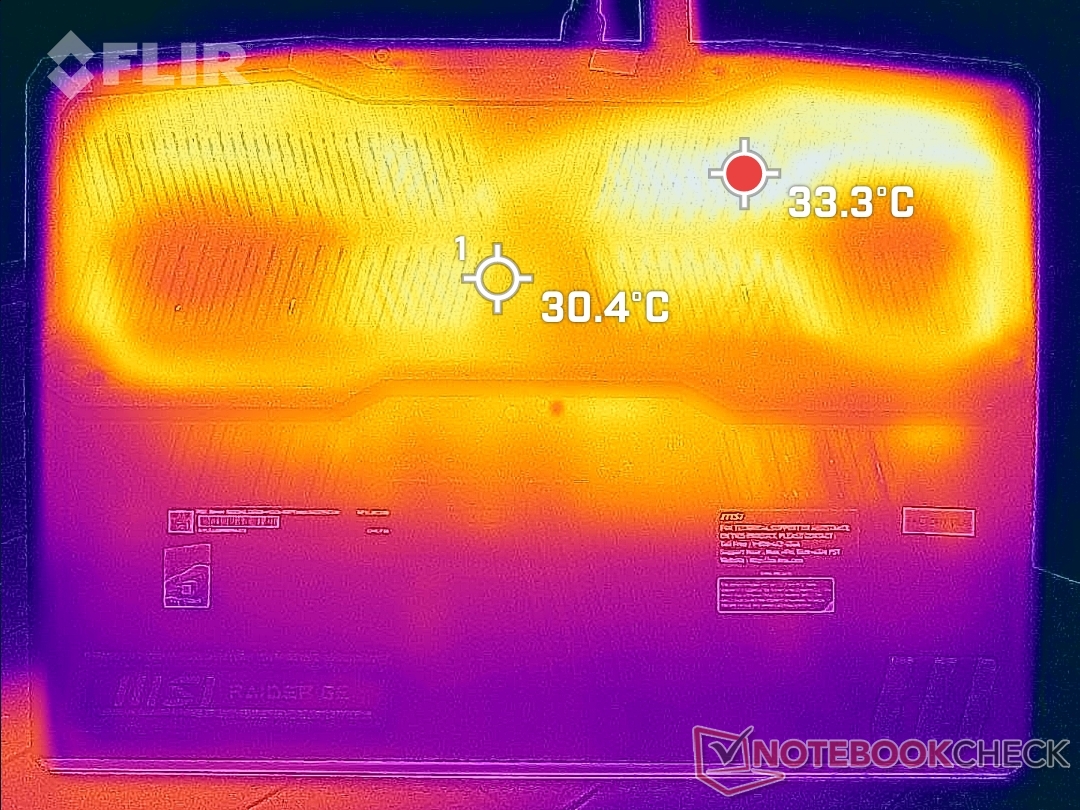
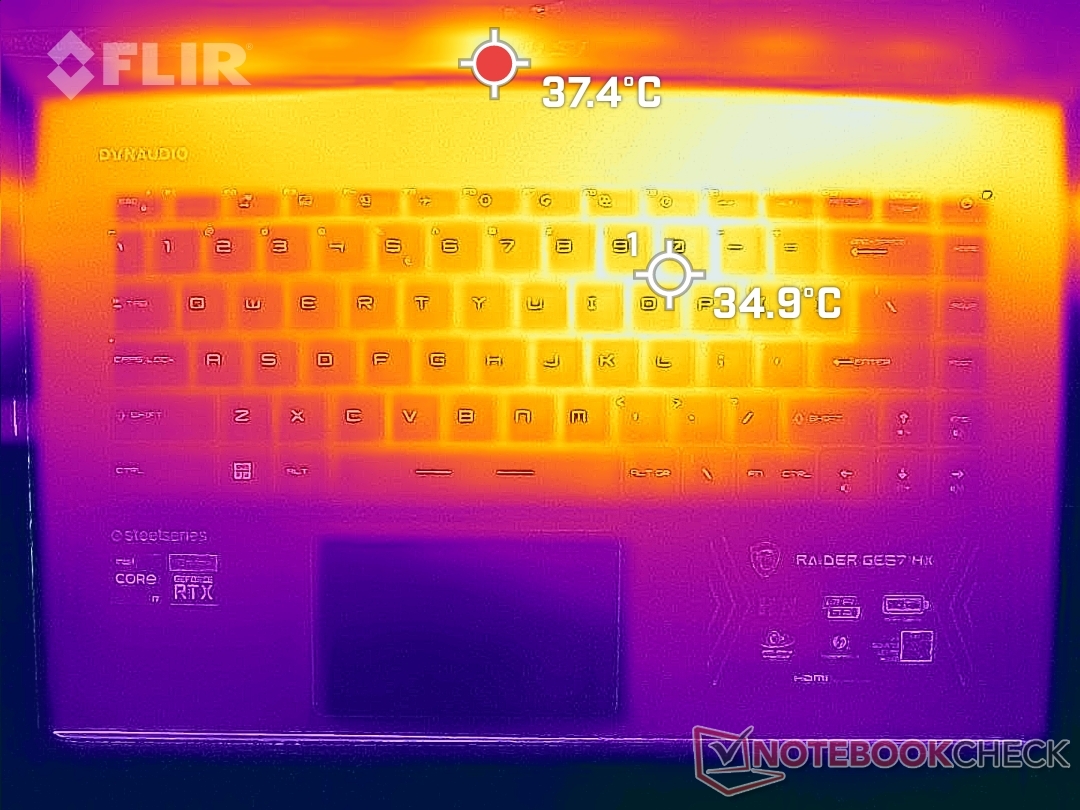
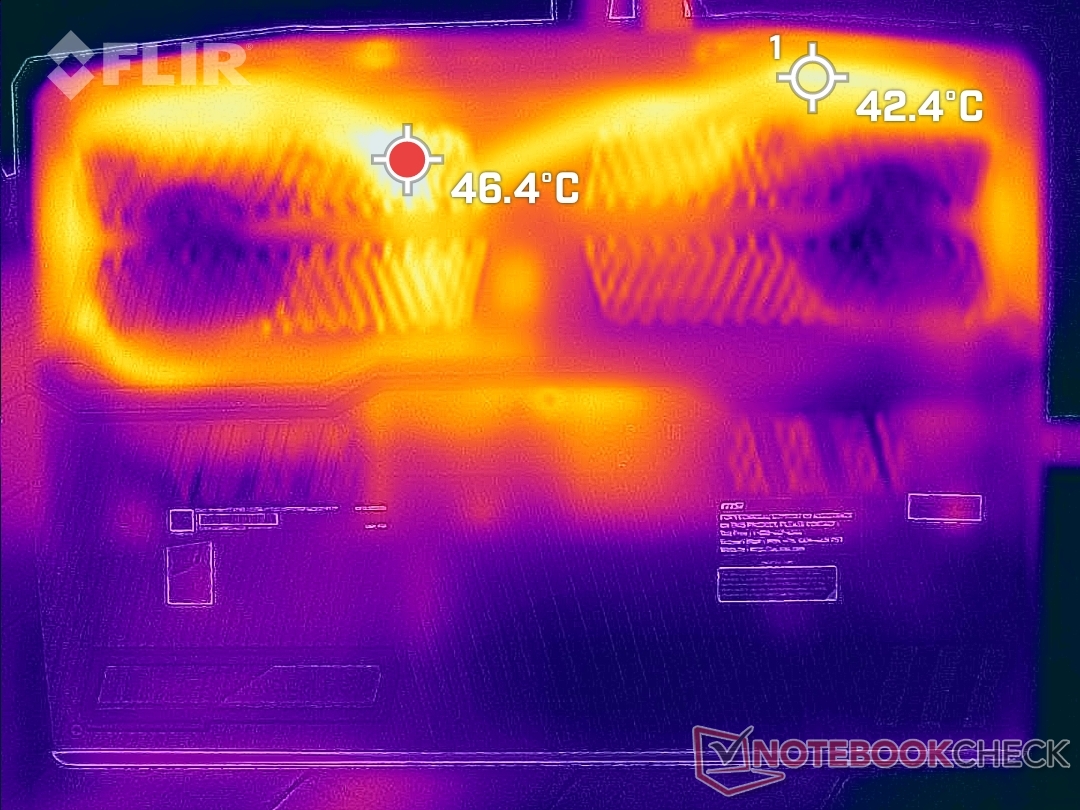
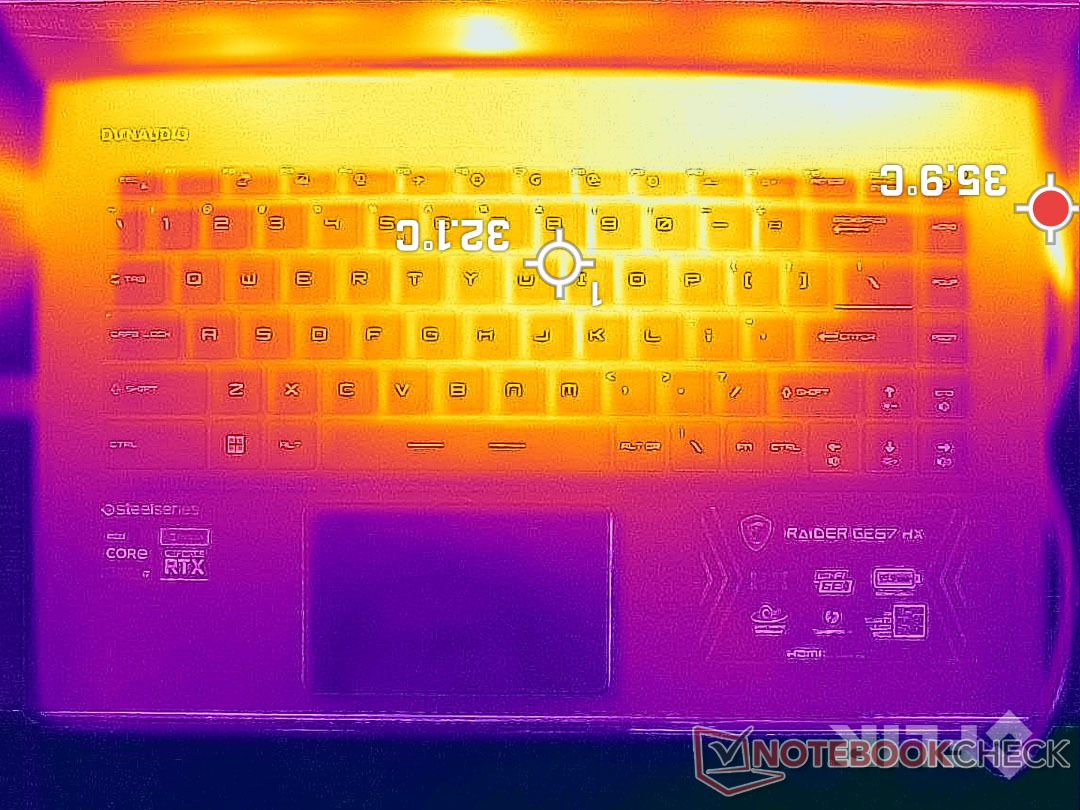
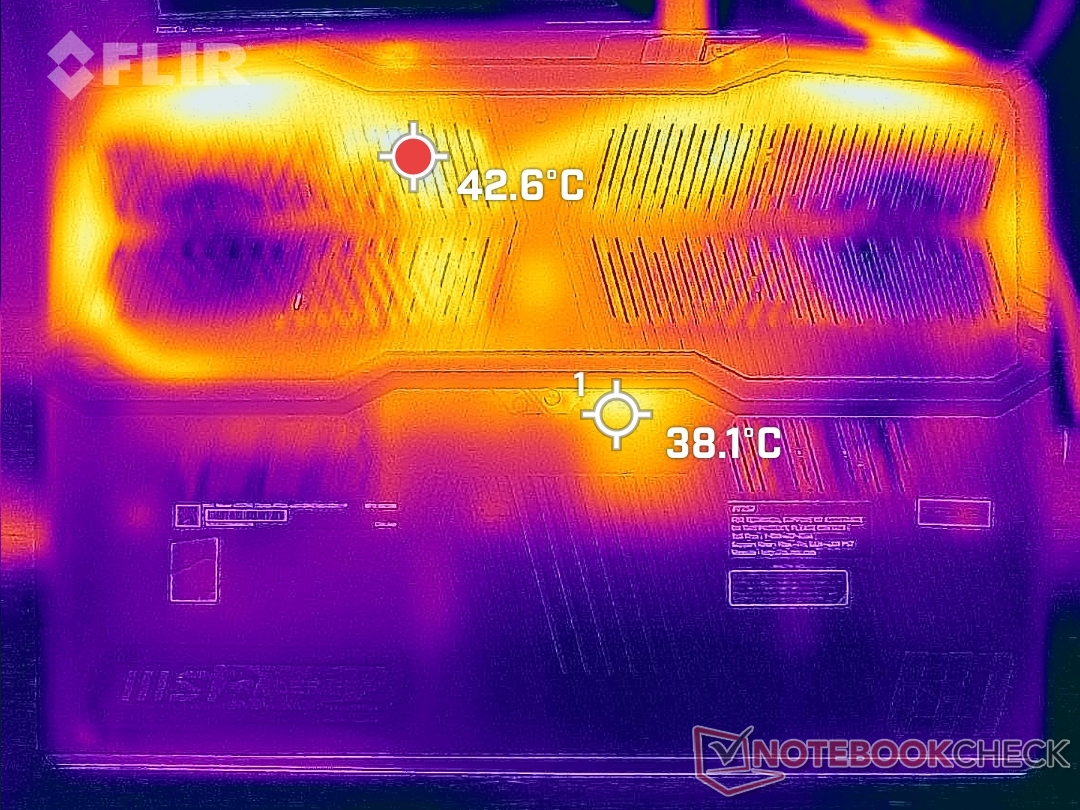
Die Oberflächentemperaturen sind kühler als beim GE66. Im Gaming-Betrieb erreichen die wärmsten Stellen auf der Tastaturfläche und der Bodenplatte 35 °C bzw. 46 °C. Die Bereiche befinden sich im hinteren Teil des Gehäuses, wie die Wärmebilder unten zeigen.
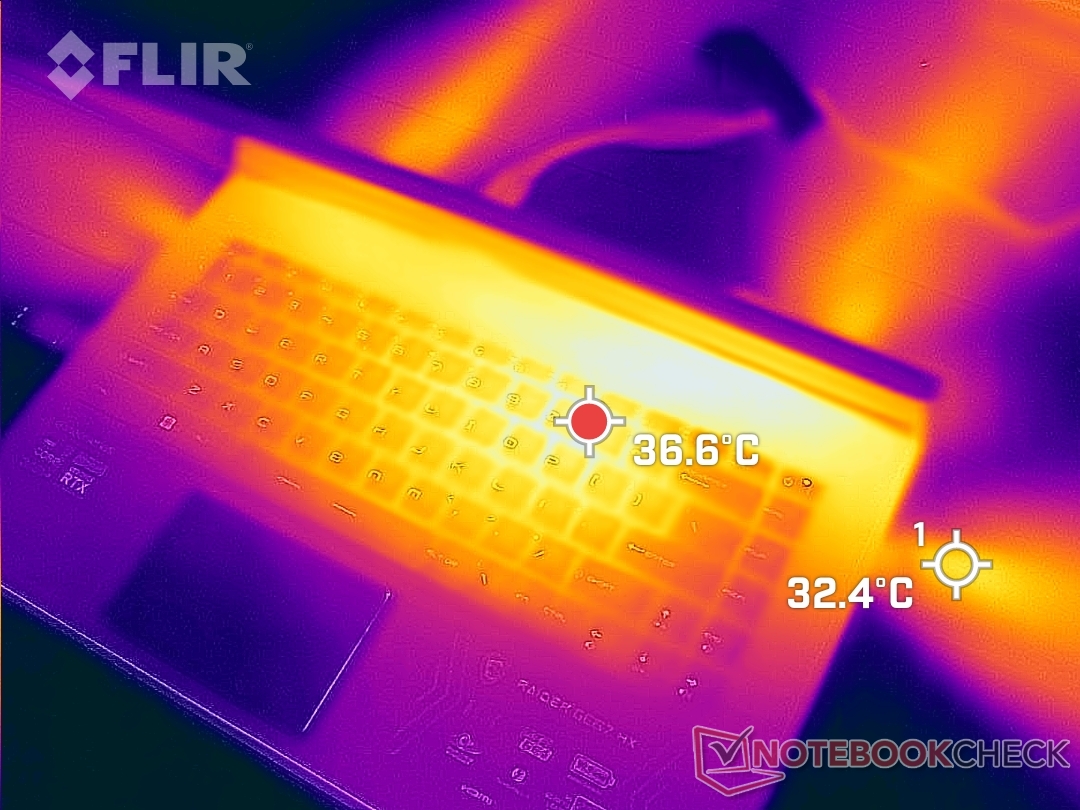
(+) Die maximale Temperatur auf der Oberseite ist 34.4 °C. Im Vergleich liegt der Klassendurchschnitt bei 40.4 °C (von 21.2 bis 68.8 °C für die Klasse Gaming).
(±) Auf der Unterseite messen wir eine maximalen Wert von 42 °C (im Vergleich zum Durchschnitt von 43.2 °C).
(+) Ohne Last messen wir eine durchschnittliche Temperatur von 21.4 °C auf der Oberseite. Der Klassendurchschnitt erreicht 33.9 °C.
(+) Beim längeren Spielen von The Witcher 3 erhitzt sich das Gerät durchschnittlich auf 27.9 °C. Der Durchschnitt der Klasse ist derzeit 33.9 °C.
(+) Die Handballen und der Touchpad-Bereich sind mit gemessenen 20.4 °C kühler als die typische Hauttemperatur und fühlen sich dadurch kühl an.
(+) Die durchschnittliche Handballen-Temperatur anderer getesteter Geräte war 28.8 °C (+8.4 °C).
| MSI GE67 HX 12UGS Intel Core i7-12800HX, NVIDIA GeForce RTX 3070 Ti Laptop GPU | MSI Raider GE66 12UHS Intel Core i9-12900HK, NVIDIA GeForce RTX 3080 Ti Laptop GPU | MSI Vector GP66 12UGS Intel Core i9-12900H, NVIDIA GeForce RTX 3070 Ti Laptop GPU | Asus ROG Strix Scar 15 G533ZW-LN106WS Intel Core i9-12900H, NVIDIA GeForce RTX 3070 Ti Laptop GPU | Alienware m15 R6, i7-11800H RTX 3080 Intel Core i7-11800H, NVIDIA GeForce RTX 3080 Laptop GPU | Razer Blade 15 2022 Intel Core i7-12800H, NVIDIA GeForce RTX 3080 Ti Laptop GPU | |
|---|---|---|---|---|---|---|
| Hitze | -36% | -19% | -29% | -45% | -32% | |
| Last oben max * (°C) | 34.4 | 54 -57% | 40.2 -17% | 42.6 -24% | 61 -77% | 50 -45% |
| Last unten max * (°C) | 42 | 65 -55% | 43.8 -4% | 50.2 -20% | 58 -38% | 47 -12% |
| Idle oben max * (°C) | 24 | 30 -25% | 34.8 -45% | 36.2 -51% | 38 -58% | 37.4 -56% |
| Idle unten max * (°C) | 33.2 | 35 -5% | 37 -11% | 40.2 -21% | 36 -8% | 38.4 -16% |
* ... kleinere Werte sind besser
Stresstest
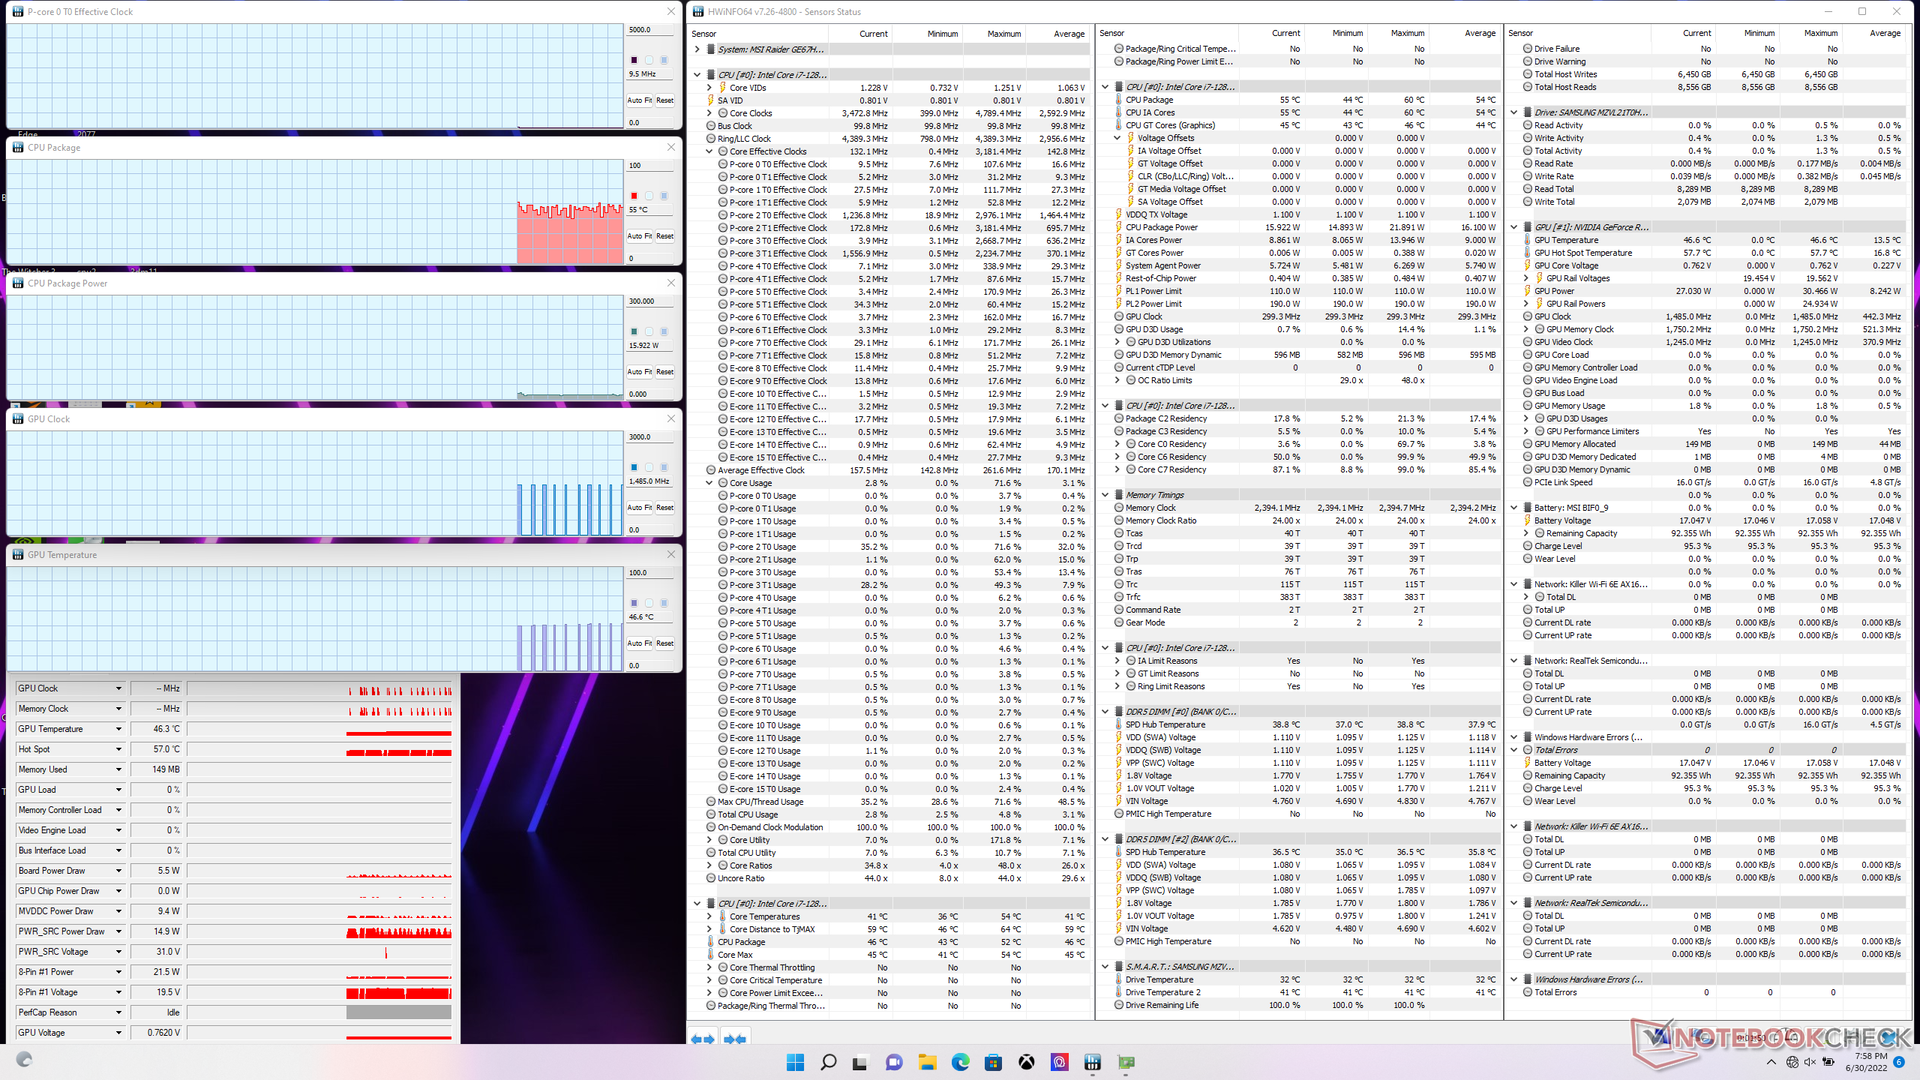
Bei der Auslastung der CPU mittels Prime95 erreicht die CPU zunächst eine Taktfrequenz von 4,2 GHz und 90 Sekunden später eine Kerntemperatur von 96 °C. Darauf fallen die Taktraten auf den 3,4-bis-3,7-GHz-Bereich, wodurch die CPU eine kühlere Kerntemperatur von rund 87 °C beibehalten kann. Die CPU-Package-Power erreicht innerhalb der ersten 90 Sekunden einen Spitzenwert von 140 W udn stabilisiert sich schließlich bei 110 W. Zum Vergleich: Der Core i7-12900HK im älteren GE66 stabilisiert sich unter ähnlichen Bedingungen bei nur 45 W.
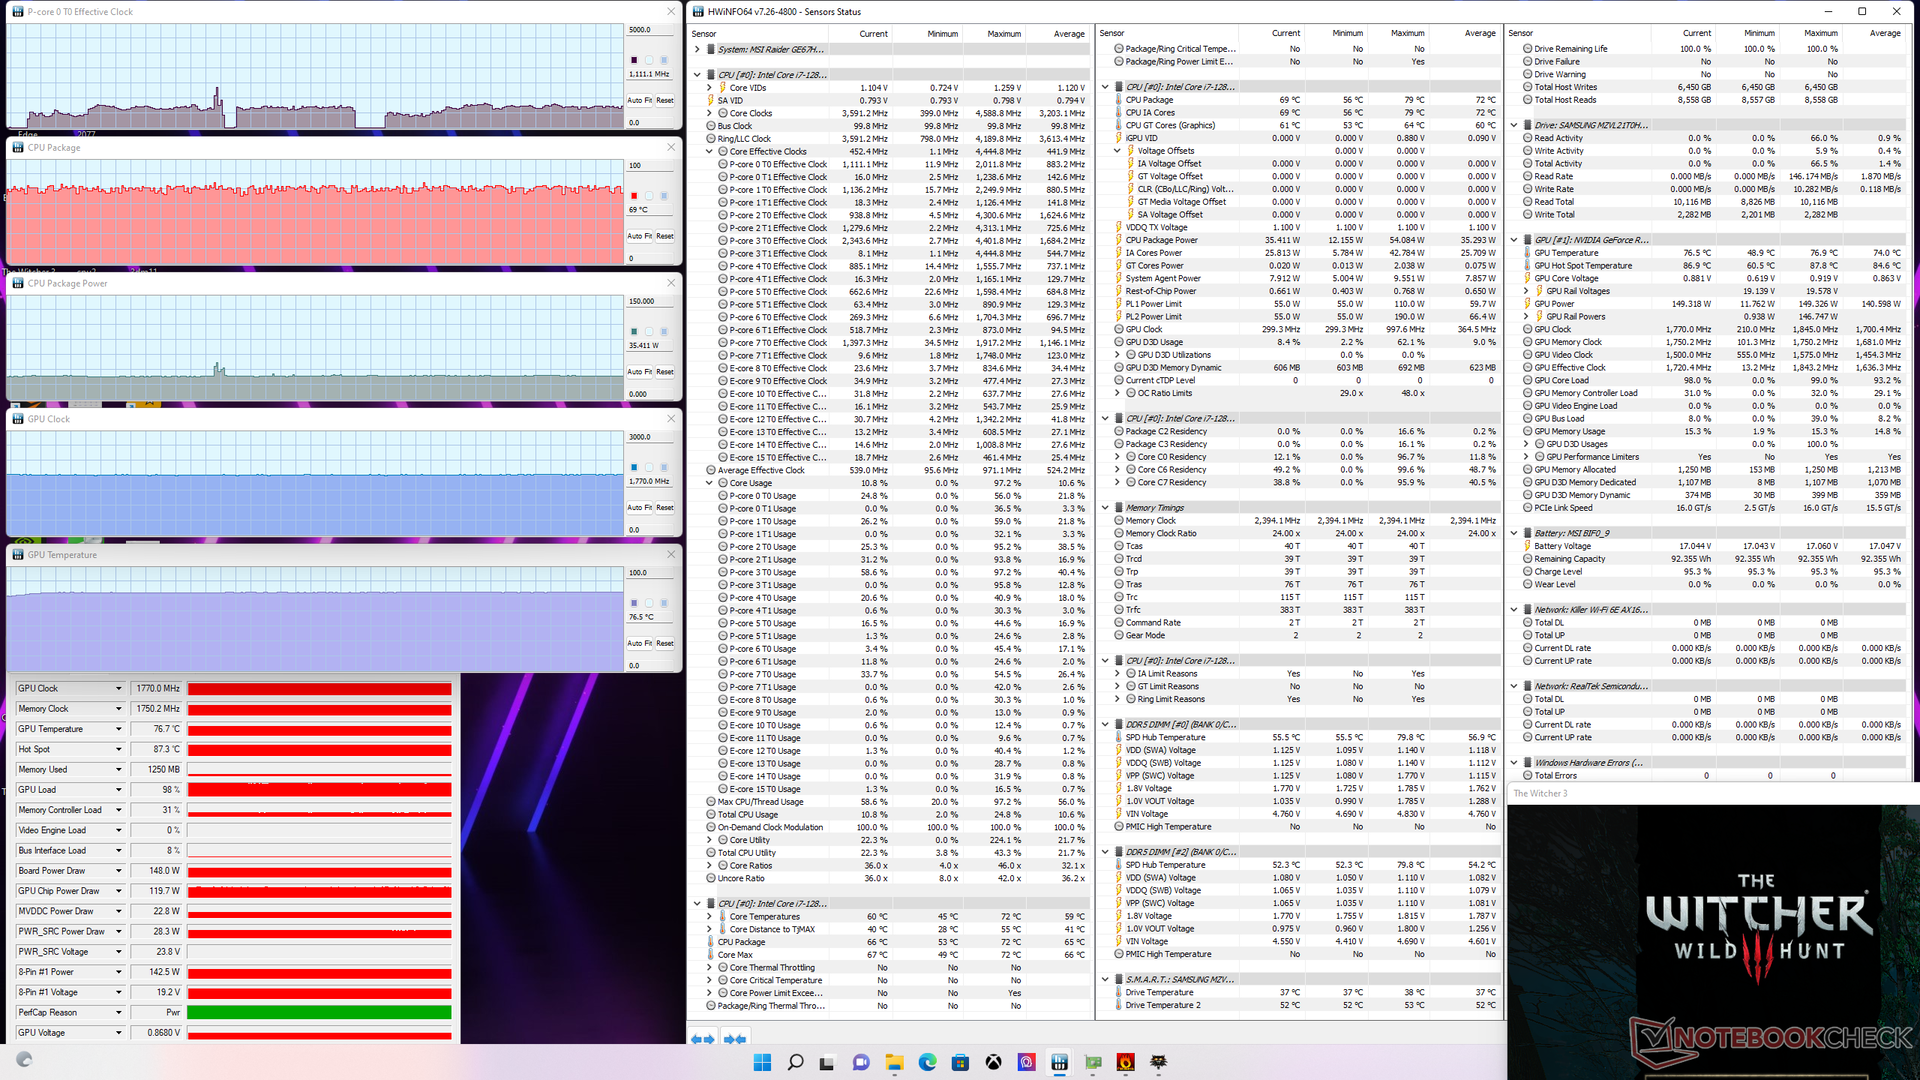
Der GPU-Board-Power-Draw erreicht im Extremleistungsmodus maximal 148 W, während im ausbalancierten Modus ~135 W erreicht werden. Daher sollte man, wenn man die GPU-Leistung maximieren möchte, den Extremleistungsmodus aktivieren. Die durchschnittlichen CPU- und GPU-Temperaturen fallen mit 69 °C bzw. 77 °C passabel aus - das Vector GP66, das ebenfalls mit einer GeForce RTX 3070 Ti, jedoch mit einer langsameren CPU aus der 11. Generation ausgestattet ist, liegt hier bei 71 °C bzw. 70 °C.
Erwähnenswert ist auch, dass wir zumindest laut GPU-Z auch im Extremleistungsmodus nur einen GPU-Board-Power-Draw von 148 W erreichen konnten, obwohl MSI mit 150 W + 25 W Dynamic Boost wirbt.
Im Akkumodus ist die Leistung eingeschränkt. Ein Fire-Strike-Durchlauf liefert im Akkumodus Physik- und Grafikpunktzahlen von 22.492 bzw. 11.614 Punkten, während im Netzbetrieb 34.445 bzw. 31.096 Punkte erreicht werden.
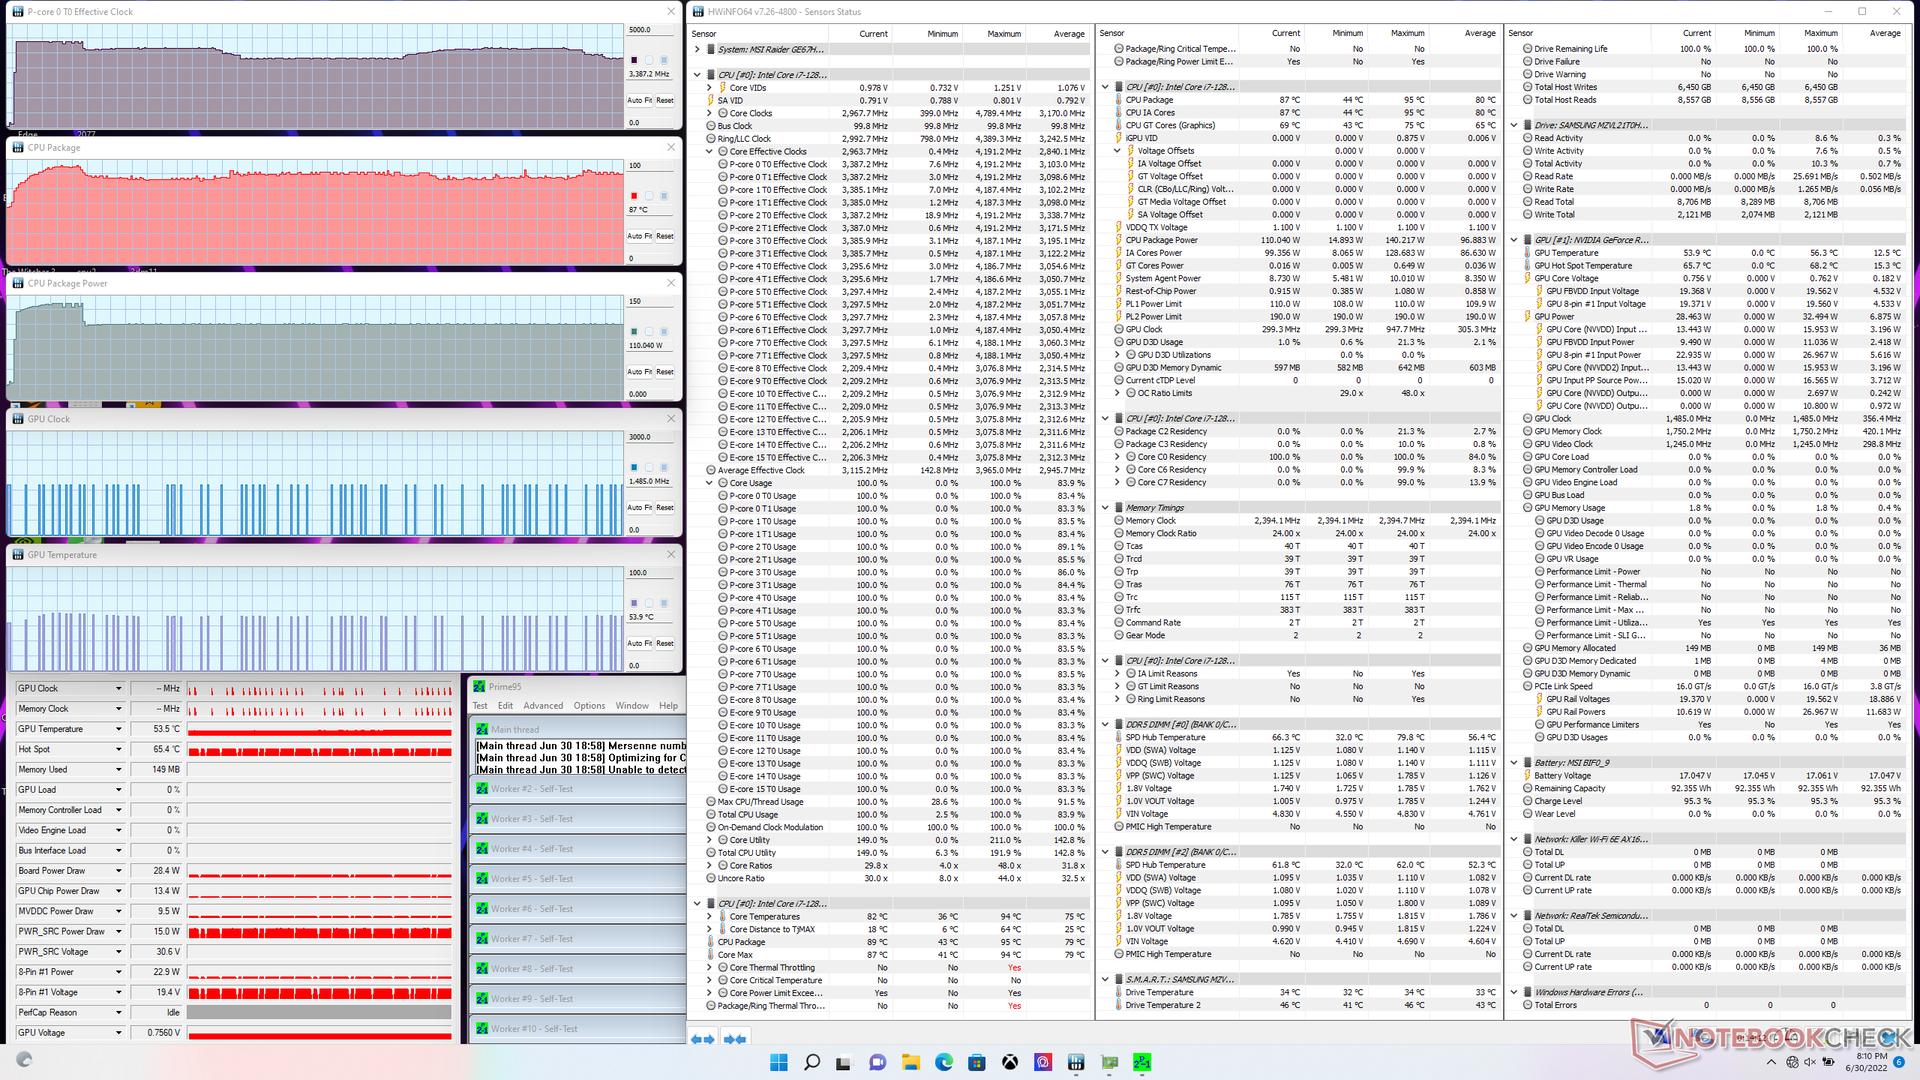
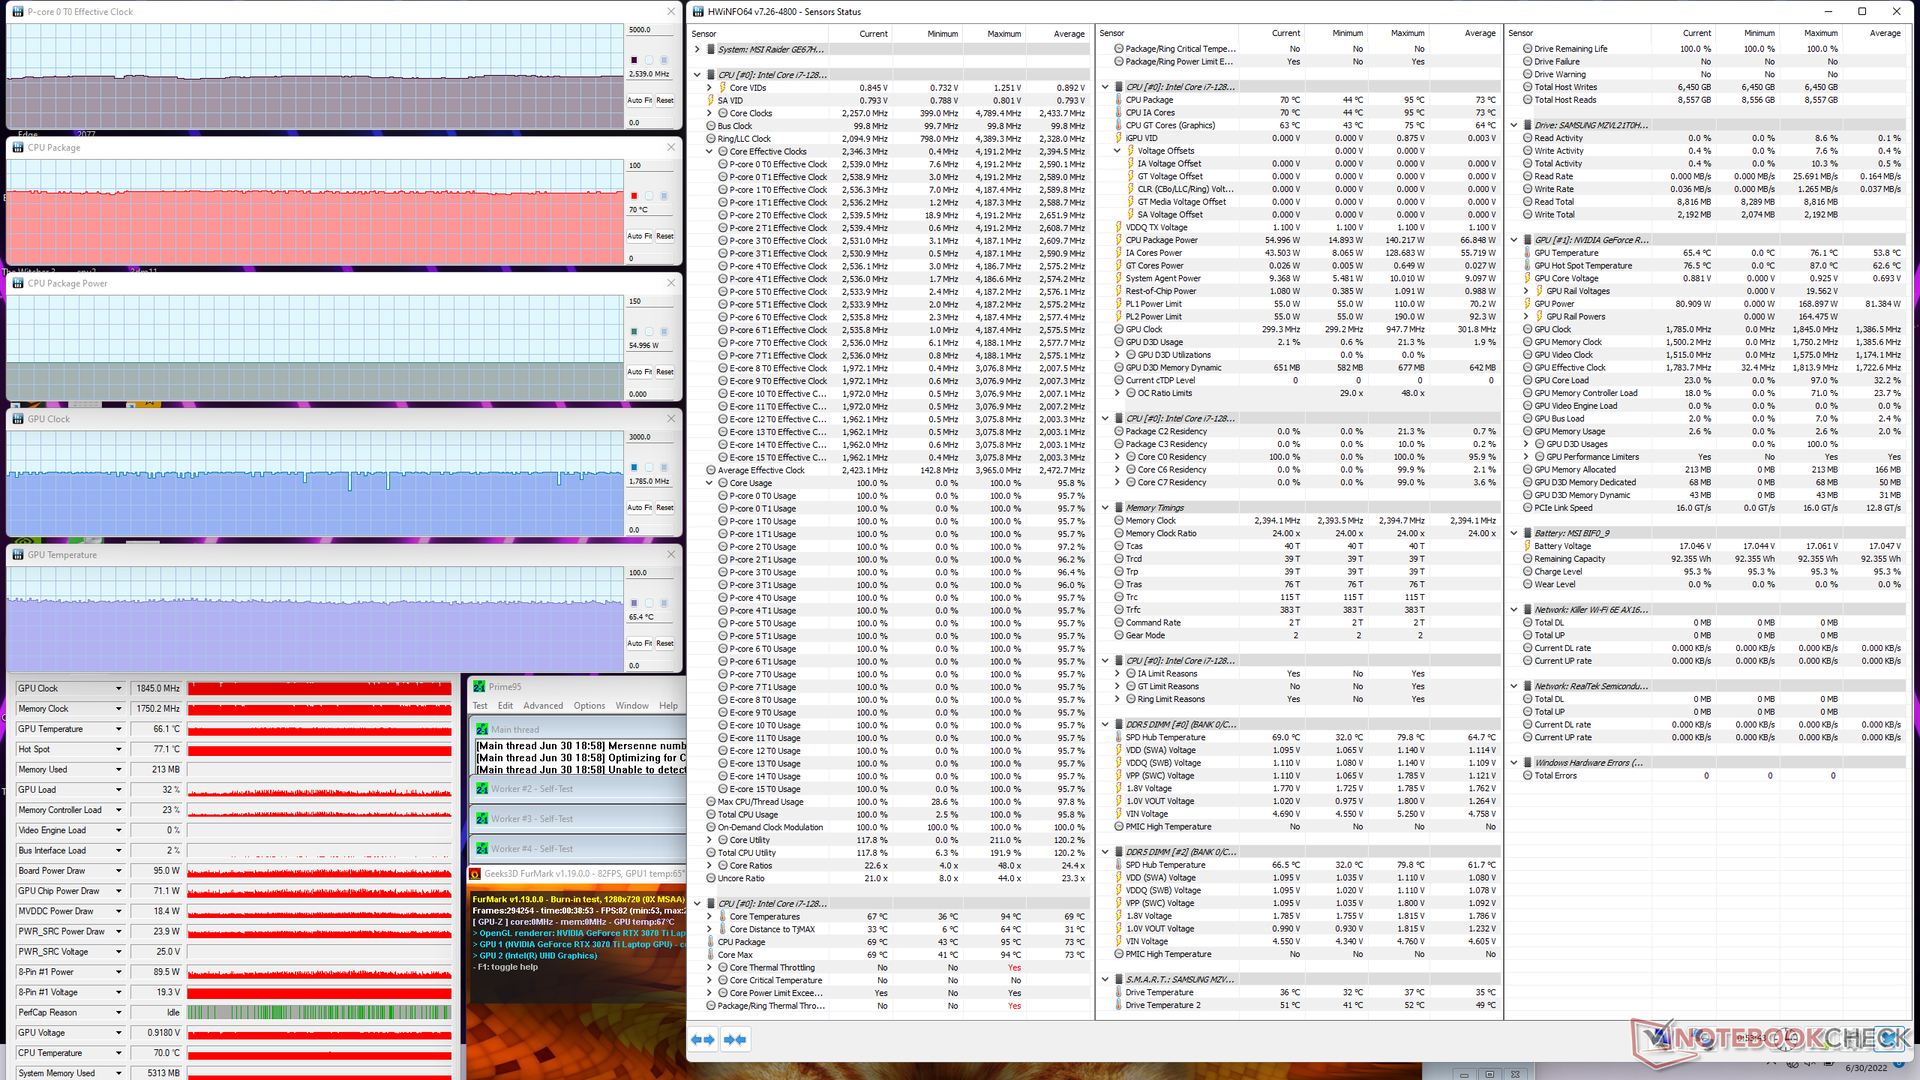
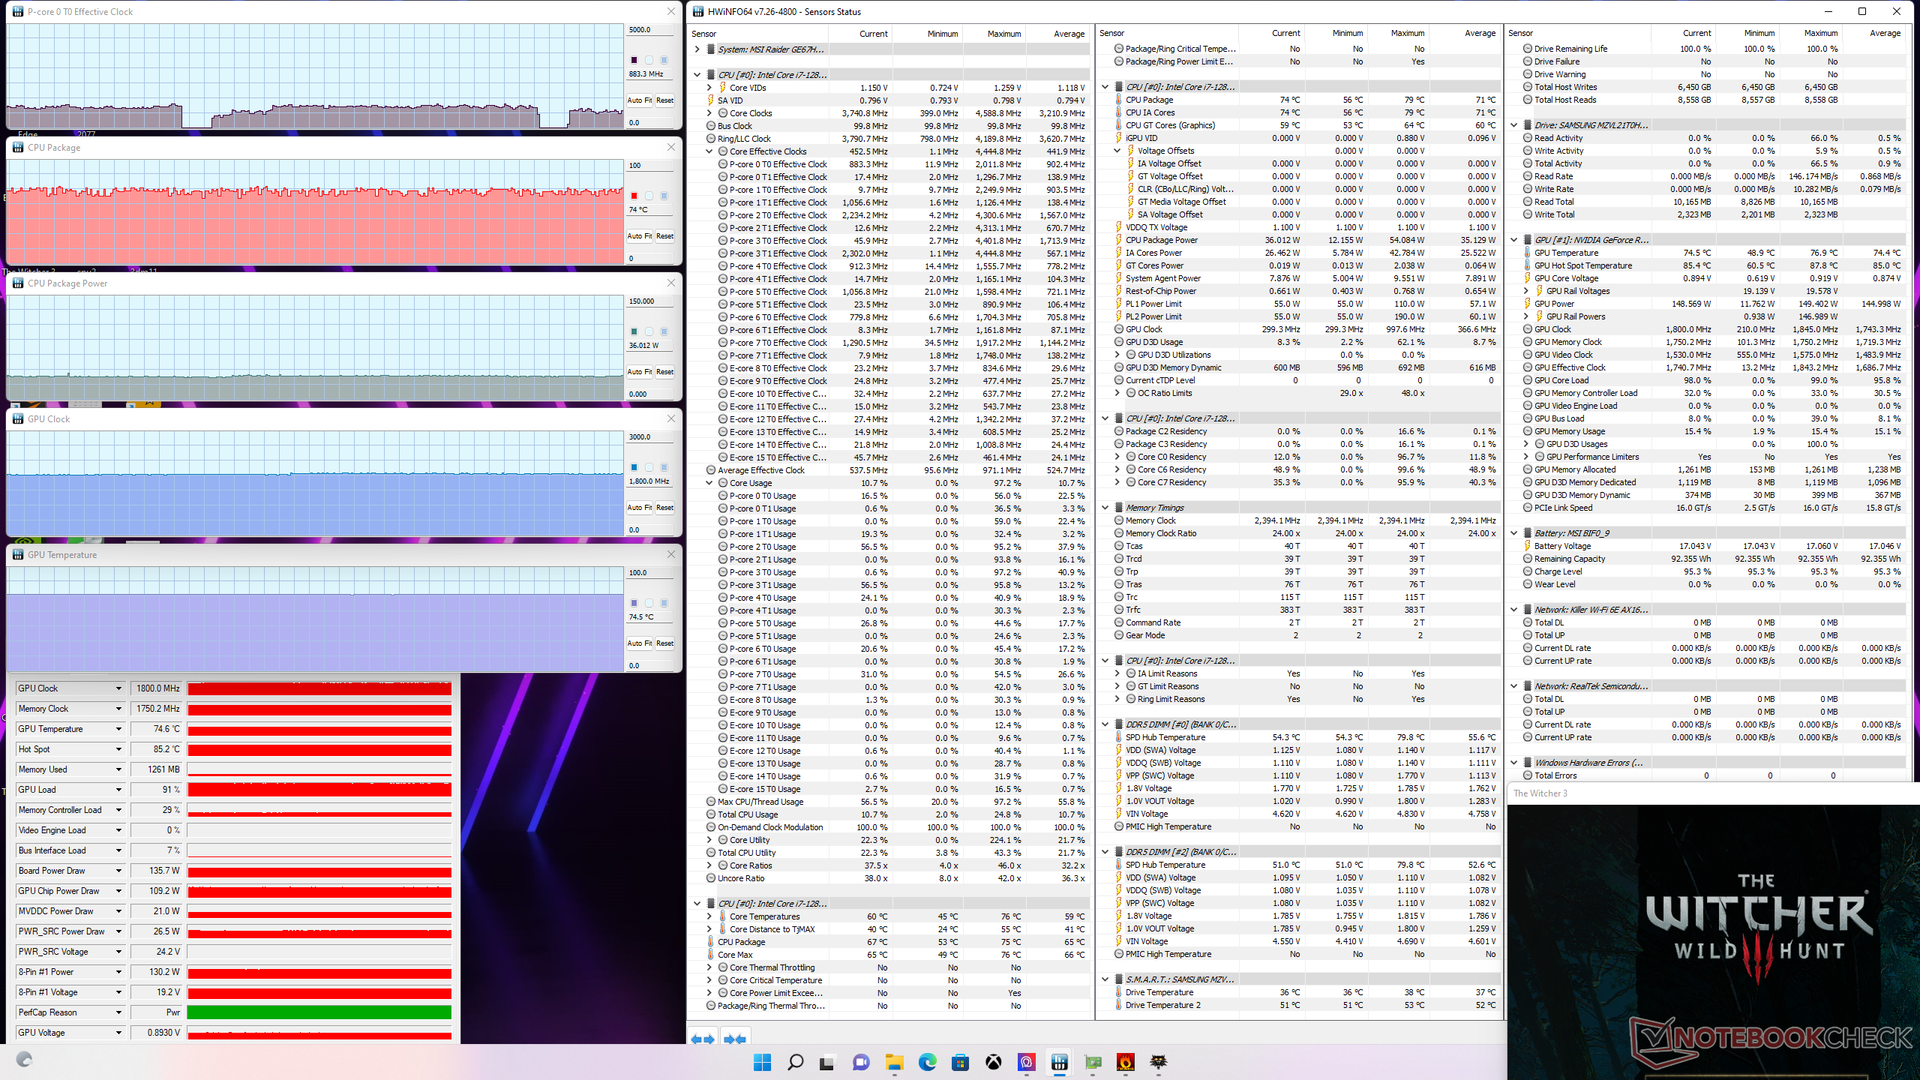
| CPU-Takt(GHz) | GPU-Takt (MHz) | Durchschnittliche CPU-Temperatur (°C) | Durchschnittliche GPU-Temperatur (°C) | |
| Leerlauf | -- | -- | 55 | 47 |
| Prime95-Stress | 3,4 - 3,7 | -- | 87 | 54 |
| Prime95- + FurMark-Stress | 2,6 | 1.845 | 70 | 65 |
| Witcher-3-Stress (Ausbalancierter Modus) | 0,9 | 1.800 | 74 | 75 |
| Witcher-3-Stress (Extremleistungsmodus) | 1,1 | 1.770 | 69 | 77 |
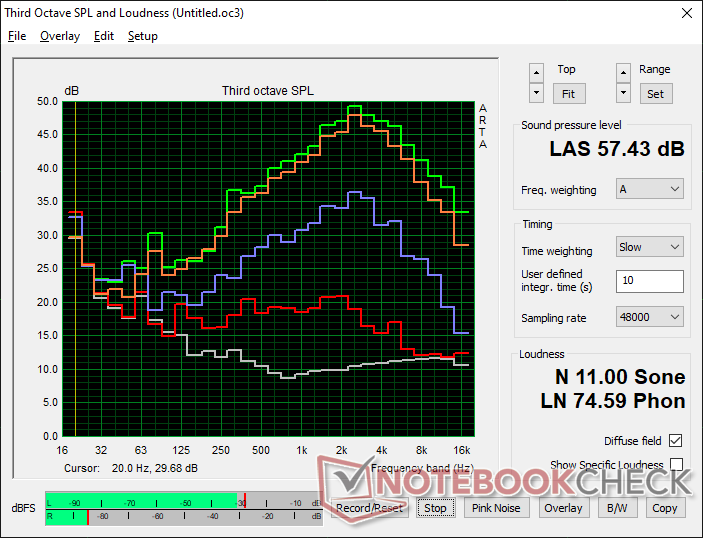
Lautsprecher
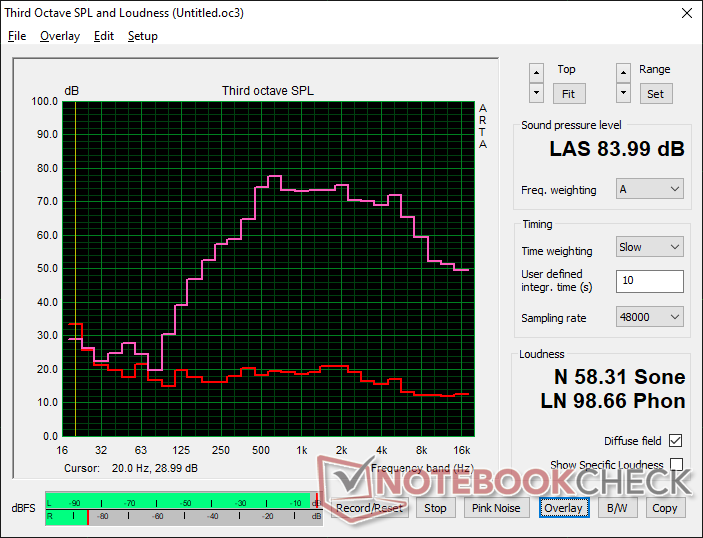
MSI GE67 HX 12UGS Audio Analyse
(+) | Die Lautsprecher können relativ laut spielen (84 dB)
Bass 100 - 315 Hz
(-) | kaum Bass - 17.9% niedriger als der Median
(±) | durchschnittlich lineare Bass-Wiedergabe (13.7% Delta zum Vorgänger)
Mitteltöne 400 - 2000 Hz
(±) | zu hohe Mitten, vom Median 7.9% abweichend
(+) | lineare Mitten (6.6% Delta zum Vorgänger)
Hochtöne 2 - 16 kHz
(±) | zu hohe Hochtöne, vom Median nur 5.5% abweichend
(±) | durchschnittlich lineare Hochtöne (8.6% Delta zum Vorgänger)
Gesamt im hörbaren Bereich 100 - 16.000 Hz
(±) | hörbarer Bereich ist durchschnittlich linear (22.1% Abstand zum Median)
Im Vergleich zu allen Geräten derselben Klasse
» 79% aller getesteten Geräte dieser Klasse waren besser, 6% vergleichbar, 15% schlechter
» Das beste Gerät hat einen Delta-Wert von 6%, durchschnittlich ist 18%, das schlechteste Gerät hat 132%
Im Vergleich zu allen Geräten im Test
» 64% aller getesteten Geräte waren besser, 6% vergleichbar, 30% schlechter
» Das beste Gerät hat einen Delta-Wert von 4%, durchschnittlich ist 24%, das schlechteste Gerät hat 134%
Apple MacBook Pro 16 2021 M1 Pro Audio Analyse
(+) | Die Lautsprecher können relativ laut spielen (84.7 dB)
Bass 100 - 315 Hz
(+) | guter Bass - nur 3.8% Abweichung vom Median
(+) | lineare Bass-Wiedergabe (5.2% Delta zum Vorgänger)
Mitteltöne 400 - 2000 Hz
(+) | ausgeglichene Mitten, vom Median nur 1.3% abweichend
(+) | lineare Mitten (2.1% Delta zum Vorgänger)
Hochtöne 2 - 16 kHz
(+) | ausgeglichene Hochtöne, vom Median nur 1.9% abweichend
(+) | sehr lineare Hochtöne (2.7% Delta zum Vorgänger)
Gesamt im hörbaren Bereich 100 - 16.000 Hz
(+) | hörbarer Bereich ist sehr linear (4.6% Abstand zum Median
Im Vergleich zu allen Geräten derselben Klasse
» 0% aller getesteten Geräte dieser Klasse waren besser, 0% vergleichbar, 100% schlechter
» Das beste Gerät hat einen Delta-Wert von 5%, durchschnittlich ist 17%, das schlechteste Gerät hat 45%
Im Vergleich zu allen Geräten im Test
» 0% aller getesteten Geräte waren besser, 0% vergleichbar, 100% schlechter
» Das beste Gerät hat einen Delta-Wert von 4%, durchschnittlich ist 24%, das schlechteste Gerät hat 134%
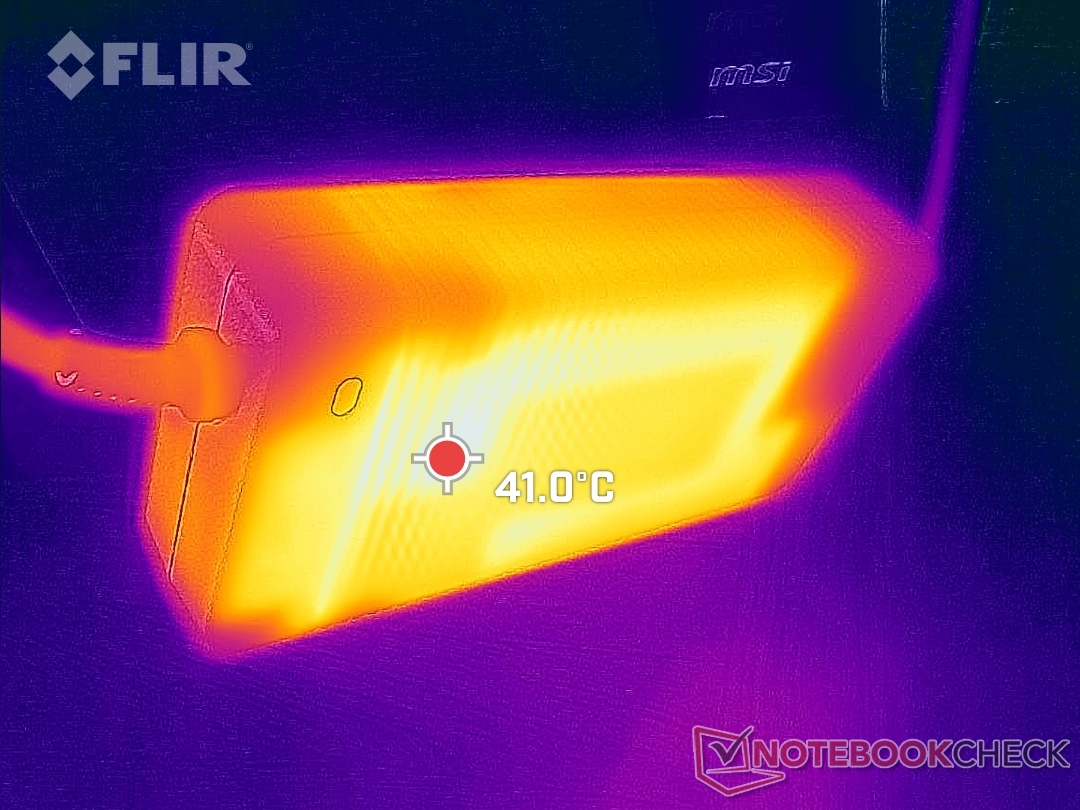
Energieverwaltung — Hoher Verbraucht und schweres Netzteil
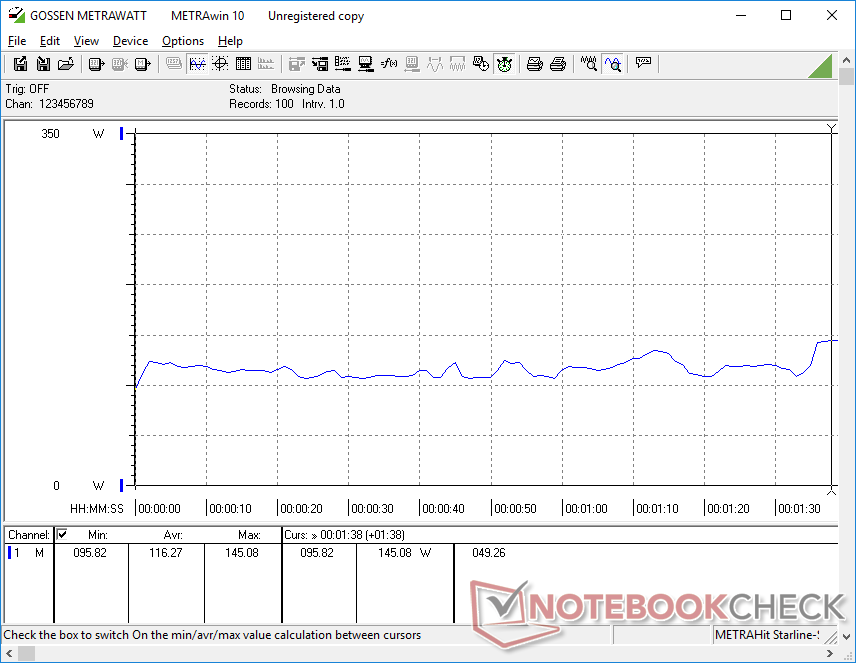
Energieaufnahme
Der Verbrauch ist vor allem CPU-lastigen Szenarien deutlich höher als beim älteren Core i9-12900HK im GE66. So werden beim Ausführen von Prime95 vom GE67 ca. 165 W verbraucht, während das GE66 nur 90 W benötigte - das entspricht einer Steigerung von 83 %. Damit bezahlt man einen hohen Preis für die 35- bis 40-prozentige Steigerung der Multi-Thread-Leistung des Core i7-12800HX gegenüber dem Core i9-12900HK.
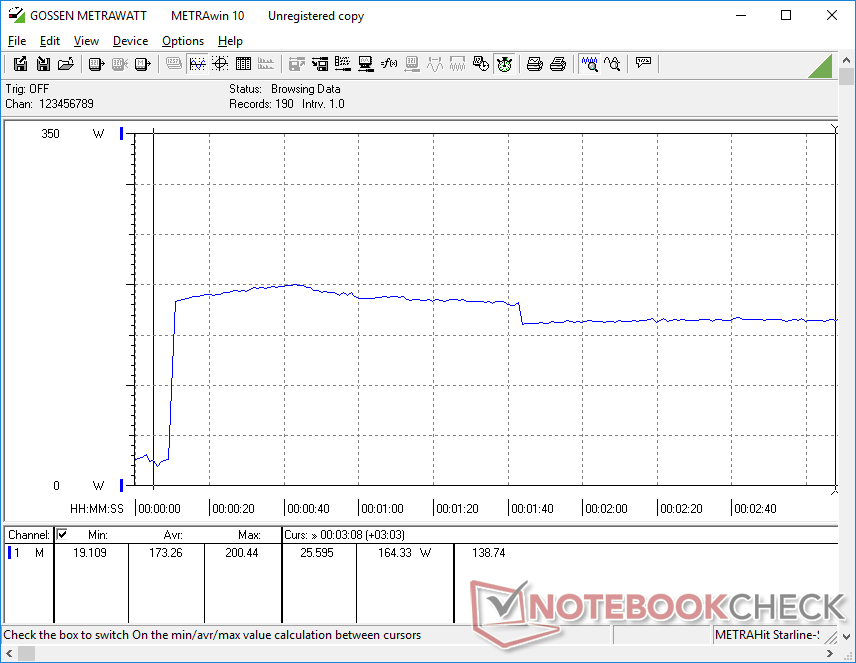
Beim Spielen von The Witcher 3 ist der Verbrauch mit 237 W ebenfalls höher als beim GE66 (202 W). Auch im Vergleich zu anderen Hochleistungs-Gaming-Laptops wie dem Asus ROG Strix Scar 15 oder dem Alienware m15 R6 verbraucht das GE67 jeweils mehr Strom.
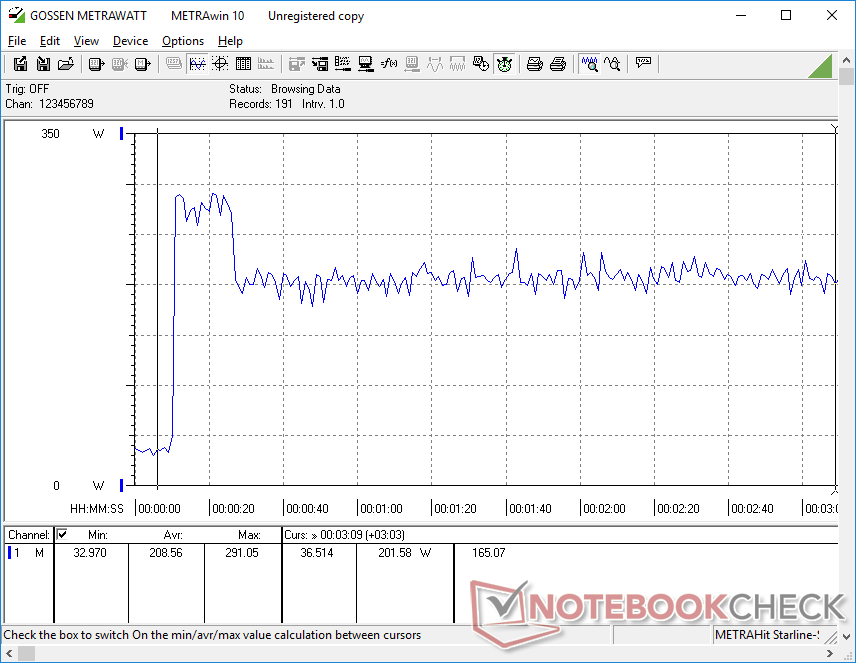
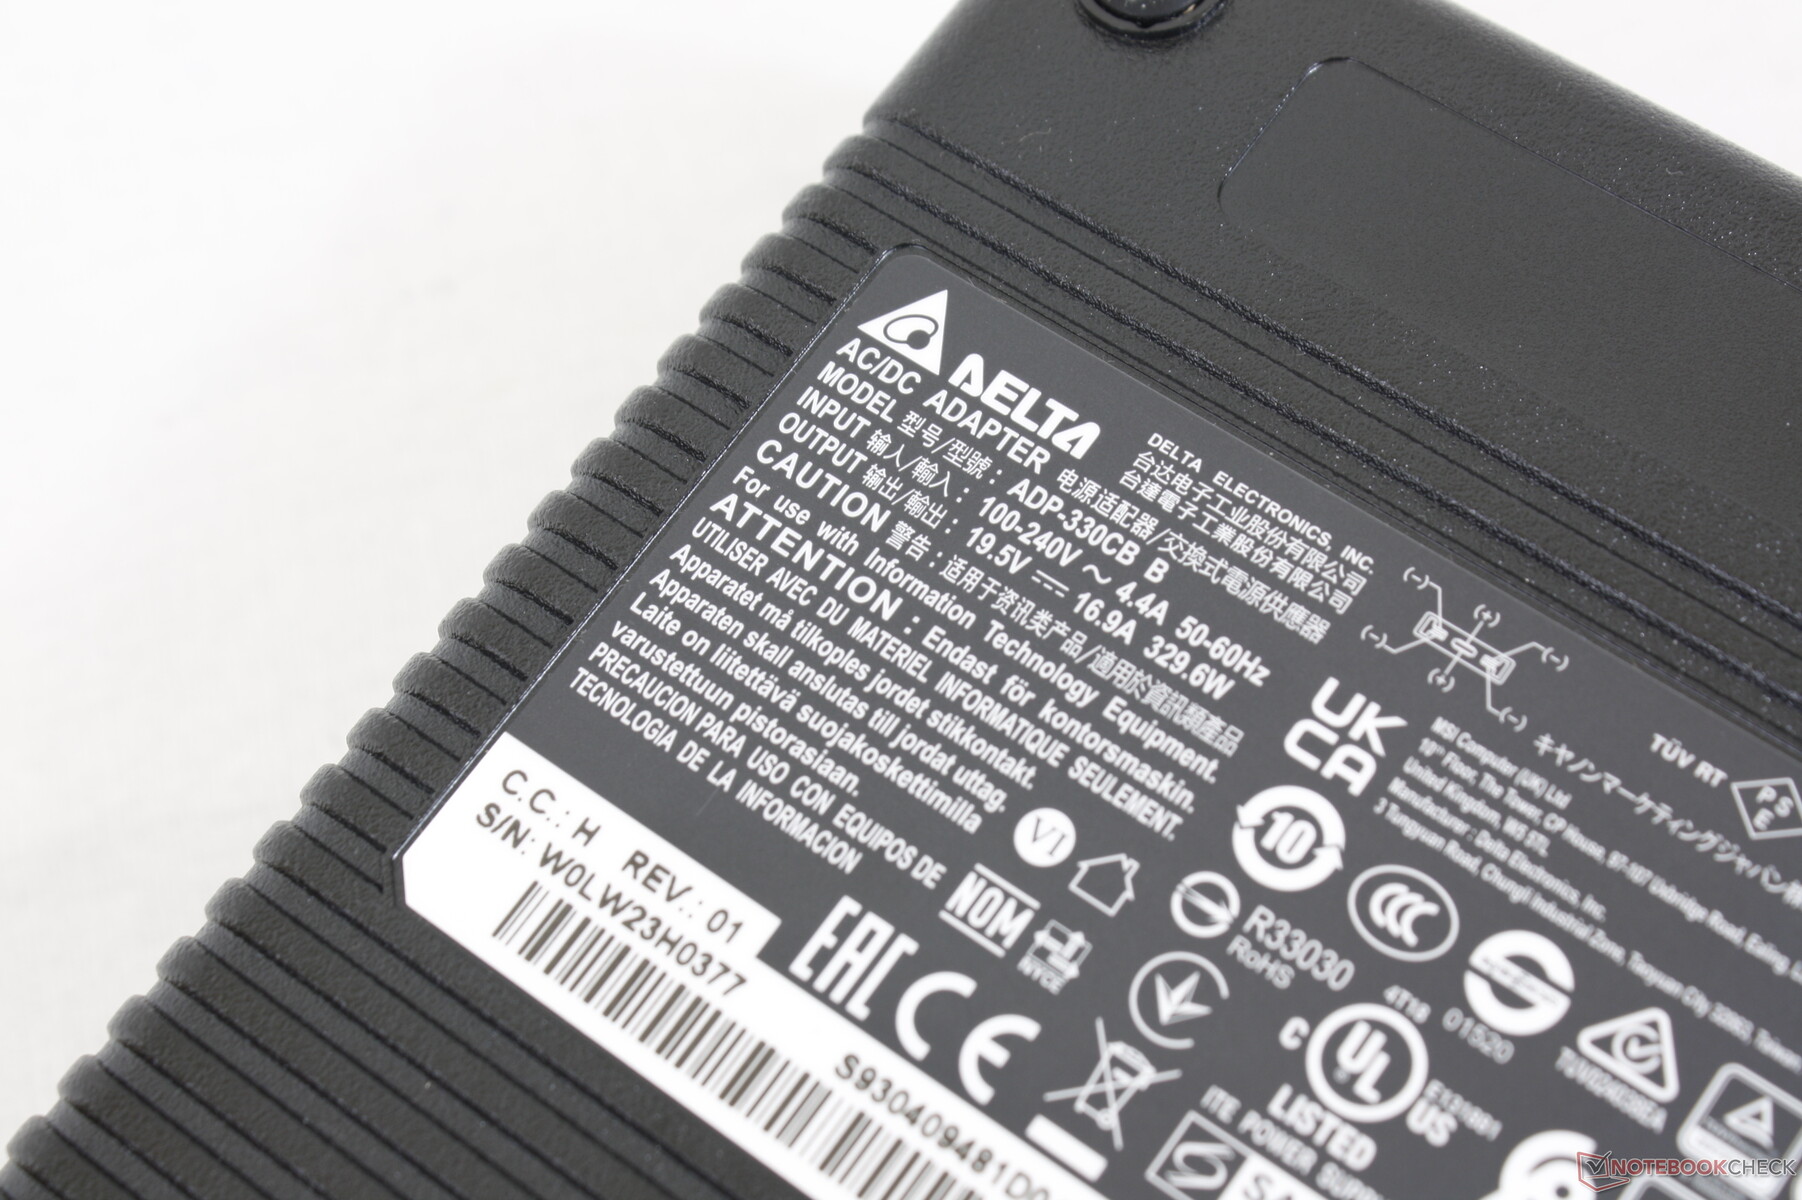
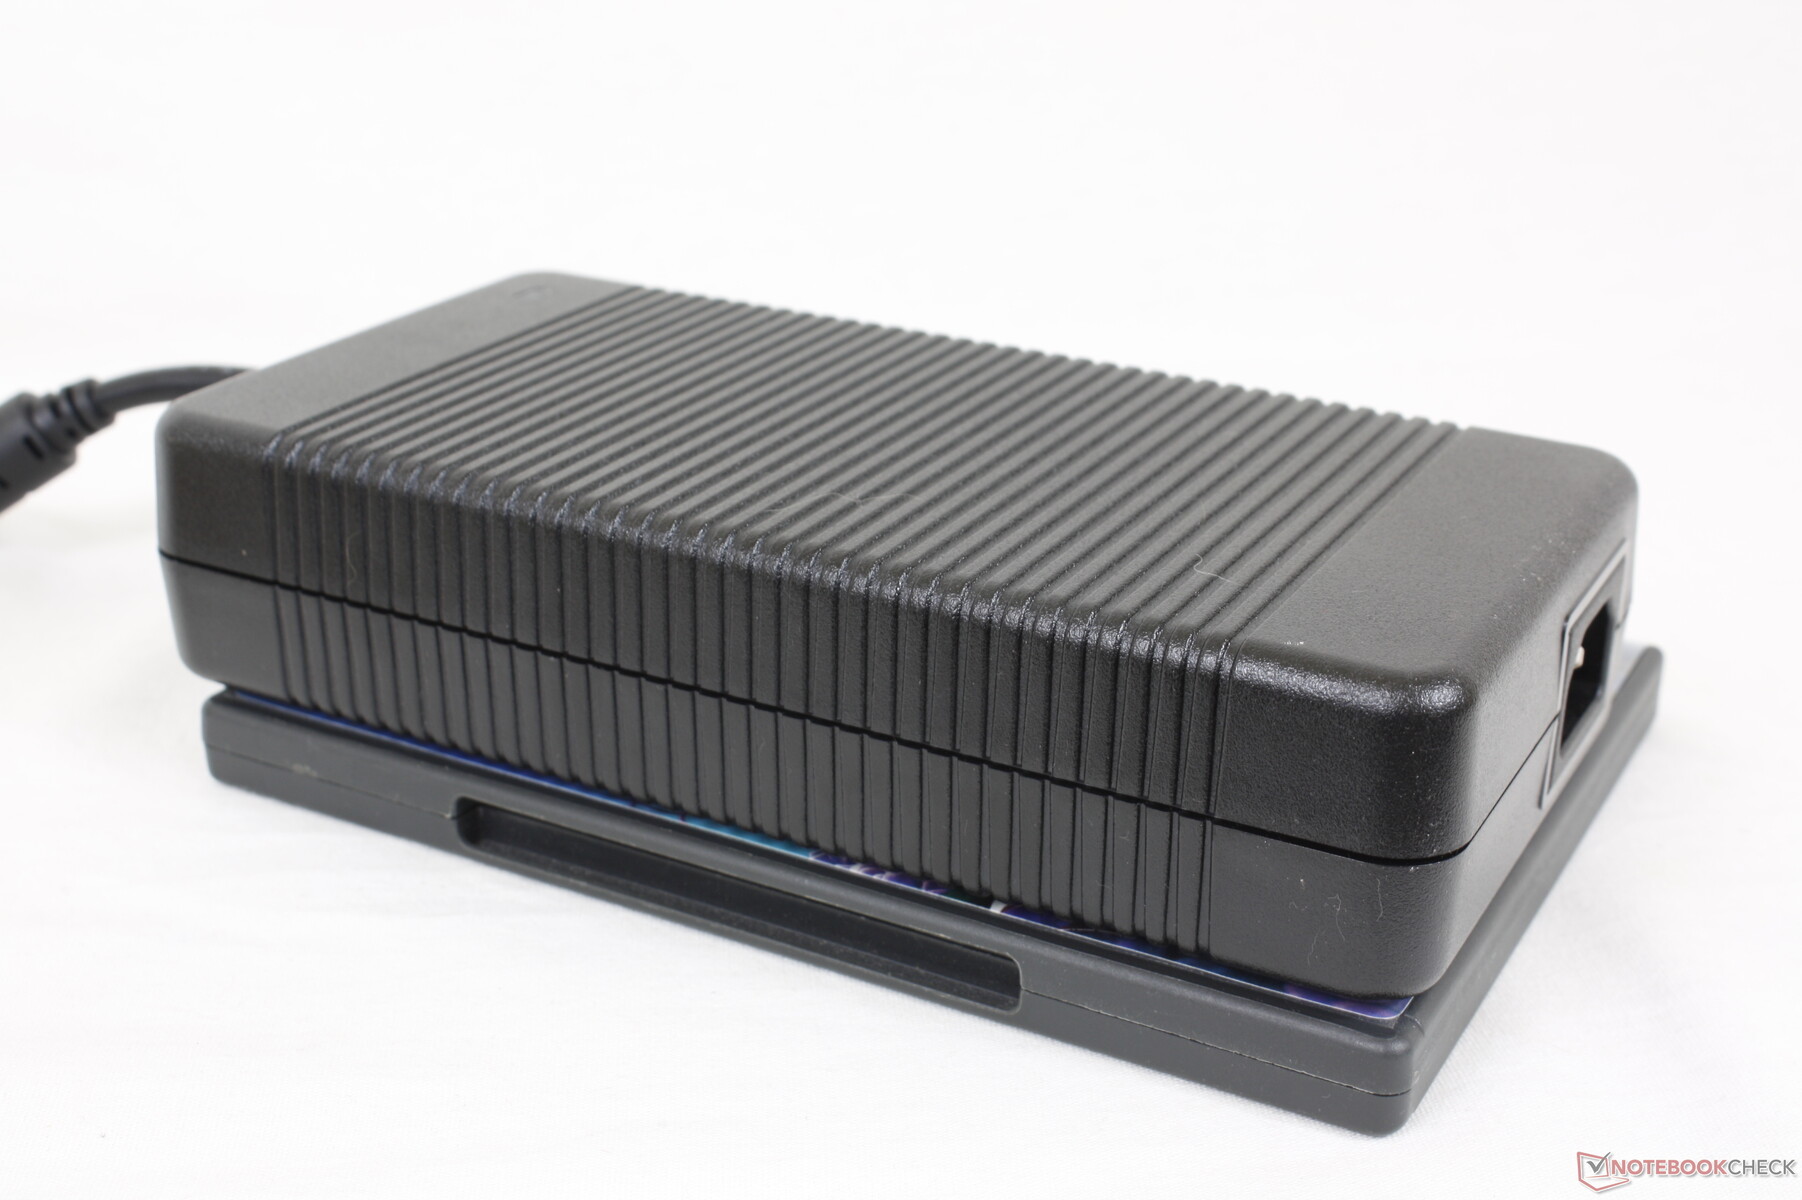
Wir konnten beim gleichzeitigen Ausführen von Prime95 und FurMark an dem sperrigen (~20 x 9,8 x 4,3 cm) und schweren (1,3 kg) 330-W-Netzteil einen maximalen Verbrauch von 291 W messen. Die meisten anderen Laptops werden von 280-W- bzw. noch kleineren Netzteilen versorgt.

| Aus / Standby | |
| Idle | |
| Last |
|
Legende:
min: | |
| MSI GE67 HX 12UGS i7-12800HX, GeForce RTX 3070 Ti Laptop GPU, Samsung PM9A1 MZVL21T0HCLR, OLED, 1920x1080, 15.6" | MSI Raider GE66 12UHS i9-12900HK, GeForce RTX 3080 Ti Laptop GPU, Samsung PM9A1 MZVL22T0HBLB, IPS, 3840x2160, 15.6" | MSI Vector GP66 12UGS i9-12900H, GeForce RTX 3070 Ti Laptop GPU, , IPS, 1920x1080, 15.6" | Asus ROG Strix Scar 15 G533ZW-LN106WS i9-12900H, GeForce RTX 3070 Ti Laptop GPU, Samsung PM9A1 MZVL22T0HBLB, IPS-level, 2560x1440, 15.6" | Alienware m15 R6, i7-11800H RTX 3080 i7-11800H, GeForce RTX 3080 Laptop GPU, Samsung PM9A1 MZVL21T0HCLR, IPS, 1920x1080, 15.6" | Razer Blade 15 2022 i7-12800H, GeForce RTX 3080 Ti Laptop GPU, SSSTC CA6-8D1024, IPS, 2560x1440, 15.6" | |
|---|---|---|---|---|---|---|
| Stromverbrauch | 5% | -15% | 21% | 12% | -35% | |
| Idle min * (Watt) | 16.1 | 16 1% | 17.5 -9% | 7.56 53% | 14 13% | 33.2 -106% |
| Idle avg * (Watt) | 17.1 | 19 -11% | 20.1 -18% | 13.5 21% | 18 -5% | 36.4 -113% |
| Idle max * (Watt) | 26.6 | 26 2% | 47.3 -78% | 16.87 37% | 29 -9% | 37.6 -41% |
| Last avg * (Watt) | 116.3 | 110 5% | 107.3 8% | 128.9 -11% | 93 20% | 116.7 -0% |
| Witcher 3 ultra * (Watt) | 237 | 202 15% | 225 5% | 196.2 17% | 190 20% | 172 27% |
| Last max * (Watt) | 291.1 | 242 17% | 277.7 5% | 274.86 6% | 203 30% | 228.6 21% |
* ... kleinere Werte sind besser
Verbrauch Witcher 3 / Stresstest
Verbrauch externer Monitor
Akkulaufzeit — Gar nicht schlecht
Die Akkukapazität ist mit 99,9 Wh ausgereizt, höhere Kapaziäten würden die FAA-Lithiumakku-Sicherheitsbestimmungen verletzen. Man kann im ausbalancierten Profil mit einer WLAN-Laufzeit von ca. 5,5 Stunden und damit trotz der Leistungsunterschiede einer ähnlichen Laufzeit wie beim GE66 rechnen.
Den leeren Akku voll aufzuladen dauert mit 2 bis 2,5 Stunden lange. Der Laptop kann im Gegensatz zur Razer-Blade-Reihe und den meisten Asus-ROG-Modellen nicht über USB-C geladen werden.
| MSI GE67 HX 12UGS i7-12800HX, GeForce RTX 3070 Ti Laptop GPU, 99.9 Wh | MSI Raider GE66 12UHS i9-12900HK, GeForce RTX 3080 Ti Laptop GPU, 99 Wh | MSI Vector GP66 12UGS i9-12900H, GeForce RTX 3070 Ti Laptop GPU, 65 Wh | Asus ROG Strix Scar 15 G533ZW-LN106WS i9-12900H, GeForce RTX 3070 Ti Laptop GPU, 90 Wh | Alienware m15 R6, i7-11800H RTX 3080 i7-11800H, GeForce RTX 3080 Laptop GPU, 84 Wh | Razer Blade 15 2022 i7-12800H, GeForce RTX 3080 Ti Laptop GPU, 80 Wh | |
|---|---|---|---|---|---|---|
| Akkulaufzeit | -9% | -19% | -4% | -18% | -12% | |
| Idle (h) | 8.4 | 7.9 -6% | ||||
| WLAN (h) | 5.6 | 5.7 2% | 5.7 2% | 8.4 50% | 5 -11% | 4.9 -12% |
| Last (h) | 2.1 | 1.7 -19% | 1 -52% | 0.9 -57% | 1.6 -24% | |
| H.264 (h) | 7.1 | 8.5 | 5.6 | |||
| Witcher 3 ultra (h) | 1.2 |
Pro
Contra
Fazit — Höhere Leistung, höhere Stromkosten
Die Leistung des Core i7-12800HX lässt sich nicht kleinreden. Im Vergleich zum Ryzen 7 5800H und sogar dem Core i9-12900H bietet die Intel-HX-CPU eine um bis zu 80 % höhere Multi-Thread-Leistung bzw. eine um 30 bis 60 % höhere Leistung. Dieser Leistungssprung ist so groß, dass die mobile CPU sogar oft die Core i7-12700K aus der Desktop-Klasse hinter sich lässt. Damit ist das GE67 für Hardcore-Nutzer und Gamer, welche die Prozessorleistung zum Beispiel für hohe Bildwiederholraten in Spielen nutzen können, durchaus interessant.
Die Leistungssteigerung hat jedoch auch ihren Preis. Während das GE66 noch mit einem schlankeren 280-W-Netzteil auskam, befindet sich im Lieferumfang des GE67 ein klobigeres 330-W-Netzteil, das den hohen Ansprüchen der Intel-HX-CPU aus der 12. Generation gerecht werden soll. Der Verbrauch ist zweifellos höher. Manche Nutzer nehmen diesen Nachteil in Anbetracht der CPU-Leistungssteigerung vermutlich in Kauf, dennoch sollte man sich dessen bewusst sein und auch die Leistung-pro-Watt nicht außer Acht lassen.
Das GE67 ist dank der Core-i7-12800HX-CPU und der 150-W-GeForce-RTX-GPU einer der schnellsten 15,6-Zoll-Gaming-Laptops überhaupt. Gleichzeitig weist es auch einen der höchsten Stromverbräuche auf und muss mit einem großen 330-W-Netzteil versorgt werden.
Das QHD-OLED-240-Hz-Display ist für Gaming-Zwecke das mit Abstand beste, derzeit erhältliche OLED-Panel und eine sehr gute Ergänzung der HX-CPU und der 150-W-GeForce-RTX-3070-Ti-GPU. Die Implementierung eignet sich beim GE67 jedoch nicht für die professionelle Medienbearbeitung und ein kleiner Teil der Nutzer wird sich möglicherweise an dem Bildschirmflackern stören.
Preis und Verfügbarkeit
Das MSI Raider GE67 ist das erste verfügbare Notebook mit 240 Hz OLED Display. Zwei verschiedene Konfiguration des MSI Raider GE67 HX sind aktuell auf Amazon für 2.935 bzw. 3.037 Euro verfügbar. Basierend auf den Modellbezeichnungen besitzen beide jeweils einen Core i7-12800HX, eine GeForce RTX 3070 Ti, 16 GB DDR5-RAM und ein QHD-OLED-Display mit 240 Hz und unterscheiden sich nur dadurch, dass die günstigere Variante kein Betriebssystem beinhaltet. Bei Cyberport soll das Modell (inklusive Betriebssystem) ab dem 25.08.2022 für rund 3.000 Euro lieferbar sein.
MSI GE67 HX 12UGS
- 30.08.2022 v7 (old)
Allen Ngo
Preisvergleich

