Premiere für den Intel Core i7-12800H: Razer Blade 15 Laptop im Test
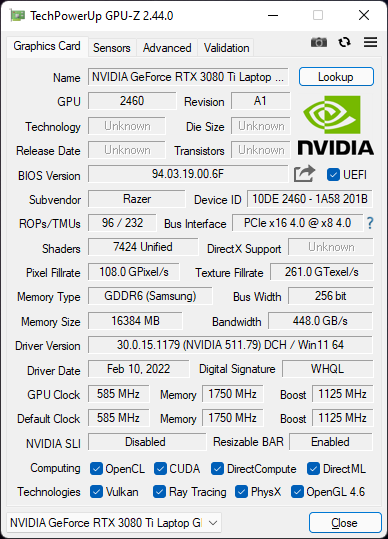
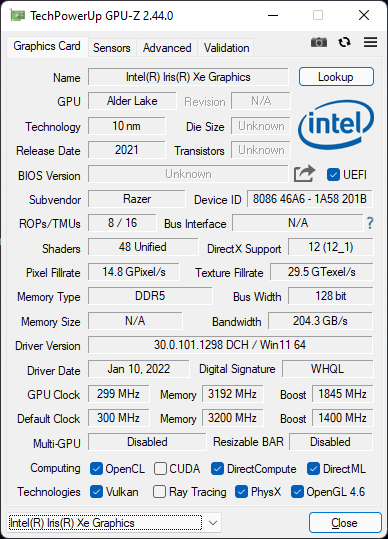
Razer hat das Blade 15 dieses Jahr mit den neuesten Intel-CPUs und Nvidia-GPUs aktualisiert. Beim aktuellen Modell ersetzen dabei die Alder-Lake-H-CPUs Core i7-12800H bzw. Core i9-12900H aus der 12. Generation und die GeForce RTX 3070 Ti bzw. 3080 Ti (110 W TGP) den älteren Core i7-11800H bzw. Core i9-11900H und die RTX 3070 bzw. RTX 3080 (105 W TGP). In diesem Test untersuchen wir die zu erwartenden Leistungsunterschieden zwischen dem älteren Razer Blade 15 und dem 2022er-Modell.
Zu den Alternativen des Blade 15 zählen andere ultradünne 15,6-Zoll-Gaming-Laptops wie das Eurocom RX315, MSI GS66, ADATA XPG Xenia 15 und Asus' Zephyrus-S-Reihe.
Weitere Razer-Tests:
Mögliche Konkurrenten im Vergleich
Bew. | Datum | Modell | Gewicht | Dicke | Größe | Auflösung | Preis ab |
|---|---|---|---|---|---|---|---|
| 89.1 % v7 (old) | 03 / 2022 | Razer Blade 15 2022 i7-12800H, GeForce RTX 3080 Ti Laptop GPU | 2.1 kg | 16.99 mm | 15.60" | 2560x1440 | |
| 87.5 % v7 (old) | 04 / 2021 | Razer Blade 15 Advanced Model Early 2021 i7-10875H, GeForce RTX 3080 Laptop GPU | 2 kg | 16.99 mm | 15.60" | 1920x1080 | |
| 85.9 % v7 (old) | 08 / 2020 | Razer Blade 15 RTX 2080 Super Max-Q i7-10875H, GeForce RTX 2080 Super Max-Q | 2.2 kg | 17.8 mm | 15.60" | 1920x1080 | |
v (old) | 02 / 2022 | Schenker XMG Neo 15 E22 (Early 2022, RTX 3080 Ti) i7-12700H, GeForce RTX 3080 Ti Laptop GPU | 2.2 kg | 26.6 mm | 15.60" | 2560x1440 | |
| 87.3 % v7 (old) | 03 / 2022 | ADATA XPG Xenia 15 i7-11800H, GeForce RTX 3070 Laptop GPU | 1.9 kg | 20.5 mm | 15.60" | 2560x1440 | |
| 83 % v7 (old) | 01 / 2022 | Eurocom Nightsky ARX315 R9 5900X, GeForce RTX 3070 Laptop GPU | 2.6 kg | 32.5 mm | 15.60" | 1920x1080 |
Gehäuse
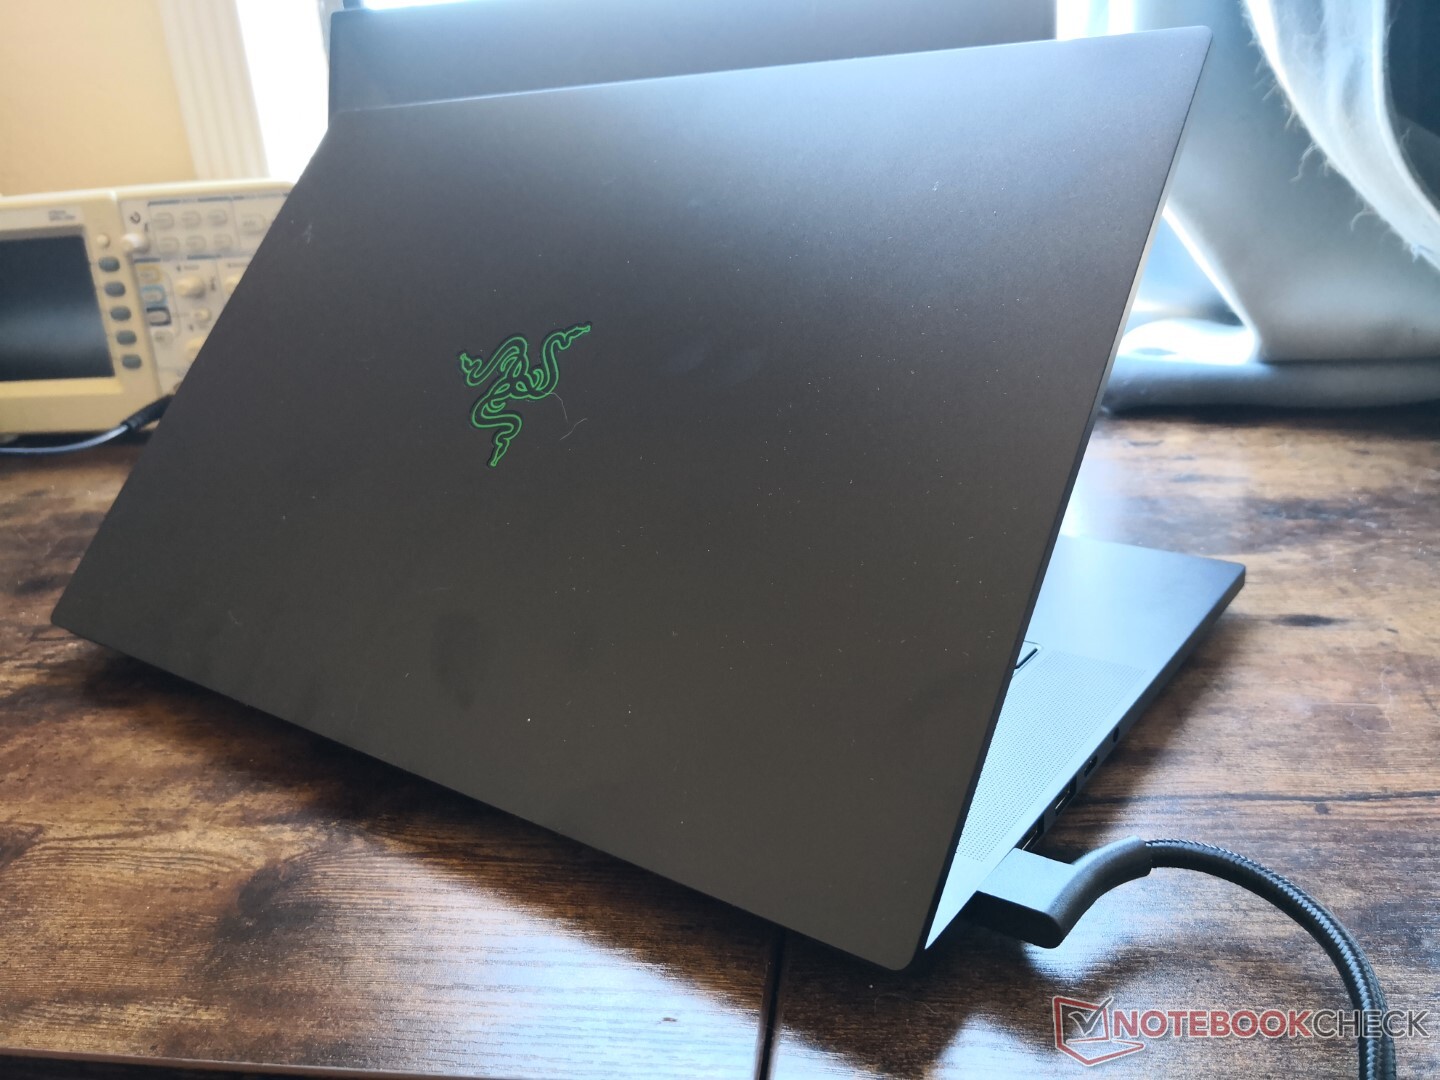
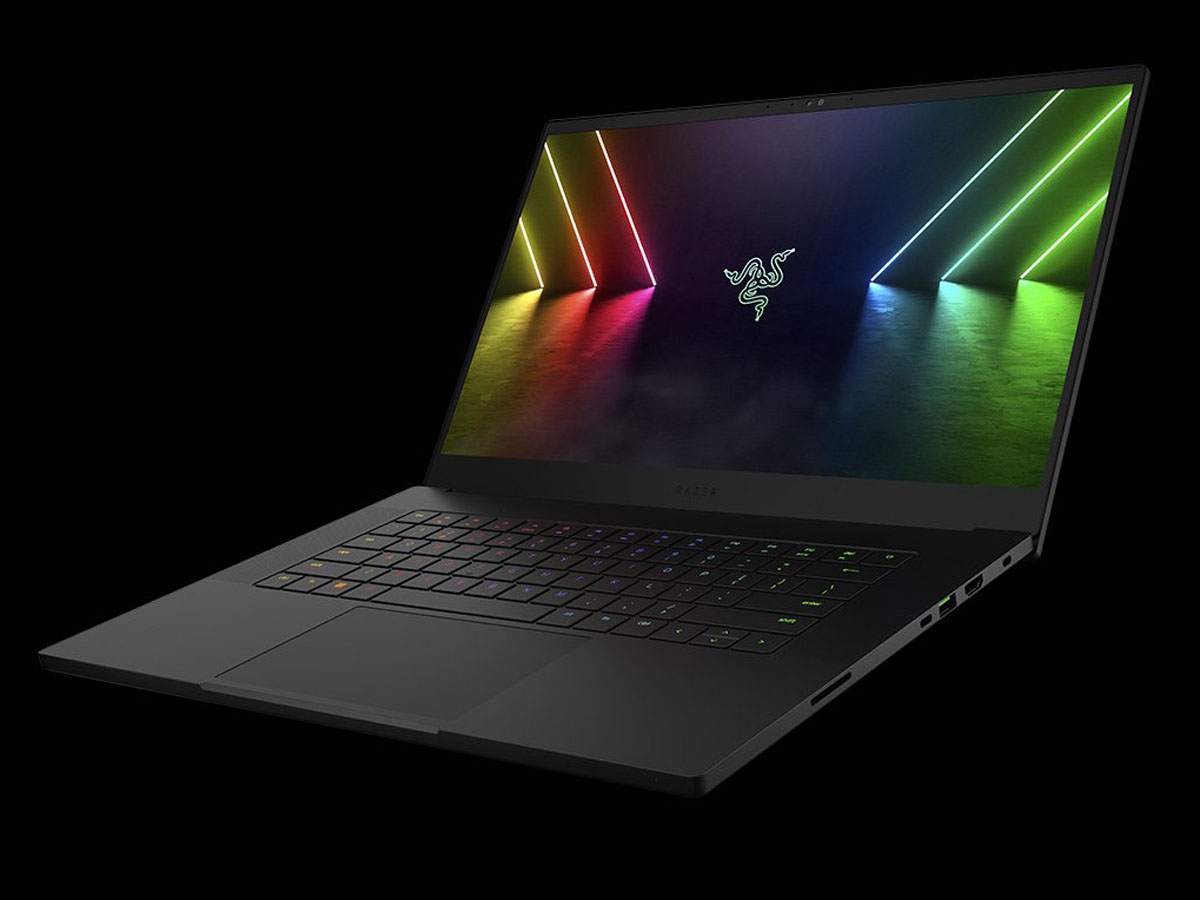
Da das Chassis gegenüber dem des Profi-Modells aus dem letzten Jahr größtenteils unverändert bleibt, gibt es auch bei der Haptik und den Abmessungen nichts Neues zu berichten. Wer schon einmal ein Blade Stealth, Blade 14, Blade 15 oder Blade Pro 17 in den Händen hatte, weiß ungefähr, was beim 2022er-Modell zu erwarten ist.
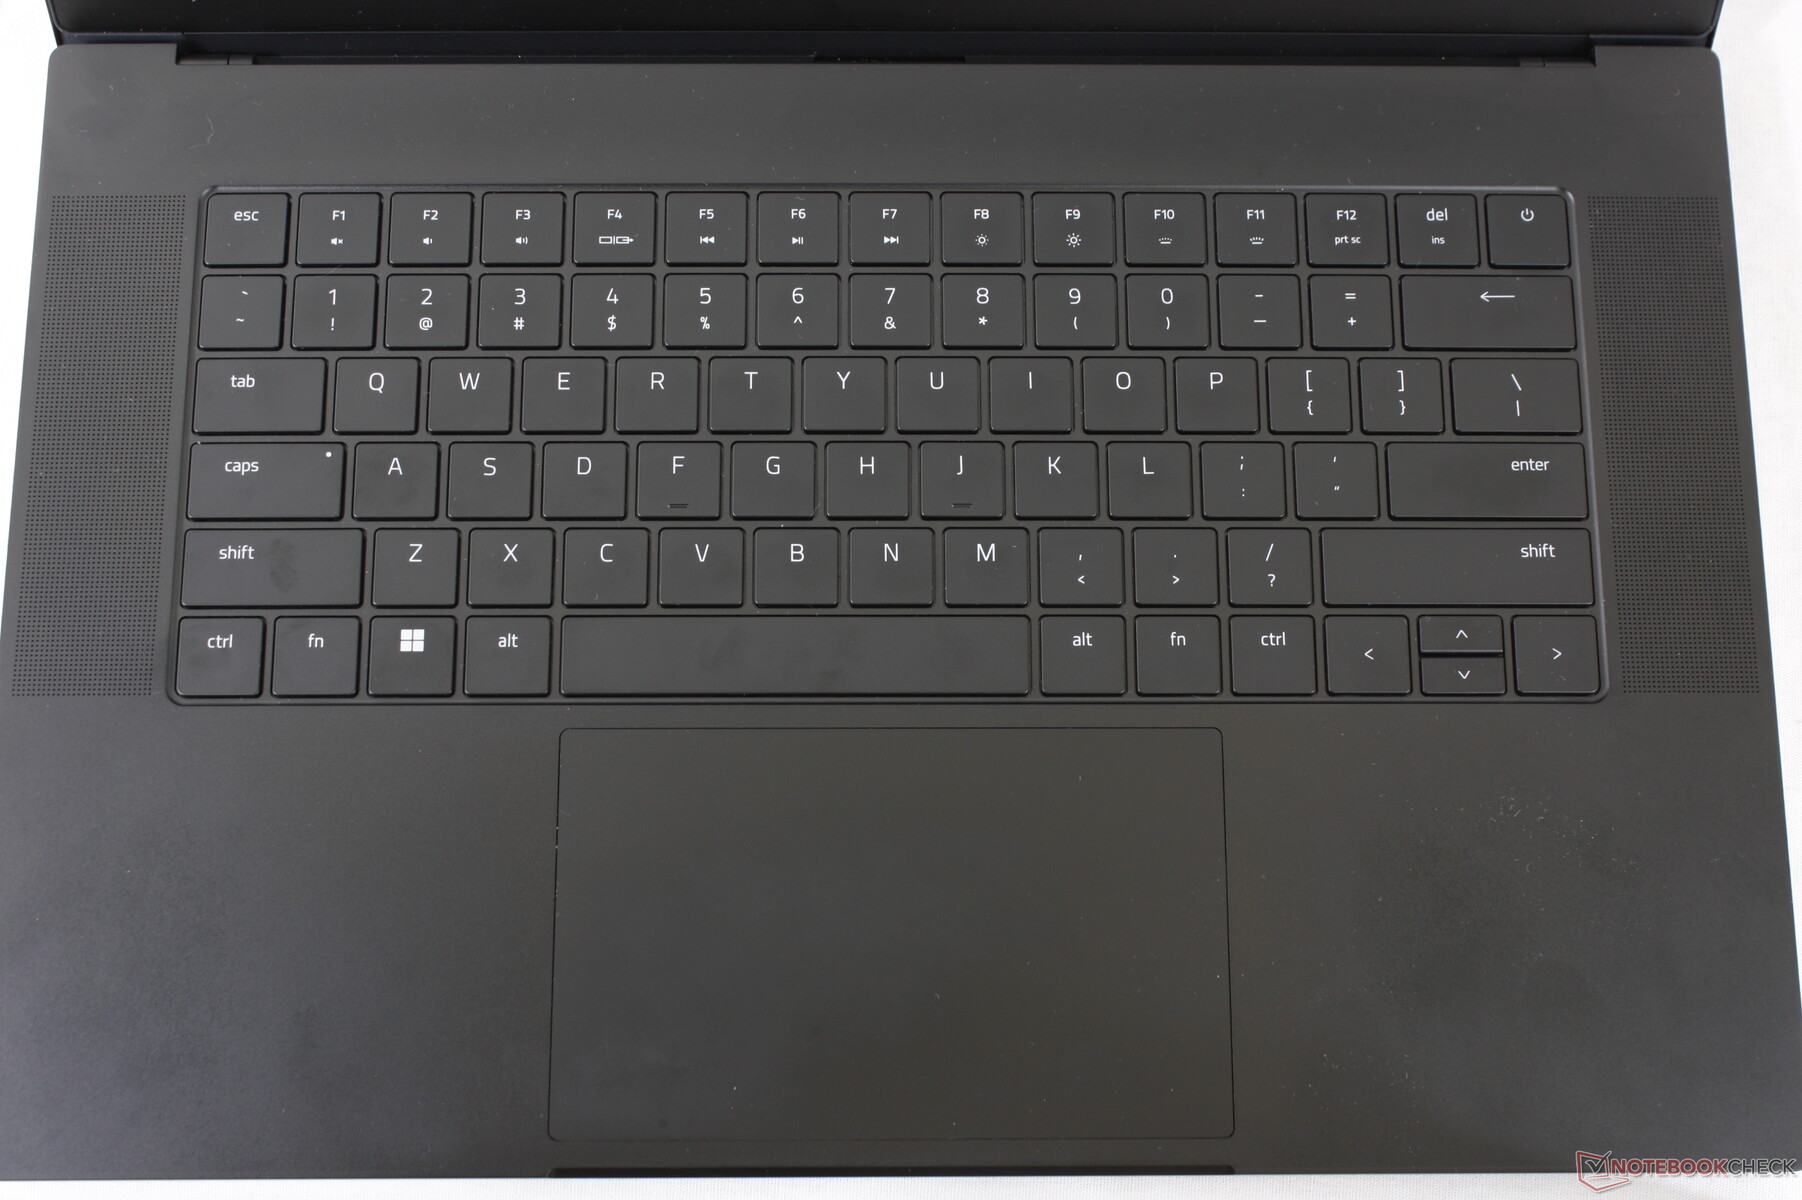
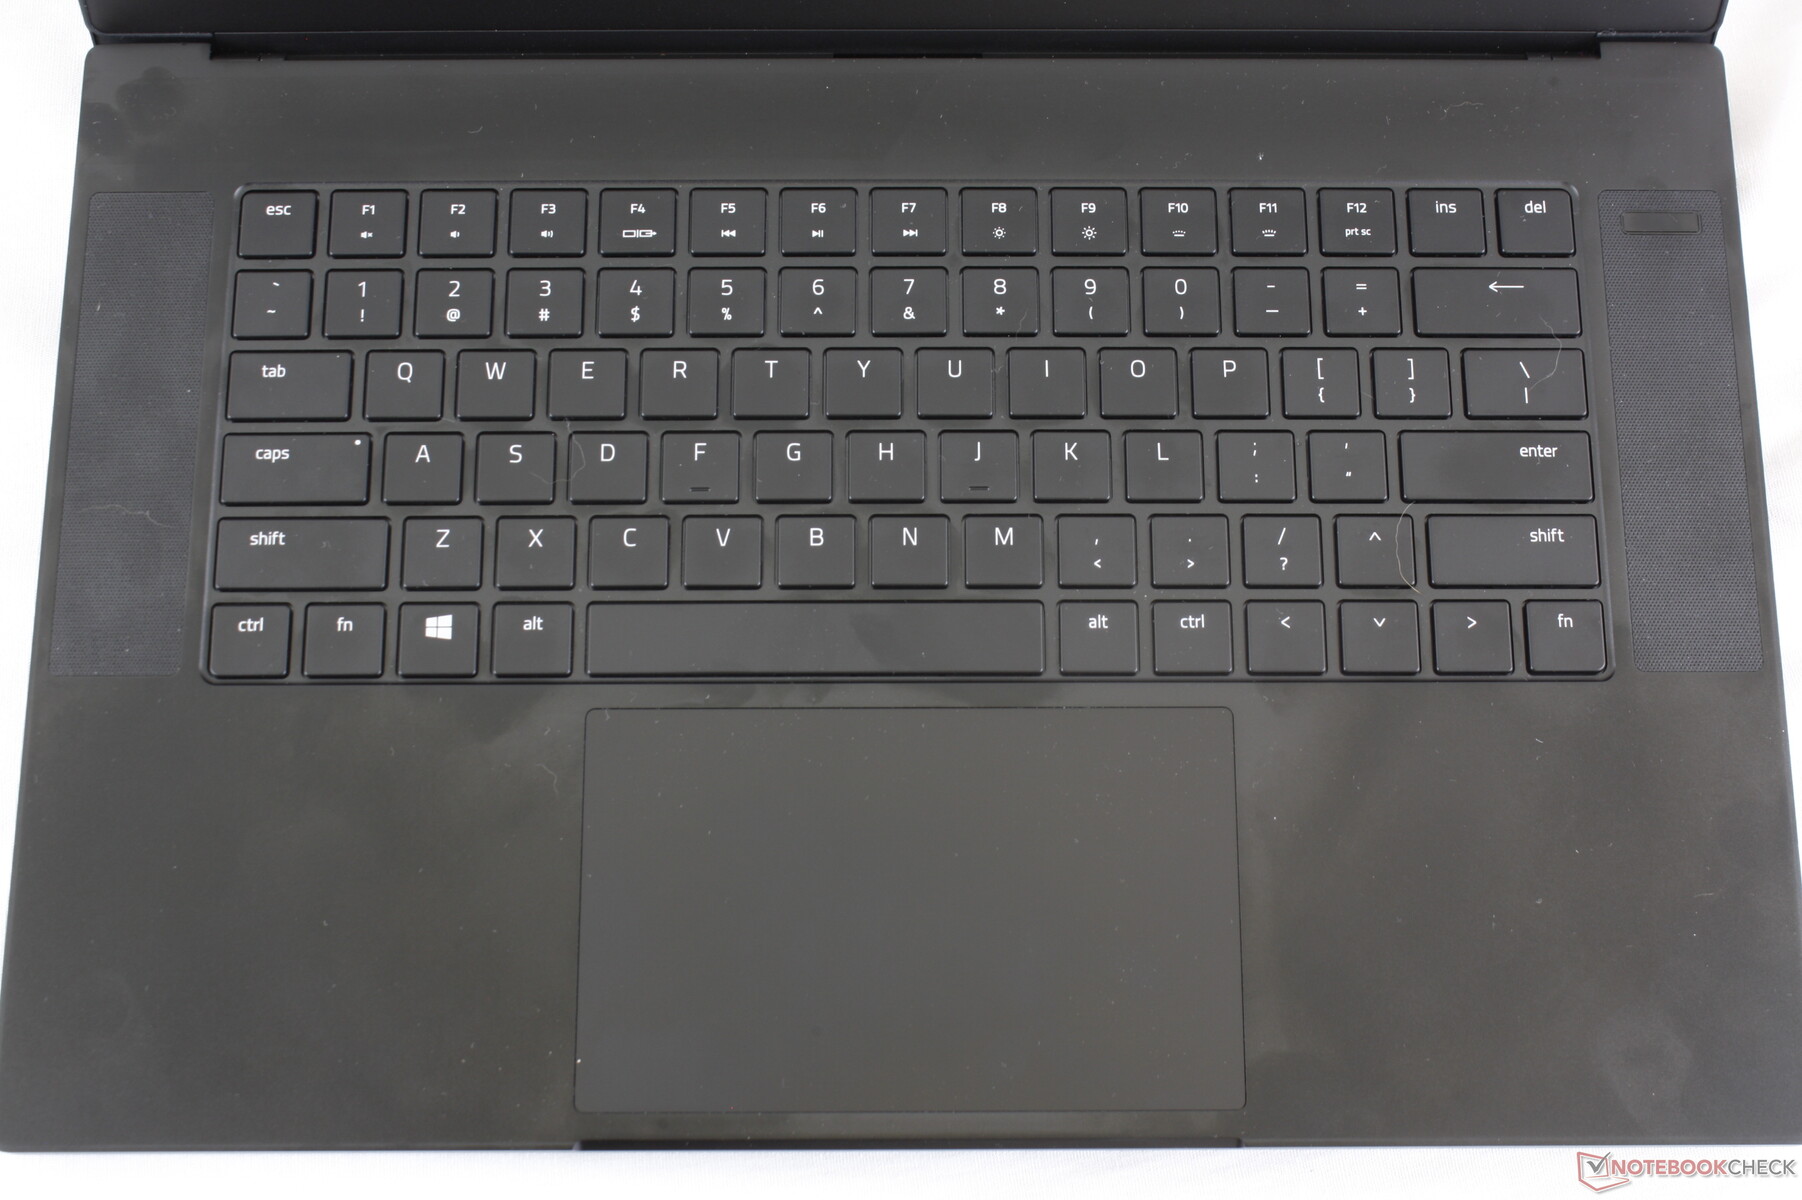
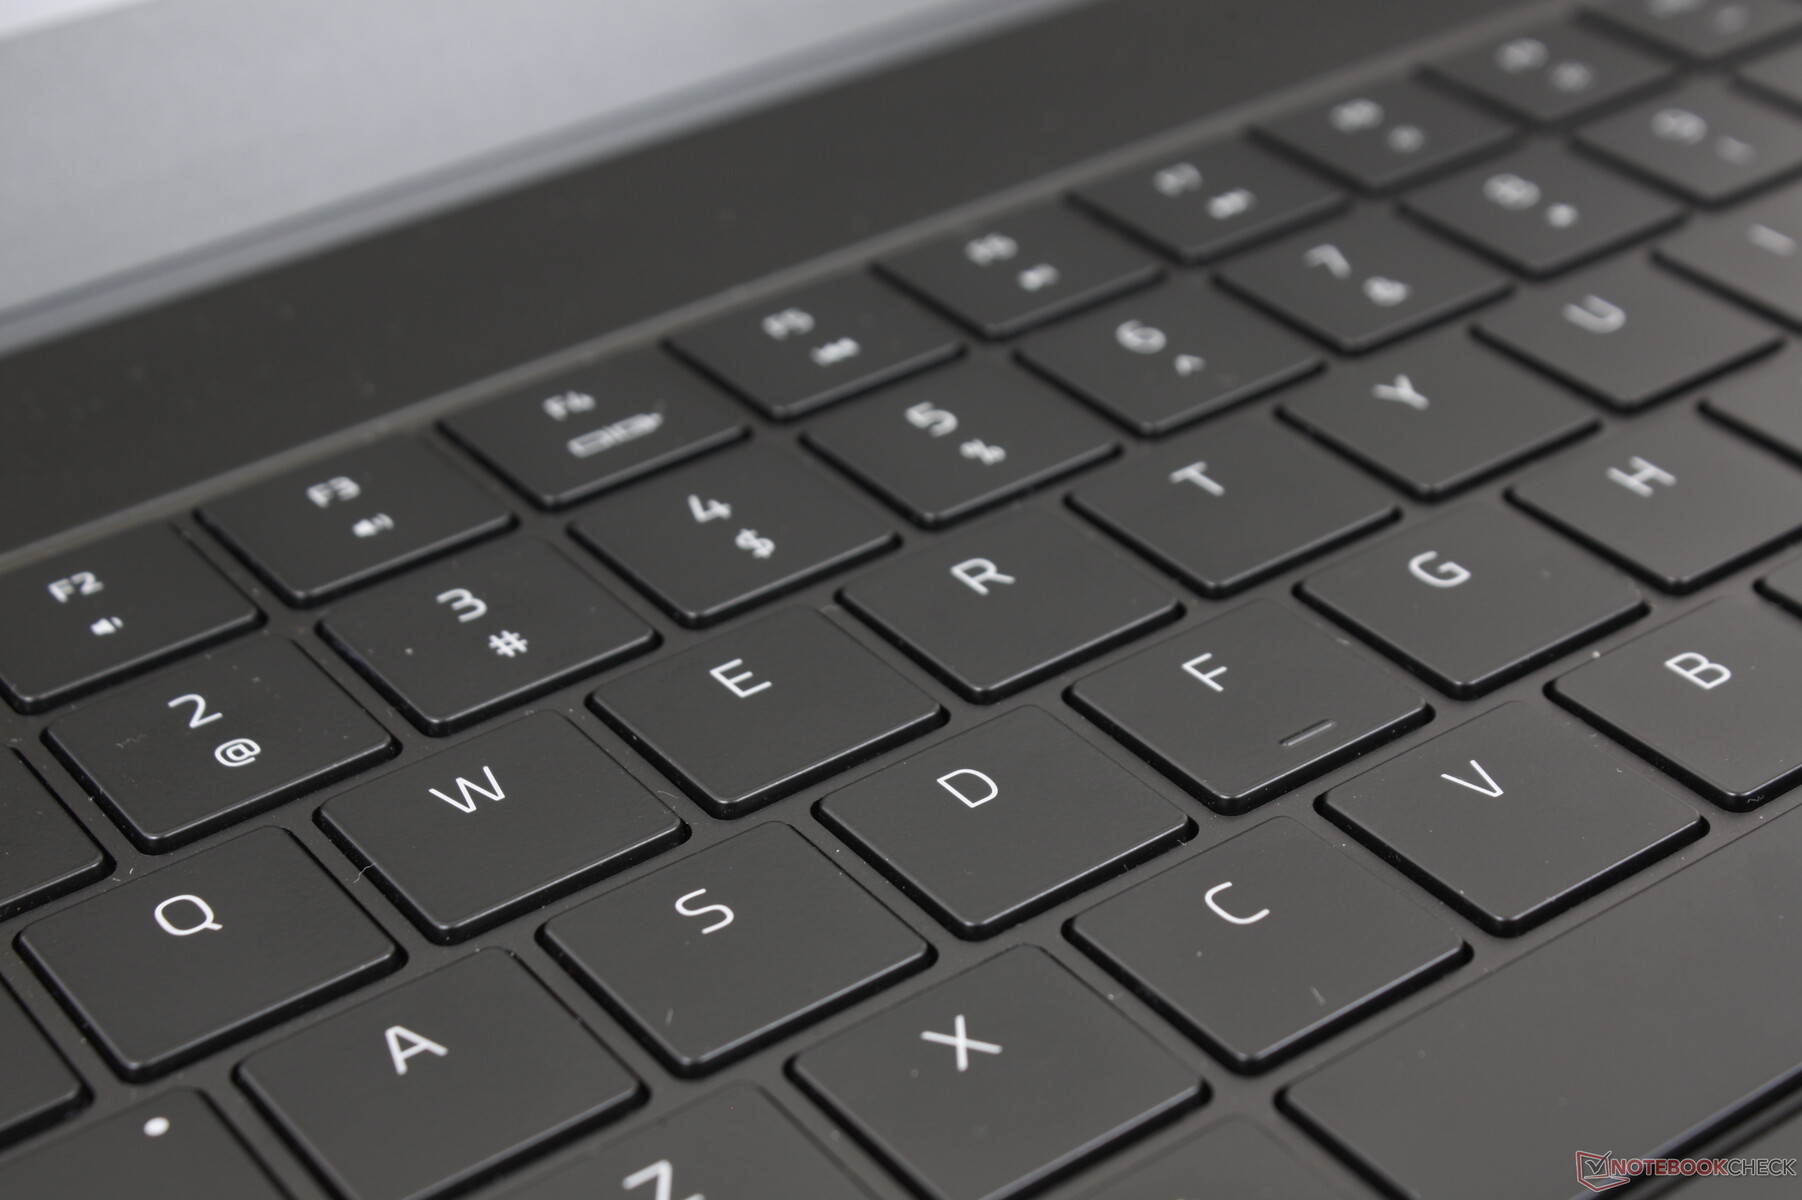
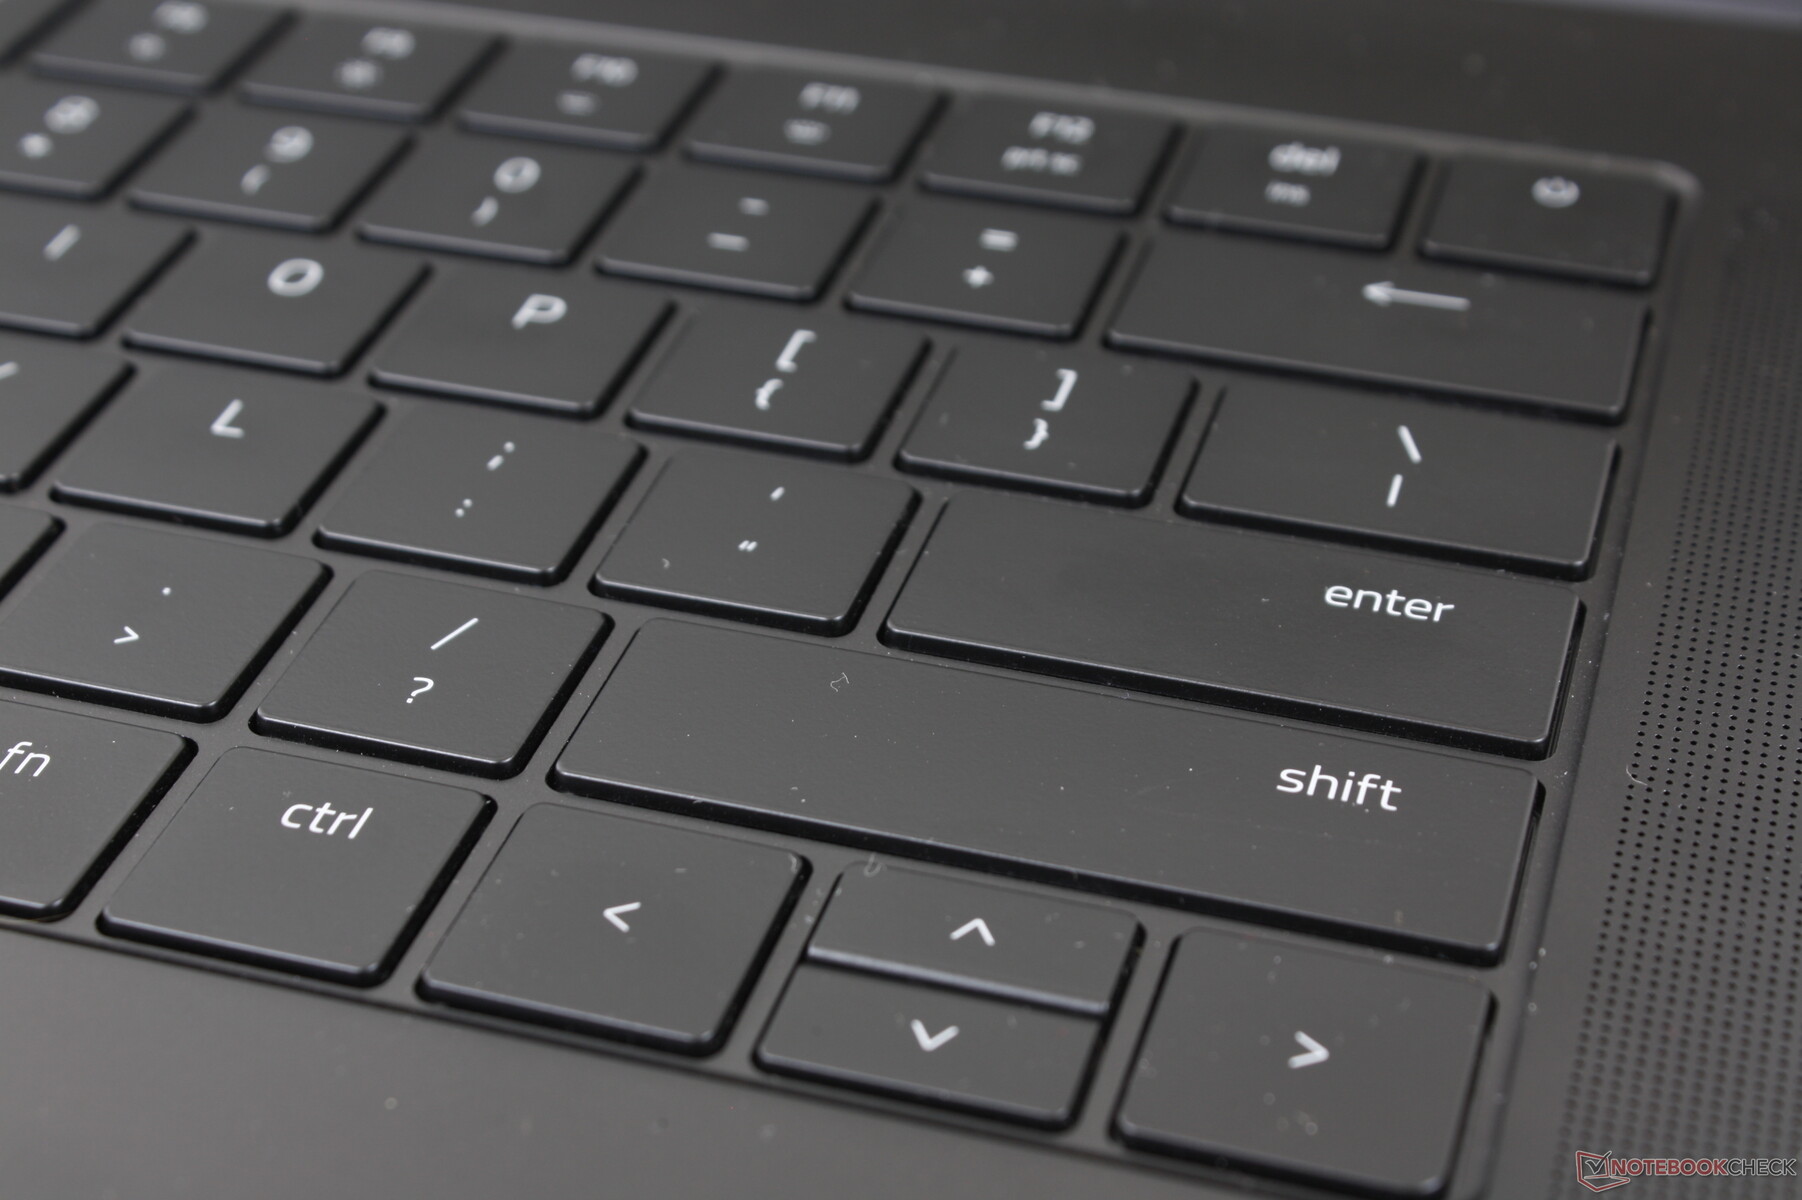
Die einzige physische Änderung sind die neuen Tastenkappen, die nun etwas größer als ihre Vorgänger sind. Der Ein-/Ausschaltknopf befindet sich außerdem an einem neuen Ort, sodass man das 2022er-Modell leicht optisch von früheren Generationen unterscheiden kann.
SD-Kartenleser
| SD Card Reader | |
| average JPG Copy Test (av. of 3 runs) | |
| Razer Blade 15 Advanced Model Early 2021 (AV PRO microSD 128 GB V60) | |
| Razer Blade 15 RTX 2080 Super Max-Q (Toshiba Exceria Pro SDXC 64 GB UHS-II) | |
| Razer Blade 15 2022 (Toshiba Exceria Pro SDXC 64 GB UHS-II) | |
| ADATA XPG Xenia 15 (AV Pro V60) | |
| Schenker XMG Neo 15 E22 (Early 2022, RTX 3080 Ti) | |
| Eurocom Nightsky ARX315 (AV Pro V60) | |
| maximum AS SSD Seq Read Test (1GB) | |
| Razer Blade 15 RTX 2080 Super Max-Q (Toshiba Exceria Pro SDXC 64 GB UHS-II) | |
| Razer Blade 15 Advanced Model Early 2021 (AV PRO microSD 128 GB V60) | |
| Razer Blade 15 2022 (Toshiba Exceria Pro SDXC 64 GB UHS-II) | |
| ADATA XPG Xenia 15 (AV Pro V60) | |
| Eurocom Nightsky ARX315 (AV Pro V60) | |
| Schenker XMG Neo 15 E22 (Early 2022, RTX 3080 Ti) | |
Kommunikation
Als WLAN-Modul kommt das neue Killer AX1690i, also im Prinzip die Gaming-Variante des Intel WLAN-6E-Chips AX210, zum Einsatz.
Webcam


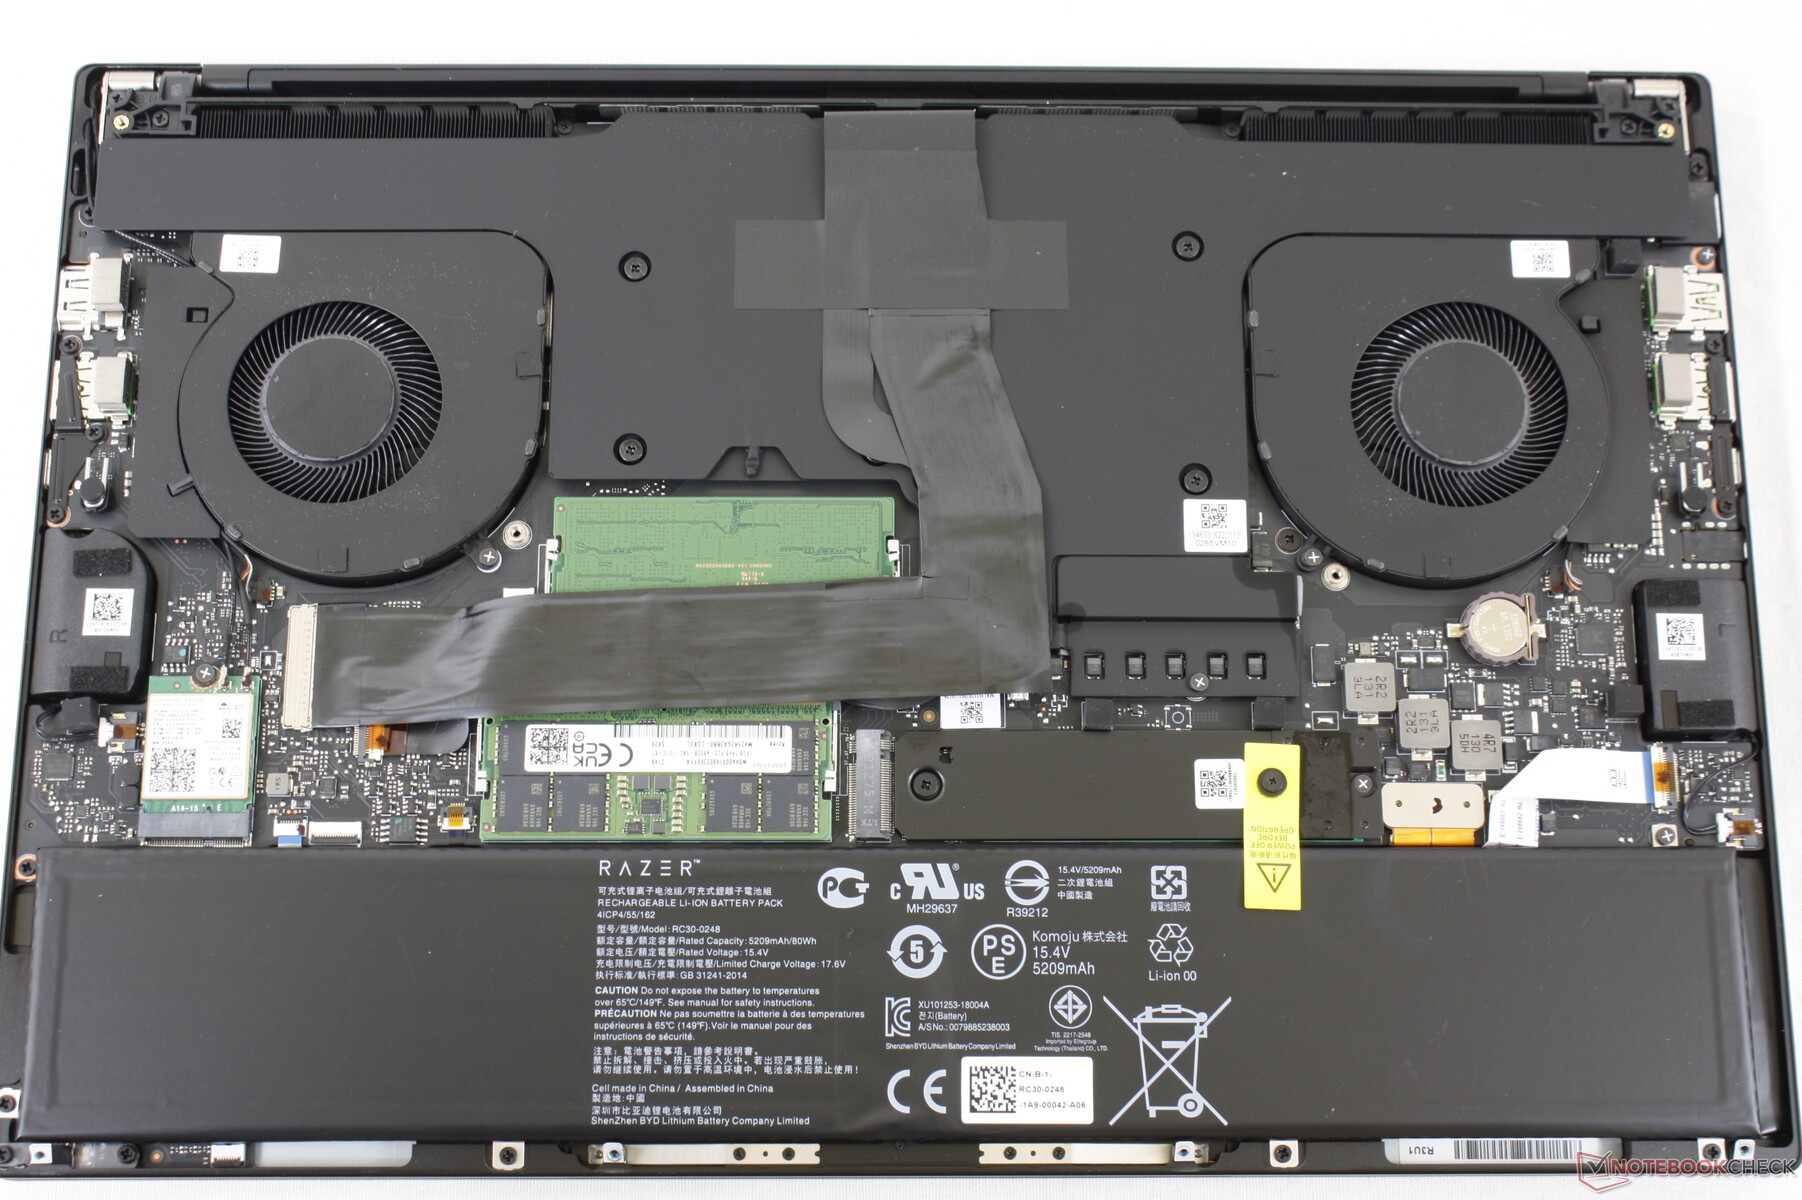
Wartung
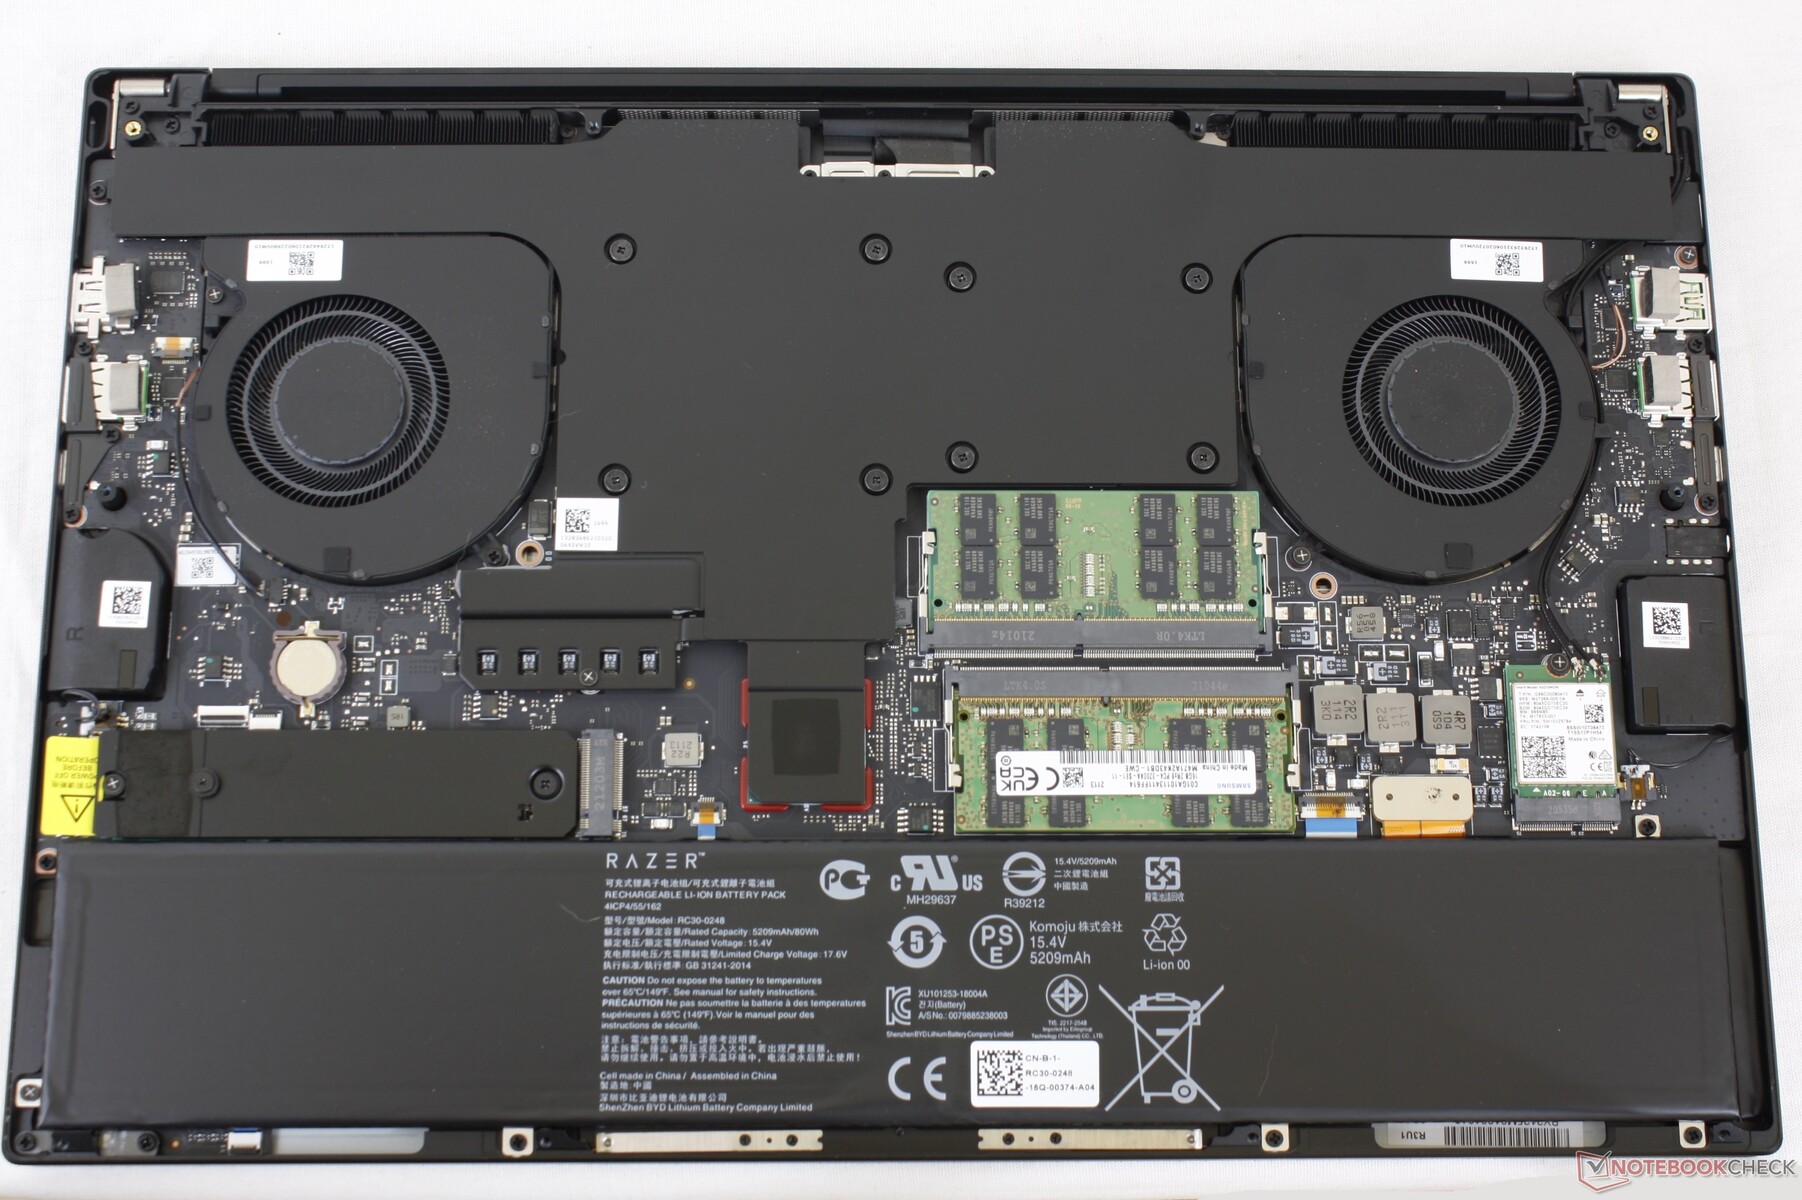
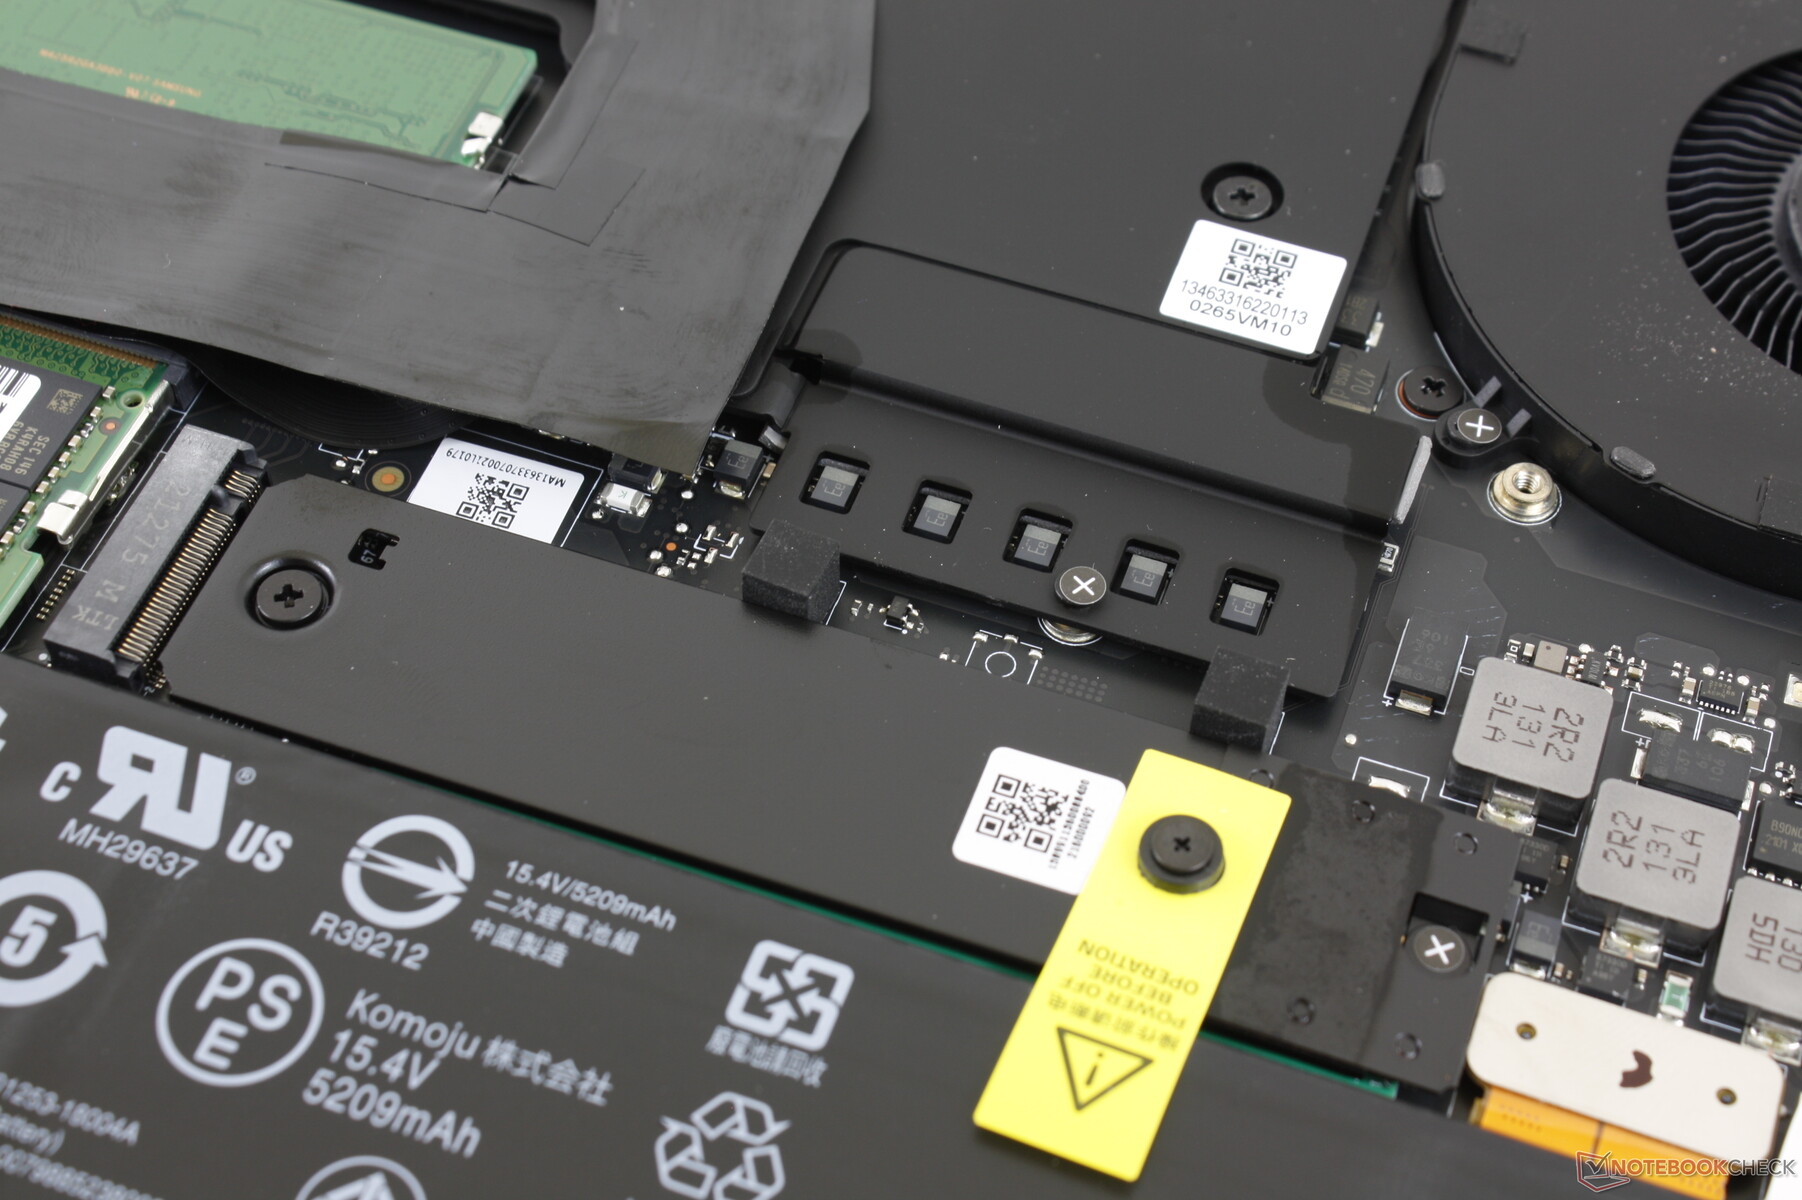
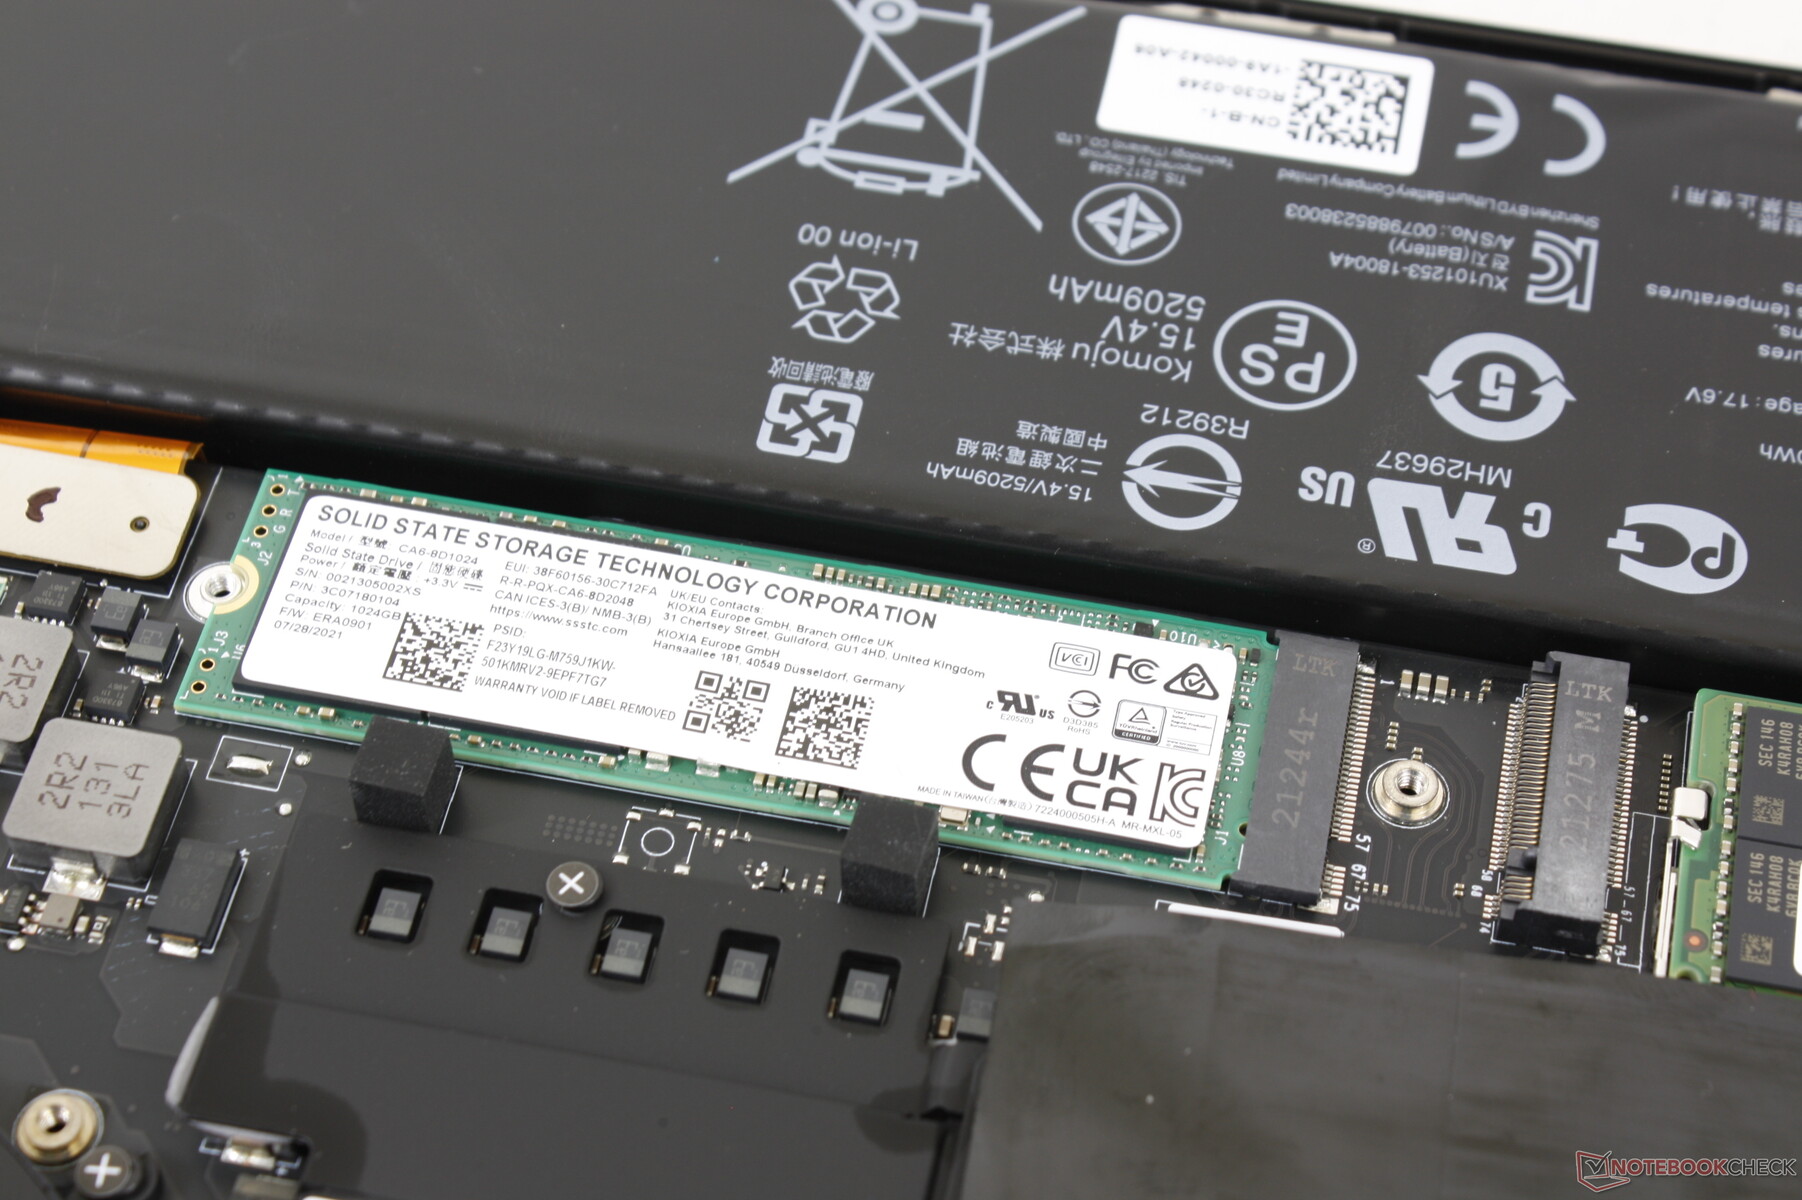
Gegenüber dem Modell aus dem Vorjahr gab es beim Innenleben und den Lüftern geringfügige Änderungen, wie die Bilder unten zeigen. Bei den zwei M.2-2280-PCIe4-Steckplätzen, den zwei SODIMM-Steckplätzen und dem austauschbaren WLAN-Modul gibt es hingegen keine Überraschungen.
Garantie und Zubehör
Im Lieferumfang befinden sich bis auf das Netzteil und den üblichen Papierkram keine Extras.
Abhängig davon, wo man den Laptop erwirbt, gelten eine einjährige Basisgarantie und eine zweijährige Akkugarantie oder die standardmäßige, zweijährige Garantiezeit. Die zweijährige Akkugarantie ist derzeit kein Bestandteil älterer Modelle.
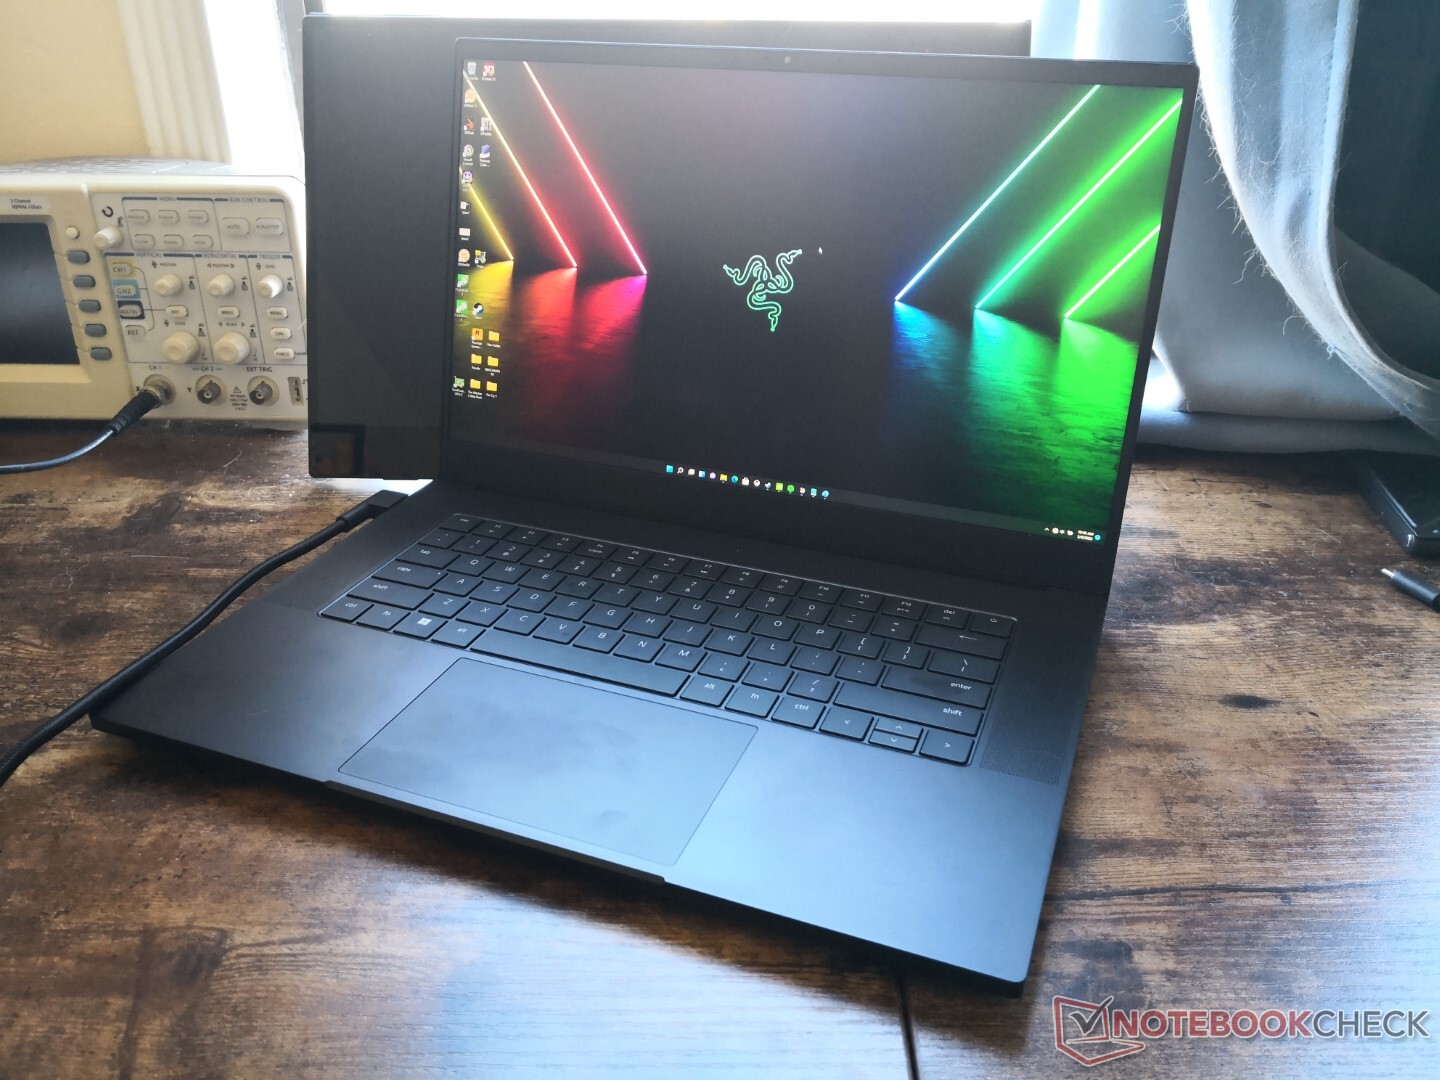
Eingabegeräte
Während beim großen ClickPad alles beim Alten bleibt, hat Razer die Tastatur des Blade 15 2022 mit etwas größeren Tastenkappen als bei vorherigen Modellen bestückt, um Tippfehler zu verhindern. Dadurch gibt es weniger Platz zwischen den Tasten. Der Tastenhub und -widerstand sind jedoch mit dem des Vorgängers identisch.
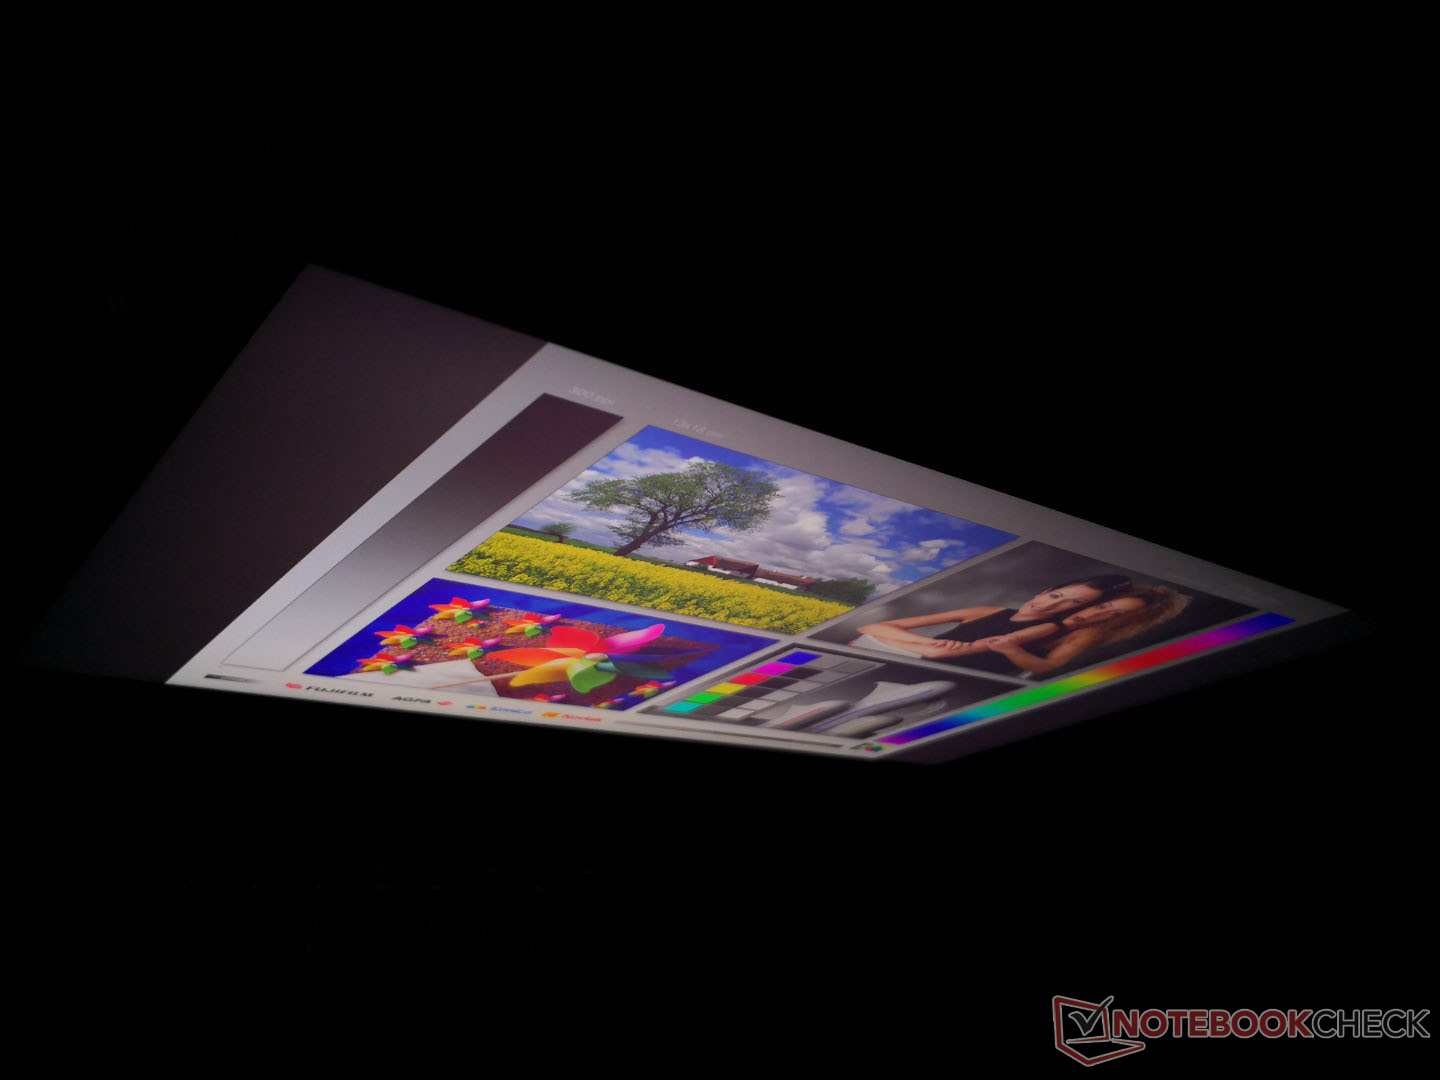
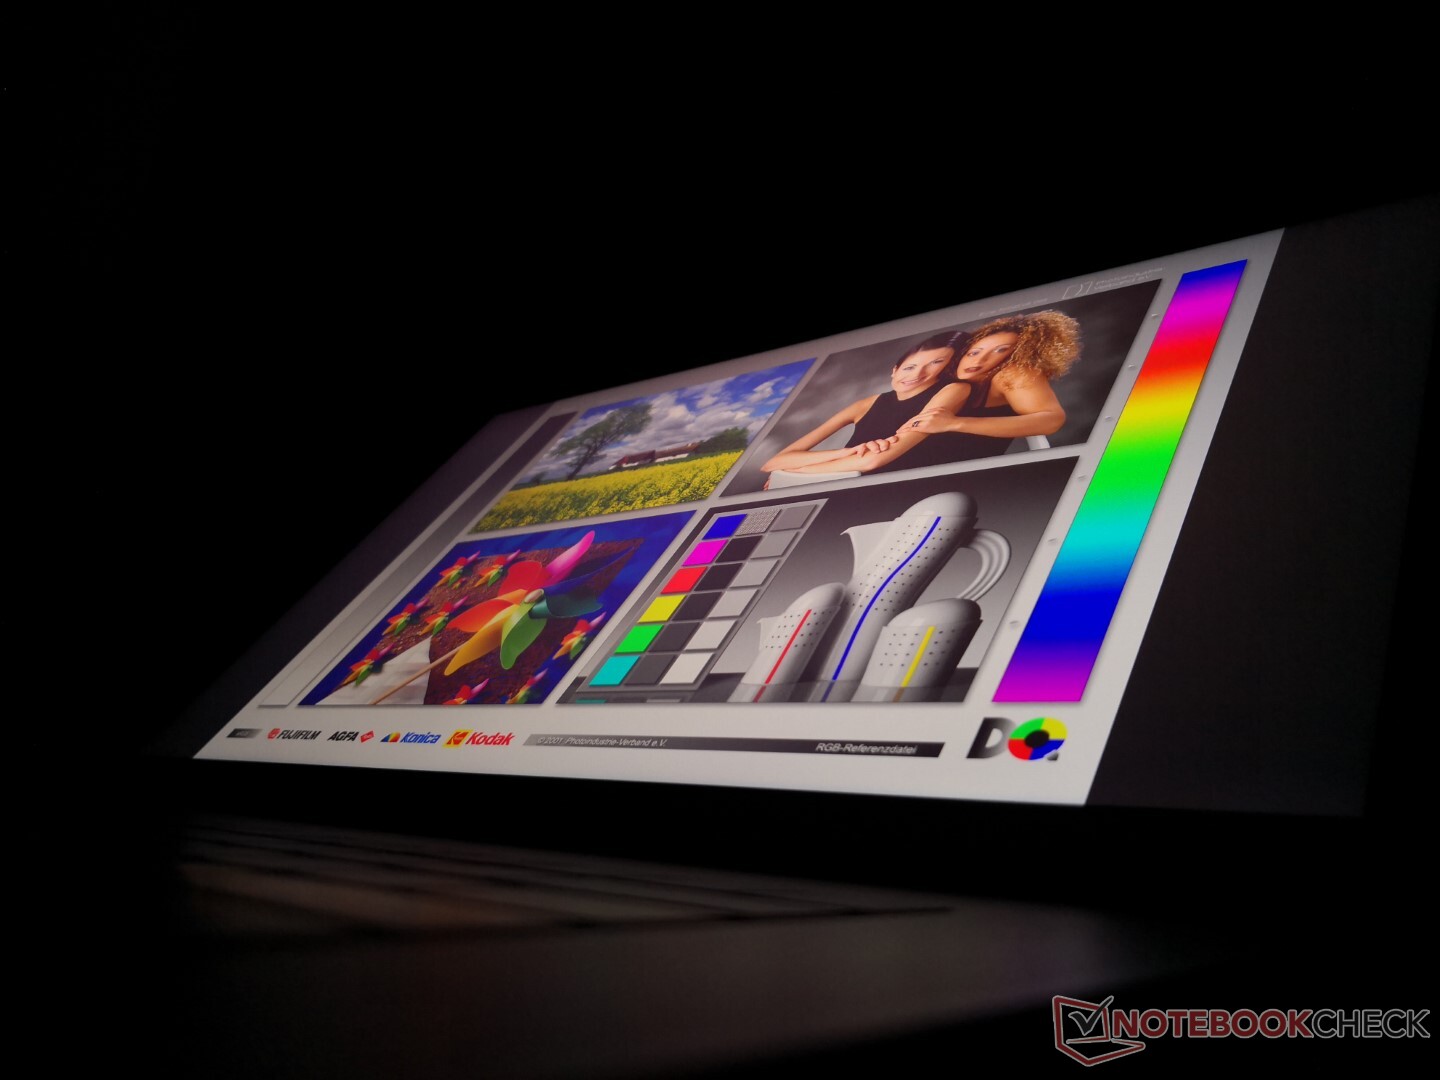
Display
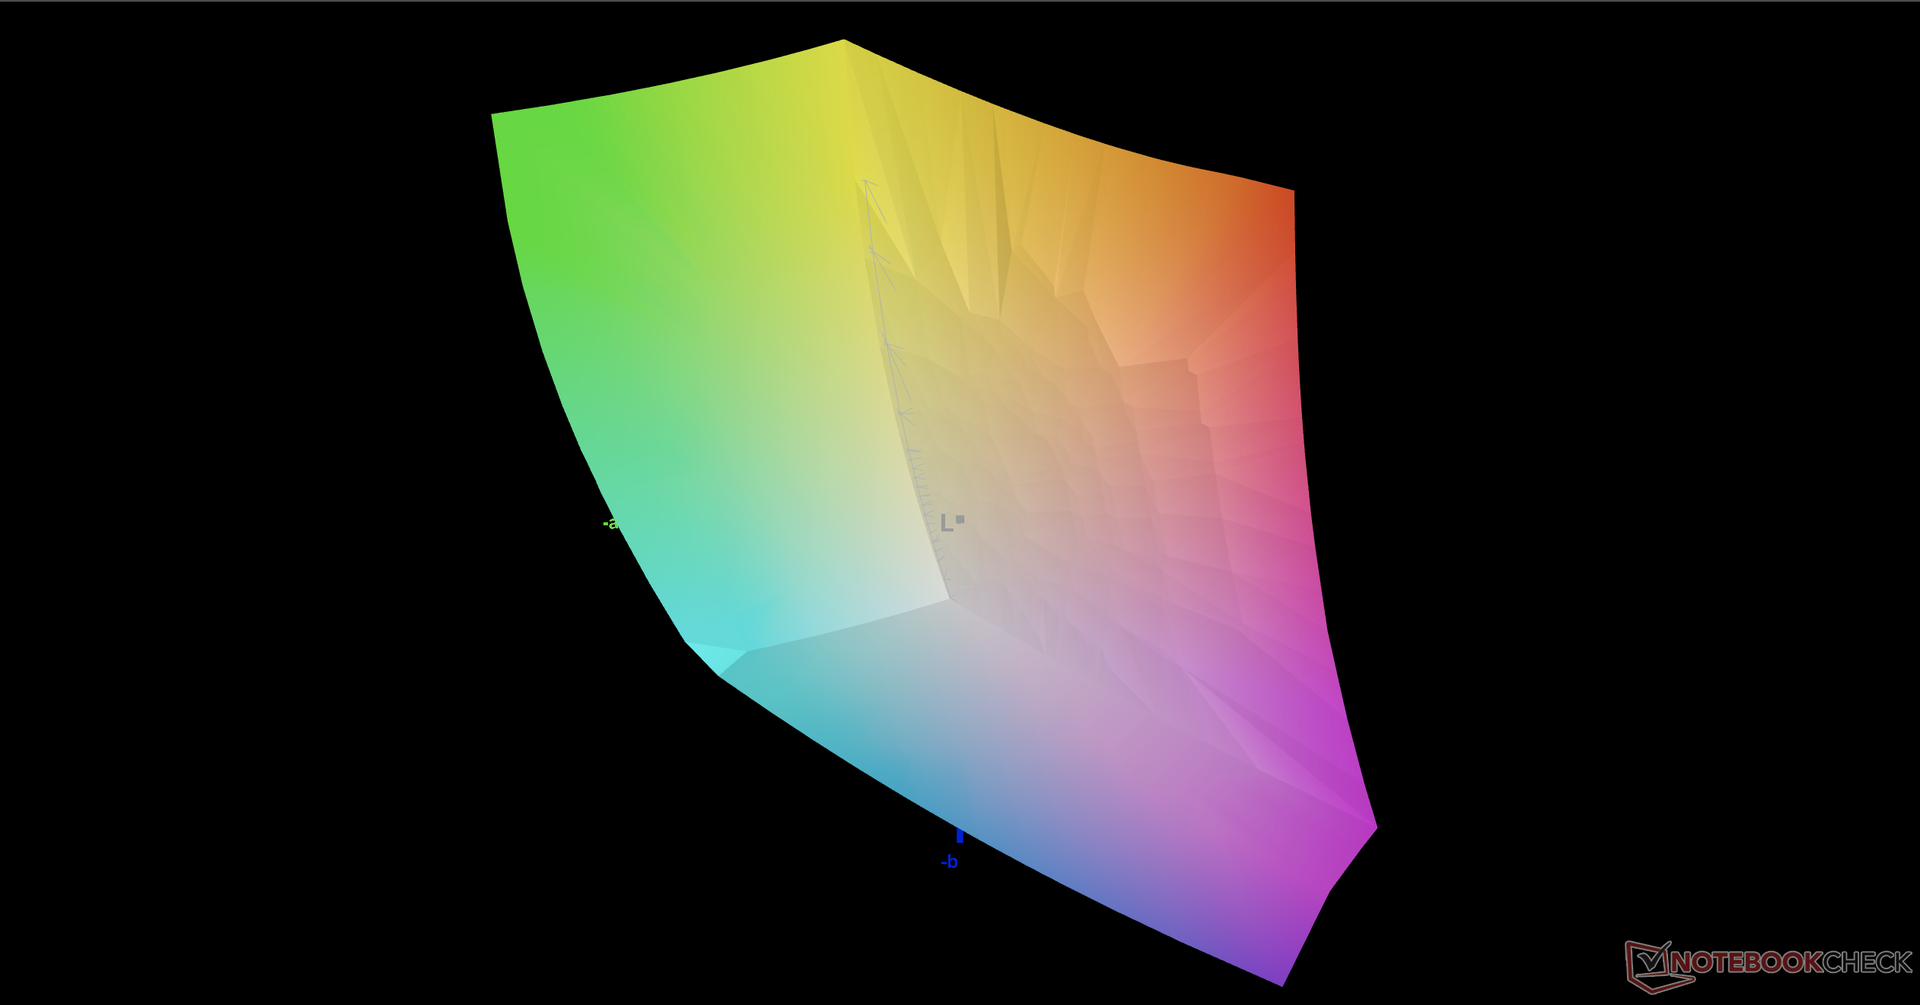
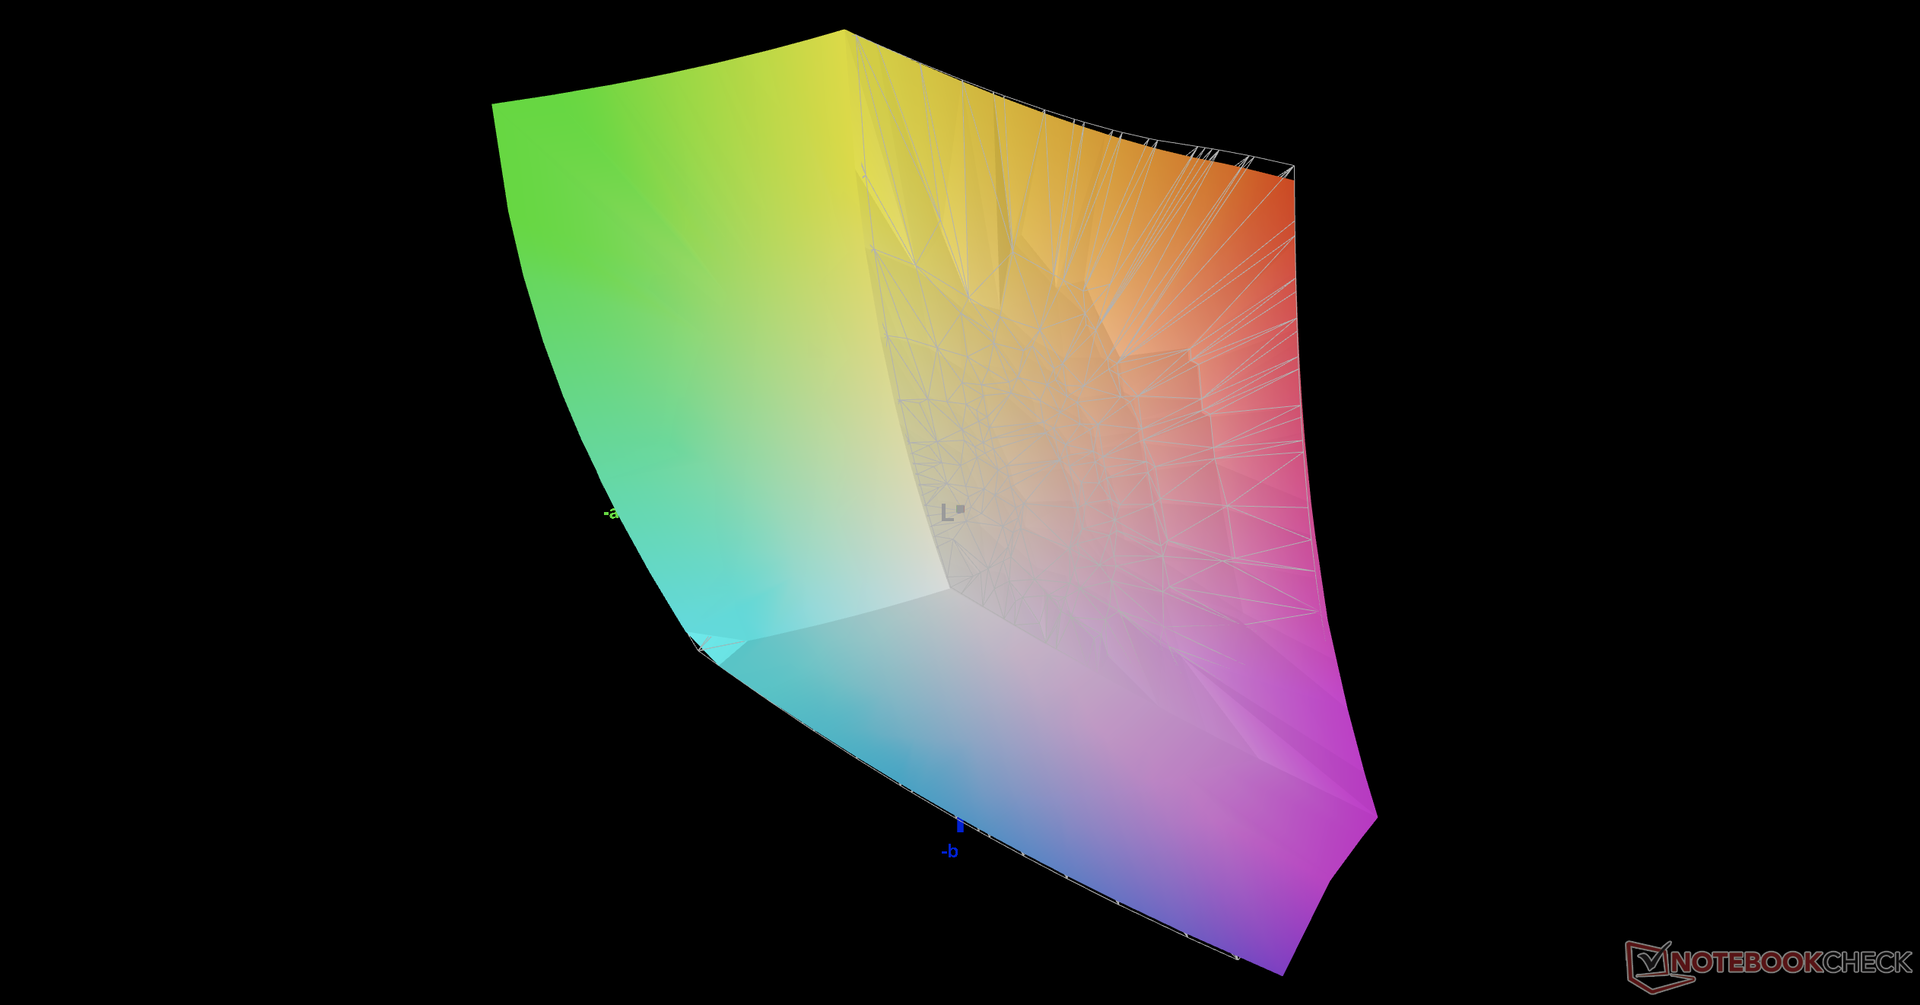
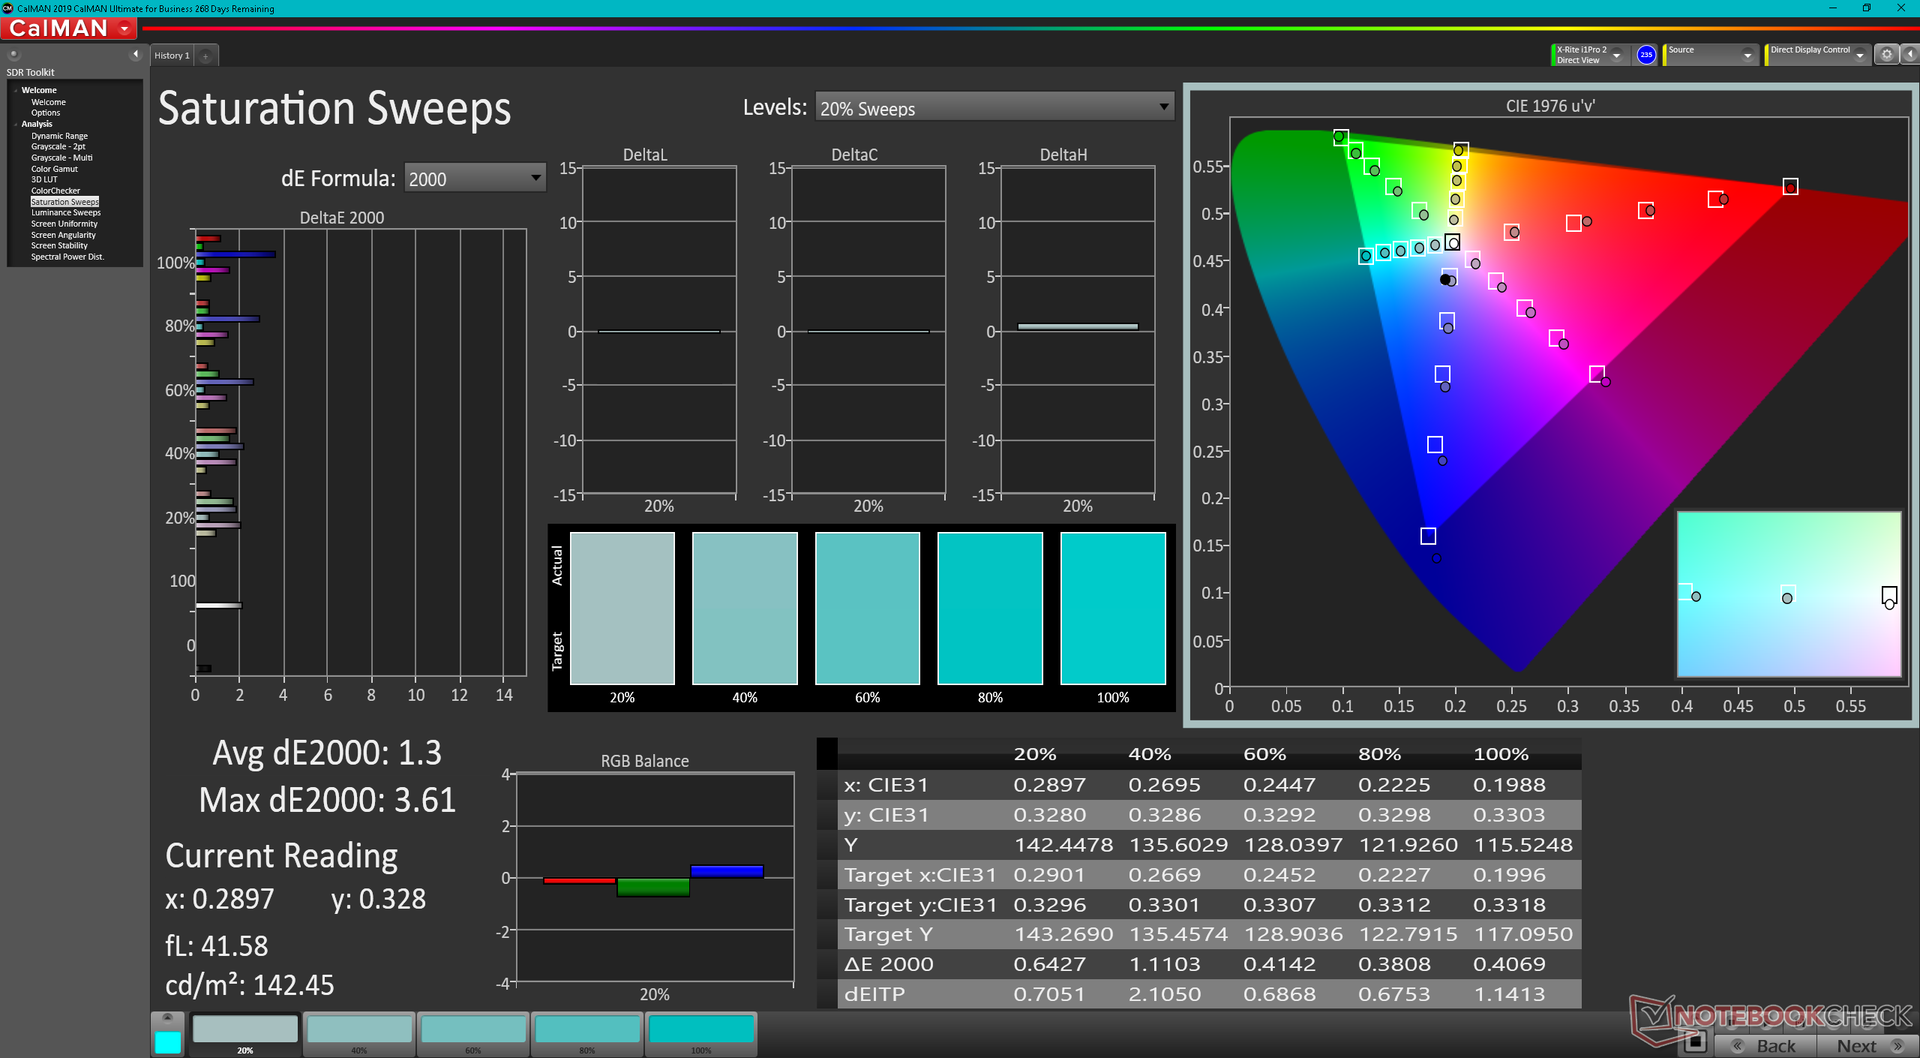
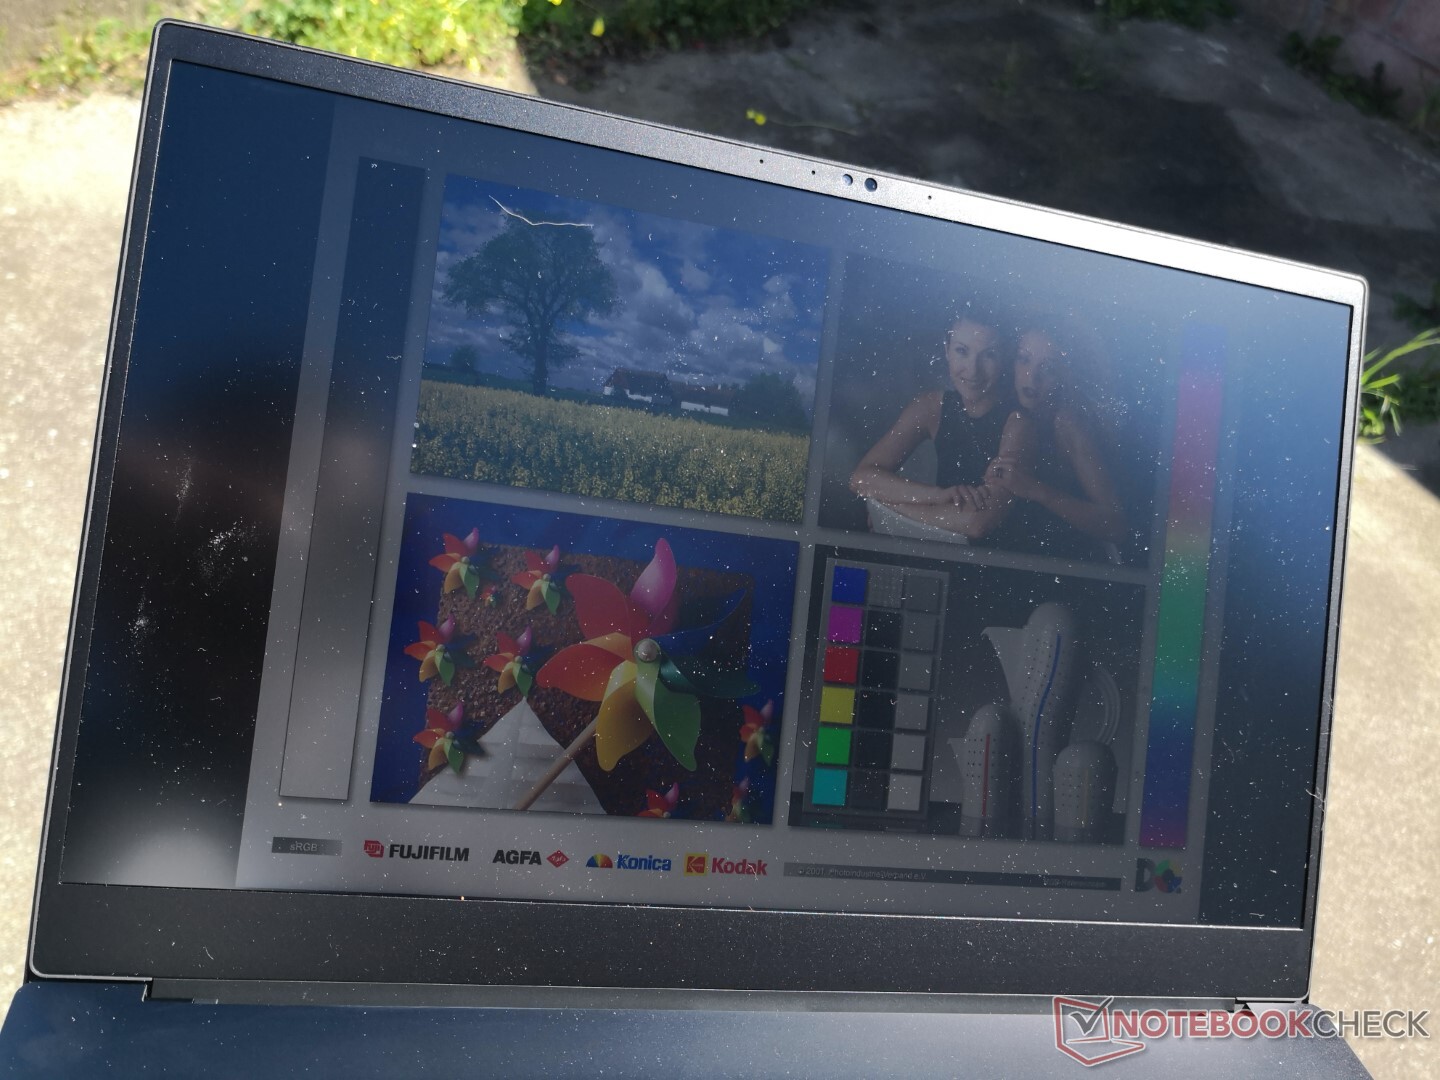
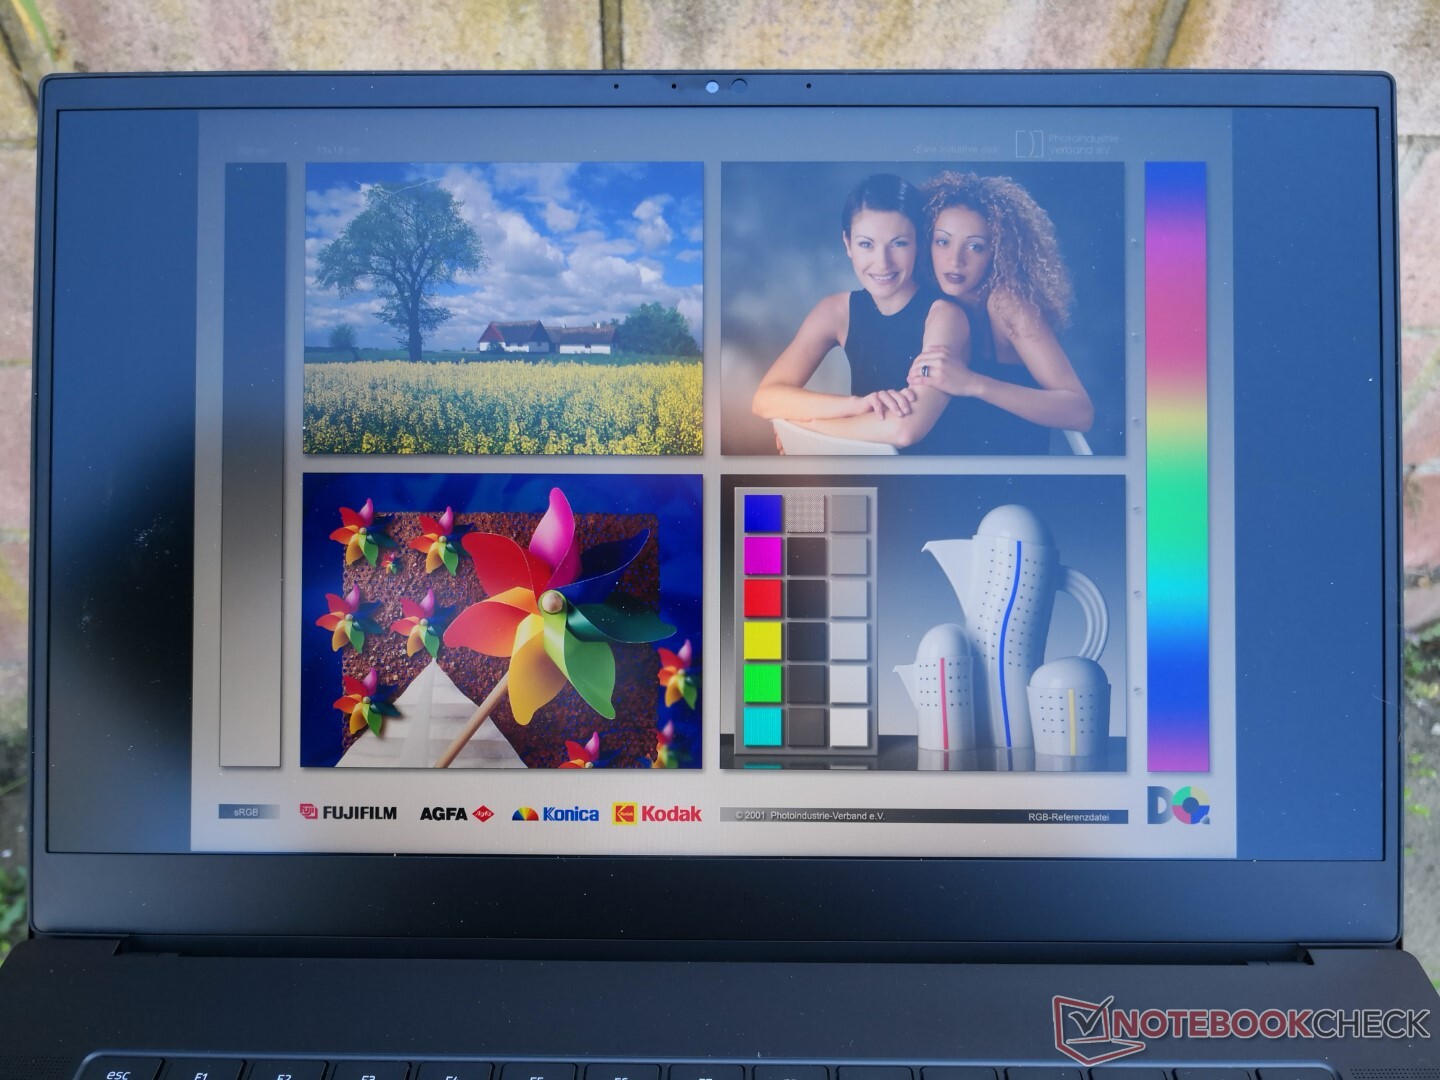
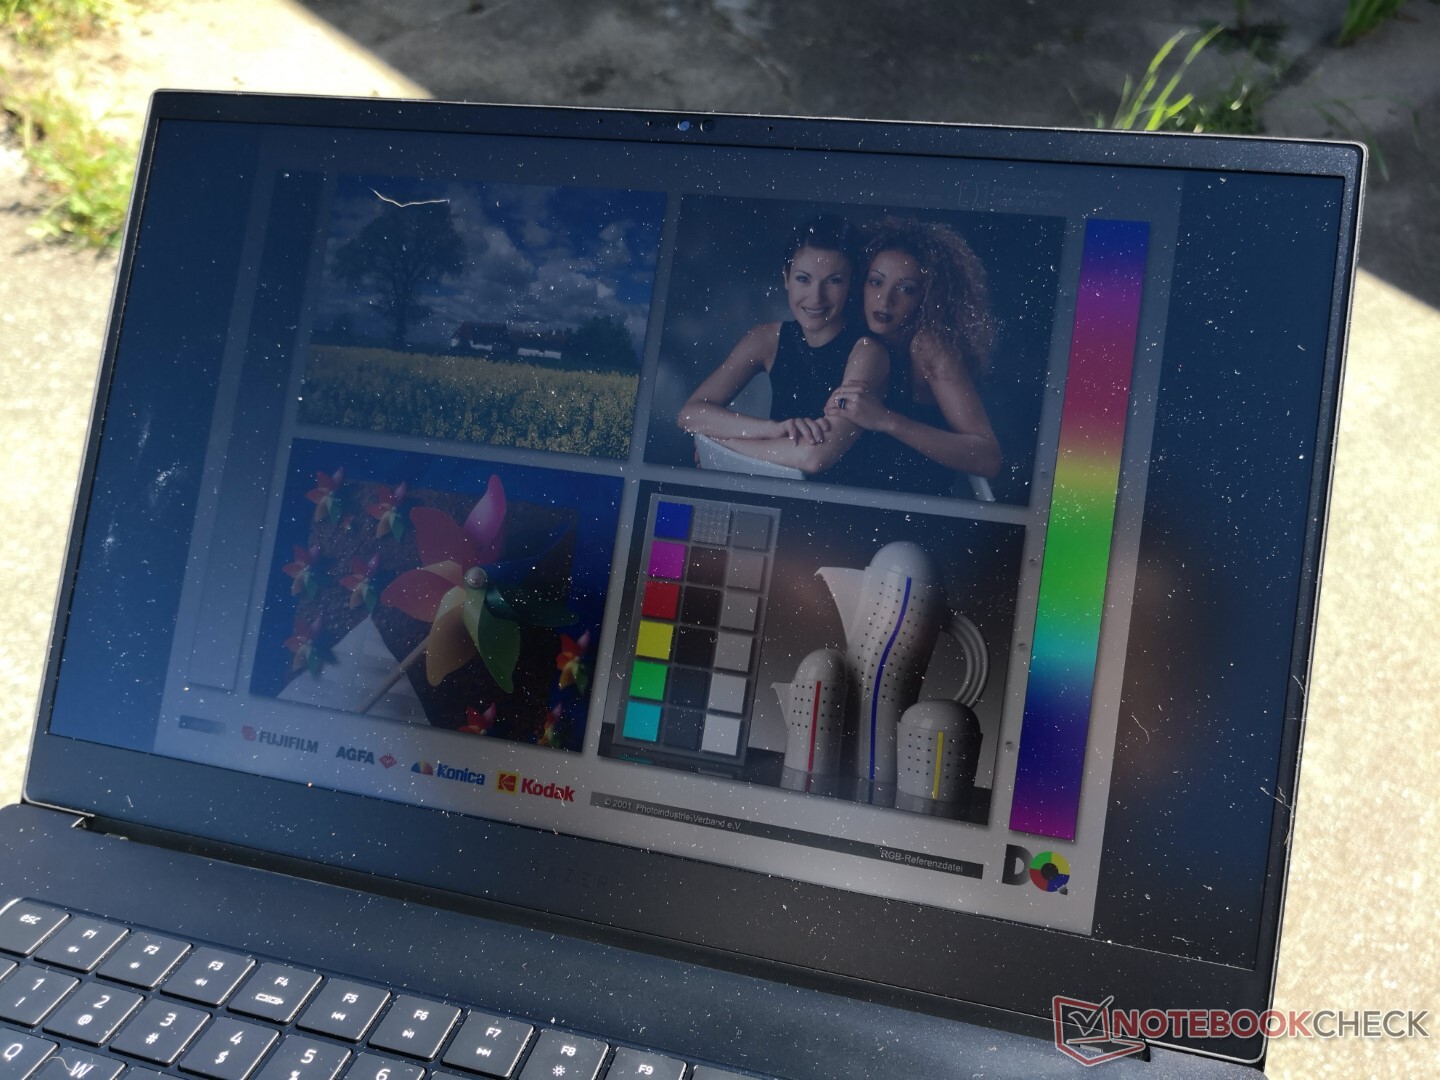
Das Blade 15 ist einer der wenigen 15,6-Zoll-Laptops mit einem 1440p-Panel mit 240 Hz und vollständiger DCI-P3-Abdeckung. Das 1440p-165-Hz-Panel des Xenia 15 bietet beispielsweise eine vollständige sRGB-Abdeckung, kann allerdings nur 68 % des DCI-P3-Farbraums darstellen. Da die Schwarz-zu-Weiß- und Grau-zu-Grau-Reaktionszeiten hier außerdem sehr gut sind, eignet sich das Panel sowohl fürs Gaming als auch für die digitale Medienbearbeitung. Bisher war man beim Blade 15 auf die 4K-UHD-Option beschränkt, wenn man in den Genuss der vollständigen DCI-P3-Farbraumabdeckung kommen wollte.

| |||||||||||||||||||||||||
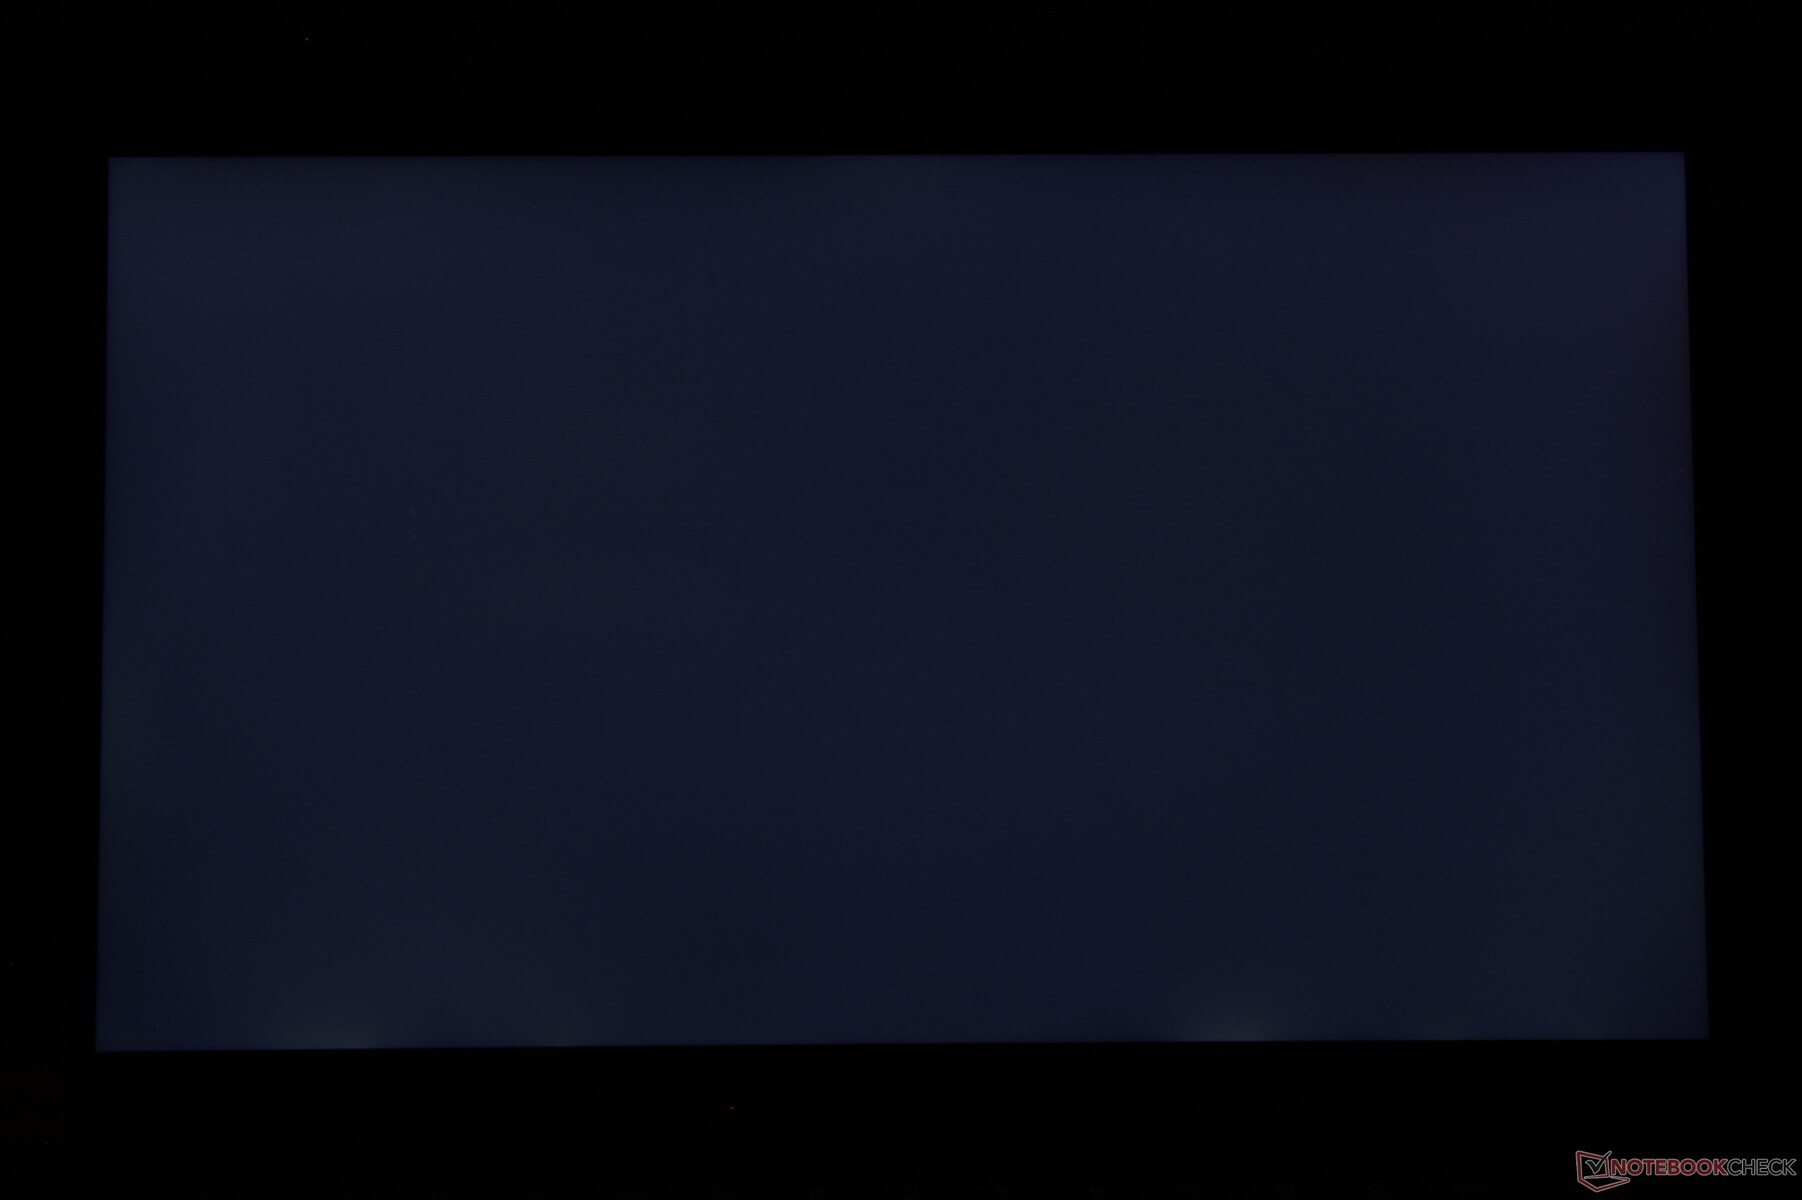
Ausleuchtung: 89 %
Helligkeit Akku: 286 cd/m²
Kontrast: 1144:1 (Schwarzwert: 0.25 cd/m²)
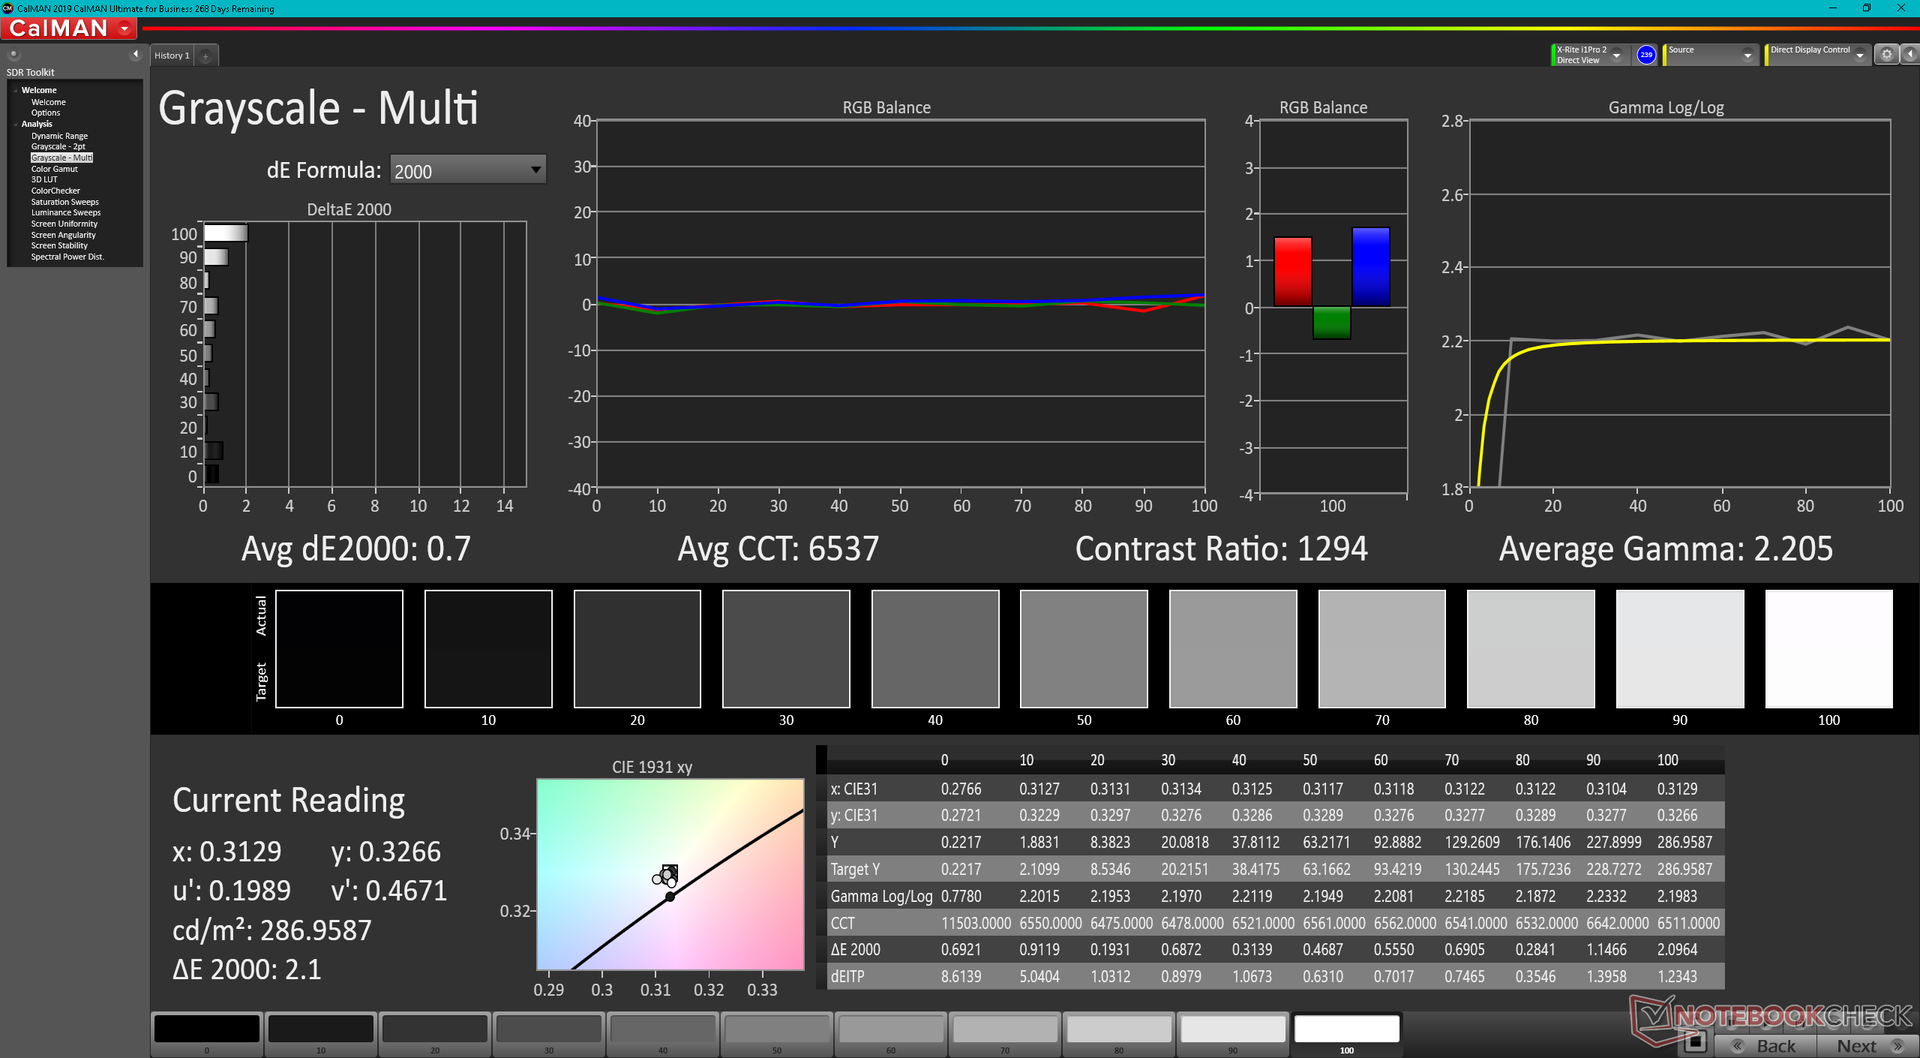
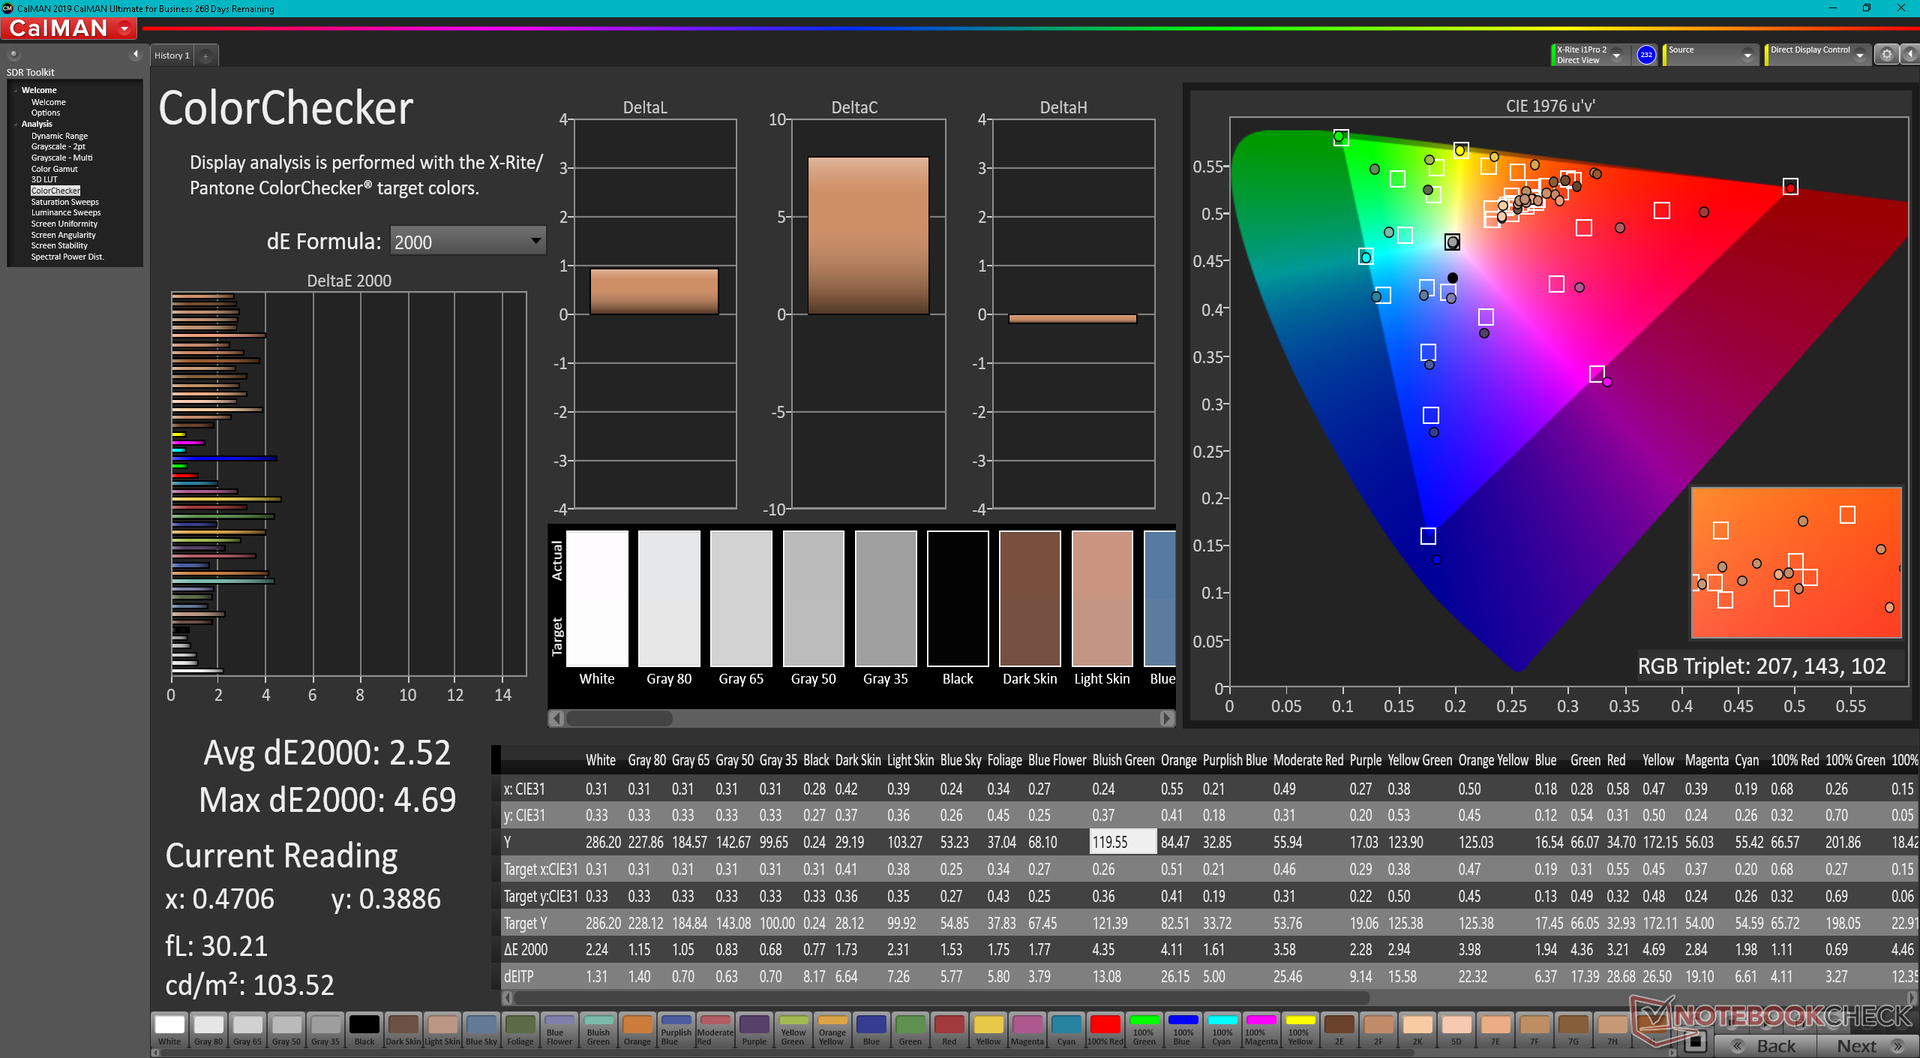
ΔE ColorChecker Calman: 2.74 | ∀{0.5-29.43 Ø4.71}
calibrated: 2.52
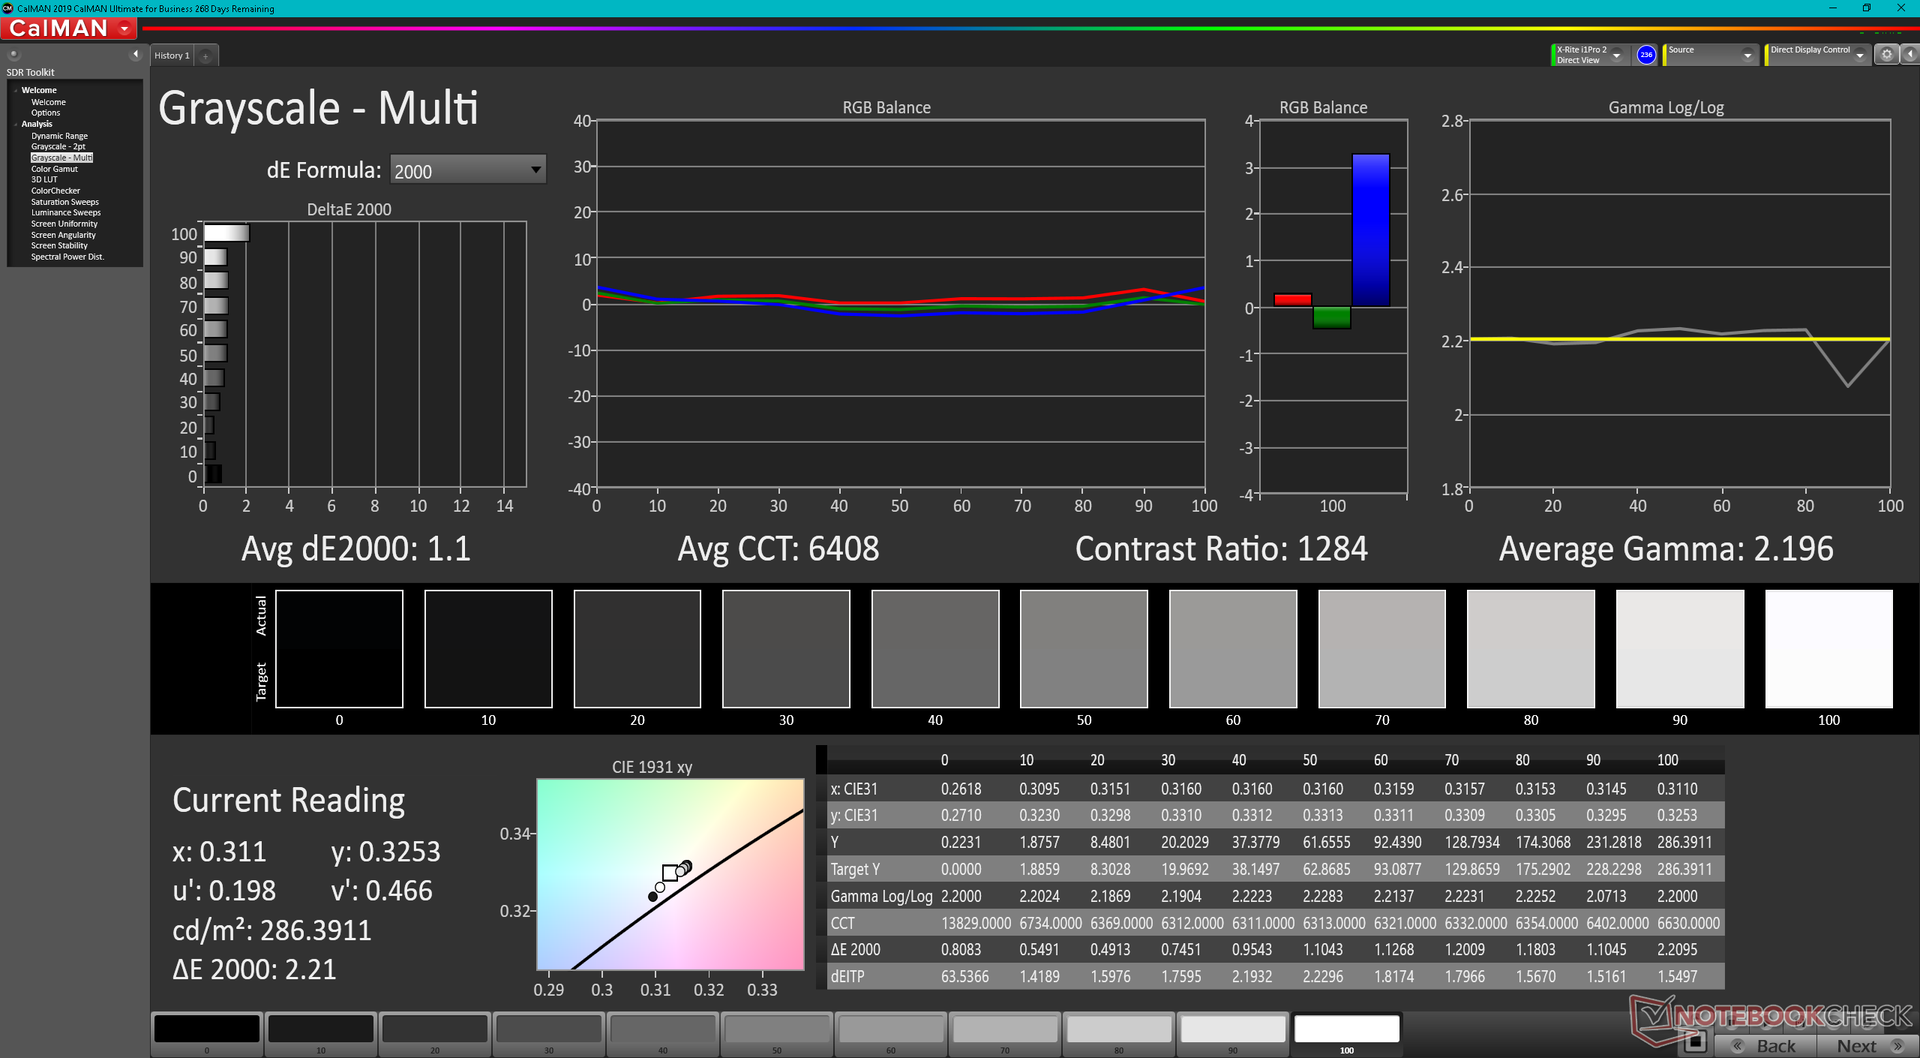
ΔE Greyscale Calman: 1.1 | ∀{0.09-98 Ø4.96}
86.8% AdobeRGB 1998 (Argyll 3D)
99.9% sRGB (Argyll 3D)
99.1% Display P3 (Argyll 3D)
Gamma: 2.2
CCT: 6408 K
| Razer Blade 15 2022 Sharp LQ156T1JW03, IPS, 2560x1440, 15.6" | Razer Blade 15 Advanced Model Early 2021 TL156VDXP02-0, IPS, 1920x1080, 15.6" | Razer Blade 15 RTX 2080 Super Max-Q AU Optronics B156HAN12.0, IPS, 1920x1080, 15.6" | Schenker XMG Neo 15 E22 (Early 2022, RTX 3080 Ti) BOE0A67 (BOE CQ NE156QHM-NZ1), IPS, 2560x1440, 15.6" | ADATA XPG Xenia 15 BOE CQ NE156QHM-NY2, IPS, 2560x1440, 15.6" | Eurocom Nightsky ARX315 Sharp LQ156M1JW03, IPS, 1920x1080, 15.6" | |
|---|---|---|---|---|---|---|
| Display | -20% | -16% | -18% | -15% | ||
| Display P3 Coverage (%) | 99.1 | 65.9 -34% | 70.2 -29% | 68.2 -31% | 67.9 -31% | |
| sRGB Coverage (%) | 99.9 | 96.4 -4% | 99 -1% | 98.1 -2% | 99.7 0% | |
| AdobeRGB 1998 Coverage (%) | 86.8 | 68 -22% | 71.4 -18% | 69.1 -20% | 73.7 -15% | |
| Response Times | -1% | 40% | 4% | 2% | -2% | |
| Response Time Grey 50% / Grey 80% * (ms) | 14.4 ? | 16 ? -11% | 6 ? 58% | 14.4 ? -0% | 13.6 ? 6% | 15.2 ? -6% |
| Response Time Black / White * (ms) | 11.6 ? | 10.4 ? 10% | 9 ? 22% | 10.8 ? 7% | 12 ? -3% | 11.2 ? 3% |
| PWM Frequency (Hz) | 23150 ? | |||||
| Bildschirm | 20% | -6% | -28% | -62% | -38% | |
| Helligkeit Bildmitte (cd/m²) | 286 | 338 18% | 347 21% | 295 3% | 321.1 12% | 312.8 9% |
| Brightness (cd/m²) | 271 | 334 23% | 328 21% | 277 2% | 308 14% | 294 8% |
| Brightness Distribution (%) | 89 | 94 6% | 89 0% | 62 -30% | 82 -8% | 90 1% |
| Schwarzwert * (cd/m²) | 0.25 | 0.24 4% | 0.285 -14% | 0.28 -12% | 0.38 -52% | 0.28 -12% |
| Kontrast (:1) | 1144 | 1408 23% | 1218 6% | 1054 -8% | 845 -26% | 1117 -2% |
| Delta E Colorchecker * | 2.74 | 1.39 49% | 2.35 14% | 2.36 14% | 3.21 -17% | 2.96 -8% |
| Colorchecker dE 2000 max. * | 5.21 | 3.31 36% | 4.15 20% | 4.24 19% | 10.56 -103% | 6.23 -20% |
| Colorchecker dE 2000 calibrated * | 2.52 | 0.97 62% | 1.16 54% | 1.53 39% | ||
| Delta E Graustufen * | 1.1 | 1.6 -45% | 3.04 -176% | 3.43 -212% | 5.7 -418% | 4.2 -282% |
| Gamma | 2.2 100% | 2.291 96% | 2.35 94% | 2.44 90% | 2.09 105% | 2.32 95% |
| CCT | 6408 101% | 6626 98% | 6658 98% | 6266 104% | 7194 90% | 7145 91% |
| Farbraum (Prozent von AdobeRGB 1998) (%) | 68 | 65 | ||||
| Color Space (Percent of sRGB) (%) | 89 | 99 | ||||
| Durchschnitt gesamt (Programm / Settings) | -0% /
8% | 6% /
-2% | -12% /
-22% | -26% /
-44% | -18% /
-27% |
* ... kleinere Werte sind besser
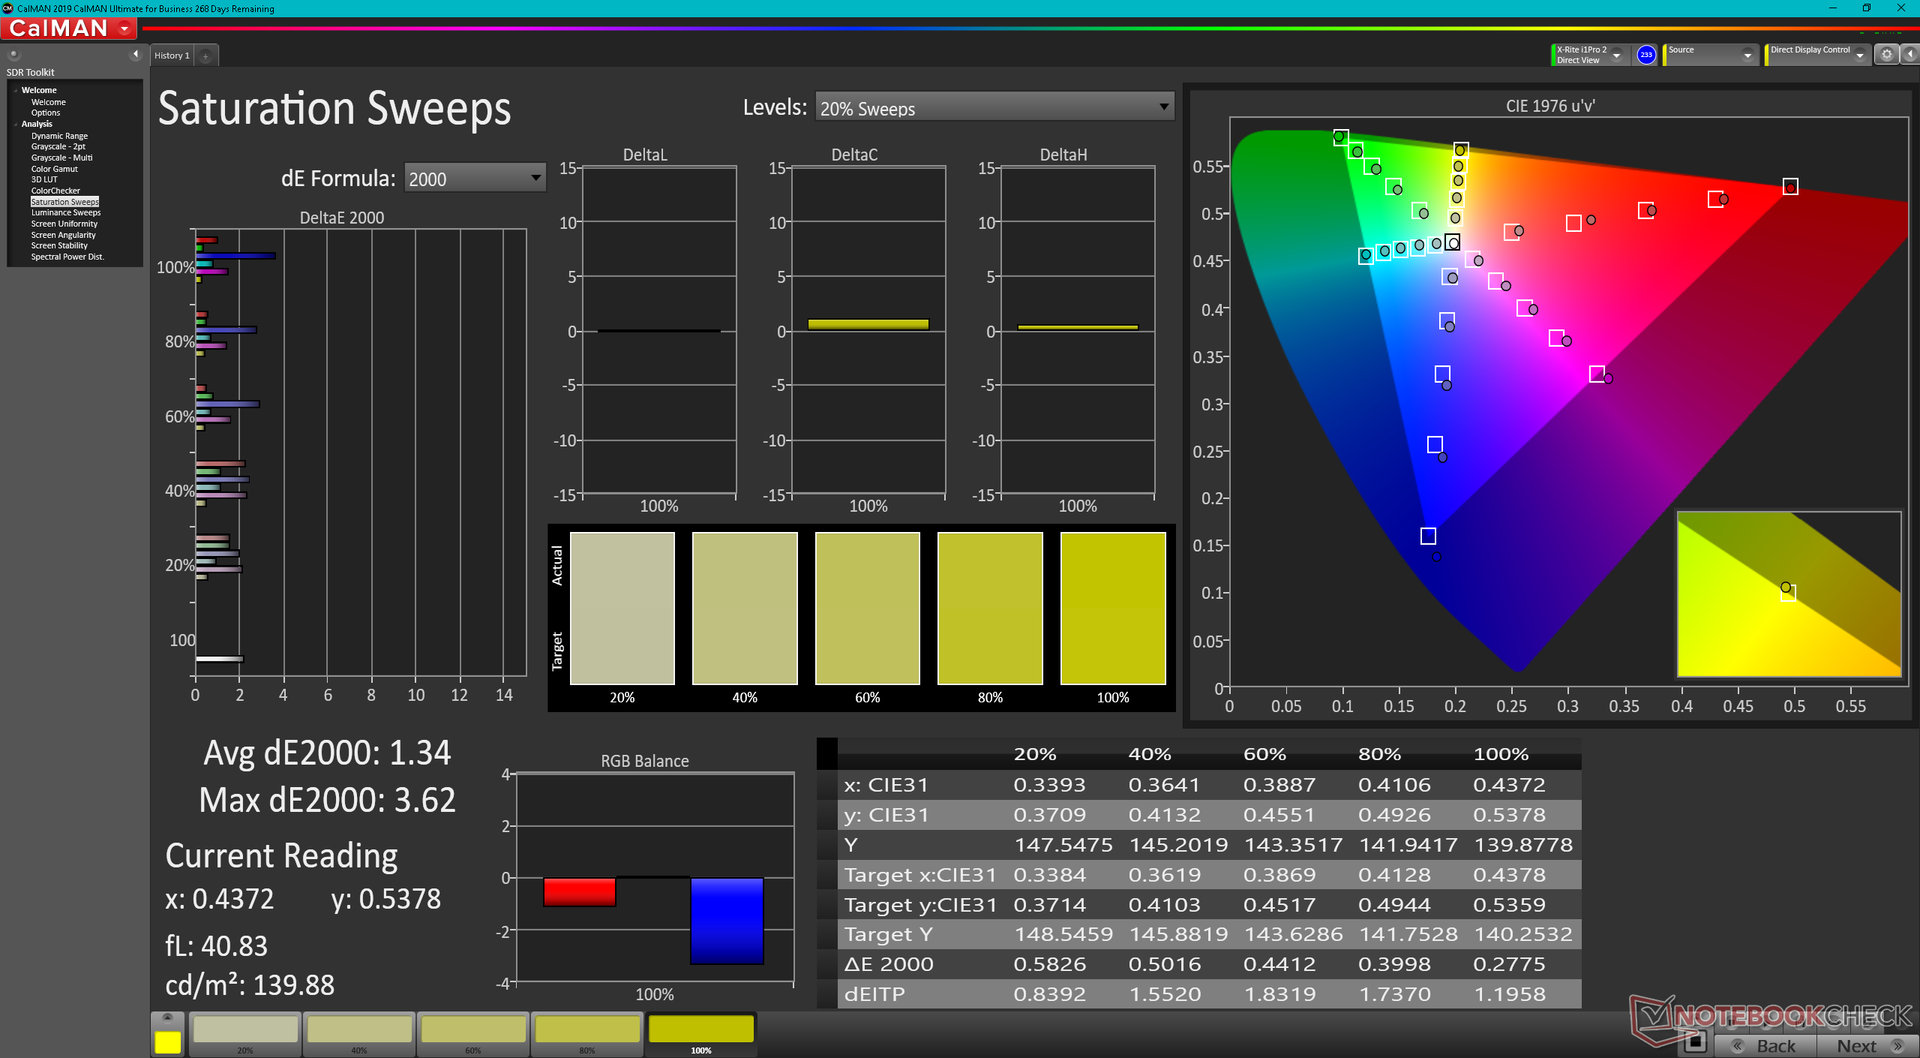
Mit durchschnittlichen Graustufen- und Farb-DeltaE-Werten von nur 1,1 bzw. 2,74 mit dem DCI-P3-Farbraum als Referenz ist die Darstellung ab Werk bereits gut. Laut Razer wird jedes Panel individuell kalibriert, was sich mit der in unserer unabhängigen Messung mit einem X-Rite-Farbmessgerät ermittelten, genauen Farb- und Graustufendarstellung deckt.

Reaktionszeiten (Response Times) des Displays
| ↔ Reaktionszeiten Schwarz zu Weiß | ||
|---|---|---|
| 11.6 ms ... steigend ↗ und fallend ↘ kombiniert | ↗ 5.6 ms steigend | 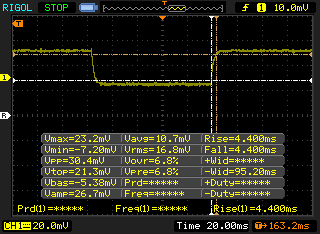 |
| ↘ 6 ms fallend | ||
| Die gemessenen Reaktionszeiten sind gut, für anspruchsvolle Spieler könnten der Bildschirm jedoch zu langsam sein. Im Vergleich rangierten die bei uns getesteten Geräte von 0.1 (Minimum) zu 240 (Maximum) ms. » 31 % aller Screens waren schneller als der getestete. Daher sind die gemessenen Reaktionszeiten besser als der Durchschnitt aller vermessenen Geräte (19.8 ms). | ||
| ↔ Reaktionszeiten 50% Grau zu 80% Grau | ||
| 14.4 ms ... steigend ↗ und fallend ↘ kombiniert | ↗ 6.8 ms steigend | 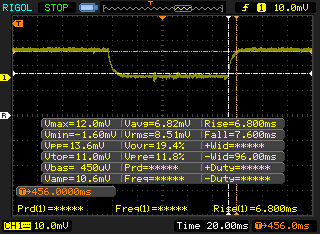 |
| ↘ 7.6 ms fallend | ||
| Die gemessenen Reaktionszeiten sind gut, für anspruchsvolle Spieler könnten der Bildschirm jedoch zu langsam sein. Im Vergleich rangierten die bei uns getesteten Geräte von 0.165 (Minimum) zu 636 (Maximum) ms. » 29 % aller Screens waren schneller als der getestete. Daher sind die gemessenen Reaktionszeiten besser als der Durchschnitt aller vermessenen Geräte (30.9 ms). | ||
Bildschirm-Flackern / PWM (Pulse-Width Modulation)
| Flackern / PWM nicht festgestellt | 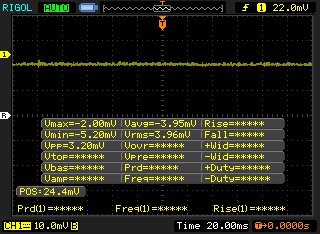 | ||
Im Vergleich: 52 % aller getesteten Geräte nutzten kein PWM um die Helligkeit zu reduzieren. Wenn PWM eingesetzt wurde, dann bei einer Frequenz von durchschnittlich 7744 (Minimum 5, Maximum 343500) Hz. | |||

Leistung
Testbedingungen
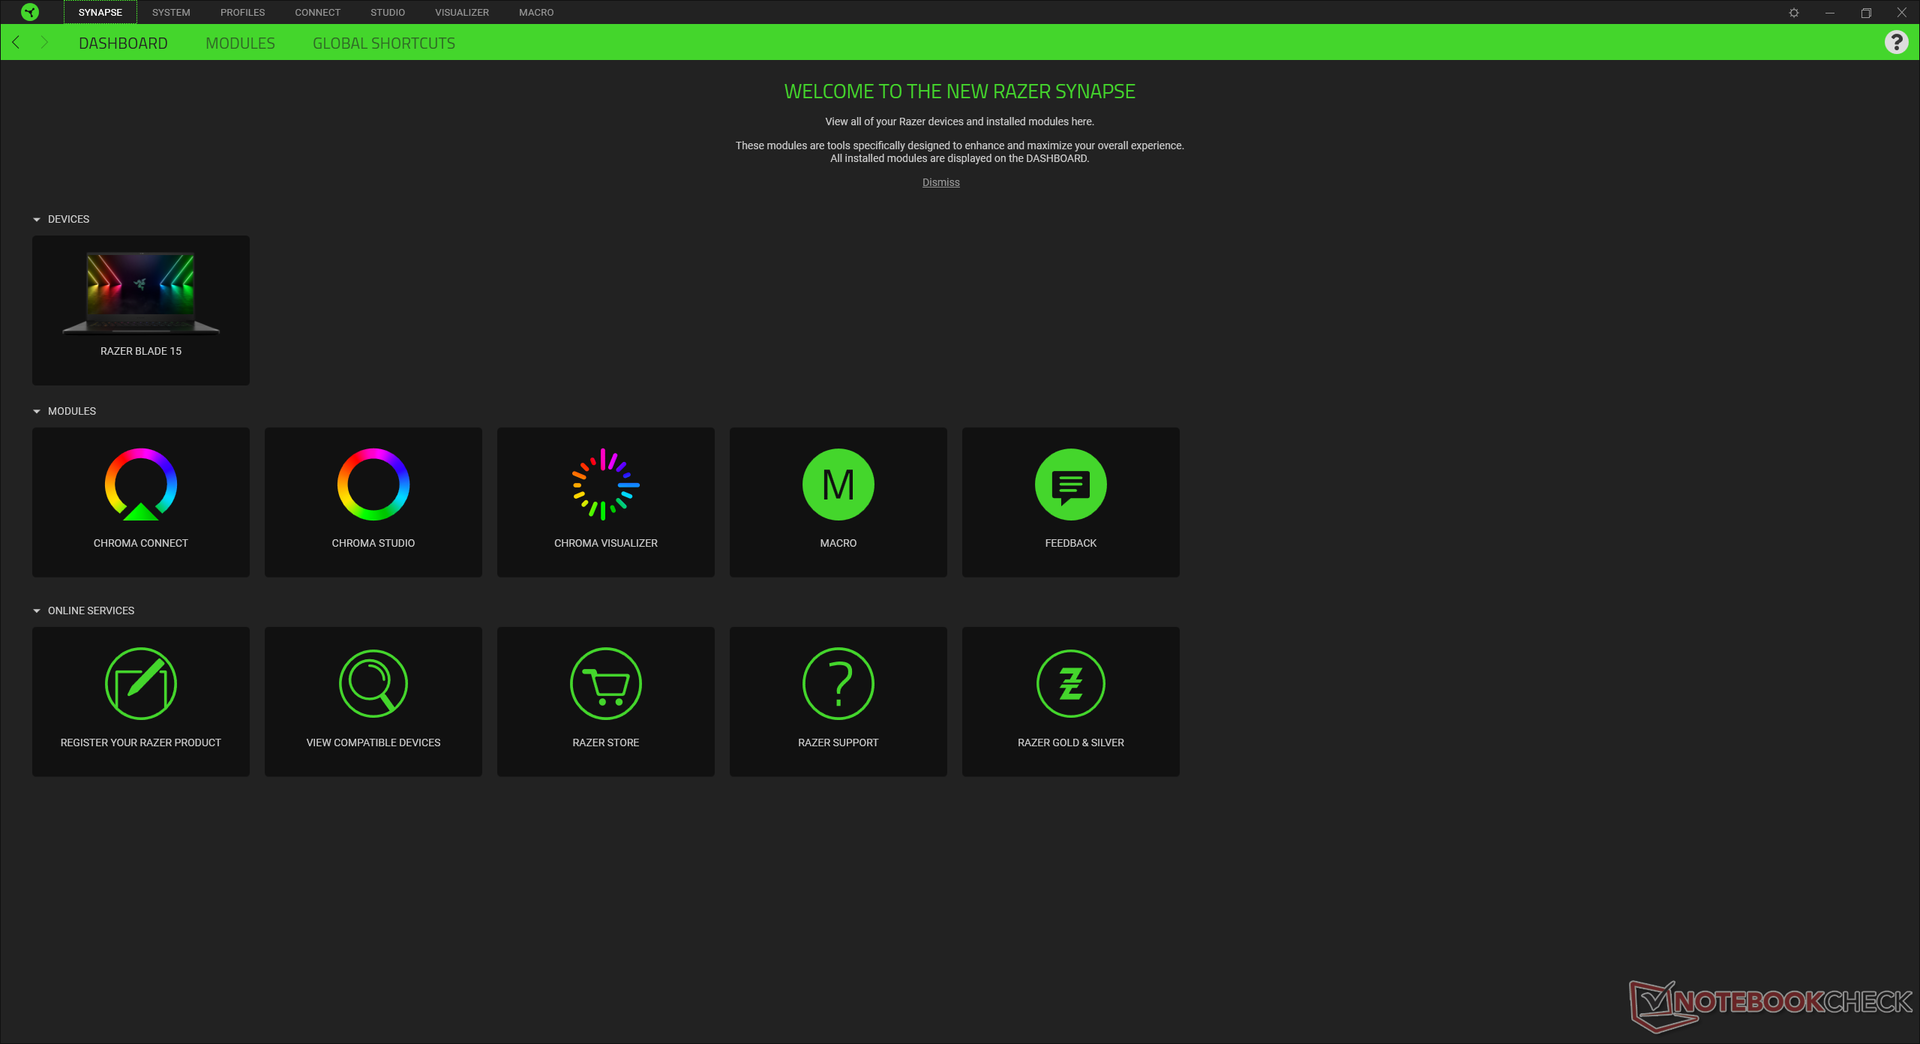
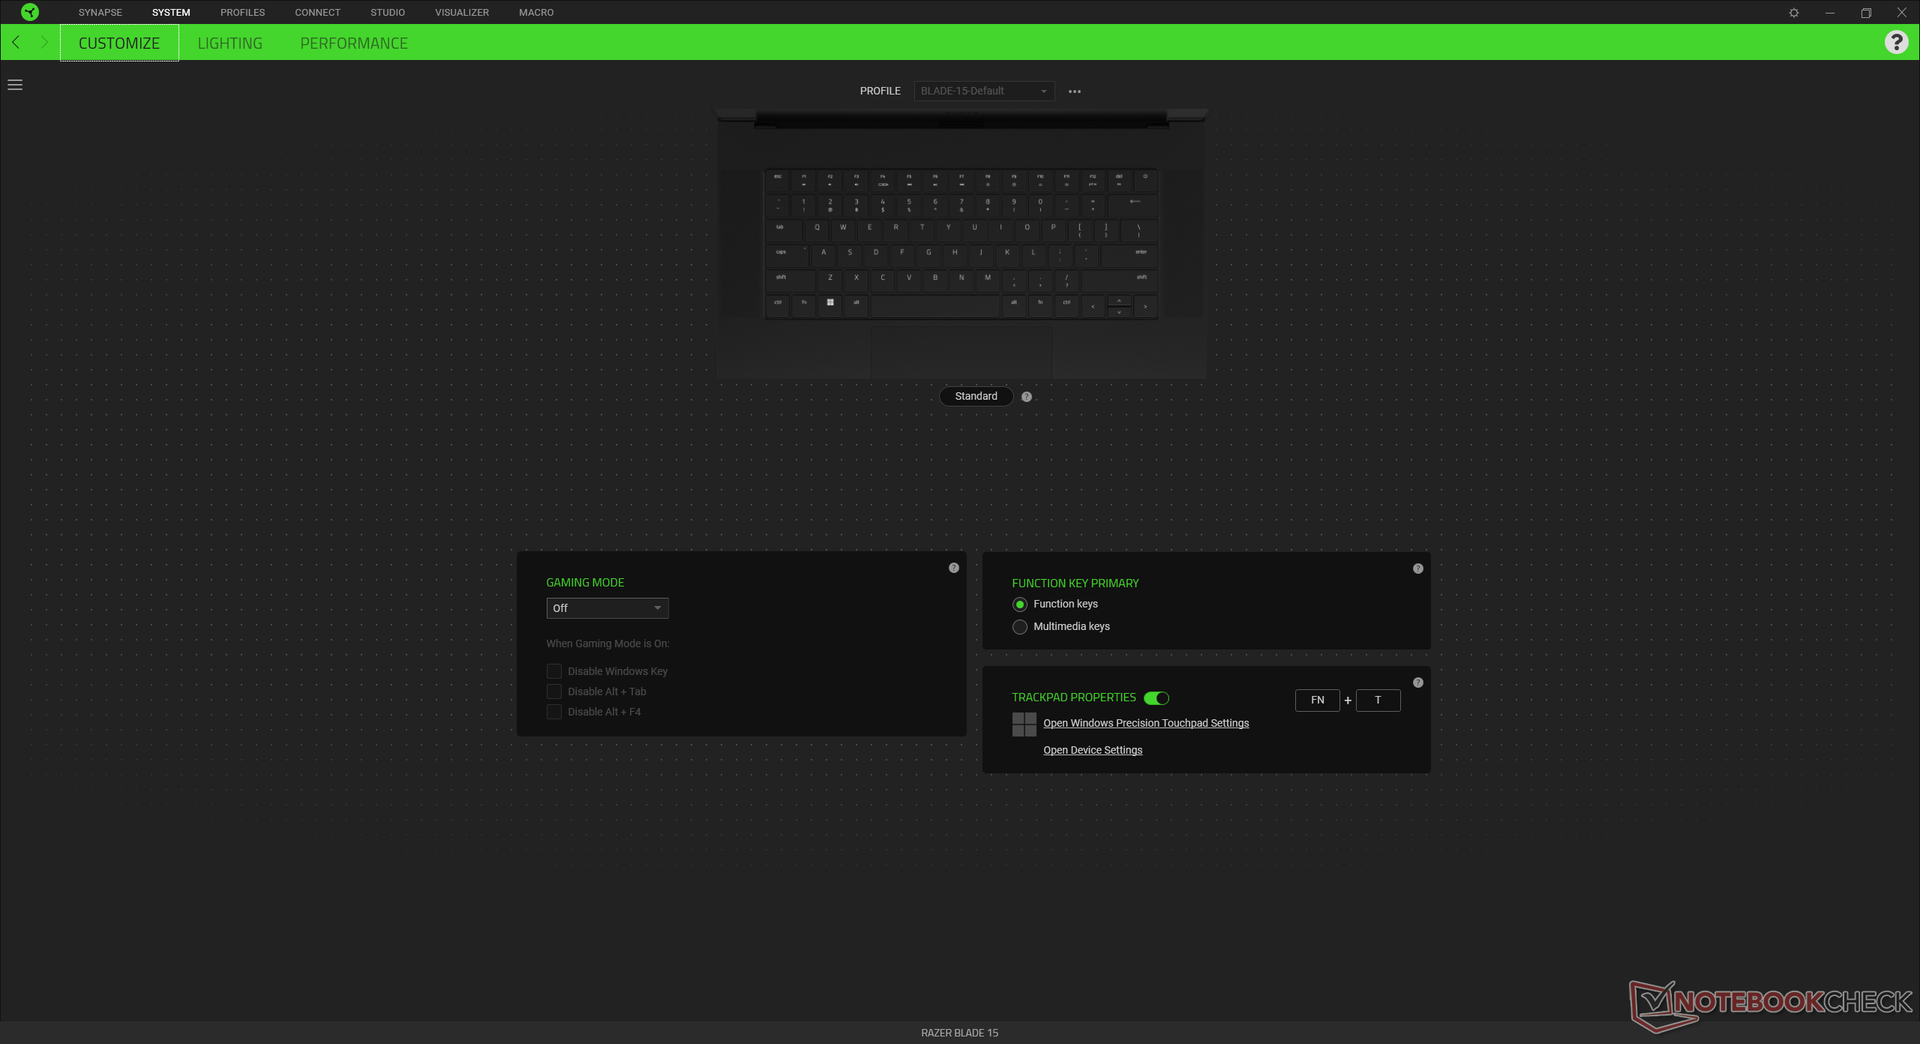
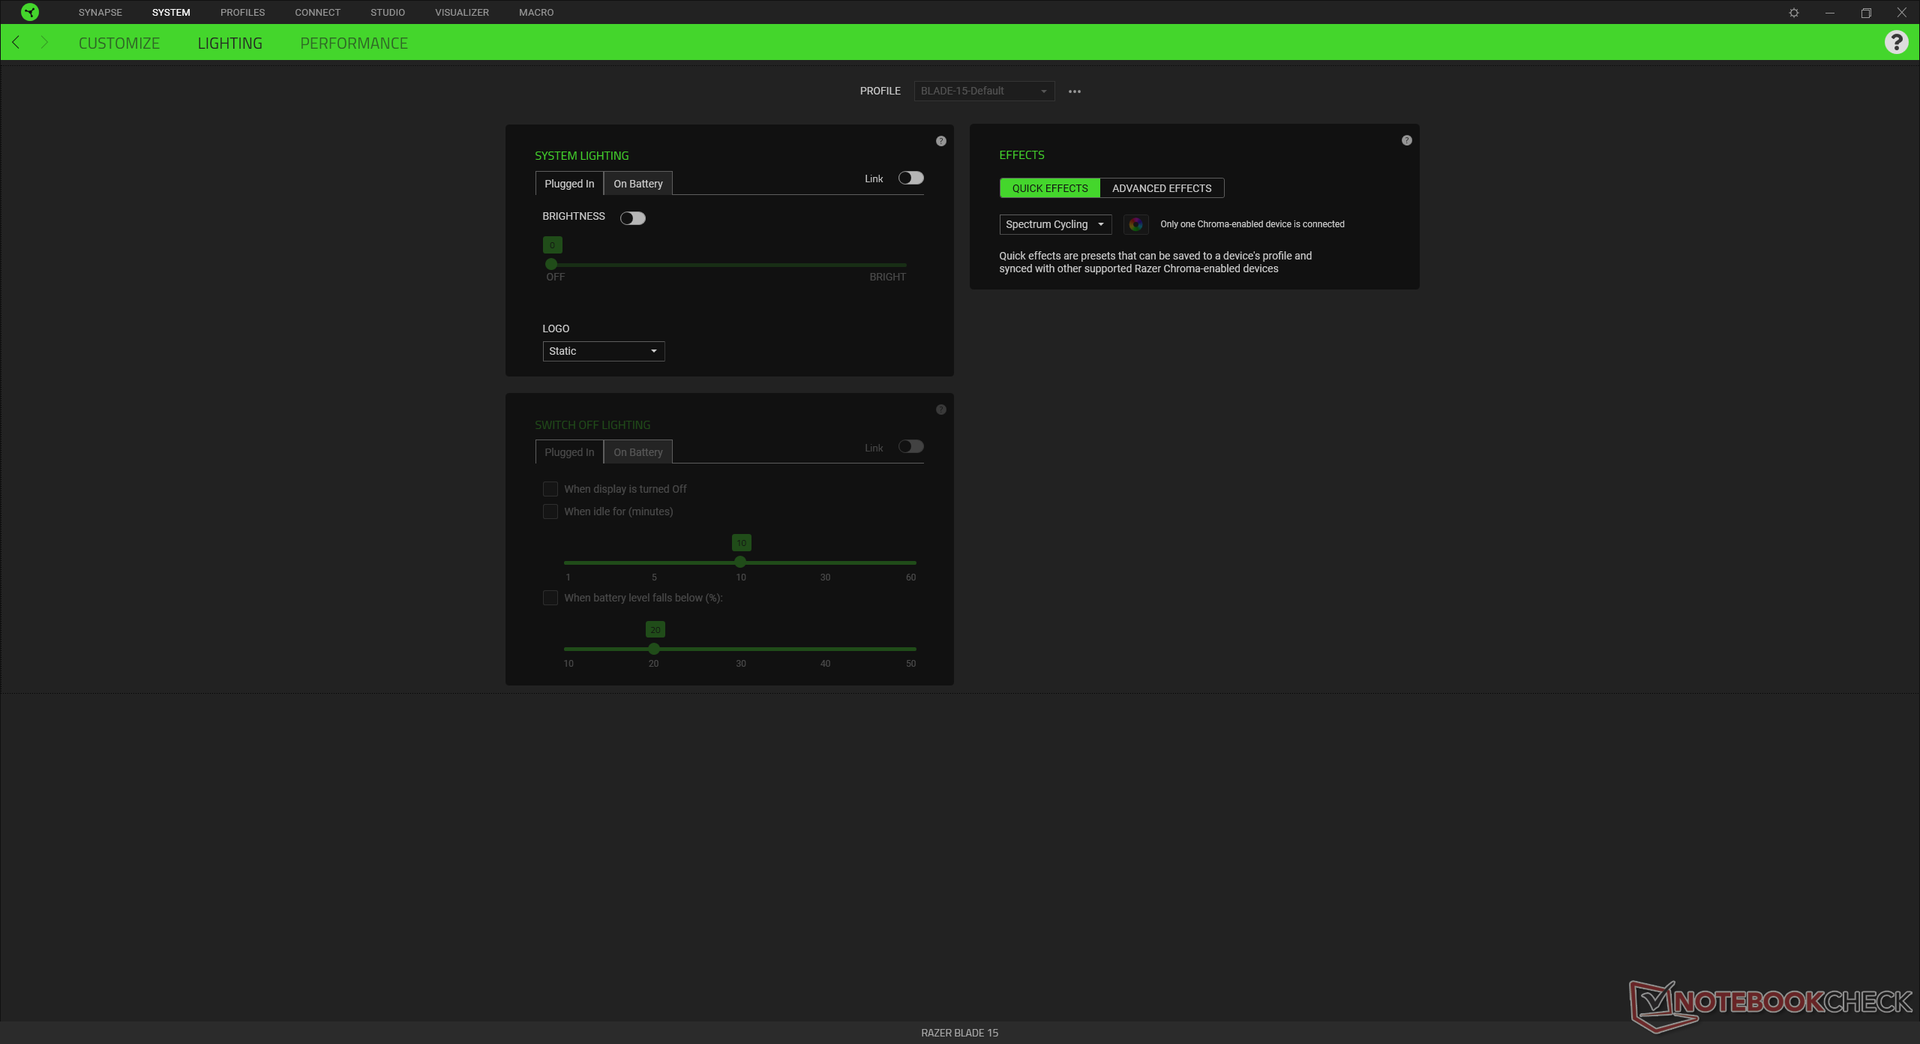
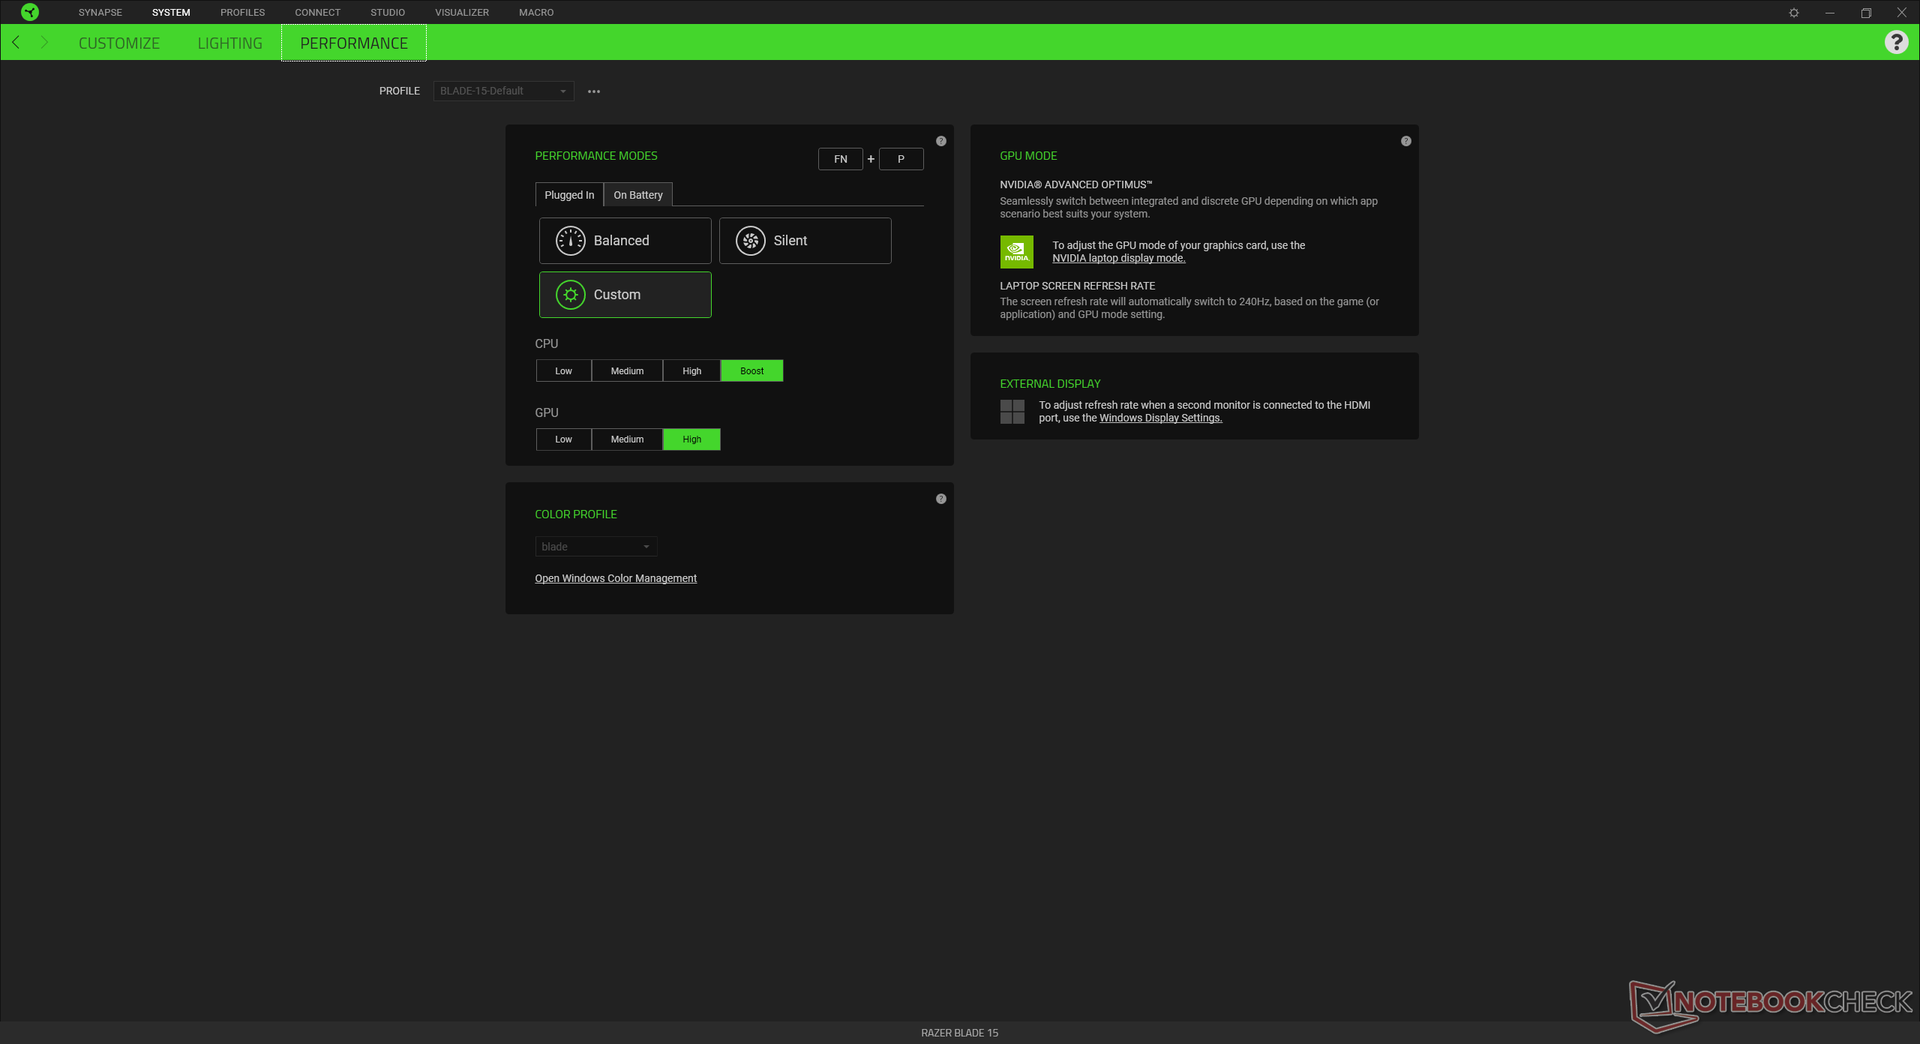
Für die Leistungsbenchmarks haben wir bei unserem Testgerät in Razers Synapse-Software ein benutzerdefiniertes Leistungsprofil erstellt, in dem wir den CPU- und GPU-Boost jeweils auf "Hoch" gesetzt haben, um die höchstmöglichen Punktzahlen zu erzielen. Wir haben außerdem die dGPU aktiviert, indem wir Optimus deaktiviert haben. Da Razer Synapse als Zentrale für die Steuerung der Leistung und Funktionen dient, lohnt es sich, sich mit der Software vertraut zu machen.
Da das Blade 15 einer der wenigen Gaminig-Laptops mit Advanced Optimus bzw. Optimus 2.0 ist, kann man ohne Neustart zwischen dem dGPU- und dem Nvidia-Optimus-Modus (MUX) wechseln. Um G-Sync auf dem eingebauten Display zu nutzen, ist der Optimus-Modus zwingend erforderlich. Darüber hinaus ist auch die Thunderbolt-4-Unterstützung wie bei den meisten anderen Alder-Lake-H-Laptops nur im Optimus-Modus aktiv.
Prozessor
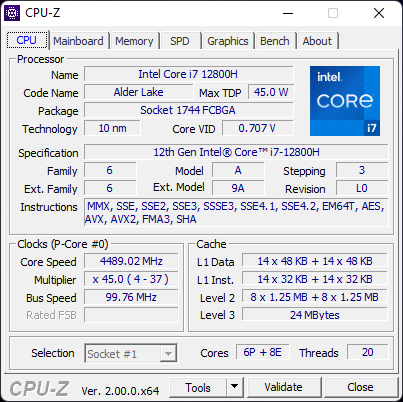
Der Core i7-12800H bietet 20 % mehr Single-Core- und Multi-Core-Leistung als sein direkter Vorgänger Core i7-11800H. Das Modell mit dem Core i9-12900H sollte basierend auf unseren Erfahrungen mit dem MSI Vector GP66 zusätzliche 5 bis 15 % CPU-Leistung bieten.
Cinebench R15 Multi Dauertest
Cinebench R23: Multi Core | Single Core
Cinebench R15: CPU Multi 64Bit | CPU Single 64Bit
Blender: v2.79 BMW27 CPU
7-Zip 18.03: 7z b 4 | 7z b 4 -mmt1
Geekbench 5.5: Multi-Core | Single-Core
HWBOT x265 Benchmark v2.2: 4k Preset
LibreOffice : 20 Documents To PDF
R Benchmark 2.5: Overall mean
| Cinebench R20 / CPU (Multi Core) | |
| MSI Vector GP66 12UGS | |
| Razer Blade 15 2022 | |
| Durchschnittliche Intel Core i7-12800H (3741 - 6433, n=5) | |
| Asus ROG Zephyrus M16 GU603H | |
| Razer Blade 14 Ryzen 9 RTX 3070 | |
| Razer Blade 15 Advanced (Mid 2021) | |
| MSI Alpha 15 B5EEK-008 | |
| Asus ROG Zephyrus G15 GA502IU-ES76 | |
| Aorus 15P XC | |
| Lenovo Legion C7 15IMH05 82EH0030GE | |
| Razer Blade 15 Advanced Model Early 2021 | |
| Cinebench R20 / CPU (Single Core) | |
| MSI Vector GP66 12UGS | |
| Durchschnittliche Intel Core i7-12800H (690 - 714, n=5) | |
| Razer Blade 15 2022 | |
| Asus ROG Zephyrus M16 GU603H | |
| Razer Blade 15 Advanced (Mid 2021) | |
| MSI Alpha 15 B5EEK-008 | |
| Lenovo Legion C7 15IMH05 82EH0030GE | |
| Asus ROG Zephyrus G15 GA502IU-ES76 | |
| Razer Blade 15 Advanced Model Early 2021 | |
| Aorus 15P XC | |
| Razer Blade 14 Ryzen 9 RTX 3070 | |
| Cinebench R23 / Multi Core | |
| MSI Vector GP66 12UGS | |
| Razer Blade 15 2022 | |
| Durchschnittliche Intel Core i7-12800H (9777 - 16597, n=5) | |
| Razer Blade 14 Ryzen 9 RTX 3070 | |
| Razer Blade 15 Advanced (Mid 2021) | |
| MSI Alpha 15 B5EEK-008 | |
| Aorus 15P XC | |
| Lenovo Legion C7 15IMH05 82EH0030GE | |
| Razer Blade 15 Advanced Model Early 2021 | |
| Cinebench R23 / Single Core | |
| MSI Vector GP66 12UGS | |
| Durchschnittliche Intel Core i7-12800H (1796 - 1859, n=5) | |
| Razer Blade 15 2022 | |
| Razer Blade 15 Advanced (Mid 2021) | |
| MSI Alpha 15 B5EEK-008 | |
| Lenovo Legion C7 15IMH05 82EH0030GE | |
| Aorus 15P XC | |
| Razer Blade 14 Ryzen 9 RTX 3070 | |
| Razer Blade 15 Advanced Model Early 2021 | |
| Cinebench R15 / CPU Multi 64Bit | |
| MSI Vector GP66 12UGS | |
| Durchschnittliche Intel Core i7-12800H (1566 - 2697, n=5) | |
| Asus ROG Zephyrus M16 GU603H | |
| Razer Blade 15 2022 | |
| Razer Blade 14 Ryzen 9 RTX 3070 | |
| MSI Alpha 15 B5EEK-008 | |
| Razer Blade 15 Advanced (Mid 2021) | |
| Aorus 15P XC | |
| Lenovo Legion C7 15IMH05 82EH0030GE | |
| Asus ROG Zephyrus G15 GA502IU-ES76 | |
| Razer Blade 15 Advanced Model Early 2021 | |
| Cinebench R15 / CPU Single 64Bit | |
| MSI Vector GP66 12UGS | |
| Durchschnittliche Intel Core i7-12800H (242 - 269, n=5) | |
| Razer Blade 15 2022 | |
| Asus ROG Zephyrus M16 GU603H | |
| MSI Alpha 15 B5EEK-008 | |
| Razer Blade 15 Advanced (Mid 2021) | |
| Lenovo Legion C7 15IMH05 82EH0030GE | |
| Aorus 15P XC | |
| Razer Blade 15 Advanced Model Early 2021 | |
| Razer Blade 14 Ryzen 9 RTX 3070 | |
| Asus ROG Zephyrus G15 GA502IU-ES76 | |
| Geekbench 5.5 / Multi-Core | |
| Razer Blade 15 2022 | |
| MSI Vector GP66 12UGS | |
| Durchschnittliche Intel Core i7-12800H (9607 - 12940, n=5) | |
| Asus ROG Zephyrus M16 GU603H | |
| MSI Alpha 15 B5EEK-008 | |
| Lenovo Legion C7 15IMH05 82EH0030GE | |
| Aorus 15P XC | |
| Asus ROG Zephyrus G15 GA502IU-ES76 | |
| Razer Blade 15 Advanced Model Early 2021 | |
| Geekbench 5.5 / Single-Core | |
| MSI Vector GP66 12UGS | |
| Durchschnittliche Intel Core i7-12800H (1739 - 1842, n=5) | |
| Razer Blade 15 2022 | |
| Asus ROG Zephyrus M16 GU603H | |
| MSI Alpha 15 B5EEK-008 | |
| Lenovo Legion C7 15IMH05 82EH0030GE | |
| Razer Blade 15 Advanced Model Early 2021 | |
| Aorus 15P XC | |
| Asus ROG Zephyrus G15 GA502IU-ES76 | |
| HWBOT x265 Benchmark v2.2 / 4k Preset | |
| MSI Vector GP66 12UGS | |
| Razer Blade 15 2022 | |
| Durchschnittliche Intel Core i7-12800H (11.7 - 19.4, n=5) | |
| Razer Blade 14 Ryzen 9 RTX 3070 | |
| MSI Alpha 15 B5EEK-008 | |
| Asus ROG Zephyrus M16 GU603H | |
| Razer Blade 15 Advanced (Mid 2021) | |
| Aorus 15P XC | |
| Asus ROG Zephyrus G15 GA502IU-ES76 | |
| Lenovo Legion C7 15IMH05 82EH0030GE | |
| Razer Blade 15 Advanced Model Early 2021 | |
| LibreOffice / 20 Documents To PDF | |
| Razer Blade 14 Ryzen 9 RTX 3070 | |
| Asus ROG Zephyrus G15 GA502IU-ES76 | |
| Lenovo Legion C7 15IMH05 82EH0030GE | |
| MSI Alpha 15 B5EEK-008 | |
| Razer Blade 15 Advanced Model Early 2021 | |
| Aorus 15P XC | |
| Razer Blade 15 2022 | |
| Razer Blade 15 Advanced (Mid 2021) | |
| Durchschnittliche Intel Core i7-12800H (41.3 - 51.5, n=5) | |
| Asus ROG Zephyrus M16 GU603H | |
| MSI Vector GP66 12UGS | |
* ... kleinere Werte sind besser
AIDA64: FP32 Ray-Trace | FPU Julia | CPU SHA3 | CPU Queen | FPU SinJulia | FPU Mandel | CPU AES | CPU ZLib | FP64 Ray-Trace | CPU PhotoWorxx
| Performance Rating | |
| Eurocom Nightsky ARX315 | |
| Schenker XMG Neo 15 E22 (Early 2022, RTX 3080 Ti) | |
| Durchschnittliche Intel Core i7-12800H | |
| Razer Blade 15 2022 | |
| Razer Blade 15 RTX 2080 Super Max-Q | |
| Razer Blade 15 Advanced Model Early 2021 | |
| ADATA XPG Xenia 15 -9! | |
| AIDA64 / FP32 Ray-Trace | |
| Eurocom Nightsky ARX315 | |
| Schenker XMG Neo 15 E22 (Early 2022, RTX 3080 Ti) | |
| Razer Blade 15 RTX 2080 Super Max-Q | |
| Durchschnittliche Intel Core i7-12800H (5839 - 15206, n=5) | |
| Razer Blade 15 Advanced Model Early 2021 | |
| Razer Blade 15 2022 | |
| AIDA64 / FPU Julia | |
| Eurocom Nightsky ARX315 | |
| Razer Blade 15 RTX 2080 Super Max-Q | |
| Razer Blade 15 Advanced Model Early 2021 | |
| Durchschnittliche Intel Core i7-12800H (27801 - 80002, n=5) | |
| Schenker XMG Neo 15 E22 (Early 2022, RTX 3080 Ti) | |
| Razer Blade 15 2022 | |
| AIDA64 / CPU SHA3 | |
| Schenker XMG Neo 15 E22 (Early 2022, RTX 3080 Ti) | |
| Eurocom Nightsky ARX315 | |
| Durchschnittliche Intel Core i7-12800H (2013 - 3684, n=5) | |
| Razer Blade 15 2022 | |
| Razer Blade 15 RTX 2080 Super Max-Q | |
| Razer Blade 15 Advanced Model Early 2021 | |
| AIDA64 / CPU Queen | |
| Eurocom Nightsky ARX315 | |
| Schenker XMG Neo 15 E22 (Early 2022, RTX 3080 Ti) | |
| Durchschnittliche Intel Core i7-12800H (85965 - 108084, n=5) | |
| Razer Blade 15 2022 | |
| Razer Blade 15 RTX 2080 Super Max-Q | |
| Razer Blade 15 Advanced Model Early 2021 | |
| AIDA64 / FPU SinJulia | |
| Eurocom Nightsky ARX315 | |
| Schenker XMG Neo 15 E22 (Early 2022, RTX 3080 Ti) | |
| Razer Blade 15 2022 | |
| Durchschnittliche Intel Core i7-12800H (7027 - 9658, n=5) | |
| Razer Blade 15 RTX 2080 Super Max-Q | |
| Razer Blade 15 Advanced Model Early 2021 | |
| AIDA64 / FPU Mandel | |
| Eurocom Nightsky ARX315 | |
| Schenker XMG Neo 15 E22 (Early 2022, RTX 3080 Ti) | |
| Razer Blade 15 RTX 2080 Super Max-Q | |
| Durchschnittliche Intel Core i7-12800H (15765 - 38179, n=5) | |
| Razer Blade 15 Advanced Model Early 2021 | |
| Razer Blade 15 2022 | |
| AIDA64 / CPU AES | |
| Eurocom Nightsky ARX315 | |
| Schenker XMG Neo 15 E22 (Early 2022, RTX 3080 Ti) | |
| Durchschnittliche Intel Core i7-12800H (55371 - 73928, n=5) | |
| Razer Blade 15 2022 | |
| Razer Blade 15 RTX 2080 Super Max-Q | |
| Razer Blade 15 Advanced Model Early 2021 | |
| AIDA64 / CPU ZLib | |
| Schenker XMG Neo 15 E22 (Early 2022, RTX 3080 Ti) | |
| Eurocom Nightsky ARX315 | |
| Razer Blade 15 2022 | |
| Durchschnittliche Intel Core i7-12800H (701 - 1047, n=5) | |
| Razer Blade 15 RTX 2080 Super Max-Q | |
| Razer Blade 15 Advanced Model Early 2021 | |
| ADATA XPG Xenia 15 | |
| AIDA64 / FP64 Ray-Trace | |
| Eurocom Nightsky ARX315 | |
| Schenker XMG Neo 15 E22 (Early 2022, RTX 3080 Ti) | |
| Razer Blade 15 RTX 2080 Super Max-Q | |
| Durchschnittliche Intel Core i7-12800H (3257 - 8559, n=5) | |
| Razer Blade 15 Advanced Model Early 2021 | |
| Razer Blade 15 2022 | |
| AIDA64 / CPU PhotoWorxx | |
| Razer Blade 15 2022 | |
| Schenker XMG Neo 15 E22 (Early 2022, RTX 3080 Ti) | |
| Durchschnittliche Intel Core i7-12800H (31329 - 40992, n=5) | |
| Razer Blade 15 Advanced Model Early 2021 | |
| Eurocom Nightsky ARX315 | |
| Razer Blade 15 RTX 2080 Super Max-Q | |
Systemleistung
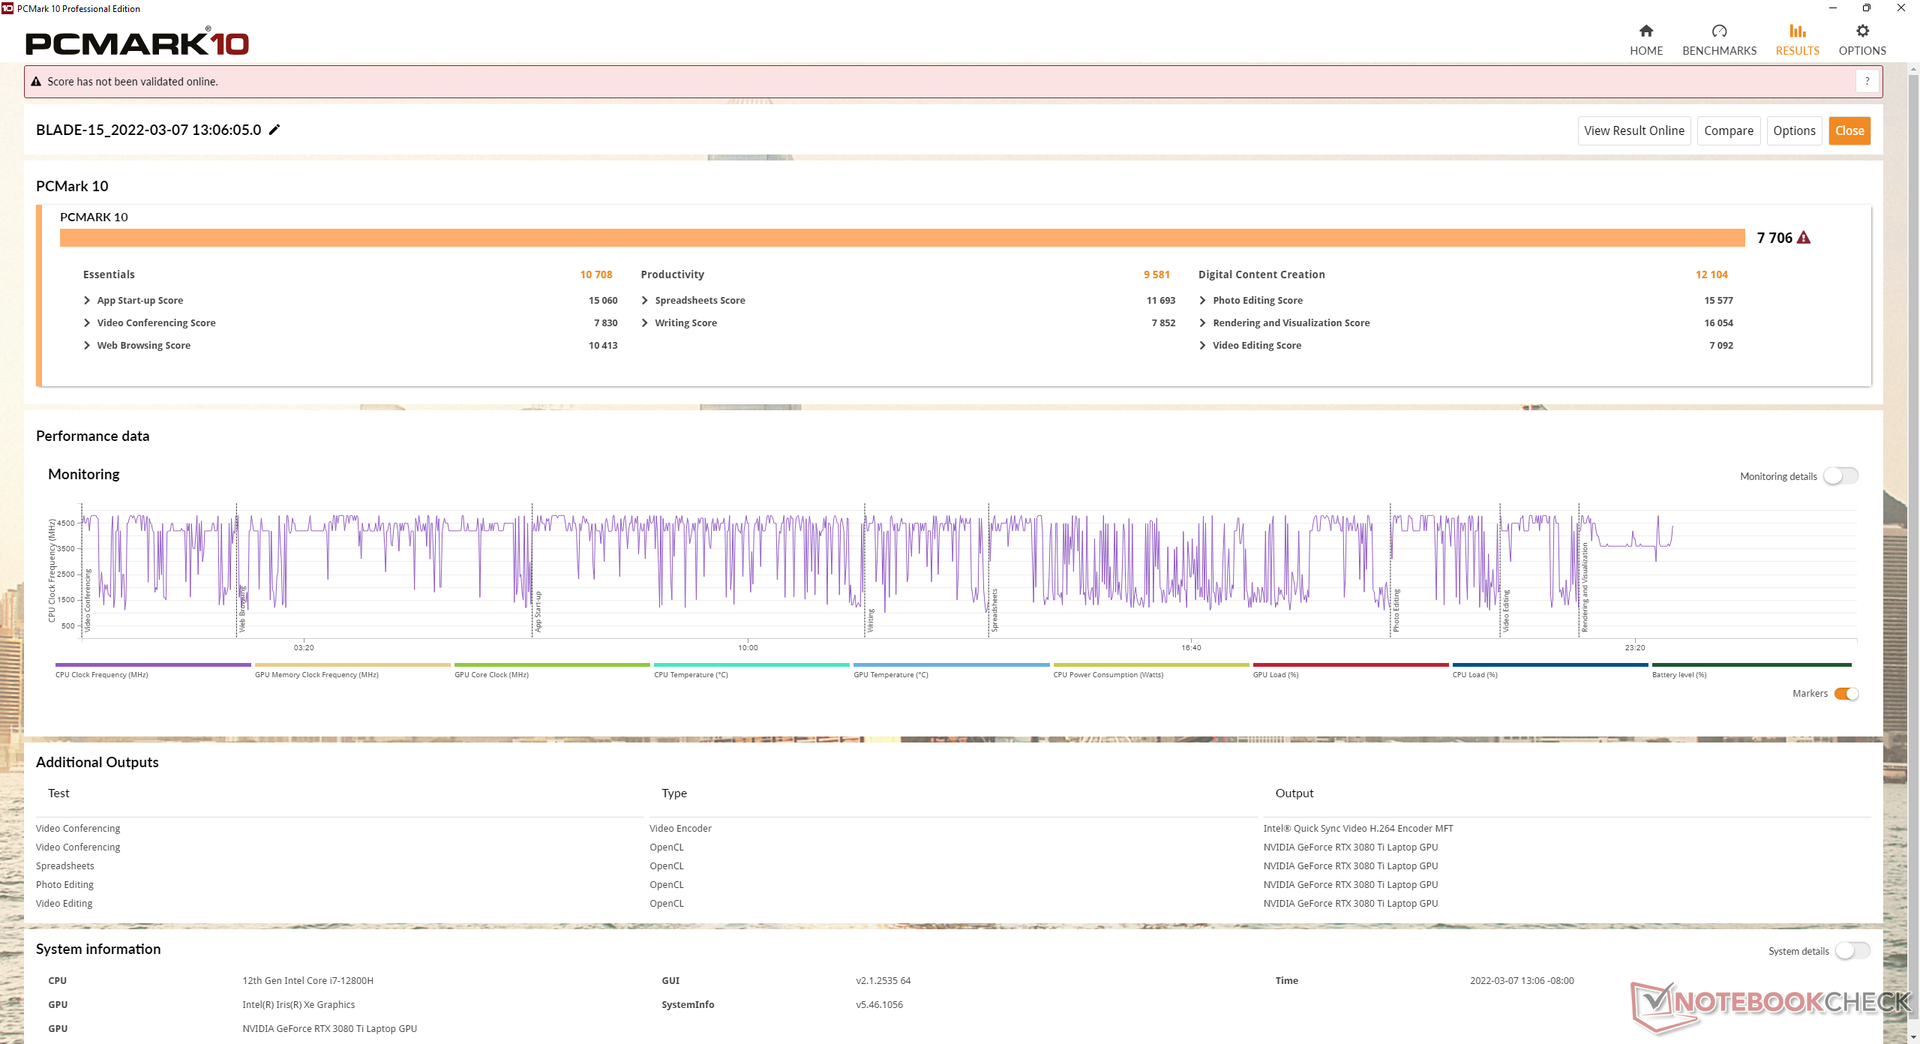
| PCMark 10 / Score | |
| Razer Blade 15 2022 | |
| Durchschnittliche Intel Core i7-12800H, NVIDIA GeForce RTX 3080 Ti Laptop GPU (7313 - 7744, n=3) | |
| Razer Blade 15 Advanced (Mid 2021) | |
| Razer Blade 17 RTX 3070 | |
| Razer Blade 14 Ryzen 9 RTX 3070 | |
| Razer Blade 15 RTX 2070 Super Max-Q | |
| Razer Blade Pro 17 2021 (QHD Touch) | |
| Razer Blade 15 Base Edition 2021, i7-10750H RTX 3060 | |
| Razer Blade 15 Advanced Model Early 2021 | |
| PCMark 10 / Essentials | |
| Razer Blade 15 Advanced (Mid 2021) | |
| Razer Blade 17 RTX 3070 | |
| Razer Blade 15 2022 | |
| Durchschnittliche Intel Core i7-12800H, NVIDIA GeForce RTX 3080 Ti Laptop GPU (10597 - 10814, n=3) | |
| Razer Blade 14 Ryzen 9 RTX 3070 | |
| Razer Blade 15 RTX 2070 Super Max-Q | |
| Razer Blade 15 Base Edition 2021, i7-10750H RTX 3060 | |
| Razer Blade Pro 17 2021 (QHD Touch) | |
| Razer Blade 15 Advanced Model Early 2021 | |
| PCMark 10 / Productivity | |
| Razer Blade 15 2022 | |
| Durchschnittliche Intel Core i7-12800H, NVIDIA GeForce RTX 3080 Ti Laptop GPU (9470 - 9675, n=3) | |
| Razer Blade 14 Ryzen 9 RTX 3070 | |
| Razer Blade 17 RTX 3070 | |
| Razer Blade 15 Advanced (Mid 2021) | |
| Razer Blade 15 RTX 2070 Super Max-Q | |
| Razer Blade Pro 17 2021 (QHD Touch) | |
| Razer Blade 15 Advanced Model Early 2021 | |
| Razer Blade 15 Base Edition 2021, i7-10750H RTX 3060 | |
| PCMark 10 / Digital Content Creation | |
| Razer Blade 15 2022 | |
| Durchschnittliche Intel Core i7-12800H, NVIDIA GeForce RTX 3080 Ti Laptop GPU (10351 - 12306, n=3) | |
| Razer Blade 15 Advanced (Mid 2021) | |
| Razer Blade 17 RTX 3070 | |
| Razer Blade 15 RTX 2070 Super Max-Q | |
| Razer Blade 14 Ryzen 9 RTX 3070 | |
| Razer Blade Pro 17 2021 (QHD Touch) | |
| Razer Blade 15 Base Edition 2021, i7-10750H RTX 3060 | |
| Razer Blade 15 Advanced Model Early 2021 | |
| PCMark 10 Score | 7706 Punkte | |
Hilfe | ||
| AIDA64 / Memory Copy | |
| Schenker XMG Neo 15 E22 (Early 2022, RTX 3080 Ti) | |
| Razer Blade 15 2022 | |
| Durchschnittliche Intel Core i7-12800H (48643 - 62522, n=5) | |
| Eurocom Nightsky ARX315 | |
| Razer Blade 15 Advanced Model Early 2021 | |
| Razer Blade 15 RTX 2080 Super Max-Q | |
| AIDA64 / Memory Read | |
| Schenker XMG Neo 15 E22 (Early 2022, RTX 3080 Ti) | |
| Razer Blade 15 2022 | |
| Durchschnittliche Intel Core i7-12800H (56629 - 66199, n=5) | |
| Eurocom Nightsky ARX315 | |
| Razer Blade 15 Advanced Model Early 2021 | |
| Razer Blade 15 RTX 2080 Super Max-Q | |
| AIDA64 / Memory Write | |
| Razer Blade 15 2022 | |
| Schenker XMG Neo 15 E22 (Early 2022, RTX 3080 Ti) | |
| Durchschnittliche Intel Core i7-12800H (50923 - 66074, n=5) | |
| Eurocom Nightsky ARX315 | |
| Razer Blade 15 Advanced Model Early 2021 | |
| Razer Blade 15 RTX 2080 Super Max-Q | |
| AIDA64 / Memory Latency | |
| Eurocom Nightsky ARX315 | |
| Razer Blade 15 Advanced Model Early 2021 | |
| Razer Blade 15 RTX 2080 Super Max-Q | |
| Durchschnittliche Intel Core i7-12800H (89.3 - 95.2, n=5) | |
| ADATA XPG Xenia 15 | |
| Schenker XMG Neo 15 E22 (Early 2022, RTX 3080 Ti) | |
| Razer Blade 15 2022 | |
* ... kleinere Werte sind besser
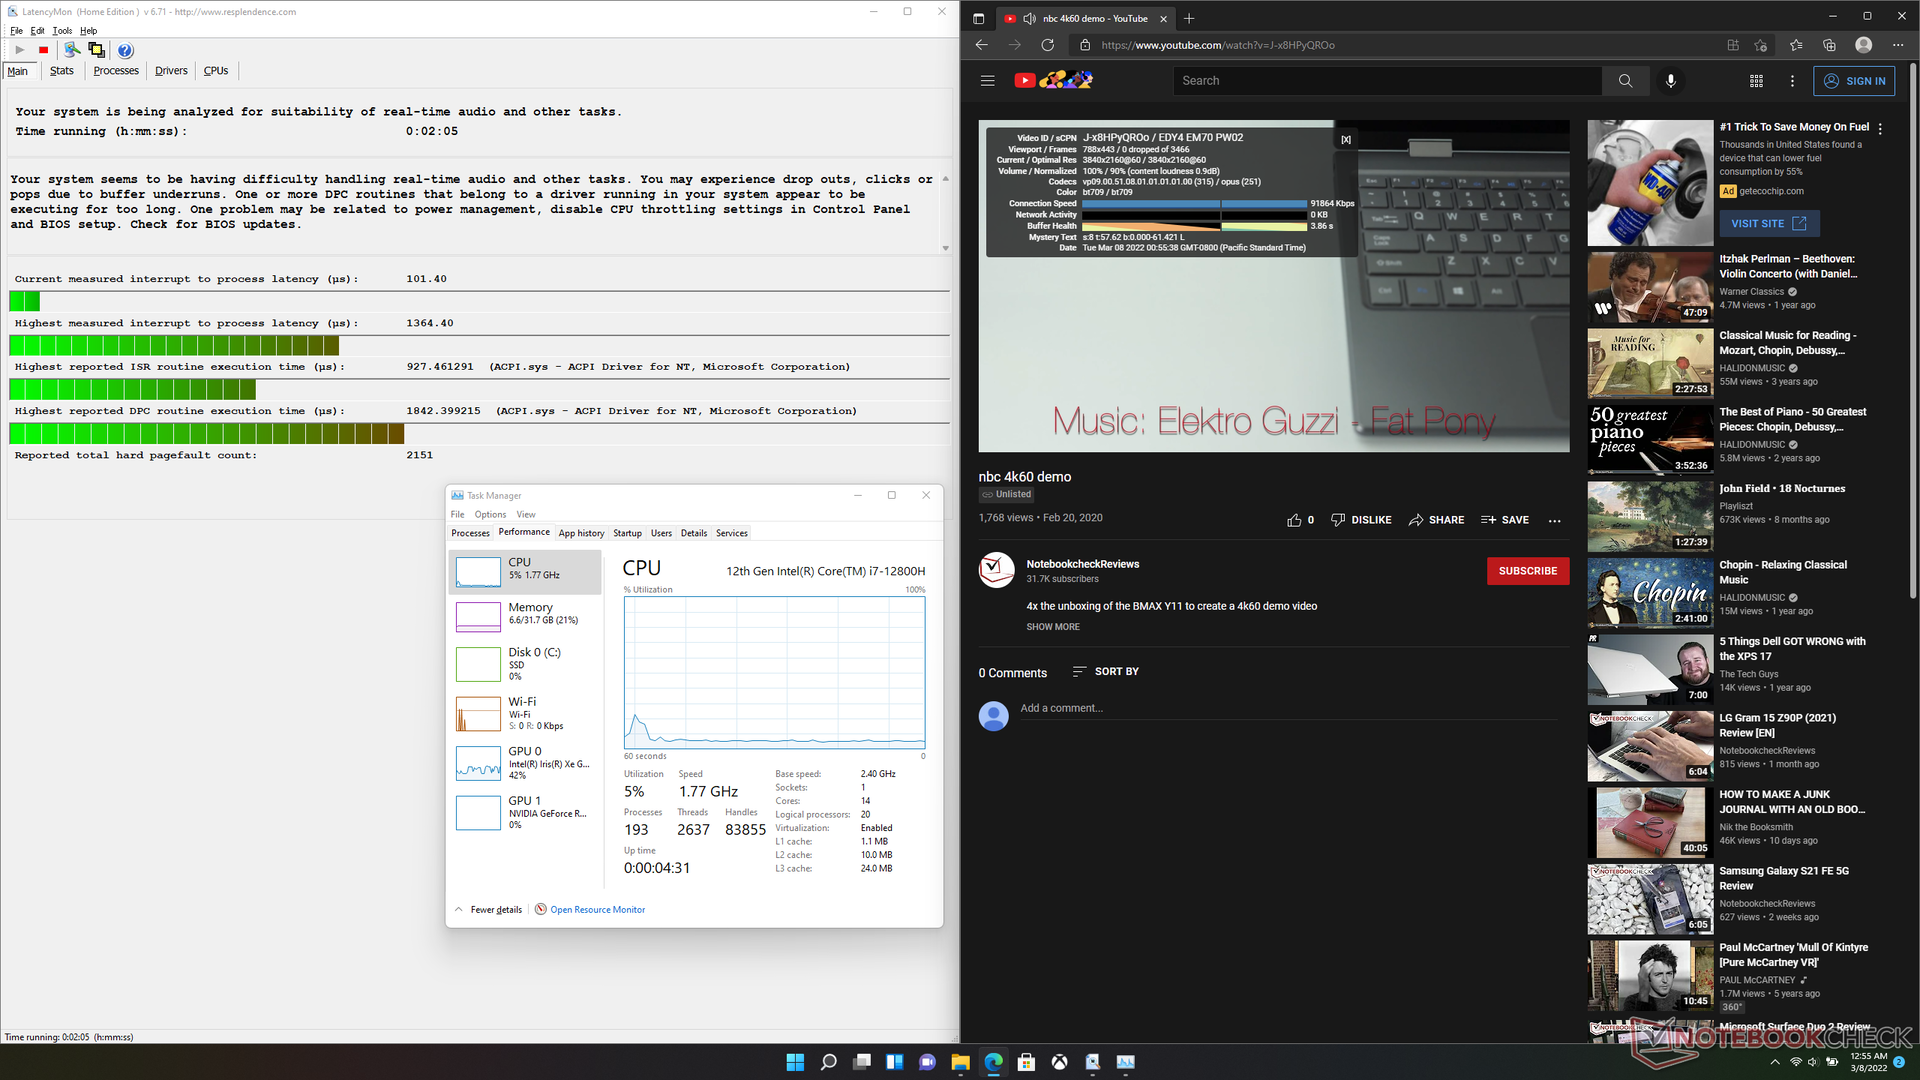
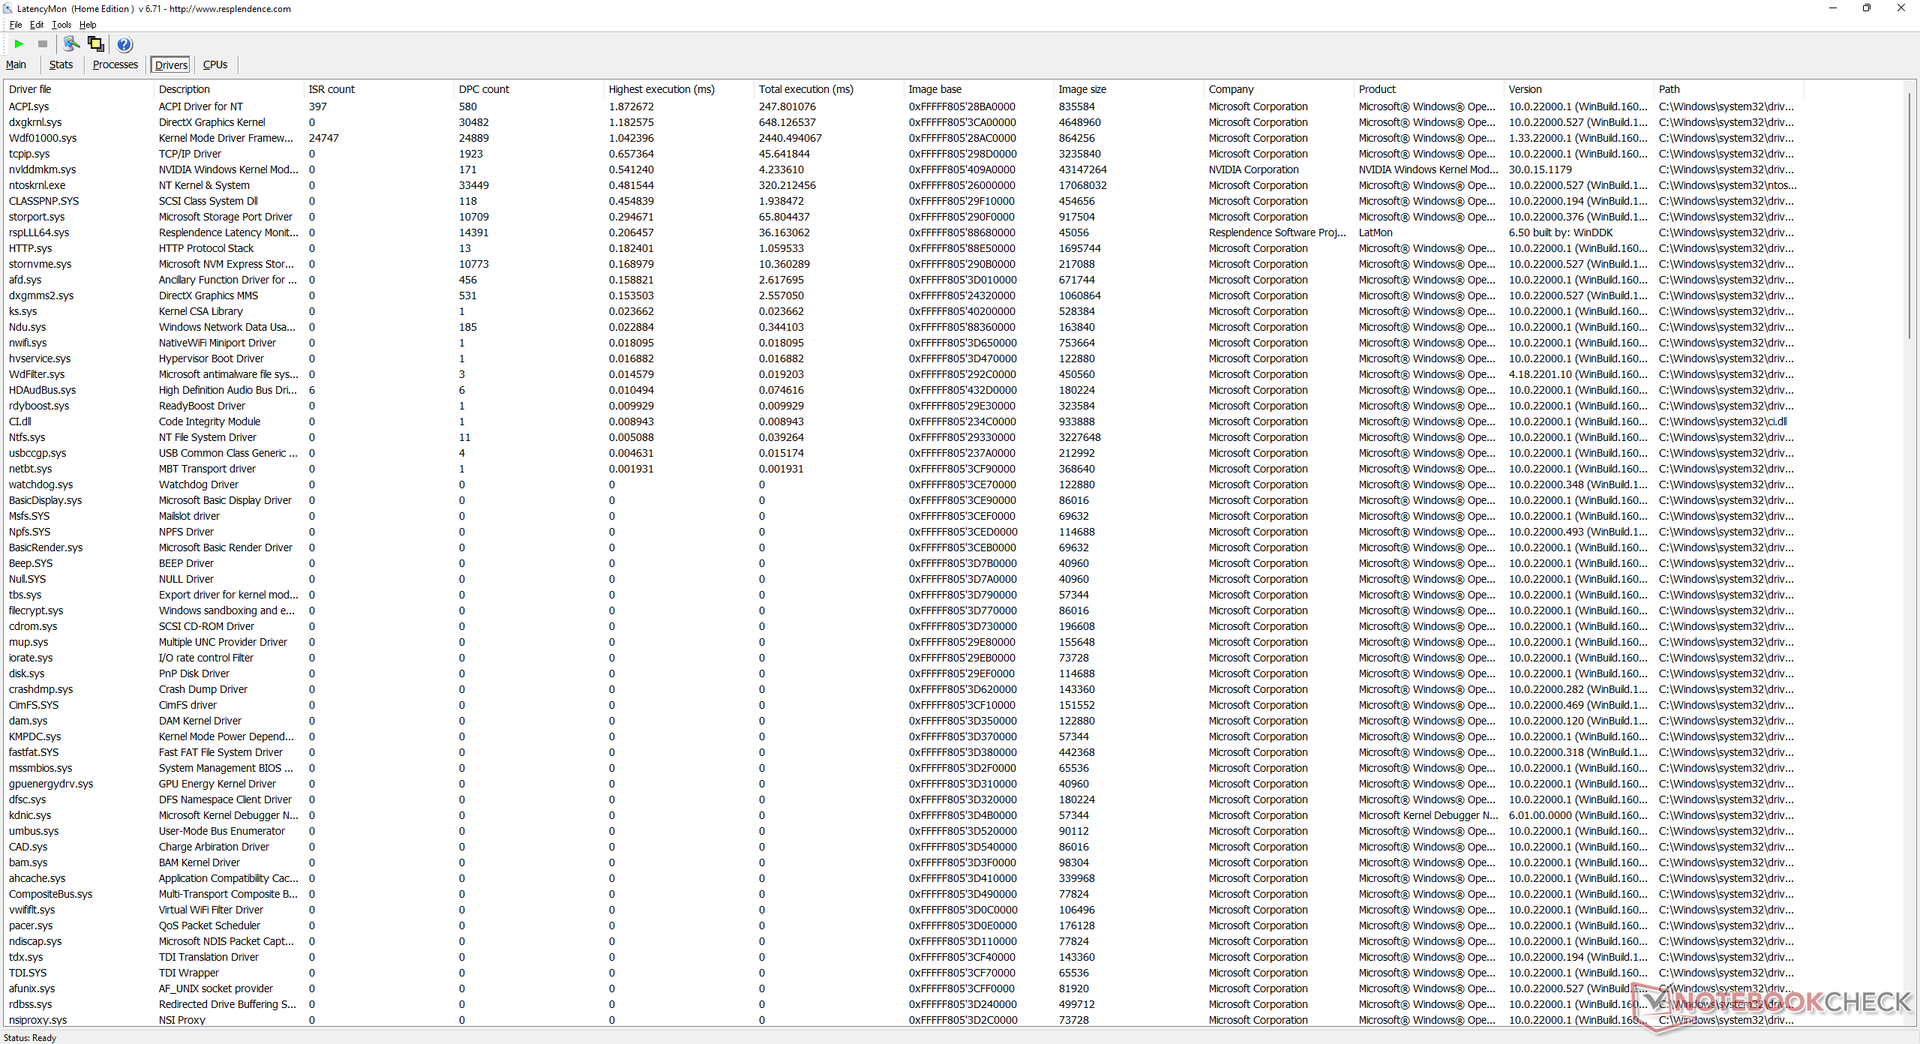
DPC-Latenzen
Beim Öffnen unserer Homepage in mehreren Tabs meldet LatencyMon problematische DPC-Latenzen. Die Wiedergabe eines 4K60-Videos ist flüssig und gelingt im Optimus-Modus ohne verlorene Frames.
| DPC Latencies / LatencyMon - interrupt to process latency (max), Web, Youtube, Prime95 | |
| ADATA XPG Xenia 15 | |
| Razer Blade 15 2022 | |
| Schenker XMG Neo 15 E22 (Early 2022, RTX 3080 Ti) | |
| Razer Blade 15 RTX 2080 Super Max-Q | |
| Razer Blade 15 Advanced Model Early 2021 | |
| Eurocom Nightsky ARX315 | |
* ... kleinere Werte sind besser
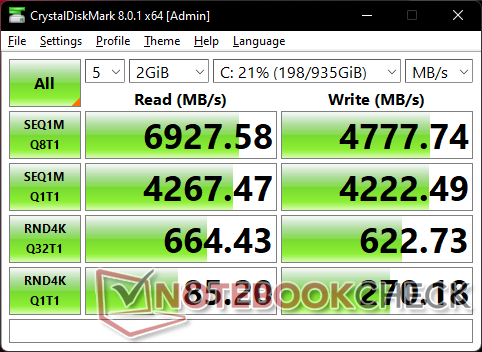
Massenspeicher
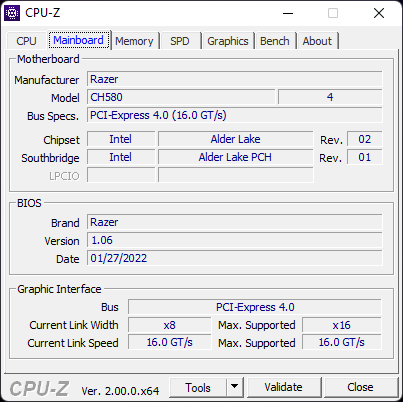
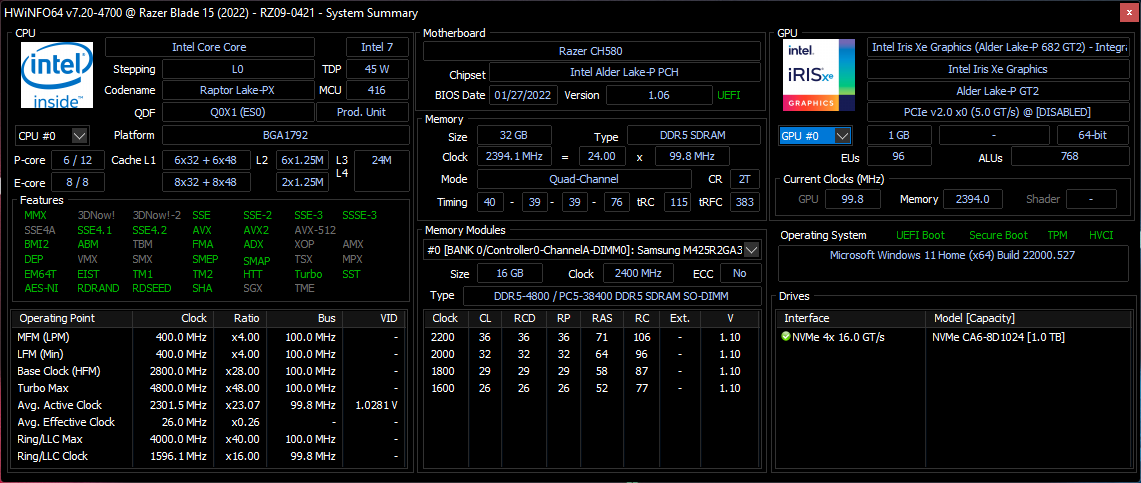
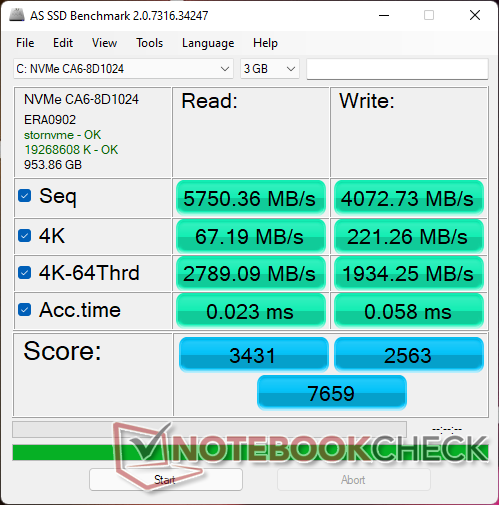
Fast alle Razer-Blade-Laptops nutzen entweder Lite-On- oder Samsung-SSDs und auch das aktuelle Blade 15 bildet davon keine Ausnahme. Unser Testgerät ist mit der 1 TB großen Lite-On CA6-8D1024 PCIe4-x4-NVMe-SSD ausgestattet und erreicht sequenzielle Lese- und Schreibraten von bis zu 6.800 MB/s bzw. 4.800 MB/s. Unsere DiskSpd-Messung zeigt, dass das Laufwerk die maximale Leistung auch langfristig aufrechterhalten kann.

* ... kleinere Werte sind besser
Dauerleistung Lesen: DiskSpd-Leseschleife, Warteschlangentiefe 8
Grafikkarte
Die Grafikleistung liegt ca. 15 bis 25 % über der eines Blade 15 RTX 3080 und ca. 30 bis 45 % über der eines Blade 15 RTX 2080 Max-Q. Bestimmte Alternativen wie das Schenker XMG Neo 15 E22 und das Schenker Uniwill Technology GM7AG8P verfügen über leistungsfähigere 150+-W-Versionen der GeForce RTX 3080 Ti, was ihnen einen Leistungssprung von ungefähr 15 % gegenüber unserem Blade 15 RTX 3080 Ti einbringt.
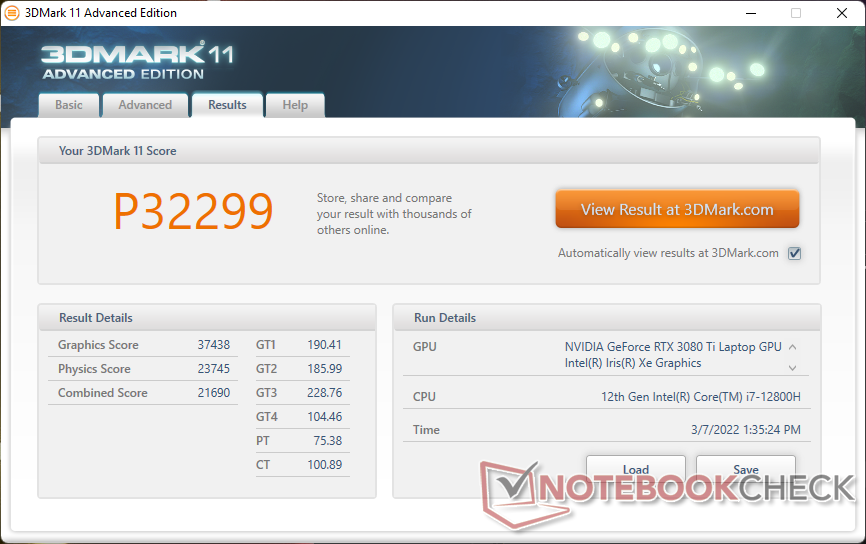
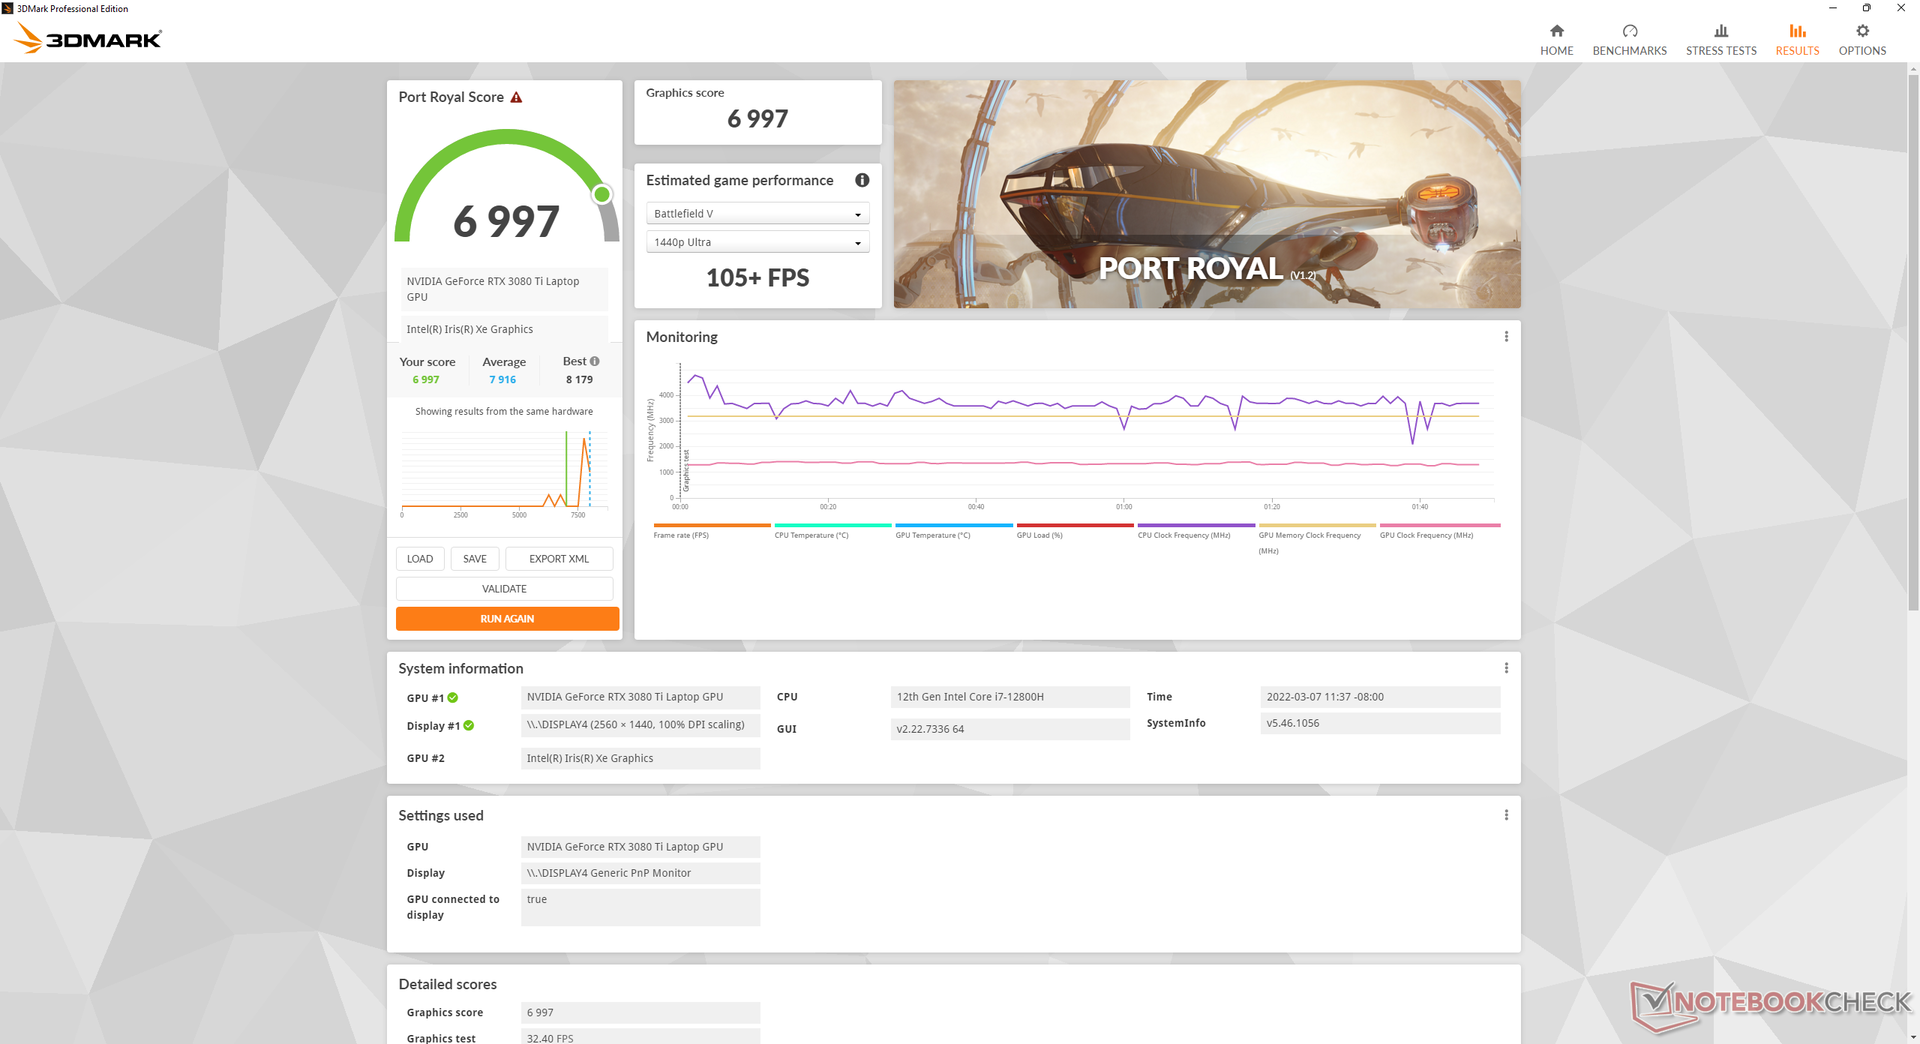
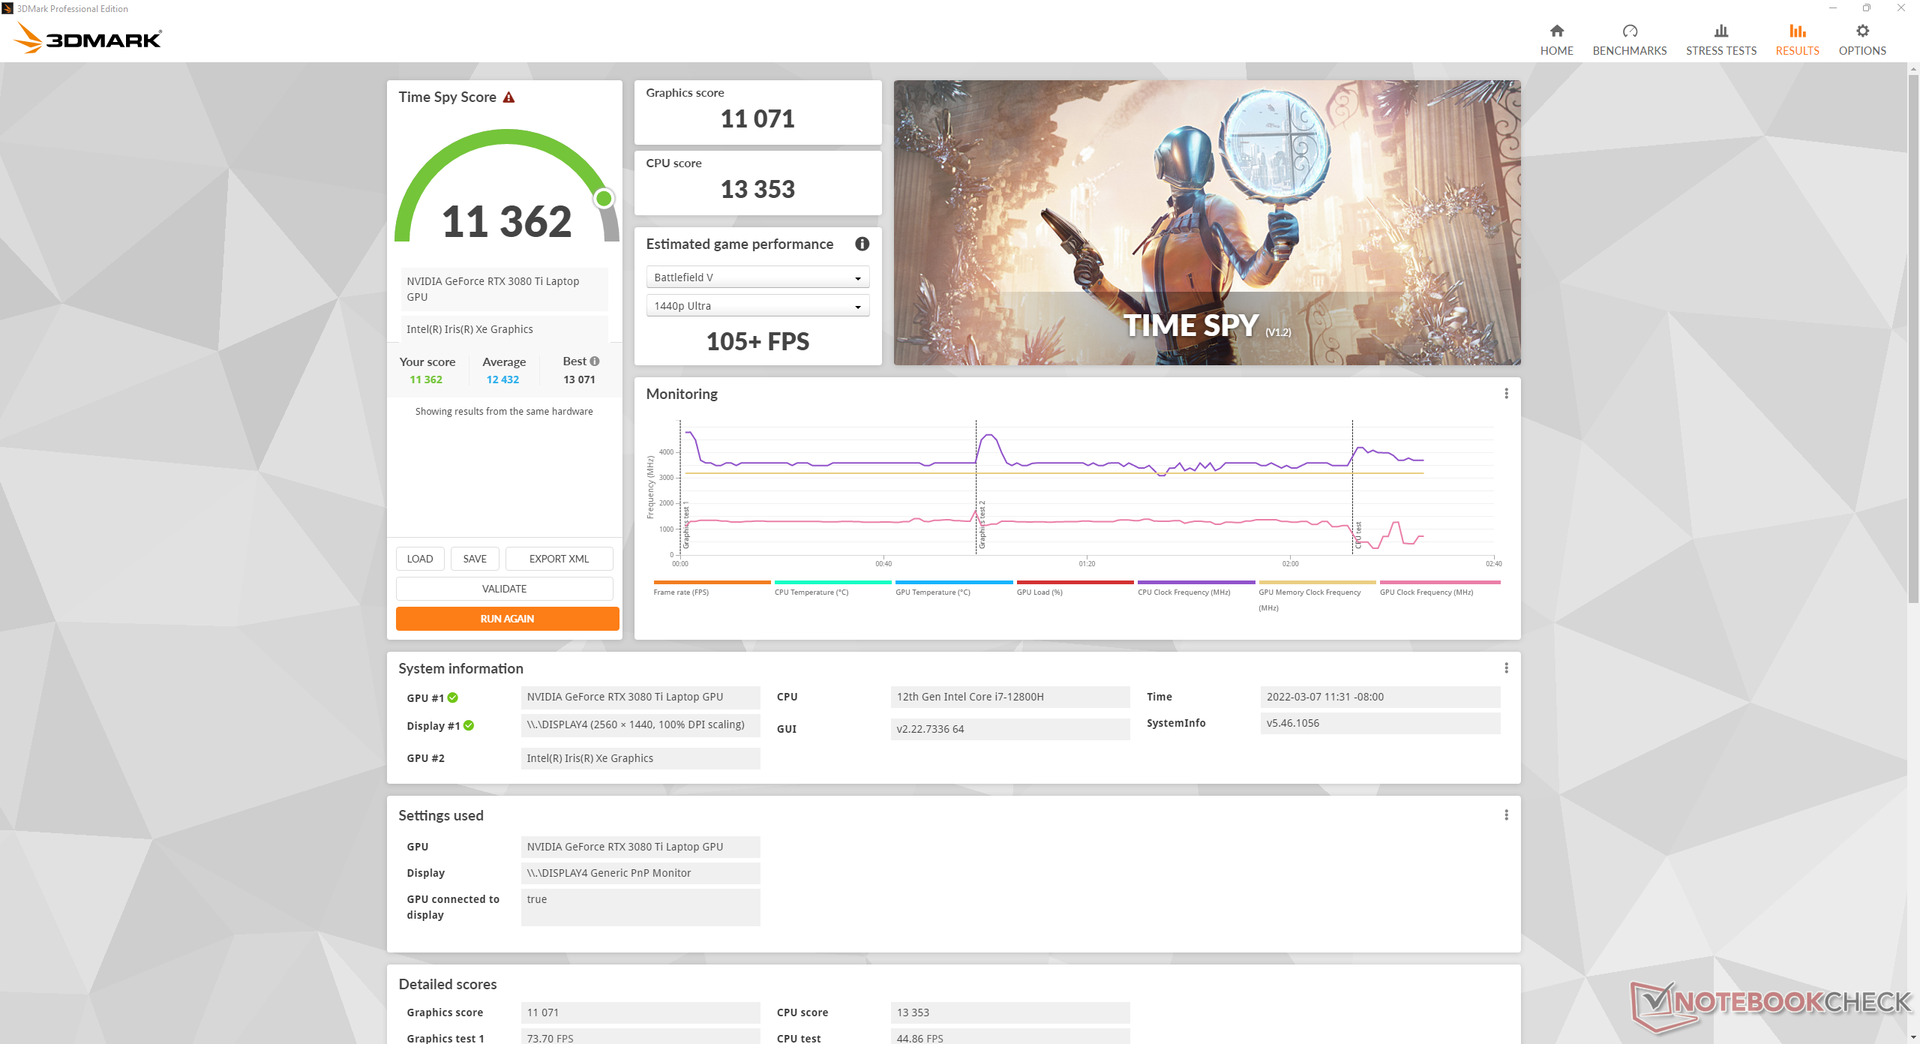
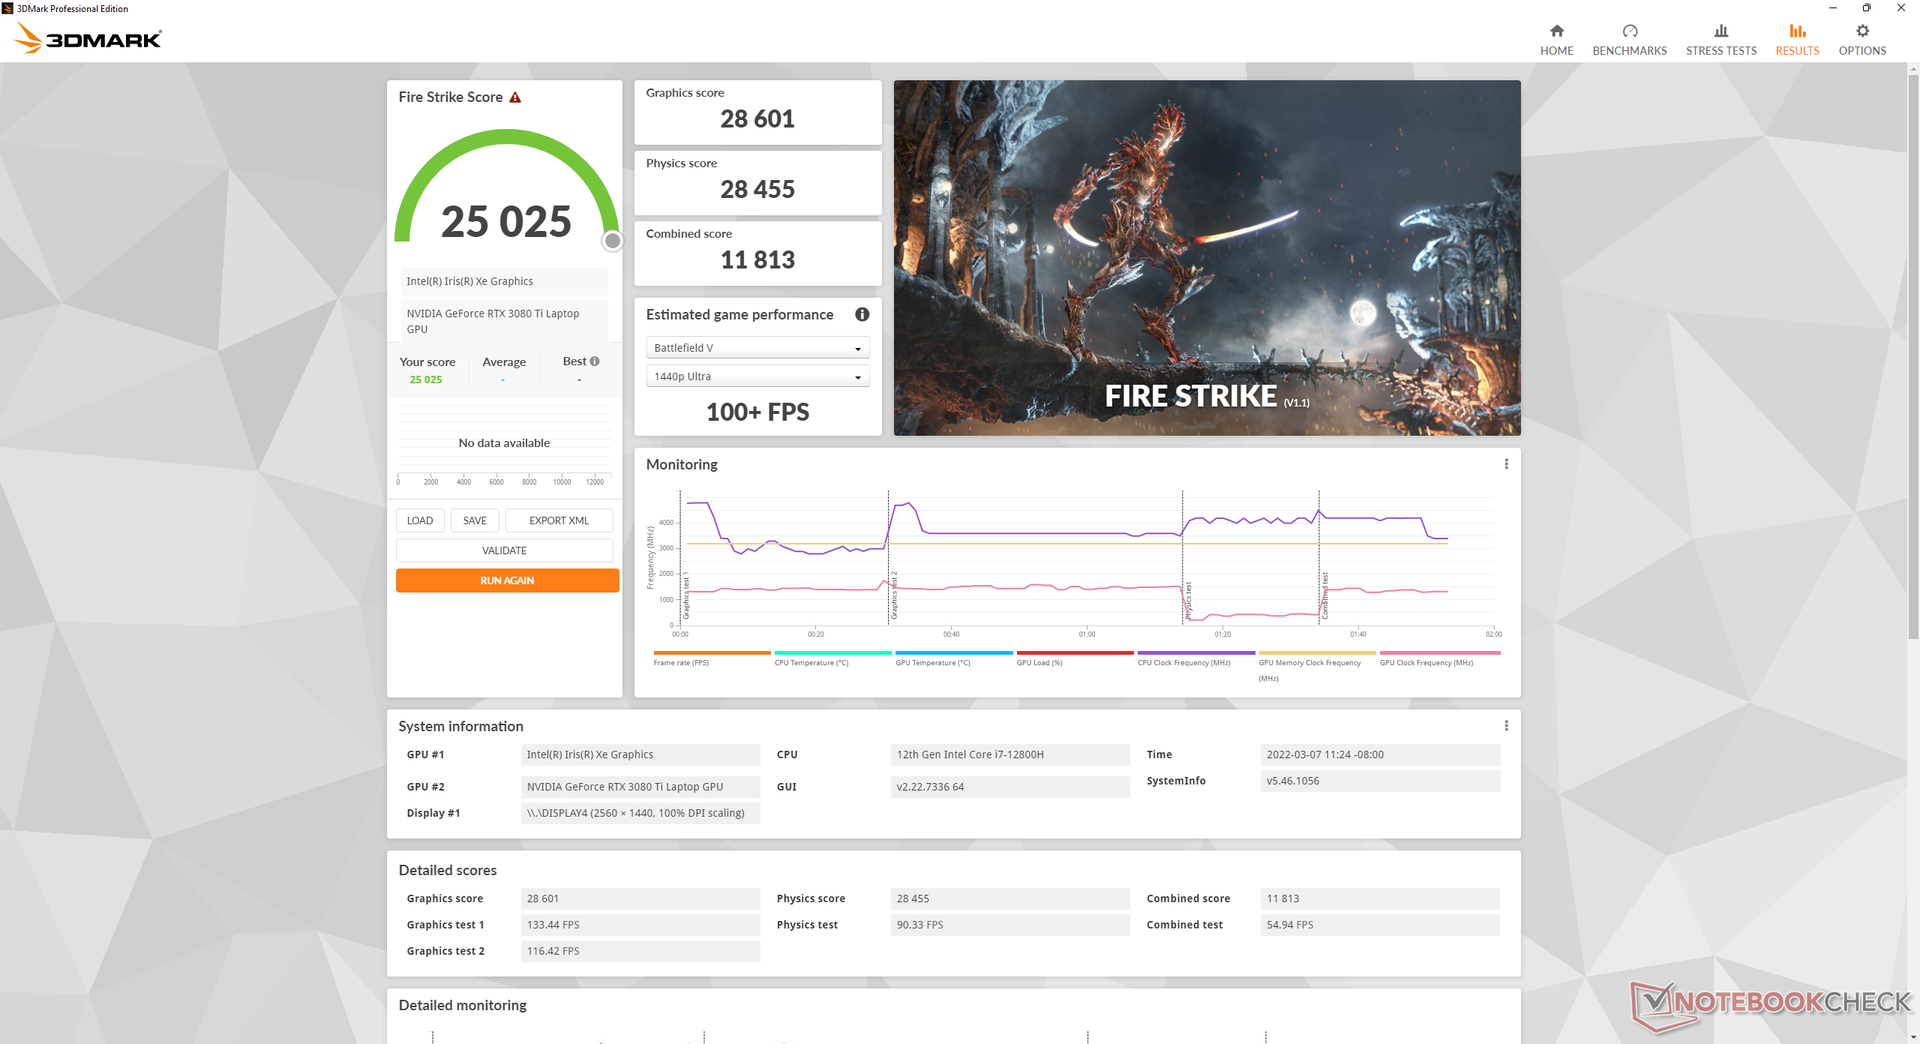
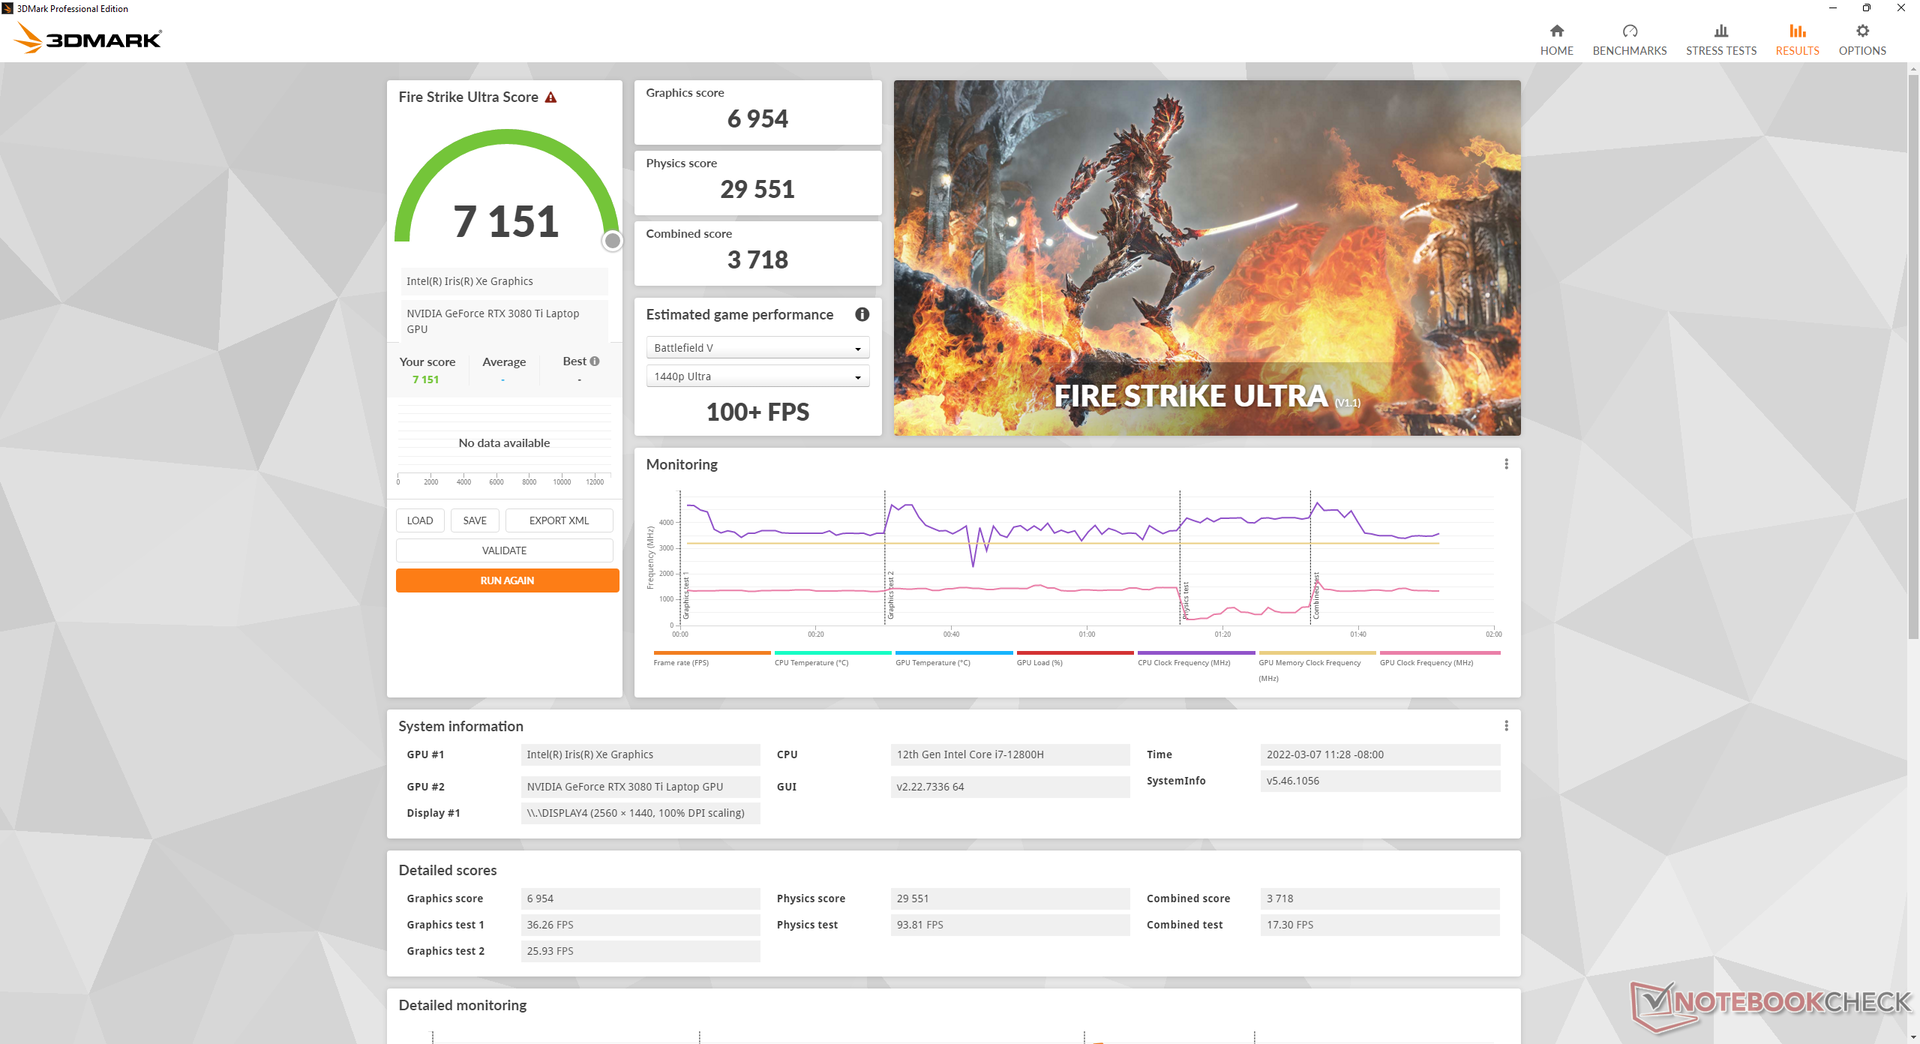
| 3DMark 11 Performance | 32299 Punkte | |
| 3DMark Cloud Gate Standard Score | 60579 Punkte | |
| 3DMark Fire Strike Score | 25025 Punkte | |
| 3DMark Time Spy Score | 11362 Punkte | |
Hilfe | ||
Witcher 3 FPS-Verlauf
| min. | mittel | hoch | max. | QHD | |
|---|---|---|---|---|---|
| GTA V (2015) | 186 | 181 | 177 | 118 | 97.8 |
| The Witcher 3 (2015) | 457.4 | 320.9 | 213.7 | 107.2 | |
| Dota 2 Reborn (2015) | 181 | 169 | 164 | 156 | |
| Final Fantasy XV Benchmark (2018) | 178 | 141 | 106 | 82.9 | |
| X-Plane 11.11 (2018) | 158 | 140 | 110 | ||
| Far Cry 5 (2018) | 179 | 151 | 144 | 135 | 107 |
| Strange Brigade (2018) | 442 | 252 | 205 | 184 | 132 |
Emissionen
Geräuschemissionen
Das Geräuschprofil hängt vom in Synapse gewählten Leistungsprofil ab. Wir empfehlen für das Surfen und Videostreaming den Modus "Leise", da die Lüfter ihre Drehzahl im Modus "Ausbalanciert" bzw. " Hochleistung" häufiger ändern. Der Nachteil am Modus "Leise" ist, dass sich die Handballenauflagen und die Geräteunterseite spürbar stärker erwärmen, da die Lüfter sich dann langsamer drehen.
Im Hochleistungsmodus beim Spielen von The Witcher 3 erzeugen die Lüfter mit rund 45 dB(A) ähnlich viel Lärm wie bisherige Blade-15-Modelle, sind jedoch zugleich deutlich leiser als die des konkurrierenden XPG Xenia 15 und Eurocom Nightsky ARX315. Wird die CPU deutlich stärker ausgelastet, kann die Geräuschkulisse auf den 49-bis-52-dB(A)-Bereich ansteigen.
Lautstärkediagramm
| Idle |
| 26.2 / 26.2 / 28.4 dB(A) |
| Last |
| 44.7 / 51.9 dB(A) |
 | ||
30 dB leise 40 dB(A) deutlich hörbar 50 dB(A) störend |
||
min: | ||
| Razer Blade 15 2022 GeForce RTX 3080 Ti Laptop GPU, i7-12800H, SSSTC CA6-8D1024 | Razer Blade 15 Advanced Model Early 2021 GeForce RTX 3080 Laptop GPU, i7-10875H, Samsung PM981a MZVLB1T0HBLR | Razer Blade 15 RTX 2080 Super Max-Q GeForce RTX 2080 Super Max-Q, i7-10875H, Samsung PM981a MZVLB1T0HBLR | Schenker XMG Neo 15 E22 (Early 2022, RTX 3080 Ti) GeForce RTX 3080 Ti Laptop GPU, i7-12700H, Samsung SSD 980 Pro 250GB MZ-V8P250BW | ADATA XPG Xenia 15 GeForce RTX 3070 Laptop GPU, i7-11800H, ADATA XPG Gammix S70 1TB | Eurocom Nightsky ARX315 GeForce RTX 3070 Laptop GPU, R9 5900X, Samsung SSD 980 Pro 1TB MZ-V8P1T0BW | |
|---|---|---|---|---|---|---|
| Geräuschentwicklung | -4% | -8% | 2% | 5% | -15% | |
| aus / Umgebung * (dB) | 25.4 | 24 6% | 30.1 -19% | 24 6% | 24.8 2% | 25.3 -0% |
| Idle min * (dB) | 26.2 | 26 1% | 30.1 -15% | 24 8% | 24.9 5% | 25.9 1% |
| Idle avg * (dB) | 26.2 | 28 -7% | 30.1 -15% | 24 8% | 24.9 5% | 27.9 -6% |
| Idle max * (dB) | 28.4 | 40 -41% | 30.1 -6% | 27.76 2% | 24.9 12% | 40.8 -44% |
| Last avg * (dB) | 44.7 | 45 -1% | 46.8 -5% | 38.81 13% | 28.8 36% | 55.2 -23% |
| Witcher 3 ultra * (dB) | 44.7 | 43 4% | 48.4 -8% | 54.2 -21% | 52.7 -18% | 52.4 -17% |
| Last max * (dB) | 51.9 | 45 13% | 46 11% | 54.18 -4% | 54.9 -6% | 60.3 -16% |
* ... kleinere Werte sind besser
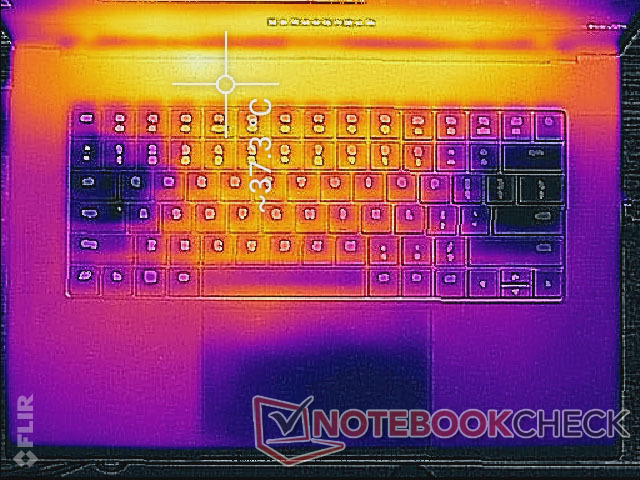
Temperatur
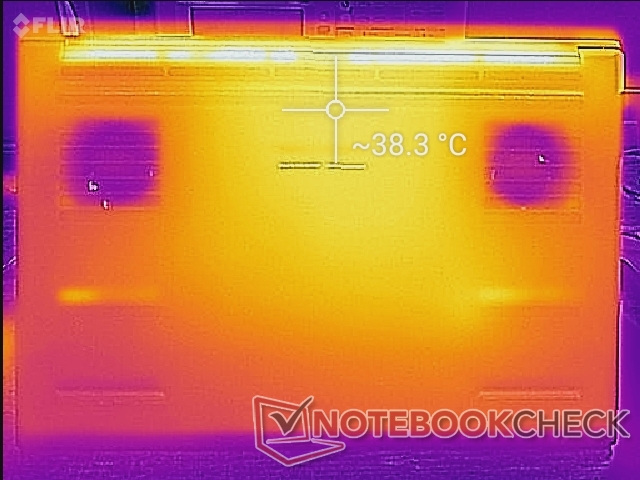
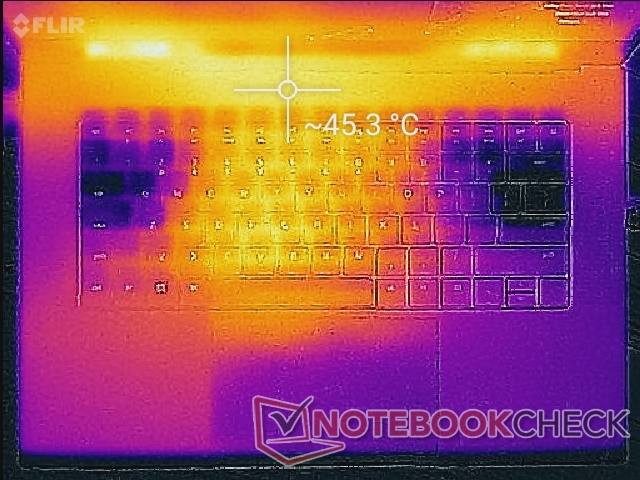
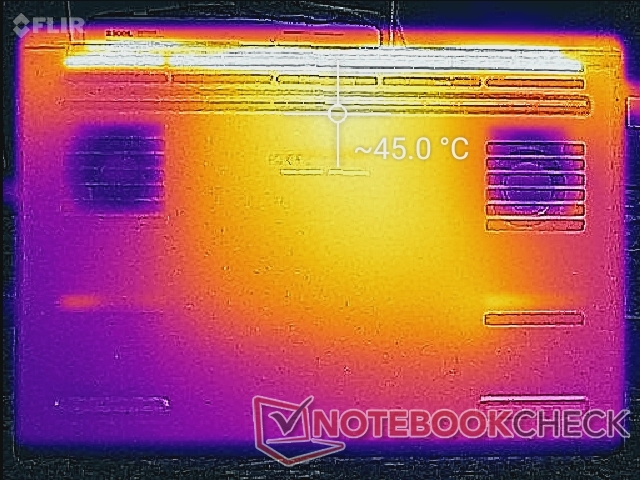
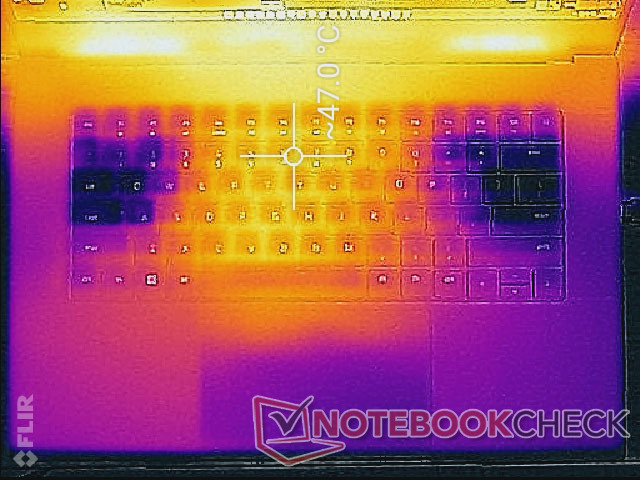
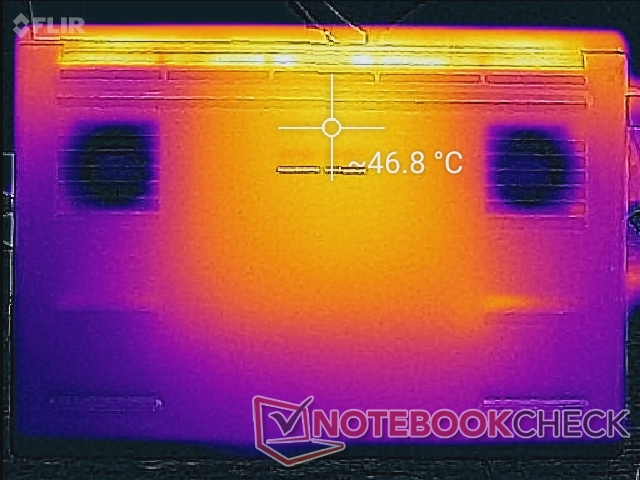
Die Oberflächen werden auch im Leerlauf auf dem Desktop warm. Die wärmsten Stellen auf der Ober- bzw. Unterseite erreichen jeweils über 37 °C und damit ähnliche Werte wie das ultradünne XPG Xenia 15 und das MSI Vector GP66 im gleichen Szenario. Im Gaming-Betrieb muss man in der Tastaturmitte mit einer hohen Temperatur von 48 °C rechnen.
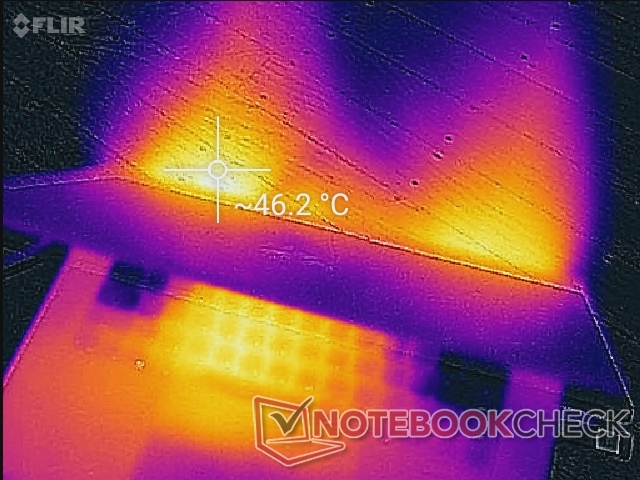
(-) Die maximale Temperatur auf der Oberseite ist 50 °C. Im Vergleich liegt der Klassendurchschnitt bei 40.4 °C (von 21.2 bis 68.8 °C für die Klasse Gaming).
(-) Auf der Unterseite messen wir eine maximalen Wert von 47 °C (im Vergleich zum Durchschnitt von 43.2 °C).
(±) Ohne Last messen wir eine durchschnittliche Temperatur von 32.4 °C auf der Oberseite. Der Klassendurchschnitt erreicht 33.9 °C.
(±) Beim längeren Spielen von The Witcher 3 erhitzt sich das Gerät durchschnittlich auf 36 °C. Der Durchschnitt der Klasse ist derzeit 33.9 °C.
(+) Die Handballen und der Touchpad-Bereich erreichen maximal 34 °C und damit die typische Hauttemperatur und fühlen sich daher nicht heiß an.
(-) Die durchschnittliche Handballen-Temperatur anderer getesteter Geräte war 28.8 °C (-5.2 °C).
| Razer Blade 15 2022 Intel Core i7-12800H, NVIDIA GeForce RTX 3080 Ti Laptop GPU | Razer Blade 15 Advanced Model Early 2021 Intel Core i7-10875H, NVIDIA GeForce RTX 3080 Laptop GPU | Razer Blade 15 RTX 2080 Super Max-Q Intel Core i7-10875H, NVIDIA GeForce RTX 2080 Super Max-Q | Schenker XMG Neo 15 E22 (Early 2022, RTX 3080 Ti) Intel Core i7-12700H, NVIDIA GeForce RTX 3080 Ti Laptop GPU | ADATA XPG Xenia 15 Intel Core i7-11800H, NVIDIA GeForce RTX 3070 Laptop GPU | Eurocom Nightsky ARX315 AMD Ryzen 9 5900X, NVIDIA GeForce RTX 3070 Laptop GPU | |
|---|---|---|---|---|---|---|
| Hitze | 6% | 7% | -7% | -12% | 6% | |
| Last oben max * (°C) | 50 | 49 2% | 52 -4% | 52 -4% | 49 2% | 36.2 28% |
| Last unten max * (°C) | 47 | 54 -15% | 53 -13% | 68 -45% | 64.2 -37% | 49.6 -6% |
| Idle oben max * (°C) | 37.4 | 30 20% | 29.3 22% | 32 14% | 37.6 -1% | 32.6 13% |
| Idle unten max * (°C) | 38.4 | 32 17% | 30.2 21% | 36 6% | 42.2 -10% | 43.2 -13% |
* ... kleinere Werte sind besser
Stresstest
Beim Auslasten der CPU mit Prime95 erreicht diese in den ersten paar Sekunden eine Taktfrequenz von 3,1 GHz und darauf eine Temperatur von 80 °C. Anschließend fallen der Takt und die Temperatur und stabilisieren sich bei 2,2 GHz bzw. 66 °C. Die "CPU Package Power" fällt dabei von der anfänglichen 90-W-Spitze auf konstantere 55 W.
The Witcher 3 zu spielen resultiert in CPU- und GPU-Temperaturen von 74 °C bzw. 67 °C, während es beim Blade 15 RTX 3080 aus dem Vorjahr 73 °C bzw. 71 °C waren (Blade 15 Basismodell: 67 °C bzw. 75 °C). Trotz der erhöhten CPU- und GPU-Leistung sind die Kerntemperaturen also relativ vergleichbar.
Im Akkumodus ist die Leistung eingeschränkt. Ein Fire-Strike-Test liefert im Akkumodus Physik- und Grafikpunktzahlen von 10.560 bzw. 8.439 Punkten, während im Netzbetrieb 28.455 bzw. 28.601 Punkte erreicht werden.
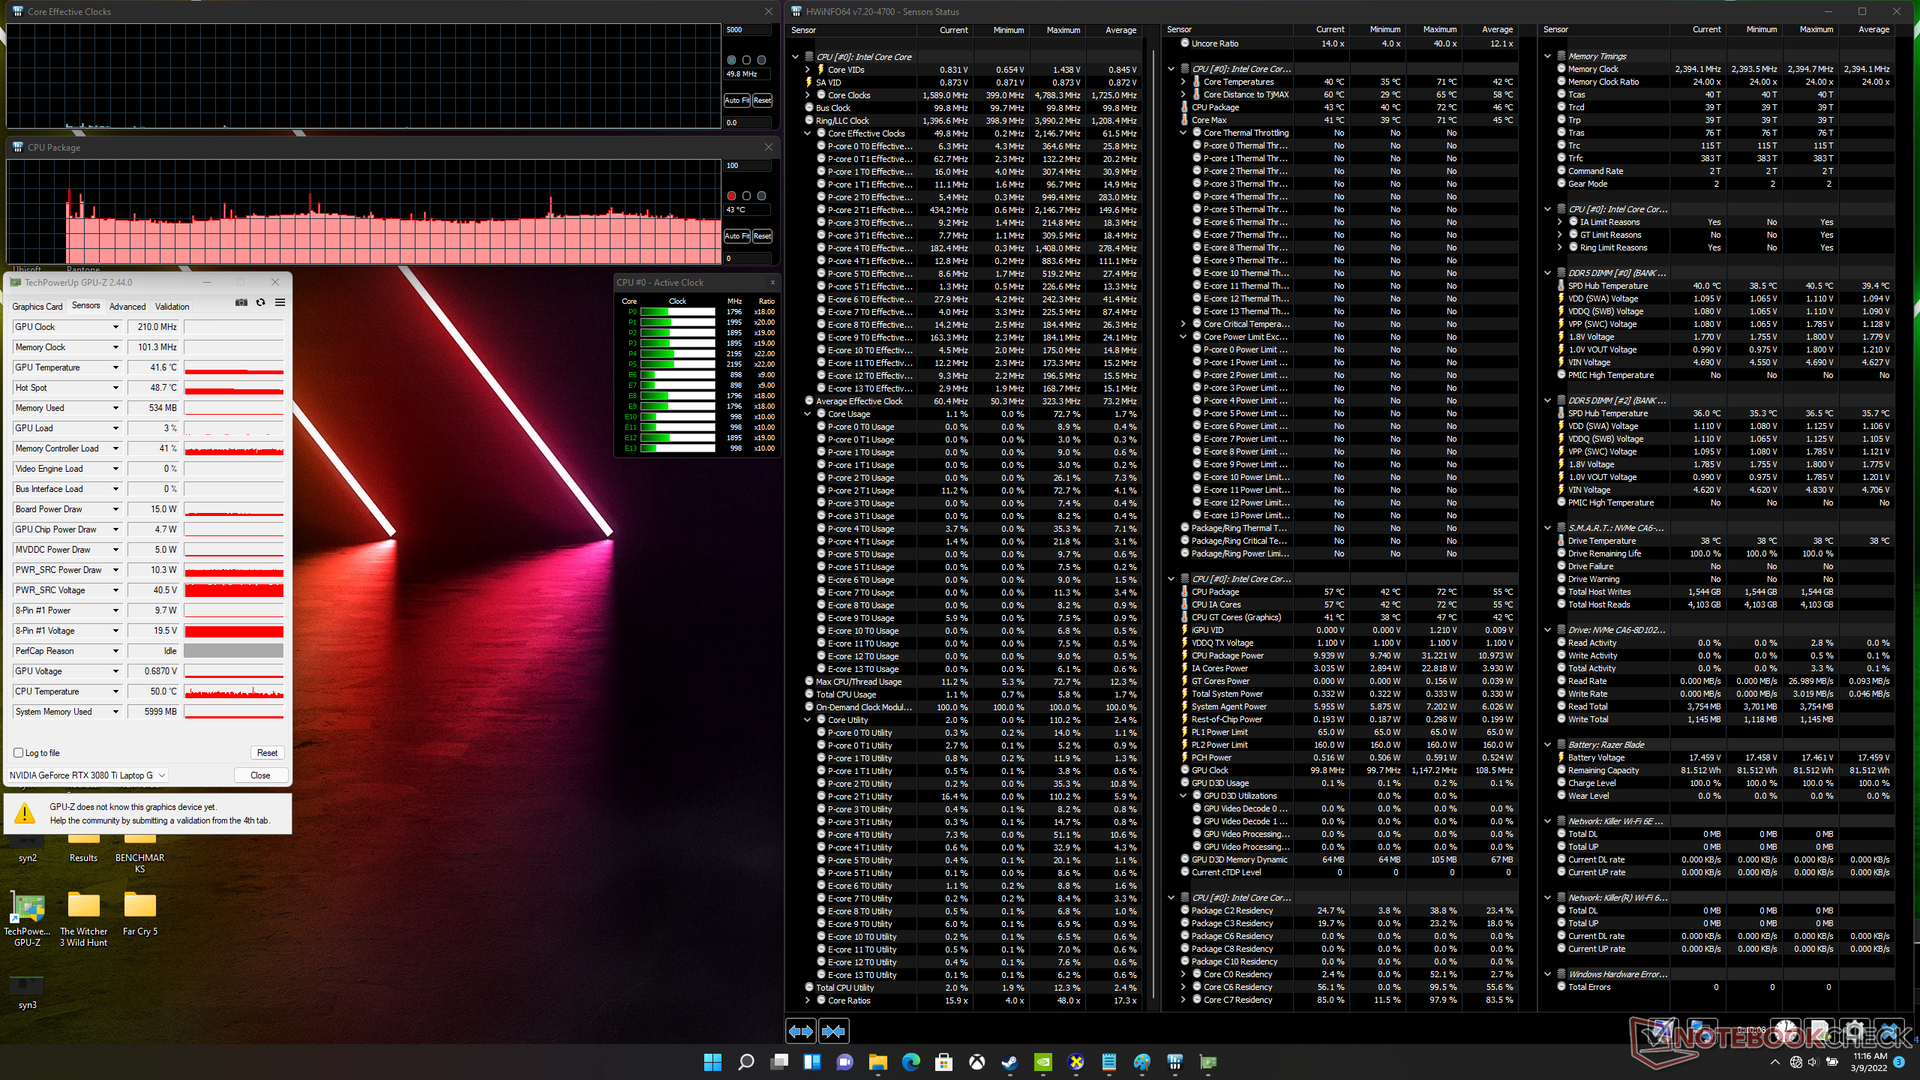
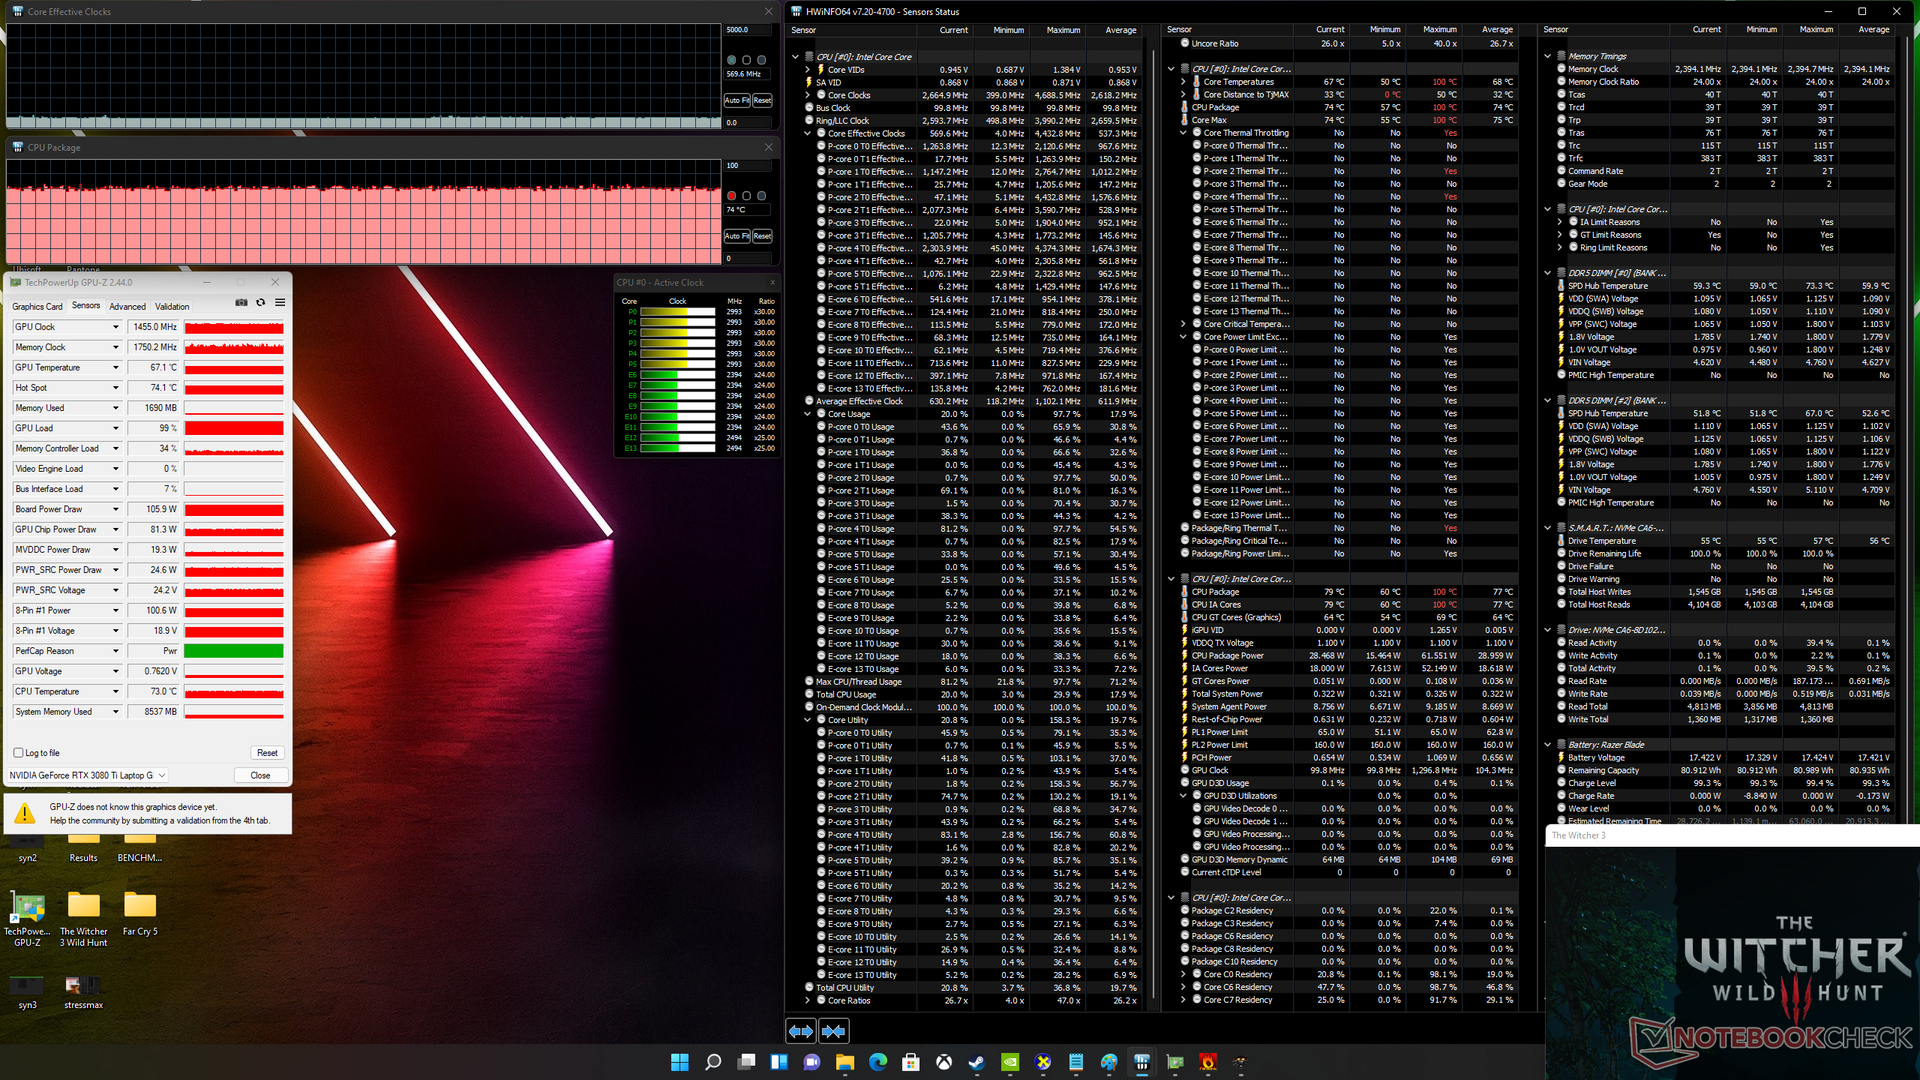
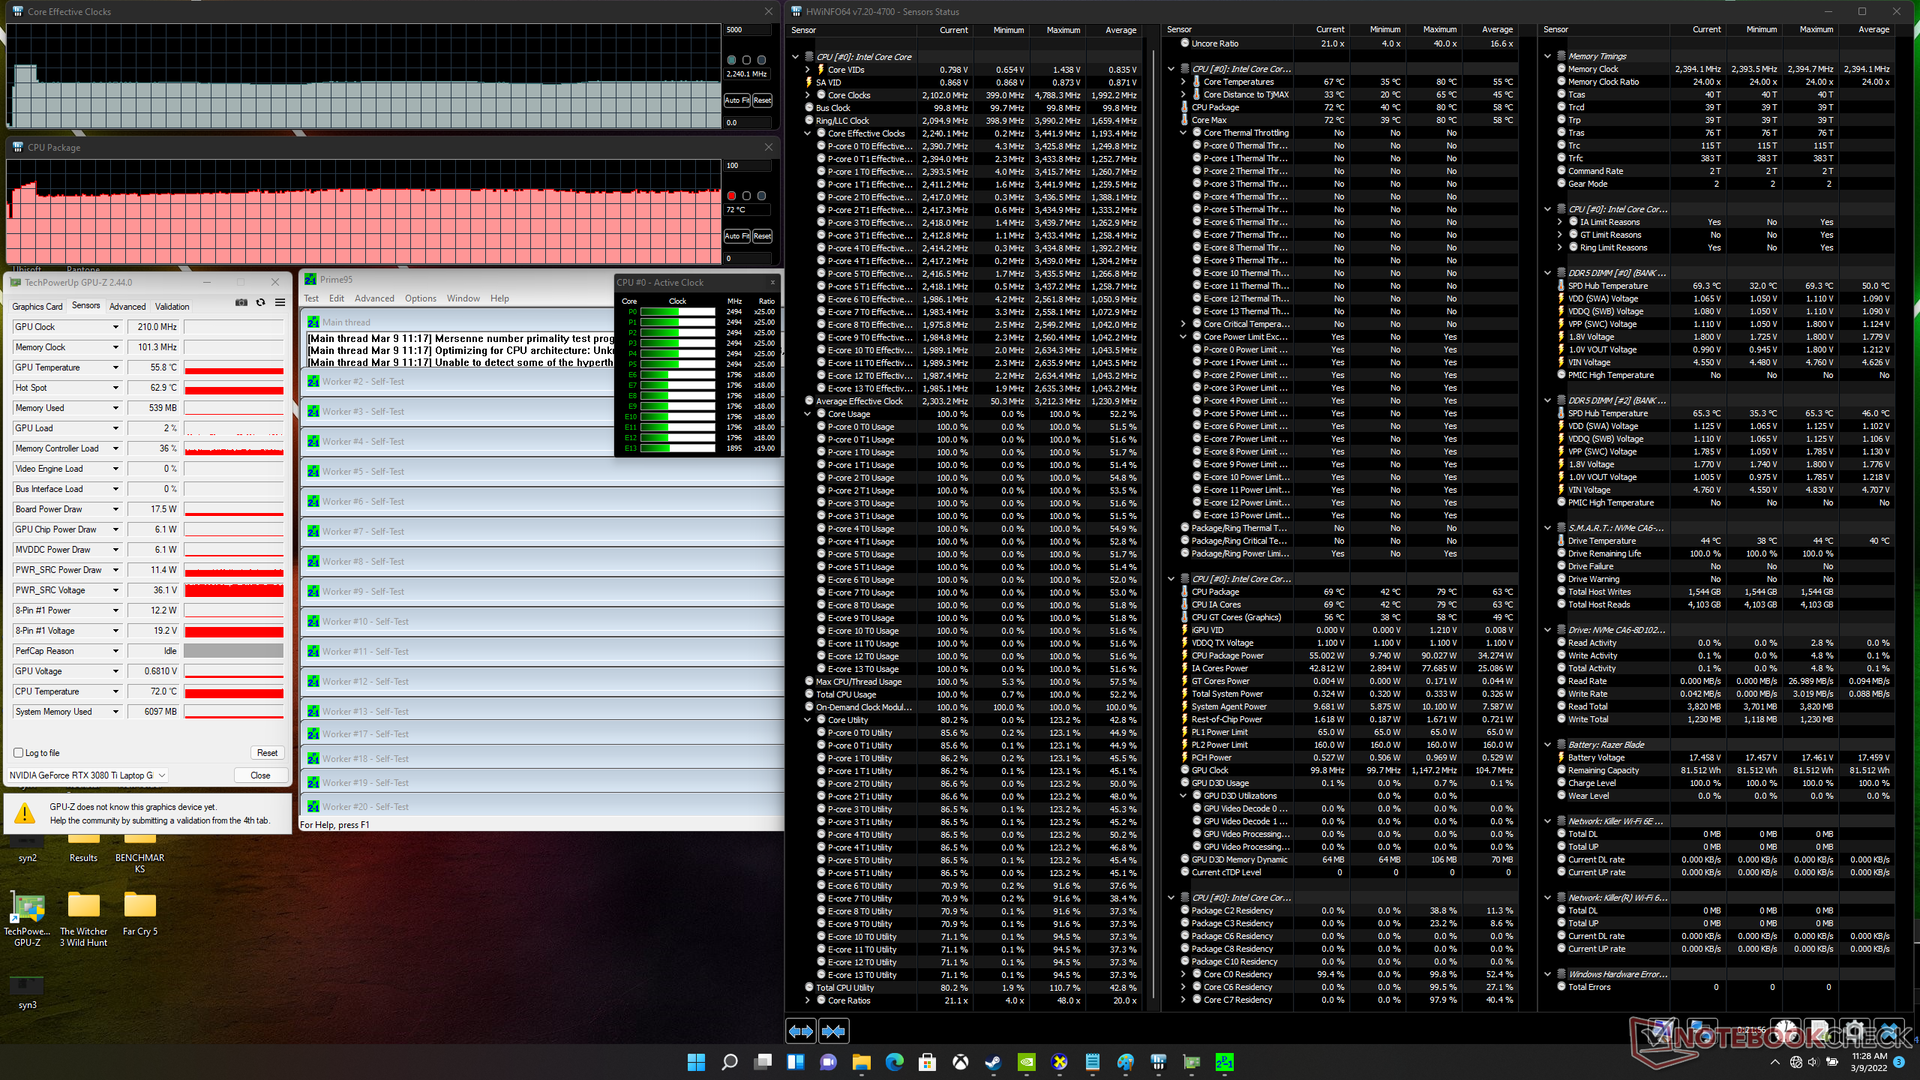
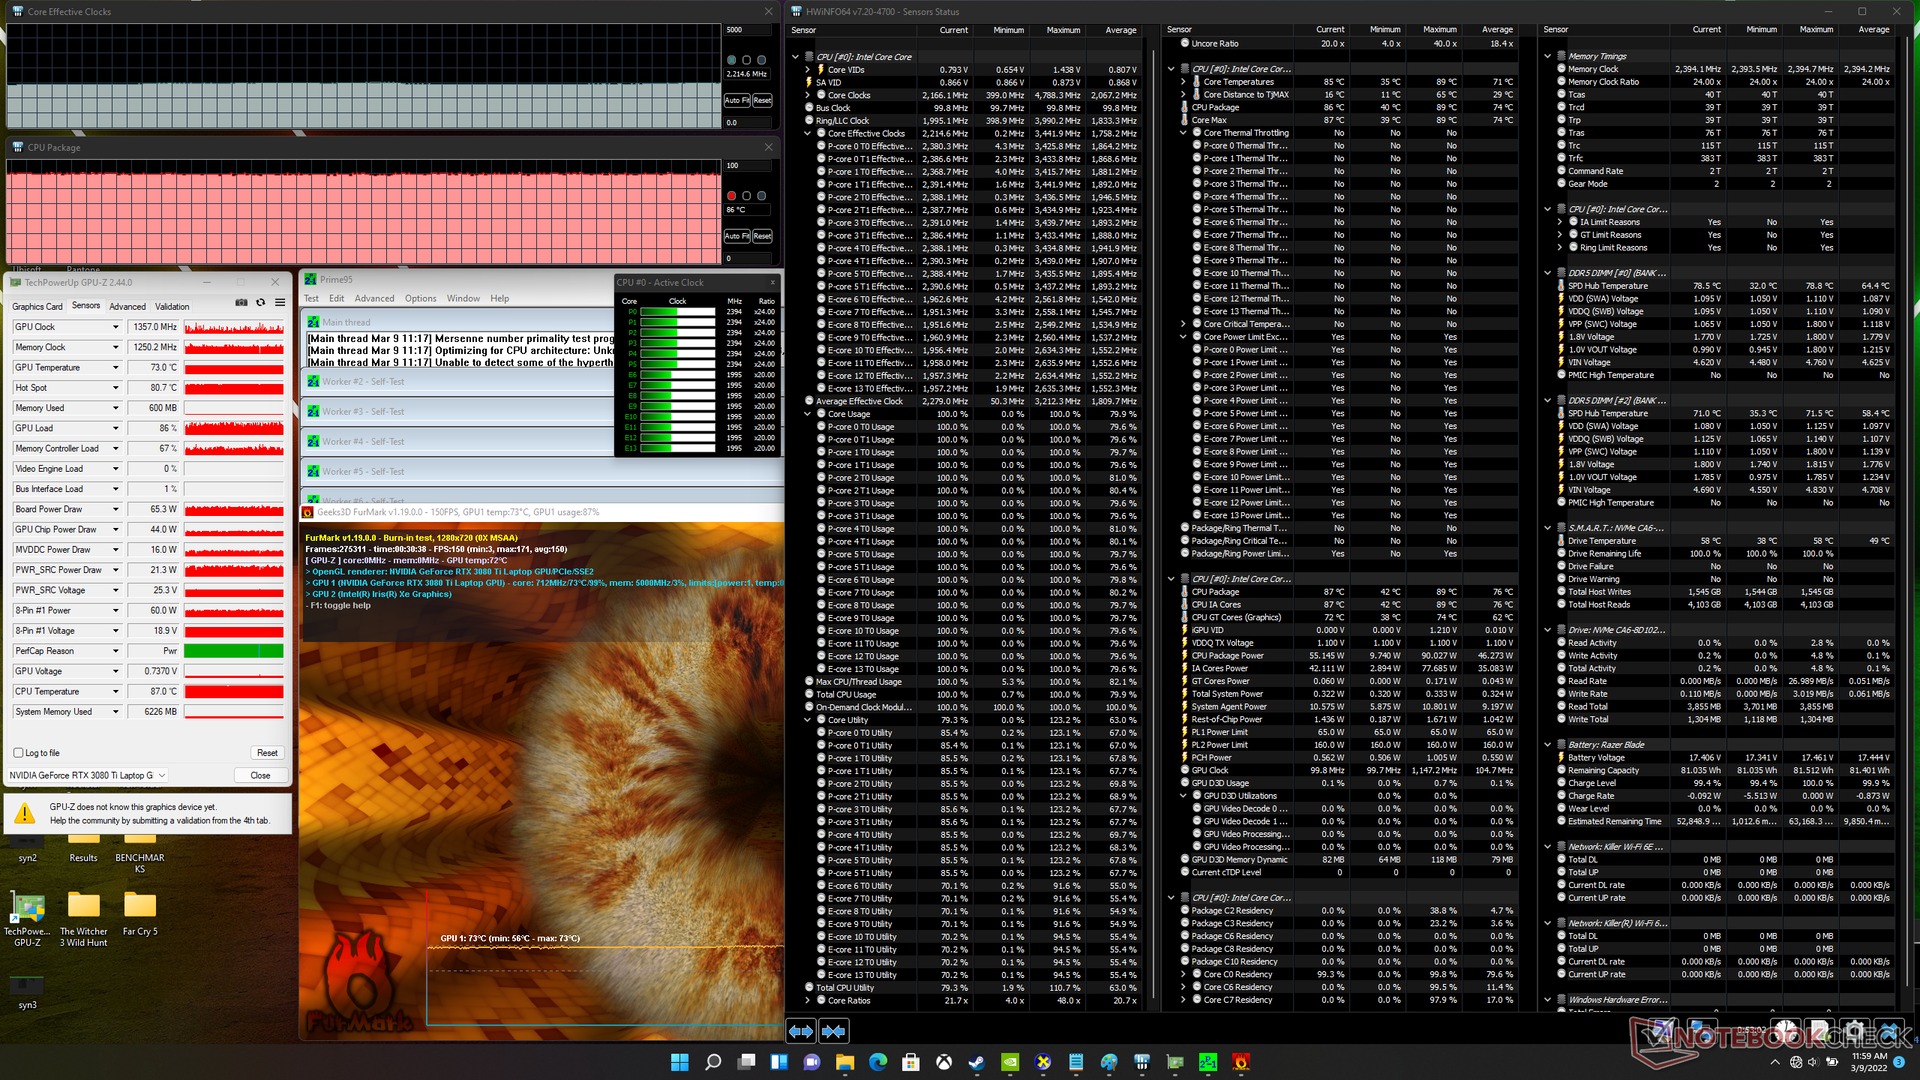
| CPU-Takt (GHz) | GPU-Takt (MHz) | Durchschnittliche CPU-Temperatur (°C) | Durchschnittliche GPU-Temperatur (°C) | |
| Leerlauf | -- | -- | 43 | 42 |
| Prime95-Stress | 2,2 | -- | 72 | 56 |
| Prime95-+FurMark-Stress | 2,2 | ~1.357 | 86 | 73 |
| Witcher-3-Stress | 0,6 | 1.455 | 74 | 67 |
Lautsprecher
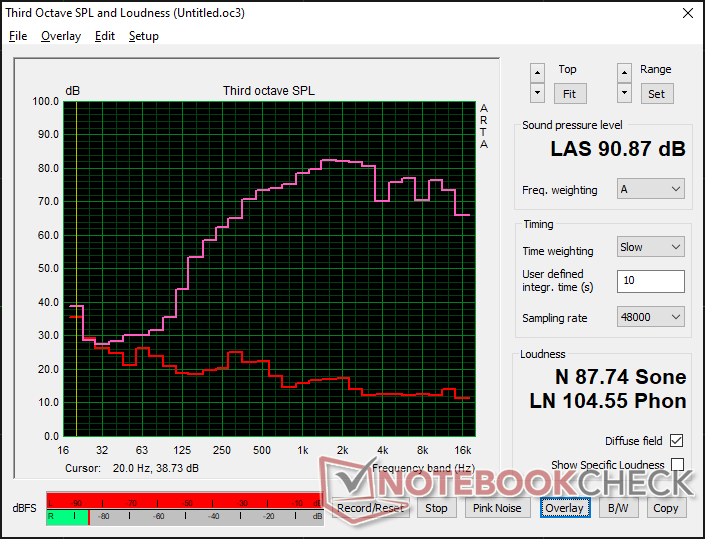
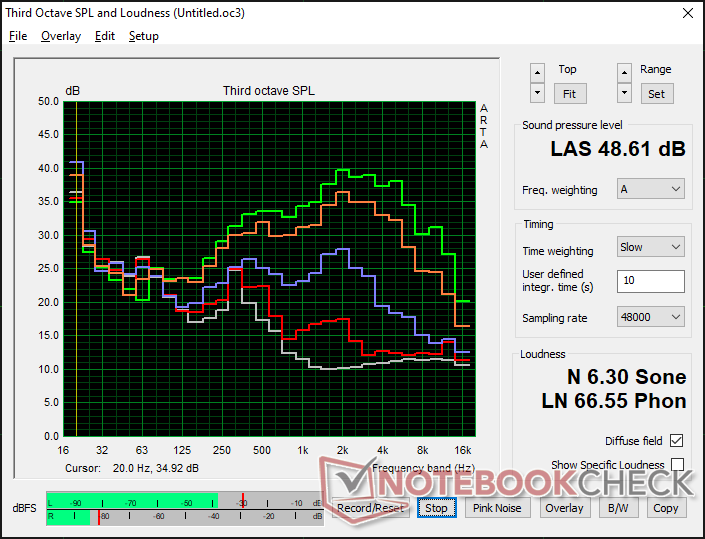
Razer Blade 15 2022 Audio Analyse
(+) | Die Lautsprecher können relativ laut spielen (90.9 dB)
Bass 100 - 315 Hz
(-) | kaum Bass - 21% niedriger als der Median
(±) | durchschnittlich lineare Bass-Wiedergabe (9.7% Delta zum Vorgänger)
Mitteltöne 400 - 2000 Hz
(+) | ausgeglichene Mitten, vom Median nur 3.9% abweichend
(+) | lineare Mitten (3.9% Delta zum Vorgänger)
Hochtöne 2 - 16 kHz
(+) | ausgeglichene Hochtöne, vom Median nur 4.2% abweichend
(±) | durchschnittlich lineare Hochtöne (7.8% Delta zum Vorgänger)
Gesamt im hörbaren Bereich 100 - 16.000 Hz
(±) | hörbarer Bereich ist durchschnittlich linear (15.7% Abstand zum Median)
Im Vergleich zu allen Geräten derselben Klasse
» 37% aller getesteten Geräte dieser Klasse waren besser, 7% vergleichbar, 57% schlechter
» Das beste Gerät hat einen Delta-Wert von 6%, durchschnittlich ist 18%, das schlechteste Gerät hat 132%
Im Vergleich zu allen Geräten im Test
» 24% aller getesteten Geräte waren besser, 5% vergleichbar, 71% schlechter
» Das beste Gerät hat einen Delta-Wert von 4%, durchschnittlich ist 23%, das schlechteste Gerät hat 134%
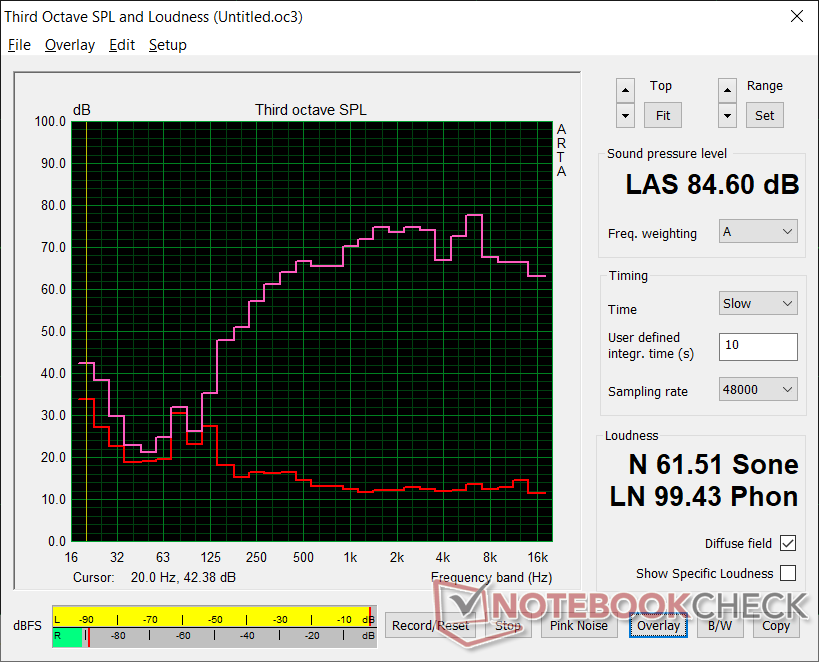
Apple MacBook Pro 16 2021 M1 Pro Audio Analyse
(+) | Die Lautsprecher können relativ laut spielen (84.7 dB)
Bass 100 - 315 Hz
(+) | guter Bass - nur 3.8% Abweichung vom Median
(+) | lineare Bass-Wiedergabe (5.2% Delta zum Vorgänger)
Mitteltöne 400 - 2000 Hz
(+) | ausgeglichene Mitten, vom Median nur 1.3% abweichend
(+) | lineare Mitten (2.1% Delta zum Vorgänger)
Hochtöne 2 - 16 kHz
(+) | ausgeglichene Hochtöne, vom Median nur 1.9% abweichend
(+) | sehr lineare Hochtöne (2.7% Delta zum Vorgänger)
Gesamt im hörbaren Bereich 100 - 16.000 Hz
(+) | hörbarer Bereich ist sehr linear (4.6% Abstand zum Median
Im Vergleich zu allen Geräten derselben Klasse
» 0% aller getesteten Geräte dieser Klasse waren besser, 0% vergleichbar, 100% schlechter
» Das beste Gerät hat einen Delta-Wert von 5%, durchschnittlich ist 17%, das schlechteste Gerät hat 45%
Im Vergleich zu allen Geräten im Test
» 0% aller getesteten Geräte waren besser, 0% vergleichbar, 100% schlechter
» Das beste Gerät hat einen Delta-Wert von 4%, durchschnittlich ist 23%, das schlechteste Gerät hat 134%
Energieverwaltung
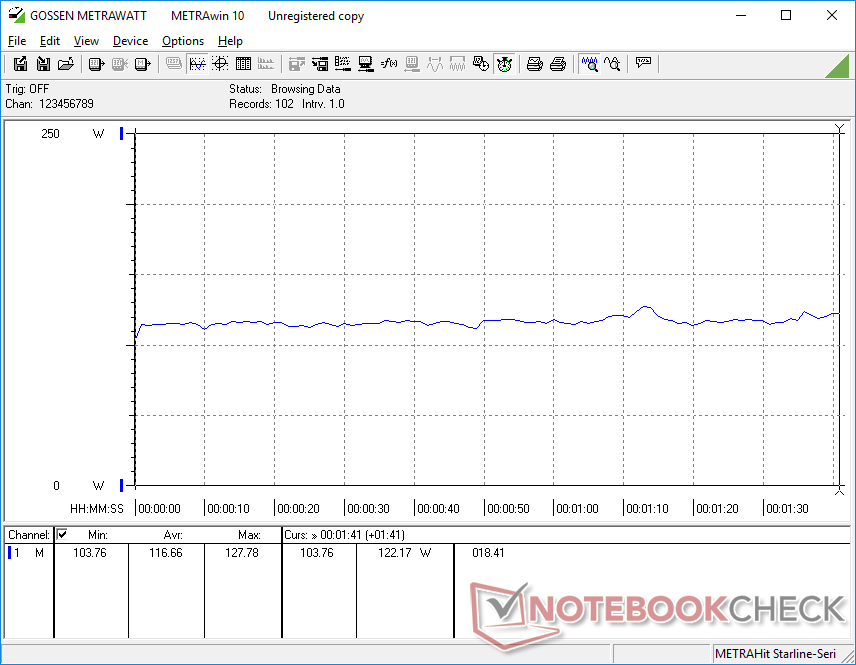
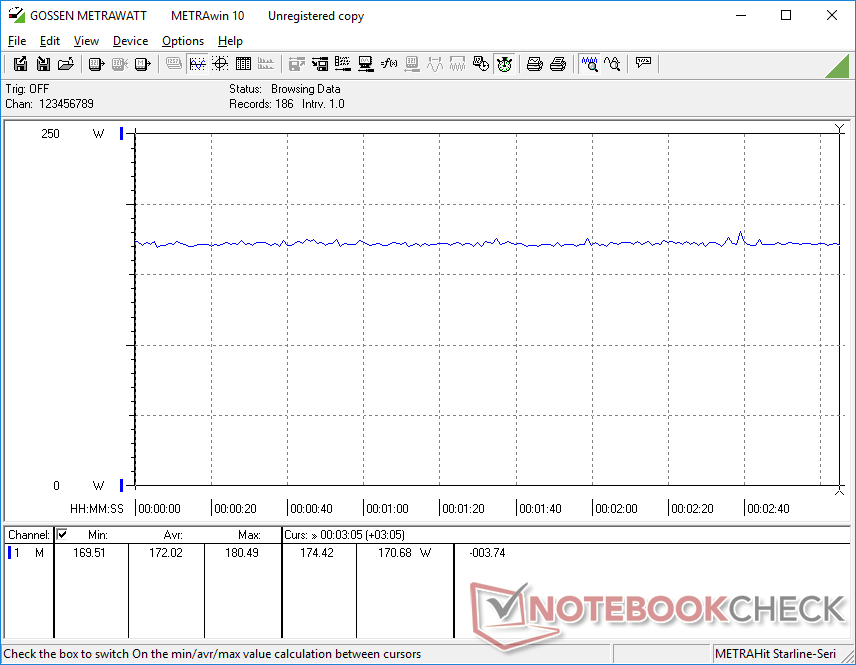
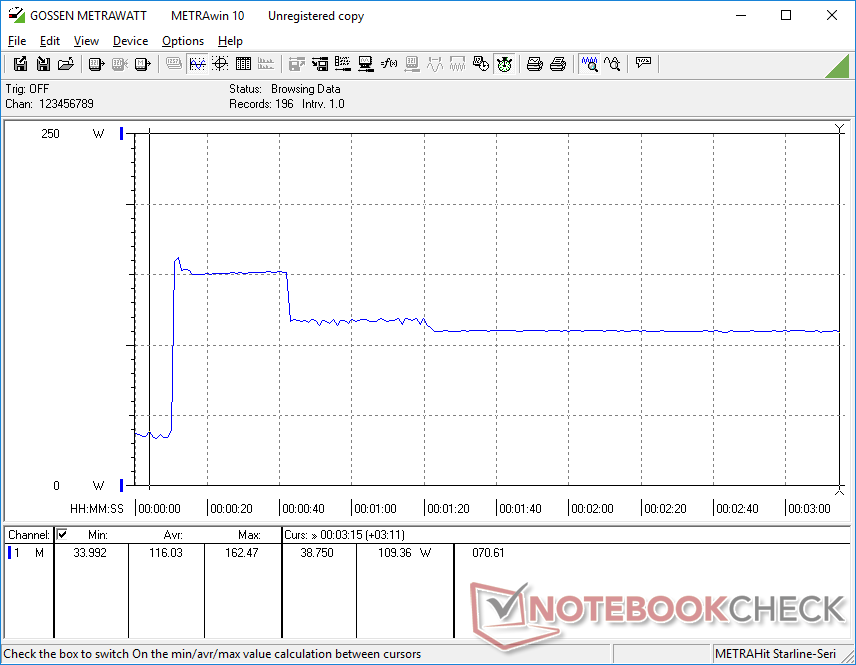
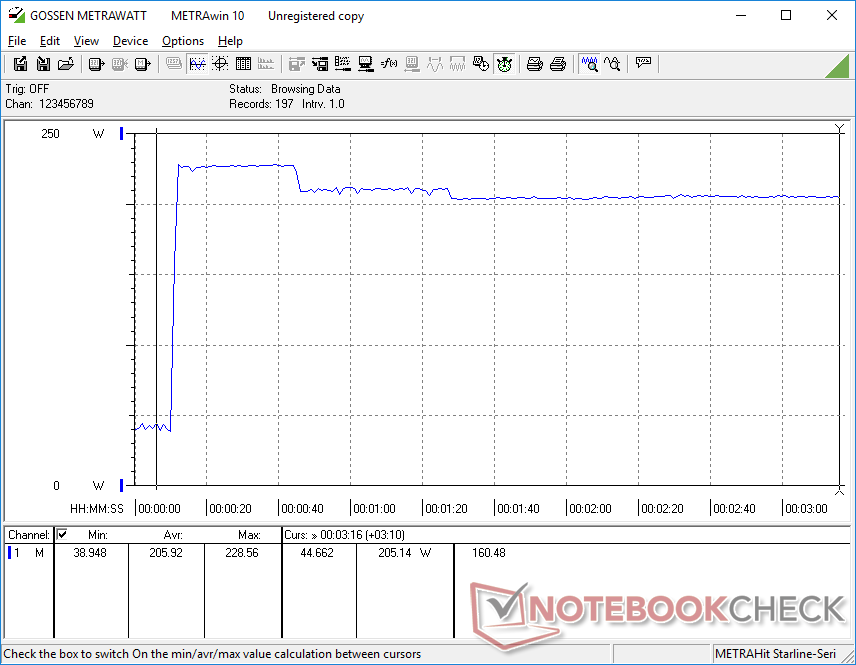
Energieaufnahme
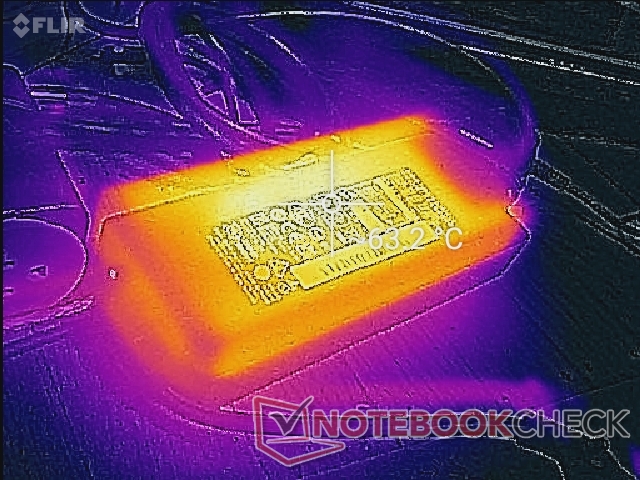
Im Vergleich zum Blade 15 aus dem Frühjahr 2021 bekommt man hier mehr als die doppelte Multi-Core-CPU-Leistung und zusätzlich 15 bis 25 % Grafikleistung. Der Verbrauch unseres aktuellen Blade-15-Modell ist unter maximaler Last dementsprechend um bis zu 60 W und im Gaming-Betrieb um ca. 30 W höher. Das Schenker XMG Neo 15 E22 und dessen 175-W-RTX-3080-Ti weisen einen noch höheren Verbrauch auf als unser Blade 15 mit 110-W-RTX-3080-Ti.
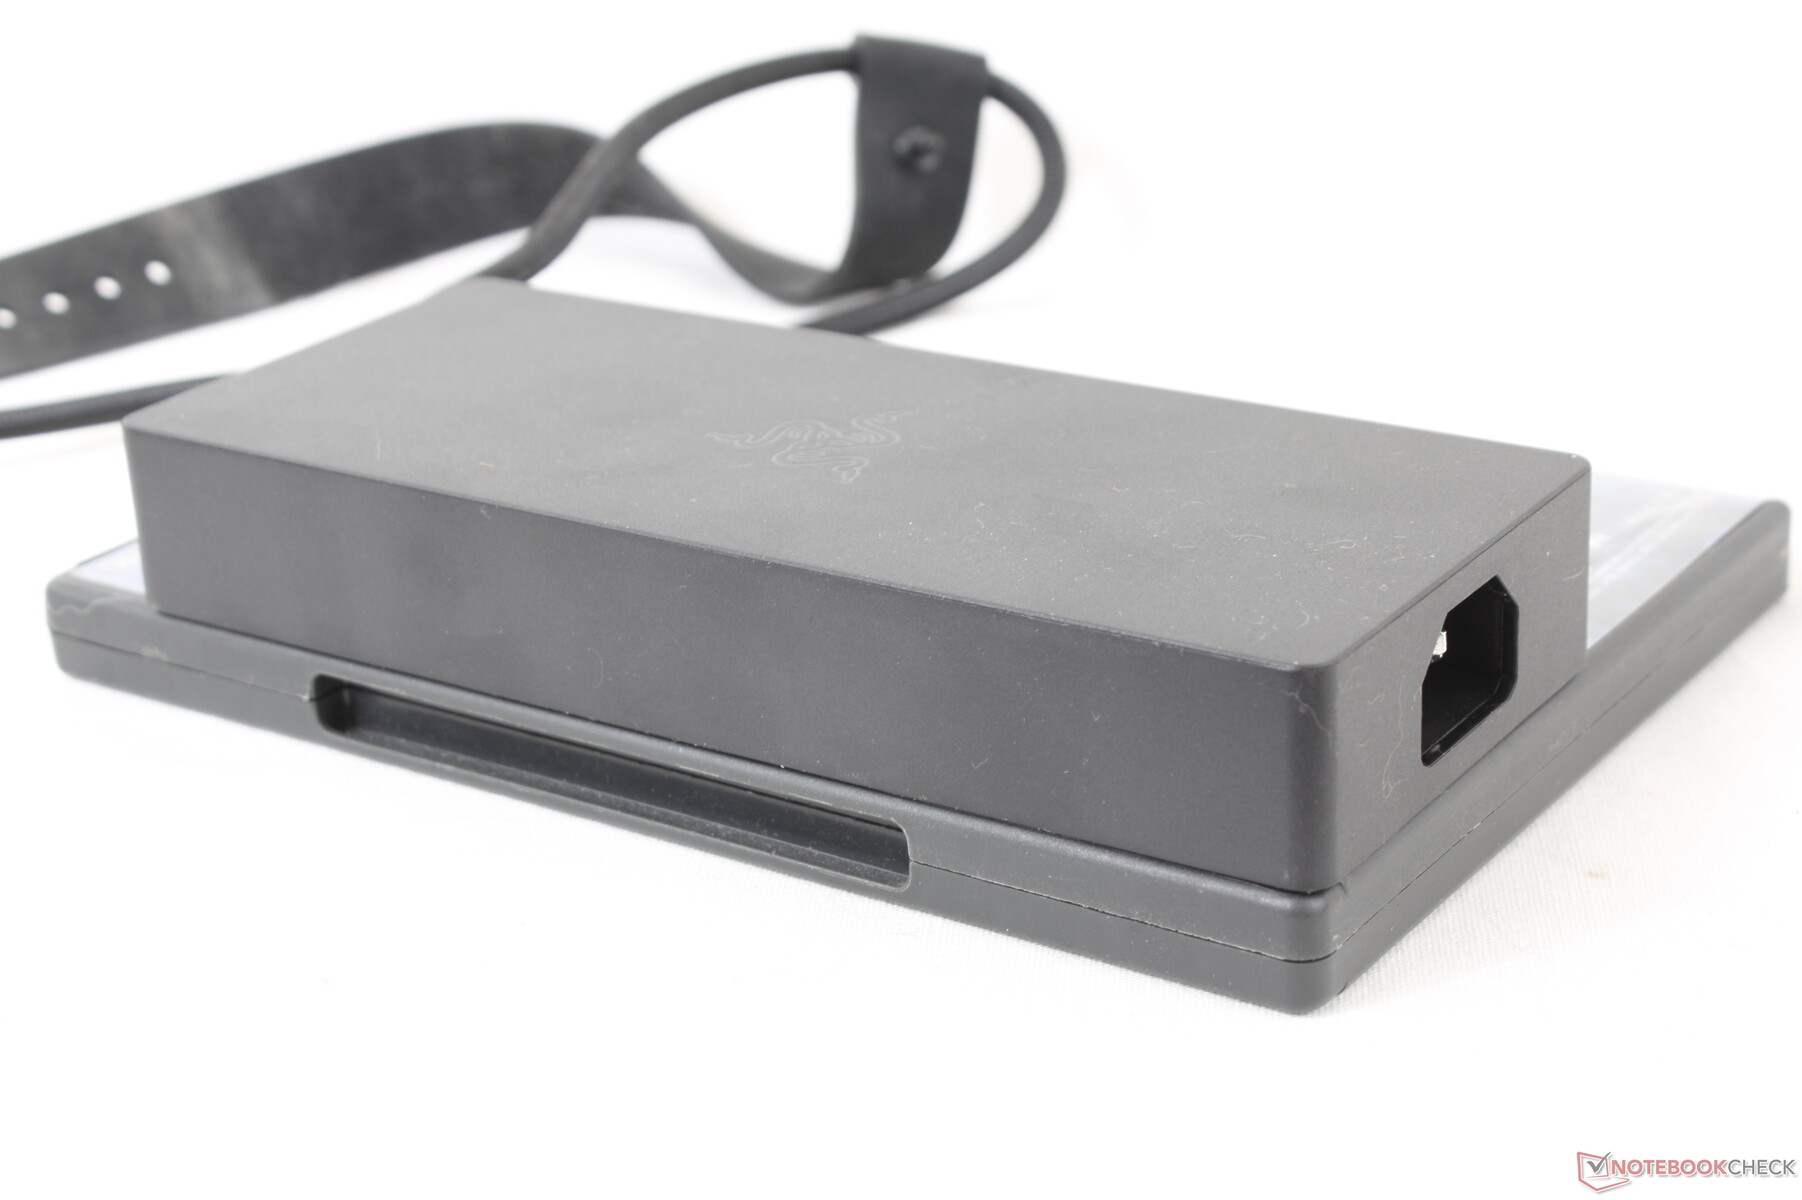
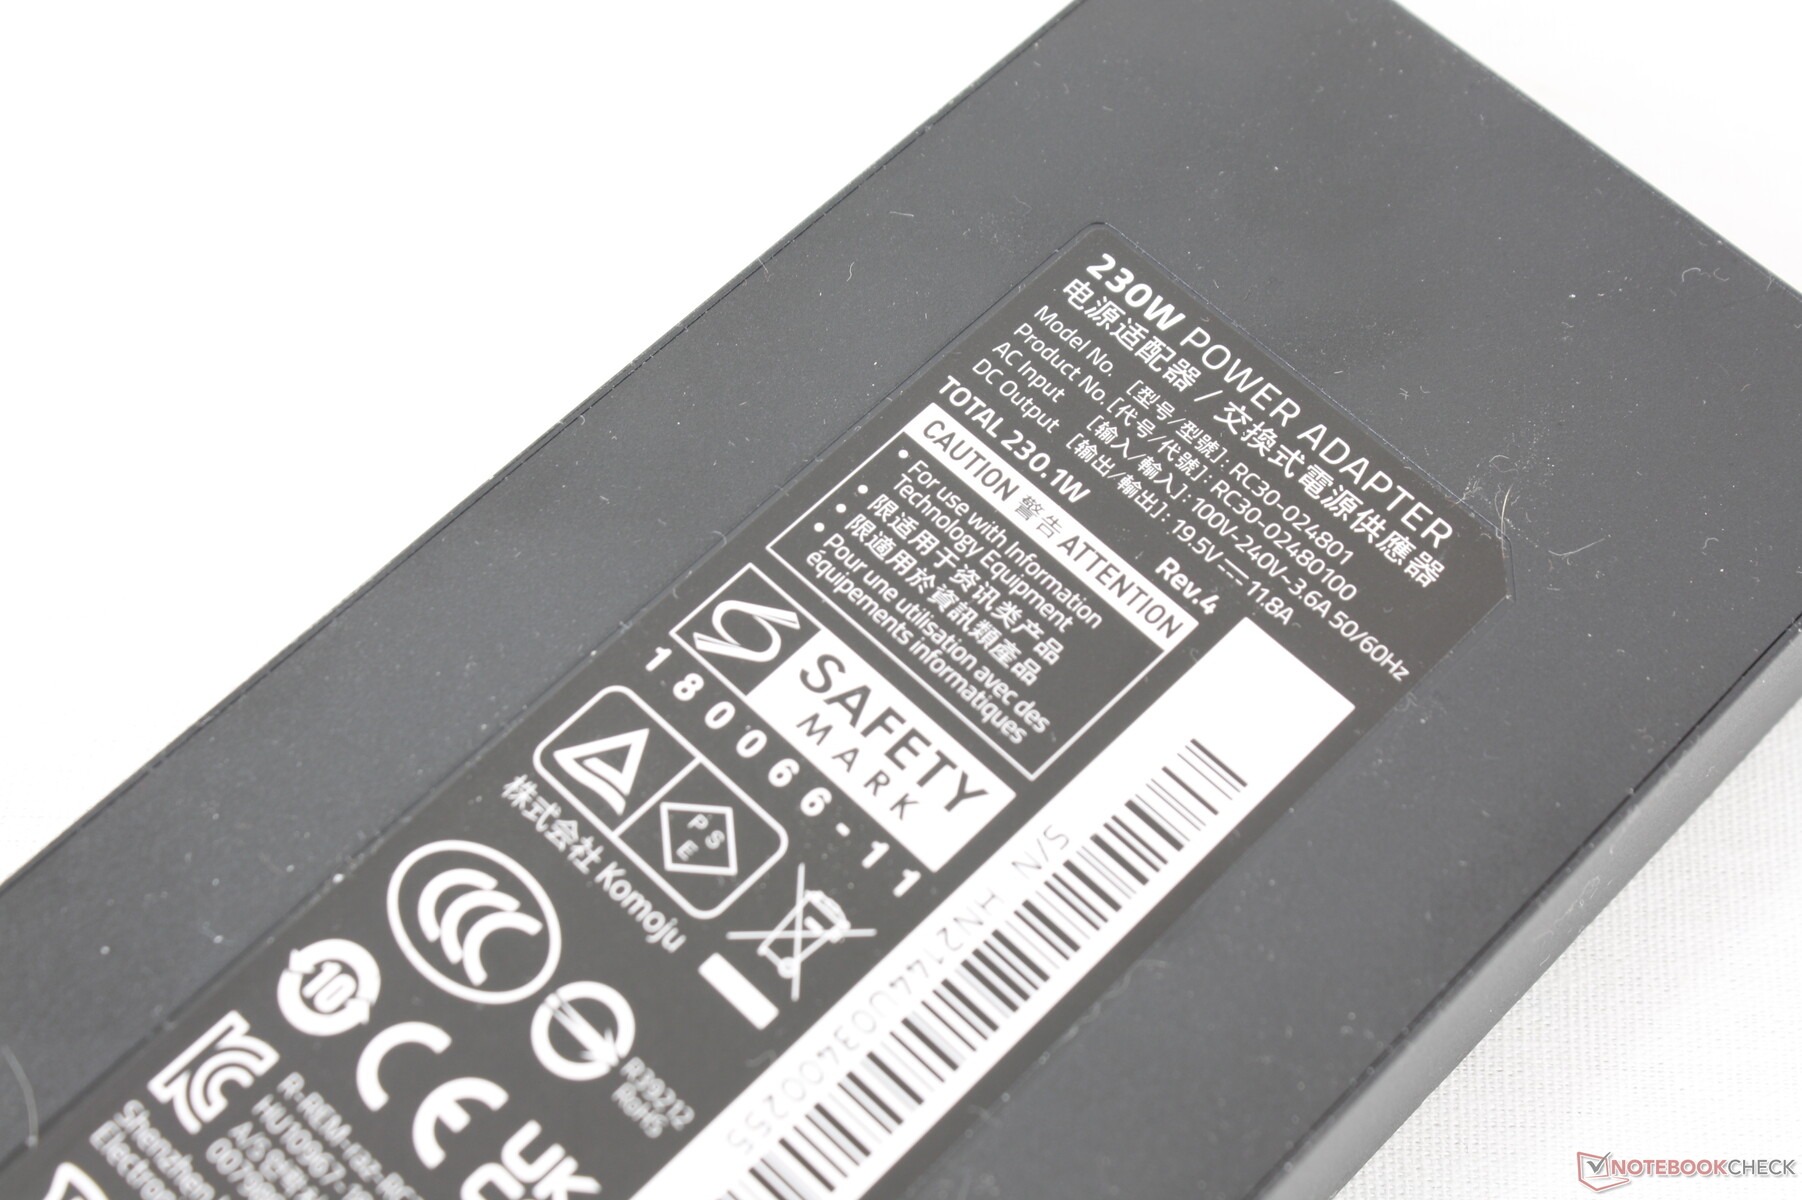
Das 230-W-Netzteil ist recht klein (~17 x 7 x 2,5 cm) und damit verglichen mit anderen Netzteilen in dieser Leistungsklasse leichter zu transportieren. Wir konnten bei jeweils vollständig ausgelasteter CPU und GPU einen Maximalverbrauch von 228 W messen.
| Aus / Standby | |
| Idle | |
| Last |
|
Legende:
min: | |
| Razer Blade 15 2022 i7-12800H, GeForce RTX 3080 Ti Laptop GPU, SSSTC CA6-8D1024, IPS, 2560x1440, 15.6" | Razer Blade 15 Advanced Model Early 2021 i7-10875H, GeForce RTX 3080 Laptop GPU, Samsung PM981a MZVLB1T0HBLR, IPS, 1920x1080, 15.6" | Razer Blade 15 RTX 2080 Super Max-Q i7-10875H, GeForce RTX 2080 Super Max-Q, Samsung PM981a MZVLB1T0HBLR, IPS, 1920x1080, 15.6" | Schenker XMG Neo 15 E22 (Early 2022, RTX 3080 Ti) i7-12700H, GeForce RTX 3080 Ti Laptop GPU, Samsung SSD 980 Pro 250GB MZ-V8P250BW, IPS, 2560x1440, 15.6" | ADATA XPG Xenia 15 i7-11800H, GeForce RTX 3070 Laptop GPU, ADATA XPG Gammix S70 1TB, IPS, 2560x1440, 15.6" | Eurocom Nightsky ARX315 R9 5900X, GeForce RTX 3070 Laptop GPU, Samsung SSD 980 Pro 1TB MZ-V8P1T0BW, IPS, 1920x1080, 15.6" | |
|---|---|---|---|---|---|---|
| Stromverbrauch | 39% | 37% | 15% | 27% | -54% | |
| Idle min * (Watt) | 33.2 | 13 61% | 10.6 68% | 14 58% | 8.9 73% | 55 -66% |
| Idle avg * (Watt) | 36.4 | 15 59% | 13.1 64% | 18 51% | 14.4 60% | 68.2 -87% |
| Idle max * (Watt) | 37.6 | 22 41% | 15.8 58% | 19 49% | 31.1 17% | 72.5 -93% |
| Last avg * (Watt) | 116.7 | 98 16% | 131 -12% | 115 1% | 97 17% | 149.2 -28% |
| Witcher 3 ultra * (Watt) | 172 | 126 27% | 146 15% | 228 -33% | 188 -9% | 233 -35% |
| Last max * (Watt) | 228.6 | 165 28% | 169 26% | 307 -34% | 222.2 3% | 255.8 -12% |
* ... kleinere Werte sind besser
Verbrauch Witcher 3 / Stresstest
Verbrauch externer Monitor
Akkulaufzeit
Die Akkulaufzeiten sind kürzer als bei früheren Modellen, was vermutlich zumindest teilweise auf das energiehungrigere 1440p-240-Hz-Panel zurückzuführen ist. Im Leistungsprofil "Ausbalanciert" mit über Nvidia Optimus ausgewählter iGPU und einer Displayhelligkeit von 150 cd/m² konnten wir eine praxisnahe WLAN-Laufzeit von fast 5 Stunden erreichen. Dagegen erreicht das Blade 15 2021 unter ähnlichen Bedingungen 6 Stunden oder mehr.
Den leeren Akku voll aufzuladen dauert mit dem mitgelieferten Netzteil weniger als 90 Minuten. Alternativ kann der Laptop über USB-C-Netzteile von Drittanbietern geladen werden.
| Razer Blade 15 2022 i7-12800H, GeForce RTX 3080 Ti Laptop GPU, 80 Wh | Razer Blade 15 Advanced Model Early 2021 i7-10875H, GeForce RTX 3080 Laptop GPU, 80 Wh | Razer Blade 15 RTX 2080 Super Max-Q i7-10875H, GeForce RTX 2080 Super Max-Q, 80 Wh | Schenker XMG Neo 15 E22 (Early 2022, RTX 3080 Ti) i7-12700H, GeForce RTX 3080 Ti Laptop GPU, 93 Wh | ADATA XPG Xenia 15 i7-11800H, GeForce RTX 3070 Laptop GPU, 94 Wh | Eurocom Nightsky ARX315 R9 5900X, GeForce RTX 3070 Laptop GPU, 62 Wh | |
|---|---|---|---|---|---|---|
| Akkulaufzeit | 84% | 24% | 37% | 78% | -80% | |
| WLAN (h) | 4.9 | 9 84% | 6.1 24% | 6.7 37% | 8.7 78% | 1 -80% |
| Idle (h) | 14.4 | 8.7 | 14 | |||
| H.264 (h) | 8.9 | 7.3 | 6.9 | |||
| Last (h) | 2 | 1.9 | 3.8 | 1.5 |
Pro
Contra
Fazit
Gegenüber dem Modell aus dem Vorjahr mit Core i7-11800H und RTX 3080 sind die CPU und GPU des Blade 15 2022 um ca. 15-20 % bzw. ungefähr 20 % schneller. Zum Glück wird der Laptop trotzdem nicht spürbar lauter oder wärmer, die zusätzliche Leistung geht jedoch zulasten der Energieaufnahme und der Akkulaufzeit. Vor allem der im Vergleich zur vorherigen Generation höhere Verbrauch scheint unter Laptops mit Intel-Prozessoren der 12. Generation wie dem Schenker Uniwill Technology GM7AG8P und dem MSI Vector GP66 keine Seltenheit zu sein. Im Gegensatz zum Modell mit dem Core i7-10875H aus der 10. Generation liegt die Leistungsentfaltung hier erfreulicherweise nicht unter dem Durchschnitt.
Das Blade 15 und sein Intel-Prozessor der 12. Generation packen noch mehr Leistung in die bekannte Unibody-Konstruktion, ohne dabei mehr Lärm oder Abwärme zu verursachen. Eine längere Akkulaufzeit hat der 15-Zöller jedoch nicht zu bieten.
Damit ist das neueste Blade 15 die alljährliche, iterative Aktualisierung des ohnehin schon ausgezeichneten Modells. Das vergleichsweise kompakte Netzteil und die größeren, klassicheren Tastenkappen sind vor allem für diejenigen, die der "experimentellen" optischen Tastatur des Blade 15 2019 nichts abgewinnen konnten, willkommene Verbesserungen. Vielleicht wird es beim nächsten Modell auch endlich eine Webcam-Abdeckung geben, die bei vielen günstigeren Laptops schon lange mit dabei ist.
Preis und Verfügbarkeit
Razer Blade 15 2022
- 12.03.2022 v7 (old)
Allen Ngo
Preisvergleich

