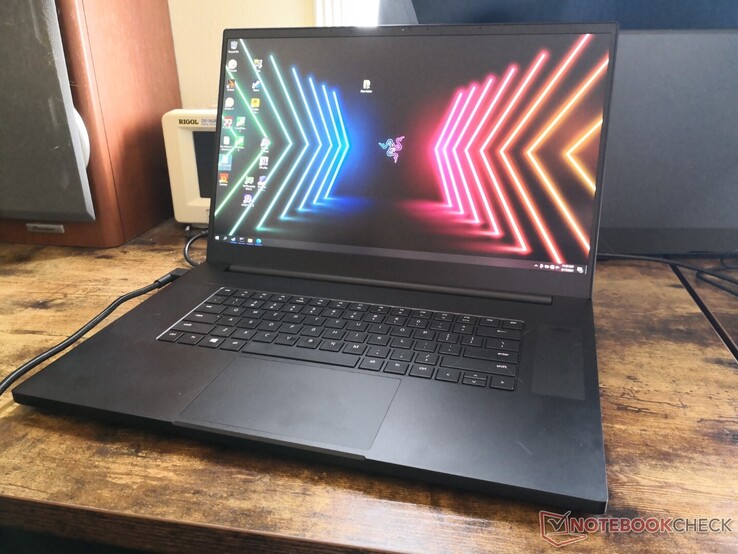
Razer Blade 17 Laptop im Test: Jetzt mit GeForce RTX mit 130 W TGP
Razer ist beim Einsatz neuer CPUs und GPUs immer unter den Ersten. Die Ergebnisse sind oft ausgezeichnet und bieten deutliche Vorteile im Vergleich zur Vorgängergeneration. Manchmal sind sie aber auch weniger glänzend. Zum Beispiel wäre da der Ice Lake Blade Stealth, dessen Leistung sich als schlechter herausstellte als die des preiswerteren Whiskey Lake-U im Vorgängermodell. Zum Glück hat das neueste 17,3-Zoll-Bade-Modell keine solchen Probleme.
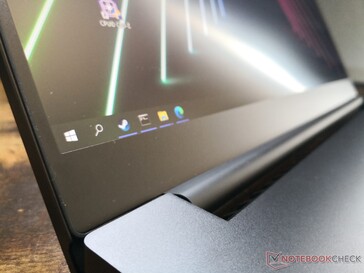
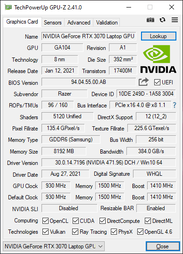
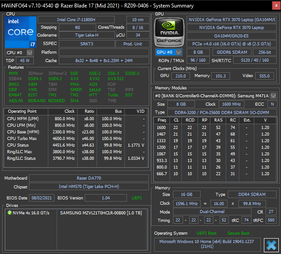
Das 2021er Blade 17 ersetzt das Blade Pro 17 und hat das "Pro" aus seinem Namen streichen lassen. Es ist mit einer neuen Intel-CPU der 11. Generation - Tiger Lake-H - ausgestattet. Auch die GPU und das Display wurden ausgetauscht und bieten jetzt statt einer TGP von 100 W und einer Bildwiederholrate von 300 Hz eine TGP von 130 W und eine Bildwiederholrate von 360 Hz. Das Gehäusedesign und die physischen Aspekte sind seit dem Original aus 2019, welches noch mit Coffee Lake-H-Prozessoren der 9. Generation und Turing-GPUs ausgestattet war, unverändert gelblieben.
Alternativen zum Blade 17 sind unter anderem High-End-Ultrathin-Gamer wir das MSI GS76, das Asus Zephyrus S17, das Acer Predator Triton, das Gigabyte Aero oder die Aorus-Reihe. Unsere Konfiguration ist aktuell um 2.900 Euro zu haben.
Weitere Razer-Testberichte:
Potenzielle Mitstreiter im Vergleich
Bew. | Datum | Modell | Gewicht | Dicke | Größe | Auflösung | Preis ab |
|---|---|---|---|---|---|---|---|
| 89.4 % v7 (old) | 09 / 2021 | Razer Blade 17 RTX 3070 i7-11800H, GeForce RTX 3070 Laptop GPU | 2.8 kg | 19.9 mm | 17.30" | 1920x1080 | |
| 90.1 % v7 (old) | 07 / 2021 | Asus ROG Zephyrus S17 GX703HSD i9-11900H, GeForce RTX 3080 Laptop GPU | 2.8 kg | 19.9 mm | 17.30" | 2560x1440 | |
| 86.2 % v7 (old) | 09 / 2021 | MSI GS76 Stealth 11UH i9-11900H, GeForce RTX 3080 Laptop GPU | 2.4 kg | 20 mm | 17.30" | 3840x2160 | |
| 82 % v7 (old) | 08 / 2021 | Acer Nitro 5 AN517-41-R9S5 R7 5800H, GeForce RTX 3080 Laptop GPU | 2.7 kg | 24.9 mm | 17.30" | 1920x1080 | |
| 88 % v7 (old) | 05 / 2021 | Gigabyte Aero 17 HDR YD i9-11980HK, GeForce RTX 3080 Laptop GPU | 2.8 kg | 22 mm | 17.30" | 3840x2160 | |
| 87.8 % v7 (old) | Maingear Vector Pro MG-VCP17 i7-11800H, GeForce RTX 3080 Laptop GPU | 2.3 kg | 19.81 mm | 17.30" | 2560x1440 |
Gehäuse — Veränderungen im Inneren
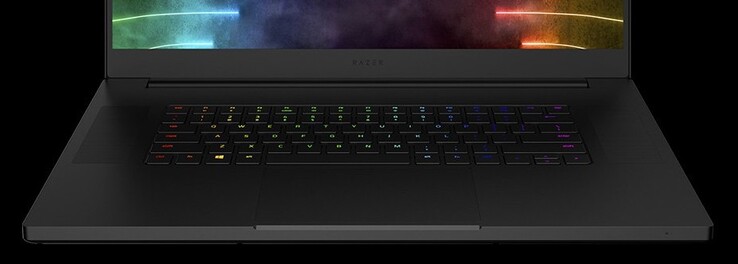
Die bisherigen Upgrades haben sich bisher immer ausschließlich mit den Innereien beschäftigt. Beim Gehäuse hat es keine Veränderungen gegeben. So hat sich das Razer Blade verändert:
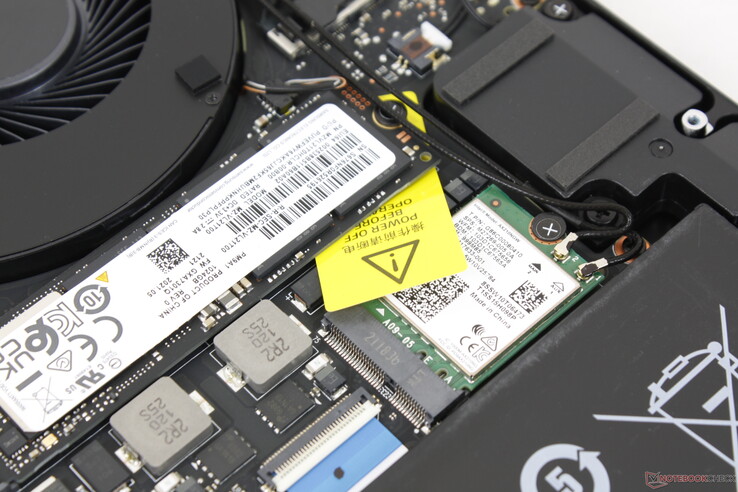
- 11. Generation Intel Tiger Lake-H CPUs (bis zu Core i9) ersetzen die 10. Generation Comet Lake-H CPUs aus dem Vorjahr
- GeForce-RTX-GPUs mit 130 W TGP anstatt der 100-W-Optionen aus dem Vorjahr
- 1.080p (2,1 MP) Webcam vs. 720p (1 MP) im Vorgängermodell
- Thunderbolt-4-Unterstützung anstatt Thunderbolt 3
- 2x PCIe4 NVMe SSDs anstatt PCIe3
- Neue Displayoptionen mit einer Bildwiederholrate von 360 Hz anstatt 300 Hz
- Intel AX210 bietet Unterstützung für Wi-Fi 6E anstatt AX200/201 aus dem Vorjahr
Ausstattung — Jetzt mit Thunderbolt 4
SDCardreader
| SD Card Reader | |
| average JPG Copy Test (av. of 3 runs) | |
| Razer Blade 17 RTX 3070 (AV Pro V60) | |
| MSI GS76 Stealth 11UH (AV PRO microSD 128 GB V60) | |
| Gigabyte Aero 17 HDR YD (AV PRO microSD 128 GB V60) | |
| Asus ROG Zephyrus S17 GX703HSD | |
| Maingear Vector Pro MG-VCP17 (AV Pro V60) | |
| maximum AS SSD Seq Read Test (1GB) | |
| Asus ROG Zephyrus S17 GX703HSD | |
| MSI GS76 Stealth 11UH (AV PRO microSD 128 GB V60) | |
| Razer Blade 17 RTX 3070 (AV Pro V60) | |
| Gigabyte Aero 17 HDR YD (AV PRO microSD 128 GB V60) | |
| Maingear Vector Pro MG-VCP17 (AV Pro V60) | |
Kommunikation — Wi-Fi 6E jetzt Standard
Für die meisten Nutzer wird Wi-Fi 6E die gleiche Leistung bieten wie Wi-Fi-6-Laptops, da es einen Wi-Fi-6E-Router braucht, um die Vorteile nutzen zu können. Die Übertragungsraten bleiben stabil und haben sich im Vergleich zum Wi-Fi-6-Modell aus dem Vorjahr beim Test mit unserem Netgear-RAX200-Testrouter kaum verändert.
| Networking | |
| iperf3 transmit AX12 | |
| Gigabyte Aero 17 HDR YD | |
| MSI GS76 Stealth 11UH | |
| Razer Blade 17 RTX 3070 | |
| Maingear Vector Pro MG-VCP17 | |
| Asus ROG Zephyrus S17 GX703HSD | |
| iperf3 receive AX12 | |
| Razer Blade 17 RTX 3070 | |
| Maingear Vector Pro MG-VCP17 | |
| MSI GS76 Stealth 11UH | |
| Gigabyte Aero 17 HDR YD | |
| Asus ROG Zephyrus S17 GX703HSD | |
Webcam — 1.080p anstatt 720p
Die Webcam ist deutlich schärfer als im Vorjahr (siehe Vergleichsbilder unten). Die Farbgenauigkeit scheint sich aber nicht verändert zu haben. Es fehlt weiterhin eine Webcam-Blende.
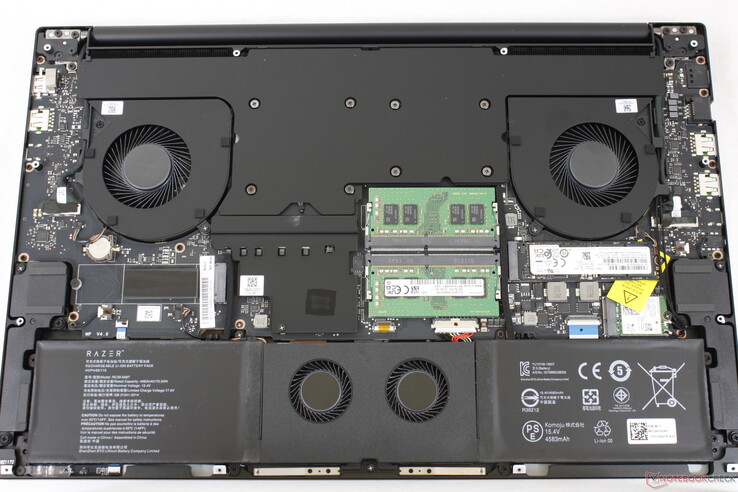
Wartung
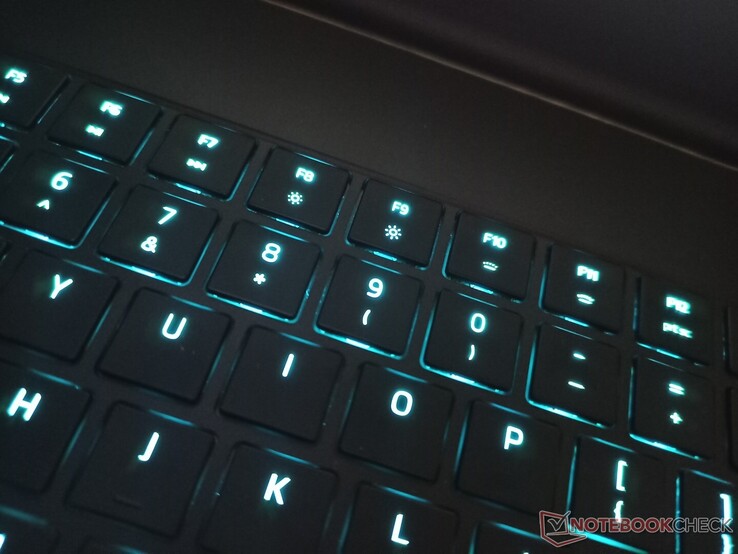
Eingabegeräte
Display — Sehr flüssige 360 Hz
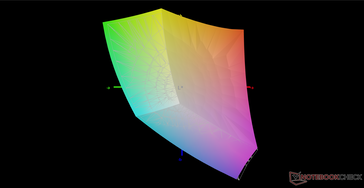
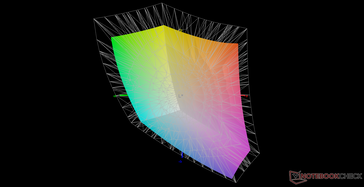
Razer setzt für sein Blade 17 das gleiche 1.080p-360-Hz-AU-Optronics-B173HAN05.4-IPS-Panel ein wie Asus im Strix Scar 17 G733QS. Daher ähnelt sich auch die Bildqualität dieser beiden Laptops. Das Panel in unserem Testgerät deckt den sRGB-Farbraum vollständig ab und bietet sehr schnelle Reaktionszeiten sowie ein gutes Kontrastverhältnis von fast 1.000:1. Somit sollte der Bildschirm sowohl für die Textverarbeitung als auch fürs Gamen gut geeignet sein. Die Eigenschaften des Panels ähneln stark denen des 300-Hz-Sharp-Panels aus dem Vorgängermodell. Das bedeutet, dass der Aufpreis alleine der etwas schnelleren Bildwiederholrate gilt.
Weitere Displayoptionen sind etwa ein 1.440p-QHD-Panel mit 165 Hz und einer vollständigen sRGB-Abdeckung und ein glänzender 4K-Touchdisplay mit vollständiger AdobeRGB-Abdeckung. Letzterer ist vermutlich auch heller als unsere Option mit 360 Hz (~400 cd/m² statt ~300 cd/m²).
| |||||||||||||||||||||||||
Ausleuchtung: 91 %
Helligkeit Akku: 323.3 cd/m²
Kontrast: 980:1 (Schwarzwert: 0.33 cd/m²)
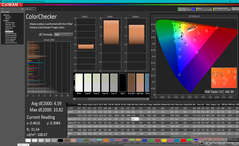
ΔE ColorChecker Calman: 4.59 | ∀{0.5-29.43 Ø4.77}
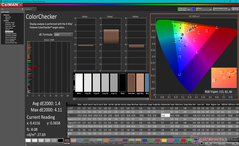
calibrated: 1.4
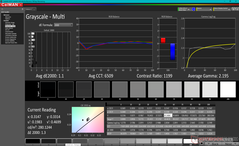
ΔE Greyscale Calman: 7.9 | ∀{0.09-98 Ø5}
73.6% AdobeRGB 1998 (Argyll 3D)
98.8% sRGB (Argyll 3D)
71.7% Display P3 (Argyll 3D)
Gamma: 2.28
CCT: 5941 K
| Razer Blade 17 RTX 3070 AU Optronics B173HAN05.4, IPS, 17.3", 1920x1080 | Asus ROG Zephyrus S17 GX703HSD BOE099D (BOE CQ NE173QHM-NY3), IPS, 17.3", 2560x1440 | MSI GS76 Stealth 11UH AUO B173ZAN06.1 (AUODE95), IPS, 17.3", 3840x2160 | Acer Nitro 5 AN517-41-R9S5 BOE NV173FHM-NX4, IPS, 17.3", 1920x1080 | Gigabyte Aero 17 HDR YD AU Optronics AUO329B, IPS, 17.3", 3840x2160 | Maingear Vector Pro MG-VCP17 BOE NE173QHM-NY2, IPS, 17.3", 2560x1440 | |
|---|---|---|---|---|---|---|
| Display | 15% | -9% | -47% | 19% | -1% | |
| Display P3 Coverage (%) | 71.7 | 94.2 31% | 63 -12% | 36.7 -49% | 86.9 21% | 70.7 -1% |
| sRGB Coverage (%) | 98.8 | 98.7 0% | 94.8 -4% | 55.3 -44% | 100 1% | 99.4 1% |
| AdobeRGB 1998 Coverage (%) | 73.6 | 84.4 15% | 65 -12% | 37.9 -49% | 99.6 35% | 71.7 -3% |
| Response Times | -3% | -42% | -194% | -667% | -154% | |
| Response Time Grey 50% / Grey 80% * (ms) | 4.2 ? | 4.8 -14% | 8.8 ? -110% | 18 ? -329% | 52 ? -1138% | 15.6 ? -271% |
| Response Time Black / White * (ms) | 8.8 ? | 8 9% | 6.4 ? 27% | 14 ? -59% | 26 ? -195% | 12 ? -36% |
| PWM Frequency (Hz) | ||||||
| Bildschirm | 11% | 30% | -0% | 46% | 16% | |
| Helligkeit Bildmitte (cd/m²) | 323.3 | 322 0% | 474 47% | 307 -5% | 488 51% | 389.7 21% |
| Brightness (cd/m²) | 315 | 288 -9% | 454 44% | 264 -16% | 467 48% | 363 15% |
| Brightness Distribution (%) | 91 | 72 -21% | 88 -3% | 76 -16% | 86 -5% | 84 -8% |
| Schwarzwert * (cd/m²) | 0.33 | 0.3 9% | 0.46 -39% | 0.24 27% | 0.33 -0% | 0.47 -42% |
| Kontrast (:1) | 980 | 1073 9% | 1030 5% | 1279 31% | 1479 51% | 829 -15% |
| Delta E Colorchecker * | 4.59 | 3.05 34% | 1.5 67% | 5.61 -22% | 1.23 73% | 1.93 58% |
| Colorchecker dE 2000 max. * | 10.82 | 5.23 52% | 5.59 48% | 18.29 -69% | 2.94 73% | 6.84 37% |
| Colorchecker dE 2000 calibrated * | 1.4 | 1.92 -37% | 0.86 39% | 0.77 45% | 1.31 6% | |
| Delta E Graustufen * | 7.9 | 3.11 61% | 2.8 65% | 2.63 67% | 1.5 81% | 2.4 70% |
| Gamma | 2.28 96% | 2.13 103% | 2.158 102% | 2.37 93% | 2.169 101% | 2.12 104% |
| CCT | 5941 109% | 6553 99% | 6597 99% | 6852 95% | 6614 98% | 6658 98% |
| Farbraum (Prozent von AdobeRGB 1998) (%) | 84 | 35 | 99 | |||
| Color Space (Percent of sRGB) (%) | 99 | 55 | 99 | |||
| Durchschnitt gesamt (Programm / Settings) | 8% /
10% | -7% /
12% | -80% /
-41% | -201% /
-61% | -46% /
-12% |
* ... kleinere Werte sind besser
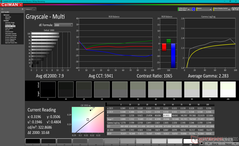
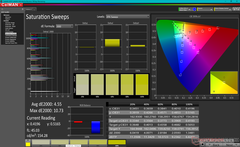
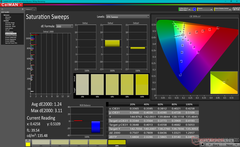
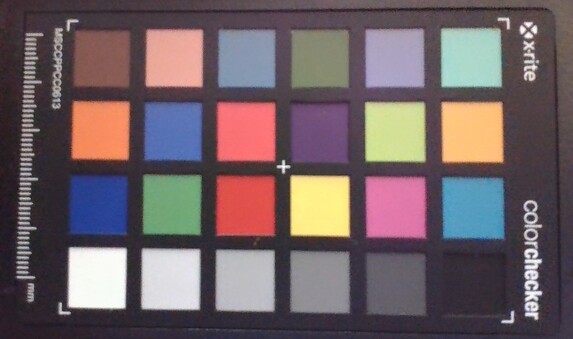
Das Display sollte nach Erhalt kalibriert werden. Die Farbtemperatur ist im Lieferzustand viel zu warm und ergibt durchschnittliche Graustufen- und Farb-Delta-E-Werte von 7,9 bzw. 4,59. Auch wenn das nicht so schlecht ist, hätten wir uns von einem High-End-Gamer mit einem Verkaufspreis von fast 3.000 Euro mehr erwartet. Durch unsere Kalibrierung verbesserten sich die durchschnittlichen Delta-E-Werte auf unter 2 (siehe Calman-Ergebnisse unten).
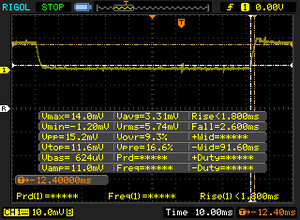
Reaktionszeiten (Response Times) des Displays
| ↔ Reaktionszeiten Schwarz zu Weiß | ||
|---|---|---|
| 8.8 ms ... steigend ↗ und fallend ↘ kombiniert | ↗ 4.4 ms steigend | |
| ↘ 4.4 ms fallend | ||
| Die gemessenen Reaktionszeiten sind kurz wodurch sich der Bildschirm auch für Spiele gut eignen sollte. Im Vergleich rangierten die bei uns getesteten Geräte von 0.1 (Minimum) zu 240 (Maximum) ms. » 23 % aller Screens waren schneller als der getestete. Daher sind die gemessenen Reaktionszeiten besser als der Durchschnitt aller vermessenen Geräte (20.1 ms). | ||
| ↔ Reaktionszeiten 50% Grau zu 80% Grau | ||
| 4.2 ms ... steigend ↗ und fallend ↘ kombiniert | ↗ 1.6 ms steigend | |
| ↘ 2.6 ms fallend | ||
| Die gemessenen Reaktionszeiten sind sehr kurz, wodurch sich der Bildschirm auch für schnelle 3D Spiele eignen sollte. Im Vergleich rangierten die bei uns getesteten Geräte von 0.165 (Minimum) zu 636 (Maximum) ms. » 15 % aller Screens waren schneller als der getestete. Daher sind die gemessenen Reaktionszeiten besser als der Durchschnitt aller vermessenen Geräte (31.5 ms). | ||
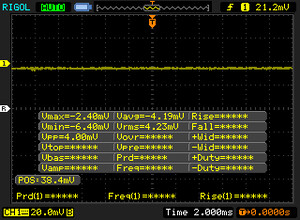
Bildschirm-Flackern / PWM (Pulse-Width Modulation)
| Flackern / PWM nicht festgestellt | |||
Im Vergleich: 53 % aller getesteten Geräte nutzten kein PWM um die Helligkeit zu reduzieren. Wenn PWM eingesetzt wurde, dann bei einer Frequenz von durchschnittlich 8042 (Minimum 5, Maximum 343500) Hz. | |||
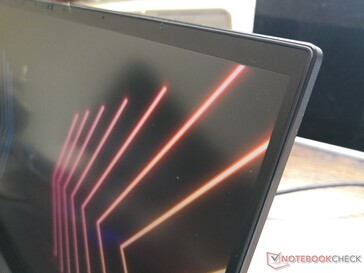
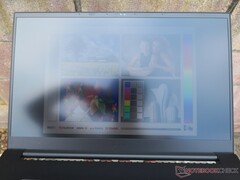
Die Sichtbarkeit im Freien hat sich im Vergleich zum Vorgängermodell kaum verändert; der Kontrast und die maximale Helligkeit bleiben gleich. Es könnte sein, dass die Displayoption mit 4K-Touchscreen heller ist. Dafür müssen Nutzer aber aufgrund des glänzenden Overlays mit mehr Spiegelungen rechnen.
Leistung — 130 W TGP GeForce RTX
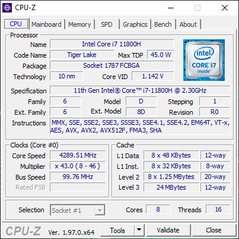
Nutzer können nun zwischen dem Tiger Lake-H Core i7-11800H oder Core i9-11900H, beide aus der 11. Generation, wählen, die die Comet-Lake-H-Optionen der 10. Generation aus dem Vorgängermodell ersetzen. Abgesehen von der offensichtlichen Leistungsverbesserung bieten die neuen CPUs auch eine native Unterstützung von PCIe4 und Thunderbolt 4. Auch Resizable Bar, Dynamic Boost 2.0 und WhisperMode 2.0 werden unterstützt.
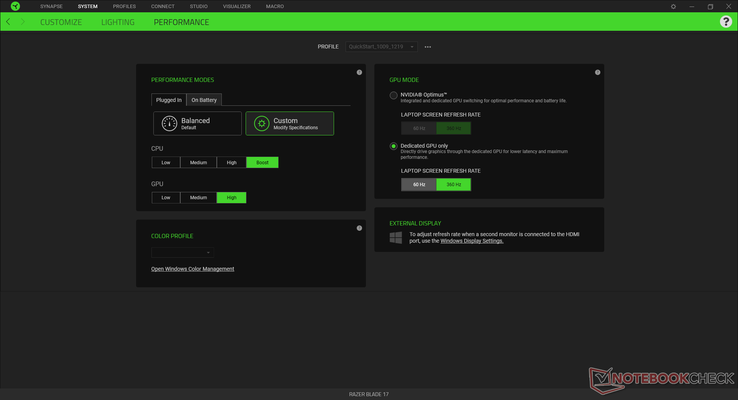
Advanced Optimus (bzw. Optimus 2.0) wird hingegen nicht unterstützt. Das bedeutet, dass Nutzer weiterhin manuell über die Razer-Softwer zwischen der dedizierten und integrierten GPU wechseln und den Computer neu starten müssen. Der Optimus-Modus hat eine geringe Auswirkung auf die Leistung. Wir empfehlen Nutzern, sich mit der Software Razer Central auseinanderzusetzen, da hier wichtige Anpassungen und Leistungseinstellungen gemacht werden können.
Prozessor — (Noch) kein AMD
Unser Core i7-11800H ist eine ausgezeichnete Verbesserung gegenüber dem Core i7-10875H aus dem Vorjahr. Insbesondere die Multi-Thread-Leistung hat sich um 25 bis 40 Prozent verbessert und kann jetzt endlich mit Zen-2- bzw. Zen-3-CPUs wie dem Ryzen 7 5800H mithalten. Auf Basis unserer Erfahrungen mit anderen Core-i9-10900H-Laptops wie dem MSI GS76 Stealth erwarten wir von einem Upgrade auf den Core i9-10900H eine um nur 5 bis 10 Prozent höhere reine Prozessorleistung.
Interessant ist, dass der Ryzen 9 5900HX im Blade 14 mit unserem i7-11800H im Bereich der Multi-Thread-Leistung gleichauf liegt, in der Single-Thread-Leistung allerdings um 15 bis 20 Prozent schwächer ist.
Cinebench R15 Multi-Loop
Cinebench R23: Multi Core | Single Core
Cinebench R15: CPU Multi 64Bit | CPU Single 64Bit
Blender: v2.79 BMW27 CPU
7-Zip 18.03: 7z b 4 -mmt1 | 7z b 4
Geekbench 5.5: Single-Core | Multi-Core
HWBOT x265 Benchmark v2.2: 4k Preset
LibreOffice : 20 Documents To PDF
R Benchmark 2.5: Overall mean
| Cinebench R20 / CPU (Multi Core) | |
| Gigabyte Aero 17 HDR YD | |
| Asus ROG Strix G17 G713QE-RB74 | |
| MSI GS76 Stealth 11UH | |
| Razer Blade 14 Ryzen 9 RTX 3070 | |
| Razer Blade 17 RTX 3070 | |
| MSI Alpha 17 A4DEK | |
| Durchschnittliche Intel Core i7-11800H (2498 - 5408, n=50) | |
| Alienware m17 R4 | |
| MSI GE76 Raider 10UH | |
| MSI GE75 9SG | |
| Razer Blade Pro 17 RTX 2070 Max-Q 300 Hz | |
| Razer Blade Pro 17 4K UHD 120 Hz | |
| Cinebench R20 / CPU (Single Core) | |
| MSI GS76 Stealth 11UH | |
| Gigabyte Aero 17 HDR YD | |
| Razer Blade 17 RTX 3070 | |
| Durchschnittliche Intel Core i7-11800H (520 - 586, n=47) | |
| Asus ROG Strix G17 G713QE-RB74 | |
| Alienware m17 R4 | |
| MSI Alpha 17 A4DEK | |
| Razer Blade Pro 17 RTX 2070 Max-Q 300 Hz | |
| MSI GE76 Raider 10UH | |
| Razer Blade 14 Ryzen 9 RTX 3070 | |
| MSI GE75 9SG | |
| Razer Blade Pro 17 4K UHD 120 Hz | |
| Cinebench R23 / Multi Core | |
| MSI GS76 Stealth 11UH | |
| Asus ROG Strix G17 G713QE-RB74 | |
| Razer Blade 14 Ryzen 9 RTX 3070 | |
| Razer Blade 17 RTX 3070 | |
| Durchschnittliche Intel Core i7-11800H (6508 - 14088, n=48) | |
| Alienware m17 R4 | |
| MSI GE76 Raider 10UH | |
| Cinebench R23 / Single Core | |
| MSI GS76 Stealth 11UH | |
| Razer Blade 17 RTX 3070 | |
| Durchschnittliche Intel Core i7-11800H (1386 - 1522, n=45) | |
| Asus ROG Strix G17 G713QE-RB74 | |
| Alienware m17 R4 | |
| Razer Blade 14 Ryzen 9 RTX 3070 | |
| MSI GE76 Raider 10UH | |
| Cinebench R15 / CPU Multi 64Bit | |
| MSI GS76 Stealth 11UH | |
| Gigabyte Aero 17 HDR YD | |
| Razer Blade 14 Ryzen 9 RTX 3070 | |
| Asus ROG Strix G17 G713QE-RB74 | |
| MSI Alpha 17 A4DEK | |
| Razer Blade 17 RTX 3070 | |
| Durchschnittliche Intel Core i7-11800H (1342 - 2173, n=50) | |
| Alienware m17 R4 | |
| MSI GE75 9SG | |
| MSI GE76 Raider 10UH | |
| Razer Blade Pro 17 RTX 2070 Max-Q 300 Hz | |
| Razer Blade Pro 17 4K UHD 120 Hz | |
| Cinebench R15 / CPU Single 64Bit | |
| MSI GS76 Stealth 11UH | |
| Gigabyte Aero 17 HDR YD | |
| Asus ROG Strix G17 G713QE-RB74 | |
| Razer Blade 17 RTX 3070 | |
| Durchschnittliche Intel Core i7-11800H (201 - 231, n=46) | |
| Alienware m17 R4 | |
| Razer Blade Pro 17 RTX 2070 Max-Q 300 Hz | |
| Razer Blade 14 Ryzen 9 RTX 3070 | |
| MSI GE76 Raider 10UH | |
| MSI Alpha 17 A4DEK | |
| MSI GE75 9SG | |
| Razer Blade Pro 17 4K UHD 120 Hz | |
| Blender / v2.79 BMW27 CPU | |
| Razer Blade Pro 17 RTX 2070 Max-Q 300 Hz | |
| MSI GE75 9SG | |
| Durchschnittliche Intel Core i7-11800H (217 - 454, n=46) | |
| MSI GE76 Raider 10UH | |
| Razer Blade 17 RTX 3070 | |
| MSI Alpha 17 A4DEK | |
| Razer Blade 14 Ryzen 9 RTX 3070 | |
| MSI GS76 Stealth 11UH | |
| Alienware m17 R4 | |
| Asus ROG Strix G17 G713QE-RB74 | |
| Gigabyte Aero 17 HDR YD | |
| 7-Zip 18.03 / 7z b 4 -mmt1 | |
| Gigabyte Aero 17 HDR YD | |
| MSI GS76 Stealth 11UH | |
| Asus ROG Strix G17 G713QE-RB74 | |
| Durchschnittliche Intel Core i7-11800H (5138 - 5732, n=46) | |
| Razer Blade 17 RTX 3070 | |
| Alienware m17 R4 | |
| Razer Blade Pro 17 RTX 2070 Max-Q 300 Hz | |
| MSI GE76 Raider 10UH | |
| MSI GE75 9SG | |
| Razer Blade 14 Ryzen 9 RTX 3070 | |
| MSI Alpha 17 A4DEK | |
| Geekbench 5.5 / Single-Core | |
| MSI GS76 Stealth 11UH | |
| Gigabyte Aero 17 HDR YD | |
| Durchschnittliche Intel Core i7-11800H (1429 - 1625, n=40) | |
| Alienware m17 R4 | |
| Razer Blade Pro 17 RTX 2070 Max-Q 300 Hz | |
| MSI GE76 Raider 10UH | |
| MSI Alpha 17 A4DEK | |
| Geekbench 5.5 / Multi-Core | |
| Gigabyte Aero 17 HDR YD | |
| MSI GS76 Stealth 11UH | |
| Durchschnittliche Intel Core i7-11800H (4655 - 9851, n=40) | |
| Alienware m17 R4 | |
| MSI Alpha 17 A4DEK | |
| MSI GE76 Raider 10UH | |
| Razer Blade Pro 17 RTX 2070 Max-Q 300 Hz | |
| HWBOT x265 Benchmark v2.2 / 4k Preset | |
| Gigabyte Aero 17 HDR YD | |
| Razer Blade 14 Ryzen 9 RTX 3070 | |
| Razer Blade 17 RTX 3070 | |
| MSI GS76 Stealth 11UH | |
| Asus ROG Strix G17 G713QE-RB74 | |
| Alienware m17 R4 | |
| Durchschnittliche Intel Core i7-11800H (7.38 - 17.4, n=46) | |
| MSI GE76 Raider 10UH | |
| MSI Alpha 17 A4DEK | |
| MSI GE75 9SG | |
| LibreOffice / 20 Documents To PDF | |
| MSI Alpha 17 A4DEK | |
| Razer Blade 14 Ryzen 9 RTX 3070 | |
| Razer Blade Pro 17 RTX 2070 Max-Q 300 Hz | |
| Asus ROG Strix G17 G713QE-RB74 | |
| Alienware m17 R4 | |
| MSI GS76 Stealth 11UH | |
| MSI GE76 Raider 10UH | |
| Durchschnittliche Intel Core i7-11800H (38.6 - 59.9, n=45) | |
| Razer Blade 17 RTX 3070 | |
| Gigabyte Aero 17 HDR YD | |
| R Benchmark 2.5 / Overall mean | |
| Razer Blade 14 Ryzen 9 RTX 3070 | |
| MSI GE76 Raider 10UH | |
| MSI Alpha 17 A4DEK | |
| Alienware m17 R4 | |
| Durchschnittliche Intel Core i7-11800H (0.548 - 0.615, n=46) | |
| Razer Blade 17 RTX 3070 | |
| Gigabyte Aero 17 HDR YD | |
| MSI GS76 Stealth 11UH | |
| Asus ROG Strix G17 G713QE-RB74 | |
* ... kleinere Werte sind besser
Systemleistung
| PCMark 10 / Score | |
| Razer Blade 17 RTX 3070 | |
| Durchschnittliche Intel Core i7-11800H, NVIDIA GeForce RTX 3070 Laptop GPU (6126 - 7311, n=11) | |
| Razer Blade Pro 17 2021 (QHD Touch) | |
| Razer Blade Pro 17 RTX 2070 Max-Q 300 Hz | |
| Razer Blade Pro 17 4K UHD 120 Hz | |
| Razer Blade Pro 17 RTX 2080 Max-Q | |
| Razer Blade Pro 17 RTX 2060 | |
| PCMark 10 / Essentials | |
| Razer Blade 17 RTX 3070 | |
| Durchschnittliche Intel Core i7-11800H, NVIDIA GeForce RTX 3070 Laptop GPU (9248 - 10832, n=11) | |
| Razer Blade Pro 17 4K UHD 120 Hz | |
| Razer Blade Pro 17 2021 (QHD Touch) | |
| Razer Blade Pro 17 RTX 2070 Max-Q 300 Hz | |
| Razer Blade Pro 17 RTX 2080 Max-Q | |
| Razer Blade Pro 17 RTX 2060 | |
| PCMark 10 / Productivity | |
| Razer Blade 17 RTX 3070 | |
| Durchschnittliche Intel Core i7-11800H, NVIDIA GeForce RTX 3070 Laptop GPU (8571 - 9669, n=11) | |
| Razer Blade Pro 17 2021 (QHD Touch) | |
| Razer Blade Pro 17 RTX 2070 Max-Q 300 Hz | |
| Razer Blade Pro 17 RTX 2060 | |
| Razer Blade Pro 17 RTX 2080 Max-Q | |
| Razer Blade Pro 17 4K UHD 120 Hz | |
| PCMark 10 / Digital Content Creation | |
| Razer Blade 17 RTX 3070 | |
| Durchschnittliche Intel Core i7-11800H, NVIDIA GeForce RTX 3070 Laptop GPU (7627 - 10851, n=11) | |
| Razer Blade Pro 17 2021 (QHD Touch) | |
| Razer Blade Pro 17 4K UHD 120 Hz | |
| Razer Blade Pro 17 RTX 2070 Max-Q 300 Hz | |
| Razer Blade Pro 17 RTX 2080 Max-Q | |
| Razer Blade Pro 17 RTX 2060 | |
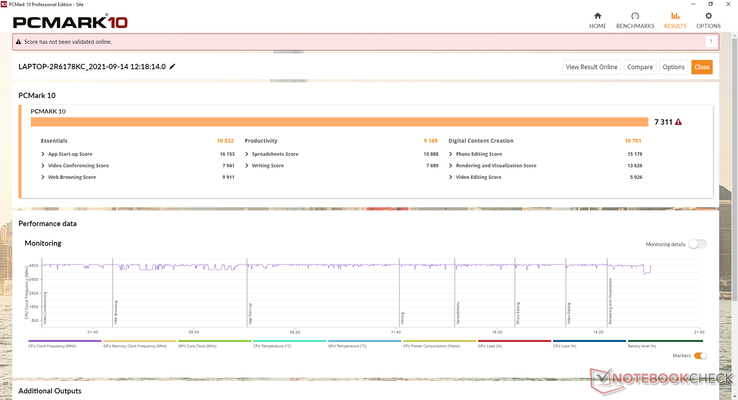
| PCMark 10 Score | 7311 Punkte | |
Hilfe | ||
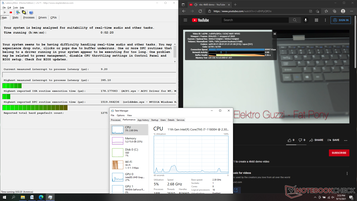
DPC-Latenzen
| DPC Latencies / LatencyMon - interrupt to process latency (max), Web, Youtube, Prime95 | |
| Gigabyte Aero 17 HDR YD | |
| Asus ROG Zephyrus S17 GX703HSD | |
| MSI GS76 Stealth 11UH | |
| Acer Nitro 5 AN517-41-R9S5 | |
| Maingear Vector Pro MG-VCP17 | |
| Razer Blade 17 RTX 3070 | |
* ... kleinere Werte sind besser
Massenspeicher — Unterstützung für PCIe4
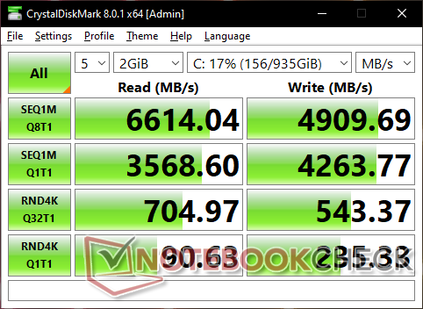
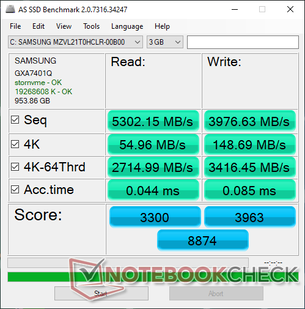
Razer hat sich beim Massenspeicher wieder einmal für Samsung entschieden. Die 1-TB-PCIe3-NVMe-SSD PM9A1 ist deutlich schneller als die PM981a aus dem Vorgängermodell. Das Gerät bietet weiterhin Platz für bis zu zwei Massenspeicher.
| Razer Blade 17 RTX 3070 Samsung PM9A1 MZVL21T0HCLR | Razer Blade Pro 17 2021 (QHD Touch) Samsung PM981a MZVLB1T0HBLR | Asus ROG Zephyrus S17 GX703HSD Samsung PM9A1 MZVL22T0HBLB | MSI GS76 Stealth 11UH Samsung PM9A1 MZVL22T0HBLB | Acer Nitro 5 AN517-41-R9S5 SK Hynix BC711 1TB HFM001TD3JX016N | Gigabyte Aero 17 HDR YD Samsung PM9A1 MZVL2512HCJQ | |
|---|---|---|---|---|---|---|
| AS SSD | -35% | 14% | 5% | -21% | 4% | |
| Seq Read (MB/s) | 5302 | 2068 -61% | 5085 -4% | 5408 2% | 2974 -44% | 5438 3% |
| Seq Write (MB/s) | 3977 | 2047 -49% | 4434 11% | 3863 -3% | 2733 -31% | 3904 -2% |
| 4K Read (MB/s) | 55 | 47.85 -13% | 80.3 46% | 52.7 -4% | 55.7 1% | 56.2 2% |
| 4K Write (MB/s) | 148.7 | 87.4 -41% | 214.7 44% | 153.1 3% | 134 -10% | 165.8 11% |
| 4K-64 Read (MB/s) | 2715 | 1932 -29% | 2573 -5% | 2692 -1% | 1854 -32% | 2489 -8% |
| 4K-64 Write (MB/s) | 3416 | 2017 -41% | 2972 -13% | 3414 0% | 2165 -37% | 3480 2% |
| Access Time Read * (ms) | 0.044 | 0.055 -25% | 0.018 59% | 0.046 -5% | 0.054 -23% | |
| Access Time Write * (ms) | 0.085 | 0.128 -51% | 0.02 76% | 0.027 68% | 0.028 67% | 0.026 69% |
| Score Read (Points) | 3300 | 2187 -34% | 3161 -4% | 3285 0% | 2207 -33% | 3089 -6% |
| Score Write (Points) | 3963 | 2309 -42% | 3631 -8% | 3953 0% | 2573 -35% | 4036 2% |
| Score Total (Points) | 8874 | 5612 -37% | 8380 -6% | 8830 0% | 5899 -34% | 8620 -3% |
| Copy ISO MB/s (MB/s) | 2710 | 2400 -11% | 3239 20% | 2260 -17% | ||
| Copy Program MB/s (MB/s) | 1114 | 684 -39% | 899 -19% | 677 -39% | ||
| Copy Game MB/s (MB/s) | 2095 | 1629 -22% | 2171 4% | 1493 -29% | ||
| CrystalDiskMark 5.2 / 6 | -43% | 3% | 1% | -36% | 3% | |
| Write 4K (MB/s) | 233.5 | 123.5 -47% | 244.2 5% | 230.7 -1% | 133.4 -43% | 230.4 -1% |
| Read 4K (MB/s) | 90.1 | 45.96 -49% | 89.8 0% | 87.9 -2% | 64.7 -28% | 91.6 2% |
| Write Seq (MB/s) | 4263 | 1861 -56% | 4300 1% | 2934 -31% | 4216 -1% | |
| Read Seq (MB/s) | 4468 | 1584 -65% | 4392 -2% | 2364 -47% | 4543 2% | |
| Write 4K Q32T1 (MB/s) | 538 | 466.4 -13% | 607 13% | 582 8% | 438.4 -19% | 667 24% |
| Read 4K Q32T1 (MB/s) | 703 | 566 -19% | 658 -6% | 730 4% | 516 -27% | 728 4% |
| Write Seq Q32T1 (MB/s) | 5097 | 2981 -42% | 5270 3% | 5152 1% | 3083 -40% | 5043 -1% |
| Read Seq Q32T1 (MB/s) | 7065 | 3260 -54% | 7091 0% | 7094 0% | 3584 -49% | 6821 -3% |
| Write 4K Q8T8 (MB/s) | 2270 | |||||
| Read 4K Q8T8 (MB/s) | 2490 | |||||
| Durchschnitt gesamt (Programm / Settings) | -39% /
-38% | 9% /
11% | 3% /
4% | -29% /
-27% | 4% /
4% |
* ... kleinere Werte sind besser
Dauerleistung Lesen: DiskSpd Read Loop, Queue Depth 8
Grafikkarte — Etwas schneller als die 100 W GeForce RTX 3080
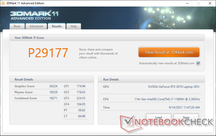
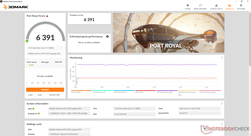
Die Grafikleistung unseres Testgeräts ist ausgezeichnet. Die 3DMark-Ergebnisse liegen um 10 bis 15 Prozent höher als beim durchschnittlichen mit der gleichen RTX 3070 ausgestatteten Laptop aus unserer Datenbank. Die reine Leistung liegt sogar mit dem Blade-Pro-RTX-3080-Modell aus dem Vorjahr gleichauf. Allerdings ist die GPU auch hier deutlich langsamer als eine "richtige" Desktop-RTX-3080, wobei das eher an Nvidia als an Razer liegt.
Ein Upgrade auf das Blade 17 mit RTX 3080 bietet im Vergleich zur Testversion mit RTX 3070 vermutlich nur mehr geringe Leistungsvorteile von wenigen Prozentpunkten — das lässt sich jedenfalls aus unserer bisherigen Erfahrung mit mindestens einem Dutzend anderer RTX-3080-Laptops schließen. Nutzer sollten auch bedenken, dass die Frameraten nicht unbedingt 360 FPS erreichen müssen, um von einem 360-Hz-Display zu profitieren.
| 3DMark 11 Performance | 29177 Punkte | |
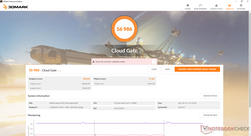
| 3DMark Cloud Gate Standard Score | 56986 Punkte | |
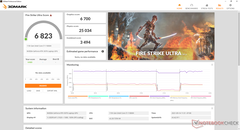
| 3DMark Fire Strike Score | 23055 Punkte | |
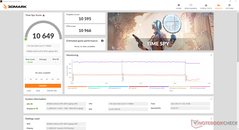
| 3DMark Time Spy Score | 10649 Punkte | |
Hilfe | ||
| Final Fantasy XV Benchmark | |
| 1280x720 Lite Quality | |
| Razer Blade 17 RTX 3070 | |
| Gigabyte Aero 17 HDR YD | |
| Maingear Vector Pro MG-VCP17 | |
| Razer Blade Pro 17 2021 (QHD Touch) | |
| Acer Nitro 5 AN517-41-R9S5 | |
| Durchschnittliche NVIDIA GeForce RTX 3070 Laptop GPU (137 - 207, n=30) | |
| 1920x1080 Standard Quality | |
| Asus ROG Zephyrus S17 GX703HSD | |
| Maingear Vector Pro MG-VCP17 | |
| Razer Blade Pro 17 2021 (QHD Touch) | |
| Razer Blade 17 RTX 3070 | |
| Gigabyte Aero 17 HDR YD | |
| Durchschnittliche NVIDIA GeForce RTX 3070 Laptop GPU (67 - 144, n=32) | |
| Acer Nitro 5 AN517-41-R9S5 | |
| 1920x1080 High Quality | |
| Razer Blade Pro 17 2021 (QHD Touch) | |
| Maingear Vector Pro MG-VCP17 | |
| Razer Blade 17 RTX 3070 | |
| Gigabyte Aero 17 HDR YD | |
| MSI GS76 Stealth 11UH | |
| Durchschnittliche NVIDIA GeForce RTX 3070 Laptop GPU (27.9 - 107, n=49) | |
| Acer Nitro 5 AN517-41-R9S5 | |
Witcher 3 FPS-Tabelle
| min. | mittel | hoch | max. | |
|---|---|---|---|---|
| GTA V (2015) | 185 | 180 | 173 | 108 |
| The Witcher 3 (2015) | 460.9 | 312.7 | 204.8 | 100.6 |
| Dota 2 Reborn (2015) | 171 | 155 | 149 | 140 |
| Final Fantasy XV Benchmark (2018) | 195 | 136 | 103 | |
| X-Plane 11.11 (2018) | 142 | 125 | 98.4 | |
| Far Cry 5 (2018) | 149 | 138 | 131 | 122 |
| Strange Brigade (2018) | 522 | 261 | 212 | 186 |
Emissionen — Beim Gamen weiterhin laut
Geräuschemissionen
Das Lüftergeräusch ist leiser, als man das von einem Gaming-Laptop mit vier individuellen Lüftern erwarten würde, denn die Lüfter stehen so oft wie möglich, etwa beim Surfen im Netz, still. Während des Gamens im manuellen Turbo-Modus kann das Lüftergeräusch allerdings bis zu 56 dB(A) erreichen und ist somit lauter als bei den meisten Gaming-Laptops. Die kleineren Lüfter unterhalb des Clickpads haben auch noch eine deutlich höhere Frequenz als andere Lüfter und sind dadurch recht penetrant.
Im ausgeglichenen Modus steigt das Lüftergeräusch beim Gamen hingegen auf maximal 43,5 dB(A). Das geht natürlich mit einem Leistungsverlust einher.
Legt man das Ohr an die Tastatur unseres Testmodells, lässt sich sehr leichtes Spulenfiepen oder elektronisches Rauschen vernehmen.
| Razer Blade 17 RTX 3070 GeForce RTX 3070 Laptop GPU, i7-11800H, Samsung PM9A1 MZVL21T0HCLR | Asus ROG Zephyrus S17 GX703HSD GeForce RTX 3080 Laptop GPU, i9-11900H, Samsung PM9A1 MZVL22T0HBLB | MSI GS76 Stealth 11UH GeForce RTX 3080 Laptop GPU, i9-11900H, Samsung PM9A1 MZVL22T0HBLB | Acer Nitro 5 AN517-41-R9S5 GeForce RTX 3080 Laptop GPU, R7 5800H, SK Hynix BC711 1TB HFM001TD3JX016N | Gigabyte Aero 17 HDR YD GeForce RTX 3080 Laptop GPU, i9-11980HK, Samsung PM9A1 MZVL2512HCJQ | Maingear Vector Pro MG-VCP17 GeForce RTX 3080 Laptop GPU, i7-11800H, Samsung PM9A1 MZVL21T0HCLR | |
|---|---|---|---|---|---|---|
| Geräuschentwicklung | 6% | -8% | -4% | -19% | 1% | |
| aus / Umgebung * (dB) | 24.2 | 23 5% | 24 1% | 26 -7% | 25 -3% | 23.8 2% |
| Idle min * (dB) | 24.7 | 23 7% | 24 3% | 26 -5% | 30 -21% | 23.9 3% |
| Idle avg * (dB) | 24.7 | 23 7% | 25 -1% | 28 -13% | 32 -30% | 23.9 3% |
| Idle max * (dB) | 24.7 | 23 7% | 42 -70% | 41 -66% | 23.9 3% | |
| Last avg * (dB) | 44.3 | 41 7% | 46 -4% | 41.6 6% | 43 3% | 38 14% |
| Witcher 3 ultra * (dB) | 56.3 | 45 20% | 48 15% | 51 9% | 55.9 1% | |
| Last max * (dB) | 47.7 | 52 -9% | 48 -1% | 48.6 -2% | 59 -24% | 55.9 -17% |
* ... kleinere Werte sind besser
Lautstärkediagramm
| Idle |
| 24.7 / 24.7 / 24.7 dB(A) |
| Last |
| 44.3 / 47.7 dB(A) |
 | ||
30 dB leise 40 dB(A) deutlich hörbar 50 dB(A) störend |
||
min: | ||
Temperatur
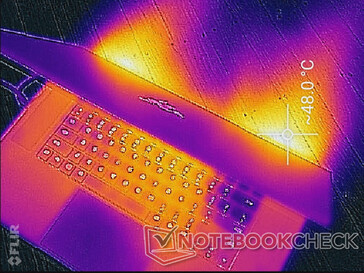
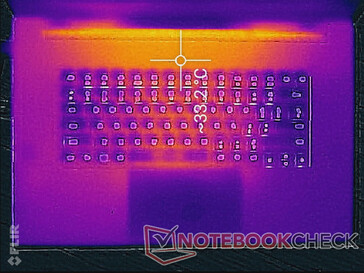
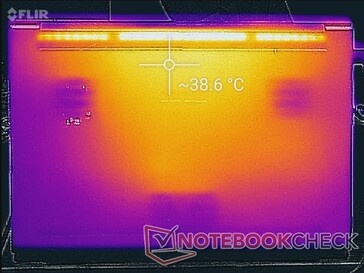
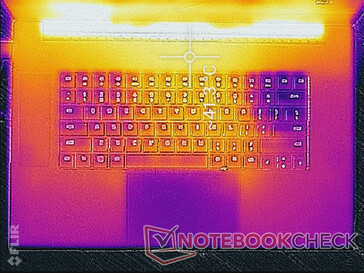
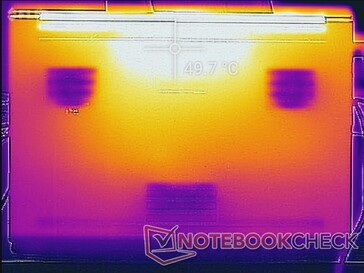
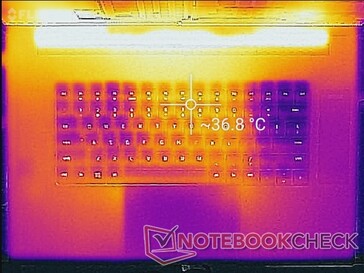
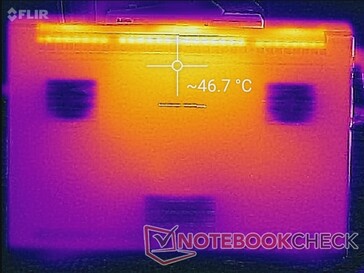
Die Oberflächentemperatur des Blade 17 ist akzeptabel, was teilweise den vier Lüftern zu verdanken ist. Die meisten Laptops sind nur mit zwei Lüftern ausgestattet. Die Hotspots auf der Ober- und Unterseite erreichen über 41 bzw. 49 °C, während das Asus Zephyrus S17 etwa Hotspots von 59 bzw. 53 °C hat. Auch die Handballenablage bleibt deutlich kühler - selbst im Vergleich zum Blade 15.
Im Leerlauf ist die Oberflächentemperatur relativ warm, da die Lüfter bei geringer Last weitgehend ausgeschaltet bleiben. Hier liegt der untere Hotspot bei 39 °C, beim zuvor genannten Asus liegt er bei nur 35 °C.
(±) Die maximale Temperatur auf der Oberseite ist 41 °C. Im Vergleich liegt der Klassendurchschnitt bei 40.4 °C (von 21.2 bis 68.8 °C für die Klasse Gaming).
(-) Auf der Unterseite messen wir eine maximalen Wert von 47.2 °C (im Vergleich zum Durchschnitt von 43.3 °C).
(+) Ohne Last messen wir eine durchschnittliche Temperatur von 29.9 °C auf der Oberseite. Der Klassendurchschnitt erreicht 33.9 °C.
(±) Beim längeren Spielen von The Witcher 3 erhitzt sich das Gerät durchschnittlich auf 33.2 °C. Der Durchschnitt der Klasse ist derzeit 33.9 °C.
(+) Die Handballen und der Touchpad-Bereich erreichen maximal 33 °C und damit die typische Hauttemperatur und fühlen sich daher nicht heiß an.
(-) Die durchschnittliche Handballen-Temperatur anderer getesteter Geräte war 28.8 °C (-4.2 °C).
Stresstest
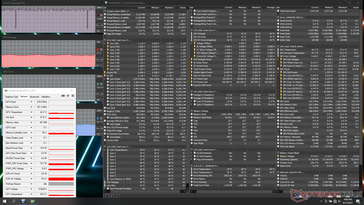
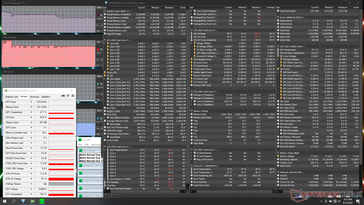
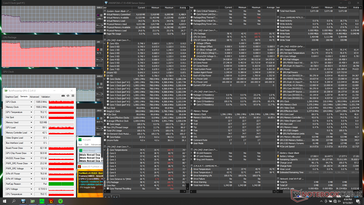
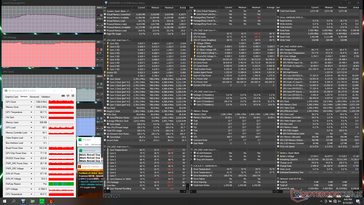
Im Stresstest mit Prime95 im Turbo-Modus steigt die CPU-Taktrate etwa 20 Sekunden lang auf 3,9 GHz und fällt dann auf 3,5 GHz und schließlich auf 2,9 GHz ab, um eine Kerntemperatur von 78 °C aufrechtzuerhalten. Das ist zwar passabel, dennoch hätten wir uns bei 100%-Auslastung über langfristig höhere Taktraten gefreut.
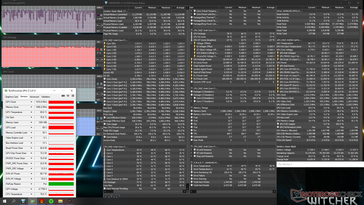
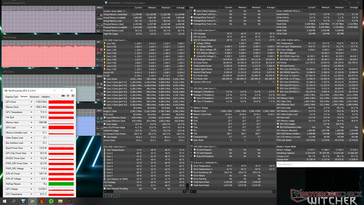
Läuft Witcher 3 im Turbo-Modus, liegt die GPU-Taktrate bei gleichmäßigen 1.725 MHz und einer Leistungsaufnahme von 116 W. Ist der Turbo-Modus nicht aktiviert, sinken die Werte auf nur 1.515 MHz und 95 W. Allerdings bleibt der Speichertakt und die GPU-Temperatur etwa gleich. Eine Leistungsaufnahme von 130 W scheint, ohne sich länger damit auseinanderzusetzen, unerreichbar. Wir würden Nutzern daher empfehlen, über die Software Razer Central manuell den Turbo-Modus zu aktivieren, um so viel Grafikleistung wie möglich aus dem Laptop herauszuholen.
Interessanterweise liegen die CPU- und GPU-Temperaturen beim Blade 17 höher als beim älteren Blade Pro mit RTX 3080. Während Witcher 3 liegen die CPU- und GPU-Temperaturen durchgehend bei 79 bzw. 72 °C, während die Chips beim älteren Blade Pro nur 65 bzw. 64 °C erreichten. Wir vermuten, dass das auf die höhere PL2 der CPU (160 W statt 120 W) und TGP (130 W statt 100W) im neueren Blade 17 zurückzuführen ist.
Im Akkubetrieb wird die Leistung eingeschränkt, da der Turbo-Modus hier nicht aktiviert werden kann. Der 3DMark 11 ergibt im Akkubetrieb Physics- und Graphics-Ergebnisse von 6.377 bzw. 11.738, während im Netzbetrieb 18.529 bzw. 36.224 Punkte erreicht werden.
| CPU Clock (GHz) | GPU Clock (MHz) | Average CPU Temperature (°C) | Average GPU Temperature (°C) | |
| System Idle | -- | -- | 46 | 42 |
| Prime95 Stress (Turbo on) | 2.8 | -- | 78 | 48 |
| Prime95 + FurMark Stress (Turbo off) | 2.0 | 1305 | 78 | 70 |
| Prime95 + FurMark Stress (Turbo on) | 2.8 - 3.4 | 1380 | 92 | 69 |
| Witcher 3 Stress (Turbo off) | ~1.8 - 4.2 | 1515 | 77 | 70 |
| Witcher 3 Stress (Turbo on) | 4.2 | 1725 | 79 | 72 |
Lautsprecher

Razer Blade 17 RTX 3070 Audio Analyse
(+) | Die Lautsprecher können relativ laut spielen (86.8 dB)
Bass 100 - 315 Hz
(-) | kaum Bass - 23.4% niedriger als der Median
(±) | durchschnittlich lineare Bass-Wiedergabe (11.6% Delta zum Vorgänger)
Mitteltöne 400 - 2000 Hz
(+) | ausgeglichene Mitten, vom Median nur 2.4% abweichend
(+) | lineare Mitten (2.1% Delta zum Vorgänger)
Hochtöne 2 - 16 kHz
(+) | ausgeglichene Hochtöne, vom Median nur 2.7% abweichend
(+) | sehr lineare Hochtöne (5.1% Delta zum Vorgänger)
Gesamt im hörbaren Bereich 100 - 16.000 Hz
(+) | hörbarer Bereich ist sehr linear (13.6% Abstand zum Median
Im Vergleich zu allen Geräten derselben Klasse
» 20% aller getesteten Geräte dieser Klasse waren besser, 7% vergleichbar, 73% schlechter
» Das beste Gerät hat einen Delta-Wert von 6%, durchschnittlich ist 18%, das schlechteste Gerät hat 132%
Im Vergleich zu allen Geräten im Test
» 14% aller getesteten Geräte waren besser, 4% vergleichbar, 82% schlechter
» Das beste Gerät hat einen Delta-Wert von 4%, durchschnittlich ist 24%, das schlechteste Gerät hat 134%
Apple MacBook 12 (Early 2016) 1.1 GHz Audio Analyse
(+) | Die Lautsprecher können relativ laut spielen (83.6 dB)
Bass 100 - 315 Hz
(±) | abgesenkter Bass - 11.3% geringer als der Median
(±) | durchschnittlich lineare Bass-Wiedergabe (14.2% Delta zum Vorgänger)
Mitteltöne 400 - 2000 Hz
(+) | ausgeglichene Mitten, vom Median nur 2.4% abweichend
(+) | lineare Mitten (5.5% Delta zum Vorgänger)
Hochtöne 2 - 16 kHz
(+) | ausgeglichene Hochtöne, vom Median nur 2% abweichend
(+) | sehr lineare Hochtöne (4.5% Delta zum Vorgänger)
Gesamt im hörbaren Bereich 100 - 16.000 Hz
(+) | hörbarer Bereich ist sehr linear (10.2% Abstand zum Median
Im Vergleich zu allen Geräten derselben Klasse
» 7% aller getesteten Geräte dieser Klasse waren besser, 2% vergleichbar, 91% schlechter
» Das beste Gerät hat einen Delta-Wert von 5%, durchschnittlich ist 18%, das schlechteste Gerät hat 53%
Im Vergleich zu allen Geräten im Test
» 4% aller getesteten Geräte waren besser, 1% vergleichbar, 94% schlechter
» Das beste Gerät hat einen Delta-Wert von 4%, durchschnittlich ist 24%, das schlechteste Gerät hat 134%
Energieverwaltung
Energieaufnahme
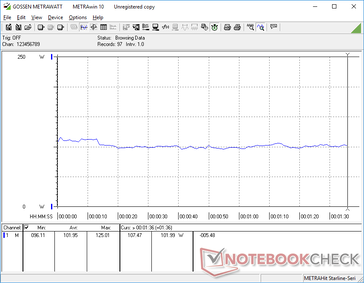
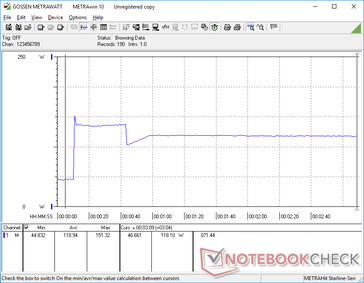
Das Blade 17 ist allgemein energiehungriger als die älteren Blade-Pro-Modelle - selbst als das Blade Pro mit RTX 3080 und 4K-Display. Während Witcher 3 nimmt unser Testgerät etwa 189 W auf, während das Blade Pro mit RTX 3080 oder RTX 2070 hier nur 158 W benötigten. Das entspricht fast eins zu eins dem Unterschied in der Ziel-TGP. Die älteren Blade-Pro-Modelle hatten eine TGP von 100 W, während das neuere Blade 17 eine TGP von 130 W anzielt. Leider entspricht diese um 20 Prozent höhere Energieaufnahme im Vergleich zwischen dem Blade Pro und dem neueren Blade 17 nicht einer um 20 Prozent höheren Grafikleistung.
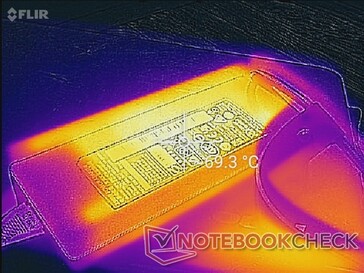
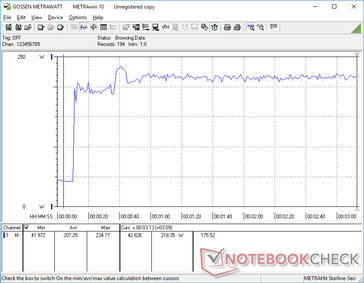
Wir haben eine maximale Leistungsaufnahme von 235 W gemessen. Das mittelgroße 230-W-Netzgerät (~17 x 7 x 2,5 cm) deckt diese Aufnahme ab, allerdings verlangsamt sich die Ladegeschwindigkeit deutlich, wenn das Gerät unter hoher Last steht.
| Aus / Standby | |
| Idle | |
| Last |
|
Legende:
min: | |
| Razer Blade 17 RTX 3070 i7-11800H, GeForce RTX 3070 Laptop GPU, Samsung PM9A1 MZVL21T0HCLR, IPS, 1920x1080, 17.3" | Razer Blade Pro 17 2021 (QHD Touch) i7-10875H, GeForce RTX 3080 Laptop GPU, Samsung PM981a MZVLB1T0HBLR, IPS, 3840x2160, 17.3" | Razer Blade Pro 17 RTX 2070 Max-Q 300 Hz i7-10875H, GeForce RTX 2070 Max-Q, Lite-On CA5-8D512, IPS, 1920x1080, 17.3" | Razer Blade Pro 17 4K UHD 120 Hz i7-9750H, GeForce RTX 2080 Max-Q, Samsung SSD PM981 MZVLB1T0HALR, IPS, 3840x2160, 17.3" | Razer Blade Pro 17 RTX 2060 i7-9750H, GeForce RTX 2060 Mobile, Samsung SSD PM981 MZVLB512HAJQ, IPS, 1920x1080, 17.3" | Razer Blade Pro 17 RTX 2080 Max-Q i7-9750H, GeForce RTX 2080 Max-Q, Samsung SSD PM981 MZVLB512HAJQ, IPS, 1920x1080, 17.3" | |
|---|---|---|---|---|---|---|
| Stromverbrauch | 12% | 8% | -20% | 16% | 17% | |
| Idle min * (Watt) | 20.9 | 15.2 27% | 19.6 6% | 34.2 -64% | 16 23% | 16.2 22% |
| Idle avg * (Watt) | 25.1 | 20.3 19% | 21.7 14% | 37.2 -48% | 21.7 14% | 20.4 19% |
| Idle max * (Watt) | 45 | 37.3 17% | 36.1 20% | 50 -11% | 26.1 42% | 26.1 42% |
| Last avg * (Watt) | 102 | 114.9 -13% | 115.6 -13% | 106.1 -4% | 105.6 -4% | 96.5 5% |
| Witcher 3 ultra * (Watt) | 189 | 158.4 16% | 157 17% | 178.7 5% | 161.8 14% | 182.9 3% |
| Last max * (Watt) | 234.8 | 223.7 5% | 219.9 6% | 223.6 5% | 225.3 4% | 214.3 9% |
* ... kleinere Werte sind besser
Energieaufnahme Witcher 3 / Stresstest
Akkulaufzeit — Nicht schlecht für einen 17,3-Zoll-Gamer
Die Akkukapazität hat sich im Vergleich zum Blade Pro nicht verändert und auch die Akkulaufzeit ähnelt sich trotz der höheren nativen Bildwiederholrate. Wir konnten im ausgeglichenen Modus mit aktivem Optimus etwas mehr als 5 Stunden WLAN-Nutzung herausholen.
Das vollständige Aufladen dauert mit dem beigelegten Netzgerät etwa 1,5 Stunden. Auch über USB-C, etwa mit dem Razer USB-C GaN-Netzgerät, kann geladen werden, allerdings muss man hier länger warten.
| Razer Blade 17 RTX 3070 i7-11800H, GeForce RTX 3070 Laptop GPU, 70 Wh | Asus ROG Zephyrus S17 GX703HSD i9-11900H, GeForce RTX 3080 Laptop GPU, 90 Wh | MSI GS76 Stealth 11UH i9-11900H, GeForce RTX 3080 Laptop GPU, 99.9 Wh | Acer Nitro 5 AN517-41-R9S5 R7 5800H, GeForce RTX 3080 Laptop GPU, 57.5 Wh | Gigabyte Aero 17 HDR YD i9-11980HK, GeForce RTX 3080 Laptop GPU, 99 Wh | Maingear Vector Pro MG-VCP17 i7-11800H, GeForce RTX 3080 Laptop GPU, 91 Wh | |
|---|---|---|---|---|---|---|
| Akkulaufzeit | 62% | 19% | 10% | -6% | 33% | |
| Idle (h) | 6.7 | 9.9 48% | ||||
| WLAN (h) | 5.2 | 7.5 44% | 6.4 23% | 5.7 10% | 5.6 8% | 6.9 33% |
| Last (h) | 1.5 | 2.7 80% | 1.3 -13% | 1.2 -20% | ||
| Witcher 3 ultra (h) | 1 |
Pro
Contra
Fazit — Enorme CPU-Steigerung mit geringen GPU-Zugewinnen
Während das Update auf eine 130-W-Grafikkarte im Vergleich zu 100 W theoretisch nach einem deutlichen Leistungsschub klingt, hat sich die tatsächliche Leistung nur minimal verbessert, da die GPU immer noch zur gleichen Ampere-Serie von Nvidia gehört. In diesem Fall entspricht die 130-W-RTX-3070-GPU mehr oder weniger dem Niveau der 100-W-RTX-3080-Karte im mit einer Comet Lake-H ausgestatteten Blade Pro. Im Turbo-Modus konnten wir konstante 115 W herausholen, während im voreingestellten Balanced-Modus nur 95 W erreicht werden. Das bedeutet, dass Nutzer den Turbo-Modus aktivieren und das hohe Lüftergeräusch in Kauf nehmen müssen, wenn sie die maximale Leistung aus dem System herausholen möchten.
Die größte Verbesserung liegt in der Prozessorleistung. Hier wurde der Sprung von einem Intel-Chip der 10. Generation auf die 11. Generation gewagt. Die Ergebnisse sind, unter anderem weil der Core i7-10875H im 2020er Blade Pro etwas geschwächelt hat, ziemlich beeindruckend. Das CPU-Update geht auch mit einer Unterstützung für PCIe4 und Thunderbolt 4 einher, wodurch die Zukunftsfähigkeit des Geräts weiter gesichert wird.
Nach zwei Jahren ständiger Updates wirkt das 17,3-Zoll-Blade jetzt sehr ausgefeilt und lässt sich leichter empfehlen als zum Zeitpunkt des ersten Produktstarts 2019.
Auch wenn das Gehäuse aus 2019 immer noch sehr elegant wirkt, würde dem Gerät ein äußerliches Update guttun. Dell hat vor kurzem das Alienware x17 mit einer mechanischen Cherry-Tastatur eingeführt. Die Tastatur des Blade 17 wirkt im Vergleich dazu recht billig. Die fehlende Webcam-Blende lässt sich kaum mehr ignorieren, und für die beiden hohen Lüfter unterhalb des Clickpads sollte eine Lösung gefunden werden, die die Luftzirkulation nicht beeinflusst.
Preis und Verfügbarkeit
Razer Blade 17 RTX 3070
- 21.09.2021 v7 (old)
Allen Ngo


