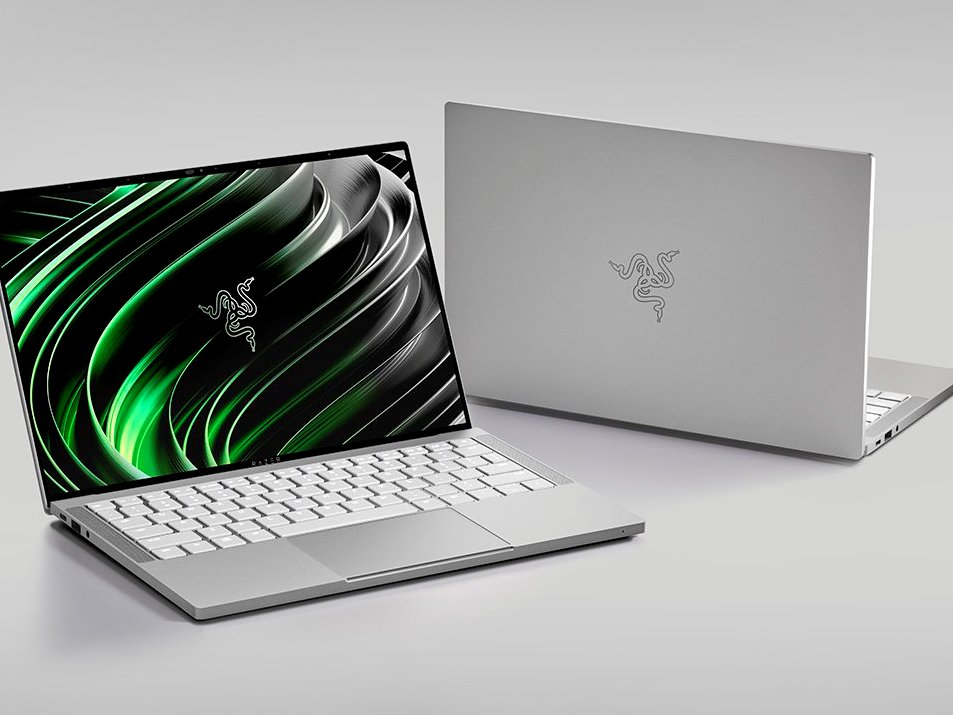
Razer Book 13 Core i7 im Laptop-Test: Wie ein XPS 13, nur schneller

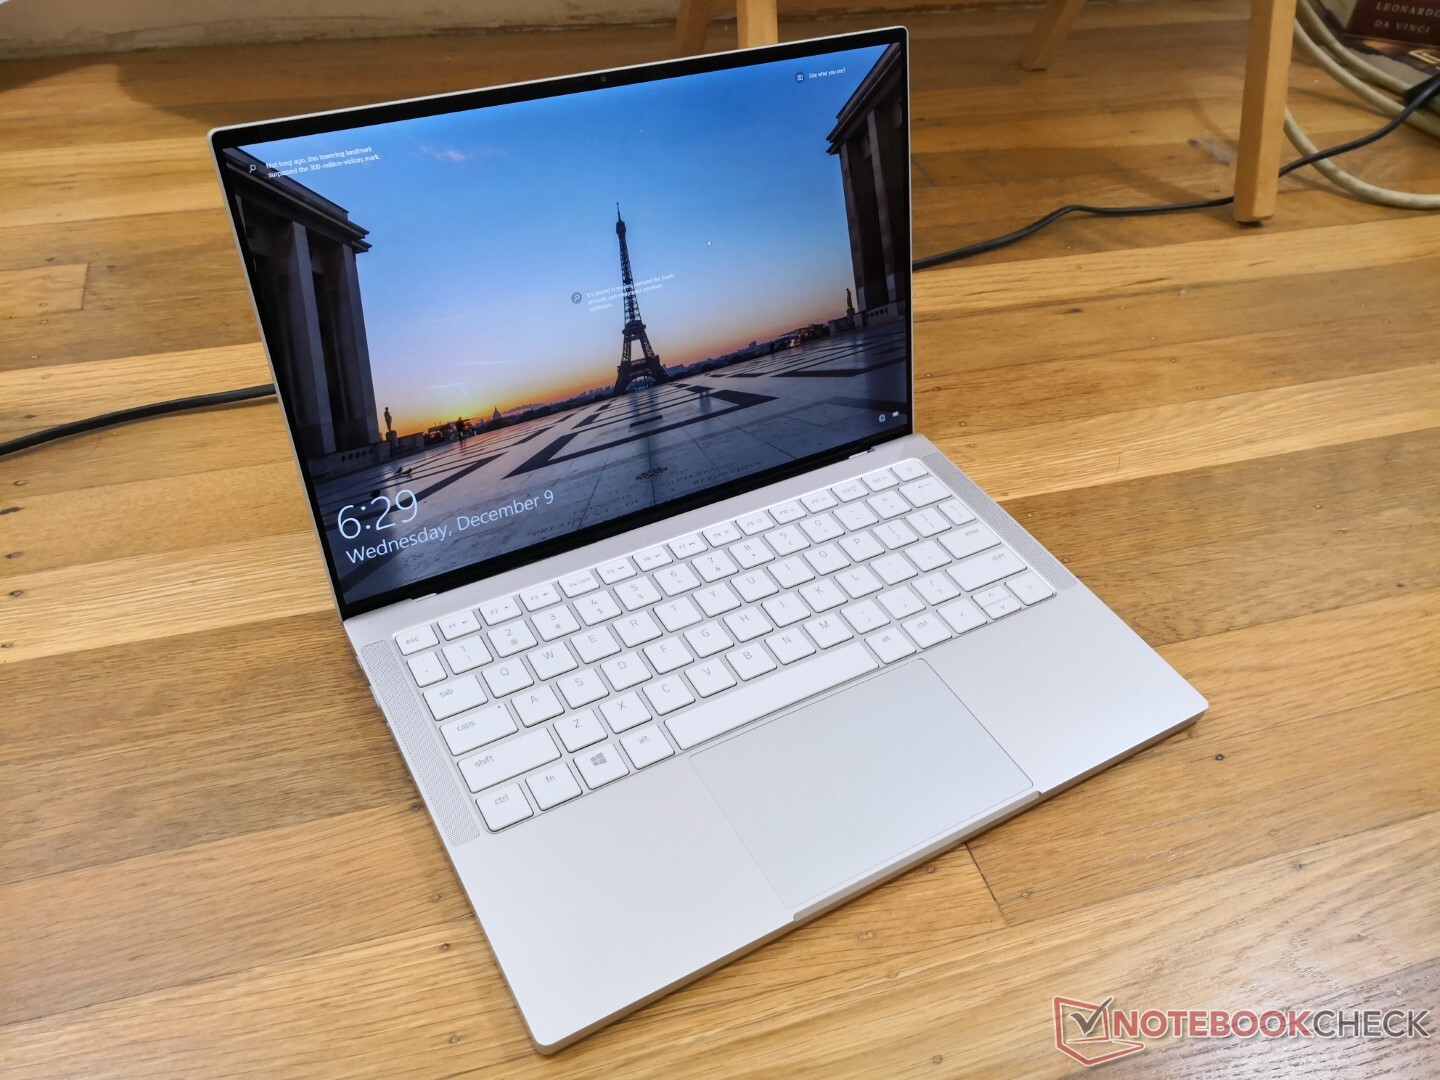
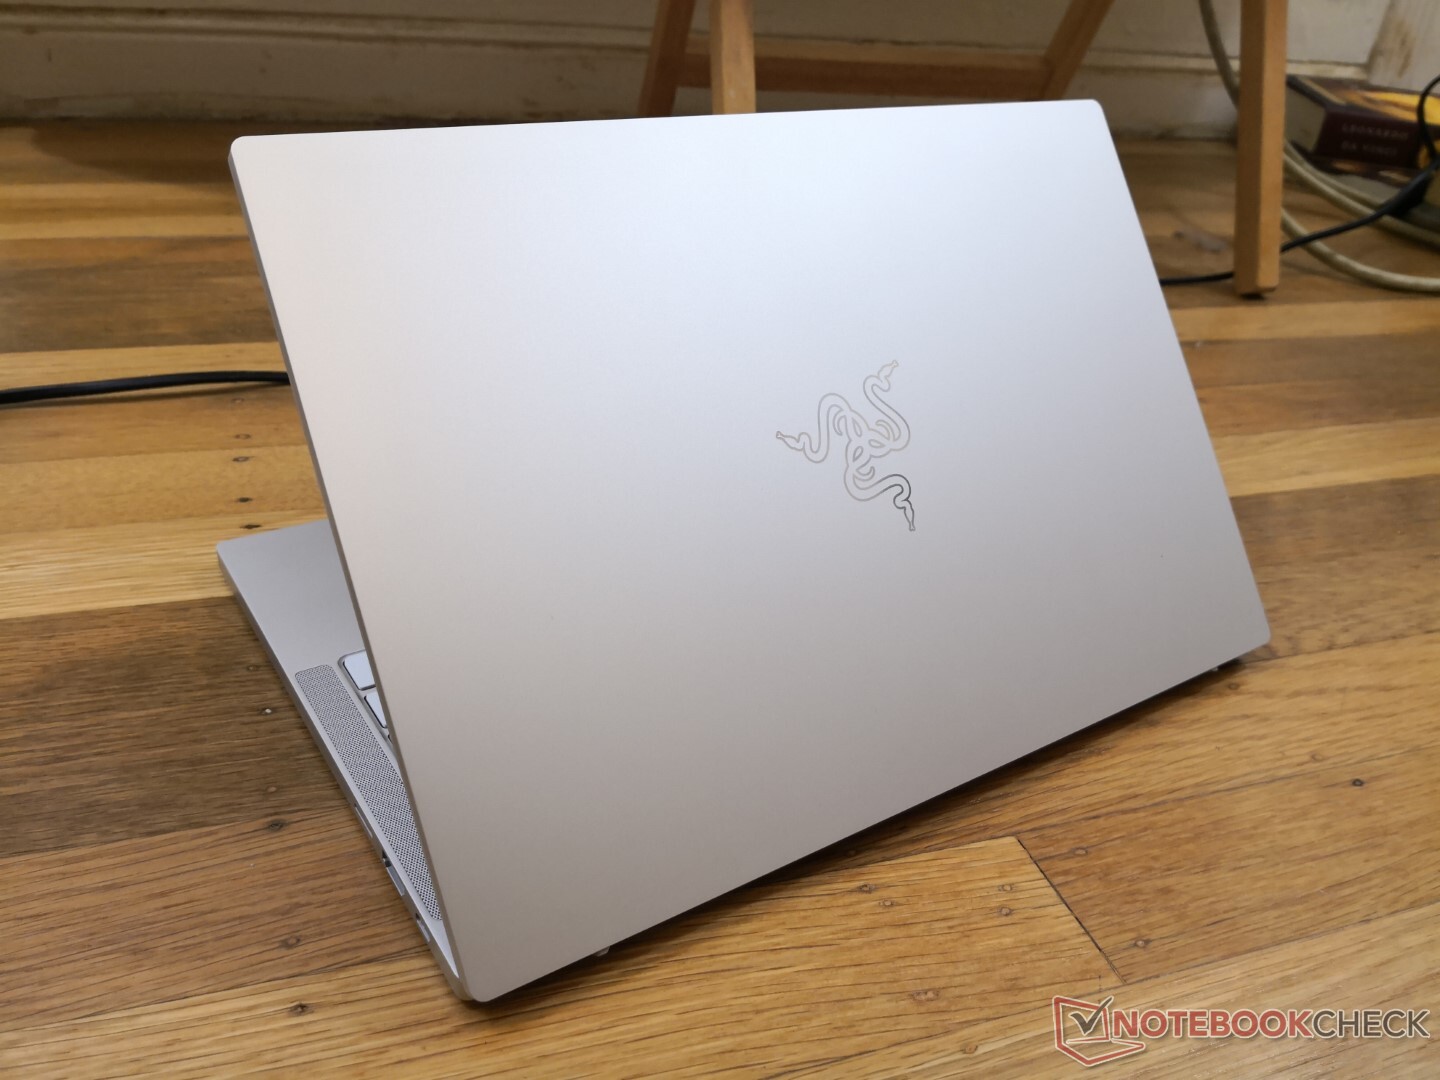
Auf den ersten Blick könnte man annehmen, dass es sich beim Razer Book 13 um ein weißes Blade Stealth handelt, welches einfach für Profis und Fachkräfte umgekrempelt wurde. Tatsächlich handelt es sich um ein komplett neues Gehäuse in einem 16:10-Formfaktor, welches in keinem anderen Modell der Blade-Serie anzutreffen ist. Razer widmet Professionellen damit eine komplett neue Laptop-Reihe abseits der Blade-Serie, Letztere kann sich damit weiter voll auf Gamer fokussieren.
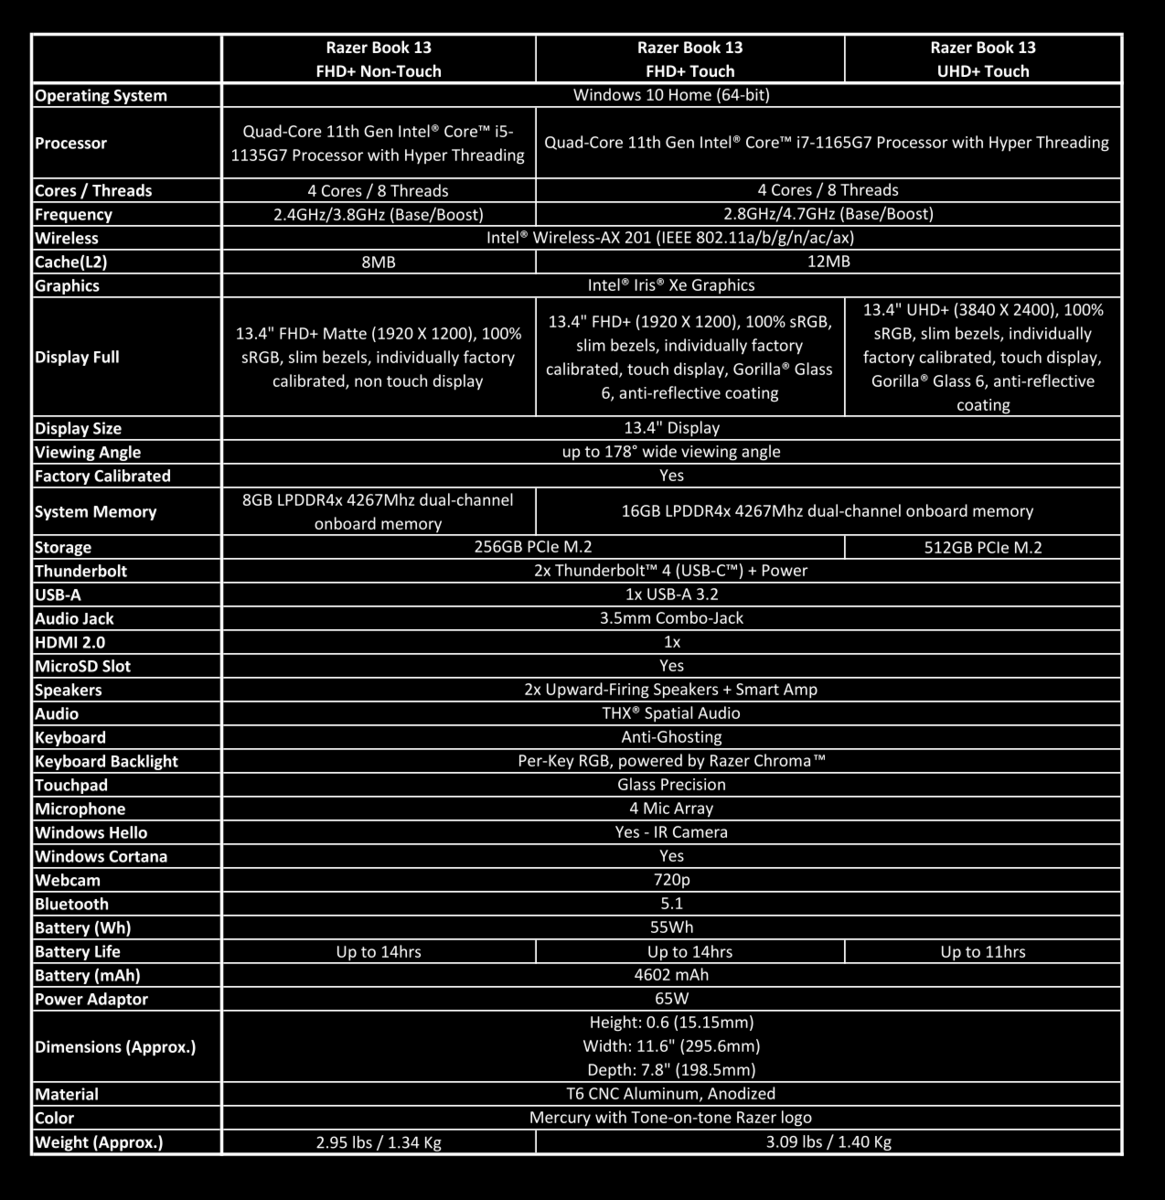
Natürlich erbt das Book 13 nicht wenige der Features aus dem Blade Stealth, diese schauen wir uns gleich genauer an. Konfigurationen starten mit einem Core i5-1135G7 CPU, einem matten 1.200p-Display, 8 GB LPDDR4x-RAM und einer 256 GB großen PCIe-SSD für $1200 USD (~988 Euro). Die stärkste Ausstattung bietet einen i7-1165G7, einen glossy 2.400p-Touchscreen, 16 GB RAM und eine 512 GB große SSD für $2000 USD (~1.647 Euro). Unsere Testeinheit kommt aus der goldenen Mitte, die Ausstattung wird weiter unten aufgelistet.
Konkurrenz zum Book 13 findet sich in anderen 13-Zoll-"Prosumer"-Subnotebooks oder Office-zentrierten Laptops wie dem Dell XPS 13, dem HP Spectre 13, dem Huawei MateBook X Pro, dem Asus ZenBook S, dem Microsoft Surface Laptop 3 13 oder dem Lenovo ThinkBook.
Weitere Razer-Tests:
potential competitors in comparison
Bew. | Datum | Modell | Gewicht | Dicke | Größe | Auflösung | Preis ab |
|---|---|---|---|---|---|---|---|
| 86.6 % v7 (old) | 12 / 2020 | Razer Book 13 FHD i7-1165G7, Iris Xe G7 96EUs | 1.4 kg | 15.15 mm | 13.40" | 1920x1200 | |
| 88.1 % v7 (old) | 10 / 2020 | Dell XPS 13 9310 Core i7 FHD i7-1165G7, Iris Xe G7 96EUs | 1.3 kg | 14.8 mm | 13.40" | 1920x1200 | |
| 85.1 % v7 (old) | Asus Zenbook S UX393JA i7-1065G7, Iris Plus Graphics G7 (Ice Lake 64 EU) | 1.4 kg | 15.7 mm | 13.90" | 3300x2200 | ||
| 87.4 % v7 (old) | 06 / 2020 | Huawei MateBook X Pro 2020 i7 i7-10510U, GeForce MX250 | 1.3 kg | 14.6 mm | 13.90" | 3000x2000 | |
| 87.3 % v6 (old) | 10 / 2018 | Lenovo Yoga C930-13IKB i5-8250U, UHD Graphics 620 | 1.4 kg | 14.9 mm | 13.90" | 1920x1080 | |
| 85.5 % v7 (old) | 11 / 2020 | Razer Blade Stealth i7-1165G7 GTX 1650 Ti Max-Q i7-1165G7, GeForce GTX 1650 Ti Max-Q | 1.4 kg | 15.3 mm | 13.30" | 1920x1080 |
Gehäuse
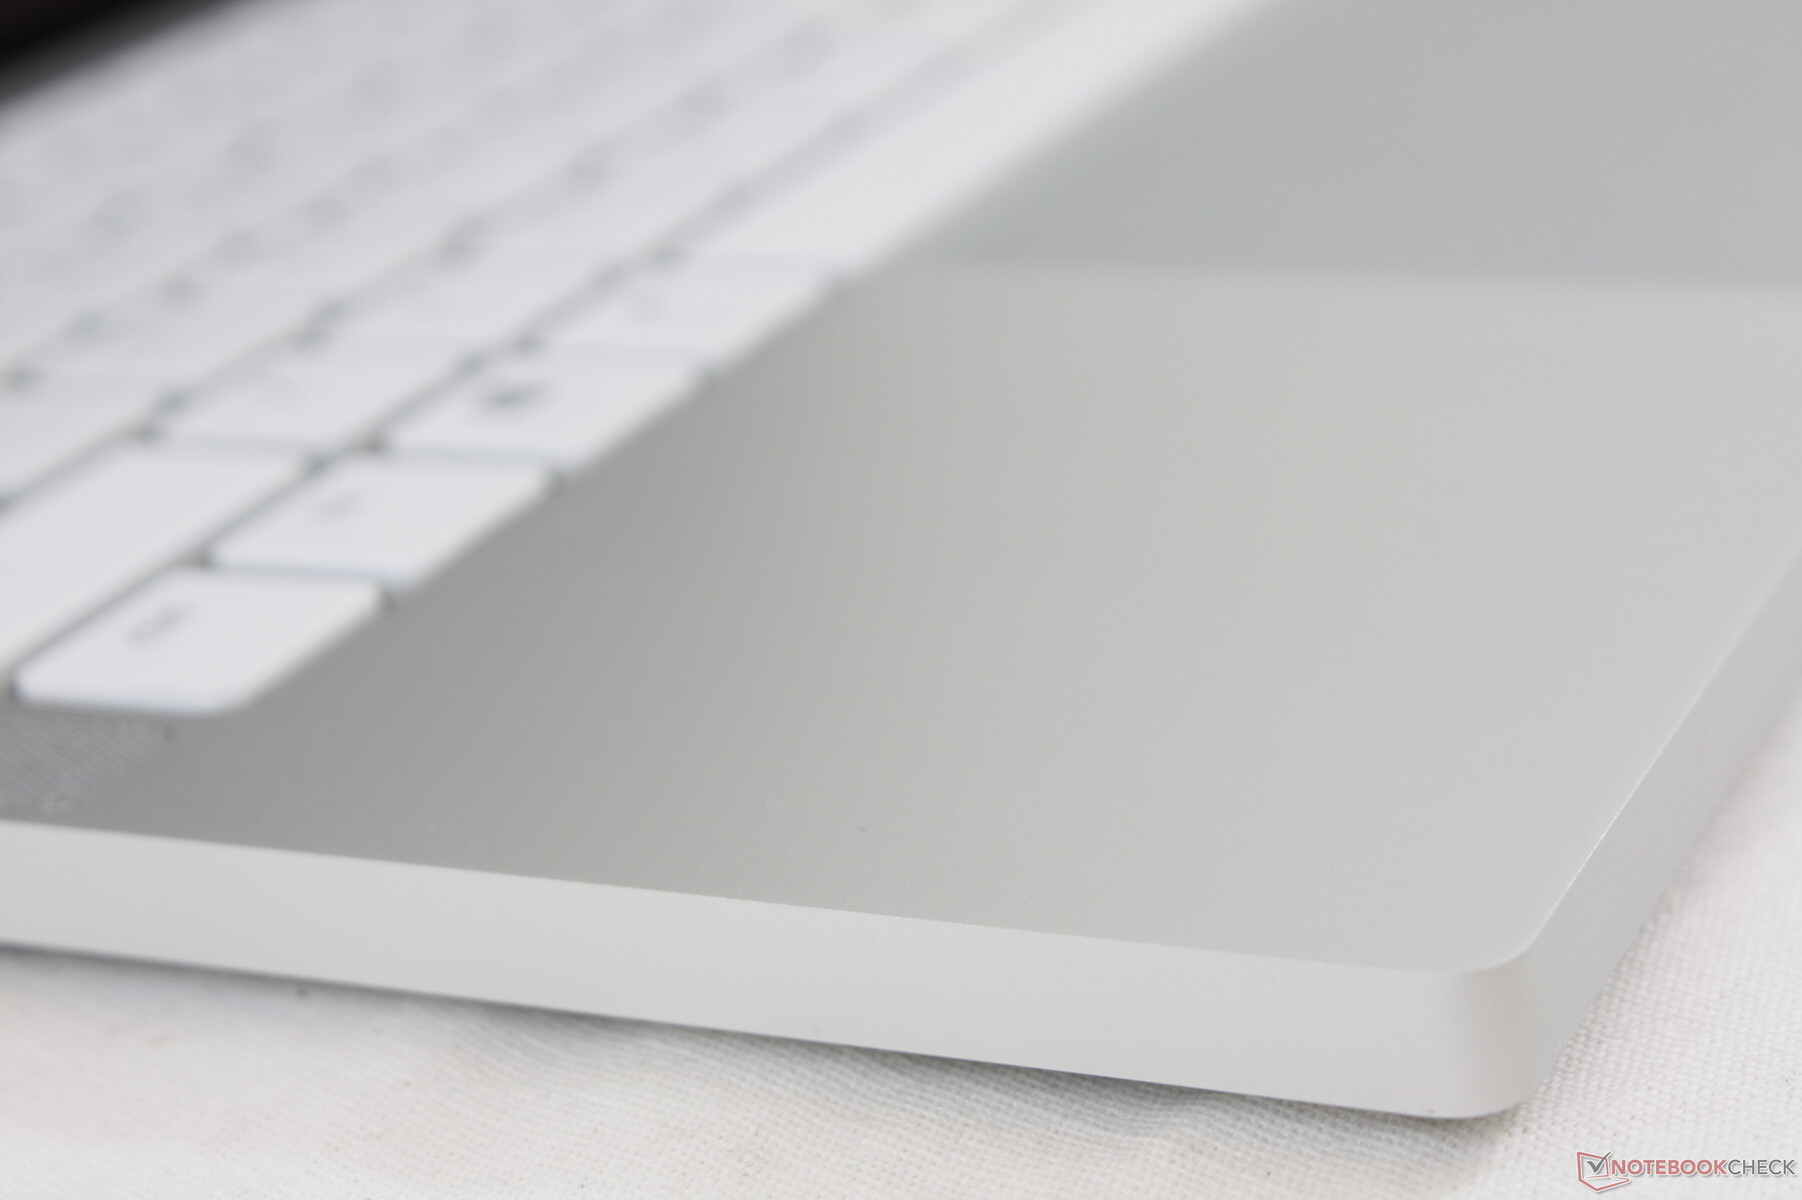
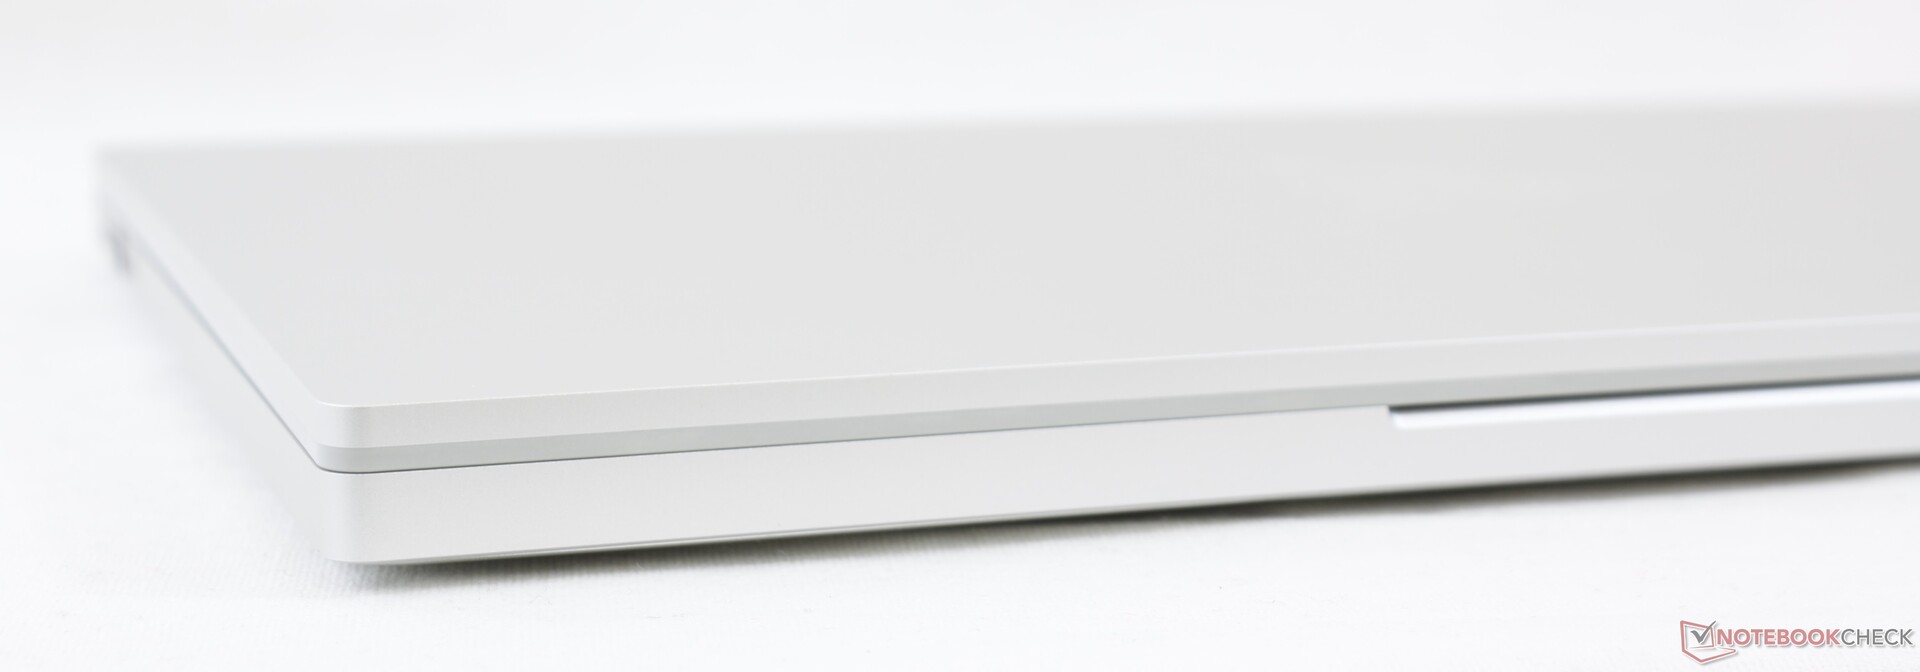
In Bezug auf Qualität, Textur und Festigkeit ist das Book 13 im Wesentlichen identisch mit dem Blade Stealth, da dieselben Metallmaterialien verwendet werden. Wer das Gefühl und Design des Blade liebt, wird vom Book 13 nicht enttäuscht werden.
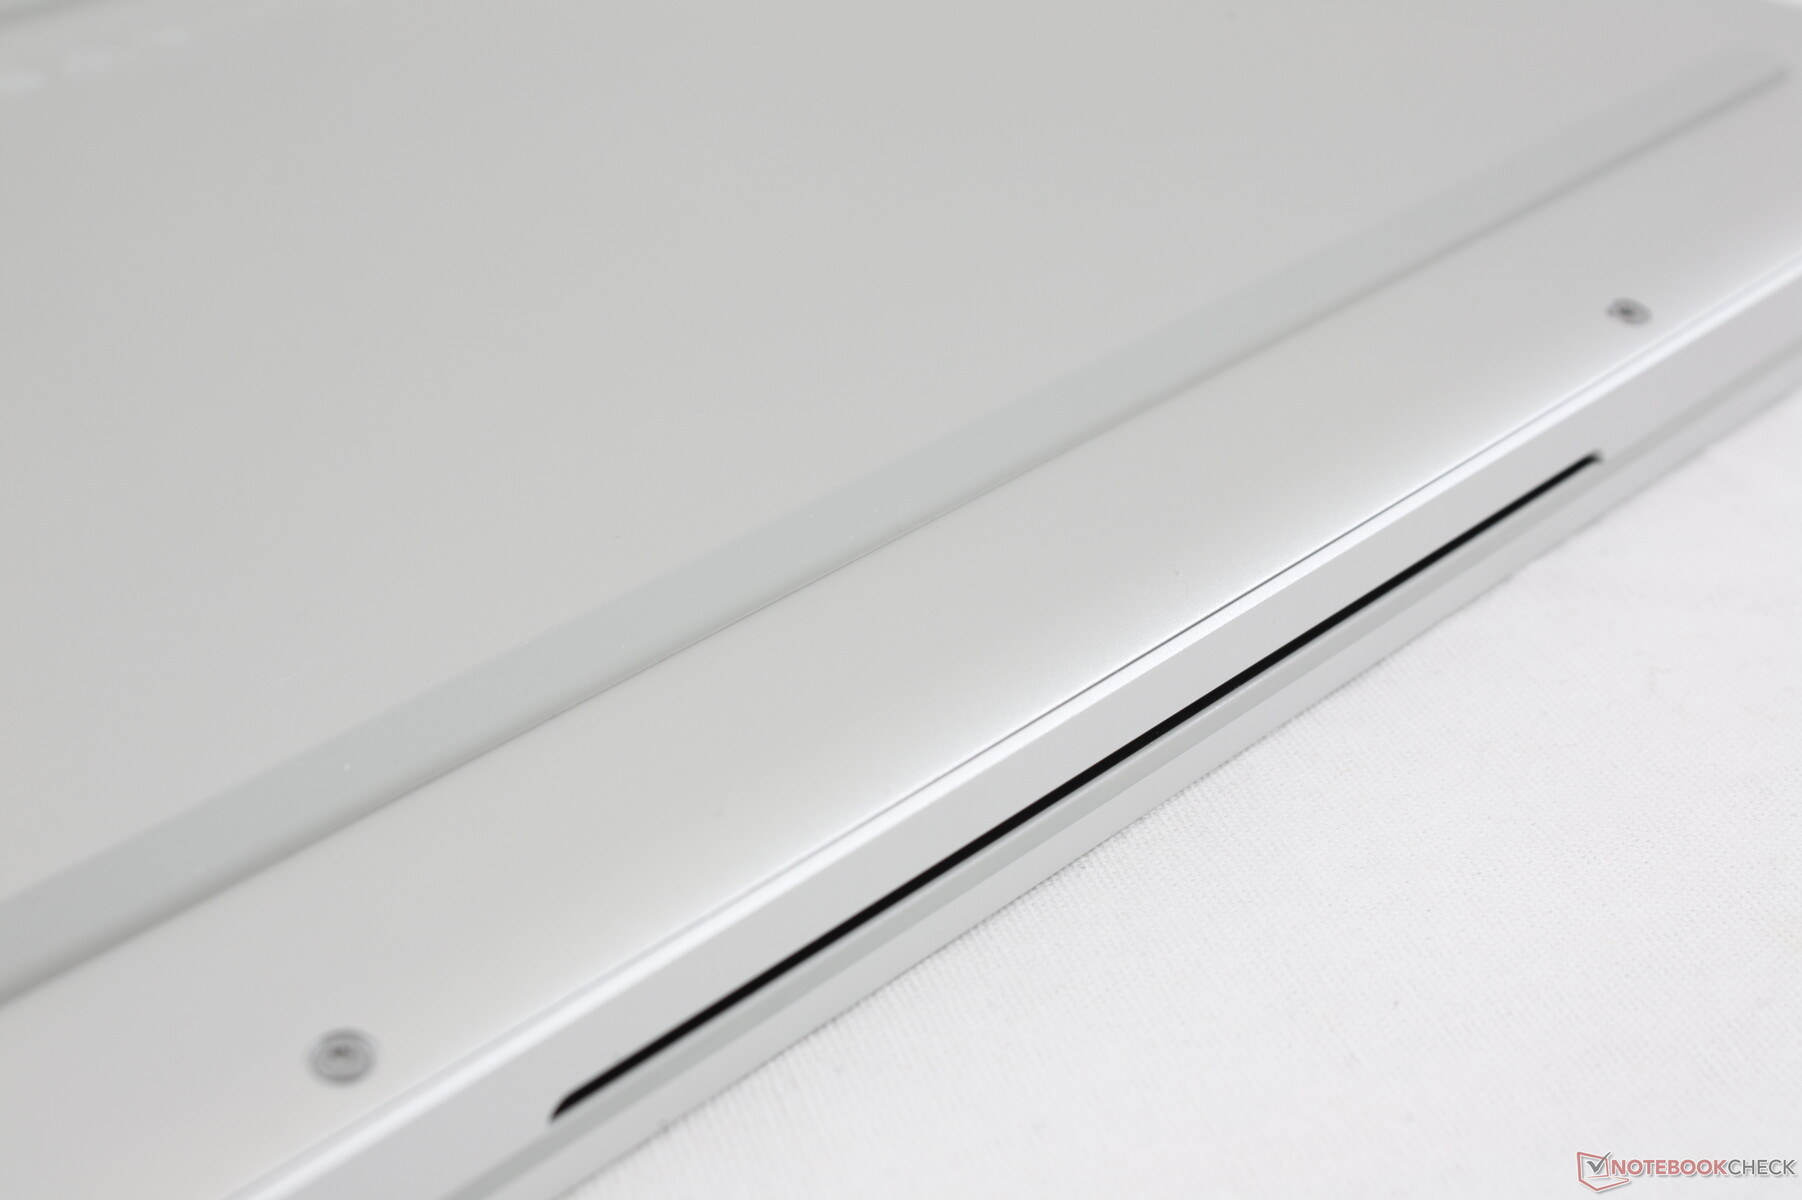
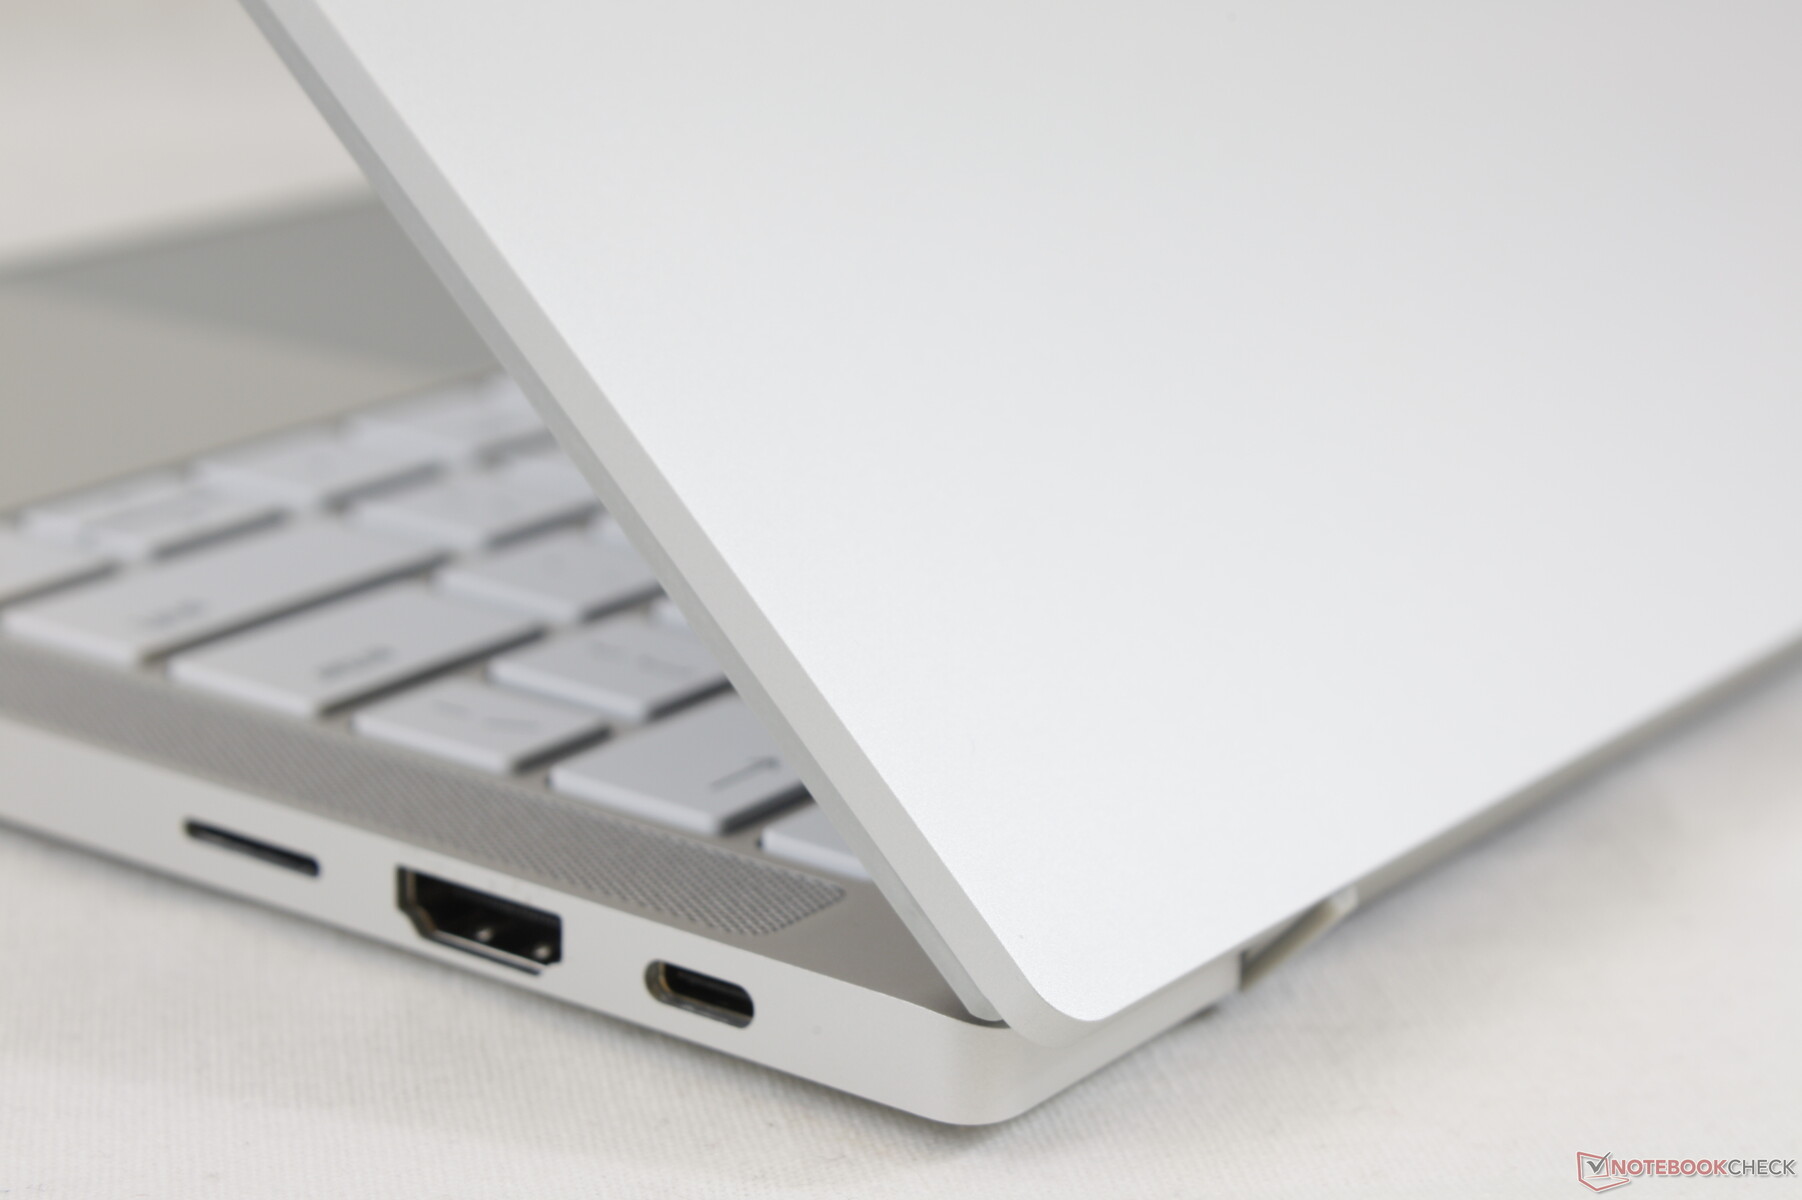
Der größte Unterschied im Gehäuse des Book 13 und des Blade Stealth liegt in den neuen Scharnieren. Razer musste sie wegen dem veränderten Display-Seitenverhältnis neu entwerfen, dabei sollte der untere Displayrahmen nicht breiter werden. Das Endergebnis ähnelt dem ZenBook S, bei dem die Scharniere unter der Basis angebracht sind und sich die Basis beim Öffnen leicht anhebt. Die Stabilität der Scharniere fühlt sich weder schlechter noch besser an als beim Blade Stealth, allerdings konnten wir ein leichtes Knarzen und Knacken beim Einstellen wahrnehmen. Der Öffnungswinkel von maximal 140 Grad kam uns ebenfalls etwas bescheiden vor.
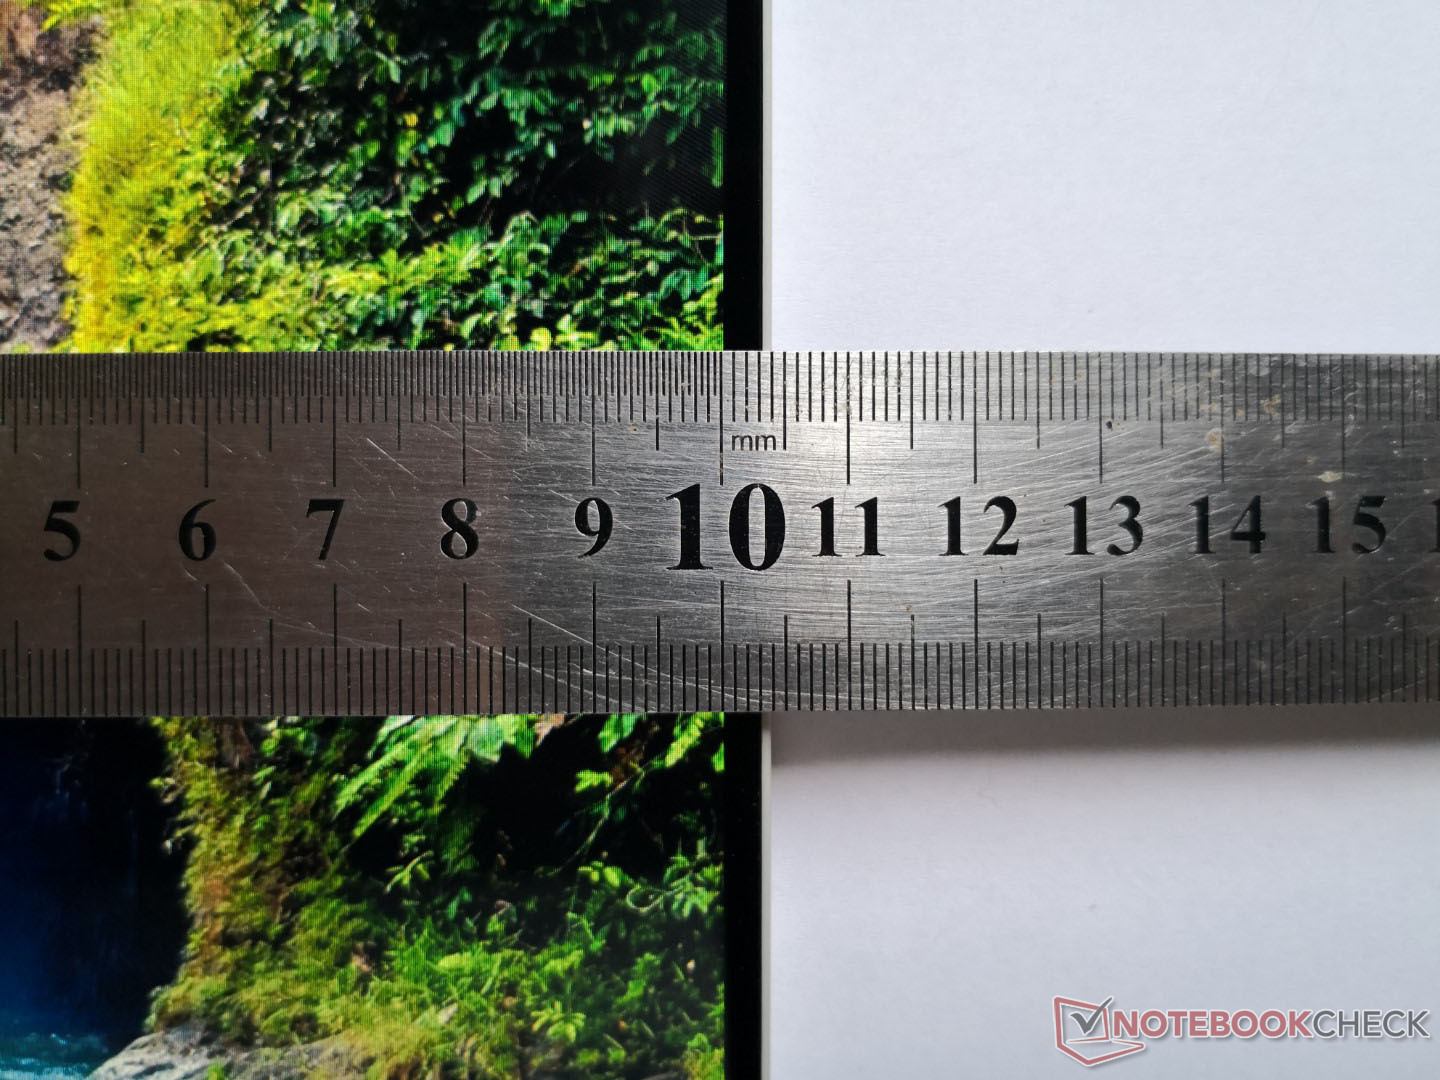
Das Blade Stealth ist bereits einer der kleinsten 13-Zoll-Laptops am Markt und das Book 13 setzt diesen Trend fort, indem es sogar noch etwas kleiner ist, ohne dafür jedoch an der Displaygröße einzubüßen. Die Ausmaße sind mit denen des XPS 13 vergleichbar, es ist nur einen Tick dicker (15.2 mm vs 14.8 mm) und schwerer (1.3 kg vs. 1.4 kg).
Ausstattung
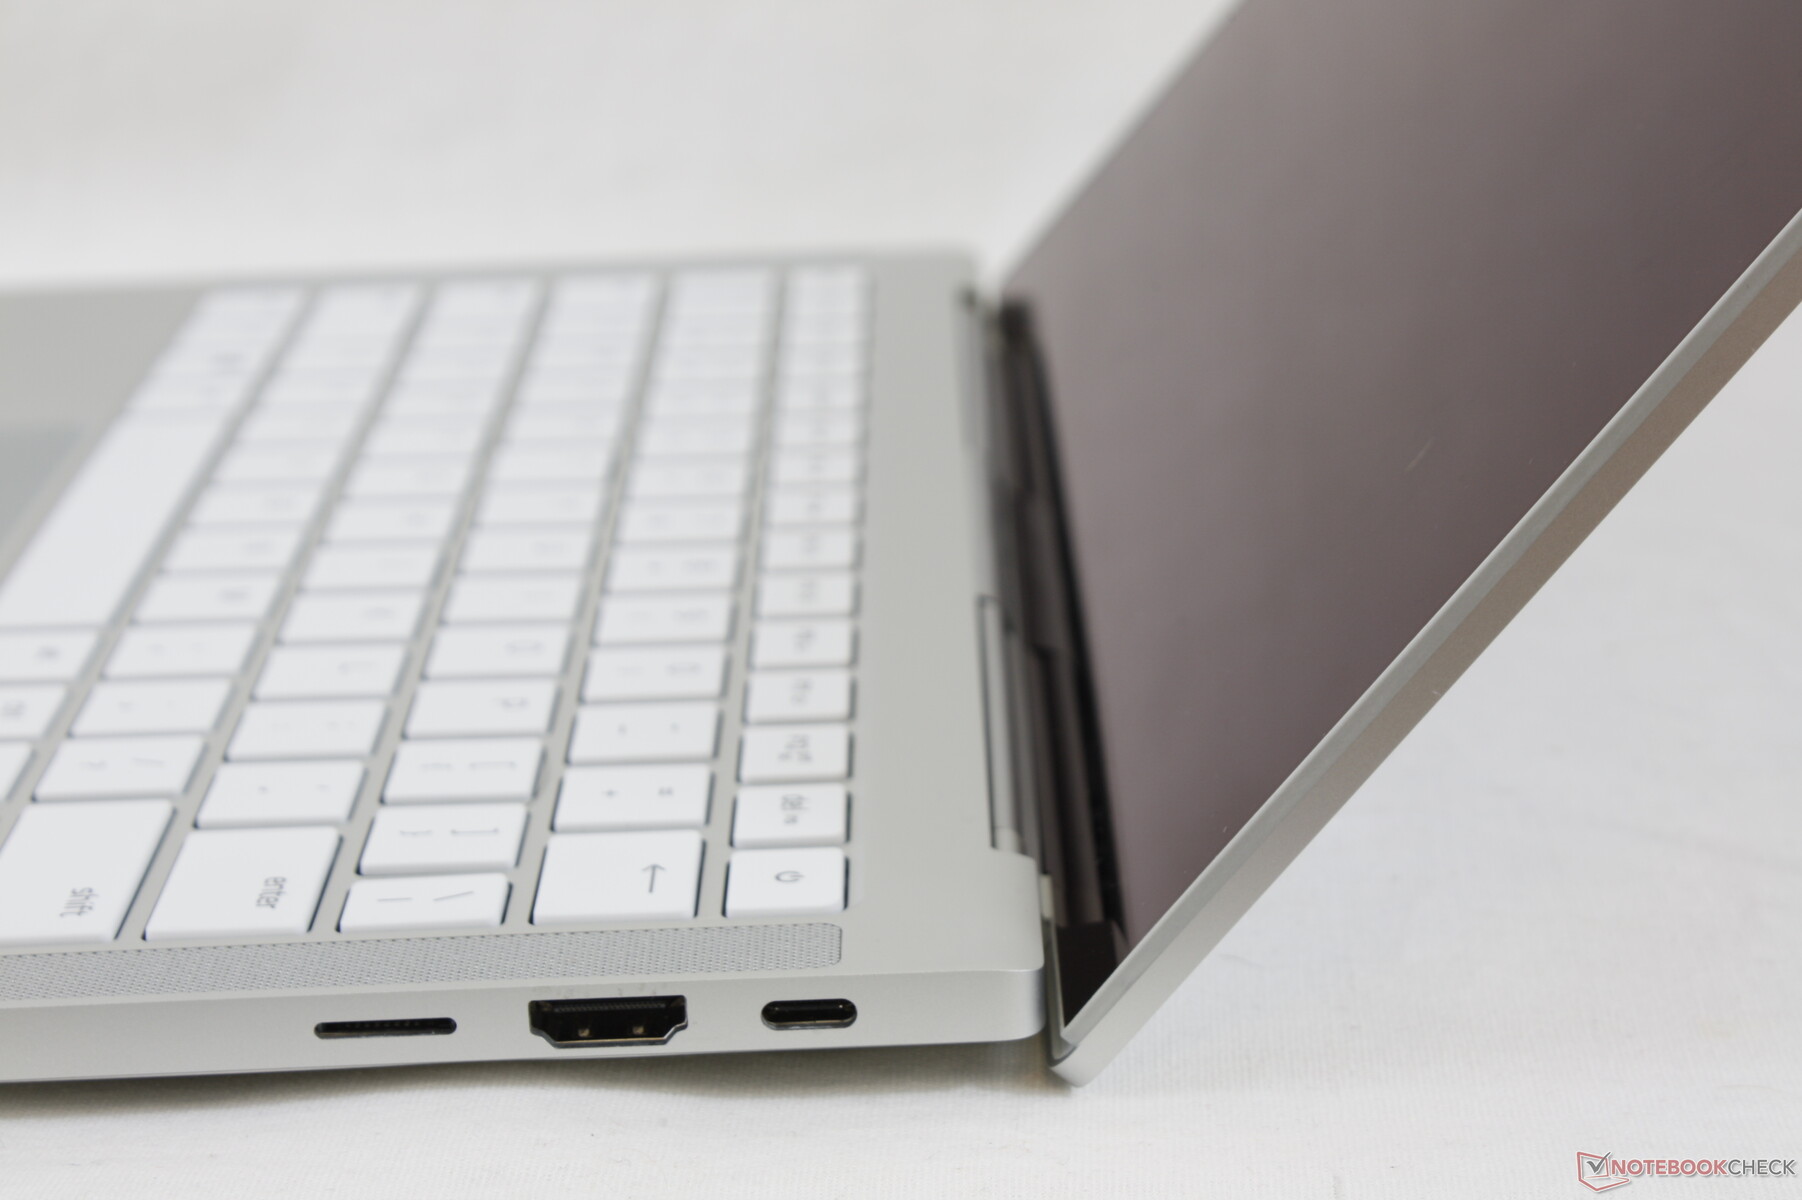
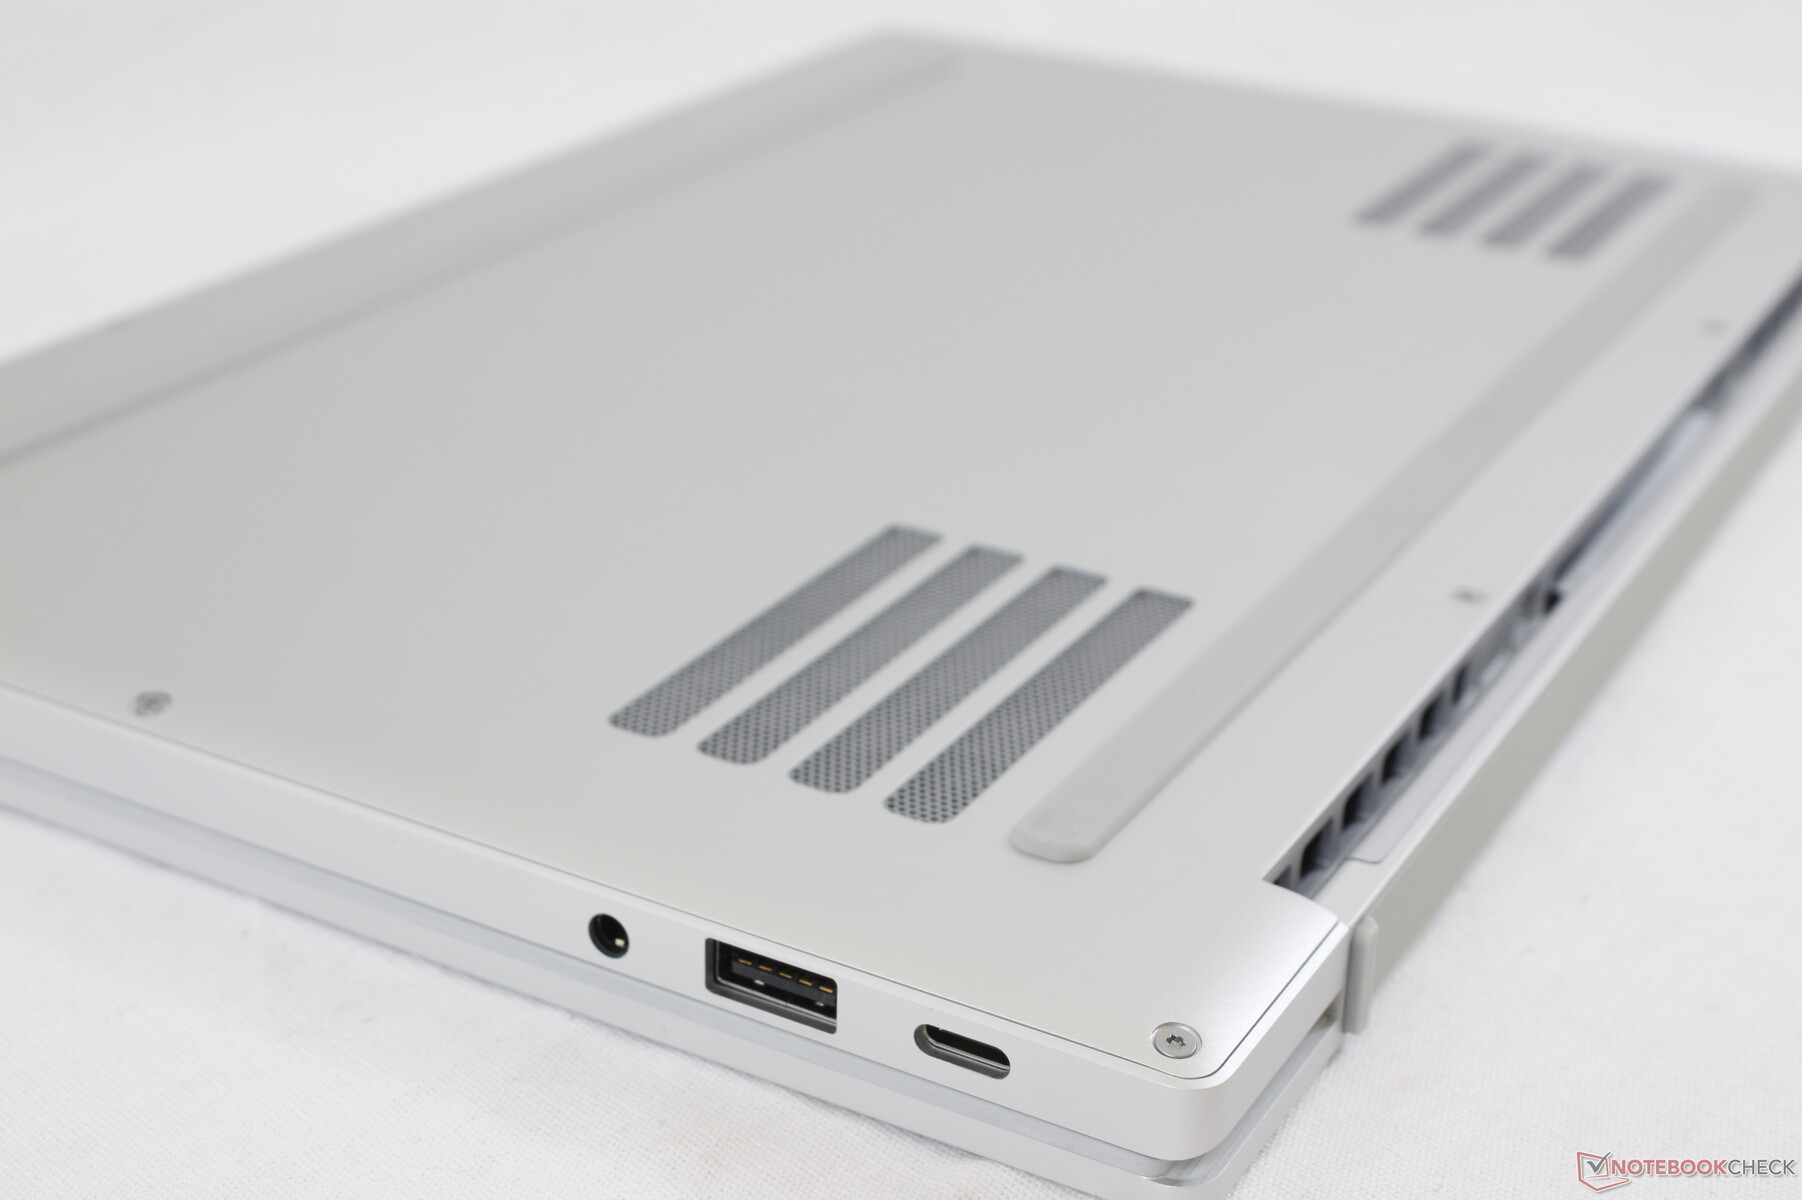
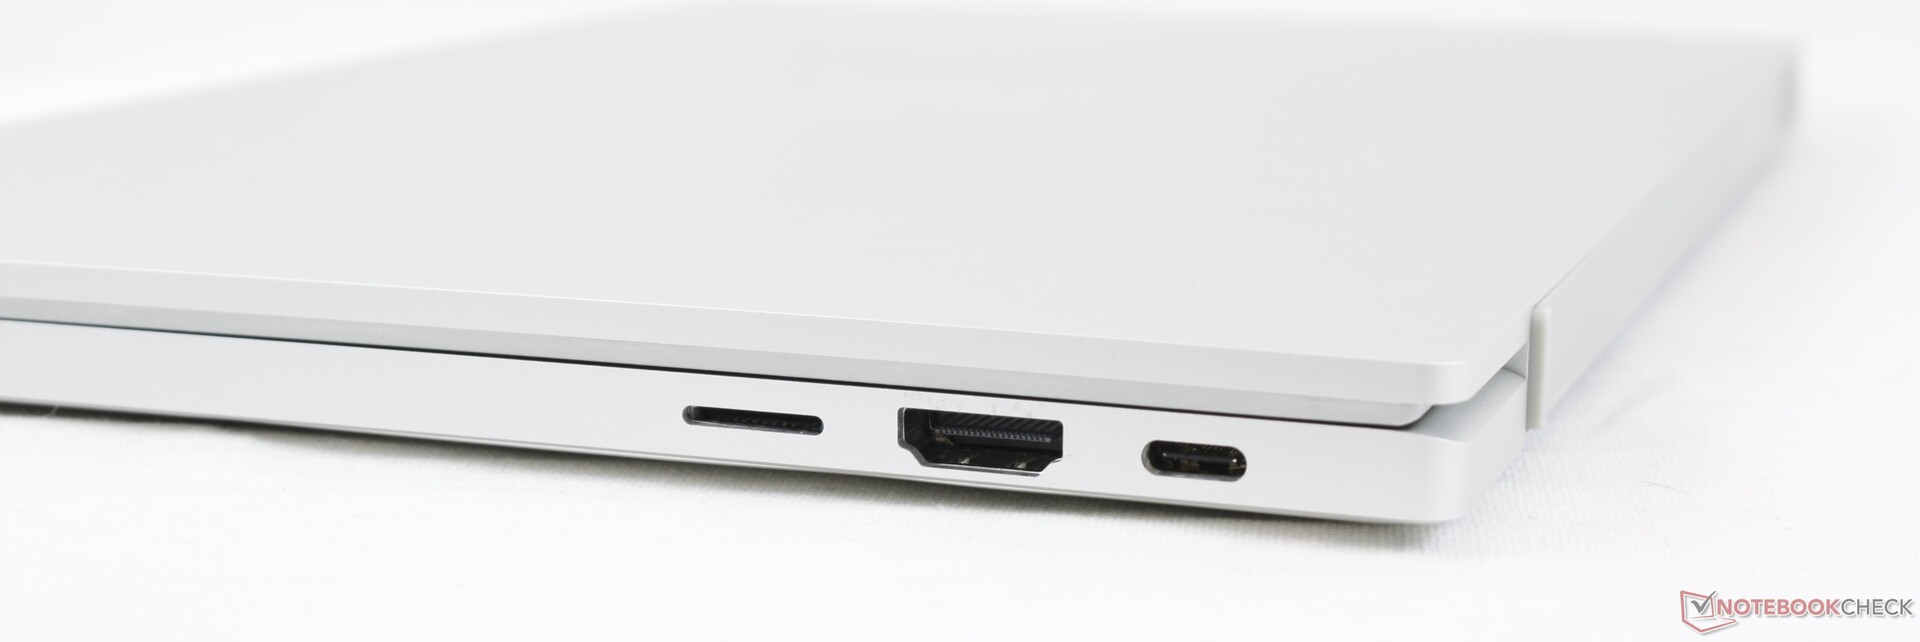
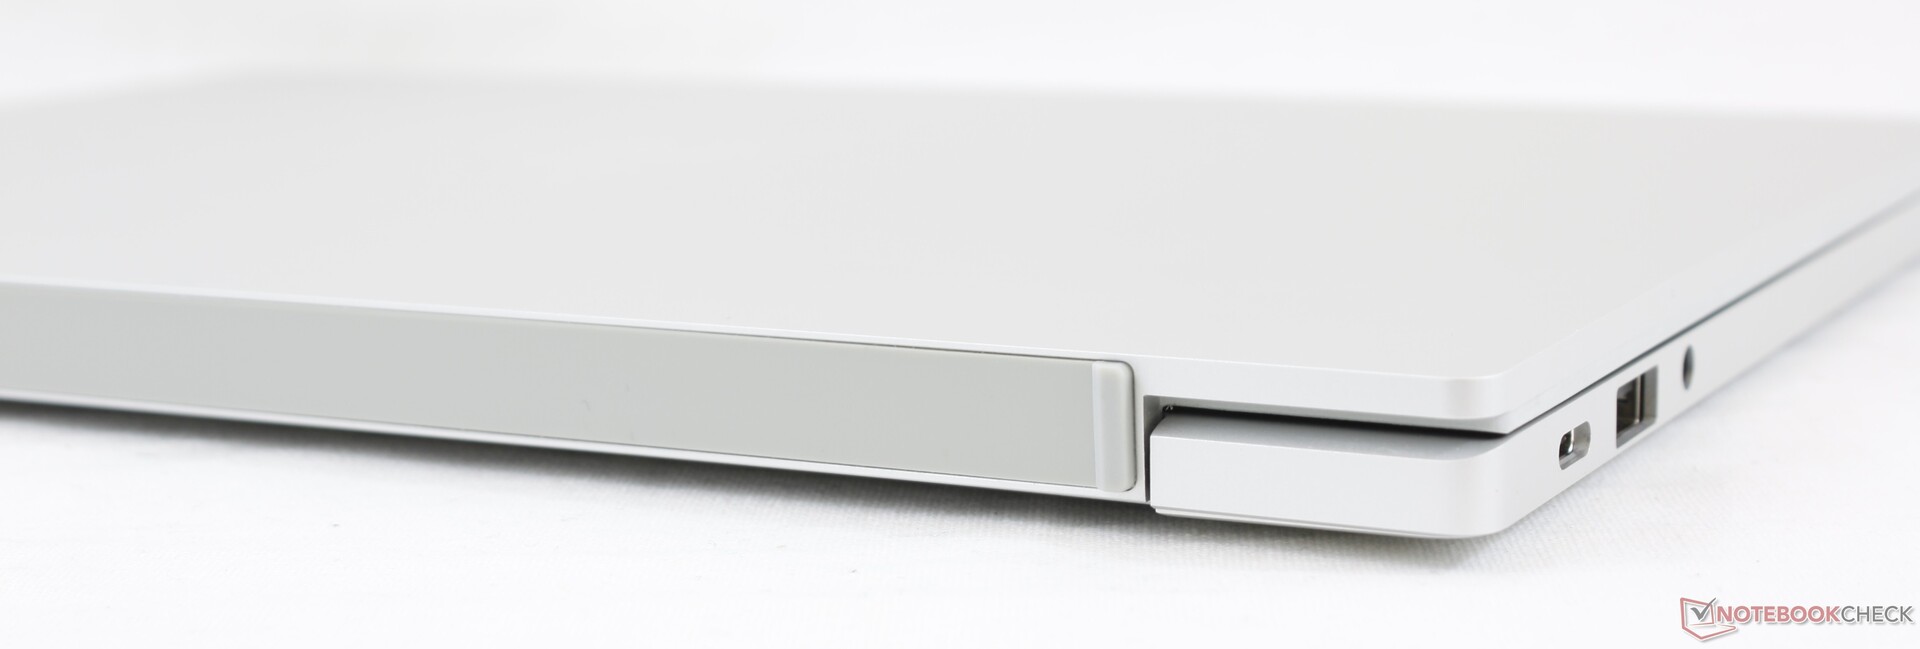
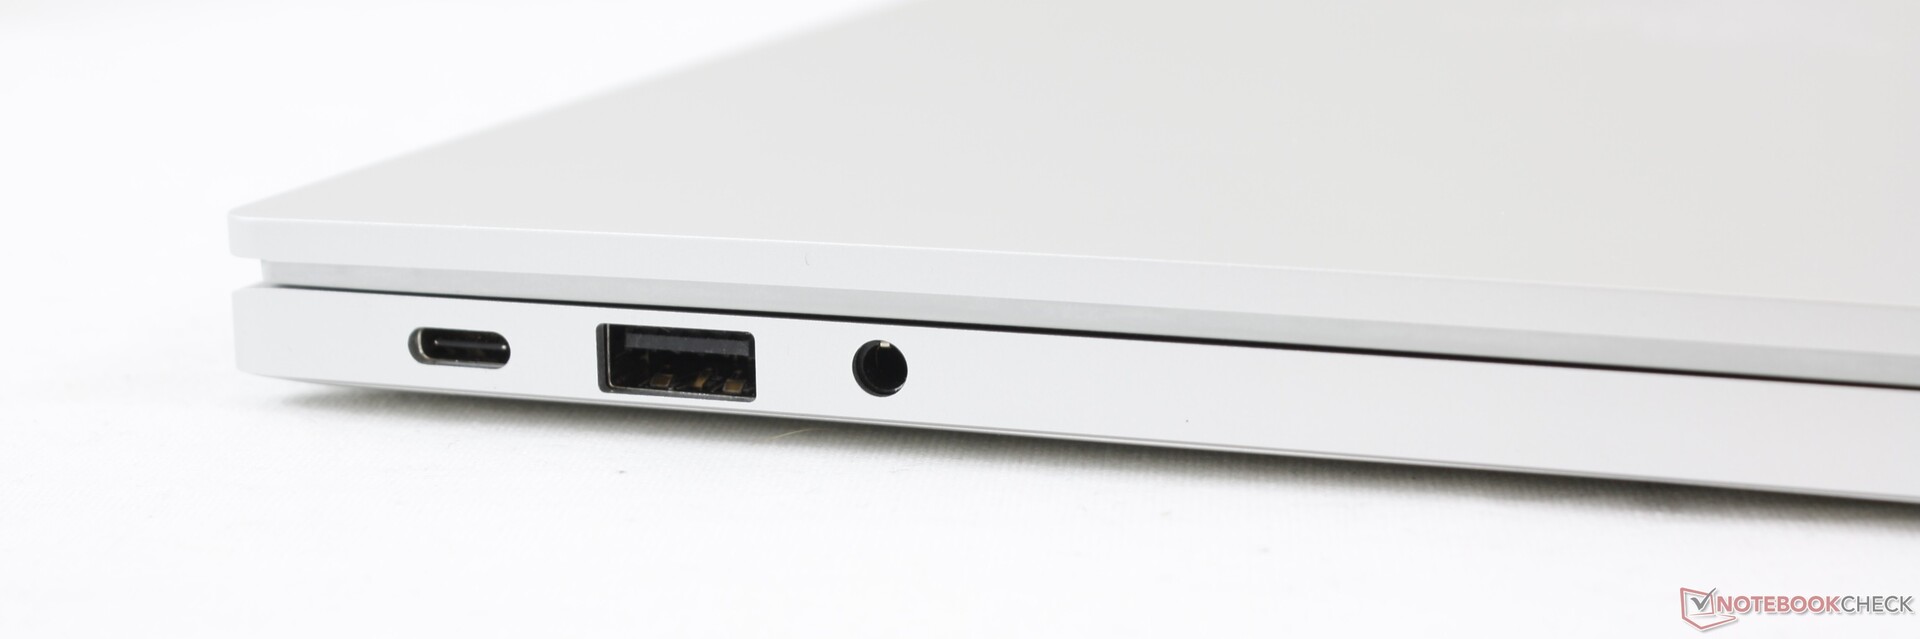
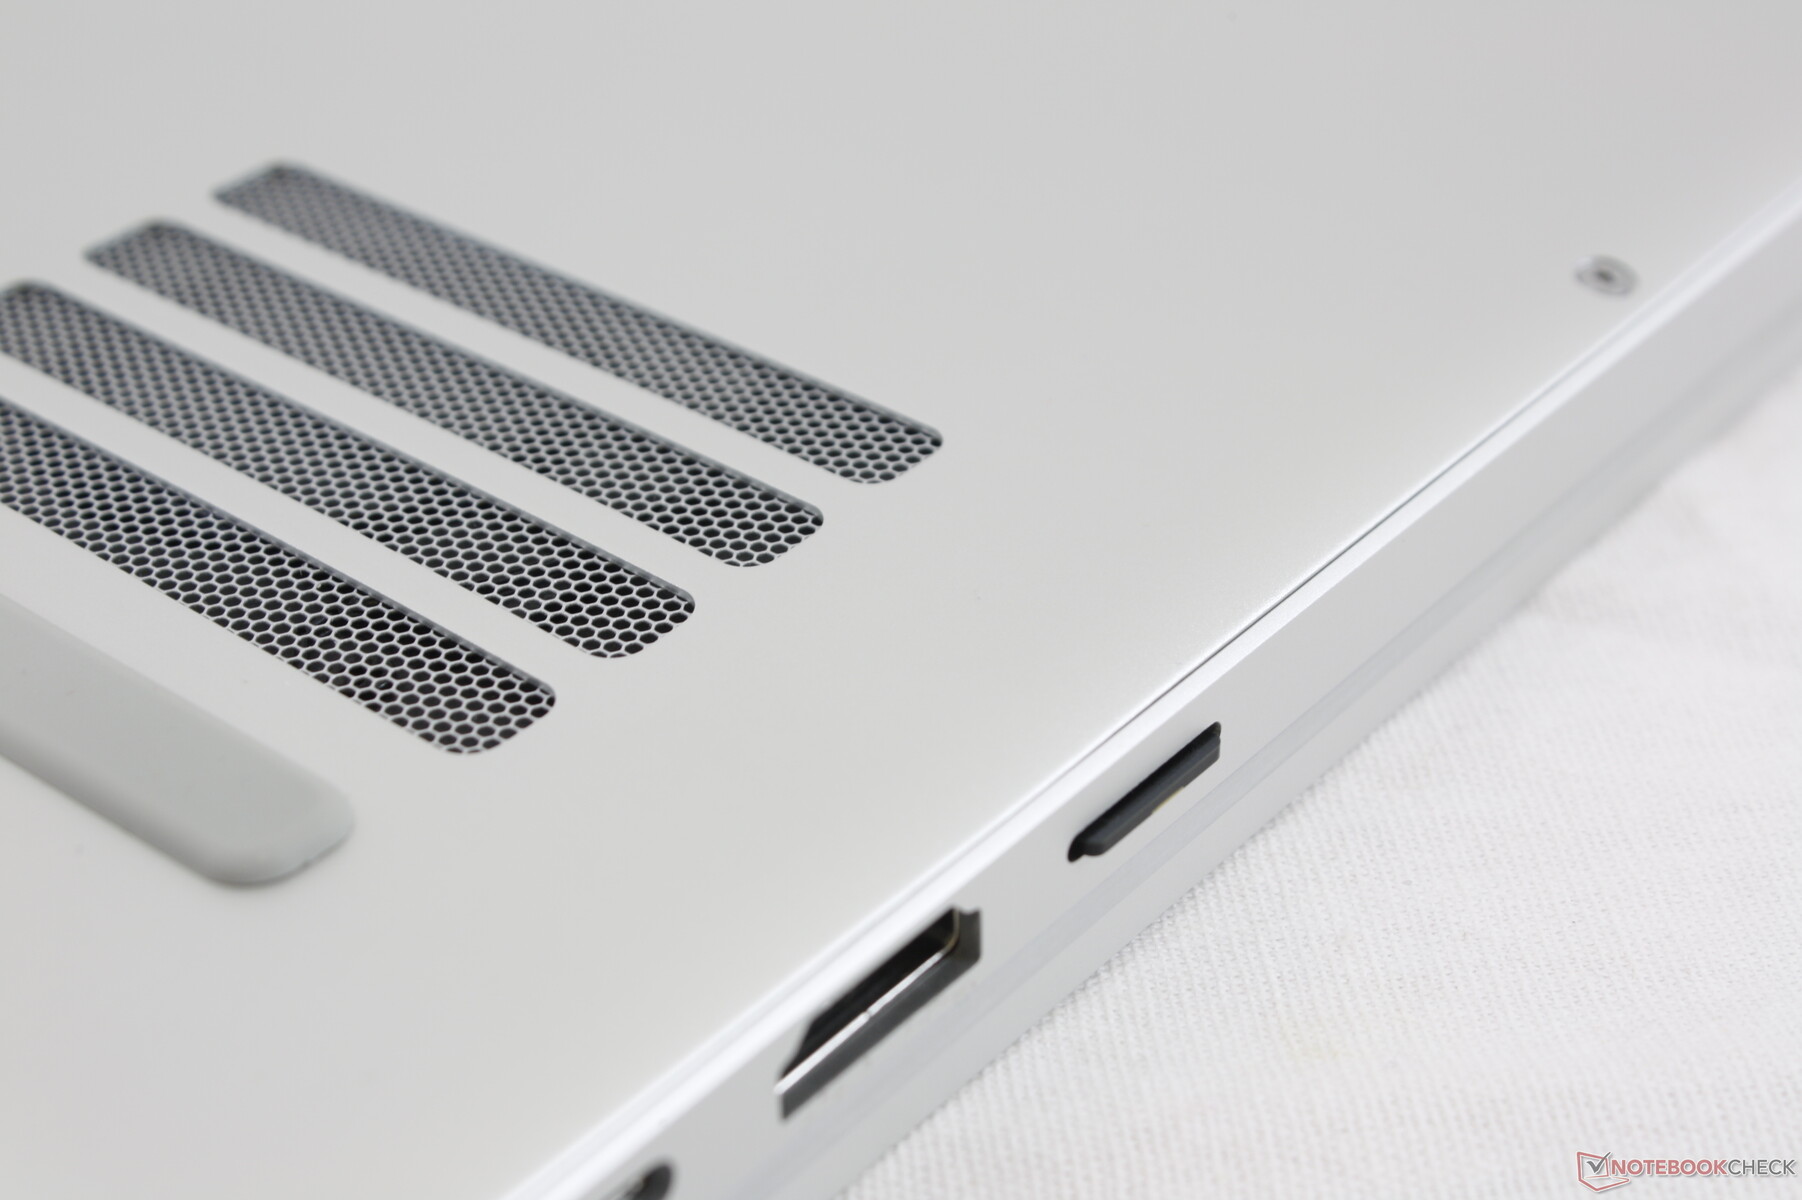
Die Anschlussmöglichkeiten sind vielfältiger als bei den meisten Subnotebooks, immerhin bietet das Book 13 USB-C, Thunderbolt, einen vollwertigen HDMI-Port, 3.5 mm Audio, MicroSD-Reader und USB-A. Viele konkurrierenden Subnotebooks bieten weniger Anschlüsse und drängen dem Nutzer so die Verwendung von Hubs oder Adaptern auf. Selbst das Blade Stealth hat keinen HDMI-Anschluss oder einen MicroSD-Reader, immerhin weiß Razer, dass die Nutzer eines Book 13 vermutlich häufiger als beim Stealth Fotos und Videos von einer Kamera übertragen werden.
SD-Kartenleser
| SD Card Reader | |
| average JPG Copy Test (av. of 3 runs) | |
| Dell XPS 13 9310 Core i7 FHD (Toshiba Exceria Pro M501 64 GB UHS-II) | |
| Razer Book 13 FHD (Toshiba Exceria Pro M501 32 GB UHS-II) | |
| Asus Zenbook S UX393JA (Toshiba Exceria Pro M501 64 GB UHS-II) | |
| maximum AS SSD Seq Read Test (1GB) | |
| Dell XPS 13 9310 Core i7 FHD (Toshiba Exceria Pro M501 64 GB UHS-II) | |
| Razer Book 13 FHD (Toshiba Exceria Pro M501 32 GB UHS-II) | |
| Asus Zenbook S UX393JA (Toshiba Exceria Pro M501 64 GB UHS-II) | |
Kommunikation
Das WLAN-Modul Intel AX201 mit Wi-Fi 6 ist standardmäßig verbaut und eine der Voraussetzungen für einen Intel-Evo-Laptop. Verbunden mit unserem Testrouter Netgear RAX200 ergaben sich keinerlei Probleme.
| Networking | |
| iperf3 transmit AX12 | |
| Huawei MateBook X Pro 2020 i7 | |
| Razer Book 13 FHD | |
| Razer Blade Stealth i7-1165G7 GTX 1650 Ti Max-Q | |
| Dell XPS 13 9310 Core i7 FHD | |
| Asus Zenbook S UX393JA | |
| Lenovo Yoga C930-13IKB | |
| iperf3 receive AX12 | |
| Razer Book 13 FHD | |
| Asus Zenbook S UX393JA | |
| Dell XPS 13 9310 Core i7 FHD | |
| Razer Blade Stealth i7-1165G7 GTX 1650 Ti Max-Q | |
| Huawei MateBook X Pro 2020 i7 | |
| Lenovo Yoga C930-13IKB | |
Webcam


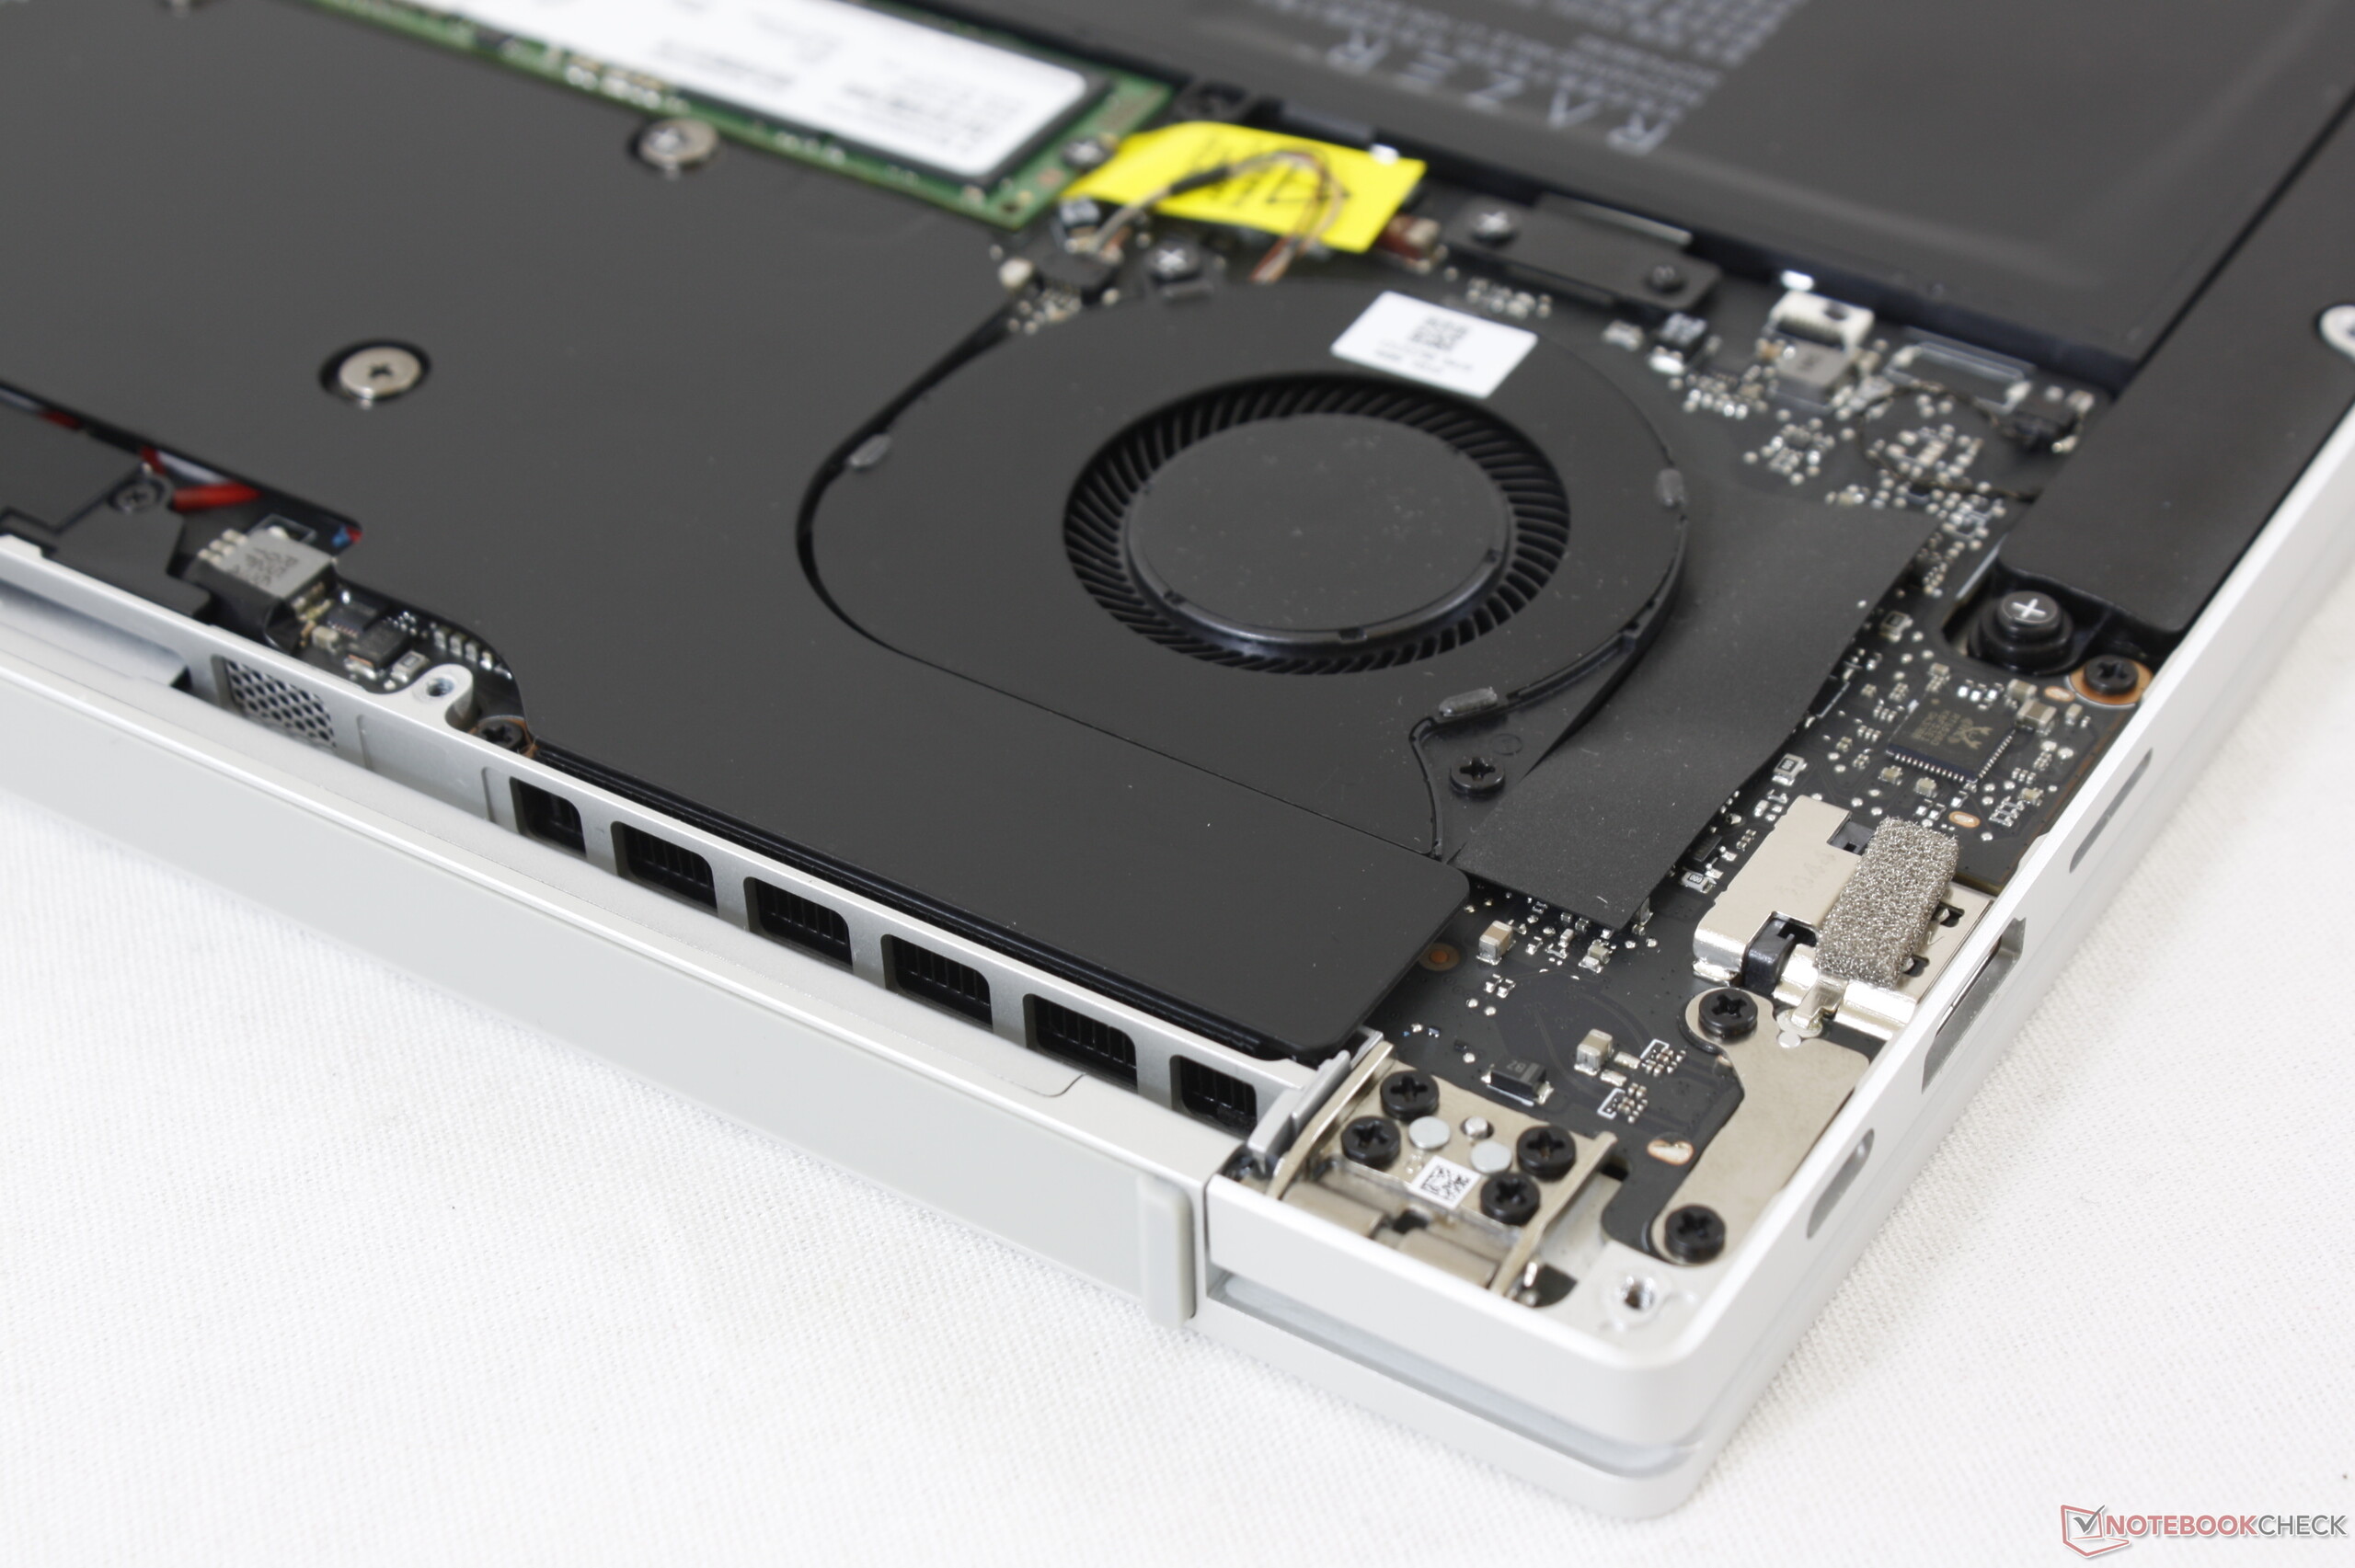
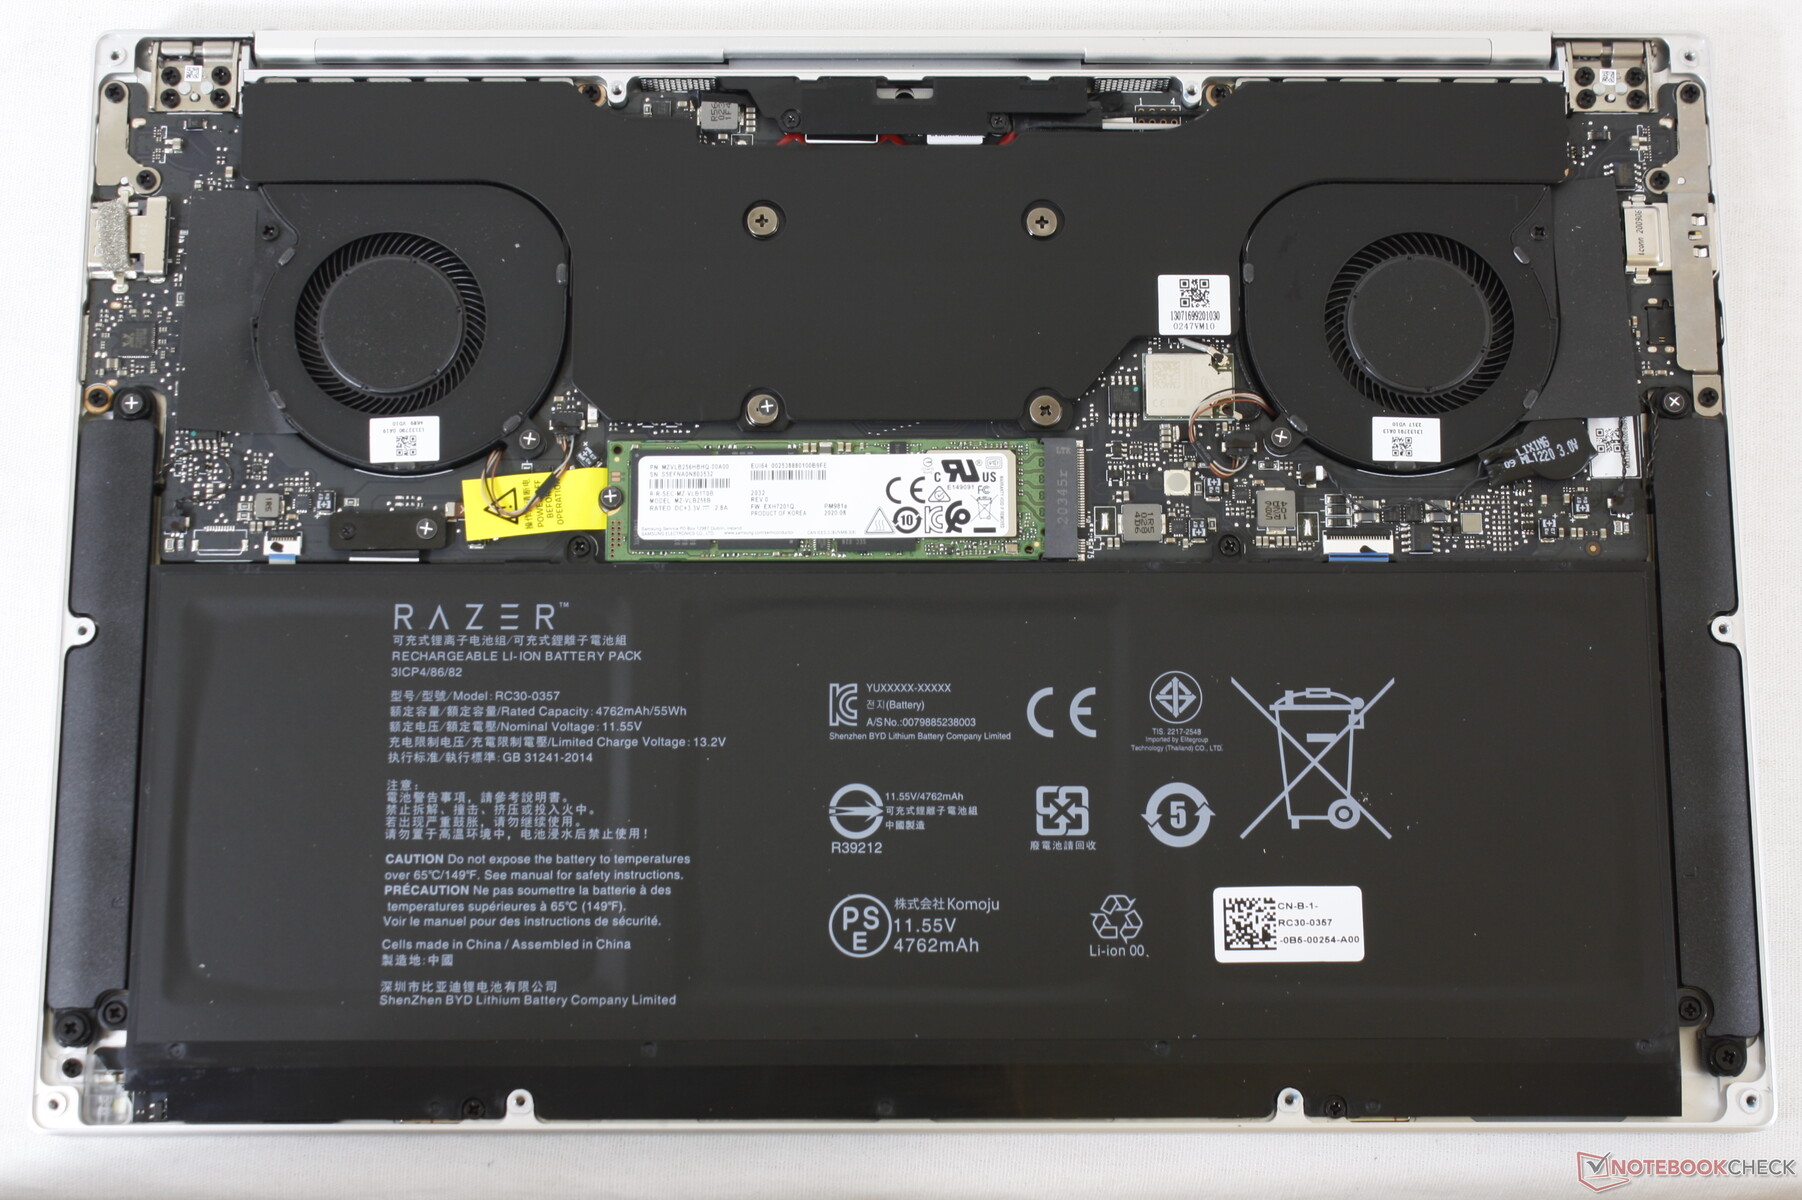
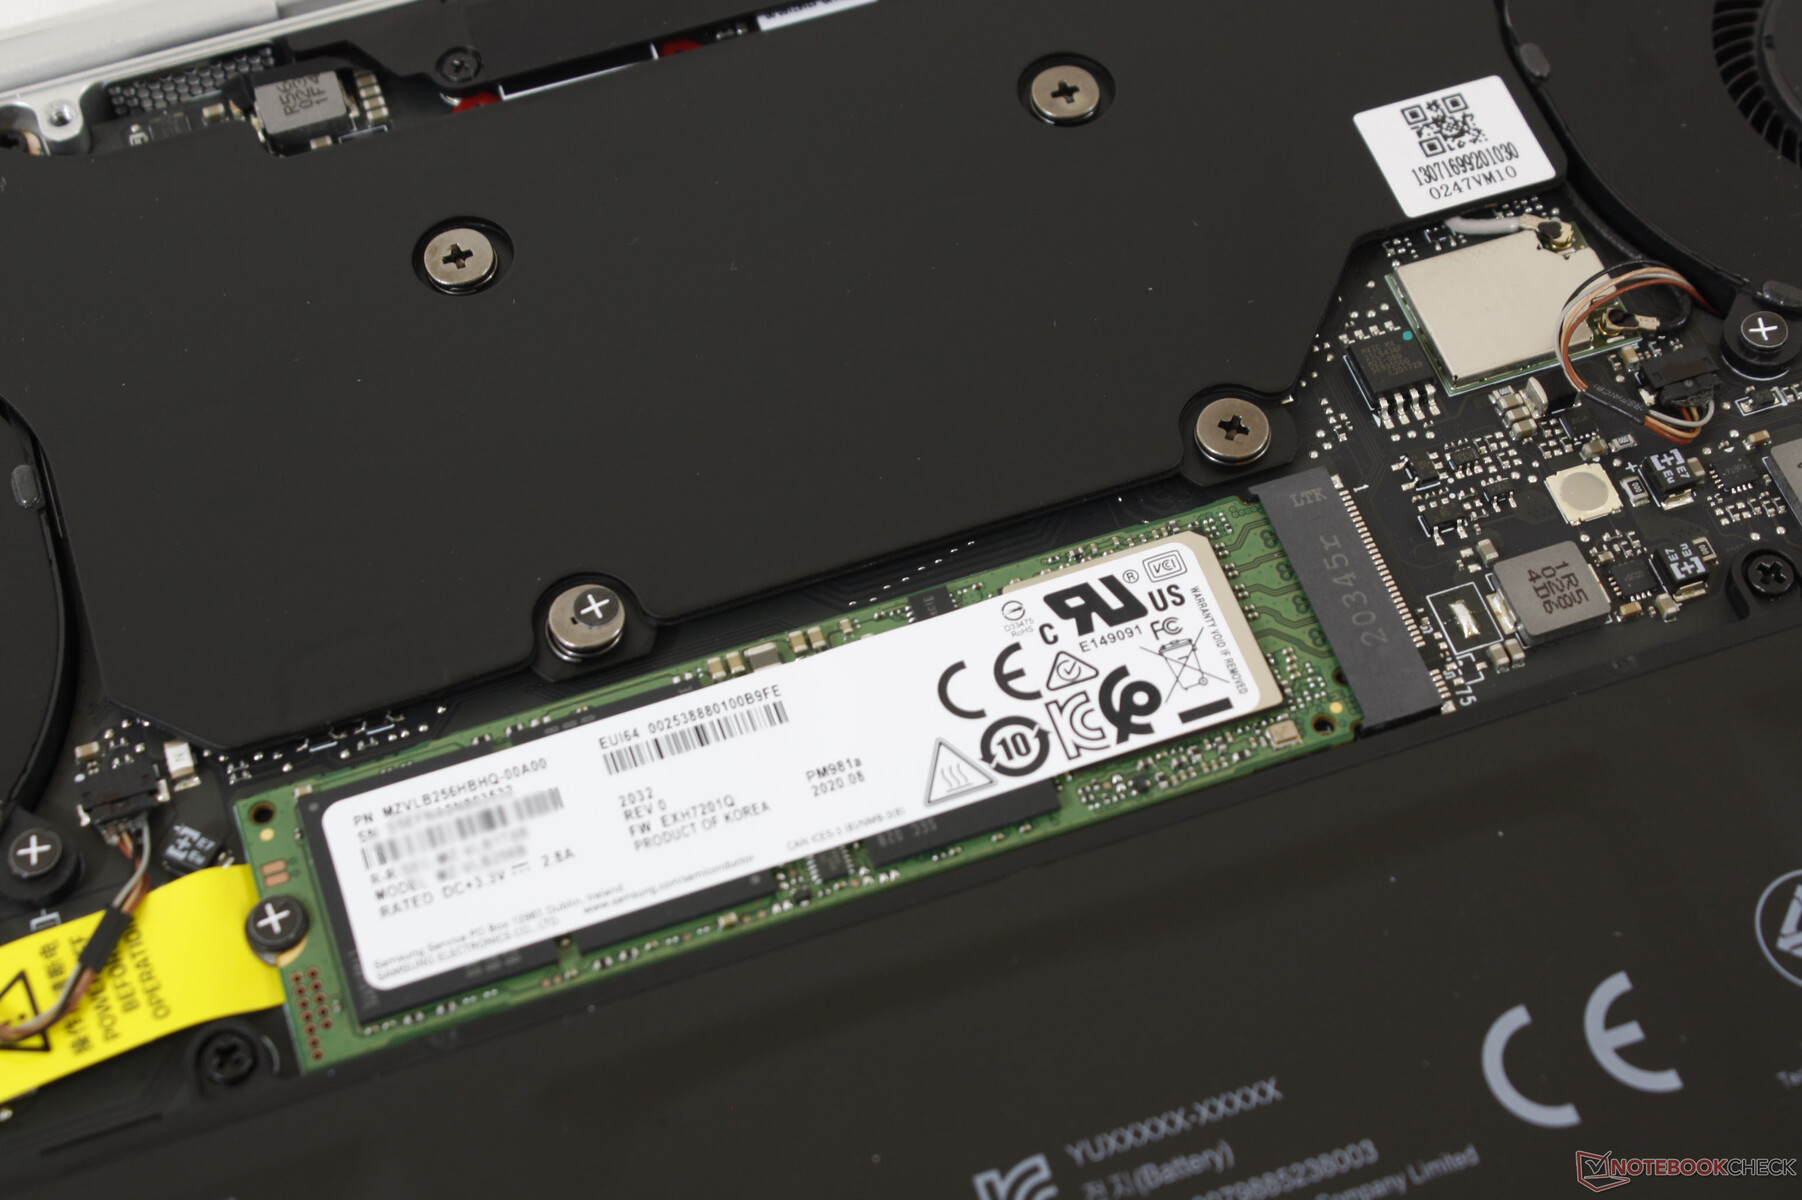
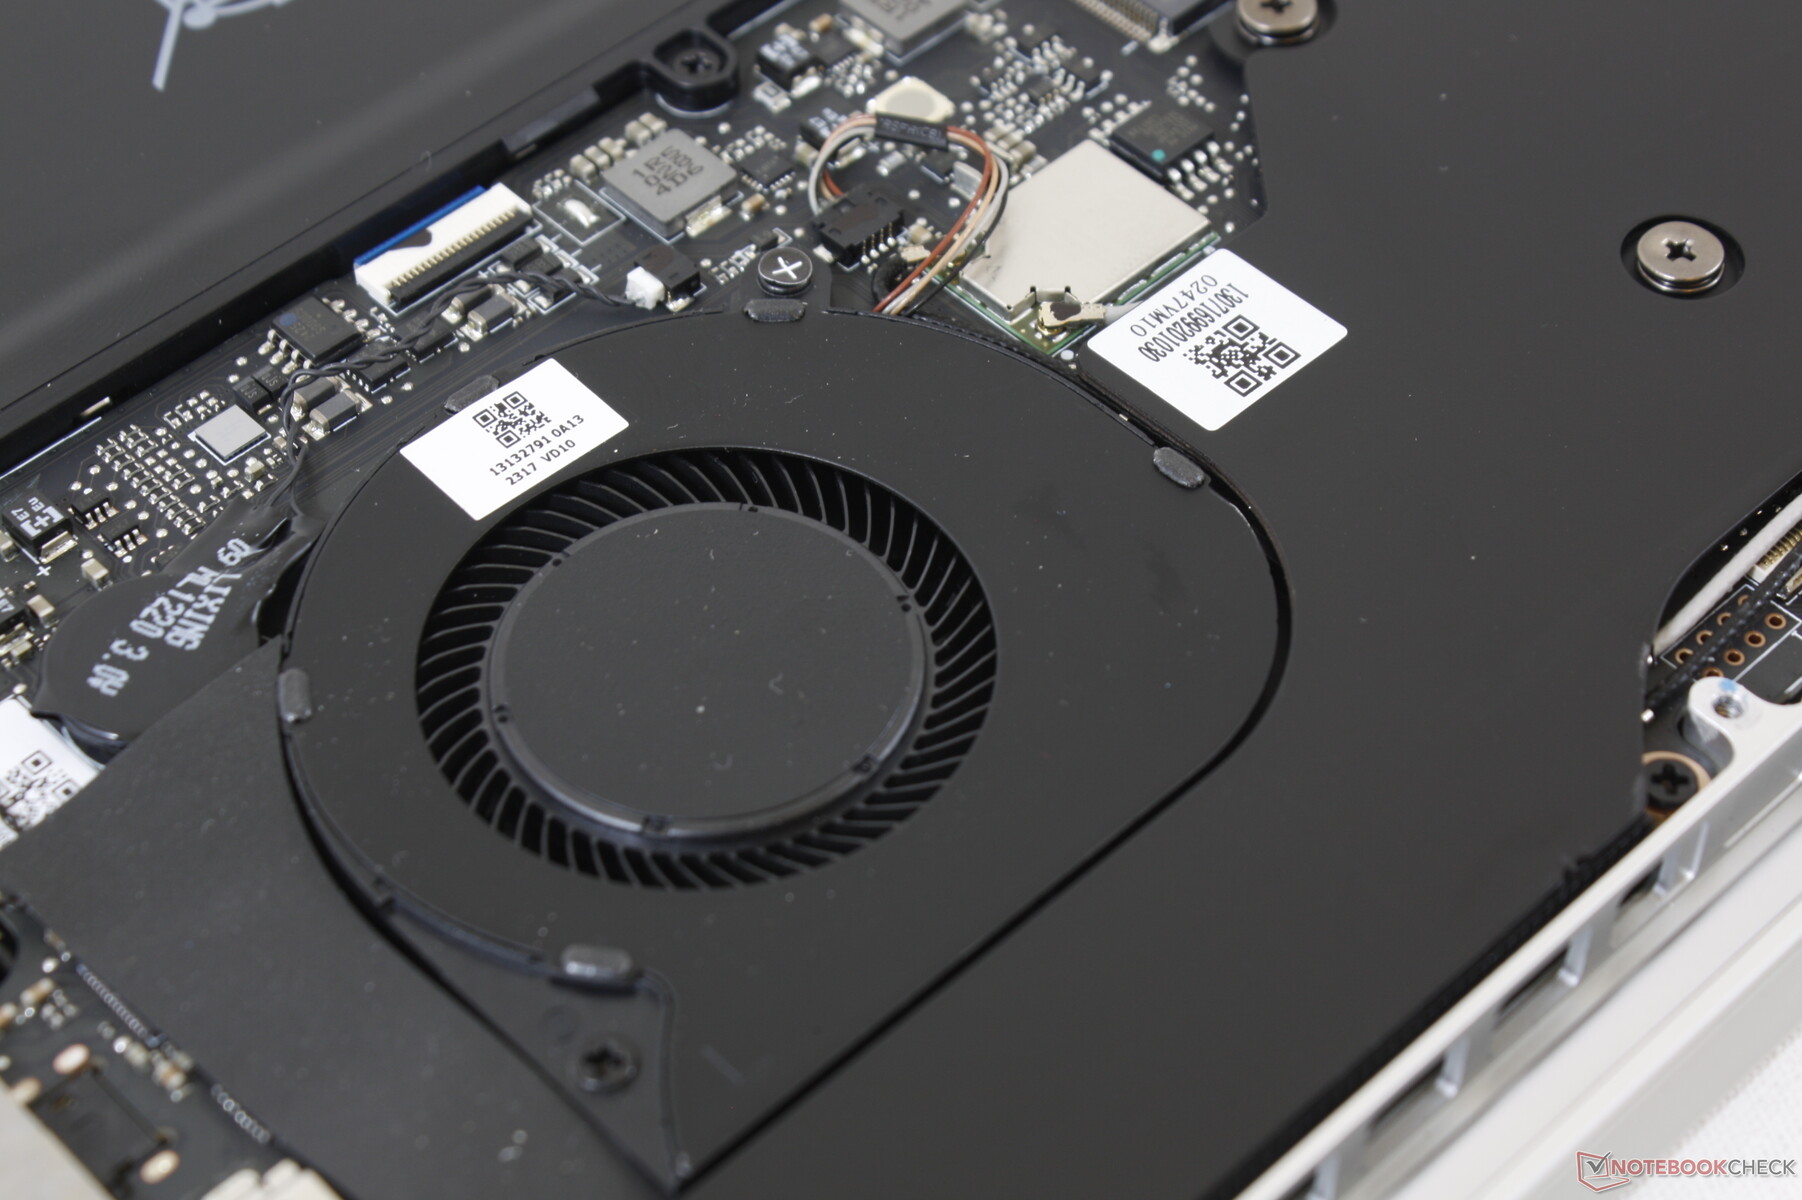
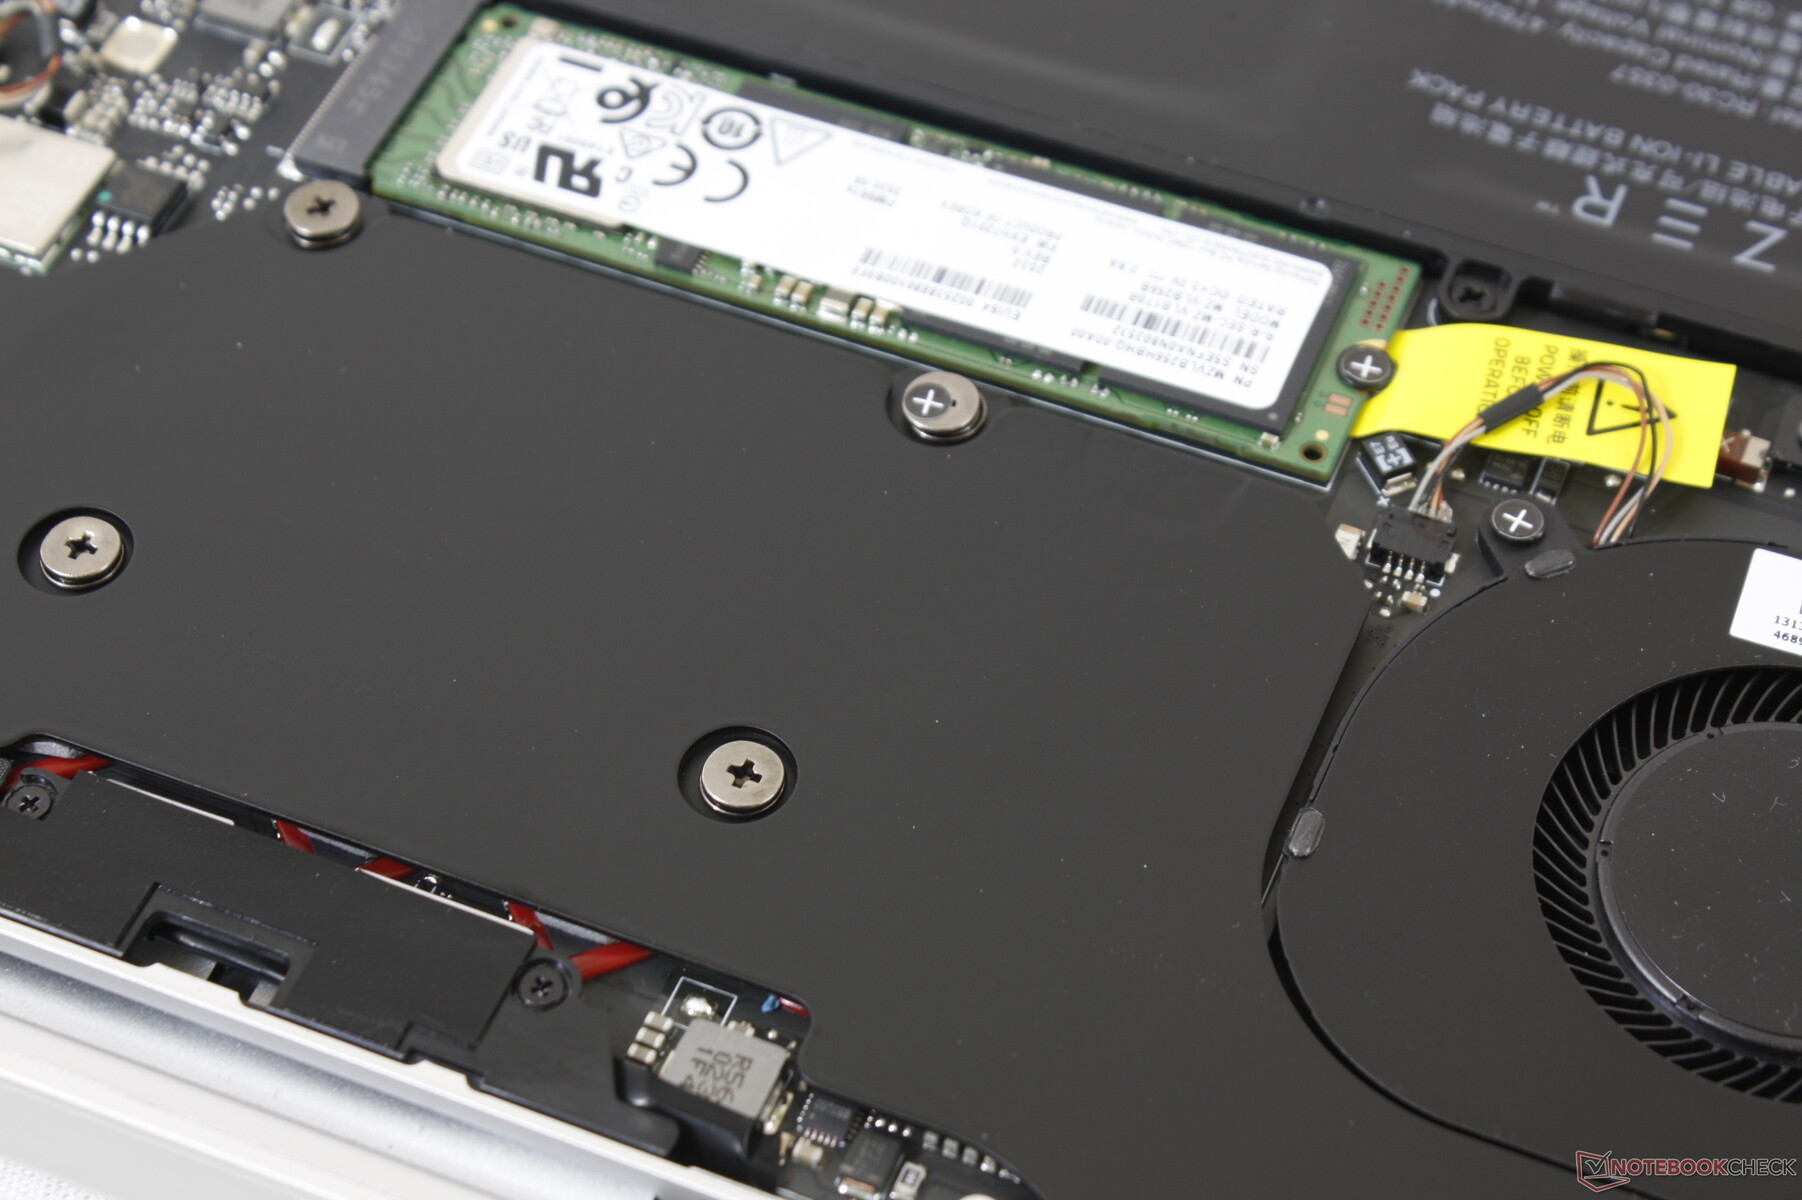
Wartung
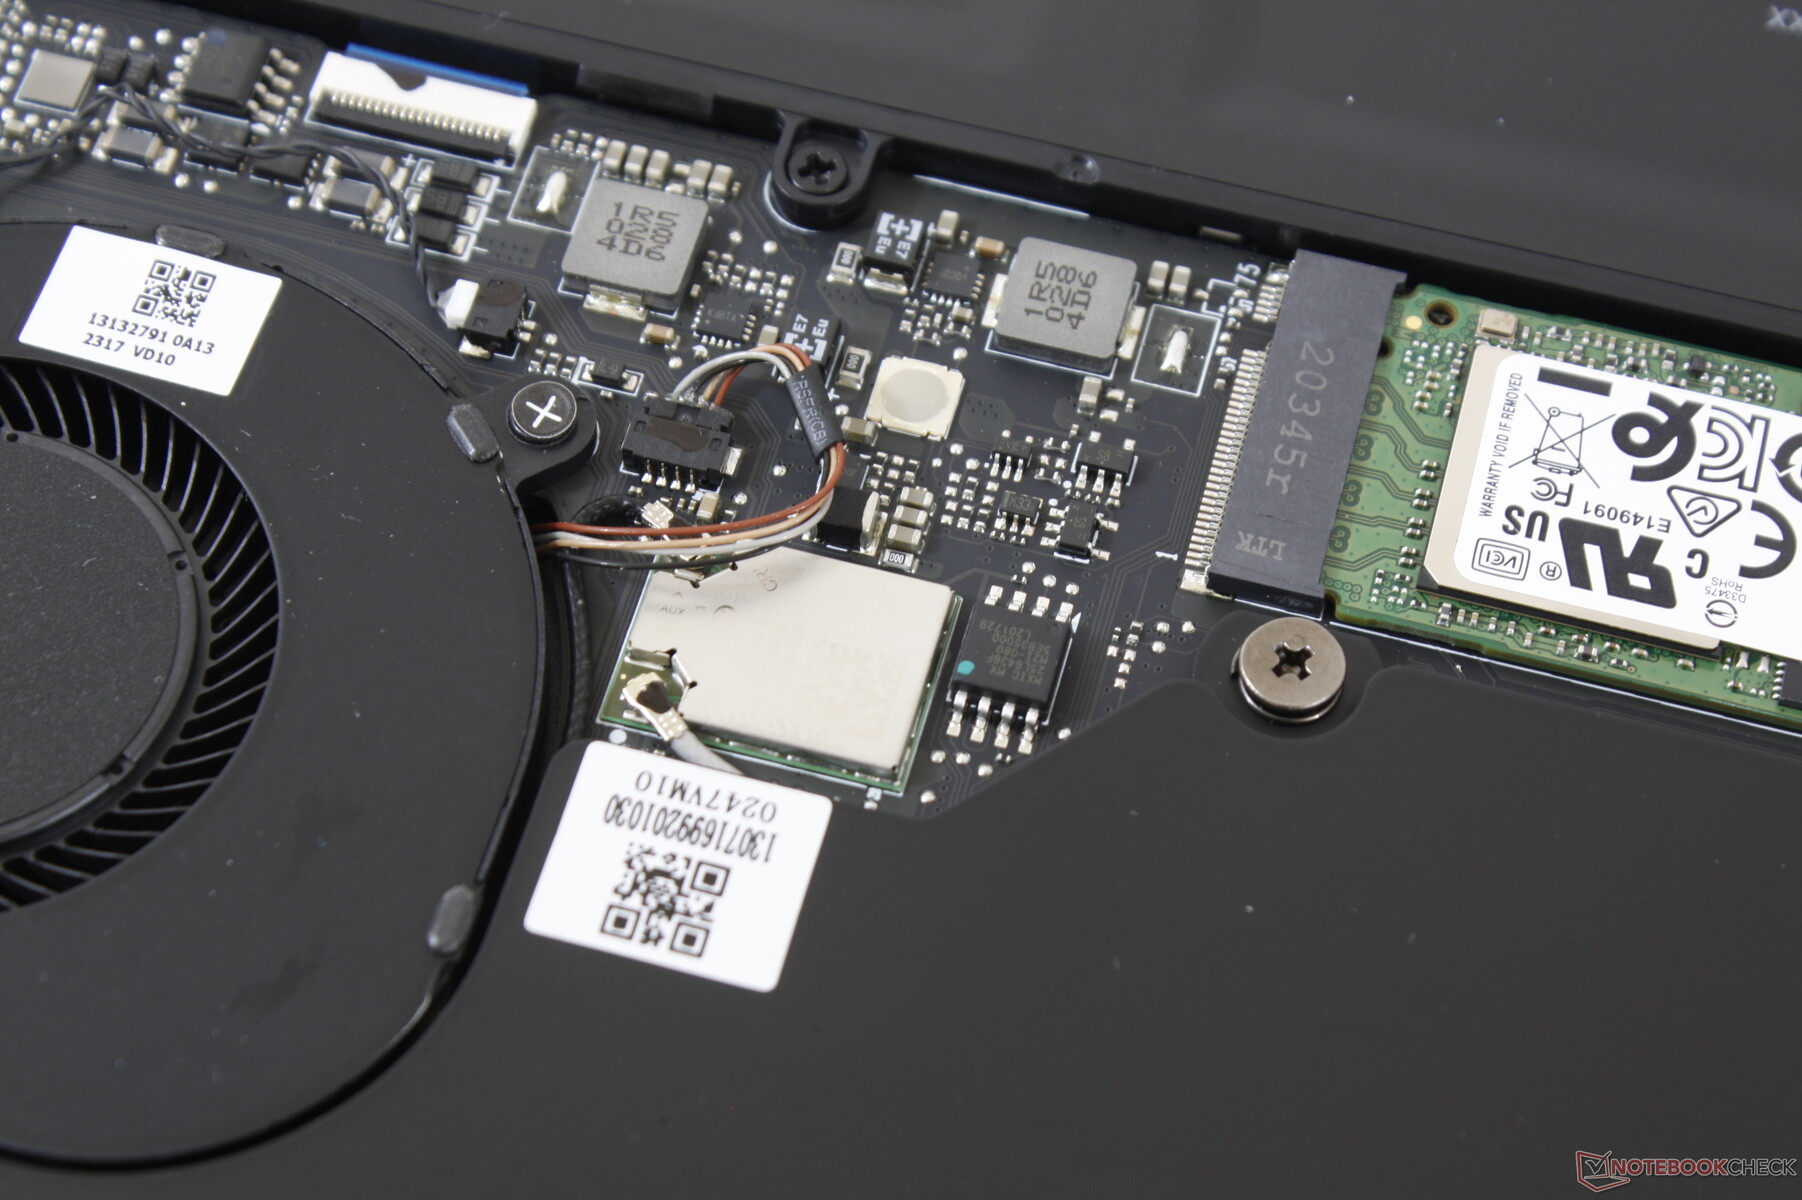
Das Abnehmen der Unterseite erfordert einen T5-Torx-Schraubendreher. Allerdings gibt es abseits der SSD oder des Akkus eigentlich kaum etwas zu warten oder auszutauschen.
Zubehör und Garantie
Die Verkaufsverpackung enthält neben dem üblichen Netzteil und Papierkram ein kleines Samtwischtuch und einen Razer-Logo-Aufkleber. Der Hersteller verspricht volle Kompatibilität mit der Razer-Core-eGPU-Dockingstation.
Eine einjährige Garantie ist Standard im Vergleich zu drei Jahren bei herkömmlichen Business-Laptops.
Eingabegeräte
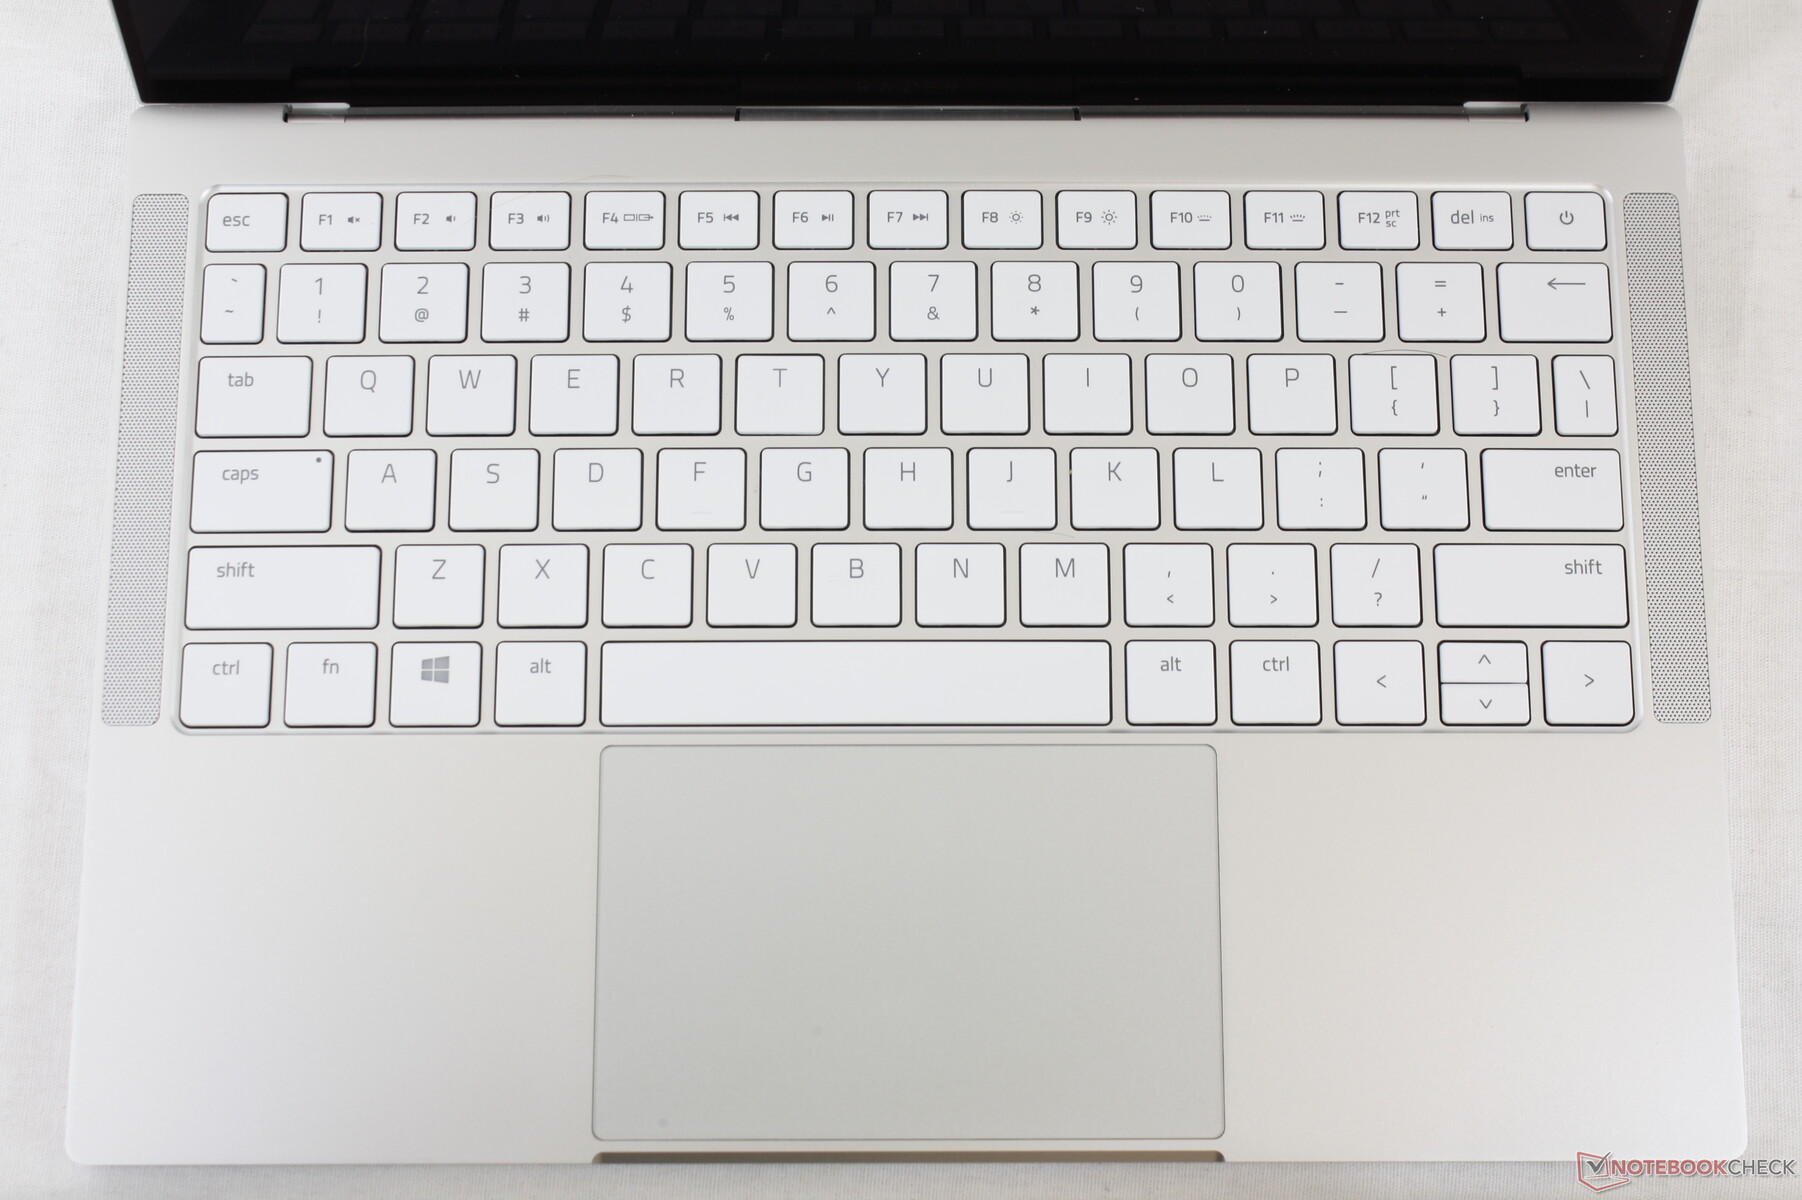
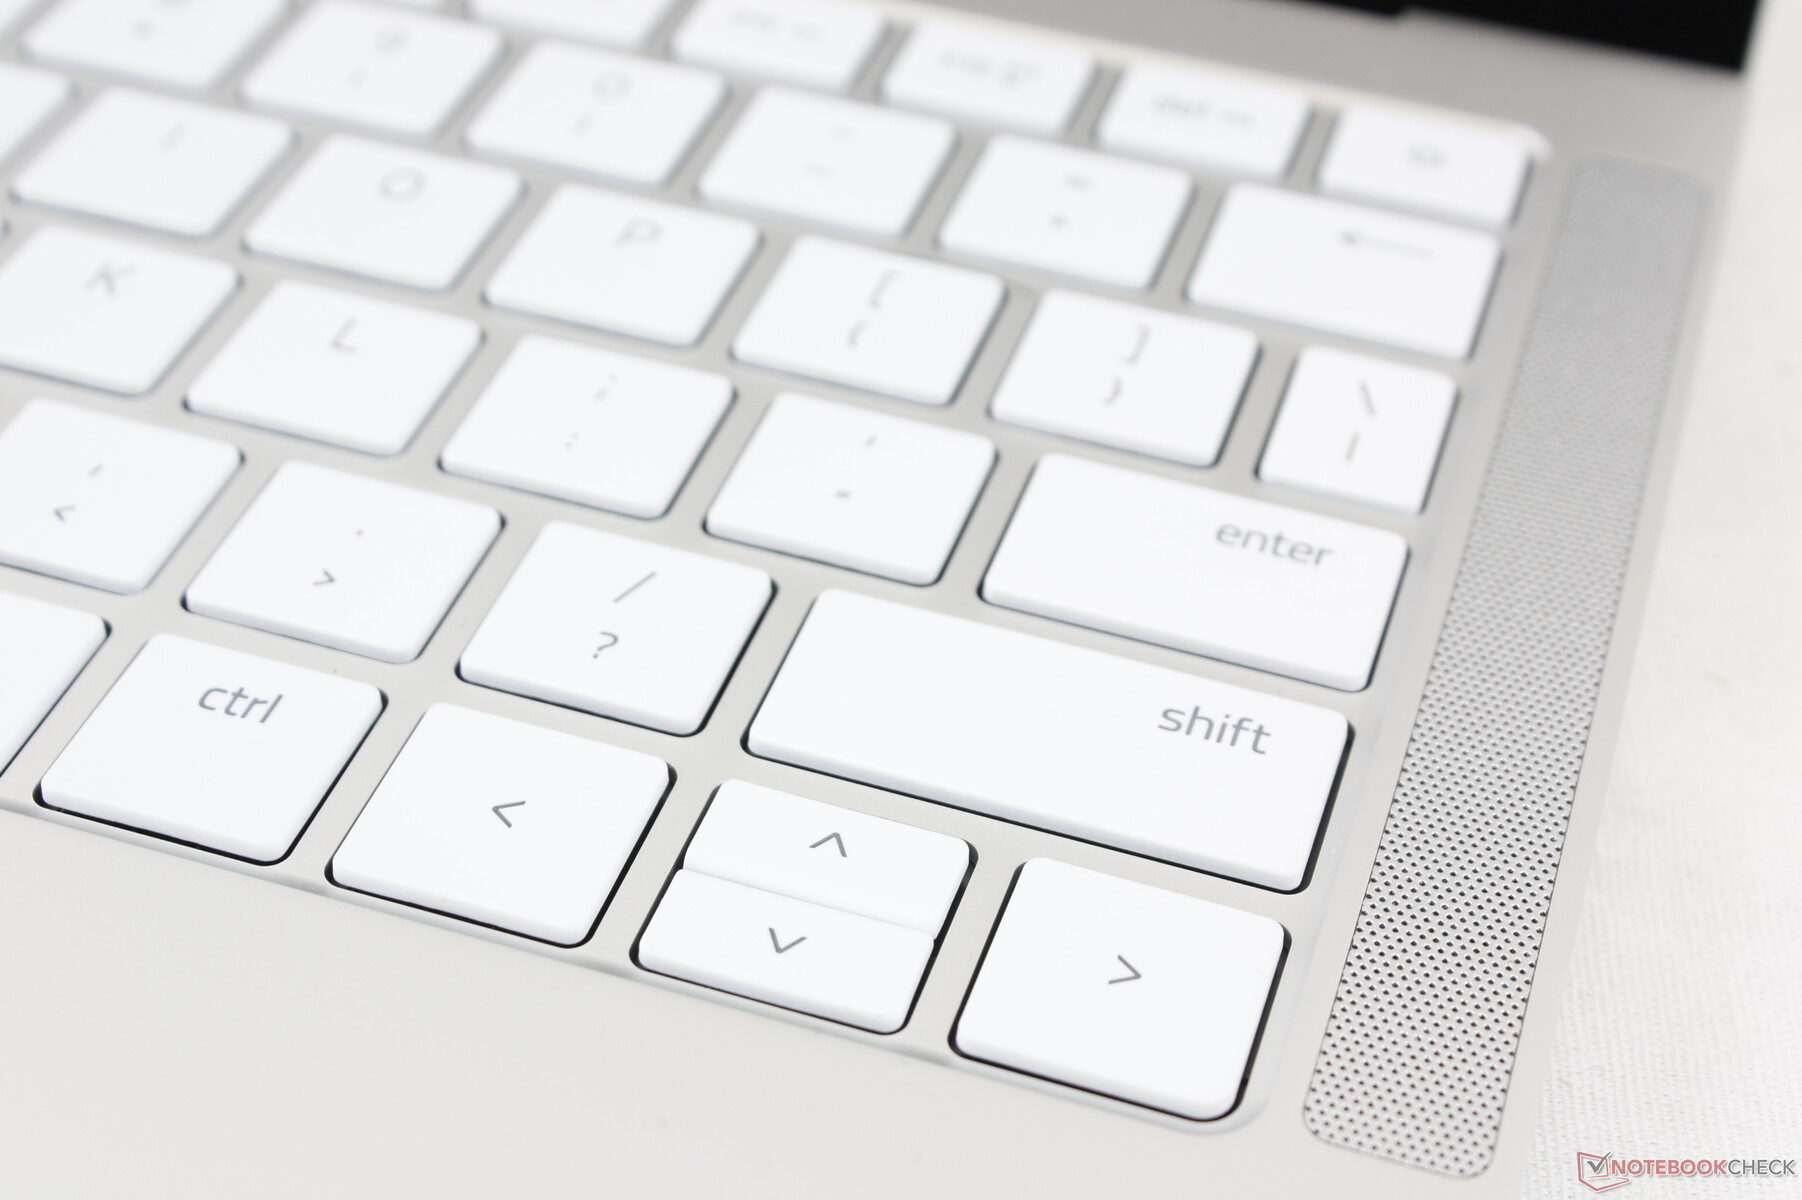
Tastatur
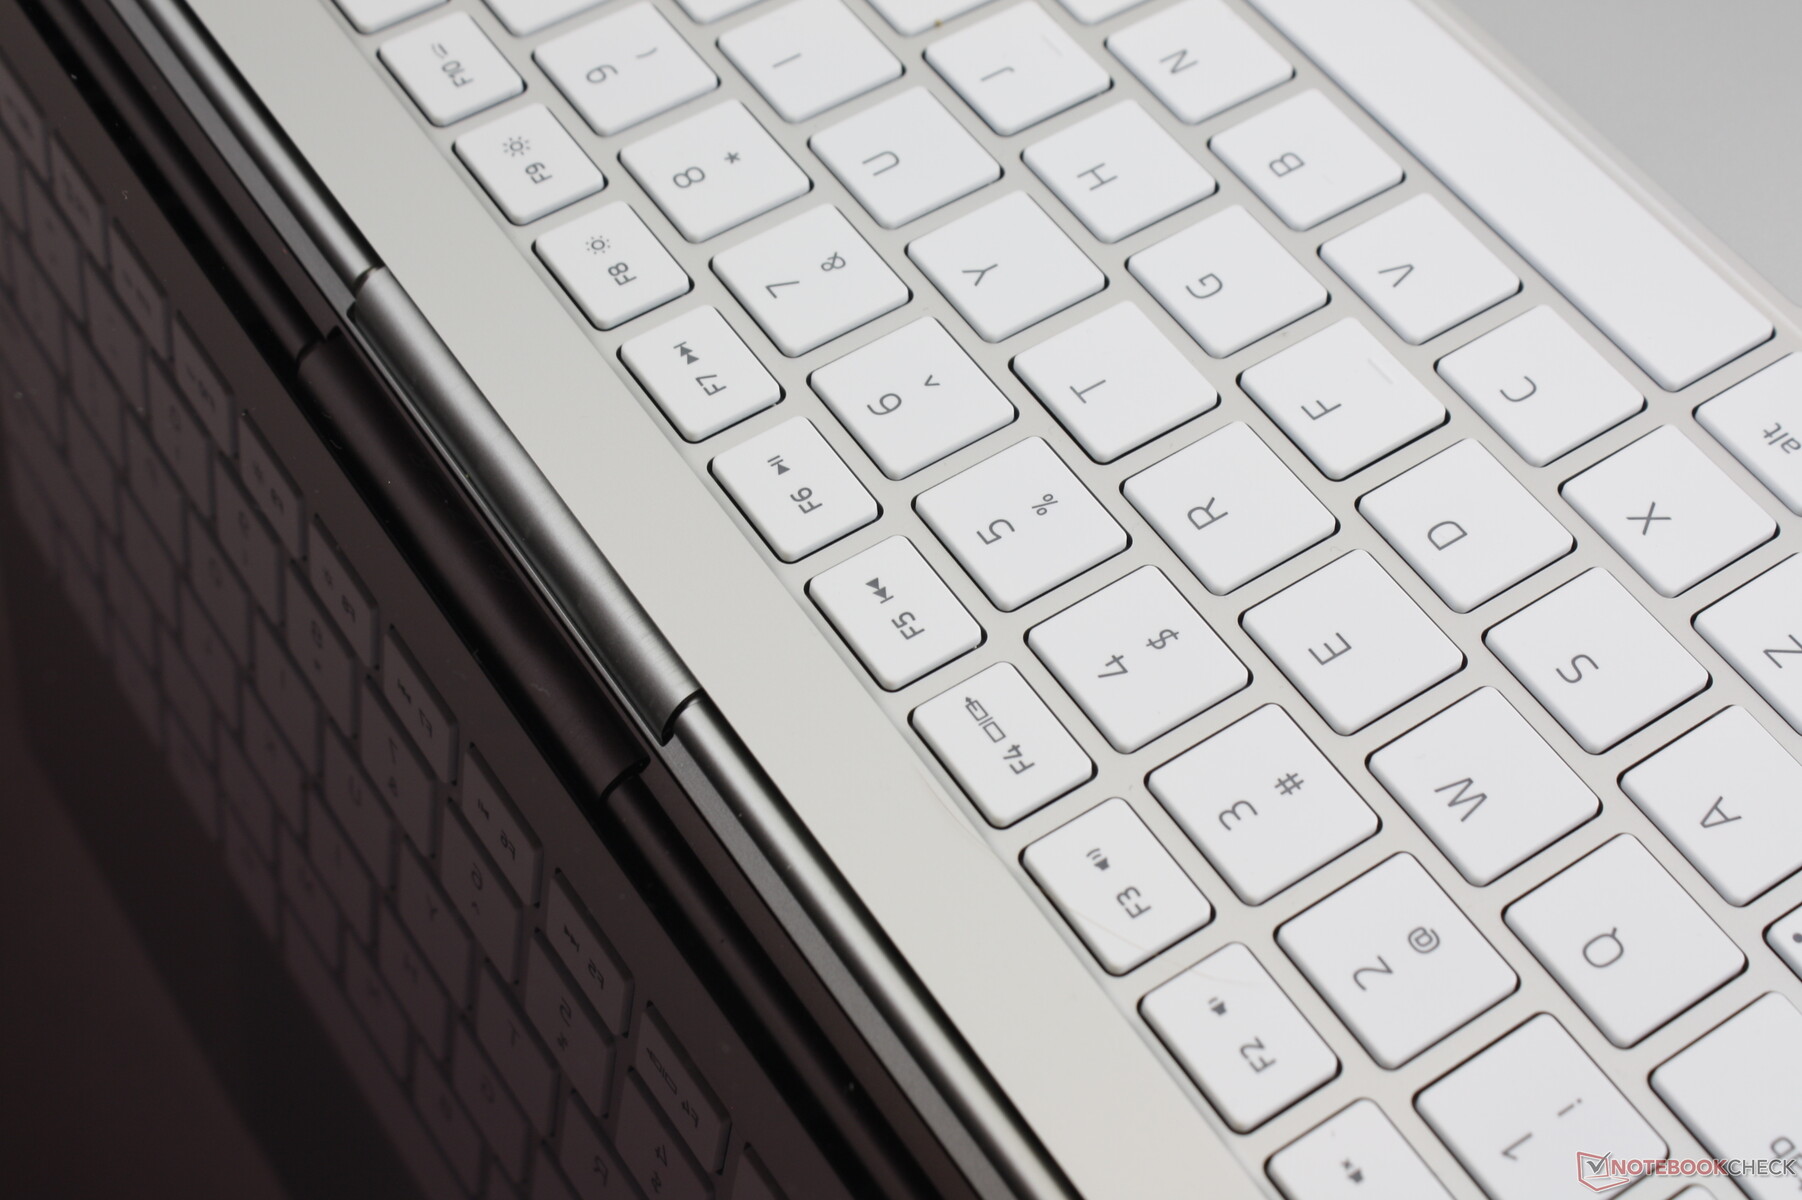
Die Tastatur des Book 13 ist identisch zu der im Blade Stealth was die Größe und das Feedback der Tasten angeht. Sogar die RGB-Beleuchtung je Taste wurde beibehalten, damit ist das Book 13 unseres Wissens nach der einzige Produktivitätslaptop mit diesem Feature. Einerseits werden sich Besitzer eines Blade Stealth kaum umstellen müssen, andererseits sind wir nicht gerade Fans des dürftigen Hubs und des schwachen Feedbacks der Tasten. Das HP Spectre, das EliteBook, das ThinkPad und das MateBook X Pro haben allesamt straffere Tasten, welche wir für längere Schreibarbeiten bevorzugen würden.
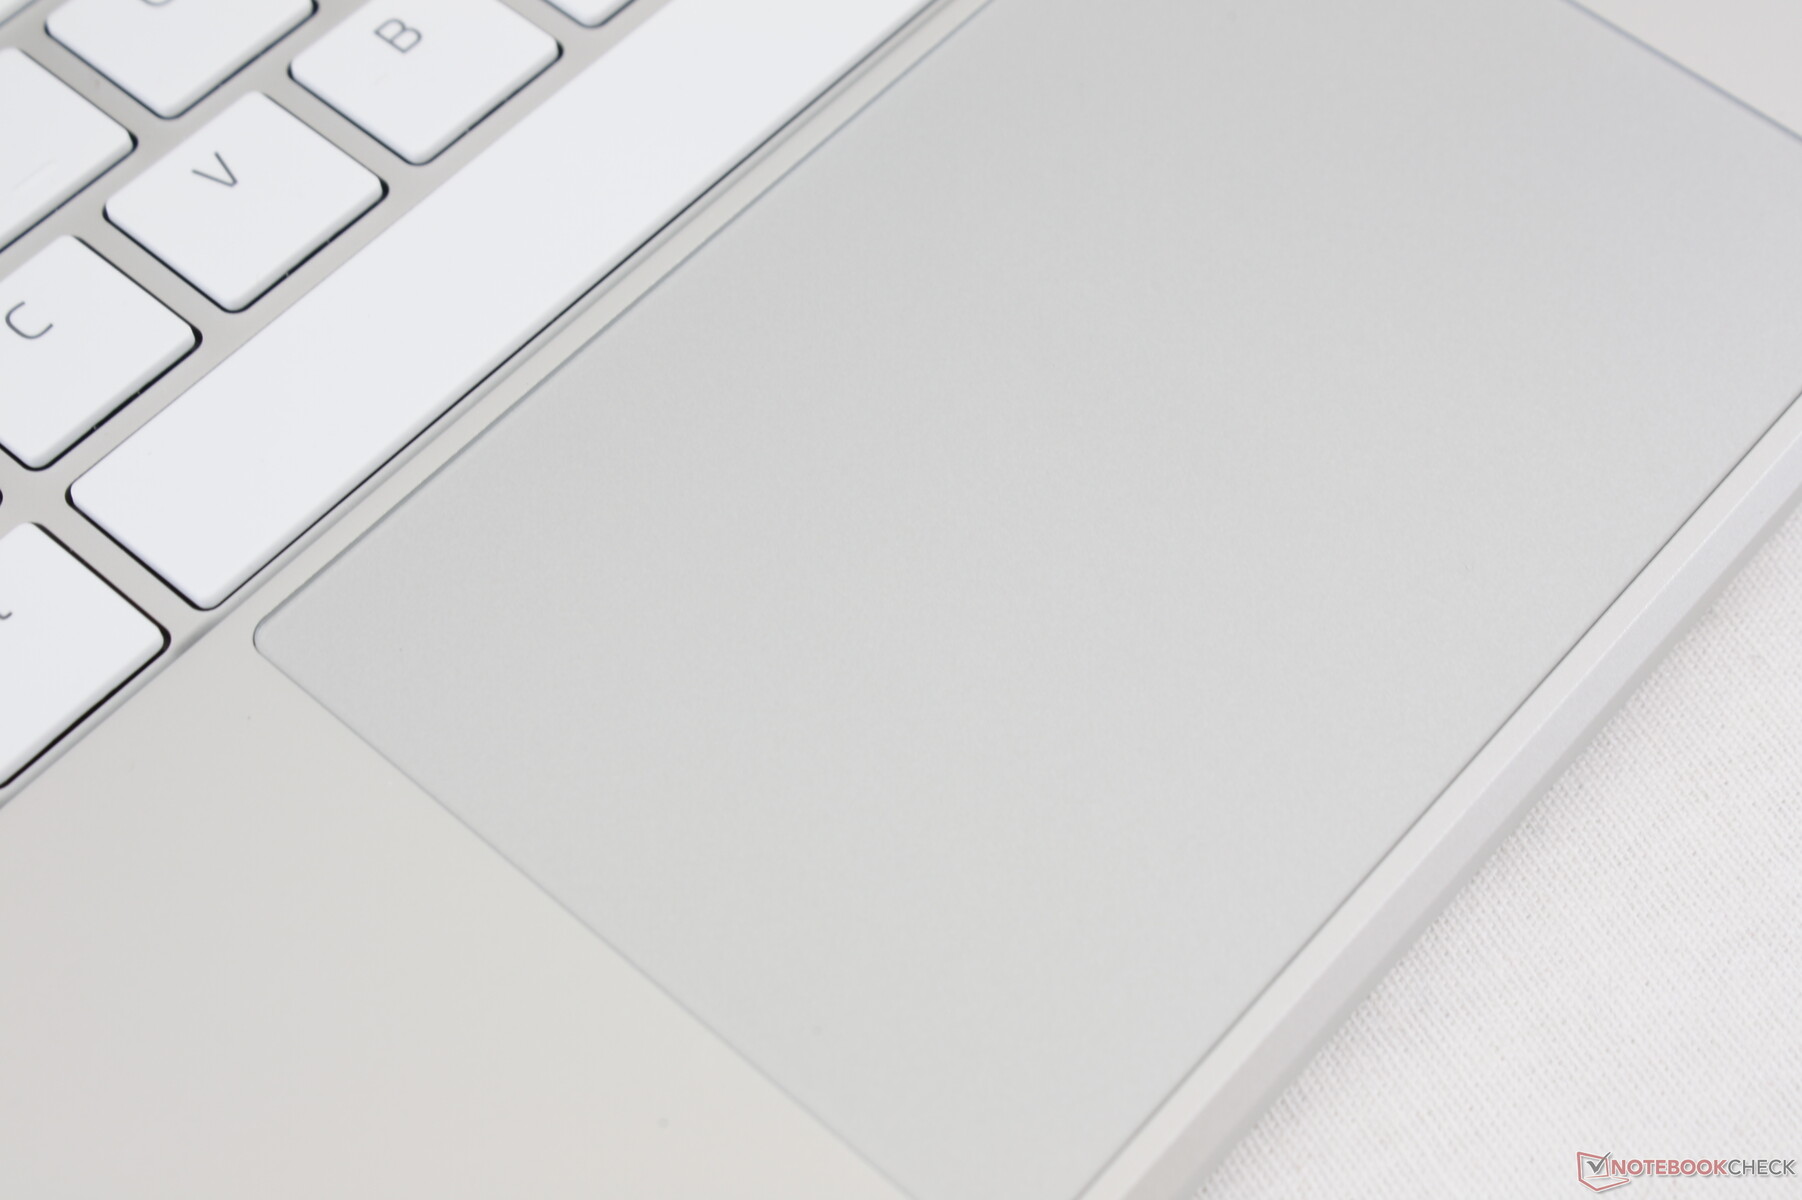
Touchpad
Das Touchpad ist das gleiche wie beim Blade Stealth mit allen Vor- und Nachteilen. Positiv ist die große Oberfläche (~11.1 x 7 cm) gemessen am kleinen Formfaktor, das schwache und schwammige Feedback gehört hingegen überarbeitet. Traditionellere Business-Laptops wie das ThinkPad T490 oder das HP EliteBook 735 G6 integrieren noch immer dedizierte Maustasten, welche wir als leichter und akkurater benutzbar erachten wenn eine Maus einmal nicht zur Hand ist.

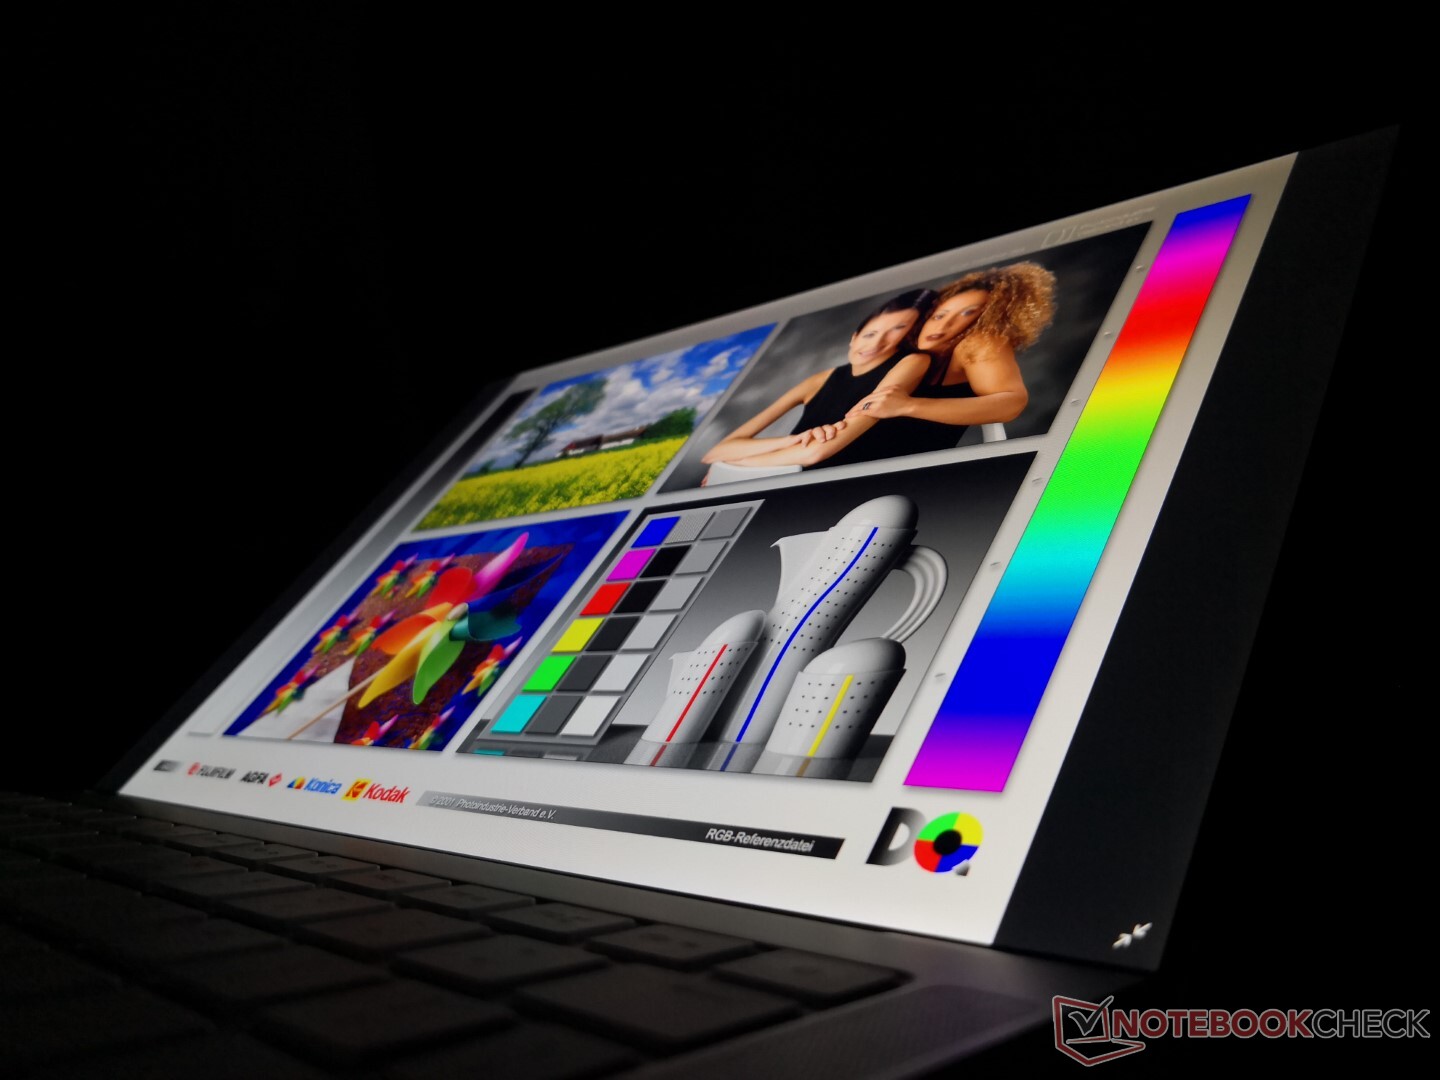
Display
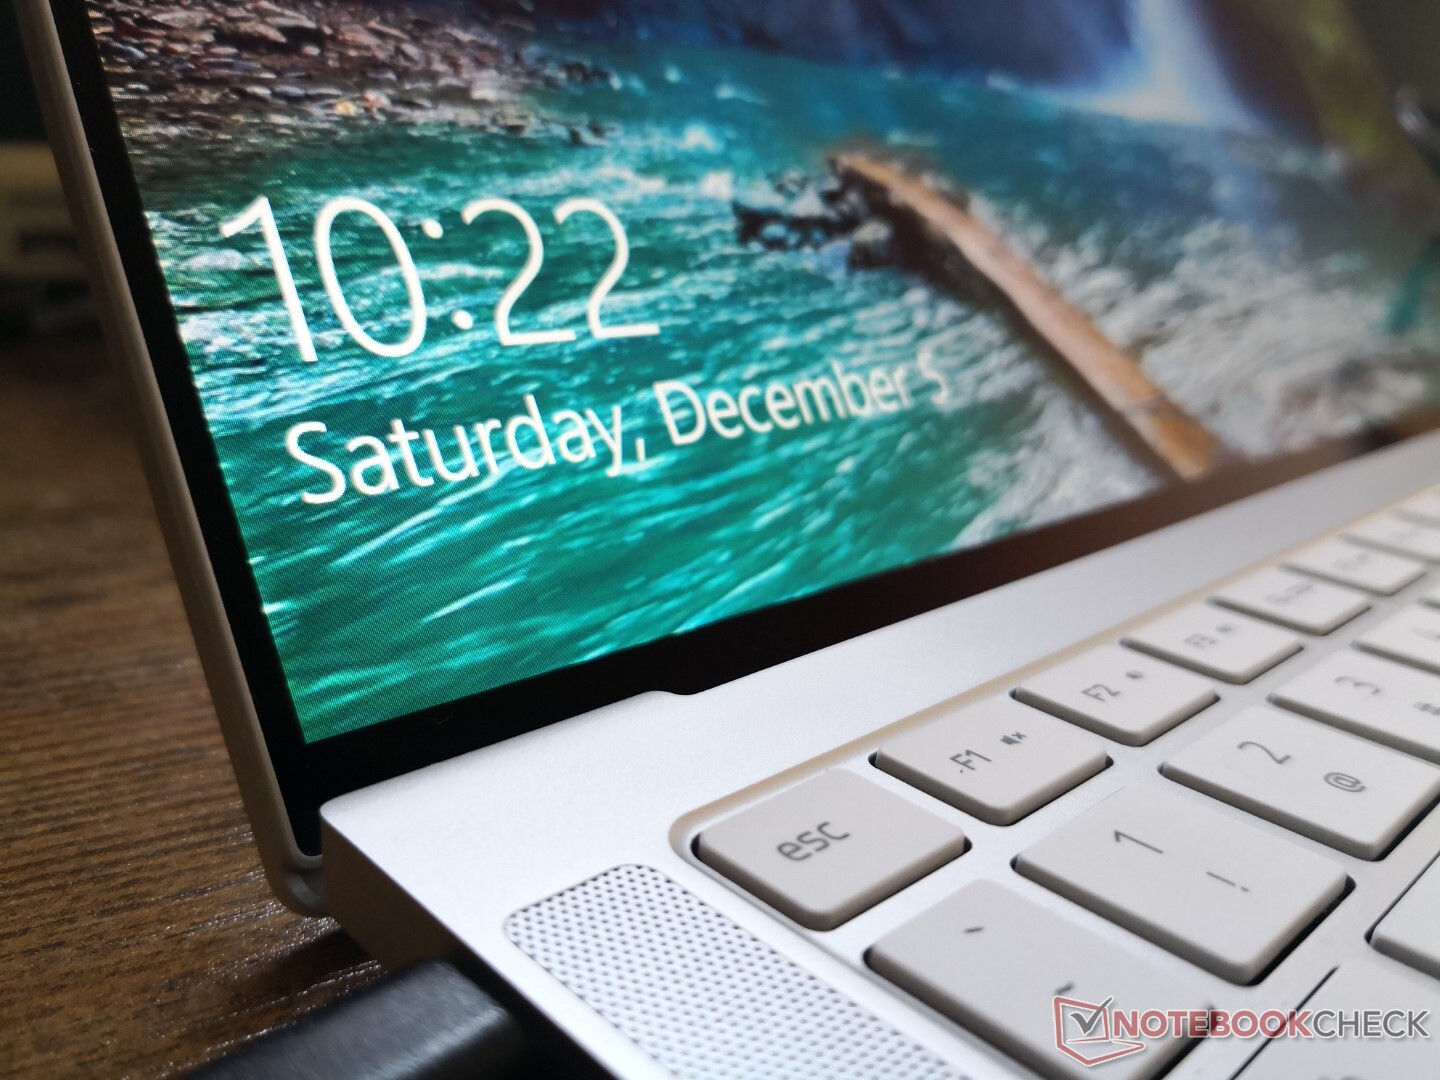
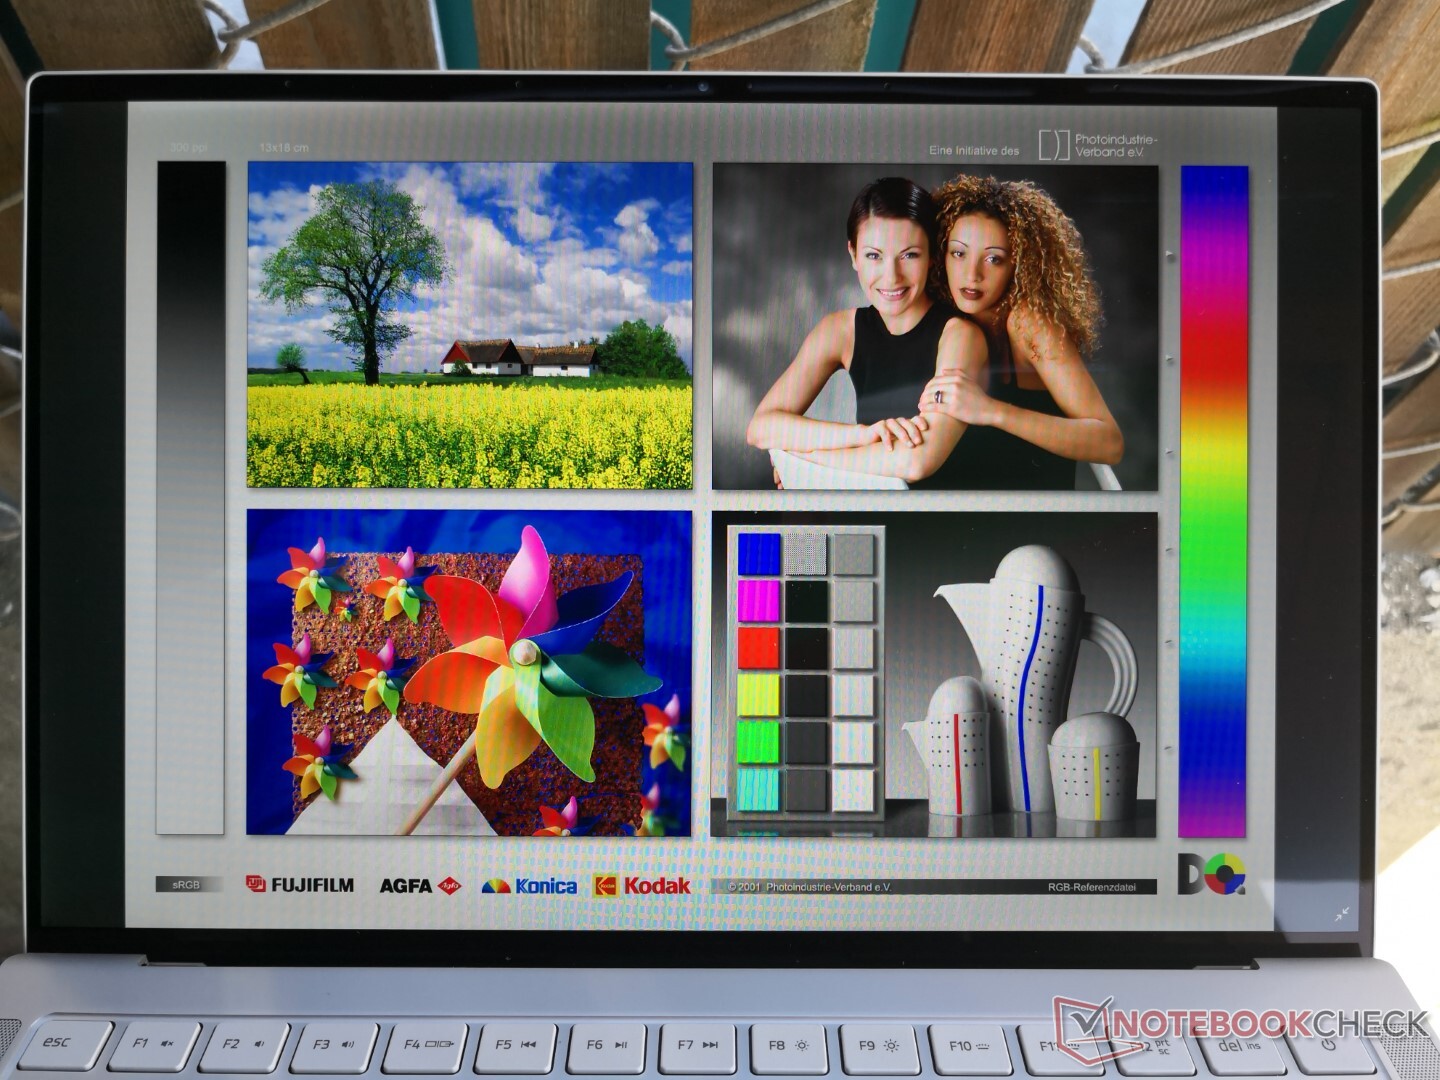
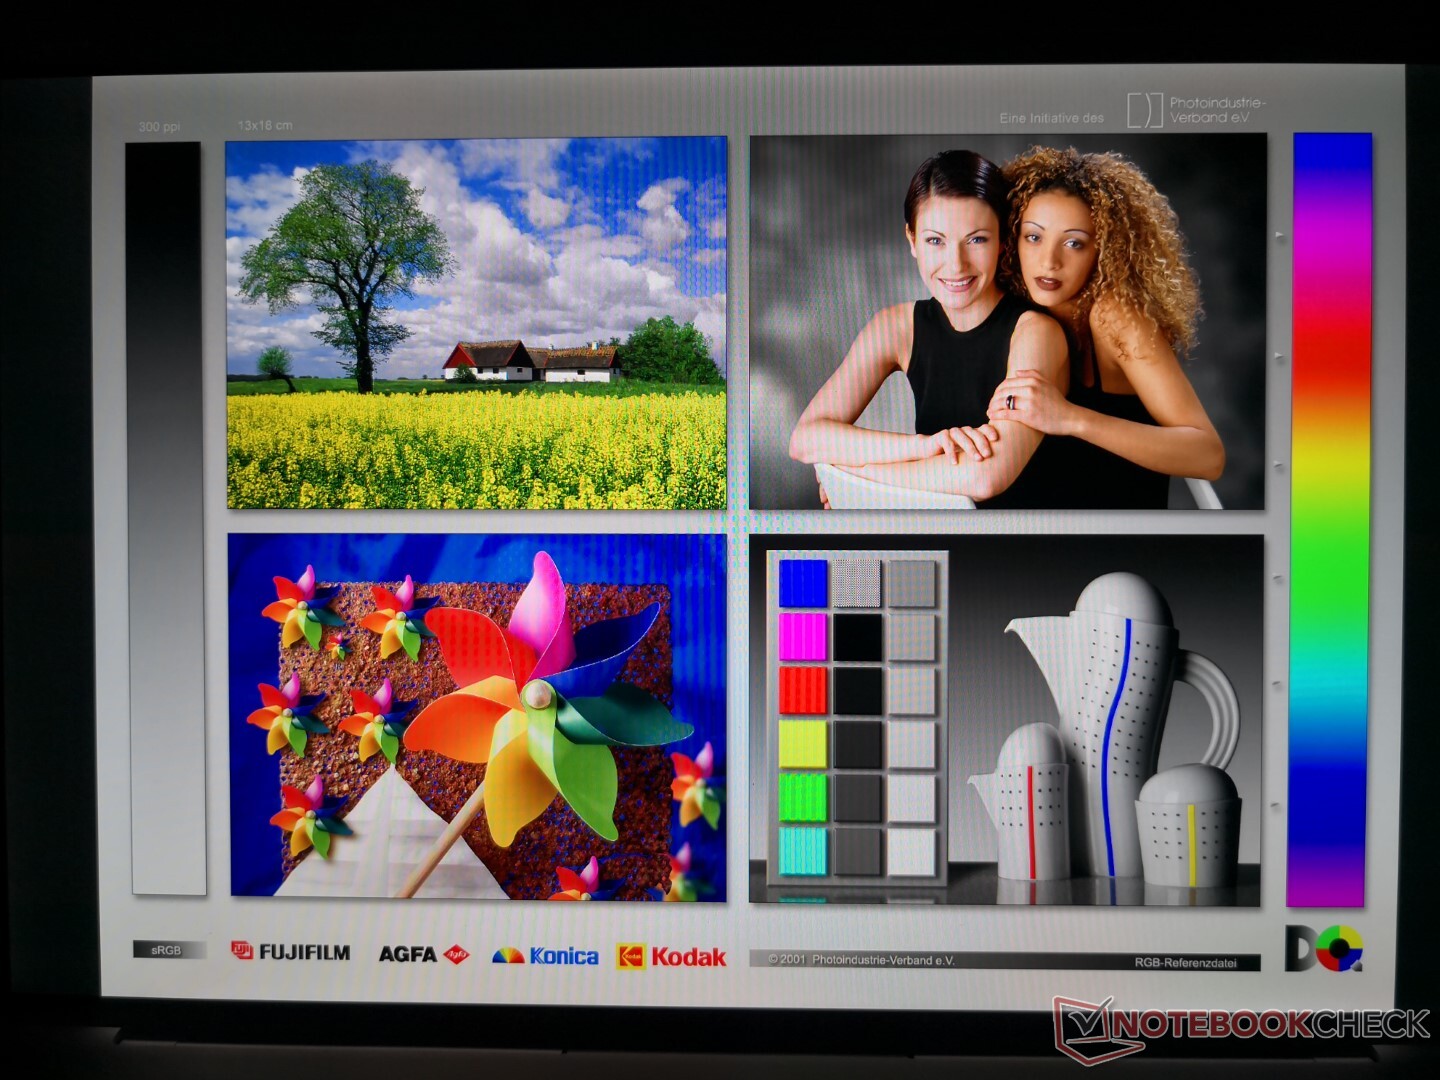
Wie bereits vermutet, verwendet das Book 13 das gleiche oder zumindest ähnliche Sharp-LQ134N1-IPS-Panel, welches auch im Dell XPS 13 9300/9310 sitzt. Tatsächlich teilen sich beide Laptops nahezu gleiche Werte in Sachen Helligkeit und PWM-Frequenz bei niedriger Helligkeit. Das ist kein Nachteil, denn das Display ist immerhin ein Highlight des XPS 13 und das trifft nun auch auf das Book 13 zu. Die Farben wirken plastisch, Texte sind scharf und der Kontrast ist hoch, sodass sich ein hervorragender Ersteindruck einstellt.
Allerdings ist das Display auch ein großer Grund dafür, dass das Book 13 wohl nicht ganz so gut als Gaming-Laptop funktioniert. Denn die Reaktionszeiten sind eindeutig schlechter als beim Blade Stealth, trotz der ausgezeichneten, oben erwähnten Werte. Daher ist Ghosting deutlich sichtbarer beim Gaming, obwohl das Book 13 auf dem Papier sogar stärker ist als einige ältere Blade-Stealth-Konfigurationen mit Intel Ice Lake oder GeForce MX.
| |||||||||||||||||||||||||
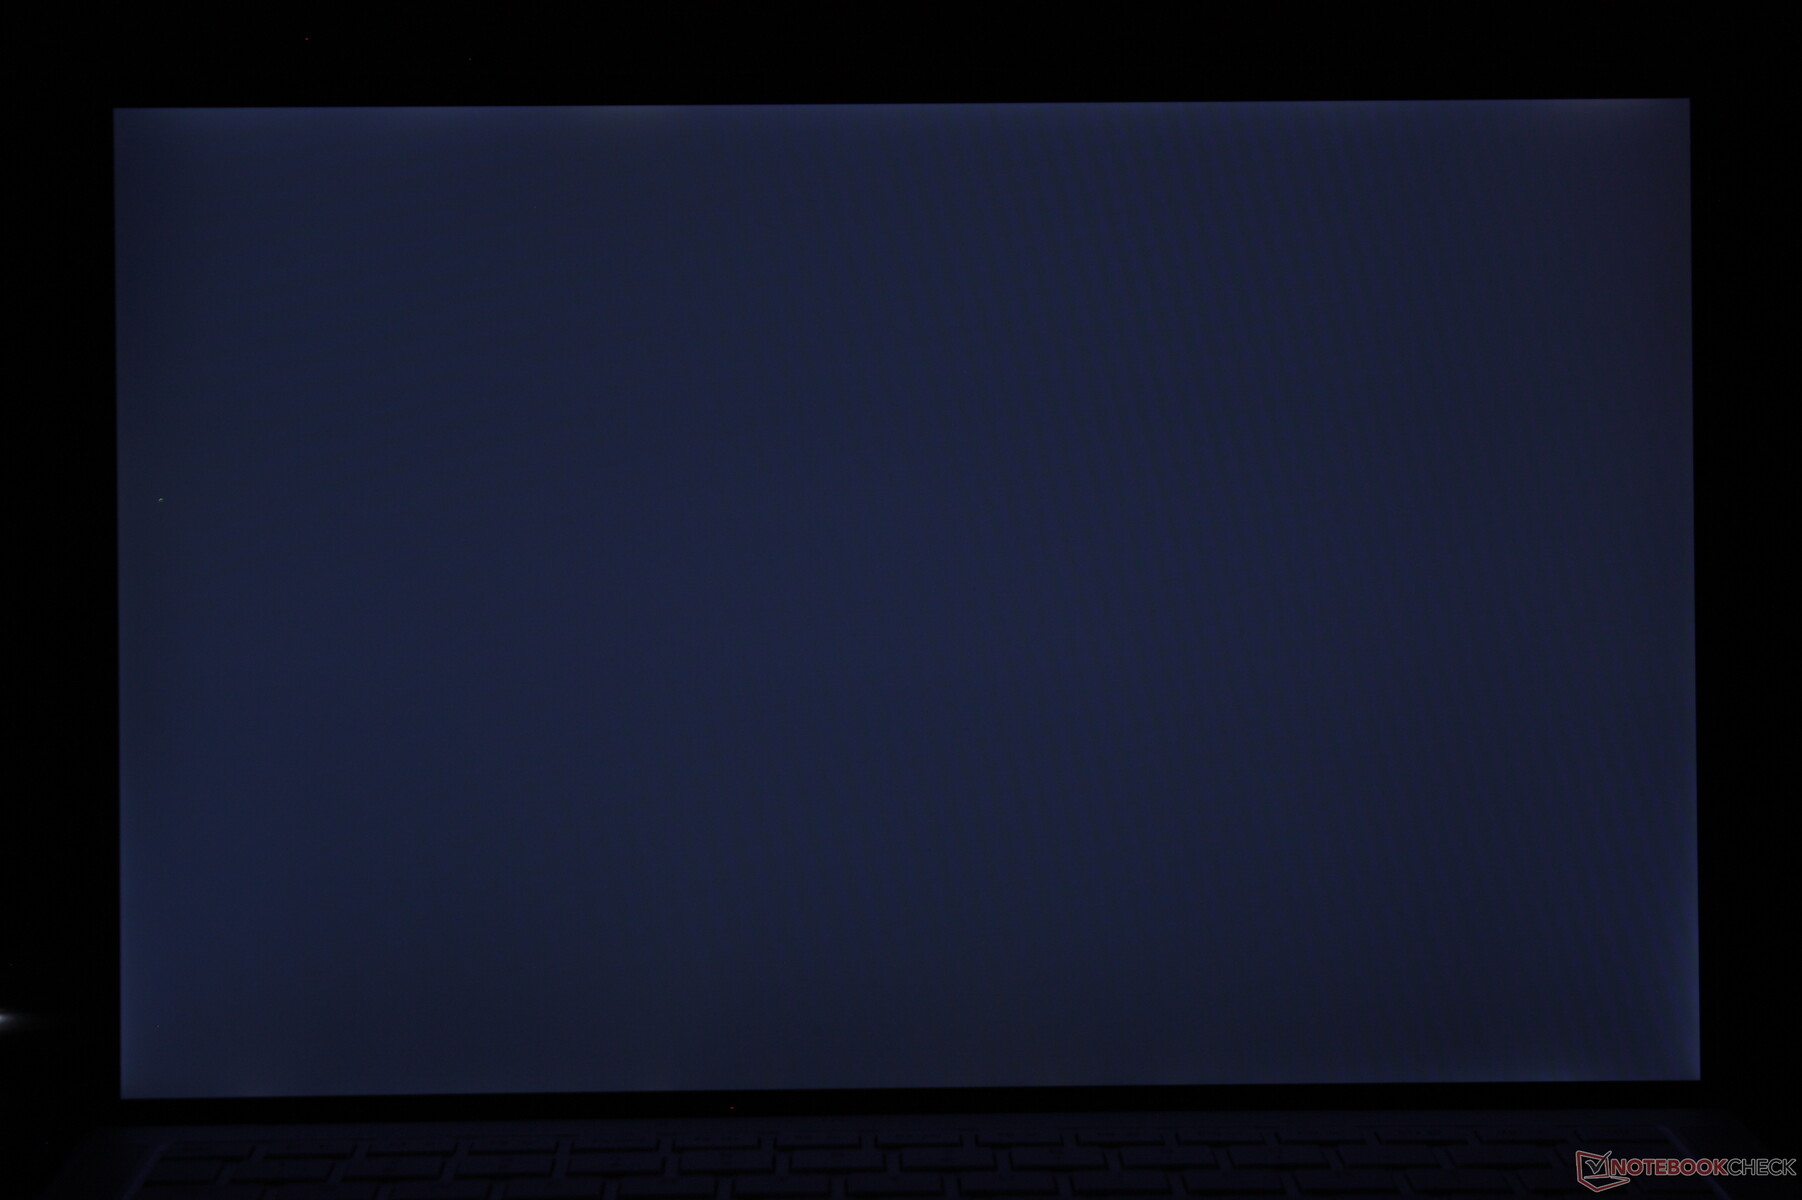
Ausleuchtung: 88 %
Helligkeit Akku: 545.3 cd/m²
Kontrast: 1759:1 (Schwarzwert: 0.31 cd/m²)
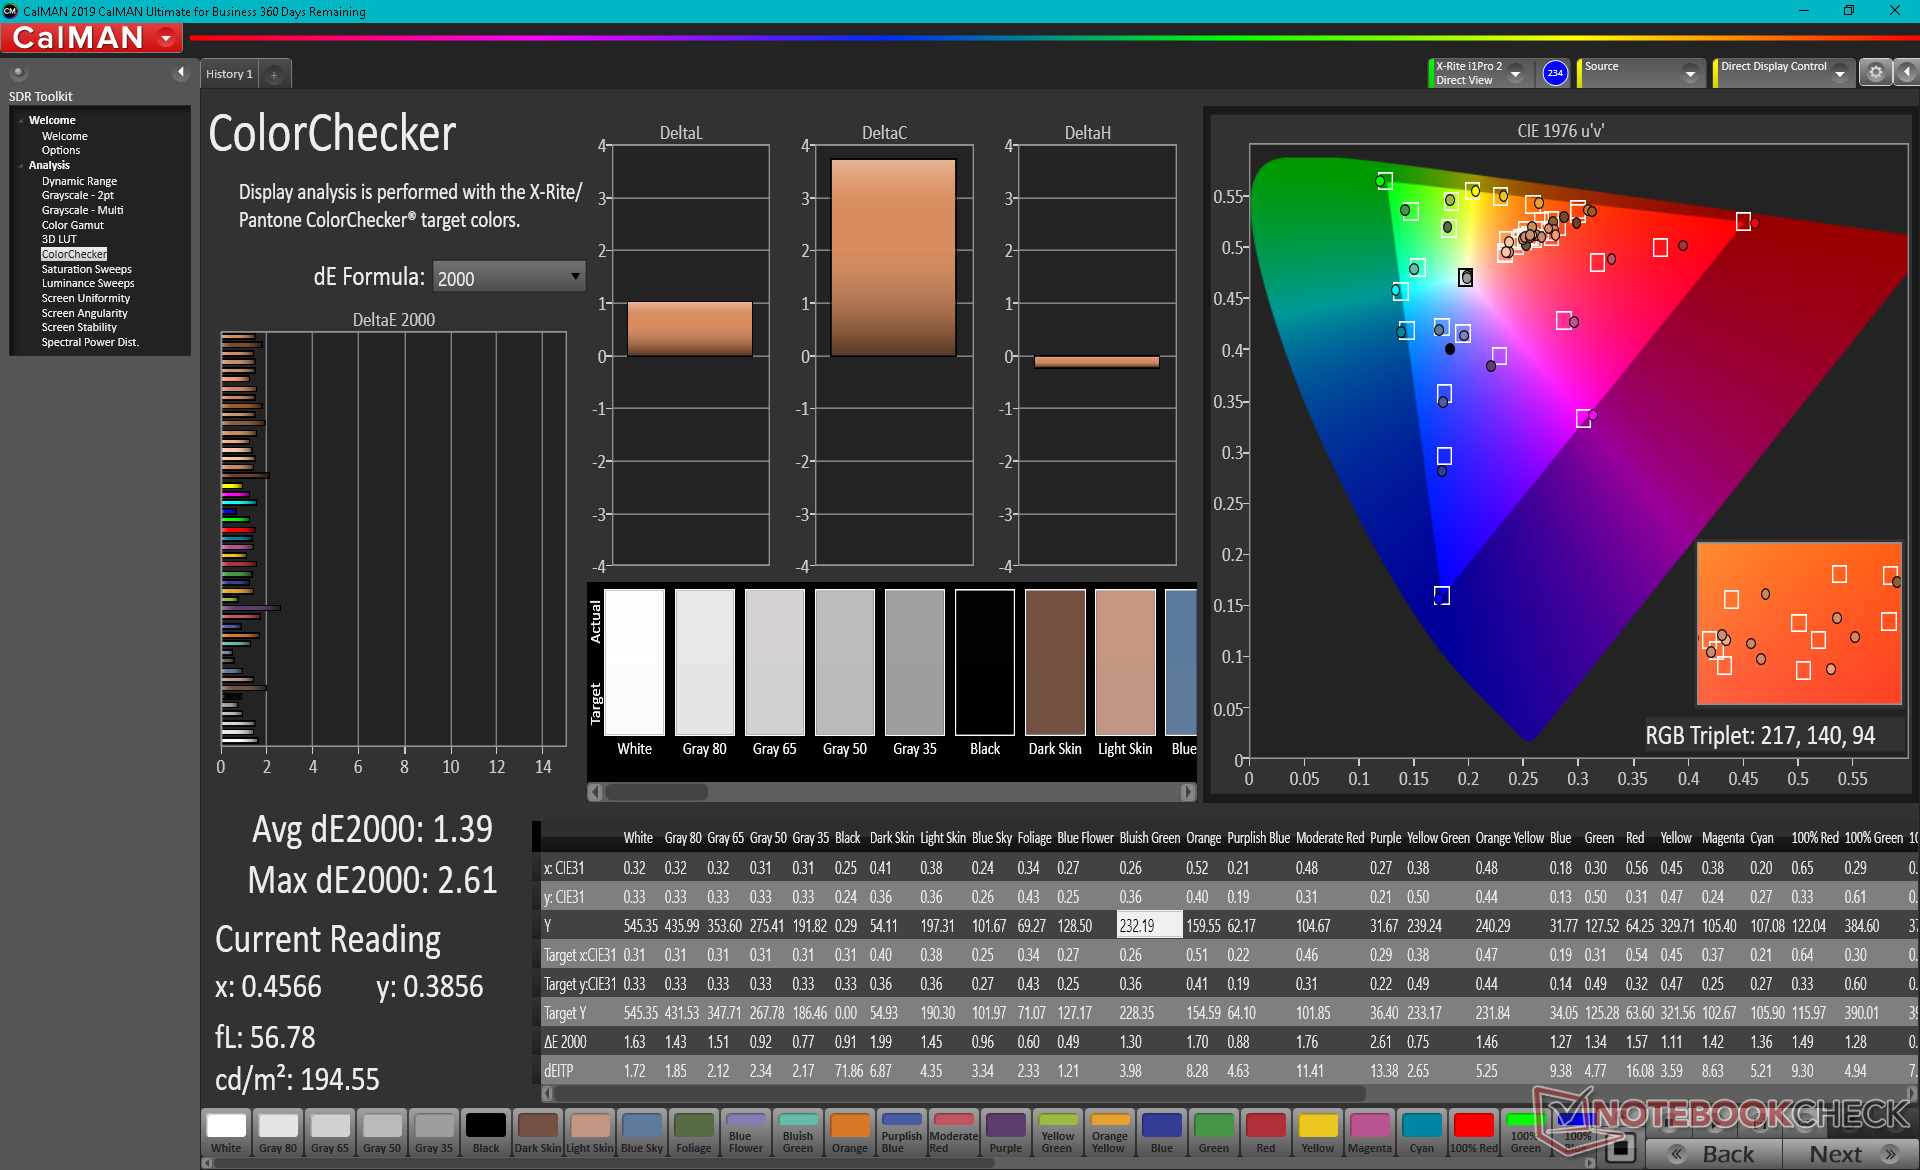
ΔE ColorChecker Calman: 1.39 | ∀{0.5-29.43 Ø4.72}
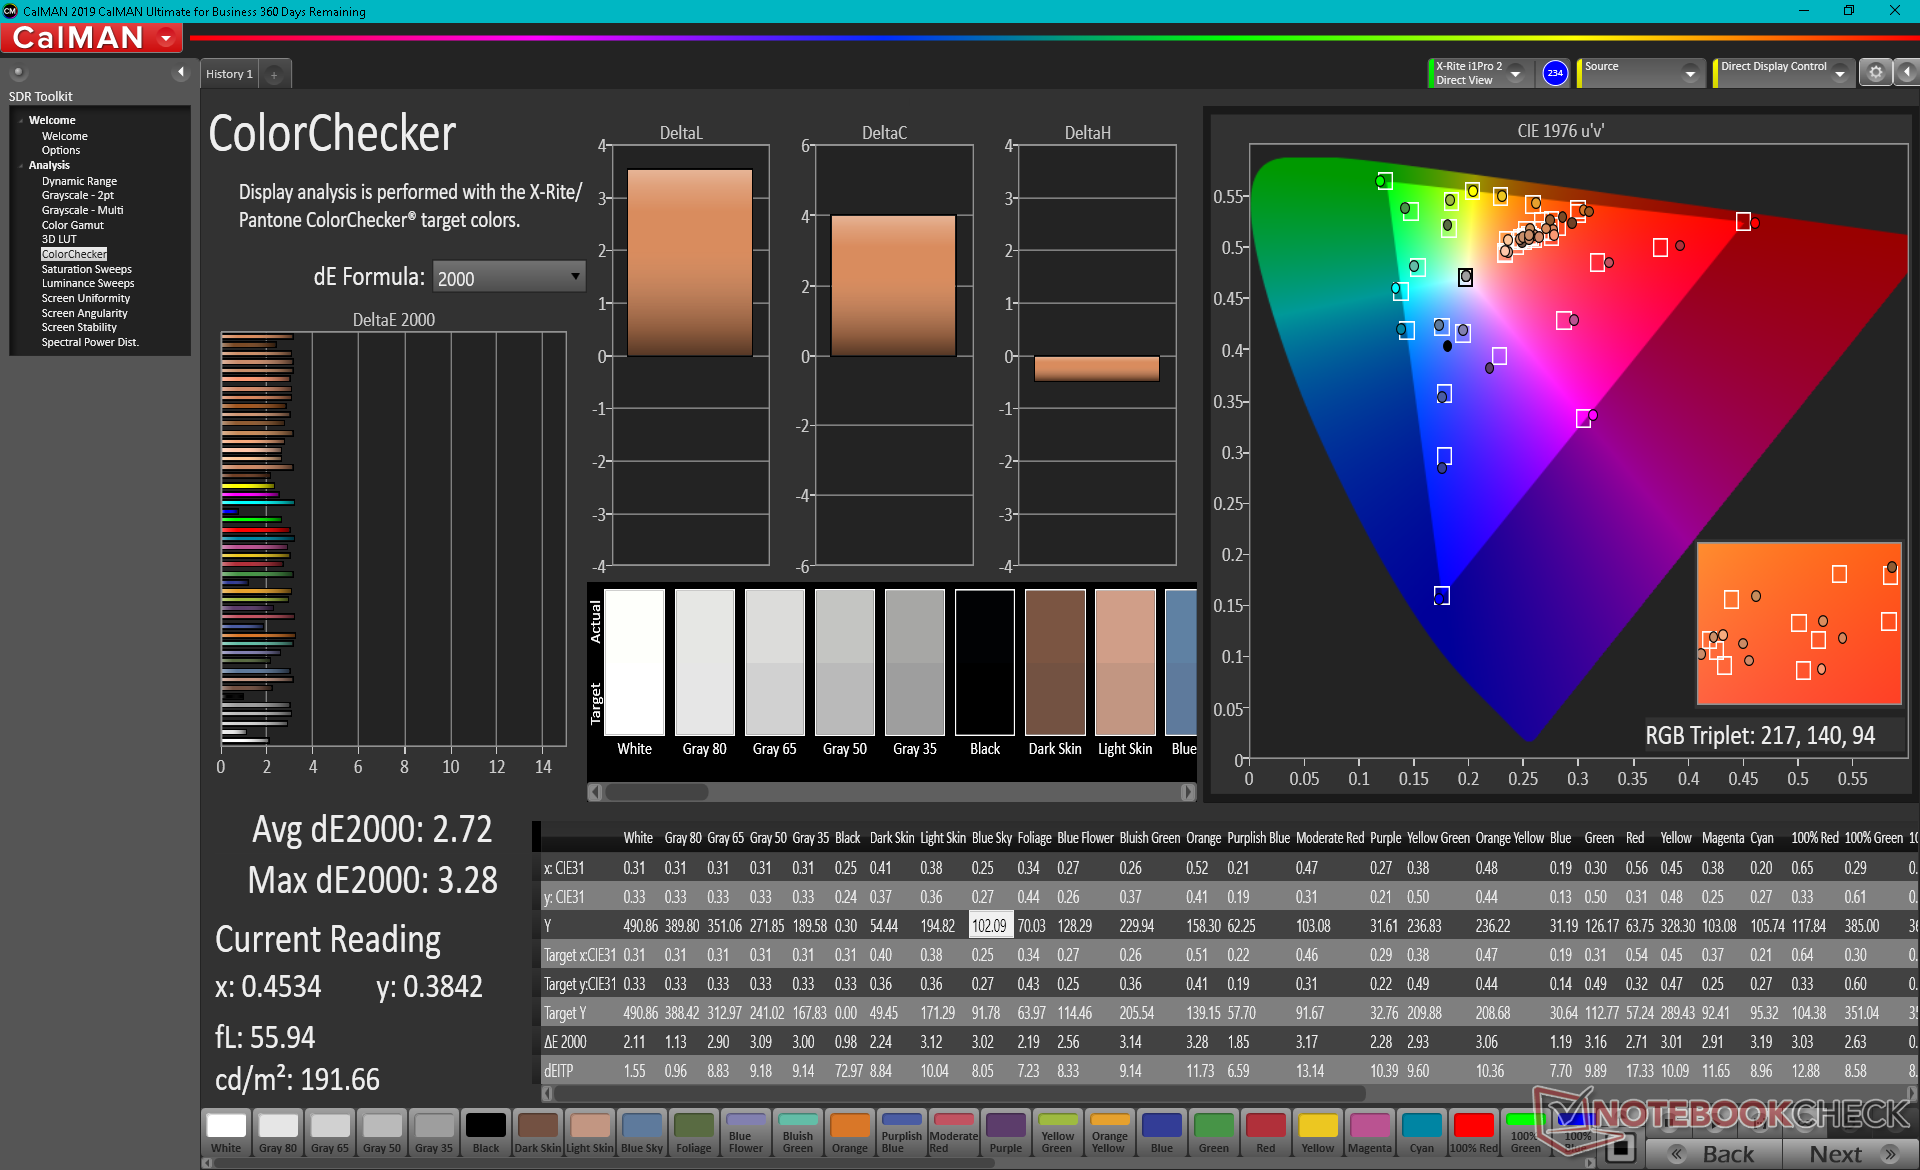
calibrated: 2.72
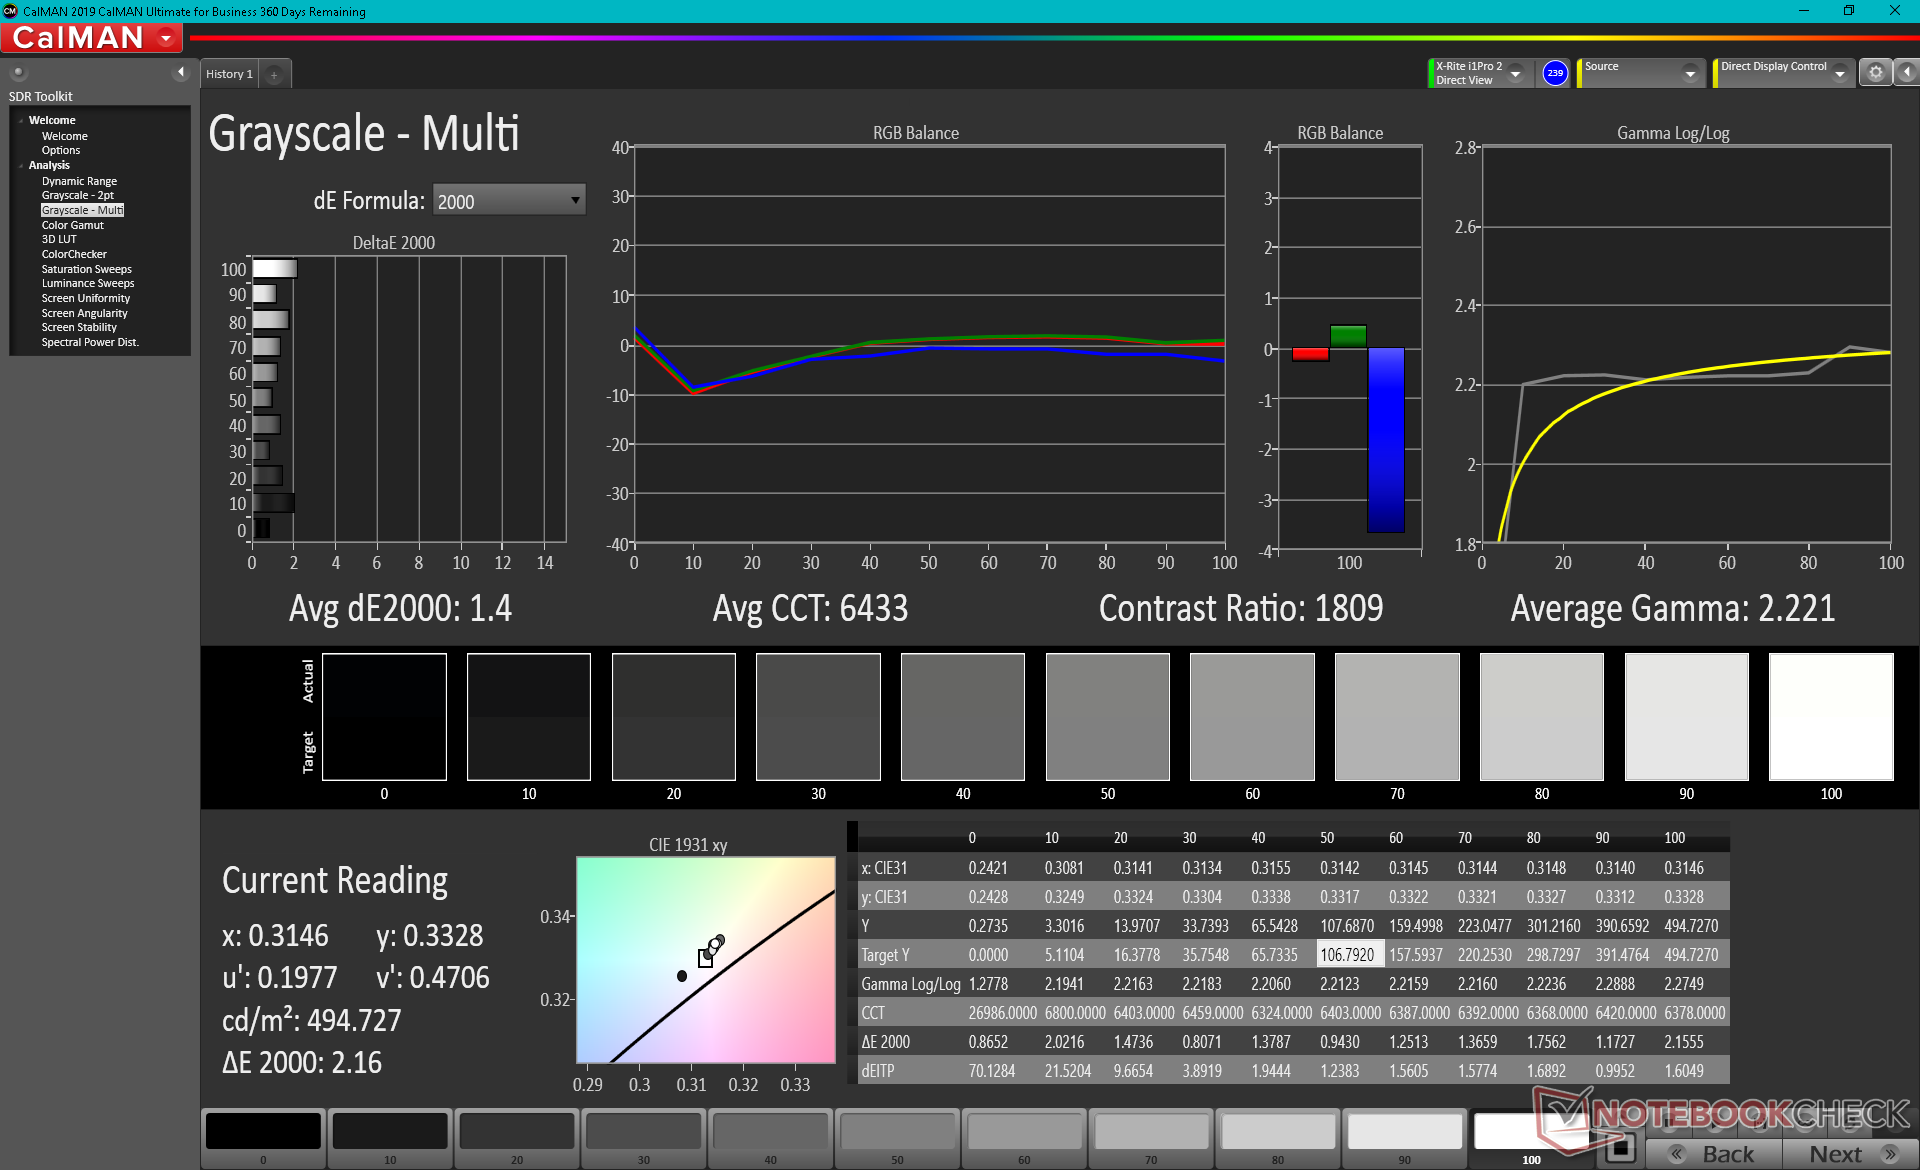
ΔE Greyscale Calman: 1.3 | ∀{0.09-98 Ø4.97}
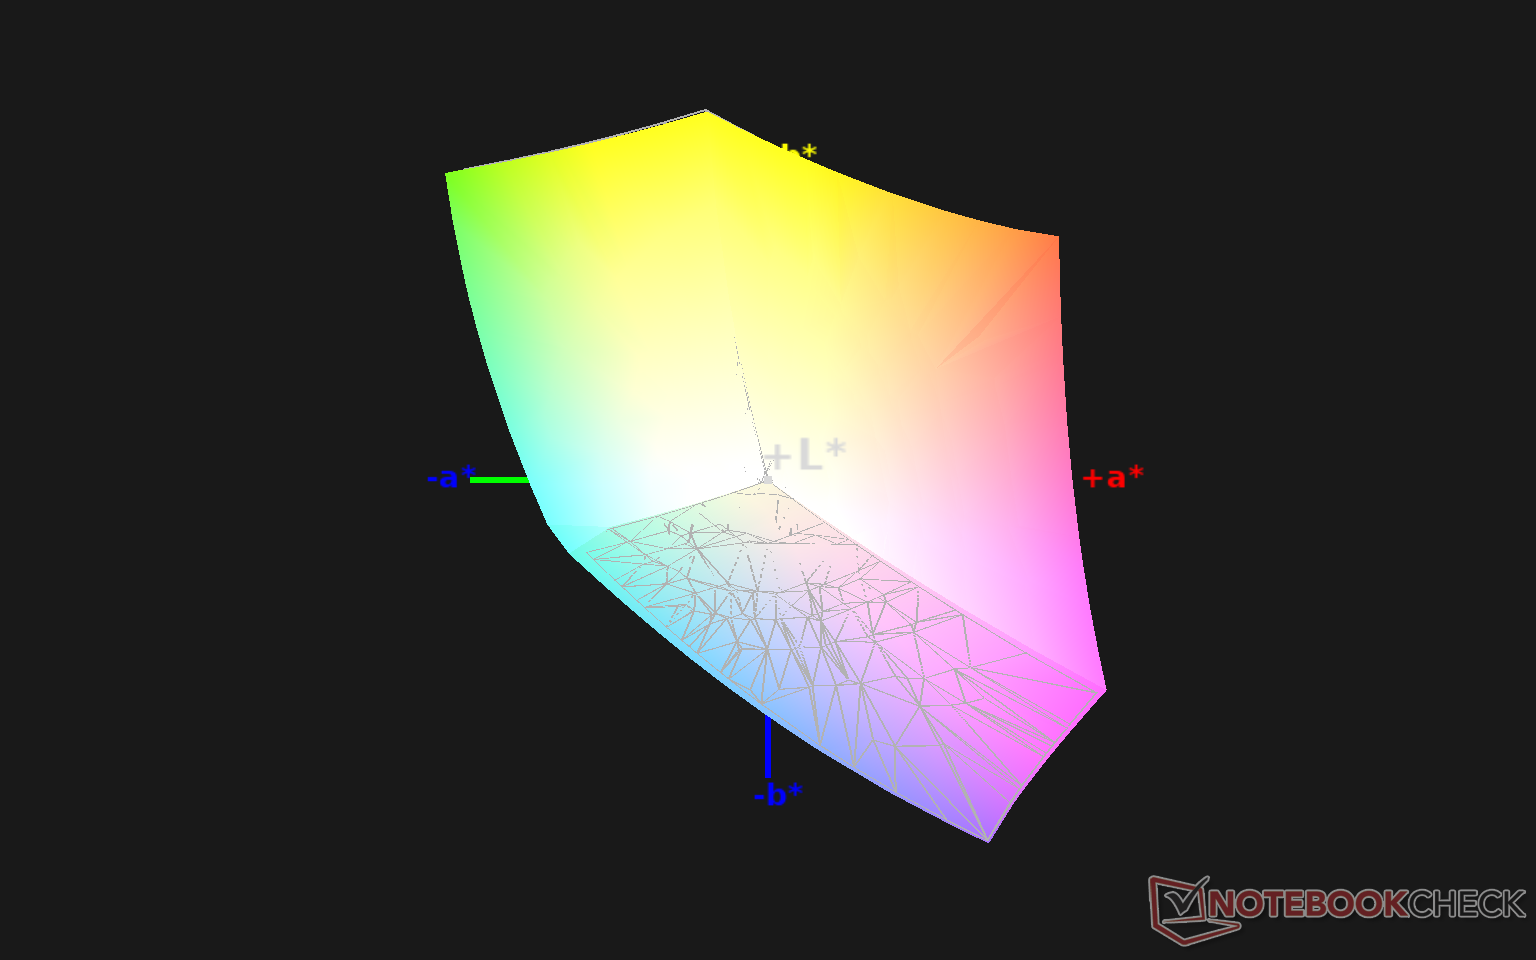
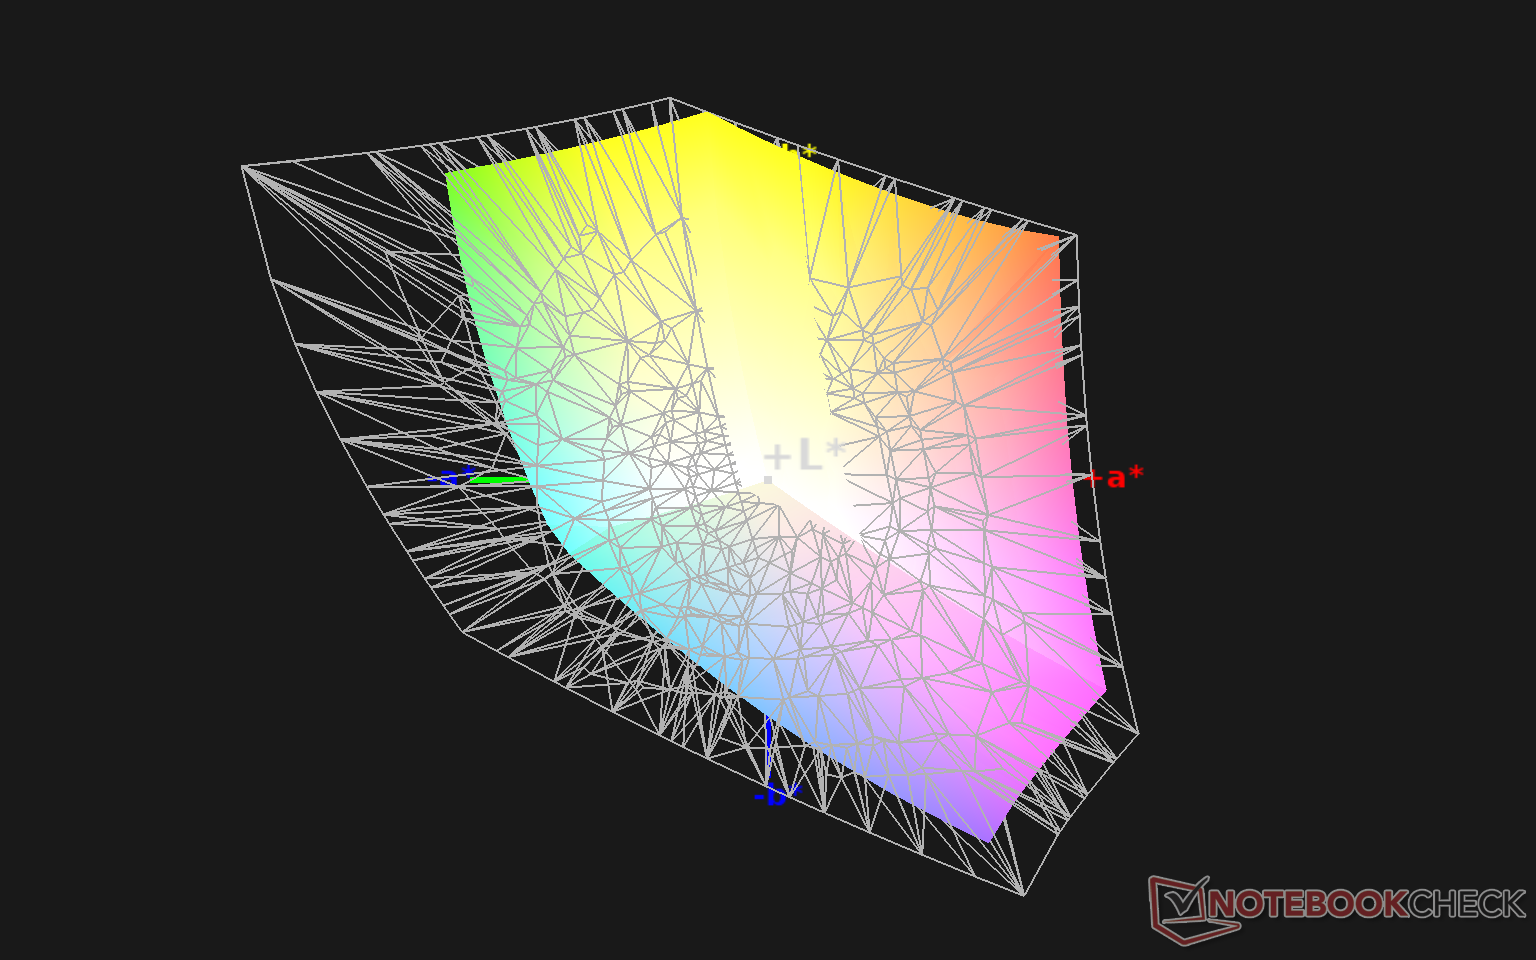
99.6% sRGB (Argyll 1.6.3 3D)
65.9% AdobeRGB 1998 (Argyll 1.6.3 3D)
71.6% AdobeRGB 1998 (Argyll 3D)
99.3% sRGB (Argyll 3D)
70.1% Display P3 (Argyll 3D)
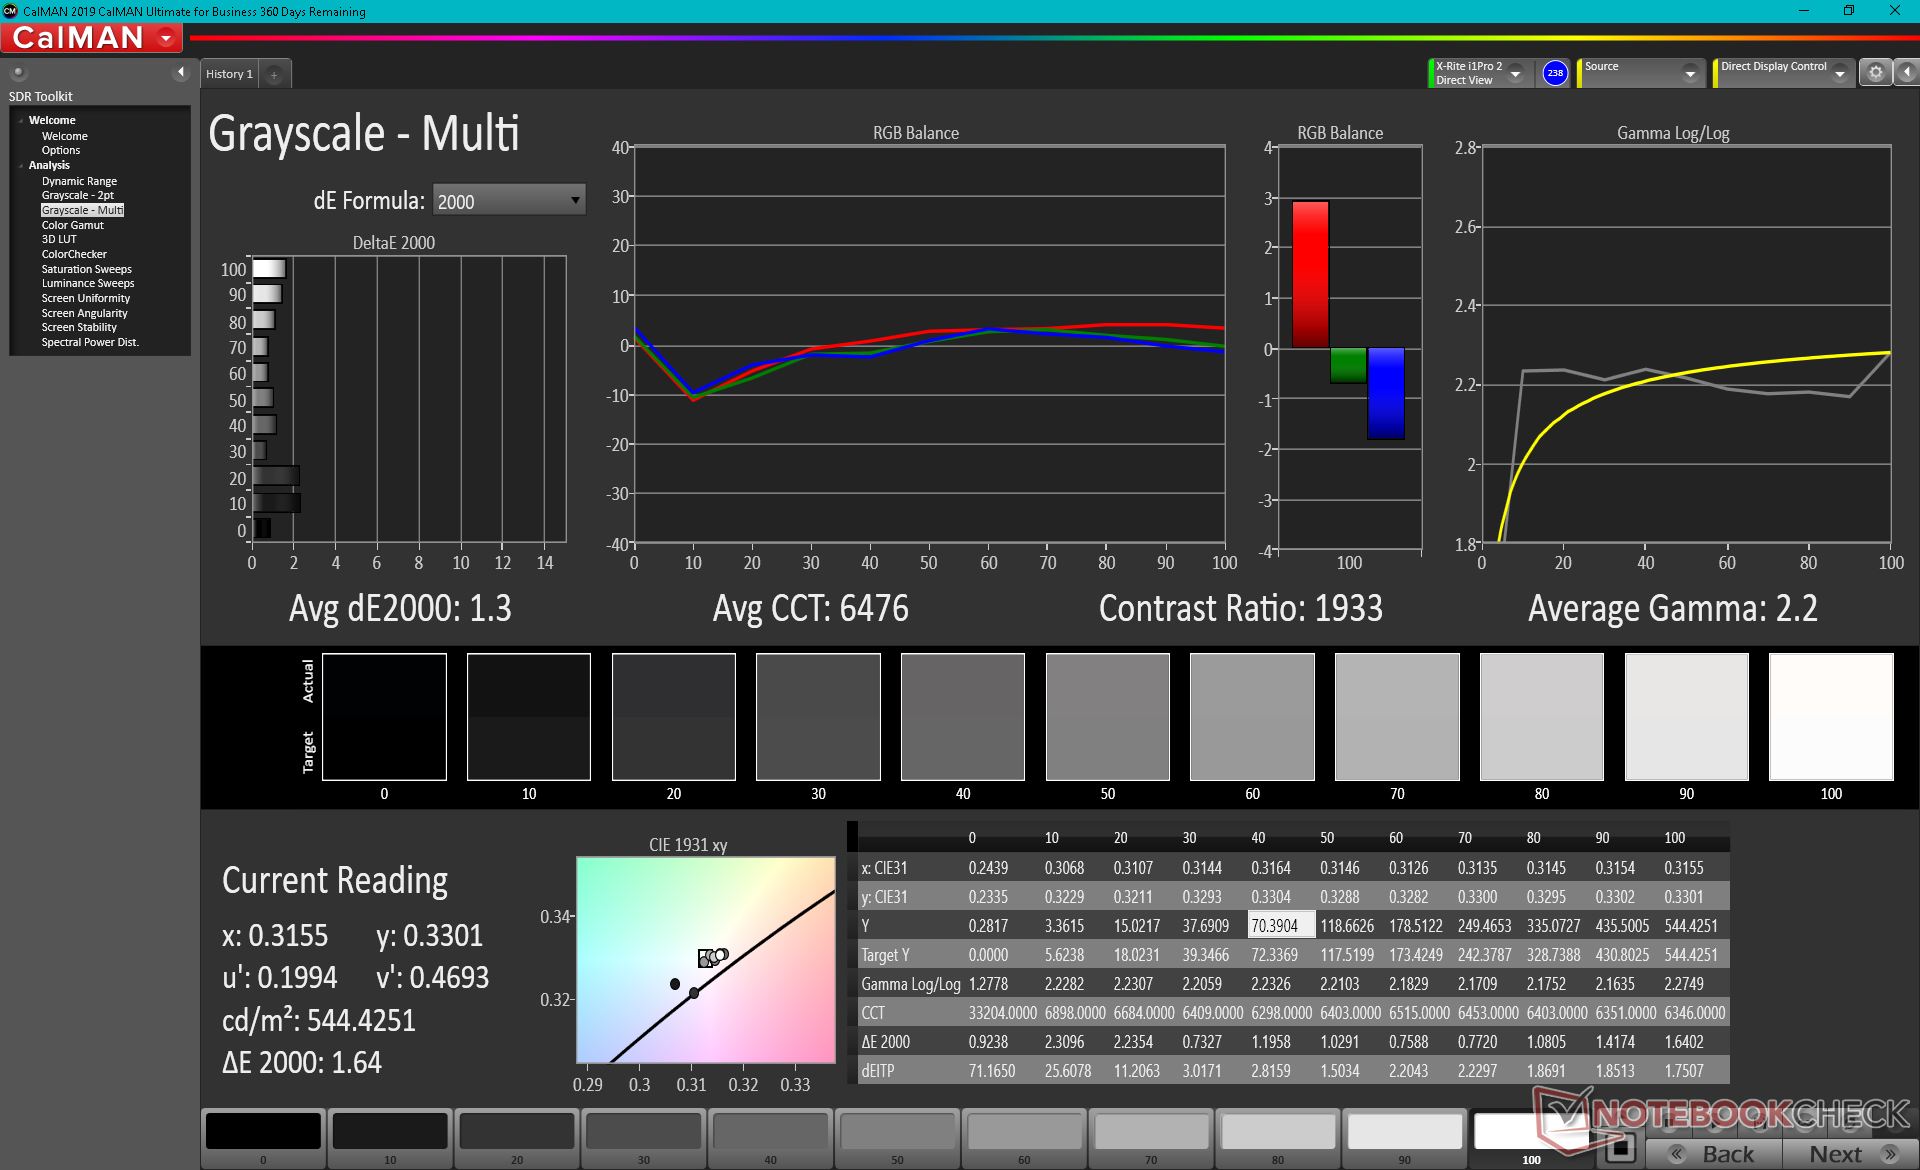
Gamma: 2.2
CCT: 6476 K
| Razer Book 13 FHD Sharp LQ134N1JW48, IPS, 13.4", 1920x1200 | Dell XPS 13 9310 Core i7 FHD Sharp LQ134N1, IPS, 13.4", 1920x1200 | Asus Zenbook S UX393JA AU Optronics B139KAN01.0, IPS, 13.9", 3300x2200 | Huawei MateBook X Pro 2020 i7 JDI LPM139M422A, LTPS, 13.9", 3000x2000 | Microsoft Surface Laptop 3 13 Core i5-1035G7 Sharp LQ135P1JX51, IPS, 13.5", 2256x1504 | Razer Blade Stealth i7-1065G7 Iris Plus Sharp LQ133M1JW41, IPS, 13.3", 1920x1080 | |
|---|---|---|---|---|---|---|
| Display | 1% | 21% | -3% | -4% | -5% | |
| Display P3 Coverage (%) | 70.1 | 70.9 1% | 97.7 39% | 66.6 -5% | 65.7 -6% | 66.2 -6% |
| sRGB Coverage (%) | 99.3 | 99.1 0% | 99.8 1% | 99.4 0% | 98.6 -1% | 97.2 -2% |
| AdobeRGB 1998 Coverage (%) | 71.6 | 72.9 2% | 87.9 23% | 68.6 -4% | 67.8 -5% | 67.1 -6% |
| Response Times | 11% | 1% | 17% | -6% | 17% | |
| Response Time Grey 50% / Grey 80% * (ms) | 56.8 ? | 52 ? 8% | 56.4 ? 1% | 49.6 ? 13% | 59.2 ? -4% | 45.2 ? 20% |
| Response Time Black / White * (ms) | 38.8 ? | 33.2 ? 14% | 38.8 ? -0% | 30.8 ? 21% | 41.6 ? -7% | 33.2 ? 14% |
| PWM Frequency (Hz) | 2475 ? | 2475 ? | 29070 ? | 21740 ? | 22730 ? | |
| Bildschirm | -52% | -45% | 1% | 2% | 0% | |
| Helligkeit Bildmitte (cd/m²) | 545.3 | 543.3 0% | 444.1 -19% | 557 2% | 403.4 -26% | 422.6 -23% |
| Brightness (cd/m²) | 507 | 524 3% | 423 -17% | 532 5% | 397 -22% | 404 -20% |
| Brightness Distribution (%) | 88 | 92 5% | 89 1% | 87 -1% | 89 1% | 87 -1% |
| Schwarzwert * (cd/m²) | 0.31 | 0.38 -23% | 0.37 -19% | 0.33 -6% | 0.34 -10% | 0.35 -13% |
| Kontrast (:1) | 1759 | 1430 -19% | 1200 -32% | 1688 -4% | 1186 -33% | 1207 -31% |
| Delta E Colorchecker * | 1.39 | 3.02 -117% | 2.94 -112% | 1.4 -1% | 0.94 32% | 1.02 27% |
| Colorchecker dE 2000 max. * | 2.61 | 7.61 -192% | 7.37 -182% | 2.5 4% | 2.92 -12% | 3.06 -17% |
| Colorchecker dE 2000 calibrated * | 2.72 | 1.23 55% | 3.05 -12% | 0.7 74% | 0.99 64% | 0.95 65% |
| Delta E Graustufen * | 1.3 | 5 -285% | 2.9 -123% | 2 -54% | 0.9 31% | 1 23% |
| Gamma | 2.2 100% | 2.02 109% | 2.1 105% | 2.14 103% | 2.13 103% | 2.21 100% |
| CCT | 6476 100% | 6550 99% | 6766 96% | 6689 97% | 6620 98% | 6502 100% |
| Farbraum (Prozent von AdobeRGB 1998) (%) | 65.9 | 66.8 1% | 78.2 19% | 62.5 -5% | 62.3 -5% | 62.1 -6% |
| Color Space (Percent of sRGB) (%) | 99.6 | 99.6 0% | 99.8 0% | 99.5 0% | 98.7 -1% | 97.1 -3% |
| Durchschnitt gesamt (Programm / Settings) | -13% /
-34% | -8% /
-27% | 5% /
2% | -3% /
-0% | 4% /
1% |
* ... kleinere Werte sind besser
Der sRGB-Farbraum wird nahezu komplett abgedeckt, hinzu kommen 66 Prozent des AdobeRGB-Farbraums. Die Werte entsprechen denen des Blade Stealth oder den meisten anderen Flaggschiff-Ultrabooks. Trotzdem bietet z.B. das MacBook Pro 13 mit 77 Prozent AdobeRGB noch genauere Farben, während einige 4K-Panels wie beim HP Spectre 15 oder dem XPS 15 AdobeRGB komplett abdecken können. Die 4K-Option des Book 13 deckt übrigens nicht mehr Farben ab als die FHD-Option.
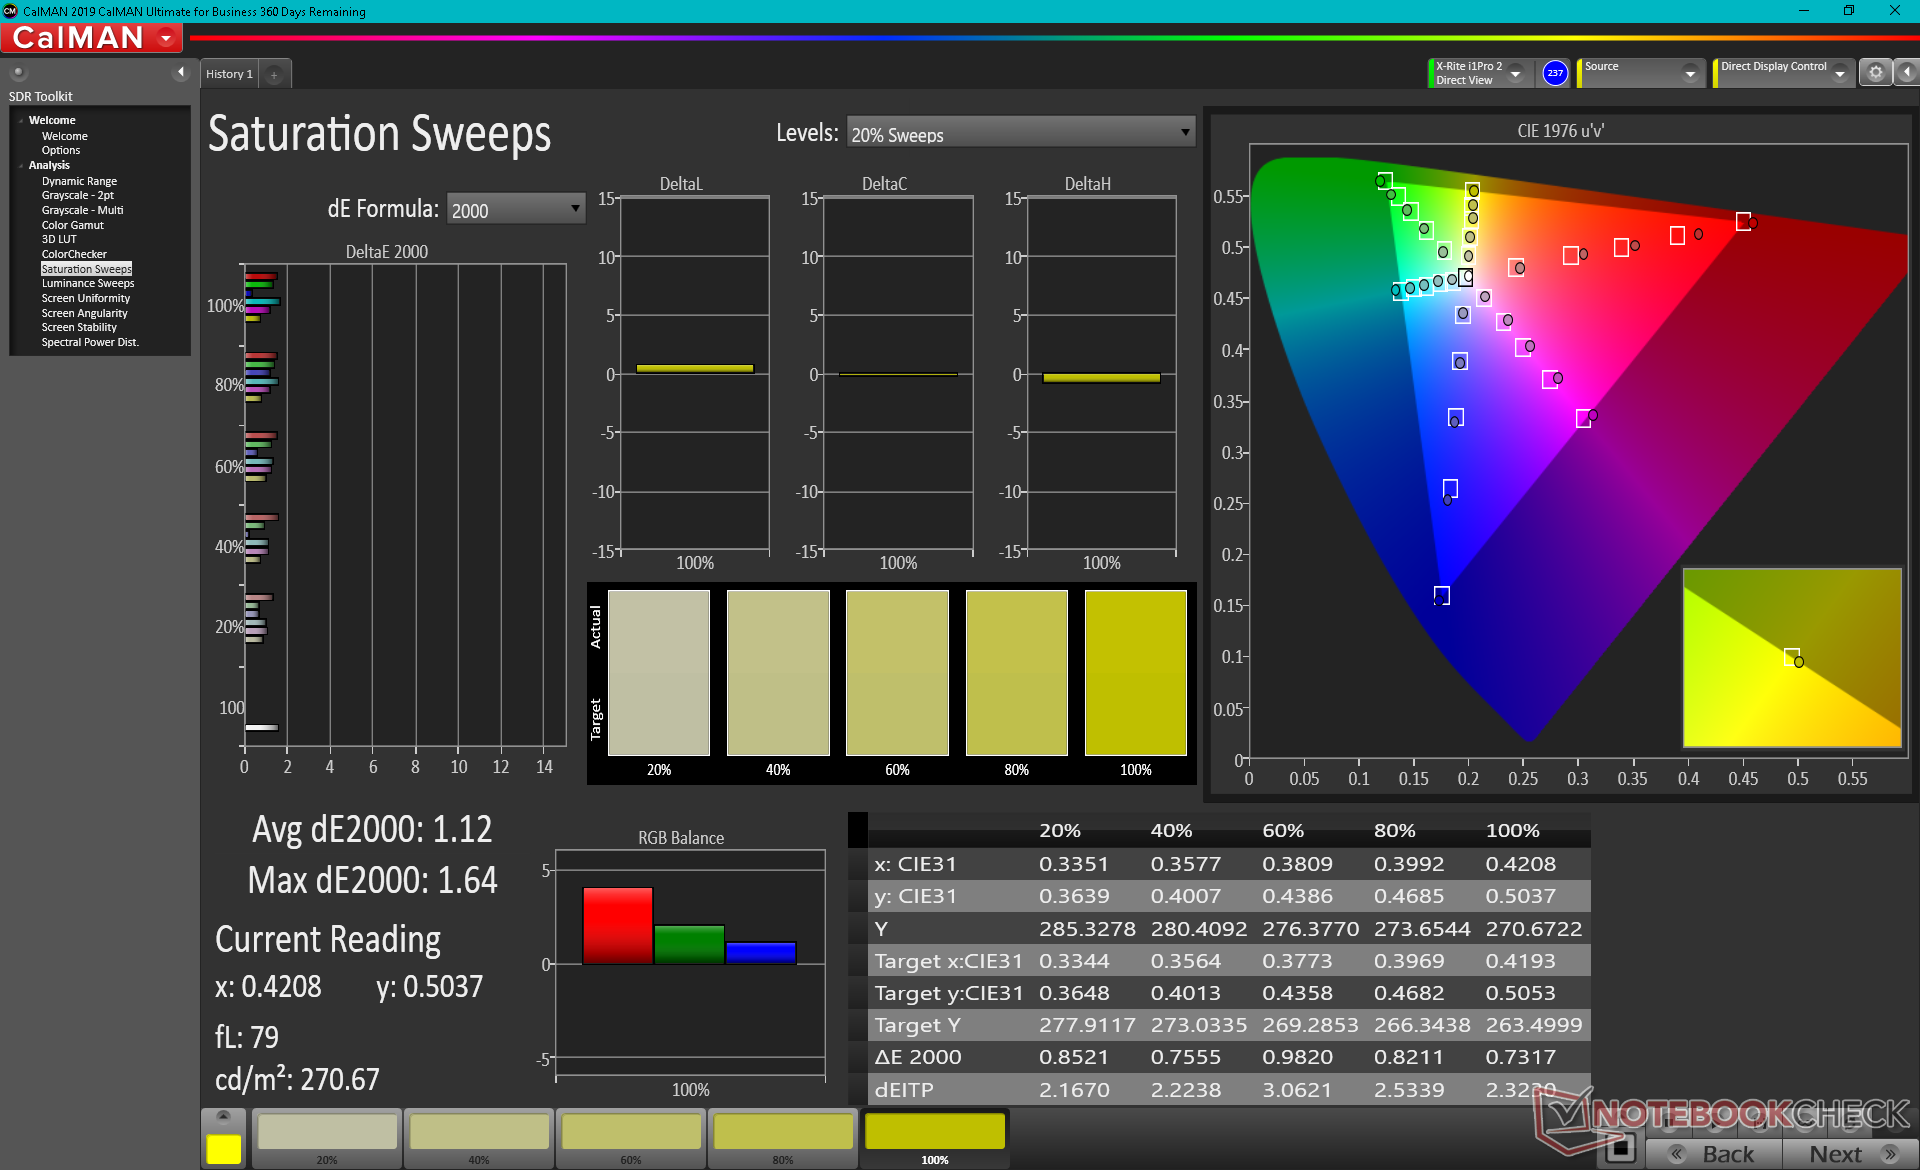
Unser X-Rite Farbmessgerät zeigt, dass das Display, wie in der Werbung versprochen, bereits ab Werk gut kalibriert ist, wir messen durchschnittliche Graustufen- und Farbabweichungen von nur 1,3 und 1,39, hinzu kommt ein nahezu perfekter Gammawert von 2,2. Ein Versuch einer erneuten Kalibrierung bringt praktisch keine Verbesserung mehr.
Reaktionszeiten (Response Times) des Displays
| ↔ Reaktionszeiten Schwarz zu Weiß | ||
|---|---|---|
| 38.8 ms ... steigend ↗ und fallend ↘ kombiniert | ↗ 20.4 ms steigend | 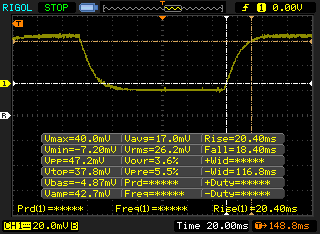 |
| ↘ 18.4 ms fallend | ||
| Die gemessenen Reaktionszeiten sind langsam und dadurch für viele Spieler wahrscheinlich zu langsam. Im Vergleich rangierten die bei uns getesteten Geräte von 0.1 (Minimum) zu 240 (Maximum) ms. » 96 % aller Screens waren schneller als der getestete. Daher sind die gemessenen Reaktionszeiten schlechter als der Durchschnitt aller vermessenen Geräte (19.8 ms). | ||
| ↔ Reaktionszeiten 50% Grau zu 80% Grau | ||
| 56.8 ms ... steigend ↗ und fallend ↘ kombiniert | ↗ 29.2 ms steigend | 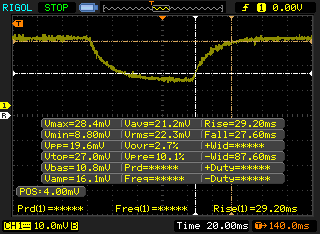 |
| ↘ 27.6 ms fallend | ||
| Die gemessenen Reaktionszeiten sind langsam und dadurch für viele Spieler wahrscheinlich zu langsam. Im Vergleich rangierten die bei uns getesteten Geräte von 0.165 (Minimum) zu 636 (Maximum) ms. » 94 % aller Screens waren schneller als der getestete. Daher sind die gemessenen Reaktionszeiten schlechter als der Durchschnitt aller vermessenen Geräte (31 ms). | ||
Bildschirm-Flackern / PWM (Pulse-Width Modulation)
| Flackern / PWM festgestellt | 2475 Hz | ≤ 25 % Helligkeit | 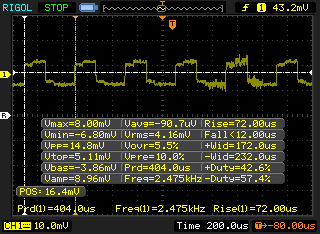 |
Das Display flackert mit 2475 Hz (im schlimmsten Fall, eventuell durch Pulsweitenmodulation PWM) bei einer eingestellten Helligkeit von 25 % und darunter. Darüber sollte es zu keinem Flackern kommen. Die Frequenz von 2475 Hz ist sehr hoch und sollte daher auch bei empfindlichen Personen zu keinen Problemen führen. Im Vergleich: 52 % aller getesteten Geräte nutzten kein PWM um die Helligkeit zu reduzieren. Wenn PWM eingesetzt wurde, dann bei einer Frequenz von durchschnittlich 7781 (Minimum 5, Maximum 343500) Hz. | |||
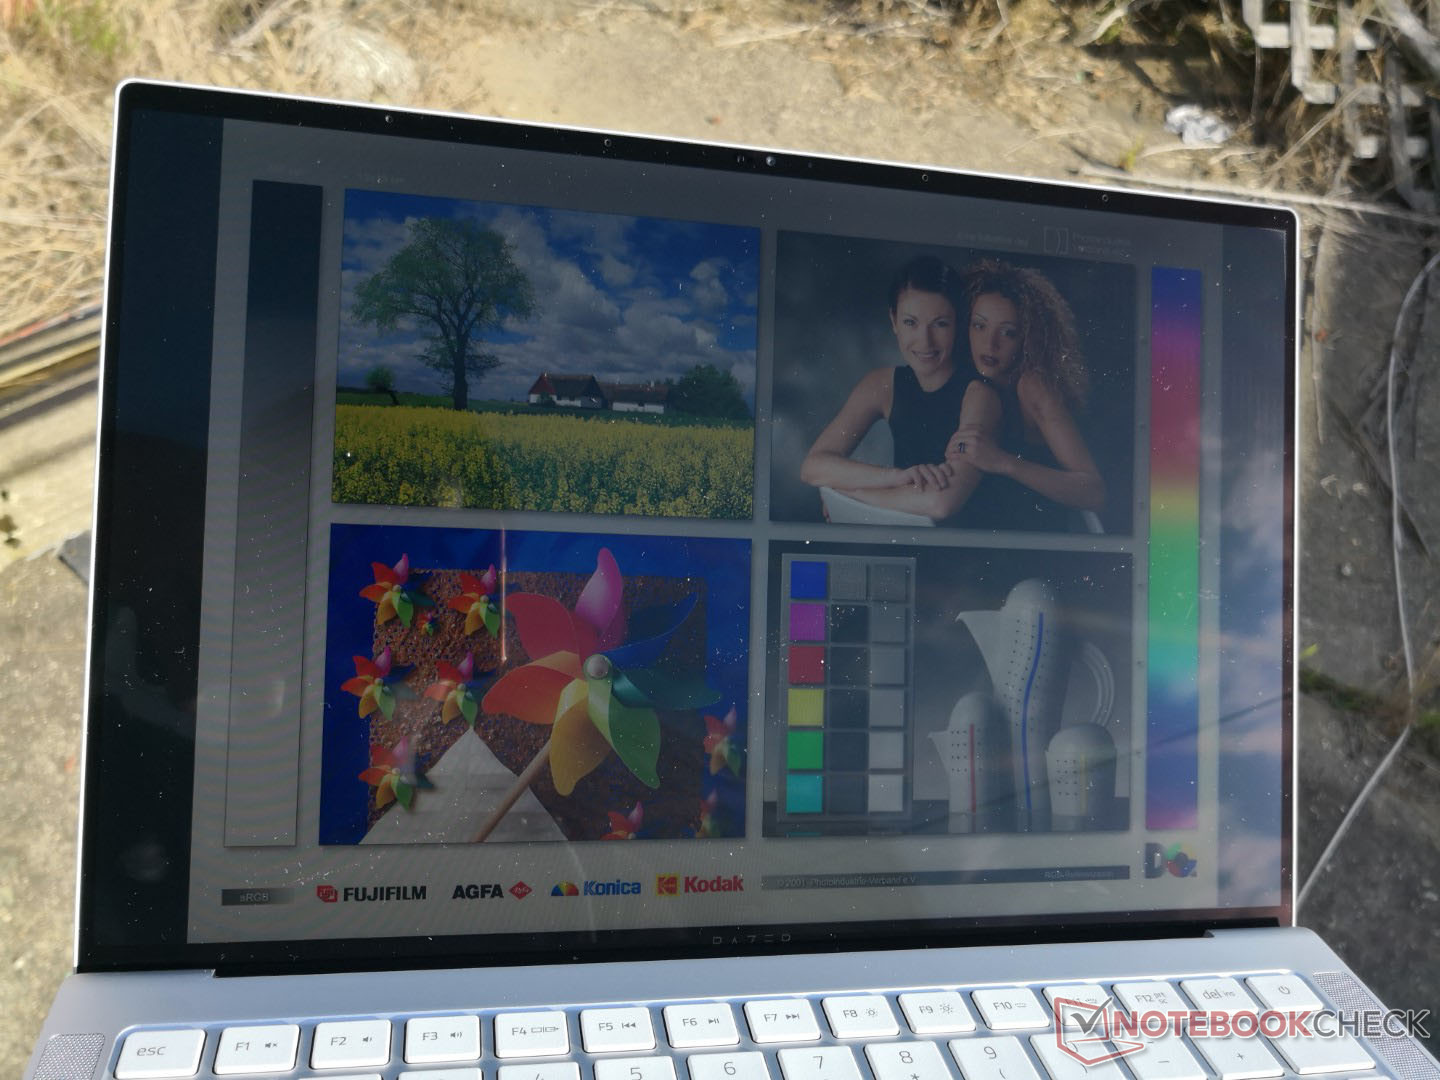
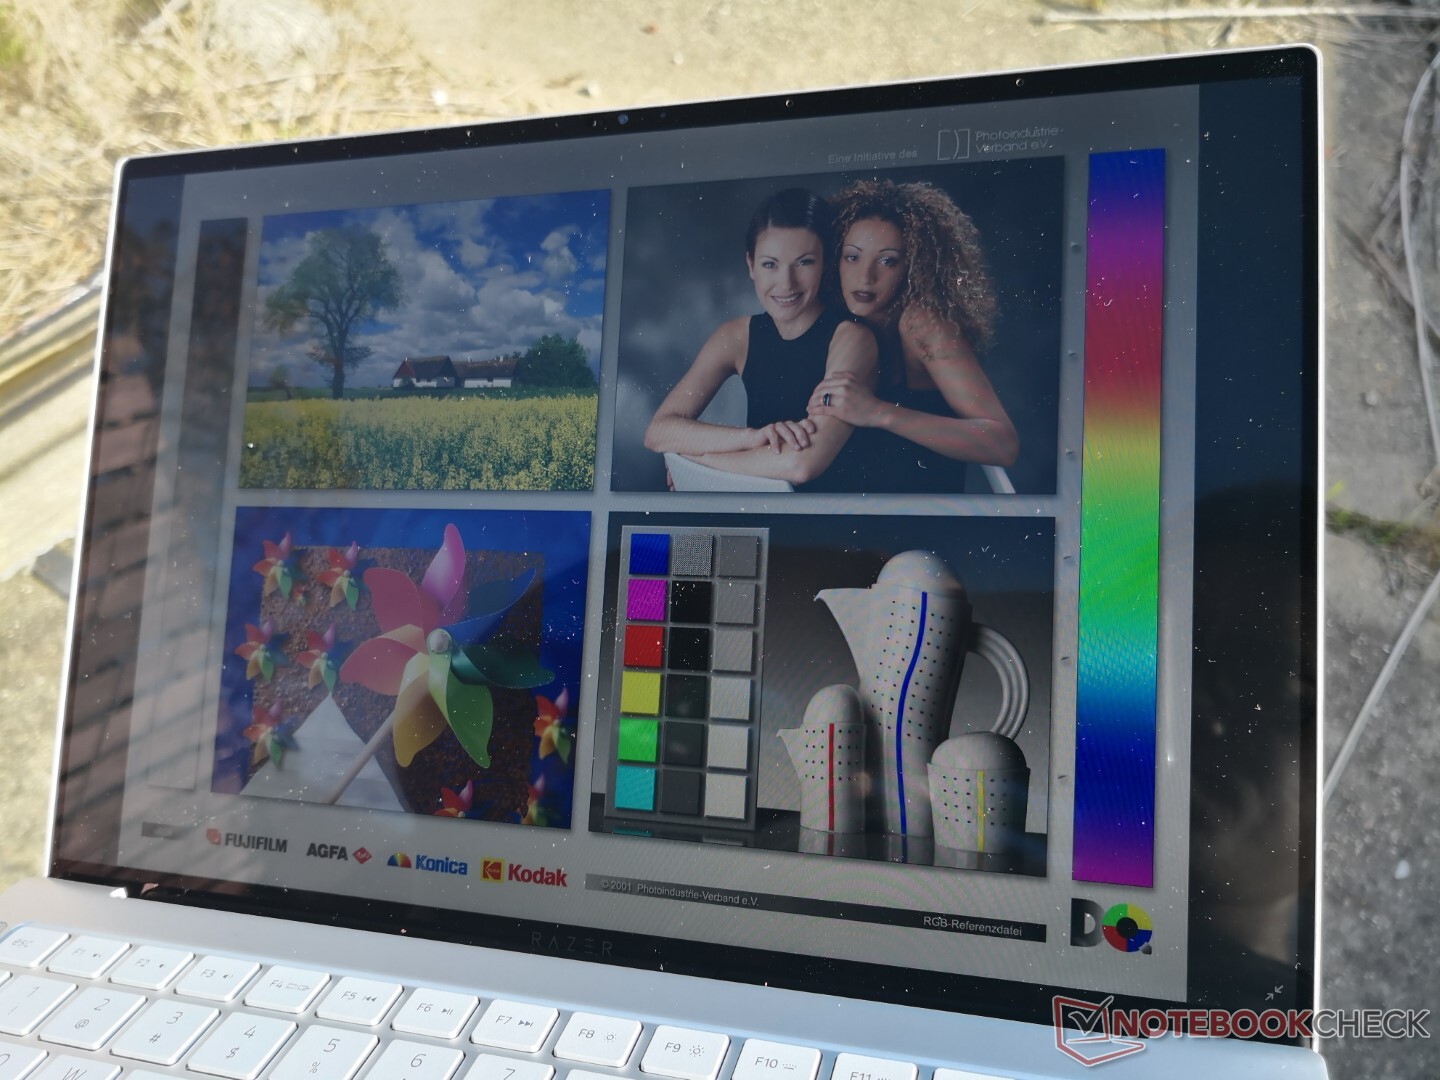
Die Lesbarkeit im Freien ist durch die leicht höhere Helligkeit etwas besser als beim Blade Stealth. Andererseits wird dieser Faktor durch die spiegelnde Touchscreenoberfläche wieder negiert. Die preiswerteren Modelle mit mattem Display könnten in dieser Hinsicht besser geeignet sein.
Leistung
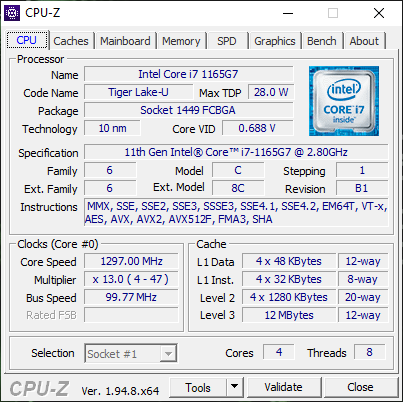
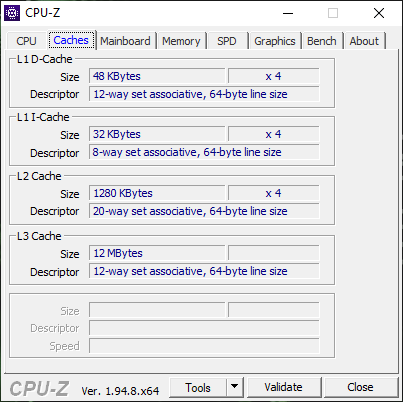
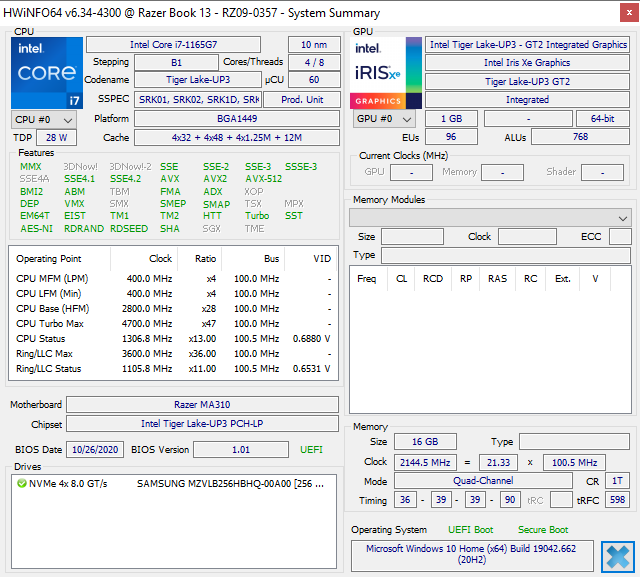
Das Book 13 ist mit einem Intel Tiger Lake (Gen 11) Core i7-1165G7 ausgestattet, alternativ kann, zum ersten Mal auf einem Razer-Laptop, auch ein schwächerer Core i5 gewählt werden. Der i7-1185G7 oder Iris-Xe-Max sind nicht verfügbar, hätten den Laptop aber noch schneller gemacht.
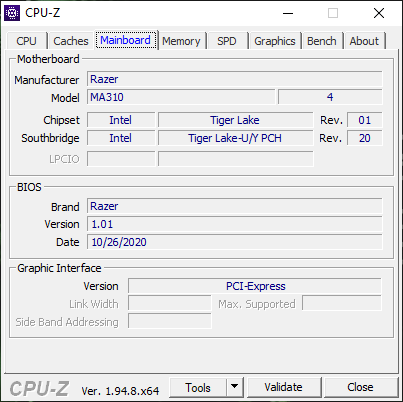
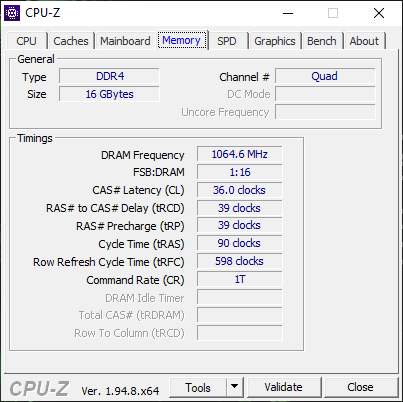
Bis zu 16 GB RAM sind fest verlötet und takten bei 4.267 MHz. Sowohl CPU-Z als auch HWiNFO führen Quad-Channel-Speicher auf, während Razer selbst nur von Dual-Channel auf der Webseite spricht. Sobald uns Razer antwortet, werden wir diesen Punkt noch anführen.
Via Razer Synapse versetzen wir den Laptop in den Performancemodus bevor wir unsere Benchmarks durchführen. Da viele wichtigen Systemoptionen hier zu finden sind, empfehlen wir sich mit Synapse auseinanderzusetzen.
Prozessor
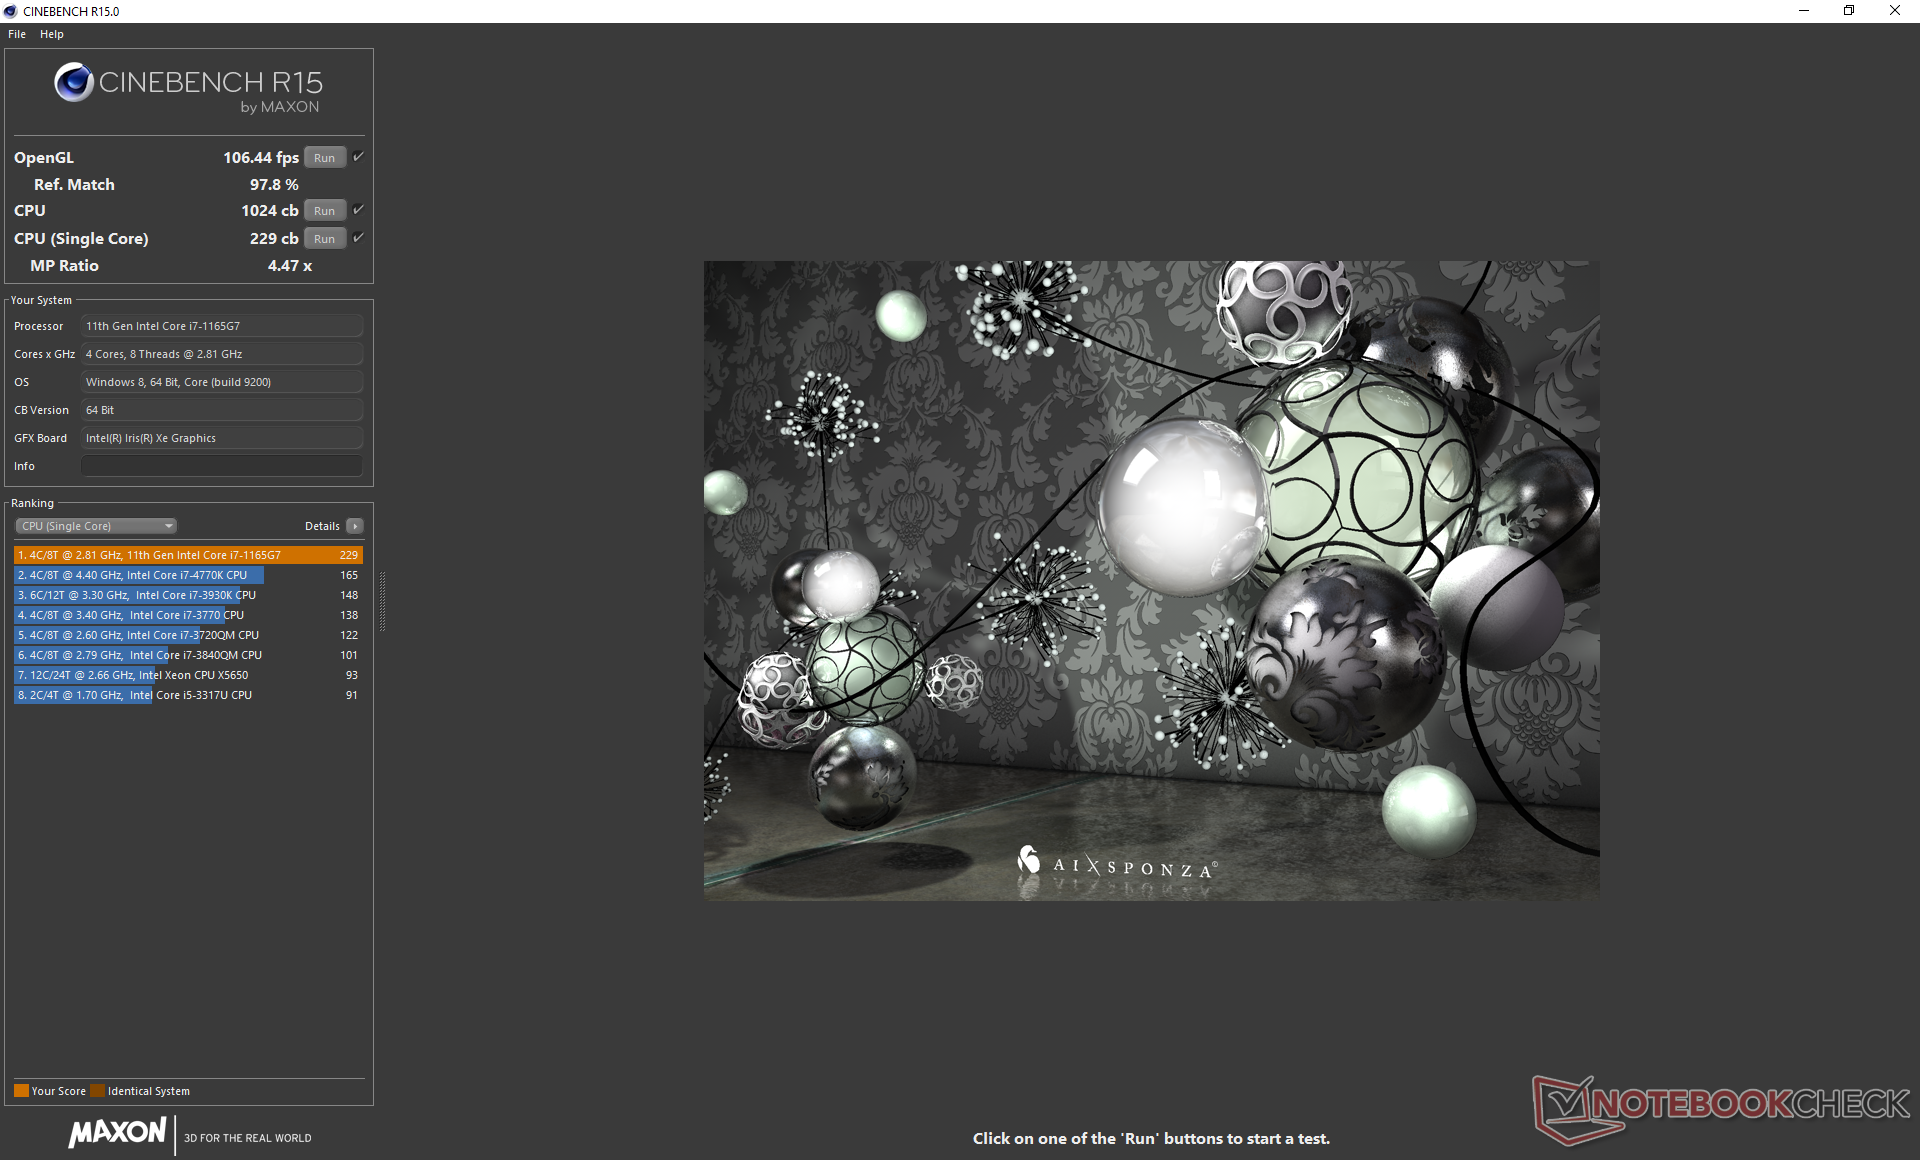
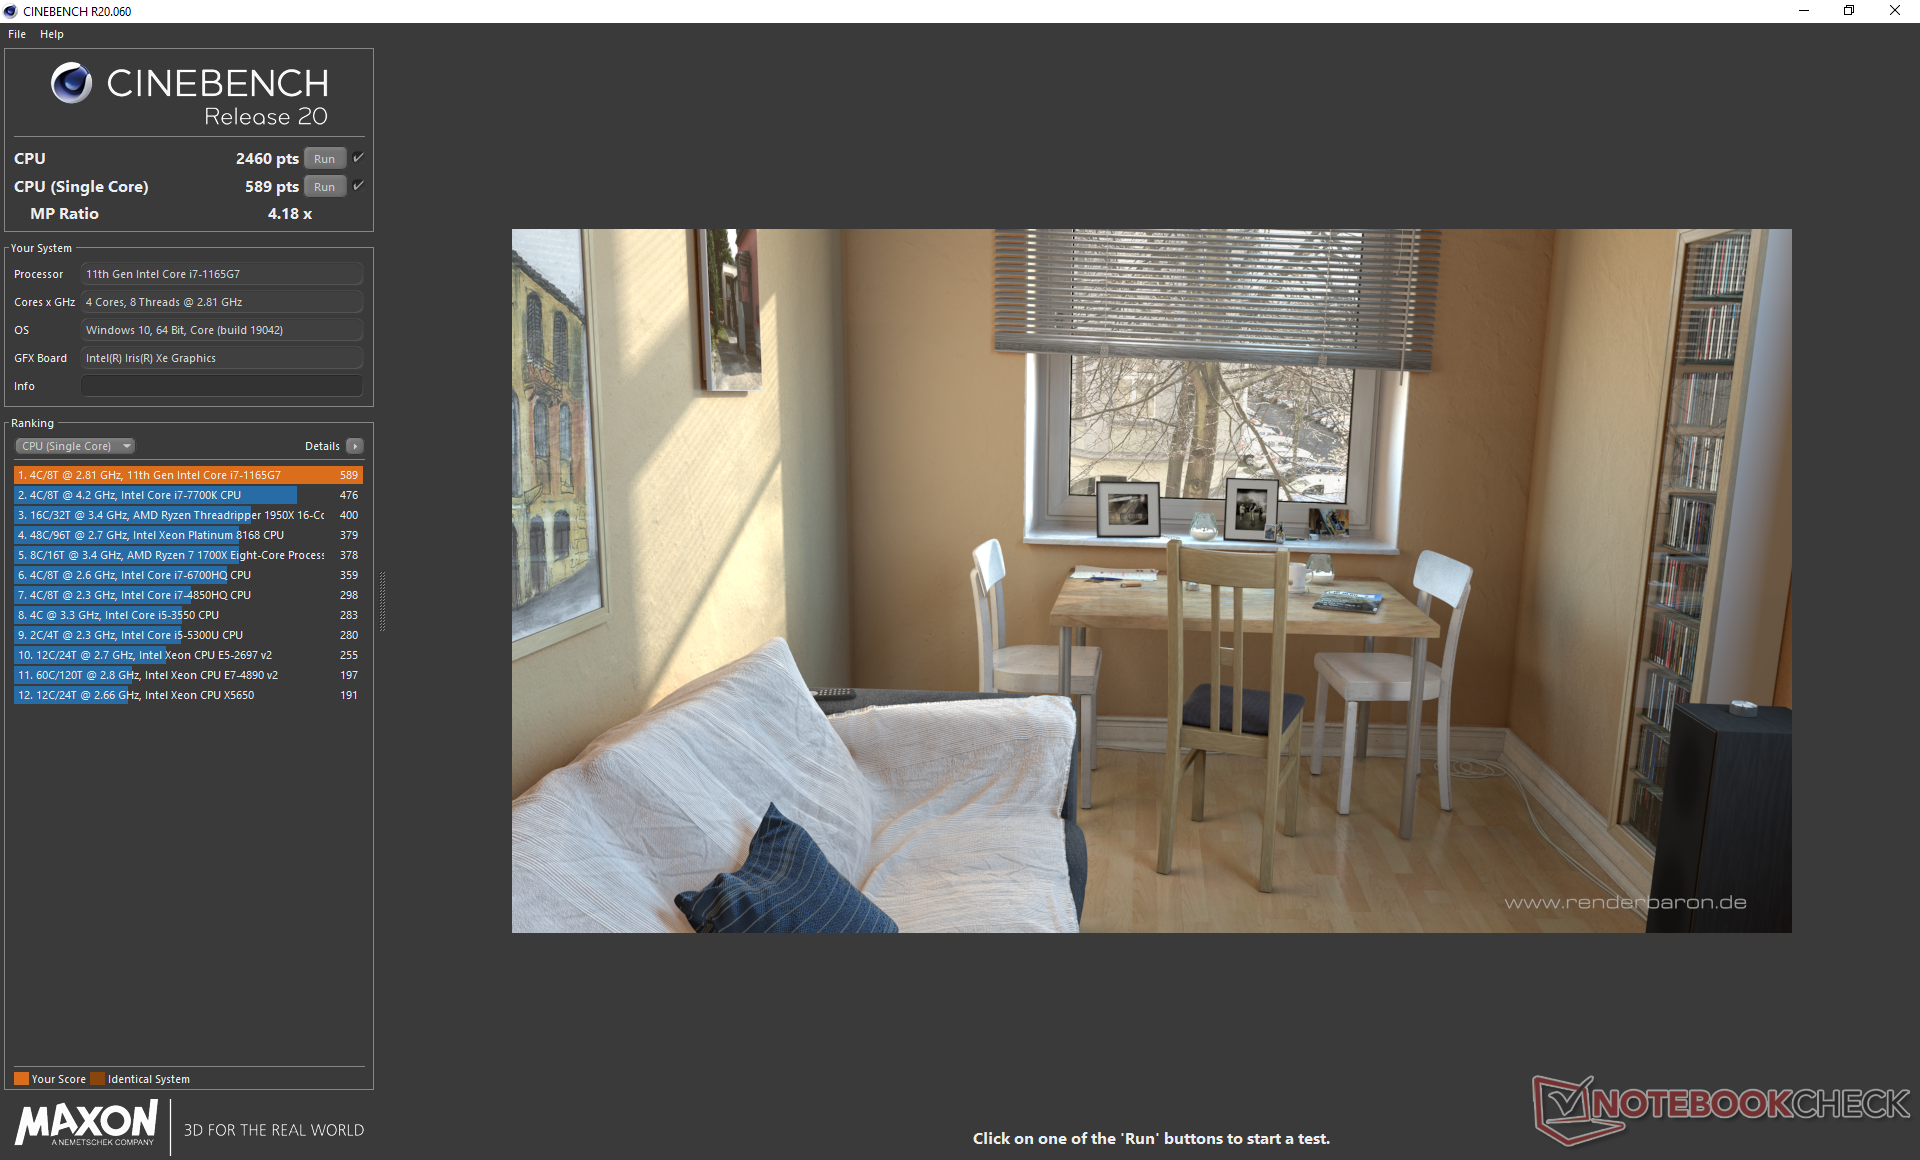
Die Multi-Thread-Leistung ist etwa 20 Prozent höher als der durchschnittliche Core i7-1165G7 in unserer Datenbank und übertrifft sogar den Core i7-1185G7 im MSI Prestige 14 Evo. Die Schwankungen sind allerdings recht hoch, was an der bescheidenen Turbo-Boost-Konstanz des Book 13 liegt und im CineBench-R15-xT-Loop-Graph unten betrachtet werden kann. Interessanterweise kommt das aktuelle Blade Stealth mit der gleichen CPU auf schlechtere Werte als unser Book 13 (minus 10 bis 15 Prozent).
Wir schätzen, dass die schwächere Version mit Core i5-1135G7 etwa 15 bis 25 Prozent weniger Leistung bietet. Es ist wirklich schade, dass es keine AMD-Optionen wie den Ryzen 5 4500U, Ryzen 7 4700U oder Ryzen 7 4800U gibt, immerhin stellen diese ausgezeichnete Alternativen dar, ohne dass man auf Multi-Thread-Leistung verzichten muss.
Unsere Extraseite zum Core i7-1165G7 zeigt mehr technische Informationen und Benchmarkvergleiche auf.
Cinebench R15: CPU Multi 64Bit | CPU Single 64Bit
Blender: v2.79 BMW27 CPU
7-Zip 18.03: 7z b 4 -mmt1 | 7z b 4
Geekbench 5.5: Single-Core | Multi-Core
HWBOT x265 Benchmark v2.2: 4k Preset
LibreOffice : 20 Documents To PDF
R Benchmark 2.5: Overall mean
| HWBOT x265 Benchmark v2.2 / 4k Preset | |
| Lenovo Yoga Slim 7-14ARE | |
| Lenovo Yoga Slim 7 14ARE05 82A20008GE | |
| Razer Book 13 FHD | |
| Lenovo ThinkPad L14-20U50003GE | |
| Lenovo Yoga 9i 14ITL5 | |
| Durchschnittliche Intel Core i7-1165G7 (1.39 - 8.47, n=80) | |
| Dell XPS 13 9300 4K UHD | |
| Dell XPS 13 9310 Core i7 FHD | |
| Asus ZenBook 14 UX434FL-DB77 | |
| Microsoft Surface Laptop 3 13 Core i5-1035G7 | |
| HP Elite Dragonfly-8MK79EA | |
| R Benchmark 2.5 / Overall mean | |
| Asus ZenBook 14 UX434FL-DB77 | |
| Apple MacBook Air 2020 M1 Entry | |
| Dell XPS 13 9300 4K UHD | |
| Lenovo ThinkPad L14-20U50003GE | |
| Lenovo Yoga 9i 14ITL5 | |
| Lenovo Yoga Slim 7 14ARE05 82A20008GE | |
| Lenovo Yoga Slim 7-14ARE | |
| Durchschnittliche Intel Core i7-1165G7 (0.552 - 1.002, n=80) | |
| Dell XPS 13 9310 Core i7 FHD | |
| Razer Book 13 FHD | |
Cinebench R15: CPU Multi 64Bit | CPU Single 64Bit
Blender: v2.79 BMW27 CPU
7-Zip 18.03: 7z b 4 -mmt1 | 7z b 4
Geekbench 5.5: Single-Core | Multi-Core
HWBOT x265 Benchmark v2.2: 4k Preset
LibreOffice : 20 Documents To PDF
R Benchmark 2.5: Overall mean
* ... kleinere Werte sind besser
Systemleistung
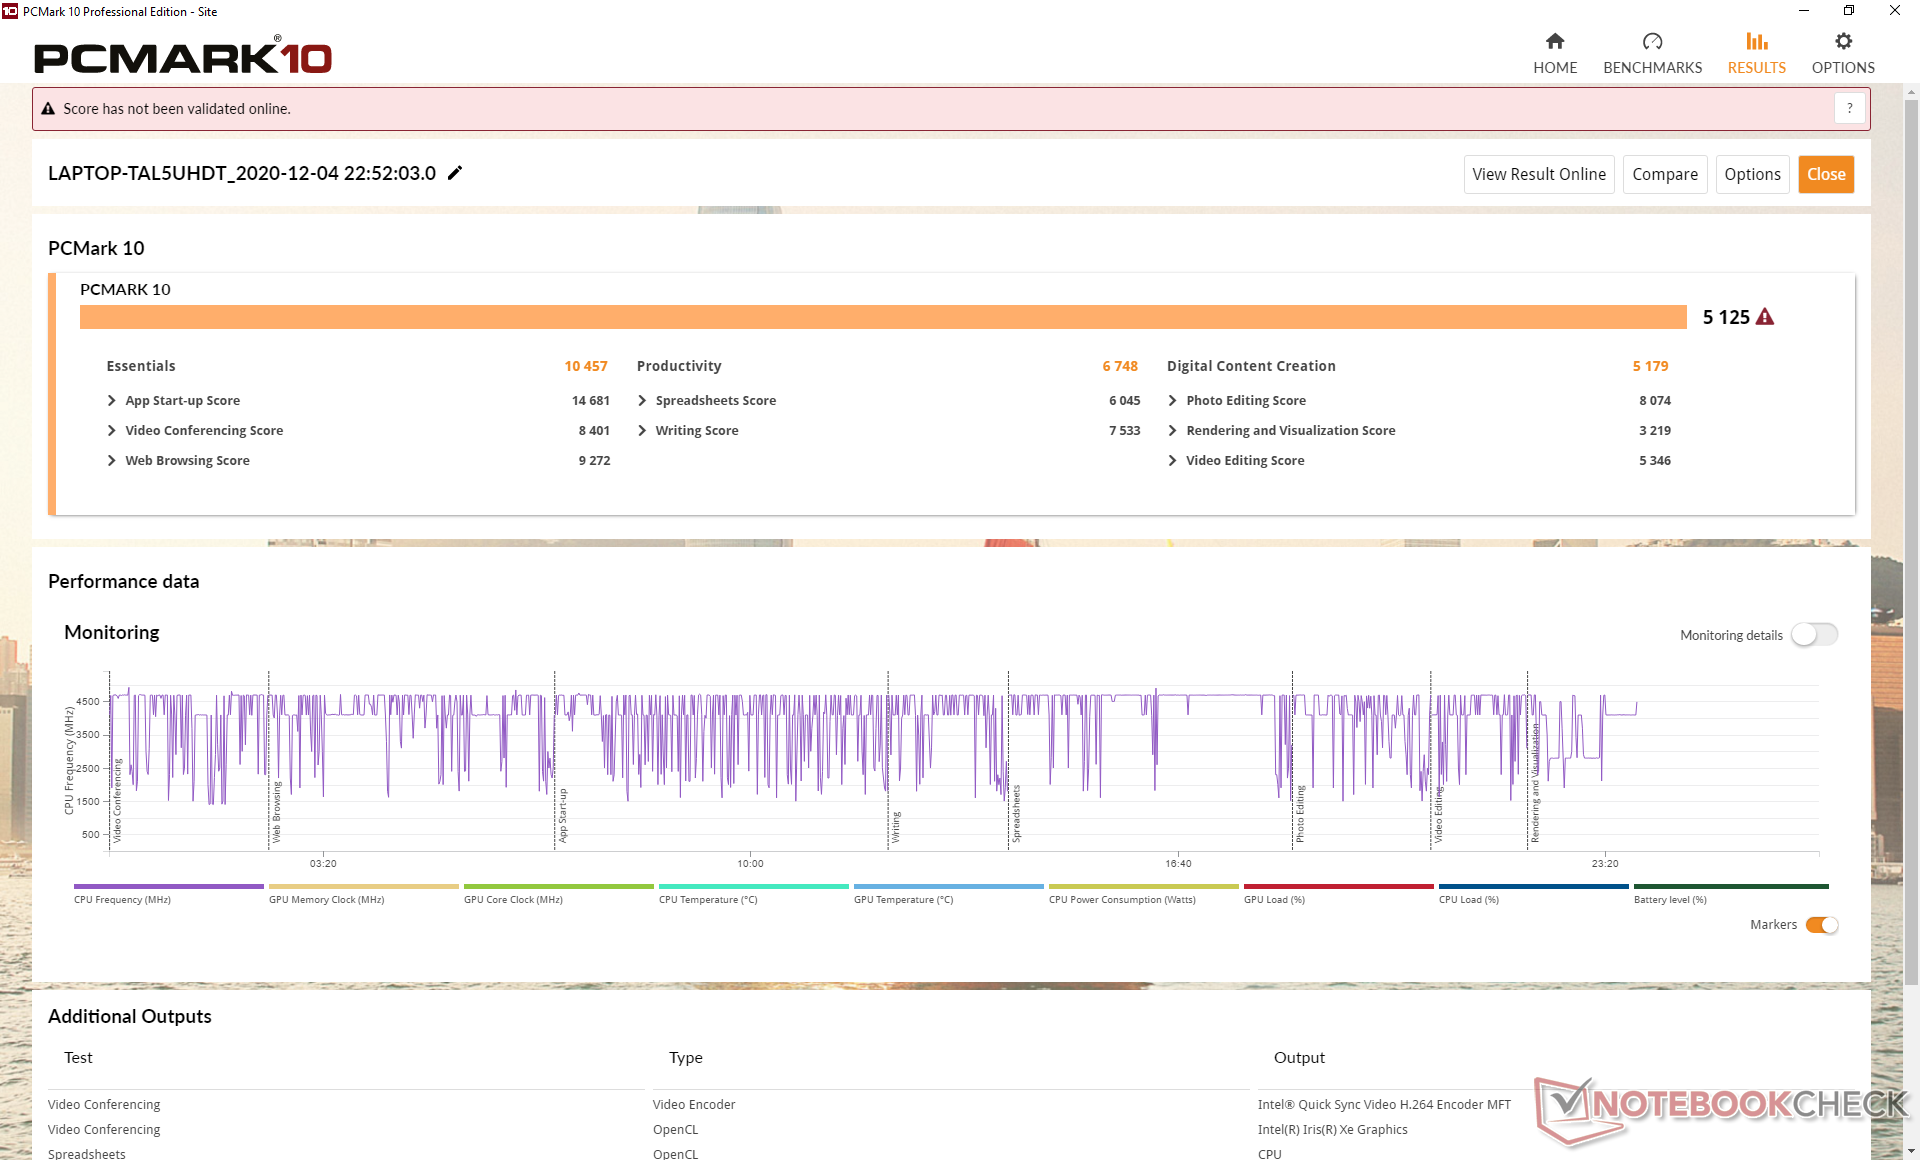
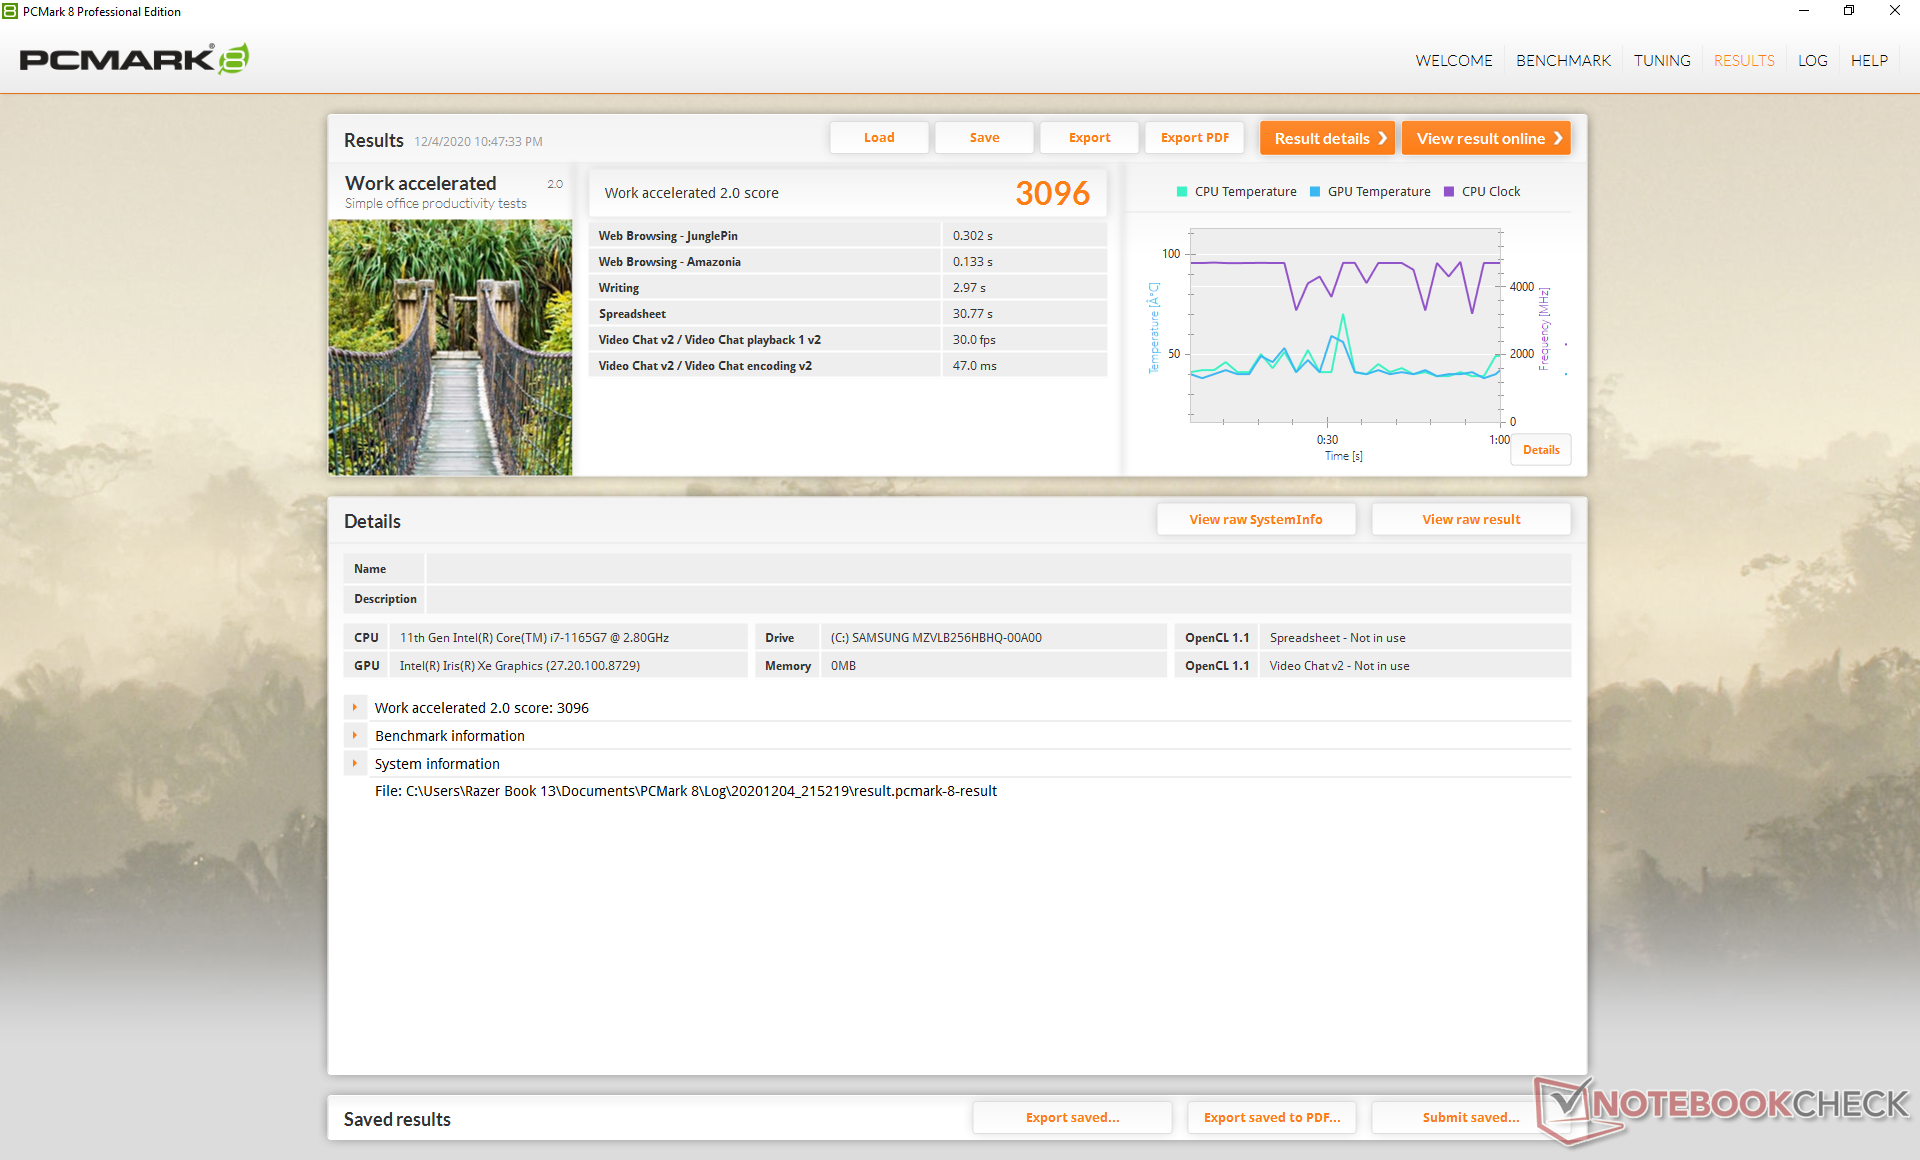
Die PCMark-Ergebnisse liegen leicht höher als beim durchschnittlichen Laptop mit der gleichen CPU und übertreffen die des XPS 13 9310 um wenige Prozentpunkte. Uns sind keine Probleme während des Tests aufgefallen, mit Ausnahme des Razer-Synapse-Bugs, bei dem die App jedes Mal einfriert, wenn sie nach dem Bootvorgang vom Internet getrennt wird.
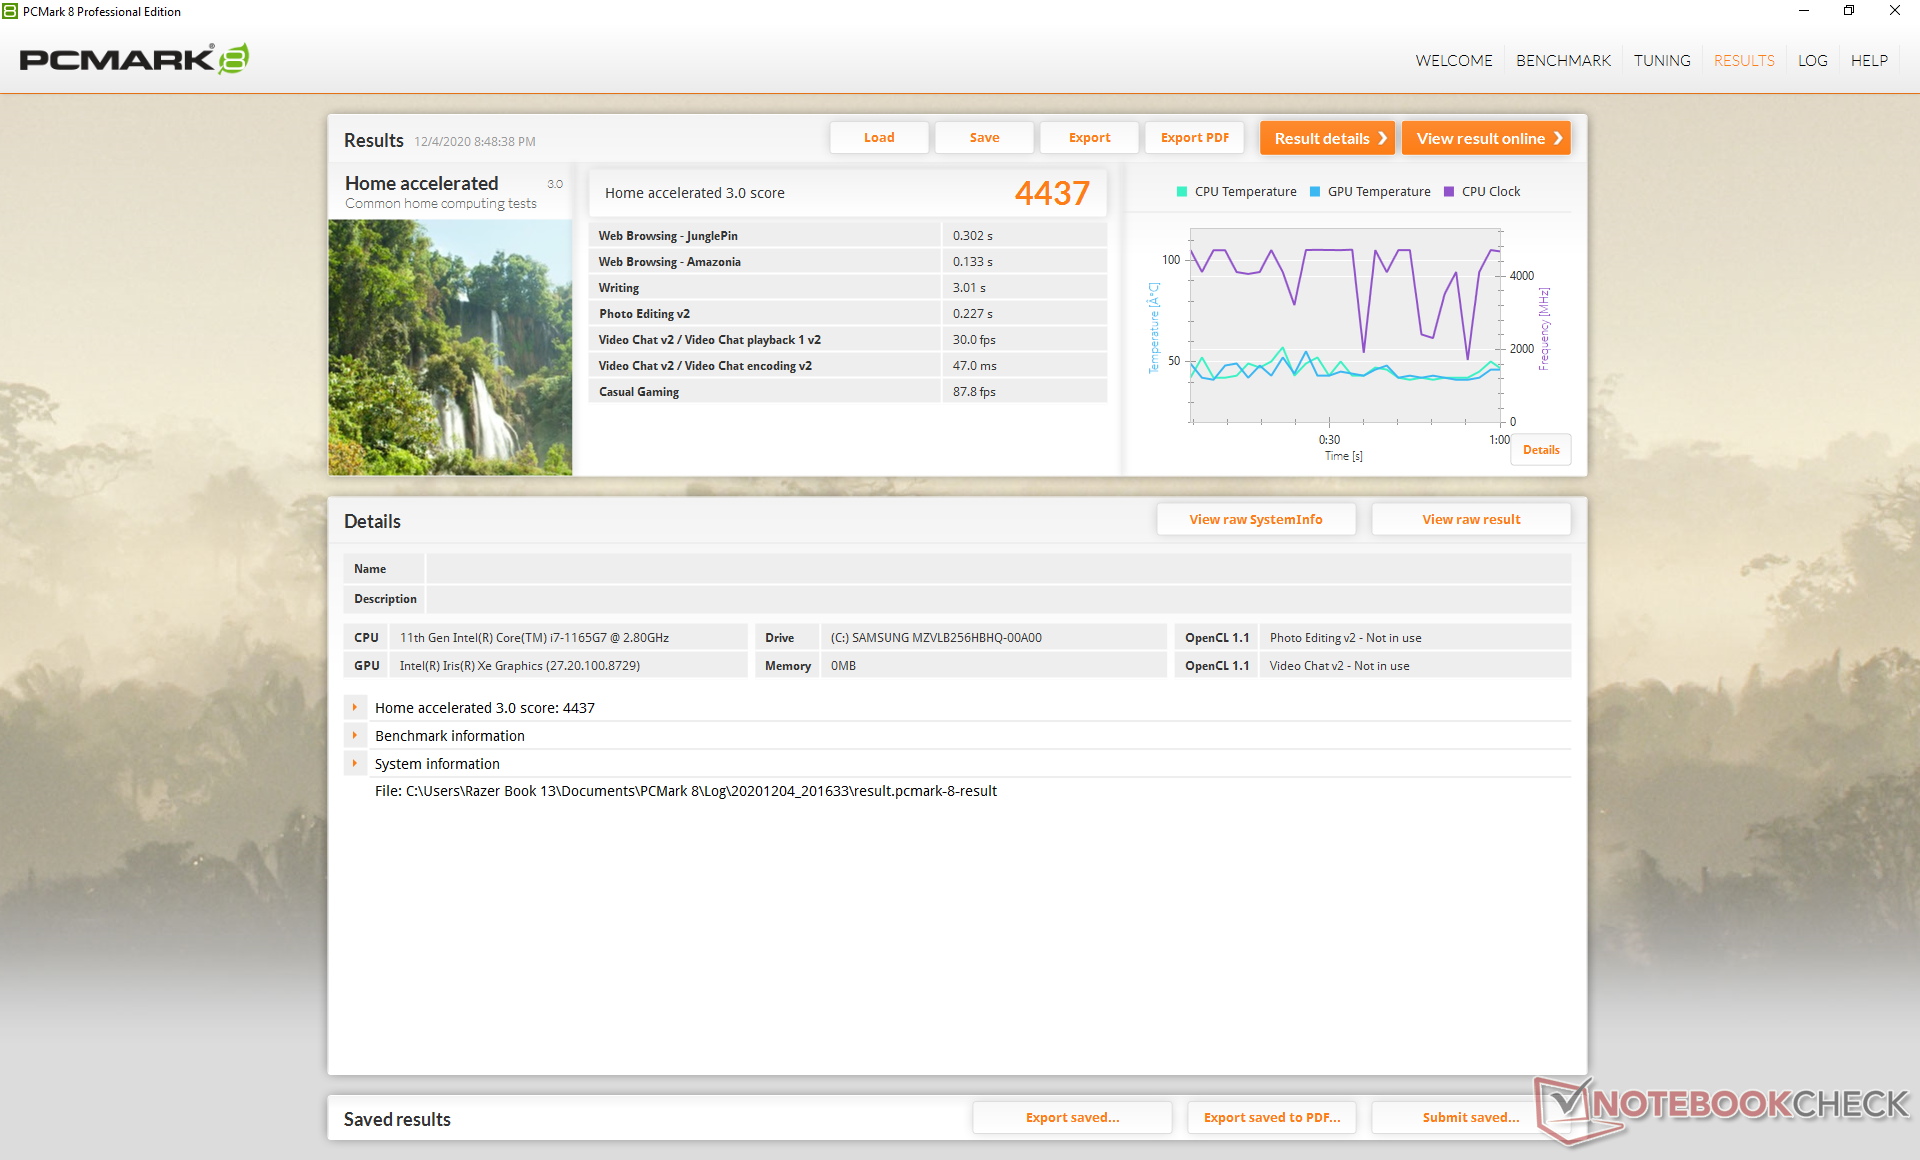
| PCMark 8 Home Score Accelerated v2 | 4437 Punkte | |
| PCMark 8 Work Score Accelerated v2 | 3096 Punkte | |
| PCMark 10 Score | 5125 Punkte | |
Hilfe | ||
DPC Latenz
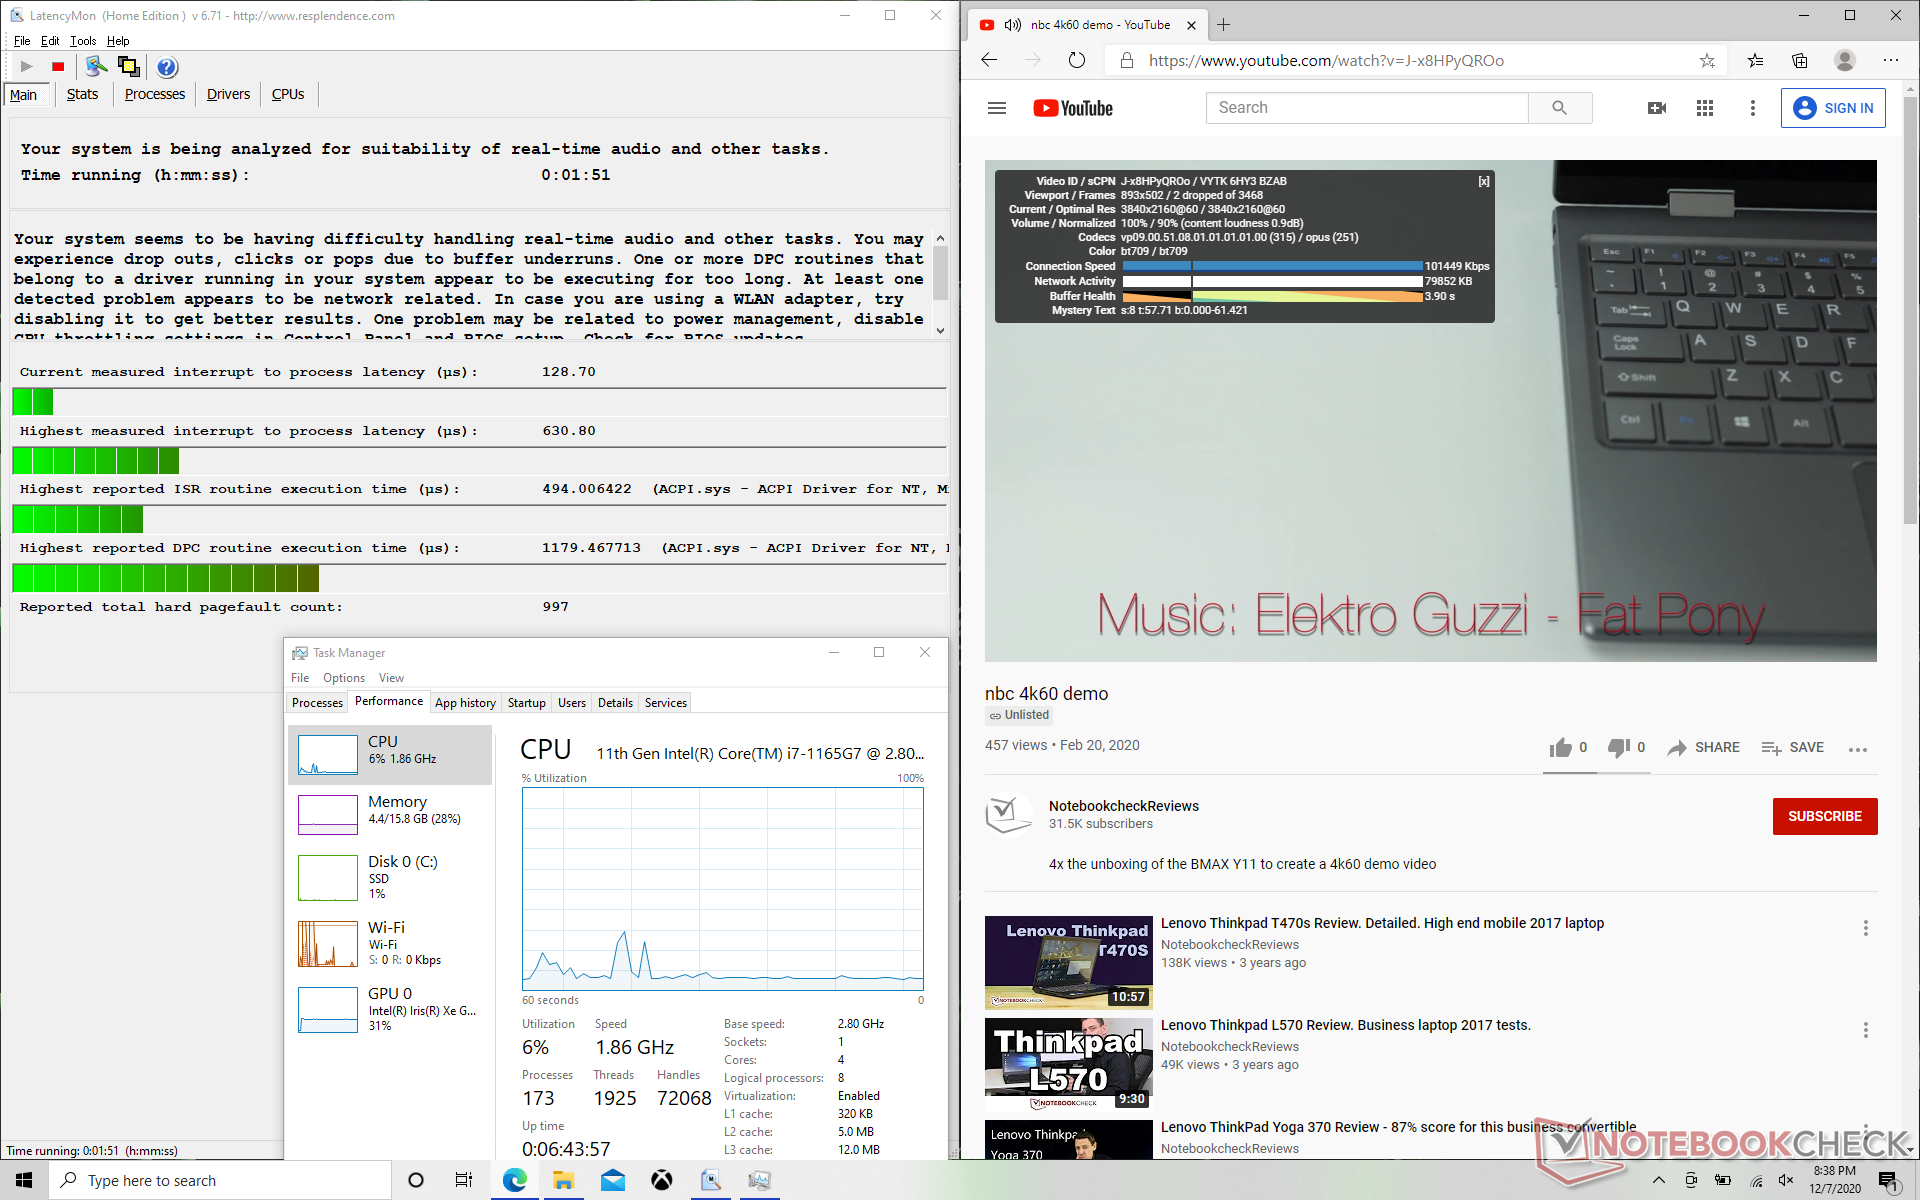
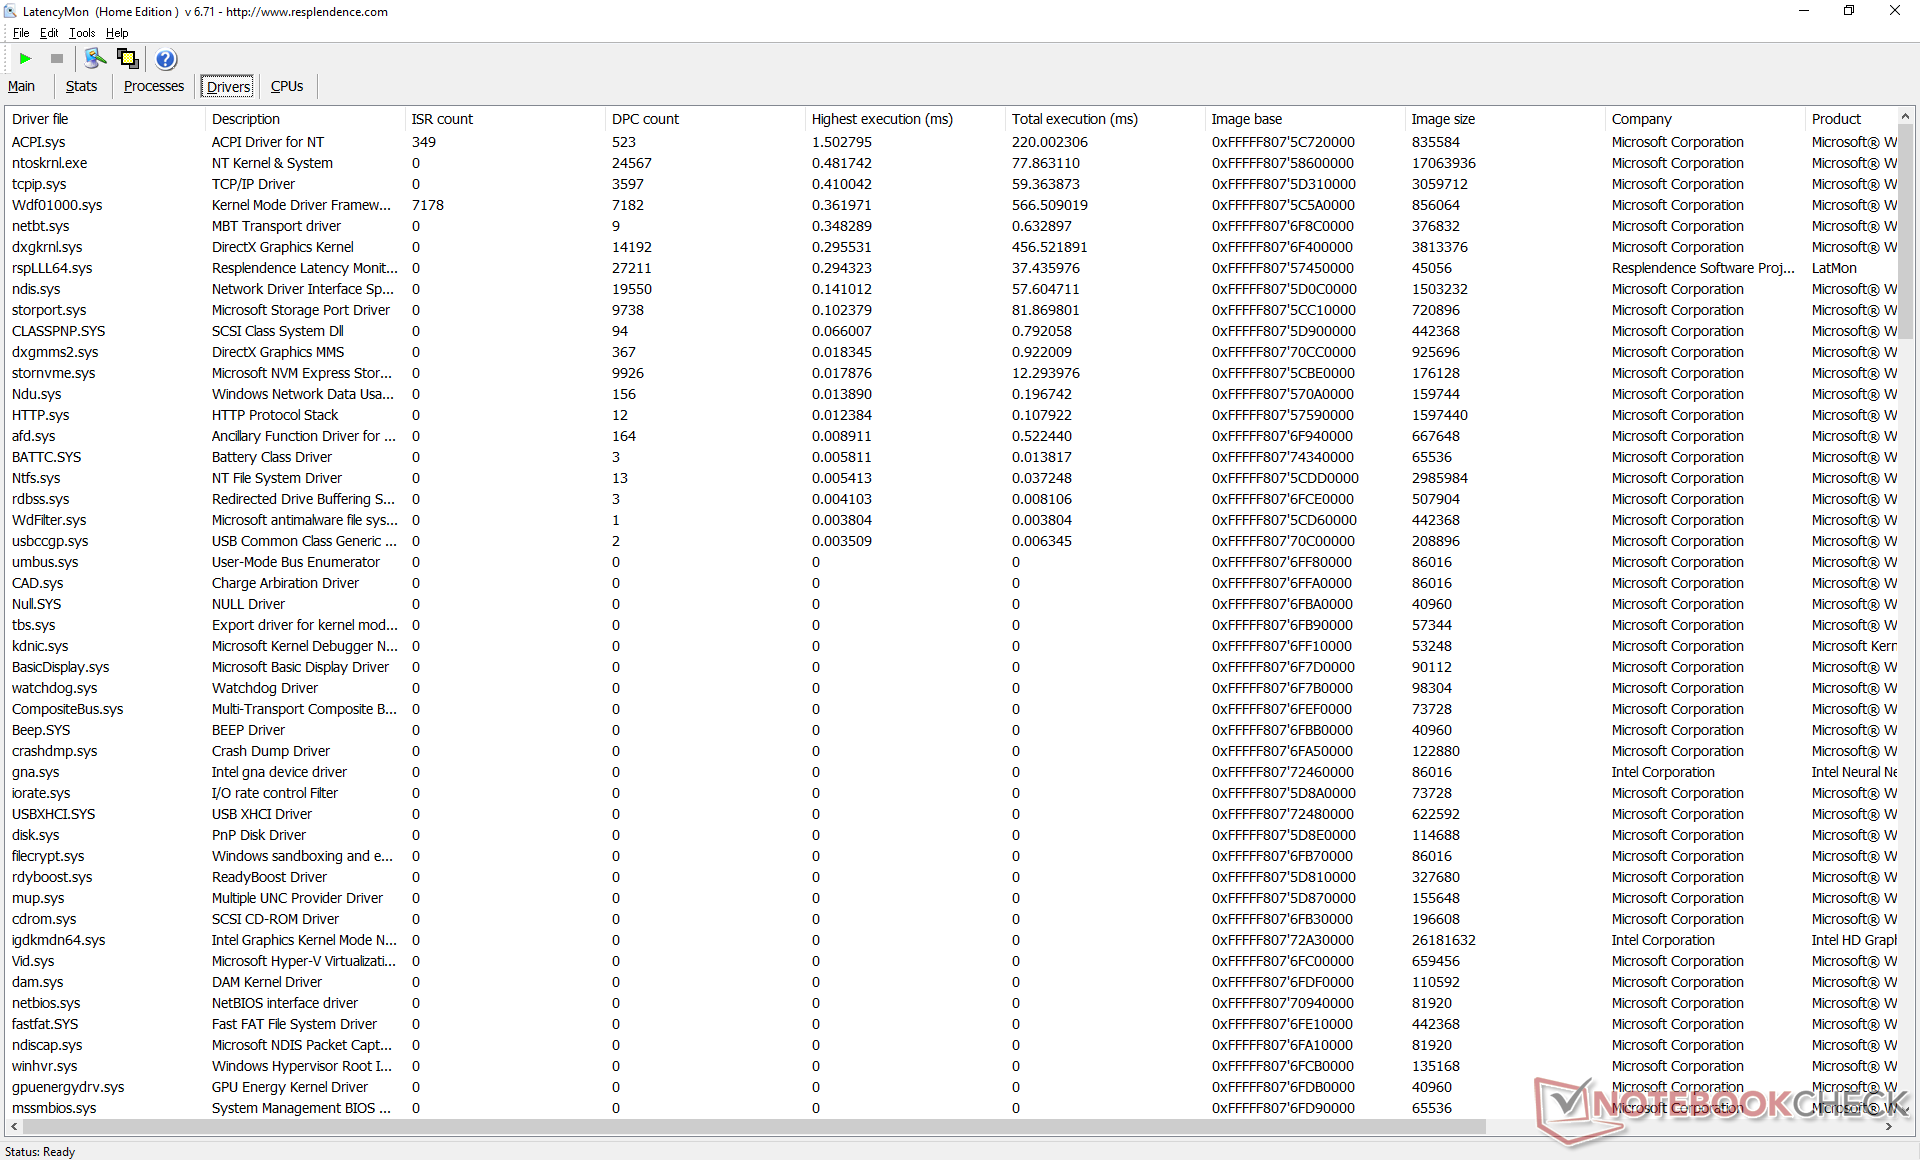
| DPC Latencies / LatencyMon - interrupt to process latency (max), Web, Youtube, Prime95 | |
| Razer Blade Stealth Core i7 GTX 1650 Ti Max-Q 4K | |
| Dell XPS 13 9300 4K UHD | |
| Asus Zenbook S UX393JA | |
| Asus ZenBook 14 UX434FL-DB77 | |
| Razer Book 13 FHD | |
| Lenovo ThinkPad L14-20U50003GE | |
| Razer Blade Stealth i7-1165G7 GTX 1650 Ti Max-Q | |
| Asus ZenBook 14 UX425EA | |
| Dell XPS 13 9310 Core i7 FHD | |
| Lenovo Yoga Slim 7 14ARE05 82A20008GE | |
* ... kleinere Werte sind besser
Massenspeicher
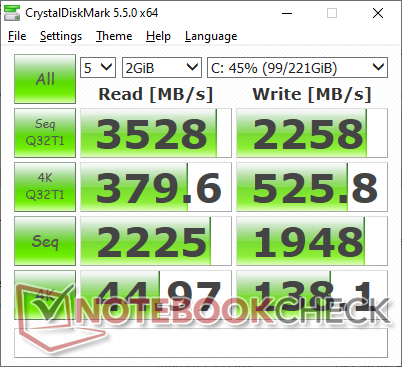
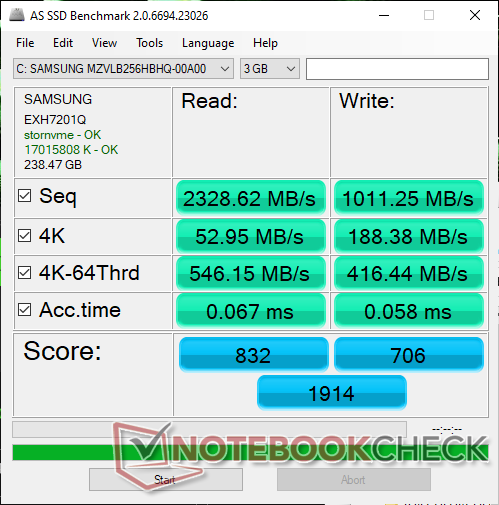
Die meisten Razer-Laptops werden mit Samsung-SSDs ausgeliefert, nur einige wenige Modelle kommen stattdessen mit einer langsameren Lite-On-SSD. In unserem Testmodell ist eine Samsung PM981a verbaut, welche gegenüber Intel 660p und ähnlichen Mittelklassemodellen eine wesentlich höhere Leistung aufweist.
| Razer Book 13 FHD Samsung SSD PM981a MZVLB256HBHQ | Dell XPS 13 9310 Core i7 FHD Micron 2300 512GB MTFDHBA512TDV | Asus Zenbook S UX393JA Intel SSD 660p 1TB SSDPEKNW010T8 | Huawei MateBook X Pro 2020 i7 Samsung PM981a MZVLB1T0HBLR | Lenovo Yoga C930-13IKB SK hynix PC401 HFS256GD9TNG | Razer Blade Stealth i7-1065G7 Iris Plus Samsung SSD PM981 MZVLB256HAHQ | |
|---|---|---|---|---|---|---|
| AS SSD | 26% | 22% | 106% | -30% | -20% | |
| Seq Read (MB/s) | 2329 | 2091 -10% | 1405 -40% | 2737 18% | 1850 -21% | 1989 -15% |
| Seq Write (MB/s) | 1011 | 1396 38% | 1062 5% | 2530 150% | 661 -35% | 827 -18% |
| 4K Read (MB/s) | 53 | 49.29 -7% | 50.8 -4% | 54 2% | 38.04 -28% | 40.12 -24% |
| 4K Write (MB/s) | 188.4 | 104.2 -45% | 124.9 -34% | 152.5 -19% | 95 -50% | 135.1 -28% |
| 4K-64 Read (MB/s) | 546 | 827 51% | 590 8% | 2011 268% | 434.3 -20% | 531 -3% |
| 4K-64 Write (MB/s) | 416.4 | 1636 293% | 840 102% | 1260 203% | 266.3 -36% | 309.9 -26% |
| Access Time Read * (ms) | 0.067 | 0.066 1% | 0.041 39% | 0.066 1% | 0.069 -3% | 0.085 -27% |
| Access Time Write * (ms) | 0.058 | 0.365 -529% | 0.118 -103% | 0.024 59% | 0.056 3% | 0.09 -55% |
| Score Read (Points) | 832 | 1086 31% | 781 -6% | 2339 181% | 657 -21% | 770 -7% |
| Score Write (Points) | 706 | 1880 166% | 1071 52% | 1666 136% | 427 -40% | 528 -25% |
| Score Total (Points) | 1914 | 3499 83% | 2251 18% | 5191 171% | 1373 -28% | 1644 -14% |
| Copy ISO MB/s (MB/s) | 1664 | 1544 -7% | 1459 -12% | 539 -68% | 1418 -15% | |
| Copy Program MB/s (MB/s) | 415.2 | 613 48% | 600 45% | 209.7 -49% | 382.7 -8% | |
| Copy Game MB/s (MB/s) | 420.2 | 1451 245% | 1411 236% | 340 -19% | 334.2 -20% | |
| CrystalDiskMark 5.2 / 6 | -4% | -20% | 8% | -38% | -5% | |
| Write 4K (MB/s) | 138.1 | 97.5 -29% | 129.5 -6% | 165.6 20% | 94.5 -32% | 176.8 28% |
| Read 4K (MB/s) | 44.97 | 50.9 13% | 54 20% | 50.2 12% | 39.95 -11% | 48.38 8% |
| Write Seq (MB/s) | 1948 | 1811 -7% | 1265 -35% | 1905 -2% | 531 -73% | 1332 -32% |
| Read Seq (MB/s) | 2225 | 1836 -17% | 1410 -37% | 1669 -25% | 1499 -33% | 1644 -26% |
| Write 4K Q32T1 (MB/s) | 526 | 521 -1% | 420.3 -20% | 474.6 -10% | 315.3 -40% | 440.6 -16% |
| Read 4K Q32T1 (MB/s) | 379.6 | 357.5 -6% | 357.7 -6% | 508 34% | 279.8 -26% | 559 47% |
| Write Seq Q32T1 (MB/s) | 2258 | 2879 28% | 1799 -20% | 3007 33% | 829 -63% | 1104 -51% |
| Read Seq Q32T1 (MB/s) | 3528 | 3204 -9% | 1616 -54% | 3556 1% | 2570 -27% | 3481 -1% |
| Write 4K Q8T8 (MB/s) | 332 | |||||
| Read 4K Q8T8 (MB/s) | 488.6 | |||||
| Durchschnitt gesamt (Programm / Settings) | 11% /
15% | 1% /
7% | 57% /
65% | -34% /
-33% | -13% /
-15% |
* ... kleinere Werte sind besser

Disk Throttling: DiskSpd Read Loop, Queue Depth 8
Grafikleistung
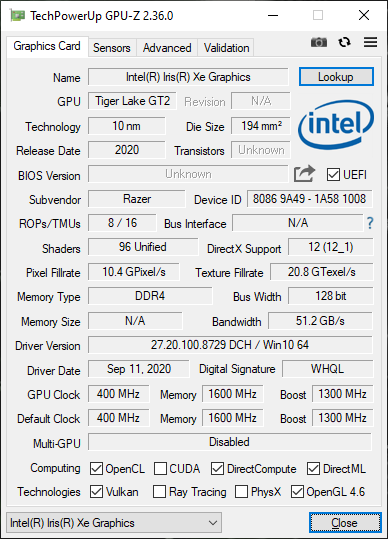
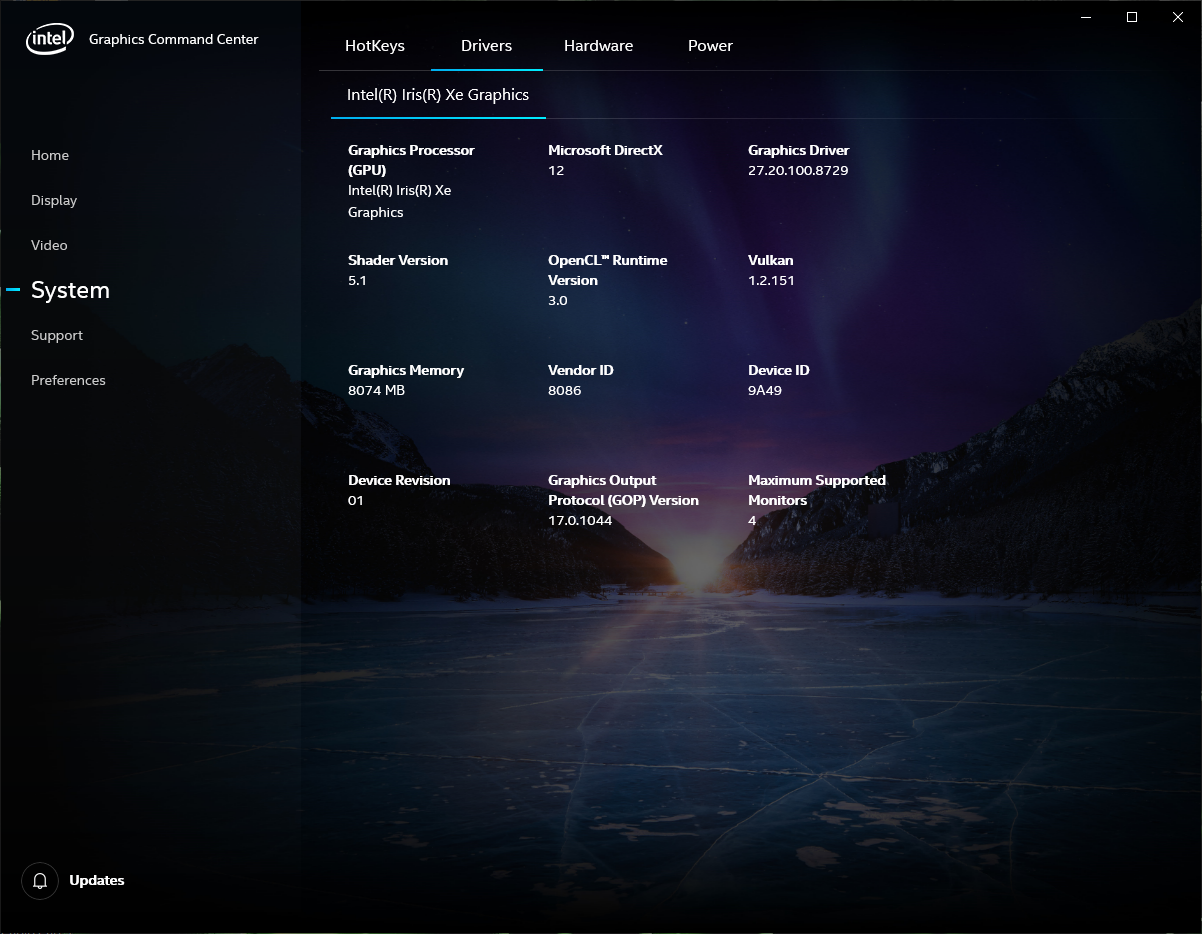
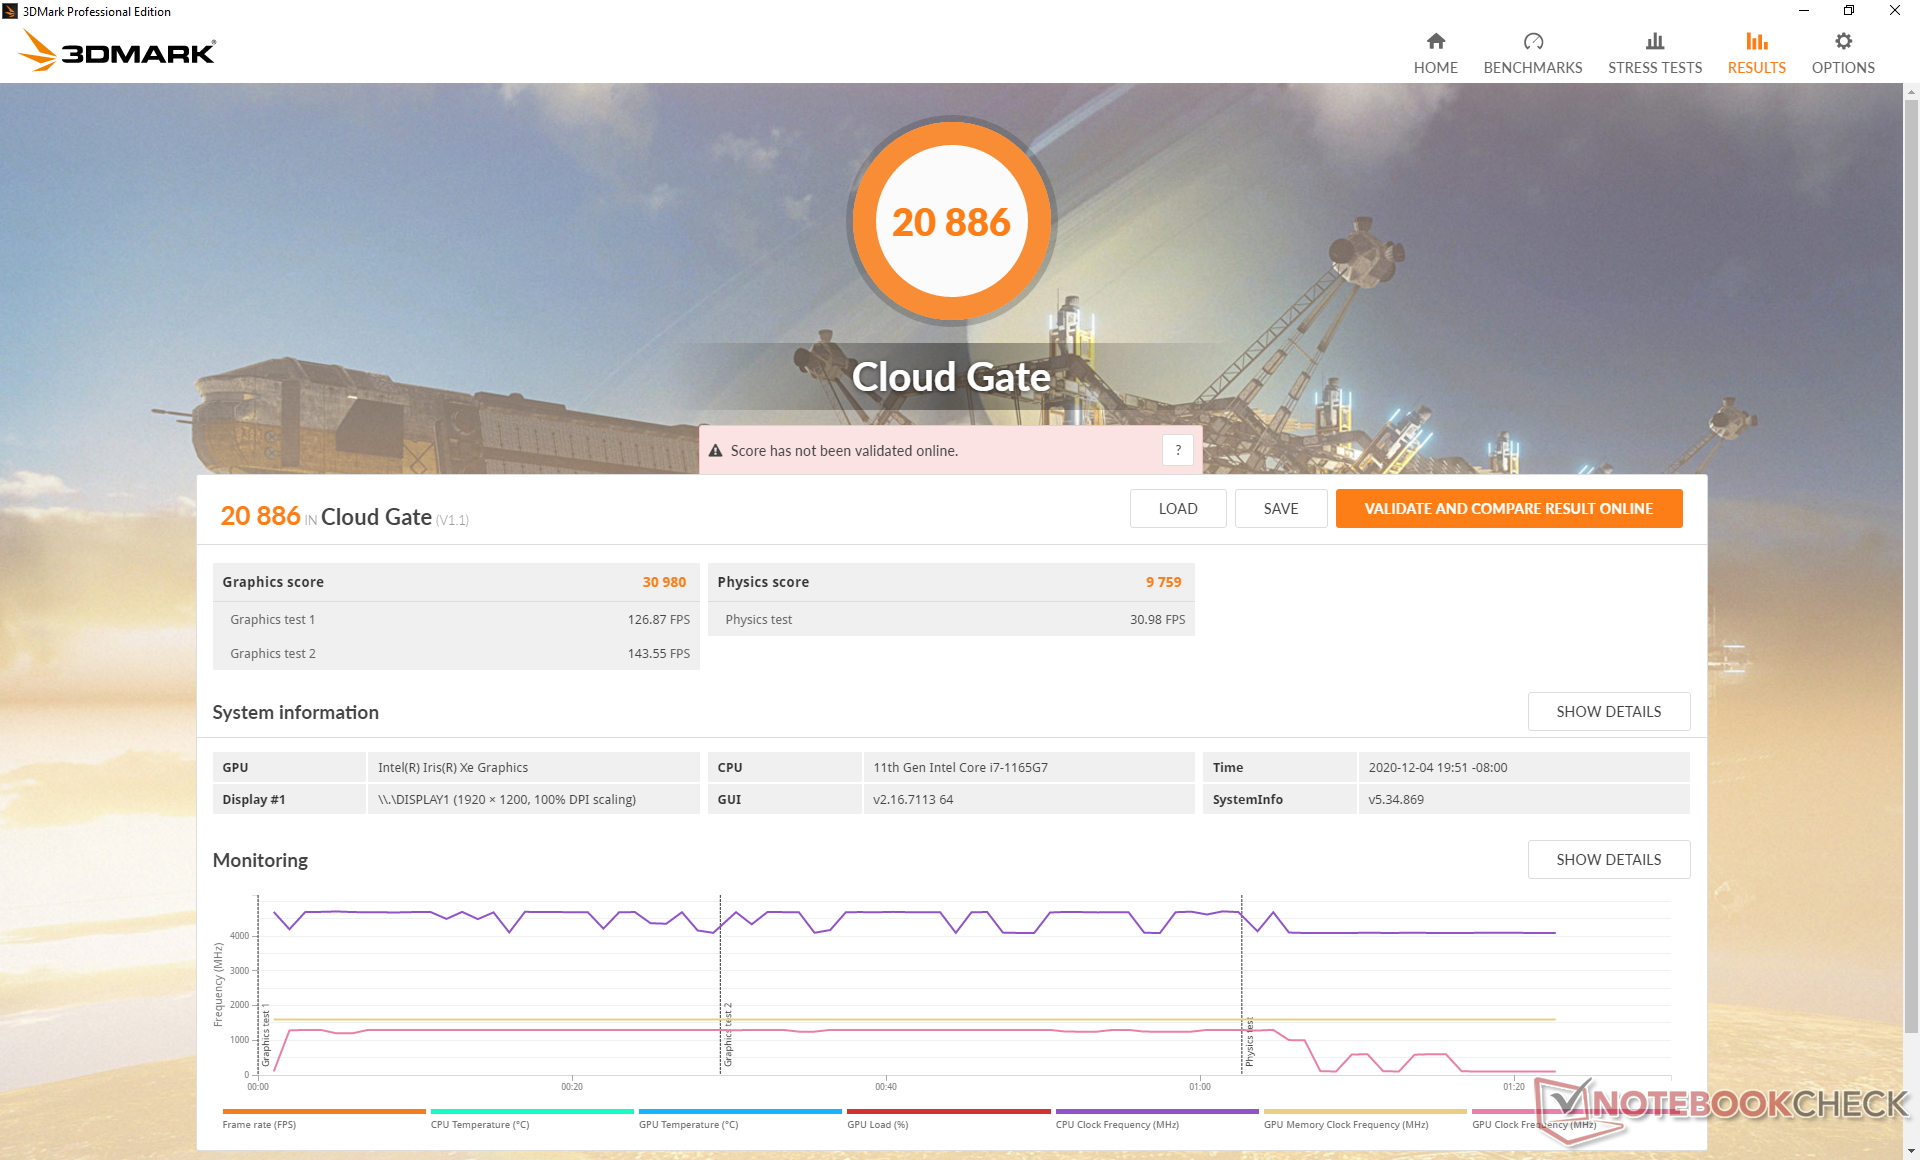
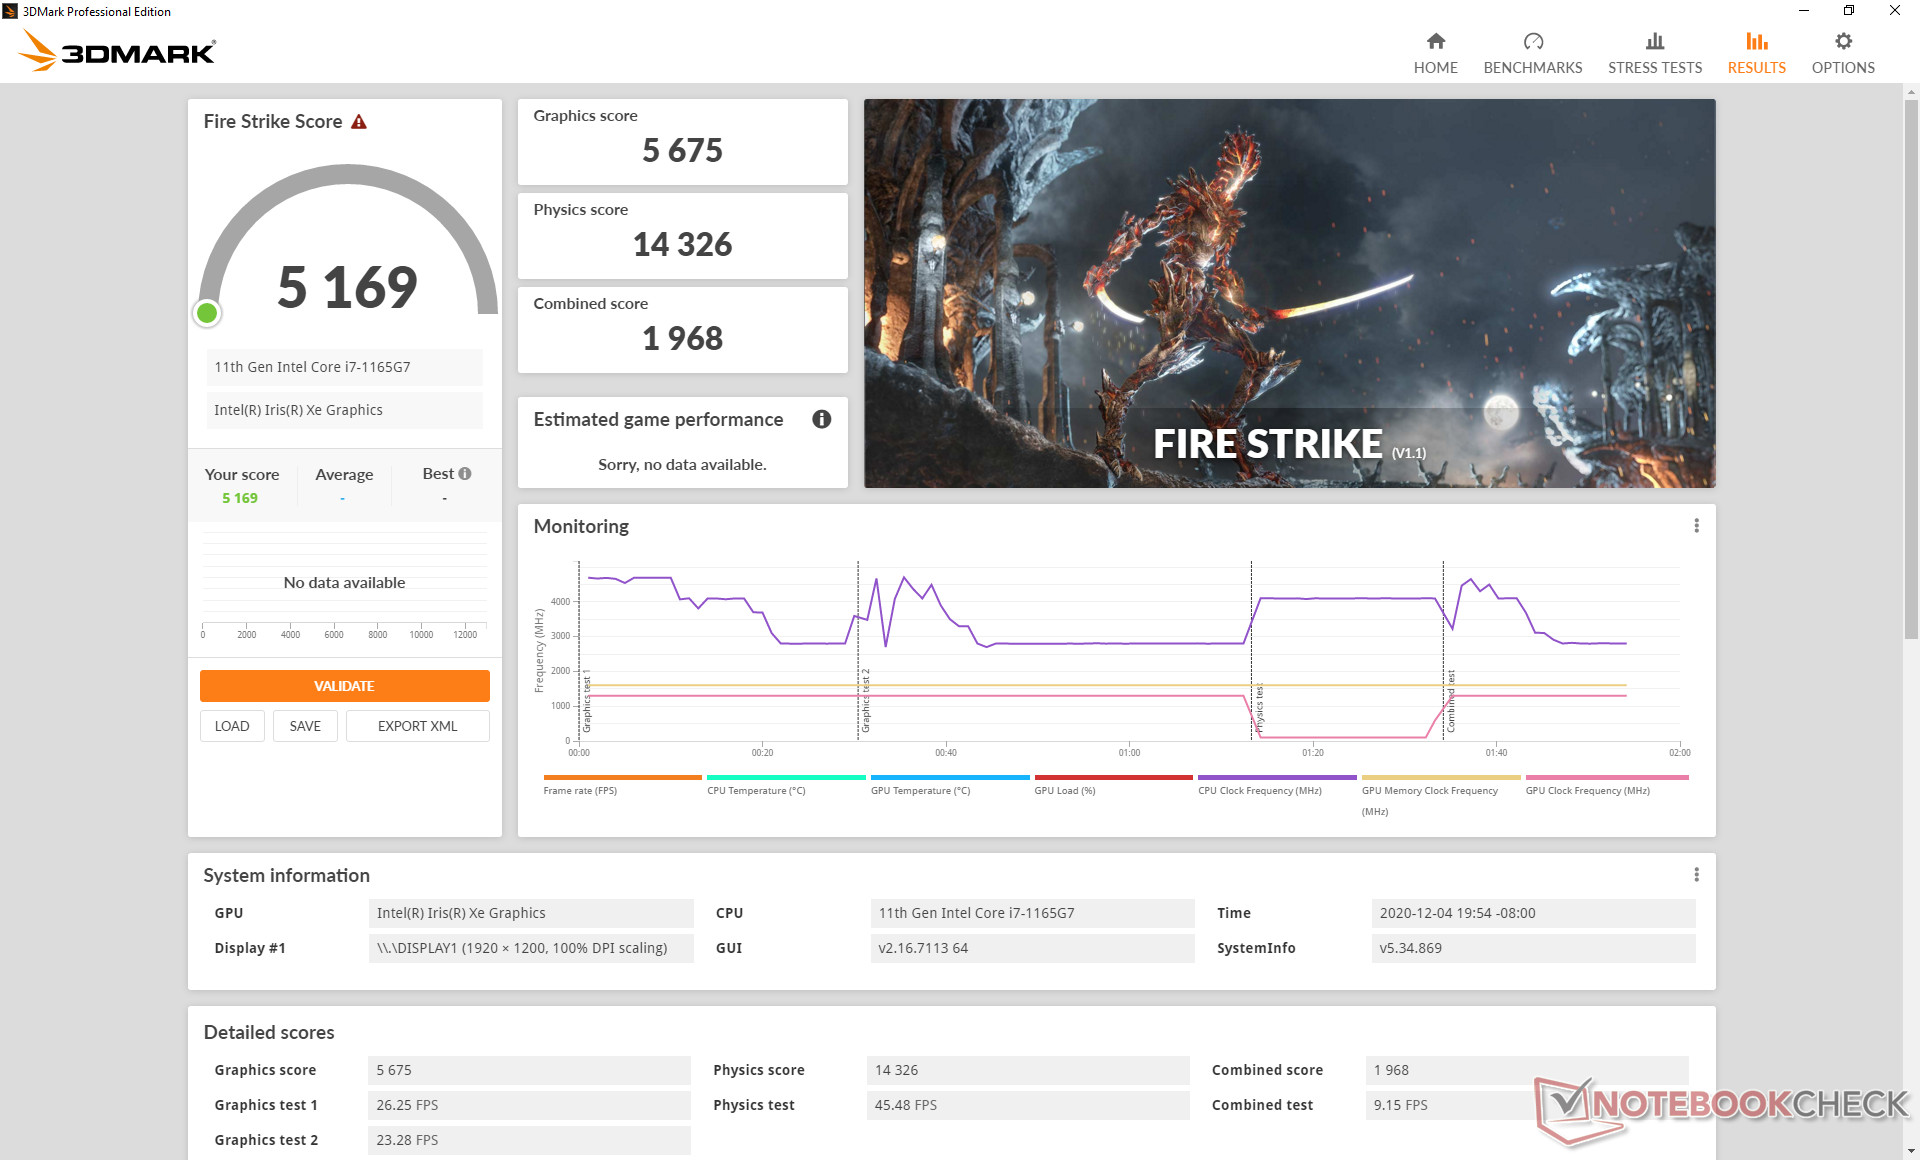
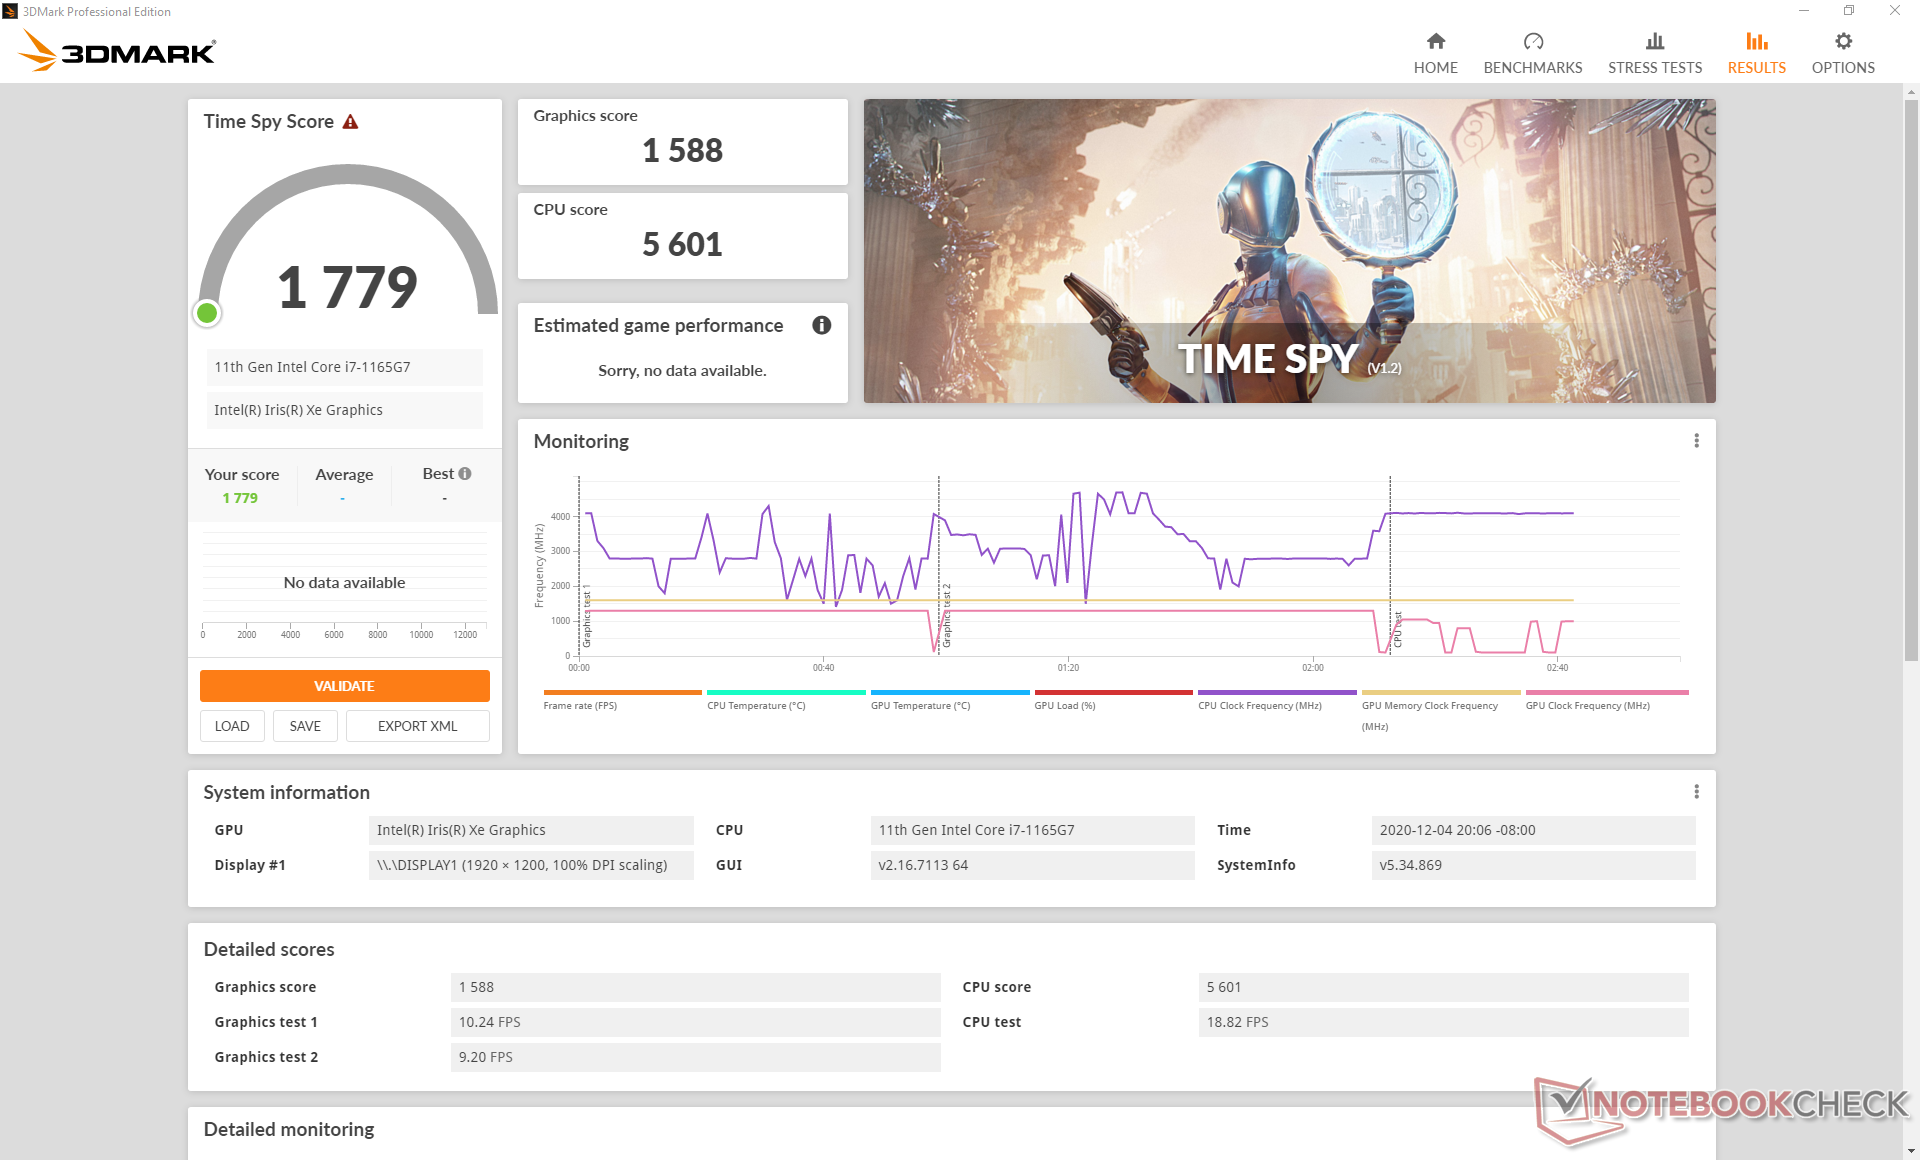
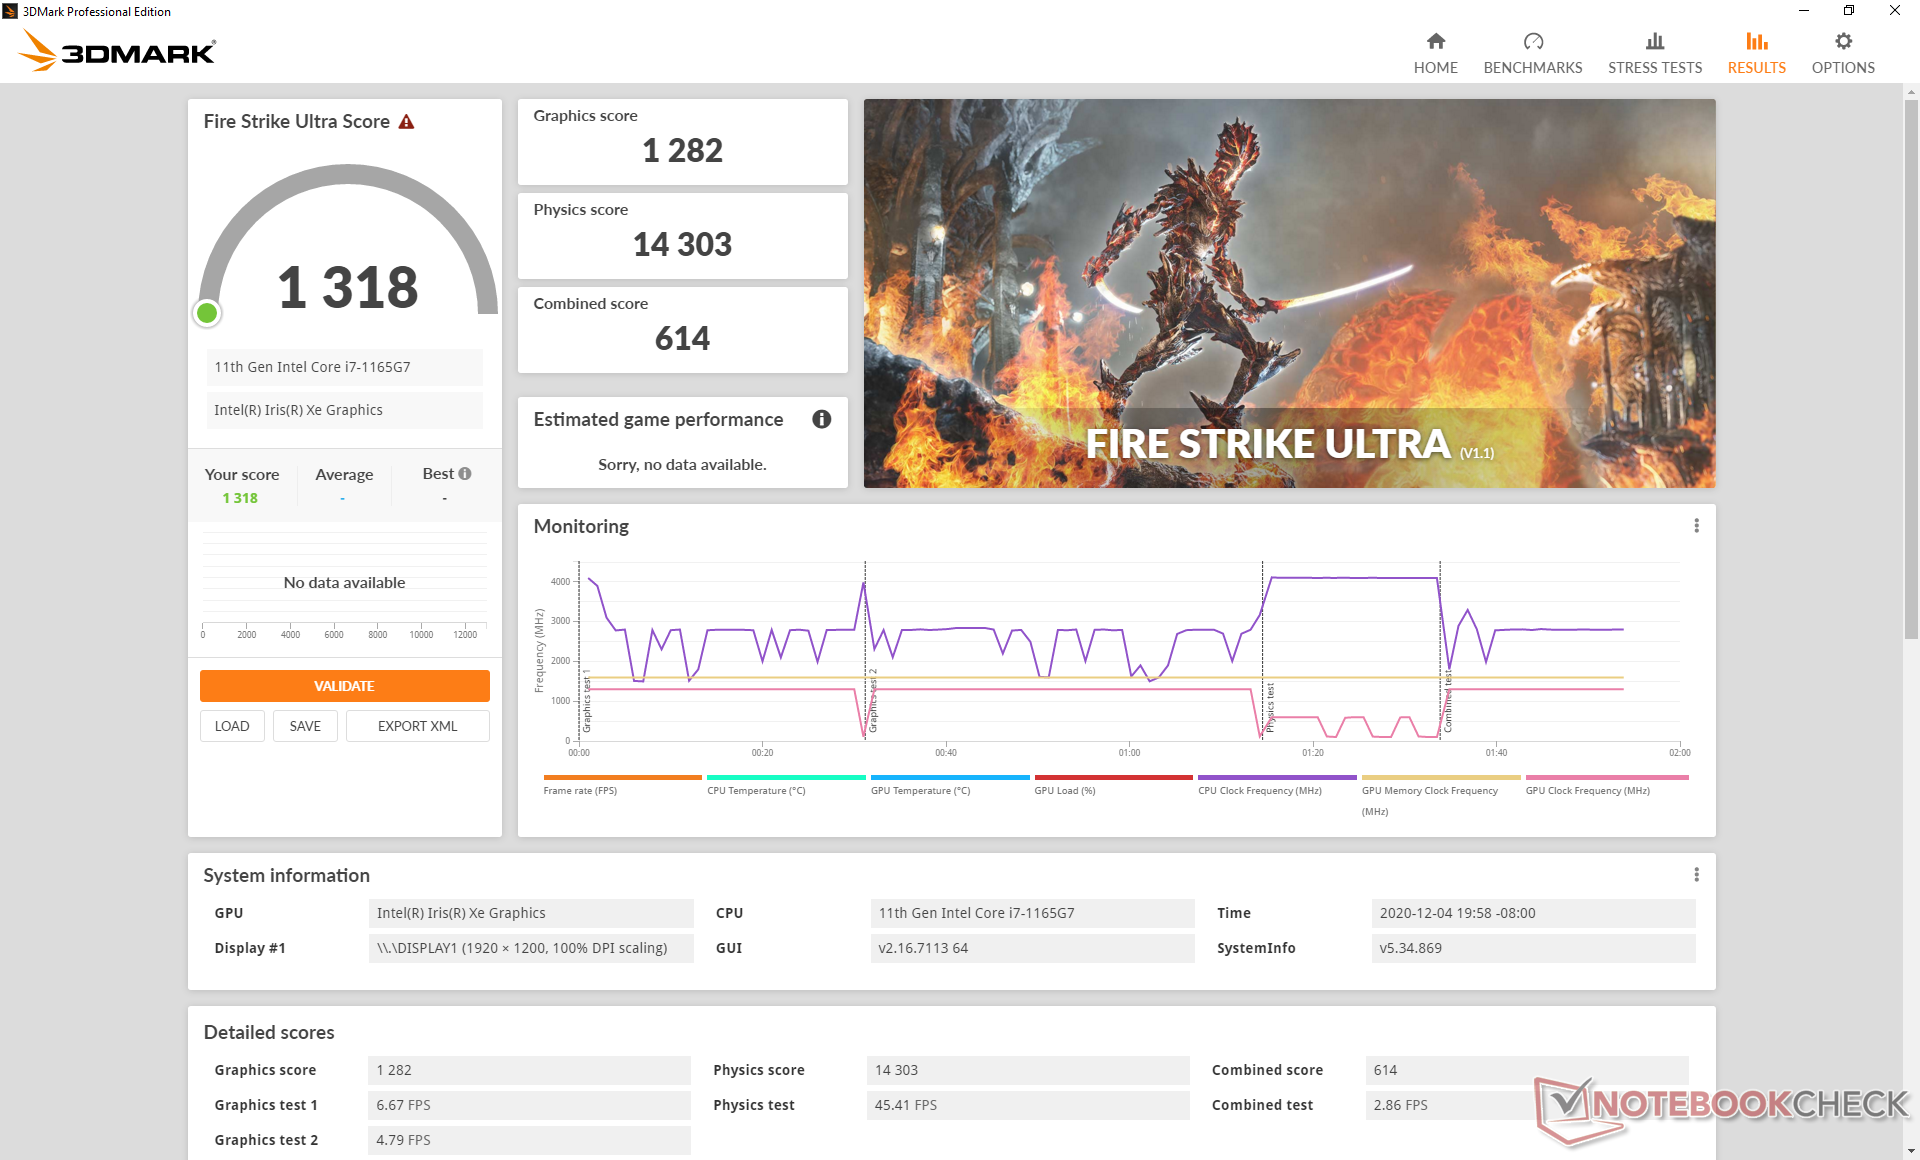
Die 3DMark-Ergebnisse liegen etwa 10 Prozent oberhalb der durchschnittlichen Iris-Xe in unserer Datenbank. Die Werte fallen sogar minimal höher aus als bei einer GeForce MX250 oder MX350, aber die Leistung in Spielen fällt eher zugunsten der Geforce-Karten aus, wie wir hier beschreiben.
Unsere Extraseite zur Iris Xe enthält mehr technische Informationen und Benchmarkvergleiche.

| 3DMark 11 Performance | 7309 Punkte | |
| 3DMark Cloud Gate Standard Score | 20886 Punkte | |
| 3DMark Fire Strike Score | 5169 Punkte | |
| 3DMark Time Spy Score | 1779 Punkte | |
Hilfe | ||
| min. | mittel | hoch | max. | |
|---|---|---|---|---|
| GTA V (2015) | 101 | 83.5 | 26.2 | 12.8 |
| The Witcher 3 (2015) | 103.1 | 60.1 | 34.1 | 15.2 |
| Dota 2 Reborn (2015) | 83.7 | 74.4 | 52 | 48.8 |
| Final Fantasy XV Benchmark (2018) | 46.3 | 25.3 | 18.8 | |
| X-Plane 11.11 (2018) | 31.1 | 40.1 | 41.3 |
Emissionen
Systemlautstärke
Beim Browsen oder Videostreaming bleiben die Lüfter still, Störgeräusche wie Pulsieren sind nicht wahrnehmbar. Im schlimmsten Fall drehen die Lüfter mit 29 dB(A) bei einer Hintergrundlautstärke von 27 dB(A), sodass sie in typischen Businessumgebungen wie Büro oder Konferenzraum quasi unhörbar bleiben. Beim Spielen von Witcher 3 messen wir 33 dB(A).
Werden die Lüfter via Synapsesoftware manuell auf Maximum gesetzt, dann touren sie auf bis zu 45 dB(A) hoch und sind dann lauter als die der meisten anderen Subnotebooks mit integrierten GPUs. Allerdings haben wir dieses Maximum nicht einmal während der Benchmarks erreicht sondern eben nur beim manuellen Setzen der Lüfter auf den Maximalwert. Im Automatikmodus werden die Lüfter diese Lautstärke kaum erreichen.
| Razer Book 13 FHD Iris Xe G7 96EUs, i7-1165G7, Samsung SSD PM981a MZVLB256HBHQ | Dell XPS 13 9310 Core i7 FHD Iris Xe G7 96EUs, i7-1165G7, Micron 2300 512GB MTFDHBA512TDV | Asus Zenbook S UX393JA Iris Plus Graphics G7 (Ice Lake 64 EU), i7-1065G7, Intel SSD 660p 1TB SSDPEKNW010T8 | Huawei MateBook X Pro 2020 i7 GeForce MX250, i7-10510U, Samsung PM981a MZVLB1T0HBLR | Microsoft Surface Laptop 3 13 Core i5-1035G7 Iris Plus Graphics G7 (Ice Lake 64 EU), i5-1035G7, SK hynix BC501 HFM256GDGTNG | Razer Blade Stealth i7-1065G7 Iris Plus Iris Plus Graphics G7 (Ice Lake 64 EU), i7-1065G7, Samsung SSD PM981 MZVLB256HAHQ | |
|---|---|---|---|---|---|---|
| Geräuschentwicklung | 5% | -8% | -10% | -5% | -7% | |
| aus / Umgebung * (dB) | 27 | 25.7 5% | 26.9 -0% | 29.6 -10% | 28.5 -6% | 28.3 -5% |
| Idle min * (dB) | 27 | 25.7 5% | 26.9 -0% | 29.6 -10% | 28.5 -6% | 28.3 -5% |
| Idle avg * (dB) | 27 | 25.7 5% | 29 -7% | 29.6 -10% | 28.5 -6% | 28.3 -5% |
| Idle max * (dB) | 27.1 | 25.9 4% | 31.1 -15% | 30.3 -12% | 28.5 -5% | 28.3 -4% |
| Last avg * (dB) | 29 | 26.2 10% | 37.7 -30% | 38 -31% | 28.5 2% | 33.5 -16% |
| Witcher 3 ultra * (dB) | 33.3 | 36.5 -10% | 40.2 -21% | 38 -14% | 40.4 -21% | 34.5 -4% |
| Last max * (dB) | 44.8 | 36.6 18% | 38.1 15% | 38 15% | 40.4 10% | 49.4 -10% |
* ... kleinere Werte sind besser
Lautstärkediagramm
| Idle |
| 27 / 27 / 27.1 dB(A) |
| Last |
| 29 / 44.8 dB(A) |
 | ||
30 dB leise 40 dB(A) deutlich hörbar 50 dB(A) störend |
||
min: | ||
Temperatur
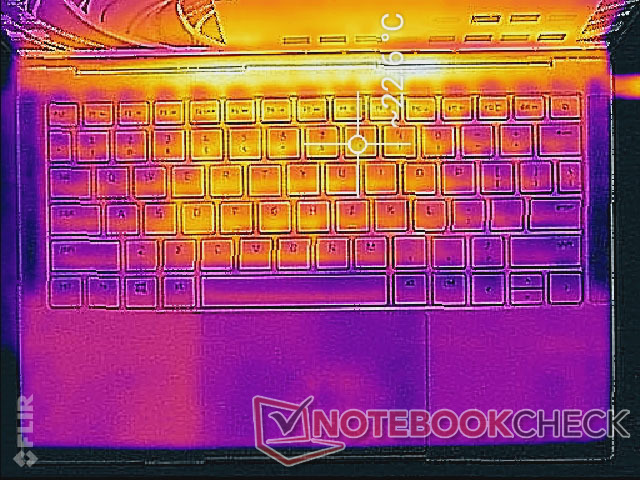
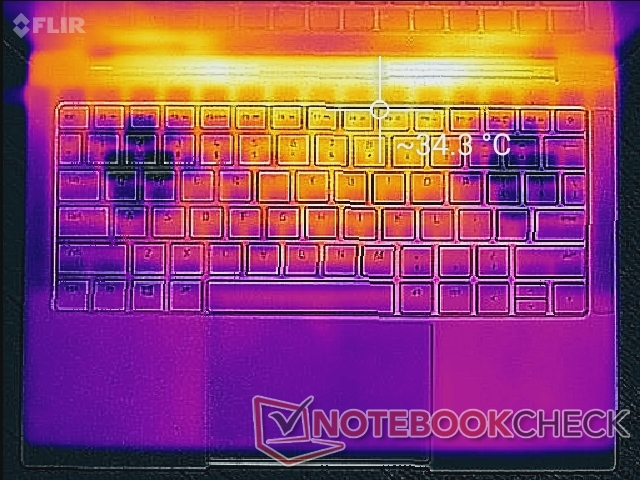
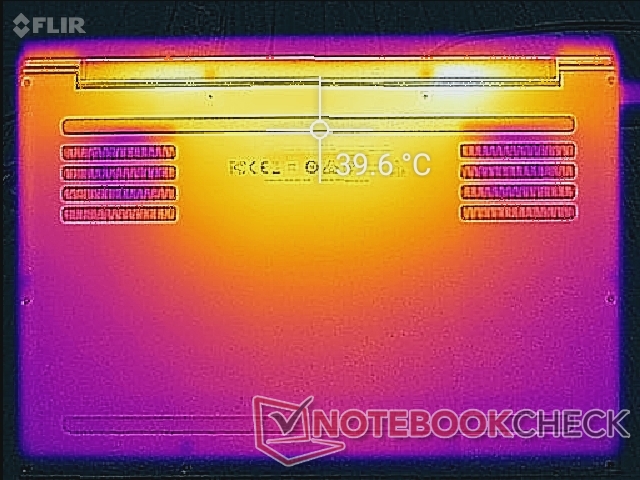
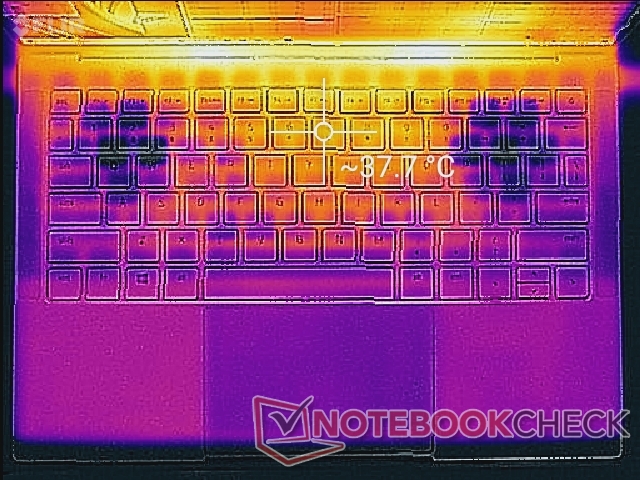
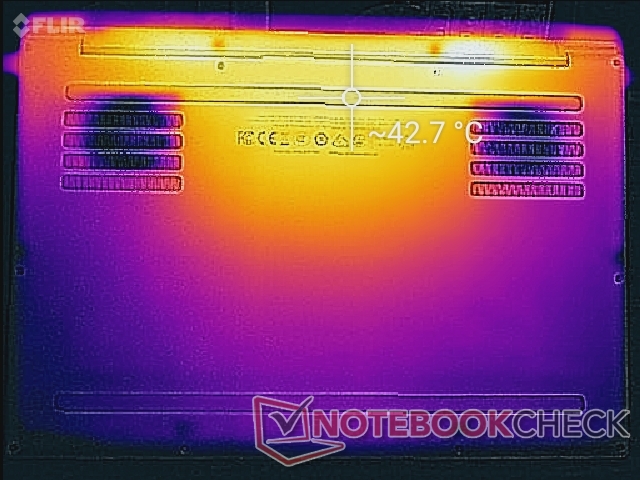
Die Oberfläche erwärmt sich etwas mehr als beim Blade Stealth auf Ice-Lake-Basis. Liegen für einen längeren Zeitraum starke Lasten an, so erwärmen sich Hotspots an der Ober- und Unterseite auf 34 °C bis 38 °C bzw. 40 °C bis 43 °C. Der Temperaturgradient ist ansonsten ähnlich symmetrisch wie beim Blade Stealth. Die Wärme ist spürbar, aber nicht störend, da die Hot Spots eher hinten liegen und von den Handballenauflagen und den meisten Tastaturtasten entfernt sind.
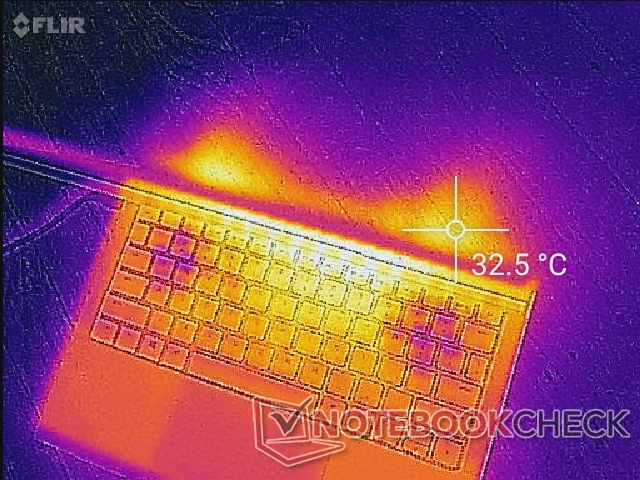
(+) Die maximale Temperatur auf der Oberseite ist 39.2 °C. Im Vergleich liegt der Klassendurchschnitt bei 34.3 °C (von 21.2 bis 62.5 °C für die Klasse Office).
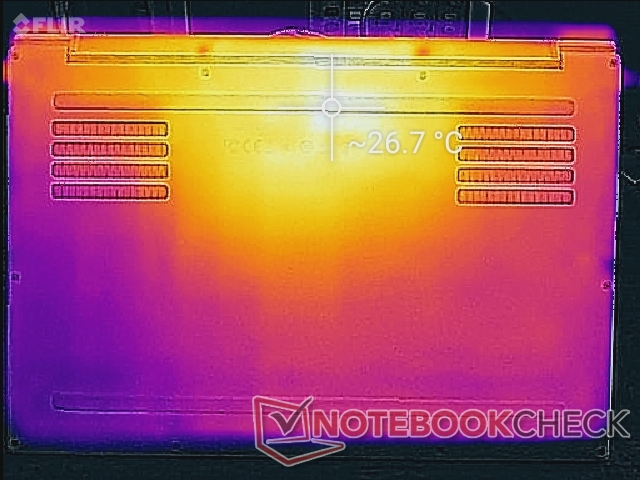
(±) Auf der Unterseite messen wir eine maximalen Wert von 44 °C (im Vergleich zum Durchschnitt von 36.8 °C).
(+) Ohne Last messen wir eine durchschnittliche Temperatur von 21.5 °C auf der Oberseite. Der Klassendurchschnitt erreicht 29.5 °C.
(+) Beim längeren Spielen von The Witcher 3 erhitzt sich das Gerät durchschnittlich auf 28 °C. Der Durchschnitt der Klasse ist derzeit 29.5 °C.
(+) Die Handballen und der Touchpad-Bereich sind mit gemessenen 31 °C kühler als die typische Hauttemperatur und fühlen sich dadurch kühl an.
(-) Die durchschnittliche Handballen-Temperatur anderer getesteter Geräte war 27.5 °C (-3.5 °C).
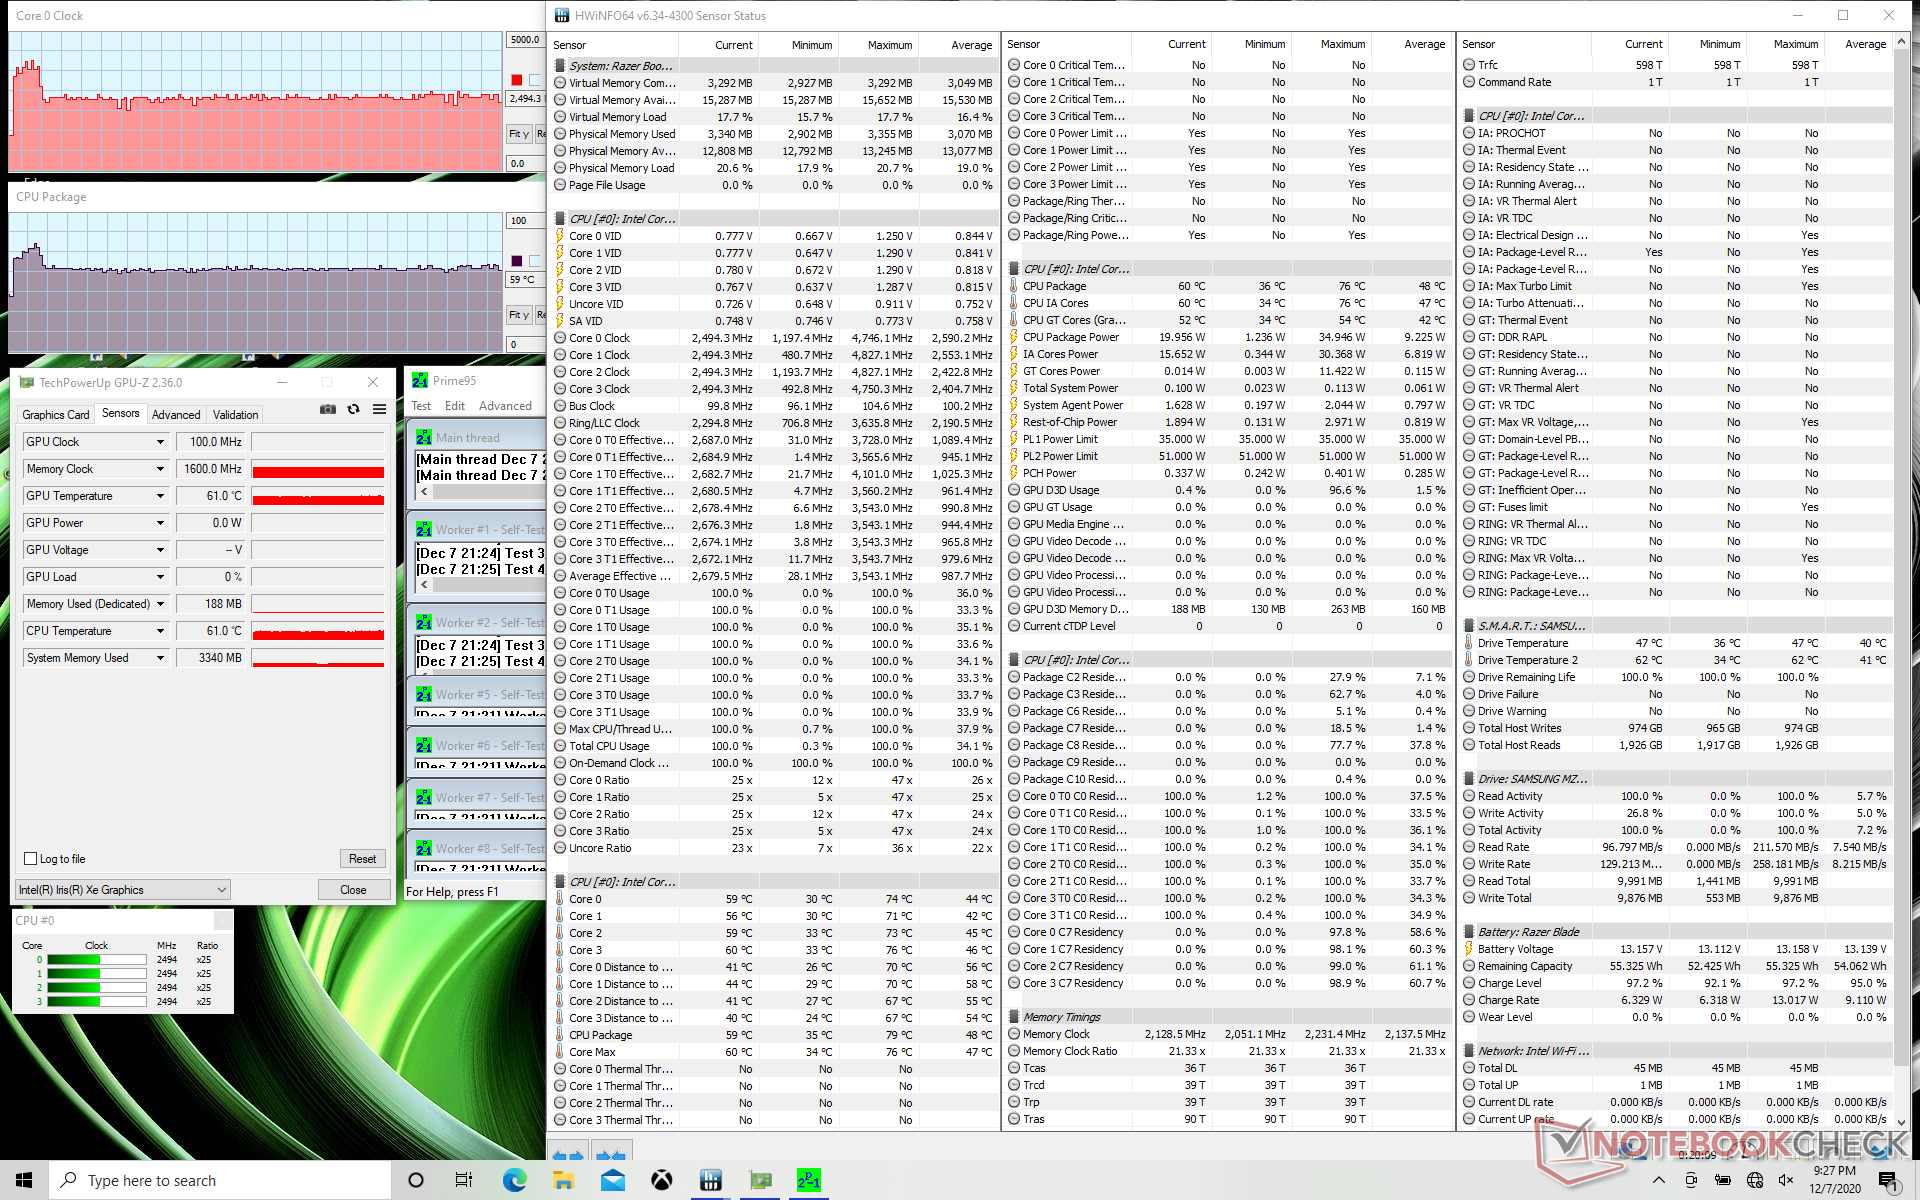
Stresstest
Im Stresstest mit Prime95 boosten die CPU-Kerne für ein paar Sekunden auf bis zu 3,8 GHz hoch. Wenn Kerntemperaturen von 79 °C erreicht werden, sinken die Taktraten ab und stabilisieren sich zwischen 2,5 und 2,7 GHz, bei einer Kerntemperatur von 60 °C. Im Vergleich führt der Stresstest beim XPS 13 9310 mit Core i7 dazu, dass die Taktraten auf bis zu 1,9 GHz absinken, bei gleichzeitig höheren Kerntemperaturen von bis zu 78 °C. Das Book 13 läuft unter Last also sowohl kühler als auch schneller als das XPS 13, was von unserem CineBench-R15-xT-Loop weiter oben gestützt wird.
Die Kerntemperaturen erreichen unter Stress ihr Maximum bei etwa 60 °C. Das deckt sich mit unseren Ergebnissen vom Asus ZenBook UX425, welches mit der gleichen CPU bestückt ist.
Im Akkubetrieb sinkt die CPU-Leistung etwas ab. Ein erneuter 3DMark-11-Test abseits der Steckdose ergibt Physik- und Grafikwerte von 10.608 und 6.973 Punkten, im Vergleich zu den 12.384 und 6.812 Punkten an der Steckdose. Zu beachten ist, dass der "Performance"-Modus in Synapse ausgegraut wird, sobald man sich im Akkumodus befindet.
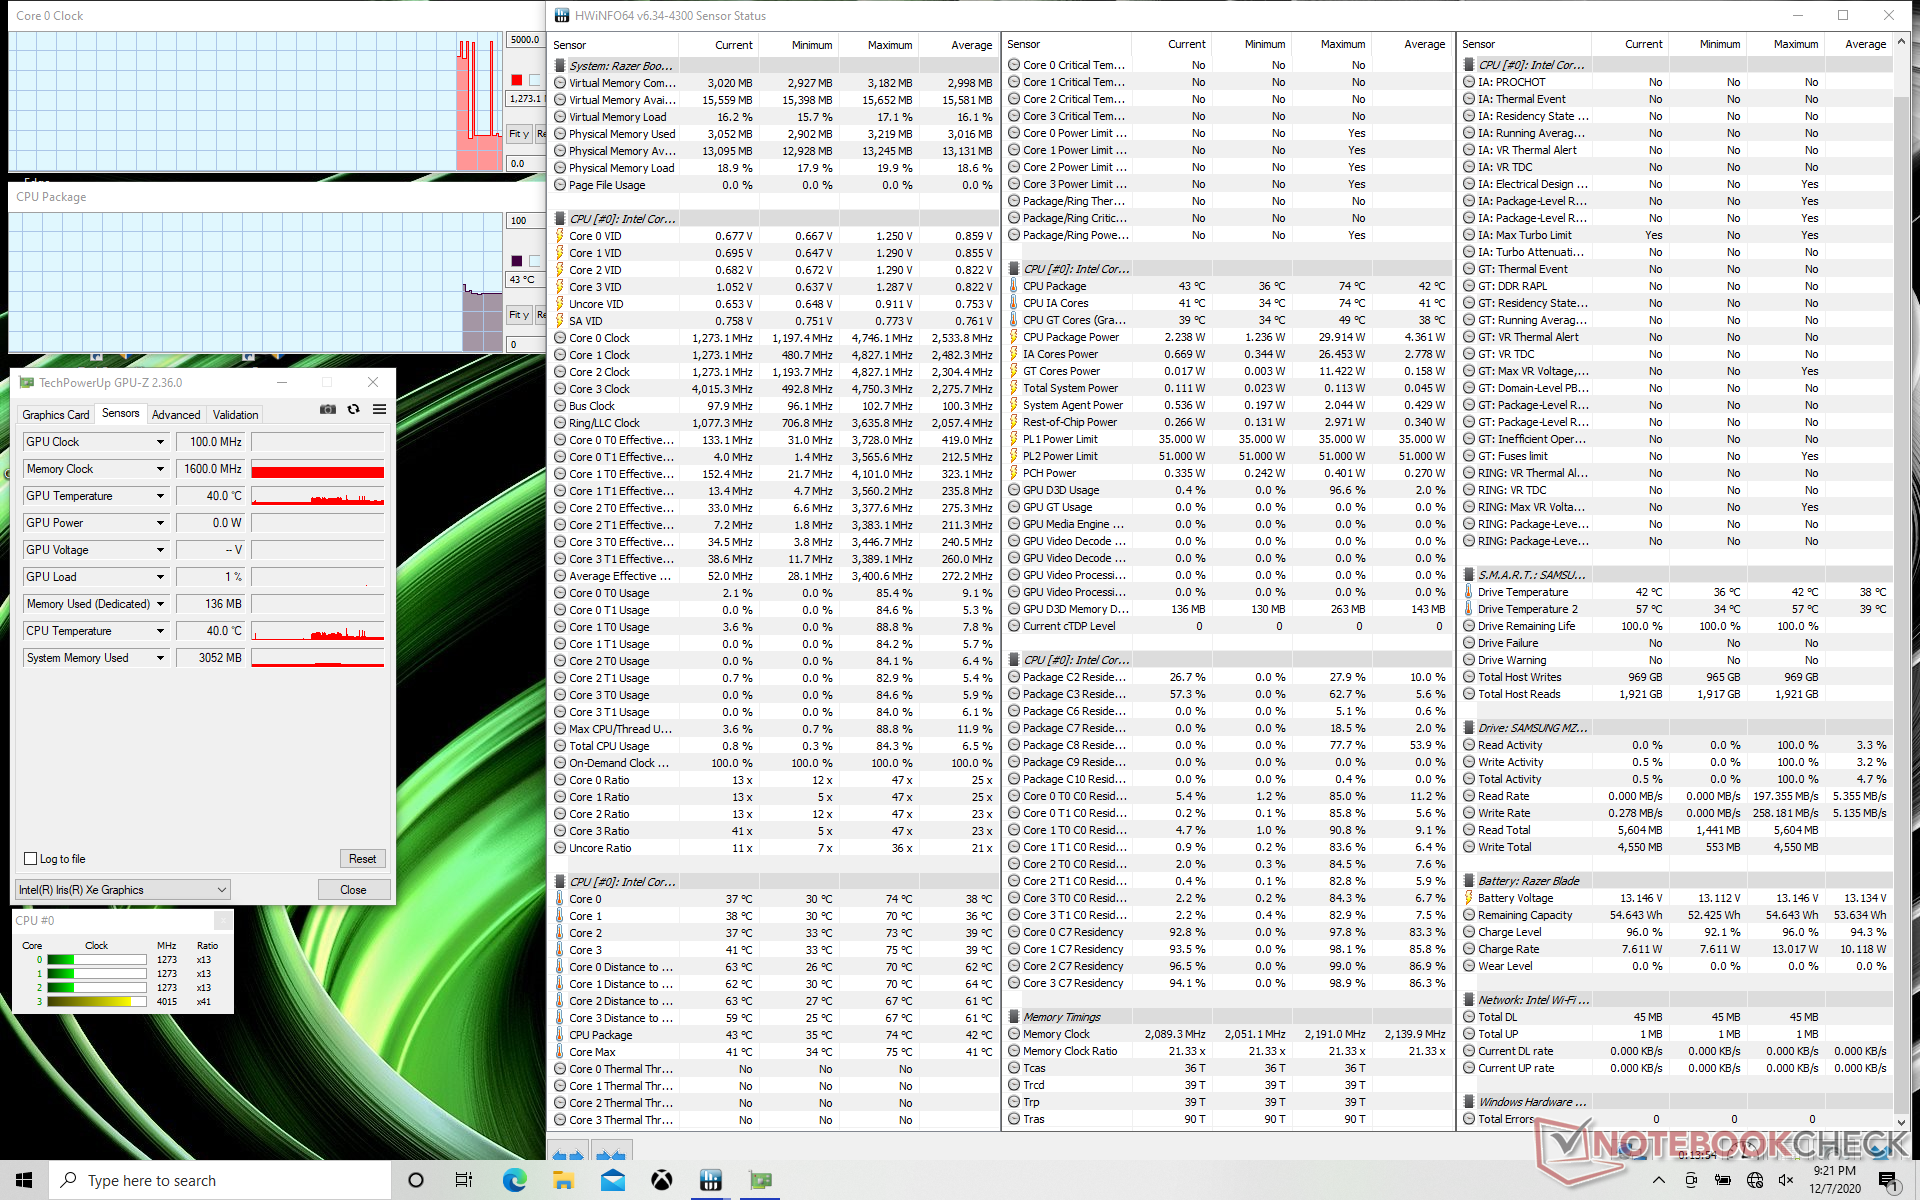
| CPU Clock (GHz) | GPU Clock (MHz) | Average CPU Temperature (°C) | |
| System Idle | -- | -- | 43 |
| Prime95 Stress | 2.5 - 2.7 | -- | 60 |
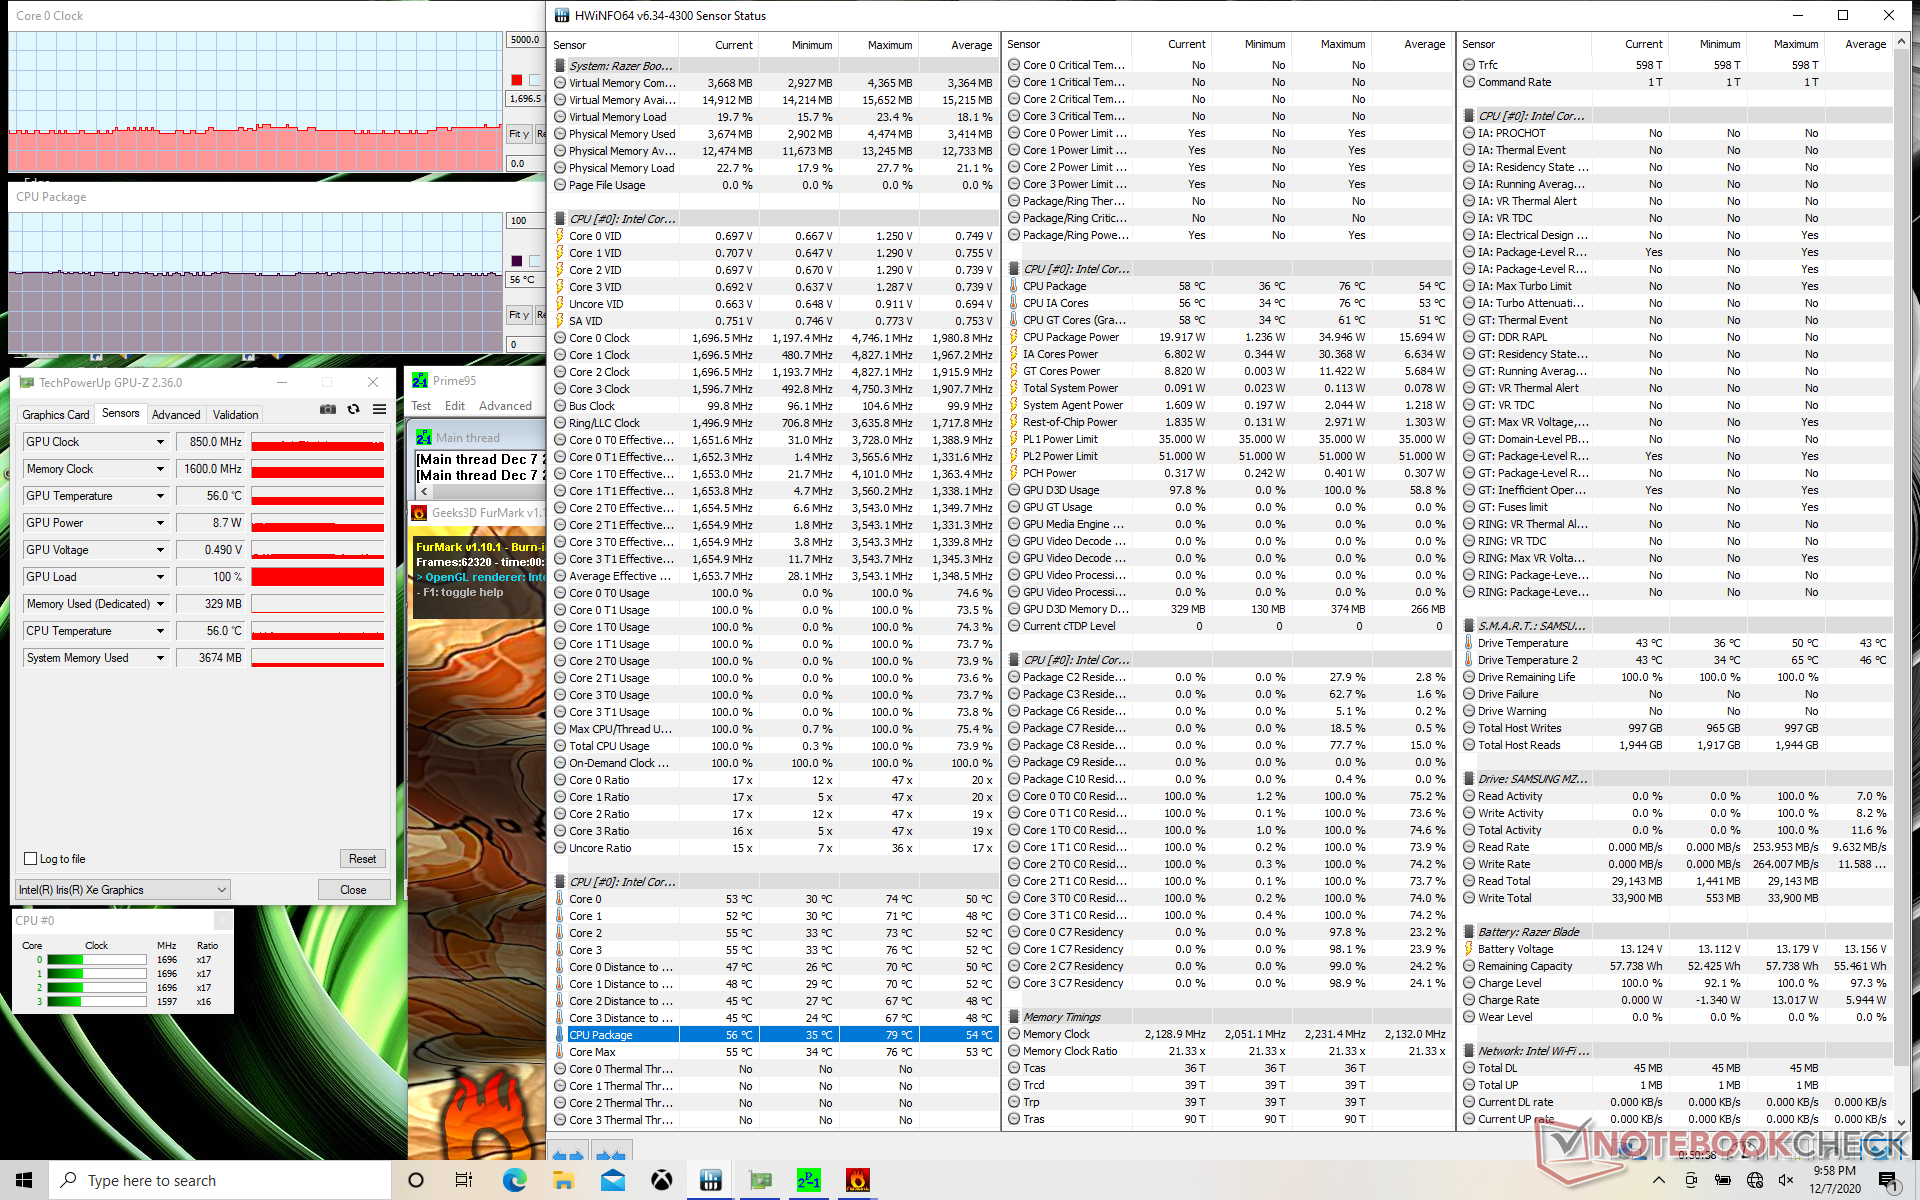
| Prime95 + FurMark Stress | 1.5 - 1.7 | 850 | 56 |
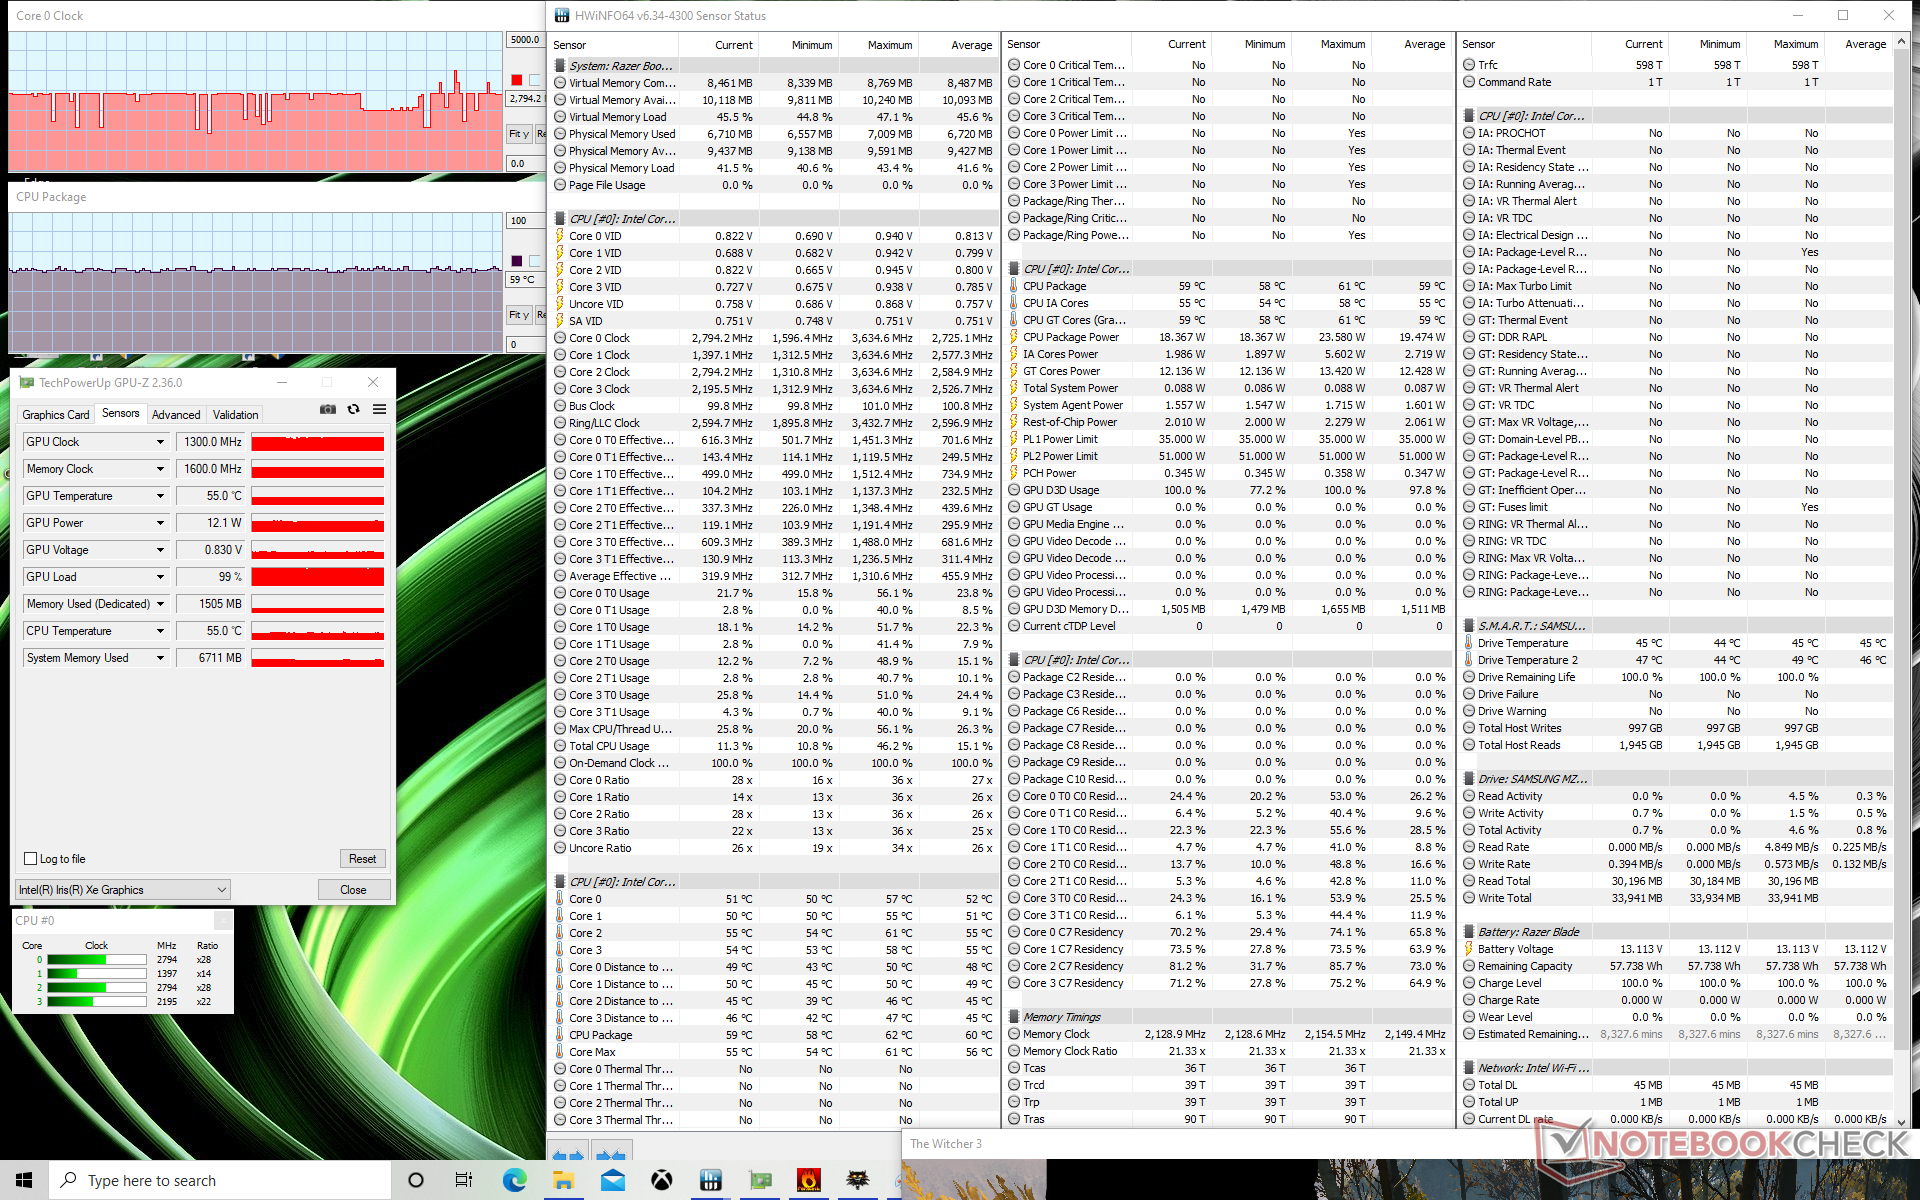
| Witcher 3 Stress | 2.2 - 2.8 | 1300 | 59 |
Speakers


Razer Book 13 FHD Audio Analyse
(±) | Mittelmäßig laut spielende Lautsprecher (78.7 dB)
Bass 100 - 315 Hz
(-) | kaum Bass - 15.1% niedriger als der Median
(±) | durchschnittlich lineare Bass-Wiedergabe (11.1% Delta zum Vorgänger)
Mitteltöne 400 - 2000 Hz
(+) | ausgeglichene Mitten, vom Median nur 2.7% abweichend
(+) | lineare Mitten (4.5% Delta zum Vorgänger)
Hochtöne 2 - 16 kHz
(+) | ausgeglichene Hochtöne, vom Median nur 4% abweichend
(±) | durchschnittlich lineare Hochtöne (8.8% Delta zum Vorgänger)
Gesamt im hörbaren Bereich 100 - 16.000 Hz
(+) | hörbarer Bereich ist sehr linear (13.7% Abstand zum Median
Im Vergleich zu allen Geräten derselben Klasse
» 8% aller getesteten Geräte dieser Klasse waren besser, 4% vergleichbar, 88% schlechter
» Das beste Gerät hat einen Delta-Wert von 7%, durchschnittlich ist 21%, das schlechteste Gerät hat 53%
Im Vergleich zu allen Geräten im Test
» 15% aller getesteten Geräte waren besser, 4% vergleichbar, 81% schlechter
» Das beste Gerät hat einen Delta-Wert von 4%, durchschnittlich ist 24%, das schlechteste Gerät hat 134%
Apple MacBook 12 (Early 2016) 1.1 GHz Audio Analyse
(+) | Die Lautsprecher können relativ laut spielen (83.6 dB)
Bass 100 - 315 Hz
(±) | abgesenkter Bass - 11.3% geringer als der Median
(±) | durchschnittlich lineare Bass-Wiedergabe (14.2% Delta zum Vorgänger)
Mitteltöne 400 - 2000 Hz
(+) | ausgeglichene Mitten, vom Median nur 2.4% abweichend
(+) | lineare Mitten (5.5% Delta zum Vorgänger)
Hochtöne 2 - 16 kHz
(+) | ausgeglichene Hochtöne, vom Median nur 2% abweichend
(+) | sehr lineare Hochtöne (4.5% Delta zum Vorgänger)
Gesamt im hörbaren Bereich 100 - 16.000 Hz
(+) | hörbarer Bereich ist sehr linear (10.2% Abstand zum Median
Im Vergleich zu allen Geräten derselben Klasse
» 7% aller getesteten Geräte dieser Klasse waren besser, 2% vergleichbar, 91% schlechter
» Das beste Gerät hat einen Delta-Wert von 5%, durchschnittlich ist 18%, das schlechteste Gerät hat 53%
Im Vergleich zu allen Geräten im Test
» 5% aller getesteten Geräte waren besser, 1% vergleichbar, 94% schlechter
» Das beste Gerät hat einen Delta-Wert von 4%, durchschnittlich ist 24%, das schlechteste Gerät hat 134%
Energiemanagement
Energieverbrauch
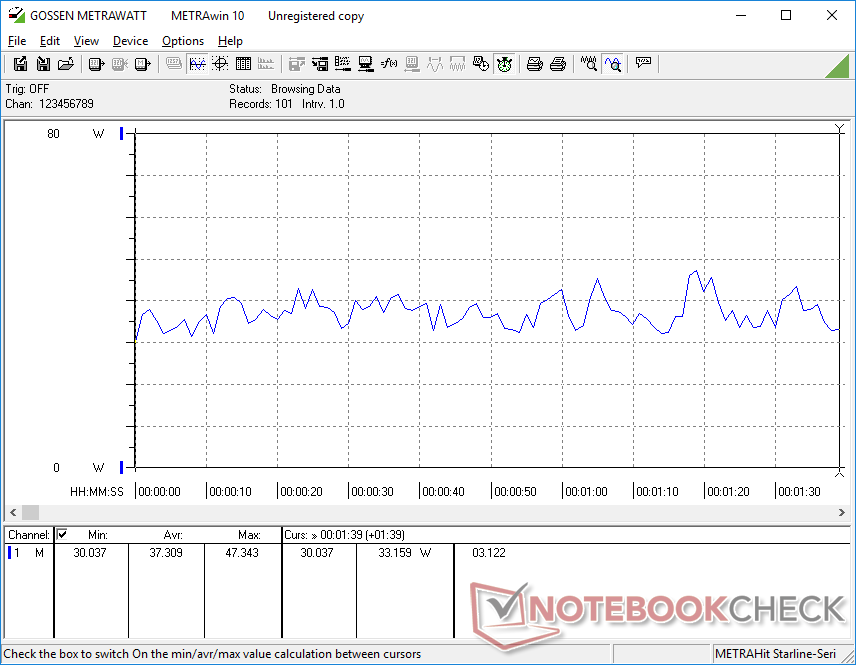
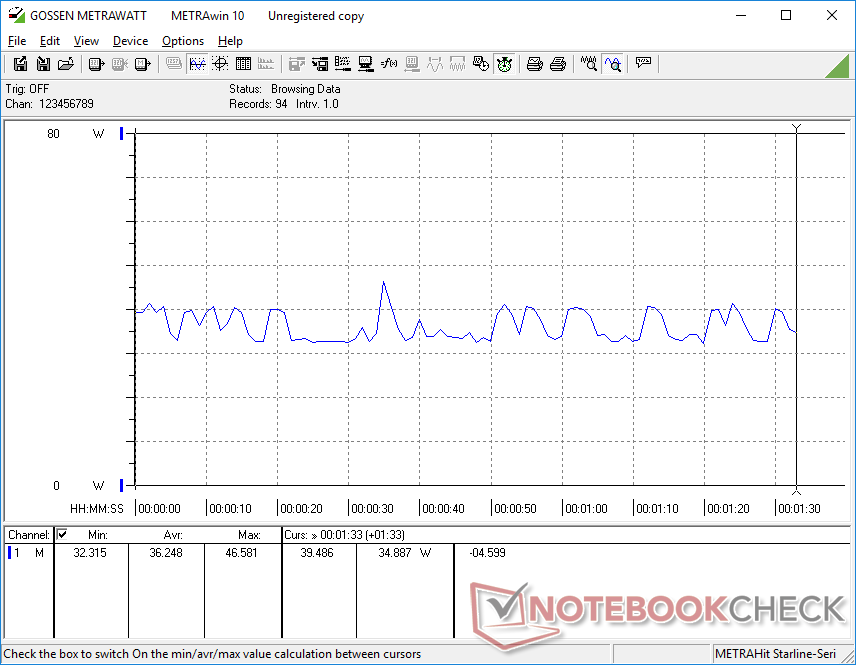
Im Systemleerlauf verbraucht der Laptop bei minimierter Helligkeit nur 3 W, bei maximaler Helligkeit sind es 7 W. Das sehr gute Leistung-pro-Watt-Verhältnis der Tiger-Lake-CPU wird spätestens dann ersichtlich, wenn man den Verbrauch mit dem eines Blade Stealth mit Geforce MX150 vergleicht. Gaming verbraucht zum Beispiel rund 37 W auf dem Book 13, das Blade Stealth kommt hier auf ganze 64 W und das obwohl das Book 13 eine sowohl bessere CPU- als auch GPU-Leistung bietet.
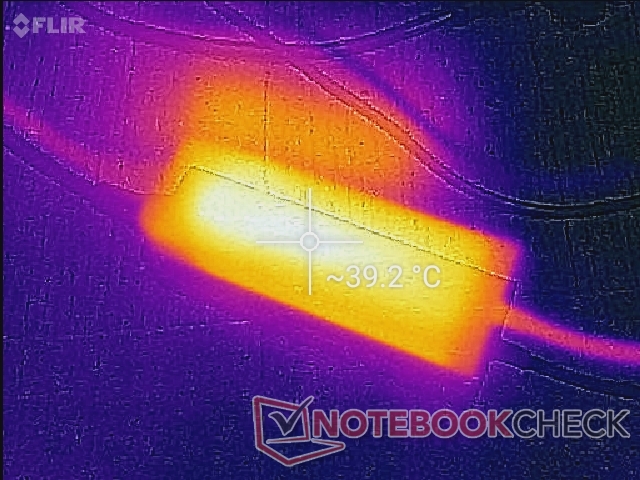
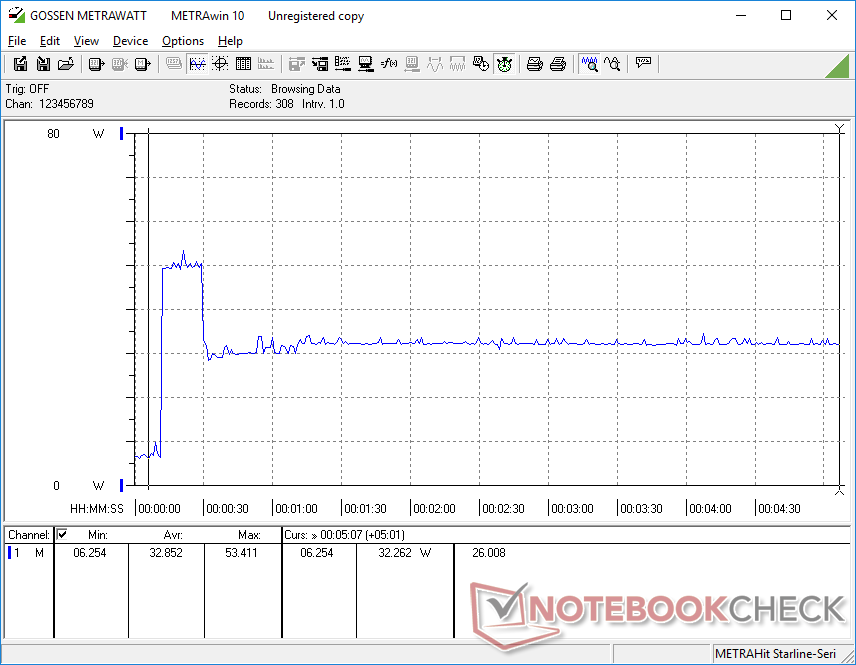
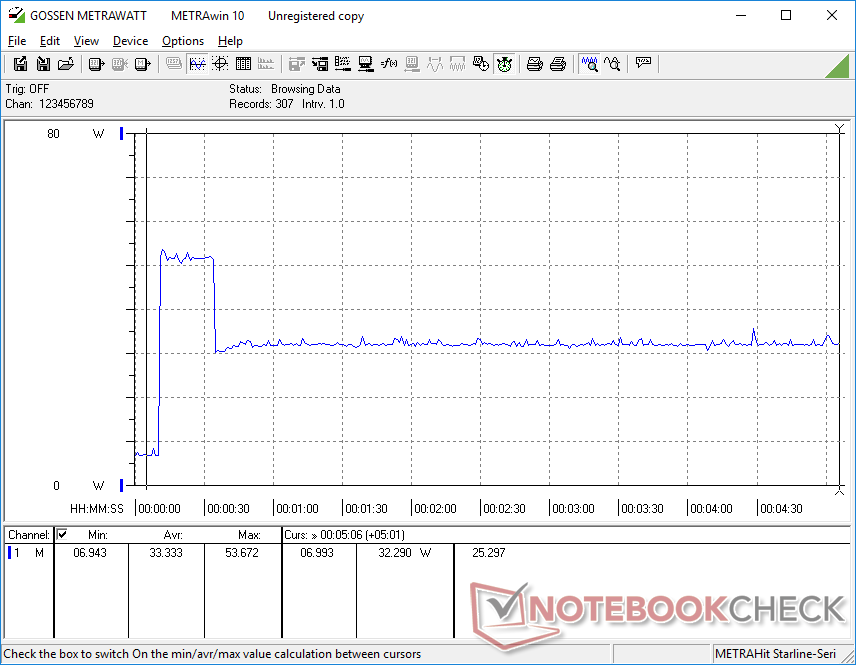
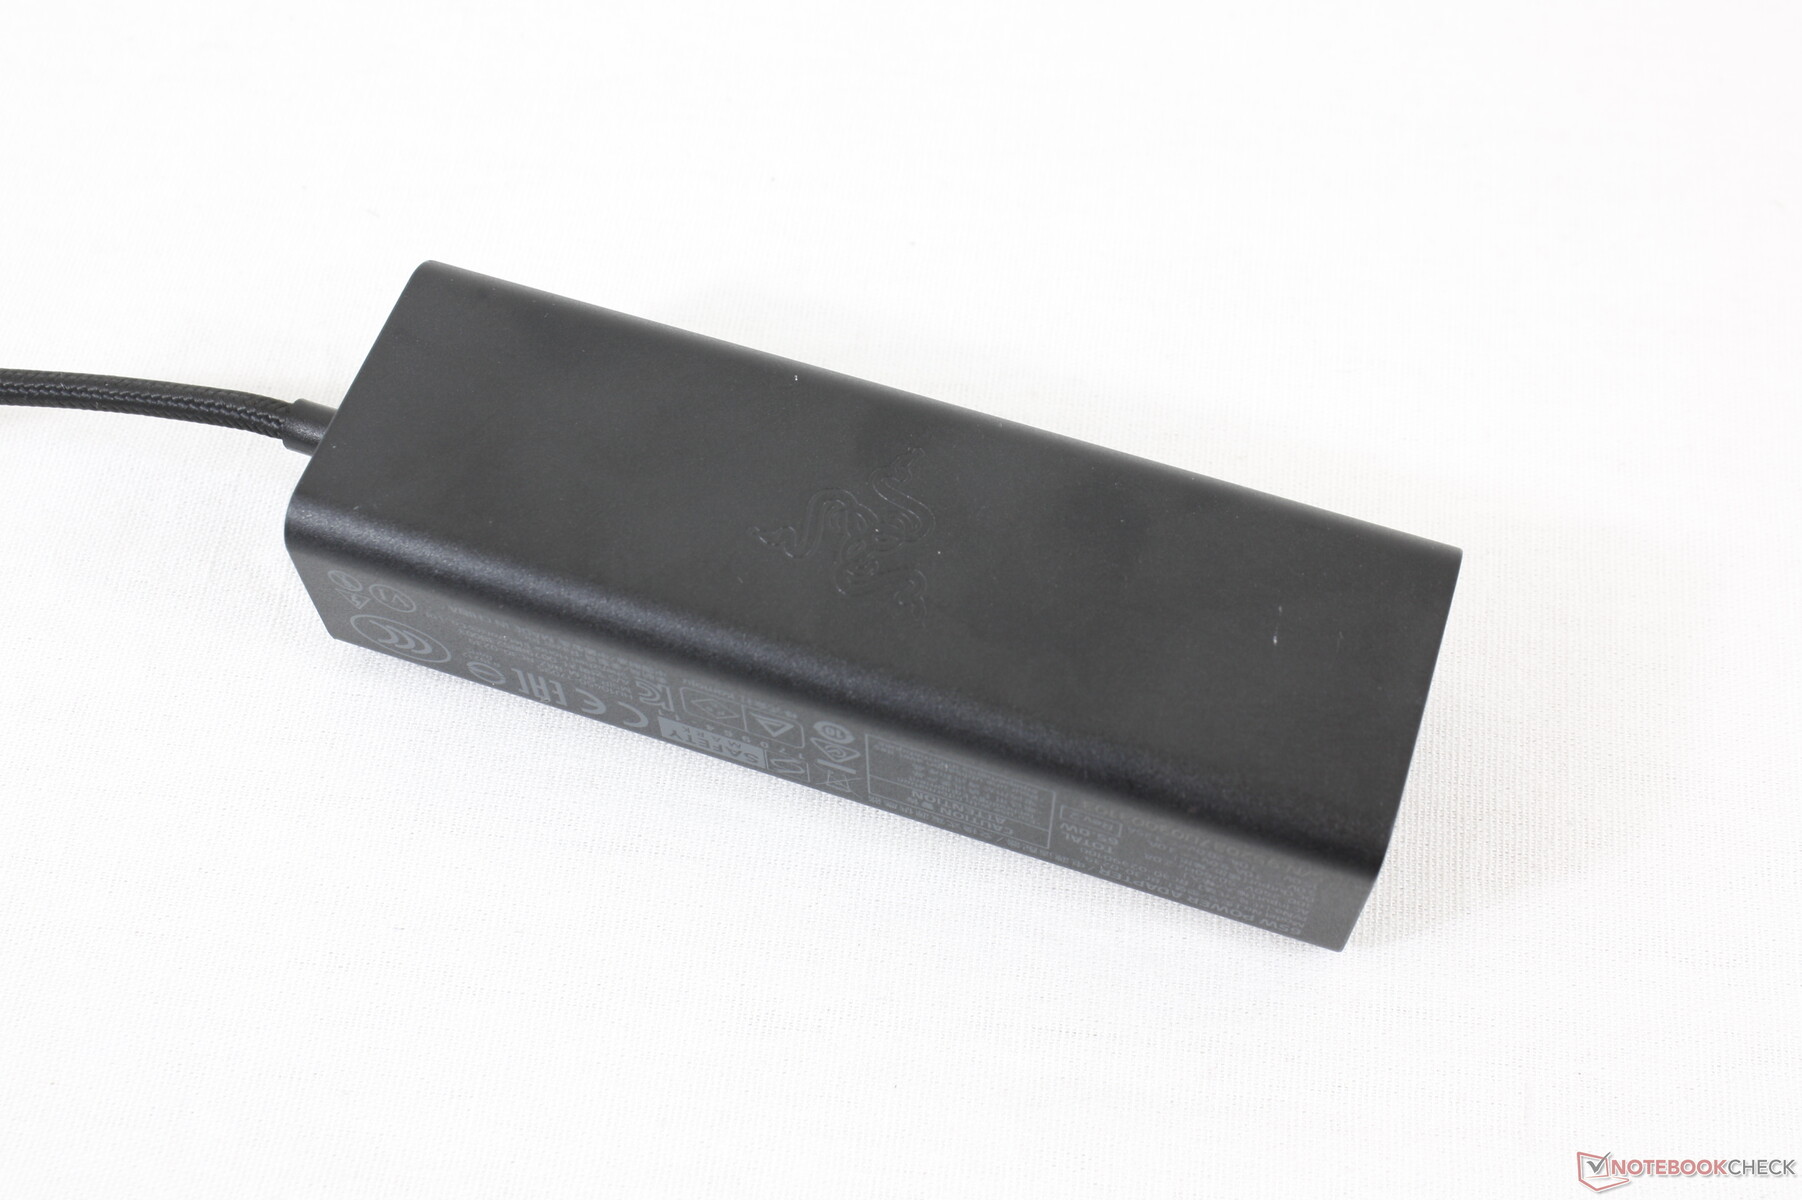
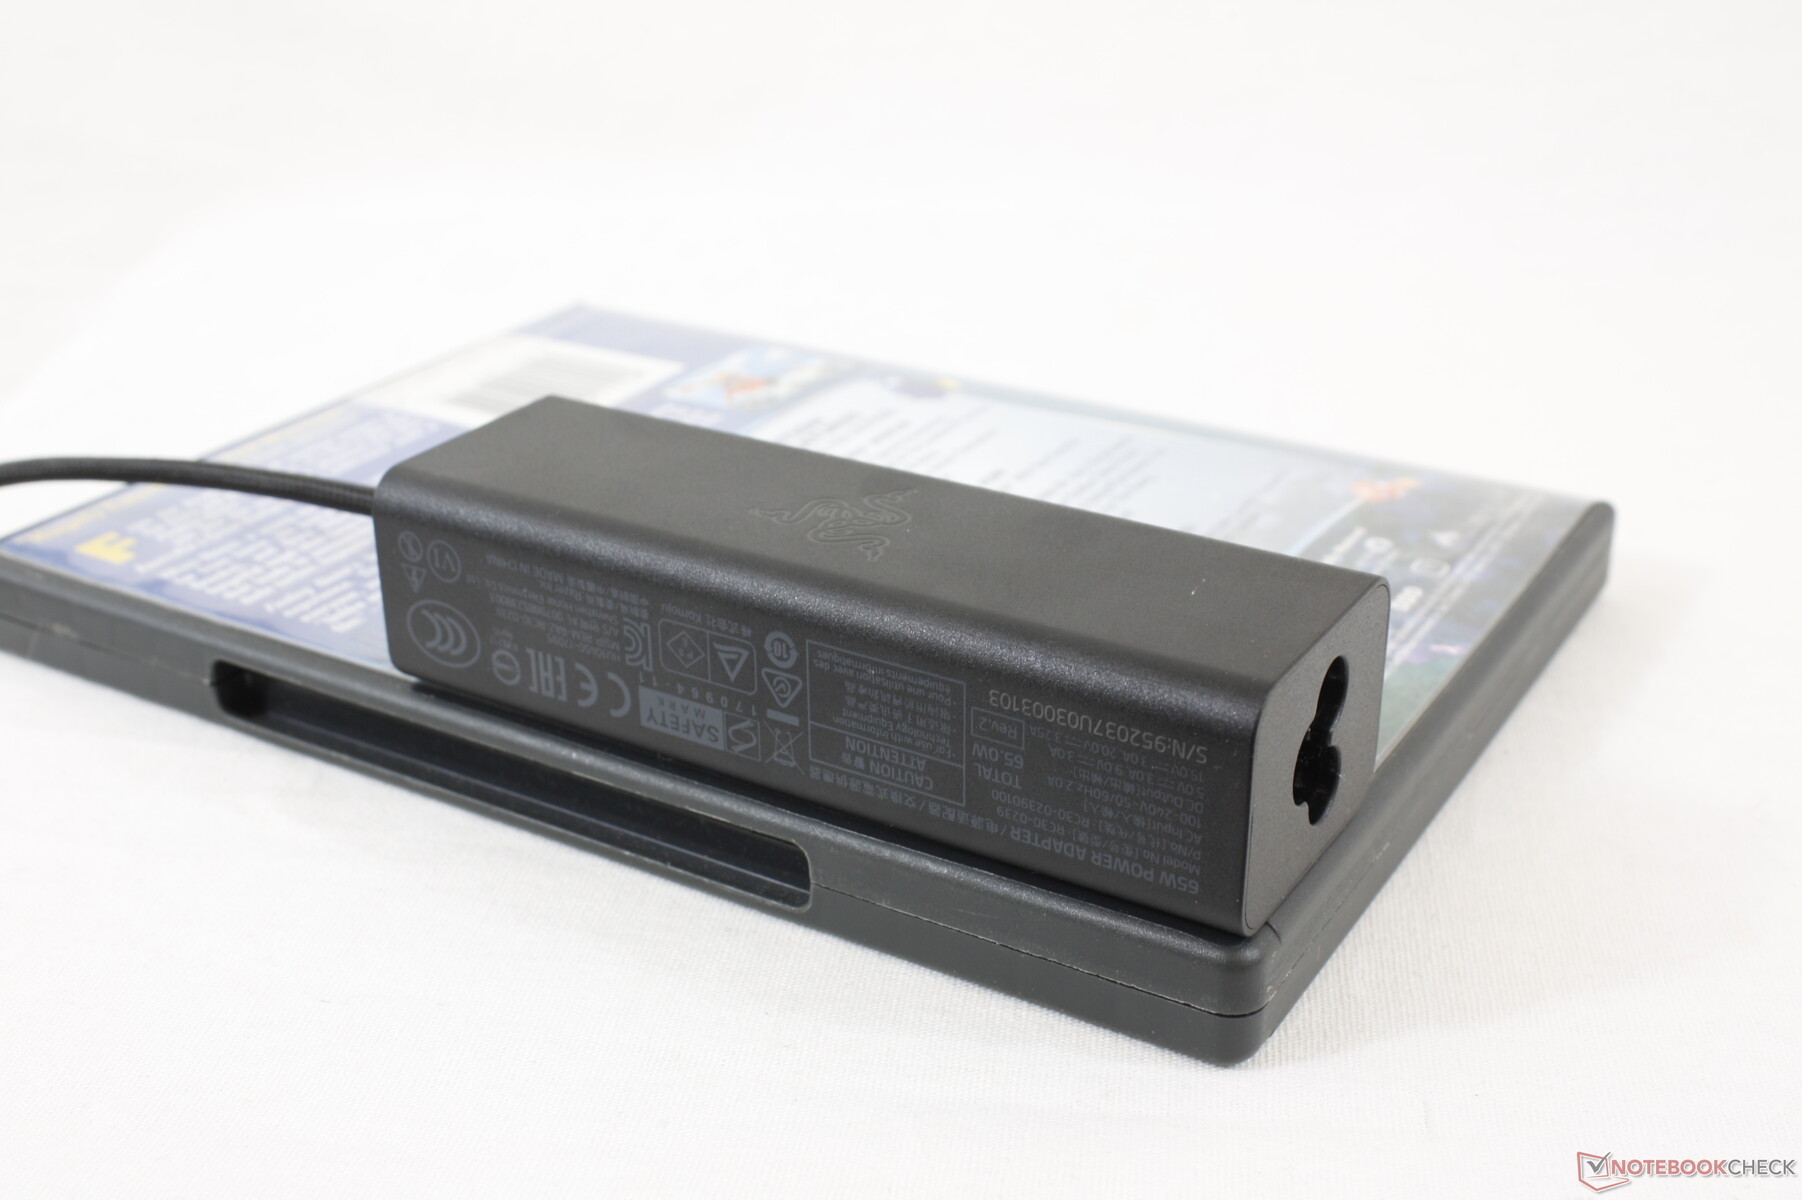
Der maximale Verbrauch liegt bei 53.7 W, allerdings nur für etwa 20 s. Auch hier ist das kleine (~10.8 x 3.5 x 2.7 cm) 65-W-Netzteil noch ausreichend.
| Aus / Standby | |
| Idle | |
| Last |
|
Legende:
min: | |
| Razer Book 13 FHD i7-1165G7, Iris Xe G7 96EUs, Samsung SSD PM981a MZVLB256HBHQ, IPS, 1920x1200, 13.4" | Dell XPS 13 9310 Core i7 FHD i7-1165G7, Iris Xe G7 96EUs, Micron 2300 512GB MTFDHBA512TDV, IPS, 1920x1200, 13.4" | Asus Zenbook S UX393JA i7-1065G7, Iris Plus Graphics G7 (Ice Lake 64 EU), Intel SSD 660p 1TB SSDPEKNW010T8, IPS, 3300x2200, 13.9" | Huawei MateBook X Pro 2020 i7 i7-10510U, GeForce MX250, Samsung PM981a MZVLB1T0HBLR, LTPS, 3000x2000, 13.9" | Microsoft Surface Laptop 3 13 Core i5-1035G7 i5-1035G7, Iris Plus Graphics G7 (Ice Lake 64 EU), SK hynix BC501 HFM256GDGTNG, IPS, 2256x1504, 13.5" | Razer Blade Stealth i7-1065G7 Iris Plus i7-1065G7, Iris Plus Graphics G7 (Ice Lake 64 EU), Samsung SSD PM981 MZVLB256HAHQ, IPS, 1920x1080, 13.3" | |
|---|---|---|---|---|---|---|
| Stromverbrauch | 2% | -14% | -38% | -17% | -32% | |
| Idle min * (Watt) | 3.3 | 3.9 -18% | 4.1 -24% | 4.3 -30% | 4.4 -33% | 5.9 -79% |
| Idle avg * (Watt) | 6.4 | 5.9 8% | 7.5 -17% | 8.5 -33% | 7.5 -17% | 8.1 -27% |
| Idle max * (Watt) | 7 | 6.3 10% | 8.5 -21% | 12 -71% | 7.8 -11% | 11.2 -60% |
| Last avg * (Watt) | 37.3 | 39.7 -6% | 36.8 1% | 54.8 -47% | 41.9 -12% | 44.3 -19% |
| Witcher 3 ultra * (Watt) | 36.4 | 34.8 4% | 39.2 -8% | 47.1 -29% | 40.8 -12% | 41.9 -15% |
| Last max * (Watt) | 53.7 | 47.5 12% | 61.6 -15% | 61.5 -15% | 63.9 -19% | 50.2 7% |
* ... kleinere Werte sind besser
Akkulaufzeit
Obwohl die Akkukapazität zum Blade Stealth nahezu gleich bleibt (55 Wh vs. 53 Wh), sind die Laufzeiten auf dem Book 13 deutlich besser. Wir konnten beinahe 15 Stunden WLAN-Nutzung aus dem Book 13 herausquetschen, ein XPS 13 oder Blade Stealth halten hier gleich mehrere Stunden weniger durch.
Eine komplette Aufladung von 0 auf 100 Prozent nimmt etwa 1,5 Stunden in Anspruch. Ein Lob geht an die USB-C-Ports, welche an beiden Seiten des Laptops vorhanden sind, sodass das Gerät auch von beiden Seiten aufladbar ist, das geht bei vielen anderen Ultrabooks nicht.
| Razer Book 13 FHD i7-1165G7, Iris Xe G7 96EUs, 55 Wh | Dell XPS 13 9310 Core i7 FHD i7-1165G7, Iris Xe G7 96EUs, 52 Wh | Asus Zenbook S UX393JA i7-1065G7, Iris Plus Graphics G7 (Ice Lake 64 EU), 67 Wh | Huawei MateBook X Pro 2020 i7 i7-10510U, GeForce MX250, 57.4 Wh | Microsoft Surface Laptop 3 13 Core i5-1035G7 i5-1035G7, Iris Plus Graphics G7 (Ice Lake 64 EU), 45 Wh | Razer Blade Stealth i7-1065G7 Iris Plus i7-1065G7, Iris Plus Graphics G7 (Ice Lake 64 EU), 53.1 Wh | |
|---|---|---|---|---|---|---|
| Akkulaufzeit | 3% | -4% | -8% | -20% | -34% | |
| Idle (h) | 36.8 | 30 -18% | 38.4 4% | 34.4 -7% | ||
| WLAN (h) | 14.8 | 11 -26% | 8.3 -44% | 10.4 -30% | 8.3 -44% | 9.7 -34% |
| Last (h) | 2.1 | 3.2 52% | 2.7 29% | 2.4 14% | 1.9 -10% |
Pro
Contra
Fazit
Ein 16:10-Display eines Dell XPS 13 einfach in ein Razer Blade Stealth gepackt und schon hat man, mehr oder weniger, ein Book 13. Der neue Razer-Laptop vereint das Beste beider Welten, legt aber mehr Fokus auf Leistung und visuellen Style als die Dell-Alternative. Alleine der Fakt, dass das Book 13 den gleichen Core i7-1165G7-Prozessor wie das XPS 13 hat und trotzdem ganze 20 bis 30 Prozent schneller läuft, zeigt schon, dass Razer das neue Gehäuse extra für Intels Gen11-Plattform optimiert hat. Es ist minimal schwerer und dicker als das Dell, aber die höhere Leistung, das Mehr an Anschlussmöglichkeiten und das stabilere Design dürften es wert sein.
Die Kehrseite der Medaille ist, dass das Book 13 auf eine Handvoll üblicher Sicherheitsfunktionen verzichtet, darunter einen Fingerabdrucksensor oder auch ein Kensington-Port. Auch ein fortschrittliches vPro oder freihändige Login-Möglichkeiten wie beim Latitude 7400 oder HP EliteBook x360 1030 G7 sucht man vergebens. Die RGB-beleuchteten Tasten sind zwar optisch ansprechend, haben aber ein schwächeres Feedback als die meisten anderen Business-Subnotebooks. Und nennt uns altmodisch, aber dedizierte Maustasten und ein größerer Öffnungswinkel der Scharniere wie bei den meisten Lenovo ThinkPads fühlen sich einfach ergonomischer und komfortabler an wenn man unterwegs ist. Wer allerdings ein schickes Design und schnelle Performance in einem 13-Zoll-Gerät gegenüber den oben genannten Kritikpunkten mehr Priorität einräumt, sollte mit dem Book 13 glücklich werden.
Das Razer Book 13 ist ein herausragender Intel-Evo-Laptop, dessen Leistung und Anschlussmöglichkeiten das schnittige Aussehen unterstreichen. Allerdings fehlen einige Sicherheitsfunktionen und die bescheidene Tastatur sowie das schwammige Touchpad liegen etwas unterhalb des Standards traditionellerer Business-Laptops.
Razer Book 13 FHD
- 13.12.2020 v7 (old)
Allen Ngo
Preisvergleich

