Notebookcheck Logo

Dell XPS 13 9310 Core i7 Laptop im Test: Tiger Lake macht den Unterschied

Intel Evo(lution).

Intels Tiger-Lake-Chips der zehnten Generation führten bedeutende Verbesserungen der Grafikleistung gegenüber der alternden UHD Graphics 620 ein. Die Tiger-Lake-Serie der elften Generation ist nun ein weiterer großer Sprung. Die CPU-Leistung hat sich jedoch nicht allzu sehr verändert.

Kaum ist das Dell XPS 13 9300 ein Jahr alt, ist bereits sein Nachfolger im Handel. Das neuere Modell mit der Bezeichnung XPS 13 9310 ersetzt die Intel-Ice-Lake-CPU der 10. Generation durch Tiger-Lake-Optionen der 11. Generation sowie schnellere Speichertaktfrequenzen. Ansonsten ist das XPS 13 9310 optisch identisch mit seinem unmittelbaren Vorgänger.

Für diesen Testbericht vergleichen wir die Leistung des 9310 mit der des 9300, um zu sehen, wie viel Leistungszuwachs die Anwender erwarten können und wie sich die Temperaturen, Laufzeiten, Anzeigequalität oder der Stromverbrauch zwischen ihnen - wenn überhaupt - unterscheiden. Weitere Informationen über das Gehäuse und andere physikalische Merkmale finden Sie in unserem bestehenden XPS 13 9300 Testbericht hier.


Weitere Laptops von Dell im Notebookcheck:

Dell XPS 13 9310 Core i7 FHD (XPS 13 9310 Serie)
Prozessor
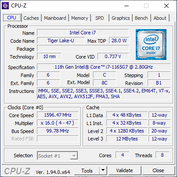
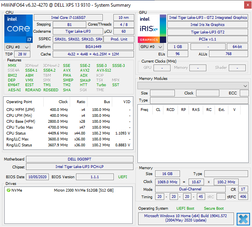
Intel Core i7-1165G7 4 x 2.8 - 4.7 GHz, Tiger Lake-UP3
Grafikkarte
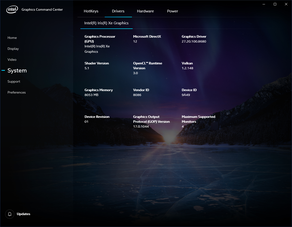
Intel Iris Xe Graphics G7 96EUs, Kerntakt: 400 MHz, Speichertakt: 1600 MHz, LPDDR4x, 27.20.100.8680
RAM
16 GB 
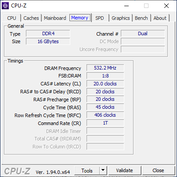
, LPDDR4x 2133.3 MHz, 20-20-20-45, Dual-Channel, Soldered
Bildschirm
13.40 Zoll 16:10, 1920 x 1200 Pixel 169 PPI, 10-point capacitive, Sharp LQ134N1, IPS, SHP14F9 controller, Dell P/N: VVK8Y, spiegelnd: ja, 60 Hz
Mainboard
Intel Tiger Lake-UP3 PCH-LP
Massenspeicher
Micron 2300 512GB MTFDHBA512TDV, 512 GB 
Soundkarte
Intel Tiger Lake-U/Y PCH-LP - cAVS (Audio, Voice, Speech)
Anschlüsse
2 USB 3.1 Gen2, 2 Thunderbolt, USB-C Power Delivery (PD), 2 DisplayPort, Audio Anschlüsse: 3.5 mm combo, Card Reader: MicroSD, Helligkeitssensor

Netzwerk
Intel Killer Wi-Fi 6 AX1650s (ax = Wi-Fi 6/), Bluetooth 5.1
Abmessungen
Höhe x Breite x Tiefe (in mm): 14.8 x 296 x 199
Akku
52 Wh Lithium-Polymer
Betriebssystem
Microsoft Windows 10 Home 64 Bit
Kamera
Webcam: 720p
Primary Camera: 0.9 MPix
Sonstiges
Lautsprecher: Stereo 2x 2.5 W, Tastatur: Chiclet, Tastatur-Beleuchtung: ja, Dell Mobile Connect, Power Manager, Update, CinemaCenter, Digital Delivery, 12 Monate Garantie
Gewicht
1.292 kg, Netzteil: 218 g
Preis
1500 USD
Hinweis: Der Hersteller kann abweichende Bauteile wie Bildschirme, Laufwerke und Speicherriegel mit ähnlichen Spezifikationen unter dem gleichen Modellnamen einsetzen.


Bew.
Datum
Modell
Gewicht
Dicke
Größe
Auflösung
Preis ab
88.1 %
v7 (old)
10 / 2020
Dell XPS 13 9310 Core i7 FHD
i7-1165G7, Iris Xe G7 96EUs
1.3 kg14.8 mm13.40"1920x1200
88.9 %
v7 (old)
03 / 2020
Dell XPS 13 9300 Core i7-1065G7
i7-1065G7, Iris Plus Graphics G7 (Ice Lake 64 EU)
1.2 kg14.8 mm13.40"1920x1200
92.1 %
v7 (old)
06 / 2020
Apple MacBook Pro 13 2020 2GHz i5 10th-Gen
i5-1038NG7, Iris Plus Graphics G7 (Ice Lake 64 EU)
1.4 kg15.6 mm13.30"2560x1600
87.4 %
v7 (old)
06 / 2020
Huawei MateBook X Pro 2020 i7
i7-10510U, GeForce MX250
1.3 kg14.6 mm13.90"3000x2000
85.3 %
v7 (old)
08 / 2020
Lenovo Yoga Slim 7-14ARE
R7 4800U, Vega 8
1.4 kg14.9 mm14.00"1920x1080
88.4 %
v7 (old)
12 / 2019
HP Spectre x360 13-aw0013dx
i7-1065G7, Iris Plus Graphics G7 (Ice Lake 64 EU)
1.2 kg16.9 mm13.30"1920x1080

Gehäuse

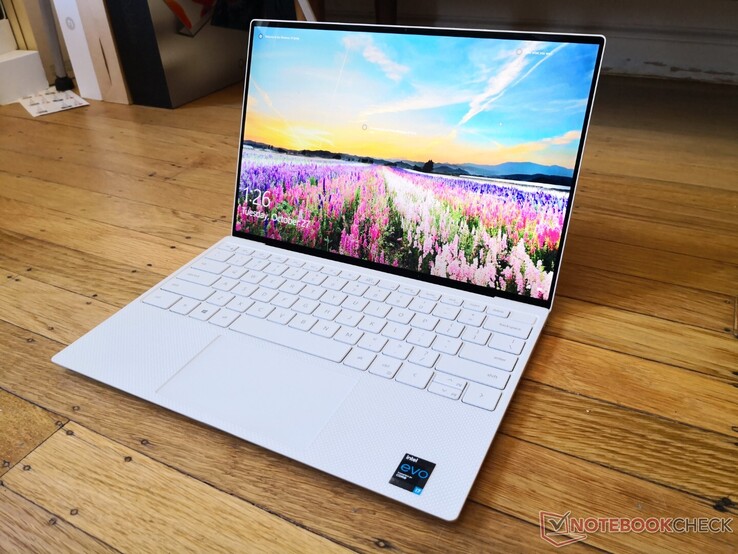
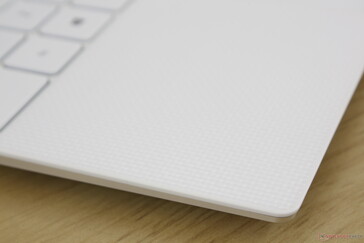
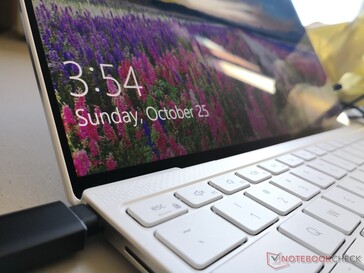
Dell hat das aktuelle 16:10-Design des XPS 13 Anfang dieses Jahres mit dem XPS 13 9300 eingeführt, so dass das XPS 13 9310 noch relativ neu ist, auch wenn es keine größeren visuellen Aktualisierungen gibt. Am bemerkenswertesten ist vielleicht, dass die weiße glasgewebte Farboption der älteren 16:9 XPS 13-Serie zurückgekehrt ist, während das XPS 9300 nur in Schwarz erhältlich war. Der Hauptanreiz der weißen Option ist vor allem ästhetischer Natur, da unansehnliche Fingerabdrücke nicht so offensichtlich sind.

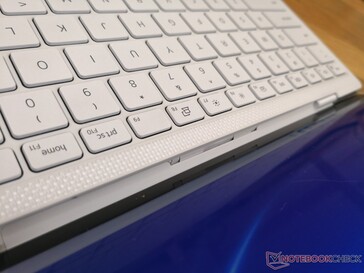
Texturierte weiße Handballenauflagen weisen Fingerabdrücke wesentlich besser ab als die normale schwarze Version
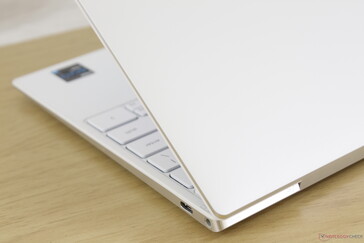
Das gleiche Design wie beim XPS 13 9300
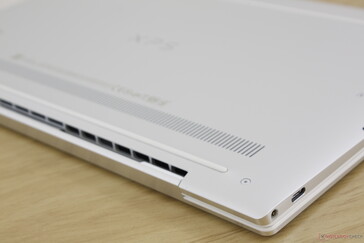
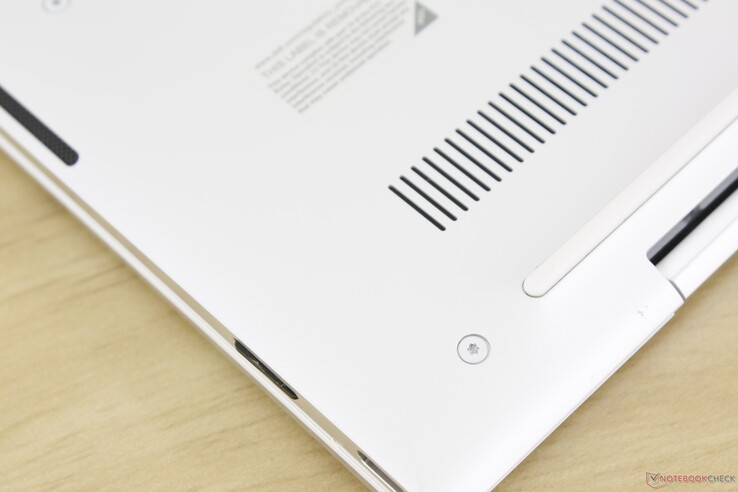
Lüftungsgitter sind unter den Scharnieren versteckt
Hohes Bildschirm-zu-Gehäuse-Verhältnis durch schmale Einfassungen auf allen vier Seiten
Noch immer kein Kameraverschluss oder -knopf für zusätzliche Privatsphäre
Deckel bis zum maximalen Winkel geöffnet
320.6 mm 208.2 mm 14.9 mm 1.4 kg306 mm 194.5 mm 16.9 mm 1.2 kg304.1 mm 212.4 mm 15.6 mm 1.4 kg304 mm 217 mm 14.6 mm 1.3 kg296 mm 199 mm 14.8 mm 1.3 kg296 mm 199 mm 14.8 mm 1.2 kg297 mm 210 mm 1 mm 5.7 g

Ausstattung

Vorne: Keine Anschlüsse
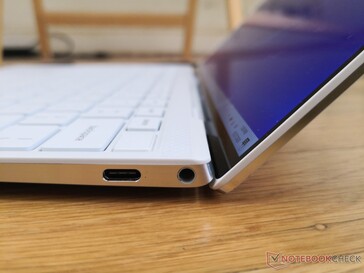
Rechts: USB Typ-C mit DisplayPort + Thunderbolt 3, 3,5 mm Kombi-Audio
Hinten: Keine Anschlüsse
Links: USB Type-C mit DisplayPort + Thunderbolt 3, MicroSD reader

SD-Karten-Lesegerät

Vollständig eingesetzter MicroSD-Leser sitzt fast bündig am Rand
SD Card Reader
average JPG Copy Test (av. of 3 runs)
Dell XPS 13 9310 Core i7 FHD
  (Toshiba Exceria Pro M501 64 GB UHS-II)
194.7 MB/s
HP Spectre x360 13-aw0013dx
  (Toshiba Exceria Pro M501 microSDXC 64GB)
155.2 MB/s -20%
Dell XPS 13 9300 Core i7-1065G7
  (Toshiba Exceria Pro M501 64 GB UHS-II)
146.3 MB/s -25%
Lenovo Yoga Slim 7-14ARE
  (Toshiba Exceria Pro M501 64 GB UHS-II)
36.3 MB/s -81%
maximum AS SSD Seq Read Test (1GB)
Dell XPS 13 9310 Core i7 FHD
  (Toshiba Exceria Pro M501 64 GB UHS-II)
204.2 MB/s
Dell XPS 13 9300 Core i7-1065G7
  (Toshiba Exceria Pro M501 64 GB UHS-II)
187.3 MB/s -8%
HP Spectre x360 13-aw0013dx
  (Toshiba Exceria Pro M501 microSDXC 64GB)
185.7 MB/s -9%
Lenovo Yoga Slim 7-14ARE
  (Toshiba Exceria Pro M501 64 GB UHS-II)
37.8 MB/s -81%

Kommunikation

Für Wi-Fi-6- und Bluetooth-5.1-Konnektivität ist wieder der Intel-Killer-AX1650s standardmäßig verbaut. Obwohl wir bei der Kopplung mit unserem Netgear RAX200-Router keine Verbindungsprobleme hatten, sind die Übertragungsraten im zweiten Jahr in Folge nicht annähernd so schnell wie die Empfangsraten.

Nicht entfernbares WLAN-Modul
Networking
iperf3 transmit AX12
Lenovo Yoga Slim 7-14ARE
Intel Wi-Fi 6 AX200
1461 (1327min - 1616max) MBit/s +50%
Huawei MateBook X Pro 2020 i7
Intel Wireless-AC 9560
1338 (1304min - 1355max) MBit/s +37%
Dell XPS 13 9310 Core i7 FHD
Intel Killer Wi-Fi 6 AX1650s
975 (786min - 1026max) MBit/s
Dell XPS 13 9300 Core i7-1065G7
Intel Killer Wi-Fi 6 AX1650s
852 (232min - 1307max) MBit/s -13%
Apple MacBook Pro 13 2020 2GHz i5 10th-Gen
802.11 a/b/g/n/ac
809 MBit/s -17%
iperf3 receive AX12
Dell XPS 13 9310 Core i7 FHD
Intel Killer Wi-Fi 6 AX1650s
1439 (1386min - 1504max) MBit/s
Dell XPS 13 9300 Core i7-1065G7
Intel Killer Wi-Fi 6 AX1650s
1360 (1290min - 1408max) MBit/s -5%
Lenovo Yoga Slim 7-14ARE
Intel Wi-Fi 6 AX200
1343 (1313min - 1380max) MBit/s -7%
Huawei MateBook X Pro 2020 i7
Intel Wireless-AC 9560
1293 (628min - 1379max) MBit/s -10%
Apple MacBook Pro 13 2020 2GHz i5 10th-Gen
802.11 a/b/g/n/ac
765 MBit/s -47%
05010015020025030035040045050055060065070075080085090095010001050110011501200125013001350140014501500Tooltip
Dell XPS 13 9310 Core i7 FHD; iperf3 receive AX12; iperf 3.1.3: Ø1439 (1386-1504)
Dell XPS 13 9310 Core i7 FHD; iperf3 transmit AX12; iperf 3.1.3: Ø975 (786-1026)

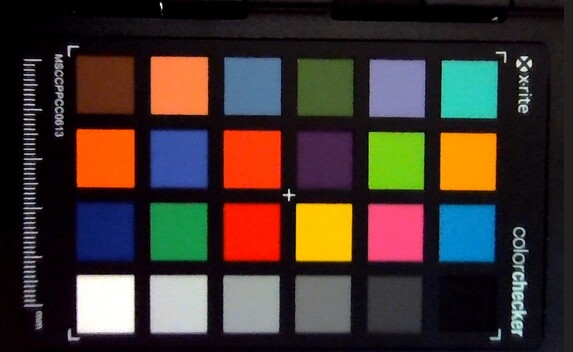
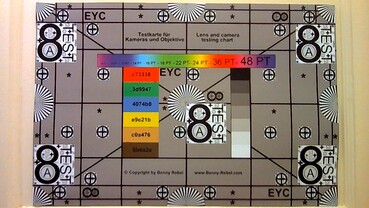
Webcam

ColorChecker
12.9 ∆E
15.4 ∆E
3.9 ∆E
5.3 ∆E
3 ∆E
6.3 ∆E
12.3 ∆E
4.4 ∆E
20 ∆E
8.7 ∆E
8.3 ∆E
8.3 ∆E
10.1 ∆E
4.1 ∆E
19 ∆E
6 ∆E
15.7 ∆E
12 ∆E
2.9 ∆E
3.1 ∆E
3.2 ∆E
2.7 ∆E
9.8 ∆E
13.8 ∆E
ColorChecker Dell XPS 13 9310 Core i7 FHD: 8.8 ∆E min: 2.66 - max: 19.97 ∆E

Wartung

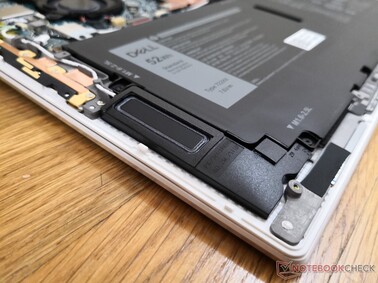
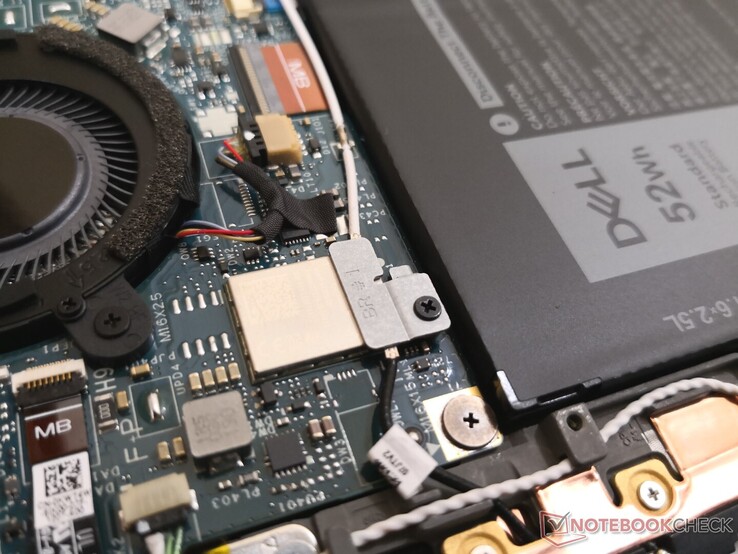
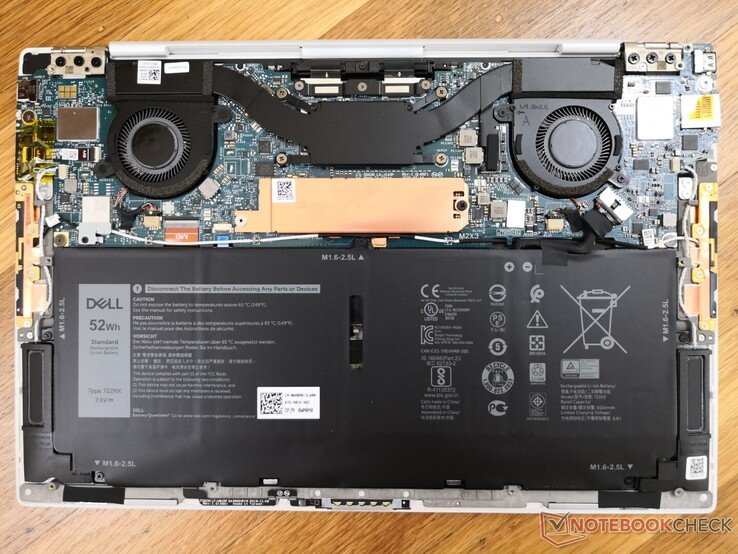
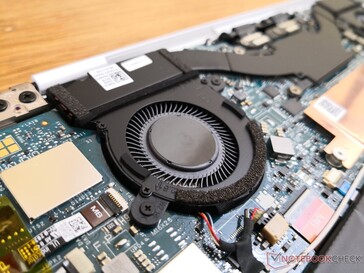
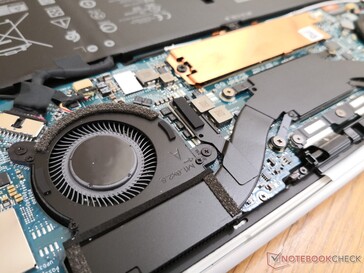
Es gibt keine größeren Änderungen im Innenleben des Systems.

Zubehör

Die Box enthält einen USB-C-zu-USB-A-Adapter und einen praktischen Stromkabeladapter, sodass Sie kein zwei- oder dreipoliges Stromkabel überallhin mitnehmen müssen.

Eingabegeräte

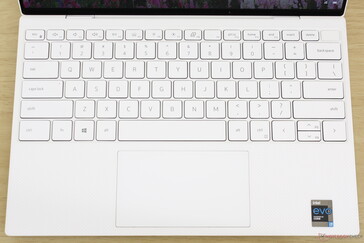
Identisches Tastaturlayout zum XPS 13 9300
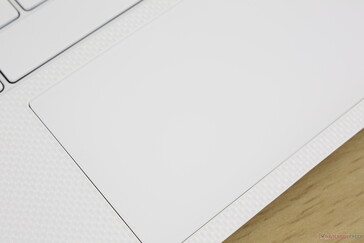
Großes 11.2 x 6.5 cm Clickpad
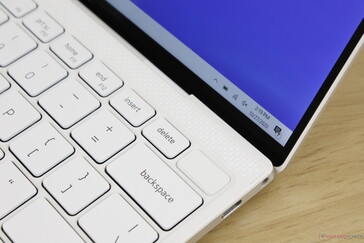
Im Gegensatz zur schwarzen Version mit schwarzen Tastenkappen kontrastieren die weißen Tastenkappen hier nicht sehr gut mit der Beschriftung
Die Auf- und Ab-Pfeiltasten sind nach wie vor halb so groß und beengt

Display

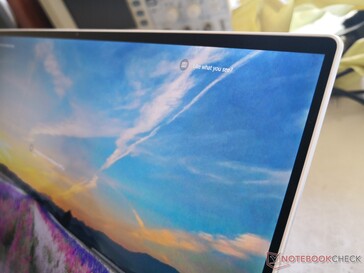
Das 9310 verwendet das gleiche Sharp-LQ134N1-IPS-Panel wie das XPS 13 9300, jedoch mit leicht unterschiedlichen Helligkeitsstufen und PWM-Werten. Displays auf XPS-Laptops gehörten schon immer zu den besten ihrer jeweiligen Kategorie, und dies gilt auch für das 9310. Hauptnachteile sind nach wie vor die relativ langsamen Reaktionszeiten und das Fehlen von adaptiver Synchronisierung als auch einer OLED-Optionen. Das AMD-basierte Lenovo Yoga Slim 7 ist beispielsweise mit Adaptive-Sync ausgestattet, um Screen-Tearing zu reduzieren.

Rand-zu-Rand-Gorilla-Glas. Obwohl Optionen ohne Touch-Funktion verfügbar sind, gibt es keine ohne Gorilla-Glas.
Die Webcam befindet sich trotz der schmalen Einfassungen am oberen Rand
Keine größeren Probleme mit ungleichmäßigem Backlight-Bleeding
Scharfe RGB-Subpixel ohne Körnigkeitsprobleme
502.3
cd/m²
519.7
cd/m²
511.4
cd/m²
544.3
cd/m²
543.3
cd/m²
544.3
cd/m²
523.7
cd/m²
513
cd/m²
517.7
cd/m²
Ausleuchtung des Bildschirms
Sharp LQ134N1 getestet mit X-Rite i1Pro 2
Maximal: 544.3 cd/m² (Nits) Durchschnitt: 524.4 cd/m² Minimum: 60.2 cd/m²
Ausleuchtung: 92 %
Helligkeit Akku: 543.3 cd/m²
Kontrast: 1430:1 (Schwarzwert: 0.38 cd/m²)
ΔE Color 3.02 | 0.5-29.43 Ø4.91, calibrated: 1.23
ΔE Greyscale 5 | 0.5-98 Ø5.2
99.6% sRGB (Argyll 1.6.3 3D)
66.8% AdobeRGB 1998 (Argyll 1.6.3 3D)
72.9% AdobeRGB 1998 (Argyll 2.2.0 3D)
99.1% sRGB (Argyll 2.2.0 3D)
70.9% Display P3 (Argyll 2.2.0 3D)
Gamma: 2.02
Dell XPS 13 9310 Core i7 FHD
Sharp LQ134N1, IPS, 13.4", 1920x1200
Dell XPS 13 9300 Core i7-1065G7
Sharp LQ134N1, IPS, 13.4", 1920x1200
Apple MacBook Pro 13 2020 2GHz i5 10th-Gen
APPA03D, IPS, 13.3", 2560x1600
Huawei MateBook X Pro 2020 i7
JDI LPM139M422A, LTPS, 13.9", 3000x2000
Lenovo Yoga Slim 7-14ARE
AU Optronics B140HAN06.8, IPS, 14", 1920x1080
HP Spectre x360 13-aw0013dx
AU Optronics AUO5E2D, IPS, 13.3", 1920x1080
Display
-5%
20%
-4%
0%
-1%
Display P3 Coverage
70.9
66.3
-6%
98.8
39%
66.6
-6%
71.7
1%
69.6
-2%
sRGB Coverage
99.1
97.3
-2%
99.9
1%
99.4
0%
99.3
0%
98.9
0%
AdobeRGB 1998 Coverage
72.9
68.5
-6%
86.4
19%
68.6
-6%
72.9
0%
71.5
-2%
Response Times
2%
1501%
362%
12%
-14%
Response Time Grey 50% / Grey 80% *
52 ?(27.6, 24.4)
50 ?(22, 28)
4%
46 ?(22, 24)
12%
49.6 ?(23.6, 26)
5%
45.6 ?(23.6, 22)
12%
60.8 ?(26, 34.8)
-17%
Response Time Black / White *
33.2 ?(19.2, 14)
33.2 ?(16, 17.2)
-0%
32.4 ?(18.4, 14)
2%
30.8 ?(14, 16.8)
7%
29.6 ?(14.8, 14.8)
11%
36.8 ?(15.6, 21.2)
-11%
PWM Frequency
2475 ?(20)
2500 ?(25)
1%
113600 ?(75)
4490%
29070 ?(40)
1075%
Bildschirm
1%
19%
23%
-9%
-11%
Helligkeit Bildmitte
543.3
607.6
12%
512
-6%
557
3%
399.6
-26%
447.4
-18%
Brightness
524
595
14%
491
-6%
532
2%
385
-27%
420
-20%
Brightness Distribution
92
96
4%
91
-1%
87
-5%
89
-3%
85
-8%
Schwarzwert *
0.38
0.4
-5%
0.32
16%
0.33
13%
0.37
3%
0.31
18%
Kontrast
1430
1519
6%
1600
12%
1688
18%
1080
-24%
1443
1%
Delta E Colorchecker *
3.02
3.23
-7%
1.7
44%
1.4
54%
3.2
-6%
4.23
-40%
Colorchecker dE 2000 max. *
7.61
8.67
-14%
3.4
55%
2.5
67%
6.44
15%
9.34
-23%
Colorchecker dE 2000 calibrated *
1.23
1.01
18%
1
19%
0.7
43%
1.73
-41%
1.32
-7%
Delta E Graustufen *
5
5.5
-10%
1.9
62%
2
60%
4.7
6%
6.1
-22%
Gamma
2.02 109%
2.12 104%
2.19 100%
2.14 103%
2.21 100%
2.11 104%
CCT
6550 99%
6413 101%
6817 95%
6689 97%
7184 90%
6136 106%
Farbraum (Prozent von AdobeRGB 1998)
66.8
63
-6%
77.4
16%
62.5
-6%
66.3
-1%
64.8
-3%
Color Space (Percent of sRGB)
99.6
97.5
-2%
99.9
0%
99.5
0%
99.5
0%
98.9
-1%
Durchschnitt gesamt (Programm / Settings)
-1% / 0%
513% / 281%
127% / 78%
1% / -5%
-9% / -10%

* ... kleinere Werte sind besser

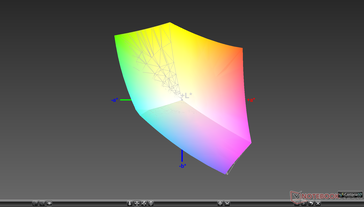
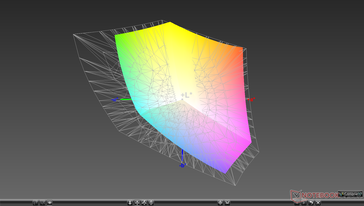
Alle XPS-13-9300/9310-SKUs erreichen eine 100-prozentige sRGB-Abdeckung, wobei es im Gegensatz zur XPS-15-Serie keine Optionen für vollständiges AdobeRGB oder DCI-P3 gibt. Dies sollte kein Problem sein, wenn Sie nicht professioneller Grafikeditor sind.

vs. sRGB
vs. sRGB
vs. AdobeRGB
vs. AdobeRGB

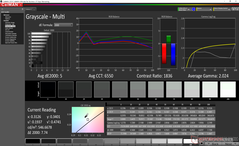
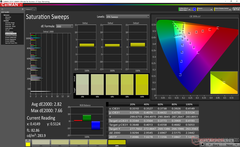
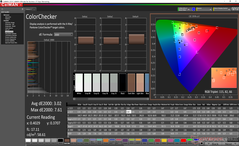
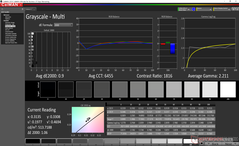
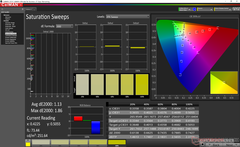
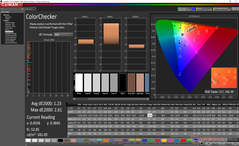
Der werkkonfigurierte Gammawert von 2,0 könnte besser sein. Durch eine eigene Kalibrierung des Displays mit einem X-Rite-Kolorimeter nähert sich der Gammawert dem 2,2-Zielwert, was zu besseren Graustufen und Farben in allen Bereichen führt.

Graustufen vor Kalibrierung
Sättigung vor Kalibrierung
Farben vor Kalibrierung
Graustufen nach Kalibrierung
Sättigung nach Kalibrierung
Farben nach Kalibrierung

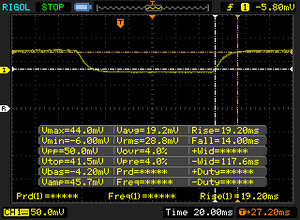
Reaktionszeiten (Response Times) des Displays

Die Reaktionszeiten (Response Times) beschreiben wie schnell zwischen zwei Farben eines Pixels umgeschaltet werden kann. Langsame Response Times können zu einer verschwommenen Darstellung, Schlieren und Geisterbilder führen. Besonders bei schnellen 3D-Spielen sind kurze Umschaltzeiten wichtig.
       Reaktionszeiten Schwarz zu Weiß
33.2 ms ... steigend ↗ und fallend ↘ kombiniert↗ 19.2 ms steigend
↘ 14 ms fallend
Die gemessenen Reaktionszeiten sind langsam und dadurch für viele Spieler wahrscheinlich zu langsam.
Im Vergleich rangierten die bei uns getesteten Geräte von 0.1 (Minimum) zu 240 (Maximum) ms. » 89 % aller Screens waren schneller als der getestete.
Daher sind die gemessenen Reaktionszeiten schlechter als der Durchschnitt aller vermessenen Geräte (20.9 ms).
       Reaktionszeiten 50% Grau zu 80% Grau
52 ms ... steigend ↗ und fallend ↘ kombiniert↗ 27.6 ms steigend
↘ 24.4 ms fallend
Die gemessenen Reaktionszeiten sind langsam und dadurch für viele Spieler wahrscheinlich zu langsam.
Im Vergleich rangierten die bei uns getesteten Geräte von 0.165 (Minimum) zu 636 (Maximum) ms. » 87 % aller Screens waren schneller als der getestete.
Daher sind die gemessenen Reaktionszeiten schlechter als der Durchschnitt aller vermessenen Geräte (32.8 ms).

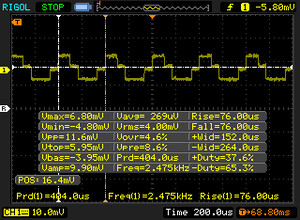
Bildschirm-Flackern / PWM (Pulse-Width Modulation)

Eine günstige Methode um die Helligkeit eines Bildschirms zu steuern, ist die Beleuchtung periodisch ein- und auszuschalten. Dies nennt sich PWM (Pulsweitenmodulation) Diese Umschaltung sollte mit einer hohen Frequenz stattfinden damit das menschliche Auge kein Flimmern wahrnimmt. Wenn die Frequenz zu niedrig ist, kann dies zu Ermüdungserscheinungen, Augenbrennen, Kopfweh und auch sichtbaren Flackern führen.
Flackern / PWM festgestellt 2475 Hz ≤ 20 % Helligkeit

Das Display flackert mit 2475 Hz (im schlimmsten Fall, eventuell durch Pulsweitenmodulation PWM) bei einer eingestellten Helligkeit von 20 % und darunter. Darüber sollte es zu keinem Flackern kommen.

Die Frequenz von 2475 Hz ist sehr hoch und sollte daher auch bei empfindlichen Personen zu keinen Problemen führen.

Im Vergleich: 53 % aller getesteten Geräte nutzten kein PWM um die Helligkeit zu reduzieren. Wenn PWM eingesetzt wurde, dann bei einer Frequenz von durchschnittlich 8705 (Minimum 5, Maximum 343500) Hz.

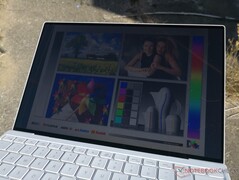
Draußen im Sonnenlicht
Draußen im Schatten. Auf dem glänzenden Bildschirm wird es immer ein wenig Blenden geben.
Draußen im Sonnenlicht
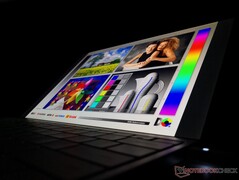
Breite IPS-Betrachtungswinkel. Farben und Kontrast verschlechtern sich nur geringfügig bei Betrachtung aus großen Winkeln

Leistung

Alle XPS-13-9310-SKUs sind entweder mit der Core i3-1115G4-, Core-i5-1135G7- oder Core-i7-1165G7-CPU mit 8 GB bis 32 GB 4267-MHz-RAM ausgestattet. Die integrierte Iris-Xe-Grafik ist bei allen Konfigurationen serienmäßig enthalten, bei der Core i3-1115G4-Option ist jedoch zu erwarten, dass sie langsamer und mit weniger EUs läuft.

Sofern nicht anders angegeben, wurden unsere nachstehenden Tests im Ultra-Performance-Modus durchgeführt, um die höchstmöglichen Punktzahlen für das System zu erzielen. Die Leistungsprofile finden Sie in der vorinstallierten Dell-Power-Manager-Software.


Prozessor

Als vierter Laptop in unserer Datenbank mit dem Core i7-1165G7 platziert sich das XPS-13-9310 dort, wo wir erwarten. Leider bedeutet dies auch, dass es keine großen Leistungssteigerungen gegenüber dem Core-i7-1065G7 des Vorjahres gibt.

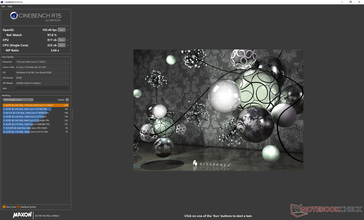
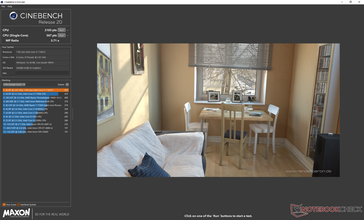
Dell setzt weiterhin auf Dynamic-Tuning, um so viel Leistung wie möglich aus dem Prozessor herauszuholen, und zwar im Rahmen der Möglichkeiten der darüber liegenden Kühllösung. Dies wird durch die zyklischen CineBench-R15-xT-Ergebnisse bei der Ausführung des Benchmarks in Schleife veranschaulicht, wie das unten stehende Diagramm im Vergleich zu den flacheren Ergebnissen der Asus-ZenBook-14-Serie mit derselben CPU zeigt. Die CineBench-R20-Bewertungen auf dem Core-i7-XPS-13-9300 können aufgrund der unterschiedlichen Taktraten zwischen 1.396 und 1.883 Punkten liegen. Wir gehen darauf genauer unten im Abschnitt Belastungstest ein.

CineBench R15
CineBench R15
CineBench R20
CineBench R20
050100150200250300350400450500550600650700750800850900Tooltip
Dell XPS 13 9310 Core i7 FHD Iris Xe G7 96EUs, i7-1165G7, Micron 2300 512GB MTFDHBA512TDV; CPU Multi 64Bit: Ø718 (617.03-918.32)
Dell XPS 13 9300 Core i7-1065G7 Iris Plus Graphics G7 (Ice Lake 64 EU), i7-1065G7, Intel SSDPEMKF512G8 NVMe SSD; CPU Multi 64Bit: Ø636 (559.86-812.55)
Asus ZenBook 14 UX425EA Iris Xe G7 96EUs, i7-1165G7, Intel SSD 660p 1TB SSDPEKNW010T8; CPU Multi 64Bit: Ø653 (629.83-862.05)
Asus ZenBook 14 UX434FL-DB77 GeForce MX250, i7-8565U, WDC PC SN520 SDAPNUW-512G; CPU Multi 64Bit: Ø547 (525.27-680.19)
Cinebench R20: CPU (Multi Core) | CPU (Single Core)
Cinebench R15: CPU Multi 64Bit | CPU Single 64Bit
Blender: v2.79 BMW27 CPU
7-Zip 18.03: 7z b 4 -mmt1 | 7z b 4
Geekbench 5.5: Single-Core | Multi-Core
HWBOT x265 Benchmark v2.2: 4k Preset
LibreOffice : 20 Documents To PDF
R Benchmark 2.5: Overall mean
Cinebench R20 / CPU (Multi Core)
Lenovo Yoga Slim 7-14ARE
AMD Ryzen 7 4800U
3213 Points +68%
Asus VivoBook Flip 14 TM420IA
AMD Ryzen 7 4700U
2829 Points +48%
Dell XPS 15 9500 Core i5
Intel Core i5-10300H
2107 Points +10%
HP Envy x360 13-ay0010nr
AMD Ryzen 5 4500U
2095 Points +10%
Apple MacBook Pro 13 2020 2GHz i5 10th-Gen
Intel Core i5-1038NG7
1998 Points +4%
Durchschnittliche Intel Core i7-1165G7
  (1060 - 2657, n=81)
1967 Points +3%
Dell XPS 13 9310 Core i7 FHD
Intel Core i7-1165G7
1913 Points
Dell XPS 13 9300 Core i7-1065G7
Intel Core i7-1065G7
1883 Points -2%
HP Spectre x360 13-aw0013dx
Intel Core i7-1065G7
1655 Points -13%
Acer Swift 3 SF314-42-R27B
AMD Ryzen 3 4300U
1432 Points -25%
Dell XPS 13 9300 4K UHD
Intel Core i7-1065G7
1396 Points -27%
Asus ZenBook 14 UX434FL-DB77
Intel Core i7-8565U
1394 Points -27%
Microsoft Surface Laptop Go Core i5
Intel Core i5-1035G1
1178 Points -38%
Huawei MateBook X Pro 2020 i7
Intel Core i7-10510U
1087 Points -43%
HP Elite Dragonfly-8MK79EA
Intel Core i5-8265U
1038 Points -46%
Cinebench R20 / CPU (Single Core)
Dell XPS 13 9310 Core i7 FHD
Intel Core i7-1165G7
559 Points
Durchschnittliche Intel Core i7-1165G7
  (442 - 589, n=81)
552 Points -1%
Lenovo Yoga Slim 7-14ARE
AMD Ryzen 7 4800U
474 Points -15%
Asus VivoBook Flip 14 TM420IA
AMD Ryzen 7 4700U
461 Points -18%
Dell XPS 13 9300 Core i7-1065G7
Intel Core i7-1065G7
458 Points -18%
Dell XPS 13 9300 4K UHD
Intel Core i7-1065G7
453 Points -19%
Dell XPS 15 9500 Core i5
Intel Core i5-10300H
446 Points -20%
Asus ZenBook 14 UX434FL-DB77
Intel Core i7-8565U
446 Points -20%
Apple MacBook Pro 13 2020 2GHz i5 10th-Gen
Intel Core i5-1038NG7
438 Points -22%
Acer Swift 3 SF314-42-R27B
AMD Ryzen 3 4300U
427 Points -24%
HP Envy x360 13-ay0010nr
AMD Ryzen 5 4500U
424 Points -24%
Microsoft Surface Laptop Go Core i5
Intel Core i5-1035G1
413 Points -26%
Huawei MateBook X Pro 2020 i7
Intel Core i7-10510U
403 Points -28%
HP Spectre x360 13-aw0013dx
Intel Core i7-1065G7
377 Points -33%
HP Elite Dragonfly-8MK79EA
Intel Core i5-8265U
370 Points -34%
Cinebench R15 / CPU Multi 64Bit
Lenovo Yoga Slim 7-14ARE
AMD Ryzen 7 4800U
1639 (1505.17min - 1639.01max) Points +79%
Asus VivoBook Flip 14 TM420IA
AMD Ryzen 7 4700U
1049 (803.97min - 1049.04max) Points +14%
Dell XPS 13 9310 Core i7 FHD
Intel Core i7-1165G7
918 Points
Dell XPS 15 9500 Core i5
Intel Core i5-10300H
889 (827.87min - 893.75max) Points -3%
Durchschnittliche Intel Core i7-1165G7
  (553 - 1027, n=86)
846 Points -8%
HP Envy x360 13-ay0010nr
AMD Ryzen 5 4500U
835 (768.42min - 834.85max) Points -9%
Apple MacBook Pro 13 2020 2GHz i5 10th-Gen
Intel Core i5-1038NG7
768 (720min - 768max) Points -16%
Dell XPS 13 9300 4K UHD
Intel Core i7-1065G7
760 (489.25min - 610.17max) Points -17%
Dell XPS 13 9300 Core i7-1065G7
Intel Core i7-1065G7
750 Points -18%
Asus ZenBook 14 UX434FL-DB77
Intel Core i7-8565U
680 (525.27min - 680.19max) Points -26%
HP Spectre x360 13-aw0013dx
Intel Core i7-1065G7
643 Points -30%
Huawei MateBook X Pro 2020 i7
Intel Core i7-10510U
590 (456.98min - 589.46max) Points -36%
Acer Swift 3 SF314-42-R27B
AMD Ryzen 3 4300U
580 Points -37%
Microsoft Surface Laptop Go Core i5
Intel Core i5-1035G1
527 (466.1min - 527.11max) Points -43%
HP Elite Dragonfly-8MK79EA
Intel Core i5-8265U
496 (406.64min - 496.34max) Points -46%
Cinebench R15 / CPU Single 64Bit
Dell XPS 13 9310 Core i7 FHD
Intel Core i7-1165G7
218 Points
Durchschnittliche Intel Core i7-1165G7
  (115 - 230, n=78)
212 Points -3%
Dell XPS 15 9500 Core i5
Intel Core i5-10300H
186 Points -15%
Lenovo Yoga Slim 7-14ARE
AMD Ryzen 7 4800U
182 Points -17%
Dell XPS 13 9300 4K UHD
Intel Core i7-1065G7
182 Points -17%
Asus VivoBook Flip 14 TM420IA
AMD Ryzen 7 4700U
182 Points -17%
Dell XPS 13 9300 Core i7-1065G7
Intel Core i7-1065G7
180 Points -17%
HP Spectre x360 13-aw0013dx
Intel Core i7-1065G7
178 Points -18%
Asus ZenBook 14 UX434FL-DB77
Intel Core i7-8565U
178 Points -18%
HP Envy x360 13-ay0010nr
AMD Ryzen 5 4500U
173 Points -21%
Huawei MateBook X Pro 2020 i7
Intel Core i7-10510U
171 Points -22%
Apple MacBook Pro 13 2020 2GHz i5 10th-Gen
Intel Core i5-1038NG7
169 Points -22%
Acer Swift 3 SF314-42-R27B
AMD Ryzen 3 4300U
165 Points -24%
Microsoft Surface Laptop Go Core i5
Intel Core i5-1035G1
161 Points -26%
HP Elite Dragonfly-8MK79EA
Intel Core i5-8265U
146 Points -33%
Blender / v2.79 BMW27 CPU
HP Elite Dragonfly-8MK79EA
Intel Core i5-8265U
1039 Seconds * -64%
Huawei MateBook X Pro 2020 i7
Intel Core i7-10510U
959 Seconds * -52%
Microsoft Surface Laptop Go Core i5
Intel Core i5-1035G1
944 Seconds * -49%
Acer Swift 3 SF314-42-R27B
AMD Ryzen 3 4300U
907 Seconds * -44%
Asus ZenBook 14 UX434FL-DB77
Intel Core i7-8565U
766 Seconds * -21%
Dell XPS 13 9300 4K UHD
Intel Core i7-1065G7
681 Seconds * -8%
Dell XPS 13 9310 Core i7 FHD
Intel Core i7-1165G7
632 Seconds *
Durchschnittliche Intel Core i7-1165G7
  (468 - 1138, n=80)
618 Seconds * +2%
HP Envy x360 13-ay0010nr
AMD Ryzen 5 4500U
605 Seconds * +4%
Dell XPS 15 9500 Core i5
Intel Core i5-10300H
508 Seconds * +20%
Asus VivoBook Flip 14 TM420IA
AMD Ryzen 7 4700U
447 Seconds * +29%
Lenovo Yoga Slim 7-14ARE
AMD Ryzen 7 4800U
322 Seconds * +49%
Apple MacBook Pro 13 2020 2GHz i5 10th-Gen
Intel Core i5-1038NG7
4.2 Seconds * +99%
7-Zip 18.03 / 7z b 4 -mmt1
Dell XPS 13 9310 Core i7 FHD
Intel Core i7-1165G7
5283 MIPS
Durchschnittliche Intel Core i7-1165G7
  (4478 - 5507, n=80)
5182 MIPS -2%
Dell XPS 15 9500 Core i5
Intel Core i5-10300H
4889 MIPS -7%
Huawei MateBook X Pro 2020 i7
Intel Core i7-10510U
4742 MIPS -10%
Dell XPS 13 9300 4K UHD
Intel Core i7-1065G7
4438 MIPS -16%
Lenovo Yoga Slim 7-14ARE
AMD Ryzen 7 4800U
4436 MIPS -16%
Asus VivoBook Flip 14 TM420IA
AMD Ryzen 7 4700U
4422 MIPS -16%
HP Envy x360 13-ay0010nr
AMD Ryzen 5 4500U
4281 MIPS -19%
Apple MacBook Pro 13 2020 2GHz i5 10th-Gen
Intel Core i5-1038NG7
4161 MIPS -21%
Acer Swift 3 SF314-42-R27B
AMD Ryzen 3 4300U
4014 MIPS -24%
Microsoft Surface Laptop Go Core i5
Intel Core i5-1035G1
3932 MIPS -26%
HP Elite Dragonfly-8MK79EA
Intel Core i5-8265U
3885 MIPS -26%
Asus ZenBook 14 UX434FL-DB77
Intel Core i7-8565U
3755 MIPS -29%
7-Zip 18.03 / 7z b 4
Lenovo Yoga Slim 7-14ARE
AMD Ryzen 7 4800U
44804 MIPS +115%
Asus VivoBook Flip 14 TM420IA
AMD Ryzen 7 4700U
31114 MIPS +49%
Dell XPS 15 9500 Core i5
Intel Core i5-10300H
24388 MIPS +17%
HP Envy x360 13-ay0010nr
AMD Ryzen 5 4500U
23237 MIPS +11%
Durchschnittliche Intel Core i7-1165G7
  (15347 - 27405, n=80)
22935 MIPS +10%
Dell XPS 13 9300 4K UHD
Intel Core i7-1065G7
21139 MIPS +1%
Dell XPS 13 9310 Core i7 FHD
Intel Core i7-1165G7
20843 MIPS
Apple MacBook Pro 13 2020 2GHz i5 10th-Gen
Intel Core i5-1038NG7
19485 MIPS -7%
Asus ZenBook 14 UX434FL-DB77
Intel Core i7-8565U
16748 MIPS -20%
Huawei MateBook X Pro 2020 i7
Intel Core i7-10510U
16346 MIPS -22%
Acer Swift 3 SF314-42-R27B
AMD Ryzen 3 4300U
15043 MIPS -28%
HP Elite Dragonfly-8MK79EA
Intel Core i5-8265U
13812 MIPS -34%
Microsoft Surface Laptop Go Core i5
Intel Core i5-1035G1
13715 MIPS -34%
Geekbench 5.5 / Single-Core
Dell XPS 13 9310 Core i7 FHD
Intel Core i7-1165G7
1547 Points
Durchschnittliche Intel Core i7-1165G7
  (1302 - 1595, n=77)
1524 Points -1%
Dell XPS 13 9300 4K UHD
Intel Core i7-1065G7
1324 Points -14%
Apple MacBook Pro 13 2020 2GHz i5 10th-Gen
Intel Core i5-1038NG7
1265 Points -18%
Dell XPS 15 9500 Core i5
Intel Core i5-10300H
1183 Points -24%
Asus ZenBook 14 UX434FL-DB77
Intel Core i7-8565U
1163 Points -25%
Asus VivoBook Flip 14 TM420IA
AMD Ryzen 7 4700U
1157 Points -25%
Lenovo Yoga Slim 7-14ARE
AMD Ryzen 7 4800U
1154 Points -25%
Lenovo Yoga Slim 7-14ARE
AMD Ryzen 7 4800U
1150 Points -26%
Microsoft Surface Laptop Go Core i5
Intel Core i5-1035G1
1144 Points -26%
HP Envy x360 13-ay0010nr
AMD Ryzen 5 4500U
1096 Points -29%
Acer Swift 3 SF314-42-R27B
AMD Ryzen 3 4300U
1027 Points -34%
Huawei MateBook X Pro 2020 i7
Intel Core i7-10510U
977 Points -37%
Geekbench 5.5 / Multi-Core
Lenovo Yoga Slim 7-14ARE
AMD Ryzen 7 4800U
6950 Points +22%
Lenovo Yoga Slim 7-14ARE
AMD Ryzen 7 4800U
5798 Points +2%
Dell XPS 13 9310 Core i7 FHD
Intel Core i7-1165G7
5682 Points
Asus VivoBook Flip 14 TM420IA
AMD Ryzen 7 4700U
5443 Points -4%
Durchschnittliche Intel Core i7-1165G7
  (3078 - 5926, n=77)
5155 Points -9%
Dell XPS 13 9300 4K UHD
Intel Core i7-1065G7
4855 Points -15%
Apple MacBook Pro 13 2020 2GHz i5 10th-Gen
Intel Core i5-1038NG7
4564 Points -20%
HP Envy x360 13-ay0010nr
AMD Ryzen 5 4500U
4469 Points -21%
Dell XPS 15 9500 Core i5
Intel Core i5-10300H
4399 Points -23%
Microsoft Surface Laptop Go Core i5
Intel Core i5-1035G1
3522 Points -38%
Acer Swift 3 SF314-42-R27B
AMD Ryzen 3 4300U
3330 Points -41%
Asus ZenBook 14 UX434FL-DB77
Intel Core i7-8565U
2839 Points -50%
Huawei MateBook X Pro 2020 i7
Intel Core i7-10510U
2636 Points -54%
HWBOT x265 Benchmark v2.2 / 4k Preset
Lenovo Yoga Slim 7-14ARE
AMD Ryzen 7 4800U
10.77 fps +84%
Asus VivoBook Flip 14 TM420IA
AMD Ryzen 7 4700U
8.81 fps +51%
Dell XPS 15 9500 Core i5
Intel Core i5-10300H
7.28 fps +25%
HP Envy x360 13-ay0010nr
AMD Ryzen 5 4500U
6.7 fps +15%
Durchschnittliche Intel Core i7-1165G7
  (1.39 - 8.47, n=80)
6.3 fps +8%
Dell XPS 13 9300 4K UHD
Intel Core i7-1065G7
6.08 fps +4%
Apple MacBook Pro 13 2020 2GHz i5 10th-Gen
Intel Core i5-1038NG7
5.99 fps +3%
Dell XPS 13 9310 Core i7 FHD
Intel Core i7-1165G7
5.84 fps
Asus ZenBook 14 UX434FL-DB77
Intel Core i7-8565U
4.82 fps -17%
Acer Swift 3 SF314-42-R27B
AMD Ryzen 3 4300U
4.37 fps -25%
Microsoft Surface Laptop Go Core i5
Intel Core i5-1035G1
3.89 fps -33%
Huawei MateBook X Pro 2020 i7
Intel Core i7-10510U
3.88 fps -34%
HP Elite Dragonfly-8MK79EA
Intel Core i5-8265U
3.51 fps -40%
LibreOffice / 20 Documents To PDF
Apple MacBook Pro 13 2020 2GHz i5 10th-Gen
Intel Core i5-1038NG7
88.6 s * -92%
Dell XPS 13 9300 4K UHD
Intel Core i7-1065G7
85.3 s * -85%
Asus ZenBook 14 UX434FL-DB77
Intel Core i7-8565U
69.6 s * -51%
Microsoft Surface Laptop Go Core i5
Intel Core i5-1035G1
64.5 s * -40%
Dell XPS 15 9500 Core i5
Intel Core i5-10300H
63.6 s * -38%
Acer Swift 3 SF314-42-R27B
AMD Ryzen 3 4300U
62.2 s * -35%
HP Envy x360 13-ay0010nr
AMD Ryzen 5 4500U
61.8 s * -34%
Lenovo Yoga Slim 7-14ARE
AMD Ryzen 7 4800U
57.8 s * -25%
Asus VivoBook Flip 14 TM420IA
AMD Ryzen 7 4700U
57 s * -23%
Huawei MateBook X Pro 2020 i7
Intel Core i7-10510U
56.1 s * -21%
Durchschnittliche Intel Core i7-1165G7
  (21.5 - 88.1, n=78)
49.2 s * -6%
Dell XPS 13 9310 Core i7 FHD
Intel Core i7-1165G7
46.2 s *
R Benchmark 2.5 / Overall mean
Asus ZenBook 14 UX434FL-DB77
Intel Core i7-8565U
0.851 sec * -45%
Microsoft Surface Laptop Go Core i5
Intel Core i5-1035G1
0.743 sec * -27%
Apple MacBook Pro 13 2020 2GHz i5 10th-Gen
Intel Core i5-1038NG7
0.702 sec * -20%
Acer Swift 3 SF314-42-R27B
AMD Ryzen 3 4300U
0.686 sec * -17%
Dell XPS 13 9300 4K UHD
Intel Core i7-1065G7
0.682 sec * -16%
Dell XPS 15 9500 Core i5
Intel Core i5-10300H
0.646 sec * -10%
Huawei MateBook X Pro 2020 i7
Intel Core i7-10510U
0.642 sec * -10%
HP Envy x360 13-ay0010nr
AMD Ryzen 5 4500U
0.629 sec * -7%
Lenovo Yoga Slim 7-14ARE
AMD Ryzen 7 4800U
0.613 sec * -5%
Asus VivoBook Flip 14 TM420IA
AMD Ryzen 7 4700U
0.611 sec * -4%
Durchschnittliche Intel Core i7-1165G7
  (0.552 - 1.002, n=80)
0.594 sec * -1%
Dell XPS 13 9310 Core i7 FHD
Intel Core i7-1165G7
0.586 sec *
Cinebench R20: CPU (Multi Core) | CPU (Single Core)
Cinebench R15: CPU Multi 64Bit | CPU Single 64Bit
Blender: v2.79 BMW27 CPU
7-Zip 18.03: 7z b 4 -mmt1 | 7z b 4
Geekbench 5.5: Single-Core | Multi-Core
HWBOT x265 Benchmark v2.2: 4k Preset
LibreOffice : 20 Documents To PDF
R Benchmark 2.5: Overall mean

* ... kleinere Werte sind besser

Cinebench R15 CPU Multi 64Bit
918 Points
Cinebench R15 OpenGL 64Bit
102 fps
Cinebench R15 Ref. Match 64Bit
97.8 %
Cinebench R15 CPU Single 64Bit
218 Points
Cinebench R20 CPU (Multi Core)
1913 Points
Cinebench R20 CPU (Single Core)
559 Points
Hilfe

Systemleistung

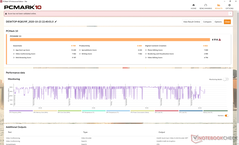
Die PCMark-Benchmarks liegen durchweg um mindestens zweistellige Prozentpunkte höher als die des letztjährigen XPS-13-9300 mit Ice-Lake-Power, was wahrscheinlich auf die schnellere integrierte GPU zurückzuführen ist. Das preiswertere AMD-betriebene Lenovo Yoga Slim 7 mit Lenovo-Antrieb liegt jedoch immer noch an der Spitze.

Während unserer Zeit mit dem Testgerät startete sich das System eines Nachts zufällig selbst neu, um sein BIOS zu aktualisieren. Es blieb dann fast 20 Minuten lang auf dem Startbildschirm hängen, bevor es schließlich in den abgesicherten Modus von Windows wechselte. Nach dem Neustart von dort war das System wieder normal, aber der gesamte Prozess war definitiv eine unerwünschte Erfahrung, insbesondere auf einem neuen Flaggschiff-Laptop.


PCMark 10 Standard
PCMark 10 Standard
PCMark 8 Home Accelerated
PCMark 8 Work Accelerated
PCMark 10
Score
Lenovo Yoga Slim 7-14ARE
Vega 8, R7 4800U, Samsung SSD PM981a MZVLB512HBJQ
5383 Points +10%
Durchschnittliche Intel Core i7-1165G7, Intel Iris Xe Graphics G7 96EUs
  (4531 - 5454, n=50)
4959 Points +1%
Dell XPS 13 9310 Core i7 FHD
Iris Xe G7 96EUs, i7-1165G7, Micron 2300 512GB MTFDHBA512TDV
4914 Points
HP Spectre x360 13-aw0013dx
Iris Plus Graphics G7 (Ice Lake 64 EU), i7-1065G7, Intel Optane Memory H10 with Solid State Storage 32GB + 512GB HBRPEKNX0202A(L/H)
4522 Points -8%
Dell XPS 13 9300 Core i7-1065G7
Iris Plus Graphics G7 (Ice Lake 64 EU), i7-1065G7, Intel SSDPEMKF512G8 NVMe SSD
4154 Points -15%
Huawei MateBook X Pro 2020 i7
GeForce MX250, i7-10510U, Samsung PM981a MZVLB1T0HBLR
3861 Points -21%
Apple MacBook Pro 13 2020 2GHz i5 10th-Gen
Iris Plus Graphics G7 (Ice Lake 64 EU), i5-1038NG7, Apple SSD SM0512F
3222 Points -34%
Essentials
Durchschnittliche Intel Core i7-1165G7, Intel Iris Xe Graphics G7 96EUs
  (8997 - 11505, n=50)
10014 Points +3%
Dell XPS 13 9310 Core i7 FHD
Iris Xe G7 96EUs, i7-1165G7, Micron 2300 512GB MTFDHBA512TDV
9749 Points
HP Spectre x360 13-aw0013dx
Iris Plus Graphics G7 (Ice Lake 64 EU), i7-1065G7, Intel Optane Memory H10 with Solid State Storage 32GB + 512GB HBRPEKNX0202A(L/H)
9664 Points -1%
Lenovo Yoga Slim 7-14ARE
Vega 8, R7 4800U, Samsung SSD PM981a MZVLB512HBJQ
9637 Points -1%
Dell XPS 13 9300 Core i7-1065G7
Iris Plus Graphics G7 (Ice Lake 64 EU), i7-1065G7, Intel SSDPEMKF512G8 NVMe SSD
8763 Points -10%
Huawei MateBook X Pro 2020 i7
GeForce MX250, i7-10510U, Samsung PM981a MZVLB1T0HBLR
8190 Points -16%
Apple MacBook Pro 13 2020 2GHz i5 10th-Gen
Iris Plus Graphics G7 (Ice Lake 64 EU), i5-1038NG7, Apple SSD SM0512F
7827 Points -20%
Productivity
Lenovo Yoga Slim 7-14ARE
Vega 8, R7 4800U, Samsung SSD PM981a MZVLB512HBJQ
7631 Points +12%
Huawei MateBook X Pro 2020 i7
GeForce MX250, i7-10510U, Samsung PM981a MZVLB1T0HBLR
7334 Points +7%
HP Spectre x360 13-aw0013dx
Iris Plus Graphics G7 (Ice Lake 64 EU), i7-1065G7, Intel Optane Memory H10 with Solid State Storage 32GB + 512GB HBRPEKNX0202A(L/H)
7051 Points +3%
Dell XPS 13 9310 Core i7 FHD
Iris Xe G7 96EUs, i7-1165G7, Micron 2300 512GB MTFDHBA512TDV
6838 Points
Durchschnittliche Intel Core i7-1165G7, Intel Iris Xe Graphics G7 96EUs
  (5570 - 7136, n=50)
6711 Points -2%
Dell XPS 13 9300 Core i7-1065G7
Iris Plus Graphics G7 (Ice Lake 64 EU), i7-1065G7, Intel SSDPEMKF512G8 NVMe SSD
5759 Points -16%
Apple MacBook Pro 13 2020 2GHz i5 10th-Gen
Iris Plus Graphics G7 (Ice Lake 64 EU), i5-1038NG7, Apple SSD SM0512F
3568 Points -48%
Digital Content Creation
Lenovo Yoga Slim 7-14ARE
Vega 8, R7 4800U, Samsung SSD PM981a MZVLB512HBJQ
5758 Points +19%
Durchschnittliche Intel Core i7-1165G7, Intel Iris Xe Graphics G7 96EUs
  (4083 - 5550, n=50)
4937 Points +2%
Dell XPS 13 9310 Core i7 FHD
Iris Xe G7 96EUs, i7-1165G7, Micron 2300 512GB MTFDHBA512TDV
4832 Points
Dell XPS 13 9300 Core i7-1065G7
Iris Plus Graphics G7 (Ice Lake 64 EU), i7-1065G7, Intel SSDPEMKF512G8 NVMe SSD
3856 Points -20%
HP Spectre x360 13-aw0013dx
Iris Plus Graphics G7 (Ice Lake 64 EU), i7-1065G7, Intel Optane Memory H10 with Solid State Storage 32GB + 512GB HBRPEKNX0202A(L/H)
3684 Points -24%
Apple MacBook Pro 13 2020 2GHz i5 10th-Gen
Iris Plus Graphics G7 (Ice Lake 64 EU), i5-1038NG7, Apple SSD SM0512F
3256 Points -33%
Huawei MateBook X Pro 2020 i7
GeForce MX250, i7-10510U, Samsung PM981a MZVLB1T0HBLR
2621 Points -46%
PCMark 8
Home Score Accelerated v2
Lenovo Yoga Slim 7-14ARE
Vega 8, R7 4800U, Samsung SSD PM981a MZVLB512HBJQ
4657 Points +6%
Durchschnittliche Intel Core i7-1165G7, Intel Iris Xe Graphics G7 96EUs
  (3769 - 5686, n=17)
4459 Points +1%
Dell XPS 13 9310 Core i7 FHD
Iris Xe G7 96EUs, i7-1165G7, Micron 2300 512GB MTFDHBA512TDV
4407 Points
Apple MacBook Pro 13 2020 2GHz i5 10th-Gen
Iris Plus Graphics G7 (Ice Lake 64 EU), i5-1038NG7, Apple SSD SM0512F
3928 Points -11%
HP Spectre x360 13-aw0013dx
Iris Plus Graphics G7 (Ice Lake 64 EU), i7-1065G7, Intel Optane Memory H10 with Solid State Storage 32GB + 512GB HBRPEKNX0202A(L/H)
3911 Points -11%
Huawei MateBook X Pro 2020 i7
GeForce MX250, i7-10510U, Samsung PM981a MZVLB1T0HBLR
3841 Points -13%
Dell XPS 13 9300 Core i7-1065G7
Iris Plus Graphics G7 (Ice Lake 64 EU), i7-1065G7, Intel SSDPEMKF512G8 NVMe SSD
3825 Points -13%
Work Score Accelerated v2
Lenovo Yoga Slim 7-14ARE
Vega 8, R7 4800U, Samsung SSD PM981a MZVLB512HBJQ
5661 Points +84%
HP Spectre x360 13-aw0013dx
Iris Plus Graphics G7 (Ice Lake 64 EU), i7-1065G7, Intel Optane Memory H10 with Solid State Storage 32GB + 512GB HBRPEKNX0202A(L/H)
5227 Points +70%
Dell XPS 13 9300 Core i7-1065G7
Iris Plus Graphics G7 (Ice Lake 64 EU), i7-1065G7, Intel SSDPEMKF512G8 NVMe SSD
5039 Points +64%
Huawei MateBook X Pro 2020 i7
GeForce MX250, i7-10510U, Samsung PM981a MZVLB1T0HBLR
4599 Points +50%
Dell XPS 13 9310 Core i7 FHD
Iris Xe G7 96EUs, i7-1165G7, Micron 2300 512GB MTFDHBA512TDV
3073 Points
Durchschnittliche Intel Core i7-1165G7, Intel Iris Xe Graphics G7 96EUs
  (2431 - 3221, n=15)
2940 Points -4%
Apple MacBook Pro 13 2020 2GHz i5 10th-Gen
Iris Plus Graphics G7 (Ice Lake 64 EU), i5-1038NG7, Apple SSD SM0512F
2407 Points -22%
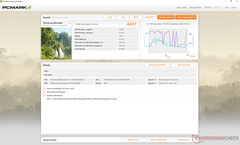
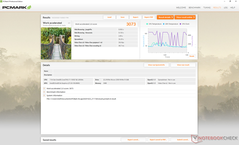
PCMark 8 Home Score Accelerated v2
4407 Punkte
PCMark 8 Work Score Accelerated v2
3073 Punkte
PCMark 10 Score
4914 Punkte
Hilfe

DPC Latenzen

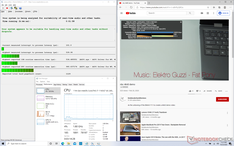
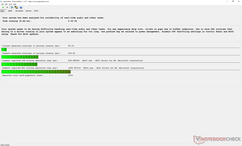
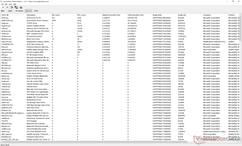
Das Öffnen mehrerer Browser-Tabs auf unserer Homepage führte laut LatencyMon zu keinen DPC-Latenzproblemen. Das Starten von Prime95 verursachte jedoch leichte Latenzen. Die 4K60-Wiedergabe ist bei unserem minutenlangen YouTube-Testvideo mit nur zwei dropped frames flüssig.

YouTube-Test
YouTube-Test
Prime95-Belastungstest
Treiber-Latenzen
Treiber-Latenzen
DPC Latencies / LatencyMon - interrupt to process latency (max), Web, Youtube, Prime95
Dell XPS 13 9300 Core i7-1065G7
Iris Plus Graphics G7 (Ice Lake 64 EU), i7-1065G7, Intel SSDPEMKF512G8 NVMe SSD
14995 μs * -1386%
Lenovo Yoga Slim 7-14ARE
Vega 8, R7 4800U, Samsung SSD PM981a MZVLB512HBJQ
2164 μs * -114%
Dell XPS 13 9310 Core i7 FHD
Iris Xe G7 96EUs, i7-1165G7, Micron 2300 512GB MTFDHBA512TDV
1009 μs *

* ... kleinere Werte sind besser

Massenspeicher

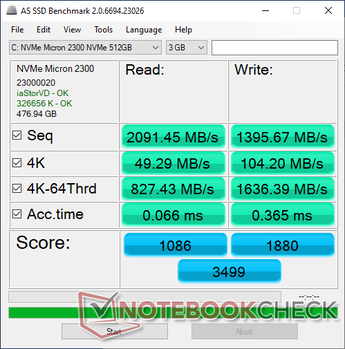
Während frühere XPS 13-Modelle mit M.2-NVMe-SSDs von Samsung, SK Hynix, Intel oder Toshiba ausgeliefert wurden, ist unser neuestes Gerät mit einer SSD von Micron ausgestattet. Es ist so ziemlich eine Art Roulette, welche SSD Sie beim Kauf eines XPS 13 zu einem bestimmten Zeitpunkt erhalten werden.

Zum Glück für uns ist das Micron 2200 ein High-End-NVMe-Laufwerk mit sequentiellen Lese- und Schreibgeschwindigkeiten von 3.300 MB/s bzw. 2.700 MB/s, und kommt damit der beliebten Samsung PM981-Serie nahe. Dennoch wären wir nicht überrascht, wenn Benutzer völlig andere Laufwerke erhalten, wenn sie SKUs mit unterschiedlichen SSD-Größen bestellen.

Weitere Speicherbenchmarks finden Sie in unserer Tabelle mobiler Festplatten und SSDs.


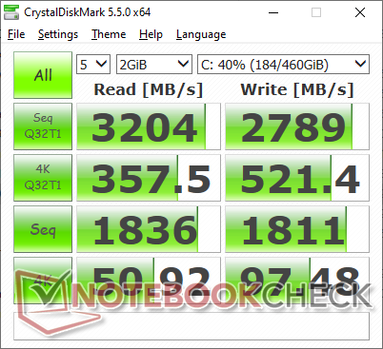
CDM 5.5
CDM 5.5
AS SSD
AS SSD
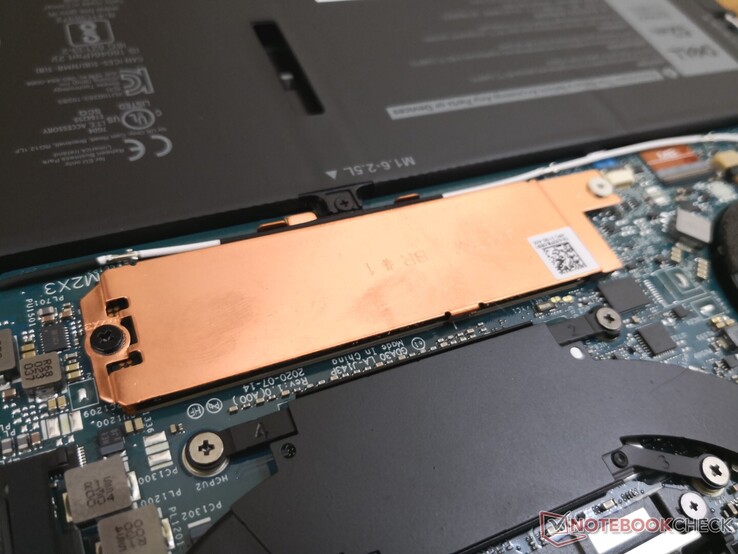
Herausnehmbare M.2 SSD mit Heat-Spreader
Dell XPS 13 9310 Core i7 FHD
Micron 2300 512GB MTFDHBA512TDV
Dell XPS 13 9300 Core i7-1065G7
Intel SSDPEMKF512G8 NVMe SSD
Apple MacBook Pro 13 2020 2GHz i5 10th-Gen
Apple SSD SM0512F
Huawei MateBook X Pro 2020 i7
Samsung PM981a MZVLB1T0HBLR
HP Spectre x360 13-aw0013dx
Intel Optane Memory H10 with Solid State Storage 32GB + 512GB HBRPEKNX0202A(L/H)
AS SSD
-16%
-49%
48%
-30%
Seq Read
2091
1956
-6%
1300
-38%
2737
31%
1039
-50%
Seq Write
1396
1227
-12%
1518
9%
2530
81%
310.1
-78%
4K Read
49.29
63
28%
14.09
-71%
54
10%
76
54%
4K Write
104.2
156.6
50%
24.25
-77%
152.5
46%
118
13%
4K-64 Read
827
475.6
-42%
725
-12%
2011
143%
371.8
-55%
4K-64 Write
1636
539
-67%
169.6
-90%
1260
-23%
469.5
-71%
Access Time Read *
0.066
0.042
36%
0.172
-161%
0.066
-0%
0.067
-2%
Access Time Write *
0.365
0.105
71%
0.155
58%
0.024
93%
0.138
62%
Score Read
1086
734
-32%
869
-20%
2339
115%
552
-49%
Score Write
1880
818
-56%
346
-82%
1666
-11%
618
-67%
Score Total
3499
1915
-45%
1667
-52%
5191
48%
1448
-59%
Copy ISO MB/s
1544
1022
-34%
764
-51%
Copy Program MB/s
613
302.8
-51%
465.8
-24%
Copy Game MB/s
1451
491.4
-66%
764
-47%
CrystalDiskMark 5.2 / 6
15%
-31%
14%
-7%
Write 4K
97.5
186.8
92%
28.16
-71%
165.6
70%
112.6
15%
Read 4K
50.9
71.4
40%
17.5
-66%
50.2
-1%
131
157%
Write Seq
1811
1203
-34%
1195
-34%
1905
5%
458.9
-75%
Read Seq
1836
2600
42%
1470
-20%
1669
-9%
1355
-26%
Write 4K Q32T1
521
514
-1%
205
-61%
474.6
-9%
341.3
-34%
Read 4K Q32T1
357.5
570
59%
692
94%
508
42%
320.6
-10%
Write Seq Q32T1
2879
786
-73%
1475
-49%
3007
4%
1219
-58%
Read Seq Q32T1
3204
2947
-8%
1920
-40%
3556
11%
2462
-23%
Durchschnitt gesamt (Programm / Settings)
-1% / -5%
-40% / -41%
31% / 34%
-19% / -22%

* ... kleinere Werte sind besser

Micron 2300 512GB MTFDHBA512TDV
CDM 5/6 Read Seq Q32T1: 3204 MB/s
CDM 5/6 Write Seq Q32T1: 2879 MB/s
CDM 5/6 Read 4K Q32T1: 357.5 MB/s
CDM 5/6 Write 4K Q32T1: 521 MB/s
CDM 5 Read Seq: 1836 MB/s
CDM 5 Write Seq: 1811 MB/s
CDM 5/6 Read 4K: 50.9 MB/s
CDM 5/6 Write 4K: 97.5 MB/s

Disk Throttling: DiskSpd Read Loop, Queue Depth 8

No graph data

Grafikleistung

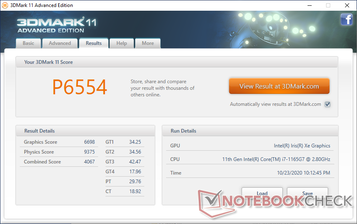
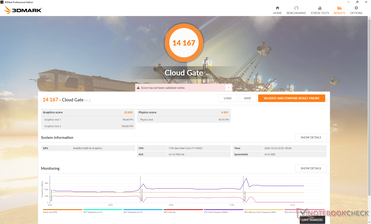
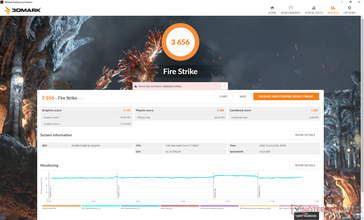
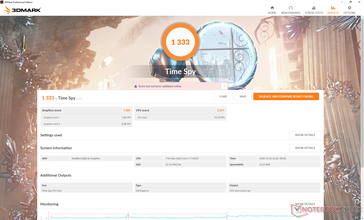
Die 3DMark-Ergebnisse sind beeindruckend für einen integrierten Grafikprozessor mit Werten, die 30 bis 35 Prozent höher sind als die der diskreten GeForce-MX250 oder fast 50 Prozent höher als die der Iris-Plus-G7 im XPS-13-9300. Wie wir jedoch bereits gezeigt haben, lassen sich diese synthetischen Ergebnisse nicht gut auf reale Gaming-Leistung übertragen, so dass Benutzer keine 30 bis 35 Prozent schnelleren Bildwiederholraten erwarten sollten als bei einem GeForce MX250-Laptop. Final Fantasy 15, Strange-Brigade und Witcher 3 zum Beispiel laufen auf unserem XPS-13-9310 schneller als auf dem ZenBook-14 mit MX250-Antrieb, während das Gegenteil bei DOTA-2-Reborn, X-Plane-11.11 und GTA-V der Fall ist.

Beachten Sie, dass sich das Dynamic-Tuning von Dell negativ auf die Bildraten auswirkt. Bei Witcher 3 zum Beispiel unter niedrigsten Einstellungen im Leerlauf, schwanken die Bildwiederholraten zwischen 61 und 80 FPS, wie unser Diagramm unten zeigt, während die Bildwiederholraten auf den meisten anderen Laptops konstanter und stabiler sind.

Weitere technische Informationen und Benchmark-Vergleiche finden Sie auf unserer Seite über den Intel Iris Xe. Wir erwarten, dass sich die allgemeine Gaming-Leistung im Laufe der Zeit mit Treiber-Updates verbessern wird.

3DMark 11
3DMark 11
Cloud Gate
Cloud Gate
Fire Strike
Fire Strike
Time Spy
Time Spy
3DMark
1280x720 Cloud Gate Standard Graphics
Asus ZenBook 14 UX425EA
Intel Iris Xe Graphics G7 96EUs, i7-1165G7
27289 Points +18%
Lenovo Yoga Slim 7-14ARE
AMD Radeon RX Vega 8 (Ryzen 4000/5000), R7 4800U
27160 Points +18%
Durchschnittliche Intel Iris Xe Graphics G7 96EUs
  (13162 - 38578, n=180)
26508 Points +15%
Dell XPS 13 9310 Core i7 FHD
Intel Iris Xe Graphics G7 96EUs, i7-1165G7
23053 Points
HP Envy x360 13-ay0010nr
AMD Radeon RX Vega 6 (Ryzen 4000/5000), R5 4500U
22109 Points -4%
Asus VivoBook Flip 14 TM420IA
AMD Radeon RX Vega 7, R7 4700U
21630 Points -6%
Asus ZenBook 14 UX434FL-DB77
NVIDIA GeForce MX250, i7-8565U
20445 Points -11%
Huawei MateBook X Pro 2020 i7
NVIDIA GeForce MX250, i7-10510U
19583 Points -15%
Acer Swift 3 SF314-42-R27B
AMD Radeon RX Vega 5, R3 4300U
18282 Points -21%
Apple MacBook Pro 13 2020 2GHz i5 10th-Gen
Intel Iris Plus Graphics G7 (Ice Lake 64 EU), i5-1038NG7
18163 Points -21%
Dell XPS 13 9300 Core i7-1065G7
Intel Iris Plus Graphics G7 (Ice Lake 64 EU), i7-1065G7
17803 Points -23%
HP Spectre x360 13-aw0013dx
Intel Iris Plus Graphics G7 (Ice Lake 64 EU), i7-1065G7
17712 Points -23%
Microsoft Surface Laptop Go Core i5
Intel UHD Graphics G1 (Ice Lake 32 EU), i5-1035G1
11894 Points -48%
Dell XPS 15 9500 Core i5
Intel UHD Graphics 630, i5-10300H
9873 Points -57%
Apple MacBook 12 (Early 2016) 1.1 GHz
Intel HD Graphics 515, 6Y30
6078 Points -74%
1920x1080 Fire Strike Graphics
Asus ZenBook 14 UX425EA
Intel Iris Xe Graphics G7 96EUs, i7-1165G7
5139 Points +23%
Durchschnittliche Intel Iris Xe Graphics G7 96EUs
  (2286 - 6482, n=215)
4920 Points +18%
Dell XPS 13 9310 Core i7 FHD
Intel Iris Xe Graphics G7 96EUs, i7-1165G7
4170 Points
Lenovo Yoga Slim 7-14ARE
AMD Radeon RX Vega 8 (Ryzen 4000/5000), R7 4800U
3938 Points -6%
Asus VivoBook Flip 14 TM420IA
AMD Radeon RX Vega 7, R7 4700U
3036 Points -27%
Huawei MateBook X Pro 2020 i7
NVIDIA GeForce MX250, i7-10510U
2951 Points -29%
Dell XPS 13 9300 Core i7-1065G7
Intel Iris Plus Graphics G7 (Ice Lake 64 EU), i7-1065G7
2950 Points -29%
Asus ZenBook 14 UX434FL-DB77
NVIDIA GeForce MX250, i7-8565U
2945 Points -29%
Apple MacBook Pro 13 2020 2GHz i5 10th-Gen
Intel Iris Plus Graphics G7 (Ice Lake 64 EU), i5-1038NG7
2883 Points -31%
HP Spectre x360 13-aw0013dx
Intel Iris Plus Graphics G7 (Ice Lake 64 EU), i7-1065G7
2874 Points -31%
HP Envy x360 13-ay0010nr
AMD Radeon RX Vega 6 (Ryzen 4000/5000), R5 4500U
2854 Points -32%
Acer Swift 3 SF314-42-R27B
AMD Radeon RX Vega 5, R3 4300U
2438 Points -42%
Microsoft Surface Laptop Go Core i5
Intel UHD Graphics G1 (Ice Lake 32 EU), i5-1035G1
1713 Points -59%
HP Elite Dragonfly-8MK79EA
Intel UHD Graphics 620, i5-8265U
1216 Points -71%
Dell XPS 15 9500 Core i5
Intel UHD Graphics 630, i5-10300H
1189 Points -71%
Apple MacBook 12 (Early 2016) 1.1 GHz
Intel HD Graphics 515, 6Y30
735 Points -82%
2560x1440 Time Spy Graphics
Durchschnittliche Intel Iris Xe Graphics G7 96EUs
  (707 - 1871, n=212)
1495 Points +24%
Asus ZenBook 14 UX425EA
Intel Iris Xe Graphics G7 96EUs, i7-1165G7
1401 Points +16%
Dell XPS 13 9310 Core i7 FHD
Intel Iris Xe Graphics G7 96EUs, i7-1165G7
1209 Points
Lenovo Yoga Slim 7-14ARE
AMD Radeon RX Vega 8 (Ryzen 4000/5000), R7 4800U
1173 Points -3%
Asus VivoBook Flip 14 TM420IA
AMD Radeon RX Vega 7, R7 4700U
903 Points -25%
Asus ZenBook 14 UX434FL-DB77
NVIDIA GeForce MX250, i7-8565U
886 Points -27%
Huawei MateBook X Pro 2020 i7
NVIDIA GeForce MX250, i7-10510U
881 Points -27%
Apple MacBook Pro 13 2020 2GHz i5 10th-Gen
Intel Iris Plus Graphics G7 (Ice Lake 64 EU), i5-1038NG7
825 Points -32%
Dell XPS 13 9300 Core i7-1065G7
Intel Iris Plus Graphics G7 (Ice Lake 64 EU), i7-1065G7
824 Points -32%
HP Envy x360 13-ay0010nr
AMD Radeon RX Vega 6 (Ryzen 4000/5000), R5 4500U
821 Points -32%
Acer Swift 3 SF314-42-R27B
AMD Radeon RX Vega 5, R3 4300U
733 Points -39%
HP Spectre x360 13-aw0013dx
Intel Iris Plus Graphics G7 (Ice Lake 64 EU), i7-1065G7
685 Points -43%
Microsoft Surface Laptop Go Core i5
Intel UHD Graphics G1 (Ice Lake 32 EU), i5-1035G1
440 Points -64%
Dell XPS 15 9500 Core i5
Intel UHD Graphics 630, i5-10300H
382 Points -68%
HP Elite Dragonfly-8MK79EA
Intel UHD Graphics 620, i5-8265U
365 Points -70%
2560x1440 Time Spy Score
Durchschnittliche Intel Iris Xe Graphics G7 96EUs
  (789 - 2133, n=209)
1675 Points +26%
Asus ZenBook 14 UX425EA
Intel Iris Xe Graphics G7 96EUs, i7-1165G7
1541 Points +16%
Lenovo Yoga Slim 7-14ARE
AMD Radeon RX Vega 8 (Ryzen 4000/5000), R7 4800U
1338 Points 0%
Dell XPS 13 9310 Core i7 FHD
Intel Iris Xe Graphics G7 96EUs, i7-1165G7
1333 Points
Asus VivoBook Flip 14 TM420IA
AMD Radeon RX Vega 7, R7 4700U
1028 Points -23%
Asus ZenBook 14 UX434FL-DB77
NVIDIA GeForce MX250, i7-8565U
990 Points -26%
Huawei MateBook X Pro 2020 i7
NVIDIA GeForce MX250, i7-10510U
980 Points -26%
Dell XPS 13 9300 Core i7-1065G7
Intel Iris Plus Graphics G7 (Ice Lake 64 EU), i7-1065G7
937 Points -30%
Apple MacBook Pro 13 2020 2GHz i5 10th-Gen
Intel Iris Plus Graphics G7 (Ice Lake 64 EU), i5-1038NG7
932 Points -30%
HP Envy x360 13-ay0010nr
AMD Radeon RX Vega 6 (Ryzen 4000/5000), R5 4500U
929 Points -30%
Acer Swift 3 SF314-42-R27B
AMD Radeon RX Vega 5, R3 4300U
825 Points -38%
HP Spectre x360 13-aw0013dx
Intel Iris Plus Graphics G7 (Ice Lake 64 EU), i7-1065G7
771 Points -42%
Microsoft Surface Laptop Go Core i5
Intel UHD Graphics G1 (Ice Lake 32 EU), i5-1035G1
505 Points -62%
Dell XPS 15 9500 Core i5
Intel UHD Graphics 630, i5-10300H
441 Points -67%
HP Elite Dragonfly-8MK79EA
Intel UHD Graphics 620, i5-8265U
417 Points -69%
3DMark 11
1280x720 Performance GPU
Dell XPS 13 9310 Core i7 FHD
Intel Iris Xe Graphics G7 96EUs, i7-1165G7
6698 Points
Asus ZenBook 14 UX425EA
Intel Iris Xe Graphics G7 96EUs, i7-1165G7
6563 Points -2%
Durchschnittliche Intel Iris Xe Graphics G7 96EUs
  (2867 - 7676, n=202)
6353 Points -5%
Lenovo Yoga Slim 7-14ARE
AMD Radeon RX Vega 8 (Ryzen 4000/5000), R7 4800U
6085 Points -9%
Asus VivoBook Flip 14 TM420IA
AMD Radeon RX Vega 7, R7 4700U
4927 Points -26%
HP Spectre x360 13-aw0013dx
Intel Iris Plus Graphics G7 (Ice Lake 64 EU), i7-1065G7
4512 Points -33%
Dell XPS 13 9300 Core i7-1065G7
Intel Iris Plus Graphics G7 (Ice Lake 64 EU), i7-1065G7
4508 Points -33%
HP Envy x360 13-ay0010nr
AMD Radeon RX Vega 6 (Ryzen 4000/5000), R5 4500U
4419 Points -34%
Apple MacBook Pro 13 2020 2GHz i5 10th-Gen
Intel Iris Plus Graphics G7 (Ice Lake 64 EU), i5-1038NG7
4374 Points -35%
Huawei MateBook X Pro 2020 i7
NVIDIA GeForce MX250, i7-10510U
3614 Points -46%
Asus ZenBook 14 UX434FL-DB77
NVIDIA GeForce MX250, i7-8565U
3585 Points -46%
Acer Swift 3 SF314-42-R27B
AMD Radeon RX Vega 5, R3 4300U
3535 Points -47%
Microsoft Surface Laptop Go Core i5
Intel UHD Graphics G1 (Ice Lake 32 EU), i5-1035G1
2280 Points -66%
HP Elite Dragonfly-8MK79EA
Intel UHD Graphics 620, i5-8265U
1789 Points -73%
Dell XPS 15 9500 Core i5
Intel UHD Graphics 630, i5-10300H
1744 Points -74%
Apple MacBook 12 (Early 2016) 1.1 GHz
Intel HD Graphics 515, 6Y30
1186 Points -82%
1280x720 Performance Combined
Durchschnittliche Intel Iris Xe Graphics G7 96EUs
  (1926 - 7661, n=201)
5537 Points +36%
Asus ZenBook 14 UX425EA
Intel Iris Xe Graphics G7 96EUs, i7-1165G7
4691 Points +15%
Lenovo Yoga Slim 7-14ARE
AMD Radeon RX Vega 8 (Ryzen 4000/5000), R7 4800U
4323 Points +6%
Dell XPS 13 9300 Core i7-1065G7
Intel Iris Plus Graphics G7 (Ice Lake 64 EU), i7-1065G7
4086 Points 0%
Dell XPS 13 9310 Core i7 FHD
Intel Iris Xe Graphics G7 96EUs, i7-1165G7
4067 Points
Asus ZenBook 14 UX434FL-DB77
NVIDIA GeForce MX250, i7-8565U
3943 Points -3%
Apple MacBook Pro 13 2020 2GHz i5 10th-Gen
Intel Iris Plus Graphics G7 (Ice Lake 64 EU), i5-1038NG7
3828 Points -6%
Huawei MateBook X Pro 2020 i7
NVIDIA GeForce MX250, i7-10510U
3790 Points -7%
HP Spectre x360 13-aw0013dx
Intel Iris Plus Graphics G7 (Ice Lake 64 EU), i7-1065G7
3767 Points -7%
Asus VivoBook Flip 14 TM420IA
AMD Radeon RX Vega 7, R7 4700U
3601 Points -11%
HP Envy x360 13-ay0010nr
AMD Radeon RX Vega 6 (Ryzen 4000/5000), R5 4500U
3322 Points -18%
Acer Swift 3 SF314-42-R27B
AMD Radeon RX Vega 5, R3 4300U
3288 Points -19%
Microsoft Surface Laptop Go Core i5
Intel UHD Graphics G1 (Ice Lake 32 EU), i5-1035G1
1989 Points -51%
Dell XPS 15 9500 Core i5
Intel UHD Graphics 630, i5-10300H
1783 Points -56%
HP Elite Dragonfly-8MK79EA
Intel UHD Graphics 620, i5-8265U
1546 Points -62%
Apple MacBook 12 (Early 2016) 1.1 GHz
Intel HD Graphics 515, 6Y30
1014 Points -75%
3DMark 11 Performance
6554 Punkte
3DMark Cloud Gate Standard Score
14167 Punkte
3DMark Fire Strike Score
3656 Punkte
3DMark Time Spy Score
1333 Punkte
Hilfe
Final Fantasy XV Benchmark
1280x720 Lite Quality
Durchschnittliche Intel Iris Xe Graphics G7 96EUs
  (14.9 - 56.5, n=183)
39.4 fps +17%
Lenovo Yoga Slim 7-14ARE
AMD Ryzen 7 4800U, AMD Radeon RX Vega 8 (Ryzen 4000/5000)
37.5 fps +11%
Asus ZenBook 14 UX425EA
Intel Core i7-1165G7, Intel Iris Xe Graphics G7 96EUs
35.4 fps +5%
Asus ZenBook 14 UX434FL-DB77
Intel Core i7-8565U, NVIDIA GeForce MX250
33.7 fps 0%
Dell XPS 13 9310 Core i7 FHD
Intel Core i7-1165G7, Intel Iris Xe Graphics G7 96EUs
33.7 fps
Asus VivoBook Flip 14 TM420IA
AMD Ryzen 7 4700U, AMD Radeon RX Vega 7
30.2 fps -10%
Microsoft Surface Laptop Go Core i5
Intel Core i5-1035G1, Intel UHD Graphics G1 (Ice Lake 32 EU)
15.1 fps -55%
1920x1080 Standard Quality
Durchschnittliche Intel Iris Xe Graphics G7 96EUs
  (10.5 - 31.2, n=179)
21.8 fps +11%
Asus ZenBook 14 UX425EA
Intel Core i7-1165G7, Intel Iris Xe Graphics G7 96EUs
20.8 fps +6%
Dell XPS 13 9310 Core i7 FHD
Intel Core i7-1165G7, Intel Iris Xe Graphics G7 96EUs
19.6 fps
Lenovo Yoga Slim 7-14ARE
AMD Ryzen 7 4800U, AMD Radeon RX Vega 8 (Ryzen 4000/5000)
18.8 fps -4%
Asus ZenBook 14 UX434FL-DB77
Intel Core i7-8565U, NVIDIA GeForce MX250
16.4 fps -16%
Asus VivoBook Flip 14 TM420IA
AMD Ryzen 7 4700U, AMD Radeon RX Vega 7
15.2 fps -22%
Microsoft Surface Laptop Go Core i5
Intel Core i5-1035G1, Intel UHD Graphics G1 (Ice Lake 32 EU)
7.49 fps -62%
1920x1080 High Quality
Durchschnittliche Intel Iris Xe Graphics G7 96EUs
  (8.15 - 27.8, n=172)
16.8 fps +9%
Asus ZenBook 14 UX425EA
Intel Core i7-1165G7, Intel Iris Xe Graphics G7 96EUs
15.8 fps +3%
Dell XPS 13 9310 Core i7 FHD
Intel Core i7-1165G7, Intel Iris Xe Graphics G7 96EUs
15.4 fps
Lenovo Yoga Slim 7-14ARE
AMD Ryzen 7 4800U, AMD Radeon RX Vega 8 (Ryzen 4000/5000)
12 fps -22%
Asus ZenBook 14 UX434FL-DB77
Intel Core i7-8565U, NVIDIA GeForce MX250
11 fps -29%
Asus VivoBook Flip 14 TM420IA
AMD Ryzen 7 4700U, AMD Radeon RX Vega 7
9.86 fps -36%
Microsoft Surface Laptop Go Core i5
Intel Core i5-1035G1, Intel UHD Graphics G1 (Ice Lake 32 EU)
5.21 fps -66%
Dota 2 Reborn
1280x720 min (0/3) fastest
Asus ZenBook 14 UX434FL-DB77
Intel Core i7-8565U, NVIDIA GeForce MX250
113 (93.1min) fps +46%
Huawei MateBook X Pro 2020 i7
Intel Core i7-10510U, NVIDIA GeForce MX250
112 (81.5min) fps +45%
Durchschnittliche Intel Iris Xe Graphics G7 96EUs
  (36 - 148, n=215)
100.3 fps +29%
Lenovo Yoga Slim 7-14ARE
AMD Ryzen 7 4800U, AMD Radeon RX Vega 8 (Ryzen 4000/5000)
97.1 (87.3min) fps +25%
HP Envy x360 13-ay0010nr
AMD Ryzen 5 4500U, AMD Radeon RX Vega 6 (Ryzen 4000/5000)
95.1 (85.7min) fps +23%
Apple MacBook Pro 13 2020 2GHz i5 10th-Gen
Intel Core i5-1038NG7, Intel Iris Plus Graphics G7 (Ice Lake 64 EU)
94.7 (84.3min) fps +22%
Asus VivoBook Flip 14 TM420IA
AMD Ryzen 7 4700U, AMD Radeon RX Vega 7
93.9 (83.7min) fps +21%
Acer Swift 3 SF314-42-R27B
AMD Ryzen 3 4300U, AMD Radeon RX Vega 5
93.3 (76.1min) fps +20%
Dell XPS 15 9500 Core i5
Intel Core i5-10300H, Intel UHD Graphics 630
79 (70.3min) fps +2%
Microsoft Surface Laptop Go Core i5
Intel Core i5-1035G1, Intel UHD Graphics G1 (Ice Lake 32 EU)
78.1 (66.3min) fps +1%
Dell XPS 13 9310 Core i7 FHD
Intel Core i7-1165G7, Intel Iris Xe Graphics G7 96EUs
77.5 (42.7min) fps
Asus ZenBook 14 UX425EA
Intel Core i7-1165G7, Intel Iris Xe Graphics G7 96EUs
76.9 (40.9min) fps -1%
HP Elite Dragonfly-8MK79EA
Intel Core i5-8265U, Intel UHD Graphics 620
66.4 (59min) fps -14%
1366x768 med (1/3)
Huawei MateBook X Pro 2020 i7
Intel Core i7-10510U, NVIDIA GeForce MX250
92.6 (76.8min) fps +71%
Asus ZenBook 14 UX434FL-DB77
Intel Core i7-8565U, NVIDIA GeForce MX250
88.6 (77.1min) fps +63%
Lenovo Yoga Slim 7-14ARE
AMD Ryzen 7 4800U, AMD Radeon RX Vega 8 (Ryzen 4000/5000)
82.3 (74.1min) fps +52%
Durchschnittliche Intel Iris Xe Graphics G7 96EUs
  (31.6 - 108.5, n=215)
75.7 fps +39%
HP Envy x360 13-ay0010nr
AMD Ryzen 5 4500U, AMD Radeon RX Vega 6 (Ryzen 4000/5000)
75.6 (69.4min) fps +39%
Acer Swift 3 SF314-42-R27B
AMD Ryzen 3 4300U, AMD Radeon RX Vega 5
74.2 (52.3min) fps +37%
Asus VivoBook Flip 14 TM420IA
AMD Ryzen 7 4700U, AMD Radeon RX Vega 7
70.3 (61.6min) fps +29%
Asus ZenBook 14 UX425EA
Intel Core i7-1165G7, Intel Iris Xe Graphics G7 96EUs
67.4 (45.7min) fps +24%
Apple MacBook Pro 13 2020 2GHz i5 10th-Gen
Intel Core i5-1038NG7, Intel Iris Plus Graphics G7 (Ice Lake 64 EU)
62.8 (46.3min) fps +16%
Dell XPS 13 9310 Core i7 FHD
Intel Core i7-1165G7, Intel Iris Xe Graphics G7 96EUs
54.3 (36.6min) fps
Dell XPS 15 9500 Core i5
Intel Core i5-10300H, Intel UHD Graphics 630
50 (45.3min) fps -8%
HP Elite Dragonfly-8MK79EA
Intel Core i5-8265U, Intel UHD Graphics 620
40.2 (35.6min) fps -26%
Microsoft Surface Laptop Go Core i5
Intel Core i5-1035G1, Intel UHD Graphics G1 (Ice Lake 32 EU)
40.1 (28.6min) fps -26%
1920x1080 high (2/3)
Asus ZenBook 14 UX434FL-DB77
Intel Core i7-8565U, NVIDIA GeForce MX250
61.3 (54.4min) fps +51%
Huawei MateBook X Pro 2020 i7
Intel Core i7-10510U, NVIDIA GeForce MX250
59.7 (51.6min) fps +47%
Lenovo Yoga Slim 7-14ARE
AMD Ryzen 7 4800U, AMD Radeon RX Vega 8 (Ryzen 4000/5000)
56 (50.6min) fps +38%
Durchschnittliche Intel Iris Xe Graphics G7 96EUs
  (23.2 - 88.1, n=215)
54.2 fps +34%
Asus ZenBook 14 UX425EA
Intel Core i7-1165G7, Intel Iris Xe Graphics G7 96EUs
46.4 (25.8min) fps +15%
HP Envy x360 13-ay0010nr
AMD Ryzen 5 4500U, AMD Radeon RX Vega 6 (Ryzen 4000/5000)
46.3 (42.4min) fps +14%
Asus VivoBook Flip 14 TM420IA
AMD Ryzen 7 4700U, AMD Radeon RX Vega 7
44.5 (36.7min) fps +10%
Acer Swift 3 SF314-42-R27B
AMD Ryzen 3 4300U, AMD Radeon RX Vega 5
41.4 (37.7min) fps +2%
Dell XPS 13 9310 Core i7 FHD
Intel Core i7-1165G7, Intel Iris Xe Graphics G7 96EUs
40.5 (28.7min) fps
Apple MacBook Pro 13 2020 2GHz i5 10th-Gen
Intel Core i5-1038NG7, Intel Iris Plus Graphics G7 (Ice Lake 64 EU)
38.5 (30.9min) fps -5%
Microsoft Surface Laptop Go Core i5
Intel Core i5-1035G1, Intel UHD Graphics G1 (Ice Lake 32 EU)
23.5 (13min) fps -42%
Dell XPS 15 9500 Core i5
Intel Core i5-10300H, Intel UHD Graphics 630
19.7 (18.4min) fps -51%
HP Elite Dragonfly-8MK79EA
Intel Core i5-8265U, Intel UHD Graphics 620
18.7 (17.3min) fps -54%
1920x1080 ultra (3/3) best looking
Asus ZenBook 14 UX434FL-DB77
Intel Core i7-8565U, NVIDIA GeForce MX250
54.1 (46.7min) fps +27%
Huawei MateBook X Pro 2020 i7
Intel Core i7-10510U, NVIDIA GeForce MX250
52.7 (45min) fps +24%
Lenovo Yoga Slim 7-14ARE
AMD Ryzen 7 4800U, AMD Radeon RX Vega 8 (Ryzen 4000/5000)
52.5 (47.3min) fps +24%
Durchschnittliche Intel Iris Xe Graphics G7 96EUs
  (20.6 - 78.5, n=215)
49.4 fps +16%
HP Envy x360 13-ay0010nr
AMD Ryzen 5 4500U, AMD Radeon RX Vega 6 (Ryzen 4000/5000)
43.3 (39.9min) fps +2%
Dell XPS 13 9310 Core i7 FHD
Intel Core i7-1165G7, Intel Iris Xe Graphics G7 96EUs
42.5 (24.8min) fps
Asus ZenBook 14 UX425EA
Intel Core i7-1165G7, Intel Iris Xe Graphics G7 96EUs
42.3 (27.3min) fps 0%
Asus VivoBook Flip 14 TM420IA
AMD Ryzen 7 4700U, AMD Radeon RX Vega 7
41.5 (32.7min) fps -2%
Acer Swift 3 SF314-42-R27B
AMD Ryzen 3 4300U, AMD Radeon RX Vega 5
39.1 (36min) fps -8%
Apple MacBook Pro 13 2020 2GHz i5 10th-Gen
Intel Core i5-1038NG7, Intel Iris Plus Graphics G7 (Ice Lake 64 EU)
35.7 (24.8min) fps -16%
Microsoft Surface Laptop Go Core i5
Intel Core i5-1035G1, Intel UHD Graphics G1 (Ice Lake 32 EU)
21.4 (10.6min) fps -50%
Dell XPS 15 9500 Core i5
Intel Core i5-10300H, Intel UHD Graphics 630
17.4 (16.3min) fps -59%
HP Elite Dragonfly-8MK79EA
Intel Core i5-8265U, Intel UHD Graphics 620
16.9 (15.9min) fps -60%
The Witcher 3
1024x768 Low Graphics & Postprocessing
Dell XPS 13 9310 Core i7 FHD
Intel Core i7-1165G7, Intel Iris Xe Graphics G7 96EUs
97.7 (89min - 107max) fps
Durchschnittliche Intel Iris Xe Graphics G7 96EUs
  (28.9 - 117.2, n=186)
84 fps -14%
Asus ZenBook 14 UX425EA
Intel Core i7-1165G7, Intel Iris Xe Graphics G7 96EUs
74.4 (38min - 89max) fps -24%
Lenovo Yoga Slim 7-14ARE
AMD Ryzen 7 4800U, AMD Radeon RX Vega 8 (Ryzen 4000/5000)
70.8 fps -28%
Asus VivoBook Flip 14 TM420IA
AMD Ryzen 7 4700U, AMD Radeon RX Vega 7
61.4 (52min - 70max) fps -37%
Asus ZenBook 14 UX434FL-DB77
Intel Core i7-8565U, NVIDIA GeForce MX250
59.5 (54min - 72max) fps -39%
HP Envy x360 13-ay0010nr
AMD Ryzen 5 4500U, AMD Radeon RX Vega 6 (Ryzen 4000/5000)
56.4 (52min - 60max) fps -42%
Apple MacBook Pro 13 2020 2GHz i5 10th-Gen
Intel Core i5-1038NG7, Intel Iris Plus Graphics G7 (Ice Lake 64 EU)
54.2 fps -45%
Huawei MateBook X Pro 2020 i7
Intel Core i7-10510U, NVIDIA GeForce MX250
52 fps -47%
Dell XPS 13 9300 Core i7-1065G7
Intel Core i7-1065G7, Intel Iris Plus Graphics G7 (Ice Lake 64 EU)
50.7 (17min - 59max) fps -48%
Acer Swift 3 SF314-42-R27B
AMD Ryzen 3 4300U, AMD Radeon RX Vega 5
44.5 fps -54%
HP Spectre x360 13-aw0013dx
Intel Core i7-1065G7, Intel Iris Plus Graphics G7 (Ice Lake 64 EU)
43.9 fps -55%
Dell XPS 15 9500 Core i5
Intel Core i5-10300H, Intel UHD Graphics 630
17.3 fps -82%
HP Elite Dragonfly-8MK79EA
Intel Core i5-8265U, Intel UHD Graphics 620
17.1 fps -82%
Apple MacBook 12 (Early 2016) 1.1 GHz
Intel Core m3-6Y30, Intel HD Graphics 515
7.4 fps -92%
1366x768 Medium Graphics & Postprocessing
Dell XPS 13 9310 Core i7 FHD
Intel Core i7-1165G7, Intel Iris Xe Graphics G7 96EUs
58.4 (17min - 66max) fps
Durchschnittliche Intel Iris Xe Graphics G7 96EUs
  (21.4 - 77.8, n=184)
53.6 fps -8%
Asus ZenBook 14 UX425EA
Intel Core i7-1165G7, Intel Iris Xe Graphics G7 96EUs
41 (37min - 45max) fps -30%
Asus VivoBook Flip 14 TM420IA
AMD Ryzen 7 4700U, AMD Radeon RX Vega 7
38.6 (37min - 43max) fps -34%
Dell XPS 13 9300 Core i7-1065G7
Intel Core i7-1065G7, Intel Iris Plus Graphics G7 (Ice Lake 64 EU)
33.5 (29min - 39max) fps -43%
Apple MacBook Pro 13 2020 2GHz i5 10th-Gen
Intel Core i5-1038NG7, Intel Iris Plus Graphics G7 (Ice Lake 64 EU)
33.1 (28min, 31.07P1 - 36max) fps -43%
Asus ZenBook 14 UX434FL-DB77
Intel Core i7-8565U, NVIDIA GeForce MX250
33 (30min - 36max) fps -43%
Huawei MateBook X Pro 2020 i7
Intel Core i7-10510U, NVIDIA GeForce MX250
30 (28min, 29P1 - 35max) fps -49%
HP Spectre x360 13-aw0013dx
Intel Core i7-1065G7, Intel Iris Plus Graphics G7 (Ice Lake 64 EU)
28.9 fps -51%
Acer Swift 3 SF314-42-R27B
AMD Ryzen 3 4300U, AMD Radeon RX Vega 5
28.4 fps -51%
Dell XPS 15 9500 Core i5
Intel Core i5-10300H, Intel UHD Graphics 630
10.8 fps -82%
1920x1080 High Graphics & Postprocessing (Nvidia HairWorks Off)
Dell XPS 13 9310 Core i7 FHD
Intel Core i7-1165G7, Intel Iris Xe Graphics G7 96EUs
32.7 (29min - 36max) fps
Durchschnittliche Intel Iris Xe Graphics G7 96EUs
  (10.6 - 45.9, n=189)
28.7 fps -12%
Asus ZenBook 14 UX425EA
Intel Core i7-1165G7, Intel Iris Xe Graphics G7 96EUs
25.4 (22min - 29max) fps -22%
Lenovo Yoga Slim 7-14ARE
AMD Ryzen 7 4800U, AMD Radeon RX Vega 8 (Ryzen 4000/5000)
23.1 fps -29%
Asus VivoBook Flip 14 TM420IA
AMD Ryzen 7 4700U, AMD Radeon RX Vega 7
20.2 (17min - 22max) fps -38%
Asus ZenBook 14 UX434FL-DB77
Intel Core i7-8565U, NVIDIA GeForce MX250
19.4 (16min - 24max) fps -41%
Dell XPS 13 9300 Core i7-1065G7
Intel Core i7-1065G7, Intel Iris Plus Graphics G7 (Ice Lake 64 EU)
18.4 (14min - 23max) fps -44%
Apple MacBook Pro 13 2020 2GHz i5 10th-Gen
Intel Core i5-1038NG7, Intel Iris Plus Graphics G7 (Ice Lake 64 EU)
18 fps -45%
HP Envy x360 13-ay0010nr
AMD Ryzen 5 4500U, AMD Radeon RX Vega 6 (Ryzen 4000/5000)
16.6 (15min - 18max) fps -49%
Huawei MateBook X Pro 2020 i7
Intel Core i7-10510U, NVIDIA GeForce MX250
16.3 fps -50%
Acer Swift 3 SF314-42-R27B
AMD Ryzen 3 4300U, AMD Radeon RX Vega 5
14.1 fps -57%
HP Spectre x360 13-aw0013dx
Intel Core i7-1065G7, Intel Iris Plus Graphics G7 (Ice Lake 64 EU)
13.8 fps -58%
1920x1080 Ultra Graphics & Postprocessing (HBAO+)
Lenovo Yoga Slim 7-14ARE
AMD Ryzen 7 4800U, AMD Radeon RX Vega 8 (Ryzen 4000/5000)
14.9 fps +4%
Dell XPS 13 9310 Core i7 FHD
Intel Core i7-1165G7, Intel Iris Xe Graphics G7 96EUs
14.3 (12min - 17max) fps
Durchschnittliche Intel Iris Xe Graphics G7 96EUs
  (8.79 - 20.1, n=179)
14 fps -2%
Asus VivoBook Flip 14 TM420IA
AMD Ryzen 7 4700U, AMD Radeon RX Vega 7
13.2 (12min - 15max) fps -8%
Asus ZenBook 14 UX425EA
Intel Core i7-1165G7, Intel Iris Xe Graphics G7 96EUs
11.9 (9min - 14max) fps -17%
HP Envy x360 13-ay0010nr
AMD Ryzen 5 4500U, AMD Radeon RX Vega 6 (Ryzen 4000/5000)
10.6 (9min - 12max) fps -26%
Asus ZenBook 14 UX434FL-DB77
Intel Core i7-8565U, NVIDIA GeForce MX250
10.3 (7min - 13max) fps -28%
Dell XPS 13 9300 Core i7-1065G7
Intel Core i7-1065G7, Intel Iris Plus Graphics G7 (Ice Lake 64 EU)
9.1 (6min - 13max) fps -36%
Huawei MateBook X Pro 2020 i7
Intel Core i7-10510U, NVIDIA GeForce MX250
9 fps -37%
Acer Swift 3 SF314-42-R27B
AMD Ryzen 3 4300U, AMD Radeon RX Vega 5
8.9 fps -38%
HP Spectre x360 13-aw0013dx
Intel Core i7-1065G7, Intel Iris Plus Graphics G7 (Ice Lake 64 EU)
7.2 fps -50%
X-Plane 11.11
1280x720 low (fps_test=1)
Huawei MateBook X Pro 2020 i7
Intel Core i7-10510U, NVIDIA GeForce MX250
55.6 fps +16%
Asus ZenBook 14 UX425EA
Intel Core i7-1165G7, Intel Iris Xe Graphics G7 96EUs
50.1 fps +4%
Asus ZenBook 14 UX434FL-DB77
Intel Core i7-8565U, NVIDIA GeForce MX250
49.2 fps +3%
Dell XPS 13 9310 Core i7 FHD
Intel Core i7-1165G7, Intel Iris Xe Graphics G7 96EUs
48 fps
Lenovo Yoga Slim 7-14ARE
AMD Ryzen 7 4800U, AMD Radeon RX Vega 8 (Ryzen 4000/5000)
42.7 fps -11%
Durchschnittliche Intel Iris Xe Graphics G7 96EUs
  (13.4 - 88.4, n=212)
41.5 fps -14%
Asus VivoBook Flip 14 TM420IA
AMD Ryzen 7 4700U, AMD Radeon RX Vega 7
40.6 fps -15%
HP Envy x360 13-ay0010nr
AMD Ryzen 5 4500U, AMD Radeon RX Vega 6 (Ryzen 4000/5000)
39.1 fps -19%
Acer Swift 3 SF314-42-R27B
AMD Ryzen 3 4300U, AMD Radeon RX Vega 5
31.5 fps -34%
Apple MacBook Pro 13 2020 2GHz i5 10th-Gen
Intel Core i5-1038NG7, Intel Iris Plus Graphics G7 (Ice Lake 64 EU)
25.9 fps -46%
Dell XPS 15 9500 Core i5
Intel Core i5-10300H, Intel UHD Graphics 630
22.4 fps -53%
Microsoft Surface Laptop Go Core i5
Intel Core i5-1035G1, Intel UHD Graphics G1 (Ice Lake 32 EU)
17.3 fps -64%
HP Elite Dragonfly-8MK79EA
Intel Core i5-8265U, Intel UHD Graphics 620
11.7 fps -76%
1920x1080 med (fps_test=2)
Asus ZenBook 14 UX434FL-DB77
Intel Core i7-8565U, NVIDIA GeForce MX250
41.1 fps +10%
Huawei MateBook X Pro 2020 i7
Intel Core i7-10510U, NVIDIA GeForce MX250
40.8 fps +9%
Dell XPS 13 9310 Core i7 FHD
Intel Core i7-1165G7, Intel Iris Xe Graphics G7 96EUs
37.3 fps
Asus ZenBook 14 UX425EA
Intel Core i7-1165G7, Intel Iris Xe Graphics G7 96EUs
35.4 fps -5%
Durchschnittliche Intel Iris Xe Graphics G7 96EUs
  (11.6 - 69.5, n=213)
35.2 fps -6%
Lenovo Yoga Slim 7-14ARE
AMD Ryzen 7 4800U, AMD Radeon RX Vega 8 (Ryzen 4000/5000)
34.5 fps -8%
Asus VivoBook Flip 14 TM420IA
AMD Ryzen 7 4700U, AMD Radeon RX Vega 7
32.5 fps -13%
HP Envy x360 13-ay0010nr
AMD Ryzen 5 4500U, AMD Radeon RX Vega 6 (Ryzen 4000/5000)
30.1 fps -19%
Acer Swift 3 SF314-42-R27B
AMD Ryzen 3 4300U, AMD Radeon RX Vega 5
24.9 fps -33%
Dell XPS 15 9500 Core i5
Intel Core i5-10300H, Intel UHD Graphics 630
14.3 fps -62%
Apple MacBook Pro 13 2020 2GHz i5 10th-Gen
Intel Core i5-1038NG7, Intel Iris Plus Graphics G7 (Ice Lake 64 EU)
11.7 fps -69%
Microsoft Surface Laptop Go Core i5
Intel Core i5-1035G1, Intel UHD Graphics G1 (Ice Lake 32 EU)
10.4 fps -72%
HP Elite Dragonfly-8MK79EA
Intel Core i5-8265U, Intel UHD Graphics 620
9.84 fps -74%
1920x1080 high (fps_test=3)
Huawei MateBook X Pro 2020 i7
Intel Core i7-10510U, NVIDIA GeForce MX250
37.9 fps +17%
Asus ZenBook 14 UX434FL-DB77
Intel Core i7-8565U, NVIDIA GeForce MX250
37.5 fps +15%
Asus ZenBook 14 UX425EA
Intel Core i7-1165G7, Intel Iris Xe Graphics G7 96EUs
32.6 fps 0%
Dell XPS 13 9310 Core i7 FHD
Intel Core i7-1165G7, Intel Iris Xe Graphics G7 96EUs
32.5 fps
Durchschnittliche Intel Iris Xe Graphics G7 96EUs
  (11.1 - 59.8, n=212)
31.6 fps -3%
Lenovo Yoga Slim 7-14ARE
AMD Ryzen 7 4800U, AMD Radeon RX Vega 8 (Ryzen 4000/5000)
30.5 fps -6%
Asus VivoBook Flip 14 TM420IA
AMD Ryzen 7 4700U, AMD Radeon RX Vega 7
28.6 fps -12%
HP Envy x360 13-ay0010nr
AMD Ryzen 5 4500U, AMD Radeon RX Vega 6 (Ryzen 4000/5000)
26.8 fps -18%
Acer Swift 3 SF314-42-R27B
AMD Ryzen 3 4300U, AMD Radeon RX Vega 5
22.4 fps -31%
Dell XPS 15 9500 Core i5
Intel Core i5-10300H, Intel UHD Graphics 630
12.8 fps -61%
Apple MacBook Pro 13 2020 2GHz i5 10th-Gen
Intel Core i5-1038NG7, Intel Iris Plus Graphics G7 (Ice Lake 64 EU)
10.9 fps -66%
Microsoft Surface Laptop Go Core i5
Intel Core i5-1035G1, Intel UHD Graphics G1 (Ice Lake 32 EU)
10.8 fps -67%
HP Elite Dragonfly-8MK79EA
Intel Core i5-8265U, Intel UHD Graphics 620
9.25 fps -72%
GTA V
1024x768 Lowest Settings possible
Asus ZenBook 14 UX434FL-DB77
Intel Core i7-8565U, NVIDIA GeForce MX250
109 (19.9min, 62.5P1 - 217max) fps +29%
Lenovo Yoga Slim 7-14ARE
AMD Ryzen 7 4800U, AMD Radeon RX Vega 8 (Ryzen 4000/5000)
101 (10.4min, 66.7P1 - 168max) fps +20%
Durchschnittliche Intel Iris Xe Graphics G7 96EUs
  (52 - 166.4, n=162)
98.5 fps +17%
Dell XPS 13 9310 Core i7 FHD
Intel Core i7-1165G7, Intel Iris Xe Graphics G7 96EUs
84.3 (19.6min, 45.5P1 - 137max) fps
Asus ZenBook 14 UX425EA
Intel Core i7-1165G7, Intel Iris Xe Graphics G7 96EUs
81.7 (15.4min, 35.7P1 - 162max) fps -3%
Acer Swift 3 SF314-42-R27B
AMD Ryzen 3 4300U, AMD Radeon RX Vega 5
80.3 fps -5%
1920x1080 Lowest Settings possible
Asus ZenBook 14 UX434FL-DB77
Intel Core i7-8565U, NVIDIA GeForce MX250
80.9 (31.1min, 41.7P1 - 155max) fps +11%
Durchschnittliche Intel Iris Xe Graphics G7 96EUs
  (34.7 - 132.1, n=136)
73.8 fps +2%
Dell XPS 13 9310 Core i7 FHD
Intel Core i7-1165G7, Intel Iris Xe Graphics G7 96EUs
72.6 (15.3min, 38.5P1 - 138max) fps
Lenovo Yoga Slim 7-14ARE
AMD Ryzen 7 4800U, AMD Radeon RX Vega 8 (Ryzen 4000/5000)
69.1 (4.94min, 50P1 - 109max) fps -5%
Asus ZenBook 14 UX425EA
Intel Core i7-1165G7, Intel Iris Xe Graphics G7 96EUs
55.2 (12min, 22.2P1 - 128max) fps -24%
Acer Swift 3 SF314-42-R27B
AMD Ryzen 3 4300U, AMD Radeon RX Vega 5
50 fps -31%
1366x768 Normal/Off AF:4x
Asus ZenBook 14 UX434FL-DB77
Intel Core i7-8565U, NVIDIA GeForce MX250
95.4 (19.3min, 45.5P1 - 155max) fps +24%
Durchschnittliche Intel Iris Xe Graphics G7 96EUs
  (24.1 - 149.3, n=165)
83.1 fps +8%
Dell XPS 13 9310 Core i7 FHD
Intel Core i7-1165G7, Intel Iris Xe Graphics G7 96EUs
76.8 (5.78min, 40P1 - 185max) fps
Acer Swift 3 SF314-42-R27B
AMD Ryzen 3 4300U, AMD Radeon RX Vega 5
70.7 fps -8%
Asus ZenBook 14 UX425EA
Intel Core i7-1165G7, Intel Iris Xe Graphics G7 96EUs
66.6 (14.4min, 22.7P1 - 131max) fps -13%
1920x1080 Normal/Off AF:4x
Asus ZenBook 14 UX434FL-DB77
Intel Core i7-8565U, NVIDIA GeForce MX250
82.1 (25.8min, 40P1 - 136max) fps +25%
Lenovo Yoga Slim 7-14ARE
AMD Ryzen 7 4800U, AMD Radeon RX Vega 8 (Ryzen 4000/5000)
69.6 (5min, 45.5P1 - 119max) fps +6%
Dell XPS 13 9310 Core i7 FHD
Intel Core i7-1165G7, Intel Iris Xe Graphics G7 96EUs
65.5 (14.1min, 35.7P1 - 117max) fps
Durchschnittliche Intel Iris Xe Graphics G7 96EUs
  (20 - 119.3, n=137)
65.2 fps 0%
Acer Swift 3 SF314-42-R27B
AMD Ryzen 3 4300U, AMD Radeon RX Vega 5
49.5 fps -24%
Asus ZenBook 14 UX425EA
Intel Core i7-1165G7, Intel Iris Xe Graphics G7 96EUs
48.4 (9.05min, 16.1P1 - 122max) fps -26%
1920x1080 High/On (Advanced Graphics Off) AA:2xMSAA + FX AF:8x
Asus ZenBook 14 UX434FL-DB77
Intel Core i7-8565U, NVIDIA GeForce MX250
35.9 (13.5min, 23.8P1 - 83.3max) fps +45%
Lenovo Yoga Slim 7-14ARE
AMD Ryzen 7 4800U, AMD Radeon RX Vega 8 (Ryzen 4000/5000)
29.8 (3.22min, 21.3P1 - 83.4max) fps +21%
Dell XPS 13 9310 Core i7 FHD
Intel Core i7-1165G7, Intel Iris Xe Graphics G7 96EUs
24.7 (7.44min, 17.9P1 - 101max) fps
Durchschnittliche Intel Iris Xe Graphics G7 96EUs
  (9.39 - 51.6, n=157)
22.8 fps -8%
Acer Swift 3 SF314-42-R27B
AMD Ryzen 3 4300U, AMD Radeon RX Vega 5
20 fps -19%
Asus ZenBook 14 UX425EA
Intel Core i7-1165G7, Intel Iris Xe Graphics G7 96EUs
18.7 (6.48min, 9.26P1 - 104max) fps -24%
Strange Brigade
1280x720 lowest AF:1
Dell XPS 13 9310 Core i7 FHD
Intel Core i7-1165G7, Intel Iris Xe Graphics G7 96EUs
94.4 (16.2min, 33.1P1 - 363max) fps
Durchschnittliche Intel Iris Xe Graphics G7 96EUs
  (48.5 - 115.1, n=168)
84.8 fps -10%
Lenovo Yoga Slim 7-14ARE
AMD Ryzen 7 4800U, AMD Radeon RX Vega 8 (Ryzen 4000/5000)
79.7 (49.2min, 68.9P1 - 151max) fps -16%
Asus ZenBook 14 UX425EA
Intel Core i7-1165G7, Intel Iris Xe Graphics G7 96EUs
77.5 (15.6min, 29P1 - 281max) fps -18%
Asus ZenBook 14 UX434FL-DB77
Intel Core i7-8565U, NVIDIA GeForce MX250
71.3 (49.1min, 57.4P1 - 118max) fps -24%
1920x1080 medium AA:medium AF:4
Dell XPS 13 9310 Core i7 FHD
Intel Core i7-1165G7, Intel Iris Xe Graphics G7 96EUs
38.5 (8.5min, 10P1 - 315max) fps
Durchschnittliche Intel Iris Xe Graphics G7 96EUs
  (18.2 - 51.4, n=166)