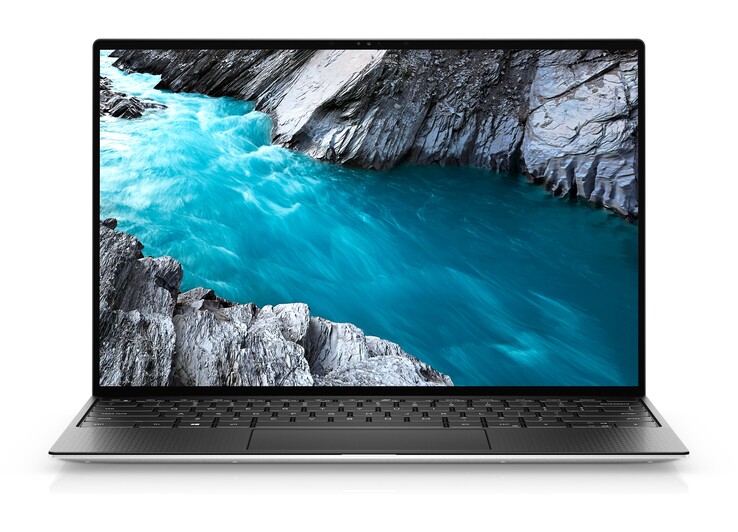
Dell XPS 13 9310 4K Laptop Test: Core i7-1165G7 vs. Core i7-1185G7
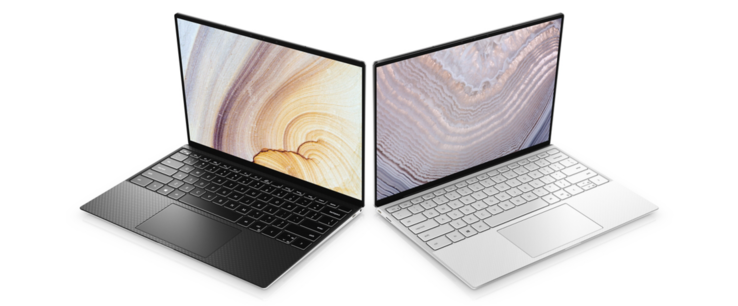
Das Dell XPS 13 9310 wurde vor ein paar Monaten zusammen mit Intels brandneuer 11. Generation Tiger Lake-U Plattform vorgestellt. Nach unserer Testzeit mit dem Dell-Gerät, erwies sich die Leistung als spürbar upgegradet zum XPS 13 9300, besonders in Bezug auf die Grafik. Am äußeren Design gab es keine Änderungen. Wenn Sie ein älteres XPS-Modell besitzen oder einen Grafik-Boost gebrauchen können, dann ist ein Upgrade auf das XPS 13 9310 sehr sinnvoll.
Für den aktuellen Artikel hat uns Dell ein höherwertiges zweites XPS 13 9310 geschickt, das mit der Core i7-1185G7-CPU und einem 4K-UHD-Display ausgestattet ist, im Gegensatz zu unserem ersten Gerät mit Core i7-1165G7 und FHD-Display. Die Konfiguration kostet derzeit ca. 1600 US-Dollar oder etwa 300 US-Dollar mehr als die Core i7-1165G7/FHD-Option. Sehen Sie sich unsere bestehenden Tests über das XPS 13 9300 und XPS 13 9310 an, um mehr über das Gehäuse und seine Funktionen zu erfahren, da sich unsere Test hier auf die Unterschiede zwischen den Core i7-1165G7/FHD und Core i7-1185G7/4K XPS 13 9310 SKUs konzentrieren wird. Ist die teurere Option die zusätzlichen Kosten wert?
Mehr Dell-Tests:
potential competitors in comparison
Bew. | Datum | Modell | Gewicht | Dicke | Größe | Auflösung | Preis ab |
|---|---|---|---|---|---|---|---|
| 87.4 % v7 (old) | 12 / 2020 | Dell XPS 13 9310 Core i7 4K i7-1185G7, Iris Xe G7 96EUs | 1.3 kg | 14.8 mm | 13.40" | 3840x2400 | |
| 85.1 % v7 (old) | Asus Zenbook S UX393JA i7-1065G7, Iris Plus Graphics G7 (Ice Lake 64 EU) | 1.4 kg | 15.7 mm | 13.90" | 3300x2200 | ||
| 87.4 % v7 (old) | 06 / 2020 | Huawei MateBook X Pro 2020 i7 i7-10510U, GeForce MX250 | 1.3 kg | 14.6 mm | 13.90" | 3000x2000 | |
| 88.9 % v7 (old) | 03 / 2020 | Dell XPS 13 9300 Core i7-1065G7 i7-1065G7, Iris Plus Graphics G7 (Ice Lake 64 EU) | 1.2 kg | 14.8 mm | 13.40" | 1920x1200 | |
| 85.3 % v7 (old) | 08 / 2020 | Lenovo Yoga Slim 7-14ARE R7 4800U, Vega 8 | 1.4 kg | 14.9 mm | 14.00" | 1920x1080 | |
| 88.4 % v7 (old) | 12 / 2019 | HP Spectre x360 13-aw0013dx i7-1065G7, Iris Plus Graphics G7 (Ice Lake 64 EU) | 1.2 kg | 16.9 mm | 13.30" | 1920x1080 |
Gehäuse
SD-Kartenleser
| SD Card Reader | |
| average JPG Copy Test (av. of 3 runs) | |
| Dell XPS 13 9310 Core i7 4K (Toshiba Exceria Pro M501 32 GB UHS-II) | |
| HP Spectre x360 13-aw0013dx (Toshiba Exceria Pro M501 microSDXC 64GB) | |
| Dell XPS 13 9300 Core i7-1065G7 (Toshiba Exceria Pro M501 64 GB UHS-II) | |
| Asus Zenbook S UX393JA (Toshiba Exceria Pro M501 64 GB UHS-II) | |
| Lenovo Yoga Slim 7-14ARE (Toshiba Exceria Pro M501 64 GB UHS-II) | |
| maximum AS SSD Seq Read Test (1GB) | |
| Dell XPS 13 9310 Core i7 4K (Toshiba Exceria Pro M501 32 GB UHS-II) | |
| Dell XPS 13 9300 Core i7-1065G7 (Toshiba Exceria Pro M501 64 GB UHS-II) | |
| HP Spectre x360 13-aw0013dx (Toshiba Exceria Pro M501 microSDXC 64GB) | |
| Lenovo Yoga Slim 7-14ARE (Toshiba Exceria Pro M501 64 GB UHS-II) | |
| Asus Zenbook S UX393JA (Toshiba Exceria Pro M501 64 GB UHS-II) | |
Kommunikation
| Networking | |
| iperf3 transmit AX12 | |
| Lenovo Yoga Slim 7-14ARE | |
| Dell XPS 13 9310 Core i7 4K | |
| Huawei MateBook X Pro 2020 i7 | |
| Dell XPS 13 9300 Core i7-1065G7 | |
| Asus Zenbook S UX393JA | |
| iperf3 receive AX12 | |
| Dell XPS 13 9310 Core i7 4K | |
| Asus Zenbook S UX393JA | |
| Dell XPS 13 9300 Core i7-1065G7 | |
| Lenovo Yoga Slim 7-14ARE | |
| Huawei MateBook X Pro 2020 i7 | |
Webcam
Display
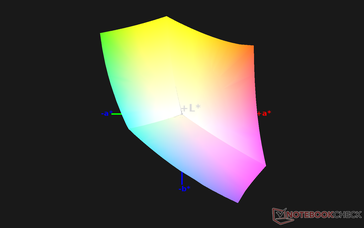
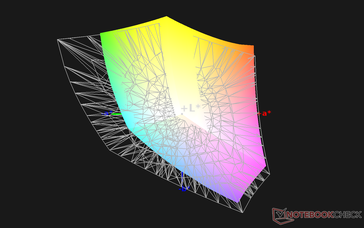
Dell verwendet das gleiche Sharp LQ134R1 IPS-Panel für die letzte Generation des XPS 13 9300 4K und die aktuelle Generation des XPS 13 9310 4K für ein ähnliches visuelles Erlebnis von Generation zu Generation. Ein großer Unterschied, den wir zwischen unseren beiden Geräten festgestellt haben, bezieht sich jedoch auf das hellere Display des neueren XPS 13 9310 (479 nits vs. 401 nits). Die Pulsweitenmodulation ist beim neueren Modell ebenfalls vorhanden, während sie beim älteren XPS 13 9300 4K fehlte, was darauf schließen lässt, dass Dell dieses Mal eine andere Hintergrundbeleuchtung verwendet.
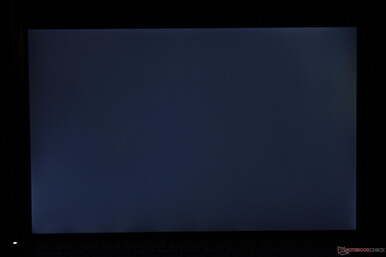
Die Gleichmäßigkeit der Helligkeit könnte bei unserem Gerät noch etwas besser sein. Die obere linke Ecke unseres Displays ist etwas dunkler als sie sein sollte, wie unsere Messungen unten zeigen. Es stört nicht wirklich, aber wir erwarten mehr von einer Flaggschiff-Serie wie dem XPS.
| |||||||||||||||||||||||||
Ausleuchtung: 84 %
Helligkeit Akku: 508.7 cd/m²
Kontrast: 1696:1 (Schwarzwert: 0.3 cd/m²)
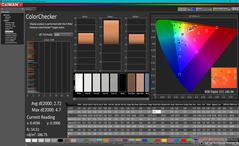
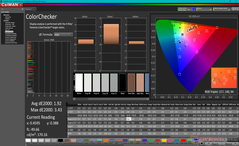
ΔE ColorChecker Calman: 2.72 | ∀{0.5-29.43 Ø4.76}
calibrated: 1.92
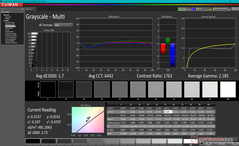
ΔE Greyscale Calman: 3.4 | ∀{0.09-98 Ø5}
100% sRGB (Argyll 1.6.3 3D)
70.7% AdobeRGB 1998 (Argyll 1.6.3 3D)
78.9% AdobeRGB 1998 (Argyll 3D)
100% sRGB (Argyll 3D)
80.2% Display P3 (Argyll 3D)
Gamma: 2.11
CCT: 6245 K
| Dell XPS 13 9310 Core i7 4K Sharp LQ134R1, IPS, 13.4", 3840x2400 | Asus Zenbook S UX393JA AU Optronics B139KAN01.0, IPS, 13.9", 3300x2200 | Huawei MateBook X Pro 2020 i7 JDI LPM139M422A, LTPS, 13.9", 3000x2000 | Dell XPS 13 9300 Core i7-1065G7 Sharp LQ134N1, IPS, 13.4", 1920x1200 | Lenovo Yoga Slim 7-14ARE AU Optronics B140HAN06.8, IPS, 14", 1920x1080 | HP Spectre x360 13-aw0013dx AU Optronics AUO5E2D, IPS, 13.3", 1920x1080 | |
|---|---|---|---|---|---|---|
| Display | 11% | -10% | -11% | -7% | -8% | |
| Display P3 Coverage (%) | 80.2 | 97.7 22% | 66.6 -17% | 66.3 -17% | 71.7 -11% | 69.6 -13% |
| sRGB Coverage (%) | 100 | 99.8 0% | 99.4 -1% | 97.3 -3% | 99.3 -1% | 98.9 -1% |
| AdobeRGB 1998 Coverage (%) | 78.9 | 87.9 11% | 68.6 -13% | 68.5 -13% | 72.9 -8% | 71.5 -9% |
| Response Times | 5% | 20% | 17% | 25% | 3% | |
| Response Time Grey 50% / Grey 80% * (ms) | 59.2 ? | 56.4 ? 5% | 49.6 ? 16% | 50 ? 16% | 45.6 ? 23% | 60.8 ? -3% |
| Response Time Black / White * (ms) | 40.4 ? | 38.8 ? 4% | 30.8 ? 24% | 33.2 ? 18% | 29.6 ? 27% | 36.8 ? 9% |
| PWM Frequency (Hz) | 2137 ? | 29070 ? | 2500 ? | |||
| Bildschirm | -15% | 18% | -11% | -17% | -23% | |
| Helligkeit Bildmitte (cd/m²) | 508.7 | 444.1 -13% | 557 9% | 607.6 19% | 399.6 -21% | 447.4 -12% |
| Brightness (cd/m²) | 479 | 423 -12% | 532 11% | 595 24% | 385 -20% | 420 -12% |
| Brightness Distribution (%) | 84 | 89 6% | 87 4% | 96 14% | 89 6% | 85 1% |
| Schwarzwert * (cd/m²) | 0.3 | 0.37 -23% | 0.33 -10% | 0.4 -33% | 0.37 -23% | 0.31 -3% |
| Kontrast (:1) | 1696 | 1200 -29% | 1688 0% | 1519 -10% | 1080 -36% | 1443 -15% |
| Delta E Colorchecker * | 2.72 | 2.94 -8% | 1.4 49% | 3.23 -19% | 3.2 -18% | 4.23 -56% |
| Colorchecker dE 2000 max. * | 4.7 | 7.37 -57% | 2.5 47% | 8.67 -84% | 6.44 -37% | 9.34 -99% |
| Colorchecker dE 2000 calibrated * | 1.92 | 3.05 -59% | 0.7 64% | 1.01 47% | 1.73 10% | 1.32 31% |
| Delta E Graustufen * | 3.4 | 2.9 15% | 2 41% | 5.5 -62% | 4.7 -38% | 6.1 -79% |
| Gamma | 2.11 104% | 2.1 105% | 2.14 103% | 2.12 104% | 2.21 100% | 2.11 104% |
| CCT | 6245 104% | 6766 96% | 6689 97% | 6413 101% | 7184 90% | 6136 106% |
| Farbraum (Prozent von AdobeRGB 1998) (%) | 70.7 | 78.2 11% | 62.5 -12% | 63 -11% | 66.3 -6% | 64.8 -8% |
| Color Space (Percent of sRGB) (%) | 100 | 99.8 0% | 99.5 0% | 97.5 -2% | 99.5 0% | 98.9 -1% |
| Durchschnitt gesamt (Programm / Settings) | 0% /
-8% | 9% /
13% | -2% /
-7% | 0% /
-10% | -9% /
-17% |
* ... kleinere Werte sind besser
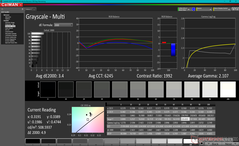
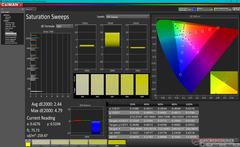
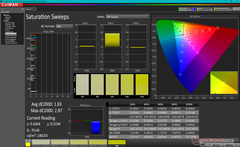
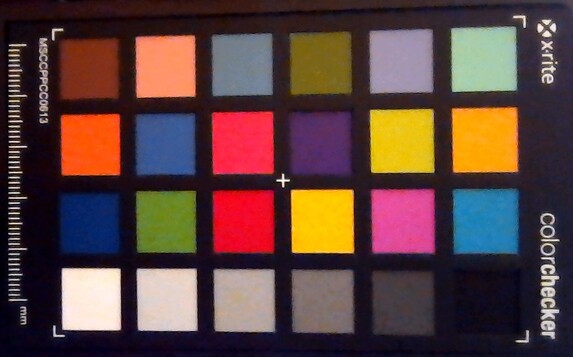
Die Farbtemperatur ist ab Werk etwas zu warm, aber das ist nichts, was unser X-Rite Kolorimeter nach einer Kalibrierung nicht beheben könnte (6245 bis 6442 CCT). Die durchschnittlichen Farb- und Graustufen-DeltaE-Werte würden sich nach ein wenig Optimieren ebenfalls nur geringfügig verbessern, nicht anders als bei unseren Erfahrungen mit den XPS 13 9310 FHD oder XPS 13 9300 4K Konfigurationen.
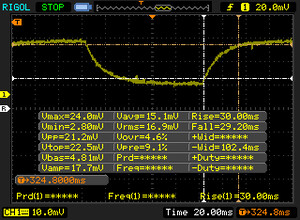
Reaktionszeiten (Response Times) des Displays
| ↔ Reaktionszeiten Schwarz zu Weiß | ||
|---|---|---|
| 40.4 ms ... steigend ↗ und fallend ↘ kombiniert | ↗ 22.4 ms steigend | |
| ↘ 18 ms fallend | ||
| Die gemessenen Reaktionszeiten sind langsam und dadurch für viele Spieler wahrscheinlich zu langsam. Im Vergleich rangierten die bei uns getesteten Geräte von 0.1 (Minimum) zu 240 (Maximum) ms. » 97 % aller Screens waren schneller als der getestete. Daher sind die gemessenen Reaktionszeiten schlechter als der Durchschnitt aller vermessenen Geräte (20.1 ms). | ||
| ↔ Reaktionszeiten 50% Grau zu 80% Grau | ||
| 59.2 ms ... steigend ↗ und fallend ↘ kombiniert | ↗ 30 ms steigend | |
| ↘ 29.2 ms fallend | ||
| Die gemessenen Reaktionszeiten sind langsam und dadurch für viele Spieler wahrscheinlich zu langsam. Im Vergleich rangierten die bei uns getesteten Geräte von 0.165 (Minimum) zu 636 (Maximum) ms. » 95 % aller Screens waren schneller als der getestete. Daher sind die gemessenen Reaktionszeiten schlechter als der Durchschnitt aller vermessenen Geräte (31.5 ms). | ||
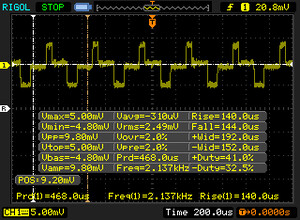
Bildschirm-Flackern / PWM (Pulse-Width Modulation)
| Flackern / PWM festgestellt | 2137 Hz | ≤ 31 % Helligkeit | |
Das Display flackert mit 2137 Hz (im schlimmsten Fall, eventuell durch Pulsweitenmodulation PWM) bei einer eingestellten Helligkeit von 31 % und darunter. Darüber sollte es zu keinem Flackern kommen. Die Frequenz von 2137 Hz ist sehr hoch und sollte daher auch bei empfindlichen Personen zu keinen Problemen führen. Im Vergleich: 53 % aller getesteten Geräte nutzten kein PWM um die Helligkeit zu reduzieren. Wenn PWM eingesetzt wurde, dann bei einer Frequenz von durchschnittlich 8033 (Minimum 5, Maximum 343500) Hz. | |||
Die Sichtbarkeit im Freien ist an einem hellen Tag aufgrund des glänzenden Panels nicht gerade großartig. Im Gegensatz zu einigen älteren XPS-13-Modellen bietet Dell keine matte Option für seine XPS-13-9310-Serie an. Allerdings ist das Display im Allgemeinen hell genug für eine angenehme Sicht, wenn man im Schatten arbeitet.
Performance
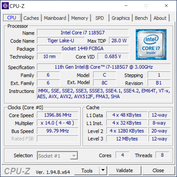
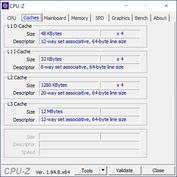
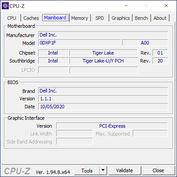
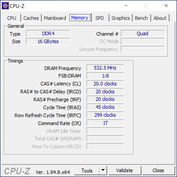
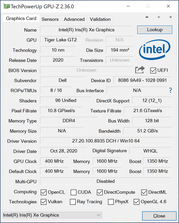
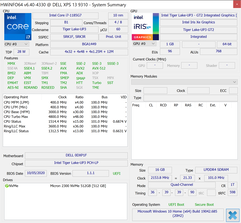
Auf dem Papier hat der Core i7-1185G7 etwas schnellere Basistaktraten und Turbo-Boost-Taktraten als der Core i7-1165G7 (3,0 bis 4,8 GHz vs. 2,8 bis 4,7 GHz). Die Praxis zeigt jedoch, dass diese gedruckten Spezifikationen nicht wirklich viel bedeuten, wenn beide Prozessoren die gleichen Kühllösung besitzen. Ansonsten gibt es keine großen Unterschiede zwischen den beiden Prozessoren, da die Cache-Größen, der TDP-Bereich und die Kernanzahl identisch sind. GPU-Z meldet einige leichte Füllratenunterschiede zwischen der integrierten Iris Xe GPU, aber nichts Signifikantes.
Wir haben unser Gerät über die Dell Power Manager Software auf den Ultra Performance Modus eingestellt, bevor wir die folgenden Leistungstests durchgeführt haben, um die bestmöglichen Werte zu erhalten. Besitzer sollten sich mit dieser Software vertraut machen, da viele XPS-spezifische Optionen hier zu finden sind.
Prozessor
Ähnlich wie beim XPS 15 Core i7-8750H und XPS 15 Core i9-8950HK sind die Leistungsunterschiede zwischen unseren XPS 13 Core i7-1185G7 und Core i7-1165G7 Konfigurationen bestenfalls minimal. Die Benchmark-Ergebnisse sind fast identisch, bis zu dem Punkt, an dem der Core i7-1165G7 manchmal sogar vor dem Core i7-1185G7 liegt, wie bei der HWBOT x265-Kodierung. Wenn man den CineBench R15 xT in einer Schleife laufen lässt, treten dieselben Taktschwankungen auf, die zu unstetigen Scores führen, was auf Dells Dynamic Power Policy-Implementierung zurückzuführen ist.
Es ist schade, dass das XPS 13 keine AMD-Ryzen-Optionen anbietet, denn der Ryzen 5 4500U oder Ryzen 7 4700U haben sogar eine schnellere Multi-Thread-Leistung als diese Intel Tiger Lake CPUs, allerdings auf Kosten einer langsameren Single-Thread-Leistung.
Cinebench R15: CPU Multi 64Bit | CPU Single 64Bit
Blender: v2.79 BMW27 CPU
7-Zip 18.03: 7z b 4 -mmt1 | 7z b 4
Geekbench 5.5: Single-Core | Multi-Core
HWBOT x265 Benchmark v2.2: 4k Preset
LibreOffice : 20 Documents To PDF
R Benchmark 2.5: Overall mean
| Cinebench R20 / CPU (Multi Core) | |
| Lenovo Yoga Slim 7-14ARE | |
| Lenovo Yoga Slim 7 14ARE05 82A20008GE | |
| Dell XPS 13 7390 Core i7-10710U | |
| Razer Book 13 FHD | |
| HP Envy x360 13-ay0010nr | |
| Durchschnittliche Intel Core i7-1185G7 (1425 - 2493, n=28) | |
| Dell XPS 13 9310 Core i7 4K | |
| Dell XPS 13 9310 Core i7 FHD | |
| Dell XPS 13 9300 Core i7-1065G7 | |
| HP Spectre x360 13-aw0013dx | |
| Asus Zenbook S UX393JA | |
| Dell XPS 13 9300 4K UHD | |
| Huawei MateBook X Pro 2020 i7 | |
| Lenovo ThinkPad P43s-20RH001FGE | |
| Cinebench R20 / CPU (Single Core) | |
| Razer Book 13 FHD | |
| Dell XPS 13 9310 Core i7 4K | |
| Dell XPS 13 9310 Core i7 FHD | |
| Durchschnittliche Intel Core i7-1185G7 (489 - 593, n=28) | |
| Lenovo Yoga Slim 7-14ARE | |
| Lenovo Yoga Slim 7 14ARE05 82A20008GE | |
| Dell XPS 13 7390 Core i7-10710U | |
| Dell XPS 13 9300 Core i7-1065G7 | |
| Dell XPS 13 9300 4K UHD | |
| Asus Zenbook S UX393JA | |
| HP Envy x360 13-ay0010nr | |
| Huawei MateBook X Pro 2020 i7 | |
| HP Spectre x360 13-aw0013dx | |
| Lenovo ThinkPad P43s-20RH001FGE | |
| Cinebench R15 / CPU Multi 64Bit | |
| Lenovo Yoga Slim 7-14ARE | |
| Lenovo Yoga Slim 7 14ARE05 82A20008GE | |
| Dell XPS 13 7390 Core i7-10710U | |
| Razer Book 13 FHD | |
| Dell XPS 13 9310 Core i7 FHD | |
| Dell XPS 13 9310 Core i7 4K | |
| Durchschnittliche Intel Core i7-1185G7 (617 - 1066, n=32) | |
| HP Envy x360 13-ay0010nr | |
| Dell XPS 13 9300 4K UHD | |
| Dell XPS 13 9300 Core i7-1065G7 | |
| Dell XPS 13 9380 2019 | |
| HP Spectre x360 13-aw0013dx | |
| Asus Zenbook S UX393JA | |
| Huawei MateBook X Pro 2020 i7 | |
| Lenovo ThinkPad P43s-20RH001FGE | |
| Cinebench R15 / CPU Single 64Bit | |
| Razer Book 13 FHD | |
| Dell XPS 13 9310 Core i7 FHD | |
| Dell XPS 13 9310 Core i7 4K | |
| Durchschnittliche Intel Core i7-1185G7 (168 - 230, n=27) | |
| Lenovo Yoga Slim 7-14ARE | |
| Dell XPS 13 9300 4K UHD | |
| Dell XPS 13 7390 Core i7-10710U | |
| Dell XPS 13 9300 Core i7-1065G7 | |
| Asus Zenbook S UX393JA | |
| HP Spectre x360 13-aw0013dx | |
| Lenovo Yoga Slim 7 14ARE05 82A20008GE | |
| HP Envy x360 13-ay0010nr | |
| Huawei MateBook X Pro 2020 i7 | |
| Lenovo ThinkPad P43s-20RH001FGE | |
| Dell XPS 13 9380 2019 | |
| Blender / v2.79 BMW27 CPU | |
| Huawei MateBook X Pro 2020 i7 | |
| Asus Zenbook S UX393JA | |
| Lenovo ThinkPad P43s-20RH001FGE | |
| Dell XPS 13 9300 4K UHD | |
| Dell XPS 13 9310 Core i7 4K | |
| Dell XPS 13 9310 Core i7 FHD | |
| HP Envy x360 13-ay0010nr | |
| Durchschnittliche Intel Core i7-1185G7 (478 - 745, n=28) | |
| Dell XPS 13 7390 Core i7-10710U | |
| Razer Book 13 FHD | |
| Lenovo Yoga Slim 7 14ARE05 82A20008GE | |
| Lenovo Yoga Slim 7-14ARE | |
| 7-Zip 18.03 / 7z b 4 -mmt1 | |
| Razer Book 13 FHD | |
| Dell XPS 13 9310 Core i7 FHD | |
| Durchschnittliche Intel Core i7-1185G7 (3678 - 5507, n=27) | |
| Dell XPS 13 9310 Core i7 4K | |
| Lenovo ThinkPad P43s-20RH001FGE | |
| Huawei MateBook X Pro 2020 i7 | |
| Dell XPS 13 9300 4K UHD | |
| Lenovo Yoga Slim 7-14ARE | |
| Asus Zenbook S UX393JA | |
| Dell XPS 13 7390 Core i7-10710U | |
| Lenovo Yoga Slim 7 14ARE05 82A20008GE | |
| HP Envy x360 13-ay0010nr | |
| 7-Zip 18.03 / 7z b 4 | |
| Lenovo Yoga Slim 7-14ARE | |
| Lenovo Yoga Slim 7 14ARE05 82A20008GE | |
| Razer Book 13 FHD | |
| Dell XPS 13 7390 Core i7-10710U | |
| Durchschnittliche Intel Core i7-1185G7 (18812 - 27693, n=27) | |
| HP Envy x360 13-ay0010nr | |
| Dell XPS 13 9300 4K UHD | |
| Dell XPS 13 9310 Core i7 FHD | |
| Dell XPS 13 9310 Core i7 4K | |
| Lenovo ThinkPad P43s-20RH001FGE | |
| Asus Zenbook S UX393JA | |
| Huawei MateBook X Pro 2020 i7 | |
| Geekbench 5.5 / Single-Core | |
| Razer Book 13 FHD | |
| Dell XPS 13 9310 Core i7 FHD | |
| Dell XPS 13 9310 Core i7 4K | |
| Durchschnittliche Intel Core i7-1185G7 (1398 - 1626, n=21) | |
| Asus Zenbook S UX393JA | |
| Dell XPS 13 9300 4K UHD | |
| Lenovo Yoga Slim 7-14ARE | |
| Lenovo Yoga Slim 7-14ARE | |
| Lenovo Yoga Slim 7 14ARE05 82A20008GE | |
| HP Envy x360 13-ay0010nr | |
| Huawei MateBook X Pro 2020 i7 | |
| Geekbench 5.5 / Multi-Core | |
| Lenovo Yoga Slim 7-14ARE | |
| Lenovo Yoga Slim 7-14ARE | |
| Lenovo Yoga Slim 7 14ARE05 82A20008GE | |
| Razer Book 13 FHD | |
| Dell XPS 13 9310 Core i7 4K | |
| Dell XPS 13 9310 Core i7 FHD | |
| Durchschnittliche Intel Core i7-1185G7 (4620 - 5944, n=21) | |
| Dell XPS 13 9300 4K UHD | |
| Asus Zenbook S UX393JA | |
| HP Envy x360 13-ay0010nr | |
| Huawei MateBook X Pro 2020 i7 | |
| HWBOT x265 Benchmark v2.2 / 4k Preset | |
| Lenovo Yoga Slim 7-14ARE | |
| Lenovo Yoga Slim 7 14ARE05 82A20008GE | |
| Razer Book 13 FHD | |
| HP Envy x360 13-ay0010nr | |
| Durchschnittliche Intel Core i7-1185G7 (5.02 - 8.13, n=27) | |
| Dell XPS 13 9300 4K UHD | |
| Dell XPS 13 7390 Core i7-10710U | |
| Dell XPS 13 9310 Core i7 FHD | |
| Dell XPS 13 9310 Core i7 4K | |
| Lenovo ThinkPad P43s-20RH001FGE | |
| Asus Zenbook S UX393JA | |
| Huawei MateBook X Pro 2020 i7 | |
| LibreOffice / 20 Documents To PDF | |
| Dell XPS 13 9300 4K UHD | |
| Lenovo Yoga Slim 7 14ARE05 82A20008GE | |
| HP Envy x360 13-ay0010nr | |
| Lenovo Yoga Slim 7-14ARE | |
| Huawei MateBook X Pro 2020 i7 | |
| Durchschnittliche Intel Core i7-1185G7 (41.3 - 61.7, n=26) | |
| Razer Book 13 FHD | |
| Asus Zenbook S UX393JA | |
| Dell XPS 13 9310 Core i7 4K | |
| Dell XPS 13 9310 Core i7 FHD | |
| R Benchmark 2.5 / Overall mean | |
| Dell XPS 13 9300 4K UHD | |
| Asus Zenbook S UX393JA | |
| Huawei MateBook X Pro 2020 i7 | |
| HP Envy x360 13-ay0010nr | |
| Lenovo Yoga Slim 7 14ARE05 82A20008GE | |
| Lenovo Yoga Slim 7-14ARE | |
| Dell XPS 13 9310 Core i7 4K | |
| Dell XPS 13 9310 Core i7 FHD | |
| Durchschnittliche Intel Core i7-1185G7 (0.55 - 0.615, n=27) | |
| Razer Book 13 FHD | |
Cinebench R15: CPU Multi 64Bit | CPU Single 64Bit
Blender: v2.79 BMW27 CPU
7-Zip 18.03: 7z b 4 -mmt1 | 7z b 4
Geekbench 5.5: Single-Core | Multi-Core
HWBOT x265 Benchmark v2.2: 4k Preset
LibreOffice : 20 Documents To PDF
R Benchmark 2.5: Overall mean
* ... kleinere Werte sind besser
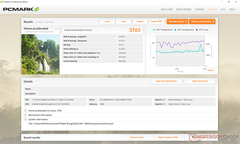
| PCMark 8 Home Score Accelerated v2 | 3765 Punkte | |
| PCMark 8 Work Score Accelerated v2 | 2493 Punkte | |
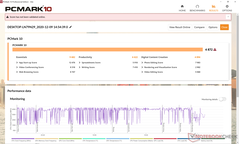
| PCMark 10 Score | 4872 Punkte | |
Hilfe | ||
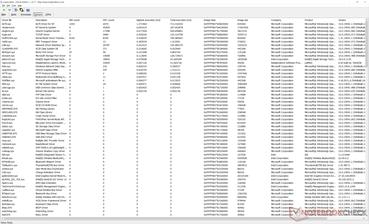
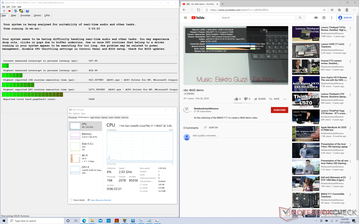
| DPC Latencies / LatencyMon - interrupt to process latency (max), Web, Youtube, Prime95 | |
| Dell XPS 13 9300 Core i7-1065G7 | |
| Asus Zenbook S UX393JA | |
| Lenovo Yoga Slim 7-14ARE | |
| Dell XPS 13 9310 Core i7 4K | |
| Dell XPS 13 9310 Core i7 FHD | |
* ... kleinere Werte sind besser
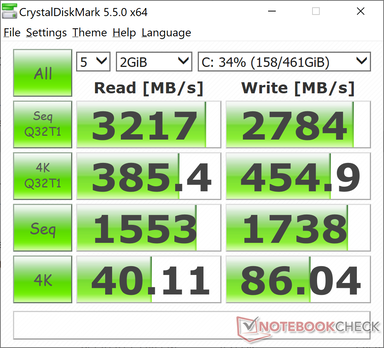
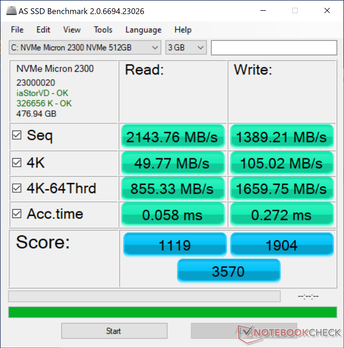
| Dell XPS 13 9310 Core i7 4K Micron 2300 512GB MTFDHBA512TDV | Asus Zenbook S UX393JA Intel SSD 660p 1TB SSDPEKNW010T8 | Huawei MateBook X Pro 2020 i7 Samsung PM981a MZVLB1T0HBLR | Dell XPS 13 9300 Core i7-1065G7 Intel SSDPEMKF512G8 NVMe SSD | Lenovo Yoga Slim 7-14ARE Samsung SSD PM981a MZVLB512HBJQ | HP Spectre x360 13-aw0013dx Intel Optane Memory H10 with Solid State Storage 32GB + 512GB HBRPEKNX0202A(L/H) | |
|---|---|---|---|---|---|---|
| AS SSD | -16% | 45% | -21% | 23% | -36% | |
| Seq Read (MB/s) | 2144 | 1405 -34% | 2737 28% | 1956 -9% | 1658 -23% | 1039 -52% |
| Seq Write (MB/s) | 1389 | 1062 -24% | 2530 82% | 1227 -12% | 2464 77% | 310.1 -78% |
| 4K Read (MB/s) | 49.77 | 50.8 2% | 54 8% | 63 27% | 59.5 20% | 76 53% |
| 4K Write (MB/s) | 105 | 124.9 19% | 152.5 45% | 156.6 49% | 128.6 22% | 118 12% |
| 4K-64 Read (MB/s) | 855 | 590 -31% | 2011 135% | 475.6 -44% | 1576 84% | 371.8 -57% |
| 4K-64 Write (MB/s) | 1660 | 840 -49% | 1260 -24% | 539 -68% | 1986 20% | 469.5 -72% |
| Access Time Read * (ms) | 0.058 | 0.041 29% | 0.066 -14% | 0.042 28% | 0.049 16% | 0.067 -16% |
| Access Time Write * (ms) | 0.272 | 0.118 57% | 0.024 91% | 0.105 61% | 0.087 68% | 0.138 49% |
| Score Read (Points) | 1119 | 781 -30% | 2339 109% | 734 -34% | 1802 61% | 552 -51% |
| Score Write (Points) | 1904 | 1071 -44% | 1666 -12% | 818 -57% | 2361 24% | 618 -68% |
| Score Total (Points) | 3570 | 2251 -37% | 5191 45% | 1915 -46% | 5133 44% | 1448 -59% |
| Copy ISO MB/s (MB/s) | 1929 | 1459 -24% | 1022 -47% | 1588 -18% | 764 -60% | |
| Copy Program MB/s (MB/s) | 1012 | 600 -41% | 302.8 -70% | 550 -46% | 465.8 -54% | |
| Copy Game MB/s (MB/s) | 1737 | 1411 -19% | 491.4 -72% | 1329 -23% | 764 -56% | |
| CrystalDiskMark 5.2 / 6 | -6% | 24% | 27% | 35% | 6% | |
| Write 4K (MB/s) | 86 | 129.5 51% | 165.6 93% | 186.8 117% | 146.1 70% | 112.6 31% |
| Read 4K (MB/s) | 40.11 | 54 35% | 50.2 25% | 71.4 78% | 47.18 18% | 131 227% |
| Write Seq (MB/s) | 1738 | 1265 -27% | 1905 10% | 1203 -31% | 2896 67% | 458.9 -74% |
| Read Seq (MB/s) | 1553 | 1410 -9% | 1669 7% | 2600 67% | 2754 77% | 1355 -13% |
| Write 4K Q32T1 (MB/s) | 454.9 | 420.3 -8% | 474.6 4% | 514 13% | 425.8 -6% | 341.3 -25% |
| Read 4K Q32T1 (MB/s) | 385.4 | 357.7 -7% | 508 32% | 570 48% | 514 33% | 320.6 -17% |
| Write Seq Q32T1 (MB/s) | 2784 | 1799 -35% | 3007 8% | 786 -72% | 2989 7% | 1219 -56% |
| Read Seq Q32T1 (MB/s) | 3217 | 1616 -50% | 3556 11% | 2947 -8% | 3568 11% | 2462 -23% |
| Durchschnitt gesamt (Programm / Settings) | -11% /
-13% | 35% /
36% | 3% /
-4% | 29% /
27% | -15% /
-21% |
* ... kleinere Werte sind besser
Disk Throttling: DiskSpd Read Loop, Queue Depth 8
GPU Performance
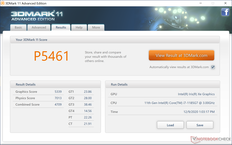
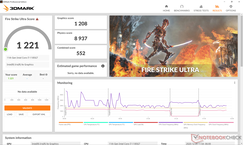
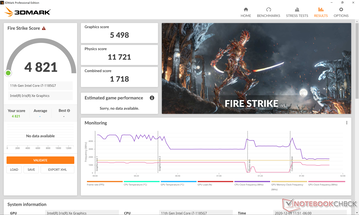
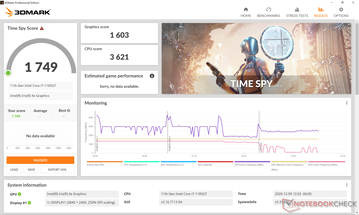
Seltsamerweise sind die 3DMark-Ergebnisse durchweg höher als die, die wir auf dem XPS 13 Core i7-1165G7 aufgezeichnet haben, obwohl Spiele auf der letzteren Konfiguration etwas schneller zu laufen scheinen. Time Spy graphics ist zum Beispiel 30 Prozent höher für unser XPS 13 Core i7-1185G7 SKU, während die Frameraten bei Spielen wie DOTA 2, Final Fantasy XV und GTA V ein paar Frames niedriger sind als auf dem XPS 13 Core i7-1165G7. Wir haben keine eindeutige Erklärung für diese Diskrepanzen, aber sie bedeuten, dass Nutzer in realistischeren Szenarien außerhalb des 3DMark etwa die gleiche Grafikleistung wie beim XPS 13 Core i7-1165G7 erwarten sollten. Wir vermuten, dass die schwankenden Taktraten und die Unterschiede im kalten Zustand vor dem Ausführen der Tests die endgültigen Scores beeinflusst haben könnten.
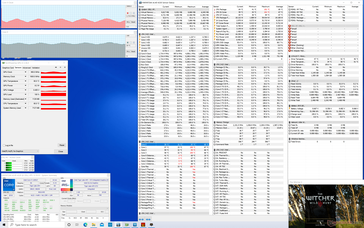
Der Leerlauf auf Witcher 3 bei niedrigen Einstellungen zeigt die gleichen sinusförmigen Schwankungen in den Frameraten, ähnlich wie wir es oben beim XPS 13 9310 Core i7-1165G7 und dem CineBench R15 xT Schleifentest beobachtet haben. In diesem Beispiel schwankten die Frameraten aufgrund der wechselnden Taktraten zwischen 50 FPS und 90 FPS.
Weitere technische Informationen und Benchmark-Vergleiche finden Sie auf unserer speziellen Seite über die Iris Xe.
| 3DMark 11 Performance | 5461 Punkte | |
| 3DMark Cloud Gate Standard Score | 15779 Punkte | |
| 3DMark Fire Strike Score | 4821 Punkte | |
| 3DMark Time Spy Score | 1749 Punkte | |
Hilfe | ||
| Final Fantasy XV Benchmark | |
| 1280x720 Lite Quality | |
| Razer Book 13 FHD | |
| Durchschnittliche Intel Iris Xe Graphics G7 96EUs (14.9 - 56.5, n=189) | |
| Lenovo Yoga Slim 7-14ARE | |
| Dell XPS 13 9310 Core i7 FHD | |
| Dell XPS 13 9310 Core i7 4K | |
| Lenovo IdeaPad S540-13ARE-82DL000YGE | |
| Asus Zenbook S UX393JA | |
| 1920x1080 Standard Quality | |
| Razer Book 13 FHD | |
| Durchschnittliche Intel Iris Xe Graphics G7 96EUs (10.5 - 31.2, n=185) | |
| Dell XPS 13 9310 Core i7 FHD | |
| Lenovo Yoga Slim 7-14ARE | |
| Dell XPS 13 9310 Core i7 4K | |
| Lenovo IdeaPad S540-13ARE-82DL000YGE | |
| Asus Zenbook S UX393JA | |
| 1920x1080 High Quality | |
| Razer Book 13 FHD | |
| Durchschnittliche Intel Iris Xe Graphics G7 96EUs (8.15 - 27.8, n=178) | |
| Dell XPS 13 9310 Core i7 FHD | |
| Dell XPS 13 9310 Core i7 4K | |
| Lenovo Yoga Slim 7-14ARE | |
| Lenovo IdeaPad S540-13ARE-82DL000YGE | |
| Asus Zenbook S UX393JA | |
| min. | mittel | hoch | max. | QHD | 4K | |
|---|---|---|---|---|---|---|
| GTA V (2015) | 80.8 | 64.6 | 20.5 | 9.75 | ||
| The Witcher 3 (2015) | 107 | 61.9 | 34.5 | 15.3 | ||
| Dota 2 Reborn (2015) | 80.7 | 51.4 | 38.2 | 38.6 | 20 | |
| Final Fantasy XV Benchmark (2018) | 31.3 | 18.8 | 14.6 | 11.4 | 7.54 | |
| X-Plane 11.11 (2018) | 26 | 27.8 | 31.8 | 14.9 |
Emissionen
Systemrauschen
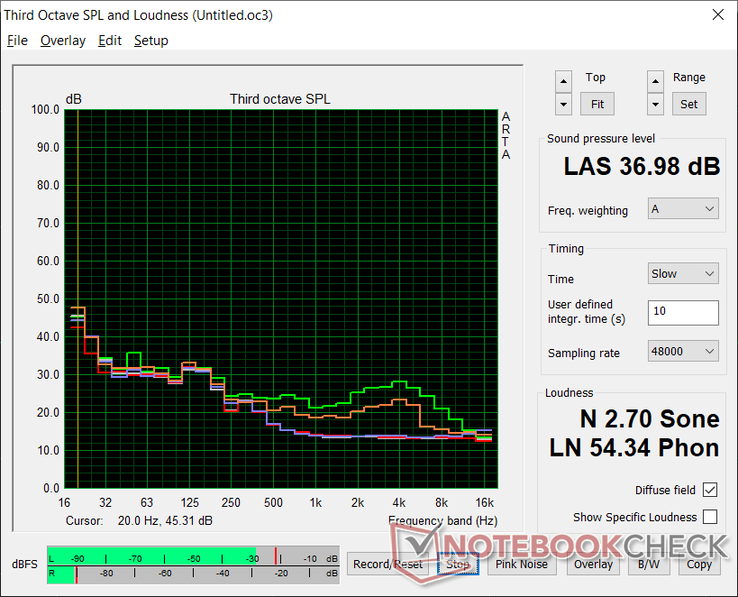
Obwohl die Taktraten unter Last immer schwanken, bleibt das Lüftergeräusch erfreulicherweise konstant. Tatsächlich ist das System immer leise oder unhörbar, bis schwerere Lasten wie Spiele eingeführt werden. Realistisch betrachtet, werden die meisten Anwender nichts über 33 dB(A) hören, es sei denn, der Prozessor wird für längere Zeit maximal gestresst.
| Dell XPS 13 9310 Core i7 4K Iris Xe G7 96EUs, i7-1185G7, Micron 2300 512GB MTFDHBA512TDV | Asus Zenbook S UX393JA Iris Plus Graphics G7 (Ice Lake 64 EU), i7-1065G7, Intel SSD 660p 1TB SSDPEKNW010T8 | Huawei MateBook X Pro 2020 i7 GeForce MX250, i7-10510U, Samsung PM981a MZVLB1T0HBLR | Dell XPS 13 9300 Core i7-1065G7 Iris Plus Graphics G7 (Ice Lake 64 EU), i7-1065G7, Intel SSDPEMKF512G8 NVMe SSD | Lenovo Yoga Slim 7-14ARE Vega 8, R7 4800U, Samsung SSD PM981a MZVLB512HBJQ | HP Spectre x360 13-aw0013dx Iris Plus Graphics G7 (Ice Lake 64 EU), i7-1065G7, Intel Optane Memory H10 with Solid State Storage 32GB + 512GB HBRPEKNX0202A(L/H) | |
|---|---|---|---|---|---|---|
| Geräuschentwicklung | -10% | -12% | -7% | 0% | -2% | |
| aus / Umgebung * (dB) | 27.7 | 26.9 3% | 29.6 -7% | 28.3 -2% | 26.3 5% | 28.5 -3% |
| Idle min * (dB) | 27.8 | 26.9 3% | 29.6 -6% | 28.3 -2% | 26.5 5% | 28.5 -3% |
| Idle avg * (dB) | 27.8 | 29 -4% | 29.6 -6% | 28.3 -2% | 26.5 5% | 28.5 -3% |
| Idle max * (dB) | 27.8 | 31.1 -12% | 30.3 -9% | 28.3 -2% | 26.5 5% | 28.5 -3% |
| Last avg * (dB) | 27.9 | 37.7 -35% | 38 -36% | 32.5 -16% | 31.8 -14% | 28.5 -2% |
| Witcher 3 ultra * (dB) | 32.8 | 40.2 -23% | 38 -16% | 39.3 -20% | 35.9 -9% | 35.3 -8% |
| Last max * (dB) | 37 | 38.1 -3% | 38 -3% | 39.3 -6% | 35.9 3% | 35.3 5% |
* ... kleinere Werte sind besser
Lautstärkediagramm
| Idle |
| 27.8 / 27.8 / 27.8 dB(A) |
| Last |
| 27.9 / 37 dB(A) |
 | ||
30 dB leise 40 dB(A) deutlich hörbar 50 dB(A) störend |
||
min: | ||
Temperatur
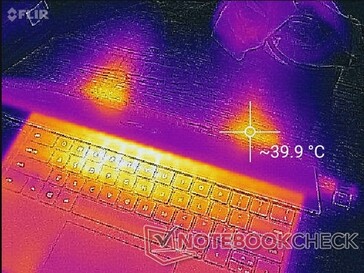
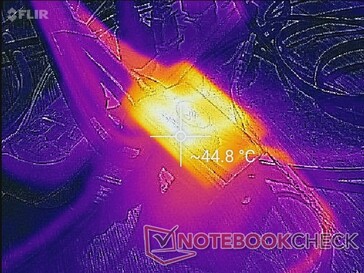
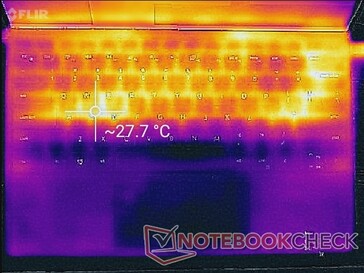
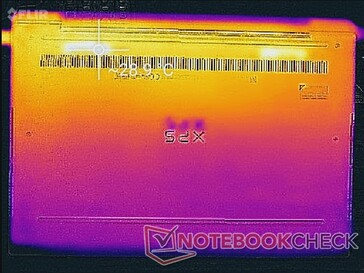
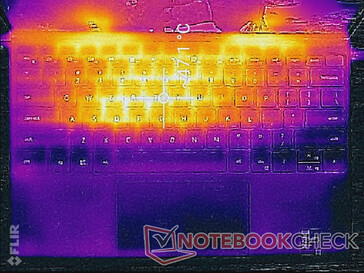
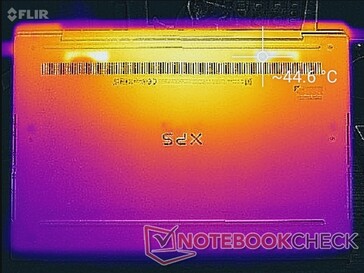
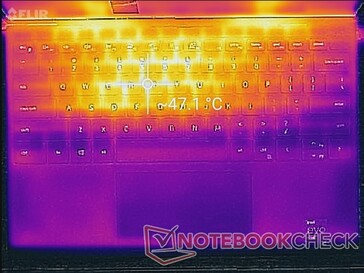
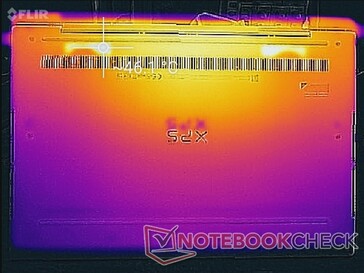
Die Hotspots sind fast die gleichen, die wir beim XPS 13 9310 mit der kleineren Core i7-1165G7 CPU aufgezeichnet haben. Ein Upgrade auf die Core i7-1185G7-Option bedeutet also nicht unbedingt, dass sich das Notebook wärmer anfühlt.
(-) Die maximale Temperatur auf der Oberseite ist 47 °C. Im Vergleich liegt der Klassendurchschnitt bei 35.9 °C (von 21.4 bis 59 °C für die Klasse Subnotebook).
(±) Auf der Unterseite messen wir eine maximalen Wert von 45 °C (im Vergleich zum Durchschnitt von 39.3 °C).
(+) Ohne Last messen wir eine durchschnittliche Temperatur von 26.1 °C auf der Oberseite. Der Klassendurchschnitt erreicht 30.8 °C.
(±) Beim längeren Spielen von The Witcher 3 erhitzt sich das Gerät durchschnittlich auf 34.4 °C. Der Durchschnitt der Klasse ist derzeit 30.8 °C.
(+) Die Handballen und der Touchpad-Bereich sind mit gemessenen 28.8 °C kühler als die typische Hauttemperatur und fühlen sich dadurch kühl an.
(±) Die durchschnittliche Handballen-Temperatur anderer getesteter Geräte war 28.2 °C (-0.6 °C).
Stresstest
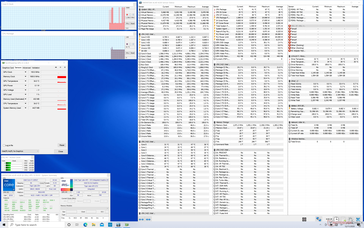
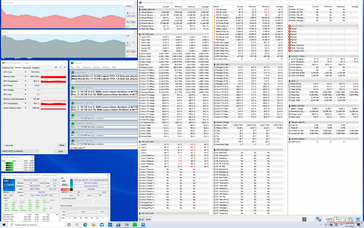
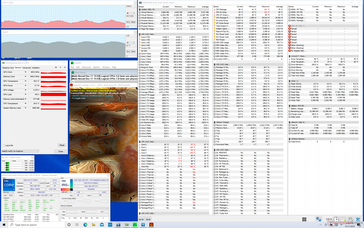
Unter Stress mit Prime95 stieg das System für einige Sekunden in den Bereich von 3,9 GHz bis 4,3 GHz, bis es eine Kerntemperatur von 101 °C erreichte. Danach fielen die Taktraten stetig, bis sie anfingen, unendlich zwischen 2,1 GHz bis 3 GHz und 63 °C bis 81 °C zu pendeln. Diese Raten sind sehr ähnlich zu denen, die wir auf dem XPS 13 Core i7-1165G7 beobachtet haben, wo die Taktraten zwischen 1,9 GHz und 3,1 GHz bei einer Kerntemperatur von 71 °C bis 78 °C pendelten.
Die CPU- und GPU-Taktraten schwankten auch im Betrieb von Witcher 3, was sich, wie oben erwähnt, stark auf die Frameraten auswirkt. Auch die GPU-Leistung schwankt laut GPU-Z zwischen 5,7 W und 9,2 W.
Im Akkubetrieb gibt es keine größeren Leistungseinbußen. Ein 3DMark 11 Test im Akkubetrieb liefert Physics und Graphics Scores von 10181 bzw. 6463 Punkten, verglichen mit 7013 und 5339 Punkten im Netzbetrieb. Die höheren Scores im Akkubetrieb können auf einen kälteren Systemzustand vor der Ausführung des Tests zurückgeführt werden.
| CPU-Takt (GHz)GPU-Takt (MHz)DurchschnittlicheCPU-Temperatur (°C) |
| System Leerlauf----41 |
| Prime95 Stress 2.1 - 3--63 - 81 |
| Prime95+ FurMark Stress 0.9 - 1.8600 - 100061 - 71 |
| Witcher 3 Stress1.3 - 2.1700 - 115058 - 65 |
Lautsprecher
Dell XPS 13 9310 Core i7 4K Audio Analyse
(+) | Die Lautsprecher können relativ laut spielen (84.6 dB)
Bass 100 - 315 Hz
(±) | abgesenkter Bass - 13.1% geringer als der Median
(±) | durchschnittlich lineare Bass-Wiedergabe (11.1% Delta zum Vorgänger)
Mitteltöne 400 - 2000 Hz
(+) | ausgeglichene Mitten, vom Median nur 4.3% abweichend
(+) | lineare Mitten (4.2% Delta zum Vorgänger)
Hochtöne 2 - 16 kHz
(+) | ausgeglichene Hochtöne, vom Median nur 1.5% abweichend
(+) | sehr lineare Hochtöne (3.8% Delta zum Vorgänger)
Gesamt im hörbaren Bereich 100 - 16.000 Hz
(+) | hörbarer Bereich ist sehr linear (10.9% Abstand zum Median
Im Vergleich zu allen Geräten derselben Klasse
» 9% aller getesteten Geräte dieser Klasse waren besser, 3% vergleichbar, 88% schlechter
» Das beste Gerät hat einen Delta-Wert von 5%, durchschnittlich ist 18%, das schlechteste Gerät hat 53%
Im Vergleich zu allen Geräten im Test
» 6% aller getesteten Geräte waren besser, 2% vergleichbar, 93% schlechter
» Das beste Gerät hat einen Delta-Wert von 4%, durchschnittlich ist 24%, das schlechteste Gerät hat 134%
Apple MacBook 12 (Early 2016) 1.1 GHz Audio Analyse
(+) | Die Lautsprecher können relativ laut spielen (83.6 dB)
Bass 100 - 315 Hz
(±) | abgesenkter Bass - 11.3% geringer als der Median
(±) | durchschnittlich lineare Bass-Wiedergabe (14.2% Delta zum Vorgänger)
Mitteltöne 400 - 2000 Hz
(+) | ausgeglichene Mitten, vom Median nur 2.4% abweichend
(+) | lineare Mitten (5.5% Delta zum Vorgänger)
Hochtöne 2 - 16 kHz
(+) | ausgeglichene Hochtöne, vom Median nur 2% abweichend
(+) | sehr lineare Hochtöne (4.5% Delta zum Vorgänger)
Gesamt im hörbaren Bereich 100 - 16.000 Hz
(+) | hörbarer Bereich ist sehr linear (10.2% Abstand zum Median
Im Vergleich zu allen Geräten derselben Klasse
» 7% aller getesteten Geräte dieser Klasse waren besser, 2% vergleichbar, 91% schlechter
» Das beste Gerät hat einen Delta-Wert von 5%, durchschnittlich ist 18%, das schlechteste Gerät hat 53%
Im Vergleich zu allen Geräten im Test
» 4% aller getesteten Geräte waren besser, 1% vergleichbar, 94% schlechter
» Das beste Gerät hat einen Delta-Wert von 4%, durchschnittlich ist 24%, das schlechteste Gerät hat 134%
Energie
Energieaufnahme
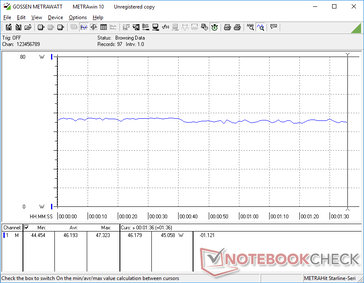
Der Leerlauf auf dem Desktop bei höchster Helligkeitseinstellung verbraucht etwa 8,3 W bis 8,8 W im Vergleich zu 5,9 W bis 6,3 W bei der FHD-Konfiguration. Der leichte Anstieg ist wahrscheinlich teilweise auf das anspruchsvollere Panel mit 4K-Auflösung zurückzuführen.
Die Leistungsaufnahme ist im 3DMark 06 generell höher als bei anderen Core i7 Ultrabooks mit integrierter Grafik. Wir können einen Durchschnitt von 46 W messen, verglichen mit nur 32 W bis 37 W beim HP Spectre x360 13, ZenBook S oder XPS 13 9310, die jeweils mit dem langsameren Core i7-1065G7 des letzten Jahres ausgestattet sind. Nichtsdestotrotz ist die Leistung pro Watt immer noch unglaublich im Vergleich zu älteren Whiskey Lake-U oder Comet Lake-U Systemen.
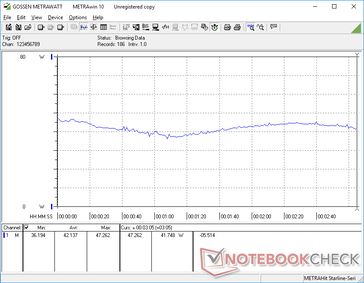
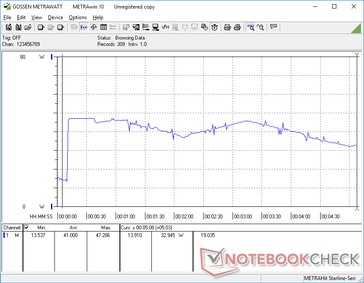
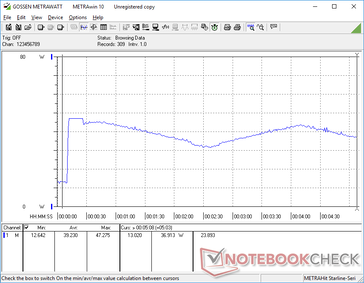
Der Betrieb von Prime95 zieht 47 W aus dem kleinen (~6 x 5,5 x 2,3 cm) 45-Watt-Netzteil. Allerdings hält diese Rate nur für ein paar Sekunden an, bevor der Zyklus beginnt, wie unsere Grafiken unten zeigen.
| Aus / Standby | |
| Idle | |
| Last |
|
Legende:
min: | |
| Dell XPS 13 9310 Core i7 4K i7-1185G7, Iris Xe G7 96EUs, Micron 2300 512GB MTFDHBA512TDV, IPS, 3840x2400, 13.4" | Asus Zenbook S UX393JA i7-1065G7, Iris Plus Graphics G7 (Ice Lake 64 EU), Intel SSD 660p 1TB SSDPEKNW010T8, IPS, 3300x2200, 13.9" | Huawei MateBook X Pro 2020 i7 i7-10510U, GeForce MX250, Samsung PM981a MZVLB1T0HBLR, LTPS, 3000x2000, 13.9" | Dell XPS 13 9300 Core i7-1065G7 i7-1065G7, Iris Plus Graphics G7 (Ice Lake 64 EU), Intel SSDPEMKF512G8 NVMe SSD, IPS, 1920x1200, 13.4" | Lenovo Yoga Slim 7-14ARE R7 4800U, Vega 8, Samsung SSD PM981a MZVLB512HBJQ, IPS, 1920x1080, 14" | HP Spectre x360 13-aw0013dx i7-1065G7, Iris Plus Graphics G7 (Ice Lake 64 EU), Intel Optane Memory H10 with Solid State Storage 32GB + 512GB HBRPEKNX0202A(L/H), IPS, 1920x1080, 13.3" | |
|---|---|---|---|---|---|---|
| Stromverbrauch | 3% | -17% | 12% | 0% | 17% | |
| Idle min * (Watt) | 4.3 | 4.1 5% | 4.3 -0% | 4.2 2% | 4 7% | 3.9 9% |
| Idle avg * (Watt) | 8.3 | 7.5 10% | 8.5 -2% | 6.9 17% | 6.3 24% | 6.3 24% |
| Idle max * (Watt) | 8.8 | 8.5 3% | 12 -36% | 7.5 15% | 7.7 12% | 6.8 23% |
| Last avg * (Watt) | 46.2 | 36.8 20% | 54.8 -19% | 33.3 28% | 48.3 -5% | 32.6 29% |
| Witcher 3 ultra * (Watt) | 42.2 | 39.2 7% | 47.1 -12% | 37.1 12% | 49 -16% | 25.6 39% |
| Last max * (Watt) | 47.3 | 61.6 -30% | 61.5 -30% | 48.4 -2% | 57.6 -22% | 59 -25% |
* ... kleinere Werte sind besser
Akkulaufzeit
Die Laufzeiten sind viel kürzer als die, die wir beim XPS 13 FHD aufgezeichnet haben. Während unser FHD-Gerät bei realer WLAN-Nutzung über 12 Stunden durchhielt, machte unser 4K-Gerät bei gleichem Dell-Optimierungsprofil und gleicher Helligkeitseinstellung nach 7 Stunden schlapp. Wir haben sogar unseren Akkulaufzeittest wiederholt, nur um eventuelle Unstimmigkeiten zu überprüfen, aber die ungefähre Laufzeit von 7 Stunden hat sich nicht verändert.
Das Aufladen von leerer zu voller Kapazität ist mit 2,5 bis 3 Stunden langsam. Viele andere Ultrabooks können fast zwei Mal so schnell aufladen wie das Razer Book 13.
| Dell XPS 13 9310 Core i7 4K i7-1185G7, Iris Xe G7 96EUs, 52 Wh | Asus Zenbook S UX393JA i7-1065G7, Iris Plus Graphics G7 (Ice Lake 64 EU), 67 Wh | Huawei MateBook X Pro 2020 i7 i7-10510U, GeForce MX250, 57.4 Wh | Dell XPS 13 9300 Core i7-1065G7 i7-1065G7, Iris Plus Graphics G7 (Ice Lake 64 EU), 52 Wh | Lenovo Yoga Slim 7-14ARE R7 4800U, Vega 8, 61 Wh | HP Spectre x360 13-aw0013dx i7-1065G7, Iris Plus Graphics G7 (Ice Lake 64 EU), 60 Wh | |
|---|---|---|---|---|---|---|
| Akkulaufzeit | 15% | 44% | 76% | 43% | 38% | |
| WLAN (h) | 7.2 | 8.3 15% | 10.4 44% | 12.7 76% | 10.3 43% | 9.9 38% |
| Idle (h) | 38.4 | 27.1 | 37.1 | |||
| Last (h) | 2.7 | 2.4 | 1.3 | 2.7 |
Pro
Contra
Fazit
Aus Performance-Sicht bietet der Core i7-1185G7 kein großes Upgrade gegenüber dem Core i7-1165G7, weshalb wir empfehlen, die paar Euro zu sparen und den Core i7-1165G7 zu wählen. Das gesparte Geld kann stattdessen in zusätzlichen Arbeitsspeicher oder Speicherplatz oder die höher auflösende 4K-Option investiert werden, wo die Upgrades spürbarer sind. Die Akkulaufzeit wird allerdings ein paar Stunden kürzer sein als bei der FHD-Option.
Eine Investition in mehr RAM, Speicher oder das höher auflösende 4K-Display würde sich eher lohnen als der Core i7-1185G7, da die Leistungsgewinne gegenüber dem Core i7-1165G7 bestenfalls minimal sind.
Wenn wir eine Änderung am XPS 13 9310 vornehmen könnten, dann wäre es eine Option für gleichmäßigere Taktraten im High Performance Modus. Die zyklischen Taktraten funktionieren gut, um die durchschnittliche CPU-Leistung zu maximieren wenn die Kühllösung der begrenzende Faktor ist, aber die daraus resultierenden Leistungsschwankungen können für bestimmte Anwendungen ungünstig sein.
Dell XPS 13 9310 Core i7 4K
- 31.05.2021 v7 (old)
Allen Ngo


