Notebookcheck Logo

Dell Precision 3551 Laptop Testbericht: Intel Core i9-10885H Debüt
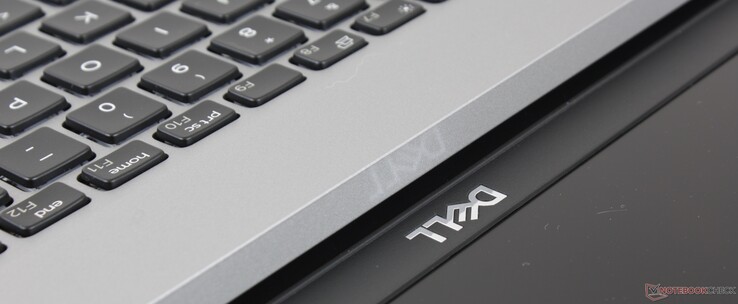
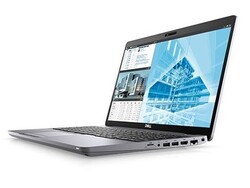
Erschwingliche Core-i9-Workstation. Die Precision 3551 ist eine der preiswertesten mobilen Workstations, die Sie mit einer vPro-fähigen Intel-Core-i9-CPU der 10. Generation finden können. Anschlüsse und Funktionen sind lobenswert, solange Sie mit dem langweiligen visuellen Design einverstanden sind.

Im Gegensatz zur Precision 3550, die auf langsameren CPUs der Intel-U-Klasse mit optionaler Quadro-P520-Grafik läuft, steigert die Precision 3551 den Leistungsfaktor mit Core-H-Klasse-CPUs und der optionalen Quadro-P620-Grafikkarte. Der Laptop ist eine mobile Workstation der Einstiegsklasse, die unterhalb der mittleren Precision-5000-Serie und der Spitzenklasse der Precision-7000-Serie angesiedelt ist.

Weitere Testberichte von Dell:

Dell Precision 3000 3551 (Precision 3000 Serie)
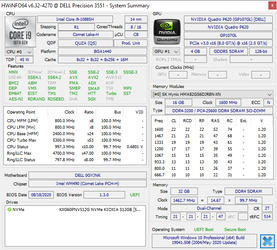
Prozessor
Grafikkarte
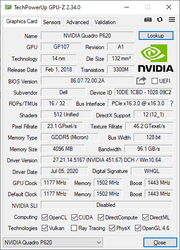
NVIDIA Quadro P620 - 4 GB VRAM, Kerntakt: 1177 MHz, Speichertakt: 1502 MHz, GDDR5, 451.67, Optimus
Hauptspeicher
32 GB 
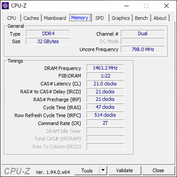
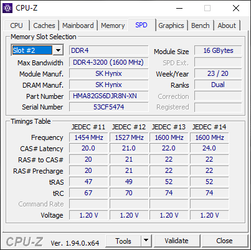
, DDR4-3200, 21-21-21-47, Dual-Channel
Bildschirm
15.60 Zoll 16:9, 1920 x 1080 Pixel 141 PPI, 10-point capacitive, LG Philips 156WFD, IPS, LGD05FF, Dell P/N: NM22V, spiegelnd: nein, 60 Hz
Mainboard
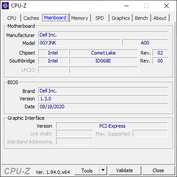
Intel WM490 (Comet Lake PCH-H)
Massenspeicher
Toshiba Kioxia XG6 KXG60PNV512G, 512 GB 
Soundkarte
Intel Comet Lake PCH-H - cAVS
Anschlüsse
4 USB 3.0 / 3.1 Gen1, 1 USB 3.1 Gen2, 1 USB 3.2 Gen 2x2 20Gbps, 1 Thunderbolt, USB-C Power Delivery (PD), 1 HDMI, 1 DisplayPort, 1 Kensington Lock, Audio Anschlüsse: 3.5 mm combo, Card Reader: MicroSD, 1 Fingerprint Reader
Netzwerk
Intel Ethernet Connection I219-LM (10/100/1000MBit/s), Intel Wi-Fi 6 AX201 (a/b/g/h/n = Wi-Fi 4/ac = Wi-Fi 5/ax = Wi-Fi 6/), Bluetooth 5.1
Abmessungen
Höhe x Breite x Tiefe (in mm): 24.92 x 359.1 x 236.3
Akku
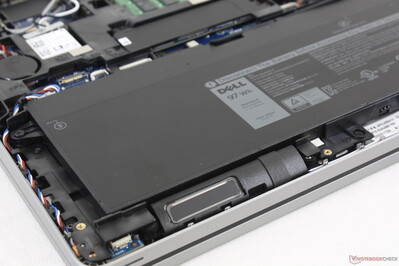
97 Wh Lithium-Polymer
Betriebssystem
Microsoft Windows 10 Pro 64 Bit
Kamera
Webcam: 720p
Primary Camera: 0.9 MPix
Sonstiges
Lautsprecher: 2 W stereo, Tastatur: Chiclet, Tastatur-Beleuchtung: ja, Dell Command, Power Manager, Optimizer, Digital Delivery, PointStick Assistant, 12 Monate Garantie
Gewicht
2.2 kg, Netzteil: 430 g
Preis
2100 USD
Hinweis: Der Hersteller kann abweichende Bauteile wie Bildschirme, Laufwerke und Speicherriegel mit ähnlichen Spezifikationen unter dem gleichen Modellnamen einsetzen.


Bew.
Datum
Modell
Gewicht
Dicke
Größe
Auflösung
Preis ab
81.2 %
10.2020
Dell Precision 3000 3551
i9-10885H, Quadro P620
2.2 kg24.92 mm15.60"1920x1080
82.7 %
10.2020
HP ZBook Firefly 15 G7
i7-10610U, Quadro P520
1.8 kg19.2 mm15.60"3840x2160
86.3 %
08.2020
Dell Precision 5550 P91F
i7-10875H, Quadro T2000 Max-Q
2 kg18 mm15.60"3840x2400
81.2 %
11.2019
Lenovo ThinkPad P53s-20N6001NGE
i7-8565U, Quadro P520
1.9 kg19.95 mm15.60"1920x1080
76 %
MSI WP65
i7-9750H, Quadro P620
1.9 kg21.7 mm15.60"1920x1080
84.3 %
08.2018
Dell Precision 3530
E-2176M, Quadro P600
2.3 kg24.3 mm15.60"1920x1080

Gehäuse

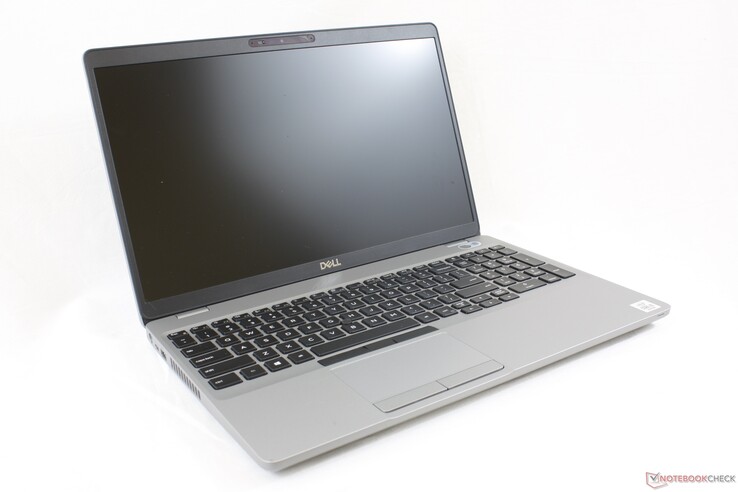
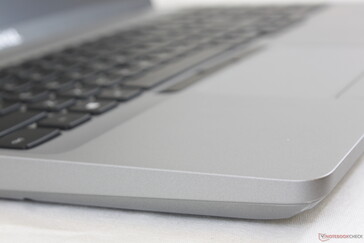
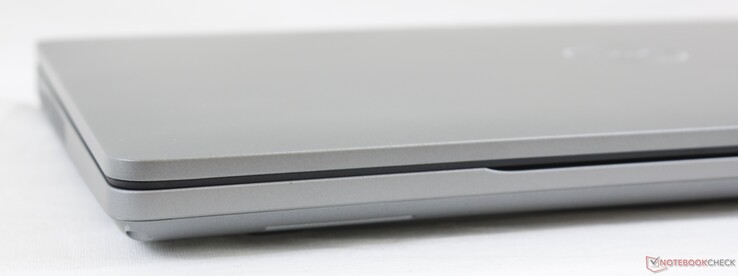
Das Gehäuse ist nach heutigen Standards, wo scharfe und schlanke Designs üblich sind, rund. Kanten und Ecken sind abgerundet, um trotz der schmalen seitlichen Einfassungen und der Größenreduzierung im Vergleich zur älteren Precision 3530 ein Old-School-Aussehen und -Gefühl zu vermitteln. Dies alles ist natürlich beabsichtigt, da Benutzer die preiswertere Precision-5000- oder -7000-Serie in Betracht ziehen müssen, wenn sie optisch ansprechendere Arbeitsplätze wünschen.

Keine ausgefallene Kohlefaser hier. Nichtsdestotrotz erfüllt das Chassis nach wie vor die MIL-STD 810G-Normen
Leicht gehärtete matte Oberflächen beeinträchtigen Fingerabdrücke gut
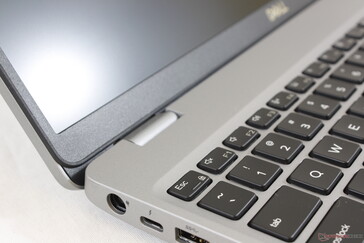
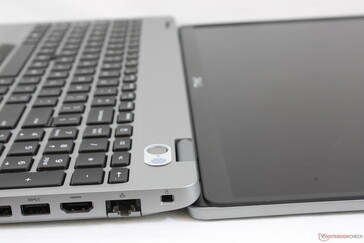
Die Scharniersteifigkeit ist in Ordnung, aber bei flacheren Winkeln ist sie nicht so steif
Deckel um volle 180 Grad geöffnet
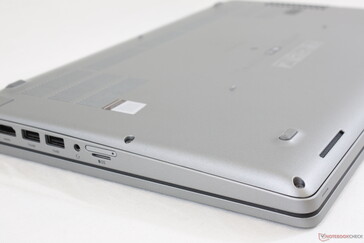
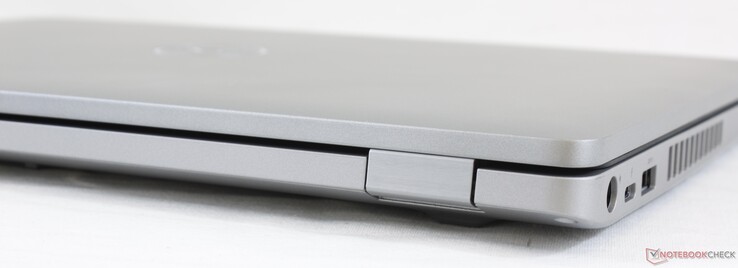
Abgerundete Kanten und Ecken
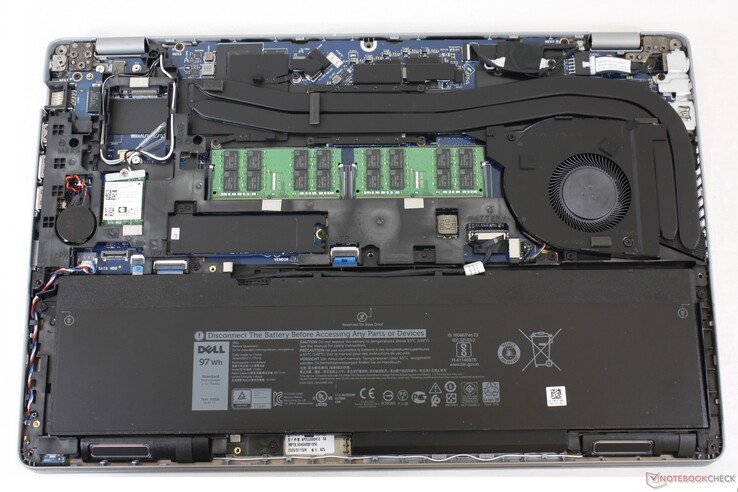
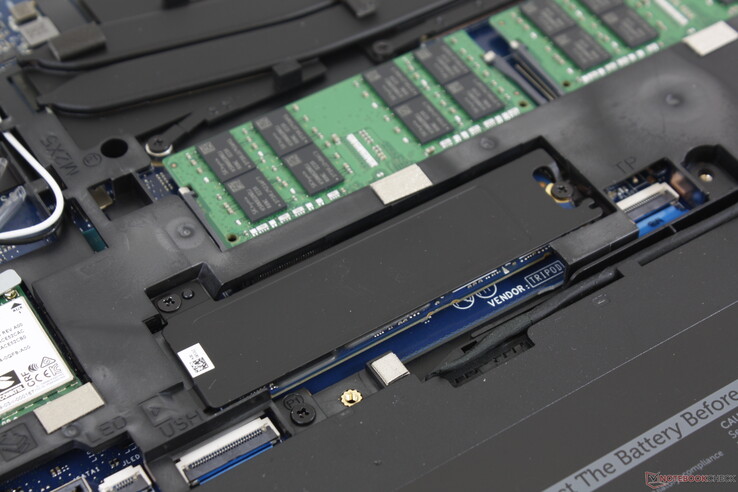
Zum Entfernen der Bodenplatte ist nur ein Kreuzschlitzschraubendreher erforderlich
376 mm 251 mm 24.3 mm 2.3 kg365.8 mm 248 mm 19.95 mm 1.9 kg359.1 mm 236.3 mm 24.92 mm 2.2 kg359 mm 254 mm 21.7 mm 1.9 kg359.5 mm 233.6 mm 19.2 mm 1.8 kg344.72 mm 230.14 mm 18 mm 2 kg297 mm 210 mm 1 mm 5.7 g

Konnektivität

Vorderseite: Keine Konnektivität
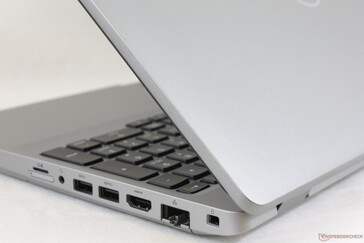
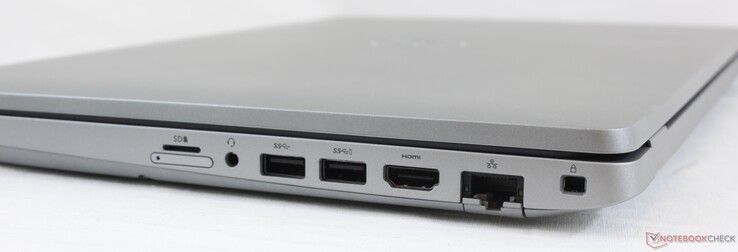
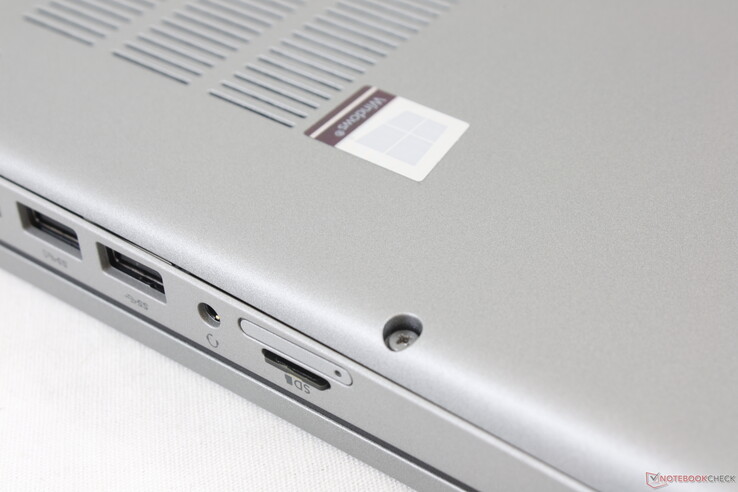
Richtig: MicroSD-Lesegerät, SIM-Steckplatz, 3,5-mm-Audio, 2x USB 3.2 Gen. 1, HDMI, Gigabit RJ-45, Edles Schloss
Hinten: Keine Konnektivität
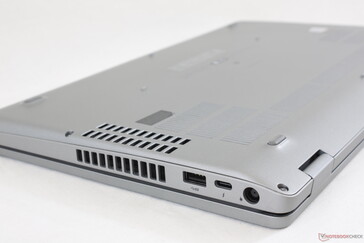
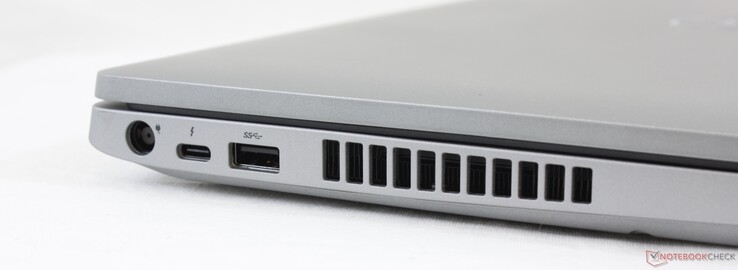
Links: Netzteil, USB-C mit Thunderbolt 3, USB-A 3.2 Gen. 1, Chipkartenleser (optional)

SD-Karten-Lesegerät

Gefedertes MicroSD-Lesegerät arbeitet genauso schnell wie die letzte Generation des Precision 3530
SD Card Reader
average JPG Copy Test (av. of 3 runs)
Dell Precision 5550 P91F
  (Toshiba Exceria Pro SDXC 64 GB UHS-II)
193.1 MB/s +25%
Dell Precision 3530
  (Toshiba Exceria Pro SDXC 64 GB UHS-II)
179 MB/s +16%
Dell Precision 3000 3551
  (Toshiba Exceria Pro M501 64 GB UHS-II)
153.9 MB/s
Lenovo ThinkPad P53s-20N6001NGE
  (Toshiba Exceria Pro M501 64 GB UHS-II)
78.2 MB/s -49%
maximum AS SSD Seq Read Test (1GB)
Dell Precision 3530
  (Toshiba Exceria Pro SDXC 64 GB UHS-II)
201 MB/s +7%
Dell Precision 5550 P91F
  (Toshiba Exceria Pro SDXC 64 GB UHS-II)
196.7 MB/s +4%
Dell Precision 3000 3551
  (Toshiba Exceria Pro M501 64 GB UHS-II)
188.7 MB/s
Lenovo ThinkPad P53s-20N6001NGE
  (Toshiba Exceria Pro M501 64 GB UHS-II)
84.4 MB/s -55%

Kommunikation

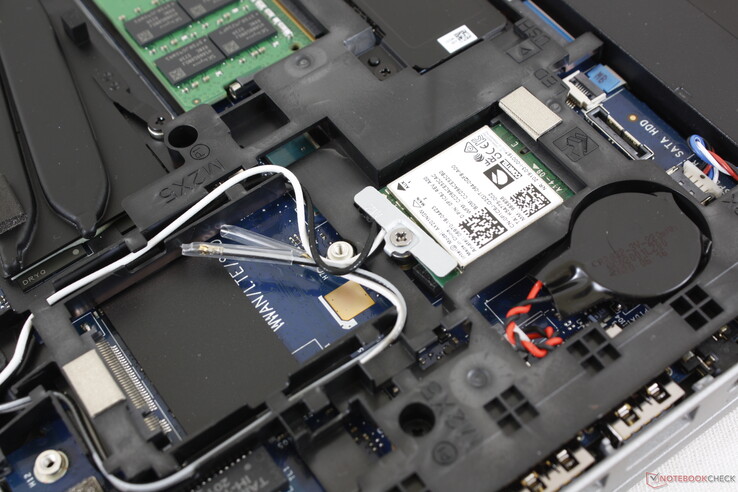
Bei der Verbindung mit unserem Test-Router Netgear RAX200 haben wir keine Probleme festgestellt. WWAN-Antennen sind im Lieferumfang enthalten, auch wenn sie nicht mit WWAN konfiguriert sind
Networking
iperf3 transmit AX12
MSI WS66 10TMT-207US
Intel Wi-Fi 6 AX201
1476 (1355min - 1581max) MBit/s +26%
Dell Precision 3000 3551
Intel Wi-Fi 6 AX201
1167 (1092min - 1233max) MBit/s
HP ZBook Firefly 15 G7
Intel Wi-Fi 6 AX201
1016 (596min - 1247max) MBit/s -13%
Dell Precision 7550
Intel Wi-Fi 6 AX201
1011 (507min - 1065max) MBit/s -13%
Dell Precision 5000 5750 P92F
Intel Wi-Fi 6 AX201
941 (763min - 1176max) MBit/s -19%
iperf3 receive AX12
Dell Precision 3000 3551
Intel Wi-Fi 6 AX201
1407 (1295min - 1454max) MBit/s
Dell Precision 7550
Intel Wi-Fi 6 AX201
1316 (579min - 1479max) MBit/s -6%
Dell Precision 5000 5750 P92F
Intel Wi-Fi 6 AX201
1286 (1229min - 1366max) MBit/s -9%
HP ZBook Firefly 15 G7
Intel Wi-Fi 6 AX201
1137 (568min - 1726max) MBit/s -19%
MSI WS66 10TMT-207US
Intel Wi-Fi 6 AX201
899 (873min - 913max) MBit/s -36%
0501001502002503003504004505005506006507007508008509009501000105011001150120012501300135014001450Tooltip
Dell Precision 3000 3551; iperf3 receive AX12; iperf 3.1.3: Ø1407 (1295-1454)
Dell Precision 3000 3551; iperf3 transmit AX12; iperf 3.1.3: Ø1167 (1092-1233)

Webcam

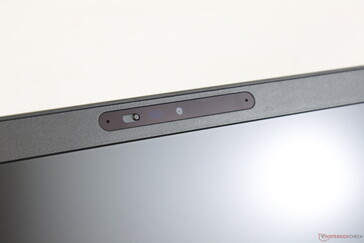
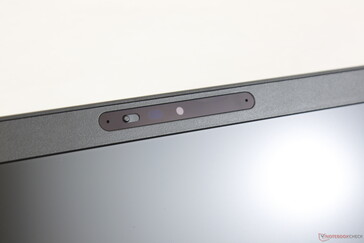
Webcam-Verschluss an
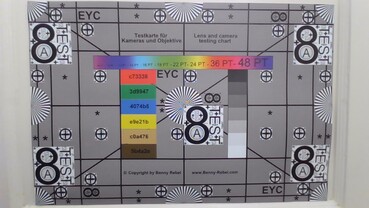
Webcam-Ausblendung aus. Integrierte IR-Kamera ist im Lieferumfang enthalten, jedoch ohne Dell ExpressSign-In
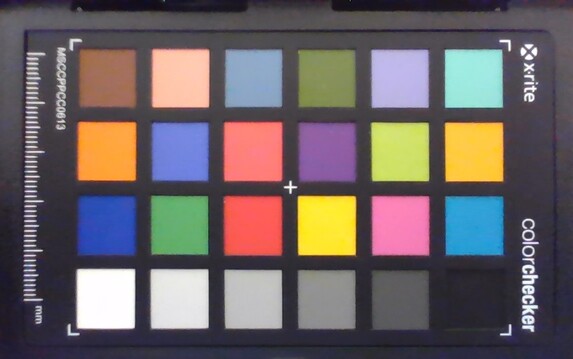
ColorChecker
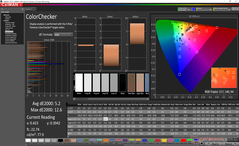
14.1 ∆E
14 ∆E
15.2 ∆E
16 ∆E
17 ∆E
12.6 ∆E
11.8 ∆E
17.2 ∆E
15.9 ∆E
15.4 ∆E
10.1 ∆E
10.9 ∆E
7.2 ∆E
9.9 ∆E
20.5 ∆E
8.1 ∆E
16.4 ∆E
12.7 ∆E
2.9 ∆E
7.1 ∆E
9.1 ∆E
8.5 ∆E
3.5 ∆E
8.2 ∆E
ColorChecker Dell Precision 3000 3551: 11.84 ∆E min: 2.9 - max: 20.47 ∆E

Wartung

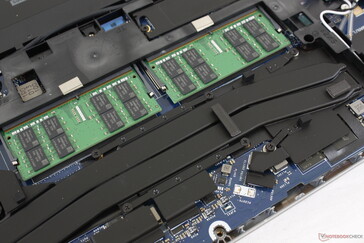
Die SODIMM-Steckplätze, M.2 SSD-, WLAN- und WWAN-Module sind alle herausnehmbar

Zubehör und Garantie

Außer dem Netzteil und dem Papierkram befindet sich kein weiteres Zubehör in der Schachtel. Benutzer haben die Wahl zwischen einem USB-C- oder dem Fassladegerät, wenn sie direkt bei Dell gekauft haben.

Die beschränkte Standardgarantie beträgt nur ein Jahr im Gegensatz zu drei Jahren für die Precision-7000-Serie. Dies ist definitiv eine kostensparende Maßnahme, da sich die Precision-3000-Serie an preisbewusste Benutzer richtet.

Eingabegeräte

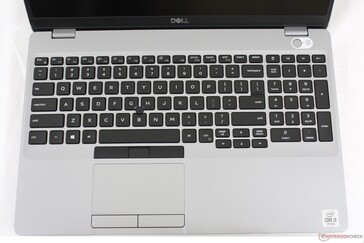
Sie wissen, dass es sich um eine herkömmliche mobile Arbeitsstation handelt, wenn der TrackPoint und die oberen Maustasten vorhanden sind
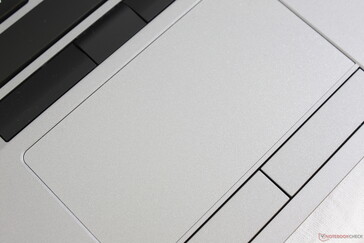
Kleines (10 x 5,3 cm) Clickpad. Die umgebenden fünf Maustasten sind leise und einfach zu bedienen
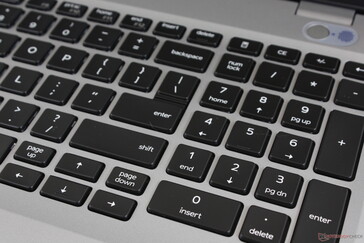
Die Tastenkappen sind klein und die Leertaste ist laut, aber die Rückmeldung ist fest und angenehm beim Tippen
NumPad in voller Größe. Die Pfeiltasten und die PgUp/PgDn-Tasten fühlen sich jedoch beengt an

Anzeigen

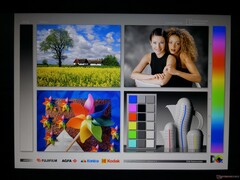
Dell verwendet das gleiche IPS-Panel 156WFD 1080p von LG Philips für das Precision 3551 und das Latitude 5500. Obwohl der Kontrast mit fast 1000:1 gut ist, sind andere Eigenschaften wie Helligkeit, Reaktionszeiten und Farben bestenfalls durchschnittlich, um ein preisgünstiges Display darzustellen. Dies ist definitiv nicht die Paneloption, die Sie wünschen, wenn die Farbgenauigkeit entscheidend ist. Glücklicherweise kann das System auf Wunsch mit höherwertigen Anzeigeoptionen konfiguriert werden, die eine vollständige sRGB-Abdeckung versprechen.

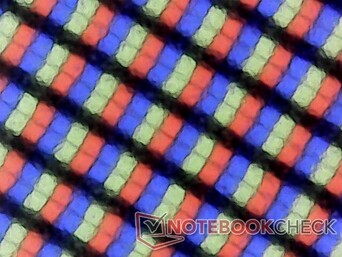
matte Subpixelanordnung ist leicht körnig. Das Display ist ebenfalls ein Touchscreen, auch wenn es nicht glänzend ist
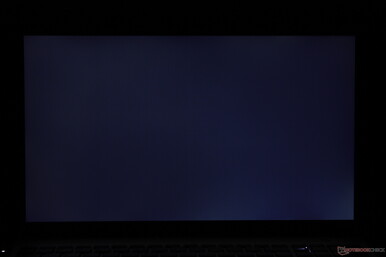
leichtes gleichmäßiges Ausbluten der Hintergrundbeleuchtung entlang der Unterkante
241.4
cd/m²
232.9
cd/m²
223.4
cd/m²
235.5
cd/m²
235.5
cd/m²
220.2
cd/m²
230.2
cd/m²
219.9
cd/m²
215.4
cd/m²
Ausleuchtung des Bildschirms
LG Philips 156WFD getestet mit X-Rite i1Pro 2
Maximal: 241.4 cd/m² (Nits) Durchschnitt: 228.3 cd/m² Minimum: 12.39 cd/m²
Ausleuchtung: 89 %
Helligkeit Akku: 235.5 cd/m²
Kontrast: 942:1 (Schwarzwert: 0.25 cd/m²)
ΔE Color 5.44 | 0.5-29.43 Ø4.94, calibrated: 5.2
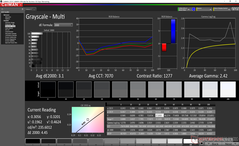
ΔE Greyscale 3.1 | 0.5-98 Ø5.2
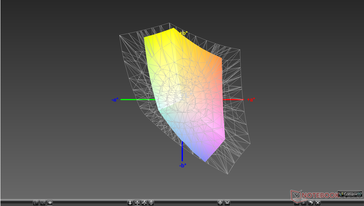
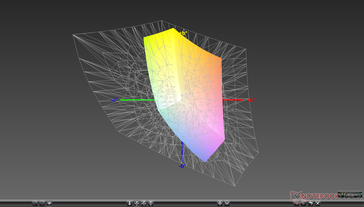
56.1% sRGB (Argyll 1.6.3 3D)
35.5% AdobeRGB 1998 (Argyll 1.6.3 3D)
38.74% AdobeRGB 1998 (Argyll 2.2.0 3D)
56.5% sRGB (Argyll 2.2.0 3D)
37.5% Display P3 (Argyll 2.2.0 3D)
Gamma: 2.42
Dell Precision 3000 3551
LG Philips 156WFD, IPS, 15.6", 1920x1080
HP ZBook Firefly 15 G7
LGD064F, IPS LED, 15.6", 3840x2160
Dell Precision 5550 P91F
Sharp LQ156R1, IPS, 15.6", 3840x2400
Lenovo ThinkPad P53s-20N6001NGE
Lenovo LEN40BA, IPS, 15.6", 1920x1080
MSI WP65
AU Optronics B156HAN02.1, IPS, 15.6", 1920x1080
Dell Precision 3530
BOE BOE06F1, IPS, 15.6", 1920x1080
Display
79%
125%
5%
5%
80%
Display P3 Coverage
37.5
68.8
83%
89.9
140%
39.58
6%
39.46
5%
72.8
94%
sRGB Coverage
56.5
97.7
73%
100
77%
57.6
2%
58.8
4%
94.6
67%
AdobeRGB 1998 Coverage
38.74
69.8
80%
99.9
158%
40.89
6%
40.69
5%
69.3
79%
Response Times
-33%
-42%
-50%
-16%
-34%
Response Time Grey 50% / Grey 80% *
29.6 ?(16.4, 13.2)
44 ?(21.2, 22.8)
-49%
46 ?(24, 22)
-55%
51.2 ?(24.4, 26.8)
-73%
37.6 ?(20.4, 17.2)
-27%
40.4 ?(22, 18.4)
-36%
Response Time Black / White *
26.4 ?(14, 12.4)
30.8 ?(16.4, 14.4)
-17%
34 ?(17.6, 16.4)
-29%
33.6 ?(18, 15.6)
-27%
27.6 ?(15.2, 12.4)
-5%
34.8 ?(20.8, 14)
-32%
PWM Frequency
1053 ?(98)
Bildschirm
51%
33%
4%
-2%
10%
Helligkeit Bildmitte
235.5
381
62%
469.8
99%
260
10%
267.4
14%
285.7
21%
Brightness
228
382
68%
464
104%
243
7%
259
14%
275
21%
Brightness Distribution
89
92
3%
85
-4%
88
-1%
86
-3%
85
-4%
Schwarzwert *
0.25
0.21
16%
0.42
-68%
0.18
28%
0.37
-48%
0.31
-24%
Kontrast
942
1814
93%
1119
19%
1444
53%
723
-23%
922
-2%
Delta E Colorchecker *
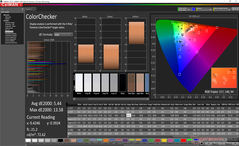
5.44
3
45%
5.16
5%
6
-10%
4.21
23%
5.84
-7%
Colorchecker dE 2000 max. *
13.58
5.2
62%
9.33
31%
19.2
-41%
21.1
-55%
8.76
35%
Colorchecker dE 2000 calibrated *
5.2
1.5
71%
3.75
28%
4.3
17%
4.27
18%
3.14
40%
Delta E Graustufen *
3.1
3.5
-13%
5.5
-77%
4.2
-35%
2.3
26%
6.5
-110%
Gamma
2.42 91%
2.26 97%
2 110%
2.49 88%
2.2 100%
2.383 92%
CCT
7070 92%
7254 90%
6198 105%
6865 95%
6578 99%
7176 91%
Farbraum (Prozent von AdobeRGB 1998)
35.5
64.3
81%
89.2
151%
37.6
6%
37.2
5%
62
75%
Color Space (Percent of sRGB)
56.1
97.5
74%
100
78%
59.2
6%
58.5
4%
94
68%
Durchschnitt gesamt (Programm / Settings)
32% / 46%
39% / 41%
-14% / -3%
-4% / -3%
19% / 18%

* ... kleinere Werte sind besser

gegen sRGB
gegen sRGB
gegenüber AdobeRGB
gegenüber AdobeRGB

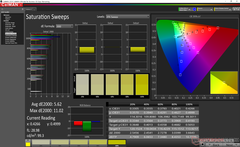
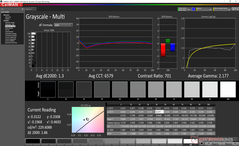
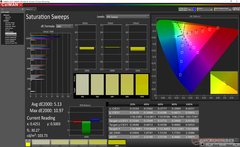
Die Anzeige ist dezent kalibriert, wobei die Farbtemperatur auf die kühle Seite tendiert. Unsere Kalibrierung behebt dies, aber die Farben bleiben aufgrund des oben erwähnten begrenzten Farbraums bestenfalls durchschnittlich.

Graustufen vor der Kalibrierung
Sättigungs-Sweeps vor der Kalibrierung
ColorChecker vor der Kalibrierung
Graustufen nach der Kalibrierung
Sättigungs-Sweeps nach der Kalibrierung
ColorChecker nach der Kalibrierung

Reaktionszeiten (Response Times) des Displays

Die Reaktionszeiten (Response Times) beschreiben wie schnell zwischen zwei Farben eines Pixels umgeschaltet werden kann. Langsame Response Times können zu einer verschwommenen Darstellung, Schlieren und Geisterbilder führen. Besonders bei schnellen 3D-Spielen sind kurze Umschaltzeiten wichtig.
       Reaktionszeiten Schwarz zu Weiß
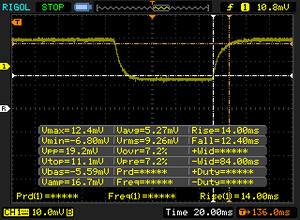
26.4 ms ... steigend ↗ und fallend ↘ kombiniert↗ 14 ms steigend
↘ 12.4 ms fallend
Die gemessenen Reaktionszeiten sind mittelmäßig und dadurch für Spieler eventuell zu langsam.
Im Vergleich rangierten die bei uns getesteten Geräte von 0.1 (Minimum) zu 240 (Maximum) ms. » 62 % aller Screens waren schneller als der getestete.
Daher sind die gemessenen Reaktionszeiten schlechter als der Durchschnitt aller vermessenen Geräte (21.1 ms).
       Reaktionszeiten 50% Grau zu 80% Grau
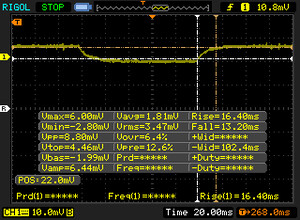
29.6 ms ... steigend ↗ und fallend ↘ kombiniert↗ 16.4 ms steigend
↘ 13.2 ms fallend
Die gemessenen Reaktionszeiten sind mittelmäßig und dadurch für Spieler eventuell zu langsam.
Im Vergleich rangierten die bei uns getesteten Geräte von 0.165 (Minimum) zu 636 (Maximum) ms. » 35 % aller Screens waren schneller als der getestete.
Daher sind die gemessenen Reaktionszeiten besser als der Durchschnitt aller vermessenen Geräte (33.1 ms).

Bildschirm-Flackern / PWM (Pulse-Width Modulation)

Eine günstige Methode um die Helligkeit eines Bildschirms zu steuern, ist die Beleuchtung periodisch ein- und auszuschalten. Dies nennt sich PWM (Pulsweitenmodulation) Diese Umschaltung sollte mit einer hohen Frequenz stattfinden damit das menschliche Auge kein Flimmern wahrnimmt. Wenn die Frequenz zu niedrig ist, kann dies zu Ermüdungserscheinungen, Augenbrennen, Kopfweh und auch sichtbaren Flackern führen.
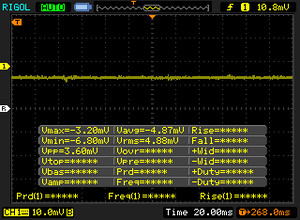
Flackern / PWM nicht festgestellt

Im Vergleich: 53 % aller getesteten Geräte nutzten kein PWM um die Helligkeit zu reduzieren. Wenn PWM eingesetzt wurde, dann bei einer Frequenz von durchschnittlich 17204 (Minimum 5, Maximum 3846000) Hz.

Draußen an einem bewölkten Tag
Draußen im Schatten
Draußen im Schatten
Draußen an einem bewölkten Tag
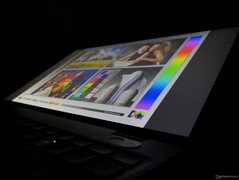
Breite IPS-Betrachtungswinkel. Farben und Kontrast verschieben sich bei Betrachtung aus extremen Winkeln

Leistung


Bearbeiter

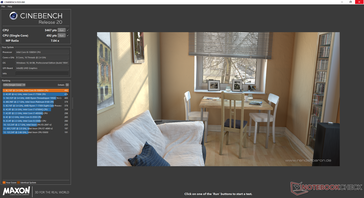
Laut CineBench-Benchmarks ist die CPU-Leistung in der Precision 5550 um fast 20 Prozent langsamer als der nicht-vPro-fähige Core i7-10875H. Dennoch ist die Rohleistung fast 1,5x schneller als die des Precision 3550, wenn er mit dem Core i7-10510U konfiguriert wäre.

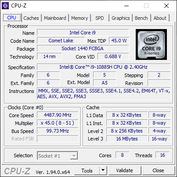
Weitere technische Informationen und Benchmarks finden Sie auf unserer speziellen Seite über den Core i9-10885H. Unser Gerät wurde vor der Ausführung dieser Benchmarks über die Dell-Power-Manager-Software auf den Ultra-Performance-Modus eingestellt.

CineBench R10 32-Bit
CineBench R11.5 64-Bit
CineBench R15
CineBench R15
CineBench R20
CineBench R20
09018027036045054063072081090099010801170126013501440153016201710Tooltip
Dell Precision 3000 3551 Quadro P620, i9-10885H, Toshiba Kioxia XG6 KXG60PNV512G; CPU Multi 64Bit: Ø1152 (1113.77-1263.86)
Dell Precision 5000 5750 P92F Quadro RTX 3000 Max-Q, W-10885M, Toshiba Kioxia XG6 KXG60PNV1T02; CPU Multi 64Bit: Ø1646 (1622.65-1794.37)
Dell Precision 7550 Quadro RTX 5000 Max-Q, W-10885M, SK Hynix PC601A NVMe 1TB; CPU Multi 64Bit: Ø1606 (1577.91-1652.14)
Dell Precision 5550 P91F Quadro T2000 Max-Q, i7-10875H, SK Hynix PC601A NVMe 1TB; CPU Multi 64Bit: Ø1295 (1188.78-1518.72)
Cinebench R20: CPU (Multi Core) | CPU (Single Core)
Cinebench R15: CPU Multi 64Bit | CPU Single 64Bit
Blender: v2.79 BMW27 CPU
7-Zip 18.03: 7z b 4 -mmt1 | 7z b 4
Geekbench 5.5: Single-Core | Multi-Core
HWBOT x265 Benchmark v2.2: 4k Preset
LibreOffice : 20 Documents To PDF
R Benchmark 2.5: Overall mean
Cinebench R20 / CPU (Multi Core)
MSI WS66 10TMT-207US
Intel Core i9-10980HK
4161 Points +49%
Dell Precision 7550
Intel Xeon W-10885M
3930 Points +40%
Dell Precision 5550 P91F
Intel Core i7-10875H
3429 Points +23%
Durchschnittliche Intel Core i9-10885H
  (2798 - 3762, n=3)
3400 Points +22%
Dell Precision 3000 3551
Intel Core i9-10885H
2798 Points
Acer ConceptD 3 Pro CN315-71P-73W1
Intel Core i7-9750H
2161 Points -23%
Lenovo ThinkPad P1 2019-20QT000RGE
Intel Core i7-9850H
1800 Points -36%
HP ZBook Firefly 15 G7
Intel Core i7-10610U
1624 Points -42%
Acer TravelMate P215-52
Intel Core i7-10510U
1175 Points -58%
Cinebench R20 / CPU (Single Core)
MSI WS66 10TMT-207US
Intel Core i9-10980HK
500 Points +9%
Dell Precision 5550 P91F
Intel Core i7-10875H
492 Points +7%
Dell Precision 7550
Intel Xeon W-10885M
488 Points +6%
Durchschnittliche Intel Core i9-10885H
  (460 - 513, n=3)
487 Points +6%
HP ZBook Firefly 15 G7
Intel Core i7-10610U
469 Points +2%
Dell Precision 3000 3551
Intel Core i9-10885H
460 Points
Acer ConceptD 3 Pro CN315-71P-73W1
Intel Core i7-9750H
440 Points -4%
Lenovo ThinkPad P1 2019-20QT000RGE
Intel Core i7-9850H
425 Points -8%
Acer TravelMate P215-52
Intel Core i7-10510U
382 Points -17%
Cinebench R15 / CPU Multi 64Bit
MSI WS66 10TMT-207US
Intel Core i9-10980HK
1714 (1647.11min - 1843.74max) Points +36%
Dell Precision 7550
Intel Xeon W-10885M
1652 (1577.91min - 1652.14max) Points +31%
Dell Precision 5550 P91F
Intel Core i7-10875H
1519 (1188.78min - 1518.72max) Points +20%
Durchschnittliche Intel Core i9-10885H
  (1264 - 1726, n=3)
1502 Points +19%
Dell Precision 5540
Intel Core i9-9980HK
1407 (1126.13min - 1407max) Points +11%
Dell Precision 3000 3551
Intel Core i9-10885H
1264 (1113.77min - 1263.86max) Points
Lenovo ThinkPad P53-20QN000YGE
Intel Core i7-9850H
1230 (1097.03min - 1230.35max) Points -3%
Fujitsu Celsius H780
Intel Core i7-8850H
1116 Points -12%
Lenovo ThinkPad P1 2019-20QT000RGE
Intel Core i7-9850H
1114 (896min - 1114max) Points -12%
Acer ConceptD 3 Pro CN315-71P-73W1
Intel Core i7-9750H
1014 Points -20%
Lenovo ThinkPad P53s-20N6001NGE
Intel Core i7-8565U
686 (568.11min - 688.08max) Points -46%
HP ZBook Firefly 15 G7
Intel Core i7-10610U
675 (629.17min - 674.89max) Points -47%
Acer TravelMate P215-52
Intel Core i7-10510U
517 (448.91min - 517.29max) Points -59%
Cinebench R15 / CPU Single 64Bit
MSI WS66 10TMT-207US
Intel Core i9-10980HK
210 Points +7%
Dell Precision 7550
Intel Xeon W-10885M
208 Points +6%
Durchschnittliche Intel Core i9-10885H
  (197 - 212, n=3)
207 Points +5%
Dell Precision 5550 P91F
Intel Core i7-10875H
203 Points +3%
Dell Precision 3000 3551
Intel Core i9-10885H
197 Points
Lenovo ThinkPad P53-20QN000YGE
Intel Core i7-9850H
196.5 Points 0%
Lenovo ThinkPad P1 2019-20QT000RGE
Intel Core i7-9850H
193 Points -2%
Dell Precision 5540
Intel Core i9-9980HK
193 Points -2%
HP ZBook Firefly 15 G7
Intel Core i7-10610U
191 Points -3%
Acer ConceptD 3 Pro CN315-71P-73W1
Intel Core i7-9750H
186 Points -6%
Fujitsu Celsius H780
Intel Core i7-8850H
185 Points -6%
Lenovo ThinkPad P53s-20N6001NGE
Intel Core i7-8565U
178 Points -10%
Acer TravelMate P215-52
Intel Core i7-10510U
167 Points -15%
Blender / v2.79 BMW27 CPU
Acer TravelMate P215-52
Intel Core i7-10510U
879 Seconds * -153%
Lenovo ThinkPad P53s-20N6001NGE
Intel Core i7-8565U
699 Seconds * -101%
HP ZBook Firefly 15 G7
Intel Core i7-10610U
674 Seconds * -94%
Lenovo ThinkPad P1 2019-20QT000RGE
Intel Core i7-9850H
552 Seconds * -59%
Acer ConceptD 3 Pro CN315-71P-73W1
Intel Core i7-9750H
494.9 Seconds * -42%
Fujitsu Celsius H780
Intel Core i7-8850H
494.1 Seconds * -42%
Lenovo ThinkPad P53-20QN000YGE
Intel Core i7-9850H
415 Seconds * -19%
Dell Precision 5550 P91F
Intel Core i7-10875H
351 Seconds * -1%
Dell Precision 5540
Intel Core i9-9980HK
348.4 Seconds * -0%
Dell Precision 3000 3551
Intel Core i9-10885H
348 Seconds *
Durchschnittliche Intel Core i9-10885H
  (283 - 348, n=3)
311 Seconds * +11%
Dell Precision 7550
Intel Xeon W-10885M
281 Seconds * +19%
MSI WS66 10TMT-207US
Intel Core i9-10980HK
273 Seconds * +22%
7-Zip 18.03 / 7z b 4 -mmt1
Durchschnittliche Intel Core i9-10885H
  (5397 - 5668, n=3)
5551 MIPS +3%
Dell Precision 7550
Intel Xeon W-10885M
5495 MIPS +2%
Dell Precision 3000 3551
Intel Core i9-10885H
5397 MIPS
Dell Precision 5550 P91F
Intel Core i7-10875H
5379 MIPS 0%
MSI WS66 10TMT-207US
Intel Core i9-10980HK
5335 MIPS -1%
Dell Precision 5540
Intel Core i9-9980HK
5283 MIPS -2%
Lenovo ThinkPad P53-20QN000YGE
Intel Core i7-9850H
5092 MIPS -6%
Lenovo ThinkPad P1 2019-20QT000RGE
Intel Core i7-9850H
5086 MIPS -6%
Lenovo ThinkPad P53s-20N6001NGE
Intel Core i7-8565U
4815 MIPS -11%
HP ZBook Firefly 15 G7
Intel Core i7-10610U
4783 MIPS -11%
Acer ConceptD 3 Pro CN315-71P-73W1
Intel Core i7-9750H
4610 MIPS -15%
Fujitsu Celsius H780
Intel Core i7-8850H
4558 MIPS -16%
Acer TravelMate P215-52
Intel Core i7-10510U
4409 MIPS -18%
7-Zip 18.03 / 7z b 4
MSI WS66 10TMT-207US
Intel Core i9-10980HK
48730 MIPS +33%
Dell Precision 7550
Intel Xeon W-10885M
48044 MIPS +31%
Durchschnittliche Intel Core i9-10885H
  (36740 - 42993, n=3)
40519 MIPS +10%
Dell Precision 5550 P91F
Intel Core i7-10875H
39599 MIPS +8%
Dell Precision 5540
Intel Core i9-9980HK
39566 MIPS +8%
Dell Precision 3000 3551
Intel Core i9-10885H
36740 MIPS
Lenovo ThinkPad P53-20QN000YGE
Intel Core i7-9850H
32268 MIPS -12%
Fujitsu Celsius H780
Intel Core i7-8850H
30761 MIPS -16%
Acer ConceptD 3 Pro CN315-71P-73W1
Intel Core i7-9750H
28987 MIPS -21%
Lenovo ThinkPad P1 2019-20QT000RGE
Intel Core i7-9850H
25786 MIPS -30%
HP ZBook Firefly 15 G7
Intel Core i7-10610U
20096 MIPS -45%
Lenovo ThinkPad P53s-20N6001NGE
Intel Core i7-8565U
18860 MIPS -49%
Acer TravelMate P215-52
Intel Core i7-10510U
16371 MIPS -55%
Geekbench 5.5 / Single-Core
MSI WS66 10TMT-207US
Intel Core i9-10980HK
1341 Points +10%
Dell Precision 7550
Intel Xeon W-10885M
1331 Points +9%
Dell Precision 5550 P91F
Intel Core i7-10875H
1323 Points +9%
Durchschnittliche Intel Core i9-10885H
  (1216 - 1376, n=3)
1303 Points +7%
HP ZBook Firefly 15 G7
Intel Core i7-10610U
1261 Points +4%
Dell Precision 3000 3551
Intel Core i9-10885H
1216 Points
Acer ConceptD 3 Pro CN315-71P-73W1
Intel Core i7-9750H
1184 Points -3%
Acer TravelMate P215-52
Intel Core i7-10510U
1102 Points -9%
Geekbench 5.5 / Multi-Core
Dell Precision 5550 P91F
Intel Core i7-10875H
8393 Points +21%
Dell Precision 7550
Intel Xeon W-10885M
8378 Points +21%
MSI WS66 10TMT-207US
Intel Core i9-10980HK
8347 Points +21%
Durchschnittliche Intel Core i9-10885H
  (6529 - 7693, n=3)
7045 Points +2%
Dell Precision 3000 3551
Intel Core i9-10885H
6914 Points
Acer ConceptD 3 Pro CN315-71P-73W1
Intel Core i7-9750H
5050 Points -27%
HP ZBook Firefly 15 G7
Intel Core i7-10610U
4622 Points -33%
Acer TravelMate P215-52
Intel Core i7-10510U
2474 Points -64%
HWBOT x265 Benchmark v2.2 / 4k Preset
Dell Precision 7550
Intel Xeon W-10885M
13.1 fps +24%
MSI WS66 10TMT-207US
Intel Core i9-10980HK
13 fps +23%
Durchschnittliche Intel Core i9-10885H
  (10.6 - 12.5, n=3)
11.5 fps +8%
Dell Precision 5540
Intel Core i9-9980HK
10.8 fps +2%
Dell Precision 3000 3551
Intel Core i9-10885H
10.6 fps
Dell Precision 5550 P91F
Intel Core i7-10875H
10.4 fps -2%
Lenovo ThinkPad P53-20QN000YGE
Intel Core i7-9850H
9 fps -15%
Fujitsu Celsius H780
Intel Core i7-8850H
7.61 fps -28%
Acer ConceptD 3 Pro CN315-71P-73W1
Intel Core i7-9750H
7.54 fps -29%
Lenovo ThinkPad P1 2019-20QT000RGE
Intel Core i7-9850H
7 fps -34%
HP ZBook Firefly 15 G7
Intel Core i7-10610U
5.66 fps -47%
Lenovo ThinkPad P53s-20N6001NGE
Intel Core i7-8565U
5.4 fps -49%
Acer TravelMate P215-52
Intel Core i7-10510U
4.23 fps -60%
LibreOffice / 20 Documents To PDF
HP ZBook Firefly 15 G7
Intel Core i7-10610U
60.2 s * -31%
Acer ConceptD 3 Pro CN315-71P-73W1
Intel Core i7-9750H
55.7 s * -21%
Acer TravelMate P215-52
Intel Core i7-10510U
53.7 s * -17%
Durchschnittliche Intel Core i9-10885H
  (45.9 - 59.6, n=3)
53.4 s * -16%
Dell Precision 7550
Intel Xeon W-10885M
46.5 s * -1%
Dell Precision 3000 3551
Intel Core i9-10885H
45.9 s *
MSI WS66 10TMT-207US
Intel Core i9-10980HK
44 s * +4%
Dell Precision 5550 P91F
Intel Core i7-10875H
43 s * +6%
R Benchmark 2.5 / Overall mean
Acer TravelMate P215-52
Intel Core i7-10510U
0.716 sec * -25%
Acer ConceptD 3 Pro CN315-71P-73W1
Intel Core i7-9750H
0.695 sec * -22%
HP ZBook Firefly 15 G7
Intel Core i7-10610U
0.643 sec * -12%
Dell Precision 5550 P91F
Intel Core i7-10875H
0.589 sec * -3%
MSI WS66 10TMT-207US
Intel Core i9-10980HK
0.574 sec * -0%
Dell Precision 3000 3551
Intel Core i9-10885H
0.572 sec *
Dell Precision 7550
Intel Xeon W-10885M
0.57 sec * -0%
Durchschnittliche Intel Core i9-10885H
  (0.564 - 0.572, n=3)
0.569 sec * +1%
Cinebench R20: CPU (Multi Core) | CPU (Single Core)
Cinebench R15: CPU Multi 64Bit | CPU Single 64Bit
Blender: v2.79 BMW27 CPU
7-Zip 18.03: 7z b 4 -mmt1 | 7z b 4
Geekbench 5.5: Single-Core | Multi-Core
HWBOT x265 Benchmark v2.2: 4k Preset
LibreOffice : 20 Documents To PDF
R Benchmark 2.5: Overall mean

* ... kleinere Werte sind besser

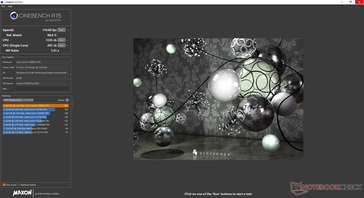
Cinebench R15 CPU Multi 64Bit
1264 Points
Cinebench R15 OpenGL 64Bit
169 fps
Cinebench R15 Ref. Match 64Bit
99.6 %
Cinebench R15 CPU Single 64Bit
197 Points
Hilfe

Systemleistung

PCMark 10
PCMark 10
PCMark 8 Home beschleunigt
PCMark 8: Beschleunigte Arbeit
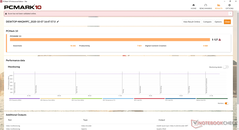
PCMark 10
Score
Dell Precision 5550 P91F
Quadro T2000 Max-Q, i7-10875H, SK Hynix PC601A NVMe 1TB
5442 Points +6%
Dell Precision 3000 3551
Quadro P620, i9-10885H, Toshiba Kioxia XG6 KXG60PNV512G
5127 Points
MSI WP65
Quadro P620, i7-9750H, Samsung SSD PM981 MZVLB512HAJQ
5025 Points -2%
Dell Precision 3530
Quadro P600, E-2176M, SK hynix PC400 512 GB
4817 Points -6%
Lenovo ThinkPad P53s-20N6001NGE
Quadro P520, i7-8565U, Intel SSD 760p SSDPEKKW256G8
4374 Points -15%
HP ZBook Firefly 15 G7
Quadro P520, i7-10610U, Toshiba XG6 KXG60ZNV1T02
4096 Points -20%
Essentials
Dell Precision 3000 3551
Quadro P620, i9-10885H, Toshiba Kioxia XG6 KXG60PNV512G
10242 Points
Dell Precision 5550 P91F
Quadro T2000 Max-Q, i7-10875H, SK Hynix PC601A NVMe 1TB
9826 Points -4%
MSI WP65
Quadro P620, i7-9750H, Samsung SSD PM981 MZVLB512HAJQ
9815 Points -4%
Dell Precision 3530
Quadro P600, E-2176M, SK hynix PC400 512 GB
9366 Points -9%
Lenovo ThinkPad P53s-20N6001NGE
Quadro P520, i7-8565U, Intel SSD 760p SSDPEKKW256G8
8612 Points -16%
HP ZBook Firefly 15 G7
Quadro P520, i7-10610U, Toshiba XG6 KXG60ZNV1T02
8414 Points -18%
Productivity
Dell Precision 3000 3551
Quadro P620, i9-10885H, Toshiba Kioxia XG6 KXG60PNV512G
7831 Points
Dell Precision 3530
Quadro P600, E-2176M, SK hynix PC400 512 GB
7798 Points 0%
Dell Precision 5550 P91F
Quadro T2000 Max-Q, i7-10875H, SK Hynix PC601A NVMe 1TB
7668 Points -2%
MSI WP65
Quadro P620, i7-9750H, Samsung SSD PM981 MZVLB512HAJQ
7587 Points -3%
Lenovo ThinkPad P53s-20N6001NGE
Quadro P520, i7-8565U, Intel SSD 760p SSDPEKKW256G8
7345 Points -6%
HP ZBook Firefly 15 G7
Quadro P520, i7-10610U, Toshiba XG6 KXG60ZNV1T02
6883 Points -12%
Digital Content Creation
Dell Precision 5550 P91F
Quadro T2000 Max-Q, i7-10875H, SK Hynix PC601A NVMe 1TB
5805 Points +27%
MSI WP65
Quadro P620, i7-9750H, Samsung SSD PM981 MZVLB512HAJQ
4624 Points +1%
Dell Precision 3000 3551
Quadro P620, i9-10885H, Toshiba Kioxia XG6 KXG60PNV512G
4560 Points
Dell Precision 3530
Quadro P600, E-2176M, SK hynix PC400 512 GB
4154 Points -9%
Lenovo ThinkPad P53s-20N6001NGE
Quadro P520, i7-8565U, Intel SSD 760p SSDPEKKW256G8
3591 Points -21%
HP ZBook Firefly 15 G7
Quadro P520, i7-10610U, Toshiba XG6 KXG60ZNV1T02
3221 Points -29%
PCMark 8
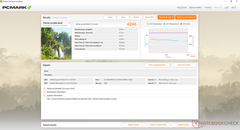
Home Score Accelerated v2
Dell Precision 3000 3551
Quadro P620, i9-10885H, Toshiba Kioxia XG6 KXG60PNV512G
4246 Points
Dell Precision 3530
Quadro P600, E-2176M, SK hynix PC400 512 GB
4233 Points 0%
MSI WP65
Quadro P620, i7-9750H, Samsung SSD PM981 MZVLB512HAJQ
4165 Points -2%
Lenovo ThinkPad P53s-20N6001NGE
Quadro P520, i7-8565U, Intel SSD 760p SSDPEKKW256G8
3840 Points -10%
Dell Precision 5550 P91F
Quadro T2000 Max-Q, i7-10875H, SK Hynix PC601A NVMe 1TB
3729 Points -12%
HP ZBook Firefly 15 G7
Quadro P520, i7-10610U, Toshiba XG6 KXG60ZNV1T02
3311 Points -22%
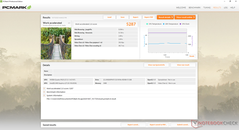
Work Score Accelerated v2
Dell Precision 3530
Quadro P600, E-2176M, SK hynix PC400 512 GB
5295 Points 0%
Dell Precision 3000 3551
Quadro P620, i9-10885H, Toshiba Kioxia XG6 KXG60PNV512G
5287 Points
MSI WP65
Quadro P620, i7-9750H, Samsung SSD PM981 MZVLB512HAJQ
5213 Points -1%
Lenovo ThinkPad P53s-20N6001NGE
Quadro P520, i7-8565U, Intel SSD 760p SSDPEKKW256G8
5140 Points -3%
Dell Precision 5550 P91F
Quadro T2000 Max-Q, i7-10875H, SK Hynix PC601A NVMe 1TB
4515 Points -15%
HP ZBook Firefly 15 G7
Quadro P520, i7-10610U, Toshiba XG6 KXG60ZNV1T02
4298 Points -19%
PCMark 8 Home Score Accelerated v2
4246 Punkte
PCMark 8 Work Score Accelerated v2
5287 Punkte
PCMark 10 Score
5127 Punkte
Hilfe

DPC-Latenzzeit

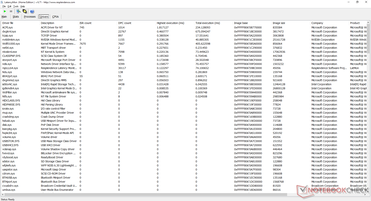
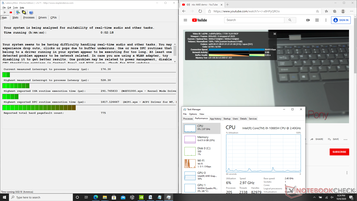
Hohe DPC-Latenzzeit im Zusammenhang mit ACPI.sys gemeldet
4K UHD 60 FPS Videowiedergabe ist flüssig und ohne Auslassungen
DPC Latencies / LatencyMon - interrupt to process latency (max), Web, Youtube, Prime95
Dell Precision 7550
Quadro RTX 5000 Max-Q, W-10885M, SK Hynix PC601A NVMe 1TB
10043 μs * -453%
HP ZBook Firefly 15 G7
Quadro P520, i7-10610U, Toshiba XG6 KXG60ZNV1T02
3861 μs * -112%
MSI WS66 10TMT-207US
Quadro RTX 5000 Max-Q, i9-10980HK, WDC PC SN730 SDBPNTY-1T00
3413 μs * -88%
Dell Precision 3000 3551
Quadro P620, i9-10885H, Toshiba Kioxia XG6 KXG60PNV512G
1817 μs *
Dell Precision 5000 5750 P92F
Quadro RTX 3000 Max-Q, W-10885M, Toshiba Kioxia XG6 KXG60PNV1T02
597 μs * +67%
Dell Precision 5550 P91F
Quadro T2000 Max-Q, i7-10875H, SK Hynix PC601A NVMe 1TB
305 μs * +83%

* ... kleinere Werte sind besser

Speichergeräte

Nur ein einziger interner M.2 2280-Steckplatz. Es sind jedoch Konfigurationen mit einem sekundären 2,5-Zoll-SATA-III-Schacht erhältlich, wenn auch mit einem kleineren Akku
Dell Precision 3000 3551
Toshiba Kioxia XG6 KXG60PNV512G
HP ZBook Firefly 15 G7
Toshiba XG6 KXG60ZNV1T02
Dell Precision 5550 P91F
SK Hynix PC601A NVMe 1TB
Lenovo ThinkPad P53s-20N6001NGE
Intel SSD 760p SSDPEKKW256G8
MSI WP65
Samsung SSD PM981 MZVLB512HAJQ
Dell Precision 3530
SK hynix PC400 512 GB
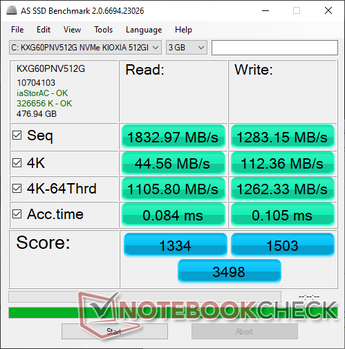
AS SSD
13%
-53%
4%
10%
-13%
Seq Read
1833
2666
45%
2039
11%
2283
25%
1097
-40%
2682
46%
Seq Write
1283
1257
-2%
1376
7%
1042
-19%
1838
43%
1272
-1%
4K Read
44.56
48.04
8%
44.11
-1%
46.62
5%
52.9
19%
25.98
-42%
4K Write
112.4
137.5
22%
113.3
1%
172.6
54%
108.4
-4%
102.8
-9%
4K-64 Read
1106
977
-12%
1094
-1%
759
-31%
1509
36%
994
-10%
4K-64 Write
1262
1142
-10%
1630
29%
916
-27%
1695
34%
908
-28%
Access Time Read *
0.084
0.053
37%
0.059
30%
0.06
29%
0.067
20%
0.099
-18%
Access Time Write *
0.105
0.03
71%
0.99
-843%
0.022
79%
0.103
2%
0.053
50%
Score Read
1334
1292
-3%
1342
1%
1034
-22%
1671
25%
1288
-3%
Score Write
1503
1406
-6%
1881
25%
1192
-21%
1988
32%
1138
-24%
Score Total
3498
3297
-6%
3883
11%
2705
-23%
4558
30%
3013
-14%
Copy ISO MB/s
2940
2489
-15%
1800
-39%
1701
-42%
Copy Program MB/s
733
682
-7%
569
-22%
346.1
-53%
Copy Game MB/s
1442
1515
5%
1409
-2%
1050
-27%
CrystalDiskMark 5.2 / 6
8%
-2%
16%
3%
-14%
Write 4K
120.9
133.1
10%
122.6
1%
195.9
62%
126.9
5%
113.6
-6%
Read 4K
46.79
51.6
10%
42.4
-9%
74.9
60%
44.91
-4%
41.18
-12%
Write Seq
1916
1986
4%
2167
13%
1194
-38%
1944
1%
1417
-26%
Read Seq
2216
2208
0%
1747
-21%
2309
4%
1449
-35%
1896
-14%
Write 4K Q32T1
393.9
462.3
17%
388.8
-1%
507
29%
531
35%
355
-10%
Read 4K Q32T1
375.1
400.2
7%
367.3
-2%
624
66%
579
54%
404.3
8%
Write Seq Q32T1
2795
3074
10%
2629
-6%
1206
-57%
1970
-30%
1411
-50%
Read Seq Q32T1
3106
3268
5%
3460
11%
3091
0%
2990
-4%
3095
0%
Durchschnitt gesamt (Programm / Settings)
11% / 11%
-28% / -35%
10% / 9%
7% / 7%
-14% / -13%

* ... kleinere Werte sind besser

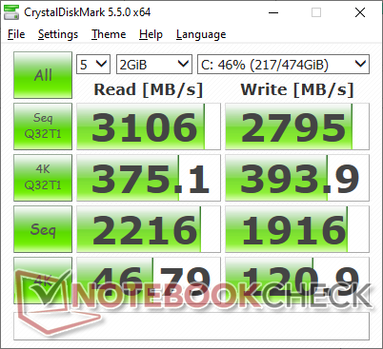
Toshiba Kioxia XG6 KXG60PNV512G
CDM 5/6 Read Seq Q32T1: 3106 MB/s
CDM 5/6 Write Seq Q32T1: 2795 MB/s
CDM 5/6 Read 4K Q32T1: 375.1 MB/s
CDM 5/6 Write 4K Q32T1: 393.9 MB/s
CDM 5 Read Seq: 2216 MB/s
CDM 5 Write Seq: 1916 MB/s
CDM 5/6 Read 4K: 46.79 MB/s
CDM 5/6 Write 4K: 120.9 MB/s

Disk Throttling: DiskSpd Read Loop, Queue Depth 8

No graph data

GPU-Leistung

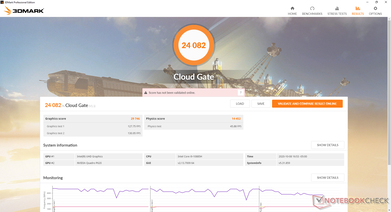
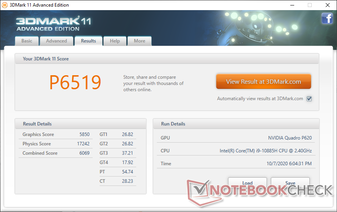
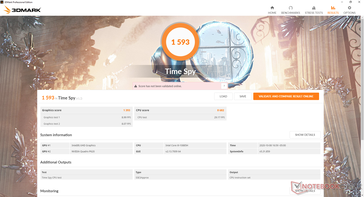
Die Rohgrafikleistung liegt etwas unter der neueren Quadro T1000 Max-Q und ohne die höheren Leistungs-Watt-Vorteile der neueren Turing-Architektur. Die Quadro P620 ist in dieser Hinsicht eine Generation hinterher und ist nicht für intensive Grafikanwendungen ausgelegt.

3DMark
1920x1080 Fire Strike Graphics
Dell Precision 7550
NVIDIA Quadro RTX 5000 Max-Q, W-10885M
19342 Points +320%
Acer ConceptD 3 Pro CN315-71P-73W1
NVIDIA Quadro T1000 (Laptop), i7-9750H
8727 Points +90%
Dell Precision 5550 P91F
NVIDIA Quadro T2000 Max-Q, i7-10875H
8416 Points +83%
Dell Precision 5540
NVIDIA Quadro T2000 Max-Q, i9-9980HK
8107 Points +76%
HP ZBook Studio G5-4QH10EA
NVIDIA Quadro P1000, i7-8750H
4756 Points +3%
MSI WP65
NVIDIA Quadro P620, i7-9750H
4745 Points +3%
Durchschnittliche NVIDIA Quadro P620
  (4600 - 4745, n=2)
4673 Points +2%
Dell Precision 3000 3551
NVIDIA Quadro P620, i9-10885H
4600 Points
Lenovo ThinkPad P53s-20N6001NGE
NVIDIA Quadro P520, i7-8565U
3410 Points -26%
HP ZBook Firefly 15 G7
NVIDIA Quadro P520, i7-10610U
3215 Points -30%
HP ZBook 15u G6 6TP54EA
AMD Radeon Pro WX 3200, i7-8565U
3088 Points -33%
2560x1440 Time Spy Graphics
Dell Precision 7550
NVIDIA Quadro RTX 5000 Max-Q, W-10885M
7349 Points +428%
Dell Precision 7540
NVIDIA Quadro RTX 3000 (Laptop), i9-9980HK
5589 Points +301%
Acer ConceptD 3 Pro CN315-71P-73W1
NVIDIA Quadro T1000 (Laptop), i7-9750H
3261 Points +134%
Dell Precision 5550 P91F
NVIDIA Quadro T2000 Max-Q, i7-10875H
3122 Points +124%
Dell Precision 5540
NVIDIA Quadro T2000 Max-Q, i9-9980HK
3066 Points +120%
HP ZBook Studio G5-4QH10EA
NVIDIA Quadro P1000, i7-8750H
1395 Points 0%
Dell Precision 3000 3551
NVIDIA Quadro P620, i9-10885H
1393 Points
Durchschnittliche NVIDIA Quadro P620
  (1383 - 1393, n=2)
1388 Points 0%
MSI WP65
NVIDIA Quadro P620, i7-9750H
1383 Points -1%
Lenovo ThinkPad P53s-20N6001NGE
NVIDIA Quadro P520, i7-8565U
1043 Points -25%
HP ZBook Firefly 15 G7
NVIDIA Quadro P520, i7-10610U
997 Points -28%
HP ZBook 15u G6 6TP54EA
AMD Radeon Pro WX 3200, i7-8565U
938 Points -33%
3DMark 11
1280x720 Performance GPU
Dell Precision 7550
NVIDIA Quadro RTX 5000 Max-Q, W-10885M
26242 Points +349%
Acer ConceptD 3 Pro CN315-71P-73W1
NVIDIA Quadro T1000 (Laptop), i7-9750H
12132 Points +107%
Dell Precision 5540
NVIDIA Quadro T2000 Max-Q, i9-9980HK
11468 Points +96%
Dell Precision 5550 P91F
NVIDIA Quadro T2000 Max-Q, i7-10875H
11454 Points +96%
HP ZBook Studio G5-4QH10EA
NVIDIA Quadro P1000, i7-8750H
5982 Points +2%
Durchschnittliche NVIDIA Quadro P620
  (5850 - 6059, n=3)
5939 Points +2%
MSI WP65
NVIDIA Quadro P620, i7-9750H
5909 Points +1%
Dell Precision 3000 3551
NVIDIA Quadro P620, i9-10885H
5850 Points
Lenovo ThinkPad P53s-20N6001NGE
NVIDIA Quadro P520, i7-8565U
4273 Points -27%
HP ZBook 15u G6 6TP54EA
AMD Radeon Pro WX 3200, i7-8565U
4256 Points -27%
HP ZBook Firefly 15 G7
NVIDIA Quadro P520, i7-10610U
4128 Points -29%
1280x720 Performance Combined
Dell Precision 5550 P91F
NVIDIA Quadro T2000 Max-Q, i7-10875H
11416 Points +88%
Dell Precision 7550
NVIDIA Quadro RTX 5000 Max-Q, W-10885M
11312 Points +86%
Acer ConceptD 3 Pro CN315-71P-73W1
NVIDIA Quadro T1000 (Laptop), i7-9750H
11239 Points +85%
Dell Precision 5540
NVIDIA Quadro T2000 Max-Q, i9-9980HK
10098 Points +66%
HP ZBook Studio G5-4QH10EA
NVIDIA Quadro P1000, i7-8750H
6359 Points +5%
MSI WP65
NVIDIA Quadro P620, i7-9750H
6289 Points +4%
Durchschnittliche NVIDIA Quadro P620
  (6069 - 6289, n=2)
6179 Points +2%
Dell Precision 3000 3551
NVIDIA Quadro P620, i9-10885H
6069 Points
HP ZBook 15u G6 6TP54EA
AMD Radeon Pro WX 3200, i7-8565U
5318 Points -12%
Lenovo ThinkPad P53s-20N6001NGE
NVIDIA Quadro P520, i7-8565U
3951 Points -35%
HP ZBook Firefly 15 G7
NVIDIA Quadro P520, i7-10610U
3728 Points -39%
SPECviewperf 12
1900x1060 Catia (catia-04)
Dell Precision 7550
NVIDIA Quadro RTX 5000 Max-Q, W-10885M
125 fps +135%
Acer ConceptD 3 Pro CN315-71P-73W1
NVIDIA Quadro T1000 (Laptop), i7-9750H
93 fps +75%
Dell Precision 5550 P91F
NVIDIA Quadro T2000 Max-Q, i7-10875H
92 fps +73%
Dell Precision 5540
NVIDIA Quadro T2000 Max-Q, i9-9980HK
88.9 fps +67%
MSI WP65
NVIDIA Quadro P620, i7-9750H
55.1 fps +4%
Durchschnittliche NVIDIA Quadro P620
  (53.2 - 55.1, n=3)
54.2 fps +2%
HP ZBook Studio G5-4QH10EA
NVIDIA Quadro P1000, i7-8750H
54 fps +2%
Dell Precision 3000 3551
NVIDIA Quadro P620, i9-10885H
53.2 fps
Lenovo ThinkPad P53s-20N6001NGE
NVIDIA Quadro P520, i7-8565U
34.14 fps -36%
HP ZBook 15u G6 6TP54EA
AMD Radeon Pro WX 3200, i7-8565U
32.08 fps -40%
1900x1060 Creo (creo-01)
Dell Precision 7550
NVIDIA Quadro RTX 5000 Max-Q, W-10885M
136 fps +131%
Dell Precision 5550 P91F
NVIDIA Quadro T2000 Max-Q, i7-10875H
89.6 fps +52%
Dell Precision 5540
NVIDIA Quadro T2000 Max-Q, i9-9980HK
88.3 fps +50%
Acer ConceptD 3 Pro CN315-71P-73W1
NVIDIA Quadro T1000 (Laptop), i7-9750H
83.9 fps +42%
MSI WP65
NVIDIA Quadro P620, i7-9750H
60.3 fps +2%
Durchschnittliche NVIDIA Quadro P620
  (59 - 60.3, n=3)
59.5 fps +1%
Dell Precision 3000 3551
NVIDIA Quadro P620, i9-10885H
59 fps
HP ZBook Studio G5-4QH10EA
NVIDIA Quadro P1000, i7-8750H
51.2 fps -13%
HP ZBook 15u G6 6TP54EA
AMD Radeon Pro WX 3200, i7-8565U
37.9 fps -36%
Lenovo ThinkPad P53s-20N6001NGE
NVIDIA Quadro P520, i7-8565U
36.59 fps -38%
1900x1060 Energy (energy-01)
Dell Precision 7550
NVIDIA Quadro RTX 5000 Max-Q, W-10885M
13.93 fps +261%
Acer ConceptD 3 Pro CN315-71P-73W1
NVIDIA Quadro T1000 (Laptop), i7-9750H
7.9 fps +105%
Dell Precision 5540
NVIDIA Quadro T2000 Max-Q, i9-9980HK
7.79 fps +102%
Dell Precision 5550 P91F
NVIDIA Quadro T2000 Max-Q, i7-10875H
6.31 fps +63%
MSI WP65
NVIDIA Quadro P620, i7-9750H
3.93 fps +2%
Durchschnittliche NVIDIA Quadro P620
  (3.86 - 3.93, n=2)
3.9 fps +1%
Dell Precision 3000 3551
NVIDIA Quadro P620, i9-10885H
3.86 fps
HP ZBook Studio G5-4QH10EA
NVIDIA Quadro P1000, i7-8750H
3.66 fps -5%
HP ZBook 15u G6 6TP54EA
AMD Radeon Pro WX 3200, i7-8565U
1.69 fps -56%
Lenovo ThinkPad P53s-20N6001NGE
NVIDIA Quadro P520, i7-8565U
0.75 fps -81%
1900x1060 Maya (maya-04)
Dell Precision 7550
NVIDIA Quadro RTX 5000 Max-Q, W-10885M
76.4 fps +86%
Acer ConceptD 3 Pro CN315-71P-73W1
NVIDIA Quadro T1000 (Laptop), i7-9750H
65.1 fps +59%
Dell Precision 5540
NVIDIA Quadro T2000 Max-Q, i9-9980HK
51 fps +24%
Dell Precision 5550 P91F
NVIDIA Quadro T2000 Max-Q, i7-10875H
50.4 fps +23%
Dell Precision 3000 3551
NVIDIA Quadro P620, i9-10885H
41.03 fps
MSI WP65
NVIDIA Quadro P620, i7-9750H
40.93 fps 0%
Durchschnittliche NVIDIA Quadro P620
  (40.7 - 41, n=3)
40.9 fps 0%
HP ZBook Studio G5-4QH10EA
NVIDIA Quadro P1000, i7-8750H
36.99 fps -10%
Lenovo ThinkPad P53s-20N6001NGE
NVIDIA Quadro P520, i7-8565U
25.04 fps -39%
HP ZBook 15u G6 6TP54EA
AMD Radeon Pro WX 3200, i7-8565U
24.84 fps -39%
1900x1060 Medical (medical-01)
Dell Precision 7550
NVIDIA Quadro RTX 5000 Max-Q, W-10885M
63.3 fps +342%
Dell Precision 5540
NVIDIA Quadro T2000 Max-Q, i9-9980HK
35.53 fps +148%
Acer ConceptD 3 Pro CN315-71P-73W1
NVIDIA Quadro T1000 (Laptop), i7-9750H
34.8 fps +143%
Dell Precision 5550 P91F
NVIDIA Quadro T2000 Max-Q, i7-10875H
28.57 fps +100%
HP ZBook Studio G5-4QH10EA
NVIDIA Quadro P1000, i7-8750H
14.89 fps +4%
MSI WP65
NVIDIA Quadro P620, i7-9750H
14.65 fps +2%
Durchschnittliche NVIDIA Quadro P620
  (14.3 - 14.7, n=2)
14.5 fps +1%
Dell Precision 3000 3551
NVIDIA Quadro P620, i9-10885H
14.32 fps
Lenovo ThinkPad P53s-20N6001NGE
NVIDIA Quadro P520, i7-8565U
13.48 fps -6%
HP ZBook 15u G6 6TP54EA
AMD Radeon Pro WX 3200, i7-8565U
8.83 fps -38%
1900x1060 Showcase (showcase-01)
Dell Precision 7550
NVIDIA Quadro RTX 5000 Max-Q, W-10885M
96.1 fps +258%
Dell Precision 5550 P91F
NVIDIA Quadro T2000 Max-Q, i7-10875H
42.75 fps +59%
Acer ConceptD 3 Pro CN315-71P-73W1
NVIDIA Quadro T1000 (Laptop), i7-9750H
40.3 fps +50%
Dell Precision 5540
NVIDIA Quadro T2000 Max-Q, i9-9980HK
37.81 fps +41%
HP ZBook Studio G5-4QH10EA
NVIDIA Quadro P1000, i7-8750H
27.42 fps +2%
Dell Precision 3000 3551
NVIDIA Quadro P620, i9-10885H
26.84 fps
Durchschnittliche NVIDIA Quadro P620
  (25.2 - 26.8, n=3)
26 fps -3%
MSI WP65
NVIDIA Quadro P620, i7-9750H
25.23 fps -6%
HP ZBook 15u G6 6TP54EA
AMD Radeon Pro WX 3200, i7-8565U
19.25 fps -28%
Lenovo ThinkPad P53s-20N6001NGE
NVIDIA Quadro P520, i7-8565U
14.63 fps -45%
1900x1060 Siemens NX (snx-02)
Dell Precision 7550
NVIDIA Quadro RTX 5000 Max-Q, W-10885M
127.5 fps +158%
Acer ConceptD 3 Pro CN315-71P-73W1
NVIDIA Quadro T1000 (Laptop), i7-9750H
82.7 fps +67%
Dell Precision 5540
NVIDIA Quadro T2000 Max-Q, i9-9980HK
74.6 fps +51%
Dell Precision 5550 P91F
NVIDIA Quadro T2000 Max-Q, i7-10875H
74.5 fps +51%
HP ZBook Studio G5-4QH10EA
NVIDIA Quadro P1000, i7-8750H
55.7 fps +13%
MSI WP65
NVIDIA Quadro P620, i7-9750H
50.3 fps +2%
Durchschnittliche NVIDIA Quadro P620
  (49.5 - 50.6, n=3)
50.1 fps +1%
Dell Precision 3000 3551
NVIDIA Quadro P620, i9-10885H
49.5 fps
HP ZBook 15u G6 6TP54EA
AMD Radeon Pro WX 3200, i7-8565U
35.12 fps -29%
Lenovo ThinkPad P53s-20N6001NGE
NVIDIA Quadro P520, i7-8565U
26.98 fps -45%
1900x1060 Solidworks (sw-03)
Dell Precision 7550
NVIDIA Quadro RTX 5000 Max-Q, W-10885M
138.4 fps +47%
Acer ConceptD 3 Pro CN315-71P-73W1
NVIDIA Quadro T1000 (Laptop), i7-9750H
113.8 fps +21%
Dell Precision 5540
NVIDIA Quadro T2000 Max-Q, i9-9980HK
100.8 fps +7%
Dell Precision 5550 P91F
NVIDIA Quadro T2000 Max-Q, i7-10875H
94 fps 0%
Dell Precision 3000 3551
NVIDIA Quadro P620, i9-10885H
93.9 fps
Durchschnittliche NVIDIA Quadro P620
  (77.7 - 93.9, n=3)
83.4 fps -11%
MSI WP65
NVIDIA Quadro P620, i7-9750H
78.7 fps -16%
HP ZBook Studio G5-4QH10EA
NVIDIA Quadro P1000, i7-8750H
75.2 fps -20%
Lenovo ThinkPad P53s-20N6001NGE
NVIDIA Quadro P520, i7-8565U
54.2 fps -42%
HP ZBook 15u G6 6TP54EA
AMD Radeon Pro WX 3200, i7-8565U
41.43 fps -56%
SPECviewperf 13
3ds Max (3dsmax-06)
Dell Precision 7550
NVIDIA Quadro RTX 5000 Max-Q, W-10885M
176.2 fps +219%
Acer ConceptD 3 Pro CN315-71P-73W1
NVIDIA Quadro T1000 (Laptop), i7-9750H
101.9 fps +85%
Dell Precision 5540
NVIDIA Quadro T2000 Max-Q, i9-9980HK
93.3 fps +69%
Dell Precision 5550 P91F
NVIDIA Quadro T2000 Max-Q, i7-10875H
88.9 fps +61%
MSI WP65
NVIDIA Quadro P620, i7-9750H
56.7 fps +3%
Durchschnittliche NVIDIA Quadro P620
  (55.2 - 57.2, n=3)
56.4 fps +2%
Dell Precision 3000 3551
NVIDIA Quadro P620, i9-10885H
55.2 fps
HP ZBook Studio G5-4QH10EA
NVIDIA Quadro P1000, i7-8750H
50.7 fps -8%
HP ZBook Firefly 15 G7
NVIDIA Quadro P520, i7-10610U
34.3 fps -38%
HP ZBook 15u G6 6TP54EA
AMD Radeon Pro WX 3200, i7-8565U
32.36 fps -41%
Lenovo ThinkPad P53s-20N6001NGE
NVIDIA Quadro P520, i7-8565U
25.17 fps -54%
Catia (catia-05)
Dell Precision 7550
NVIDIA Quadro RTX 5000 Max-Q, W-10885M
242.9 fps +217%
Dell Precision 5550 P91F
NVIDIA Quadro T2000 Max-Q, i7-10875H
143.9 fps +88%
Acer ConceptD 3 Pro CN315-71P-73W1
NVIDIA Quadro T1000 (Laptop), i7-9750H
138.3 fps +81%
Dell Precision 5540
NVIDIA Quadro T2000 Max-Q, i9-9980HK
134.6 fps +76%
MSI WP65
NVIDIA Quadro P620, i7-9750H
78.4 fps +2%
HP ZBook Studio G5-4QH10EA
NVIDIA Quadro P1000, i7-8750H
78.1 fps +2%
Durchschnittliche NVIDIA Quadro P620
  (76.6 - 78.4, n=3)
77.4 fps +1%
Dell Precision 3000 3551
NVIDIA Quadro P620, i9-10885H
76.6 fps
HP ZBook Firefly 15 G7
NVIDIA Quadro P520, i7-10610U
48.08 fps -37%
Lenovo ThinkPad P53s-20N6001NGE
NVIDIA Quadro P520, i7-8565U
47.78 fps -38%
HP ZBook 15u G6 6TP54EA
AMD Radeon Pro WX 3200, i7-8565U
45.35 fps -41%
Creo (creo-02)
Dell Precision 7550
NVIDIA Quadro RTX 5000 Max-Q, W-10885M
224.9 fps +240%
Dell Precision 5550 P91F
NVIDIA Quadro T2000 Max-Q, i7-10875H
116.8 fps +76%
Acer ConceptD 3 Pro CN315-71P-73W1
NVIDIA Quadro T1000 (Laptop), i7-9750H
116.3 fps +76%
Dell Precision 5540
NVIDIA Quadro T2000 Max-Q, i9-9980HK
109.6 fps +66%
MSI WP65
NVIDIA Quadro P620, i7-9750H
68 fps +3%
Durchschnittliche NVIDIA Quadro P620
  (66.2 - 68, n=3)
67.3 fps +2%
HP ZBook Studio G5-4QH10EA
NVIDIA Quadro P1000, i7-8750H
66.9 fps +1%
Dell Precision 3000 3551
NVIDIA Quadro P620, i9-10885H
66.2 fps
HP ZBook Firefly 15 G7
NVIDIA Quadro P520, i7-10610U
45.17 fps -32%
HP ZBook 15u G6 6TP54EA
AMD Radeon Pro WX 3200, i7-8565U
44.68 fps -33%
Lenovo ThinkPad P53s-20N6001NGE
NVIDIA Quadro P520, i7-8565U
36.25 fps -45%
Energy (energy-02)
Dell Precision 7550
NVIDIA Quadro RTX 5000 Max-Q, W-10885M
36.8 fps +356%
Acer ConceptD 3 Pro CN315-71P-73W1
NVIDIA Quadro T1000 (Laptop), i7-9750H
17.8 fps +121%
Dell Precision 5550 P91F
NVIDIA Quadro T2000 Max-Q, i7-10875H
15.66 fps +94%
Dell Precision 5540
NVIDIA Quadro T2000 Max-Q, i9-9980HK
14.87 fps +84%
Dell Precision 3000 3551
NVIDIA Quadro P620, i9-10885H
8.07 fps
Durchschnittliche NVIDIA Quadro P620
  (7.29 - 8.07, n=2)
7.68 fps -5%
MSI WP65
NVIDIA Quadro P620, i7-9750H
7.29 fps -10%
HP ZBook Firefly 15 G7
NVIDIA Quadro P520, i7-10610U
6.55 fps -19%
HP ZBook Studio G5-4QH10EA
NVIDIA Quadro P1000, i7-8750H
3.28 fps -59%
HP ZBook 15u G6 6TP54EA
AMD Radeon Pro WX 3200, i7-8565U
2.15 fps -73%
Lenovo ThinkPad P53s-20N6001NGE
NVIDIA Quadro P520, i7-8565U
0.83 fps -90%
Maya (maya-05)
Dell Precision 7550
NVIDIA Quadro RTX 5000 Max-Q, W-10885M
210.4 fps +208%
Acer ConceptD 3 Pro CN315-71P-73W1
NVIDIA Quadro T1000 (Laptop), i7-9750H
114.6 fps +68%
Dell Precision 5550 P91F
NVIDIA Quadro T2000 Max-Q, i7-10875H
110.2 fps +61%
Dell Precision 5540
NVIDIA Quadro T2000 Max-Q, i9-9980HK
105.7 fps +55%
HP ZBook Studio G5-4QH10EA
NVIDIA Quadro P1000, i7-8750H
71 fps +4%
MSI WP65
NVIDIA Quadro P620, i7-9750H
68.8 fps +1%
Durchschnittliche NVIDIA Quadro P620
  (68.3 - 69.2, n=3)
68.8 fps +1%
Dell Precision 3000 3551
NVIDIA Quadro P620, i9-10885H
68.3 fps
HP ZBook 15u G6 6TP54EA
AMD Radeon Pro WX 3200, i7-8565U
45.21 fps -34%
Lenovo ThinkPad P53s-20N6001NGE
NVIDIA Quadro P520, i7-8565U
40.74 fps -40%
HP ZBook Firefly 15 G7
NVIDIA Quadro P520, i7-10610U
40.31 fps -41%
Medical (medical-02)
Dell Precision 7550
NVIDIA Quadro RTX 5000 Max-Q, W-10885M
97.7 fps +289%
Acer ConceptD 3 Pro CN315-71P-73W1
NVIDIA Quadro T1000 (Laptop), i7-9750H
50.1 fps +100%
Dell Precision 5550 P91F
NVIDIA Quadro T2000 Max-Q, i7-10875H
48.02 fps +91%
Dell Precision 5540
NVIDIA Quadro T2000 Max-Q, i9-9980HK
41.71 fps +66%
Dell Precision 3000 3551
NVIDIA Quadro P620, i9-10885H
25.1 fps
Durchschnittliche NVIDIA Quadro P620
  (13.1 - 25.1, n=2)
19.1 fps -24%
HP ZBook Firefly 15 G7
NVIDIA Quadro P520, i7-10610U
19.06 fps -24%
HP ZBook Studio G5-4QH10EA
NVIDIA Quadro P1000, i7-8750H
13.58 fps -46%
MSI WP65
NVIDIA Quadro P620, i7-9750H
13.05 fps -48%
HP ZBook 15u G6 6TP54EA
AMD Radeon Pro WX 3200, i7-8565U
11.8 fps -53%
Lenovo ThinkPad P53s-20N6001NGE
NVIDIA Quadro P520, i7-8565U
9.85 fps -61%
Showcase (showcase-02)
Dell Precision 7550
NVIDIA Quadro RTX 5000 Max-Q, W-10885M
95.2 fps +277%
Dell Precision 5550 P91F
NVIDIA Quadro T2000 Max-Q, i7-10875H
42.39 fps +68%
Acer ConceptD 3 Pro CN315-71P-73W1
NVIDIA Quadro T1000 (Laptop), i7-9750H
40.2 fps +59%
Dell Precision 5540
NVIDIA Quadro T2000 Max-Q, i9-9980HK
37.56 fps +49%
HP ZBook Studio G5-4QH10EA
NVIDIA Quadro P1000, i7-8750H
27.23 fps +8%
Durchschnittliche NVIDIA Quadro P620
  (25.2 - 27.4, n=3)
26 fps +3%
Dell Precision 3000 3551
NVIDIA Quadro P620, i9-10885H
25.28 fps
MSI WP65
NVIDIA Quadro P620, i7-9750H
25.23 fps 0%
HP ZBook 15u G6 6TP54EA
AMD Radeon Pro WX 3200, i7-8565U
19.38 fps -23%
Lenovo ThinkPad P53s-20N6001NGE
NVIDIA Quadro P520, i7-8565U
14.56 fps -42%
HP ZBook Firefly 15 G7
NVIDIA Quadro P520, i7-10610U
13.98 fps -45%
Siemens NX (snx-03)
Dell Precision 7550
NVIDIA Quadro RTX 5000 Max-Q, W-10885M
295.2 fps +232%
Acer ConceptD 3 Pro CN315-71P-73W1
NVIDIA Quadro T1000 (Laptop), i7-9750H
148.4 fps +67%
Dell Precision 5540
NVIDIA Quadro T2000 Max-Q, i9-9980HK
143.8 fps +62%
Dell Precision 5550 P91F
NVIDIA Quadro T2000 Max-Q, i7-10875H
139.4 fps +57%
HP ZBook Studio G5-4QH10EA
NVIDIA Quadro P1000, i7-8750H
102.6 fps +15%
MSI WP65
NVIDIA Quadro P620, i7-9750H
90.4 fps +2%
Durchschnittliche NVIDIA Quadro P620
  (89 - 91.9, n=3)
90.4 fps +2%
Dell Precision 3000 3551
NVIDIA Quadro P620, i9-10885H
89 fps
HP ZBook 15u G6 6TP54EA
AMD Radeon Pro WX 3200, i7-8565U
66.1 fps -26%
HP ZBook Firefly 15 G7
NVIDIA Quadro P520, i7-10610U
49.5 fps -44%
Lenovo ThinkPad P53s-20N6001NGE
NVIDIA Quadro P520, i7-8565U
49.42 fps -44%
Solidworks (sw-04)
Dell Precision 7550
NVIDIA Quadro RTX 5000 Max-Q, W-10885M
150.4 fps +73%
Acer ConceptD 3 Pro CN315-71P-73W1
NVIDIA Quadro T1000 (Laptop), i7-9750H
104.4 fps +20%
Dell Precision 5550 P91F
NVIDIA Quadro T2000 Max-Q, i7-10875H
103.9 fps +20%
Dell Precision 5540
NVIDIA Quadro T2000 Max-Q, i9-9980HK
97.2 fps +12%
Dell Precision 3000 3551
NVIDIA Quadro P620, i9-10885H
86.7 fps
Durchschnittliche NVIDIA Quadro P620
  (78.5 - 86.7, n=3)
81.7 fps -6%
MSI WP65
NVIDIA Quadro P620, i7-9750H
79.8 fps -8%
HP ZBook Studio G5-4QH10EA
NVIDIA Quadro P1000, i7-8750H
76.6 fps -12%
HP ZBook Firefly 15 G7
NVIDIA Quadro P520, i7-10610U
62.8 fps -28%
Lenovo ThinkPad P53s-20N6001NGE
NVIDIA Quadro P520, i7-8565U
56.4 fps -35%
HP ZBook 15u G6 6TP54EA
AMD Radeon Pro WX 3200, i7-8565U
44.6 fps -49%
3DMark 06 Standard Score
35322 Punkte
3DMark 11 Performance
6519 Punkte
3DMark Cloud Gate Standard Score
24082 Punkte
3DMark Fire Strike Score
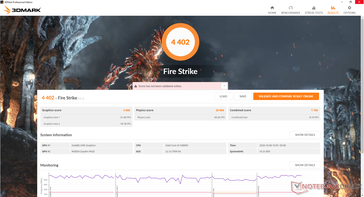
4402 Punkte
3DMark Time Spy Score
1593 Punkte
Hilfe