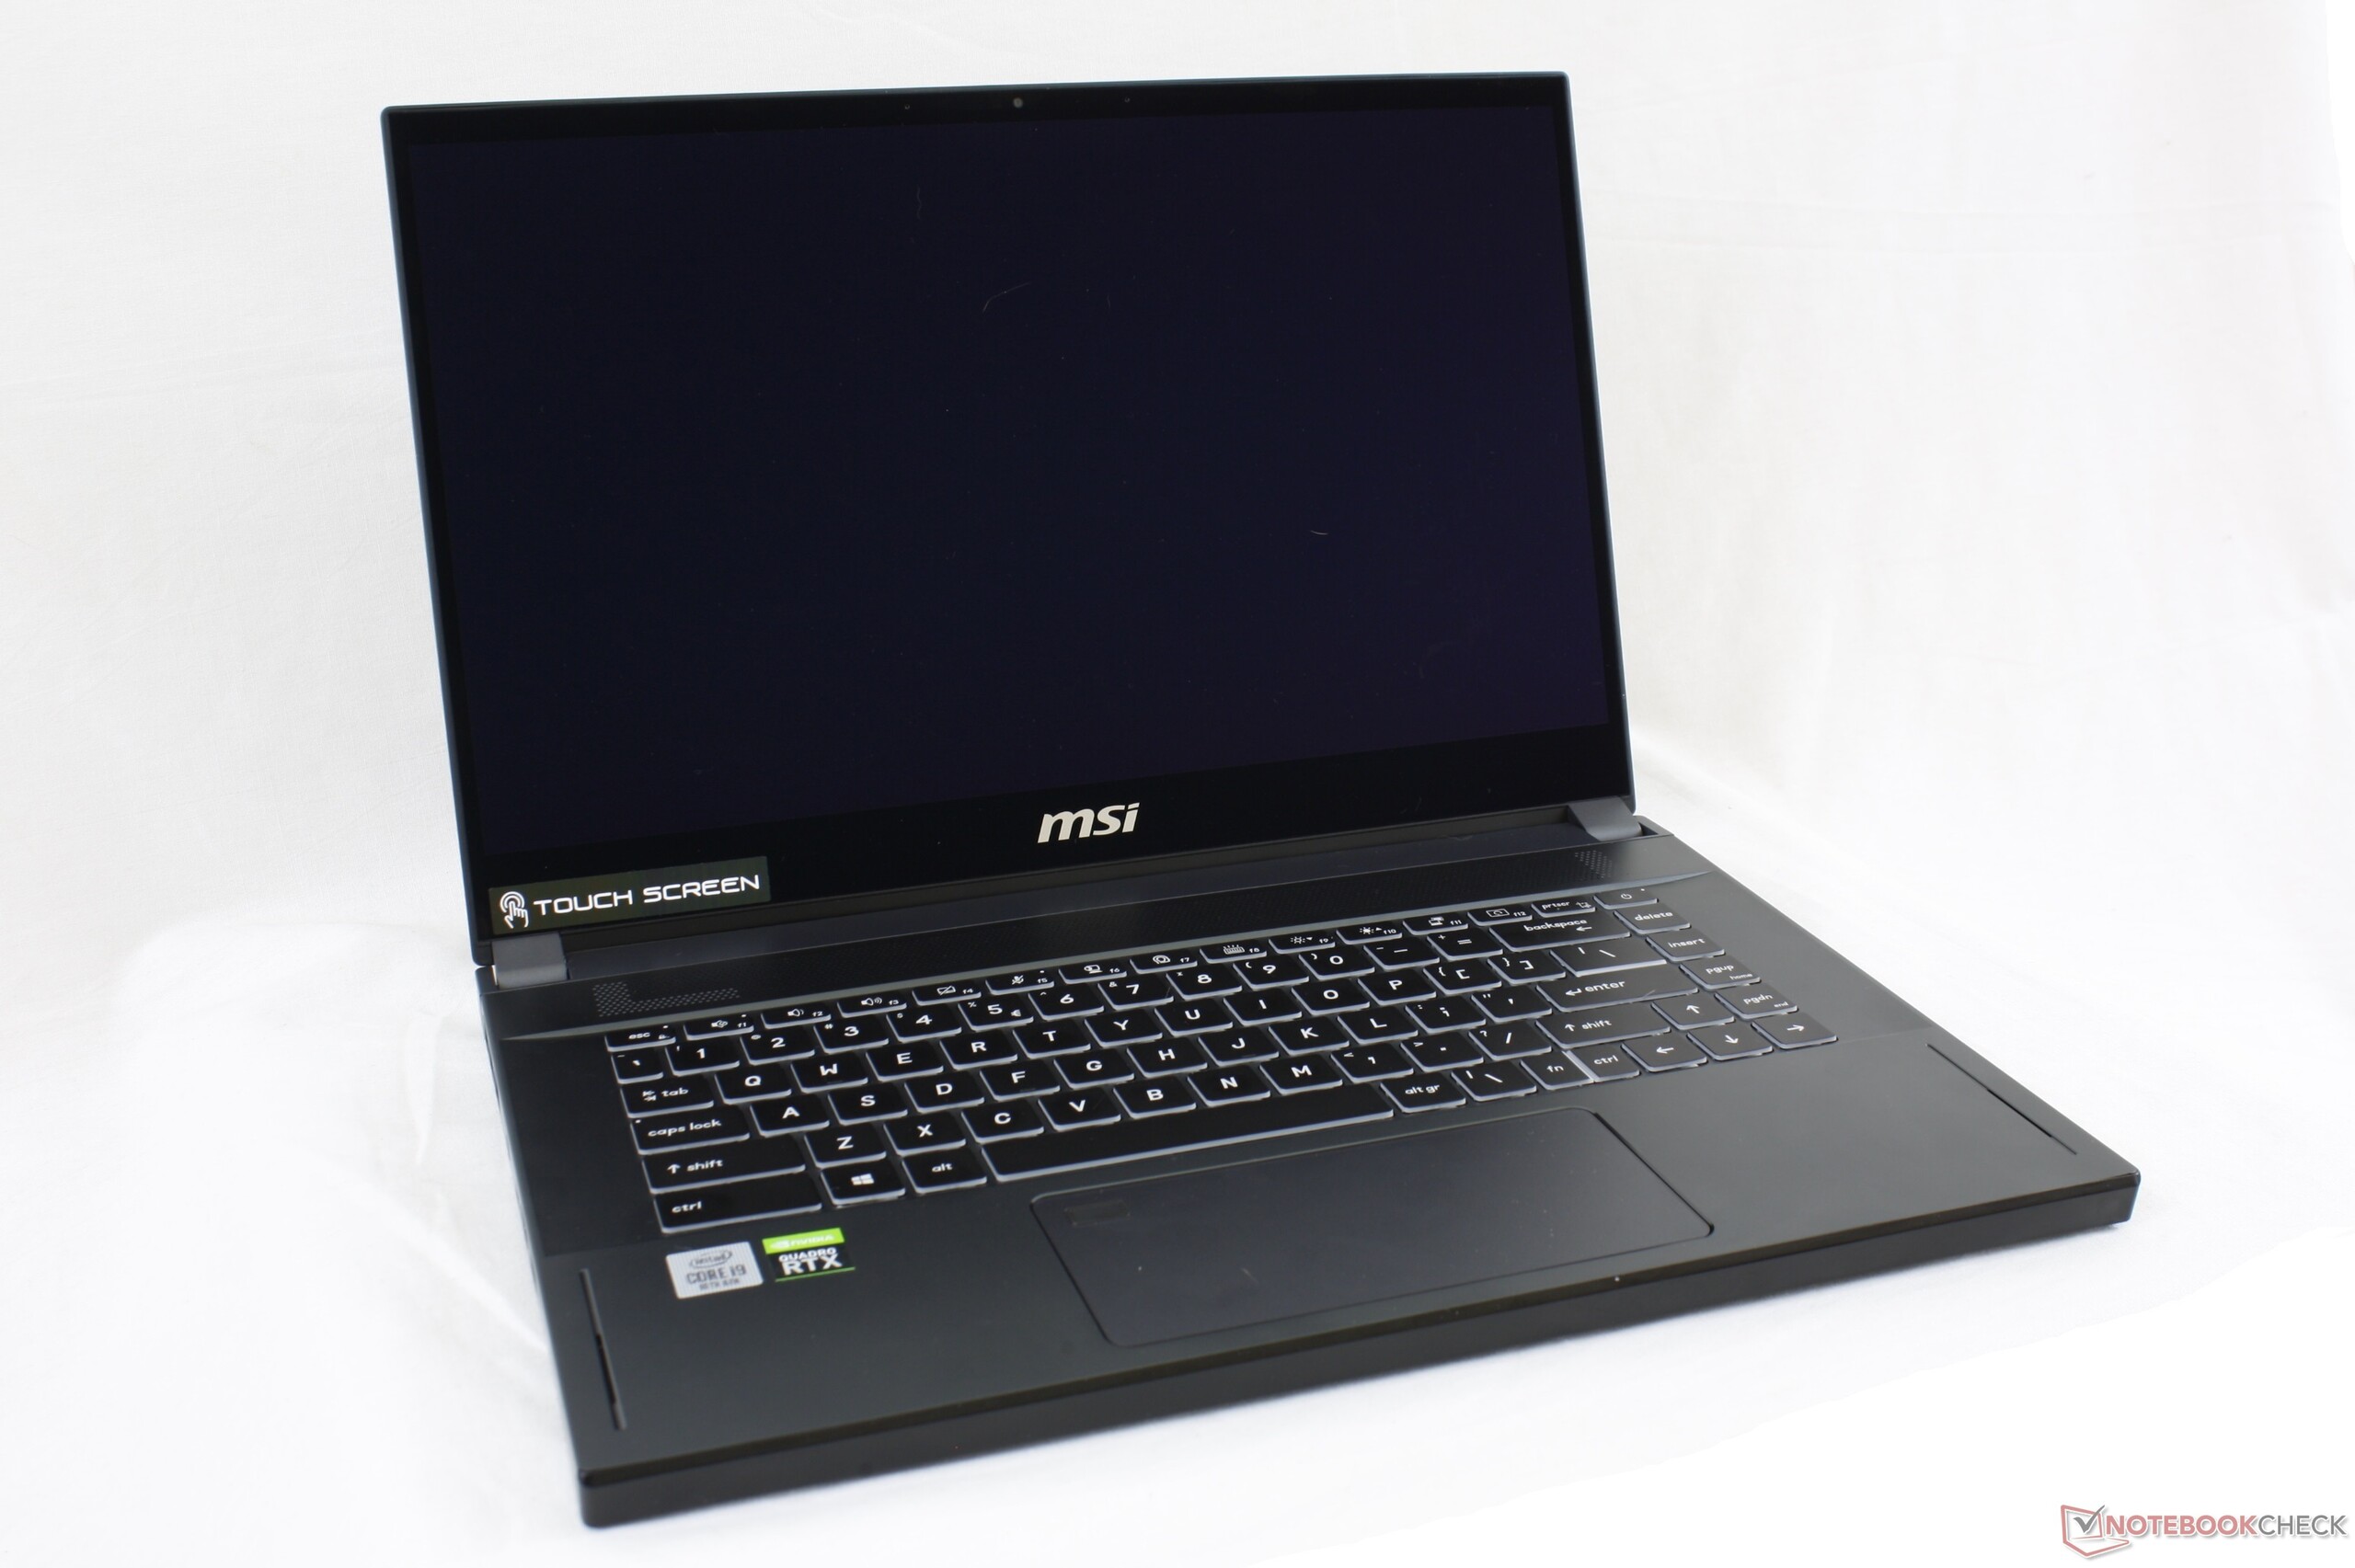
Workstation MSI WS66 10TMT im Laptop-Test: Schneller als das Razer Blade 15 Studio Edition
Das WS66 markiert MSIs brandneue, ultradünne mobile Workstation. Sie geht aus dem Gaming-Laptop GS66 hervor und beerbt das WS63 und WS65 aus dem letzten Jahr. Gegenüber der letzten Generation wurde das Äußere komplett neu designt und soll so besser mit anderen schlanken Nvidia-Studio-Workstations konkurrieren, wie z. B. mit dem Razer Blade 15 Studio, dem Asus ProArt, dem HP ZBook Studio oder dem Dell Precision 5550.
Aktuelle Konfigurationen fangen bei $2500 (~2100 Euro) an für einen Core i7-10875H, gepaart mit einer Quadro RTX 3000 und einem FHD-Touchscreen und gehen hoch bis $4000 (~3360 Euro) für einen Core i9-10980HK mit Quadro RTX 5000 Max-Q und 4K-Touchscreen, je nach RAM- oder Massenspeicheroption.
Weil das neue WS66 quasi das gleiche externe Design des GS66 übernimmt, empfehlen wir unseren Test zum MSI GS66, um mehr über das Gehäuse, die Eingabegeräte und andere äußerlichen Merkmale des WS66 zu erfahren.
Mehr MSI-Tests:
Bew. | Datum | Modell | Gewicht | Dicke | Größe | Auflösung | Preis ab |
|---|---|---|---|---|---|---|---|
| 83.4 % v7 (old) | 09 / 2020 | MSI WS66 10TMT-207US i9-10980HK, Quadro RTX 5000 Max-Q | 2.3 kg | 19.8 mm | 15.60" | 1920x1080 | |
| 87.8 % v7 (old) | 08 / 2020 | Dell Precision 7550 W-10885M, Quadro RTX 5000 Max-Q | 2.8 kg | 27.36 mm | 15.60" | 3840x2160 | |
| 86.3 % v7 (old) | 08 / 2020 | Dell Precision 5550 P91F i7-10875H, Quadro T2000 Max-Q | 2 kg | 18 mm | 15.60" | 3840x2400 | |
| 87 % v7 (old) | 08 / 2020 | Razer Blade 15 Studio Edition 2020 i7-10875H, Quadro RTX 5000 Max-Q | 2.2 kg | 13.98 mm | 15.60" | 3840x2160 | |
| 85.6 % v6 (old) | 10 / 2017 | MSI WS63VR 7RL-023US i7-7700HQ, Quadro P4000 Max-Q | 1.9 kg | 18 mm | 15.60" | 3840x2160 | |
| 82.1 % v7 (old) | 06 / 2020 | Acer ConceptD 3 Pro CN315-71P-73W1 i7-9750H, Quadro T1000 (Laptop) | 2.4 kg | 23.4 mm | 15.60" | 1920x1080 |
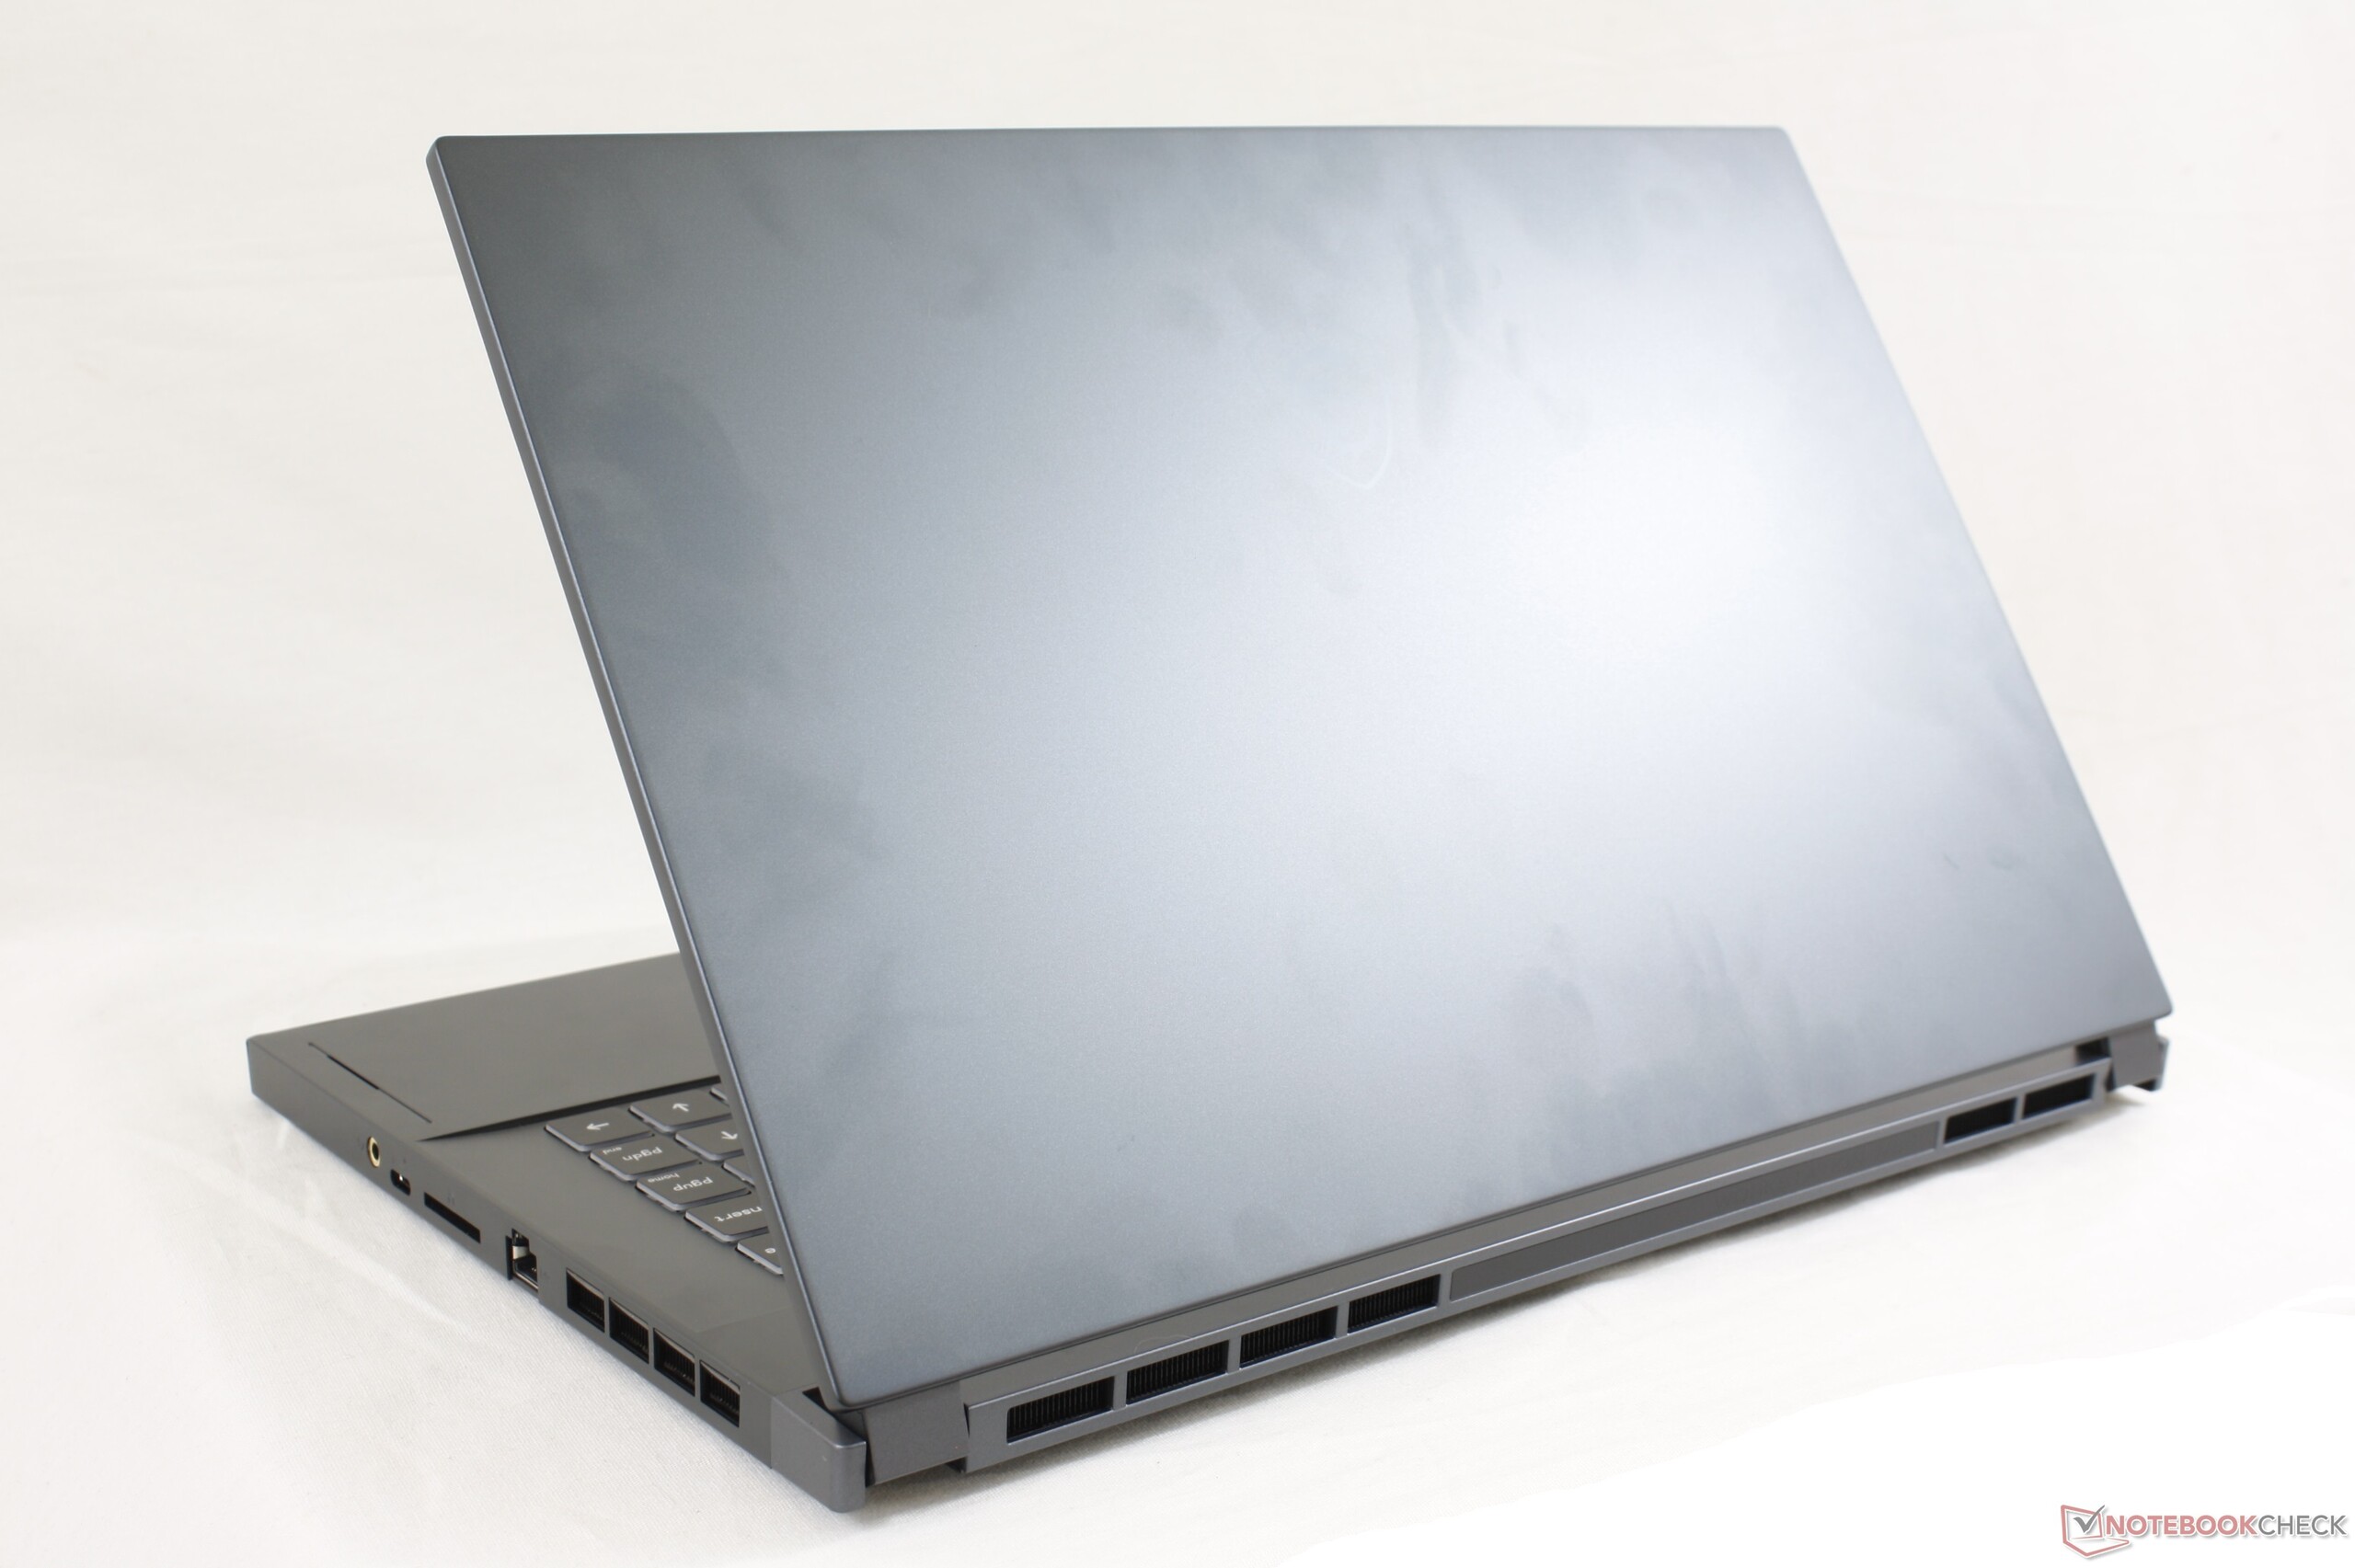
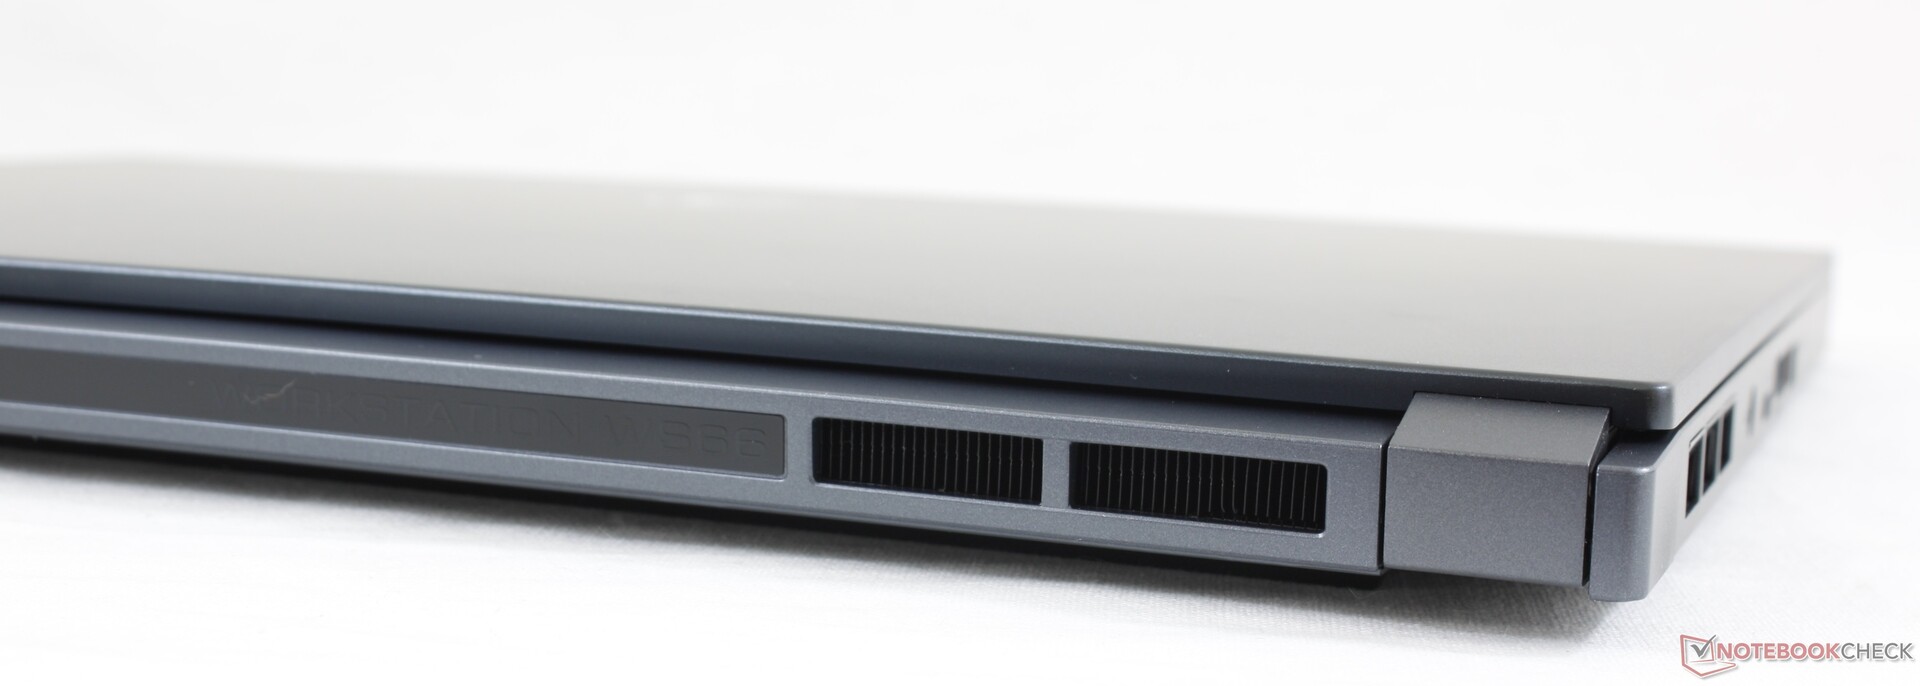
Gehäuse
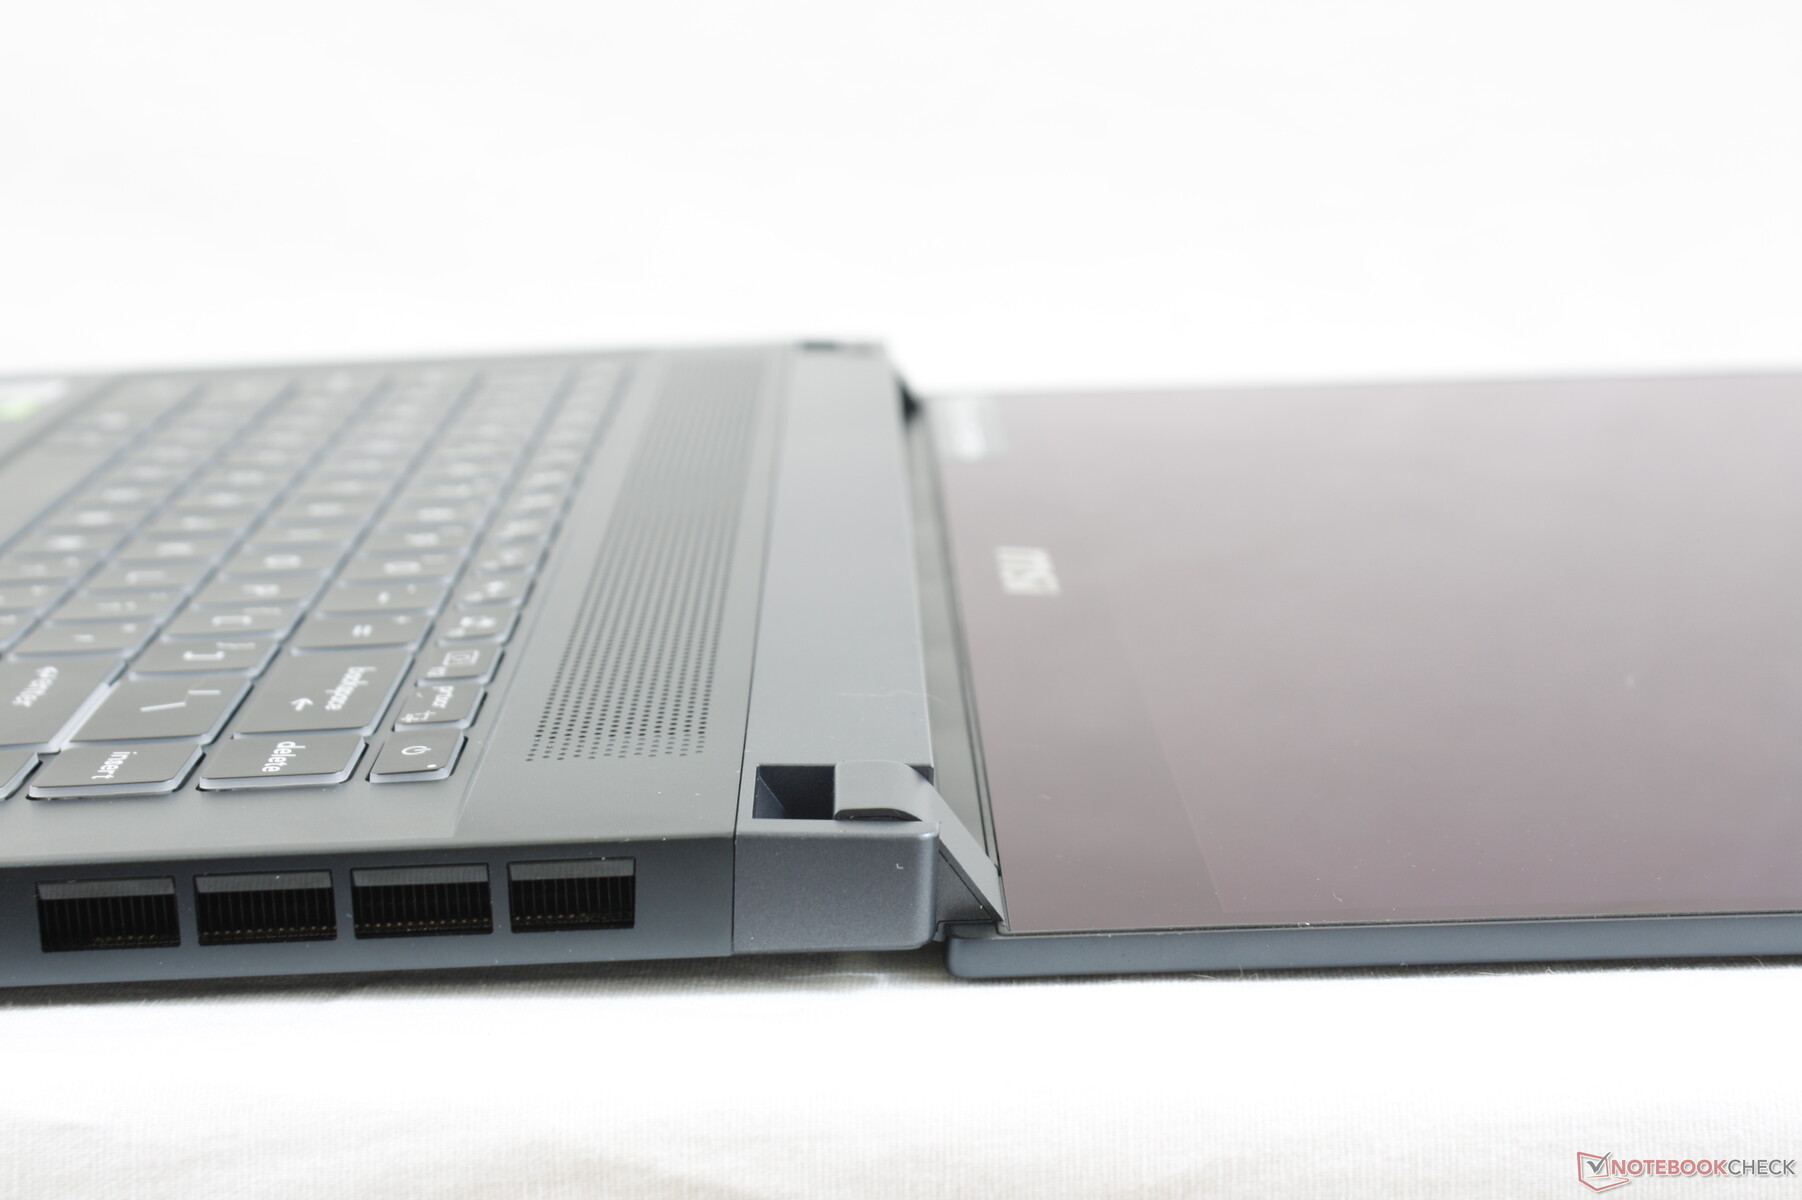
Das neue Gehäuse fühlt sich stabiler an als das des Vorgängers WS63, das Razer Blade Studio 15 ist in Sachen Verbiegen und Knackgeräusche aber immer noch deutlich besser.
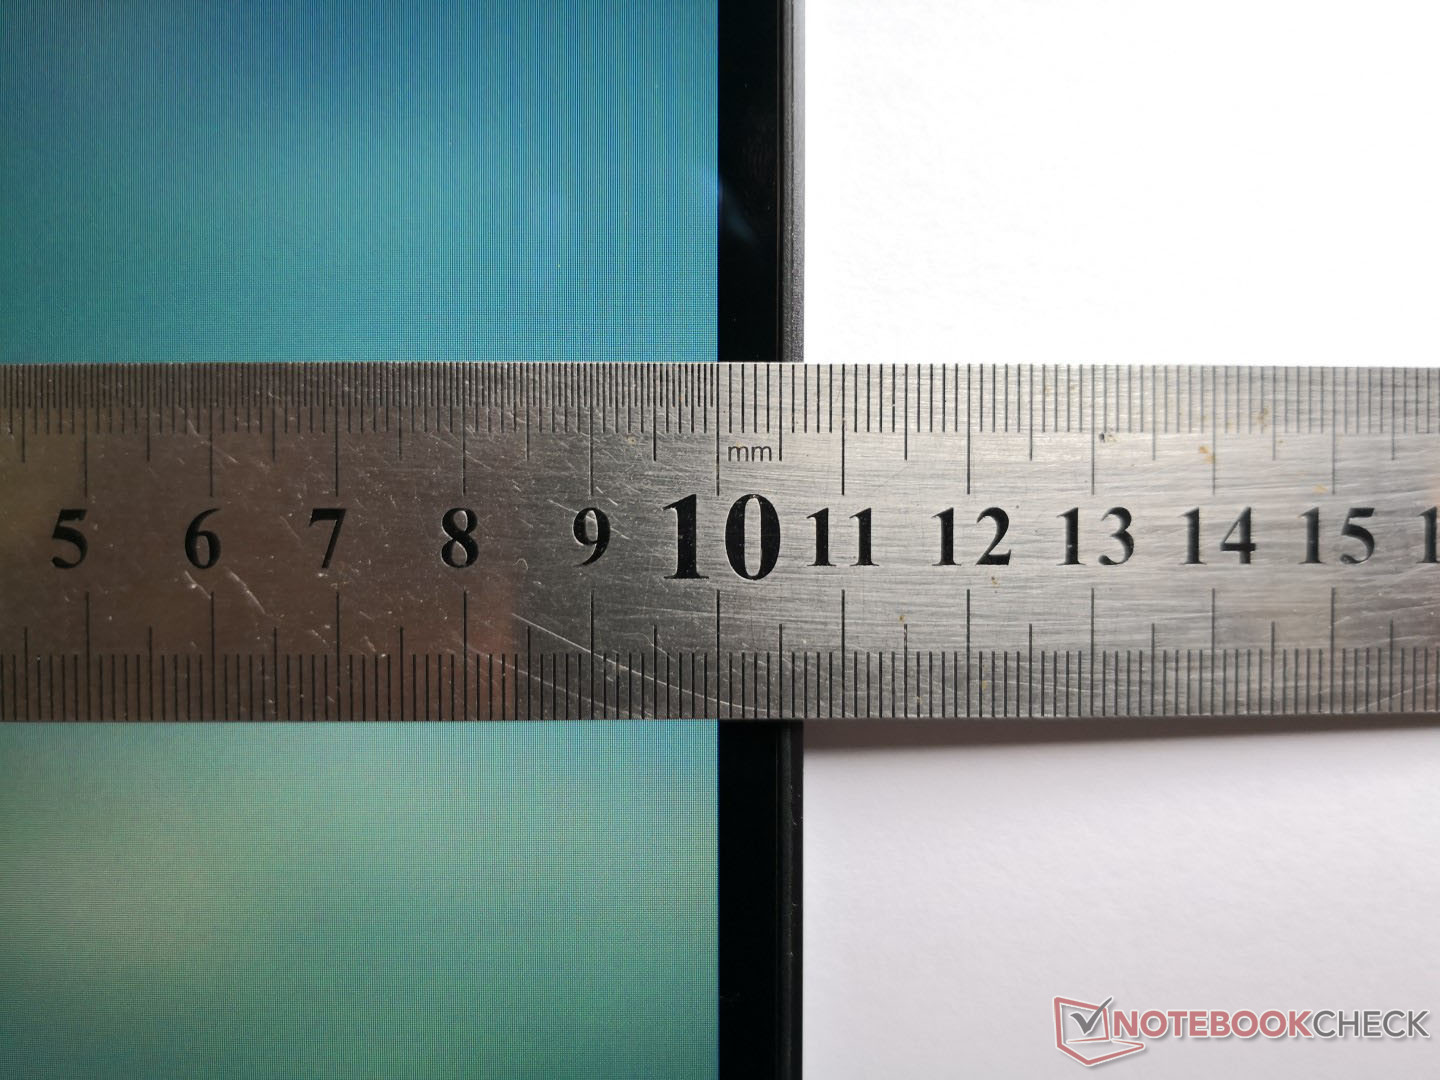
Genau wie beim Sprung vom GS63 zum GS66 ist auch das WS66 sowohl schwerer als auch dicker als sein Vorgänger. Das kommt vor allem durch die Verbesserungen bei der Stabilität und der Kühlung. Trotz dieses Umstandes ist das WS66 noch immer eines der dünnsten Workstations mit Core i9 und Quadro RTX 5000 Max-Q.
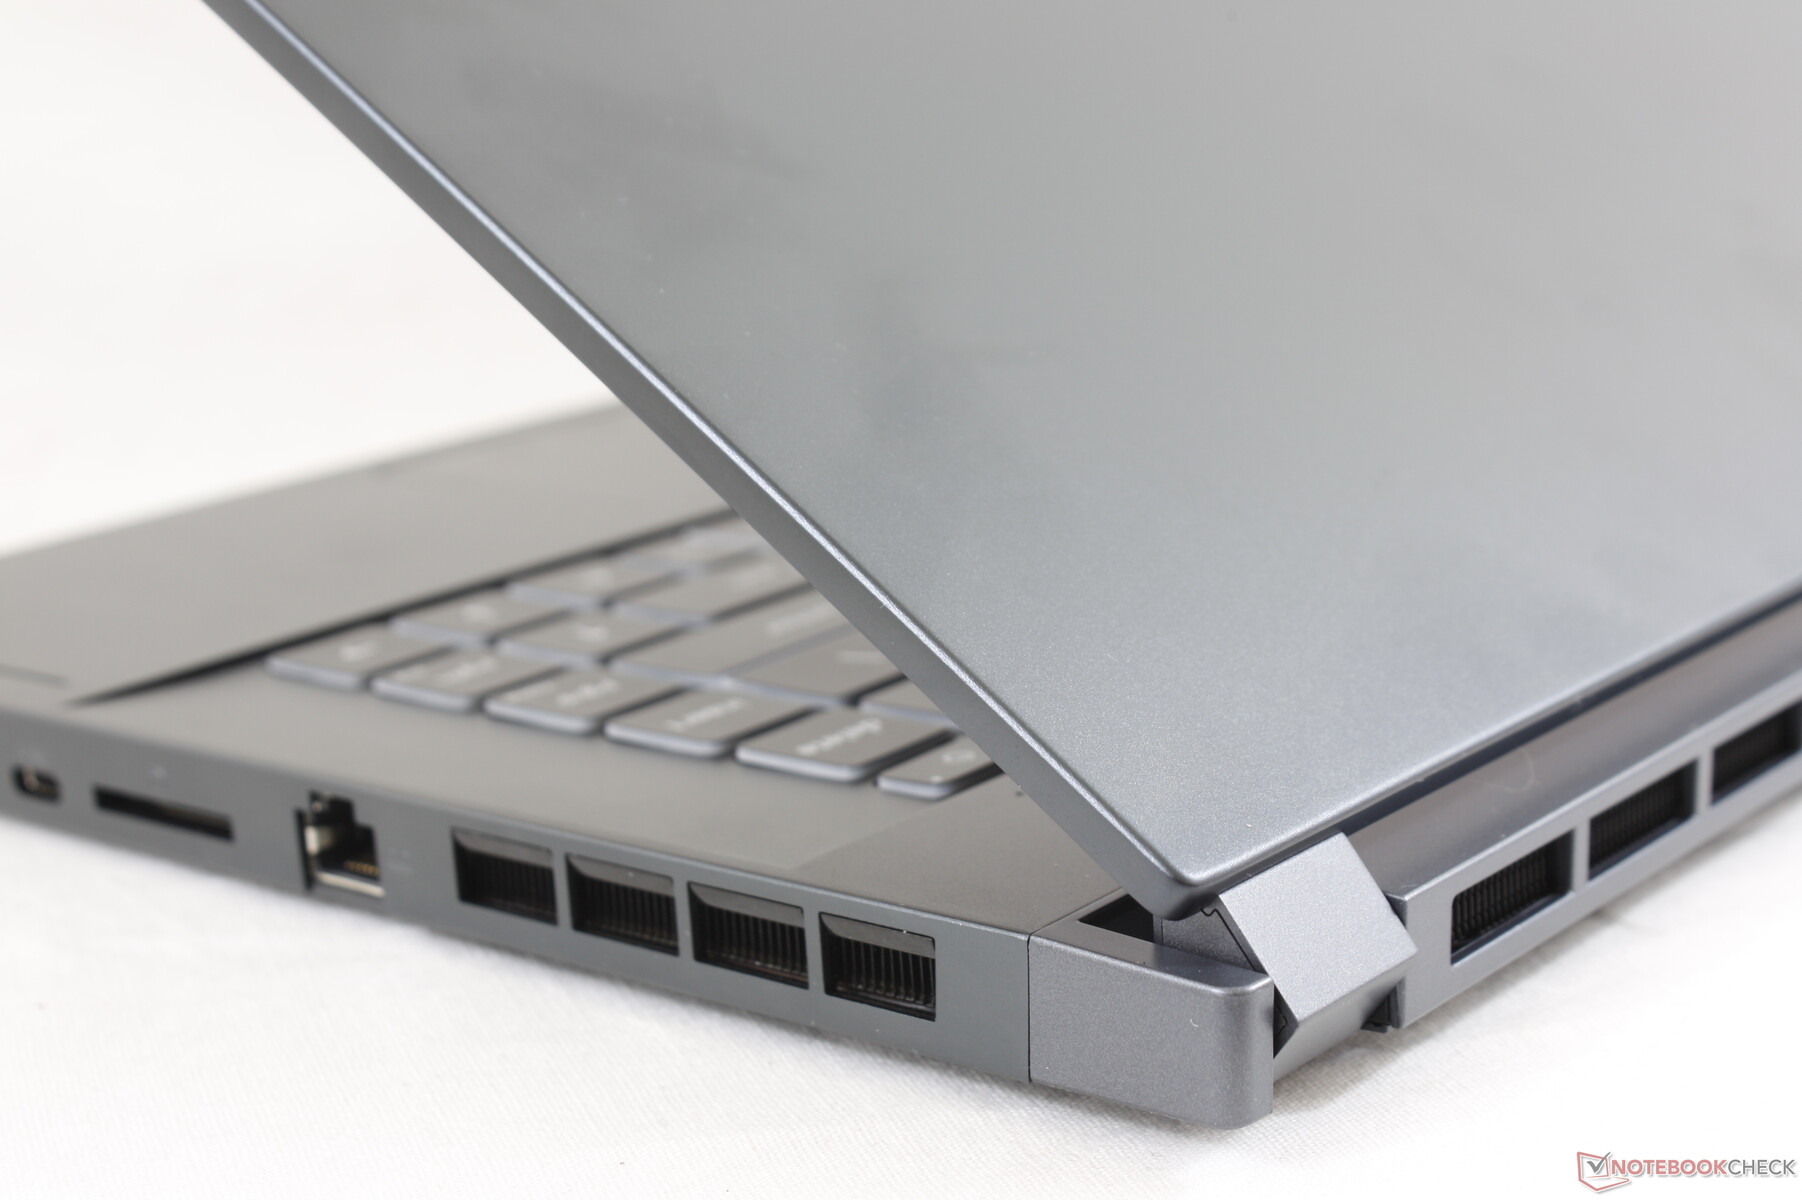
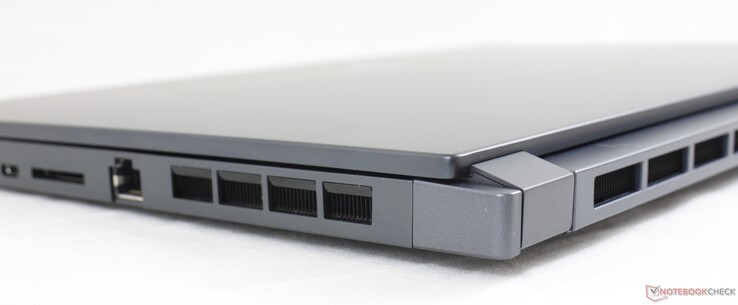
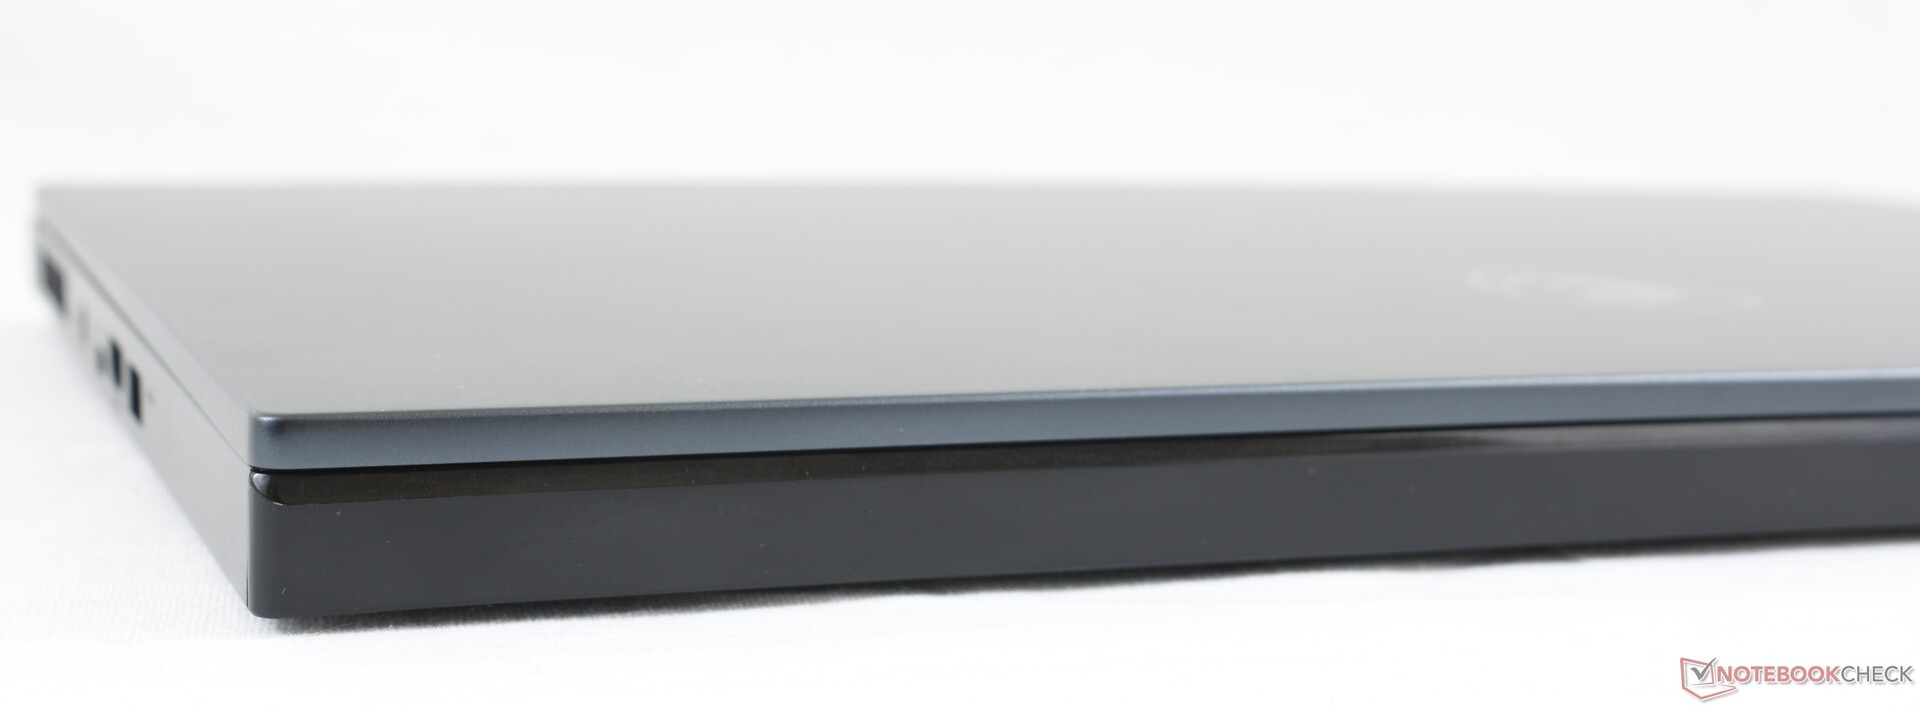
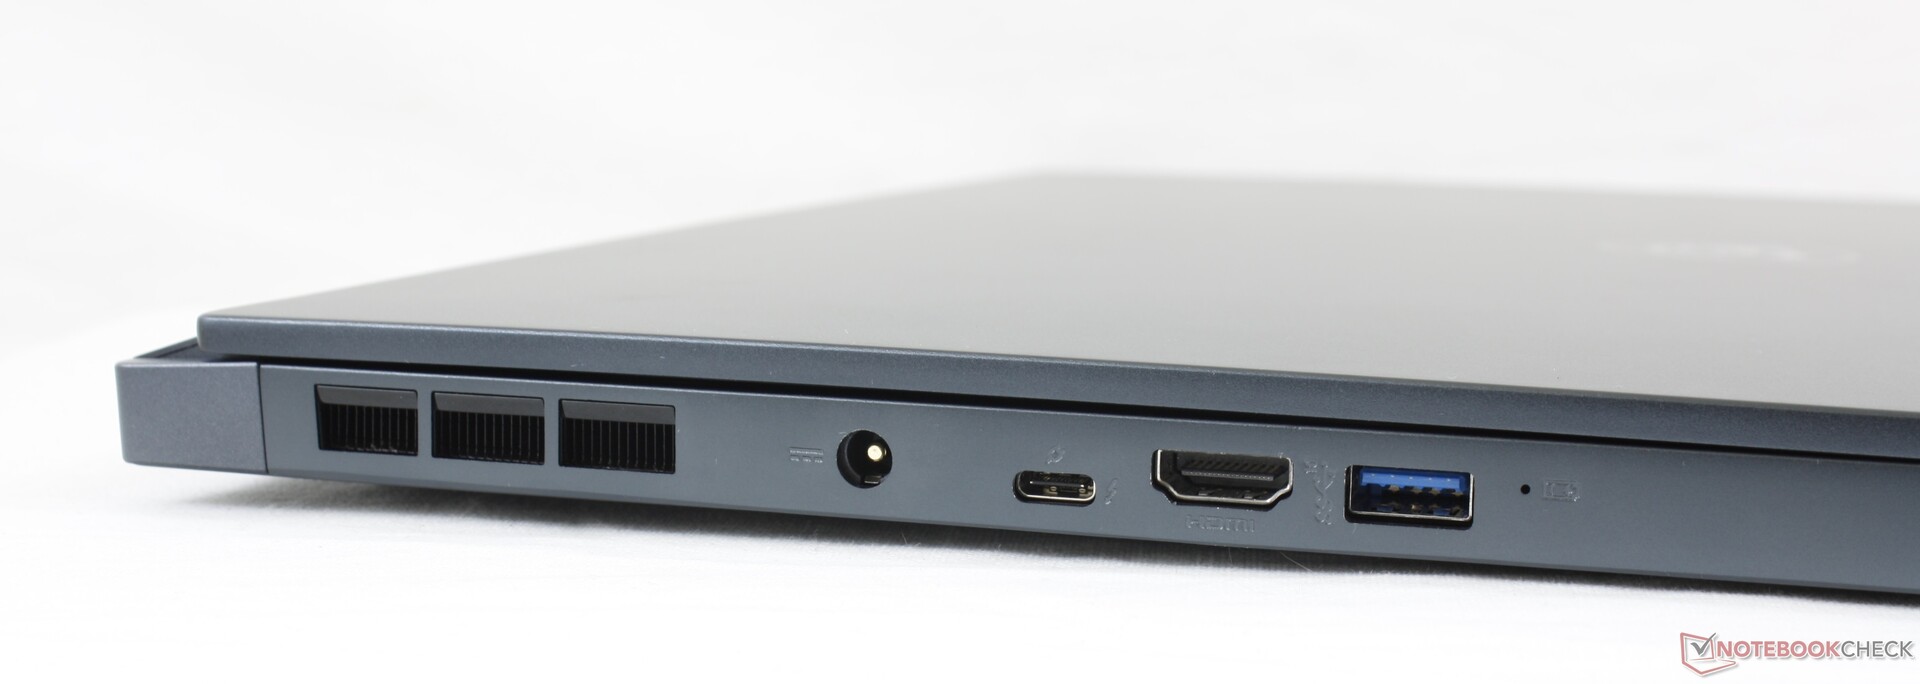
Anschlüsse
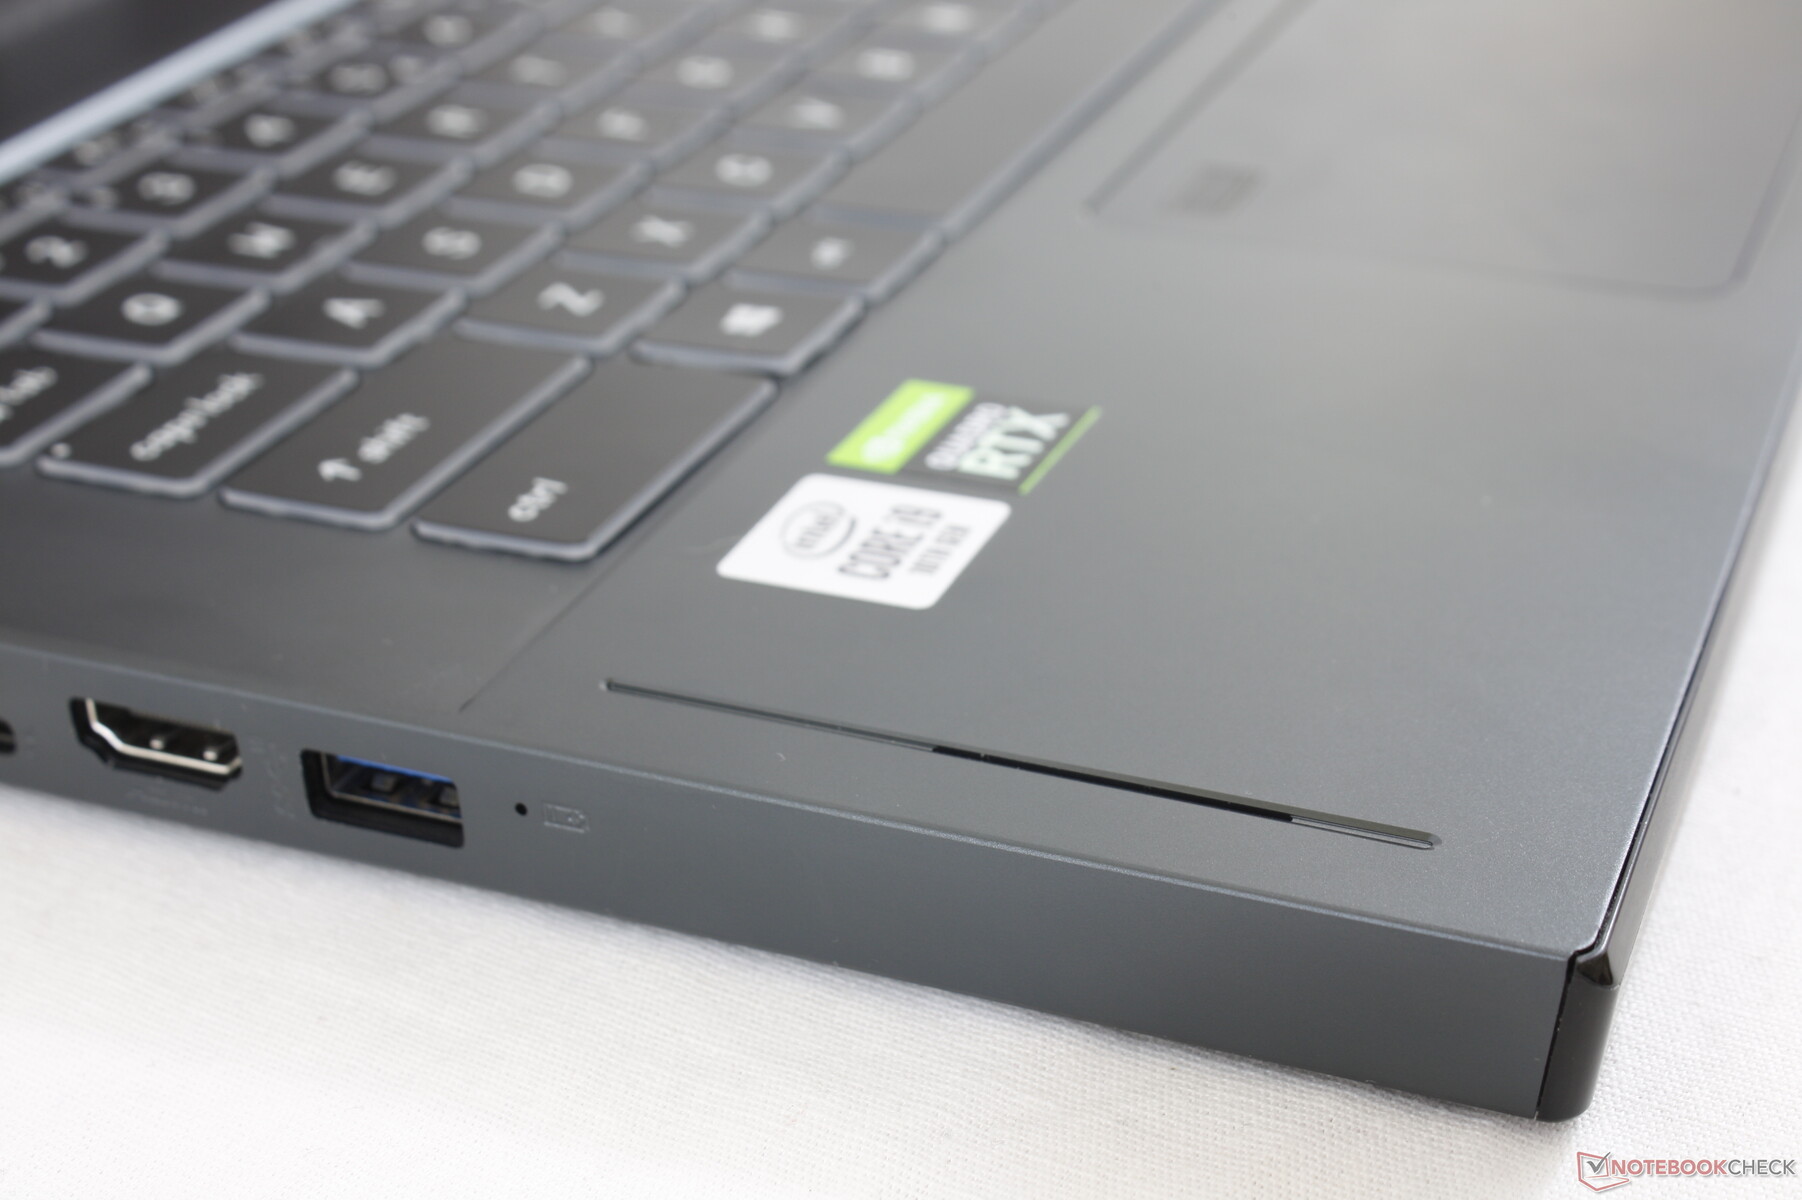
Ein Blick auf die USB-A-Ports macht die Unterschiede zum GS66 deutlich: Das WS66 hat nämlich nur einen USB-A-Anschluss, sein Gaming-Bruder besitzt drei! Dafür erhält das WS66 einen vollwertigen SD-Reader.
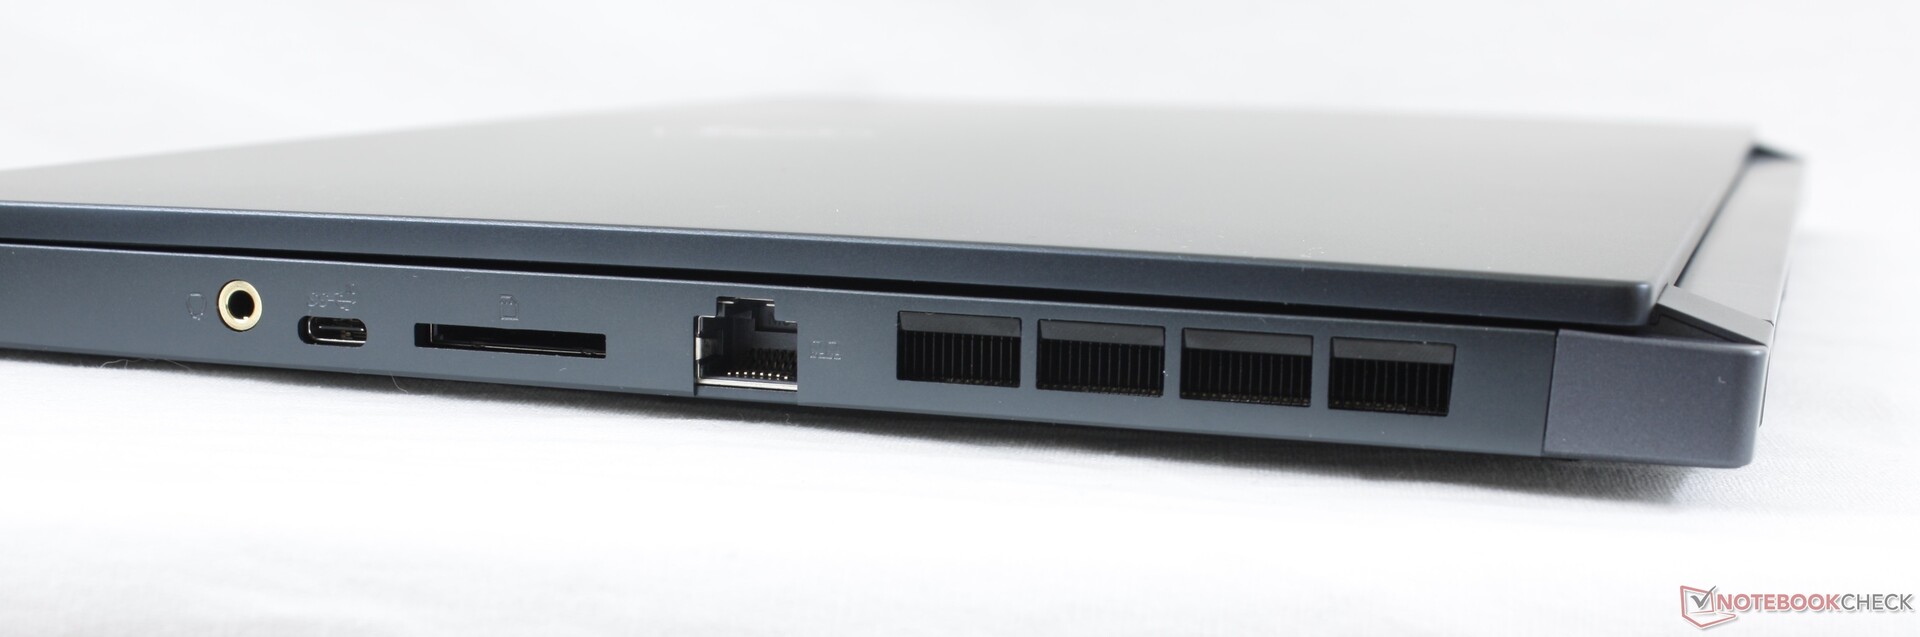
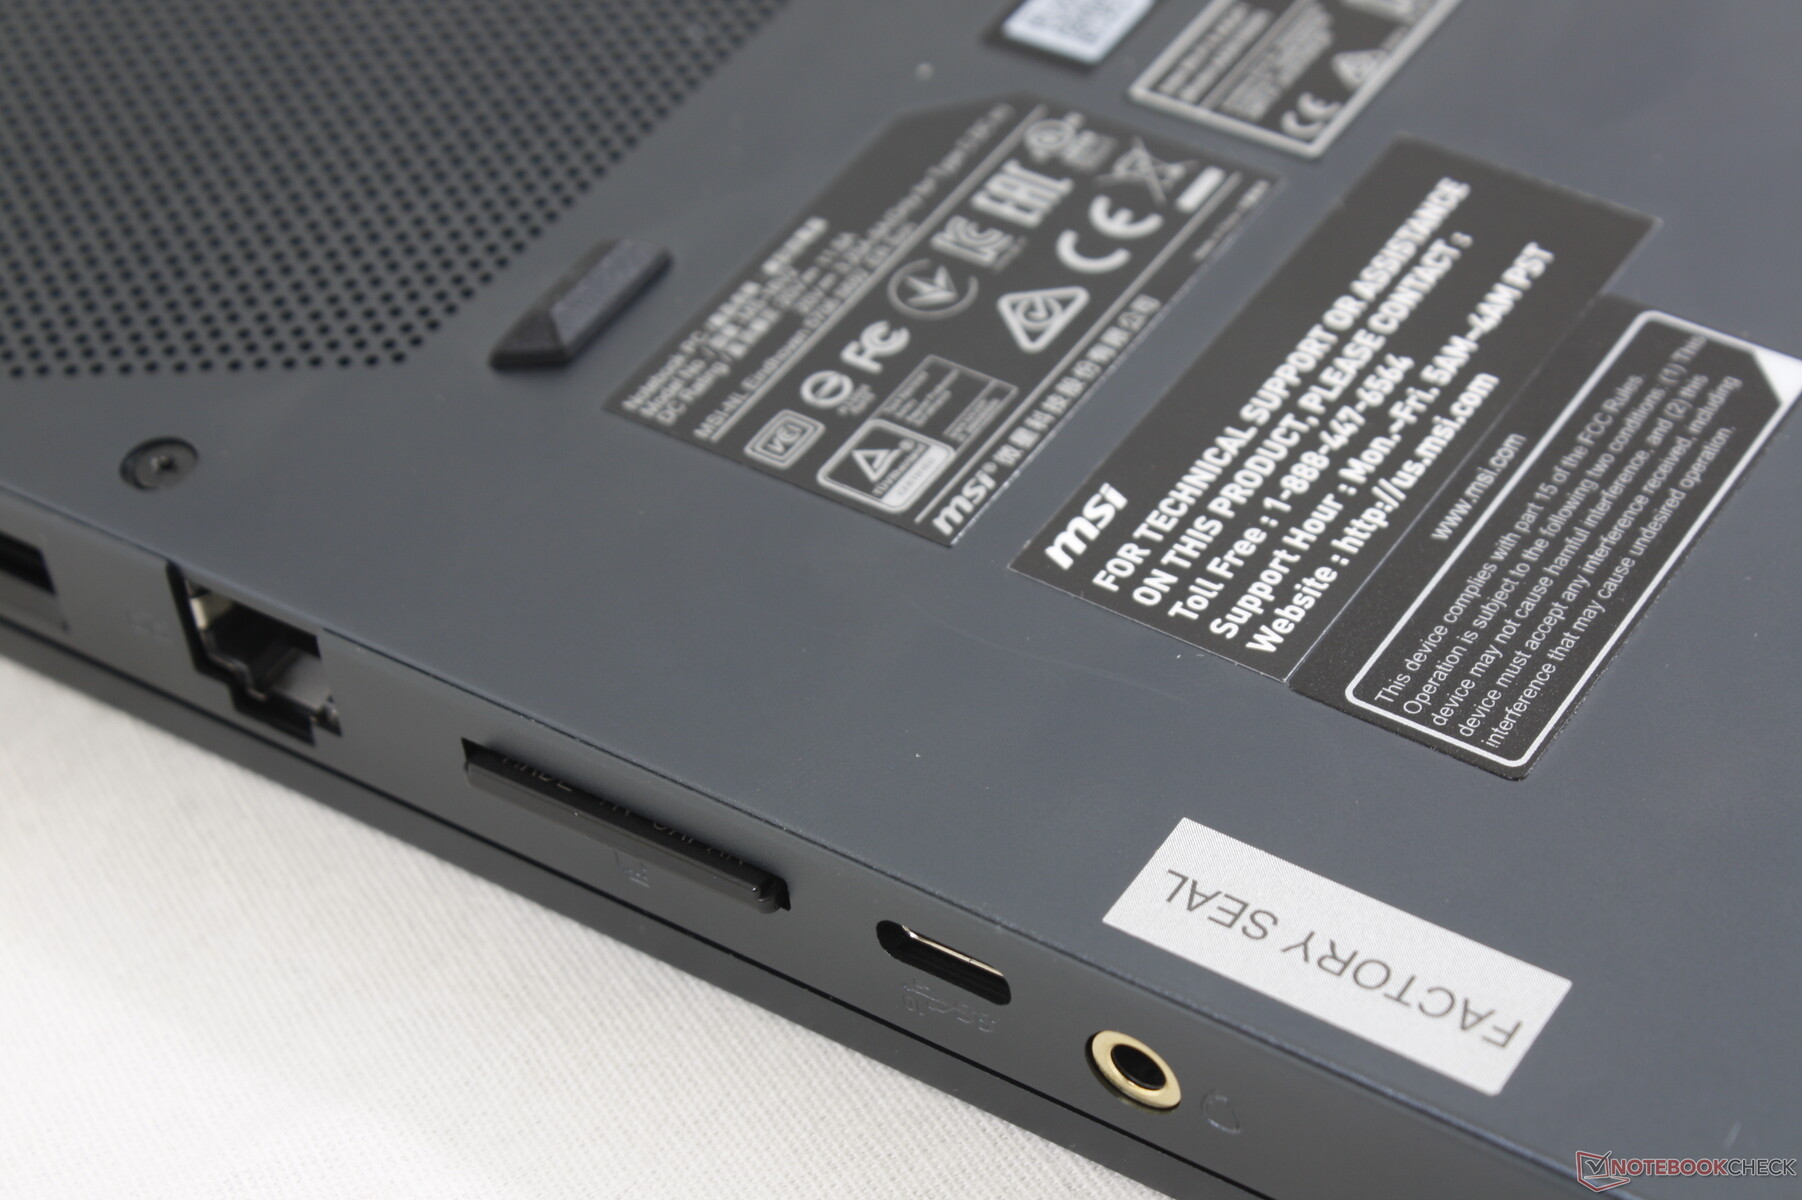
SD-Kartenleser
Die Übertragungsraten des SD-Readers sind extrem hoch. Es dauert nicht einmal 5 Sekunden, um 1 GB an Bildern von unserer UHS-II-Testspeicherkarte auf den Desktop zu befördern. Das MSI WE75 braucht dafür ganze 40 Sekunden!
| SD Card Reader | |
| average JPG Copy Test (av. of 3 runs) | |
| MSI WS66 10TMT-207US (Toshiba Exceria Pro SDXC 64 GB UHS-II) | |
| Razer Blade 15 RTX 2070 Super Max-Q (Toshiba Exceria Pro SDXC 64 GB UHS-II) | |
| Dell Precision 5550 P91F (Toshiba Exceria Pro SDXC 64 GB UHS-II) | |
| Dell Precision 7550 (Toshiba Exceria Pro SDXC 64 GB UHS-II) | |
| MSI WS63VR 7RL-023US | |
| MSI WE75 9TK (Toshiba Exceria Pro SDXC 64 GB UHS-II) | |
| maximum AS SSD Seq Read Test (1GB) | |
| MSI WS63VR 7RL-023US | |
| MSI WS66 10TMT-207US (Toshiba Exceria Pro SDXC 64 GB UHS-II) | |
| Razer Blade 15 RTX 2070 Super Max-Q (Toshiba Exceria Pro SDXC 64 GB UHS-II) | |
| Dell Precision 5550 P91F (Toshiba Exceria Pro SDXC 64 GB UHS-II) | |
| Dell Precision 7550 (Toshiba Exceria Pro SDXC 64 GB UHS-II) | |
| MSI WE75 9TK (Toshiba Exceria Pro SDXC 64 GB UHS-II) | |
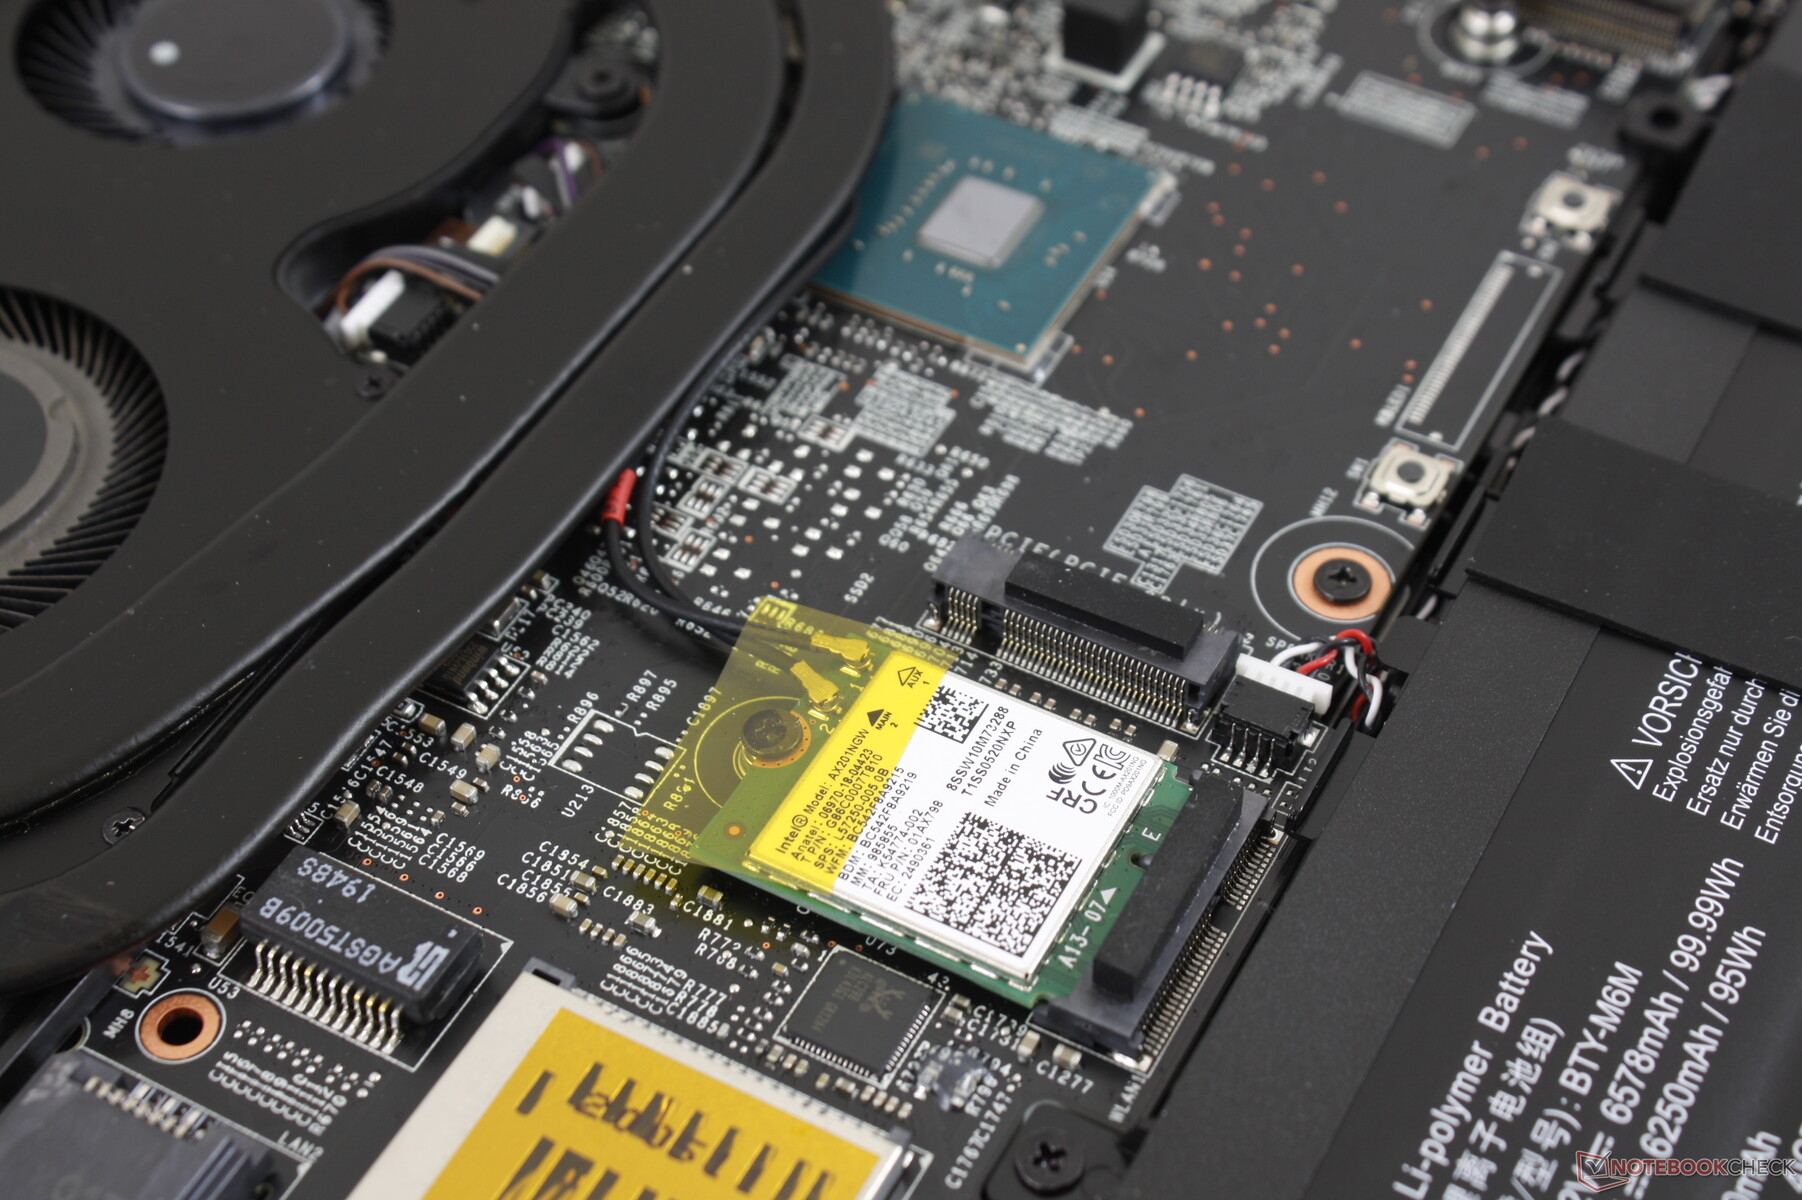
Kommunikation
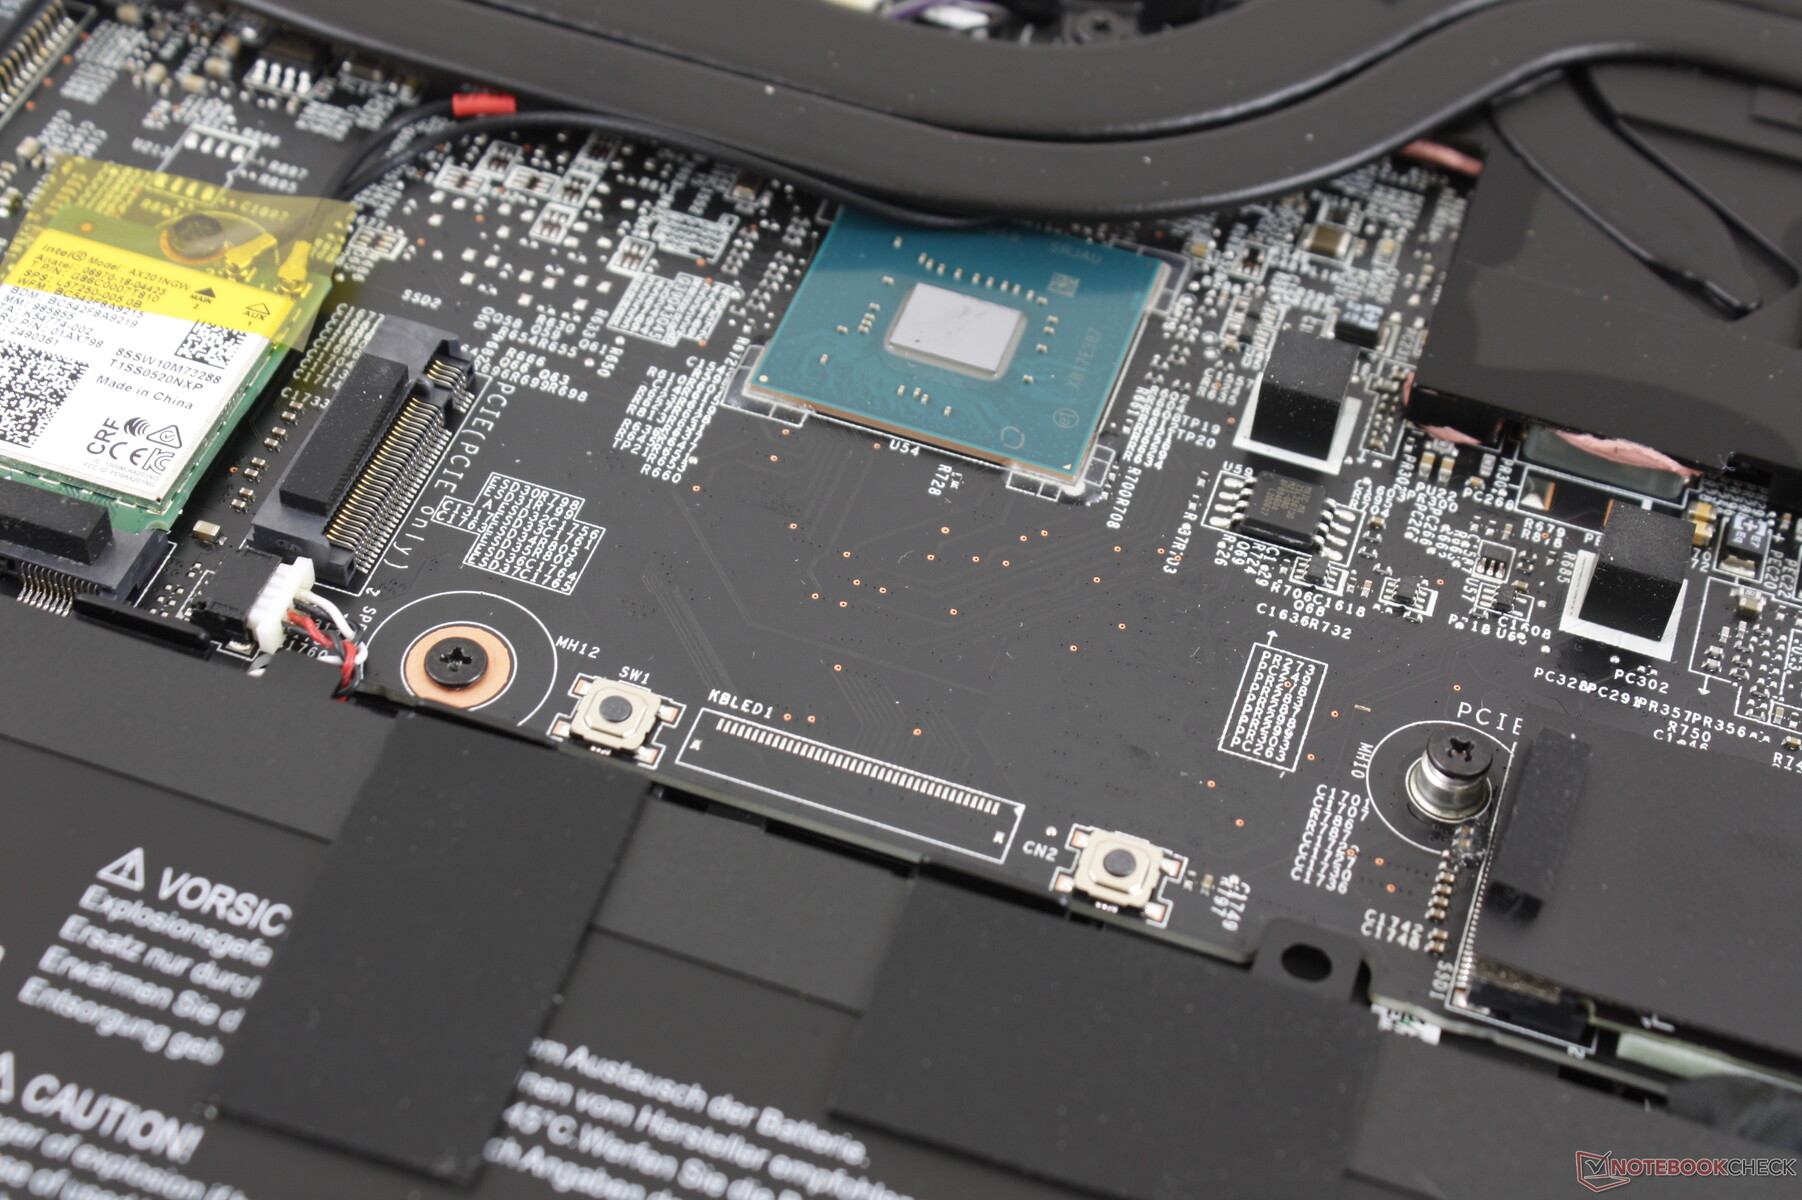
Standardmäßig ist eine Intel AX201 mit WiFi 6 und Bluetooth 5.1 verbaut. Interessanterweise sind die Empfangsraten bei 900 Mbps limitiert, obwohl hier deutlich mehr möglich wäre. In der Praxis haben wir ansonsten aber keine Probleme bei der Verbindung zu unserem Netgear-RAX200-Router feststellen können.
Webcam


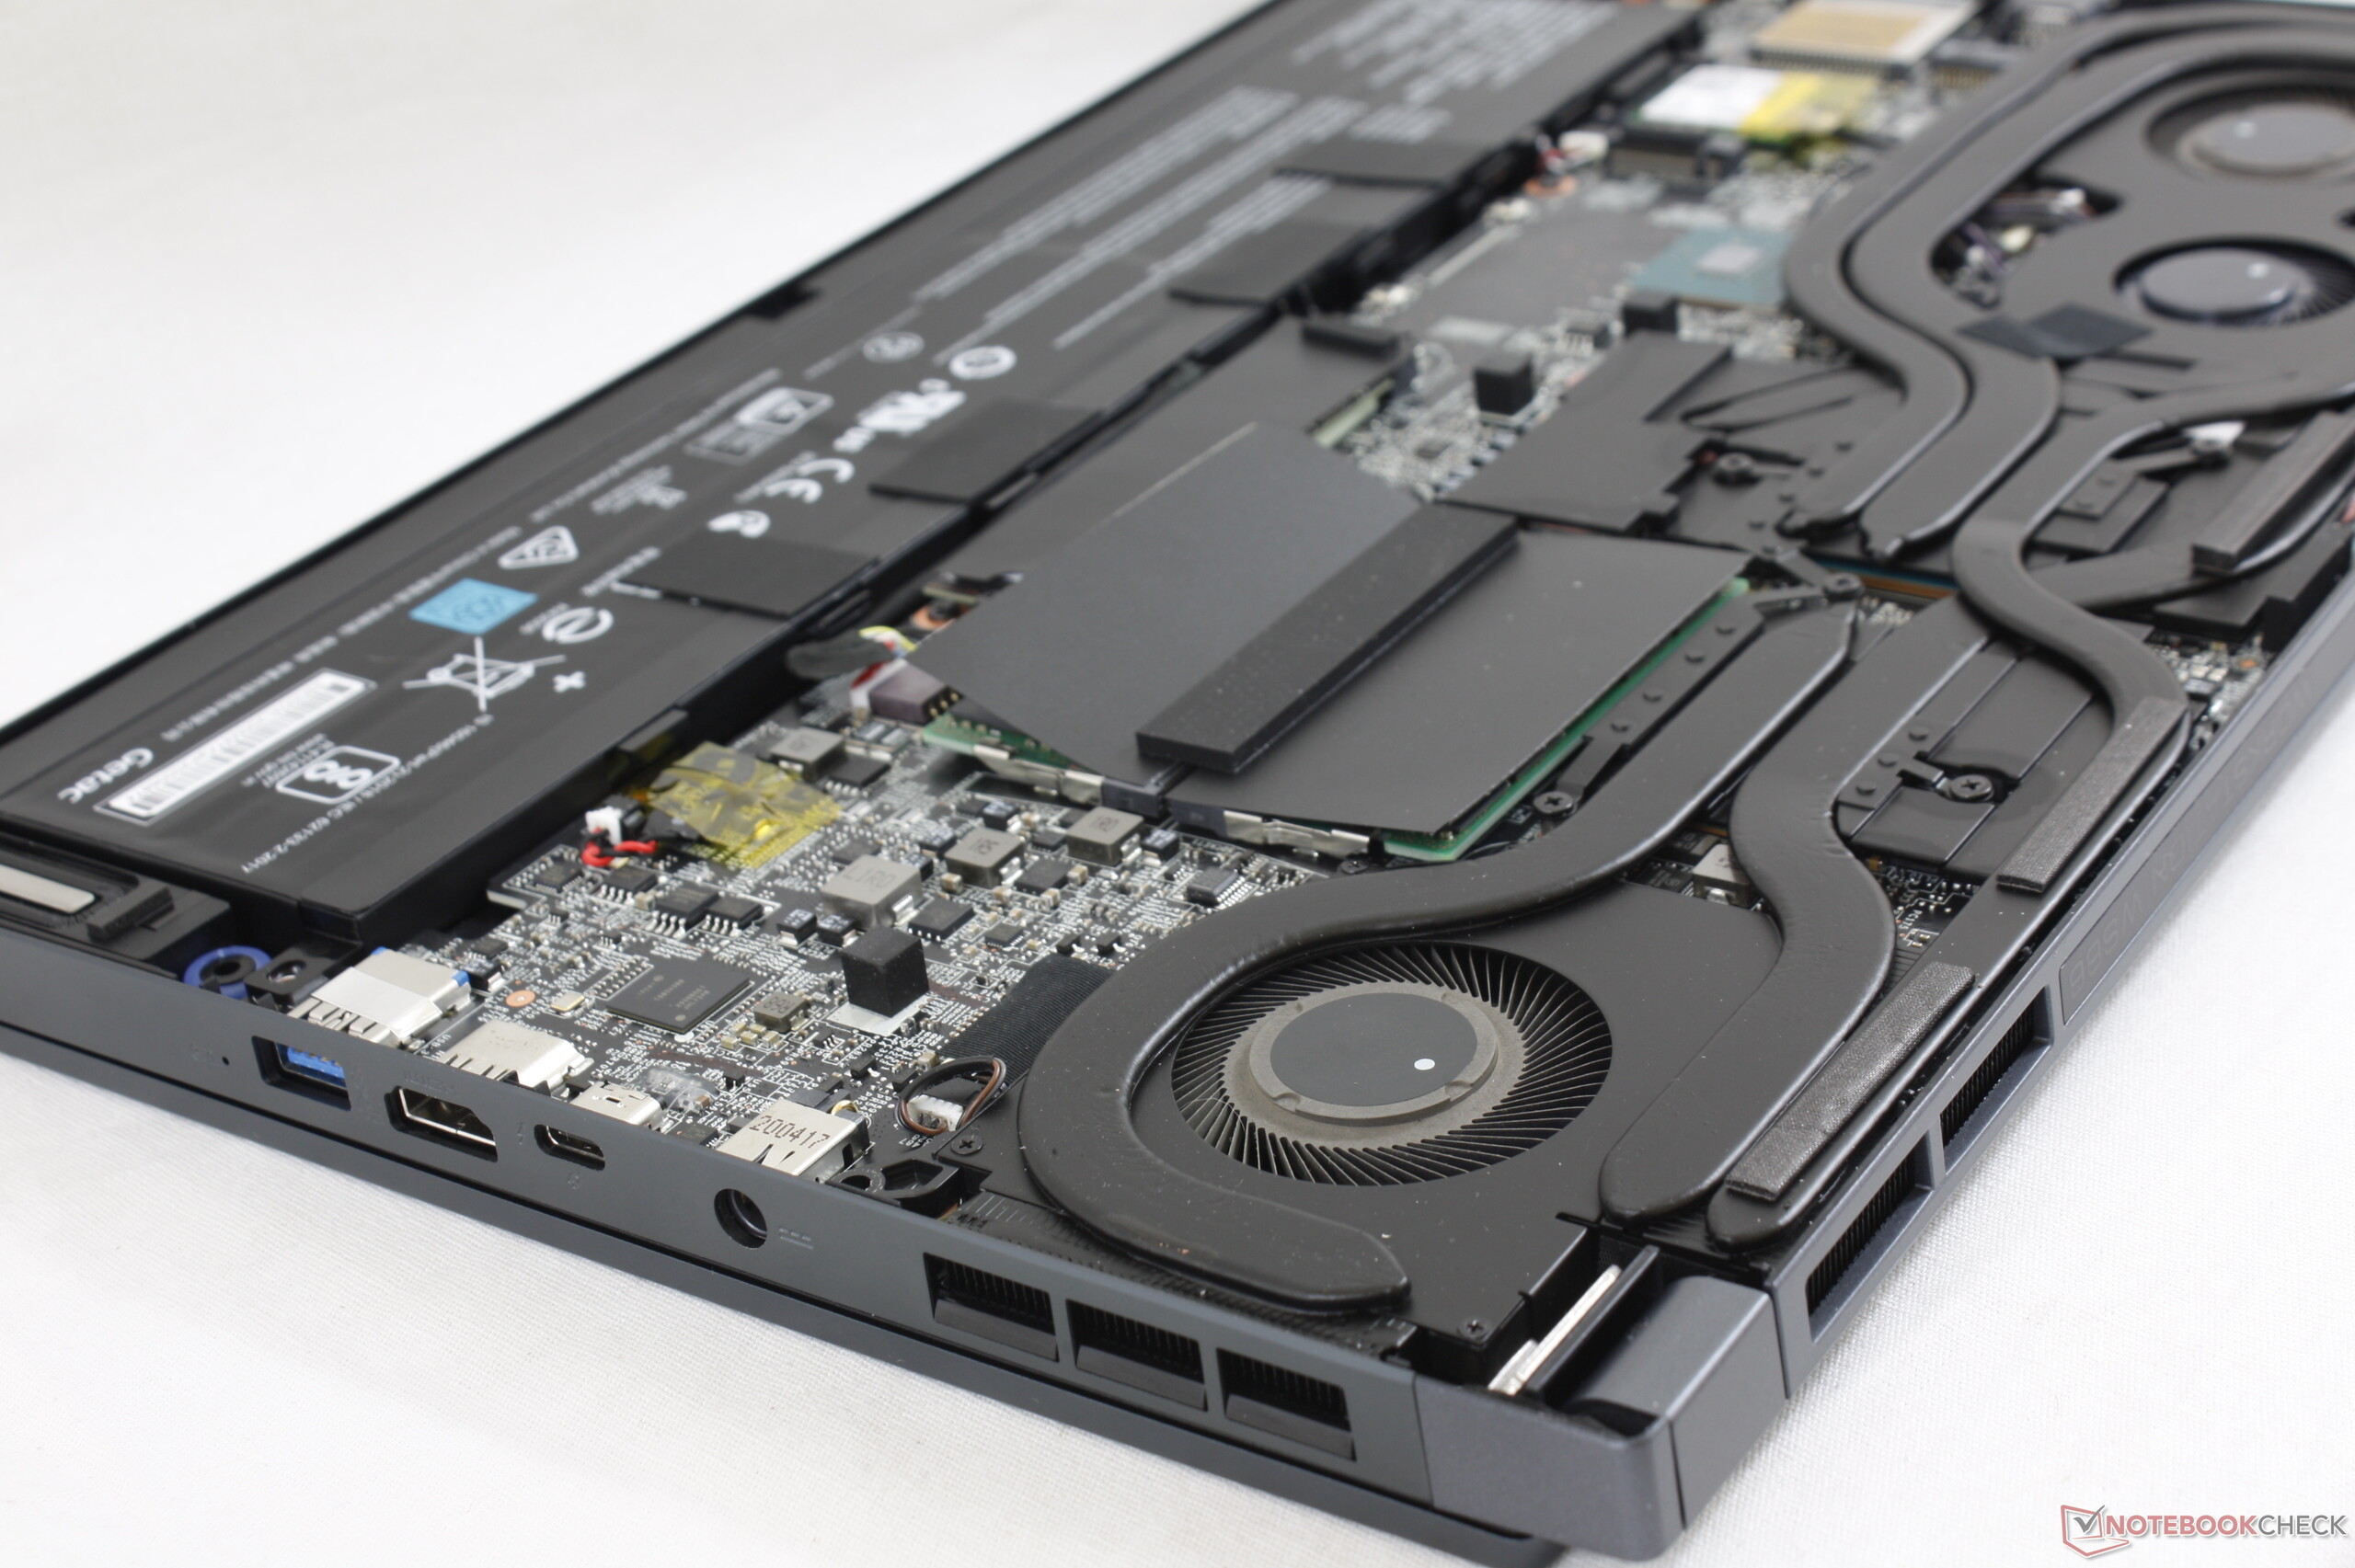
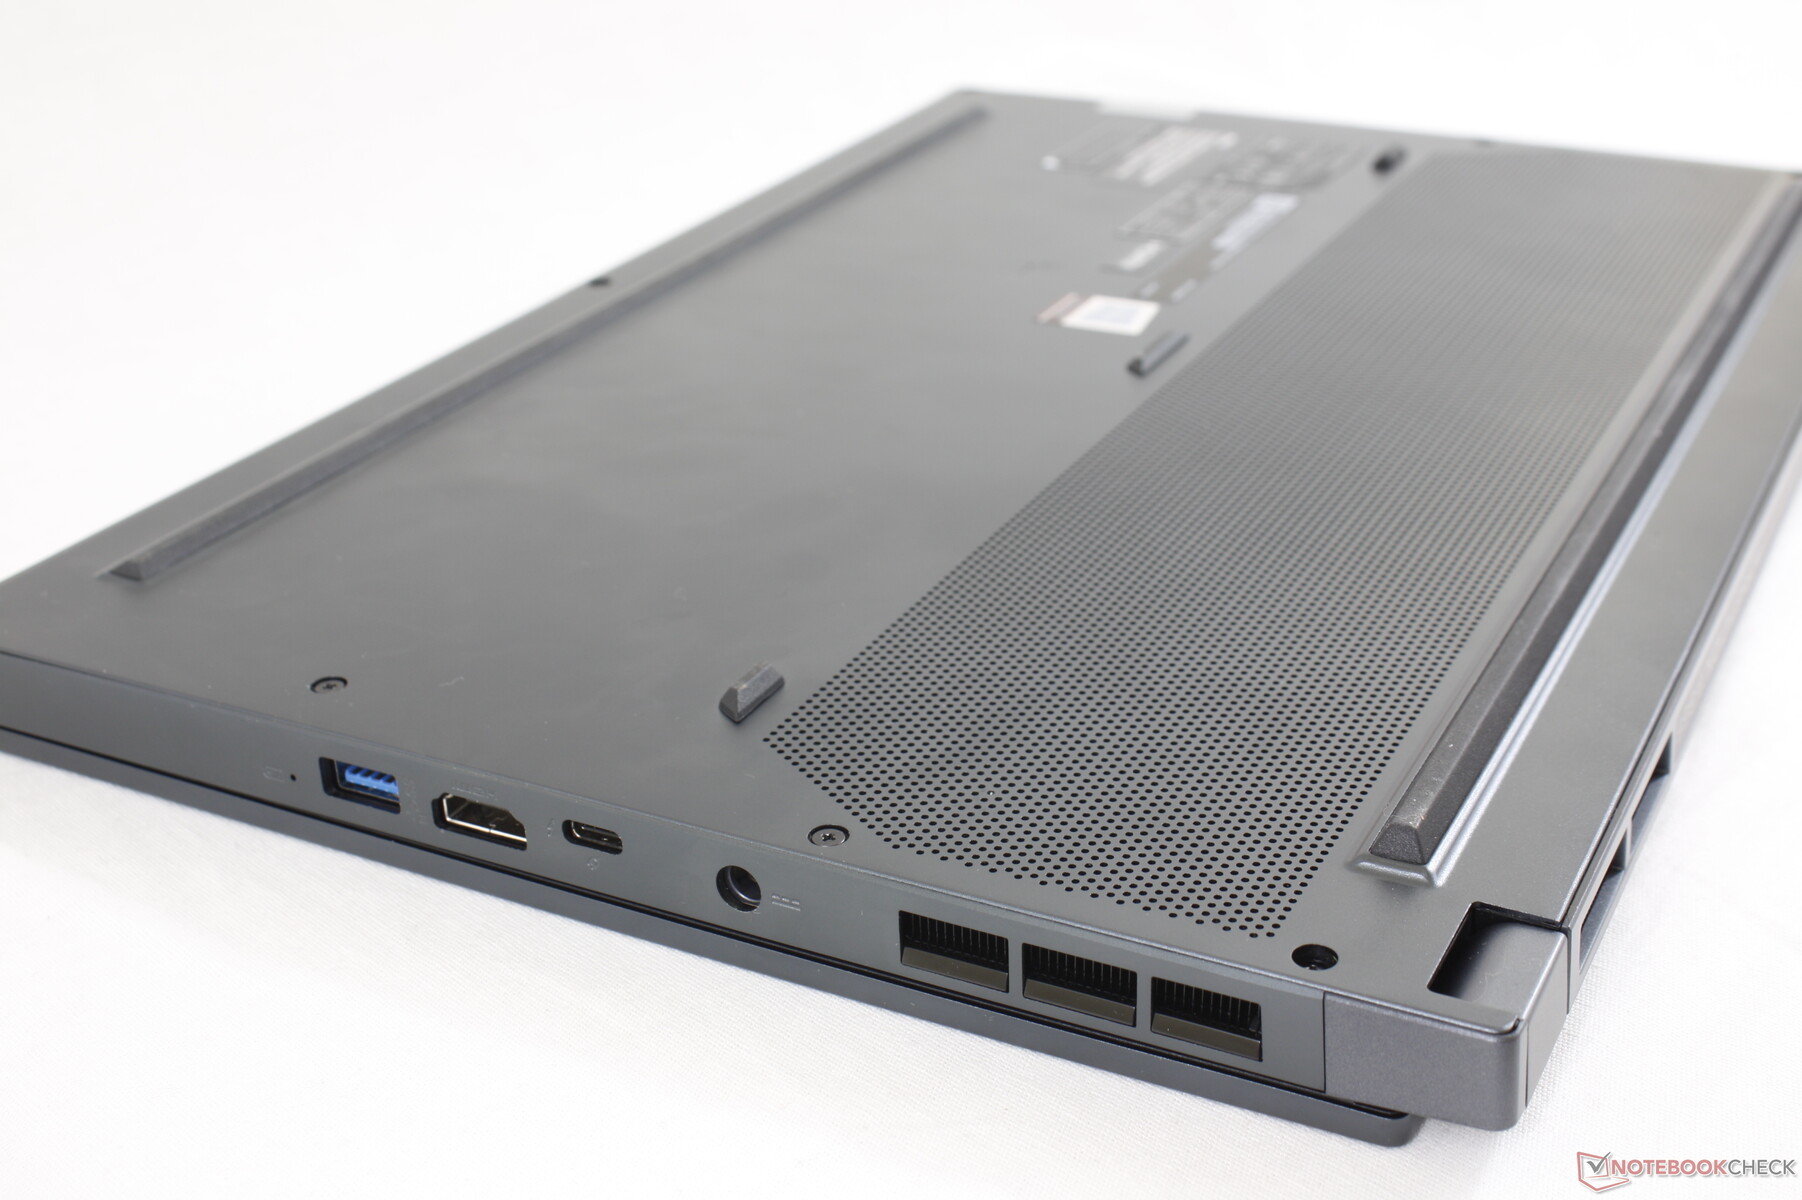
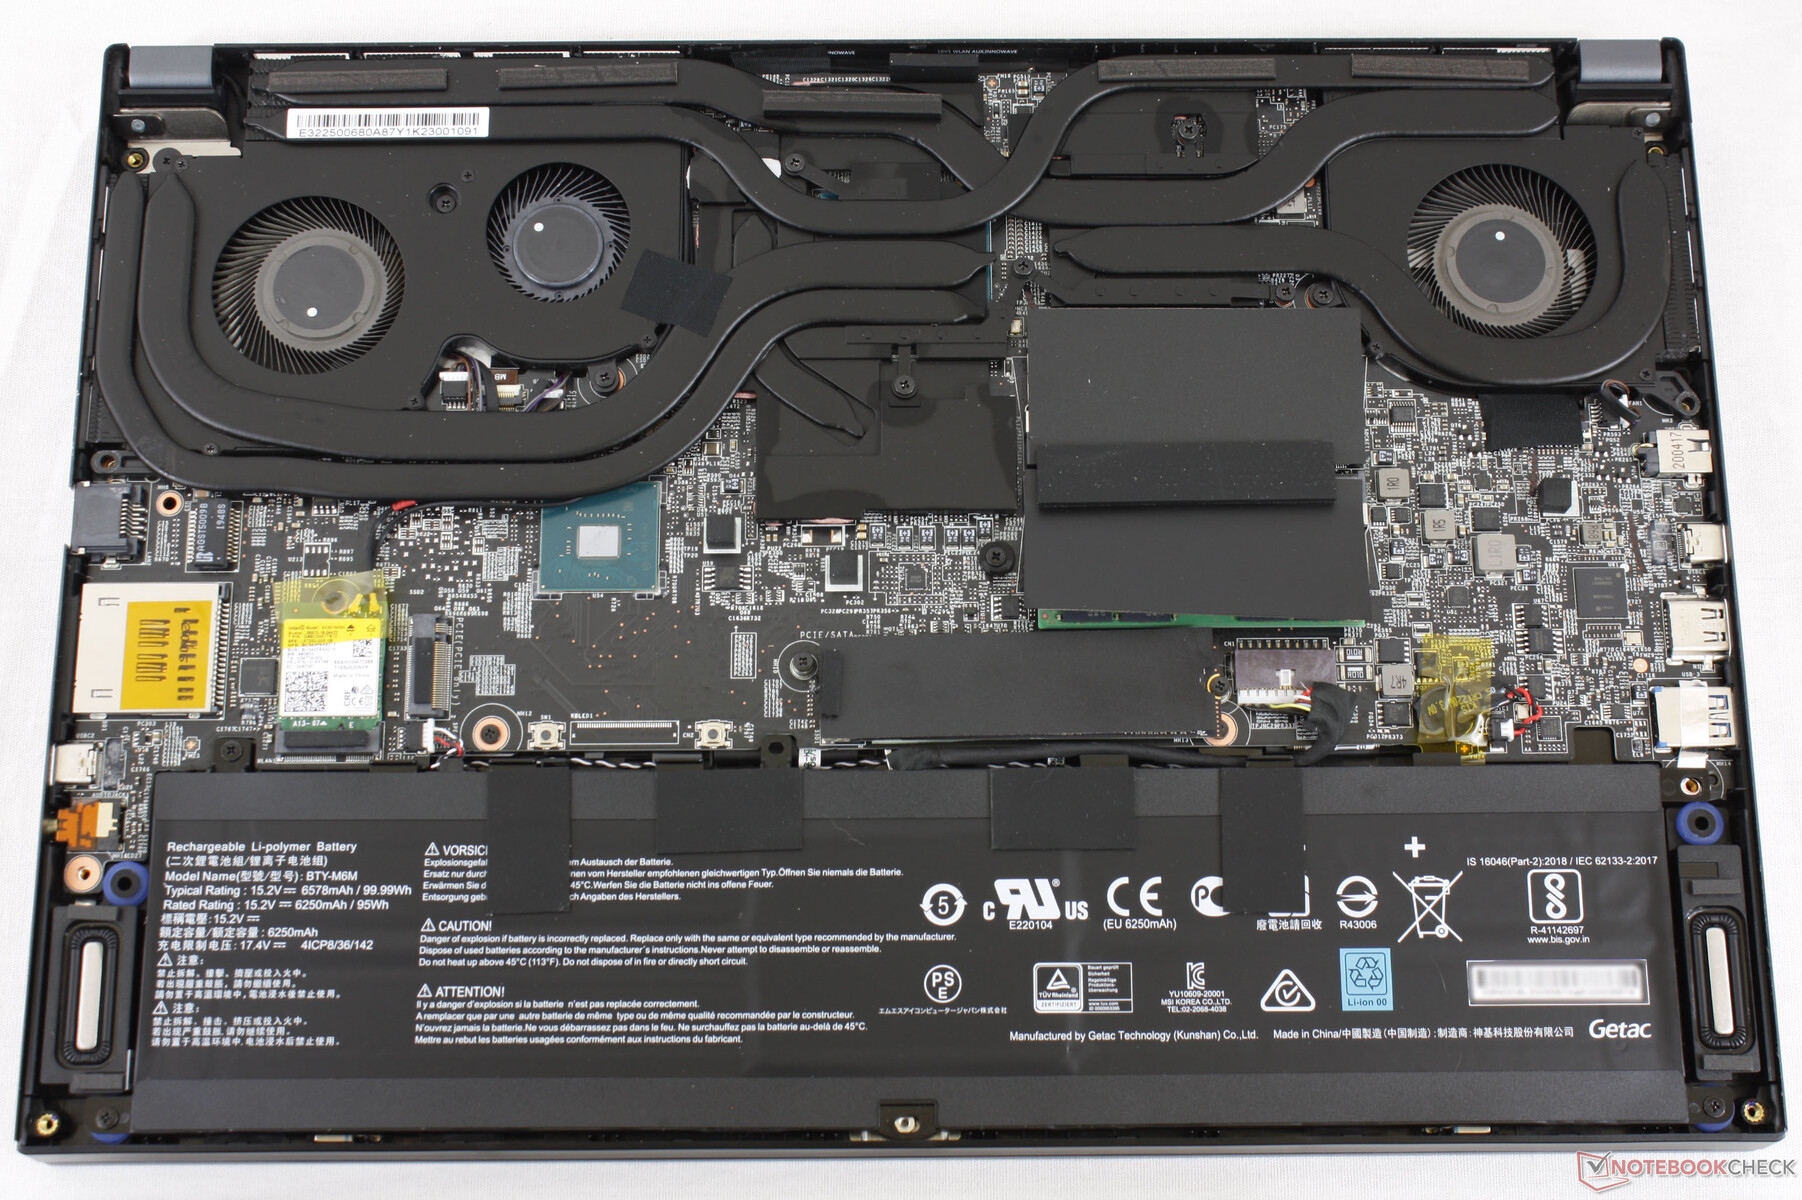
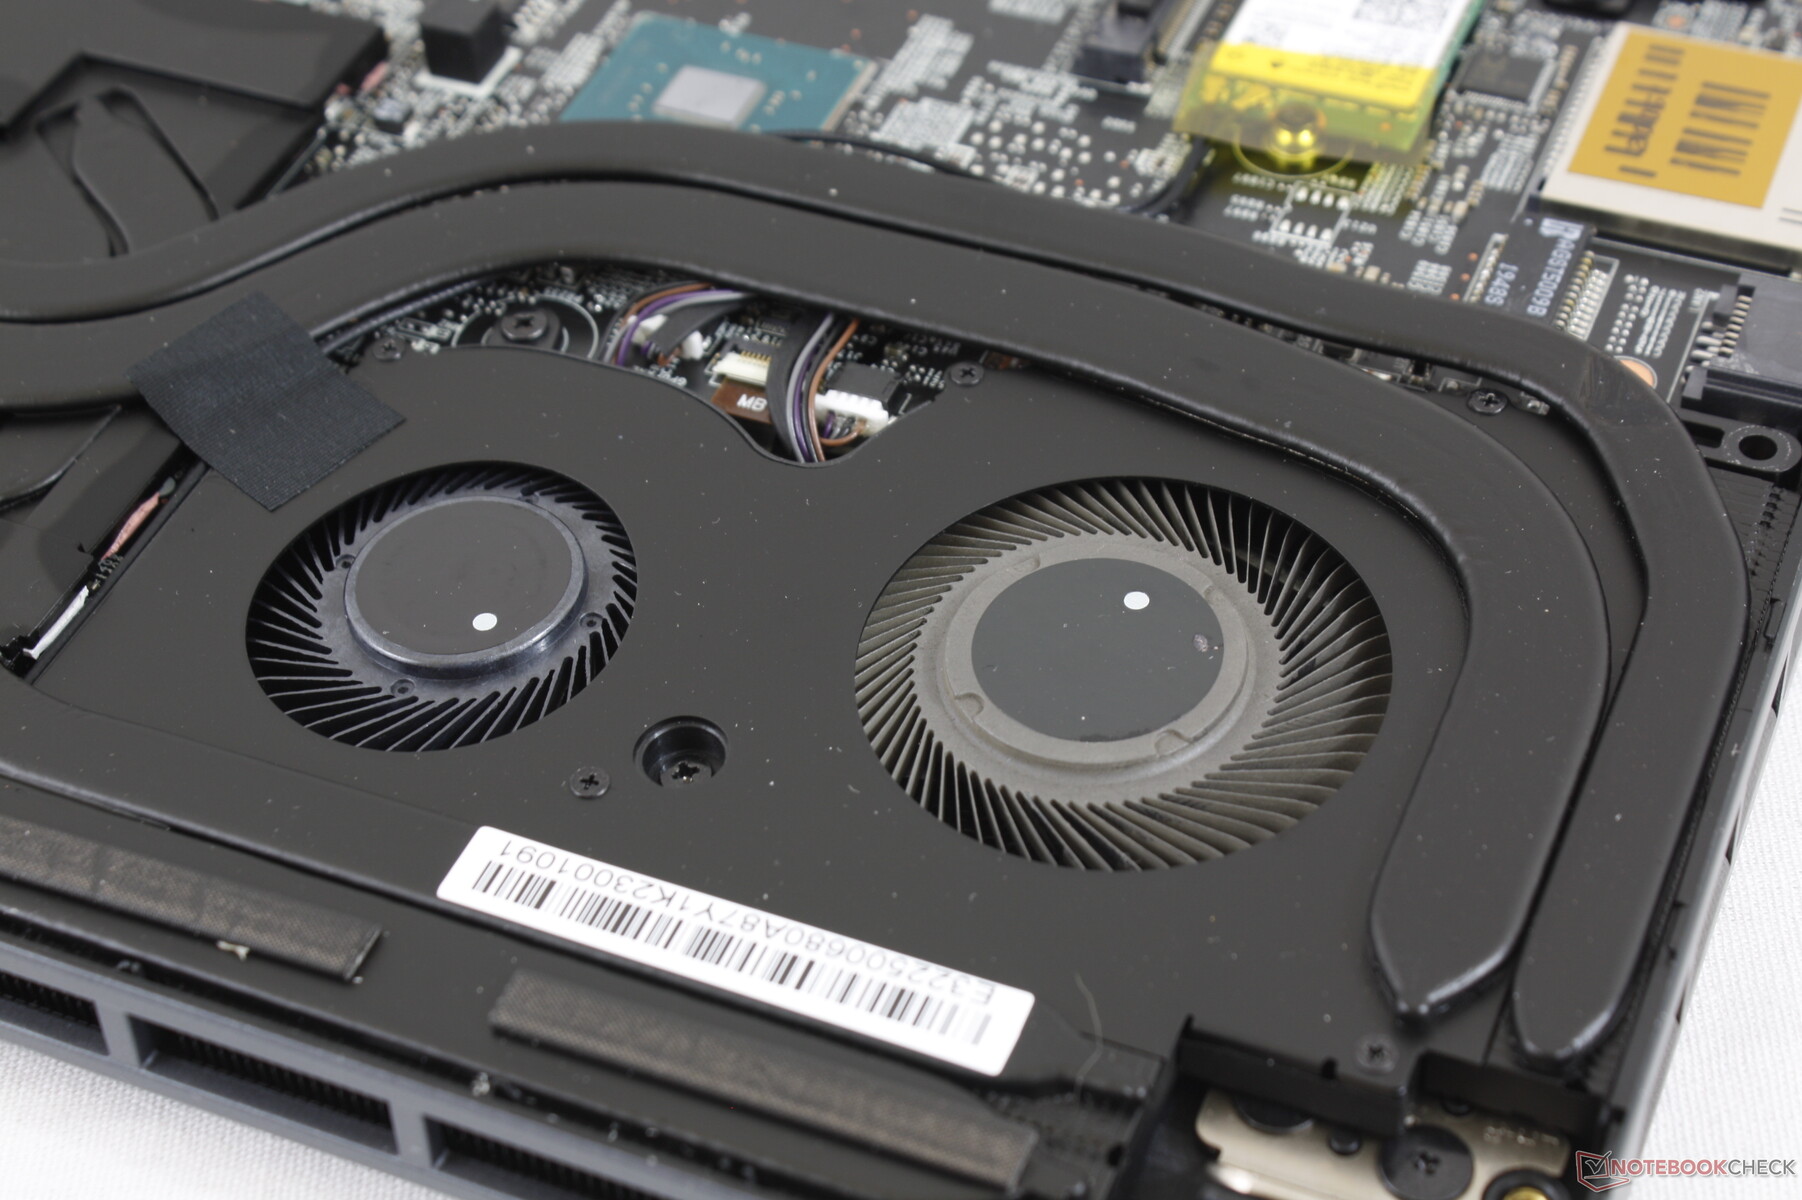
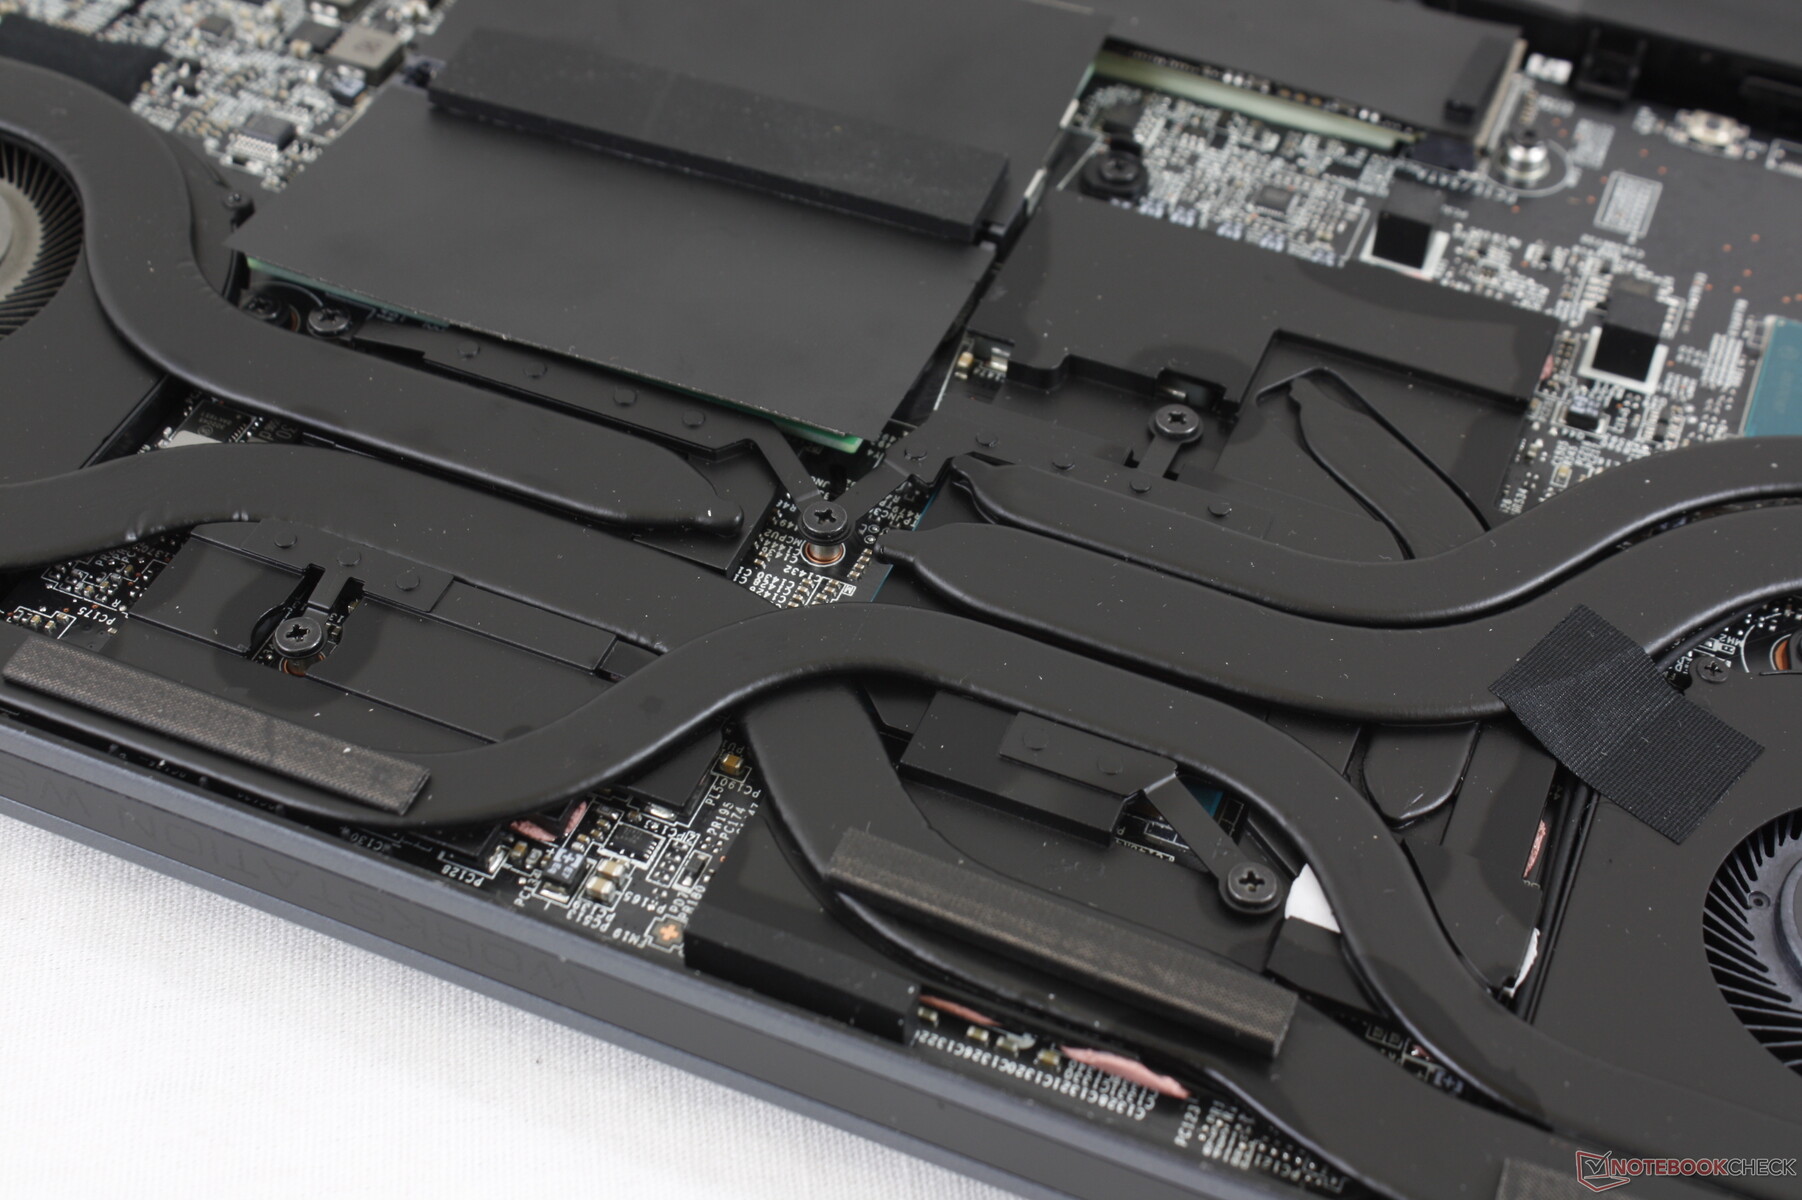
Wartung
Die Unterseite wird von 9 Philips-Schrauben gesichert. Das Entfernen ist knifflig, da die scharfen Kanten und Ecken im Vergleich zu den Bodenplatten eines WS63 oder Razer Blade 15 Studio fest mit dem Sockel verriegelt sind.
Zubehör und Garantie
Außer dem Netzteil und Papierkram liegen der Verpackung keine Extras bei. MSI bietet standardmäßig eine eingeschränkte 3-Jahres-Garantie an.
Eingabegeräte
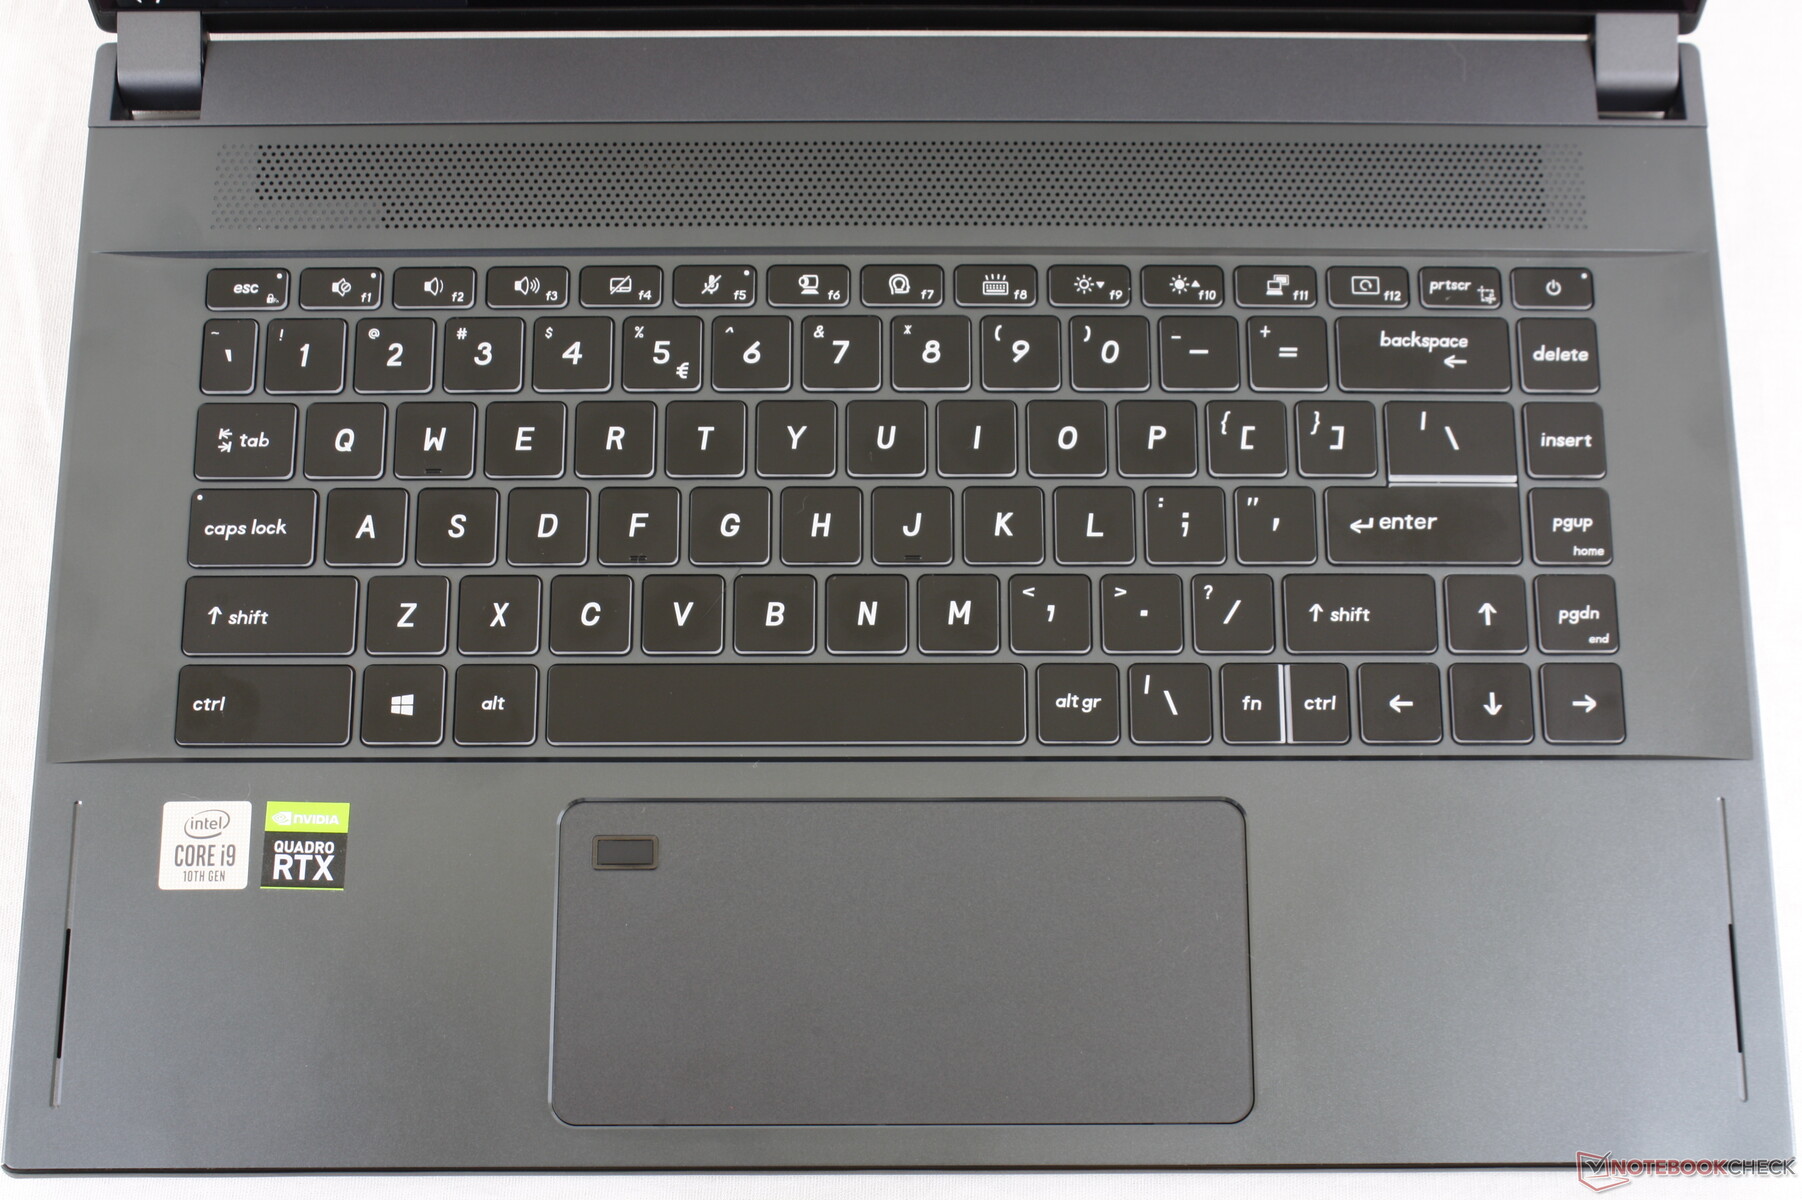
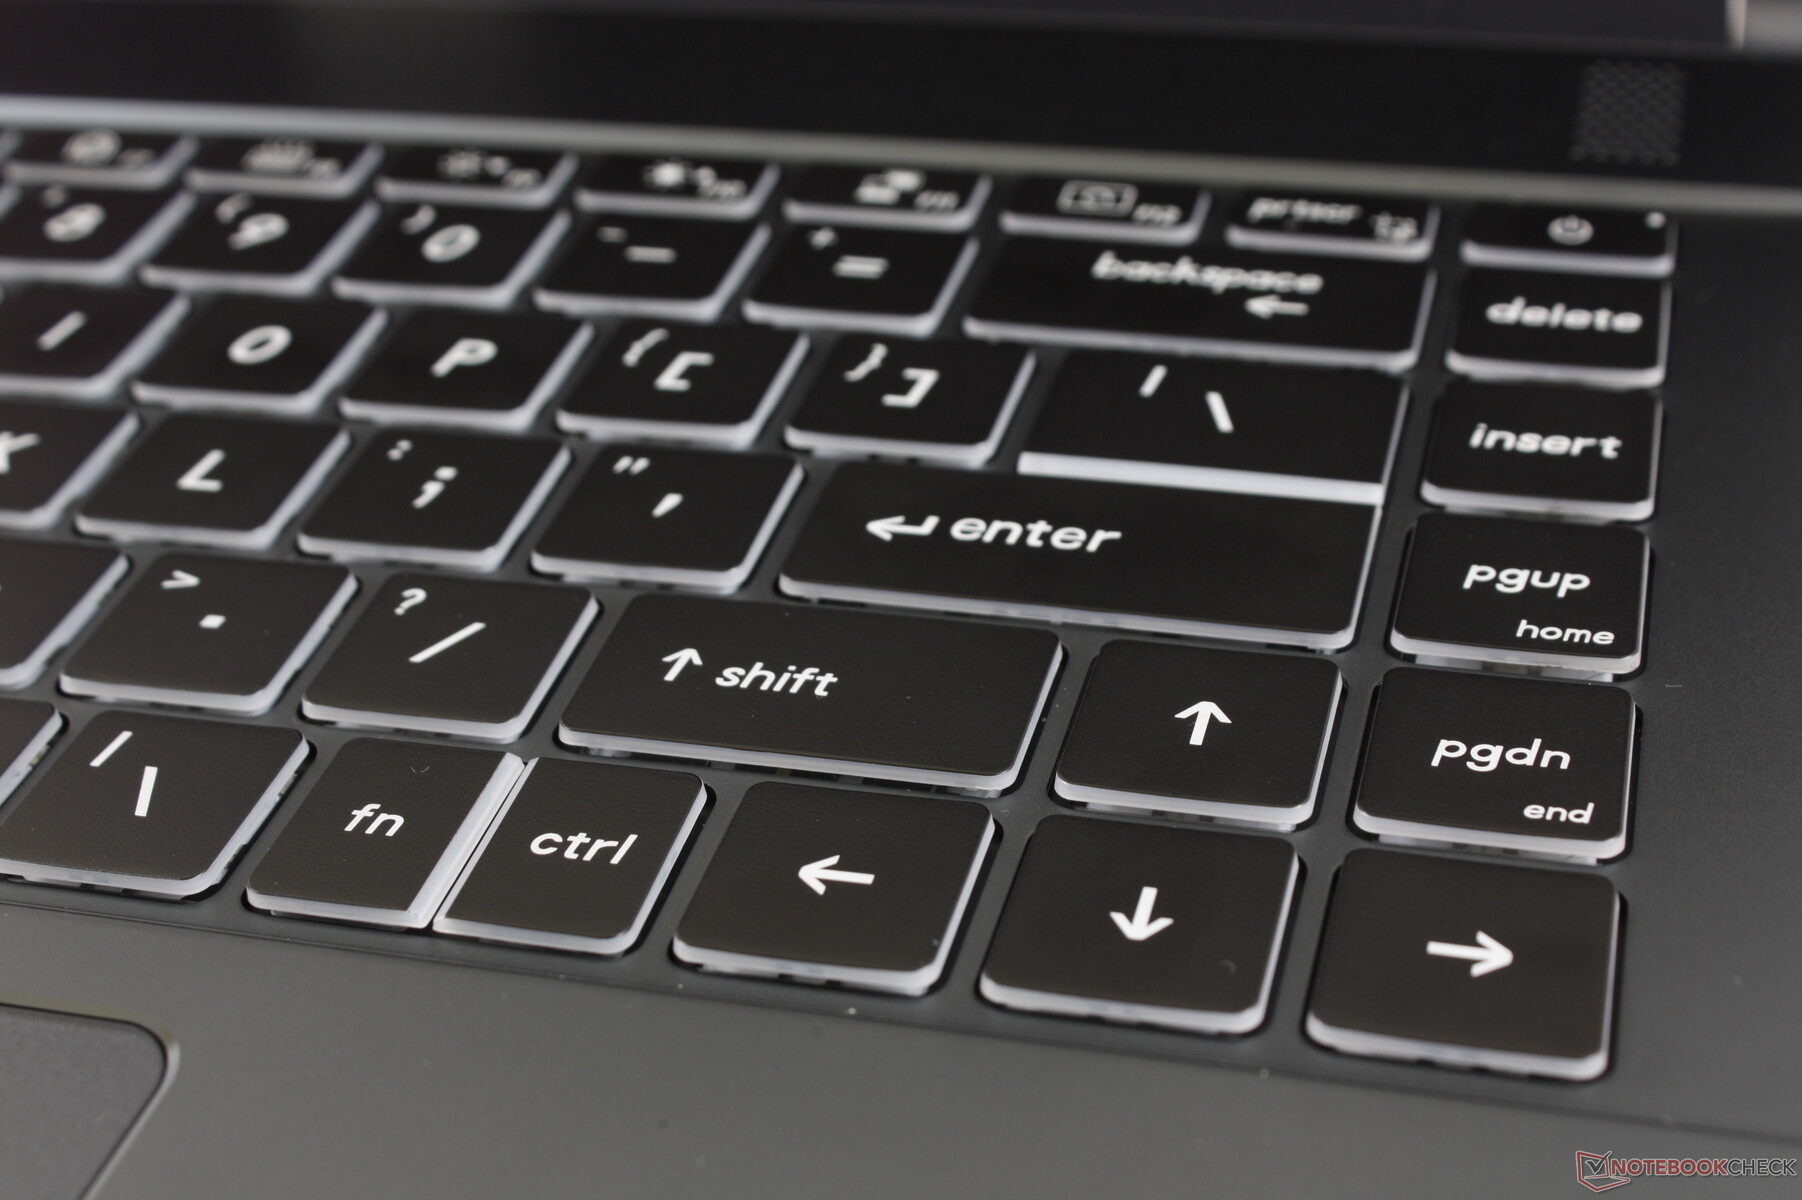
Tastatur
Das Layout und das Feedback der Tasten sind identisch zum GS66, mit allen Vor- und Nachteilen. Wir finden die Tasten zu seicht mit zu geringem Feedback, vor allem im Vergleich zu den überlegenen Tastaturen von MSIs eigener WE- oder WT-Serie. Wer sich allerdings bereits an die Tastaturen von Ultrabooks gewöhnt hat, wird mit dem WS66 keine Probleme haben.
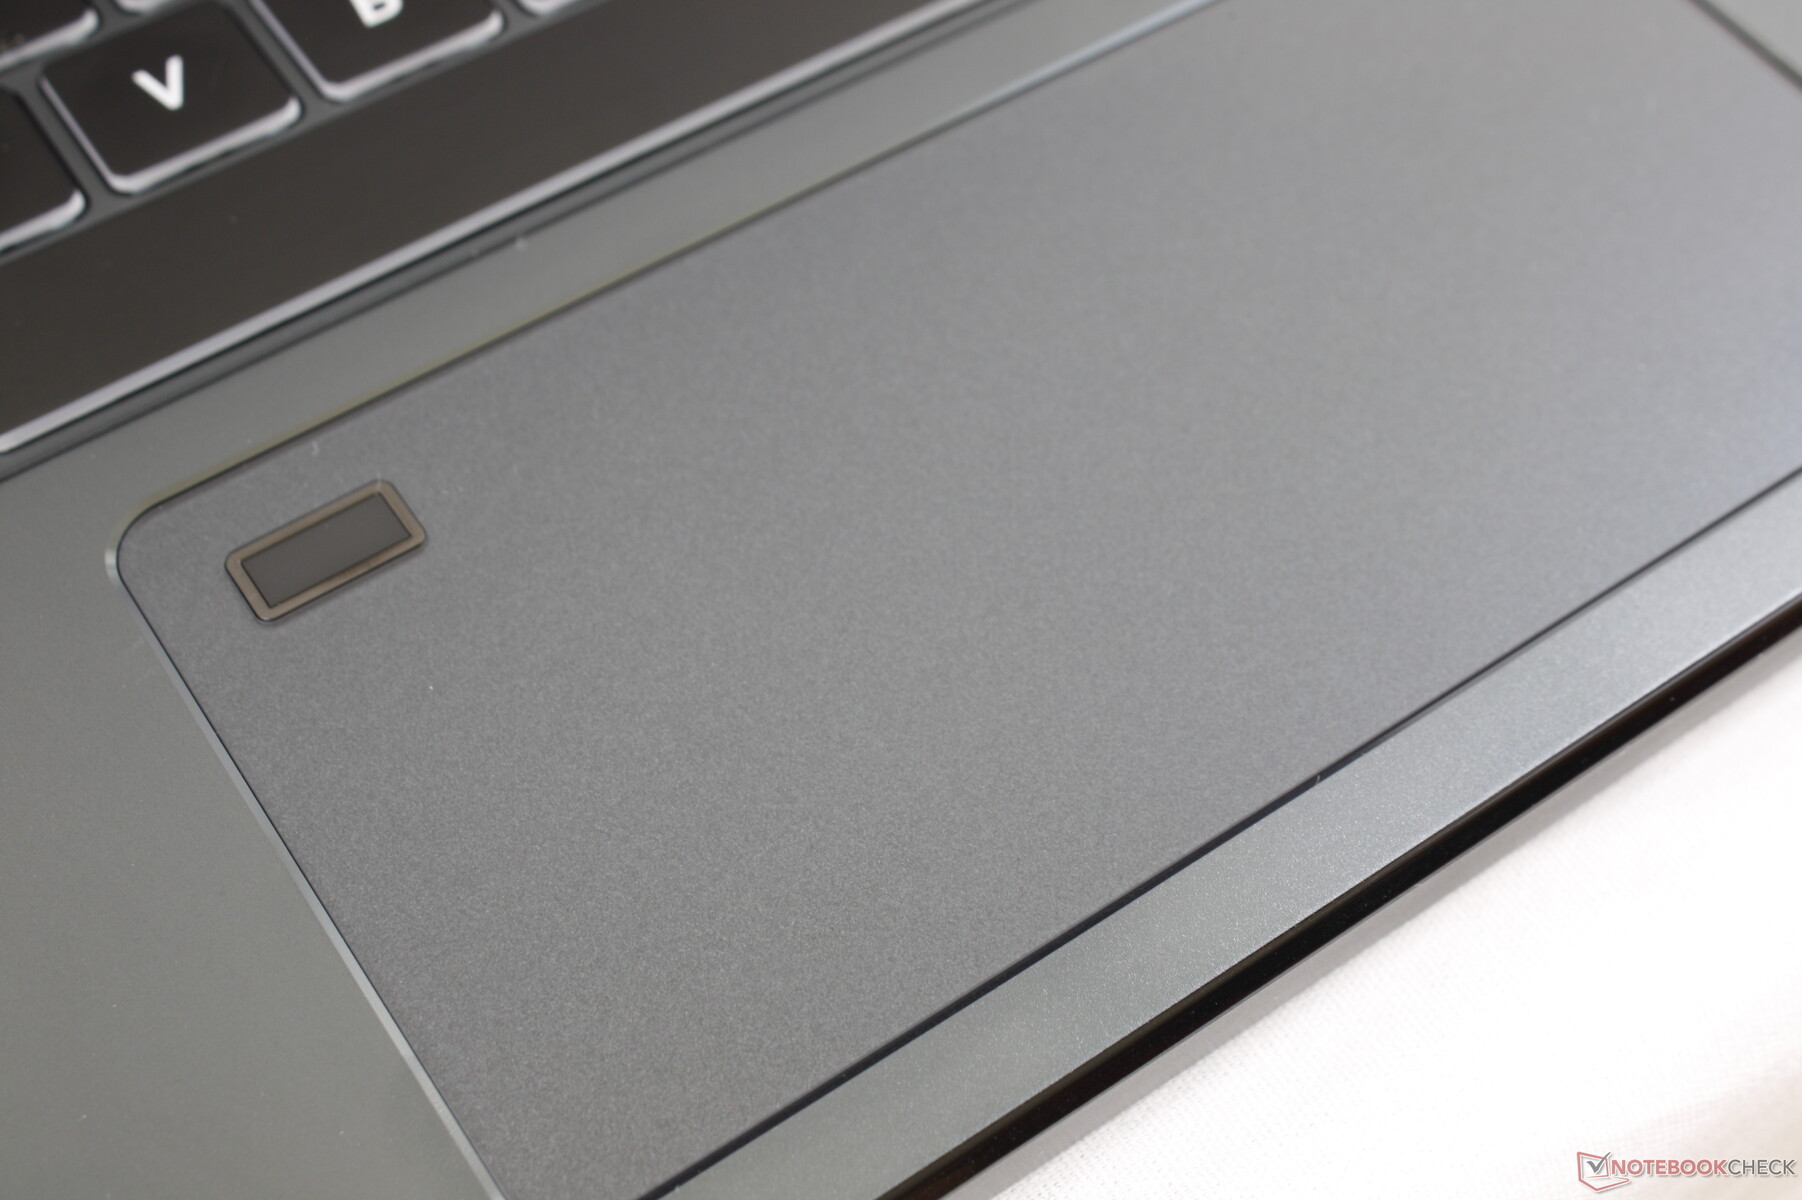
Touchpad
Das großflächige Touchpad (14 x 6,5 cm) hat gute Gleiteigenschaften, nur bei langsamen Bewegungen kann es etwas stocken. Leider sind die integrierten Maustasten zu weich im Feedback, ein flacher Hub besiegelt den unbefriedigenden Eindruck. Außerdem wirken Klicks auf der rechten Hälfte des Pads auch noch schwammiger als auf der linken Seite, dabei sollte sich das Klickpad eigentlich konstant anfühlen. Der Platzgewinn durch die integrierte Tasten mag zwar gut für Multi-Touch-Eingaben sein, wir bevorzugen dennoch die Präzision dedizierter Maustasten wie beim MSI WT75.
Eine ärgerliche Folge des länglichen Klickpads ist, dass die rechte Handfläche beim Tippen fast immer auf das Pad drückt. Die Detektion von Handflächen ist nicht perfekt, sodass man hin und wieder mit versehentlichen Mauseingaben rechnen muss.

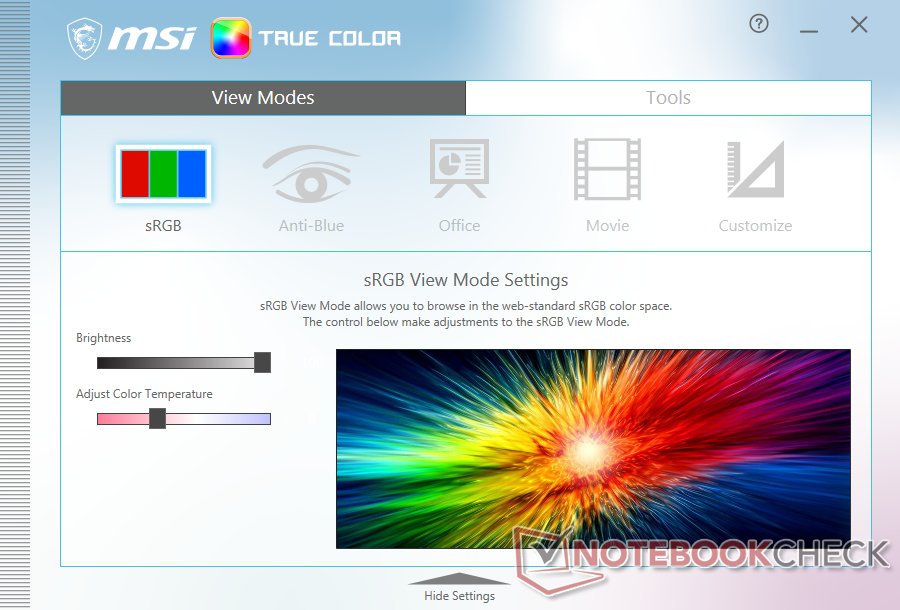
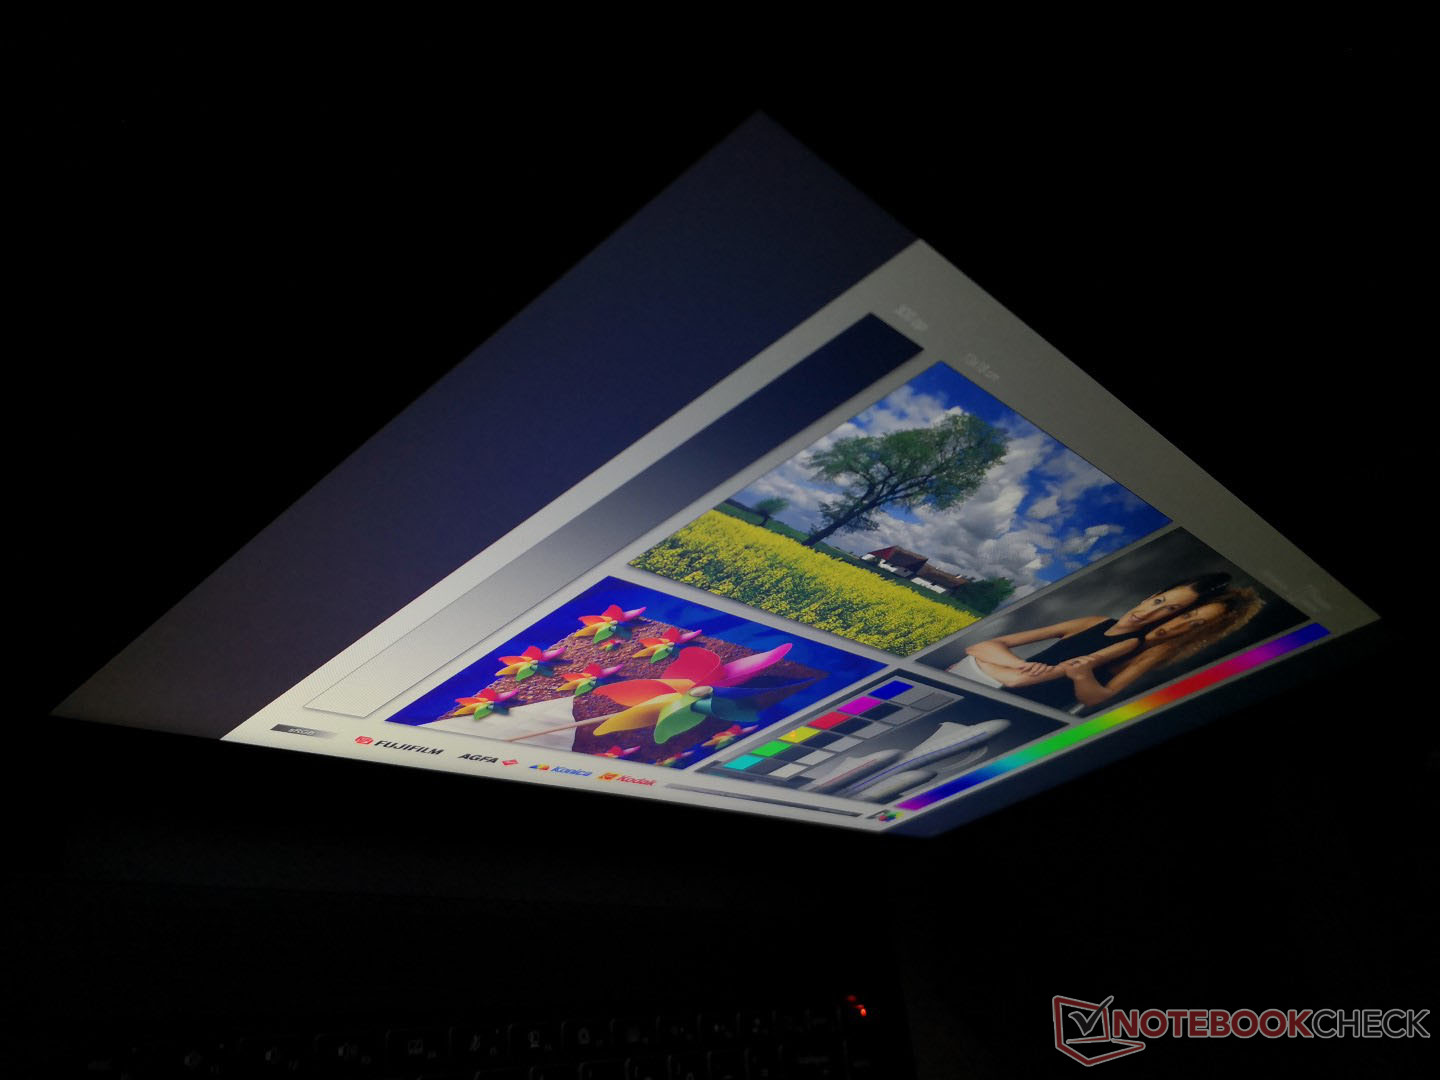
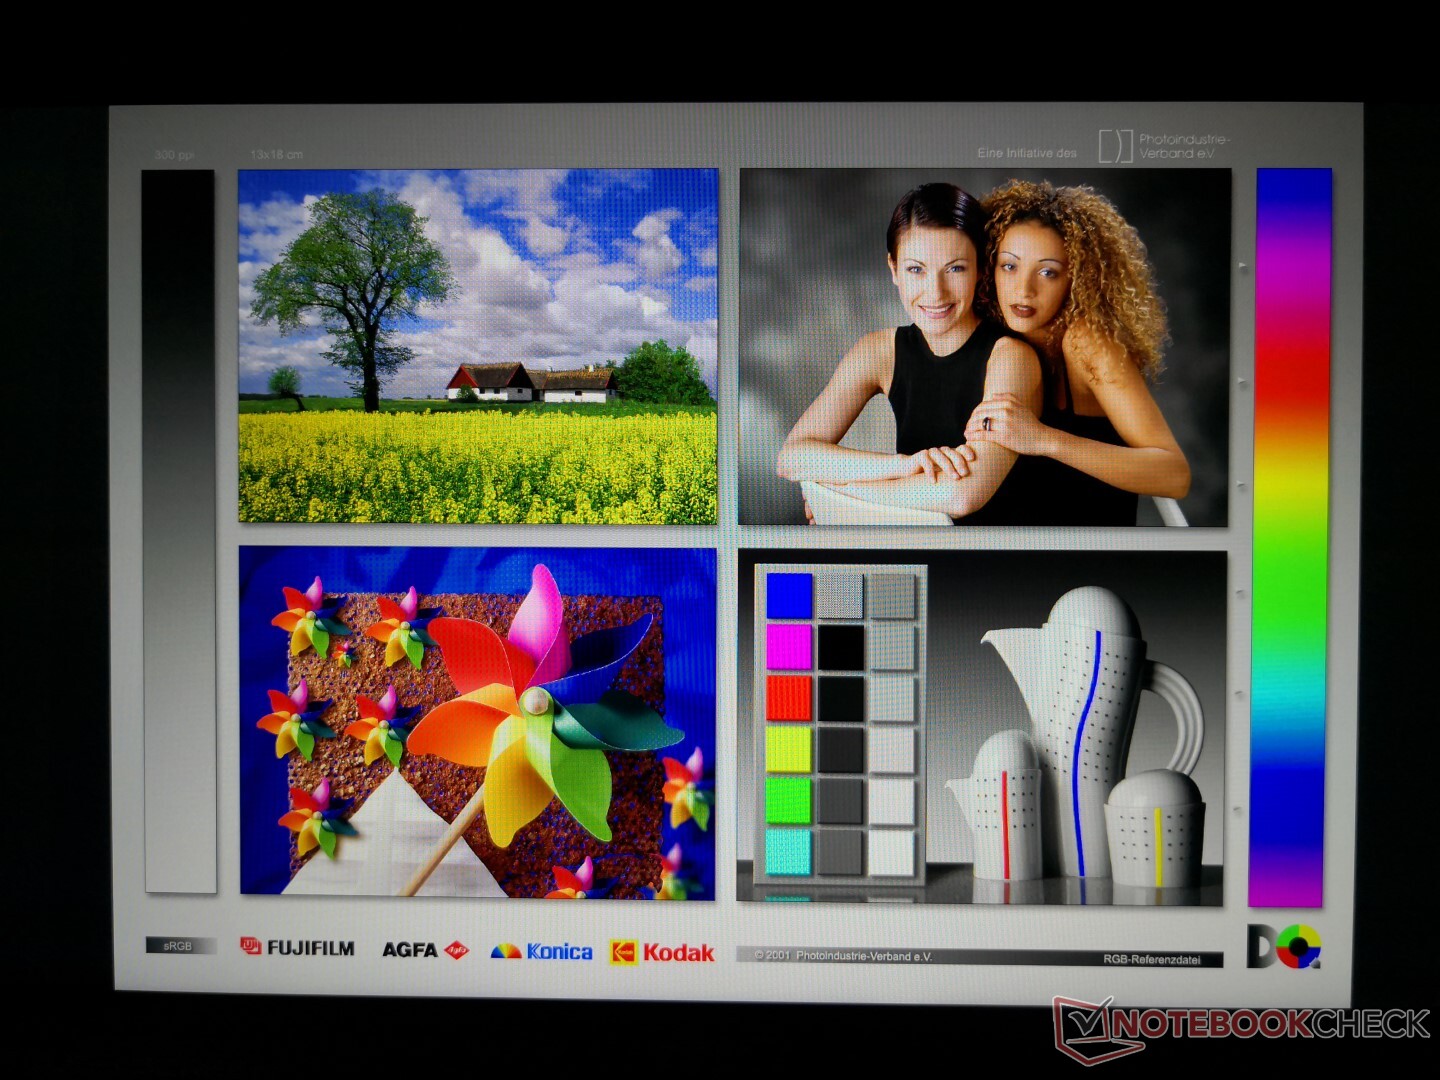
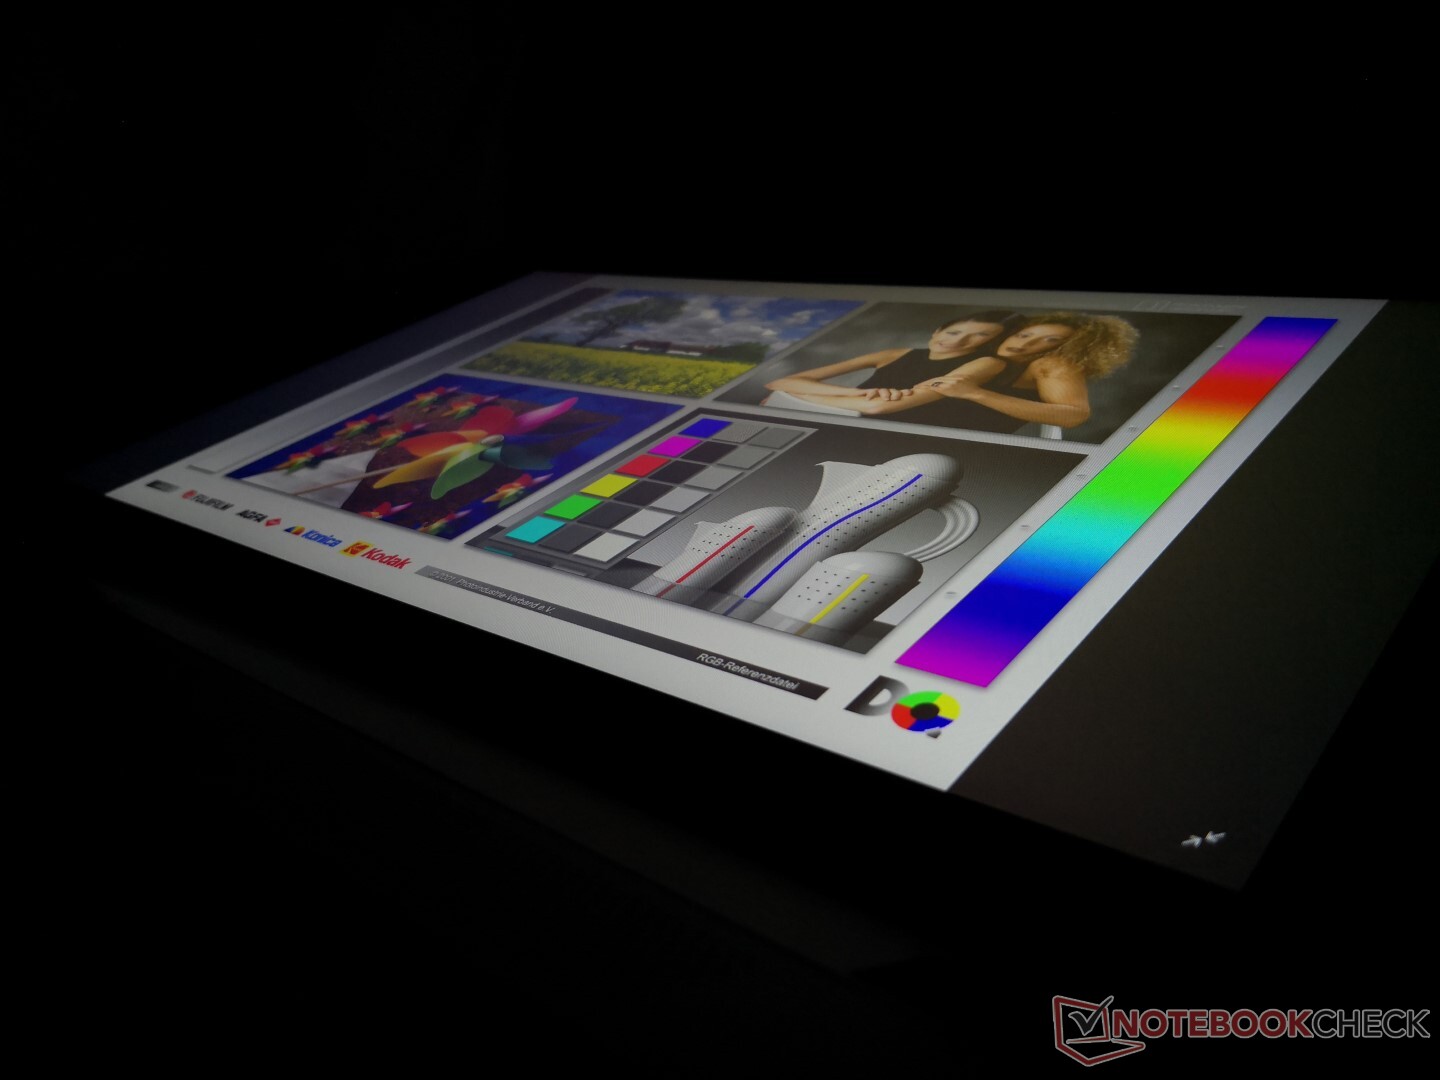
Display
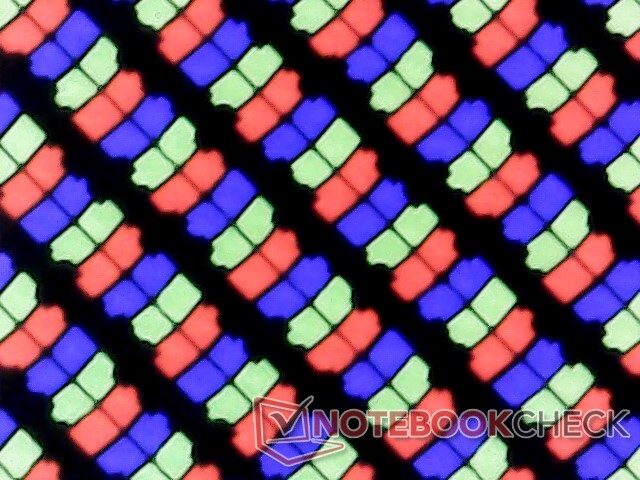
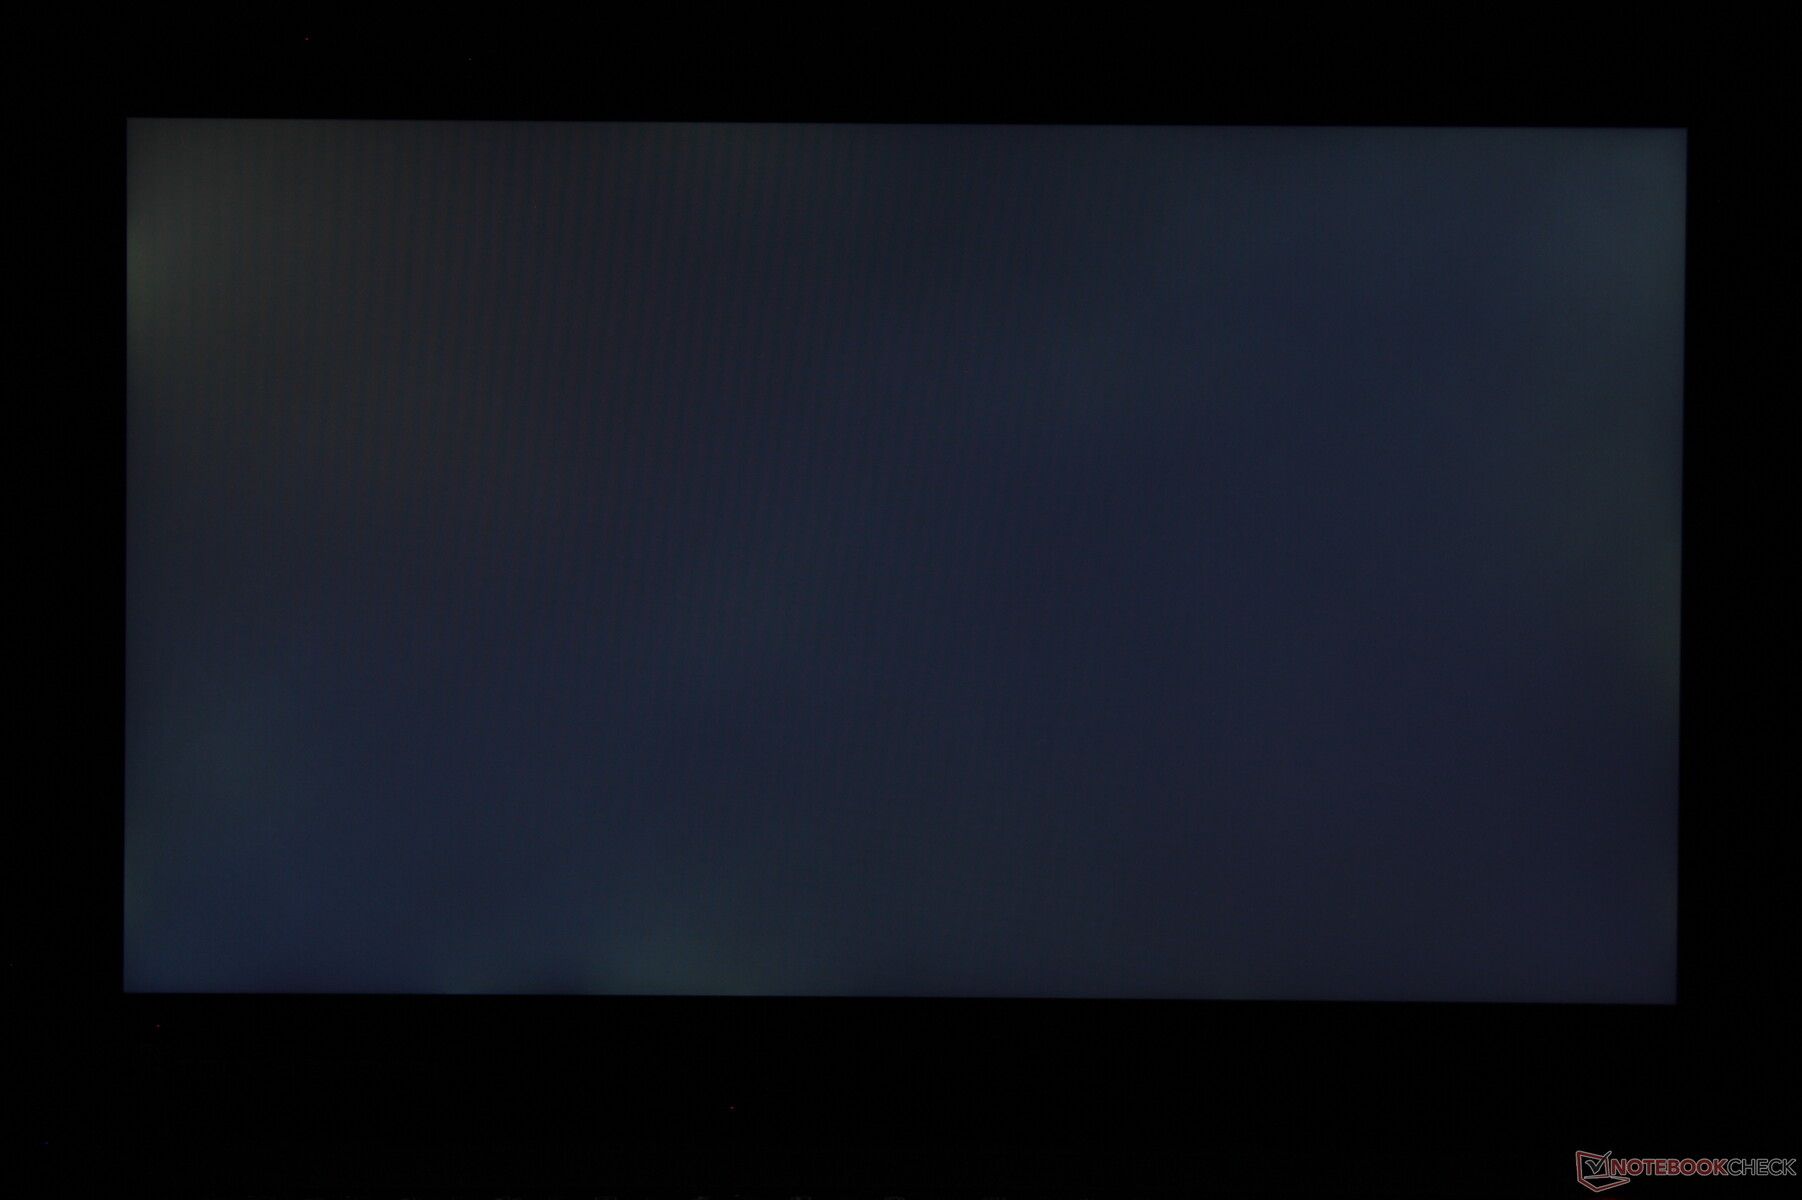
Das AU-Optronics-B156HAB03.0-IPS-Panel taucht hier erstmals in unserer Datenbank auf. Kontrast und Helligkeit sind mit 900:1 und 363 Nits ganz gut für eine Workstation, aber manch andere ultradünne Workstation, wie das Precision 5550, ist heller, farbenfroher und verfügt über einen noch besseren Schwarzwert für eine überlegenere Bildqualität. Da das WS66 kein Gamer mehr ist, gehen die durchschnittlichen Reaktionszeiten in Ordnung.
| |||||||||||||||||||||||||
Ausleuchtung: 91 %
Helligkeit Akku: 374.5 cd/m²
Kontrast: 892:1 (Schwarzwert: 0.42 cd/m²)
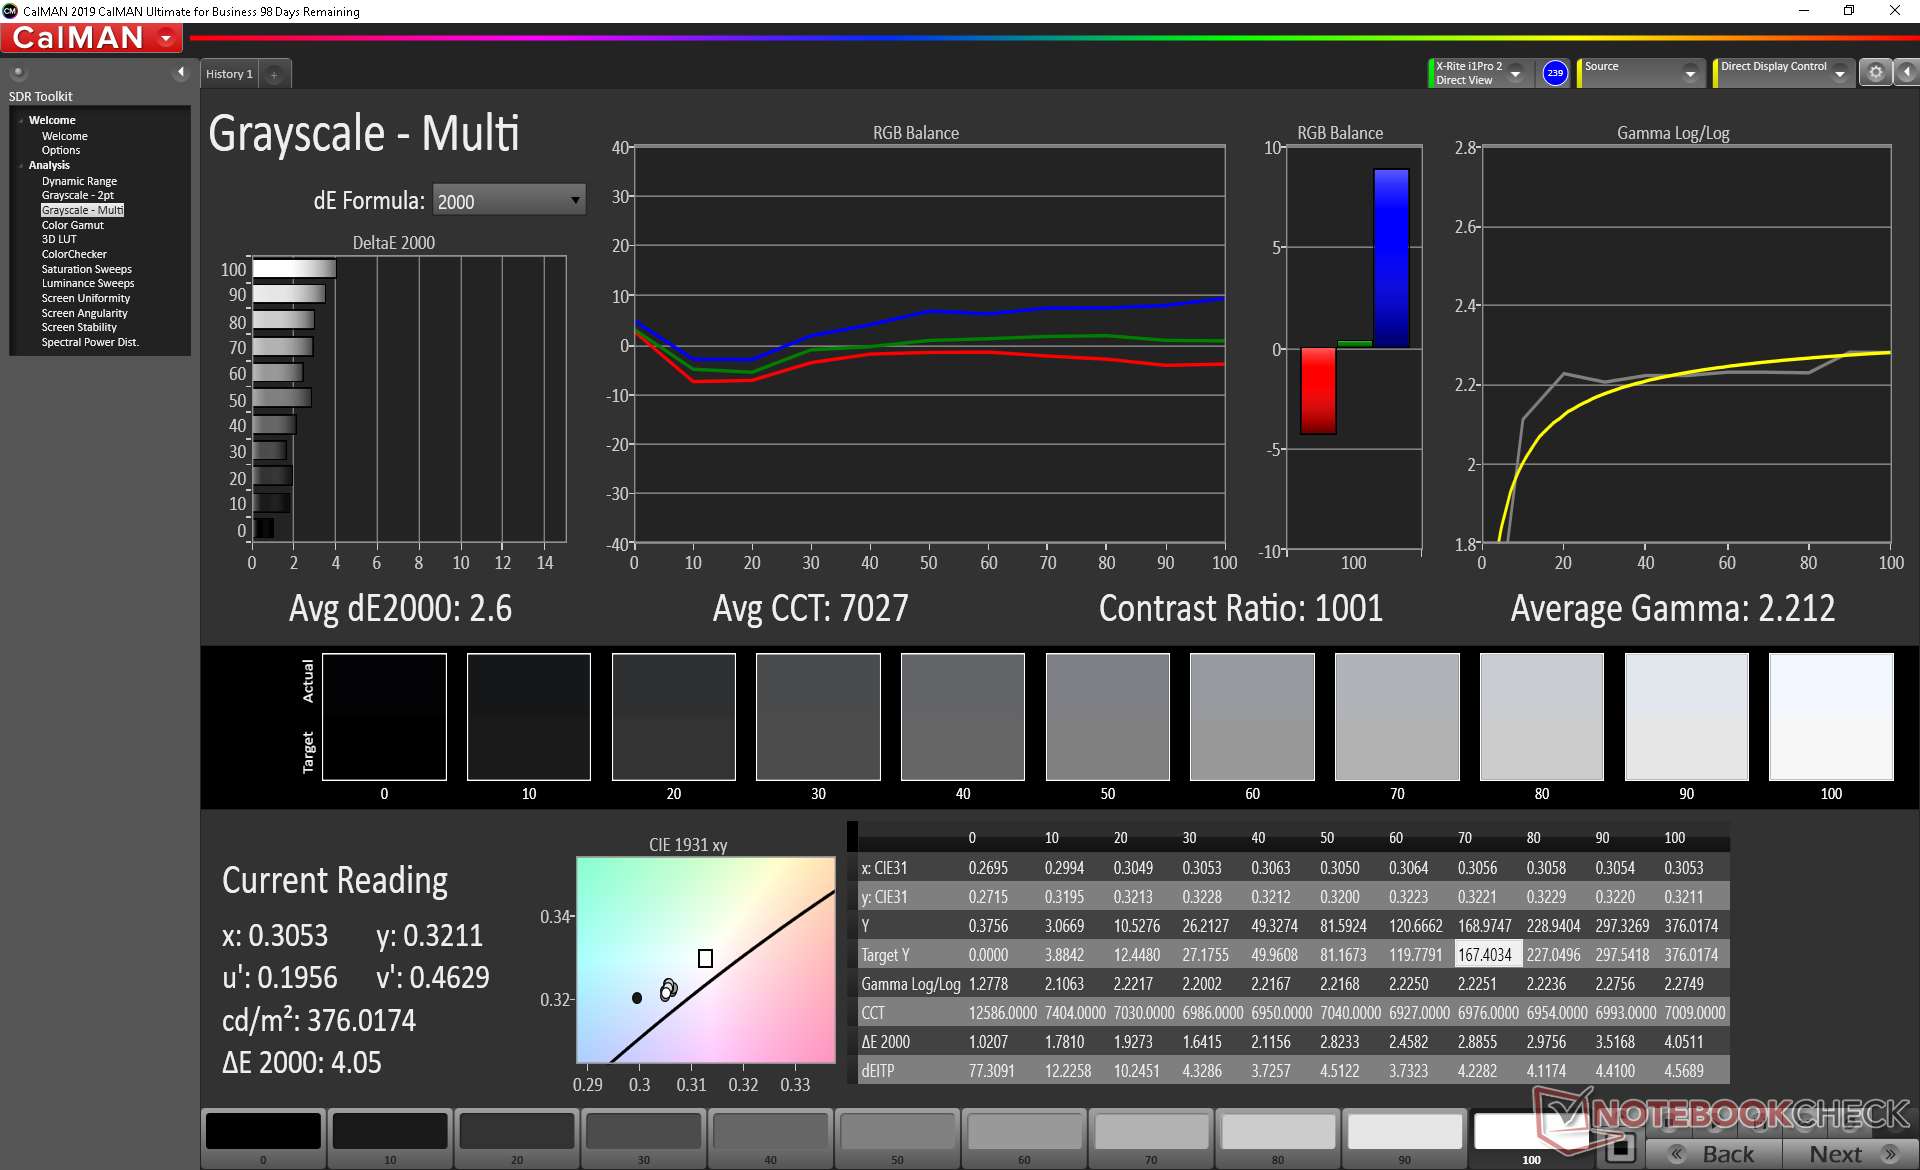
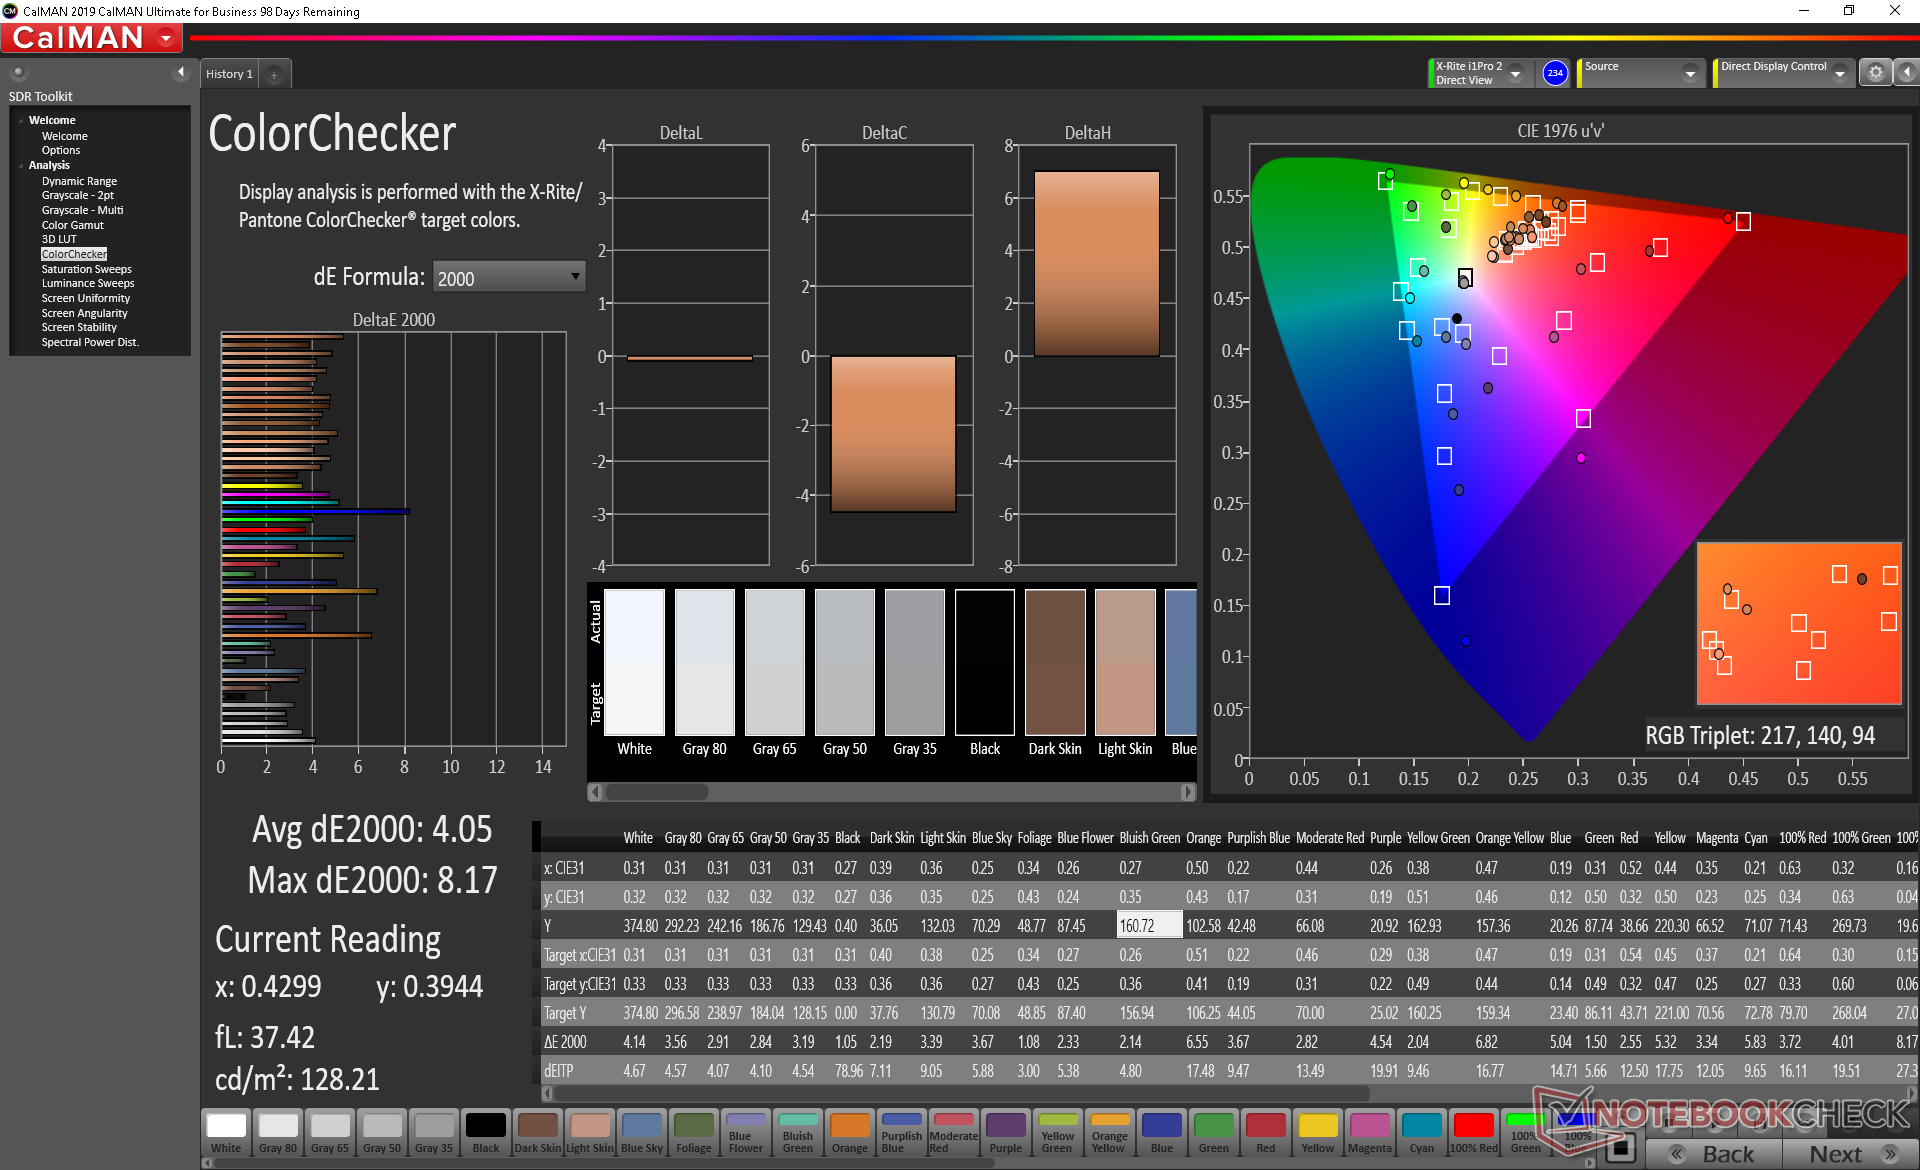
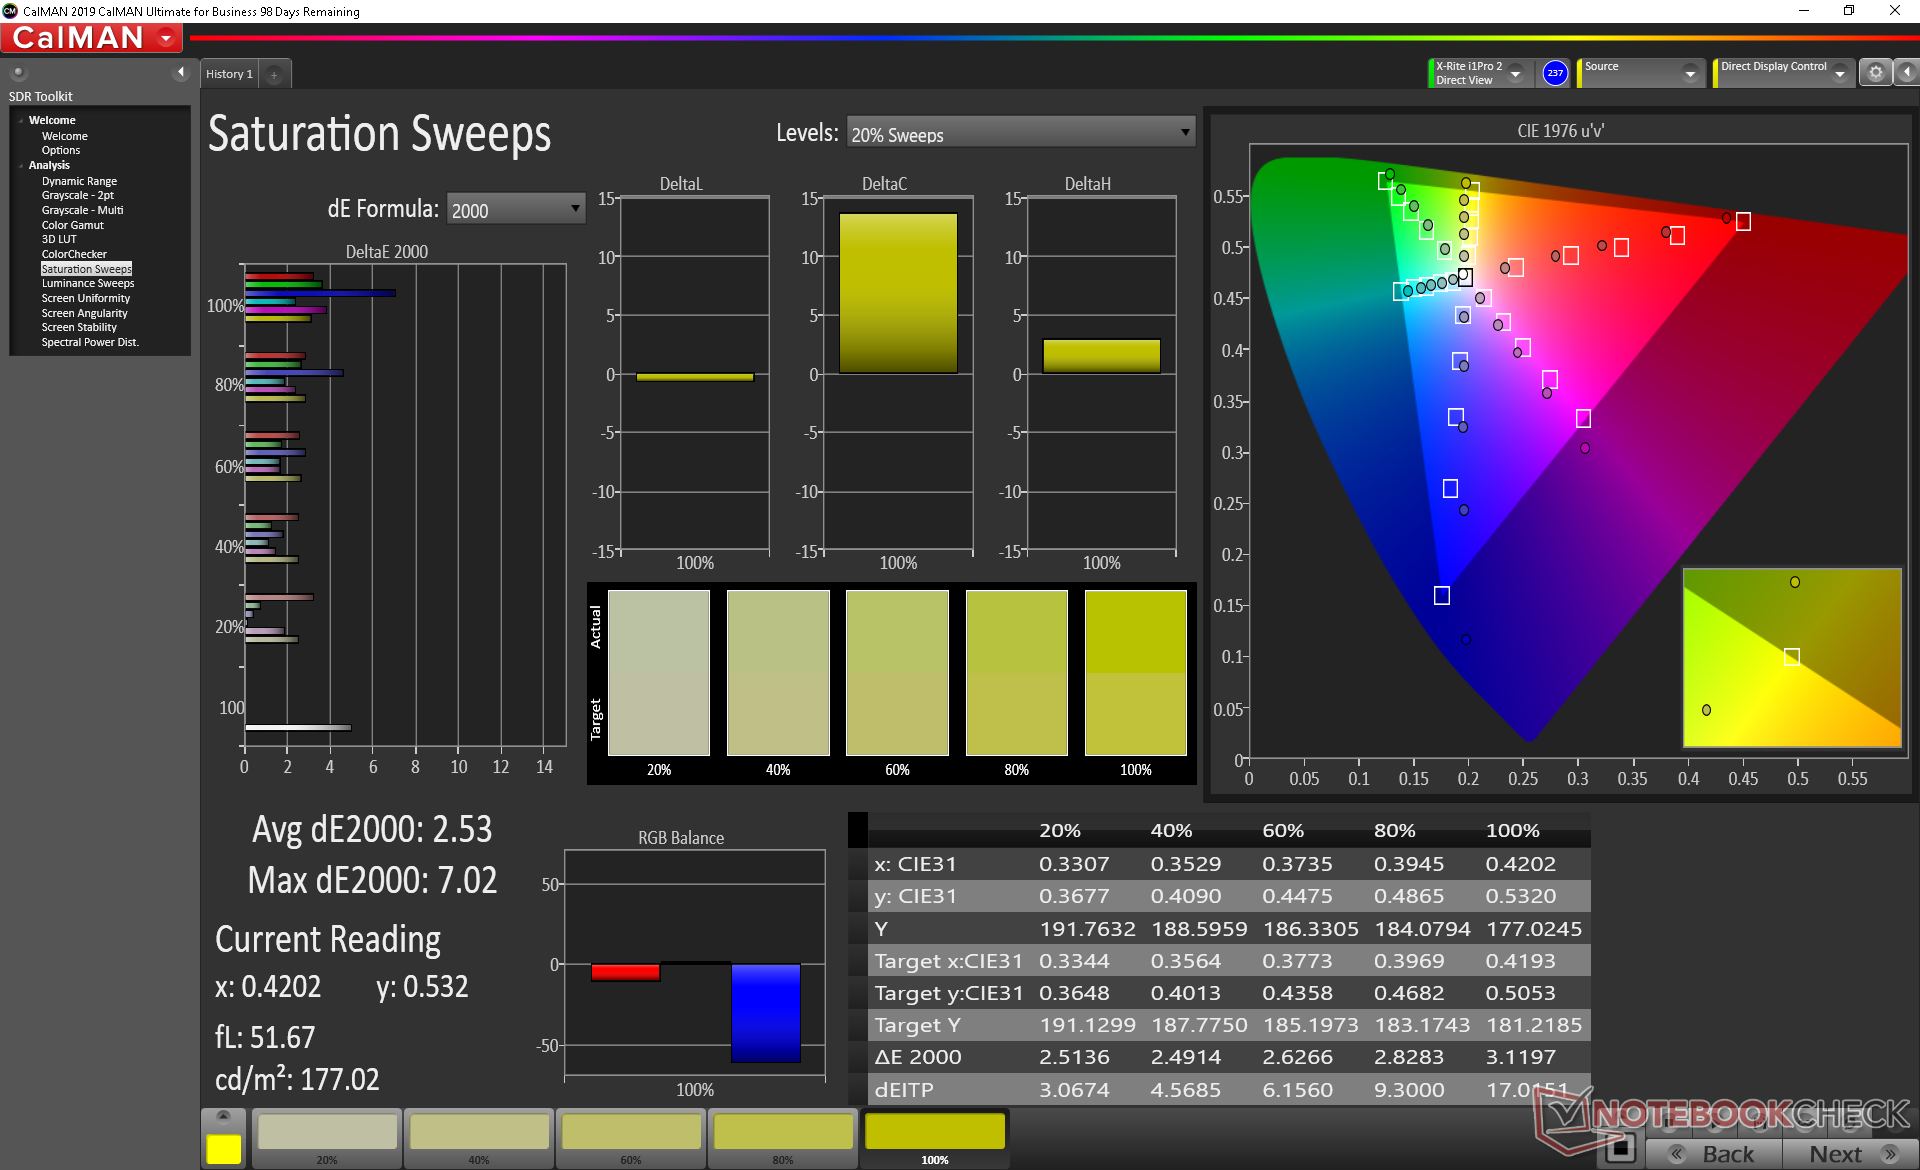
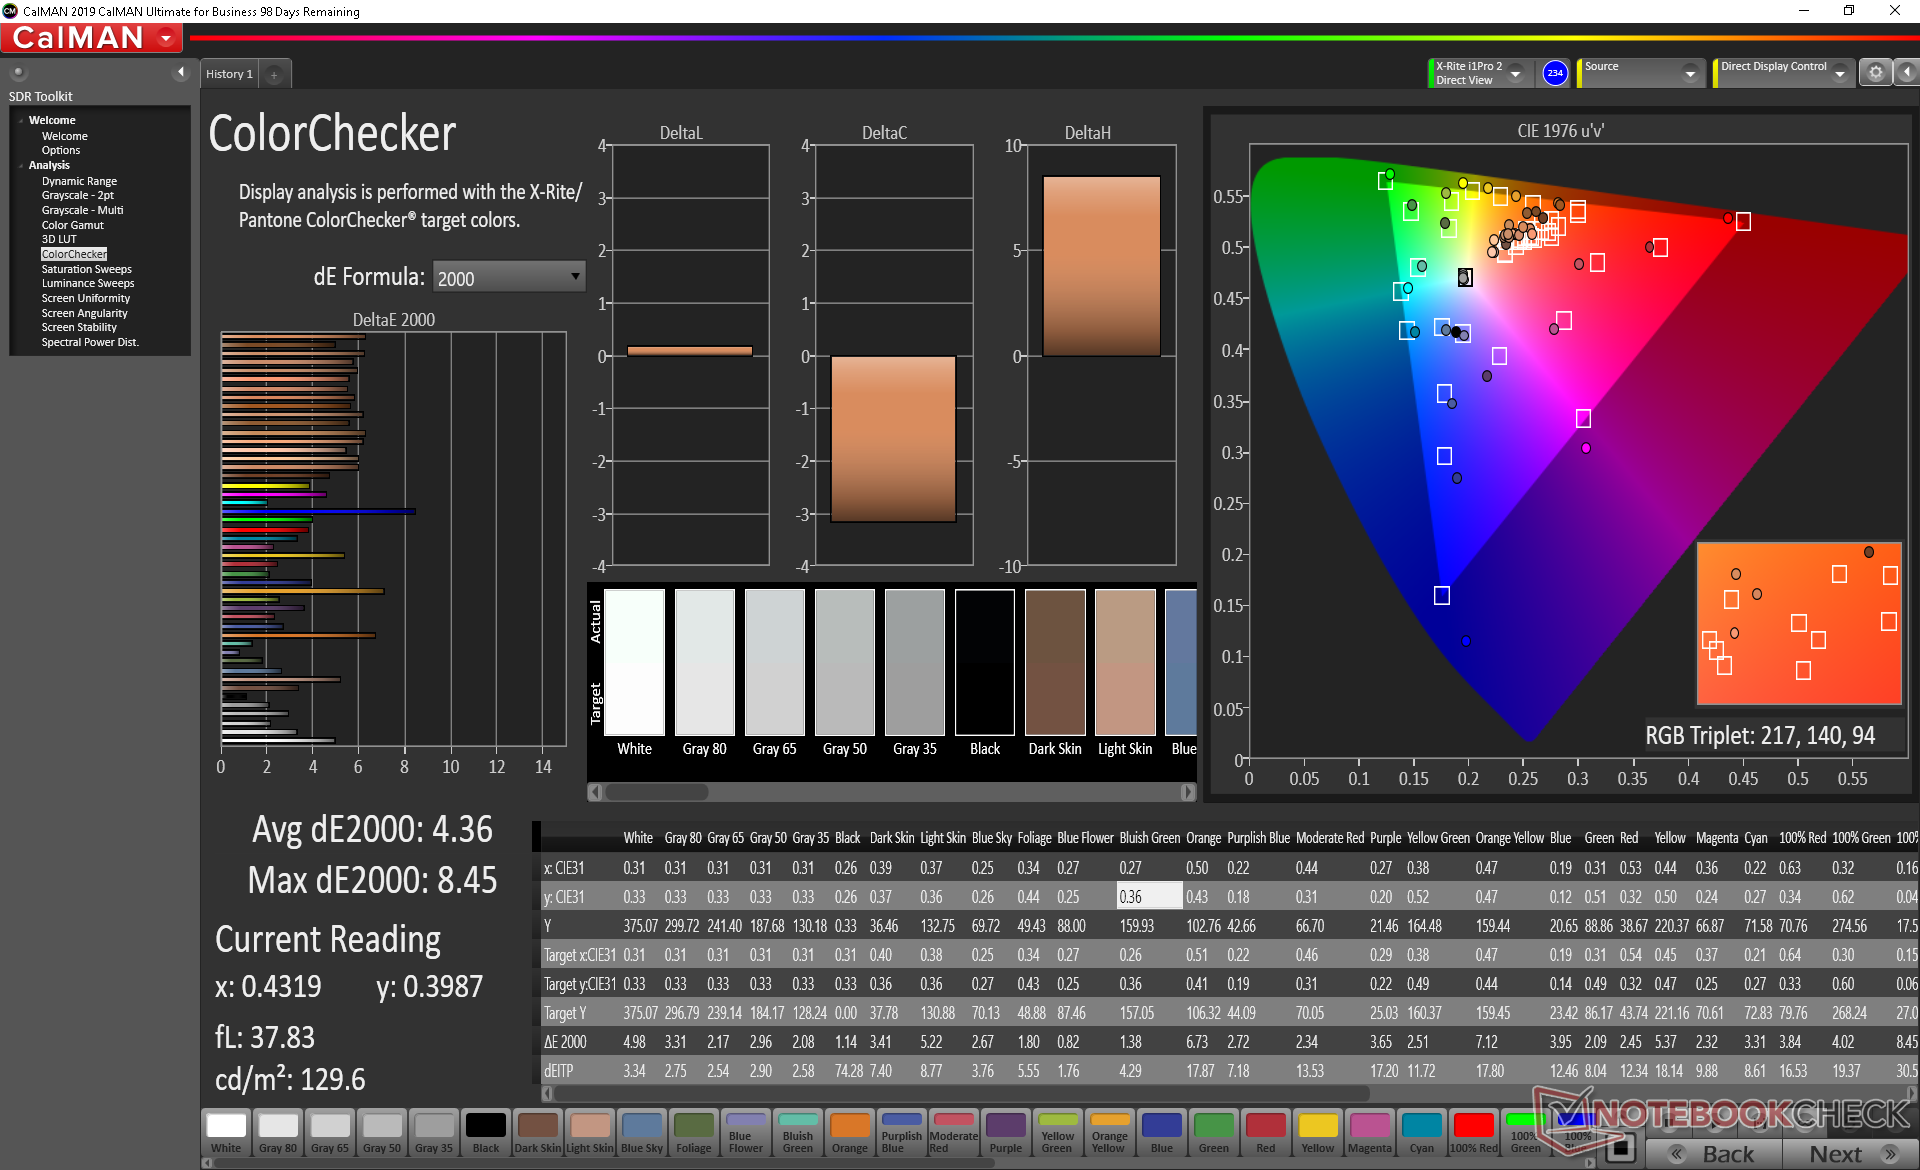
ΔE ColorChecker Calman: 4.05 | ∀{0.5-29.43 Ø4.71}
calibrated: 4.36
ΔE Greyscale Calman: 2.6 | ∀{0.09-98 Ø4.96}
86.3% sRGB (Argyll 1.6.3 3D)
56.4% AdobeRGB 1998 (Argyll 1.6.3 3D)
63.6% AdobeRGB 1998 (Argyll 3D)
86.9% sRGB (Argyll 3D)
62.8% Display P3 (Argyll 3D)
Gamma: 2.21
CCT: 7027 K
| MSI WS66 10TMT-207US AU Optronics B156HAB03.0, IPS, 15.6", 1920x1080 | Dell Precision 7550 AU Optronics B156ZAN, IPS, 15.6", 3840x2160 | Dell Precision 5550 P91F Sharp LQ156R1, IPS, 15.6", 3840x2400 | Razer Blade 15 Studio Edition 2020 Samsung SDCA029, OLED, 15.6", 3840x2160 | MSI WS63VR 7RL-023US SAMSUNG LƒFL156FL02-101 , IPS, 15.6", 3840x2160 | Acer ConceptD 3 Pro CN315-71P-73W1 Chi Mei N156HCE-EN2, IPS, 15.6", 1920x1080 | |
|---|---|---|---|---|---|---|
| Display | 33% | 38% | 42% | -22% | 36% | |
| Display P3 Coverage (%) | 62.8 | 82.1 31% | 89.9 43% | 99.9 59% | 47.43 -24% | 97.9 56% |
| sRGB Coverage (%) | 86.9 | 99.6 15% | 100 15% | 100 15% | 71.4 -18% | 99.9 15% |
| AdobeRGB 1998 Coverage (%) | 63.6 | 96.8 52% | 99.9 57% | 97.3 53% | 49 -23% | 87.2 37% |
| Response Times | -16% | -11% | 89% | 10% | 25% | |
| Response Time Grey 50% / Grey 80% * (ms) | 44.8 ? | 51.2 ? -14% | 46 ? -3% | 4 ? 91% | 36.8 ? 18% | 33 ? 26% |
| Response Time Black / White * (ms) | 28.8 ? | 34 ? -18% | 34 ? -18% | 4 ? 86% | 28.4 ? 1% | 22 ? 24% |
| PWM Frequency (Hz) | 1351 ? | |||||
| Bildschirm | -2% | 1% | 212% | -27% | 16% | |
| Helligkeit Bildmitte (cd/m²) | 374.5 | 473.5 26% | 469.8 25% | 380 1% | 259.4 -31% | 343 -8% |
| Brightness (cd/m²) | 363 | 461 27% | 464 28% | 388 7% | 247 -32% | 309 -15% |
| Brightness Distribution (%) | 91 | 90 -1% | 85 -7% | 93 2% | 85 -7% | 85 -7% |
| Schwarzwert * (cd/m²) | 0.42 | 0.55 -31% | 0.42 -0% | 0.018 96% | 0.43 -2% | 0.22 48% |
| Kontrast (:1) | 892 | 861 -3% | 1119 25% | 21111 2267% | 603 -32% | 1559 75% |
| Delta E Colorchecker * | 4.05 | 4.8 -19% | 5.16 -27% | 5.47 -35% | 5.5 -36% | 3.73 8% |
| Colorchecker dE 2000 max. * | 8.17 | 8.73 -7% | 9.33 -14% | 8.19 -0% | 12.7 -55% | 6.51 20% |
| Colorchecker dE 2000 calibrated * | 4.36 | 3.08 29% | 3.75 14% | 3.04 30% | 1.43 67% | |
| Delta E Graustufen * | 2.6 | 5.6 -115% | 5.5 -112% | 5.3 -104% | 3.6 -38% | 4.24 -63% |
| Gamma | 2.21 100% | 2.34 94% | 2 110% | 2.15 102% | 2.24 98% | 2.2 100% |
| CCT | 7027 93% | 7549 86% | 6198 105% | 6128 106% | 7163 91% | 6329 103% |
| Farbraum (Prozent von AdobeRGB 1998) (%) | 56.4 | 86.4 53% | 89.2 58% | 86 52% | 45 -20% | 78 38% |
| Color Space (Percent of sRGB) (%) | 86.3 | 99.7 16% | 100 16% | 100 16% | 71 -18% | 100 16% |
| Durchschnitt gesamt (Programm / Settings) | 5% /
3% | 9% /
6% | 114% /
165% | -13% /
-21% | 26% /
21% |
* ... kleinere Werte sind besser
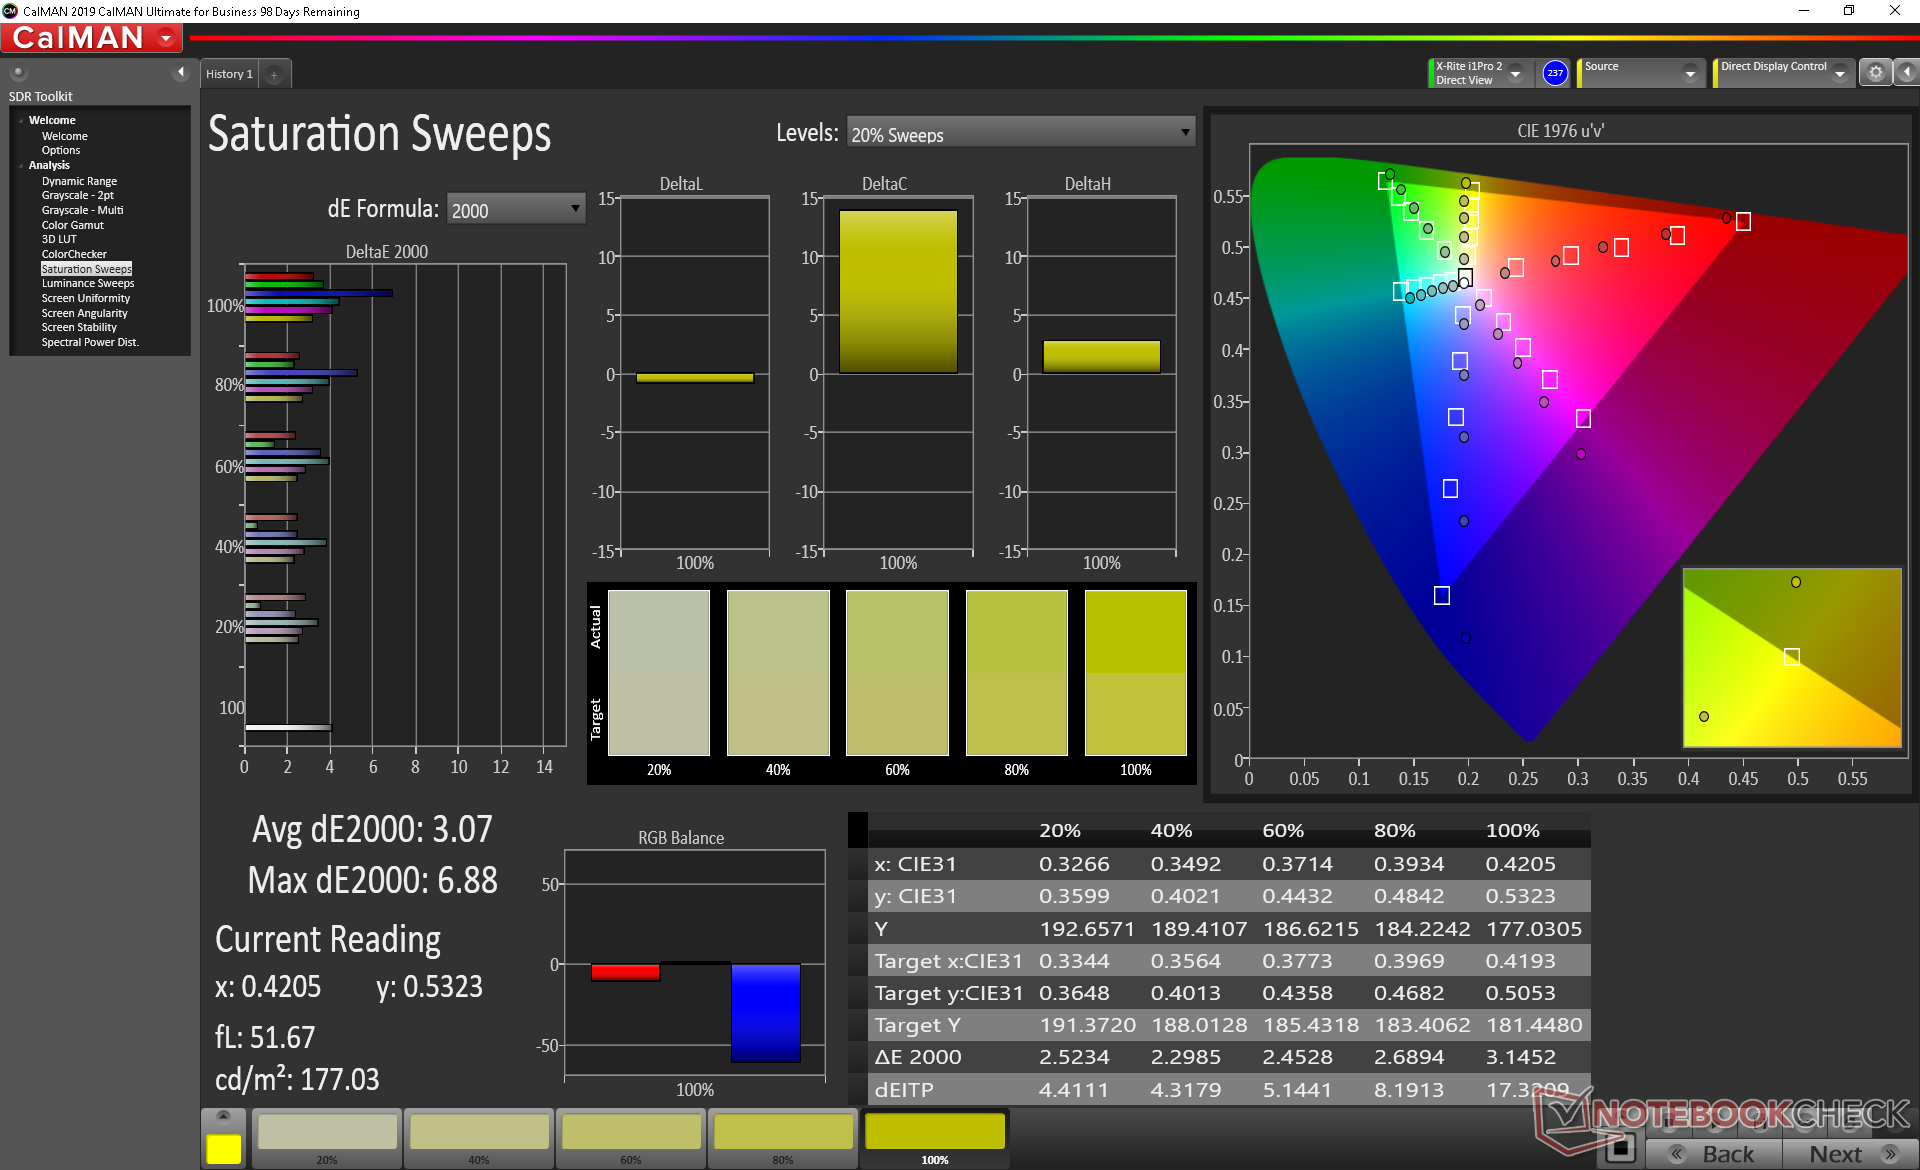
Vom sRGB-Farbraum wird nun 86 Prozent abgedeckt, was einerseits eine Verbesserung zum Vorgänger darstellt, andererseits punkten die meisten anderen Workstations mit vollen 100 Prozent. OLED-Optionen sind leider nicht verfügbar, dadurch wäre die Abdeckung von DCI-P3 möglich gewesen.
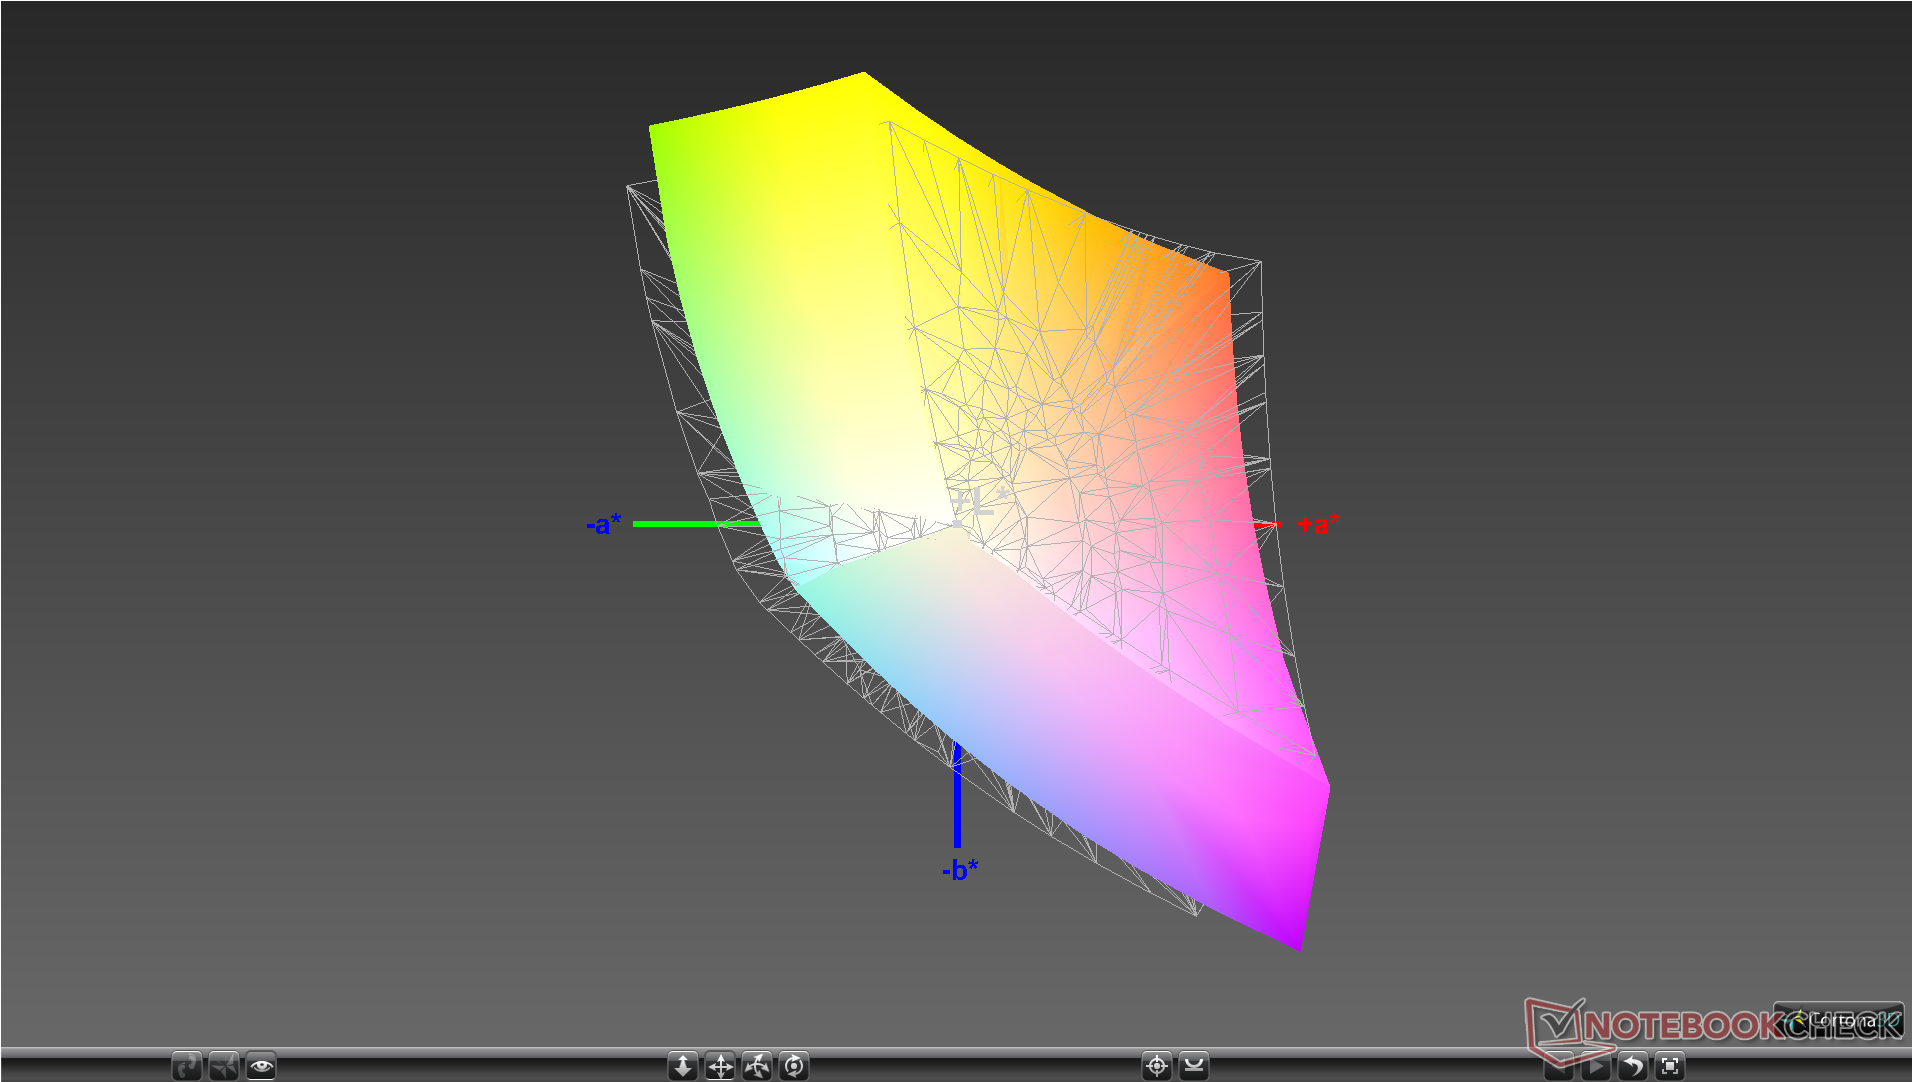
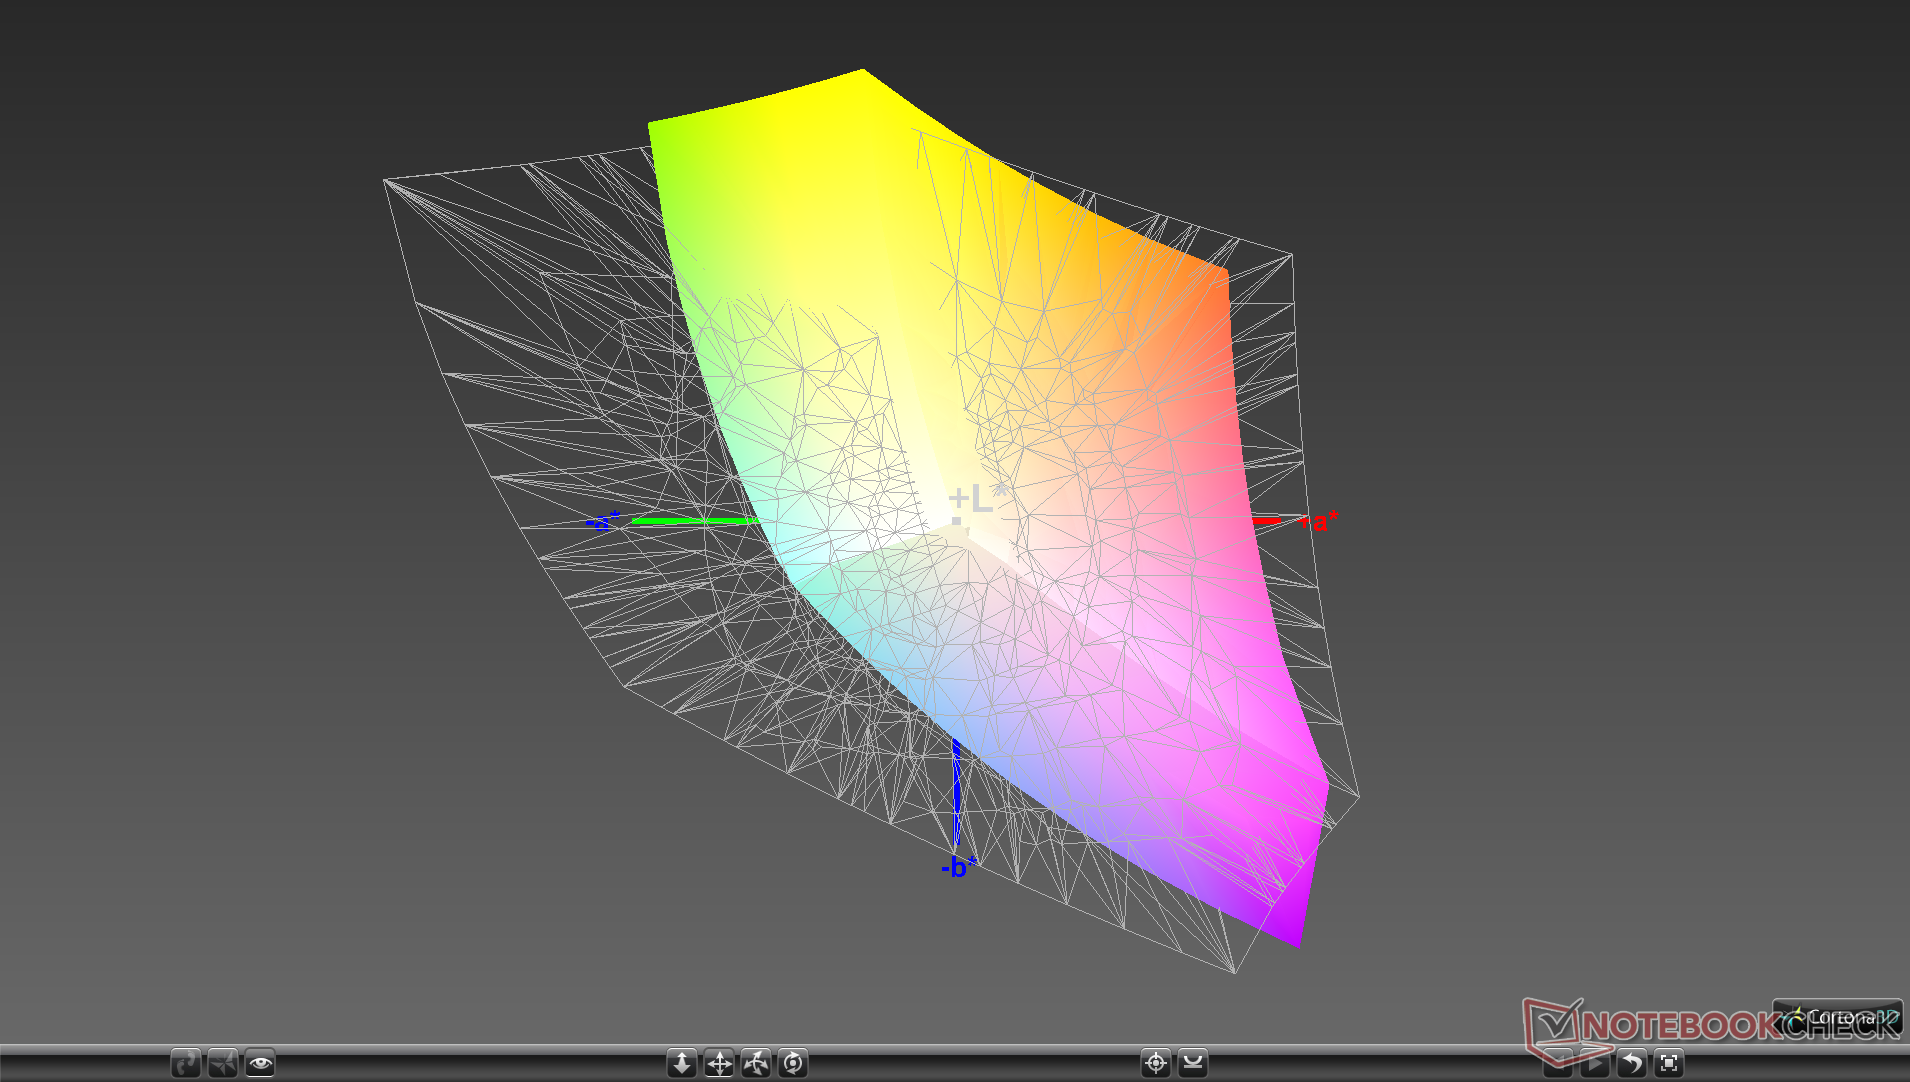
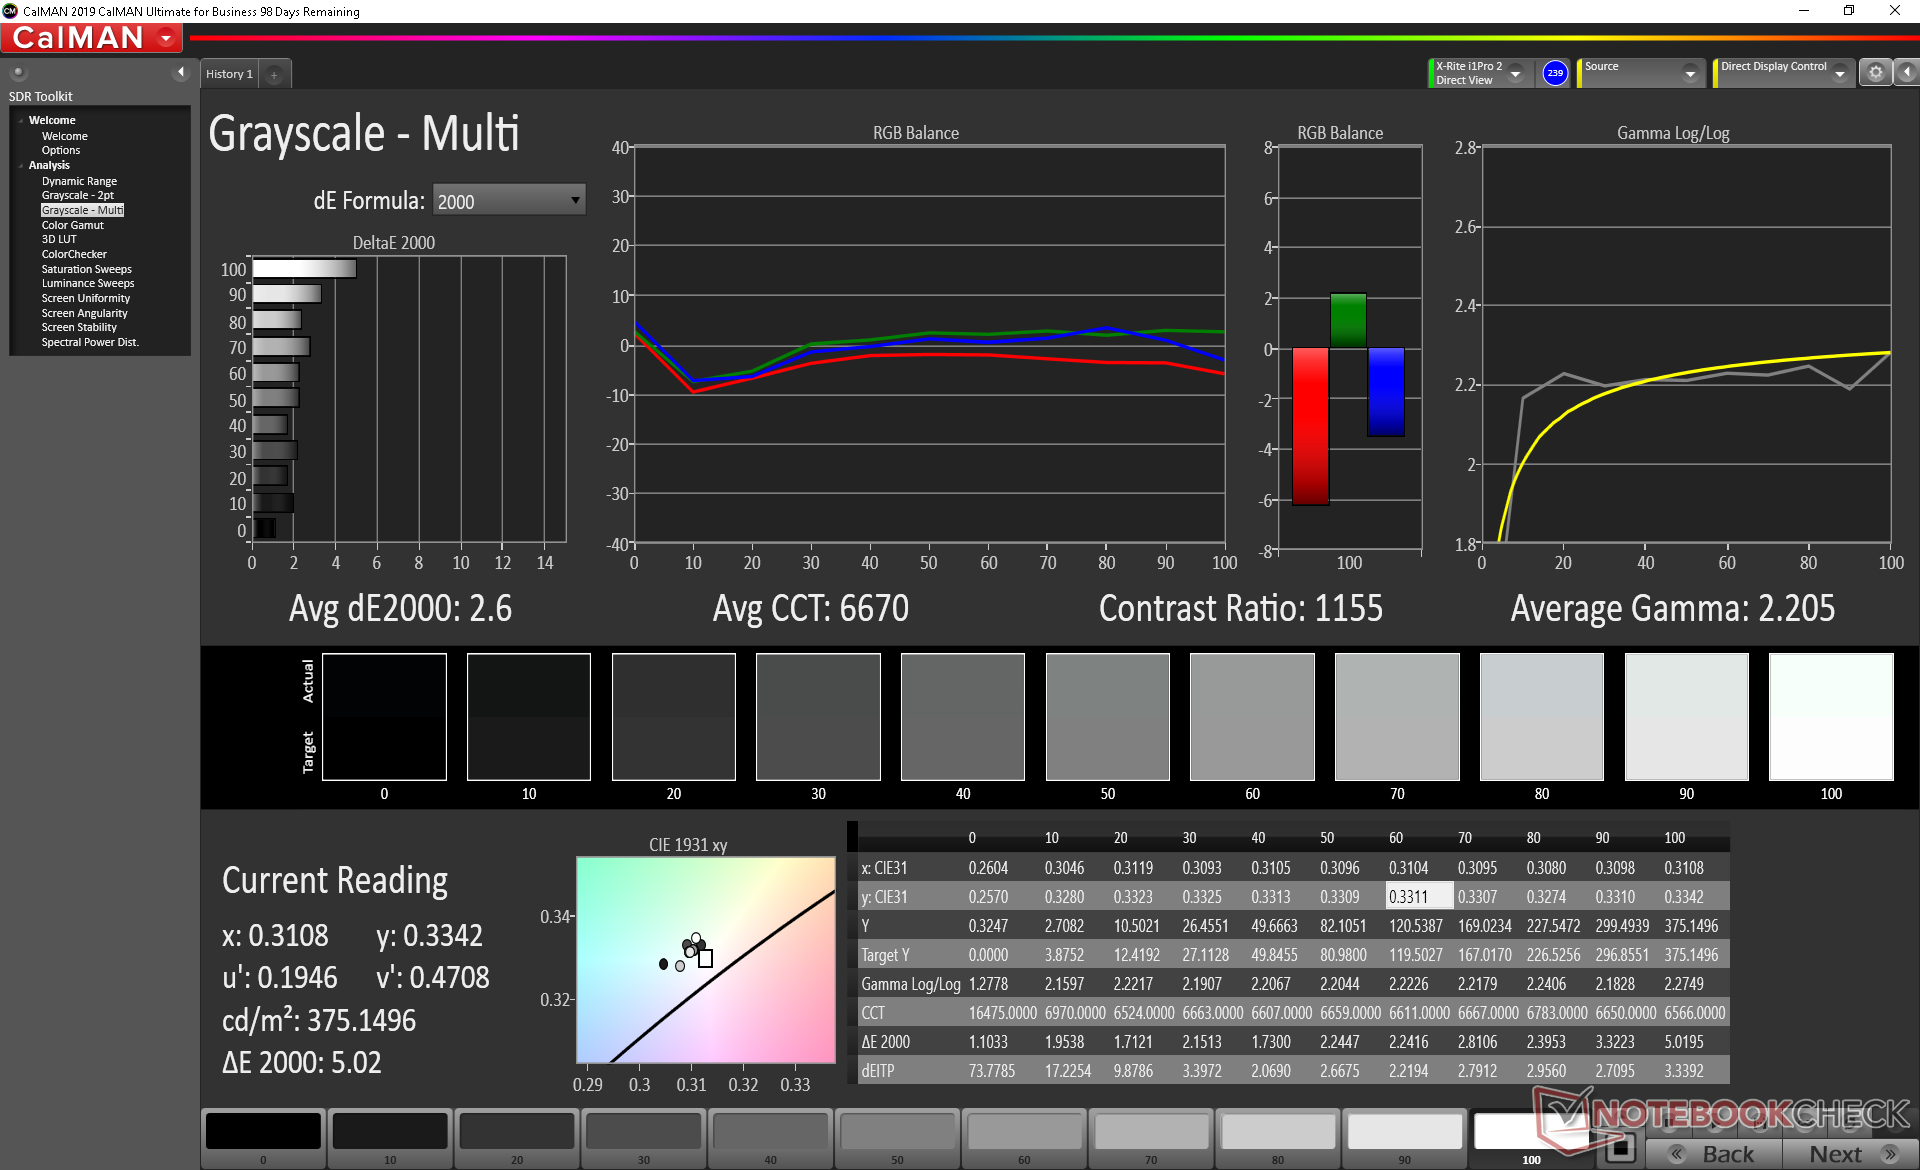
Unser X-Rite-Farbmessgerät bescheinigt dem Testmodell ein gut kalibriertes Display, so wie es MSI auch anpreist. Die Farbtemperatur geht nur minimal ins Kühle, was aber bei einer finalen Kalibrierung durch den Nutzer behoben werden kann.
Reaktionszeiten (Response Times) des Displays
| ↔ Reaktionszeiten Schwarz zu Weiß | ||
|---|---|---|
| 28.8 ms ... steigend ↗ und fallend ↘ kombiniert | ↗ 17.2 ms steigend | 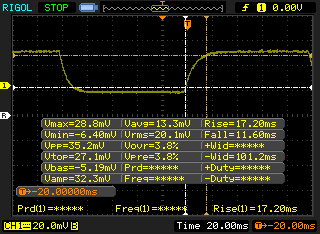 |
| ↘ 11.6 ms fallend | ||
| Die gemessenen Reaktionszeiten sind mittelmäßig und dadurch für Spieler eventuell zu langsam. Im Vergleich rangierten die bei uns getesteten Geräte von 0.1 (Minimum) zu 240 (Maximum) ms. » 76 % aller Screens waren schneller als der getestete. Daher sind die gemessenen Reaktionszeiten schlechter als der Durchschnitt aller vermessenen Geräte (19.8 ms). | ||
| ↔ Reaktionszeiten 50% Grau zu 80% Grau | ||
| 44.8 ms ... steigend ↗ und fallend ↘ kombiniert | ↗ 21.2 ms steigend | 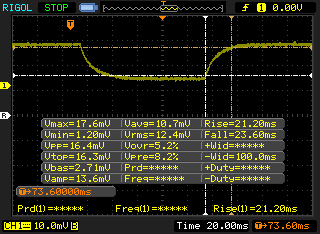 |
| ↘ 23.6 ms fallend | ||
| Die gemessenen Reaktionszeiten sind langsam und dadurch für viele Spieler wahrscheinlich zu langsam. Im Vergleich rangierten die bei uns getesteten Geräte von 0.165 (Minimum) zu 636 (Maximum) ms. » 76 % aller Screens waren schneller als der getestete. Daher sind die gemessenen Reaktionszeiten schlechter als der Durchschnitt aller vermessenen Geräte (31 ms). | ||
Bildschirm-Flackern / PWM (Pulse-Width Modulation)
| Flackern / PWM nicht festgestellt |  | ||
Im Vergleich: 52 % aller getesteten Geräte nutzten kein PWM um die Helligkeit zu reduzieren. Wenn PWM eingesetzt wurde, dann bei einer Frequenz von durchschnittlich 7754 (Minimum 5, Maximum 343500) Hz. | |||
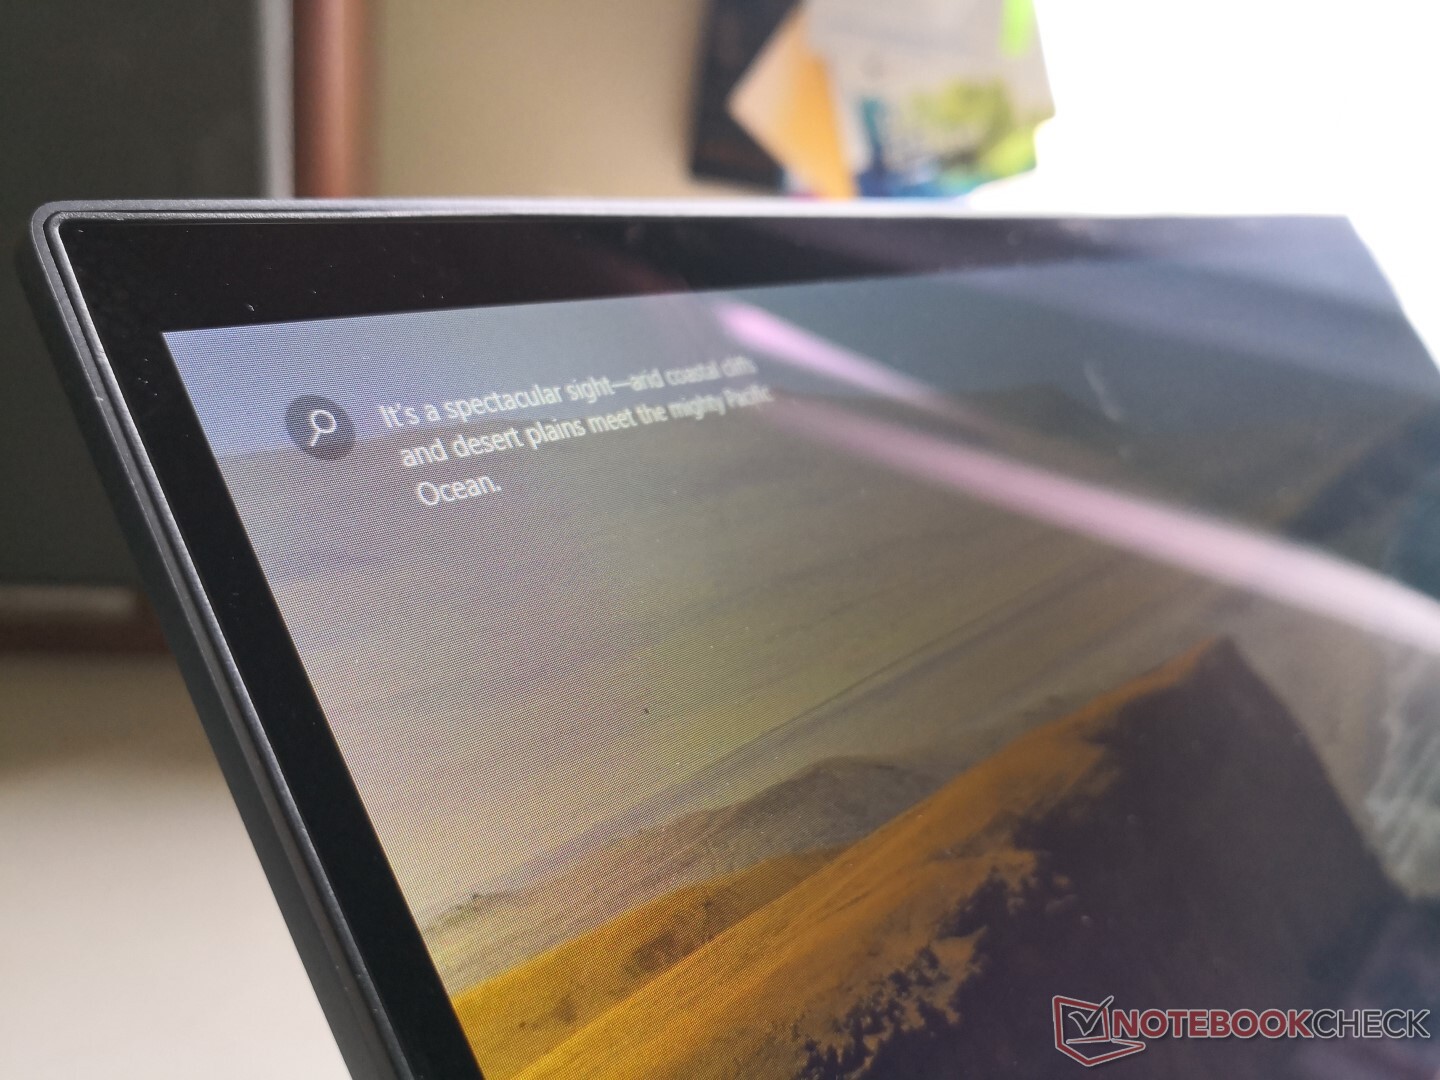
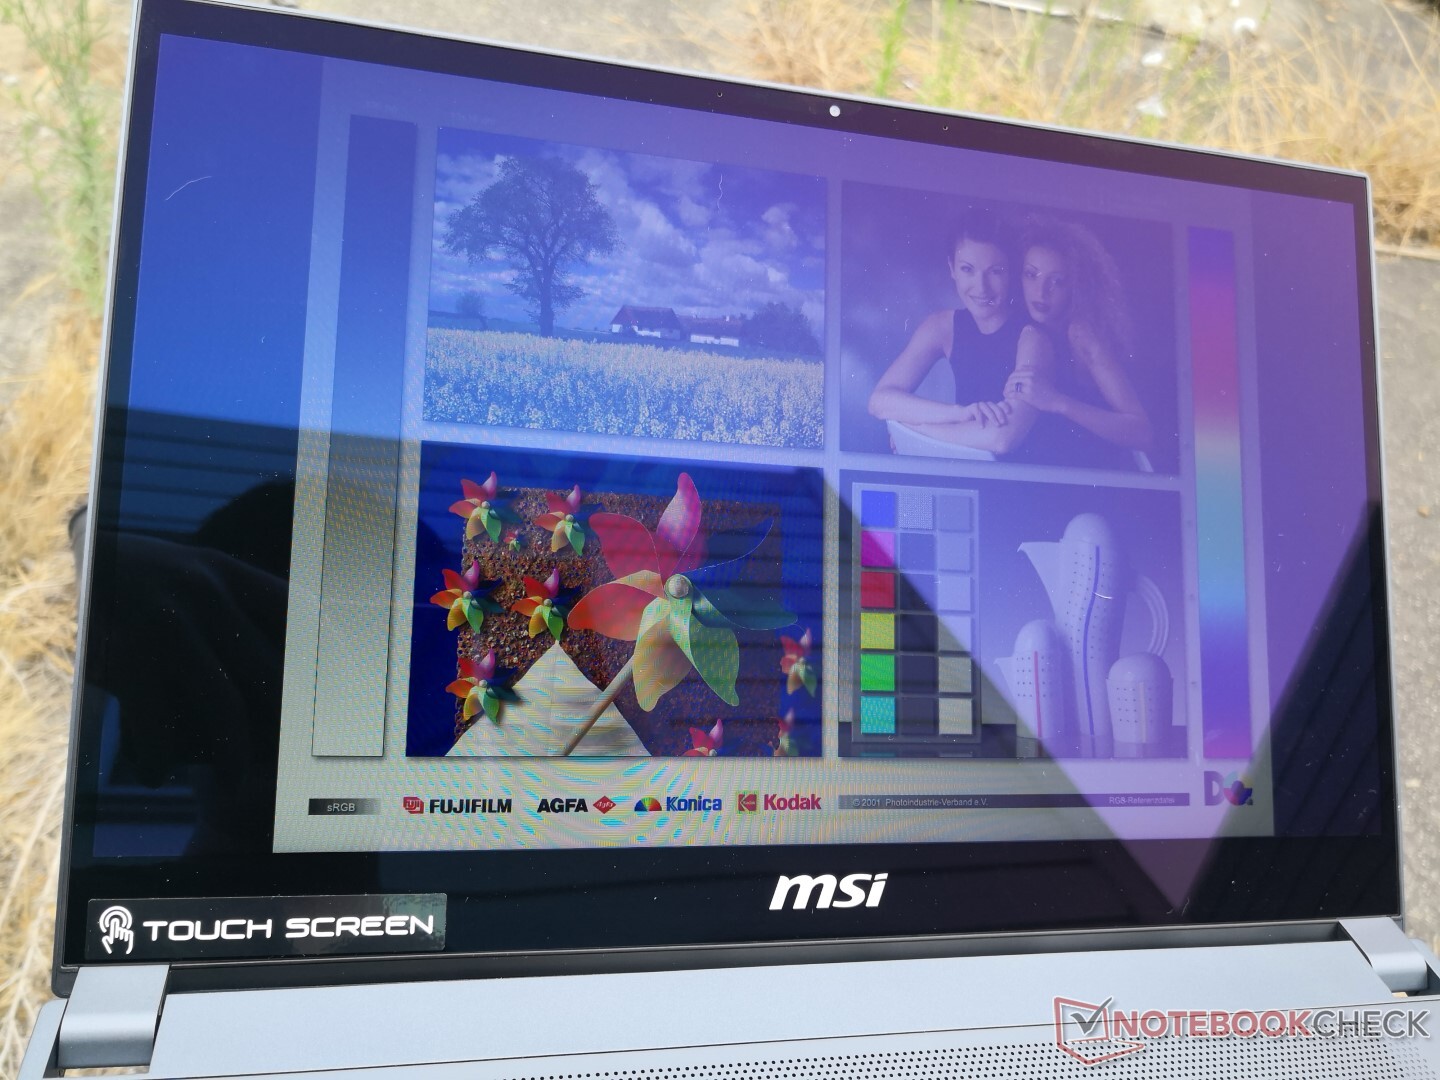
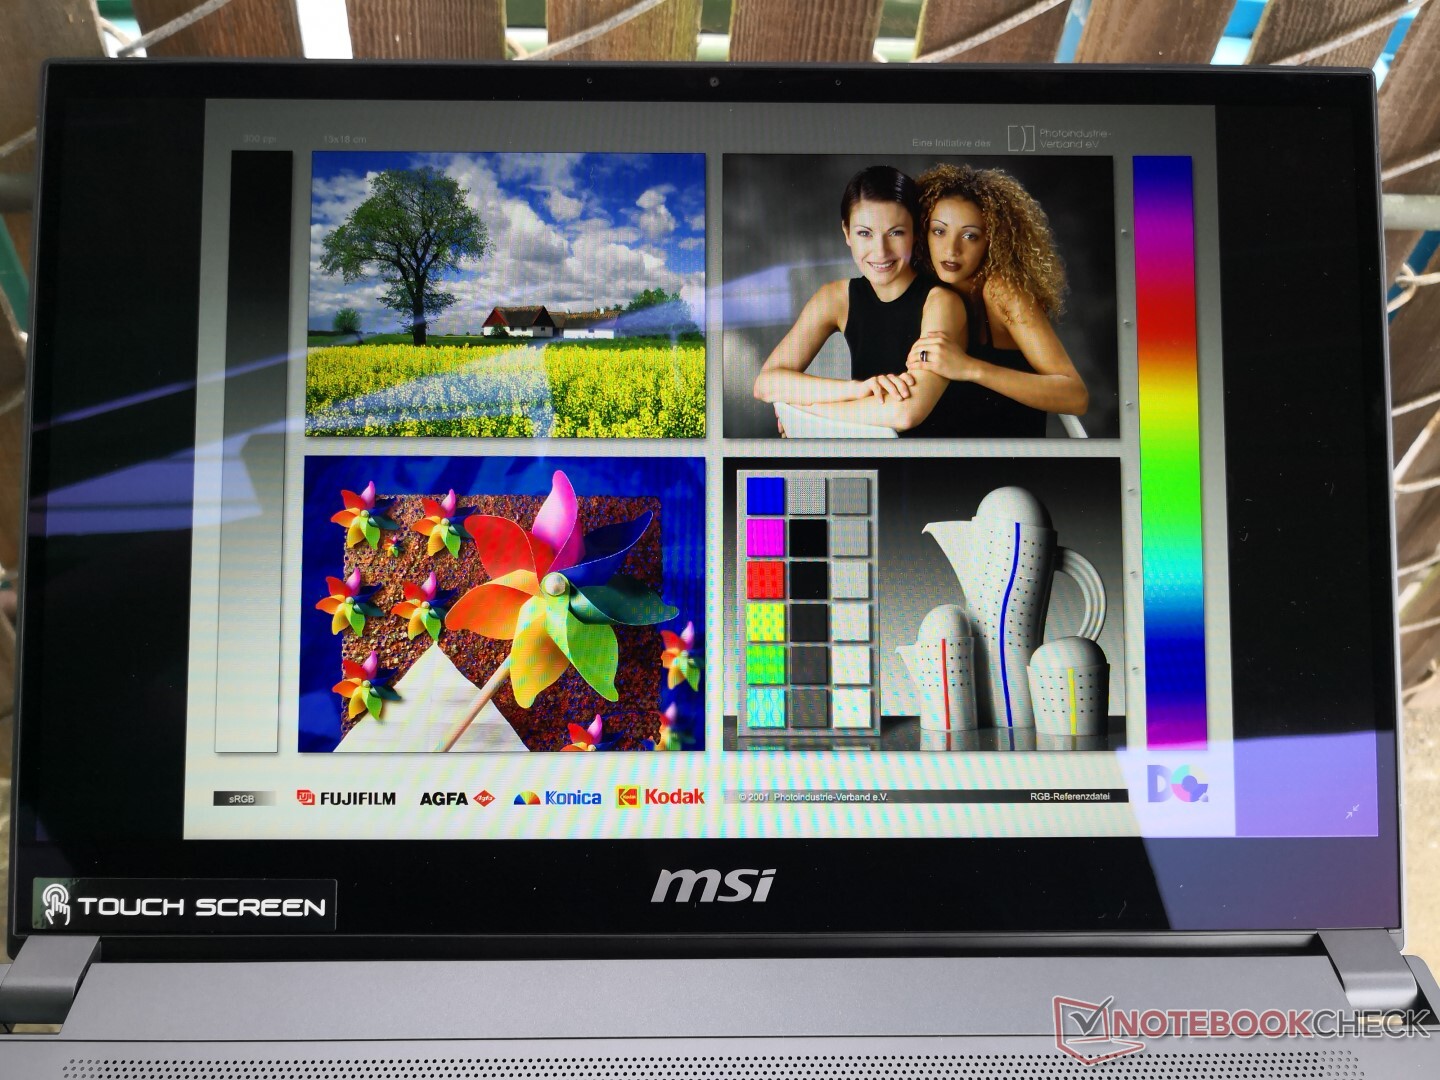
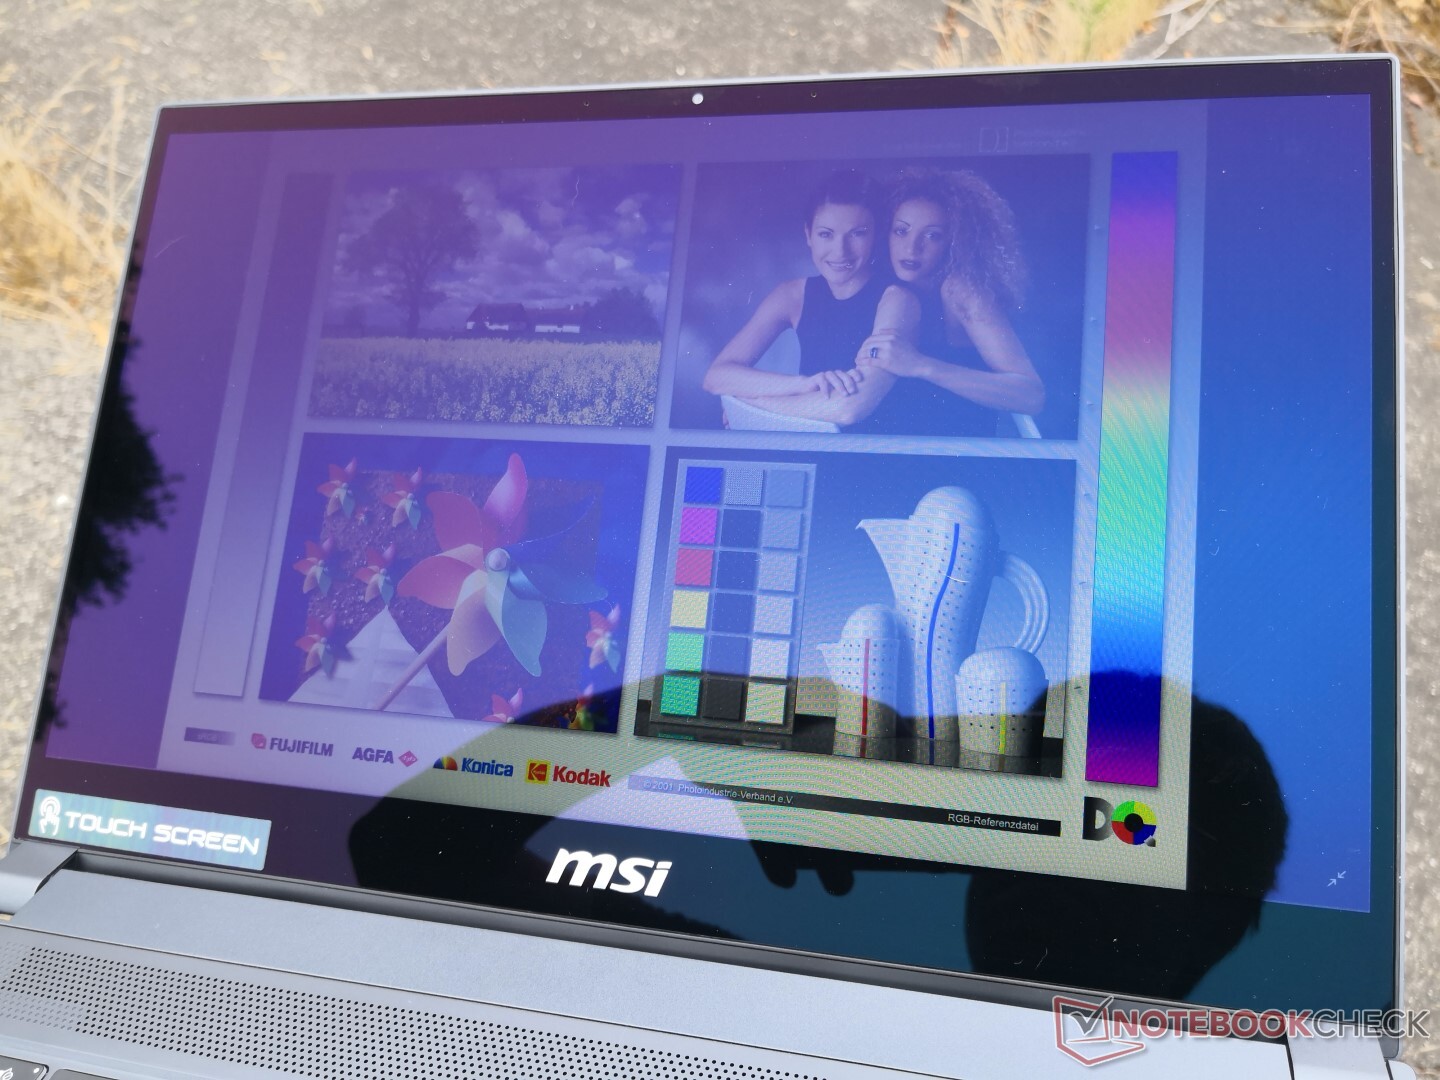
Im Freien ist die Sichtbarkeit noch in Ordnung solange man im Schatten bleibt. Helles Sonnenlicht überfordert aber das Display, welches den Nutzer dann blendet. Anders als bei den meisten anderen IPS-Laptops gibt das spiegelnde Panel eine leichte, violette Reflexion ab, was die Farben beim Blick von den Seiten beeinflusst.
Leistung
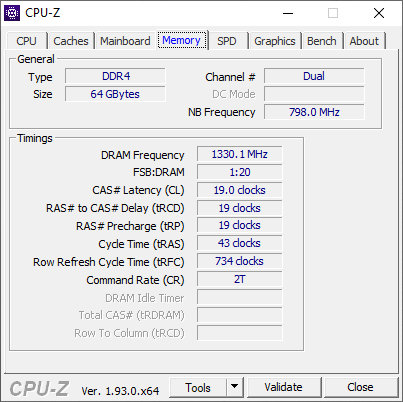
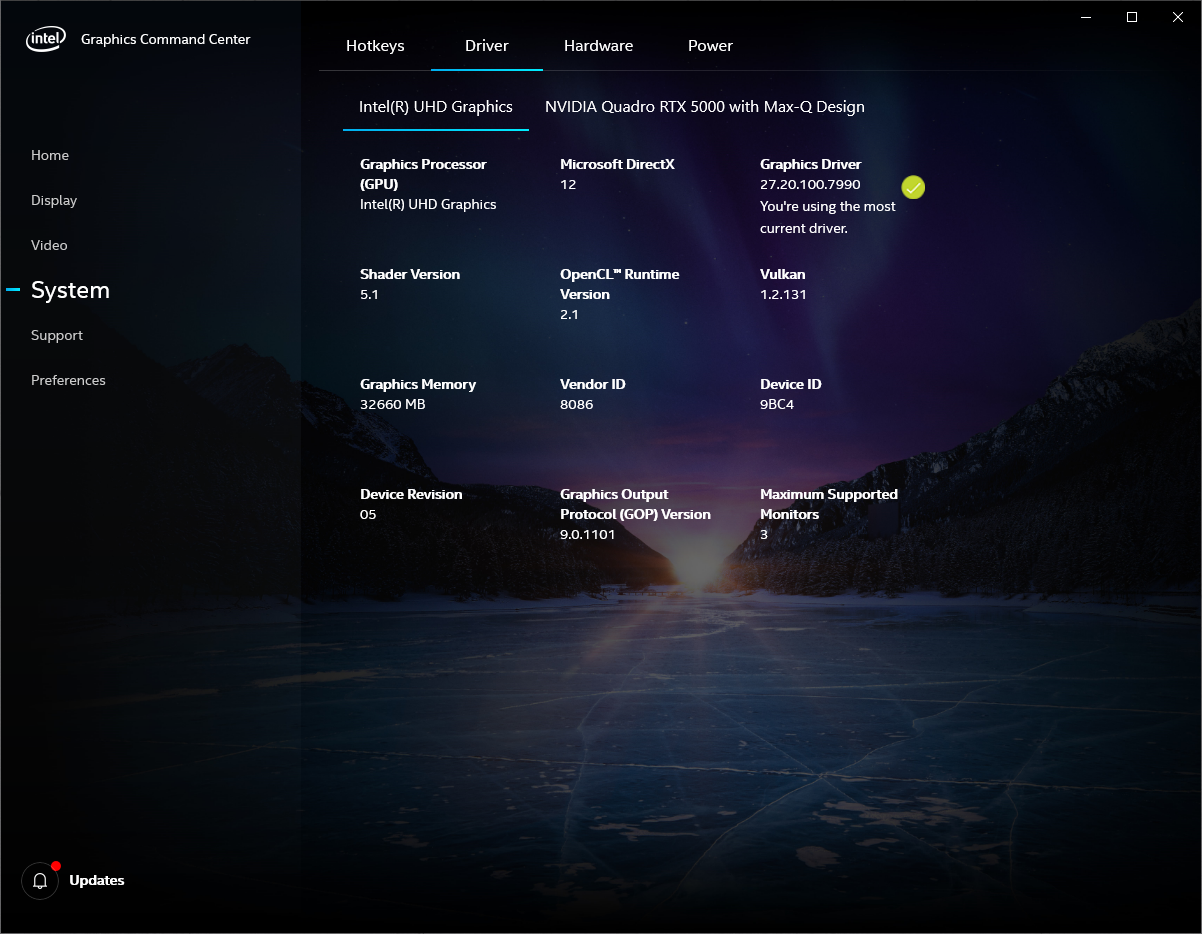
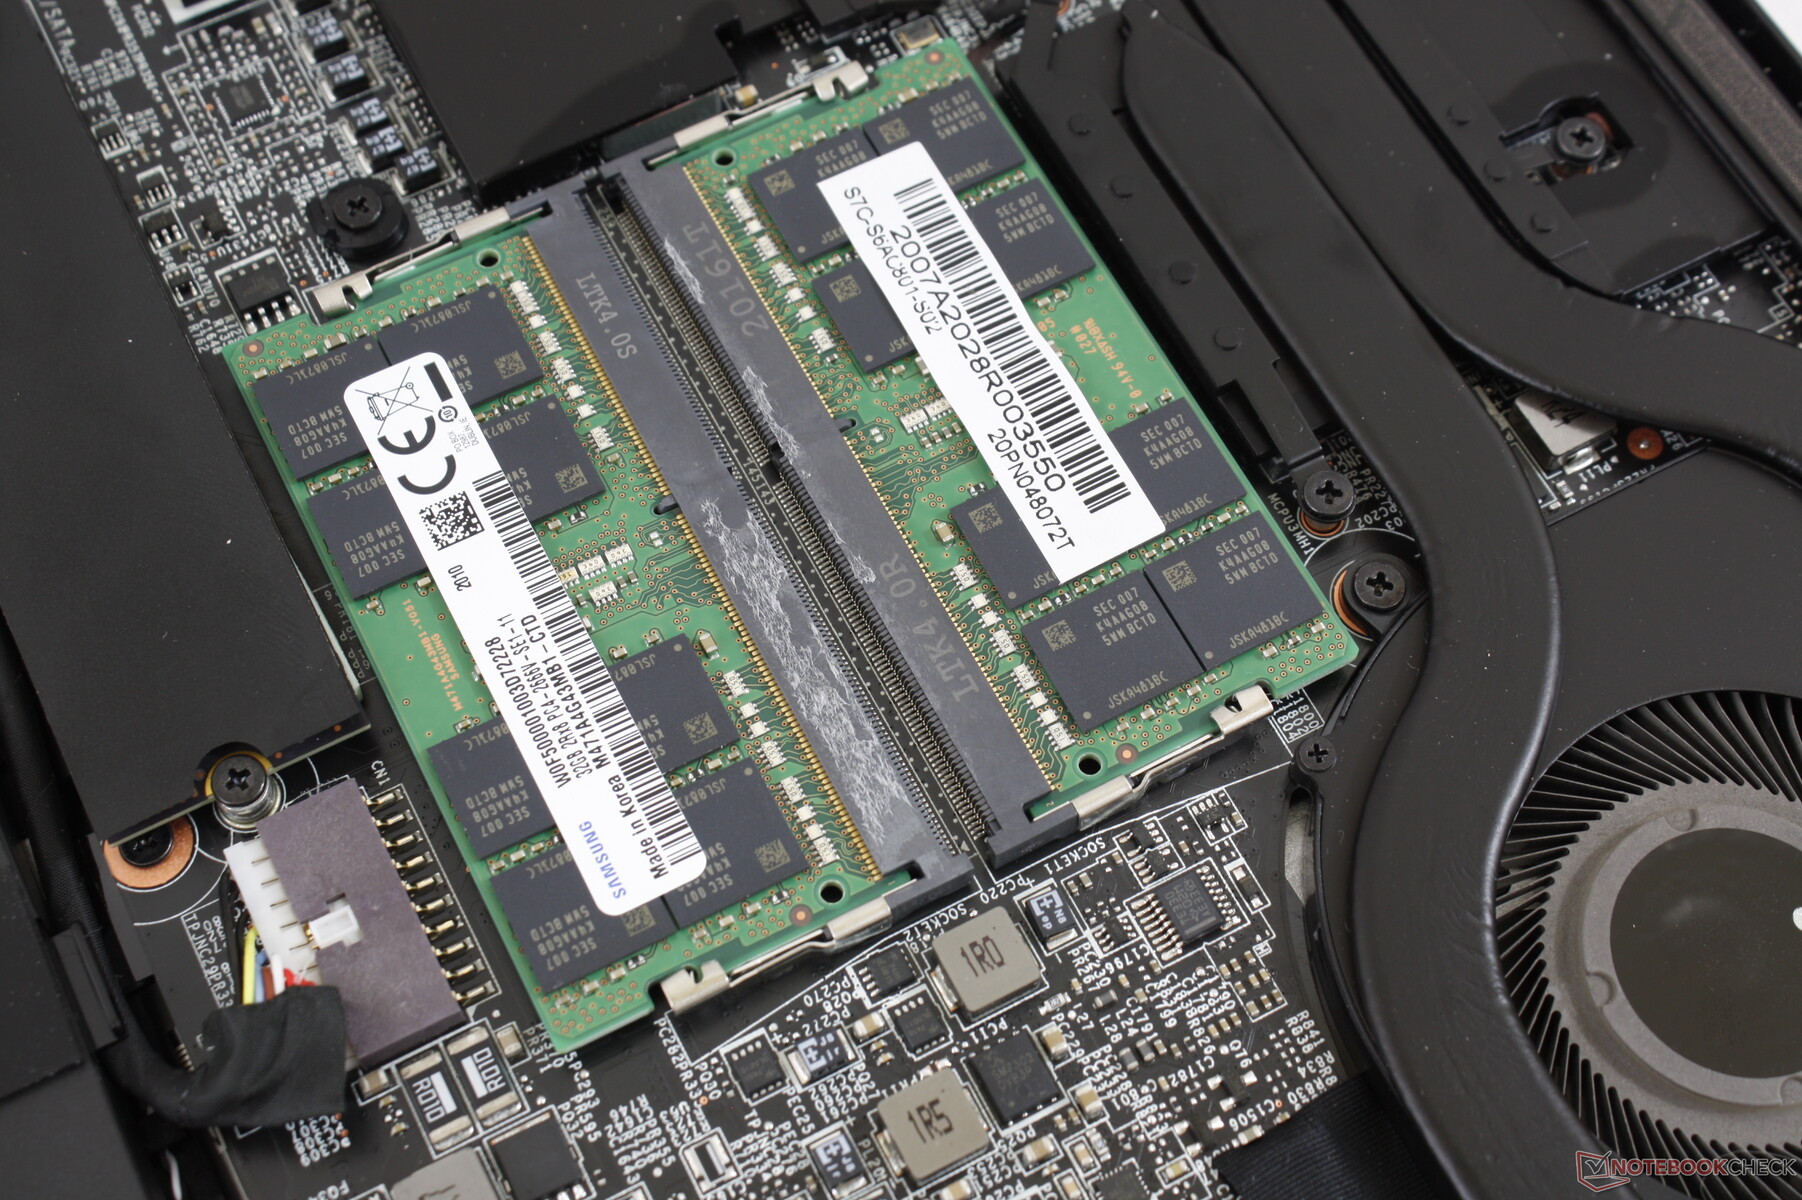
Während das Razer Blade 15 Studio auf einen Core i7-10875H festgelegt ist, bietet das WS66 sowohl Xeon- als auch Core-i9-Optionen. Das bringt neben einer ECC-RAM-Unterstützung auch eine schnellere Leistung. Der RAM kann bis zu 64 GB bestückt werden, bei vollwertigen Workstations, wie dem Dell Precision 7550, sind oftmals 128 GB möglich. Nvidia Optimus ist für einen automatischen Wechsel zwischen integrierter und dedizierter Grafikeinheit standardmäßig mit an Bord.
Für unsere Performancebenchmarks haben wir MSIs eigenen Ultra-Performance-Modus mit aktiviertem Cooler Boost aktiviert, um die höchst möglichen Ergebnisse zu erzielen.
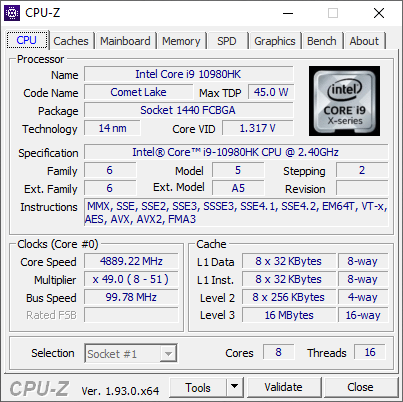
Prozessor
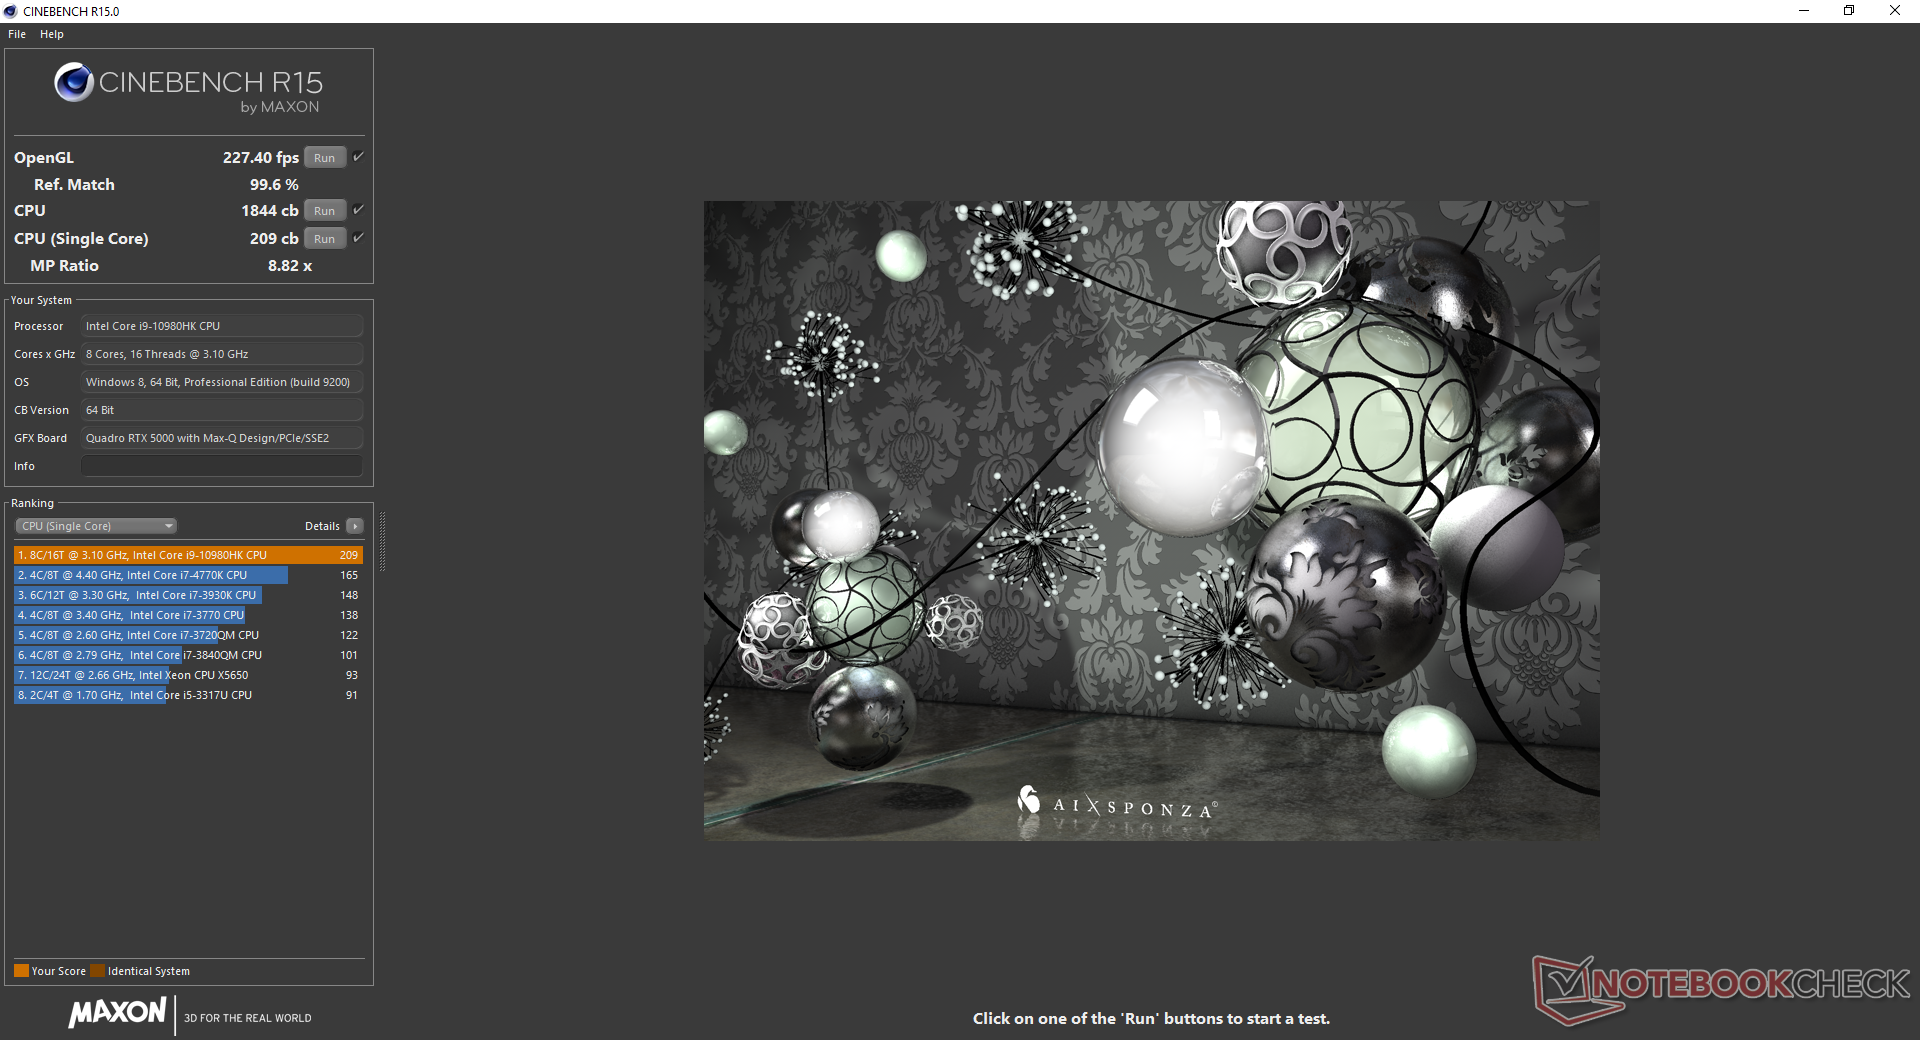
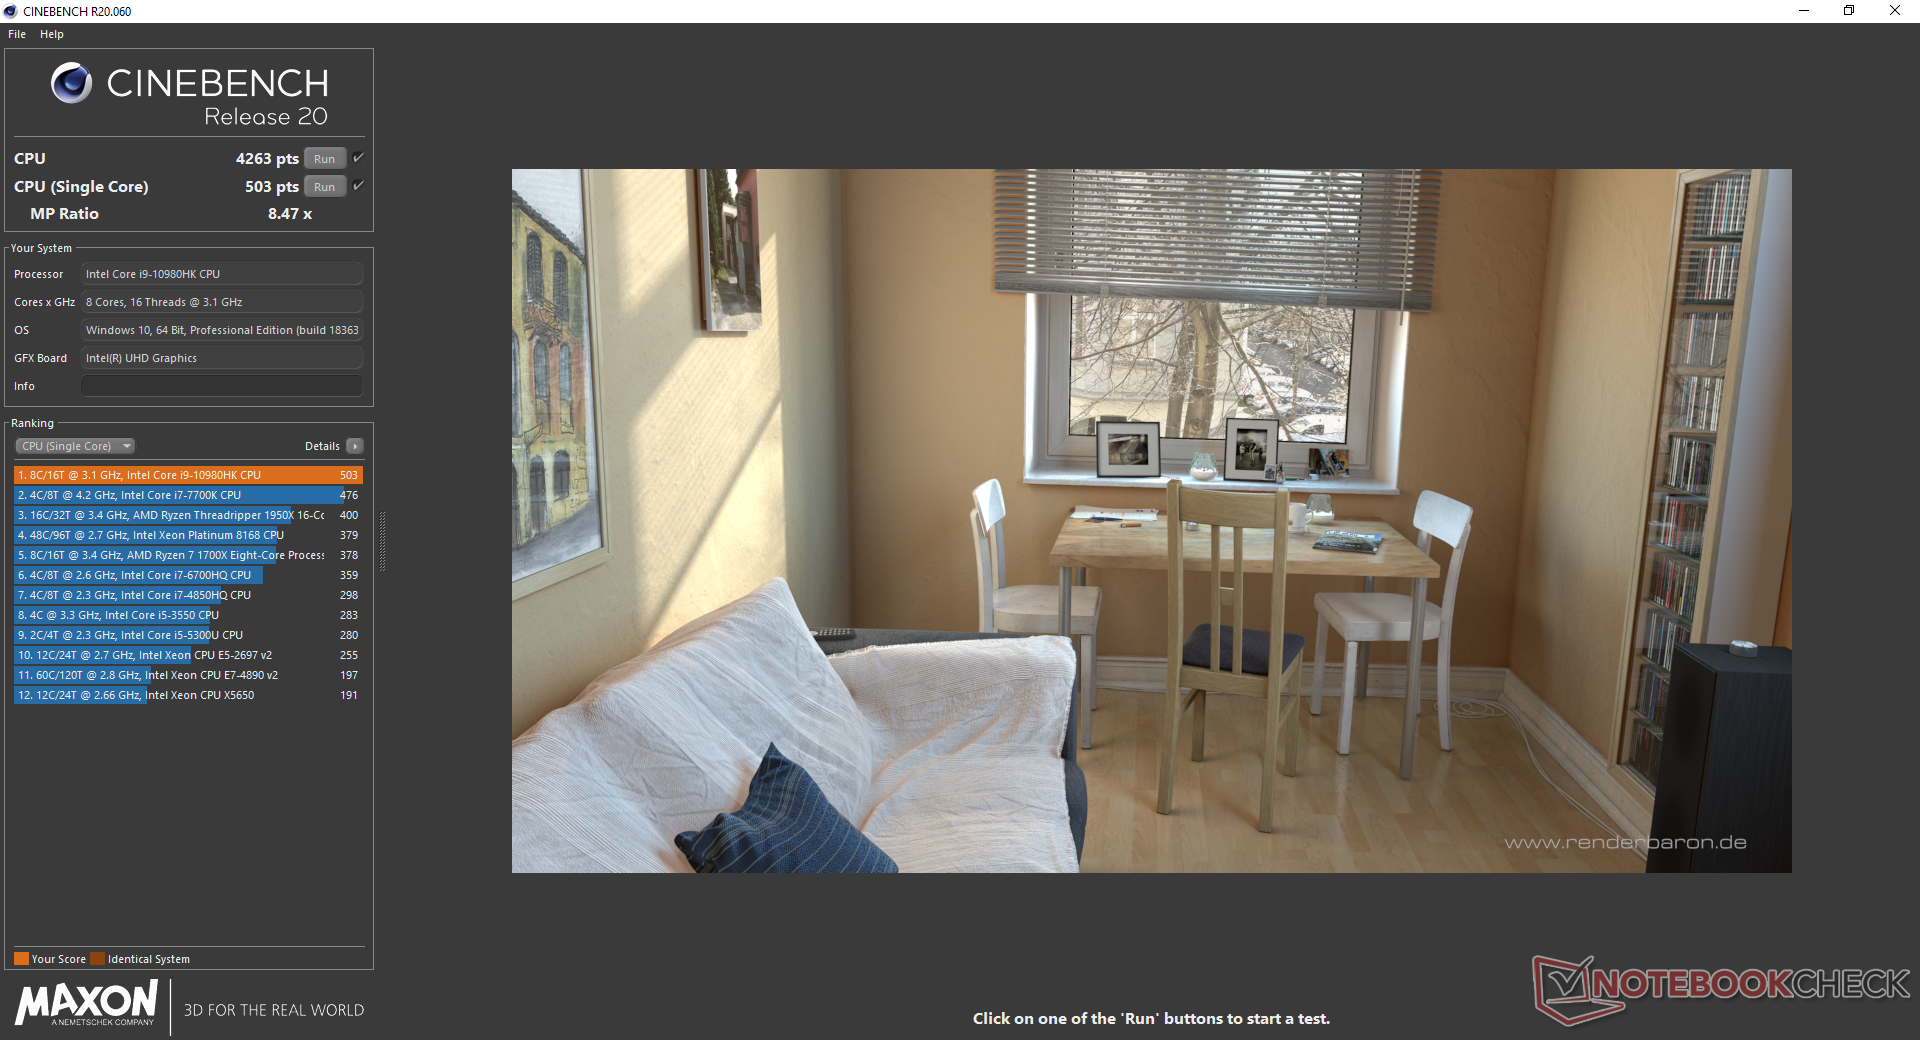
Die reine CPU-Leistung ist exzellent, im CineBench-Multi-Thread ist der Score um 25 bis 30 Prozent höher als der des unterdurchschnittlich aufspielenden Core i7-10875H im Razer Blade 15 Studio. In unserem Cinebench-R15-xT-Loop verliert das WS66 nur etwa 10 Prozent an Leistung zum Ausgangswert, was ebenfalls positiv ist. Wer lieber eine Intel-Xeon-CPU wählt, muss sich auf eine leicht schwächere Leistung einstellen, genießt dann aber die Vorteile von ECC-RAM.
Unsere Extraseite zum Core i9-10980HK enthält mehr technische Informationen und Benchmarkvergleiche.
Cinebench R15: CPU Single 64Bit | CPU Multi 64Bit
Blender: v2.79 BMW27 CPU
7-Zip 18.03: 7z b 4 -mmt1 | 7z b 4
Geekbench 5.5: Single-Core | Multi-Core
HWBOT x265 Benchmark v2.2: 4k Preset
LibreOffice : 20 Documents To PDF
R Benchmark 2.5: Overall mean
| Cinebench R20 / CPU (Multi Core) | |
| Intel Core i9-9900KS, Nvidia Titan RTX | |
| Eluktronics RP-15 | |
| MSI WS66 10TMT-207US | |
| Durchschnittliche Intel Core i9-10980HK (3526 - 4487, n=13) | |
| Dell Precision 7550 | |
| Dell Precision 5550 P91F | |
| Razer Blade 15 RTX 2070 Super Max-Q | |
| HP Envy 15-ep0098nr | |
| Acer ConceptD 9 Pro | |
| Acer ConceptD 3 Pro CN315-71P-73W1 | |
| Cinebench R20 / CPU (Single Core) | |
| Intel Core i9-9900KS, Nvidia Titan RTX | |
| Acer ConceptD 9 Pro | |
| MSI WS66 10TMT-207US | |
| Dell Precision 5550 P91F | |
| Eluktronics RP-15 | |
| Razer Blade 15 RTX 2070 Super Max-Q | |
| Dell Precision 7550 | |
| Durchschnittliche Intel Core i9-10980HK (465 - 507, n=13) | |
| Acer ConceptD 3 Pro CN315-71P-73W1 | |
| HP Envy 15-ep0098nr | |
| Cinebench R15 / CPU Single 64Bit | |
| Intel Core i9-9900KS, Nvidia Titan RTX | |
| MSI WS66 10TMT-207US | |
| Dell Precision 7550 | |
| Durchschnittliche Intel Core i9-10980HK (198 - 219, n=15) | |
| Dell Precision 5550 P91F | |
| Razer Blade 15 RTX 2070 Super Max-Q | |
| Acer ConceptD 9 Pro | |
| HP Envy 15-ep0098nr | |
| Eluktronics RP-15 | |
| Acer ConceptD 3 Pro CN315-71P-73W1 | |
| Cinebench R15 / CPU Multi 64Bit | |
| Intel Core i9-9900KS, Nvidia Titan RTX | |
| Eluktronics RP-15 | |
| Durchschnittliche Intel Core i9-10980HK (1606 - 1862, n=15) | |
| MSI WS66 10TMT-207US | |
| Dell Precision 7550 | |
| Acer ConceptD 9 Pro | |
| Dell Precision 5550 P91F | |
| Razer Blade 15 RTX 2070 Super Max-Q | |
| HP Envy 15-ep0098nr | |
| Acer ConceptD 3 Pro CN315-71P-73W1 | |
| Blender / v2.79 BMW27 CPU | |
| Acer ConceptD 3 Pro CN315-71P-73W1 | |
| HP Envy 15-ep0098nr | |
| Dell Precision 5550 P91F | |
| Razer Blade 15 RTX 2070 Super Max-Q | |
| Dell Precision 7550 | |
| Durchschnittliche Intel Core i9-10980HK (239 - 299, n=13) | |
| MSI WS66 10TMT-207US | |
| Eluktronics RP-15 | |
| Intel Core i9-9900KS, Nvidia Titan RTX | |
| 7-Zip 18.03 / 7z b 4 -mmt1 | |
| Intel Core i9-9900KS, Nvidia Titan RTX | |
| Dell Precision 7550 | |
| Acer ConceptD 9 Pro | |
| Durchschnittliche Intel Core i9-10980HK (5081 - 5542, n=13) | |
| Dell Precision 5550 P91F | |
| MSI WS66 10TMT-207US | |
| Razer Blade 15 RTX 2070 Super Max-Q | |
| Eluktronics RP-15 | |
| Acer ConceptD 3 Pro CN315-71P-73W1 | |
| HP Envy 15-ep0098nr | |
| 7-Zip 18.03 / 7z b 4 | |
| Intel Core i9-9900KS, Nvidia Titan RTX | |
| Eluktronics RP-15 | |
| MSI WS66 10TMT-207US | |
| Dell Precision 7550 | |
| Durchschnittliche Intel Core i9-10980HK (43786 - 49275, n=13) | |
| Dell Precision 5550 P91F | |
| Acer ConceptD 9 Pro | |
| Razer Blade 15 RTX 2070 Super Max-Q | |
| HP Envy 15-ep0098nr | |
| Acer ConceptD 3 Pro CN315-71P-73W1 | |
| Geekbench 5.5 / Single-Core | |
| MSI WS66 10TMT-207US | |
| Durchschnittliche Intel Core i9-10980HK (1283 - 1401, n=12) | |
| Dell Precision 7550 | |
| Dell Precision 5550 P91F | |
| Acer ConceptD 9 Pro | |
| Razer Blade 15 RTX 2070 Super Max-Q | |
| HP Envy 15-ep0098nr | |
| Eluktronics RP-15 | |
| Acer ConceptD 3 Pro CN315-71P-73W1 | |
| Geekbench 5.5 / Multi-Core | |
| Eluktronics RP-15 | |
| Dell Precision 5550 P91F | |
| Dell Precision 7550 | |
| MSI WS66 10TMT-207US | |
| Durchschnittliche Intel Core i9-10980HK (7634 - 8666, n=12) | |
| Acer ConceptD 9 Pro | |
| Razer Blade 15 RTX 2070 Super Max-Q | |
| HP Envy 15-ep0098nr | |
| Acer ConceptD 3 Pro CN315-71P-73W1 | |
| HWBOT x265 Benchmark v2.2 / 4k Preset | |
| Intel Core i9-9900KS, Nvidia Titan RTX | |
| Eluktronics RP-15 | |
| Dell Precision 7550 | |
| MSI WS66 10TMT-207US | |
| Durchschnittliche Intel Core i9-10980HK (12 - 14.6, n=13) | |
| Razer Blade 15 RTX 2070 Super Max-Q | |
| Dell Precision 5550 P91F | |
| HP Envy 15-ep0098nr | |
| Acer ConceptD 3 Pro CN315-71P-73W1 | |
| LibreOffice / 20 Documents To PDF | |
| Eluktronics RP-15 | |
| Acer ConceptD 9 Pro | |
| Acer ConceptD 3 Pro CN315-71P-73W1 | |
| Durchschnittliche Intel Core i9-10980HK (44 - 89, n=13) | |
| HP Envy 15-ep0098nr | |
| Dell Precision 7550 | |
| Razer Blade 15 RTX 2070 Super Max-Q | |
| MSI WS66 10TMT-207US | |
| Dell Precision 5550 P91F | |
| R Benchmark 2.5 / Overall mean | |
| Acer ConceptD 3 Pro CN315-71P-73W1 | |
| HP Envy 15-ep0098nr | |
| Dell Precision 5550 P91F | |
| Razer Blade 15 RTX 2070 Super Max-Q | |
| Durchschnittliche Intel Core i9-10980HK (0.561 - 0.596, n=13) | |
| Eluktronics RP-15 | |
| MSI WS66 10TMT-207US | |
| Dell Precision 7550 | |
* ... kleinere Werte sind besser
System-Leistung
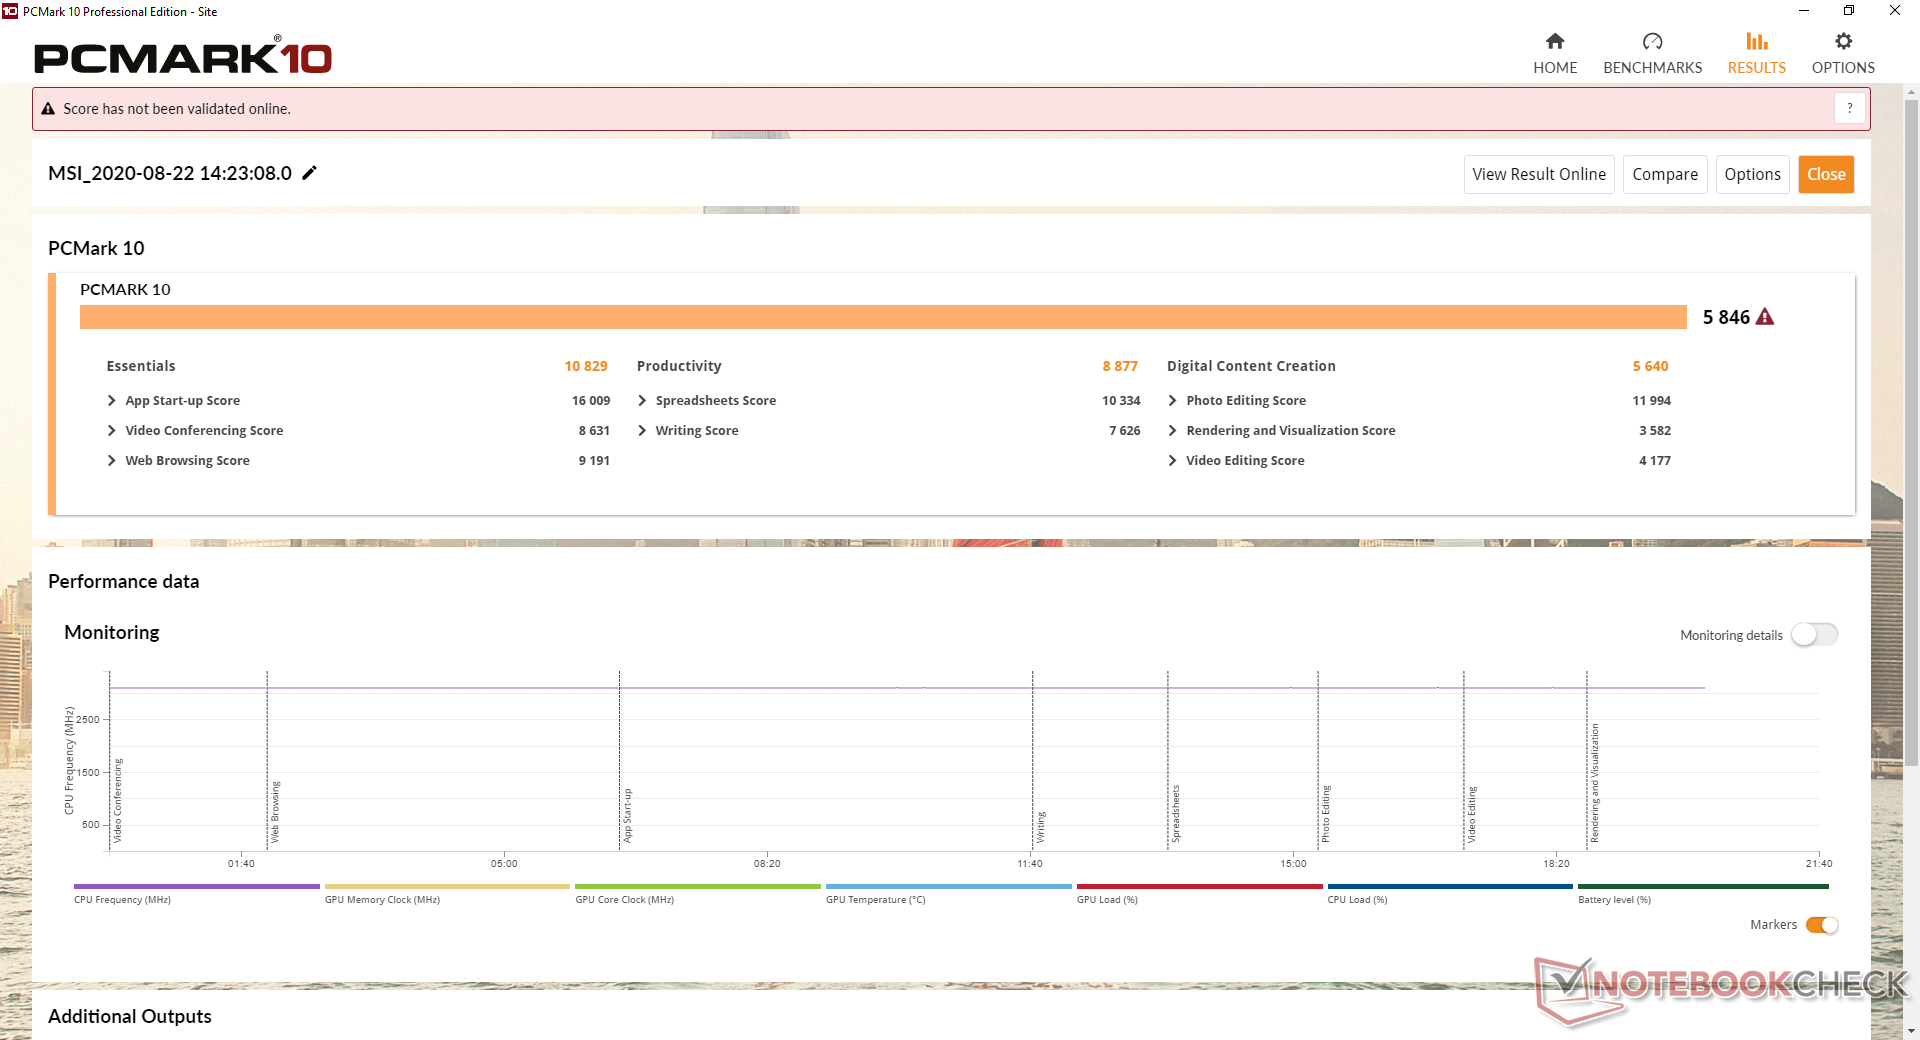
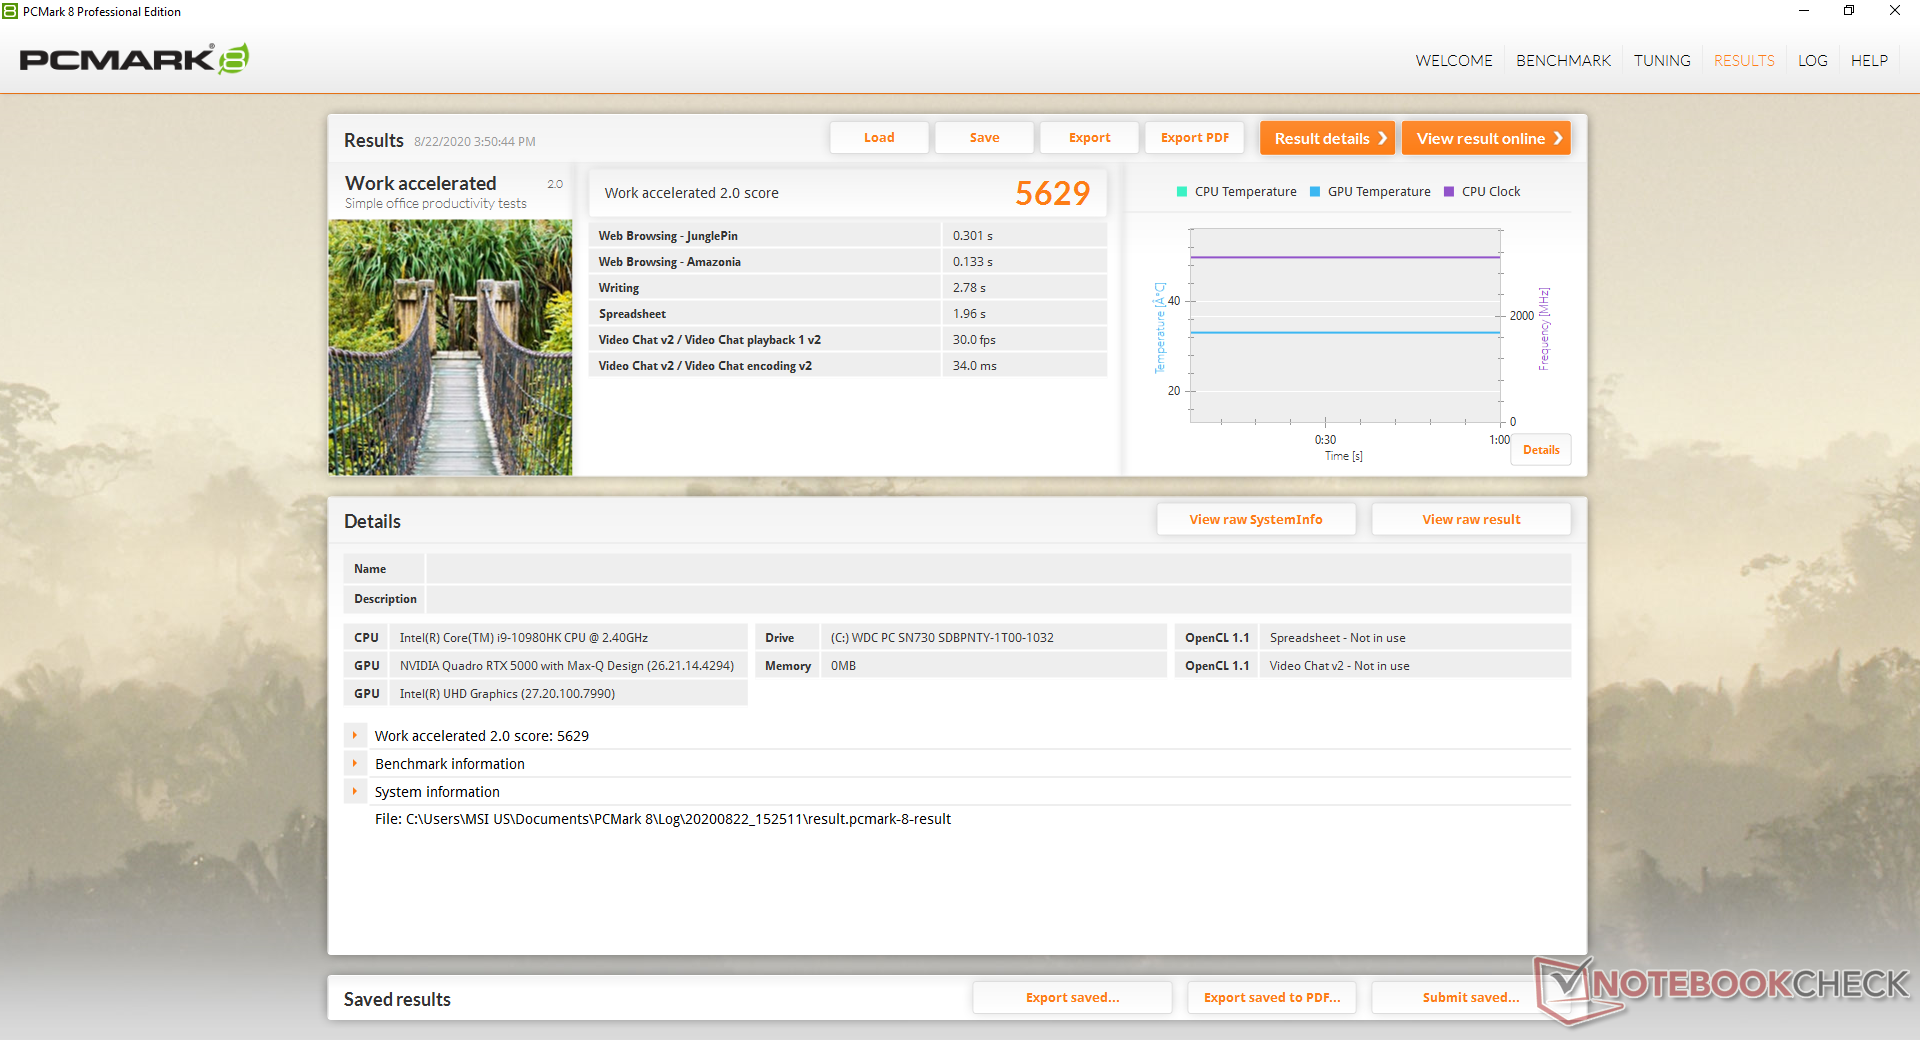
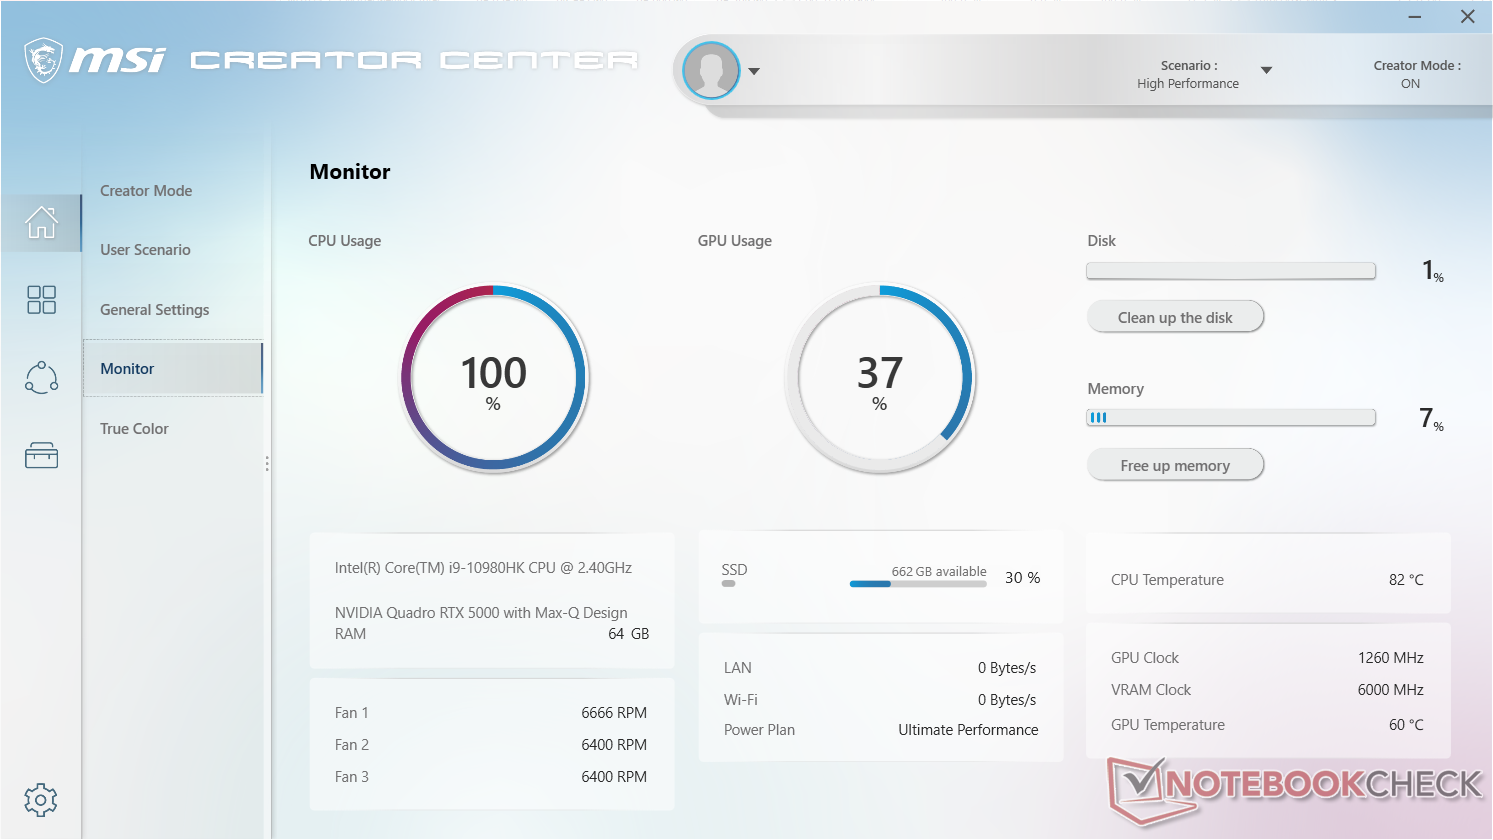
Auch in den PCMarks ist unser Testmodell konstant schneller als das Razer Blade 15 Studio, vermutlich vor allem durch die schnellere CPU-Leistung. Softwareprobleme waren im Test nicht existent, aber wir empfehlen jedem Nutzer sich mit dem MSI Creator Center auseinanderzusetzen, hier befinden sich nämlich die Optionen zur Lüfter- und Leistungssteuerung.
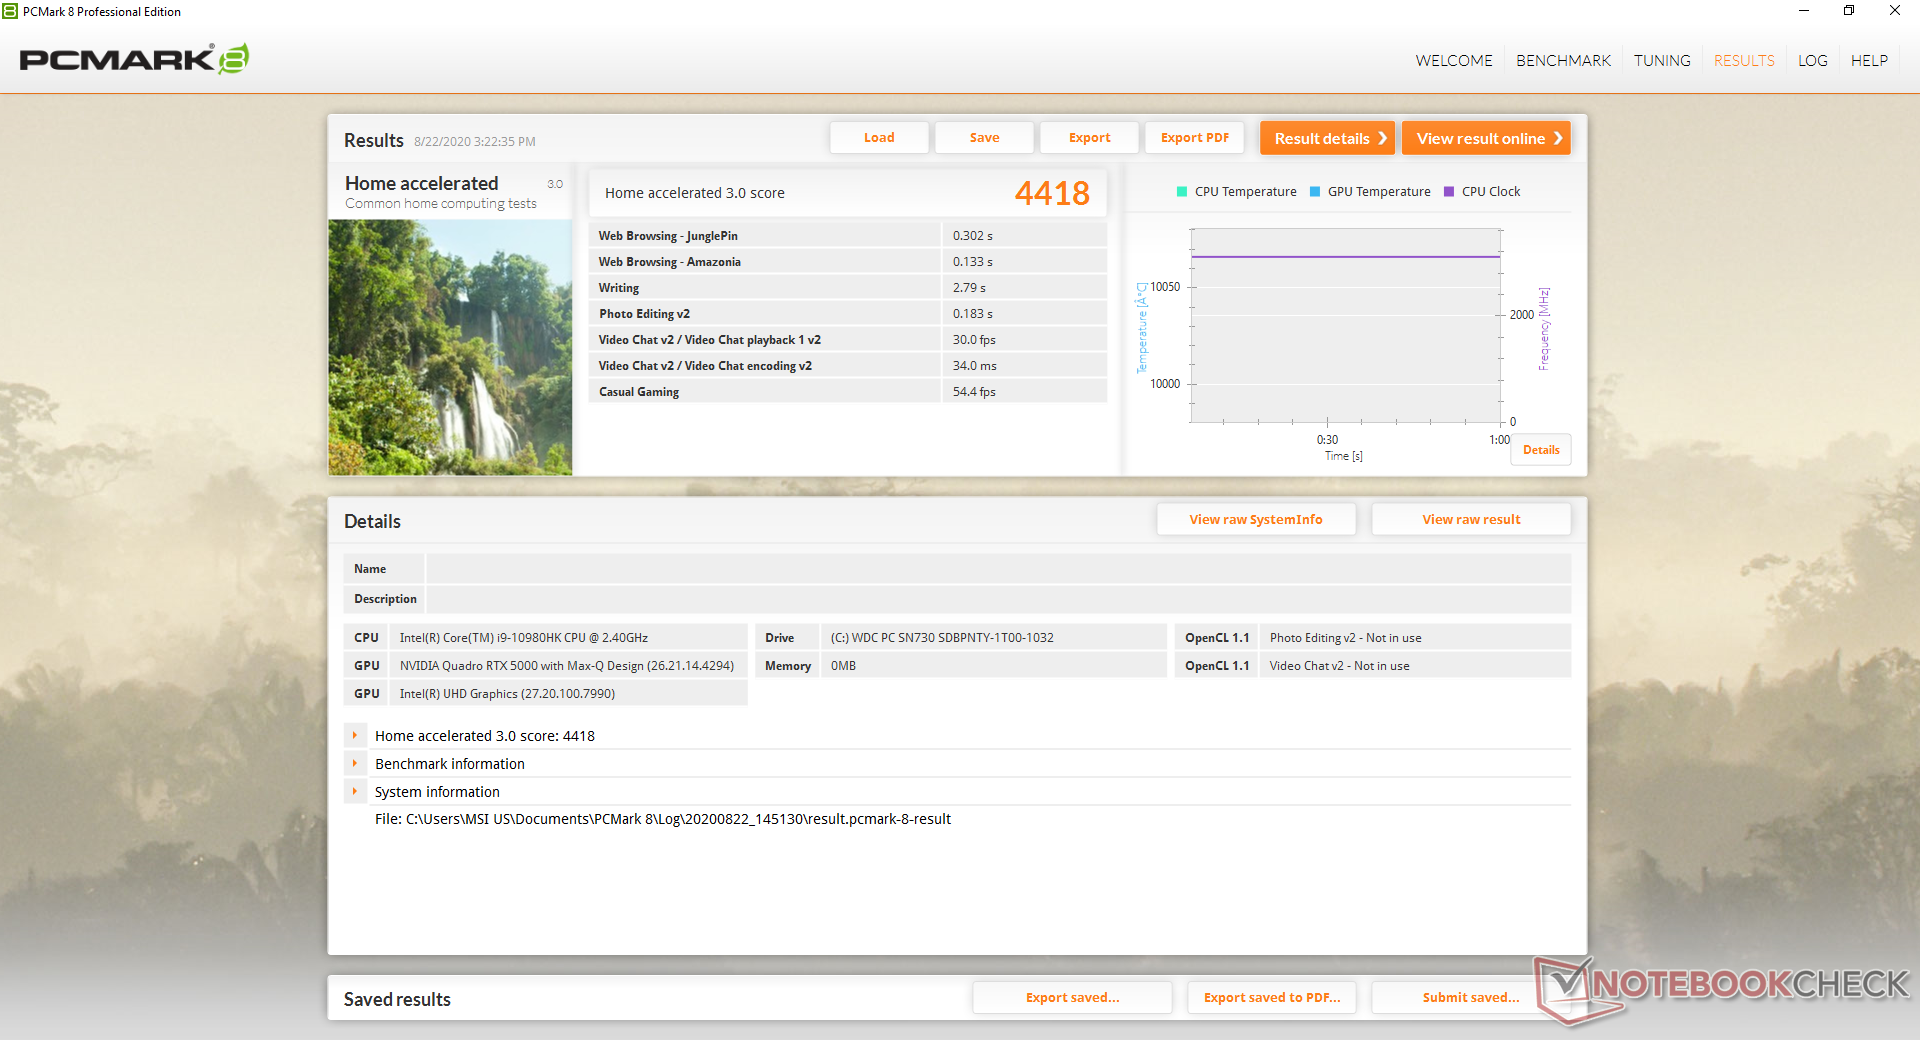
| PCMark 8 Home Score Accelerated v2 | 4418 Punkte | |
| PCMark 8 Work Score Accelerated v2 | 5629 Punkte | |
| PCMark 10 Score | 5846 Punkte | |
Hilfe | ||
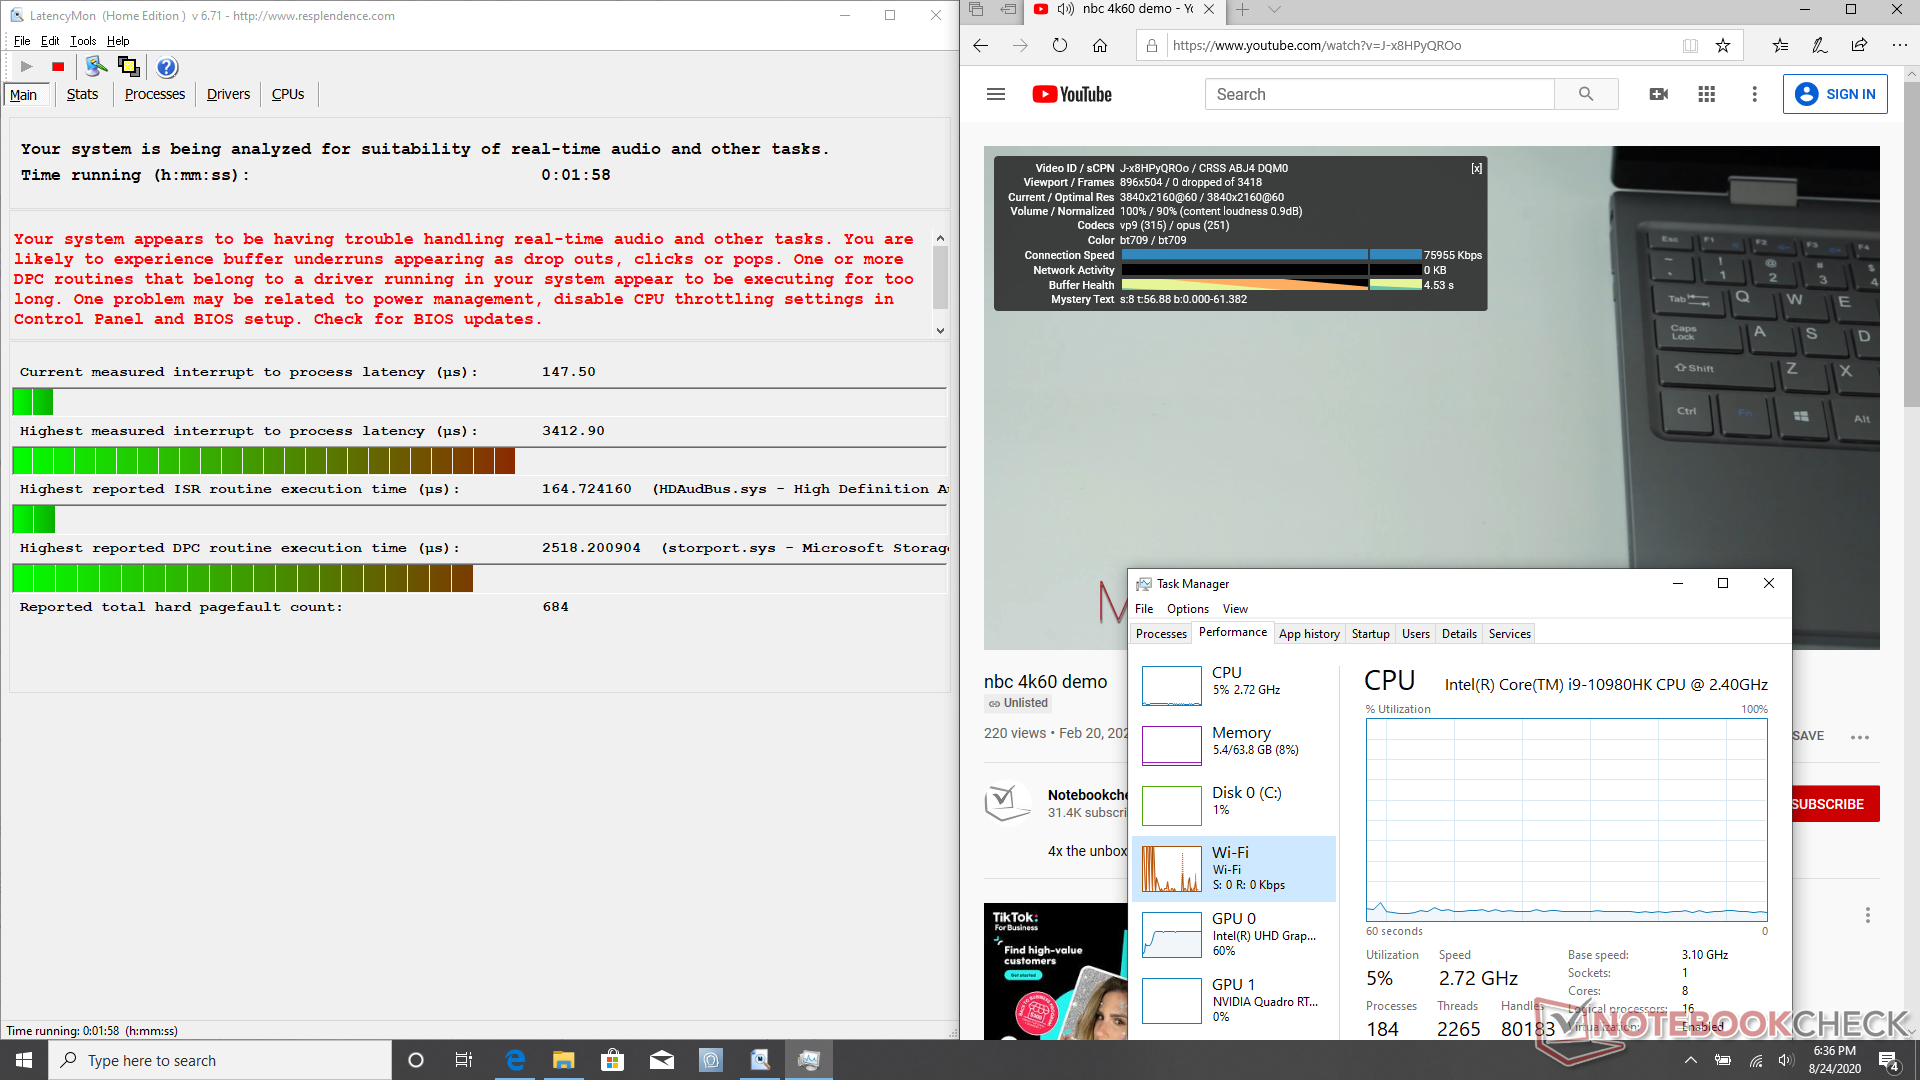
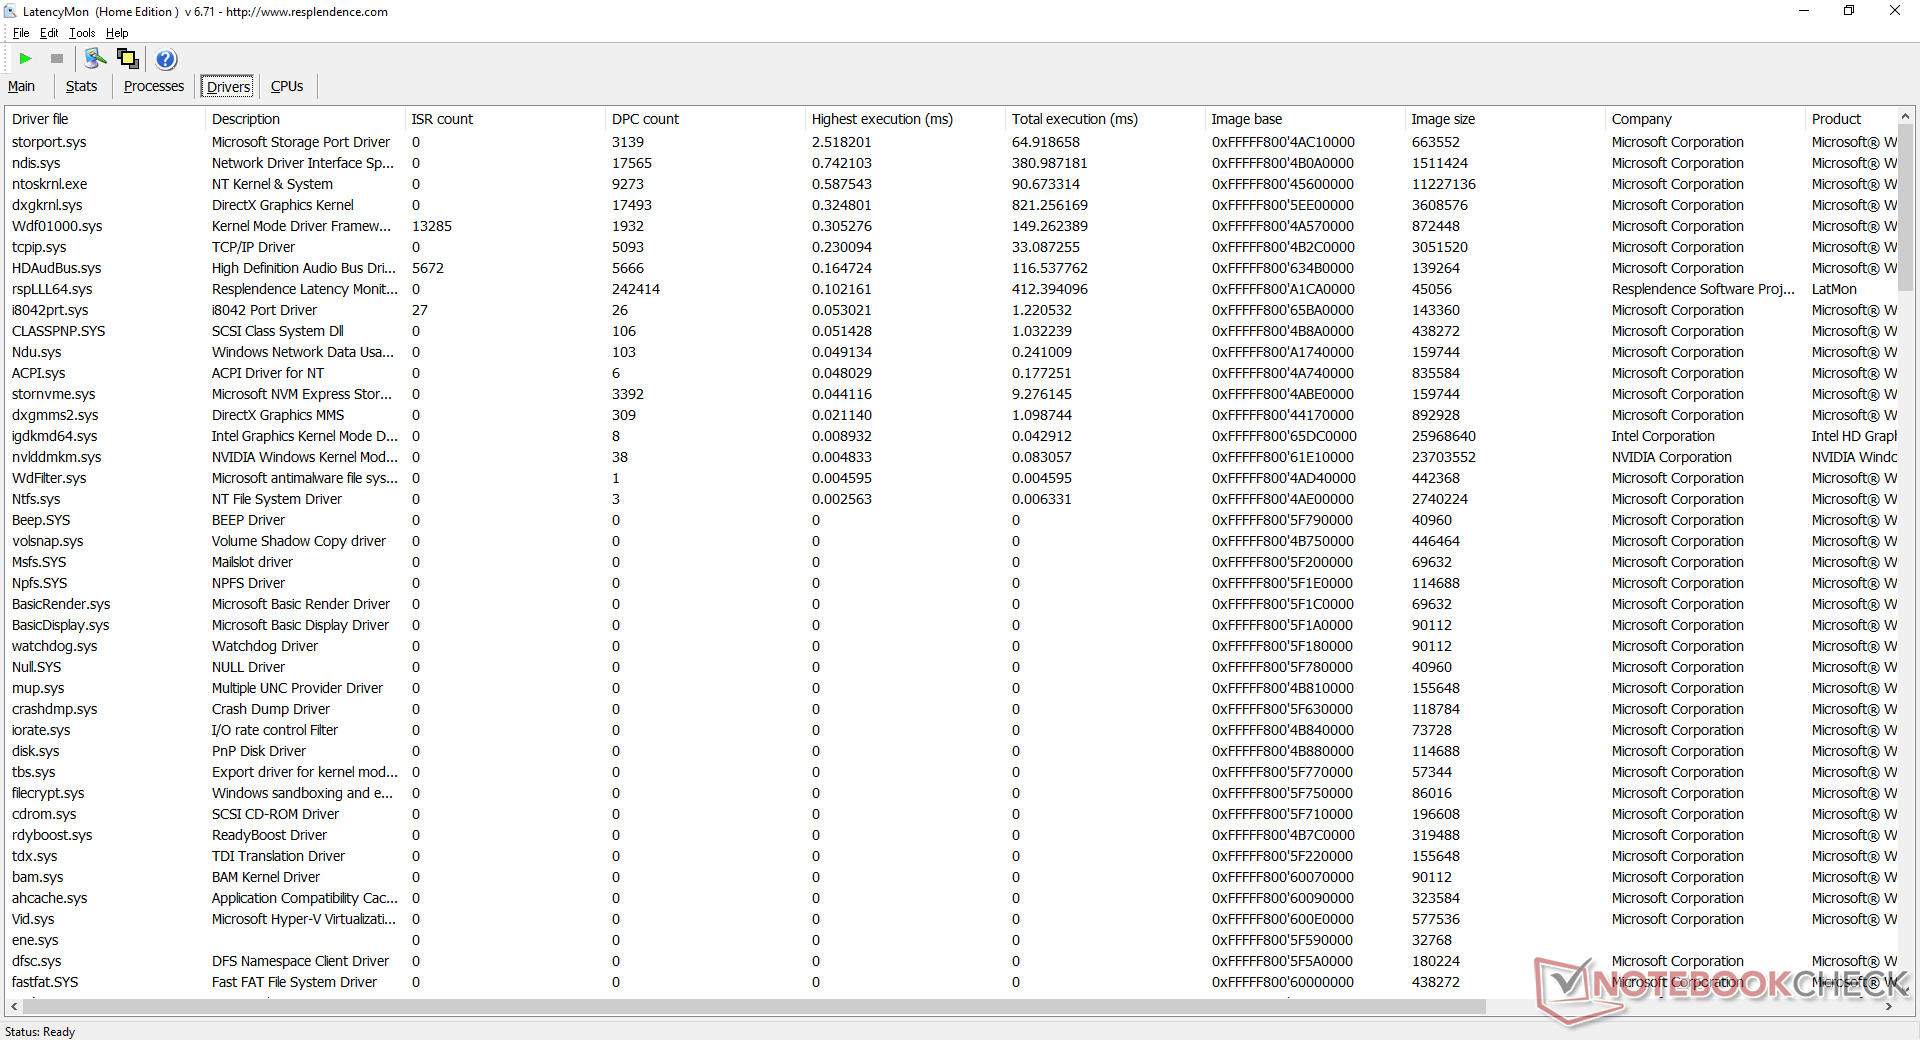
DPC Latency
LatencyMon offenbarte Probleme mit DPC-Latenzen beim Öffnen mehrerer Browsertabs, was bei einer Workstation besonders enttäuschend ist. Auf der anderen Seite wurde unser 4K60-YouTube-Video flüssig abgespielt und es gab keine Droped Frames.
| DPC Latencies / LatencyMon - interrupt to process latency (max), Web, Youtube, Prime95 | |
| Dell Precision 7550 | |
| MSI WS66 10TMT-207US | |
| Razer Blade 15 RTX 2070 Super Max-Q | |
| Acer ConceptD 3 Pro CN315-71P-73W1 | |
| Razer Blade 15 Studio Edition 2020 | |
| Dell Precision 5550 P91F | |
* ... kleinere Werte sind besser
Massenspeicher
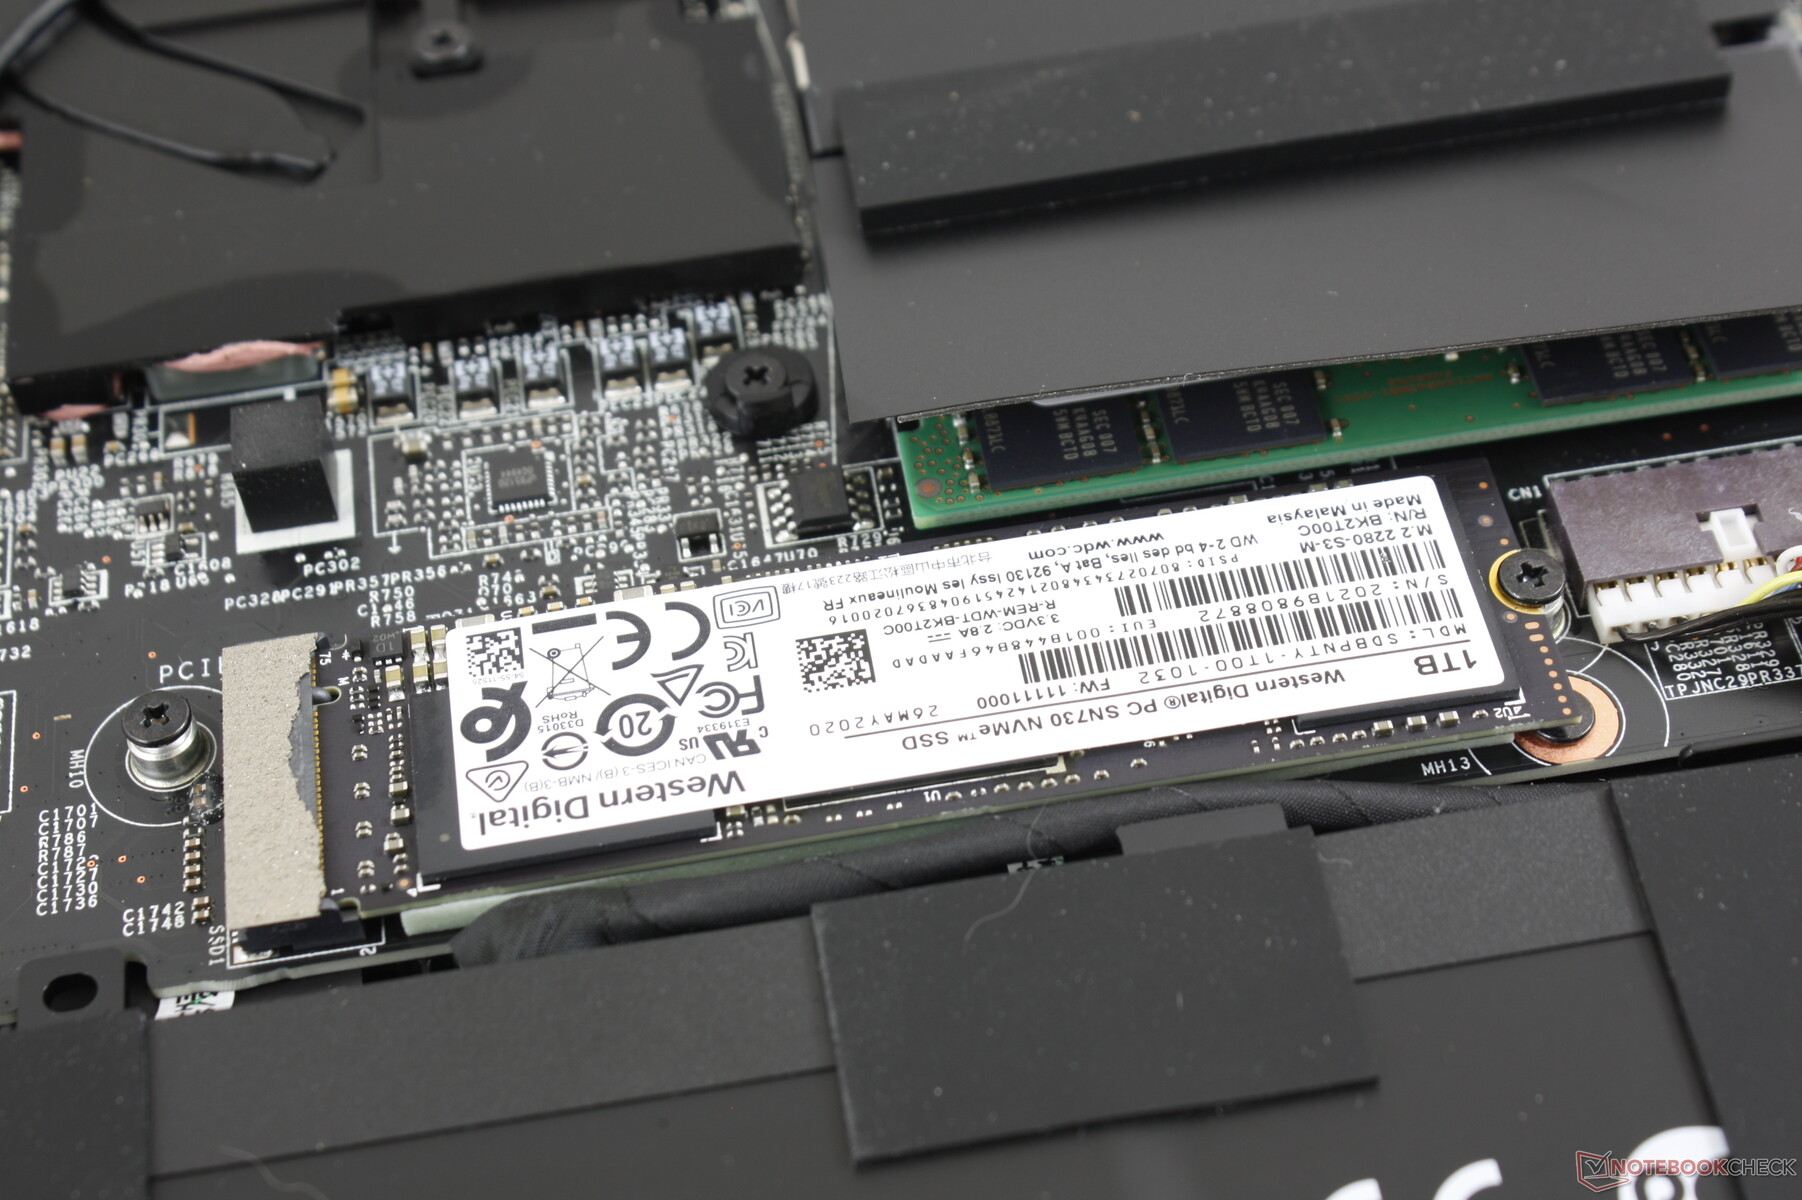
| MSI WS66 10TMT-207US WDC PC SN730 SDBPNTY-1T00 | Dell Precision 7550 SK Hynix PC601A NVMe 1TB | Dell Precision 5550 P91F SK Hynix PC601A NVMe 1TB | Razer Blade 15 Studio Edition 2020 Samsung PM981a MZVLB1T0HBLR | MSI WS63VR 7RL-023US Toshiba NVMe THNSN5512GPU7 | Acer ConceptD 3 Pro CN315-71P-73W1 WDC PC SN720 SDAPNTW-512G | |
|---|---|---|---|---|---|---|
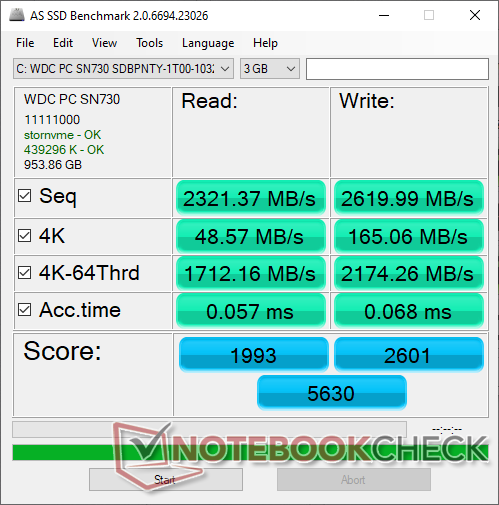
| AS SSD | -30% | -117% | -18% | -47% | -22% | |
| Seq Read (MB/s) | 2321 | 2028 -13% | 2039 -12% | 1982 -15% | 2133 -8% | 2973 28% |
| Seq Write (MB/s) | 2620 | 1193 -54% | 1376 -47% | 2252 -14% | 1287 -51% | 2429 -7% |
| 4K Read (MB/s) | 48.57 | 42.31 -13% | 44.11 -9% | 47.13 -3% | 40.2 -17% | 24.7 -49% |
| 4K Write (MB/s) | 165.1 | 105.5 -36% | 113.3 -31% | 88.2 -47% | 114.6 -31% | 115.3 -30% |
| 4K-64 Read (MB/s) | 1712 | 1128 -34% | 1094 -36% | 1481 -13% | 710 -59% | 1243 -27% |
| 4K-64 Write (MB/s) | 2174 | 1537 -29% | 1630 -25% | 1842 -15% | 314 -86% | 835 -62% |
| Access Time Read * (ms) | 0.057 | 0.069 -21% | 0.059 -4% | 0.087 -53% | 0.128 -125% | |
| Access Time Write * (ms) | 0.068 | 0.106 -56% | 0.99 -1356% | 0.04 41% | 0.033 51% | 0.034 50% |
| Score Read (Points) | 1993 | 1373 -31% | 1342 -33% | 1726 -13% | 962 -52% | 1565 -21% |
| Score Write (Points) | 2601 | 1762 -32% | 1881 -28% | 2155 -17% | 557 -79% | 1193 -54% |
| Score Total (Points) | 5630 | 3801 -32% | 3883 -31% | 4781 -15% | 1979 -65% | 3525 -37% |
| Copy ISO MB/s (MB/s) | 2589 | 1768 -32% | 2489 -4% | 1982 -23% | 2136 -17% | |
| Copy Program MB/s (MB/s) | 791 | 627 -21% | 682 -14% | 501 -37% | 489.6 -38% | |
| Copy Game MB/s (MB/s) | 1625 | 1477 -9% | 1515 -7% | 1140 -30% | 1163 -28% | |
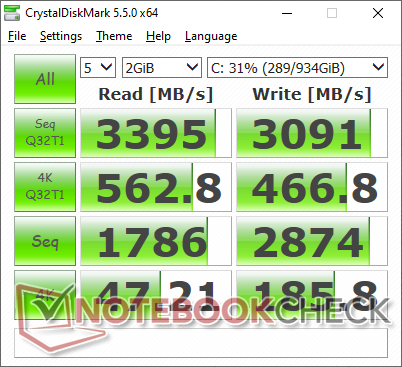
| CrystalDiskMark 5.2 / 6 | -16% | -17% | -6% | -27% | -19% | |
| Write 4K (MB/s) | 185.8 | 121 -35% | 122.6 -34% | 132.9 -28% | 157.1 -15% | 113.2 -39% |
| Read 4K (MB/s) | 47.21 | 42.16 -11% | 42.4 -10% | 46.73 -1% | 43.82 -7% | 31.1 -34% |
| Write Seq (MB/s) | 2874 | 2150 -25% | 2167 -25% | 2214 -23% | 1110 -61% | 2540 -12% |
| Read Seq (MB/s) | 1786 | 1755 -2% | 1747 -2% | 2018 13% | 1162 -35% | 2005 12% |
| Write 4K Q32T1 (MB/s) | 466.8 | 395.3 -15% | 388.8 -17% | 478.9 3% | 361.3 -23% | 331.4 -29% |
| Read 4K Q32T1 (MB/s) | 563 | 381.8 -32% | 367.3 -35% | 540 -4% | 563 0% | 368.3 -35% |
| Write Seq Q32T1 (MB/s) | 3091 | 2730 -12% | 2629 -15% | 2975 -4% | 1558 -50% | 2535 -18% |
| Read Seq Q32T1 (MB/s) | 3395 | 3468 2% | 3460 2% | 3195 -6% | 2635 -22% | 3427 1% |
| Durchschnitt gesamt (Programm / Settings) | -23% /
-25% | -67% /
-81% | -12% /
-14% | -37% /
-39% | -21% /
-21% |
* ... kleinere Werte sind besser

Disk Throttling: DiskSpd Read Loop, Queue Depth 8
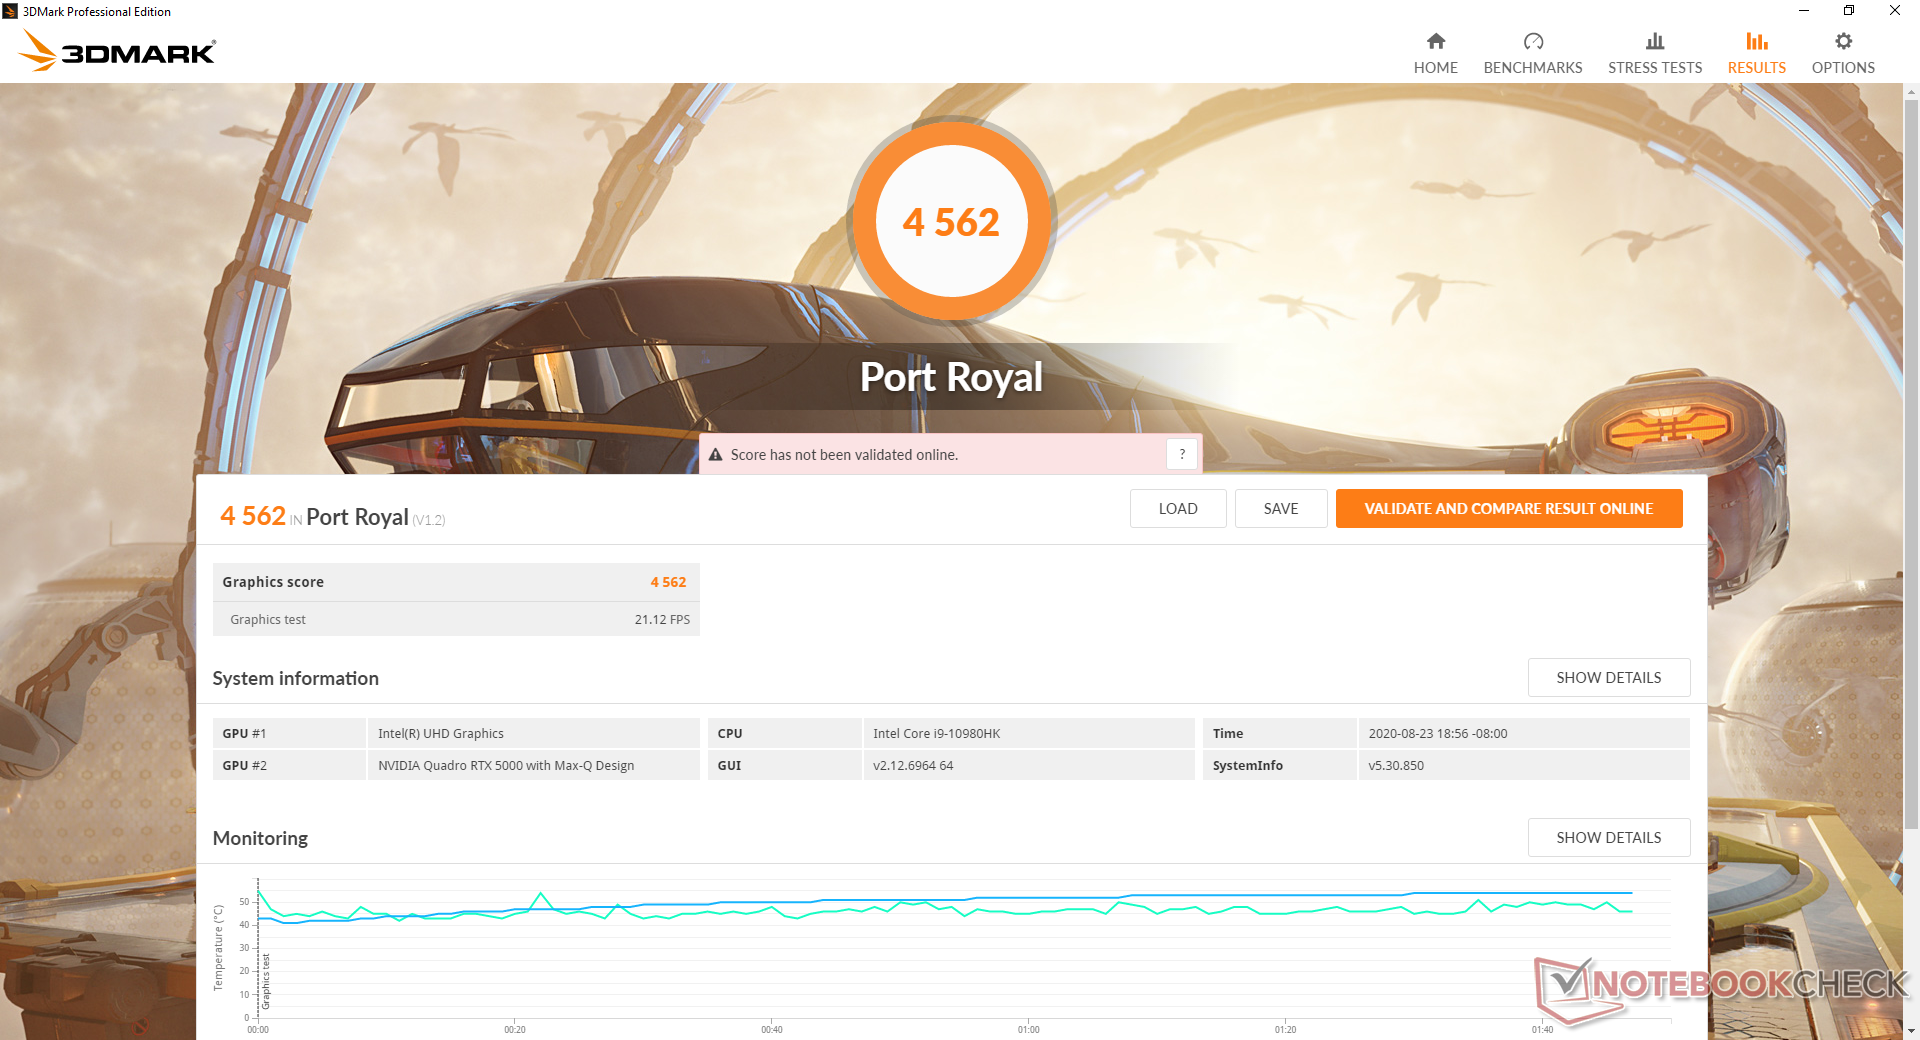
Grafikleistung
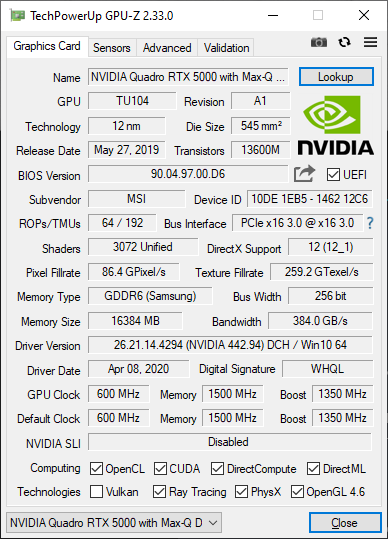
Die Quadro RTX 5000 Max-Qim WS66 leistet entsprechend dem Durchschnitt aller Laptops mit der gleichen GPU. Wer auf eine dickere Workstation mit der ungezügelten Quadro RTX 5000 umsteigt, wie sie zum Beispiel im Acer ConceptD 9 Pro oder im Eurocom Tornado F5W zu finden ist, erhält nochmals eine 30 bis 50 Prozent schnellere Grafikleistung.
Für mehr technische Informationen und Benchmarkvergleiche empfiehlt sich unsere Extraseite zur Quadro RTX 5000 Max-Q.
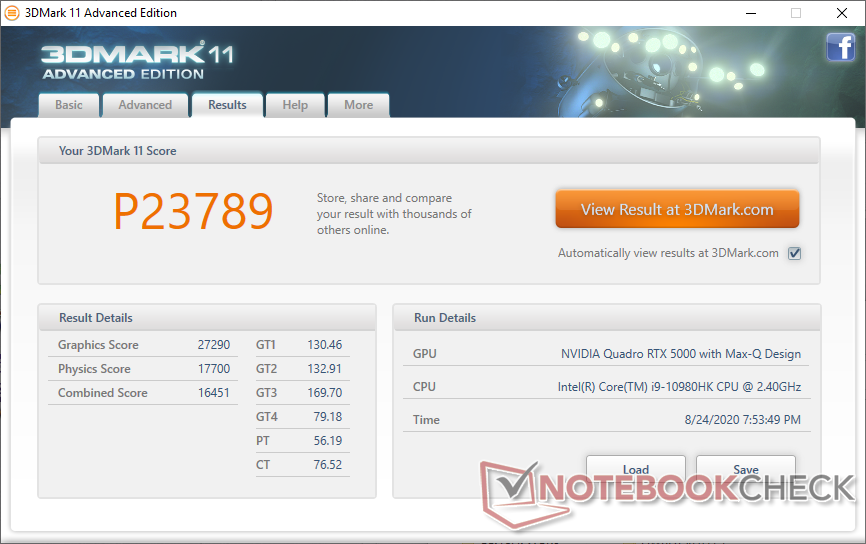


| 3DMark 11 Performance | 23789 Punkte | |
| 3DMark Cloud Gate Standard Score | 52005 Punkte | |
| 3DMark Fire Strike Score | 18226 Punkte | |
| 3DMark Time Spy Score | 7920 Punkte | |
Hilfe | ||
| min. | mittel | hoch | max. | |
|---|---|---|---|---|
| The Witcher 3 (2015) | 353.2 | 249.8 | 158.2 | 81.1 |
| Dota 2 Reborn (2015) | 161 | 143 | 130 | 122 |
| Final Fantasy XV Benchmark (2018) | 177 | 103 | 80.8 | |
| X-Plane 11.11 (2018) | 113 | 98.9 | 82 |
Emissionen
System-Lautstärke
Die Lüfter sind selbst im "Silent"-Modus immer aktiv und drehen bei mindestens 32 dB(A) bei einer Hintergrundlautstärke von 26 dB(A). Das war beim WS63 aus dem letzten Jahr nicht anders, weshalb die Vermutung naheliegt, dass sich beim Kühlsystem trotz des neuen Gehäuses nicht allzu viel getan hat. Dennoch empfiehlt sich der Silent-Modus fürs Surfen oder Videostreaming, denn bei anderen Profilen ändern die Lüfter ihre Umdrehungszahl deutlich häufiger.
Größere Lasten wie Witcher 3 haben ein zirkulierendes Lüftergeräusch zwischen 45.5 dB(A) und 47.4 d(A) zur Folge, wohlgemerkt bei deaktiviertem Cooler Boost. Ist Letzterer aktiv, dann "stabilisieren" sich die Ventilatorgeräusche erst bei 59.7 dB(A), was dem WS66 den unrühmlichen Titel einbringt eine der lautesten 15,6-Zoll-Workstations zu sein.

| MSI WS66 10TMT-207US Quadro RTX 5000 Max-Q, i9-10980HK, WDC PC SN730 SDBPNTY-1T00 | Dell Precision 7550 Quadro RTX 5000 Max-Q, W-10885M, SK Hynix PC601A NVMe 1TB | Dell Precision 5550 P91F Quadro T2000 Max-Q, i7-10875H, SK Hynix PC601A NVMe 1TB | Razer Blade 15 Studio Edition 2020 Quadro RTX 5000 Max-Q, i7-10875H, Samsung PM981a MZVLB1T0HBLR | MSI WS63VR 7RL-023US Quadro P4000 Max-Q, i7-7700HQ, Toshiba NVMe THNSN5512GPU7 | Acer ConceptD 3 Pro CN315-71P-73W1 Quadro T1000 (Laptop), i7-9750H, WDC PC SN720 SDAPNTW-512G | |
|---|---|---|---|---|---|---|
| Geräuschentwicklung | 6% | 13% | 4% | 4% | 7% | |
| aus / Umgebung * (dB) | 26 | 25.8 1% | 26.2 -1% | 30.1 -16% | 28 -8% | 31.2 -20% |
| Idle min * (dB) | 32 | 25.8 19% | 26.2 18% | 30.1 6% | 33.2 -4% | 31.2 2% |
| Idle avg * (dB) | 32 | 25.8 19% | 26.2 18% | 30.1 6% | 33.2 -4% | 31.2 2% |
| Idle max * (dB) | 32 | 25.9 19% | 26.2 18% | 30.1 6% | 33.2 -4% | 31.5 2% |
| Last avg * (dB) | 42 | 51.2 -22% | 39.2 7% | 42.3 -1% | 41.4 1% | 38.4 9% |
| Witcher 3 ultra * (dB) | 47.4 | 51.9 -9% | 39 18% | 48.2 -2% | 38.4 19% | 36.9 22% |
| Last max * (dB) | 59.7 | 51.9 13% | 50.6 15% | 42.1 29% | 43.5 27% | 41.2 31% |
* ... kleinere Werte sind besser
Lautstärkediagramm
| Idle |
| 32 / 32 / 32 dB(A) |
| Last |
| 42 / 59.7 dB(A) |
 | ||
30 dB leise 40 dB(A) deutlich hörbar 50 dB(A) störend |
||
min: | ||
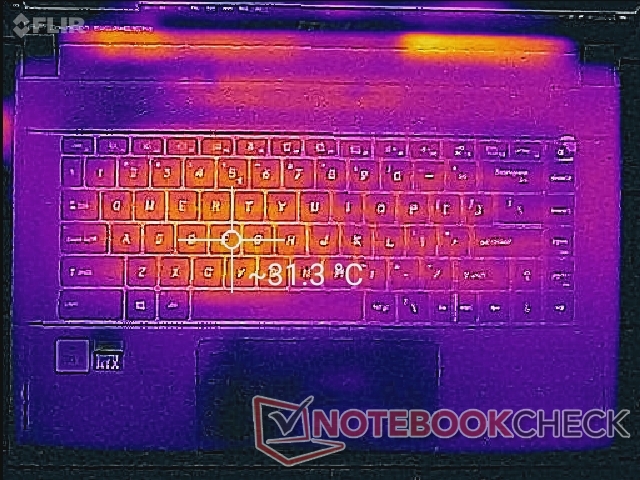
Temperatur
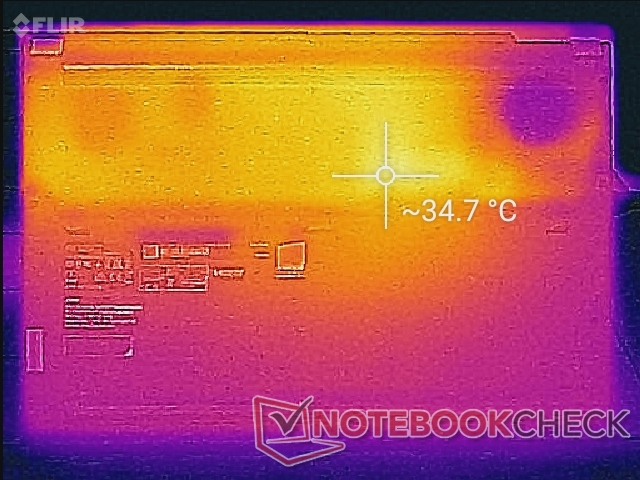
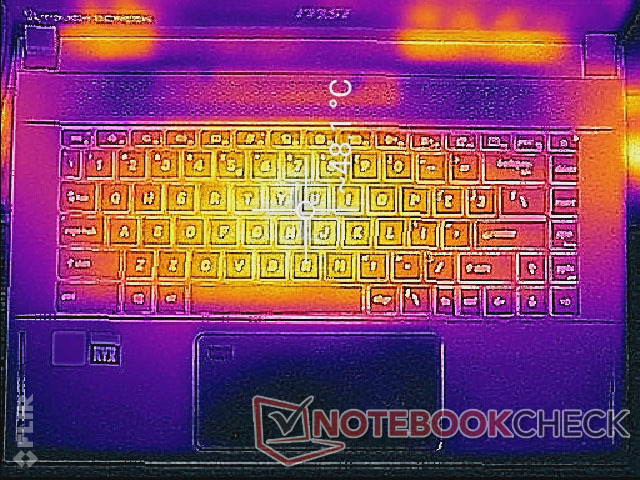
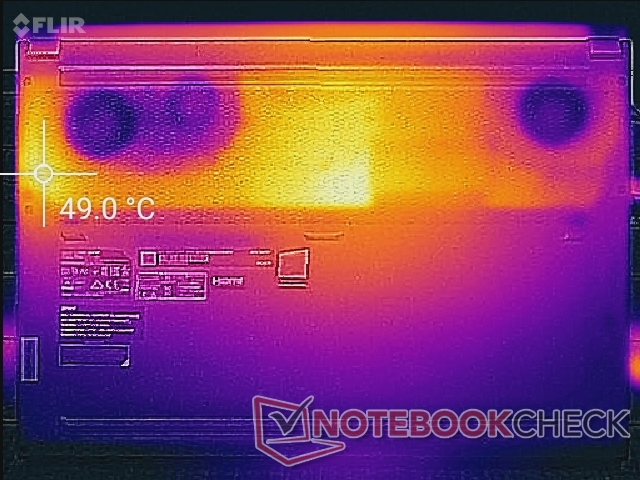
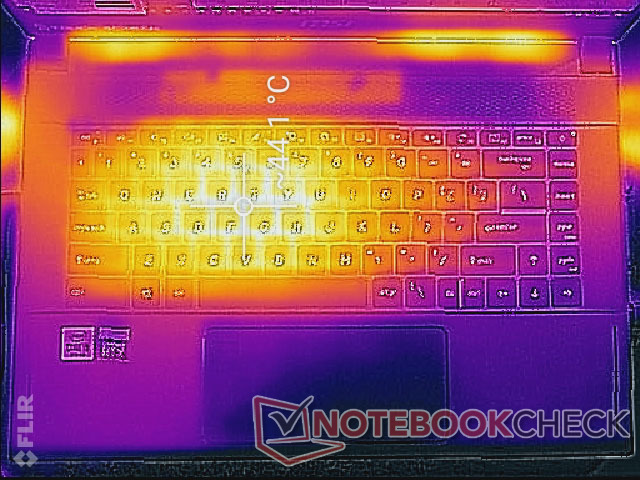
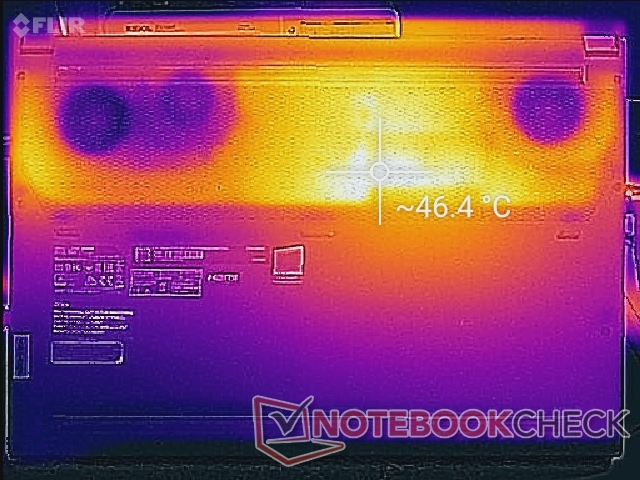
Am wärmsten wird es zur Tastaturmitte hin, unter extremen Lasten kann es hier zwischen 44 und 48 Grad Celsius warm werden. Insgesamt bleibt das WS66 aber kühler als das Razer Blade 15 Studio, bei dem Hot Spots und Handballenauflagen 60 bzw. 38 Grad erreichen. Für die niedrigeren Temperaturen dürften wohl die vergleichsweise lauten Lüfter des MSI verantwortlich sein, das Razer bleibt dafür leiser.
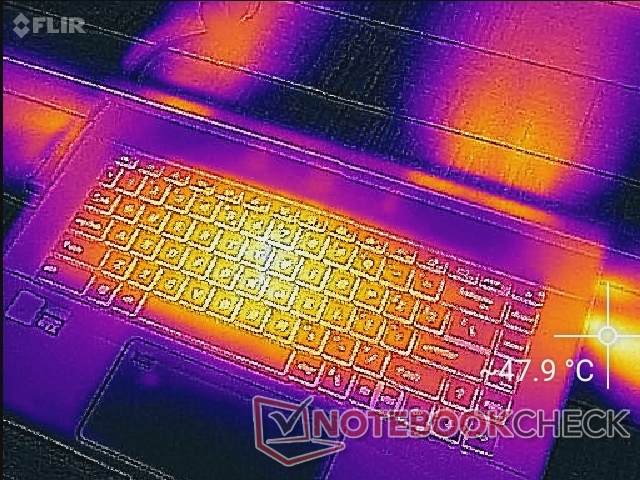
(±) Die maximale Temperatur auf der Oberseite ist 44.2 °C. Im Vergleich liegt der Klassendurchschnitt bei 38.2 °C (von 22.2 bis 69.8 °C für die Klasse Workstation).
(-) Auf der Unterseite messen wir eine maximalen Wert von 46.2 °C (im Vergleich zum Durchschnitt von 41.1 °C).
(+) Ohne Last messen wir eine durchschnittliche Temperatur von 29 °C auf der Oberseite. Der Klassendurchschnitt erreicht 32 °C.
(±) Beim längeren Spielen von The Witcher 3 erhitzt sich das Gerät durchschnittlich auf 36.8 °C. Der Durchschnitt der Klasse ist derzeit 32 °C.
(+) Die Handballen und der Touchpad-Bereich erreichen maximal 32 °C und damit die typische Hauttemperatur und fühlen sich daher nicht heiß an.
(-) Die durchschnittliche Handballen-Temperatur anderer getesteter Geräte war 27.8 °C (-4.2 °C).
Stress-Test
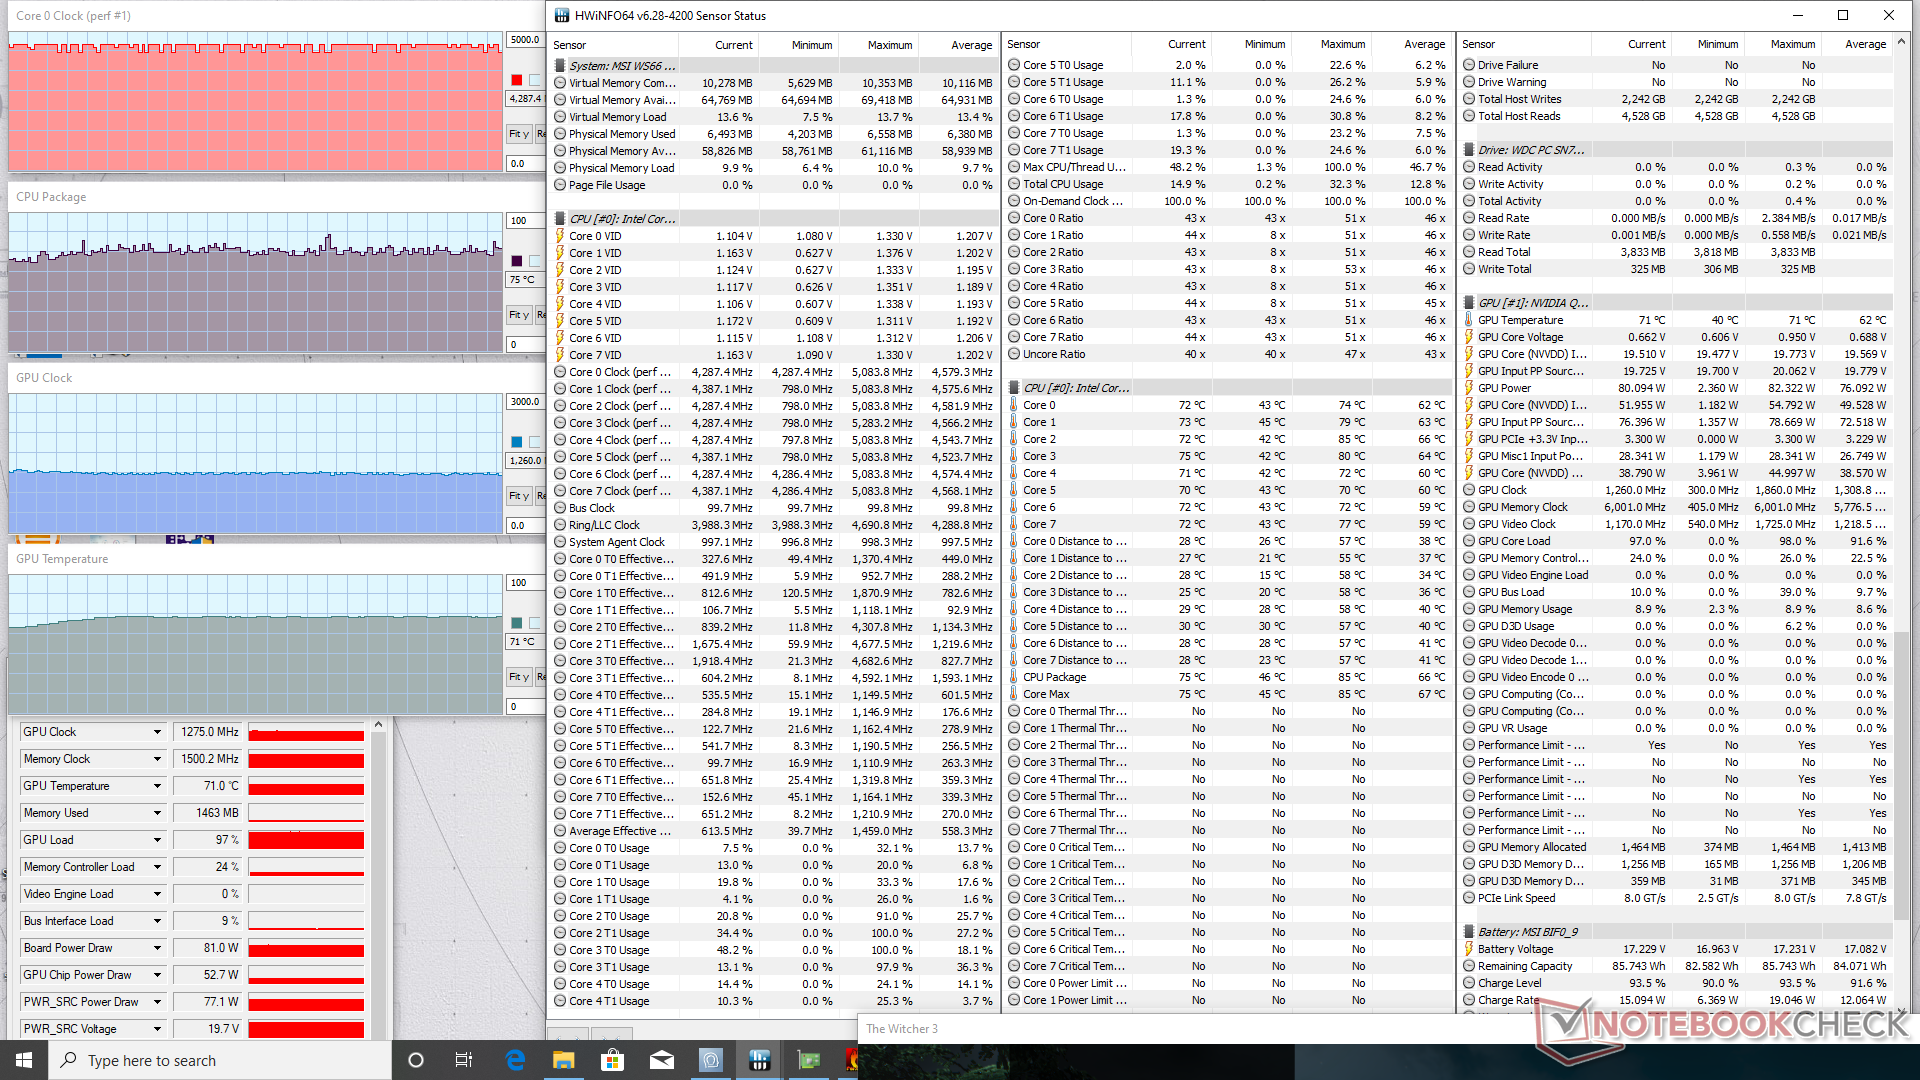
Bei unserem CPU-Stress mittels Prime95 boosten die Taktraten zunächst auf 4,3 GHz hoch bis nach etwa einer Minute Kerntemperaturen von 84 Grad Celsius erreicht werden. Dann fallen die Taktraten auf 3,9 GHz, um eine niedrigere Kerntemperatur von 74 Grad aufrecht zu halten. Das gleiche Verhalten schlägt sich auch in unseren Messungen zum Stromverbrauch nieder.
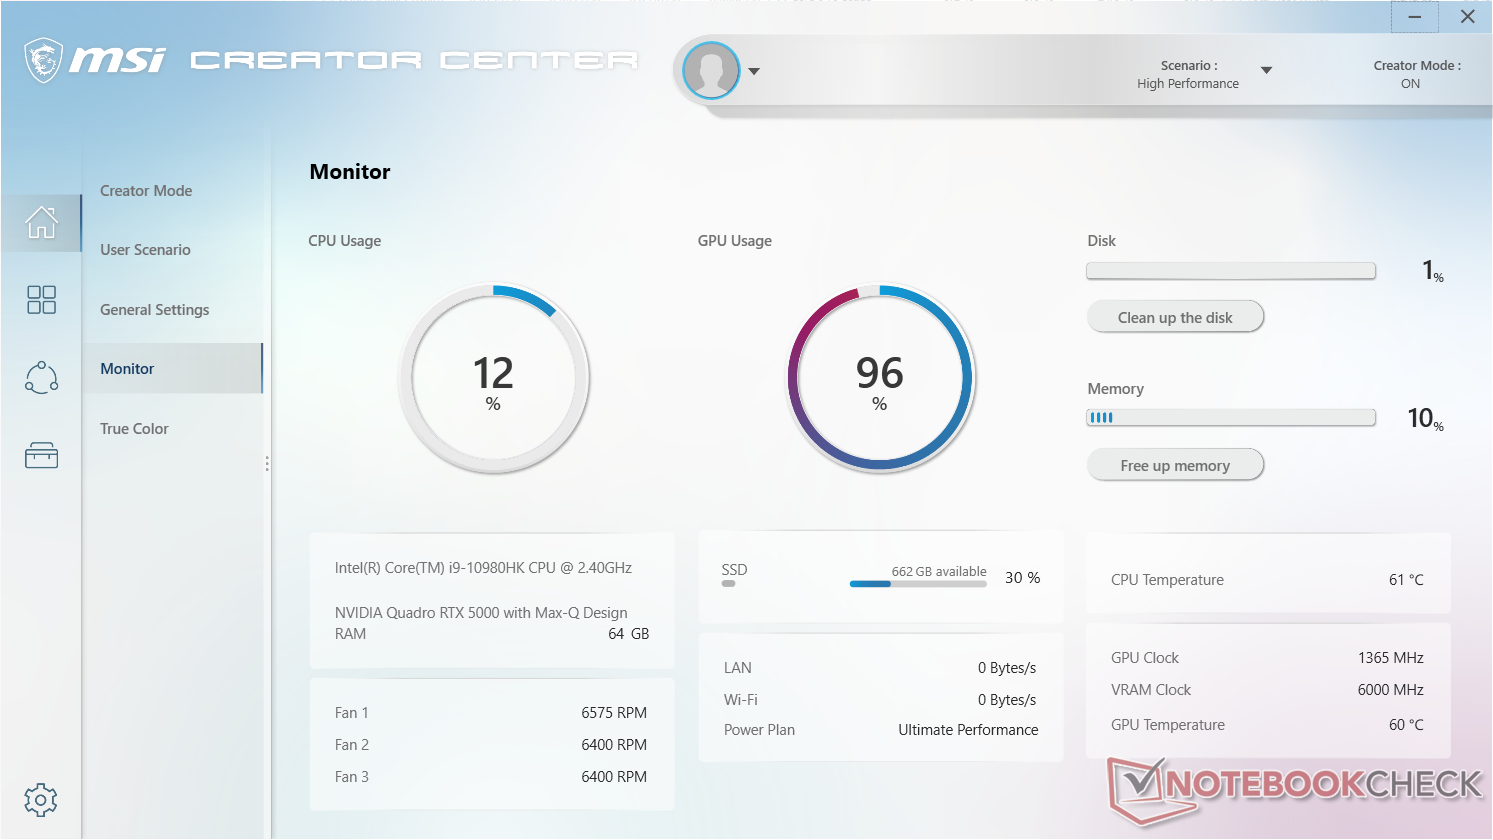
Bei aktiviertem Cooler Boost gehen die Taktraten wieder leicht nach oben bei gleichzeitig niedrigeren Kerntemperaturen. Mit ausgeschaltetem Cooler Boost liegen die CPU- und GPU-Temperaturen bei The Witcher 3 zum Beispiel bei 75 und 71 Grad, bei aktiviertem Cooler Boost sinken die Temperaturen auf 67 bzw. 60 Grad.
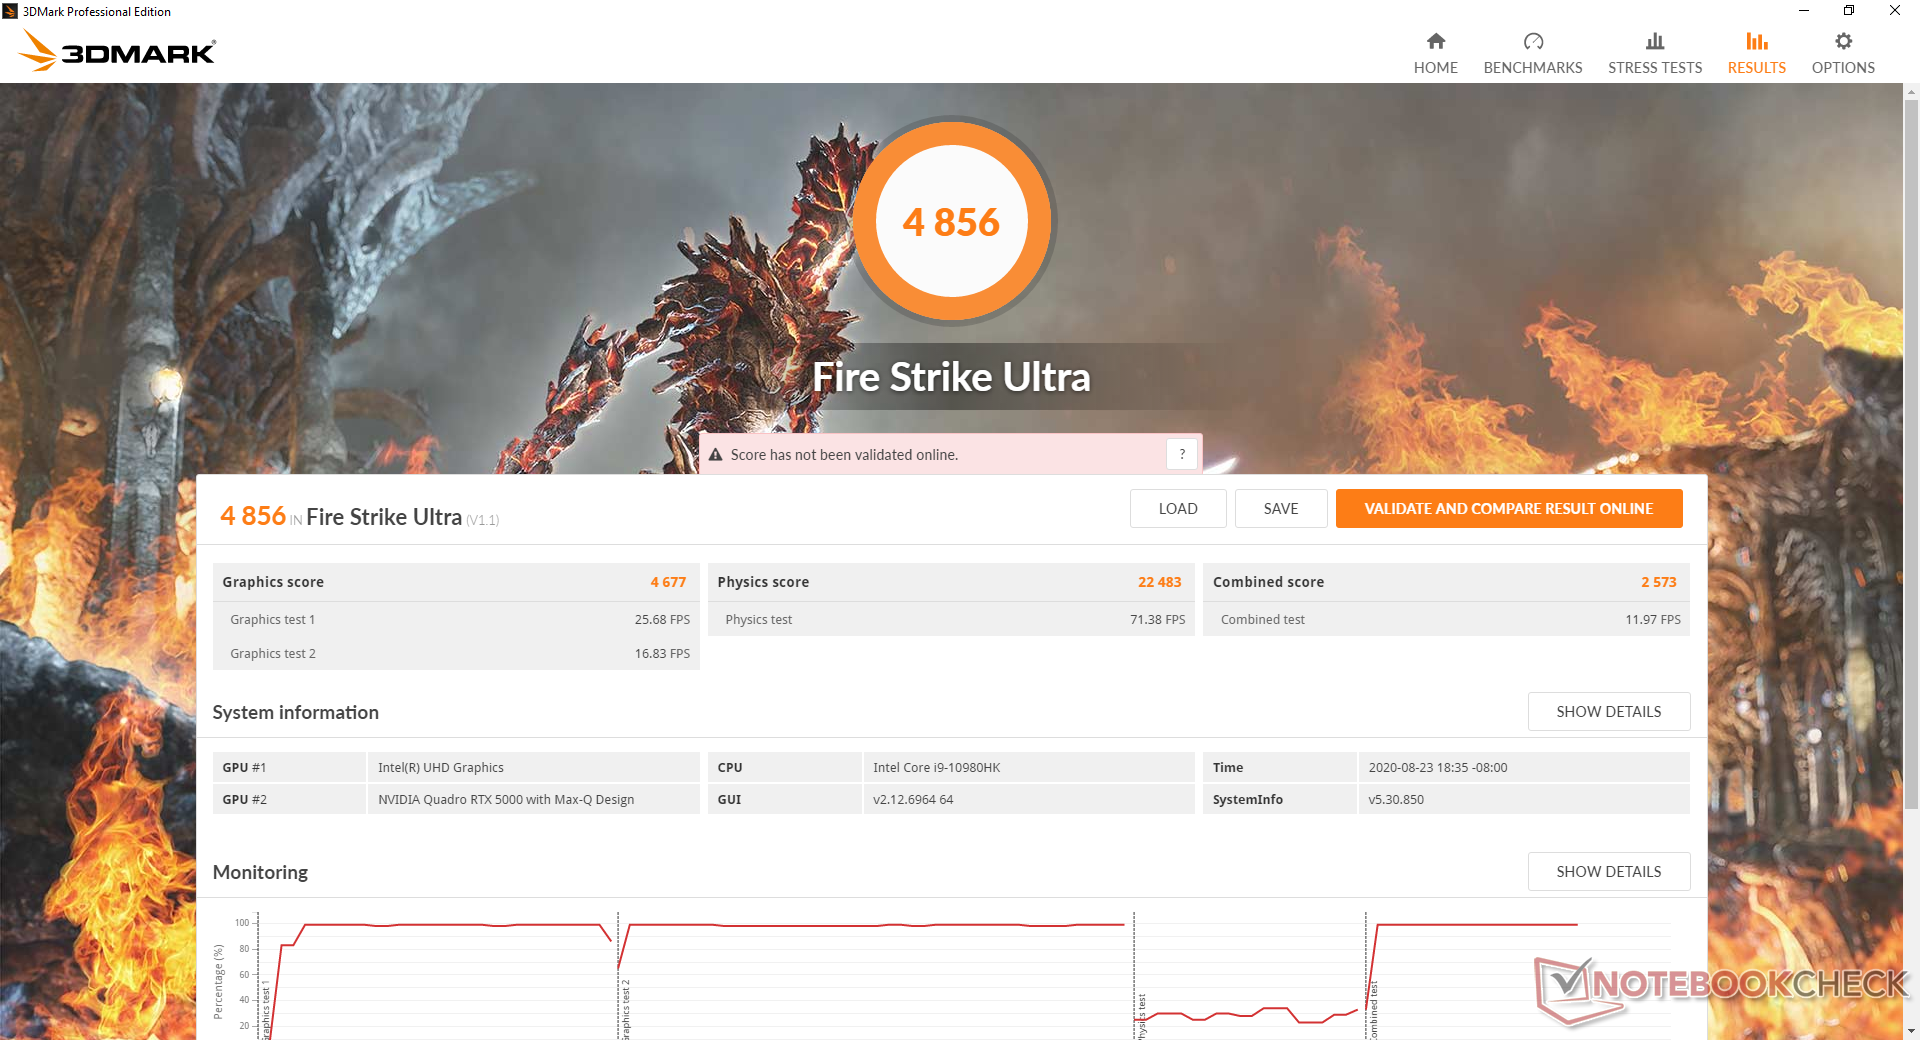
Abseits der Steckdose wird die Leistung stark eingeschränkt. Ein Fire-Strike-Durchgang im Akkumodus führt zu Physik- und Grafik-Scores von 13238 und 5944 Punkten, anstelle von 22317 und 20164 Punkten am Stromnetz.
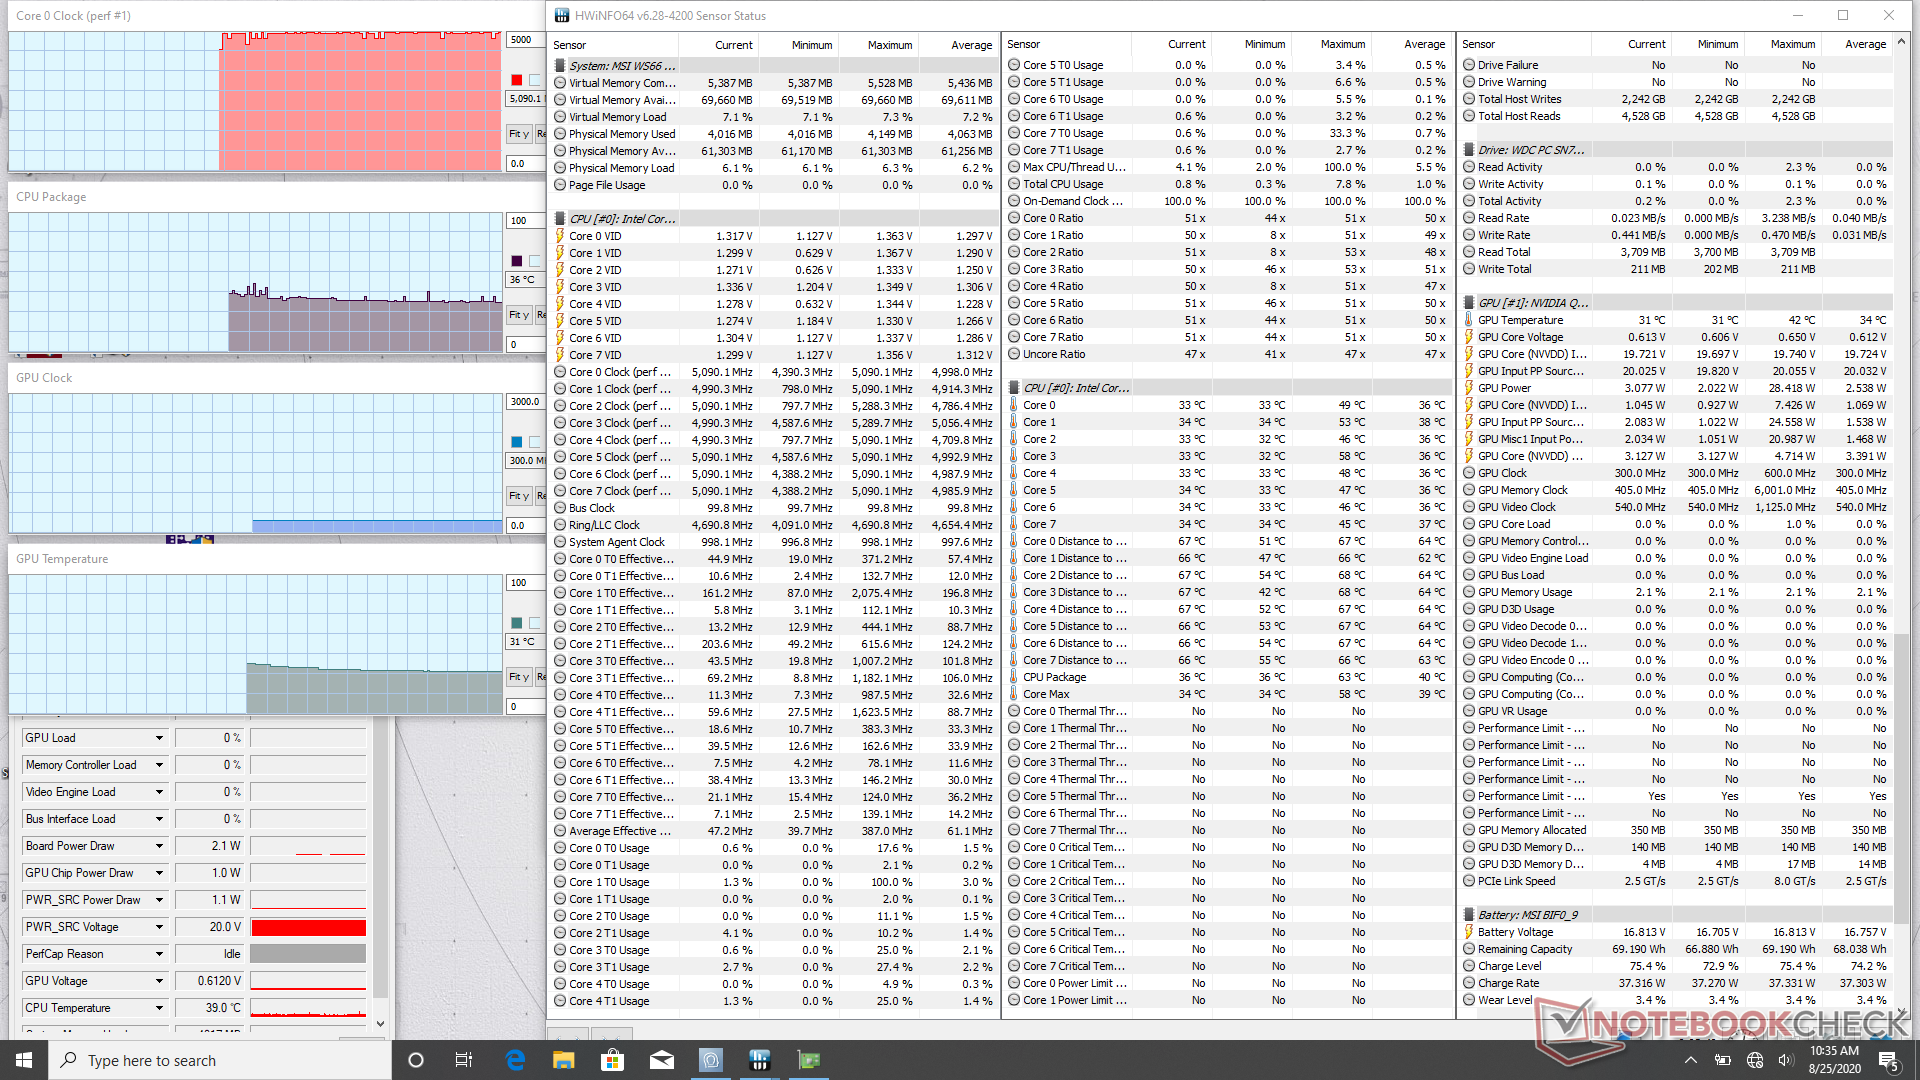
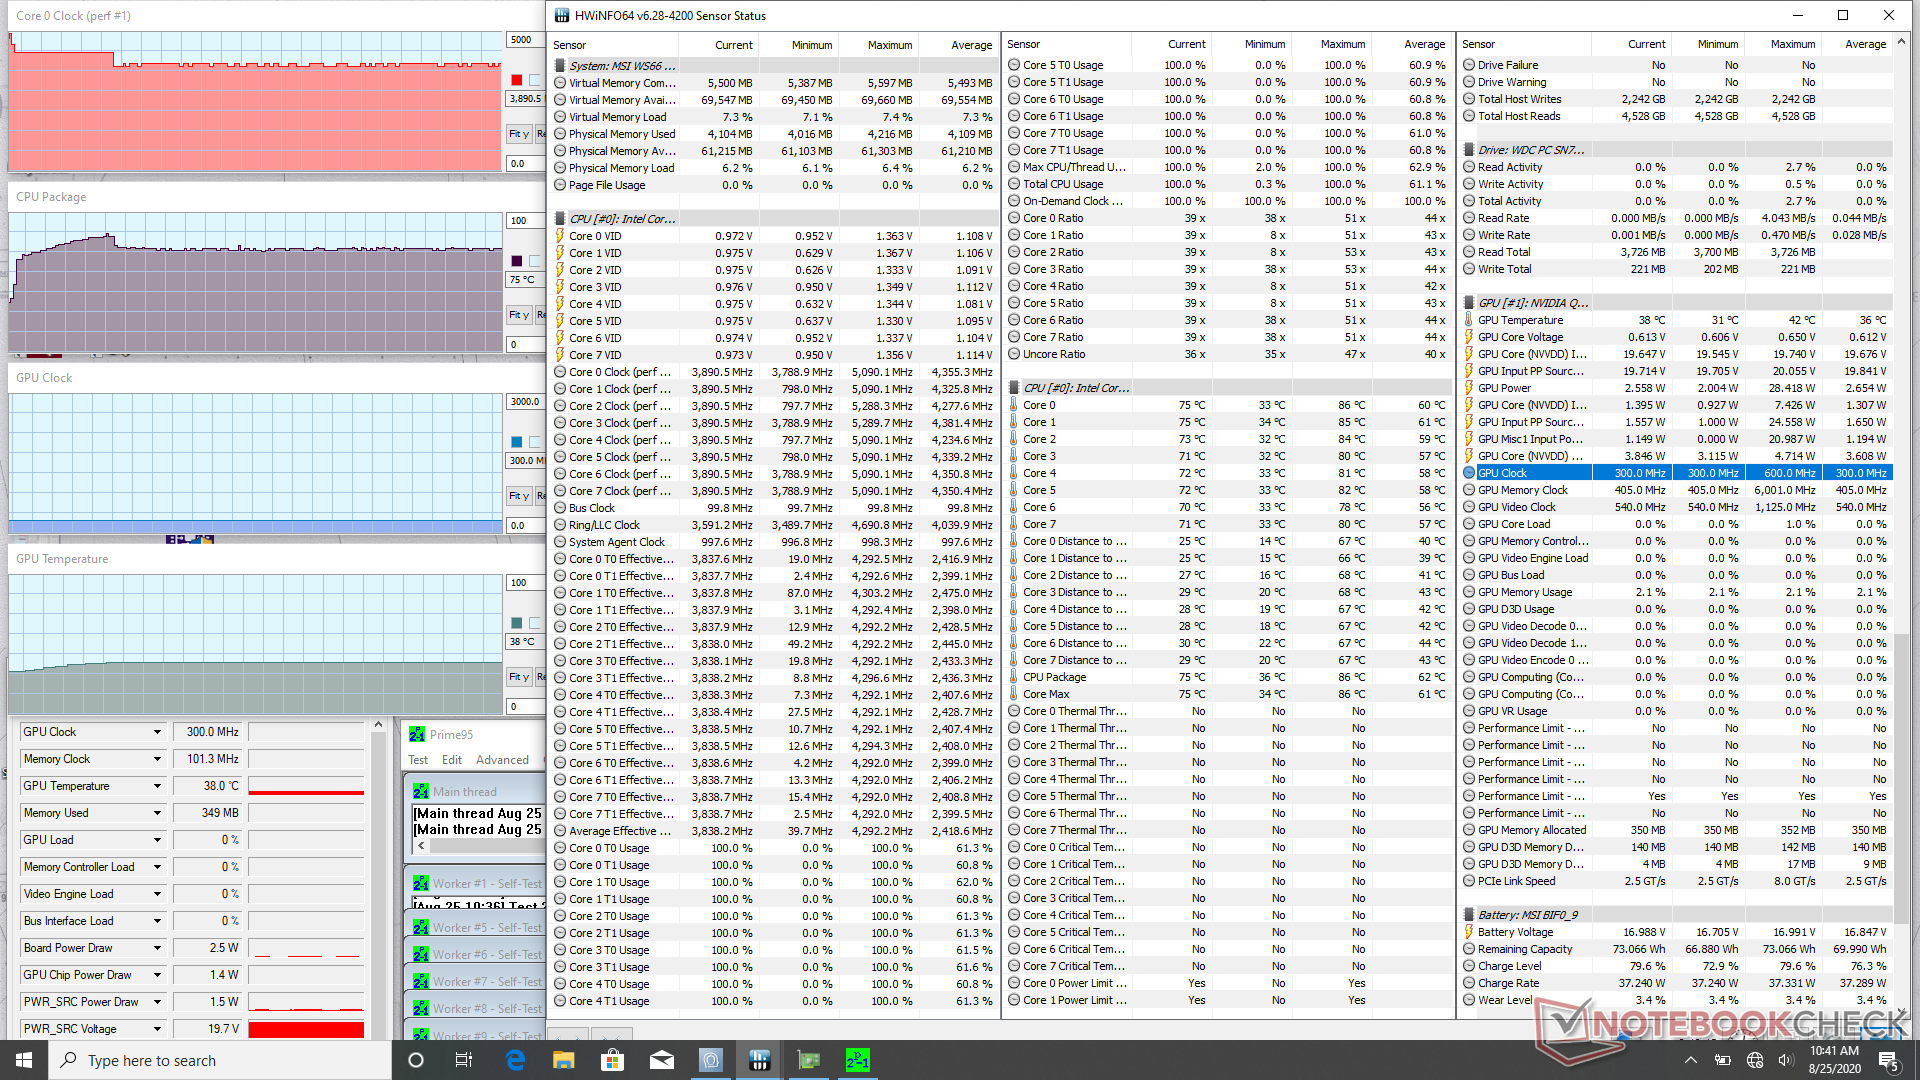
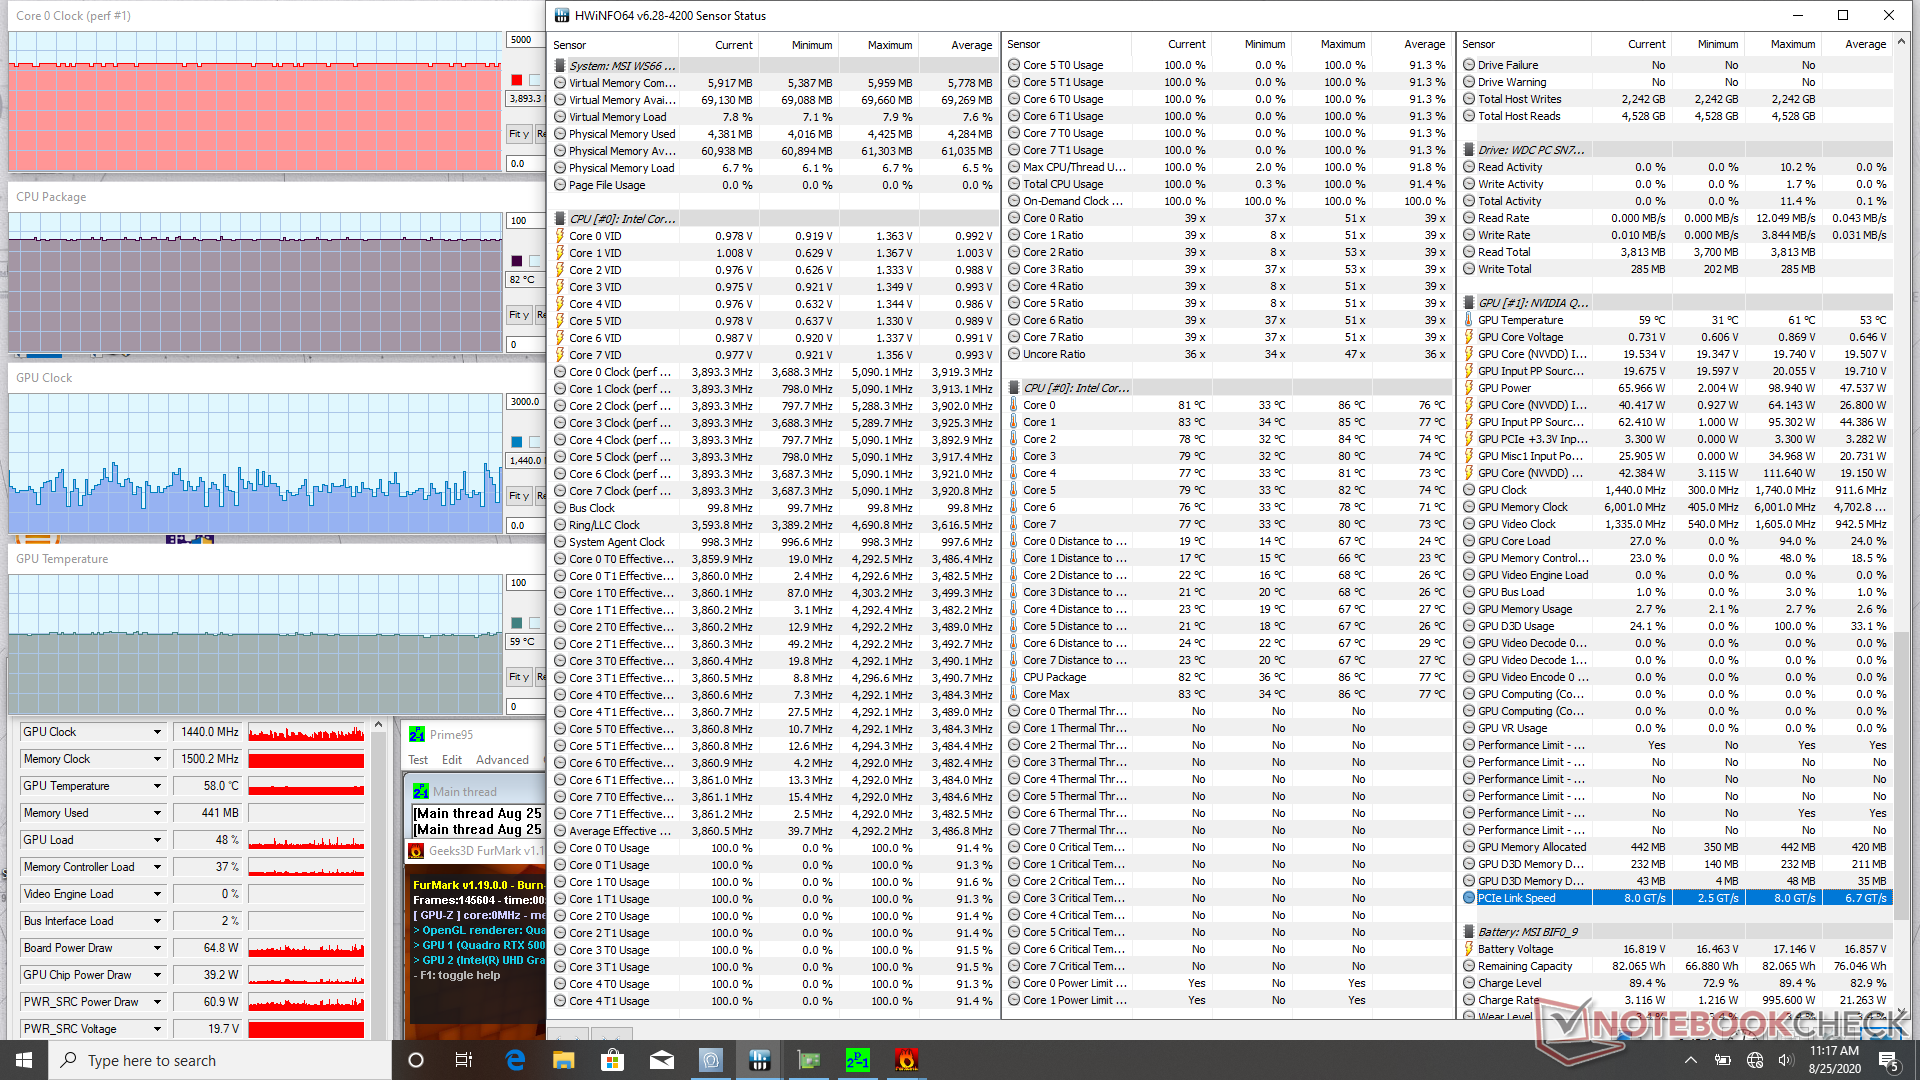


| CPU Clock (GHz) | GPU Clock (MHz) | Average CPU Temperature (°C) | Average GPU Temperature (°C) | |
| System Idle (Cooler Boost on) | -- | -- | 36 | 31 |
| Prime95 Stress (Cooler Boost on) | 3.8 - 3.9 | -- | 75 | 38 |
| Prime95 + FurMark Stress (Cooler Boost on) | 3.8 - 3.9 | ~500 - 1440 | 82 | 59 |
| Witcher 3 Stress (Cooler Boost off) | 4.3 - 4.4 | 1275 | 75 | 71 |
| Witcher 3 Stress (Cooler Boost on) | 4.6 | 1380 | 67 | 60 |
Lautsprecher


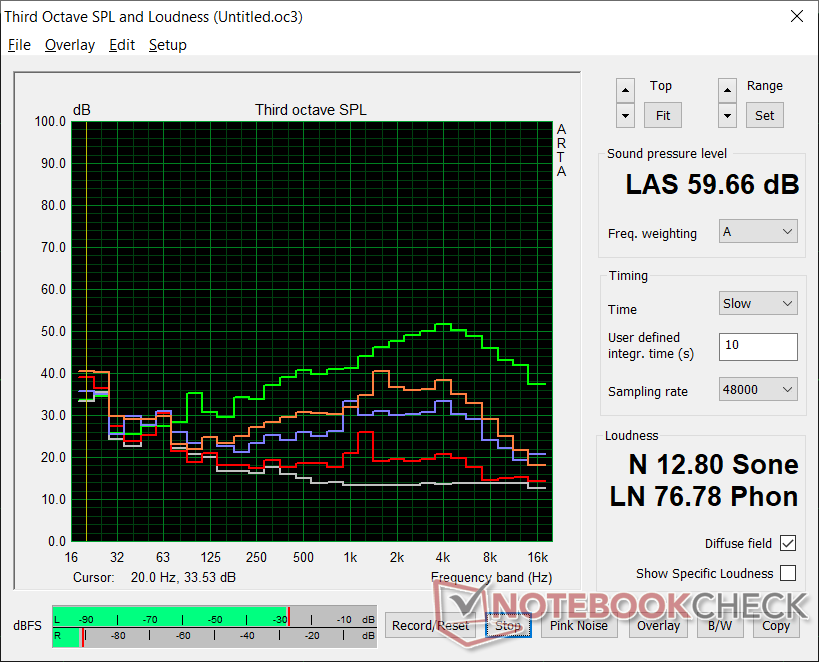
MSI WS66 10TMT-207US Audio Analyse
(±) | Mittelmäßig laut spielende Lautsprecher (80.5 dB)
Bass 100 - 315 Hz
(-) | kaum Bass - 22.6% niedriger als der Median
(±) | durchschnittlich lineare Bass-Wiedergabe (9.8% Delta zum Vorgänger)
Mitteltöne 400 - 2000 Hz
(±) | zu hohe Mitten, vom Median 7.5% abweichend
(±) | Linearität der Mitten ist durchschnittlich (11.7% Delta zum Vorgänger)
Hochtöne 2 - 16 kHz
(+) | ausgeglichene Hochtöne, vom Median nur 3.4% abweichend
(±) | durchschnittlich lineare Hochtöne (8.5% Delta zum Vorgänger)
Gesamt im hörbaren Bereich 100 - 16.000 Hz
(±) | hörbarer Bereich ist durchschnittlich linear (26.1% Abstand zum Median)
Im Vergleich zu allen Geräten derselben Klasse
» 88% aller getesteten Geräte dieser Klasse waren besser, 6% vergleichbar, 6% schlechter
» Das beste Gerät hat einen Delta-Wert von 7%, durchschnittlich ist 17%, das schlechteste Gerät hat 35%
Im Vergleich zu allen Geräten im Test
» 80% aller getesteten Geräte waren besser, 4% vergleichbar, 16% schlechter
» Das beste Gerät hat einen Delta-Wert von 4%, durchschnittlich ist 23%, das schlechteste Gerät hat 134%
Apple MacBook 12 (Early 2016) 1.1 GHz Audio Analyse
(+) | Die Lautsprecher können relativ laut spielen (83.6 dB)
Bass 100 - 315 Hz
(±) | abgesenkter Bass - 11.3% geringer als der Median
(±) | durchschnittlich lineare Bass-Wiedergabe (14.2% Delta zum Vorgänger)
Mitteltöne 400 - 2000 Hz
(+) | ausgeglichene Mitten, vom Median nur 2.4% abweichend
(+) | lineare Mitten (5.5% Delta zum Vorgänger)
Hochtöne 2 - 16 kHz
(+) | ausgeglichene Hochtöne, vom Median nur 2% abweichend
(+) | sehr lineare Hochtöne (4.5% Delta zum Vorgänger)
Gesamt im hörbaren Bereich 100 - 16.000 Hz
(+) | hörbarer Bereich ist sehr linear (10.2% Abstand zum Median
Im Vergleich zu allen Geräten derselben Klasse
» 7% aller getesteten Geräte dieser Klasse waren besser, 2% vergleichbar, 90% schlechter
» Das beste Gerät hat einen Delta-Wert von 5%, durchschnittlich ist 18%, das schlechteste Gerät hat 53%
Im Vergleich zu allen Geräten im Test
» 5% aller getesteten Geräte waren besser, 1% vergleichbar, 94% schlechter
» Das beste Gerät hat einen Delta-Wert von 4%, durchschnittlich ist 23%, das schlechteste Gerät hat 134%
Energie-Management
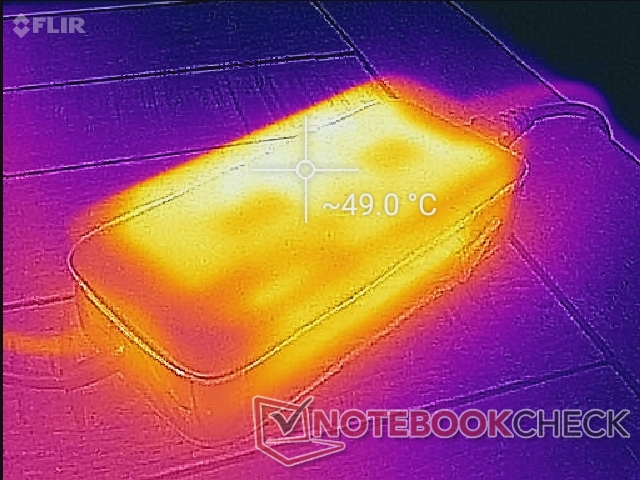
Energieverbrauch
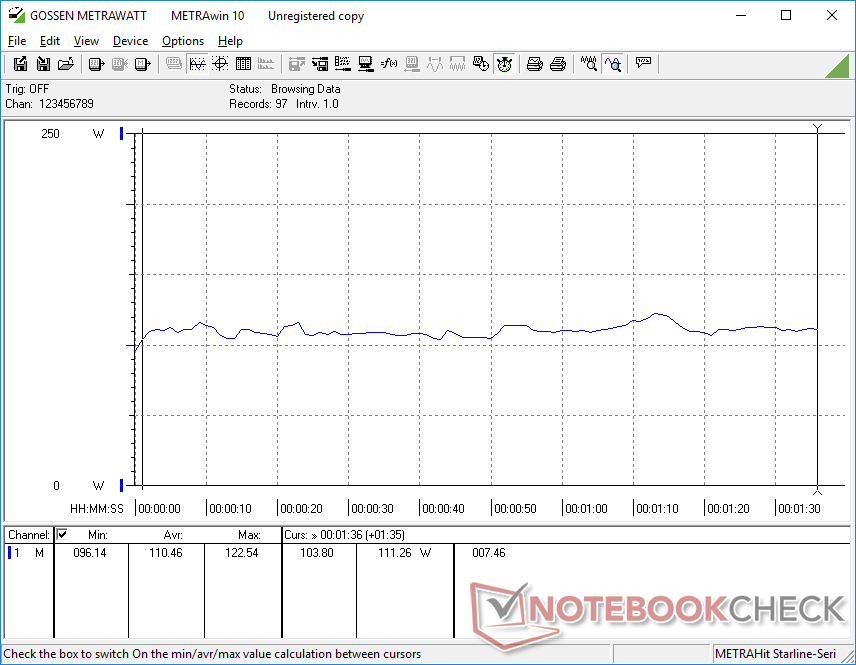
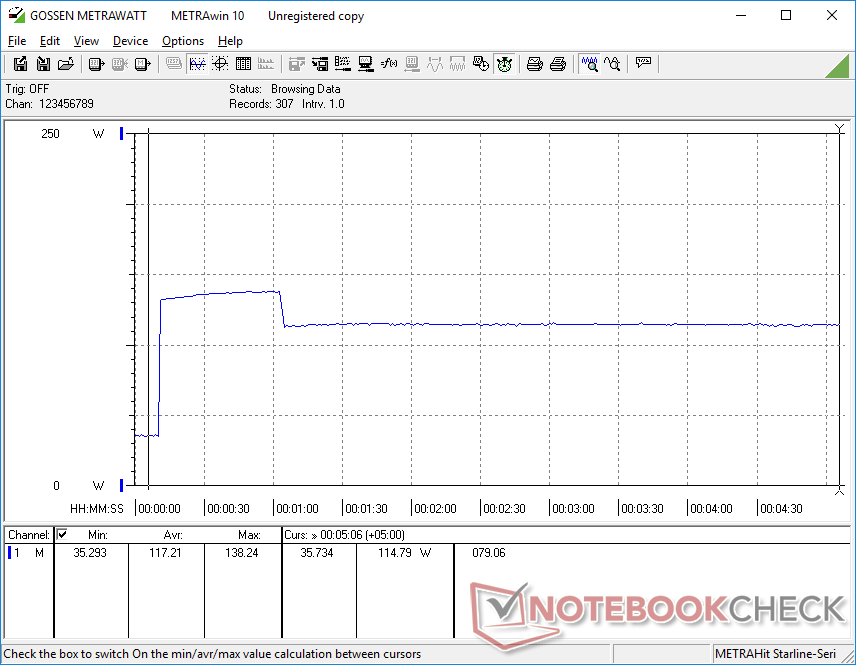
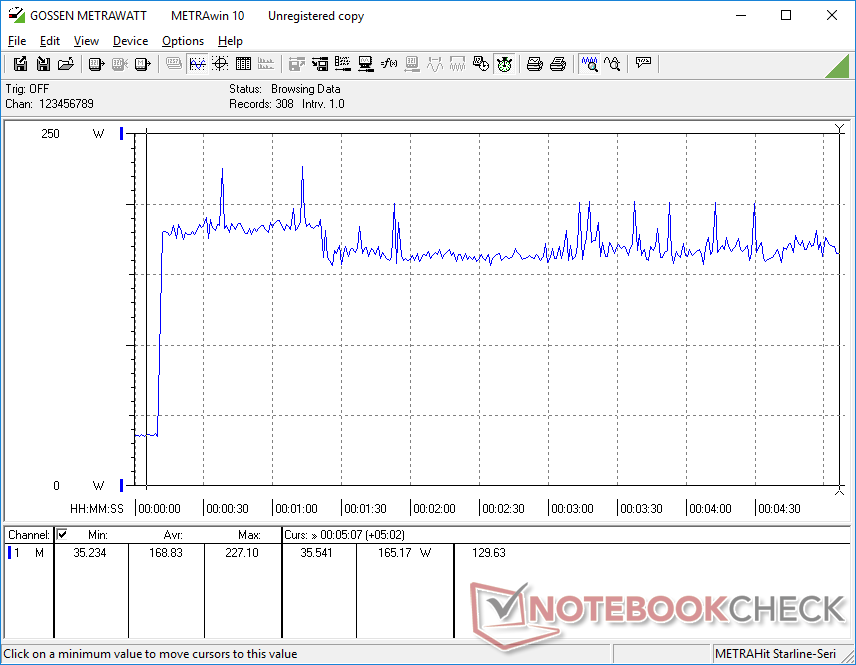
14 W verbraucht das System im Idle-Desktop bei minimierter Helligkeit und aktivierter interner Grafik. Wird die Helligkeit maximiert, so steigt der Verbrauch auf 19 W. Ist im Leerlauf der "Ultra Performance"-Modus und noch der Cooler Boost aktiviert, dann werden gleich 42 W gezogen. Für simple Aufgaben wie Surfen oder Videostreaming eignen sich diese Modi also eher weniger.
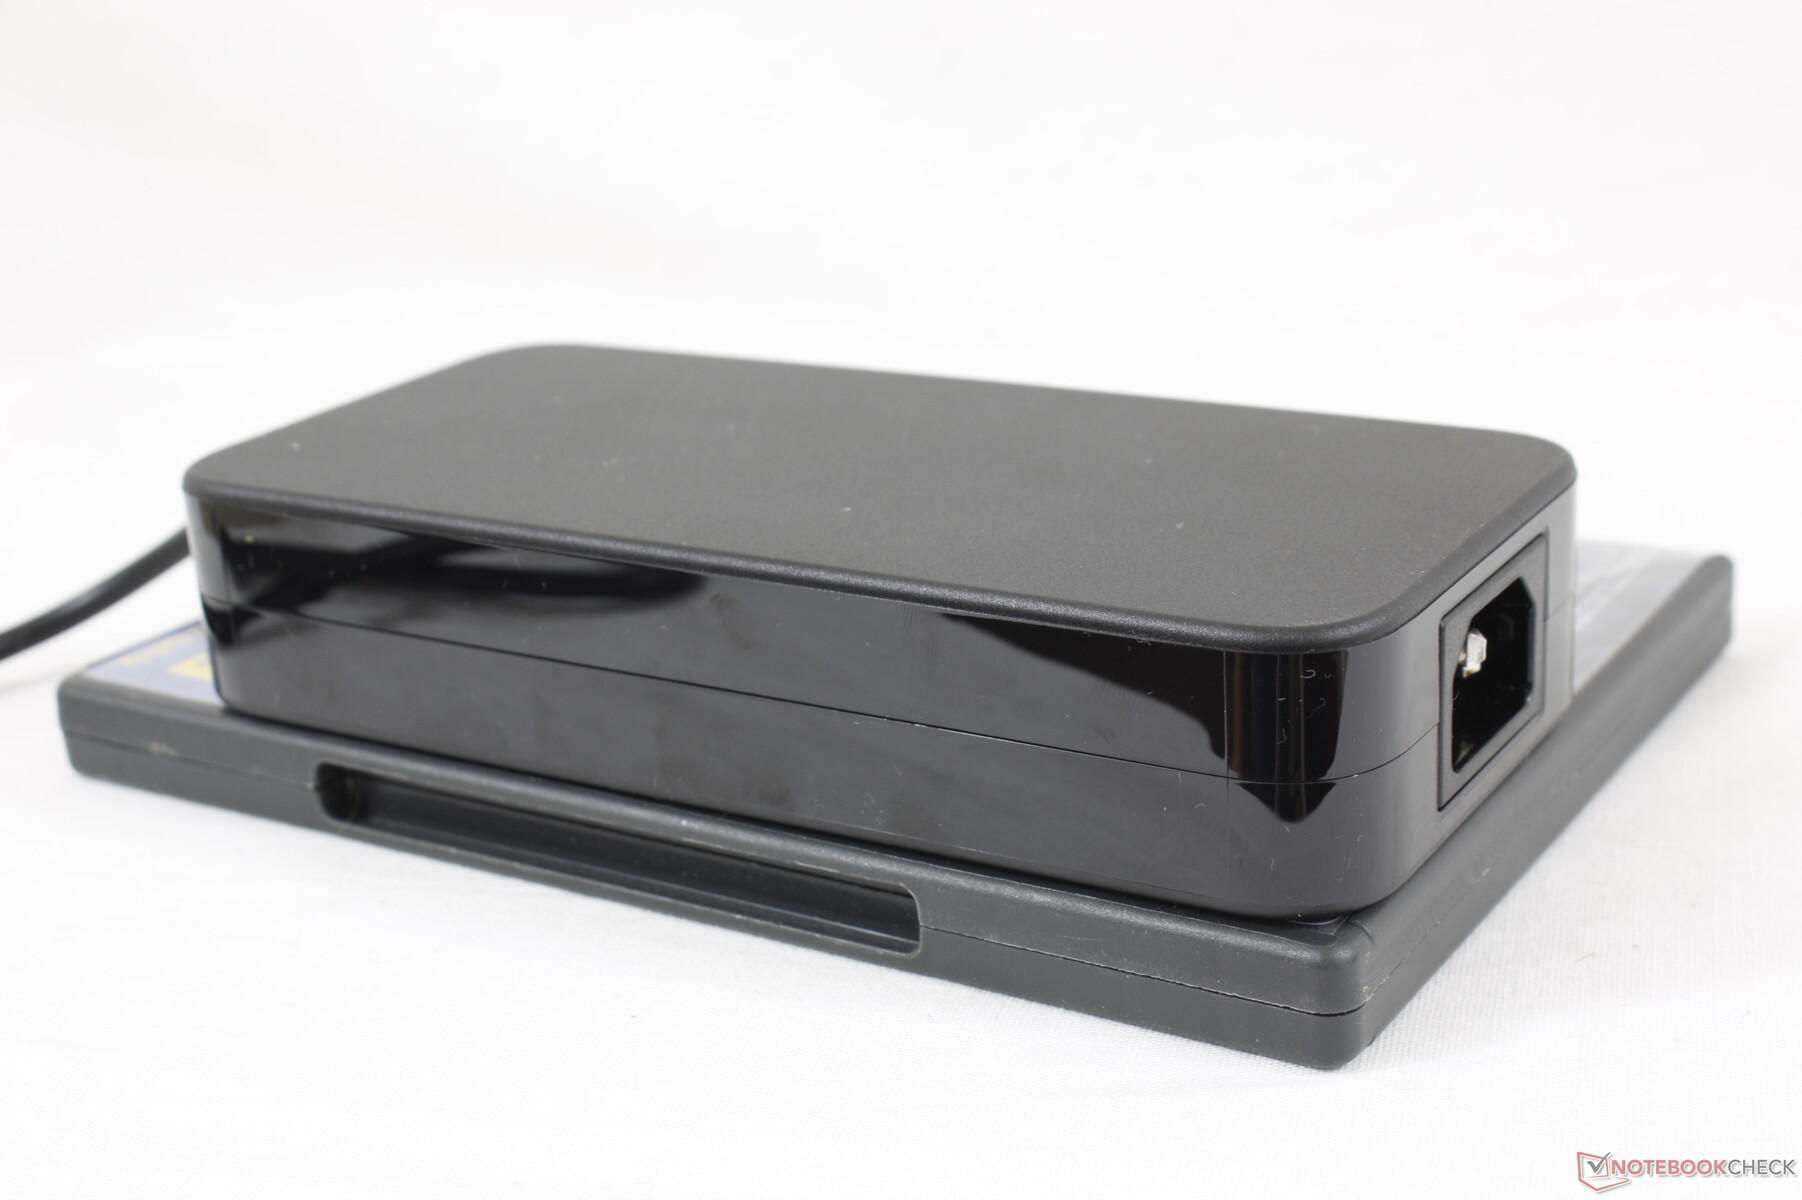
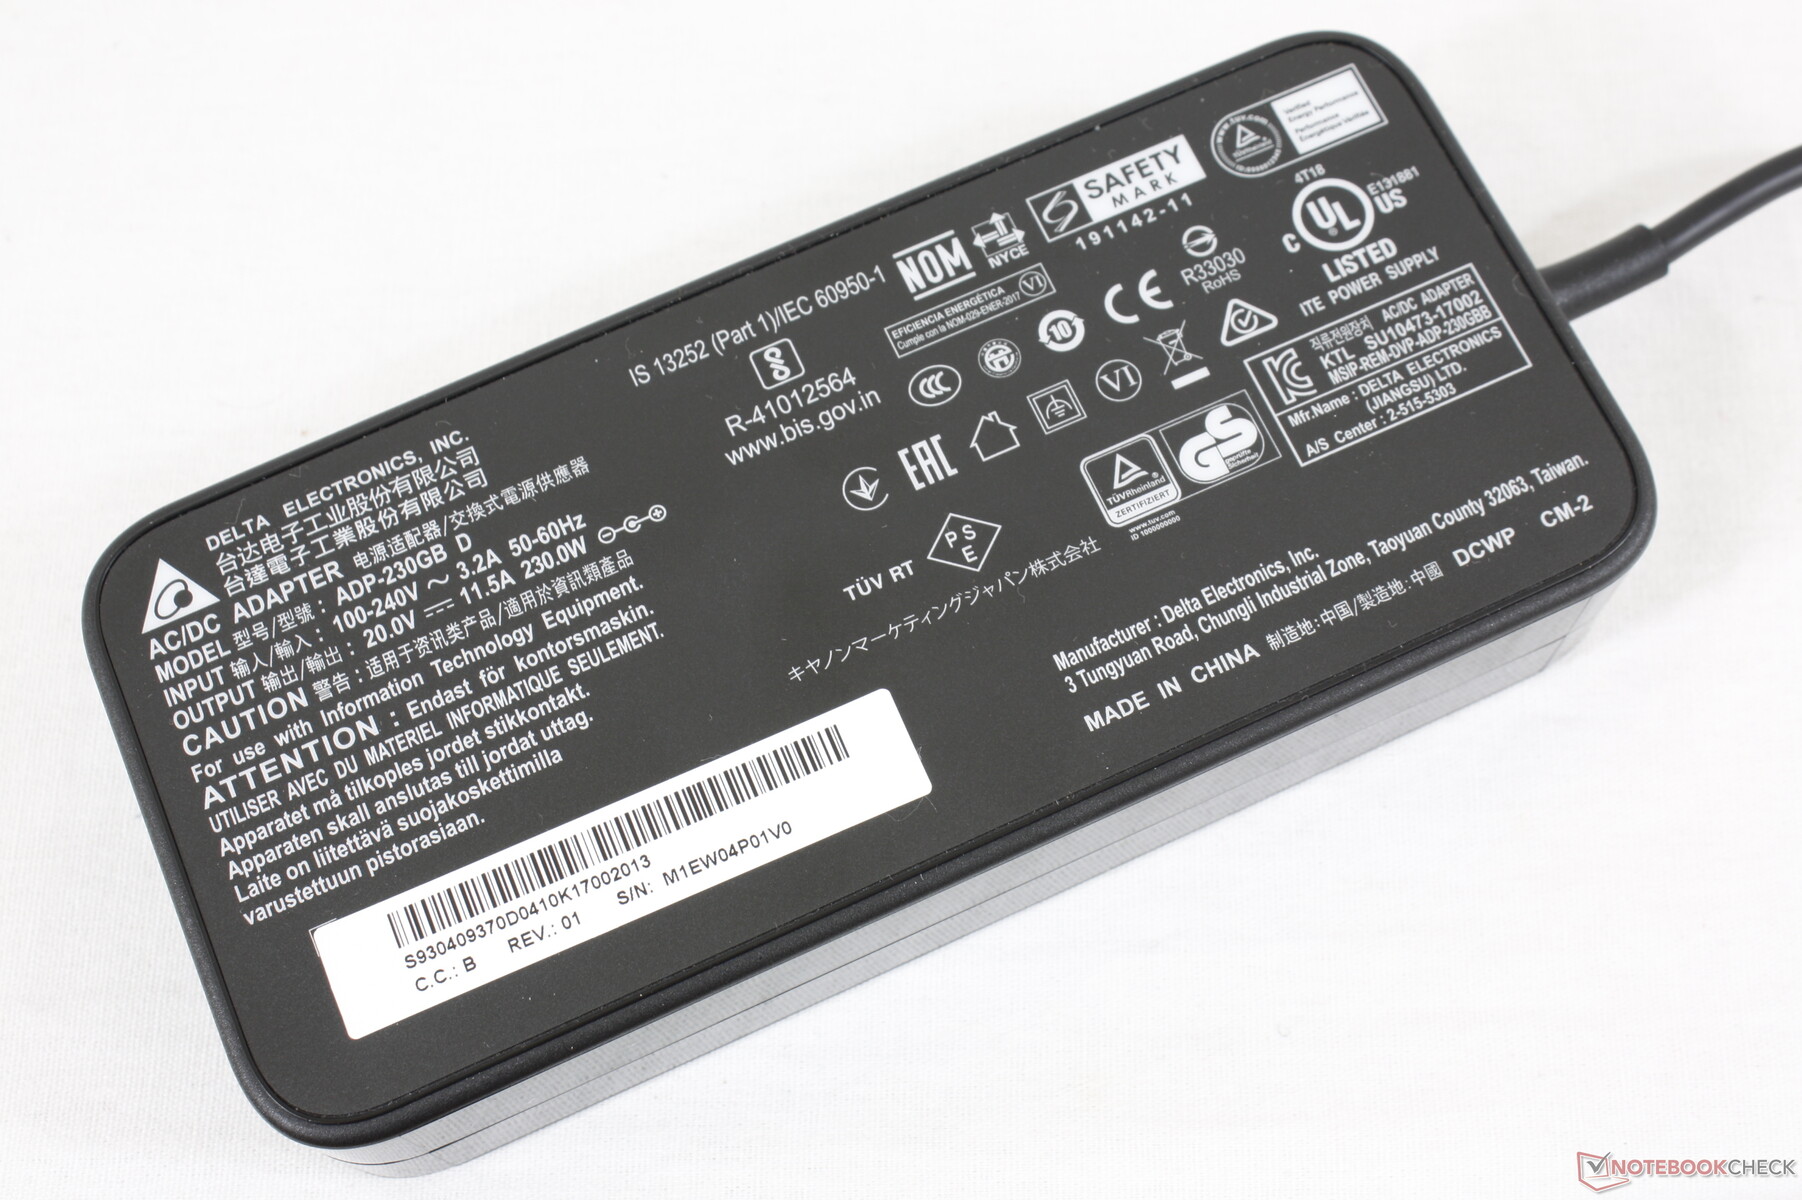
Unter Stresssituation wie beim Gaming zieht das WS66 gerne mal 152 W aus der Steckdose und liegt damit auf einer Ebene mit dem Dell Precision 7550 oder dem Razer Blade 15 Studio, welche alle mit der gleichen Grafikkarte ausgerüstet sind. Dabei treten kurzzeitige Lastspitzen von maximal 227 W auf, welche das mittelgroße (16.4 x 7.5 x 3.4 cm) 230-W-Netzteil noch gut auffangen kann. Der durchschnittliche Verbrauch ist aber deutlich niedriger, sodass das Netzteil gut gerüstet ist, um das WS66, anders als beim Precision 5750, auch in Lastsituationen noch zuverlässig aufladen zu können.

| Aus / Standby | |
| Idle | |
| Last |
|
Legende:
min: | |
| MSI WS66 10TMT-207US i9-10980HK, Quadro RTX 5000 Max-Q, WDC PC SN730 SDBPNTY-1T00, IPS, 1920x1080, 15.6" | Dell Precision 7550 W-10885M, Quadro RTX 5000 Max-Q, SK Hynix PC601A NVMe 1TB, IPS, 3840x2160, 15.6" | Dell Precision 5550 P91F i7-10875H, Quadro T2000 Max-Q, SK Hynix PC601A NVMe 1TB, IPS, 3840x2400, 15.6" | Razer Blade 15 Studio Edition 2020 i7-10875H, Quadro RTX 5000 Max-Q, Samsung PM981a MZVLB1T0HBLR, OLED, 3840x2160, 15.6" | MSI WS63VR 7RL-023US i7-7700HQ, Quadro P4000 Max-Q, Toshiba NVMe THNSN5512GPU7, IPS, 3840x2160, 15.6" | Acer ConceptD 3 Pro CN315-71P-73W1 i7-9750H, Quadro T1000 (Laptop), WDC PC SN720 SDAPNTW-512G, IPS, 1920x1080, 15.6" | |
|---|---|---|---|---|---|---|
| Stromverbrauch | 13% | 40% | 12% | 29% | 58% | |
| Idle min * (Watt) | 13.8 | 8.2 41% | 5.6 59% | 13.4 3% | 13.3 4% | 2.9 79% |
| Idle avg * (Watt) | 18.4 | 16.8 9% | 11.2 39% | 18 2% | 17.2 7% | 5.5 70% |
| Idle max * (Watt) | 41.5 | 24.4 41% | 18.4 56% | 26.1 37% | 17.9 57% | 10.6 74% |
| Last avg * (Watt) | 110.5 | 131 -19% | 114 -3% | 115 -4% | 83.7 24% | 86 22% |
| Witcher 3 ultra * (Watt) | 151.6 | 156.6 -3% | 76.7 49% | 145 4% | 101.9 33% | 83 45% |
| Last max * (Watt) | 227.1 | 201.8 11% | 134.2 41% | 165 27% | 114.3 50% | 100.7 56% |
* ... kleinere Werte sind besser
Akkulaufzeit
Die Laufzeit beträgt nur knapp 8 Stunden beim Surfen im Web, selbst bei aktiviertem "Super Battery"-Energieplan von MSI. Der große Akku mit 99,99 Wh ist in etwa 2 Stunden wieder voll aufgeladen.
Das WS66 kann auch über den USB-C-Port auf der linken Seite wieder aufgeladen werden.
| MSI WS66 10TMT-207US i9-10980HK, Quadro RTX 5000 Max-Q, 99.99 Wh | Dell Precision 7550 W-10885M, Quadro RTX 5000 Max-Q, 95 Wh | Dell Precision 5550 P91F i7-10875H, Quadro T2000 Max-Q, 86 Wh | Razer Blade 15 Studio Edition 2020 i7-10875H, Quadro RTX 5000 Max-Q, 80 Wh | MSI WS63VR 7RL-023US i7-7700HQ, Quadro P4000 Max-Q, 48 Wh | Acer ConceptD 3 Pro CN315-71P-73W1 i7-9750H, Quadro T1000 (Laptop), 58.7 Wh | |
|---|---|---|---|---|---|---|
| Akkulaufzeit | 10% | 68% | 15% | -47% | 4% | |
| Idle (h) | 8.3 | 11.1 34% | 22.6 172% | 8.8 6% | 3.9 -53% | |
| WLAN (h) | 7.8 | 8.9 14% | 9 15% | 5.7 -27% | 2.9 -63% | 8.1 4% |
| Last (h) | 1.2 | 1 -17% | 1.4 17% | 2 67% | 0.9 -25% |
Pro
Contra
Fazit
Wer nach der schnellsten Leistung in einem superdünnen Gehäuse giert, wird vom WS66 nicht enttäuscht. Sein Core i9 ist konstant schneller als das Razer Blade 15 Studio, vor allem aufgrund dessen ausschließlicher Core-i7-Option.
Die "Leistung-über-alles"-Mentalität des WS66 hat aber seine Nachteile: Allem voran sind die Lüfter signifikant lauter als im erwähnten Razer und auch nahezu allen anderen von uns getesteten Workstations. Außerdem führt die Gaming-Vergangenheit des ultradünnen WS66 zum Ausschluss einiger sonst üblicher Workstationbasisfunktionen. Man muss allerdings schon bei den klobigeren Modellen wie dem Dell Precision 7550, dem Lenovo ThinkPad P53 oder dem HP ZBook 15 schauen, wenn Funktionen wie Smart-Card-Reader, bessere Farbraumabdeckung, Maustasten, NumPad, NFC, SIM oder die Option auf ein mattes Display wichtig für das eigene Arbeiten sind.
Das MSI WS66 hat den Tunnelblick auf maximale Leistung und ist dadurch schneller als es sein dünnes Design vermuten lässt. Hilfreiche Funktionen ziehen dabei den Kürzeren und die Systemlautstärke ist bei maximaler Leistung auch maximal hoch.
MSI WS66 10TMT-207US
- 30.08.2020 v7 (old)
Allen Ngo
Preisvergleich

