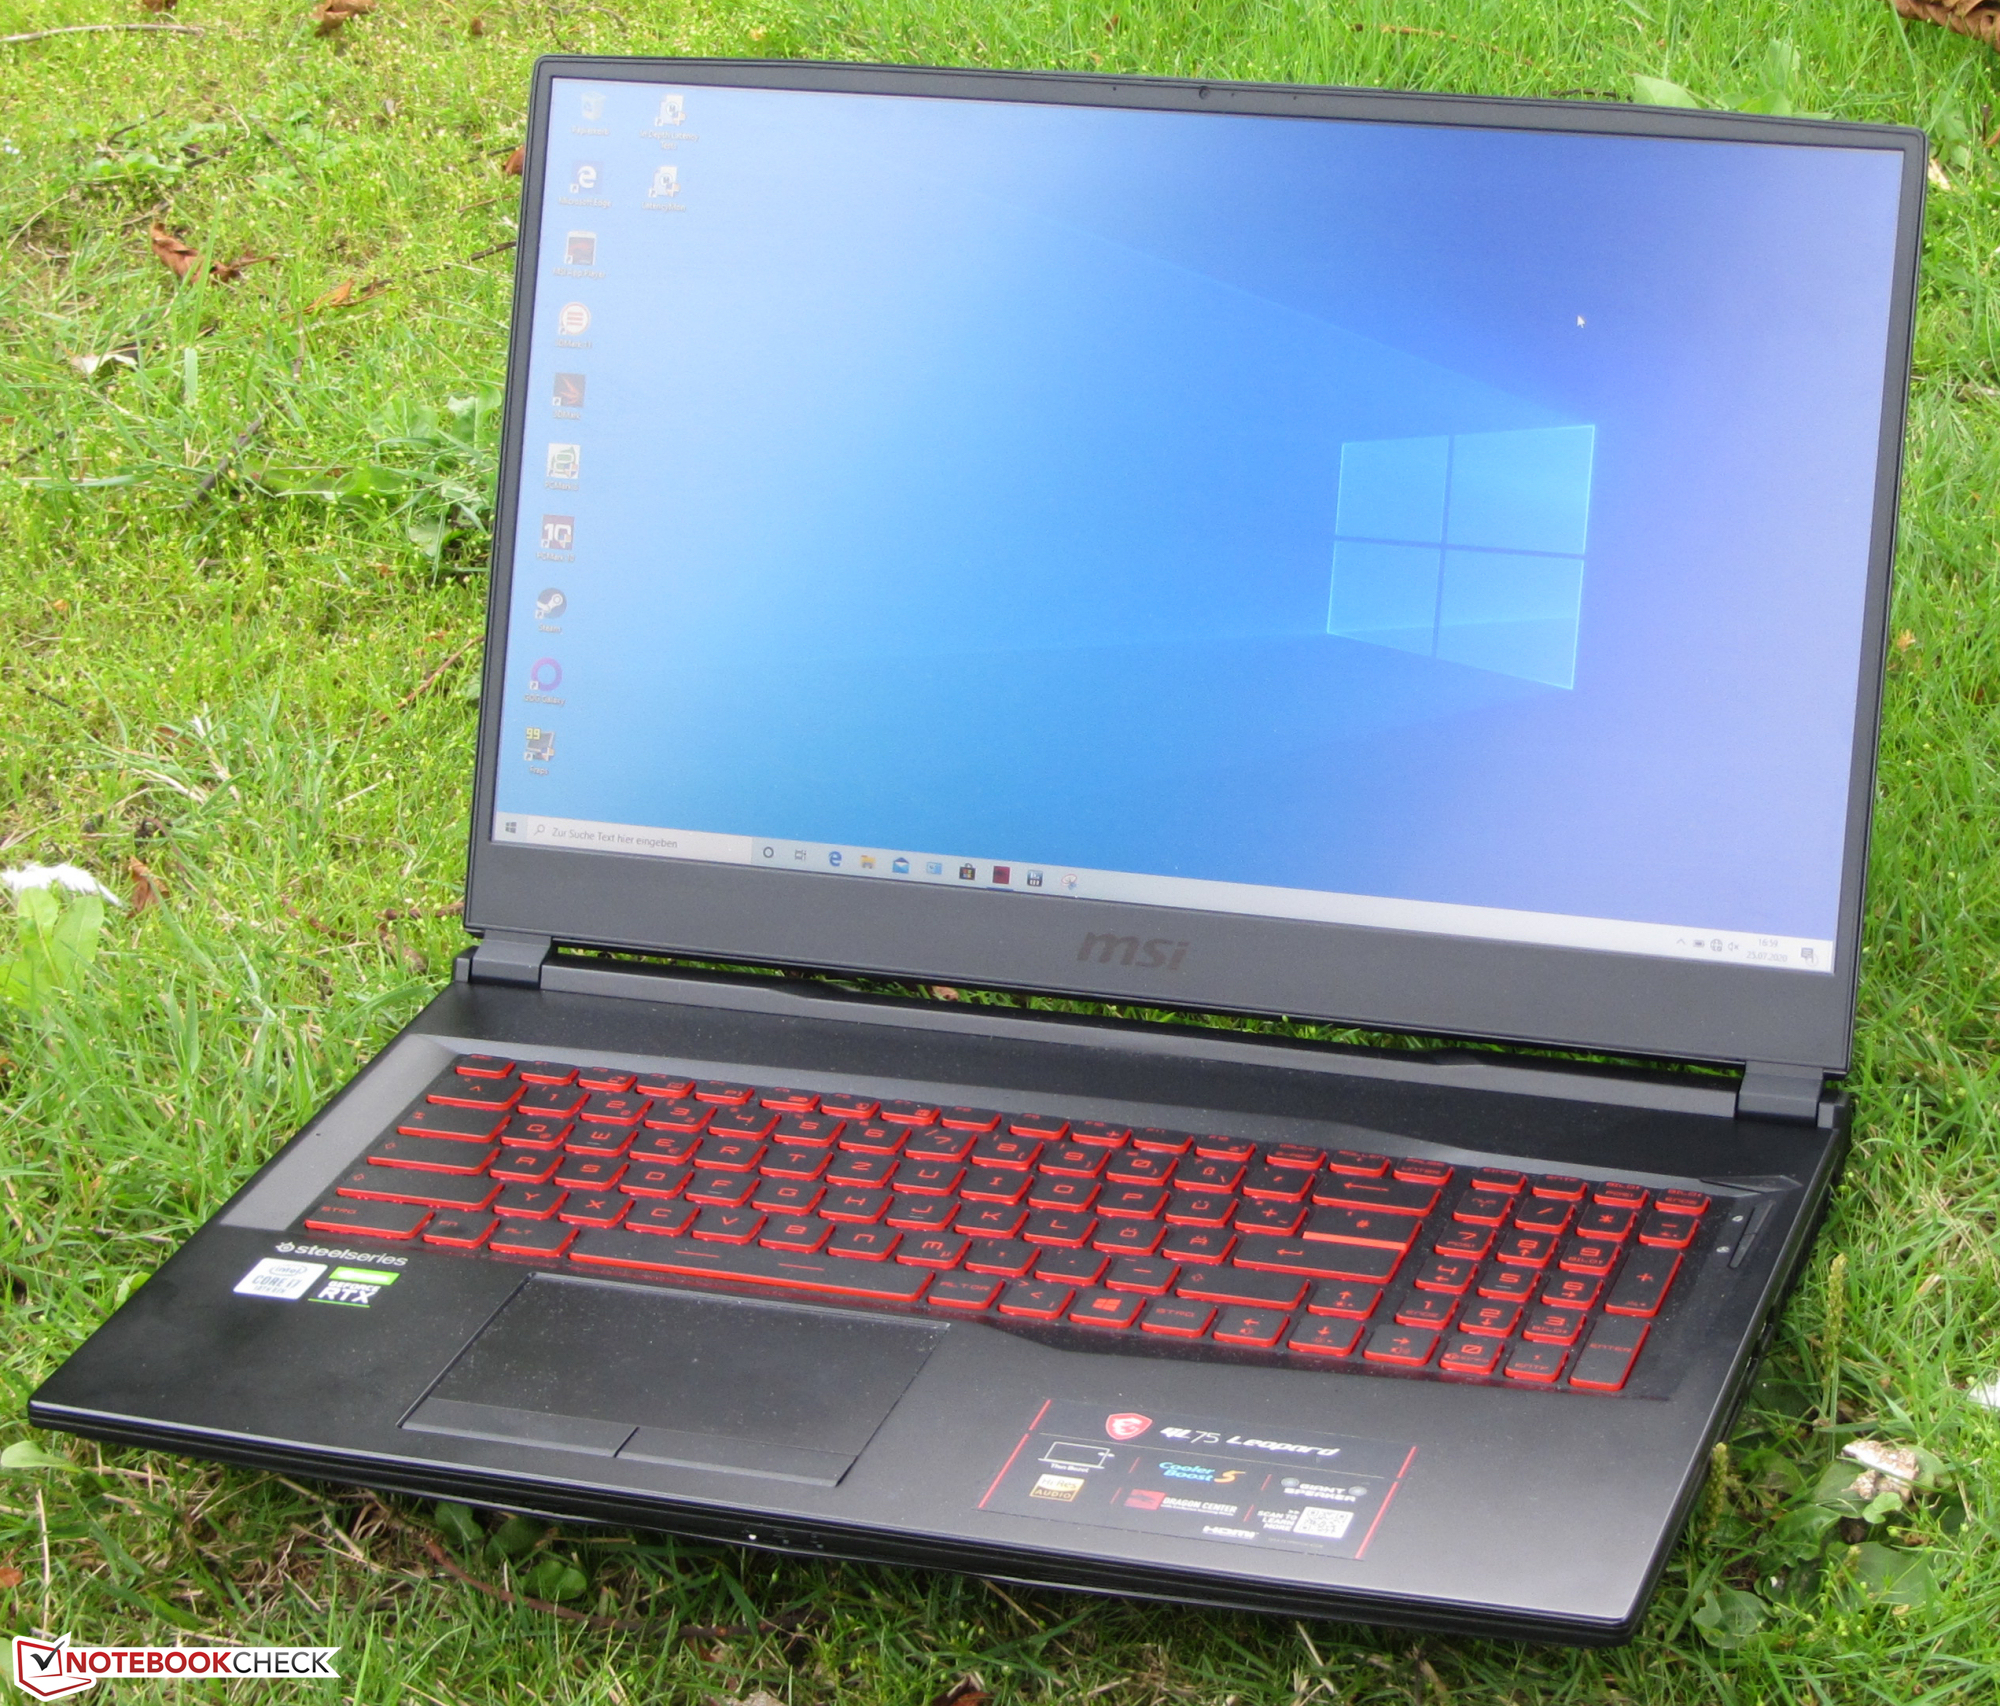
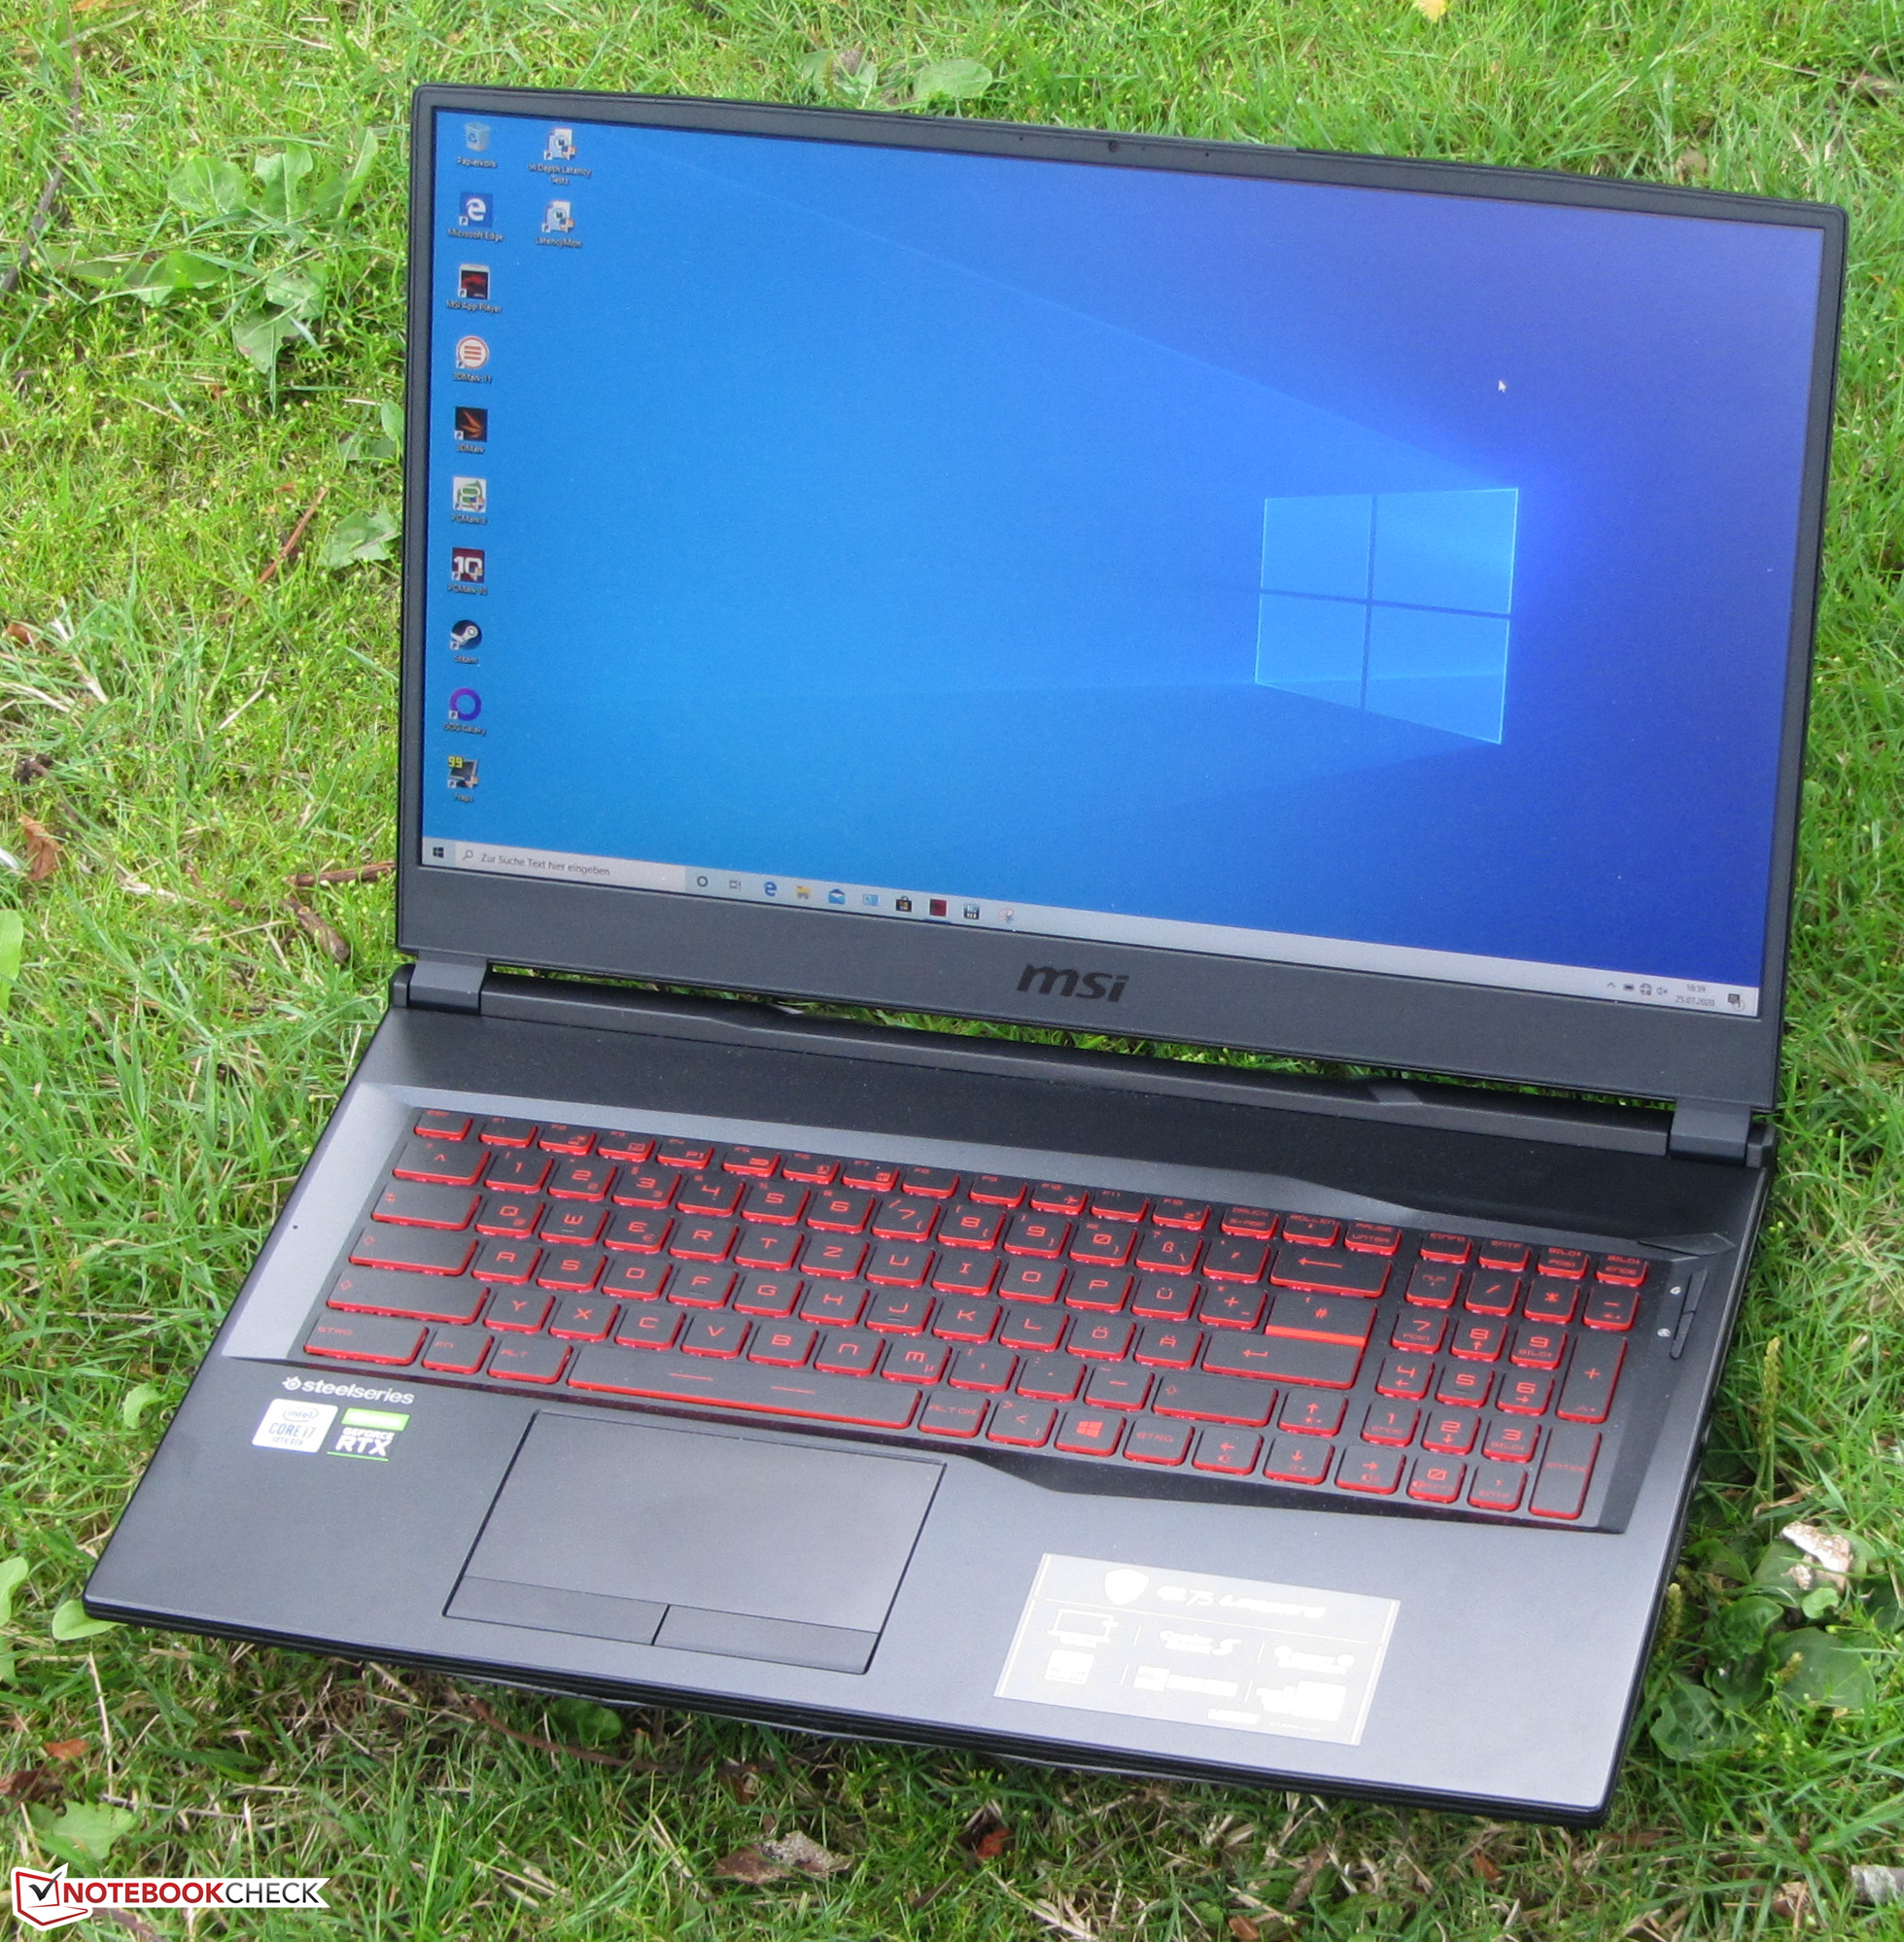
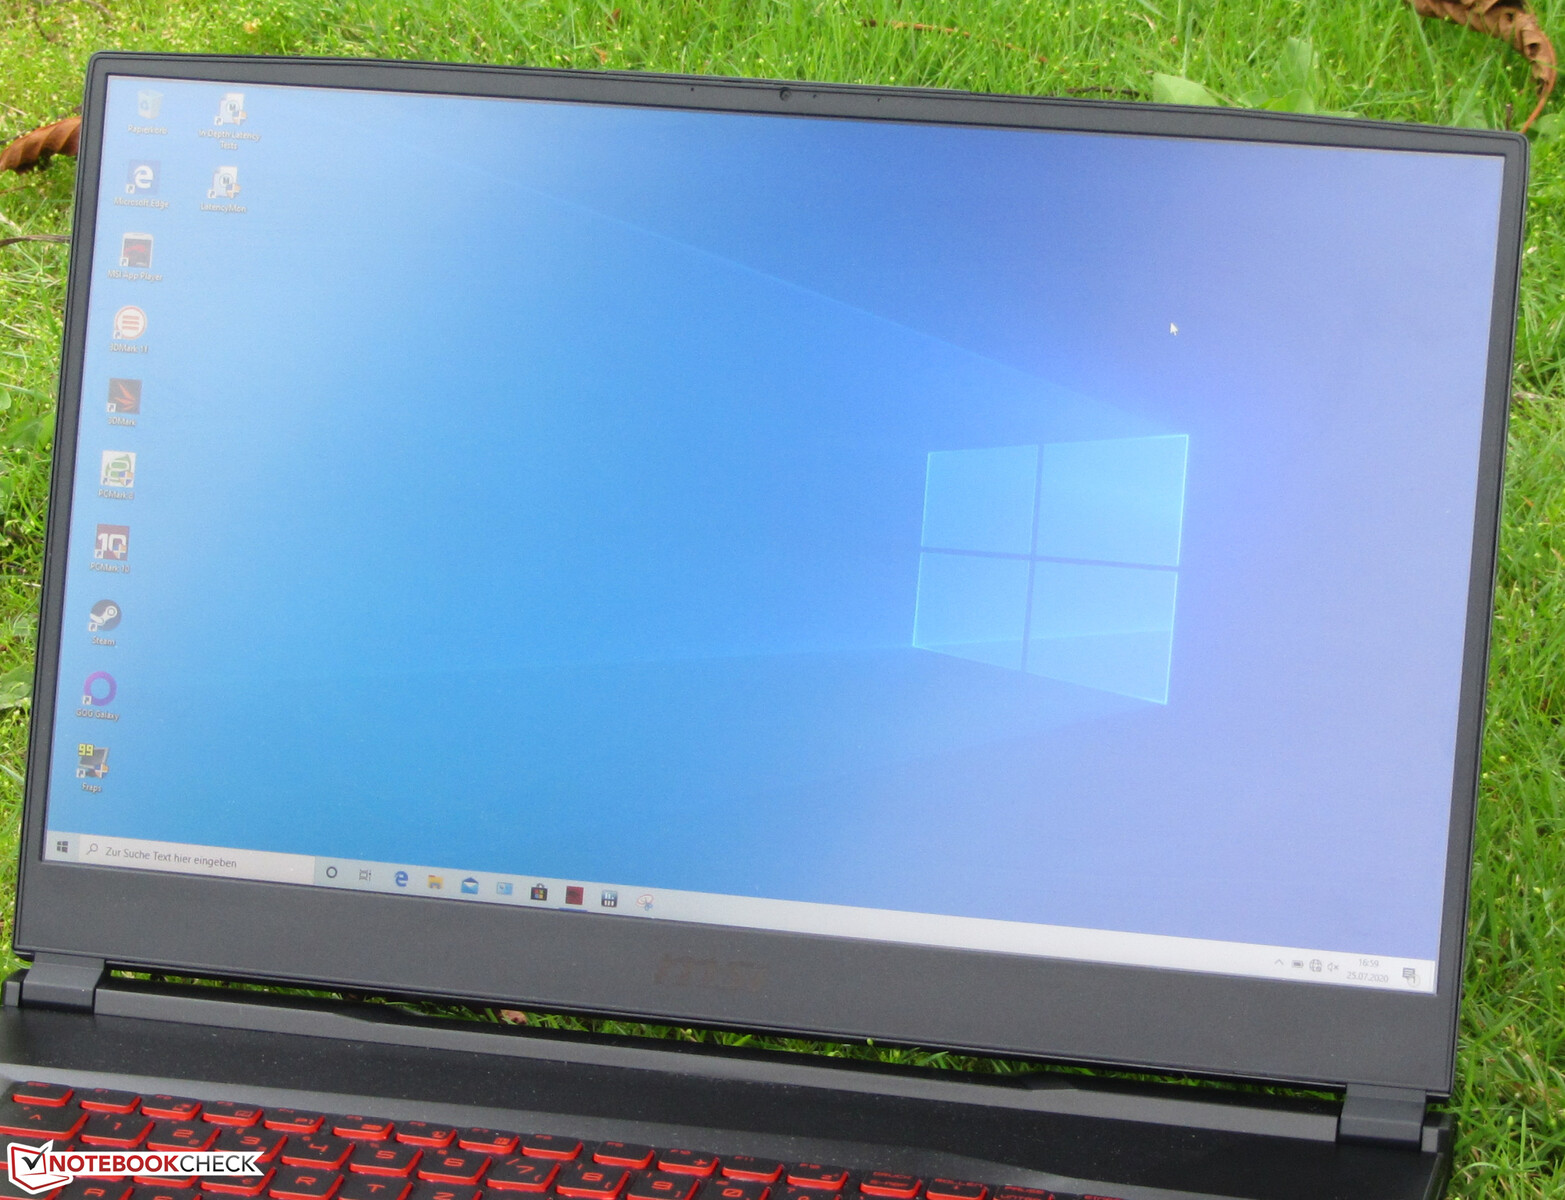
MSI GL75 Leopard im Test: Gelungenes Gaming-Notebook mit 144-Hz-Bildschirm

Das MSI GL75 Leopard gehört zu den Gaming-Notebooks im 17,3-Zoll-Format. Es wird von einem Core-i7-10750H-Sechskernprozessor und einem GeForce-RTX-2070-Grafikkern angetrieben. Das Gerät ist uns nicht unbekannt. Es handelt sich hier um den (weitgehend) baugleichen Nachfolger des GL75 9SEK bzw. das baugleiche Schwestermodell des GP75 Leopard 9SD. Zu den Konkurrenten zählen Geräte wie das Acer Nitro 5 AN517-52, das Schenker XMG Neo 17, das Lenovo Legion Y740-17IRHg.
Bew. | Datum | Modell | Gewicht | Dicke | Größe | Auflösung | Preis ab |
|---|---|---|---|---|---|---|---|
| 83.5 % v7 (old) | 08 / 2020 | MSI GL75 10SFR i7-10750H, GeForce RTX 2070 Mobile | 2.6 kg | 28 mm | 17.30" | 1920x1080 | |
| 80.6 % v7 (old) | 06 / 2020 | Acer Nitro 5 AN517-52-77DS i7-10750H, GeForce RTX 2060 Mobile | 2.2 kg | 24.9 mm | 17.30" | 1920x1080 | |
| 83.2 % v7 (old) | 12 / 2019 | Schenker XMG Neo 17 XNE17M19 i7-9750H, GeForce RTX 2060 Mobile | 2.5 kg | 27 mm | 17.30" | 1920x1080 | |
| 84 % v7 (old) | 03 / 2020 | Lenovo Legion Y740-17IRHg-81UJ001VGE i7-9750H, GeForce RTX 2080 Max-Q | 3 kg | 25.5 mm | 17.30" | 1920x1080 |
| SD Card Reader | |
| average JPG Copy Test (av. of 3 runs) | |
| Durchschnitt der Klasse Gaming (20.9 - 210, n=54, der letzten 2 Jahre) | |
| Schenker XMG Neo 17 (Toshiba Exceria Pro SDXC 64 GB UHS-II) | |
| Schenker XMG Neo 17 XNE17M19 (Toshiba Exceria Pro SDXC 64 GB UHS-II) | |
| MSI GP75 Leopard 9SD (Toshiba Exceria Pro SDXC 64 GB UHS-II) | |
| MSI GL75 9SEK-056US | |
| MSI GL75 10SFR (Toshiba Exceria Pro SDXC 64 GB UHS-II) | |
| maximum AS SSD Seq Read Test (1GB) | |
| Durchschnitt der Klasse Gaming (25.5 - 261, n=51, der letzten 2 Jahre) | |
| Schenker XMG Neo 17 (Toshiba Exceria Pro SDXC 64 GB UHS-II) | |
| Schenker XMG Neo 17 XNE17M19 (Toshiba Exceria Pro SDXC 64 GB UHS-II) | |
| MSI GL75 9SEK-056US | |
| MSI GP75 Leopard 9SD (Toshiba Exceria Pro SDXC 64 GB UHS-II) | |
| MSI GL75 10SFR (Toshiba Exceria Pro SDXC 64 GB UHS-II) | |


Display - Reaktionsschnell, hell, kontrastreich
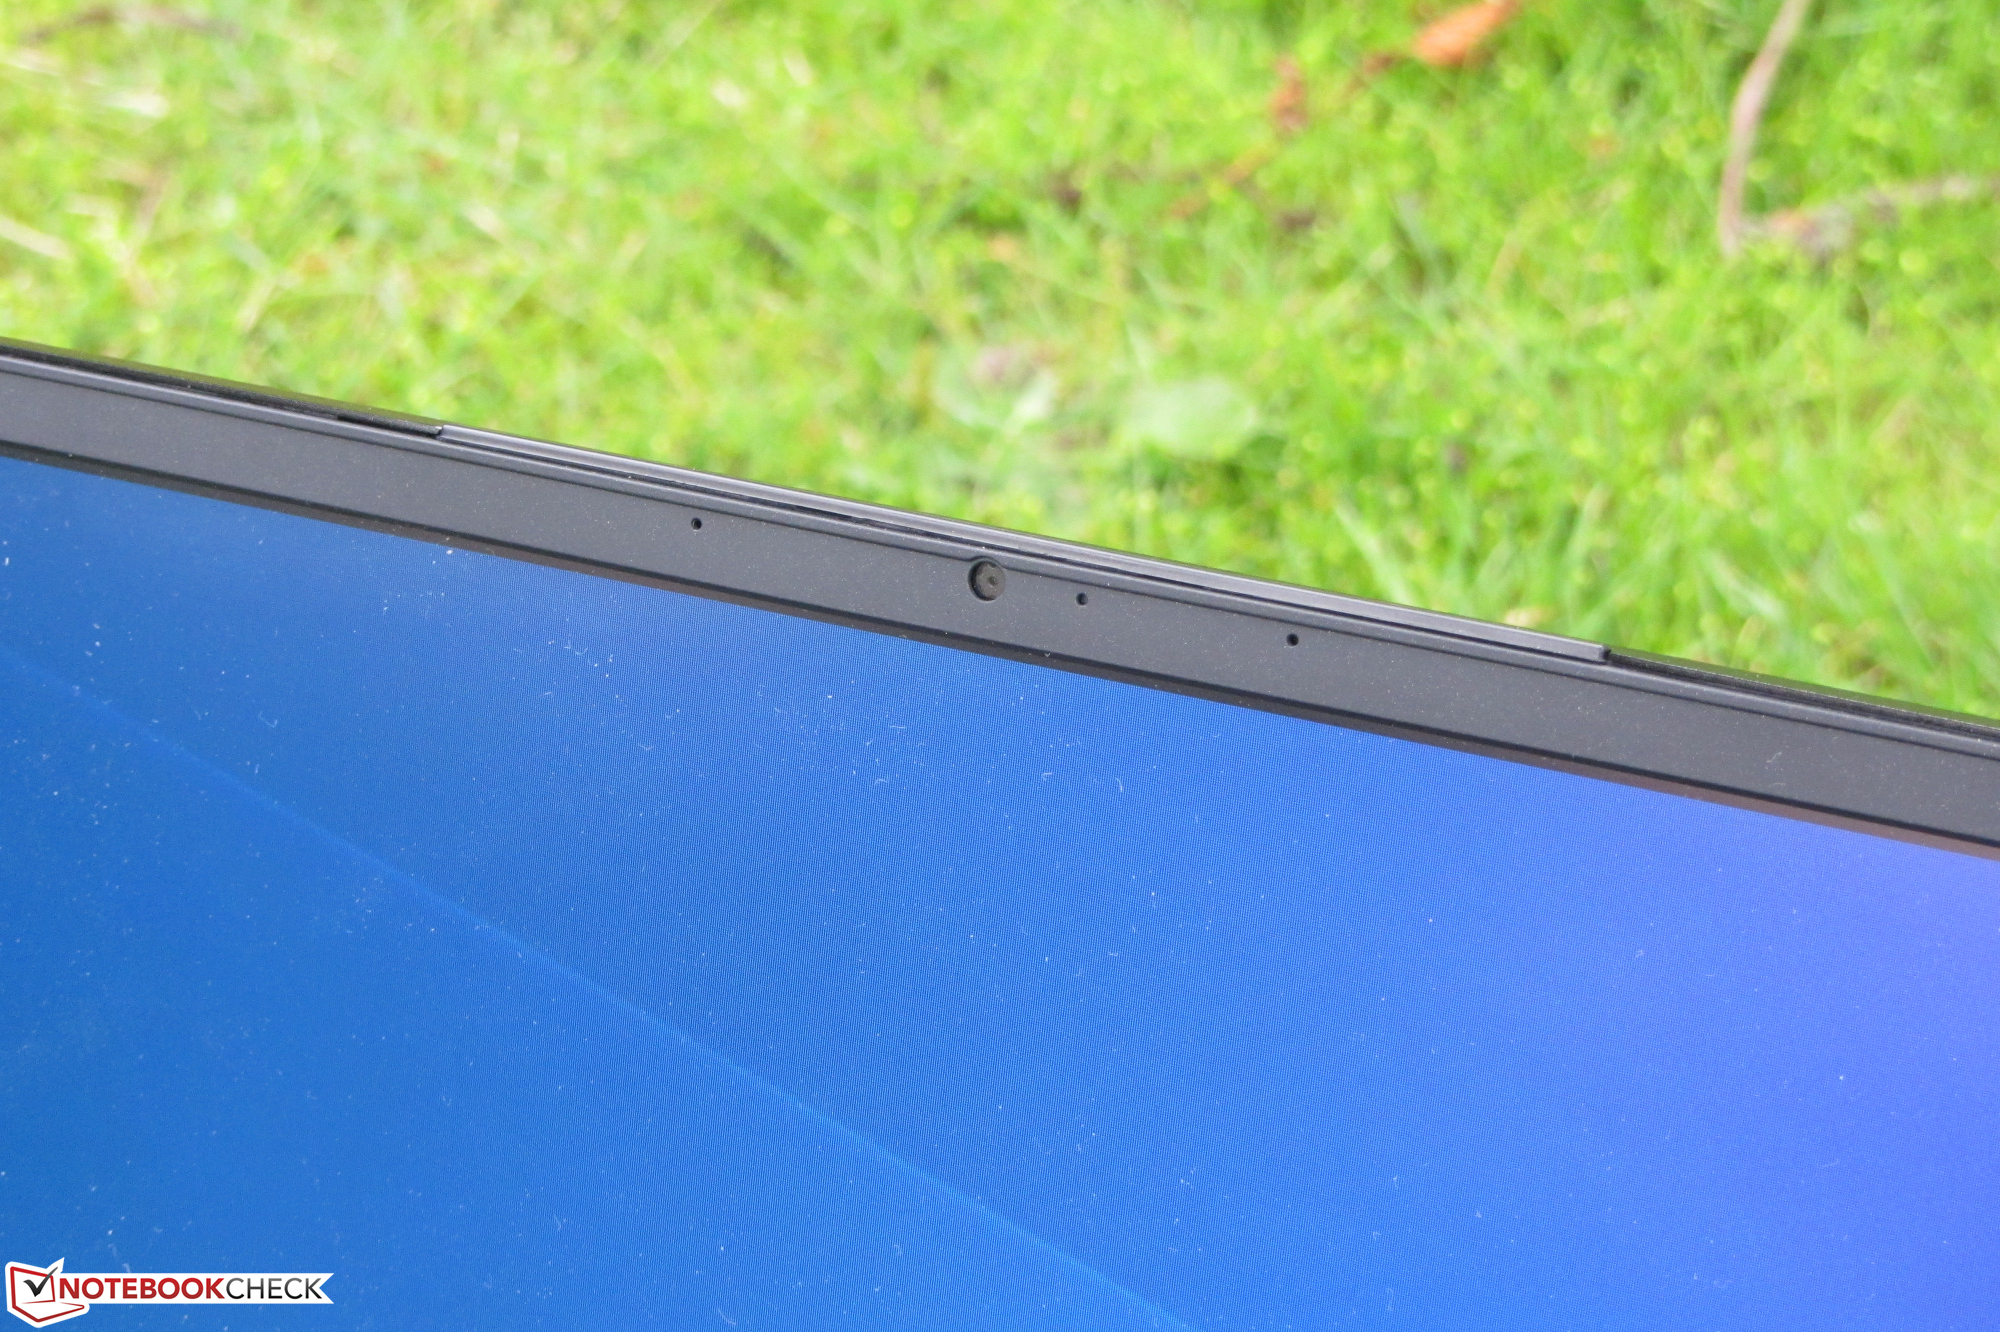
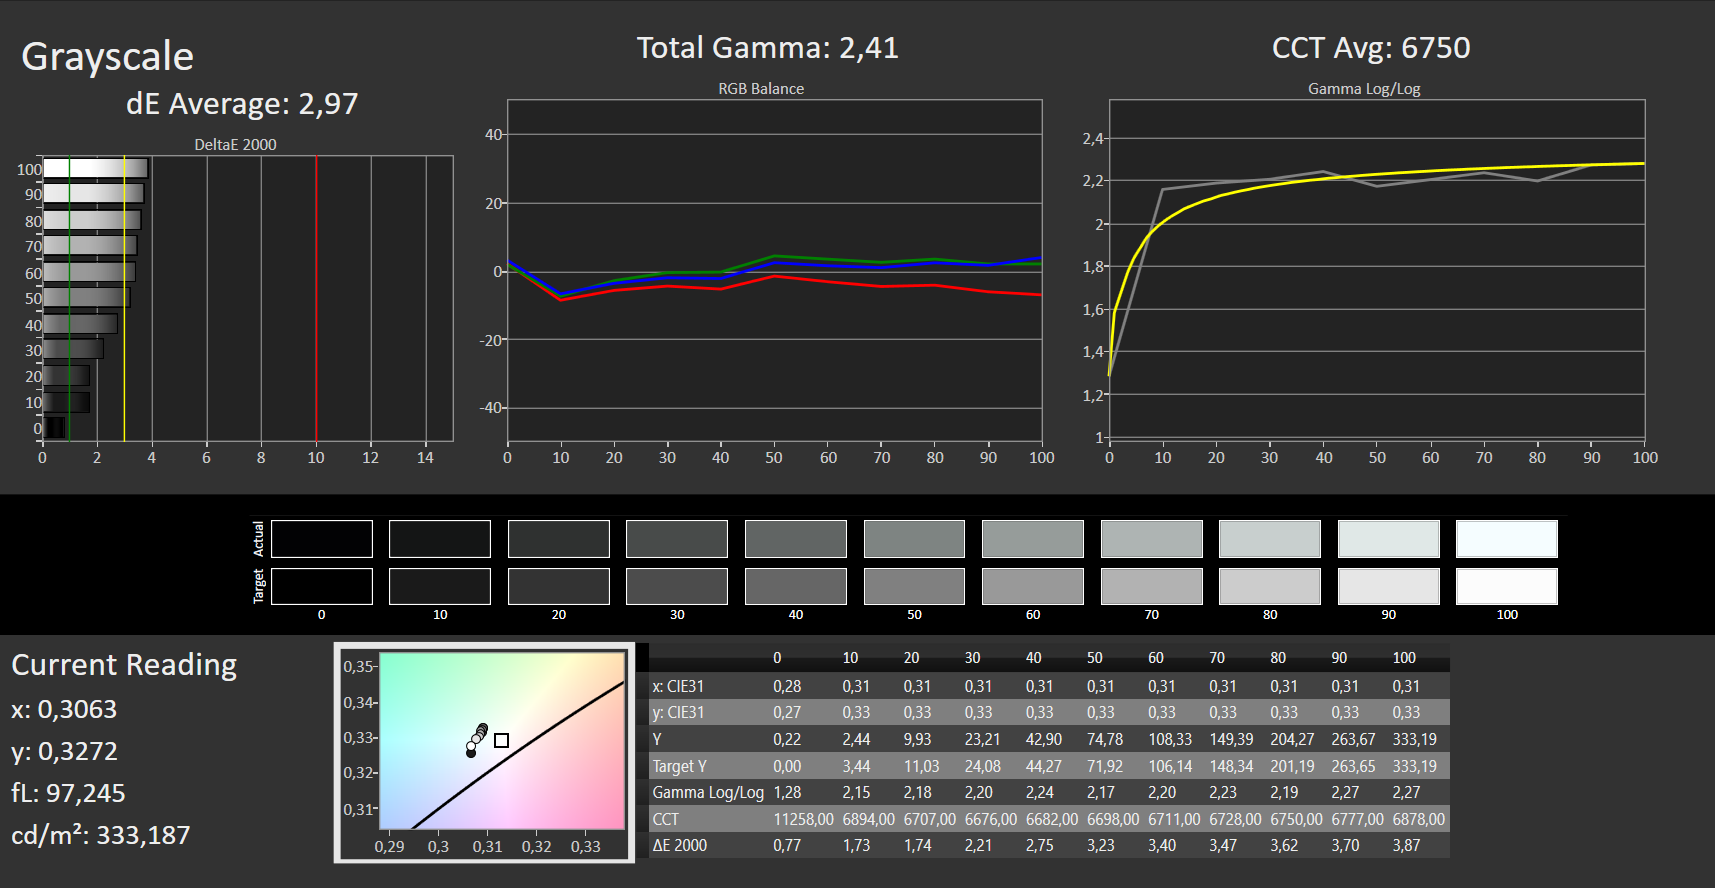
Das 17,3-Zoll-Display des GL75 arbeitet mit einer nativen Auflösung von 1.920 x 1.080 Bildpunkten. Helligkeit (308,7 cd/m²) und Kontrast (1.549:1) liegen im Soll. Darüber hinaus liefert das 144-Hz-Panel gute Reaktionszeiten. Leider zeigt es bei Helligkeitsstufen von 30 Prozent und darunter ein Displayflackern mit einer Frequenz von 208 Hz. Aufgrund der niedrigen Frequenz könnten bei empfindlichen Personen Kopfschmerzen und/oder Augenprobleme auftreten.

| |||||||||||||||||||||||||
Ausleuchtung: 86 %
Helligkeit Akku: 337 cd/m²
Kontrast: 1549:1 (Schwarzwert: 0.215 cd/m²)
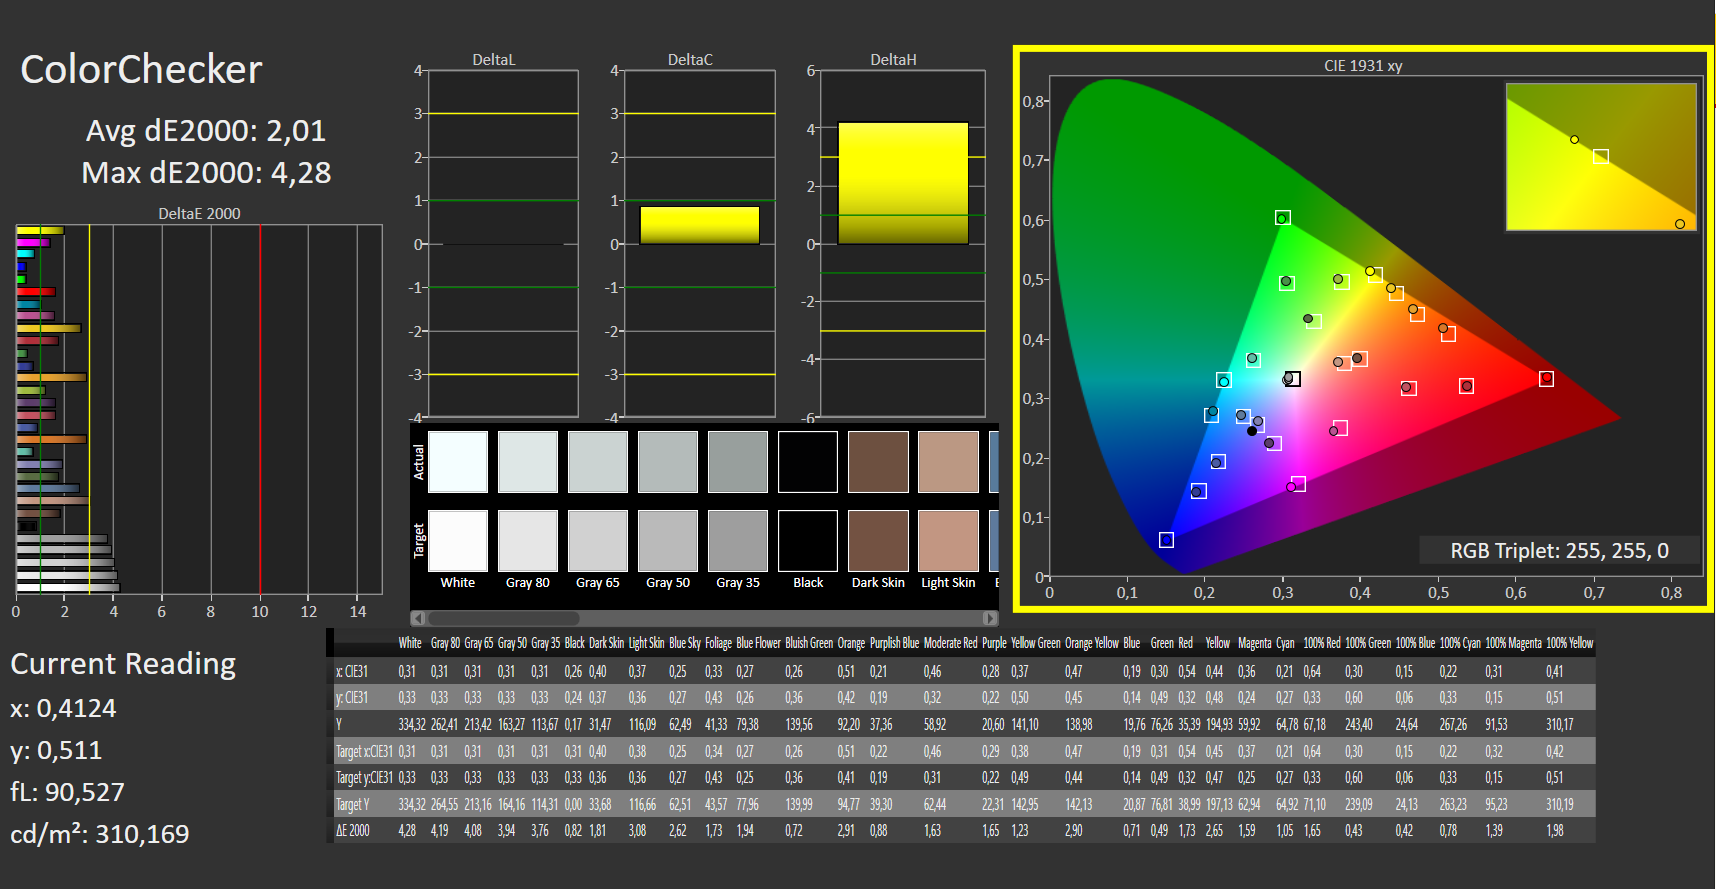
ΔE ColorChecker Calman: 1.98 | ∀{0.5-29.43 Ø4.71}
calibrated: 2.01
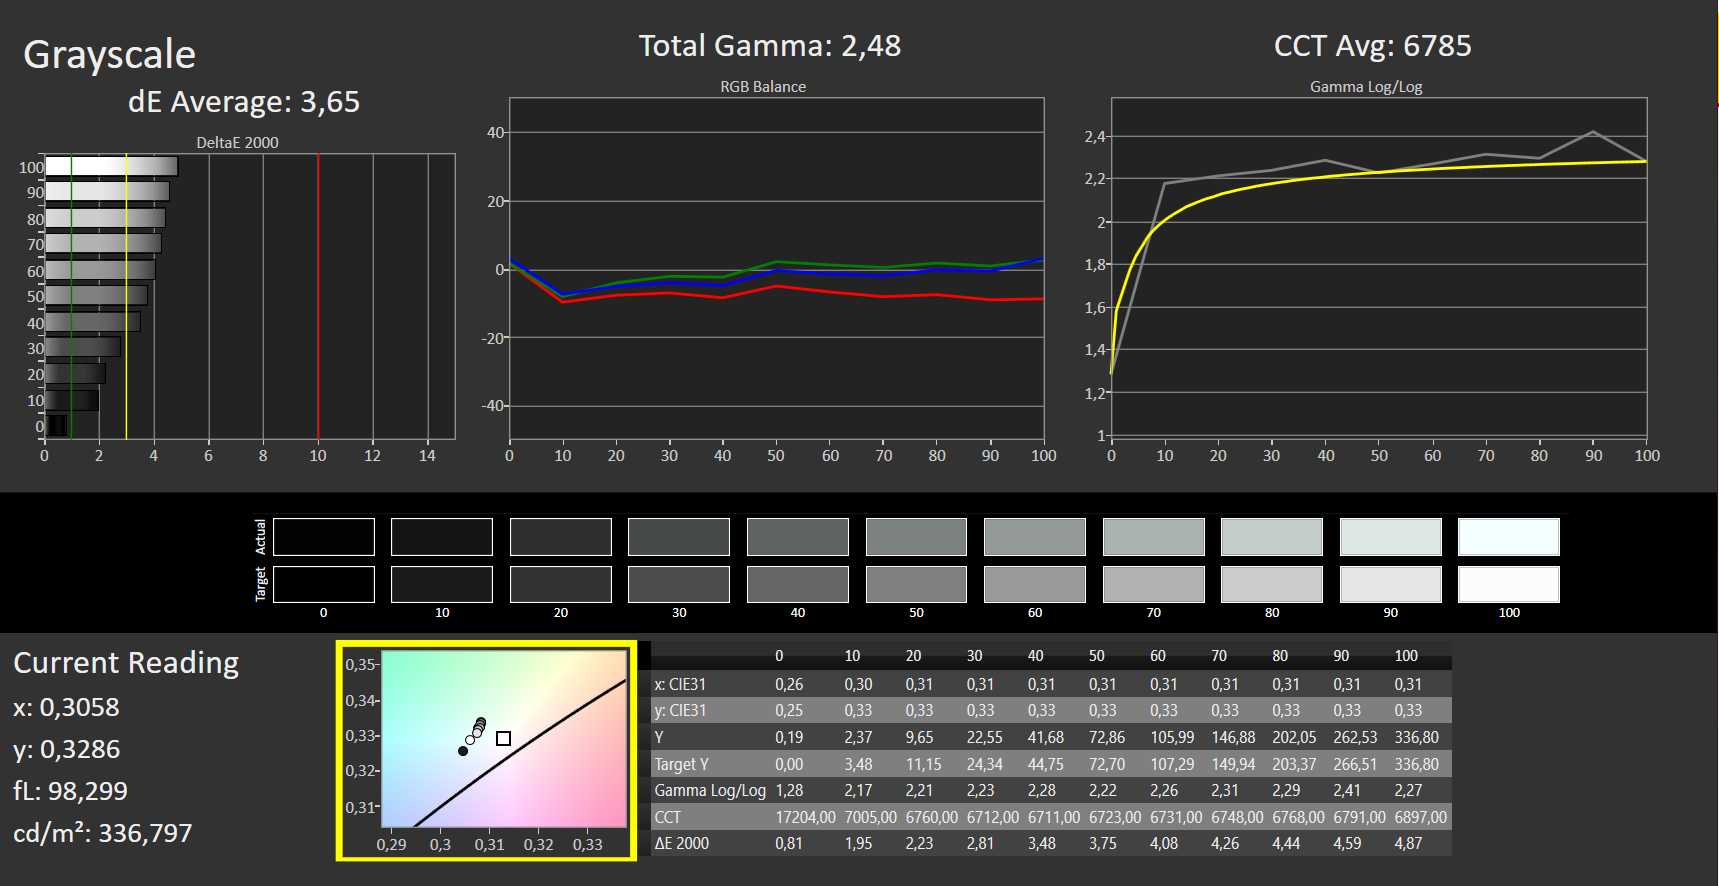
ΔE Greyscale Calman: 2.97 | ∀{0.09-98 Ø4.96}
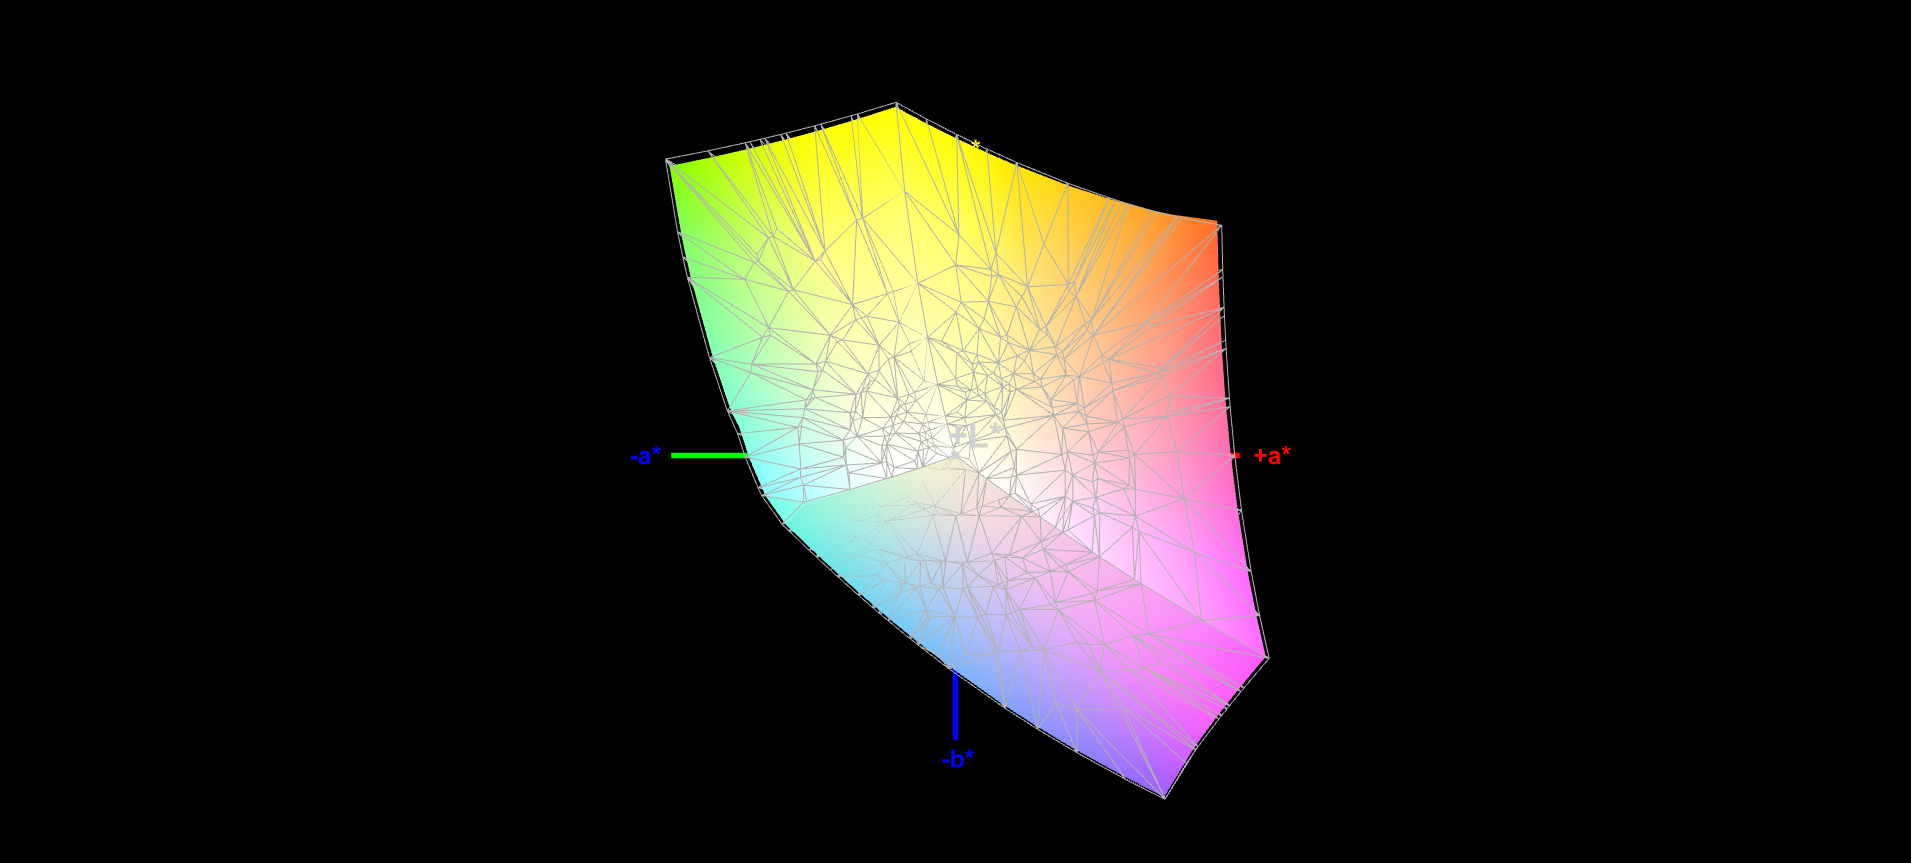
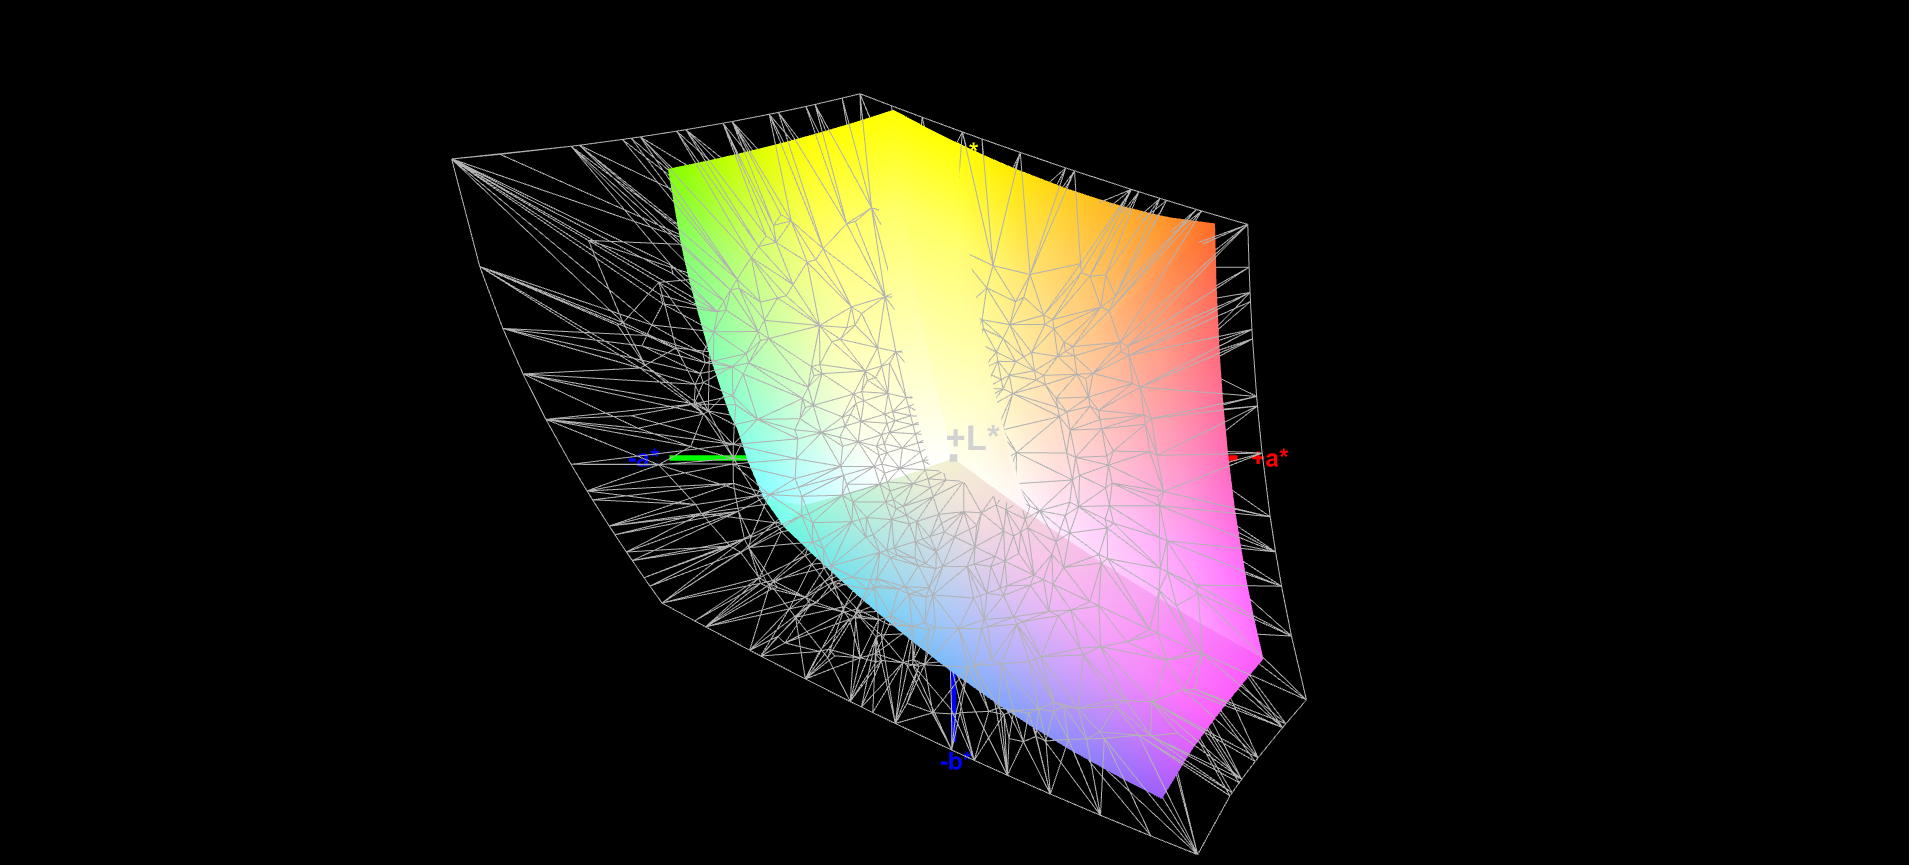
96% sRGB (Argyll 1.6.3 3D)
61% AdobeRGB 1998 (Argyll 1.6.3 3D)
66% AdobeRGB 1998 (Argyll 3D)
96.2% sRGB (Argyll 3D)
63.9% Display P3 (Argyll 3D)
Gamma: 2.41
CCT: 6750 K
| MSI GL75 10SFR Chi Mei N173HCE-G33, IPS, 1920x1080, 17.3" | Acer Nitro 5 AN517-52-77DS AU Optronics B173HAN04.7, IPS, 1920x1080, 17.3" | Schenker XMG Neo 17 XNE17M19 LG LP173WFG-SPB1 (LGD0615), IPS, 1920x1080, 17.3" | Lenovo Legion Y740-17IRHg-81UJ001VGE AUO_B173HAN03, IPS, 1920x1080, 17.3" | MSI GL75 9SEK-056US AU Optronics AUO479D (B173HAN04.7), IPS, 1920x1080, 17.3" | MSI GP75 Leopard 9SD Chi Mei N173HCE-G33 (CMN175C), IPS, 1920x1080, 17.3" | |
|---|---|---|---|---|---|---|
| Display | -38% | -0% | -2% | -36% | -1% | |
| Display P3 Coverage (%) | 63.9 | 39.47 -38% | 64.6 1% | 63.8 0% | 41.12 -36% | 63.4 -1% |
| sRGB Coverage (%) | 96.2 | 58.9 -39% | 95.6 -1% | 92.7 -4% | 61.1 -36% | 94.9 -1% |
| AdobeRGB 1998 Coverage (%) | 66 | 40.77 -38% | 65.6 -1% | 65.3 -1% | 42.49 -36% | 65.1 -1% |
| Response Times | -191% | -30% | -28% | -144% | 18% | |
| Response Time Grey 50% / Grey 80% * (ms) | 12 ? | 35 ? -192% | 15.6 ? -30% | 16 ? -33% | 26 ? -117% | 8 ? 33% |
| Response Time Black / White * (ms) | 9 ? | 26 ? -189% | 11.6 ? -29% | 11 ? -22% | 24.4 ? -171% | 8.8 ? 2% |
| PWM Frequency (Hz) | 208 ? | 25510 ? | ||||
| Bildschirm | -87% | -27% | -33% | -67% | -9% | |
| Helligkeit Bildmitte (cd/m²) | 333 | 263 -21% | 318 -5% | 310 -7% | 259.1 -22% | 420 26% |
| Brightness (cd/m²) | 309 | 246 -20% | 286 -7% | 281 -9% | 261 -16% | 393 27% |
| Brightness Distribution (%) | 86 | 85 -1% | 86 0% | 85 -1% | 93 8% | 91 6% |
| Schwarzwert * (cd/m²) | 0.215 | 0.47 -119% | 0.23 -7% | 0.31 -44% | 0.25 -16% | 0.32 -49% |
| Kontrast (:1) | 1549 | 560 -64% | 1383 -11% | 1000 -35% | 1036 -33% | 1313 -15% |
| Delta E Colorchecker * | 1.98 | 5.07 -156% | 3.89 -96% | 3.86 -95% | 4.23 -114% | 3.04 -54% |
| Colorchecker dE 2000 max. * | 4.34 | 20.5 -372% | 10.56 -143% | 7.8 -80% | 23.39 -439% | 7.22 -66% |
| Colorchecker dE 2000 calibrated * | 2.01 | 4.9 -144% | 1.03 49% | 3.9 -94% | 0.89 56% | |
| Delta E Graustufen * | 2.97 | 2.55 14% | 5.3 -78% | 4.48 -51% | 1.3 56% | 3.91 -32% |
| Gamma | 2.41 91% | 2.37 93% | 2.46 89% | 2.5 88% | 2.076 106% | 2.26 97% |
| CCT | 6750 96% | 6446 101% | 7462 87% | 7542 86% | 6542 99% | 7138 91% |
| Farbraum (Prozent von AdobeRGB 1998) (%) | 61 | 37 -39% | 60 -2% | 60 -2% | 39 -36% | 60 -2% |
| Color Space (Percent of sRGB) (%) | 96 | 59 -39% | 96 0% | 93 -3% | 61 -36% | 95 -1% |
| Durchschnitt gesamt (Programm / Settings) | -105% /
-91% | -19% /
-23% | -21% /
-26% | -82% /
-71% | 3% /
-5% |
* ... kleinere Werte sind besser
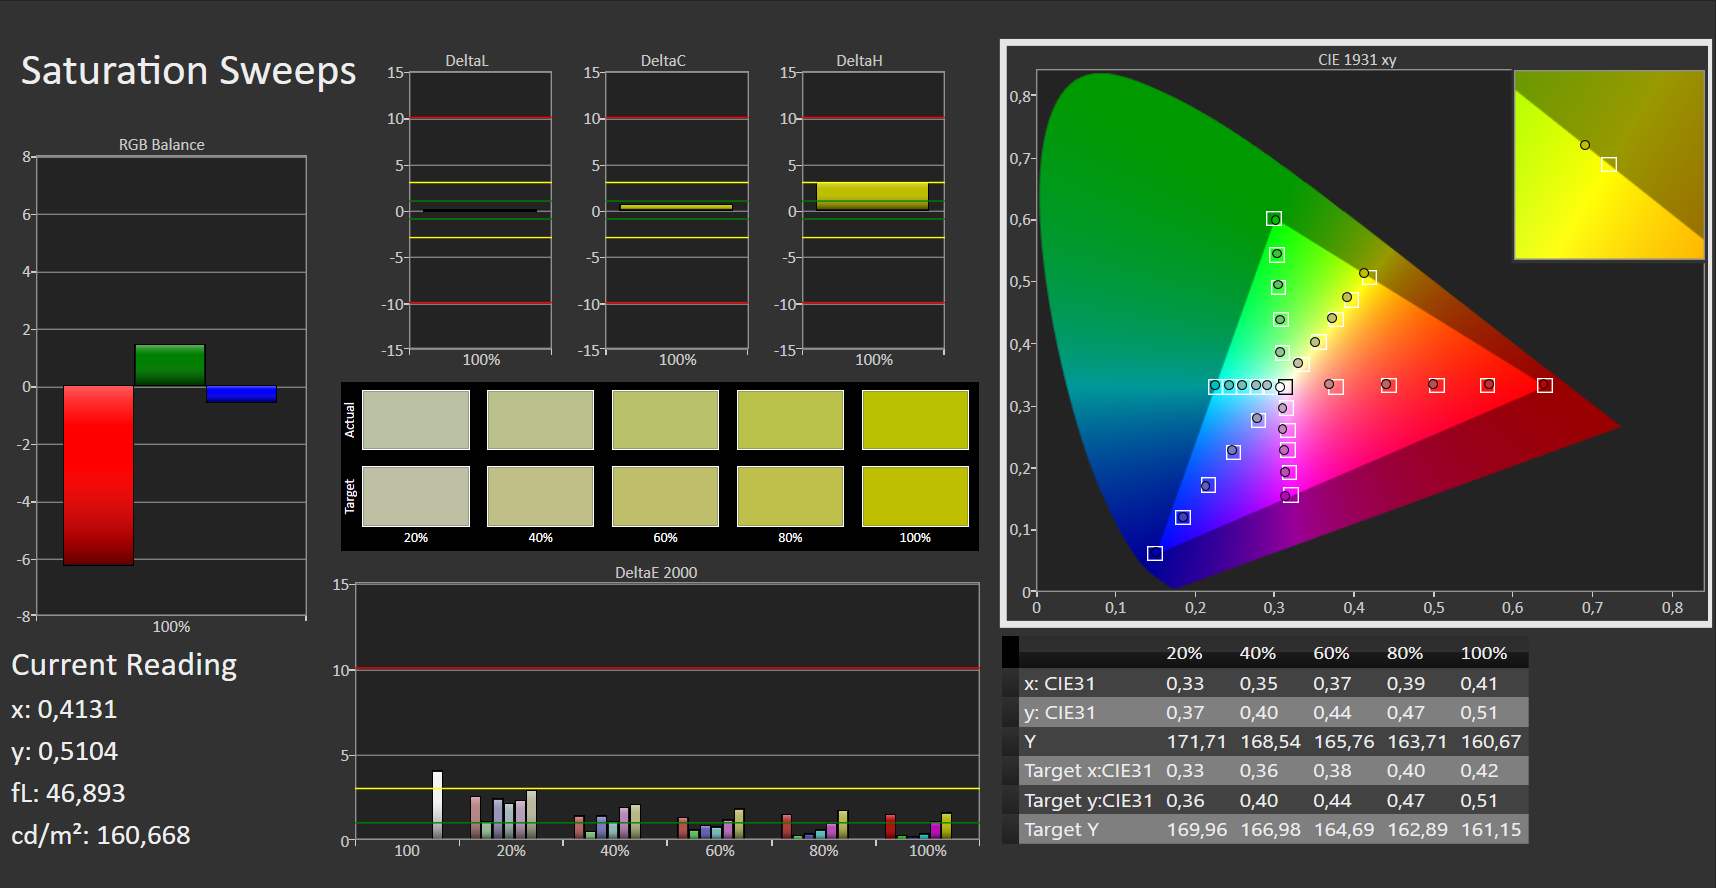
Schon im Auslieferungszustand zeigt der Bildschirm eine gute Farbdarstellung. Mit einer Delta-E-2000-Farbabweichung von knapp 2 wird das Soll (Delta-E kleiner 3) erfüllt. Unter einem Blaustich leidet das Display nicht. Mittels einer Kalibrierung werden keine Verbesserungen bei der Farbdarstellung erreicht. Der AdobeRGB-Farbraum (61 Prozent) wird nicht vollständig abgebildet. Besser sieht es beim sRGB-Farbraum (96 Prozent) aus.

Reaktionszeiten (Response Times) des Displays
| ↔ Reaktionszeiten Schwarz zu Weiß | ||
|---|---|---|
| 9 ms ... steigend ↗ und fallend ↘ kombiniert | ↗ 5 ms steigend | 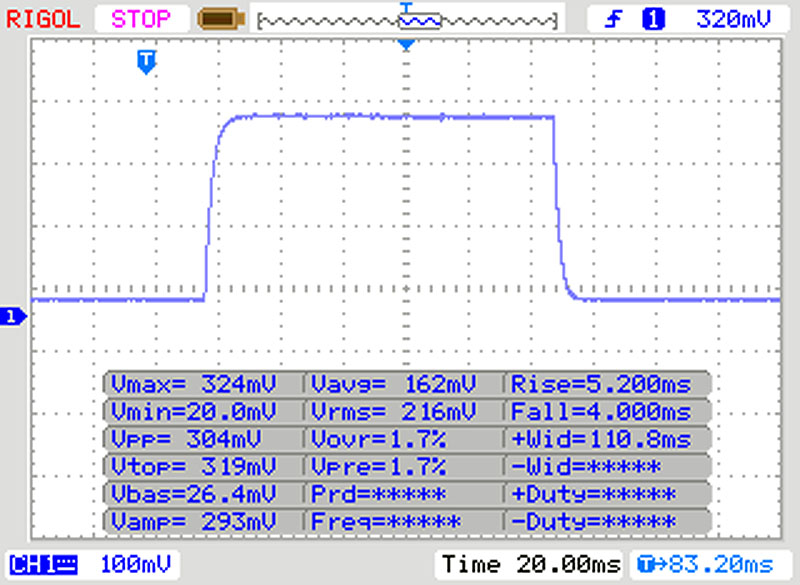 |
| ↘ 4 ms fallend | ||
| Die gemessenen Reaktionszeiten sind kurz wodurch sich der Bildschirm auch für Spiele gut eignen sollte. Im Vergleich rangierten die bei uns getesteten Geräte von 0.1 (Minimum) zu 240 (Maximum) ms. » 25 % aller Screens waren schneller als der getestete. Daher sind die gemessenen Reaktionszeiten besser als der Durchschnitt aller vermessenen Geräte (19.8 ms). | ||
| ↔ Reaktionszeiten 50% Grau zu 80% Grau | ||
| 12 ms ... steigend ↗ und fallend ↘ kombiniert | ↗ 6 ms steigend | 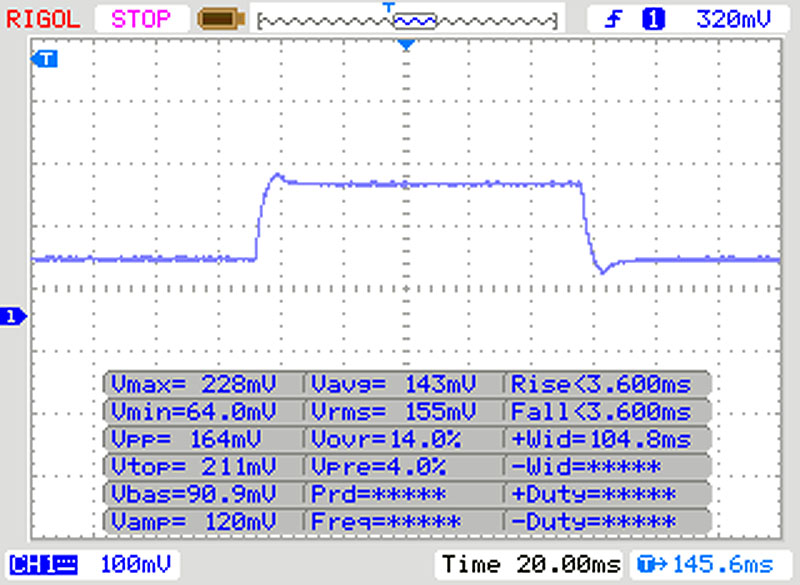 |
| ↘ 6 ms fallend | ||
| Die gemessenen Reaktionszeiten sind gut, für anspruchsvolle Spieler könnten der Bildschirm jedoch zu langsam sein. Im Vergleich rangierten die bei uns getesteten Geräte von 0.165 (Minimum) zu 636 (Maximum) ms. » 25 % aller Screens waren schneller als der getestete. Daher sind die gemessenen Reaktionszeiten besser als der Durchschnitt aller vermessenen Geräte (31 ms). | ||
Bildschirm-Flackern / PWM (Pulse-Width Modulation)
| Flackern / PWM festgestellt | 208 Hz | ≤ 30 % Helligkeit | 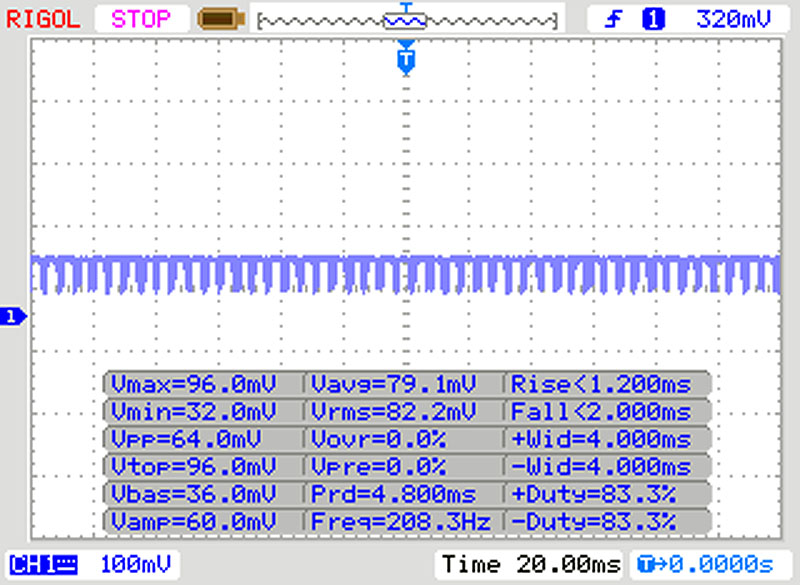 |
Das Display flackert mit 208 Hz (im schlimmsten Fall, eventuell durch Pulsweitenmodulation PWM) bei einer eingestellten Helligkeit von 30 % und darunter. Darüber sollte es zu keinem Flackern kommen. Die Frequenz von 208 Hz ist relativ gering und daher sollte es bei sensiblen Personen zu Problemen wie Flackern oder Augenbeschwerden führen. Im Vergleich: 52 % aller getesteten Geräte nutzten kein PWM um die Helligkeit zu reduzieren. Wenn PWM eingesetzt wurde, dann bei einer Frequenz von durchschnittlich 7757 (Minimum 5, Maximum 343500) Hz. | |||
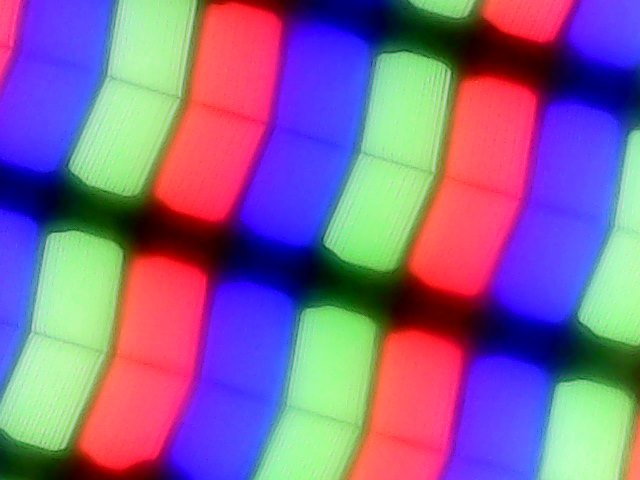
Das Notebook ist mit einem blickwinkelstabilen IPS-Panel bestückt. Somit ist der Bildschirm aus jeder Position heraus ablesbar. Im Freien ist ein Ablesen des Displays möglich, wenn die Sonne nicht allzu hell strahlt.

Leistung - Das GL75 bietet genug Leistung für alle Anwendungsbereiche
MSI hat mit dem GL75 Leopard 10SFR-221 ein 17,3-Zoll-Gaming-Notebook im Sortiment. Es bringt jedes aktuelle Spiel flüssig auf den Bildschirm und gibt auch in allen anderen Anwendungsbereichen eine gute Figur ab. Für unser Testgerät müssen knapp 1.800 Euro auf den Tisch gelegt werden. Andere Ausstattungsvarianten sind verfügbar.
Testbedingungen
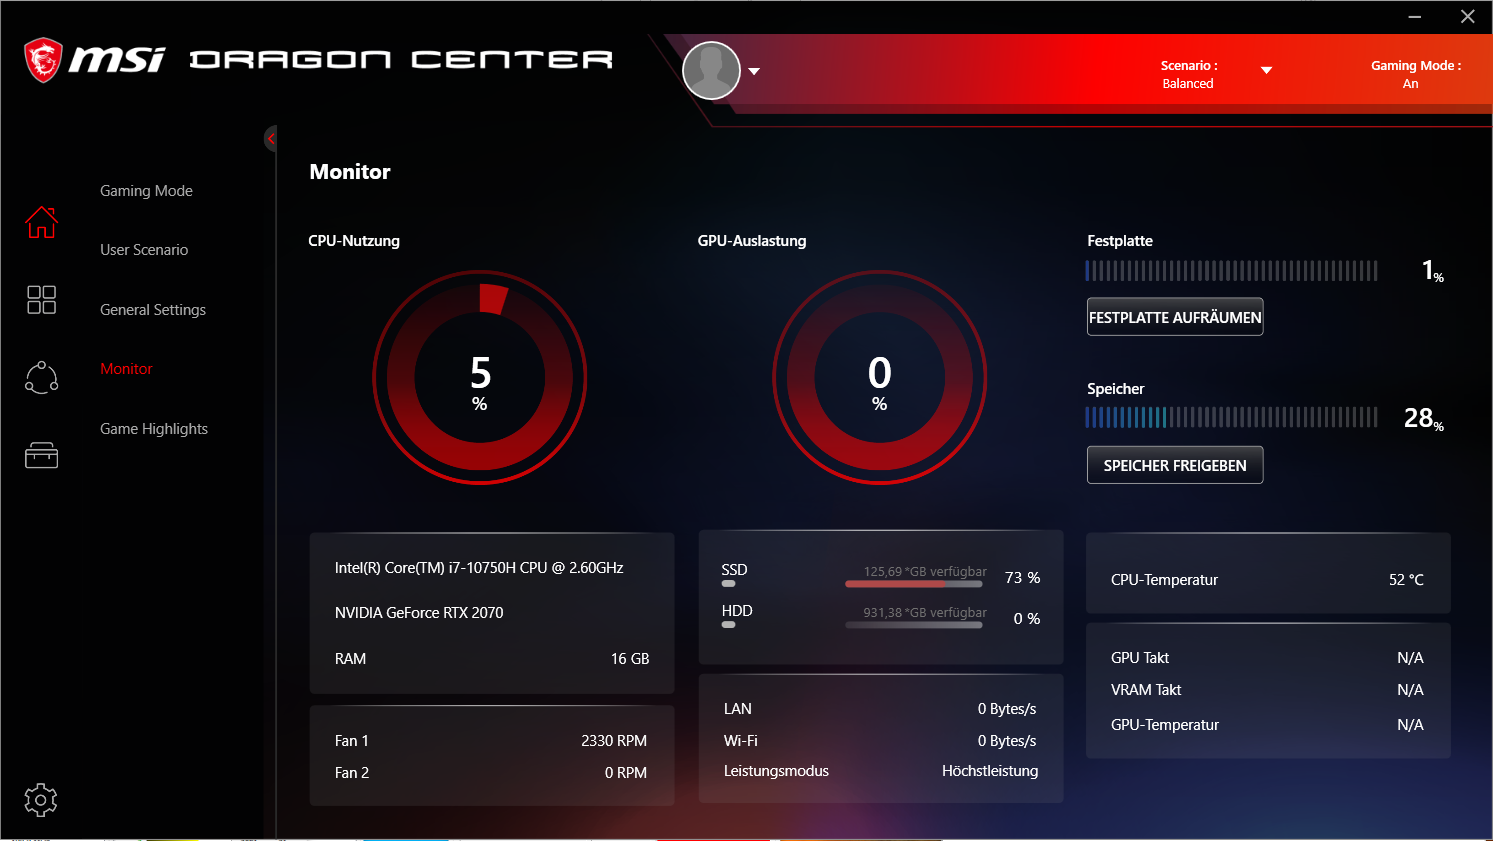
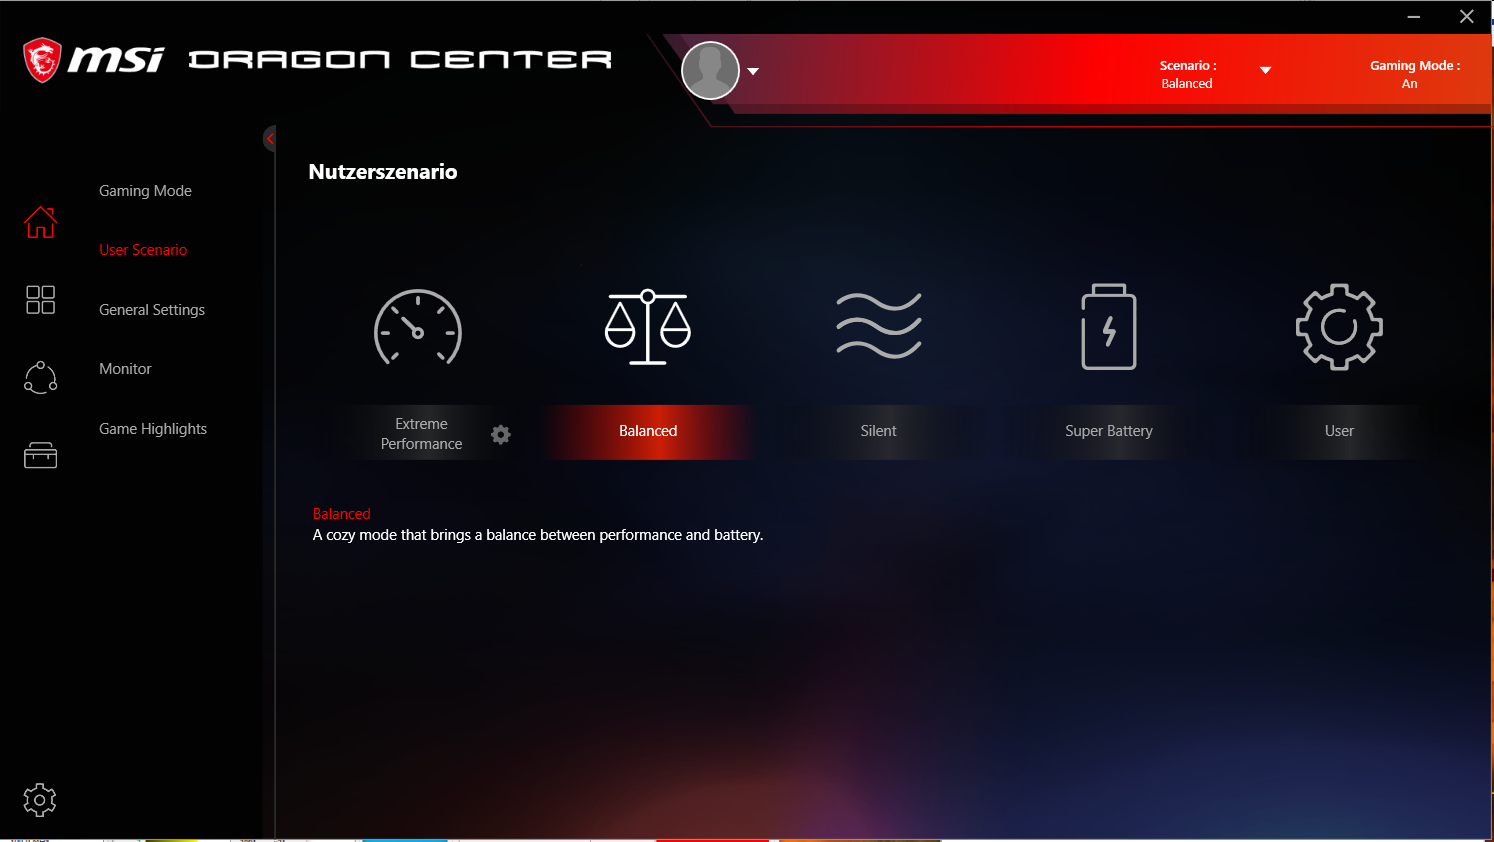
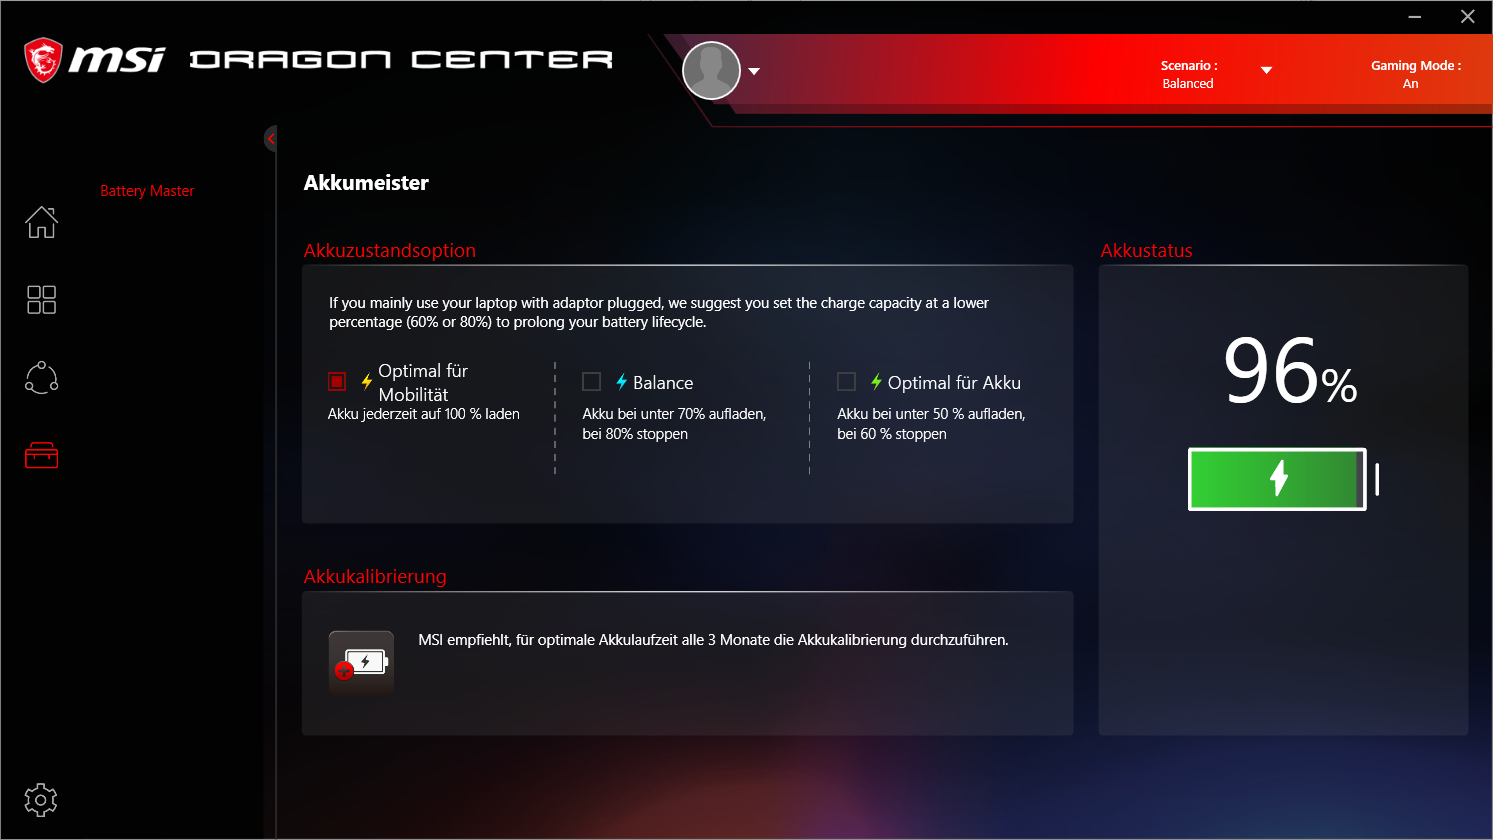
Das vorinstallierte Dragon Center bietet diverse Leistungsprofile zur Auswahl, die Auswirkungen auf die Lärmentwicklung und die Rechenleistung haben. Wir haben alle Tests mit dem Leistungsprofil "Balanced" durchführt. Einige Benchmarks haben wir zusätzlich unter dem "Extreme Performance"-Profil durchgeführt und weisen an den entsprechenden Stellen darauf hin.
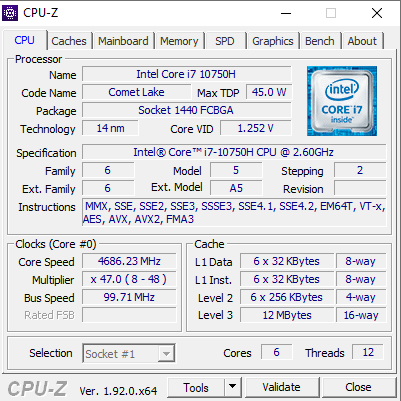
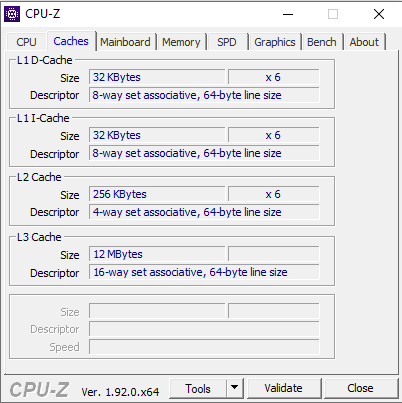
Prozessor
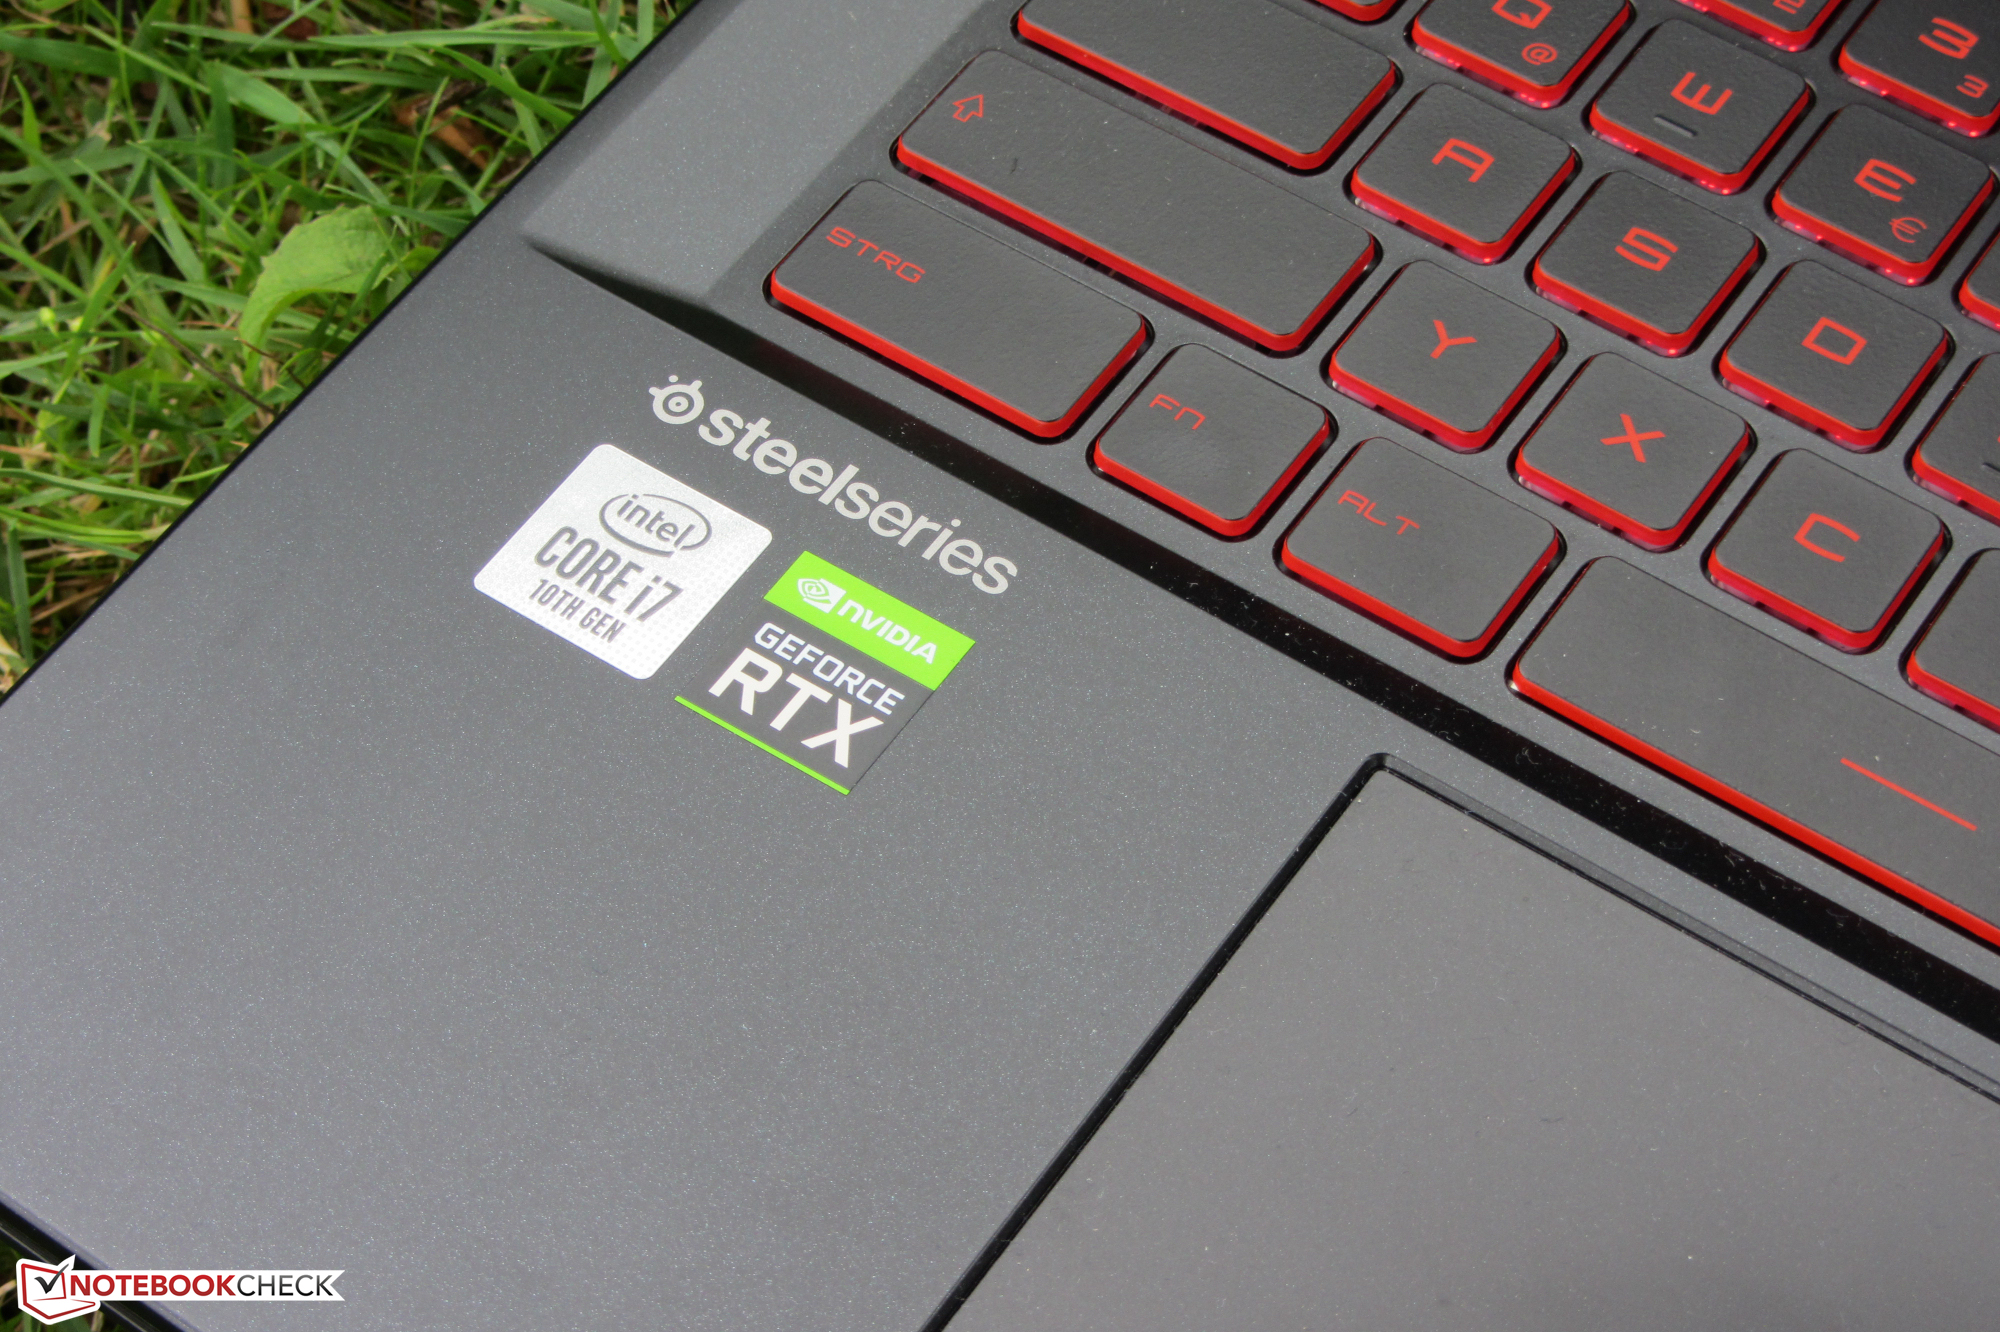
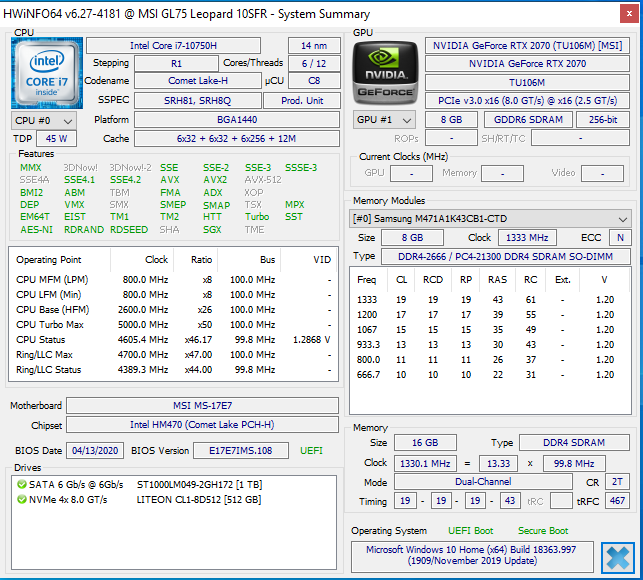
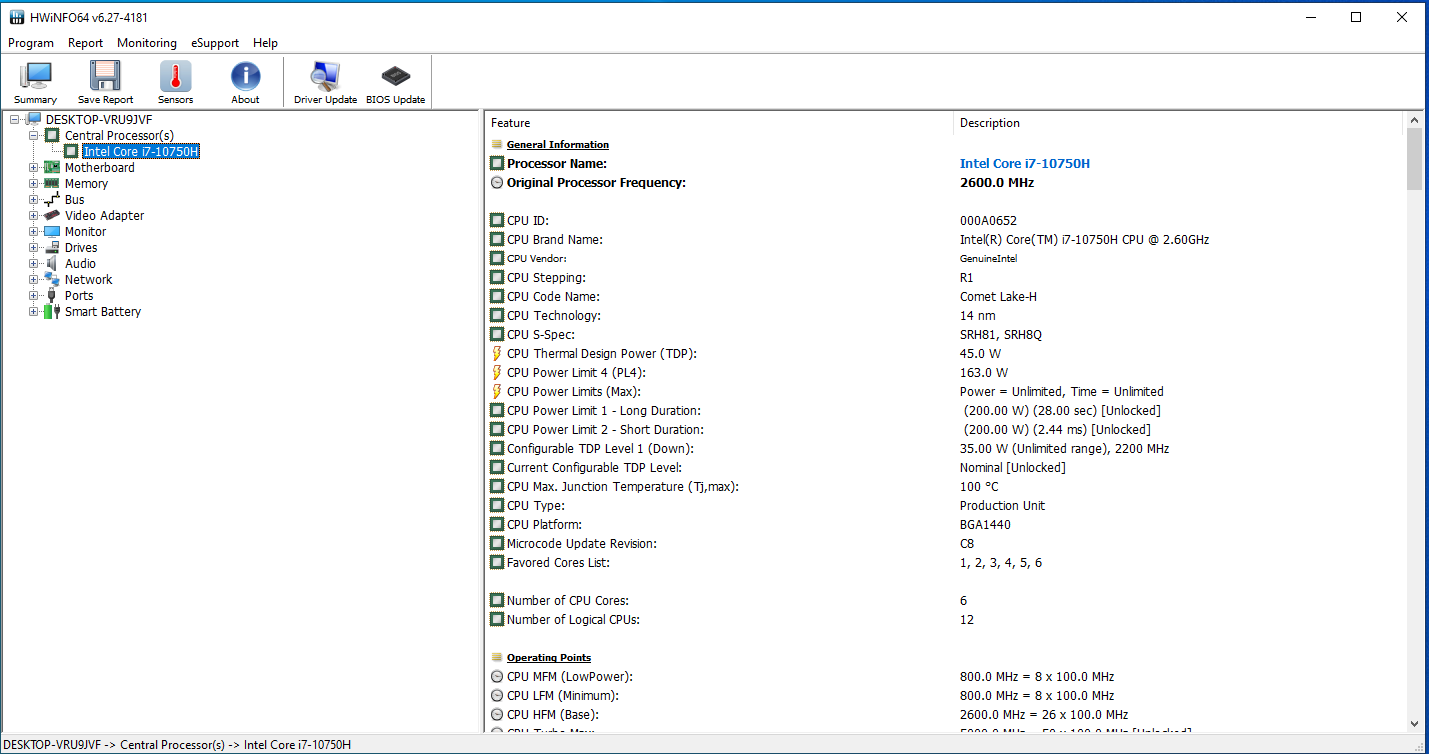
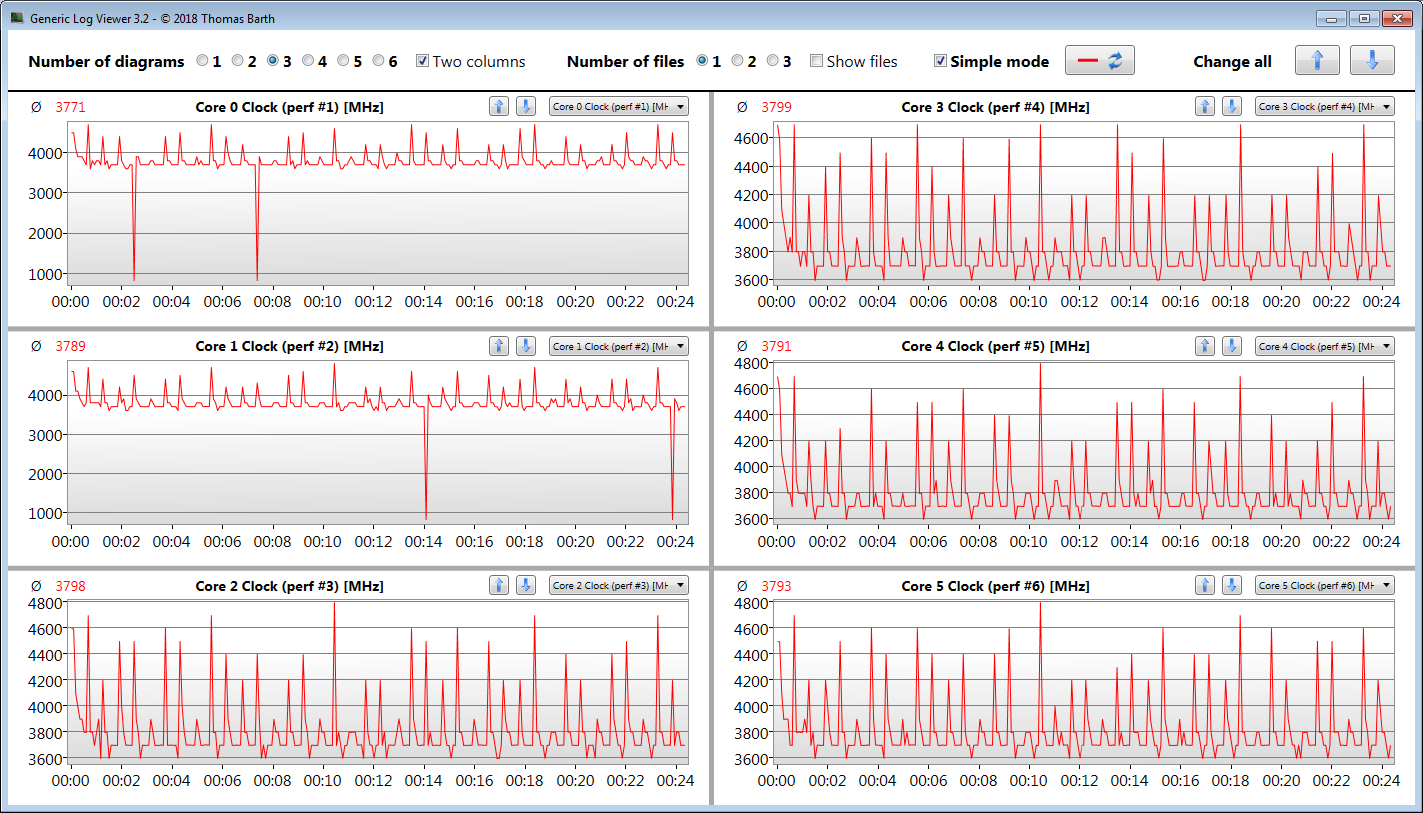
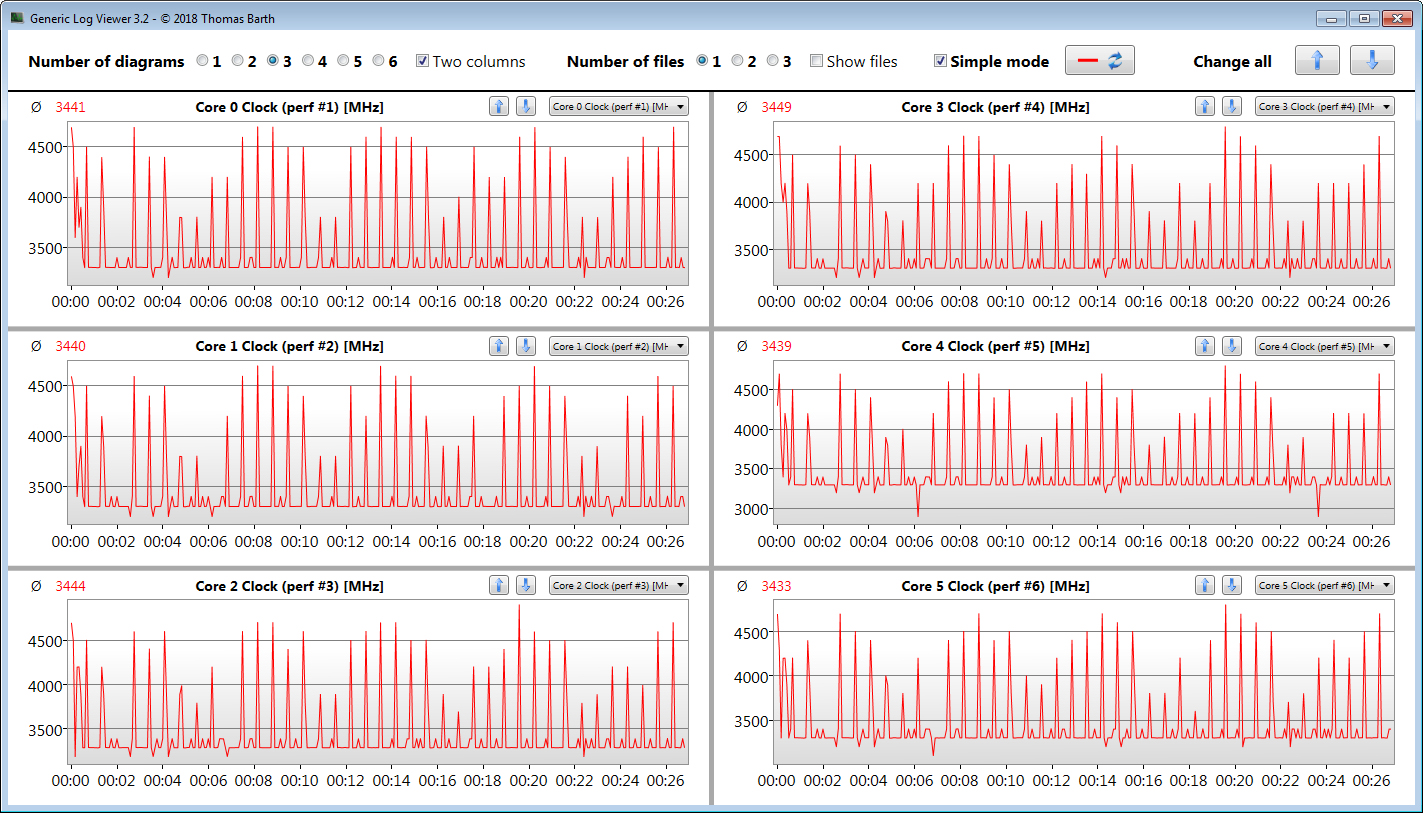
MSI stattet das GL75 mit einem Core-i7-10750H-Sechskernprozessor (Comet Lake) aus. Die CPU arbeitet mit einer Basisgeschwindigkeit von 2,6 GHz. Per Turbo kann der Takt auf 4,3 GHz (sechs Kerne) bis 5 GHz (ein Kern) gesteigert werden. Hyperthreading (zwei Threads pro Kern) wird unterstützt.
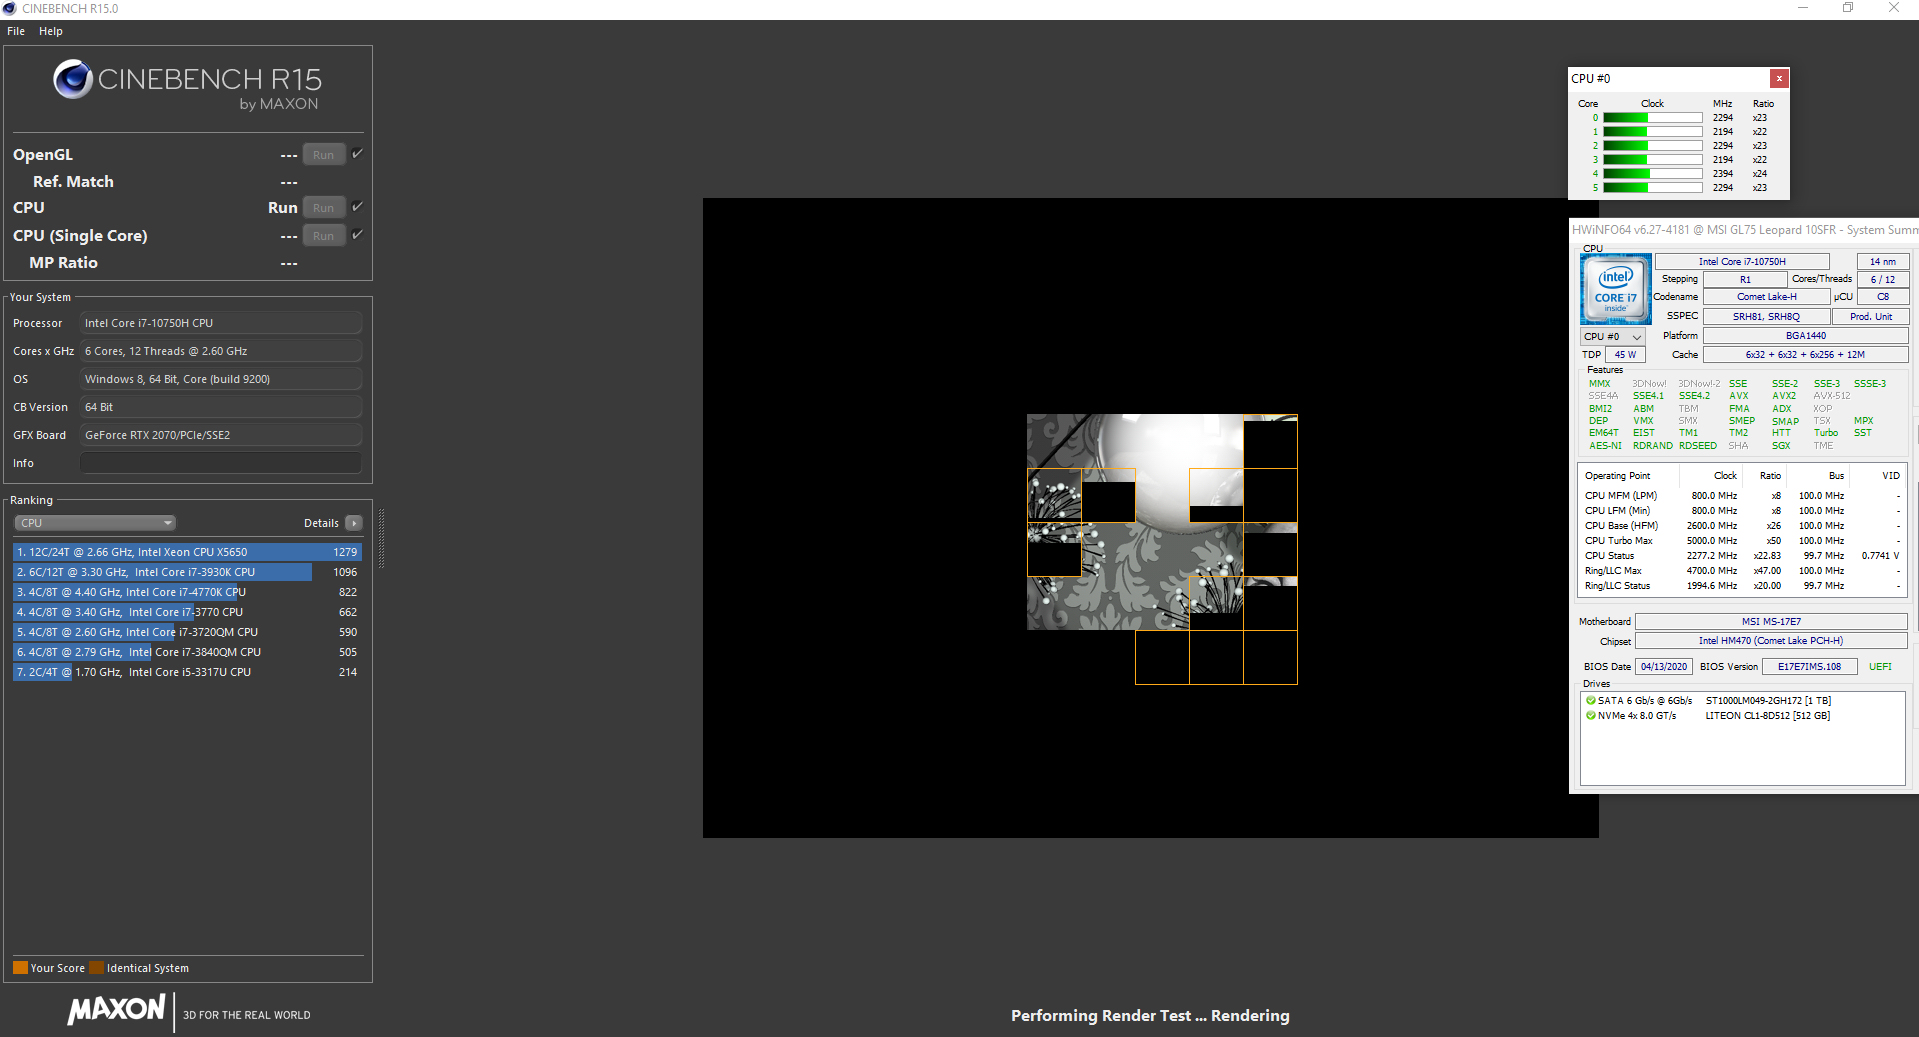
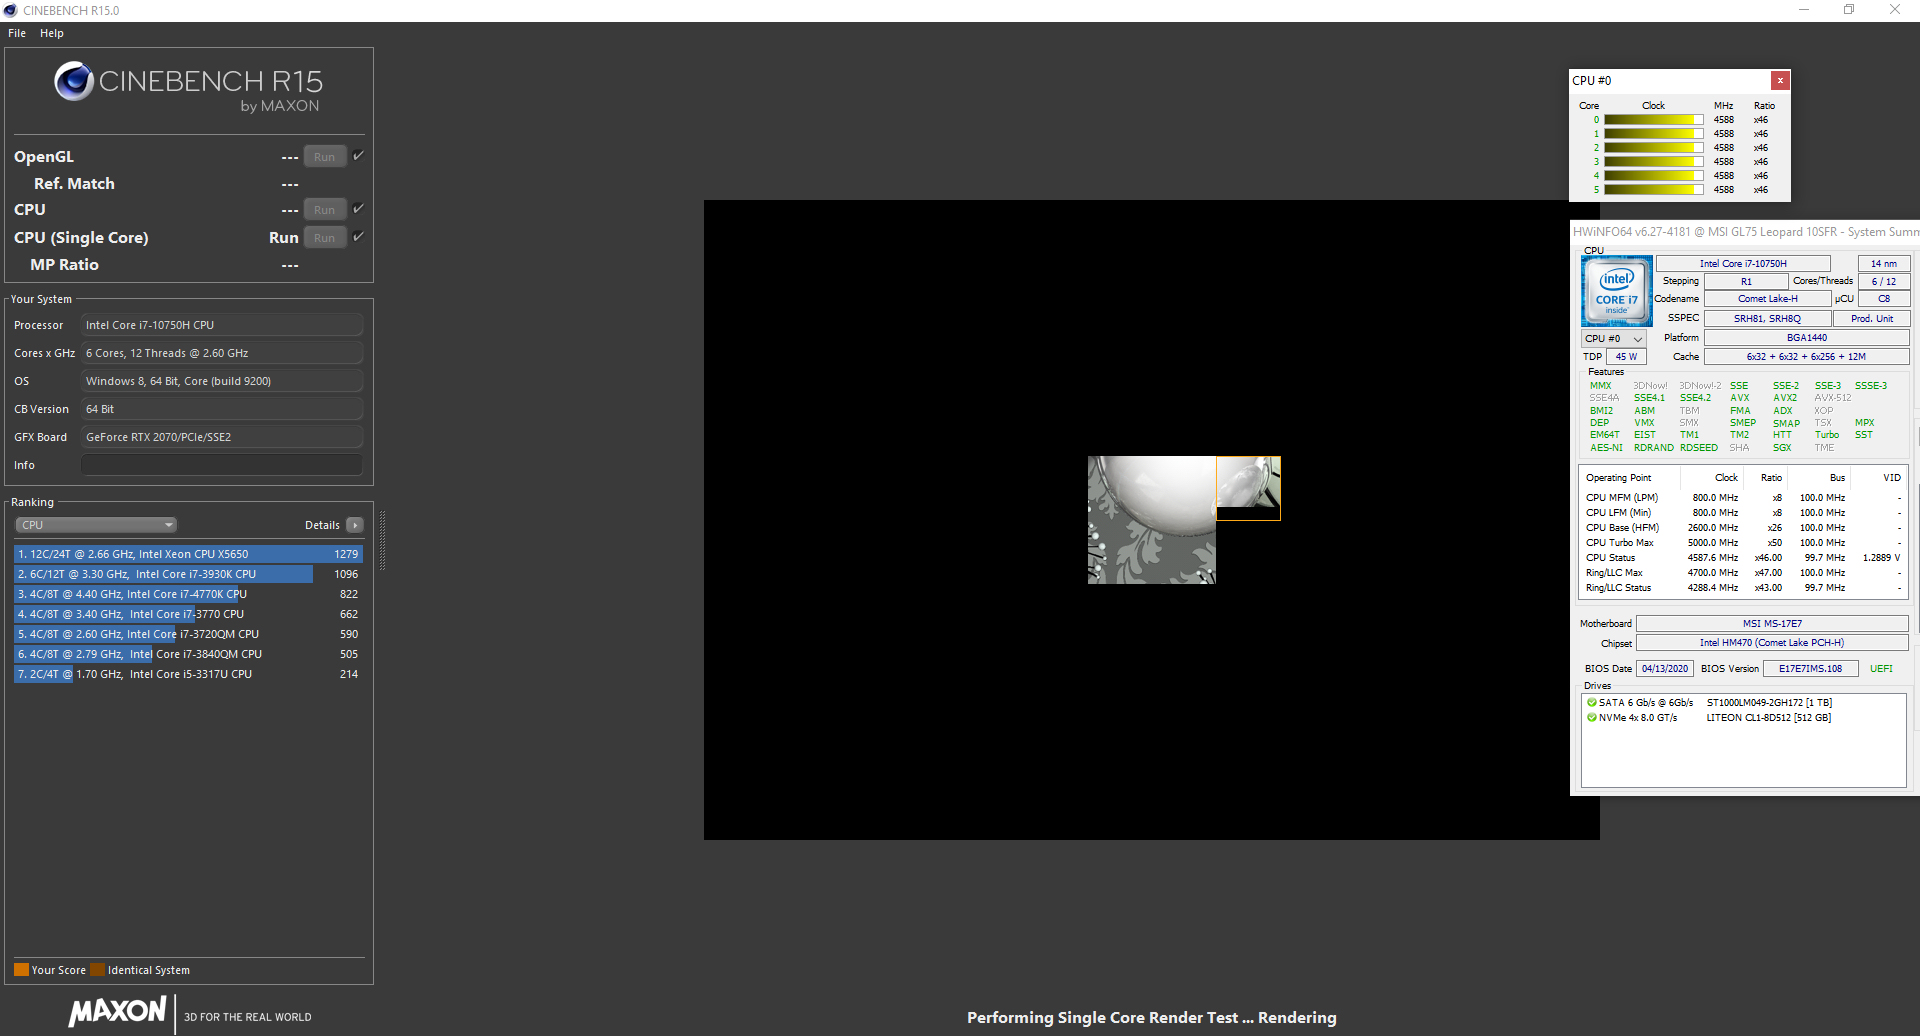
Den Multi-Thread-Test des Cinebench-R15-Benchmarks bearbeitet der Prozessor kurzzeitig mit 3,4 bis 4,2 GHz. Dann sinkt der Takt auf 3,3 bis 3,9 GHz. Der Single-Thread-Test wird mit 4,2 bis 4,6 GHz durchlaufen. Im Akkubetrieb liegen die Geschwindigkeiten bei 1,6 bis 1,9 GHz (Multi-Thread) bzw. 3,2 bis 4,6 GHz (Single-Thread).
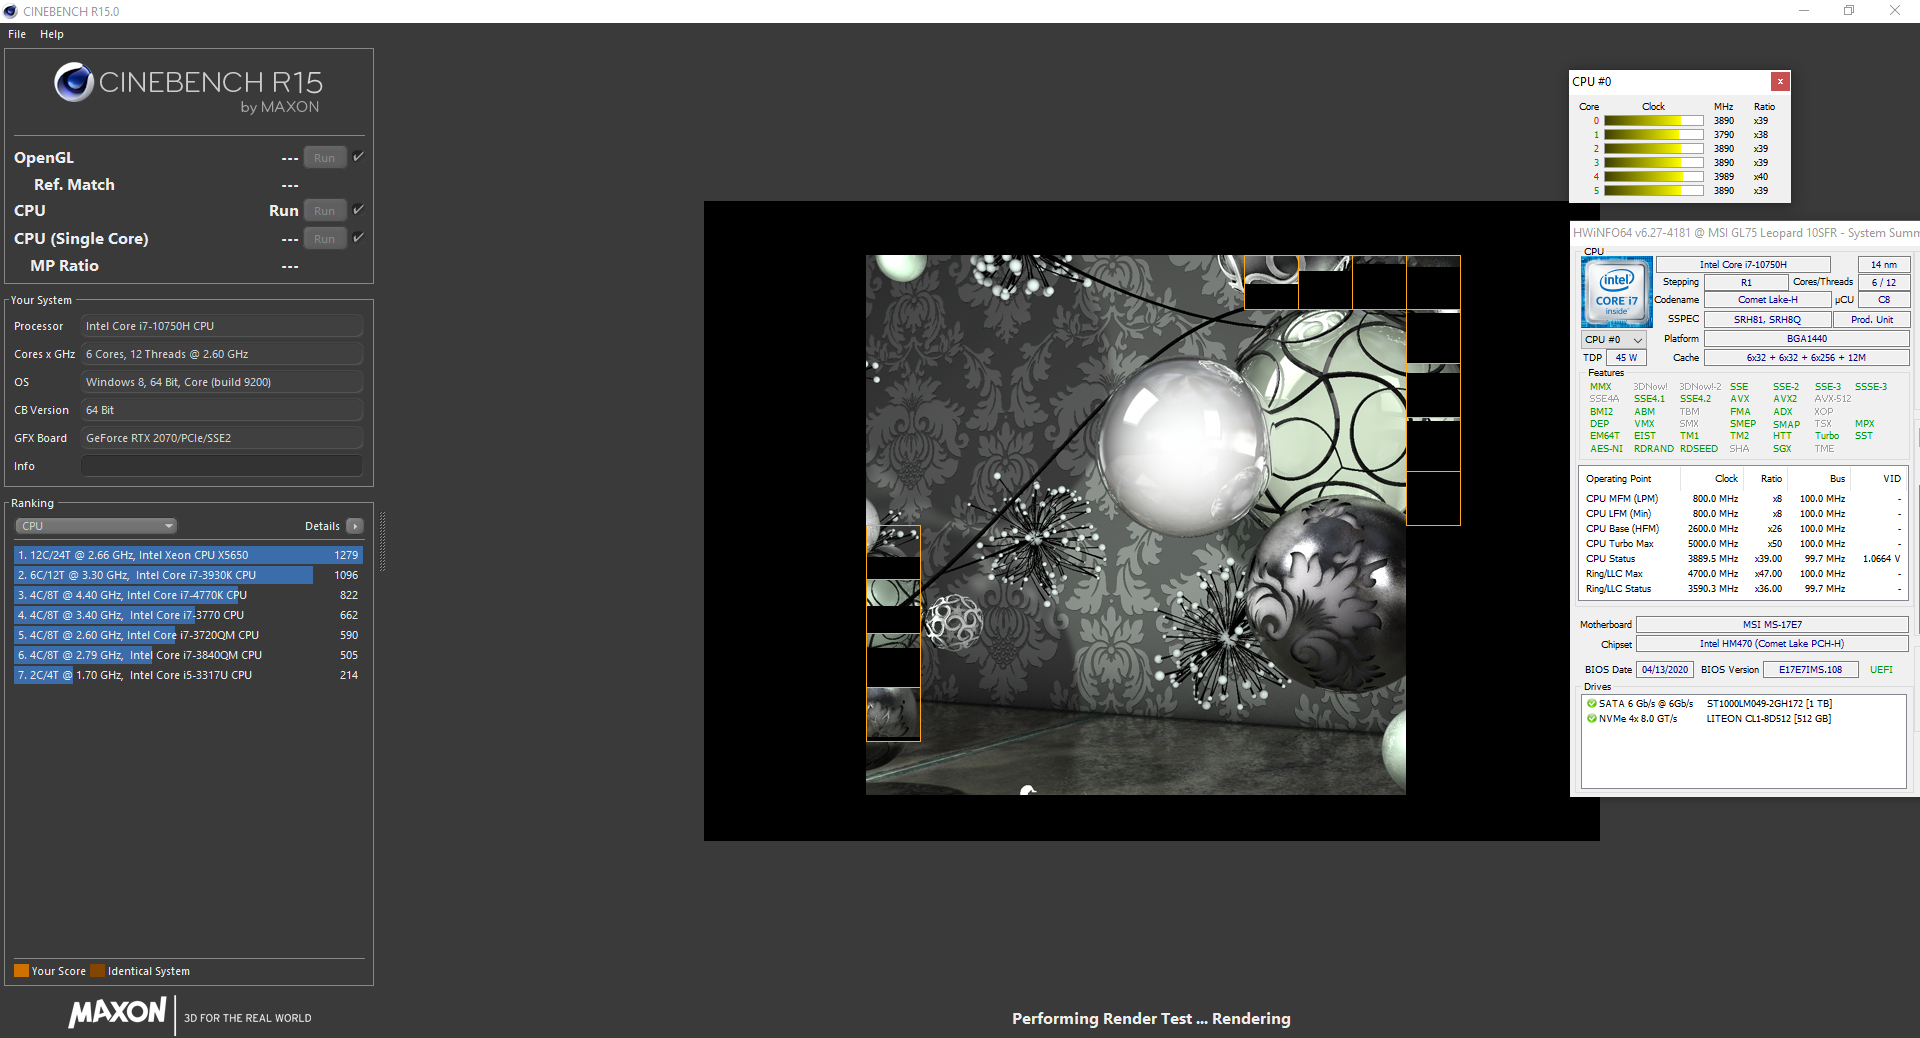

Ob der CPU-Turbo im Netzbetrieb auch dauerhaft genutzt wird, überprüfen wir, indem wir den Multi-Thread-Test des Cinebench-R15-Benchmarks für mindestens 30 Minuten in einer Dauerschleife laufen lassen. Die Resultate fallen vom ersten zum zweiten Durchlauf ab und verbleiben dann auf einem konstanten Niveau. Der Turbo kommt zum Einsatz.
Etwas höhere Ergebnisse werden erreicht, wenn innerhalb des Dragon Centers das Leistungsschema "Extreme Performance" gewählt wird.
* ... kleinere Werte sind besser
System Performance
Ein Blick auf die Ausstattungsliste des GL75 verrät, dass das Notebook über genug Rechenleistung auch für Anwendungen jenseits des Gamings verfügt. Dies bestätigen die guten Resultate in den PC-Mark-Benchmarks.
| PCMark 8 Home Score Accelerated v2 | 3372 Punkte | |
| PCMark 8 Creative Score Accelerated v2 | 3874 Punkte | |
| PCMark 8 Work Score Accelerated v2 | 5678 Punkte | |
| PCMark 10 Score | 5179 Punkte | |
Hilfe | ||
DPC-Latenzen
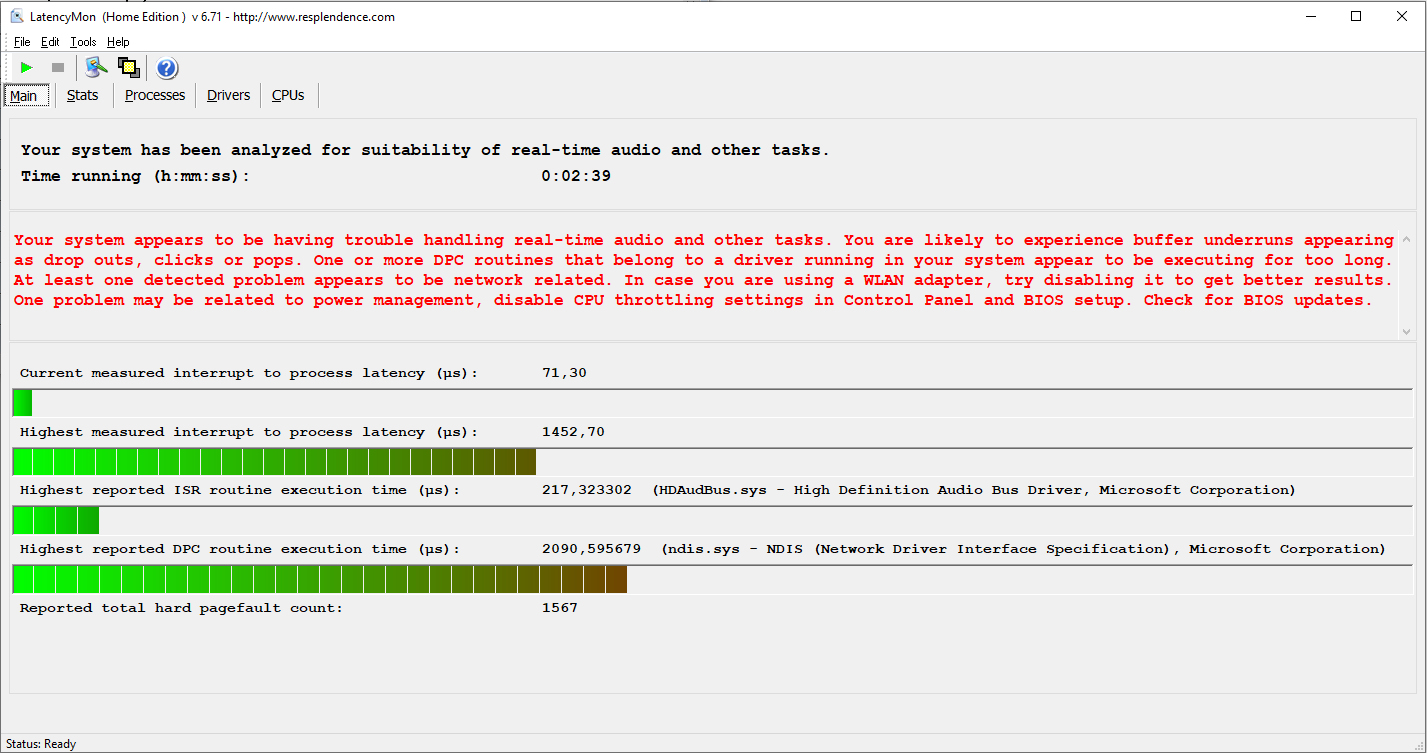
In unserem standardisierten Latency-Monitor-Test (Websurfen, 4K-Videowiedergabe, Prime95 High-Load) konnten wir hohe DPC-Latenzen beobachten. Das System ist nicht für Video- und Audiobearbeitung in Echtzeit geeignet.
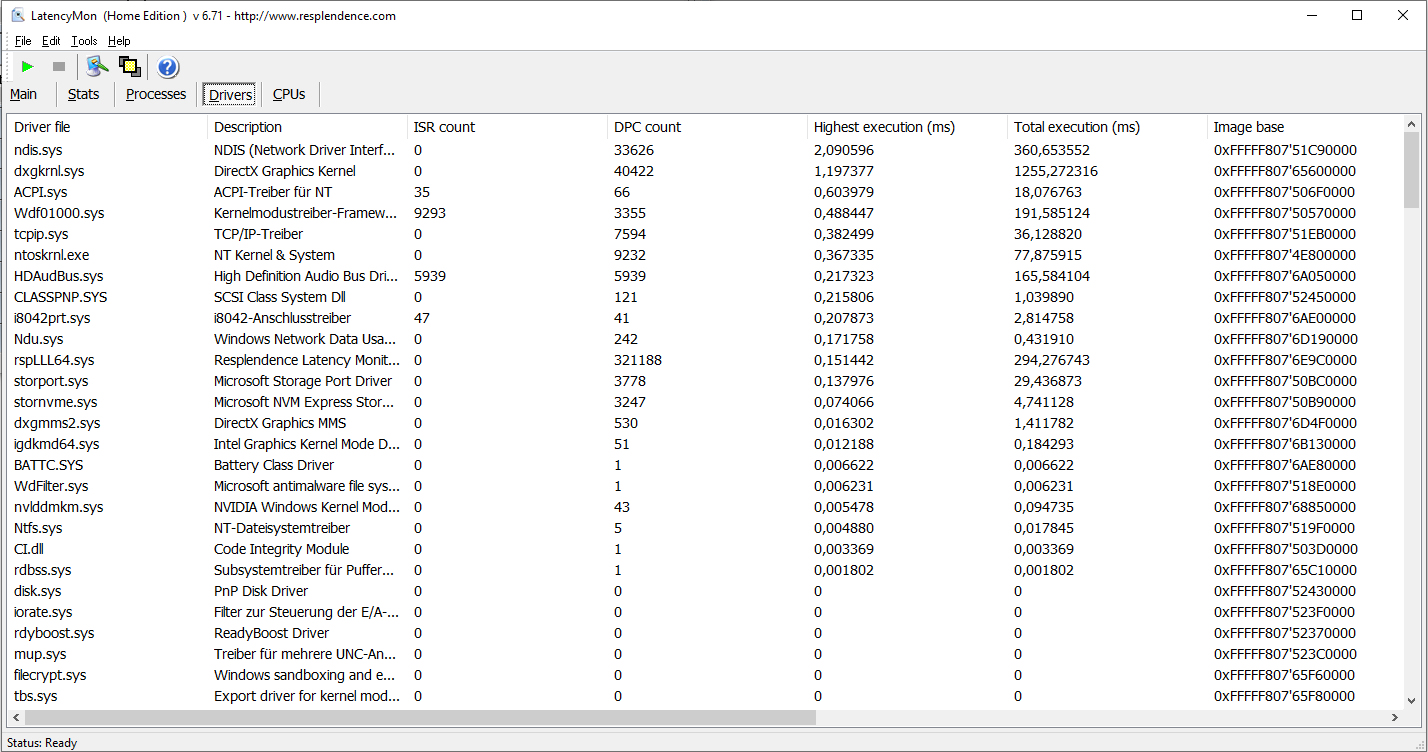
| DPC Latencies / LatencyMon - interrupt to process latency (max), Web, Youtube, Prime95 | |
| Asus TUF A17 FA706IU-AS76 | |
| MSI GL75 10SFR | |
| MSI Bravo 17 A4DDR | |
| Acer Nitro 5 AN517-52-77DS | |
* ... kleinere Werte sind besser
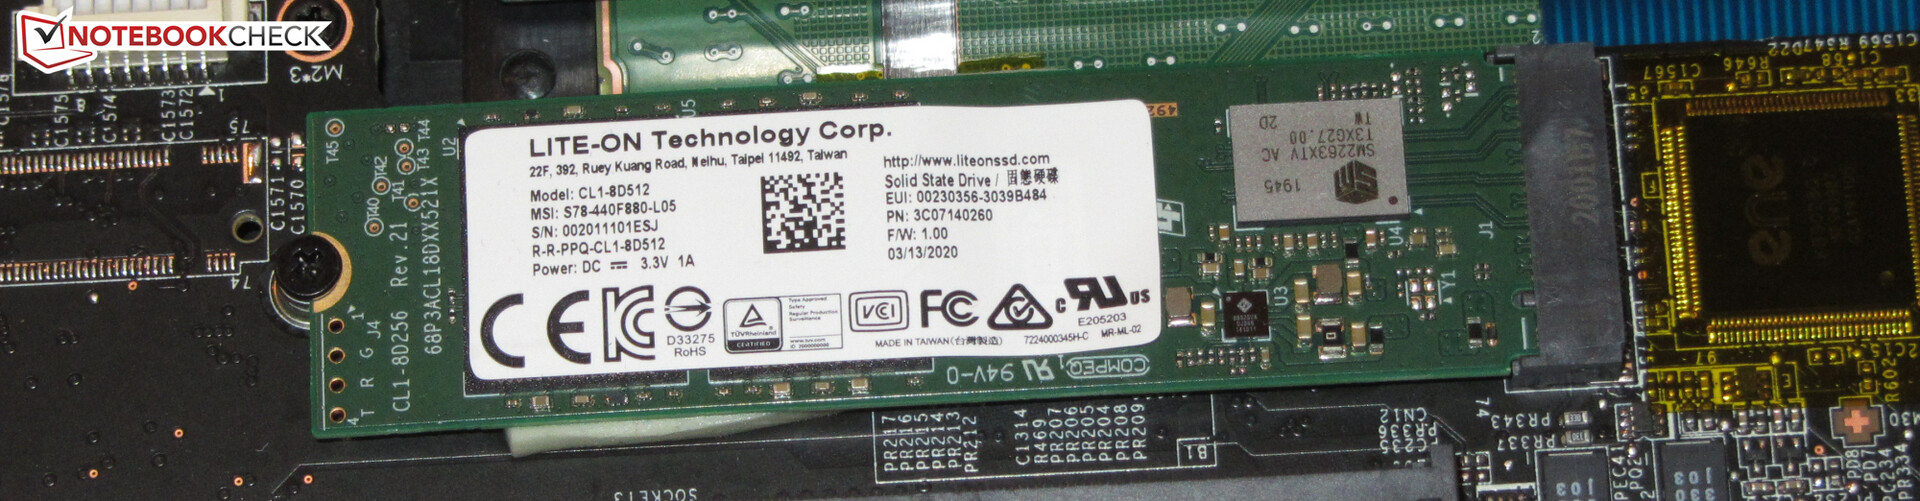
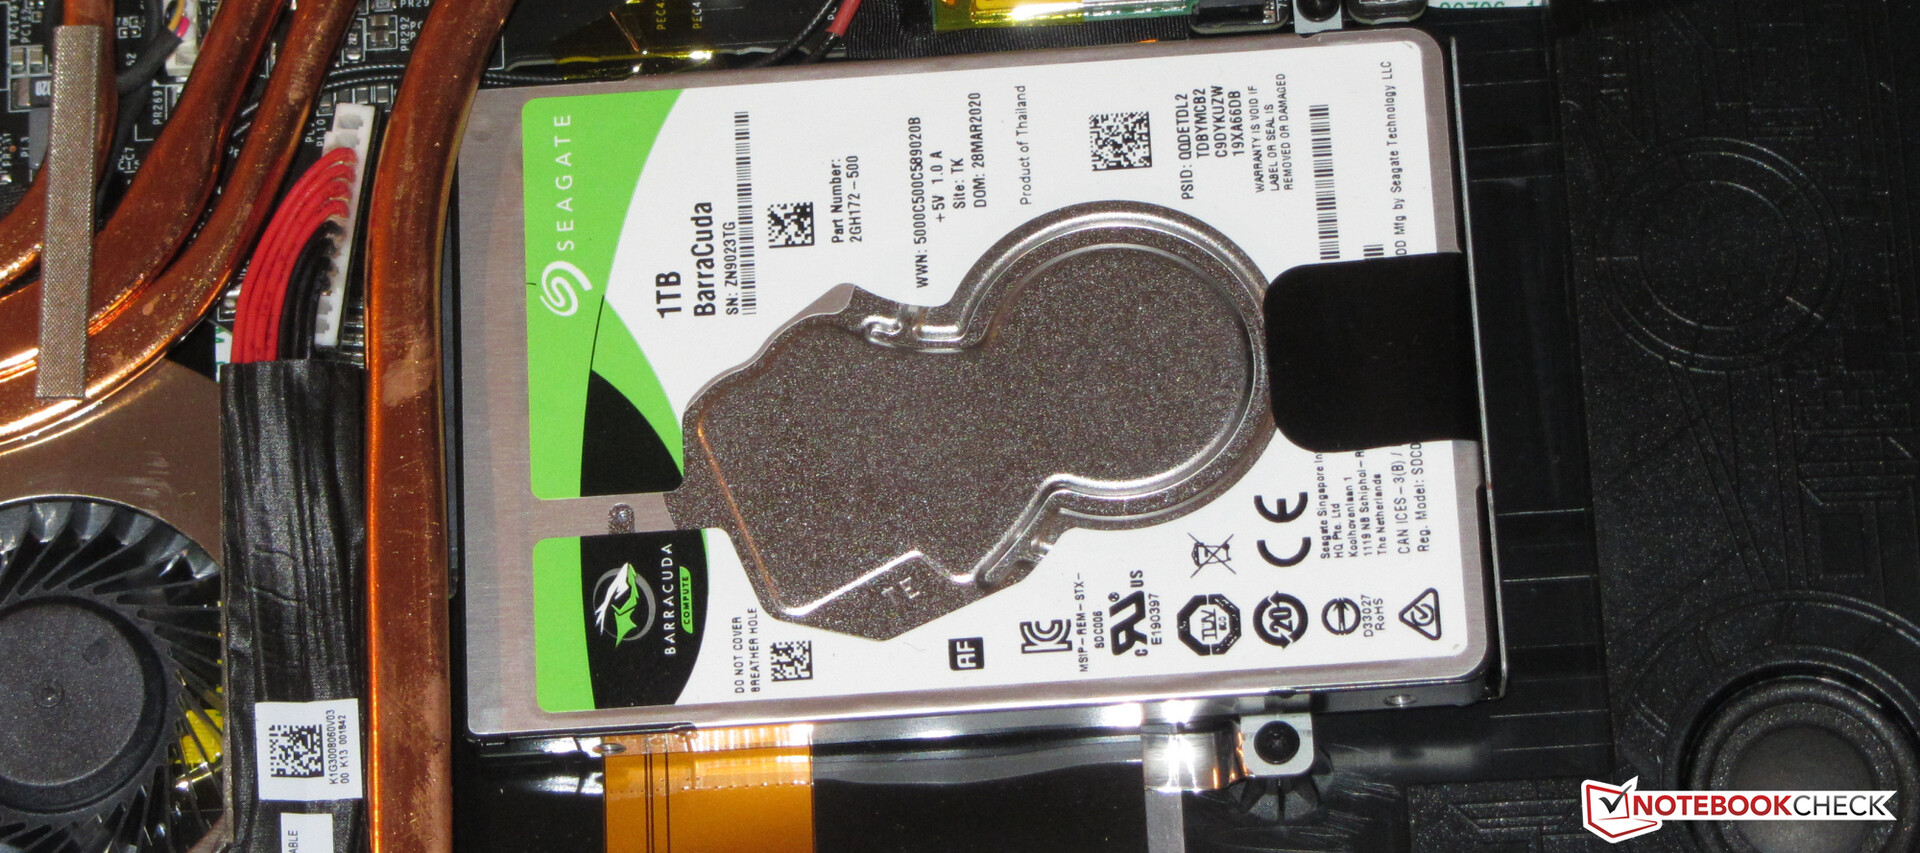
Massenspeicher
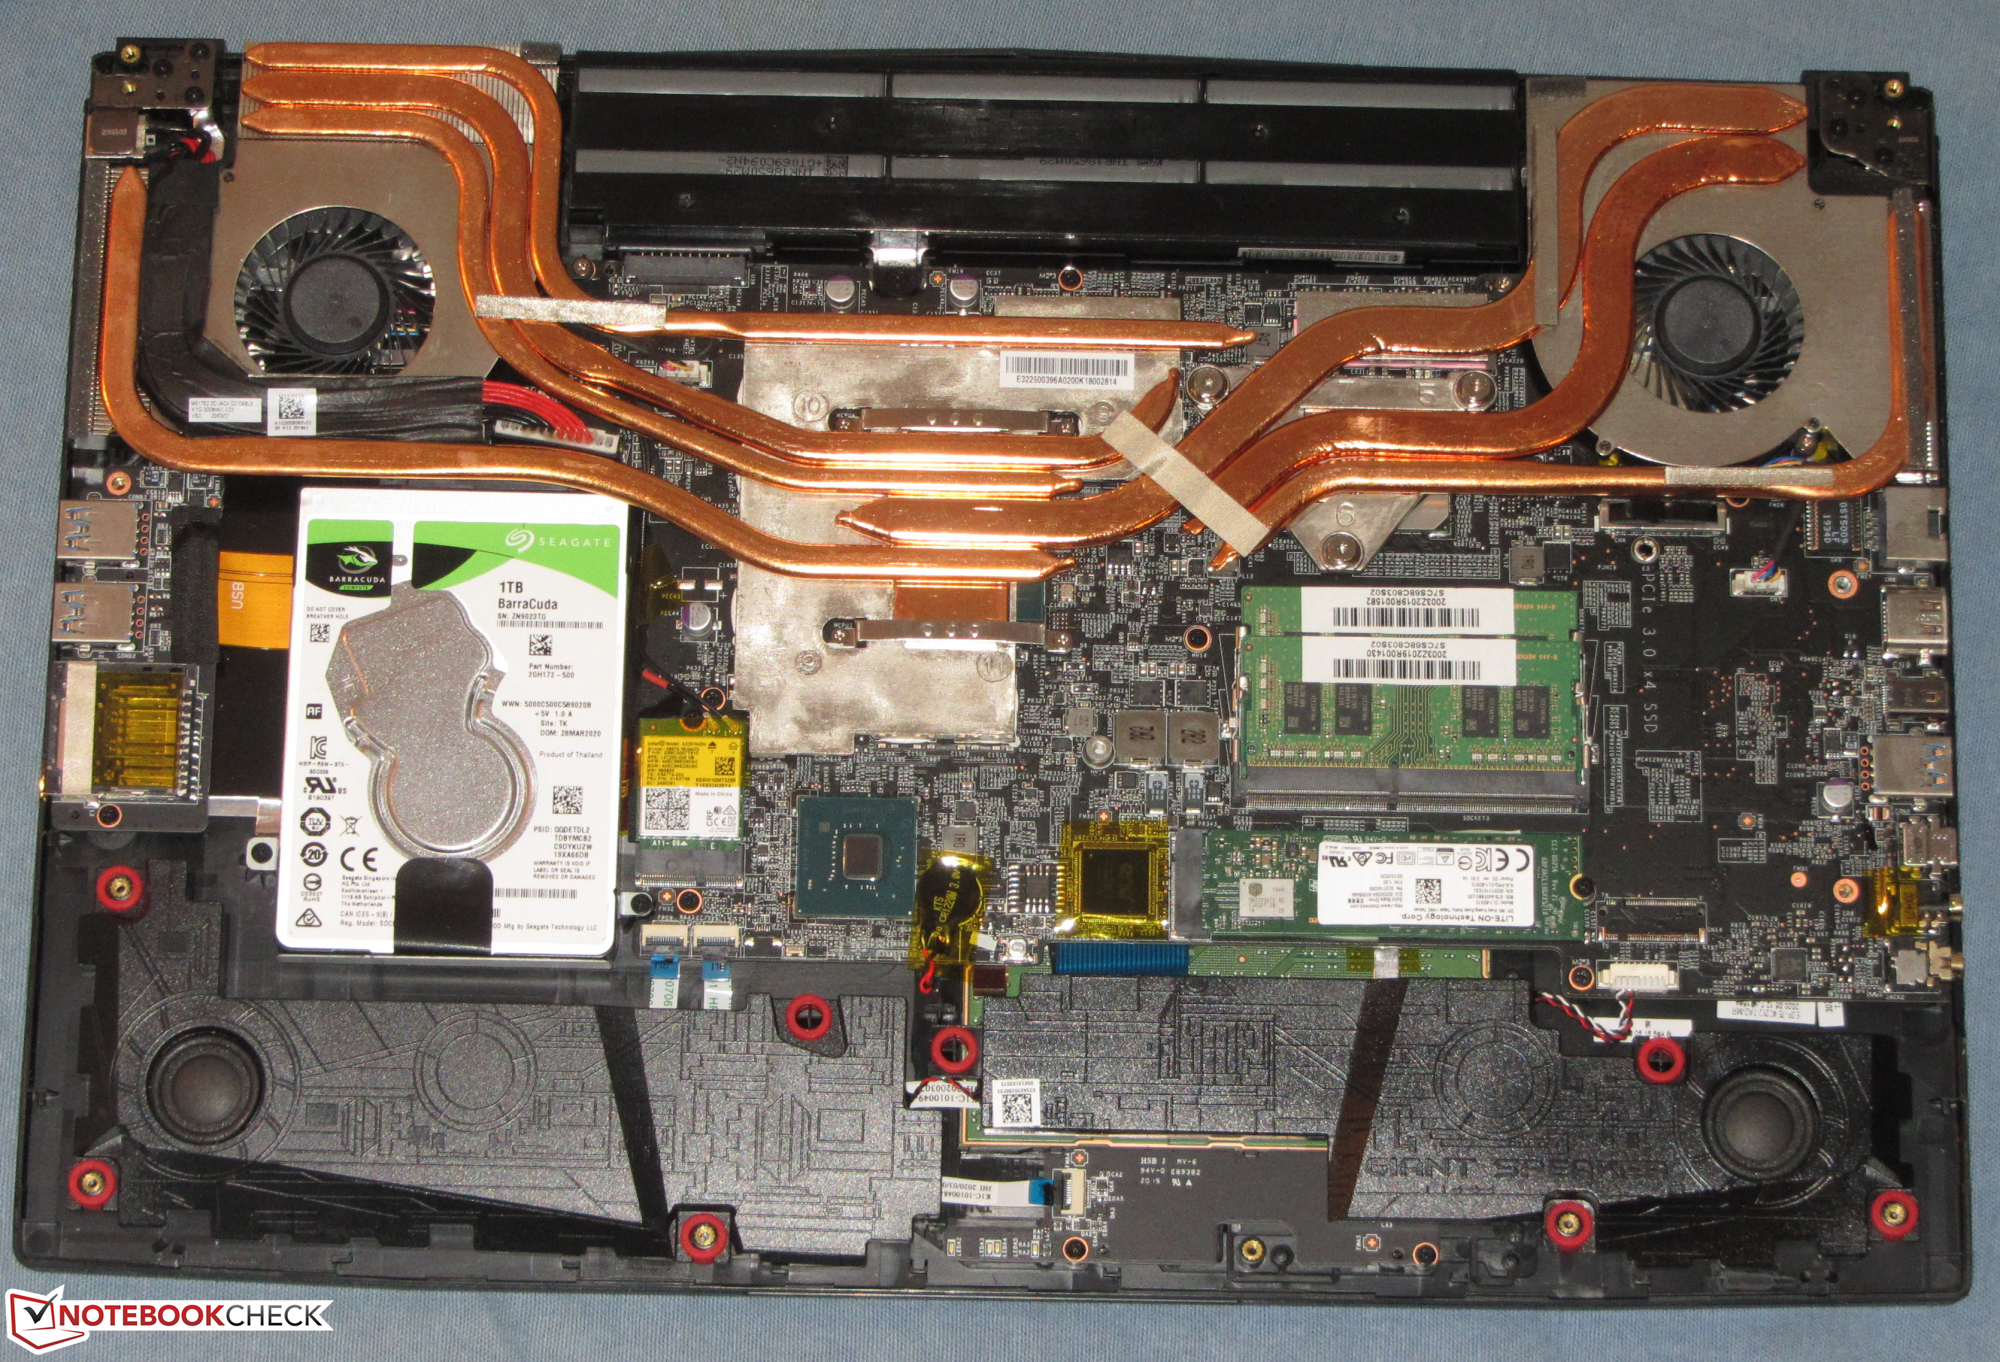
Als Systemlaufwerk dient eine NVMe-SSD (M.2-2280) der Firma Lite-On, die 512 GB Speicherplatz bereitstellt. Die SSD liefert insgesamt gute Transferraten. Das Notebook bringt zusätzlich noch eine 2,5-Zoll-Festplatte mit, die 1 TB Speicherplatz bietet und mit 7.200 Umdrehungen pro Minute arbeitet.

| MSI GL75 10SFR Lite-On CL1-8D512 | Acer Nitro 5 AN517-52-77DS WDC PC SN530 SDBPNPZ-1T00 | Schenker XMG Neo 17 XNE17M19 Samsung SSD 970 EVO Plus 500GB | Lenovo Legion Y740-17IRHg-81UJ001VGE Samsung SSD PM981 MZVLB1T0HALR | Schenker XMG Neo 17 Samsung SSD 970 EVO Plus 1TB | MSI GL75 9SEK-056US WDC PC SN520 SDAPNUW-512G | MSI GP75 Leopard 9SD Kingston RBUSNS8154P3256GJ1 | MSI Bravo 17 A4DDR Toshiba KBG30ZMV512G | Asus TUF A17 FA706IU-AS76 Intel SSD 660p 1TB SSDPEKNW010T8 | Durchschnittliche Lite-On CL1-8D512 | |
|---|---|---|---|---|---|---|---|---|---|---|
| CrystalDiskMark 5.2 / 6 | 5% | 11% | 21% | 7% | 7% | -45% | -24% | 15% | -16% | |
| Write 4K (MB/s) | 132.2 | 140 6% | 103.2 -22% | 101.2 -23% | 92.7 -30% | 149.1 13% | 105.8 -20% | 94.6 -28% | 189.7 43% | 119 ? -10% |
| Read 4K (MB/s) | 45.62 | 49.04 7% | 42.11 -8% | 44.61 -2% | 41.4 -9% | 48.58 6% | 27.89 -39% | 47.12 3% | 62.3 37% | 35.6 ? -22% |
| Write Seq (MB/s) | 1511 | 1963 30% | 1087 -28% | 2295 52% | 1363 -10% | 270.8 -82% | 850 -44% | 1681 11% | 1099 ? -27% | |
| Read Seq (MB/s) | 1890 | 1455 -23% | 974 -48% | 2174 15% | 1259 -33% | 879 -53% | 1157 -39% | 1608 -15% | 1806 ? -4% | |
| Write 4K Q32T1 (MB/s) | 375.9 | 398.2 6% | 404.7 8% | 401.2 7% | 289.7 -23% | 462 23% | 273.3 -27% | 277.7 -26% | 468.6 25% | 390 ? 4% |
| Read 4K Q32T1 (MB/s) | 525 | 461.9 -12% | 469.8 -11% | 475.5 -9% | 337.5 -36% | 606 15% | 361.2 -31% | 546 4% | 541 3% | 371 ? -29% |
| Write Seq Q32T1 (MB/s) | 1505 | 1969 31% | 3279 118% | 2397 59% | 3332 121% | 1454 -3% | 253 -83% | 908 -40% | 1770 18% | 965 ? -36% |
| Read Seq Q32T1 (MB/s) | 2008 | 1927 -4% | 3513 75% | 3337 66% | 3477 73% | 1724 -14% | 1505 -25% | 1632 -19% | 1898 -5% | 1998 ? 0% |
| Write 4K Q8T8 (MB/s) | 1562 | 1211 | ||||||||
| Read 4K Q8T8 (MB/s) | 1373 | 1104 | ||||||||
| AS SSD | 51% | 119% | 89% | 130% | 49% | -53% | 6% | 30% | -13% | |
| Seq Read (MB/s) | 1923 | 1804 -6% | 2274 18% | 2800 46% | 2359 23% | 1296 -33% | 748 -61% | 1420 -26% | 1320 -31% | 1795 ? -7% |
| Seq Write (MB/s) | 1065 | 1922 80% | 2522 137% | 2424 128% | 2469 132% | 1391 31% | 219 -79% | 922 -13% | 1539 45% | 706 ? -34% |
| 4K Read (MB/s) | 25.43 | 38.21 50% | 49.72 96% | 42.77 68% | 53.5 110% | 29.67 17% | 25.7 1% | 48.51 91% | 56.3 121% | 24.8 ? -2% |
| 4K Write (MB/s) | 101.9 | 105 3% | 118.2 16% | 94.8 -7% | 117.6 15% | 82.4 -19% | 116.8 15% | 158.5 56% | 92.6 ? -9% | |
| 4K-64 Read (MB/s) | 477.9 | 976 104% | 1209 153% | 1406 194% | 1579 230% | 1042 118% | 259.3 -46% | 928 94% | 586 23% | 379 ? -21% |
| 4K-64 Write (MB/s) | 563 | 1150 104% | 2218 294% | 1697 201% | 2048 264% | 1284 128% | 190.2 -66% | 345.4 -39% | 820 46% | 472 ? -16% |
| Access Time Read * (ms) | 0.053 | 0.055 -4% | 0.05 6% | 0.048 9% | 0.108 -104% | 0.159 -200% | 0.089 -68% | 0.043 19% | 0.069 ? -30% | |
| Access Time Write * (ms) | 0.126 | 0.045 64% | 0.031 75% | 0.039 69% | 0.03 76% | 0.031 75% | 0.058 54% | 0.189 -50% | 0.113 10% | 0.134 ? -6% |
| Score Read (Points) | 696 | 1194 72% | 1486 114% | 1729 148% | 1869 169% | 1201 73% | 360 -48% | 1119 61% | 775 11% | 584 ? -16% |
| Score Write (Points) | 771 | 1747 127% | 2588 236% | 2034 164% | 2413 213% | 1542 100% | 294 -62% | 554 -28% | 1132 47% | 635 ? -18% |
| Score Total (Points) | 1785 | 3563 100% | 4855 172% | 4630 159% | 5248 194% | 3363 88% | 821 -54% | 2232 25% | 2333 31% | 1469 ? -18% |
| Copy ISO MB/s (MB/s) | 1710 | 1305 -24% | 2148 26% | 1736 2% | 1710 ? 0% | |||||
| Copy Program MB/s (MB/s) | 465.3 | 467.5 0% | 582 25% | 553 19% | 465 ? 0% | |||||
| Copy Game MB/s (MB/s) | 1042 | 872 -16% | 1278 23% | 1264 21% | 1042 ? 0% | |||||
| Durchschnitt gesamt (Programm / Settings) | 28% /
33% | 65% /
73% | 55% /
64% | 69% /
78% | 28% /
33% | -49% /
-49% | -9% /
-7% | 23% /
24% | -15% /
-14% |
* ... kleinere Werte sind besser
Dauerleistung Lesen: DiskSpd Read Loop, Queue Depth 8
Grafikkarte
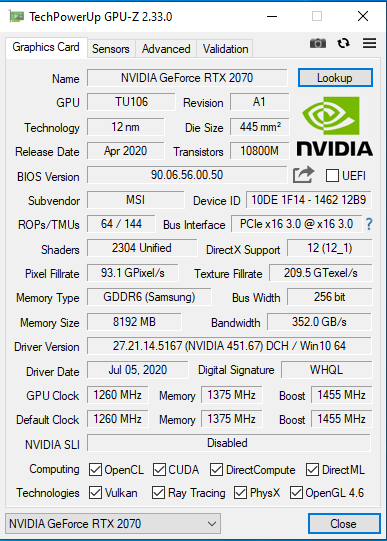
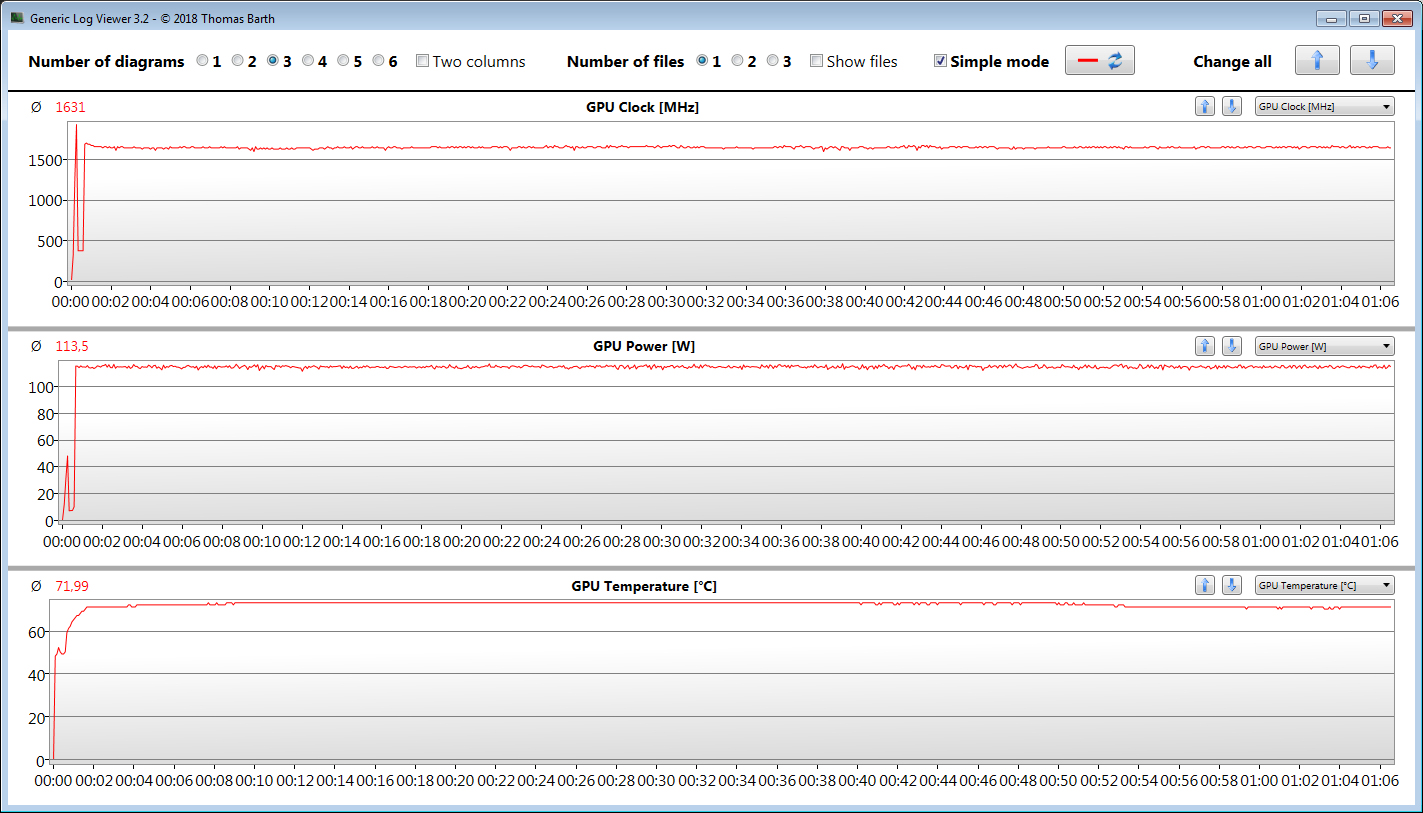
Der GeForce-RTX-2070-Grafikkern unterstützt DirectX 12 und arbeitet mit einer Basisgeschwindigkeit von 1.260 MHz. Per Boost ist eine Steigerung auf bis zu 1.455 MHz möglich. Es können allerdings auch höhere Geschwindigkeiten erreicht werden, wenn die GPU eine festgelegte Temperatur- und/oder Energieschwelle nicht erreicht. So registrieren wir ein Maximum von 1.900 MHz, das allerdings nur kurz gehalten werden kann. Den Witcher-3-Test durchläuft die GPU mit einer Durchschnittsgeschwindigkeit von 1.631 MHz. Die GPU kann auf schnellen GDDR6-Grafikspeicher (8.192 GB) zurückgreifen.
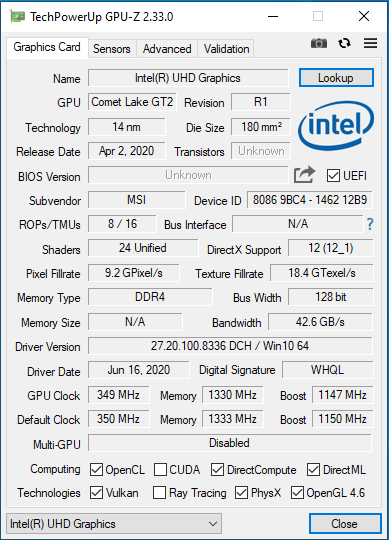
Die Resultate in den 3D-Mark-Benchmarks bewegen sich auf einem normalen Niveau für den hier verbauten Grafikkern. Die im Prozessor integrierte UHD-Graphics-630-GPU ist aktiv und das Notebook arbeitet mit Nvidias Umschaltgrafiklösung Optimus.
Das im Dragon Center wählbare Leistungsschema "Extreme Performance" hat keinen Einfluss auf die Grafikleistung. Die 3D-Mark-Resultate gleichen sich.
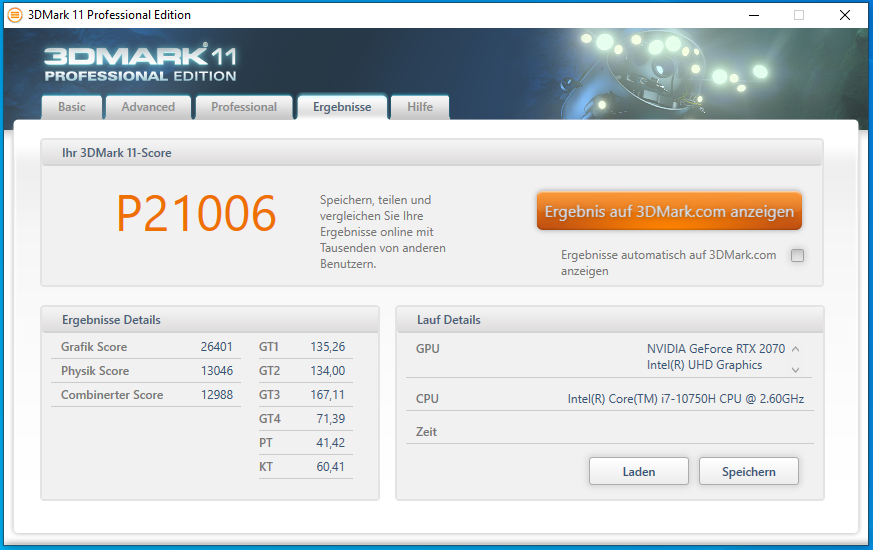
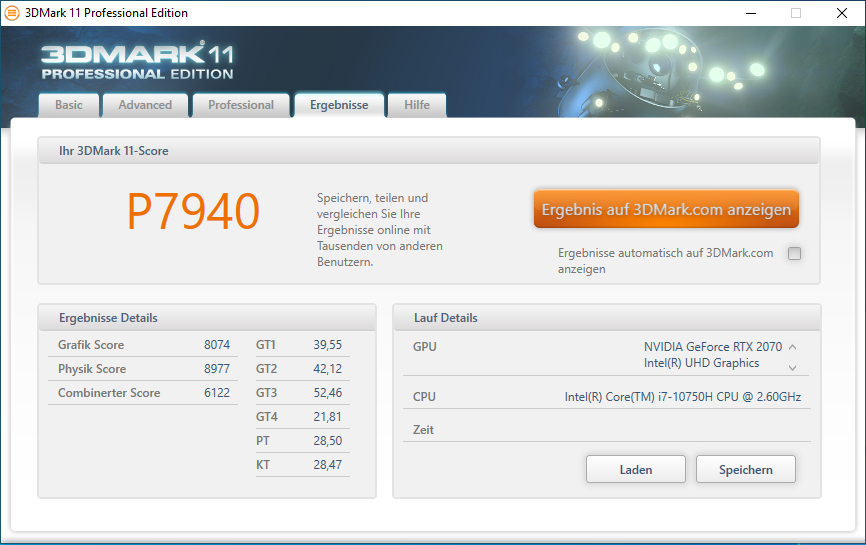
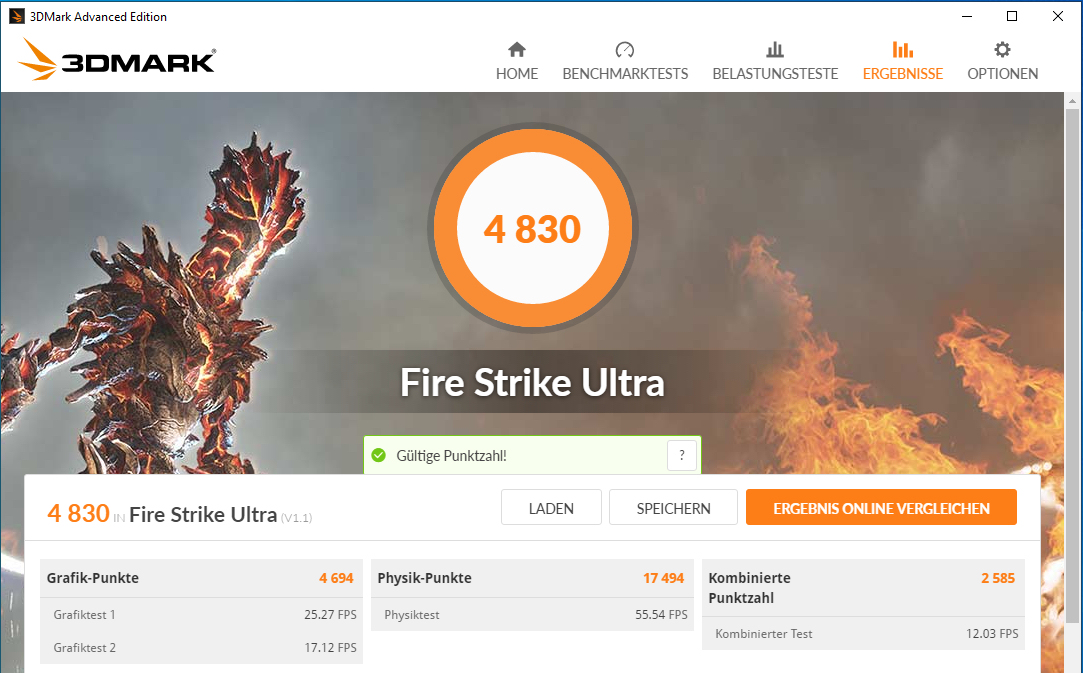
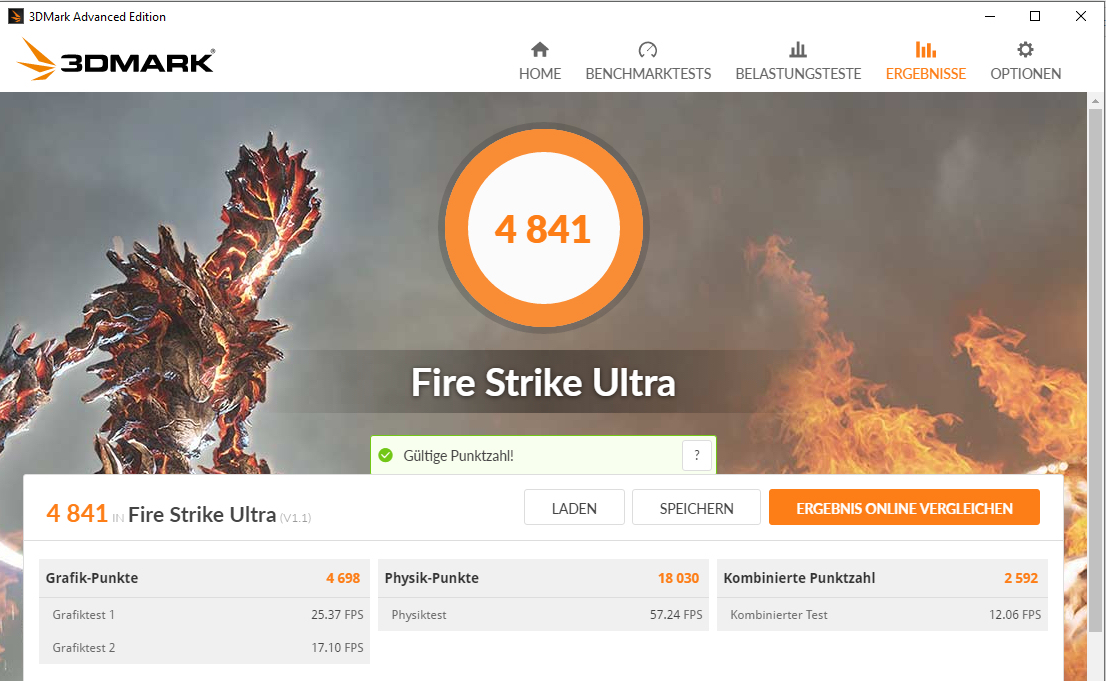
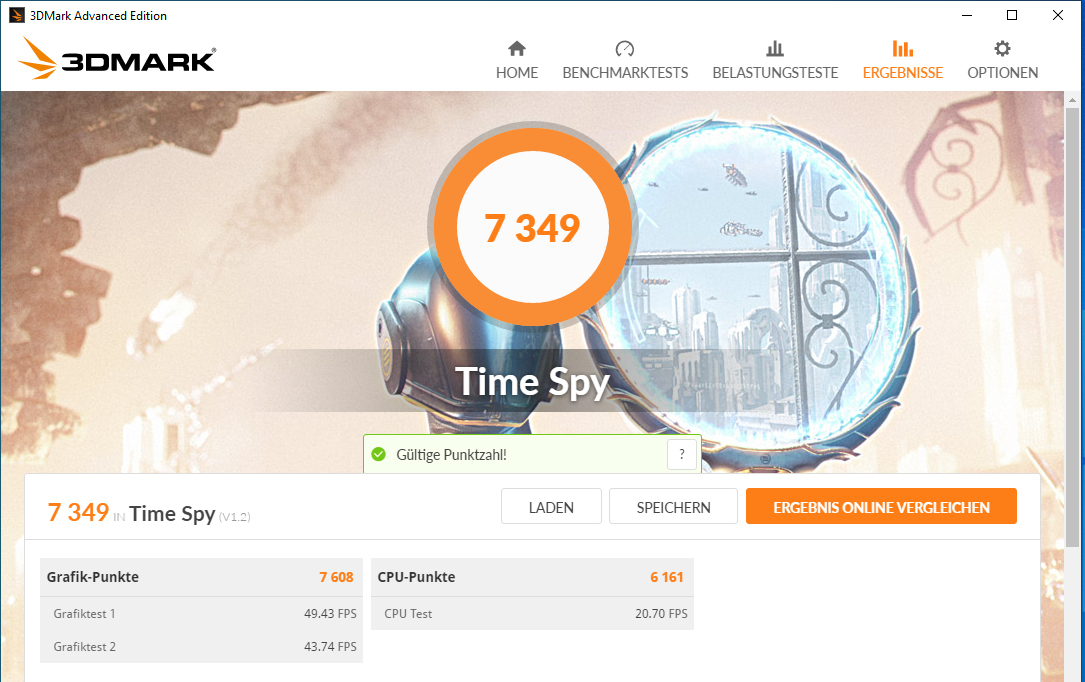
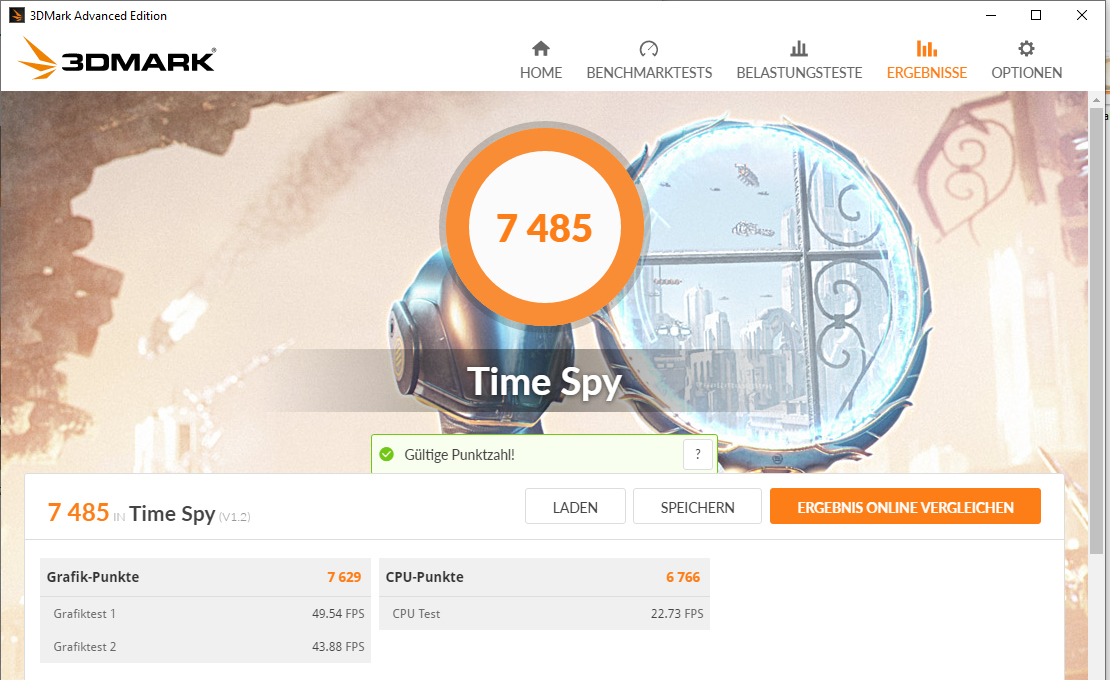
| 3DMark 11 Performance | 21006 Punkte | |
| 3DMark Cloud Gate Standard Score | 36210 Punkte | |
| 3DMark Fire Strike Score | 17529 Punkte | |
| 3DMark Time Spy Score | 7349 Punkte | |
Hilfe | ||
Gaming Performance
Die verbaute CPU-GPU-Kombination bringt alle aktuellen Spiele in Full-HD-Auflösung und mit maximalen Qualitätseinstellungen flüssig auf den matten Bildschirm. Auch Auflösungen jenseits von Full HD sind bei Anschluss eines entsprechenden Monitors möglich. Allerdings sollten die Qualitätsregler dann nicht allzu stark aufgedreht werden.
| BioShock Infinite - 1920x1080 Ultra Preset, DX11 (DDOF) | |
| Durchschnittliche NVIDIA GeForce RTX 2070 Mobile (136.9 - 187.8, n=9) | |
| Lenovo Legion Y740-17IRHg-81UJ001VGE | |
| MSI GL75 10SFR | |
| MSI GP75 Leopard 9SD | |
| Acer Nitro 5 AN517-52-77DS | |
| Shadow of the Tomb Raider - 1920x1080 Highest Preset AA:T | |
| Durchschnitt der Klasse Gaming (96 - 116, n=2, der letzten 2 Jahre) | |
| MSI GL75 10SFR | |
| Durchschnittliche NVIDIA GeForce RTX 2070 Mobile (74.2 - 97, n=11) | |
| MSI GL75 9SEK-056US | |
| Asus TUF A17 FA706IU-AS76 | |
| Acer Nitro 5 AN517-52-77DS | |
| MSI Bravo 17 A4DDR | |
| Total War: Three Kingdoms - 1920x1080 Ultra (incl textures) | |
| MSI GL75 10SFR | |
| Durchschnittliche NVIDIA GeForce RTX 2070 Mobile (n=1) | |
| Acer Nitro 5 AN517-52-77DS | |
| Red Dead Redemption 2 - 1920x1080 Maximum Settings | |
| MSI GL75 10SFR | |
| Durchschnittliche NVIDIA GeForce RTX 2070 Mobile (42.4 - 43, n=3) | |
| Acer Nitro 5 AN517-52-77DS | |
| Doom Eternal - 1920x1080 Ultra Preset | |
| Durchschnittliche NVIDIA GeForce RTX 2070 Mobile (145.1 - 157, n=3) | |
| MSI GL75 10SFR | |
| Acer Nitro 5 AN517-52-77DS | |
| MSI Bravo 17 A4DDR | |
Um zu überprüfen, ob die Bildwiederholraten auch über einen längeren Zeitraum weitgehend konstant bleiben, lassen wir das Spiel "The Witcher 3" für etwa 60 Minuten mit Full-HD-Auflösung und maximalen Qualitätseinstellungen laufen. Der vom Spieler verkörperte Charakter wird dabei über den gesamten Zeitraum nicht bewegt. Ein Einbruch der Bildwiederholraten ist nicht festzustellen.
| min. | mittel | hoch | max. | |
|---|---|---|---|---|
| BioShock Infinite (2013) | 332.8 | 294.5 | 276.3 | 163.7 |
| The Witcher 3 (2015) | 286.3 | 226.7 | 147.1 | 79.9 |
| Dota 2 Reborn (2015) | 147.2 | 129.4 | 121.8 | 115 |
| X-Plane 11.11 (2018) | 107 | 92.3 | 79.6 | |
| Shadow of the Tomb Raider (2018) | 118 | 104 | 100 | 93 |
| Total War: Three Kingdoms (2019) | 232.7 | 129.9 | 88.5 | 63.1 |
| Red Dead Redemption 2 (2019) | 127.9 | 97.5 | 66.4 | 43 |
| Hunt Showdown (2020) | 184.2 | 124 | 101.7 | |
| Doom Eternal (2020) | 217.6 | 162 | 148.9 | 145.1 |
| Gears Tactics (2020) | 226.5 | 169.9 | 115.2 | 90.9 |
| F1 2020 (2020) | 230 | 177 | 148 | 115 |
| Death Stranding (2020) | 149.3 | 126 | 114.6 | 112 |
Emissionen - Die Lüfter des MSI-Notebooks produzieren viel Lärm
Geräuschemissionen
Im Leerlauf arbeiten die Lüfter in der Regel mit niedriger Geschwindigkeit. Wirklich wahrzunehmen sind sie dann nicht. Gelegentlich stehen sie still und es herrscht Lautlosigkeit. Unter Last drehen die Lüfter auf. So registrieren wir während des Stresstests einen Schalldruckpegel von 53,2 dB(A) (Stresstest). Wird innerhalb des Dragon Centers auf den Leistungsmodus "Extreme Performance" umgeschaltet, steigt der Pegel auf 54,9 dB(A). Ein insgesamt niedrigeres Lärmniveau bewirkt der Modus "Silent" - auf Kosten der Rechenleistung.
Lautstärkediagramm
| Idle |
| 32.2 / 32.2 / 32.2 dB(A) |
| Last |
| 52.8 / 53.2 dB(A) |
 | ||
30 dB leise 40 dB(A) deutlich hörbar 50 dB(A) störend |
||
min: | ||
| MSI GL75 10SFR i7-10750H, GeForce RTX 2070 Mobile | Acer Nitro 5 AN517-52-77DS i7-10750H, GeForce RTX 2060 Mobile | Schenker XMG Neo 17 XNE17M19 i7-9750H, GeForce RTX 2060 Mobile | Lenovo Legion Y740-17IRHg-81UJ001VGE i7-9750H, GeForce RTX 2080 Max-Q | MSI GL75 9SEK-056US i7-9750H, GeForce RTX 2060 Mobile | MSI GP75 Leopard 9SD i7-9750H, GeForce GTX 1660 Ti Mobile | Durchschnittliche NVIDIA GeForce RTX 2070 Mobile | Durchschnitt der Klasse Gaming | |
|---|---|---|---|---|---|---|---|---|
| Geräuschentwicklung | 10% | 5% | 12% | 6% | -1% | 2% | 13% | |
| aus / Umgebung * (dB) | 30.1 | 30.2 -0% | 31 -3% | 30.3 -1% | 28.1 7% | 29 4% | 28.8 ? 4% | 24.1 ? 20% |
| Idle min * (dB) | 32.2 | 30.2 6% | 31 4% | 30.3 6% | 30.9 4% | 29 10% | 30.4 ? 6% | 26 ? 19% |
| Idle avg * (dB) | 32.2 | 30.2 6% | 33 -2% | 30.3 6% | 30.9 4% | 34 -6% | 31.7 ? 2% | 27.4 ? 15% |
| Idle max * (dB) | 32.2 | 30.2 6% | 35 -9% | 30.5 5% | 31 4% | 37 -15% | 34.9 ? -8% | 30.1 ? 7% |
| Last avg * (dB) | 52.8 | 41.5 21% | 43 19% | 40.8 23% | 39 26% | 53 -0% | 46.8 ? 11% | 43.6 ? 17% |
| Witcher 3 ultra * (dB) | 53.8 | 44.5 17% | 45 16% | 40.5 25% | 53.5 1% | 51 5% | ||
| Last max * (dB) | 53.2 | 44.6 16% | 47 12% | 40.8 23% | 53.5 -1% | 55 -3% | 55.8 ? -5% | 54.2 ? -2% |
* ... kleinere Werte sind besser
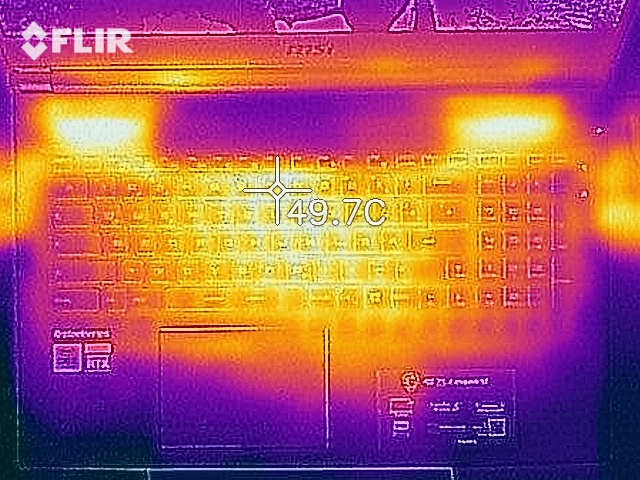
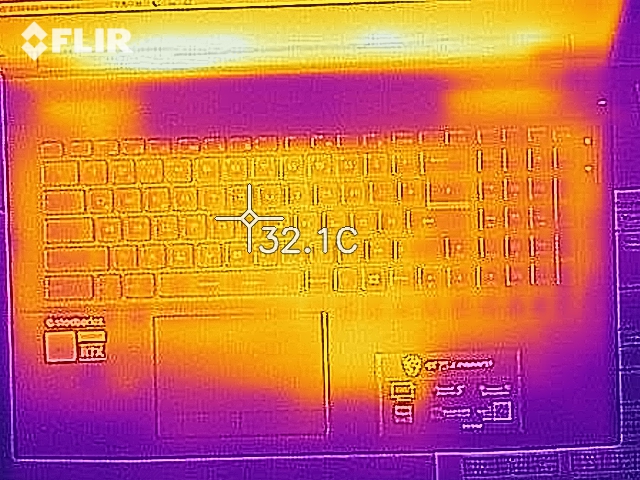
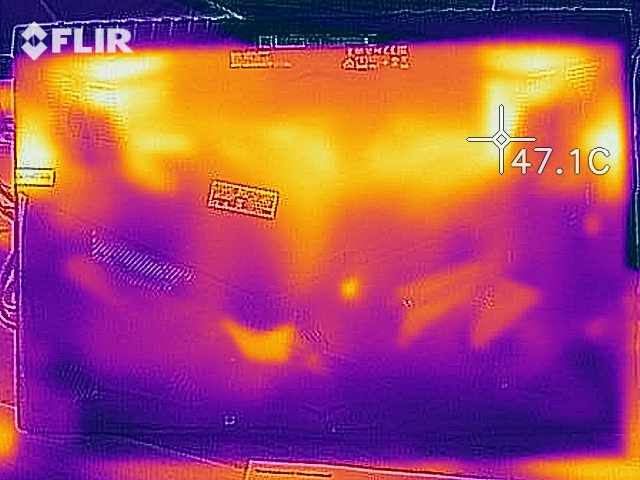
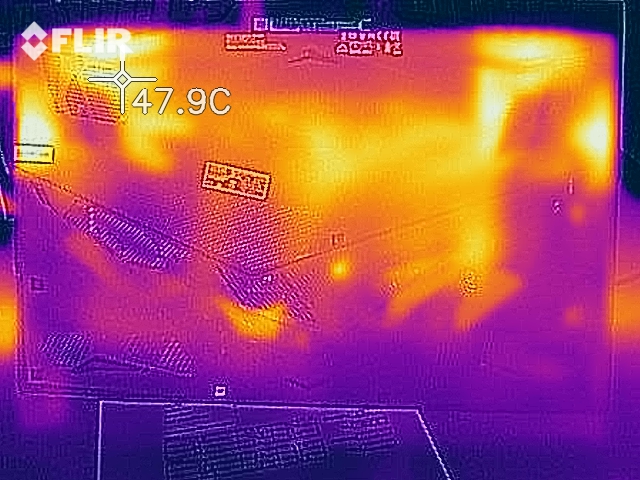
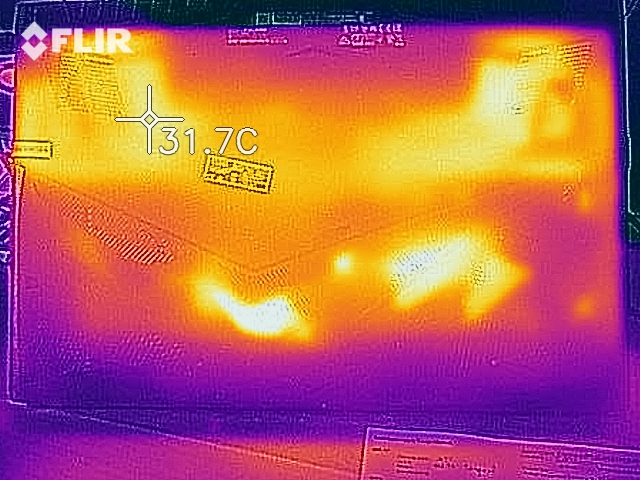
Temperatur
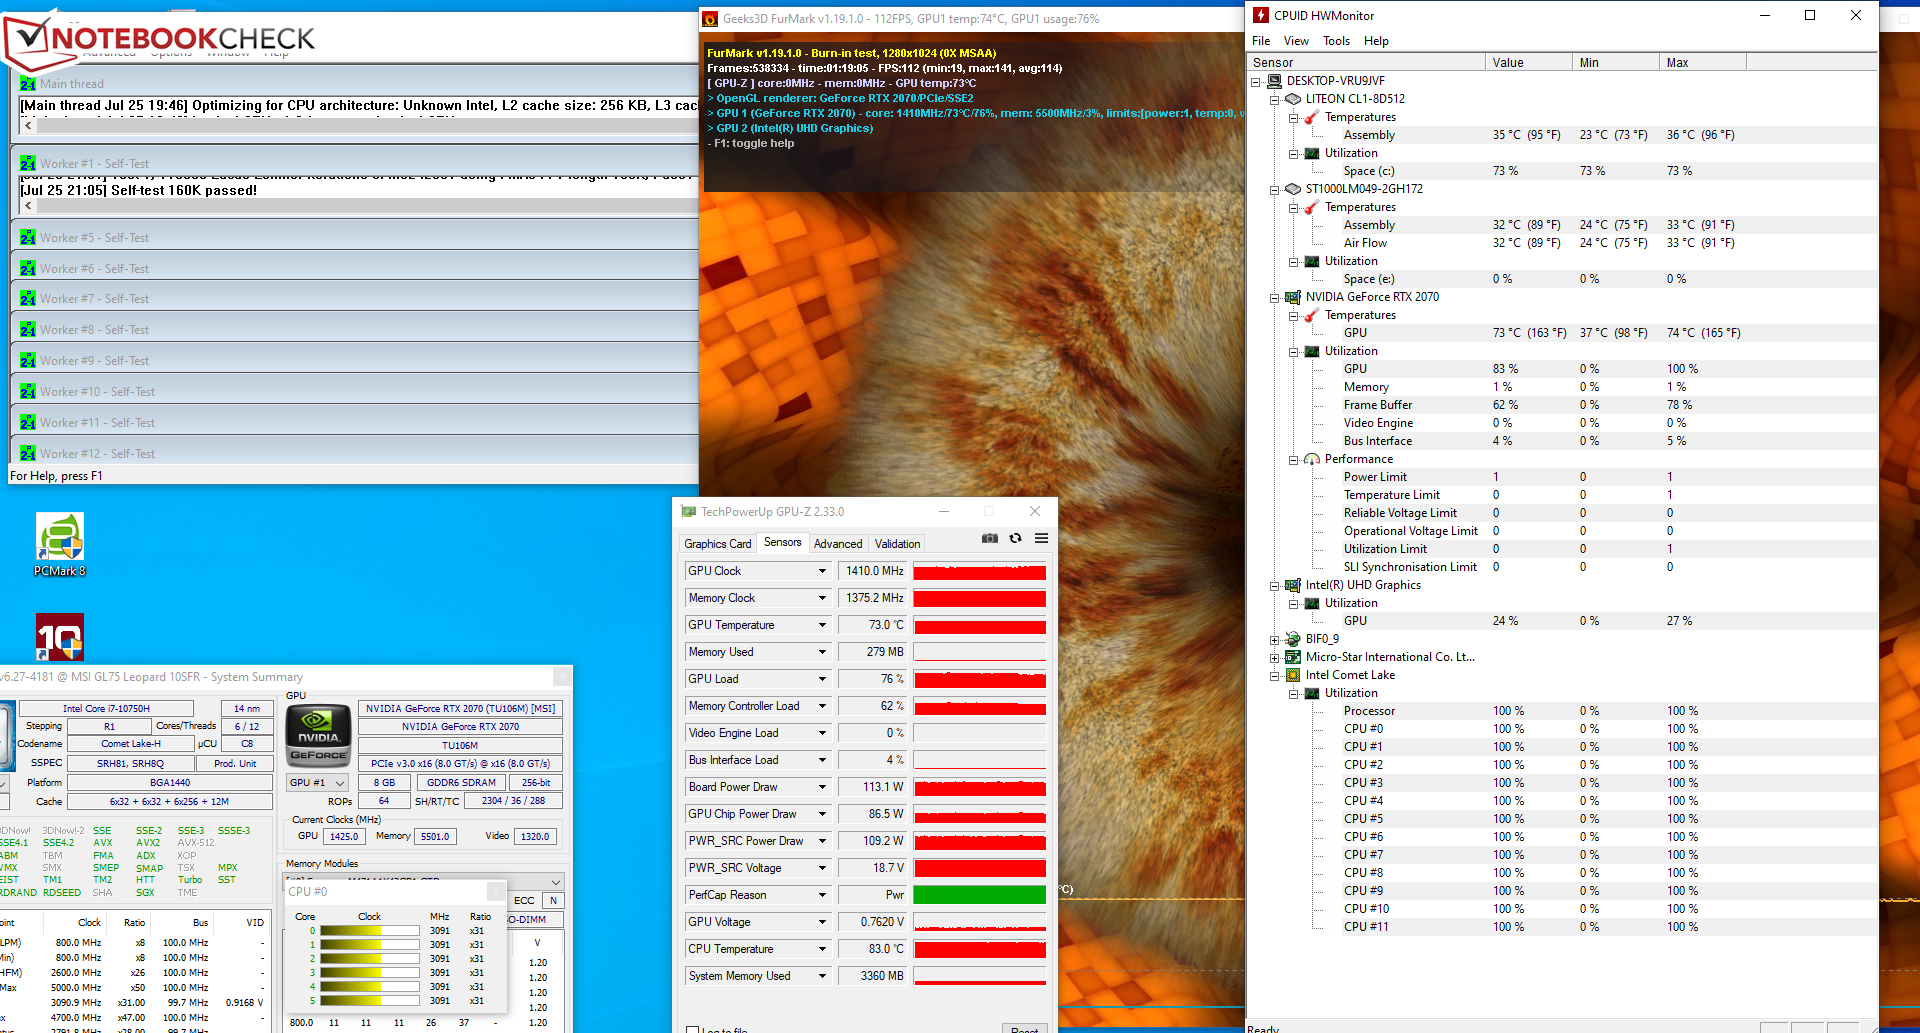
Unseren Stresstest (Prime95 und FurMark laufen für mindestens eine Stunde) bearbeiten CPU bzw. GPU mit 3,1 GHz bzw. 1.400 bis 1.450 MHz. Im Akkubetrieb liegen die Taktraten bei 1,6 bis 1,9 GHz (CPU) bzw. 300 MHz (GPU). Der Stresstest stellt ein Extremszenario dar, welches so im Alltag nicht auftritt. Wir überprüfen mit diesem Test, ob das System auch bei voller Auslastung stabil läuft.
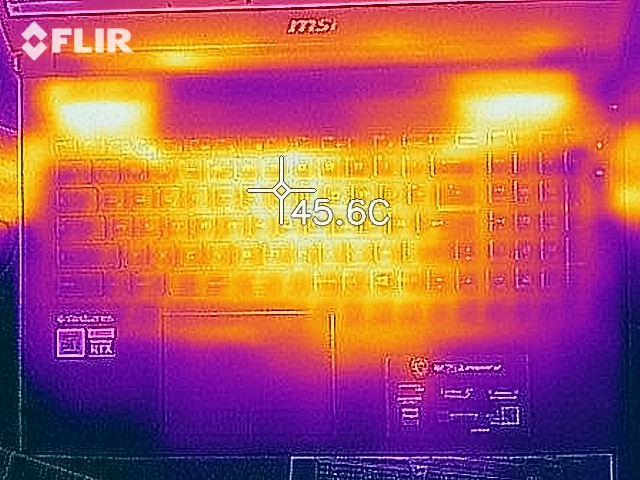
Sonderlich stark erwärmt sich das GL75 nicht. Während des Stresstests registrieren wir an einigen Messpunkten Temperaturen etwas oberhalb von 40 Grad Celsius. Auf dem gleichen Niveau bewegt sich die Erwärmung bei der Durchführung des Witcher-3-Tests. Im Alltagsbetrieb liegen die Werte im grünen Bereich.
(±) Die maximale Temperatur auf der Oberseite ist 44 °C. Im Vergleich liegt der Klassendurchschnitt bei 40.4 °C (von 21.2 bis 68.8 °C für die Klasse Gaming).
(±) Auf der Unterseite messen wir eine maximalen Wert von 42.5 °C (im Vergleich zum Durchschnitt von 43.2 °C).
(+) Ohne Last messen wir eine durchschnittliche Temperatur von 27.4 °C auf der Oberseite. Der Klassendurchschnitt erreicht 33.9 °C.
(±) Beim längeren Spielen von The Witcher 3 erhitzt sich das Gerät durchschnittlich auf 36.4 °C. Der Durchschnitt der Klasse ist derzeit 33.9 °C.
(+) Die Handballen und der Touchpad-Bereich erreichen maximal 33.3 °C und damit die typische Hauttemperatur und fühlen sich daher nicht heiß an.
(-) Die durchschnittliche Handballen-Temperatur anderer getesteter Geräte war 28.8 °C (-4.5 °C).
| MSI GL75 10SFR i7-10750H, GeForce RTX 2070 Mobile | Acer Nitro 5 AN517-52-77DS i7-10750H, GeForce RTX 2060 Mobile | Schenker XMG Neo 17 XNE17M19 i7-9750H, GeForce RTX 2060 Mobile | Lenovo Legion Y740-17IRHg-81UJ001VGE i7-9750H, GeForce RTX 2080 Max-Q | MSI GL75 9SEK-056US i7-9750H, GeForce RTX 2060 Mobile | MSI GP75 Leopard 9SD i7-9750H, GeForce GTX 1660 Ti Mobile | Durchschnittliche NVIDIA GeForce RTX 2070 Mobile | Durchschnitt der Klasse Gaming | |
|---|---|---|---|---|---|---|---|---|
| Hitze | -7% | -4% | -4% | -27% | -3% | -14% | -10% | |
| Last oben max * (°C) | 44 | 50.6 -15% | 48 -9% | 40.7 7% | 49.4 -12% | 45 -2% | 47.1 ? -7% | 45.2 ? -3% |
| Last unten max * (°C) | 42.5 | 53.8 -27% | 54 -27% | 42.2 1% | 50.6 -19% | 42 1% | 51 ? -20% | 48.1 ? -13% |
| Idle oben max * (°C) | 29.1 | 26.6 9% | 26 11% | 31.9 -10% | 39 -34% | 30 -3% | 31.8 ? -9% | 31 ? -7% |
| Idle unten max * (°C) | 29.5 | 27.8 6% | 27 8% | 33.9 -15% | 42 -42% | 32 -8% | 34.8 ? -18% | 34.2 ? -16% |
* ... kleinere Werte sind besser
Lautsprecher
MSI GL75 10SFR Audio Analyse
(±) | Mittelmäßig laut spielende Lautsprecher (75.6 dB)
Bass 100 - 315 Hz
(-) | kaum Bass - 20.3% niedriger als der Median
(±) | durchschnittlich lineare Bass-Wiedergabe (13.1% Delta zum Vorgänger)
Mitteltöne 400 - 2000 Hz
(+) | ausgeglichene Mitten, vom Median nur 1.9% abweichend
(±) | Linearität der Mitten ist durchschnittlich (7% Delta zum Vorgänger)
Hochtöne 2 - 16 kHz
(+) | ausgeglichene Hochtöne, vom Median nur 2.3% abweichend
(+) | sehr lineare Hochtöne (3.7% Delta zum Vorgänger)
Gesamt im hörbaren Bereich 100 - 16.000 Hz
(+) | hörbarer Bereich ist sehr linear (13.9% Abstand zum Median
Im Vergleich zu allen Geräten derselben Klasse
» 22% aller getesteten Geräte dieser Klasse waren besser, 7% vergleichbar, 70% schlechter
» Das beste Gerät hat einen Delta-Wert von 6%, durchschnittlich ist 18%, das schlechteste Gerät hat 132%
Im Vergleich zu allen Geräten im Test
» 16% aller getesteten Geräte waren besser, 4% vergleichbar, 80% schlechter
» Das beste Gerät hat einen Delta-Wert von 4%, durchschnittlich ist 23%, das schlechteste Gerät hat 134%
Energieverwaltung - Lange Akkulaufzeiten bietet das MSI Leopard nicht
Energieaufnahme
Im Leerlauf registrieren wir eine maximale Leistungsaufnahme von 18 Watt - ein hoher Wert, aber durchaus normal für ein Gerät der hier vorliegenden Leistungsklasse. Der Stresstest lässt den Bedarf auf bis zu 224 Watt steigen. Während der Durchführung unseres Witcher-3-Tests messen wir eine Leistungsaufnahme von durchschnittlich 203 Watt (196 bis 212 Watt). Die Nennleistung des Netzteils beträgt 230 Watt.
| Aus / Standby | |
| Idle | |
| Last |
|
Legende:
min: | |
| MSI GL75 10SFR i7-10750H, GeForce RTX 2070 Mobile | Acer Nitro 5 AN517-52-77DS i7-10750H, GeForce RTX 2060 Mobile | Schenker XMG Neo 17 XNE17M19 i7-9750H, GeForce RTX 2060 Mobile | Lenovo Legion Y740-17IRHg-81UJ001VGE i7-9750H, GeForce RTX 2080 Max-Q | MSI GL75 9SEK-056US i7-9750H, GeForce RTX 2060 Mobile | MSI GP75 Leopard 9SD i7-9750H, GeForce GTX 1660 Ti Mobile | Durchschnittliche NVIDIA GeForce RTX 2070 Mobile | Durchschnitt der Klasse Gaming | |
|---|---|---|---|---|---|---|---|---|
| Stromverbrauch | 34% | 14% | -18% | 15% | 11% | -42% | -12% | |
| Idle min * (Watt) | 12 | 5.4 55% | 11 8% | 15.7 -31% | 10.7 11% | 10 17% | 21.4 ? -78% | 13 ? -8% |
| Idle avg * (Watt) | 16.6 | 9.8 41% | 14 16% | 26.3 -58% | 15.2 8% | 15 10% | 26.3 ? -58% | 19 ? -14% |
| Idle max * (Watt) | 18 | 10.9 39% | 20 -11% | 28 -56% | 17.8 1% | 22 -22% | 32.2 ? -79% | 24.6 ? -37% |
| Last avg * (Watt) | 130 | 104 20% | 100 23% | 136 -5% | 88.2 32% | 92 29% | 114.8 ? 12% | 110.7 ? 15% |
| Witcher 3 ultra * (Watt) | 203 | 134.3 34% | 151 26% | 160 21% | 147.8 27% | 153 25% | ||
| Last max * (Watt) | 224 | 193 14% | 174 22% | 177 21% | 206.5 8% | 216 4% | 238 ? -6% | 259 ? -16% |
* ... kleinere Werte sind besser
Akkulaufzeit
Das Gaming-Notebook erreicht in unserem praxisnahen WLAN-Test (Aufruf von Webseiten mittels eines Skripts) eine Laufzeit von 3:54 h. Unseren Videotest beendet der 17,3-Zöller nach 5:11 h. Hierbei lassen wir den Kurzfilm Big Buck Bunny (H.264-Kodierung, 1.920 x 1.080 Pixel) in einer Dauerschleife laufen. Testbedingungen: Die Energiesparfunktionen und die Funkmodule (nur beim Videotest) sind deaktiviert, die Displayhelligkeit wird auf etwa 150 cd/m² geregelt.
| MSI GL75 10SFR i7-10750H, GeForce RTX 2070 Mobile, 51 Wh | Acer Nitro 5 AN517-52-77DS i7-10750H, GeForce RTX 2060 Mobile, 57.48 Wh | Schenker XMG Neo 17 XNE17M19 i7-9750H, GeForce RTX 2060 Mobile, 46 Wh | Lenovo Legion Y740-17IRHg-81UJ001VGE i7-9750H, GeForce RTX 2080 Max-Q, 76 Wh | MSI GL75 9SEK-056US i7-9750H, GeForce RTX 2060 Mobile, 51 Wh | MSI GP75 Leopard 9SD i7-9750H, GeForce GTX 1660 Ti Mobile, 51 Wh | Durchschnitt der Klasse Gaming | |
|---|---|---|---|---|---|---|---|
| Akkulaufzeit | 83% | 17% | -15% | 19% | -23% | 65% | |
| Idle (h) | 6.4 | 11 72% | 6.7 5% | 3.8 -41% | 7.9 23% | 4.8 -25% | 8.27 ? 29% |
| H.264 (h) | 5.2 | 7.3 40% | 2.8 -46% | 8.32 ? 60% | |||
| WLAN (h) | 3.9 | 6.6 69% | 4.7 21% | 3 -23% | 4.2 8% | 3.2 -18% | 7.11 ? 82% |
| Last (h) | 0.8 | 2 150% | 1 25% | 1.2 50% | 1 25% | 0.6 -25% | 1.502 ? 88% |
Pro
Contra
Fazit
Das MSI GL75 macht, was von ihm erwartet wird. Es bringt alle aktuellen Spiele flüssig auf den Bildschirm. Dabei müssen keine Kompromisse bei Auflösung und Qualitätsniveau eingegangen werden. Möglich macht es die Kombination aus Core-i7-10750H-Sechskernprozessor und GeForce-RTX-2070-GPU.
Die leistungsfähige Hardware will gekühlt werden. Daher drehen die beiden Lüfter des Notebooks unter Last mächtig auf und produzieren viel Lärm. Positive Folge: Das Gehäuse erwärmt sich nur moderat.
MSI liefert mit dem GL75 Leopard 10SFR-221 ein rundes Gaming-Notebook zu einem angemessenen Preis.
Das Notebook bringt eine flinke NVMe-SSD mit, die insgesamt 512 GB Speicherplatz bietet. Da ein Gaming-Notebook nie über zu viel Speicher verfügen kann, verbaut MSI zusätzlich eine 1-TB-Festplatte (7.200 rpm). Beide Speichermedien könnten getauscht werden. Dazu müsste die Gehäuseunterschale demontiert werden.
Der matte 144-Hz-IPS-Full-HD Bildschirm punktet mit stabilen Blickwinkeln, ausreichender Helligkeit, gutem Kontrast, kurzen Reaktionszeiten und einer tollen Farbdarstellung. Auch die Farbraumabdeckung weiß zu gefallen.
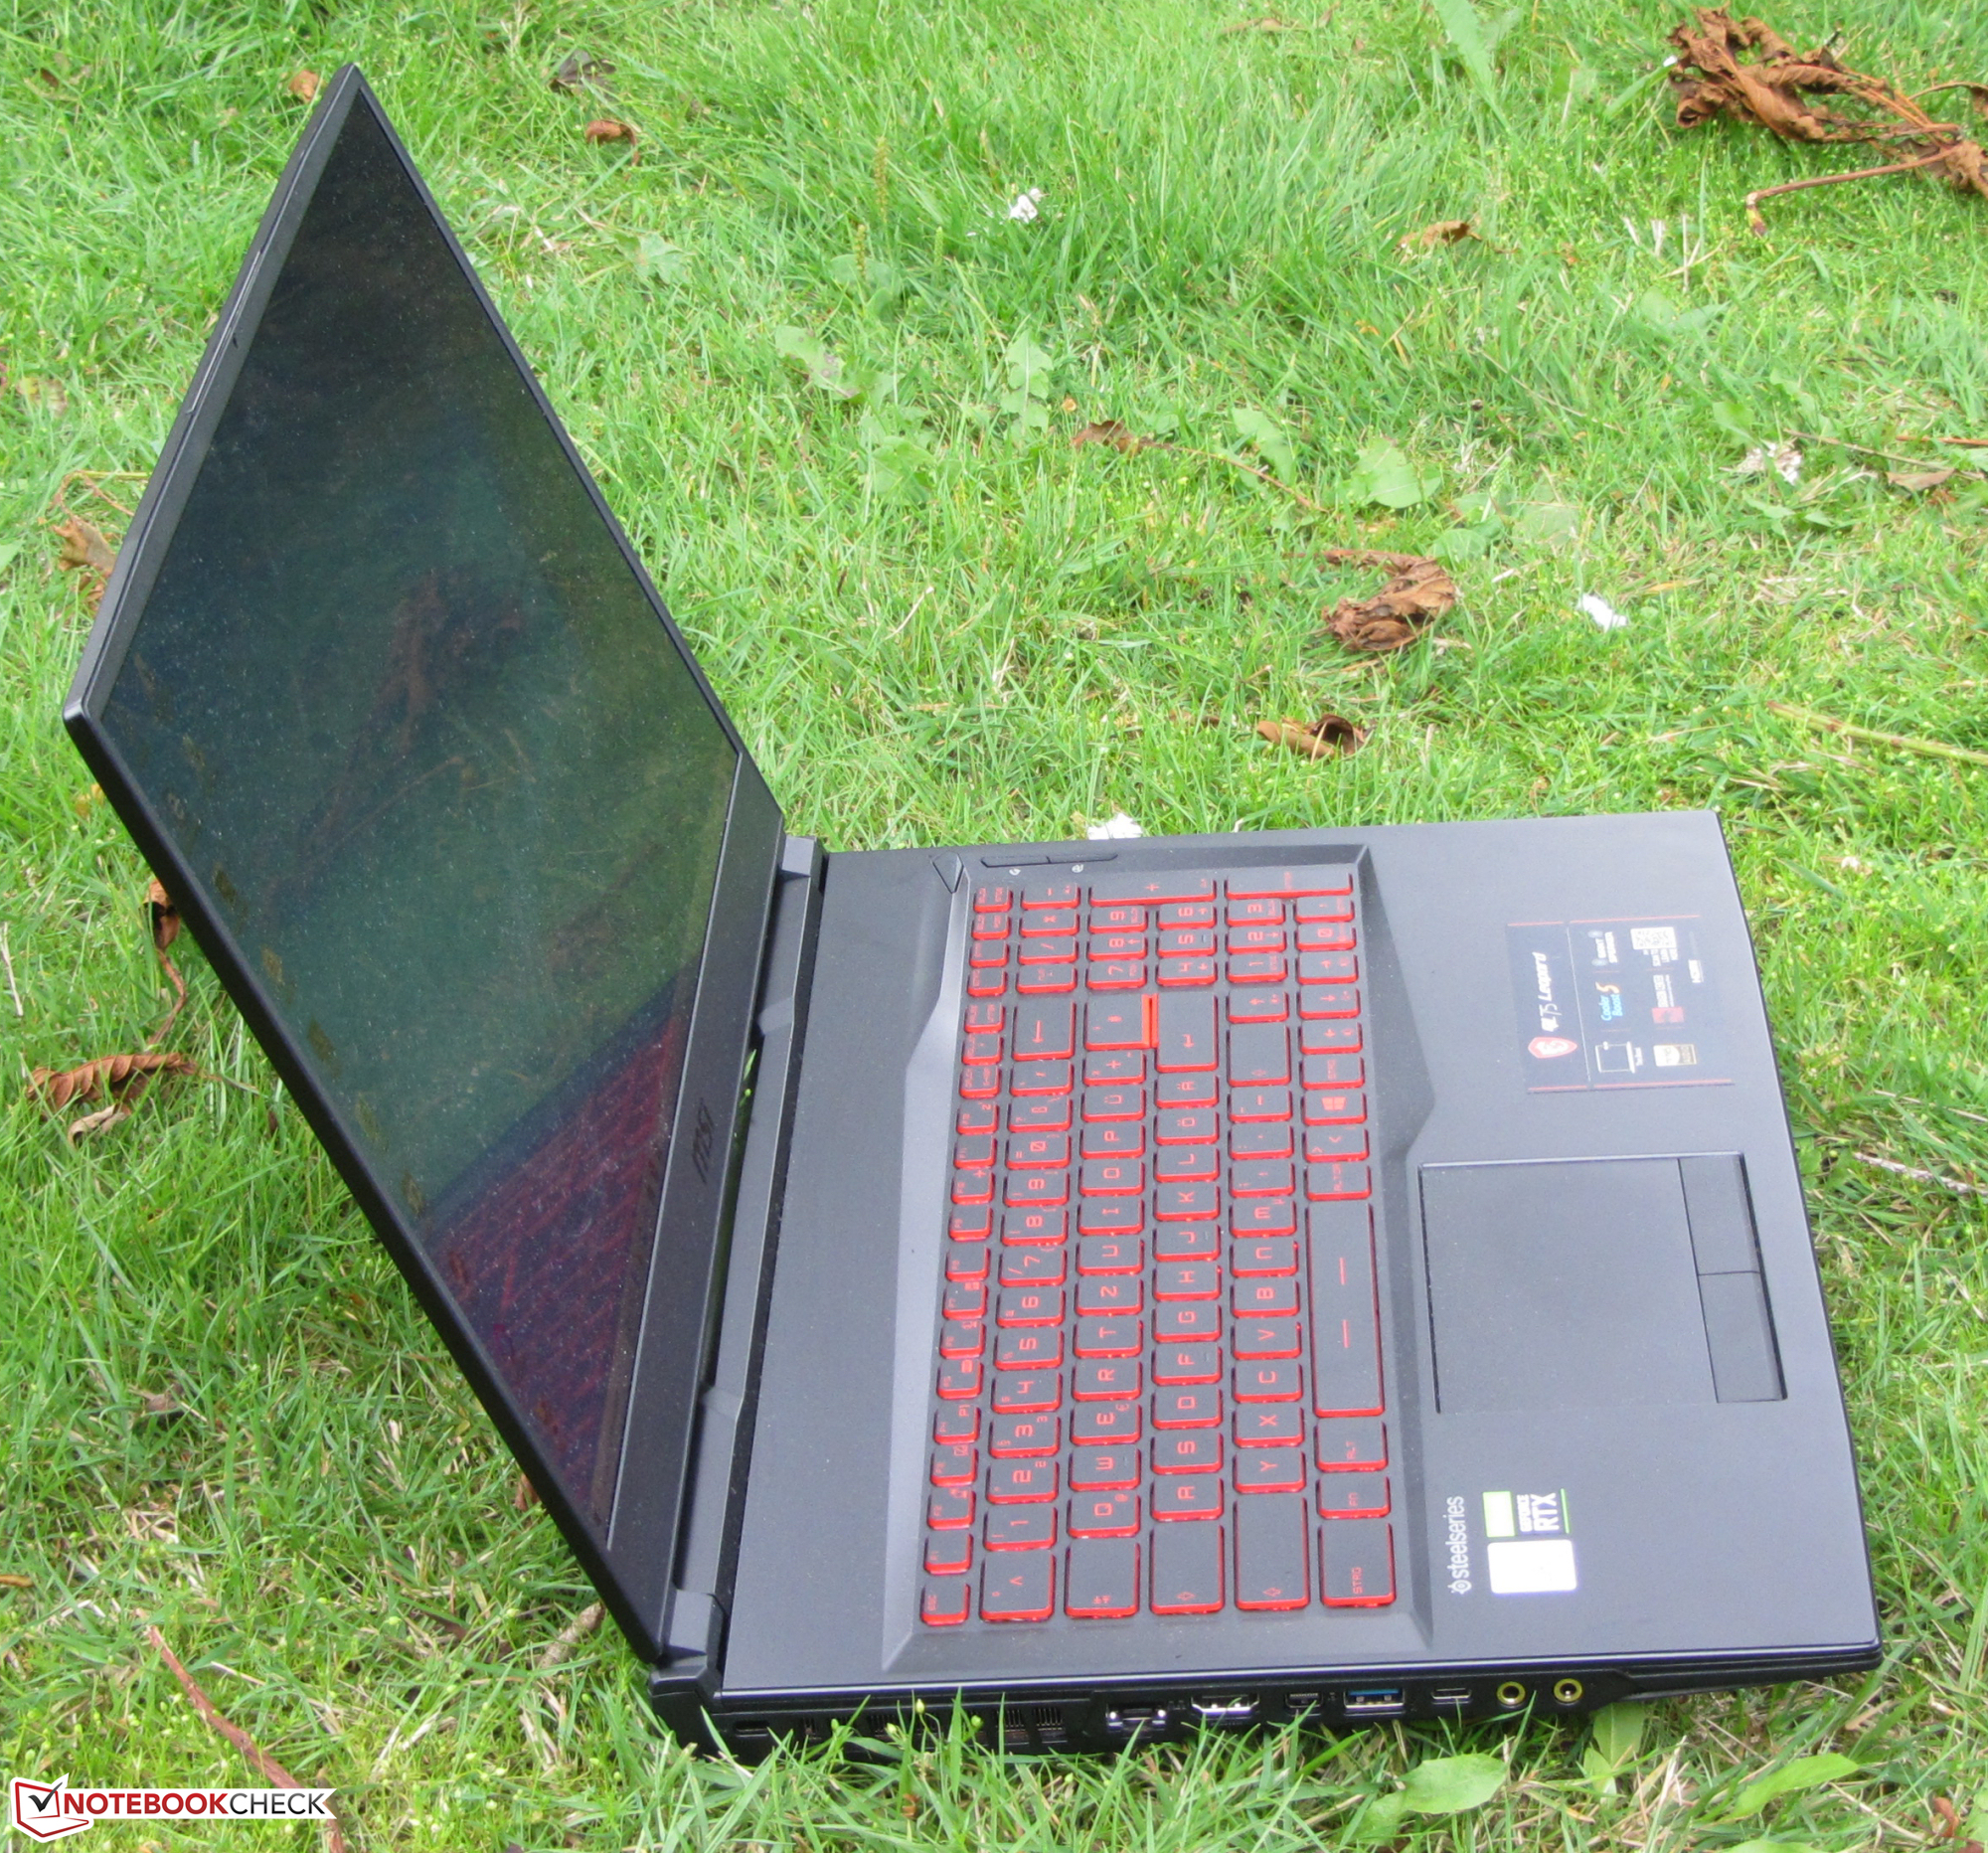
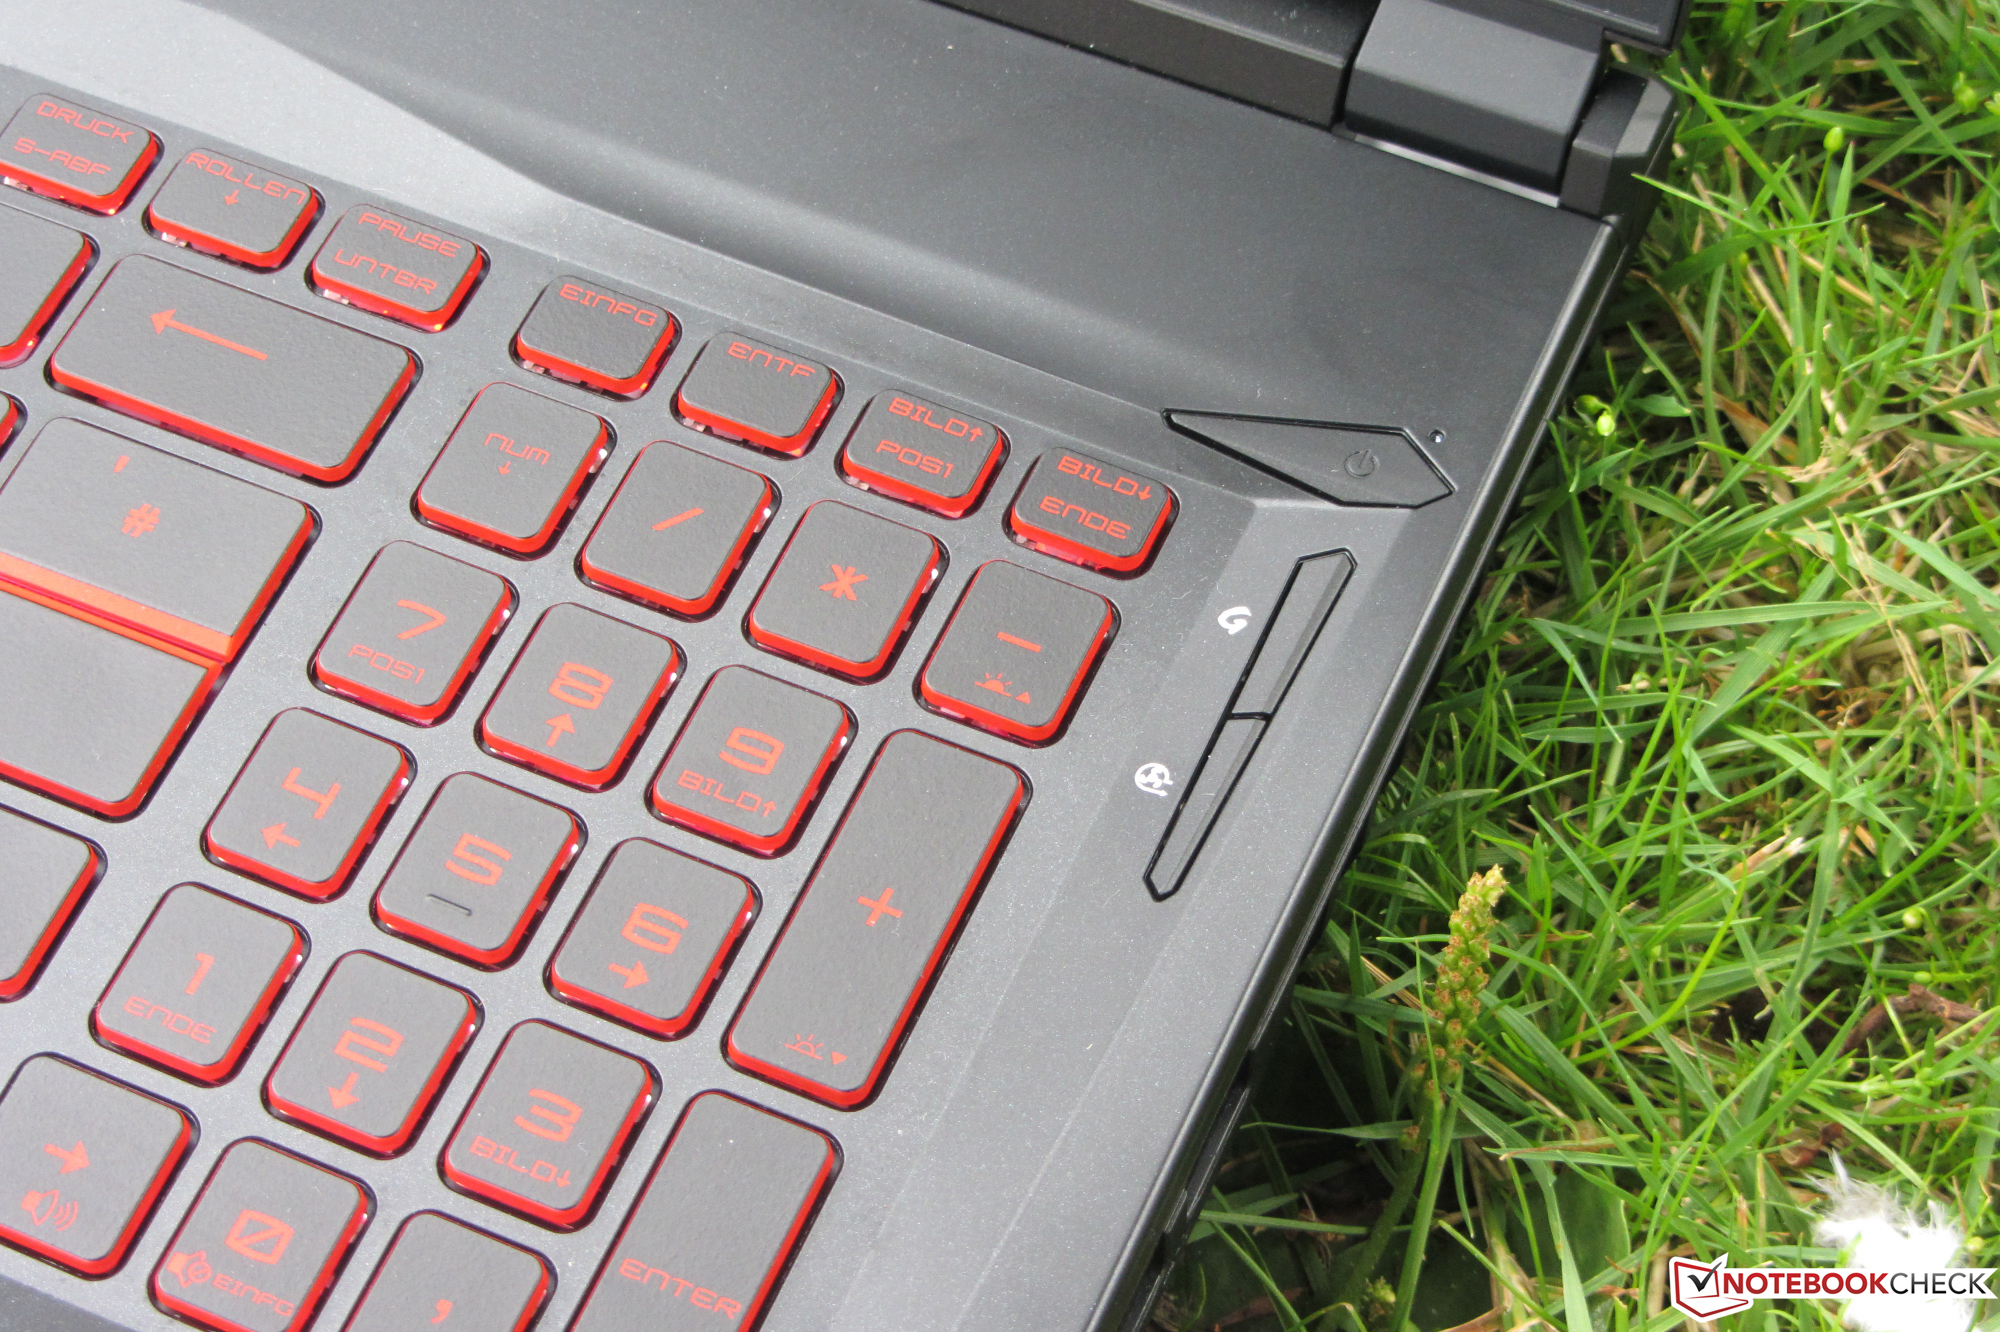
Die Akkulaufzeiten reißen niemanden vom Hocker, gehen für ein Gaming-Notebook aber in Ordnung. Die beleuchtete Tastatur hat ihre Alltagstauglichkeit bewiesen. Allerdings bietet sie keine RGB-Beleuchtung wie das Vorgänger- und das Schwestermodell, sondern nur eine einfarbige Beleuchtung in rot. Einen Thunderbolt-3-Steckplatz hat das Notebook nicht zu bieten. MSI verbaut nur einen Typ-C-USB-3.2-Gen-2-Anschluss, der weder Displayport per USB-C noch Power Delivery unterstützt.
MSI GL75 10SFR
- 31.07.2020 v7 (old)
Sascha Mölck
Preisvergleich
