Notebookcheck Logo

Test MSI WE75 9TK Workstation: Core i7 mit Quadro-RTX-Power
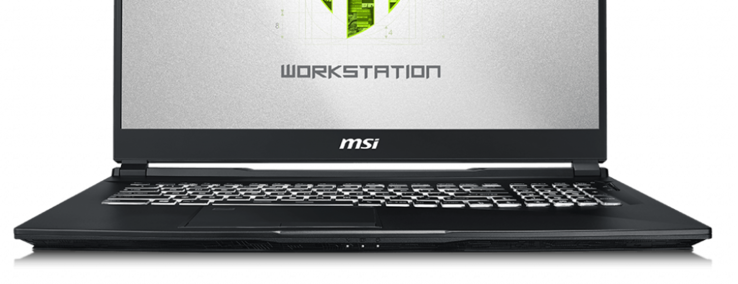
Nicht genügend Konfigurationen. Obwohl die Workstation MSI WE75 auf dem vielseitigen GE75-Chassis basiert, fehlen hier viele Ausstattungsmerkmale, die bei letzterem vorhanden sind. Während das, was hier geboten wird, keineswegs schlecht ist, wissen wir auch, dass das WE75 noch leistungsfähigere Komponenten unterbringen könnte.

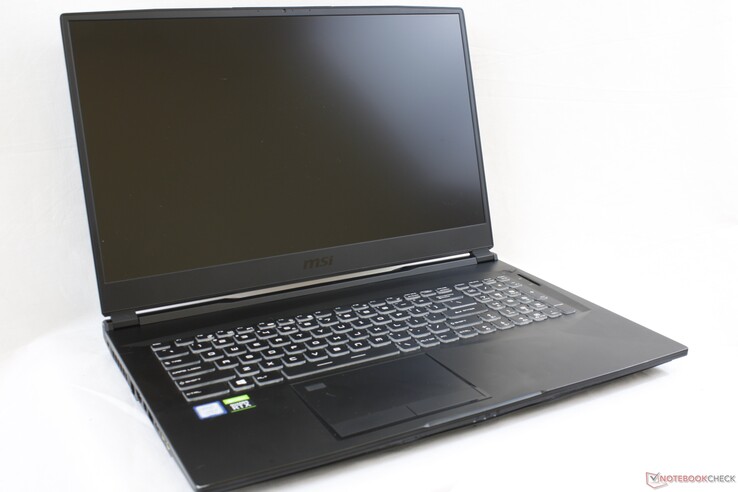
Das MSI WE75 ist im Prinzip ein MSI GE75, bei dem die GeForce-GPU durch eine Quadro-GPU ersetzt wurde. Selbstverständlich gibt es noch einige weitere Unterschiede, auf die wir unten näher eingehen werden, die meisten mobilen Workstations von MSI entstehen jedoch nach diesem Rezept. Unsere heutige Konfiguration des WE75 ist mit einem Core i7-9750H, einer Quadro RTX 3000, 32 GB DDR4-RAM und einem 1080p-60Hz-Display ausgestattet und kostet ca. 2.400 US-Dollar (~2.181 Euro). Es gibt zwar weitere Modelle mit Core i9-, Xeon- oder Quadro-T2000-Optionen, bessere Displays oder Grafikkarten stehen jedoch eigenartigerweise nicht zur Auswahl.

Das WE75 konkurriert direkt mit anderen leistungsfähigen 17,3-Zoll-Workstations wie dem Dell Precision 7730, Fujitsu Celsius H980, Eurocom Tornado F7W, Lenovo ThinkPad P73 und dem HP ZBook 17. Es ist außerdem der direkte Nachfolger des zwei Jahre alten WE72.

Da es unter anderem die gleichen physikalischen Eigenschaften, Anschlüsse, die gleiche Tastatur besitzt wie das GE75, empfehlen für mehr Details hierzu einen Blick auf unsere bestehenden GE75-Tests:

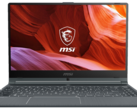
MSI WE75 9TK
Prozessor
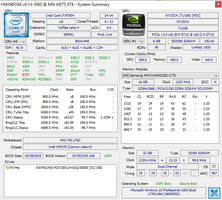
Intel Core i7-9750H 6 x 2.6 - 4.5 GHz, Coffee Lake-H
Grafikkarte
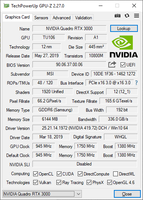
NVIDIA Quadro RTX 3000 (Laptop) - 6 GB VRAM, Kerntakt: 945 MHz, Speichertakt: 1750 MHz, GDDR6, 441.28, Optimus
Hauptspeicher
32 GB 
, Samsung DDR4-21300, 19-19-19-43, Dual-Channel
Bildschirm
17.30 Zoll 16:9, 1920 x 1080 Pixel 127 PPI, AU Optronics B173HAN04.2, IPS, AUO429D, spiegelnd: nein
Mainboard
Intel HM370
Massenspeicher
Soundkarte
Nvidia TU106 - High Definition Audio Controller
Anschlüsse
2 USB 3.0 / 3.1 Gen1, 2 USB 3.1 Gen2, 1 HDMI, 1 DisplayPort, 1 Kensington Lock, Audio Anschlüsse: 3.5 mm microphone, 3.5 mm headphone, Card Reader: SD/SDHC/SDXC
Netzwerk
Qualcomm Atheros AR8171/8175 PCI-E Gigabit Ethernet (10/100/1000MBit/s), Intel Wireless-AC 9560 (a/b/g/n = Wi-Fi 4/ac = Wi-Fi 5/), Bluetooth 5.0
Abmessungen
Höhe x Breite x Tiefe (in mm): 27.5 x 397 x 268.5
Akku
65 Wh Lithium-Ion, 6 Cell
Betriebssystem
Microsoft Windows 10 Pro 64 Bit
Kamera
Webcam: HD (720p)
Sonstiges
Tastatur: Chiclet, Tastatur-Beleuchtung: ja, MSI Creator Center, 12 Monate Garantie
Gewicht
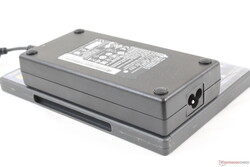
2.6 kg, Netzteil: 738 g
Preis
2400 USD
Hinweis: Der Hersteller kann abweichende Bauteile wie Bildschirme, Laufwerke und Speicherriegel mit ähnlichen Spezifikationen unter dem gleichen Modellnamen einsetzen.


Bew.
Datum
Modell
Gewicht
Dicke
Größe
Auflösung
Preis ab
84.8 %
11.2019
MSI WE75 9TK
i7-9750H, Quadro RTX 3000 (Laptop)
2.6 kg27.5 mm17.30"1920x1080

Gehäuse

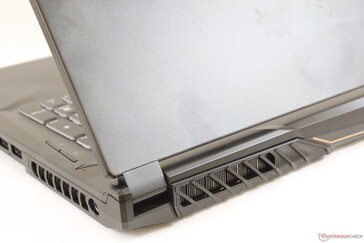
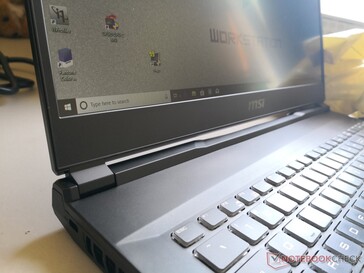
Da beim GE75 das gleiche Chassis-Design wie beim WE75 zum Einsatz kommt, gelten unsere diesbezüglichen Anmerkungen auch hier. Die roten "Gamer"-Verkleidungselemente und das Drachenlogo der G-Reihe ist hier MSIs goldenem W-Logo gewichen. Insgesamt ist das WE75 eine der optisch ansprechenderen mobilen Workstations - vor allem, da klobige, quadratische Designs in dieser Kategorie besonders stark vertreten sind. Schließlich sind die meisten klassischen Workstations auch nicht darauf getrimmt, optisch attraktiv zu sein.
So schön es auch aussehen mag, der Deckel gibt für unseren Geschmack etwas zu leicht nach. In dieser Hinsicht haben das Razer Blade Pro Studio, ThinkPad P73, HP ZBook 17 und das Dell Precision 7730 die Nase vorn.

Das WE75 ist 13 Prozent kleiner als das WE72 der vorherigen Generation, was hauptsächlich auf die schmaleren Displayränder zurückzuführen ist. Zusätzlich ist es auch ganze 300 Gramm leichter, wodurch es sogar weniger wiegt als das Razer Blade Pro 17.

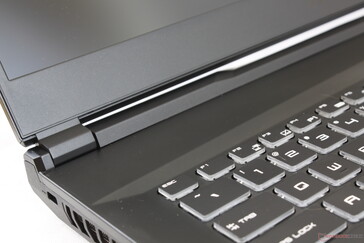
Die kleinen Scharniere sind brauchbar, der Deckel ist jedoch etwas schwach
Die robuste Basiseinheit knarzt beim Verwindungsversuch kaum
Maximaler Öffnungswinkel des Displays (~160 Grad)
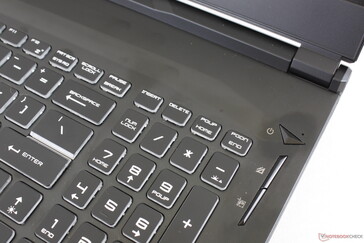
Der Ein-/Ausschalter befindet sich über der Leistungsprofilwechsel- und der Screenshot-Taste
MSIs Logo für die W-Reihe ist deutlich bescheidener und subtiler als das exzentrische Drachensymbol der G-Reihe
Die glatten Kunststoffoberflächen verstecken Fingerabdrücke gut
416 mm 288 mm 33 mm 3.3 kg416 mm 281 mm 31 mm 3.5 kg418 mm 279 mm 28.9 mm 2.9 kg397 mm 330 mm 42 mm 4.2 kg397 mm 268.5 mm 27.5 mm 2.6 kg395 mm 260 mm 19.9 mm 2.8 kg297 mm 210 mm 1 mm 5.7 g

Ausstattung

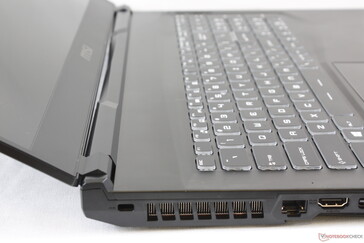
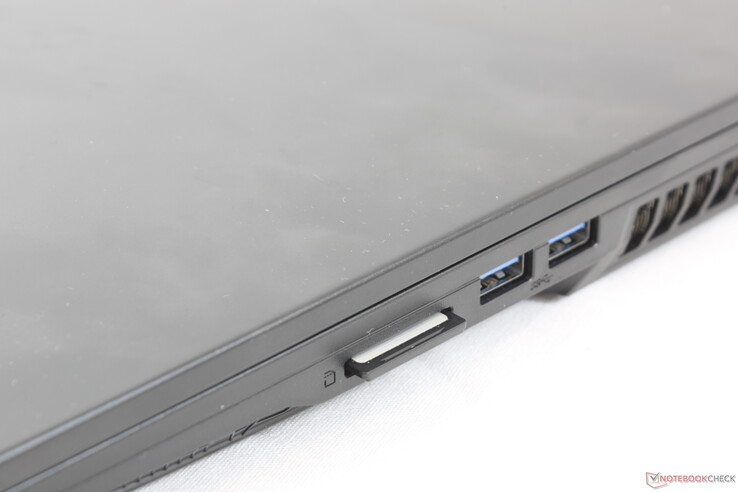
Die Anschlussausstattung ist vielfältig, auch wenn bei dem Layout an manchen Stellen noch Verbesserungsbedarf besteht. Die linke Seite ist beispielsweise dicht bepackt und wirkt etwas überfüllt. Im Gegensatz zu vielen konkurrierenden Modellen der ThinkPad-P- oder der HP-ZBook-Reihen gibt es hier auch keinen SmartCard-Leser. Auf Thunderbolt-3-Unterstützung wurde ebenfalls verzichtet.

Vorderseite: Keine Anschlüsse
Rechts: SD-Kartenleser, 2x USB 3.1 Gen. 1, Netzanschluss
Rückseite: Keine Anschlüsse
Links: Gigabit RJ-45, HDMI 2.0, Mini-DisplayPort 1.2, USB 3.1 Gen. 2, USB 3.1 Gen.2 Typ-C, 3,5-mm-Kopfhörerausgang, 3,5-mm-SPDIF (ESS Sabre HiFi)

SD-Kartenleser

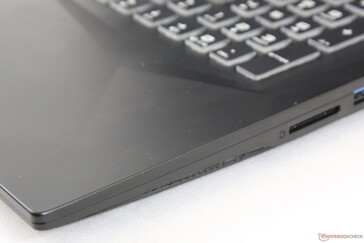
Der gefederte Kartenleser ist vor allem für eine mobile Workstation in dieser Preisklasse enttäuschend langsam. Das Übertragen von 1 GB Bildern von unserer UHS-II-Testkarte auf den Desktop dauert hier ungefähr 40 Sekunden, das Dell XPS 15 vollendet die gleiche Aufgabe in weniger als 8 Sekunden.

Vollständig eingesteckte SD-Karte
SD Card Reader
average JPG Copy Test (av. of 3 runs)
Lenovo ThinkPad P73-20QR002DGE
  (Toshiba Exceria Pro SDXC 64 GB UHS-II)
187 MB/s +606%
HP ZBook 17 G5-2ZC48EA
  (Toshiba Exceria Pro SDXC 64 GB UHS-II)
177 MB/s +568%
Razer Blade Pro 17 RTX 2080 Max-Q
  (Toshiba Exceria Pro SDXC 64 GB UHS-II)
174.4 MB/s +558%
MSI WE75 9TK
  (Toshiba Exceria Pro SDXC 64 GB UHS-II)
26.5 MB/s
MSI GE75 8SG Raider
  (Toshiba Exceria Pro SDXC 64 GB UHS-II)
26 MB/s -2%
MSI WE72 7RJ
  (Toshiba Exceria Pro SDXC 64 GB UHS-II)
17.2 MB/s -35%
maximum AS SSD Seq Read Test (1GB)
Lenovo ThinkPad P73-20QR002DGE
  (Toshiba Exceria Pro SDXC 64 GB UHS-II)
206.3 MB/s +553%
Razer Blade Pro 17 RTX 2080 Max-Q
  (Toshiba Exceria Pro SDXC 64 GB UHS-II)
203.4 MB/s +544%
HP ZBook 17 G5-2ZC48EA
  (Toshiba Exceria Pro SDXC 64 GB UHS-II)
202.7 MB/s +542%
MSI WE75 9TK
  (Toshiba Exceria Pro SDXC 64 GB UHS-II)
31.57 MB/s
MSI GE75 8SG Raider
  (Toshiba Exceria Pro SDXC 64 GB UHS-II)
27 MB/s -14%
MSI WE72 7RJ
  (Toshiba Exceria Pro SDXC 64 GB UHS-II)
18.4 MB/s -42%

Kommunikation

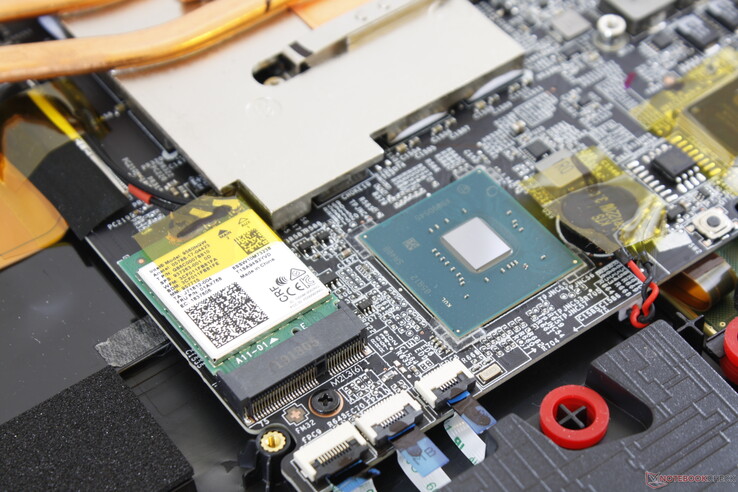
Anders als bei den meisten neuen Gaming-Laptops und Ultrabooks kommt hier keines der WLAN-6-Module Intel AX200 oder Killer 1650 zum Einsatz, sondern das WLAN-5-Modul Intel 9560. Verbindungsprobleme sind im Verlauf unseres Tests nicht aufgetreten.

Herausnehmbares WLAN-Modul
Networking
iperf3 transmit AX12
MSI GT76 Titan DT 9SG
Killer Wi-Fi 6 AX1650x Wireless Network Adapter (200NGW)
730 MBit/s
Razer Blade Pro 17 RTX 2080 Max-Q
Intel Wi-Fi 6 AX200
697 MBit/s
HP ZBook 17 G5-2ZC48EA
Intel Wireless-AC 9560
679 MBit/s
Lenovo ThinkPad P73-20QR002DGE
Intel Wi-Fi 6 AX200
670 MBit/s
MSI WE72 7RJ
Intel Dual Band Wireless-AC 3168
287 MBit/s
iperf3 receive AX12
MSI GT76 Titan DT 9SG
Killer Wi-Fi 6 AX1650x Wireless Network Adapter (200NGW)
690 MBit/s
Razer Blade Pro 17 RTX 2080 Max-Q
Intel Wi-Fi 6 AX200
686 MBit/s
HP ZBook 17 G5-2ZC48EA
Intel Wireless-AC 9560
657 MBit/s
Lenovo ThinkPad P73-20QR002DGE
Intel Wi-Fi 6 AX200
547 MBit/s
MSI WE72 7RJ
Intel Dual Band Wireless-AC 3168
351 MBit/s

Wartung

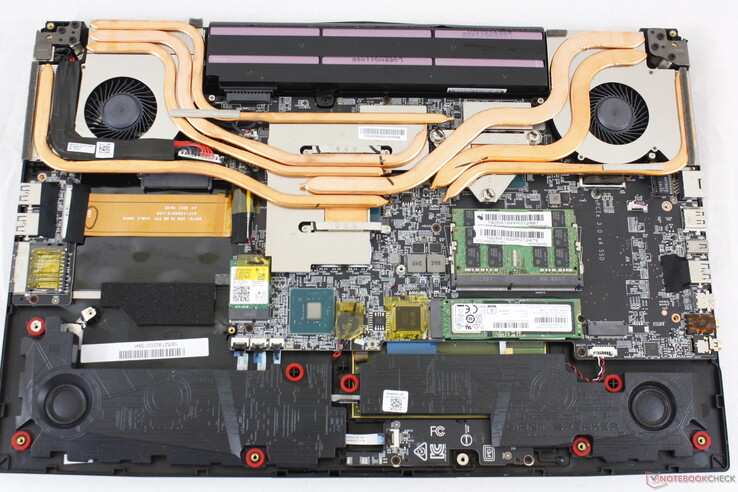
Die Wartung erfordert einen Kreuzschraubenzieher und einen Gegenstand mit einer scharfen Kante. Beim Entfernen der Bodenplatte muss man aufpassen, dass deren Kanten seitlich nicht an den Anschlüssen hängenbleiben. Um die Abdeckung der Unterseite entfernen zu können, muss man außerdem ein Garantiesiegel zerstören.

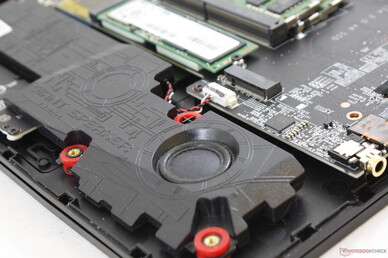
Bis auf die zwei zusätzlichen Lautsprecher ist das Layout mit dem des MSI GE75 quasi identisch

Garantie und Zubehör

Es befindet sich bis auf den üblichen Papierkram kein Zubehör im Lieferumfang. Es gilt die standardmäßige, eingeschränkte einjährige Garantie.

Eingabegeräte

Tastatur und Touchpad

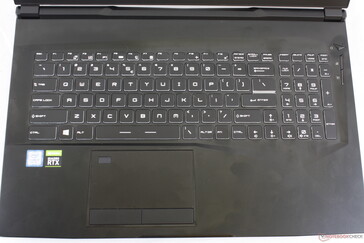
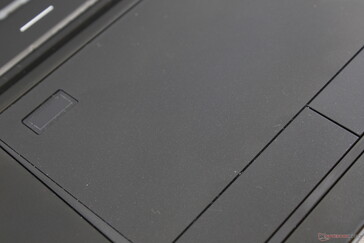
Die Tastatur und das Touchpad (~11 x 6,3 cm) sind mit den Gegenstücken im GE75 fast identisch, weshalb wir an dieser Stelle auf unseren bestehenden Test verweisen. Trotzdem unterscheiden sich die Varianten des WE75 geringfügig. Die individuelle RGB-Tastenbeleuchtung wurde hier durch eine bürofreundliche, einheitlich weiße Hintergrundbeleuchtung ersetzt und auch die rote Umrandung des Touchpads ist verschwunden. Dafür befindet sich jetzt ein Fingerabdruckscanner in der oberen linken Ecke des Touchpads.

Wir sind bei unserem Testgerät auf einen Touchpad-Bug gestoßen. Streicht man mit dem Finger langsam und mit konstanter Geschwindigkeit über das Touchpad, bleibt der Mauszeiger häufig für den Bruchteil einer Sekunde stehen, bevor er sich weiterbewegt. Dieses unbeabsichtigte Verhalten erschwert präzise Klicks ohne eine externe Maus. Beim Versuch, den Synaptics-Treiber über MSIs eigene Treiber- und App-Center-Software zu aktualisieren, treten Windows-Zertifizierungsfehler auf.

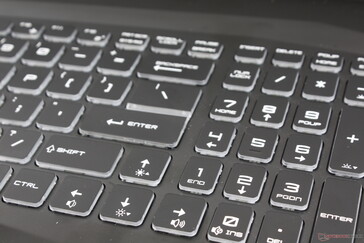
Gleiches Layout und Tastenfeedback wie beim GE75
Die Tippgeräusche sind relativ leise und das Tastenfeedback gleichmäßig deutlich
Das Touchpad ist unflexibel und gibt unter Druck nicht nach. Die dedizierten Maustasten wirken schwammig.
Die Pfeiltasten sind normal groß und die Tasten des Ziffernblocks etwas schmaler

Display

Es ist gleichermaßen verwunderlich und enttäuschend, dass es beim WE75 abgesehen vom Mittelklasse-1080p-60-Hz-Panel keine weiteren Panel-Optionen gibt. Dieses bestimmte B173HAN04.2 AU-Optronics-IPS-Panel, welches man auch in den günstigen Gaming Laptops MSI GF75 und Asus TUF FX705DT findet, verfügt nicht über die schnellen Reaktionszeiten oder die schnelle Bildwiederholfrequenz fortschrittlicherer Panels, die zum Beispiel im Razer Blade Pro 17 oder auch im MSI GE75 aus eigenem Hause verbaut sind. Positiv anzumerken ist, dass das Display trotz matter Schicht unter keinen störenden Bildkörnungseffekten leidet, allerdings werden wir das Gefühl nicht los, dass MSI in Bezug auf das Display des WE75 mehr bieten könnte.

Ein Display mit randlosem Glas, Touchscreen oder 4K-UHD-Auflösung steht nicht zur Auswahl
Die Displayränder sind schmal, vor allem für eine mobile Workstation
Die ungleichmäßigen Lichthöfe am oberen Bildschirmrand sind schwach, aber sichtbar
Subpixel
Subpixel
270
cd/m²
273.8
cd/m²
287.9
cd/m²
274
cd/m²
287.3
cd/m²
295.3
cd/m²
279.9
cd/m²
262.5
cd/m²
288.8
cd/m²
Ausleuchtung des Bildschirms
AU Optronics B173HAN04.2 getestet mit X-Rite i1Pro 2
Maximal: 295.3 cd/m² (Nits) Durchschnitt: 279.9 cd/m² Minimum: 31.56 cd/m²
Ausleuchtung: 89 %
Helligkeit Akku: 287.3 cd/m²
Kontrast: 1105:1 (Schwarzwert: 0.26 cd/m²)
ΔE Color 2.98 | 0.5-29.43 Ø4.94, calibrated: 3.06
ΔE Greyscale 3 | 0.5-98 Ø5.2
89.5% sRGB (Argyll 1.6.3 3D)
58.1% AdobeRGB 1998 (Argyll 1.6.3 3D)
64.3% AdobeRGB 1998 (Argyll 2.2.0 3D)
89.9% sRGB (Argyll 2.2.0 3D)
63.2% Display P3 (Argyll 2.2.0 3D)
Gamma: 2.28
MSI WE75 9TK
AU Optronics B173HAN04.2, IPS, 17.3", 1920x1080
Razer Blade Pro 17 RTX 2080 Max-Q
AU Optronics B173HAN04.0, IPS, 17.3", 1920x1080
MSI WE72 7RJ
LP173WF4-SPF1, IPS, 17.3", 1920x1080
HP ZBook 17 G5-2ZC48EA
AUO B173HW01 V0, , 17.3", 1920x1080
Lenovo ThinkPad P73-20QR002DGE
N173HCE-E31, IPS LED, 17.3", 1920x1080
MSI GT76 Titan DT 9SG
Chi Mei N173HCE-G33 (CMN175C), IPS, 17.3", 1920x1080
Display
-3%
-0%
3%
6%
1%
Display P3 Coverage
63.2
60.6
-4%
67.4
7%
66.3
5%
67.5
7%
62.3
-1%
sRGB Coverage
89.9
89
-1%
85.3
-5%
89.9
0%
94.2
5%
93.4
4%
AdobeRGB 1998 Coverage
64.3
62.1
-3%
62.4
-3%
67.8
5%
64.3
0%
Response Times
74%
-16%
-15%
-10%
71%
Response Time Grey 50% / Grey 80% *
30.8 ?(14.4, 16.4)
6.8 ?(3.4, 3.4)
78%
45.2 ?(27.2, 18)
-47%
42.4 ?(21.2, 21.2)
-38%
40 ?(20.4, 19.6)
-30%
8 ?(4.4, 3.6)
74%
Response Time Black / White *
31.2 ?(18.8, 12.4)
9.6 ?(5.2, 4.4)
69%
26.4 ?(14.8, 11.6)
15%
28.4 ?(15.6, 12.8)
9%
28 ?(17.2, 10.8)
10%
10 ?(5.2, 4.8)
68%
PWM Frequency
25000 ?(50)
26040 ?(20)
Bildschirm
0%
-38%
-13%
-16%
18%
Helligkeit Bildmitte
287.3
299.3
4%
302
5%
335
17%
333
16%
396
38%
Brightness
280
294
5%
306
9%
326
16%
310
11%
373
33%
Brightness Distribution
89
94
6%
93
4%
92
3%
83
-7%
89
0%
Schwarzwert *
0.26
0.29
-12%
0.31
-19%
0.22
15%
0.39
-50%
0.33
-27%
Kontrast
1105
1032
-7%
974
-12%
1523
38%
854
-23%
1200
9%
Delta E Colorchecker *
2.98
2.55
14%
6.2
-108%
4.7
-58%
4.4
-48%
2.04
32%
Colorchecker dE 2000 max. *
5.08
4.73
7%
10.6
-109%
8.7
-71%
7.5
-48%
3.85
24%
Colorchecker dE 2000 calibrated *
3.06
2.9
5%
2.7
12%
2
35%
0.82
73%
Delta E Graustufen *
3
3.5
-17%
7.3
-143%
6.5
-117%
5.1
-70%
2.83
6%
Gamma
2.28 96%
2.28 96%
2.08 106%
2.23 99%
2.39 92%
2.49 88%
CCT
6993 93%
7101 92%
7020 93%
6108 106%
7061 92%
7113 91%
Farbraum (Prozent von AdobeRGB 1998)
58.1
57
-2%
56
-4%
58.7
1%
61.1
5%
59
2%
Color Space (Percent of sRGB)
89.5
88.7
-1%
85.2
-5%
89.7
0%
94
5%
94
5%
Durchschnitt gesamt (Programm / Settings)
24% / 9%
-18% / -28%
-8% / -11%
-7% / -11%
30% / 21%

* ... kleinere Werte sind besser

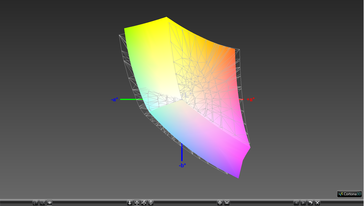
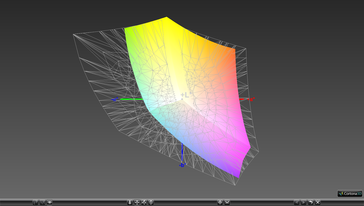
Mit ca. 90 Prozent und 58 Prozent des sRGB bzw. AdobeRGB Farbraums hat sich die Farbraumabdeckung gegenüber dem WE72 nicht merklich verbessert. Dagegen bieten Laptops mit 4K-UHD-IGZO- oder OLED-Panels wie das Razer Blade Pro 17 oder Asus' ZenBook Pro-Reihe eine vollständige AdobeRGB-Abdeckung.

Vs. sRGB
Vs. sRGB
Vs. AdobeRGB
Vs. AdobeRGB

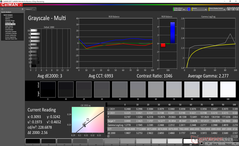
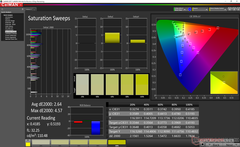
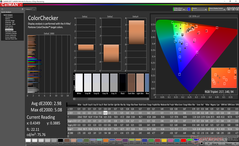
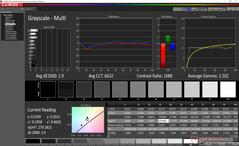
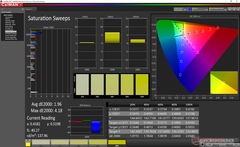
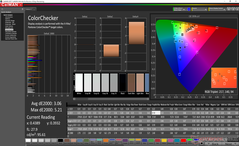
Mit durchschnittlichen Delta-E-Werten von weniger als 3 ist das Display ab Werk gut kalibriert. Mit einer Kalibrierung haben wir versucht, die etwas zu kühle Farbtemperatur zu beheben und auf niedrigen Sättigungsstufen letztendlich eine etwas bessere Farbtreue erreicht.

Graustufen vor der Kalibrierung
Sättigungswerte vor der Kalibrierung
ColorChecker vor der Kalibrierung
Graustufen nach der Kalibrierung
Sättigungswerte nach der Kalibrierung
ColorChecker nach der Kalibrierung

Reaktionszeiten (Response Times) des Displays

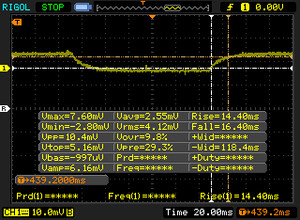
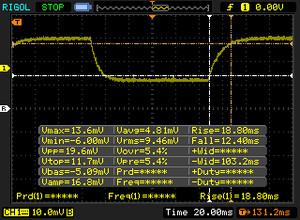
Die Reaktionszeiten (Response Times) beschreiben wie schnell zwischen zwei Farben eines Pixels umgeschaltet werden kann. Langsame Response Times können zu einer verschwommenen Darstellung, Schlieren und Geisterbilder führen. Besonders bei schnellen 3D-Spielen sind kurze Umschaltzeiten wichtig.
       Reaktionszeiten Schwarz zu Weiß
31.2 ms ... steigend ↗ und fallend ↘ kombiniert↗ 18.8 ms steigend
↘ 12.4 ms fallend
Die gemessenen Reaktionszeiten sind langsam und dadurch für viele Spieler wahrscheinlich zu langsam.
Im Vergleich rangierten die bei uns getesteten Geräte von 0.1 (Minimum) zu 240 (Maximum) ms. » 83 % aller Screens waren schneller als der getestete.
Daher sind die gemessenen Reaktionszeiten schlechter als der Durchschnitt aller vermessenen Geräte (21.1 ms).
       Reaktionszeiten 50% Grau zu 80% Grau
30.8 ms ... steigend ↗ und fallend ↘ kombiniert↗ 14.4 ms steigend
↘ 16.4 ms fallend
Die gemessenen Reaktionszeiten sind langsam und dadurch für viele Spieler wahrscheinlich zu langsam.
Im Vergleich rangierten die bei uns getesteten Geräte von 0.165 (Minimum) zu 636 (Maximum) ms. » 37 % aller Screens waren schneller als der getestete.
Daher sind die gemessenen Reaktionszeiten durchschnittlich (33.1 ms).

Bildschirm-Flackern / PWM (Pulse-Width Modulation)

Eine günstige Methode um die Helligkeit eines Bildschirms zu steuern, ist die Beleuchtung periodisch ein- und auszuschalten. Dies nennt sich PWM (Pulsweitenmodulation) Diese Umschaltung sollte mit einer hohen Frequenz stattfinden damit das menschliche Auge kein Flimmern wahrnimmt. Wenn die Frequenz zu niedrig ist, kann dies zu Ermüdungserscheinungen, Augenbrennen, Kopfweh und auch sichtbaren Flackern führen.
Flackern / PWM nicht festgestellt

Im Vergleich: 53 % aller getesteten Geräte nutzten kein PWM um die Helligkeit zu reduzieren. Wenn PWM eingesetzt wurde, dann bei einer Frequenz von durchschnittlich 17204 (Minimum 5, Maximum 3846000) Hz.

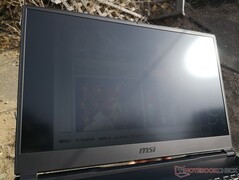
Die Lesbarkeit im Freien ist ähnlich wie bei anderen 17,3-Zoll-Gaming-Laptops mit der wie üblich 300 cd/m² starken Hintergrundbeleuchtung. Die Blickwinkel sind sehr stabil und die Farben und der Kontrast werden nur beim Betrachten von extrem steilen Winkeln leicht verfälscht.

Im Freien in der Sonne
Im Freien im Schatten
Im Freien in der Sonne
Große IPS-Blickwinkel

Leistung

Der Core i7-9750H und die Quadro-RTX-3000 richten sich an anspruchsvolle Anwender. Die noch leistungsfähigere Quadro RTX 5000 bekommt man jedoch nur bei MSIs WS-Reihe. Hier gibt es stattdessen noch eine langsamere Quadro-T2000-Konfiguration, die keine RTX-Funktionen bietet und eine Xeon-E-2176M-Konfiguration, die ECC-RAM unterstützt.

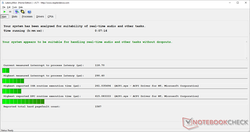
Nvidia Optimus kommt standardmäßig zum Einsatz und erlaubt die automatische Umschaltung zwischen den Grafikkarten. LatencyMon zeigt auch bei aktivierter Drahtlosverbindung keine Probleme mit den DPC-Latenzen.

Prozessor

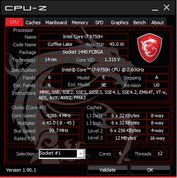
Der Core i7-9750H kann seine Leistung im WE75 gut entfalten, den Turbo Boost gut aufrechterhalten und auch Drosseln ist im Wesentlichen kein Problem. Trotzdem ist das Leistungsniveau insgesamt nicht viel höher als beim Core i7-8750H aus dem letzten Jahr. Während man beim Xeon E-2176M mit einer ähnlichen Leistung rechnen kann, bietet der Achtkernprozessor Core i9-9880H einen spürbaren Leistungsschub von bis zu 40 Prozent.

Weitere technische Informationen und Benchmarkvergleiche finden Sie auf unserer Seite zum Core i7-9750H.

CineBench R15
CineBench R15
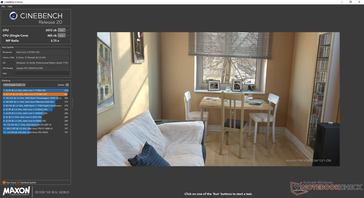
CineBench R20
CineBench R20
0651301952603253904555205856507157808459109751040110511701235Tooltip
MSI WE75 9TK Quadro RTX 3000 (Laptop), i7-9750H, Samsung SSD PM981 MZVLB512HAJQ; CPU Multi 64Bit: Ø1149 (1132.57-1211.28)
Razer Blade Pro 17 RTX 2080 Max-Q GeForce RTX 2080 Max-Q, i7-9750H, Samsung SSD PM981 MZVLB512HAJQ; CPU Multi 64Bit: Ø1076 (1067.18-1187.86)
Dell G7 17 7790 GeForce RTX 2070 Max-Q, i7-8750H, Toshiba BG3 KBG30ZMS256G; CPU Multi 64Bit: Ø1081 (1056.8-1189.87)
MSI WP65 Quadro P620, i7-9750H, Samsung SSD PM981 MZVLB512HAJQ; CPU Multi 64Bit: Ø1131 (1112.84-1252.15)
Cinebench R20
CPU (Single Core)
AMD Radeon RX Vega 64
AMD Ryzen 9 3900X
514 Points +11%
MSI GT76 Titan DT 9SG
Intel Core i9-9900K
509 Points +9%
Medion Erazer X15805
Intel Core i9-8950HK
498 Points +7%
Dell XPS 13 7390 2-in-1 Core i7
Intel Core i7-1065G7
465 Points 0%
MSI WE75 9TK
Intel Core i7-9750H
465 Points
Durchschnittliche Intel Core i7-9750H
  (416 - 486, n=55)
443 Points -5%
MSI GE75 9SG
Intel Core i9-9880H
441 Points -5%
SCHENKER Key 16
Intel Core i7-8750H
416 Points -11%
Dell G5 15 5590-PCNJJ
Intel Core i5-9300H
404 Points -13%
Asus TUF FX505DT-EB73
AMD Ryzen 7 3750H
386 Points -17%
Asus Zephyrus GX501
Intel Core i7-7700HQ
382 Points -18%
CPU (Multi Core)
AMD Radeon RX Vega 64
AMD Ryzen 9 3900X
6910 Points +159%
MSI GT76 Titan DT 9SG
Intel Core i9-9900K
4926 Points +84%
MSI GE75 9SG
Intel Core i9-9880H
3712 Points +39%
Medion Erazer X15805
Intel Core i9-8950HK
2924 Points +9%
MSI WE75 9TK
Intel Core i7-9750H
2672 Points
Durchschnittliche Intel Core i7-9750H
  (2017 - 3133, n=55)
2564 Points -4%
SCHENKER Key 16
Intel Core i7-8750H
2333 Points -13%
Dell XPS 13 7390 2-in-1 Core i7
Intel Core i7-1065G7
2024 Points -24%
Dell G5 15 5590-PCNJJ
Intel Core i5-9300H
1821 Points -32%
Asus TUF FX505DT-EB73
AMD Ryzen 7 3750H
1793 Points -33%
Asus Zephyrus GX501
Intel Core i7-7700HQ
1765 Points -34%
Cinebench R15
CPU Single 64Bit
MSI GT76 Titan DT 9SG
Intel Core i9-9900K
212 Points +11%
AMD Radeon RX Vega 64
AMD Ryzen 9 3900X
209 Points +9%
Medion Erazer X15805
Intel Core i9-8950HK
203 Points +6%
MSI WE75 9TK
Intel Core i7-9750H
191 Points
MSI GE75 9SG
Intel Core i9-9880H
189 Points -1%
Lenovo ThinkPad P1-20MD002LUS
Intel Xeon E-2176M
187 Points -2%
Durchschnittliche Intel Core i7-9750H
  (170 - 194, n=82)
183.7 Points -4%
Dell XPS 13 7390 2-in-1 Core i7
Intel Core i7-1065G7
174 Points -9%
SCHENKER Key 16
Intel Core i7-8750H
171 Points -10%
Dell G5 15 5590-PCNJJ
Intel Core i5-9300H
169 Points -12%
Asus Zephyrus GX501
Intel Core i7-7700HQ
160 Points -16%
Asus TUF FX505DT-EB73
AMD Ryzen 7 3750H
157 Points -18%
CPU Multi 64Bit
AMD Radeon RX Vega 64
AMD Ryzen 9 3900X
3049 Points +152%
MSI GT76 Titan DT 9SG
Intel Core i9-9900K
2022 Points +67%
MSI GE75 9SG
Intel Core i9-9880H
1721 Points +42%
Medion Erazer X15805
Intel Core i9-8950HK
1217 Points 0%
MSI WE75 9TK
Intel Core i7-9750H
1211 Points
Durchschnittliche Intel Core i7-9750H
  (952 - 1306, n=85)
1182 Points -2%
Lenovo ThinkPad P1-20MD002LUS
Intel Xeon E-2176M
1118 Points -8%
SCHENKER Key 16
Intel Core i7-8750H
1116 Points -8%
Dell XPS 13 7390 2-in-1 Core i7
Intel Core i7-1065G7
830 Points -31%
Dell G5 15 5590-PCNJJ
Intel Core i5-9300H
818 Points -32%
Asus TUF FX505DT-EB73
AMD Ryzen 7 3750H
799 Points -34%
Asus Zephyrus GX501
Intel Core i7-7700HQ
735 Points -39%
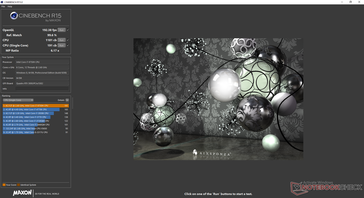
Cinebench R15 CPU Single 64Bit
191 Points
Cinebench R15 CPU Multi 64Bit
1211 Points
Cinebench R15 OpenGL 64Bit
192.4 fps
Cinebench R15 Ref. Match 64Bit
99.6 %
Hilfe

System Performance

In den PCMark-Benchmarks liegen unser heutiges Testgerät und das Lenovo ThinkPad P73, das auch mit einer Quadro-RTX-3000-Grafikkarte und einer Samsung PM981 SSD ausgestattet ist, nur wenige Prozente auseinander. Während unserer Tests sind weder Software- noch Hardwareprobleme aufgetreten. Nutzer müssen sich nach dem Bootvorgang und der erfolgreichen Verbindung mit dem Internet jedoch auf MSI-Pop-ups einstellen.

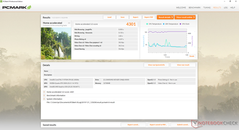
PCMark 8 Home Accelerated
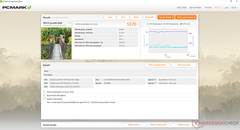
PCMark 8 Work Accelerated
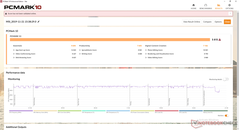
PCMark 10 Standard
PCMark 10 Standard
PCMark 10
Score
MSI GT76 Titan DT 9SG
GeForce RTX 2080 Mobile, i9-9900K, 2x Samsung PM961 MZVLW256HEHP (RAID 0)
6599 Points +13%
MSI WE75 9TK
Quadro RTX 3000 (Laptop), i7-9750H, Samsung SSD PM981 MZVLB512HAJQ
5815 Points
Lenovo ThinkPad P73-20QR002DGE
Quadro RTX 3000 (Laptop), i7-9850H, Intel SSD Pro 7600p SSDPEKKF512G8L
5768 Points -1%
Razer Blade Pro 17 RTX 2080 Max-Q
GeForce RTX 2080 Max-Q, i7-9750H, Samsung SSD PM981 MZVLB512HAJQ
5734 Points -1%
HP ZBook 17 G5-2ZC48EA
Quadro P3200, i7-8850H, Toshiba XG5 KXG50ZNV256G
5287 Points -9%
Essentials
MSI GT76 Titan DT 9SG
GeForce RTX 2080 Mobile, i9-9900K, 2x Samsung PM961 MZVLW256HEHP (RAID 0)
10466 Points +8%
Lenovo ThinkPad P73-20QR002DGE
Quadro RTX 3000 (Laptop), i7-9850H, Intel SSD Pro 7600p SSDPEKKF512G8L
9917 Points +2%
MSI WE75 9TK
Quadro RTX 3000 (Laptop), i7-9750H, Samsung SSD PM981 MZVLB512HAJQ
9694 Points
Razer Blade Pro 17 RTX 2080 Max-Q
GeForce RTX 2080 Max-Q, i7-9750H, Samsung SSD PM981 MZVLB512HAJQ
9473 Points -2%
Productivity
MSI GT76 Titan DT 9SG
GeForce RTX 2080 Mobile, i9-9900K, 2x Samsung PM961 MZVLW256HEHP (RAID 0)
8068 Points +5%
MSI WE75 9TK
Quadro RTX 3000 (Laptop), i7-9750H, Samsung SSD PM981 MZVLB512HAJQ
7693 Points
Lenovo ThinkPad P73-20QR002DGE
Quadro RTX 3000 (Laptop), i7-9850H, Intel SSD Pro 7600p SSDPEKKF512G8L
7641 Points -1%
Razer Blade Pro 17 RTX 2080 Max-Q
GeForce RTX 2080 Max-Q, i7-9750H, Samsung SSD PM981 MZVLB512HAJQ
7482 Points -3%
Digital Content Creation
MSI GT76 Titan DT 9SG
GeForce RTX 2080 Mobile, i9-9900K, 2x Samsung PM961 MZVLW256HEHP (RAID 0)
9239 Points +29%
Razer Blade Pro 17 RTX 2080 Max-Q
GeForce RTX 2080 Max-Q, i7-9750H, Samsung SSD PM981 MZVLB512HAJQ
7219 Points +1%
MSI WE75 9TK
Quadro RTX 3000 (Laptop), i7-9750H, Samsung SSD PM981 MZVLB512HAJQ
7156 Points
Lenovo ThinkPad P73-20QR002DGE
Quadro RTX 3000 (Laptop), i7-9850H, Intel SSD Pro 7600p SSDPEKKF512G8L
6876 Points -4%
PCMark 8
Home Score Accelerated v2
Razer Blade Pro 17 RTX 2080 Max-Q
GeForce RTX 2080 Max-Q, i7-9750H, Samsung SSD PM981 MZVLB512HAJQ
4412 Points +3%
HP ZBook 17 G5-2ZC48EA
Quadro P3200, i7-8850H, Toshiba XG5 KXG50ZNV256G
4332 Points +1%
MSI WE75 9TK
Quadro RTX 3000 (Laptop), i7-9750H, Samsung SSD PM981 MZVLB512HAJQ
4301 Points
MSI WE72 7RJ
Quadro M2200, i7-7700HQ, Samsung SM961 MZVPW256 m.2 PCI-e
4295 Points 0%
Lenovo ThinkPad P73-20QR002DGE
Quadro RTX 3000 (Laptop), i7-9850H, Intel SSD Pro 7600p SSDPEKKF512G8L
4271 Points -1%
Work Score Accelerated v2
Razer Blade Pro 17 RTX 2080 Max-Q
GeForce RTX 2080 Max-Q, i7-9750H, Samsung SSD PM981 MZVLB512HAJQ
5672 Points +2%
MSI WE75 9TK
Quadro RTX 3000 (Laptop), i7-9750H, Samsung SSD PM981 MZVLB512HAJQ
5570 Points
Lenovo ThinkPad P73-20QR002DGE
Quadro RTX 3000 (Laptop), i7-9850H, Intel SSD Pro 7600p SSDPEKKF512G8L
5432 Points -2%
HP ZBook 17 G5-2ZC48EA
Quadro P3200, i7-8850H, Toshiba XG5 KXG50ZNV256G
5276 Points -5%
MSI WE72 7RJ
Quadro M2200, i7-7700HQ, Samsung SM961 MZVPW256 m.2 PCI-e
5150 Points -8%
PCMark 8 Home Score Accelerated v2
4301 Punkte
PCMark 8 Work Score Accelerated v2
5570 Punkte
PCMark 10 Score
5815 Punkte
Hilfe

Massenspeicher

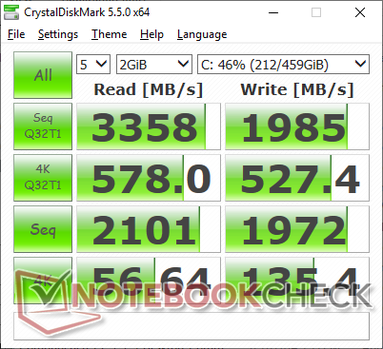
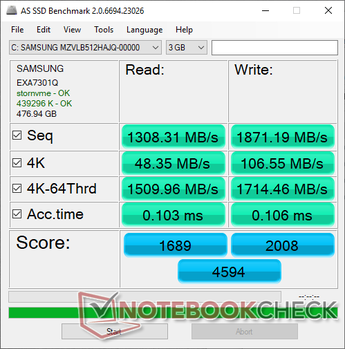
Für die Erweiterung des Speichers können zwei M.2-2280-Steckplätze und ein 2,5-Zoll-SATA-III-Schacht genutzt werden. Ähnlich wie beim Razer Blade Pro und unserem letztes MSI GE75 kommt bei diesem WE75 die NVMe-SSD Samsung PM981, die schnelle Lese- und Schreibraten bietet, zum Einsatz. Je nach Vertriebspartner bzw. Shop bekommt man wahrscheinlich unterschiedliche Laufwerke.

Weitere Benchmarkvergleiche finden Sie in unserer Festplatten- und SSD-Tabelle.

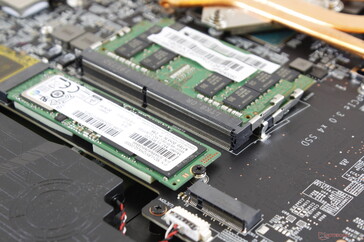
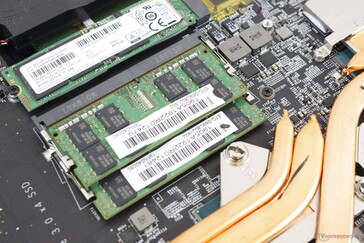
Die zwei M.2-Steckplätze befinden sich senkrecht auf dem Mainboard
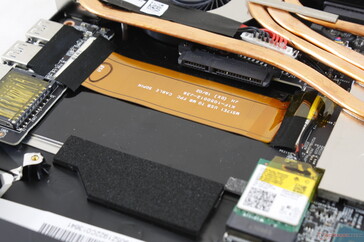
Freier 2,5-Zoll-SATA-III-Schacht
CDM 5.5
CDM 5.5
AS SSD
AS SSD
MSI WE75 9TK
Samsung SSD PM981 MZVLB512HAJQ
Razer Blade Pro 17 RTX 2080 Max-Q
Samsung SSD PM981 MZVLB512HAJQ
MSI GT76 Titan DT 9SG
2x Samsung PM961 MZVLW256HEHP (RAID 0)
MSI WE72 7RJ
Samsung SM961 MZVPW256 m.2 PCI-e
Lenovo ThinkPad P73-20QR002DGE
Intel SSD Pro 7600p SSDPEKKF512G8L
AS SSD
-1%
11%
2%
2%
Seq Read
1308
1831
40%
2646
102%
2586
98%
2693
106%
Seq Write
1871
1744
-7%
2214
18%
1441
-23%
1542
-18%
4K Read
48.35
45.16
-7%
30.42
-37%
53
10%
62.6
29%
4K Write
106.6
107.1
0%
95.9
-10%
148.1
39%
149.5
40%
4K-64 Read
1510
1240
-18%
1609
7%
1517
0%
871
-42%
4K-64 Write
1715
1695
-1%
1573
-8%
826
-52%
1006
-41%
Access Time Read *
0.103
0.064
38%
0.128
-24%
0.041
60%
0.058
44%
Access Time Write *
0.106
0.037
65%
0.039
63%
0.026
75%
0.067
37%
Score Read
1689
1468
-13%
1904
13%
1829
8%
1203
-29%
Score Write
2008
1977
-2%
1890
-6%
1118
-44%
1309
-35%
Score Total
4594
4197
-9%
4740
3%
3831
-17%
3088
-33%
Copy ISO MB/s
2343
2086
-11%
1600
-32%
1716
-27%
Copy Program MB/s
526
425.5
-19%
290
-45%
542
3%
Copy Game MB/s
1506
555
-63%
863
-43%
1375
-9%

* ... kleinere Werte sind besser

Samsung SSD PM981 MZVLB512HAJQ
CDM 5/6 Read Seq Q32T1: 3358 MB/s
CDM 5/6 Write Seq Q32T1: 1985 MB/s
CDM 5/6 Read 4K Q32T1: 578 MB/s
CDM 5/6 Write 4K Q32T1: 527 MB/s
CDM 5 Read Seq: 2101 MB/s
CDM 5 Write Seq: 1972 MB/s
CDM 5/6 Read 4K: 56.6 MB/s
CDM 5/6 Write 4K: 135.4 MB/s

Grafikkarte

Die mobile Quadro RTX 3000 ist einer mobilen GeForce RTX 2060 sehr ähnlich, da beide GPUs über die gleiche Anzahl an ROPs, TMUs und vereinigten Shadern verfügen. Dadurch sind die 3DMark- und Gaming-Resultate sehr ähnlich. CAD-basierte Aufgaben profitieren natürlich von der Quadro-Karte und auch unsere SpecViewPerf-Werte können dies bestätigen. Gegenüber der Quadro T2000 ist die theoretische Leistung hier um ca. 90 Prozent höher.

Weitere technische Informationen und Benchmarkvergleiche finden Sie auf unserer Seite zur Quadro RTX 3000.

Ice Storm Extreme
Ice Storm Extreme
Cloud Gate
Cloud Gate
Time Spy
Time Spy
Port Royal
Port Royal
Fire Strike
Fire Strike
Fire Strike Ultra
Fire Strike Ultra
3DMark
1280x720 Cloud Gate Standard Graphics
Asus Strix Scar III G531GW-AZ062T
NVIDIA GeForce RTX 2070 Mobile, i7-9750H
119860 Points +13%
Asus ROG G703GXR
NVIDIA GeForce RTX 2080 Mobile, i7-9750H
119847 Points +13%
MSI RTX 2060 Gaming Z 6G
NVIDIA GeForce RTX 2060 (Desktop), R7 2700X
107083 Points +1%
MSI WE75 9TK
NVIDIA Quadro RTX 3000 (Laptop), i7-9750H
106470 Points
SCHENKER XMG Neo 17 XNE17M19
NVIDIA GeForce RTX 2060 Mobile, i7-9750H
101947 Points -4%
Maingear Vector 15
NVIDIA GeForce GTX 1660 Ti Mobile, i7-9750H
97136 Points -9%
Durchschnittliche NVIDIA Quadro RTX 3000 (Laptop)
  (62730 - 106470, n=3)
86865 Points -18%
HP ZBook 17 G4-Y3J82AV
NVIDIA Quadro P5000, E3-1535M v6
83316 (76849min - 83381max) Points -22%
Razer Blade 15 Studio Edition
NVIDIA Quadro RTX 5000 Max-Q, i7-9750H
64768 Points -39%
Dell G3 3590
NVIDIA GeForce GTX 1650 Mobile, i5-9300H
58270 Points -45%
Lenovo ThinkPad P1 2019-20QT000RGE
NVIDIA Quadro T1000 (Laptop), i7-9850H
48965 Points -54%
Dell Precision 5540
NVIDIA Quadro T2000 Max-Q, i9-9980HK
42409 Points -60%
Lenovo ThinkPad P53s-20N6001NGE
NVIDIA Quadro P520, i7-8565U
20665 Points -81%
1920x1080 Fire Strike Graphics
Asus ROG G703GXR
NVIDIA GeForce RTX 2080 Mobile, i7-9750H
25727 Points +62%
Asus Strix Scar III G531GW-AZ062T
NVIDIA GeForce RTX 2070 Mobile, i7-9750H
19846 Points +25%
Razer Blade 15 Studio Edition
NVIDIA Quadro RTX 5000 Max-Q, i7-9750H
19821 Points +25%
MSI RTX 2060 Gaming Z 6G
NVIDIA GeForce RTX 2060 (Desktop), R7 2700X
19338 Points +22%
MSI WE75 9TK
NVIDIA Quadro RTX 3000 (Laptop), i7-9750H
15881 Points
SCHENKER XMG Neo 17 XNE17M19
NVIDIA GeForce RTX 2060 Mobile, i7-9750H
15398 Points -3%
Durchschnittliche NVIDIA Quadro RTX 3000 (Laptop)
  (13802 - 15881, n=2)
14842 Points -7%
Maingear Vector 15
NVIDIA GeForce GTX 1660 Ti Mobile, i7-9750H
14718 Points -7%
HP ZBook 17 G4-Y3J82AV
NVIDIA Quadro P5000, E3-1535M v6
14665 (14572min - 14667max) Points -8%
Dell G3 3590
NVIDIA GeForce GTX 1650 Mobile, i5-9300H
9315 Points -41%
Dell Precision 5540
NVIDIA Quadro T2000 Max-Q, i9-9980HK
8107 Points -49%
Lenovo ThinkPad P1 2019-20QT000RGE
NVIDIA Quadro T1000 (Laptop), i7-9850H
7558 Points -52%
Lenovo ThinkPad P53s-20N6001NGE
NVIDIA Quadro P520, i7-8565U
3410 Points -79%
2560x1440 Time Spy Graphics
Asus ROG G703GXR
NVIDIA GeForce RTX 2080 Mobile, i7-9750H
10181 Points +69%
MSI RTX 2060 Gaming Z 6G
NVIDIA GeForce RTX 2060 (Desktop), R7 2700X
7732 Points +29%
Asus Strix Scar III G531GW-AZ062T
NVIDIA GeForce RTX 2070 Mobile, i7-9750H
7722 Points +28%
Razer Blade 15 Studio Edition
NVIDIA Quadro RTX 5000 Max-Q, i7-9750H
7153 Points +19%
MSI WE75 9TK
NVIDIA Quadro RTX 3000 (Laptop), i7-9750H
6014 Points
Durchschnittliche NVIDIA Quadro RTX 3000 (Laptop)
  (5503 - 6014, n=3)
5702 Points -5%
SCHENKER XMG Neo 17 XNE17M19
NVIDIA GeForce RTX 2060 Mobile, i7-9750H
5660 Points -6%
Maingear Vector 15
NVIDIA GeForce GTX 1660 Ti Mobile, i7-9750H
5534 Points -8%
HP ZBook 17 G4-Y3J82AV
NVIDIA Quadro P5000, E3-1535M v6
4867 (4840min - 4873max) Points -19%
Dell G3 3590
NVIDIA GeForce GTX 1650 Mobile, i5-9300H
3519 Points -41%
Dell Precision 5540
NVIDIA Quadro T2000 Max-Q, i9-9980HK
3066 Points -49%
Lenovo ThinkPad P1 2019-20QT000RGE
NVIDIA Quadro T1000 (Laptop), i7-9850H
2834 Points -53%
Lenovo ThinkPad P53s-20N6001NGE
NVIDIA Quadro P520, i7-8565U
1043 Points -83%
3DMark 11
1280x720 Performance GPU
Asus ROG G703GXR
NVIDIA GeForce RTX 2080 Mobile, i7-9750H
35754 Points +74%
Razer Blade 15 Studio Edition
NVIDIA Quadro RTX 5000 Max-Q, i7-9750H
26465 Points +29%
MSI RTX 2060 Gaming Z 6G
NVIDIA GeForce RTX 2060 (Desktop), R7 2700X
26413 Points +29%
Asus Strix Scar III G531GW-AZ062T
NVIDIA GeForce RTX 2070 Mobile, i7-9750H
25500 Points +24%
MSI WE75 9TK
NVIDIA Quadro RTX 3000 (Laptop), i7-9750H
20542 Points
HP ZBook 17 G4-Y3J82AV
NVIDIA Quadro P5000, E3-1535M v6
20096 (19942min - 20278max) Points -2%
Maingear Vector 15
NVIDIA GeForce GTX 1660 Ti Mobile, i7-9750H
19670 Points -4%
SCHENKER XMG Neo 17 XNE17M19
NVIDIA GeForce RTX 2060 Mobile, i7-9750H
19513 Points -5%
Durchschnittliche NVIDIA Quadro RTX 3000 (Laptop)
  (17569 - 20542, n=4)
19467 Points -5%
Dell G3 3590
NVIDIA GeForce GTX 1650 Mobile, i5-9300H
13228 Points -36%
Dell Precision 5540
NVIDIA Quadro T2000 Max-Q, i9-9980HK
11468 Points -44%
Lenovo ThinkPad P1 2019-20QT000RGE
NVIDIA Quadro T1000 (Laptop), i7-9850H
10407 Points -49%
Lenovo ThinkPad P53s-20N6001NGE
NVIDIA Quadro P520, i7-8565U
4273 Points -79%
1280x720 Performance Combined
MSI RTX 2060 Gaming Z 6G
NVIDIA GeForce RTX 2060 (Desktop), R7 2700X
13742 Points +7%
MSI WE75 9TK
NVIDIA Quadro RTX 3000 (Laptop), i7-9750H
12899 Points
Durchschnittliche NVIDIA Quadro RTX 3000 (Laptop)
  (12329 - 12899, n=2)
12614 Points -2%
Asus ROG G703GXR
NVIDIA GeForce RTX 2080 Mobile, i7-9750H
12286 Points -5%
Maingear Vector 15
NVIDIA GeForce GTX 1660 Ti Mobile, i7-9750H
12192 Points -5%
SCHENKER XMG Neo 17 XNE17M19
NVIDIA GeForce RTX 2060 Mobile, i7-9750H
11610 Points -10%
Razer Blade 15 Studio Edition
NVIDIA Quadro RTX 5000 Max-Q, i7-9750H
11410 Points -12%
Asus Strix Scar III G531GW-AZ062T
NVIDIA GeForce RTX 2070 Mobile, i7-9750H
10851 Points -16%
HP ZBook 17 G4-Y3J82AV
NVIDIA Quadro P5000, E3-1535M v6
10699 (10684min - 10701max) Points -17%
Dell Precision 5540
NVIDIA Quadro T2000 Max-Q, i9-9980HK
10098 Points -22%
Lenovo ThinkPad P1 2019-20QT000RGE
NVIDIA Quadro T1000 (Laptop), i7-9850H
9227 Points -28%
Dell G3 3590
NVIDIA GeForce GTX 1650 Mobile, i5-9300H
8880 Points -31%
Lenovo ThinkPad P53s-20N6001NGE
NVIDIA Quadro P520, i7-8565U
3951 Points -69%
SPECviewperf 13
3ds Max (3dsmax-06)
KFA2 GeForce RTX 2080 Ti EX
GeForce RTX 2080 Ti (Desktop), R9 3900X, Corsair MP600
269.4 fps +66%
MSI RTX 2070 Gaming Z 8G
GeForce RTX 2070 (Desktop), R7 2700X
207.3 fps +28%
MSI RTX 2060 Gaming Z 6G
GeForce RTX 2060 (Desktop), R7 2700X
184.4 fps +13%
Razer Blade 15 Studio Edition
Quadro RTX 5000 Max-Q, i7-9750H, Samsung SSD PM981 MZVLB1T0HALR
174.2 fps +7%
MSI WS75 9TL-636
Quadro RTX 4000 (Laptop), i7-9750H, Samsung SSD PM981 MZVLB1T0HALR
173 fps +6%
MSI WE75 9TK
Quadro RTX 3000 (Laptop), i7-9750H, Samsung SSD PM981 MZVLB512HAJQ
162.5 fps
Durchschnittliche NVIDIA Quadro RTX 3000 (Laptop)
  (149.4 - 162.5, n=4)
156.7 fps -4%
Schenker XMG Ultra 15
GeForce RTX 2060 Mobile, i7-9700K
150.1 fps -8%
MSI WT75 8SM
Quadro P5200, E-2176G, Samsung SSD PM981 MZVLB512HAJQ
149.6 fps -8%
Dell Precision 7730
Quadro P3200, i7-8850H, Samsung SSD PM981 MZVLB512HAJQ
108 fps -34%
Dell Precision 5540
Quadro T2000 Max-Q, i9-9980HK, SK hynix PC400 512 GB
93.3 fps -43%
Lenovo ThinkPad P1 2019-20QT000RGE
Quadro T1000 (Laptop), i7-9850H, WDC PC SN720 SDAQNTW-512G
83.9 fps -48%
MSI WP65
Quadro P620, i7-9750H, Samsung SSD PM981 MZVLB512HAJQ
56.7 fps -65%
Lenovo ThinkPad P53s-20N6001NGE
Quadro P520, i7-8565U, Intel SSD 760p SSDPEKKW256G8
25.17 fps -85%
Catia (catia-05)
MSI WT75 8SM
Quadro P5200, E-2176G, Samsung SSD PM981 MZVLB512HAJQ
291.7 fps +42%
MSI WS75 9TL-636
Quadro RTX 4000 (Laptop), i7-9750H, Samsung SSD PM981 MZVLB1T0HALR
212.6 fps +4%
Razer Blade 15 Studio Edition
Quadro RTX 5000 Max-Q, i7-9750H, Samsung SSD PM981 MZVLB1T0HALR
207.8 fps +1%
MSI WE75 9TK
Quadro RTX 3000 (Laptop), i7-9750H, Samsung SSD PM981 MZVLB512HAJQ
205.2 fps
Durchschnittliche NVIDIA Quadro RTX 3000 (Laptop)
  (185.8 - 205, n=4)
199 fps -3%
Dell Precision 7730
Quadro P3200, i7-8850H, Samsung SSD PM981 MZVLB512HAJQ
180.8 fps -12%
KFA2 GeForce RTX 2080 Ti EX
GeForce RTX 2080 Ti (Desktop), R9 3900X, Corsair MP600
178.8 fps -13%
Dell Precision 5540
Quadro T2000 Max-Q, i9-9980HK, SK hynix PC400 512 GB
134.6 fps -34%
Lenovo ThinkPad P1 2019-20QT000RGE
Quadro T1000 (Laptop), i7-9850H, WDC PC SN720 SDAQNTW-512G
121.3 fps -41%
MSI RTX 2070 Gaming Z 8G
GeForce RTX 2070 (Desktop), R7 2700X
118.6 fps -42%
MSI RTX 2060 Gaming Z 6G
GeForce RTX 2060 (Desktop), R7 2700X
108.2 fps -47%
Schenker XMG Ultra 15
GeForce RTX 2060 Mobile, i7-9700K
97.8 fps -52%
MSI WP65
Quadro P620, i7-9750H, Samsung SSD PM981 MZVLB512HAJQ
78.4 fps -62%
Lenovo ThinkPad P53s-20N6001NGE
Quadro P520, i7-8565U, Intel SSD 760p SSDPEKKW256G8
47.78 fps -77%
Creo (creo-02)
KFA2 GeForce RTX 2080 Ti EX
GeForce RTX 2080 Ti (Desktop), R9 3900X, Corsair MP600
286.5 fps +46%
MSI WT75 8SM
Quadro P5200, E-2176G, Samsung SSD PM981 MZVLB512HAJQ
241.6 fps +23%
Razer Blade 15 Studio Edition
Quadro RTX 5000 Max-Q, i7-9750H, Samsung SSD PM981 MZVLB1T0HALR
211.4 fps +8%
MSI WS75 9TL-636
Quadro RTX 4000 (Laptop), i7-9750H, Samsung SSD PM981 MZVLB1T0HALR
208 fps +6%
MSI WE75 9TK
Quadro RTX 3000 (Laptop), i7-9750H, Samsung SSD PM981 MZVLB512HAJQ
196.2 fps
MSI RTX 2070 Gaming Z 8G
GeForce RTX 2070 (Desktop), R7 2700X
184.2 fps -6%
Durchschnittliche NVIDIA Quadro RTX 3000 (Laptop)
  (160.6 - 196.2, n=4)
182.5 fps -7%
MSI RTX 2060 Gaming Z 6G
GeForce RTX 2060 (Desktop), R7 2700X
169.8 fps -13%
Dell Precision 7730
Quadro P3200, i7-8850H, Samsung SSD PM981 MZVLB512HAJQ
154.8 fps -21%
Schenker XMG Ultra 15
GeForce RTX 2060 Mobile, i7-9700K
151 fps -23%
Dell Precision 5540
Quadro T2000 Max-Q, i9-9980HK, SK hynix PC400 512 GB
109.6 fps -44%
Lenovo ThinkPad P1 2019-20QT000RGE
Quadro T1000 (Laptop), i7-9850H, WDC PC SN720 SDAQNTW-512G
99.9 fps -49%
MSI WP65
Quadro P620, i7-9750H, Samsung SSD PM981 MZVLB512HAJQ
68 fps -65%
Lenovo ThinkPad P53s-20N6001NGE
Quadro P520, i7-8565U, Intel SSD 760p SSDPEKKW256G8
36.25 fps -82%
Energy (energy-02)
Razer Blade 15 Studio Edition
Quadro RTX 5000 Max-Q, i7-9750H, Samsung SSD PM981 MZVLB1T0HALR
36.5 fps +19%
MSI WS75 9TL-636
Quadro RTX 4000 (Laptop), i7-9750H, Samsung SSD PM981 MZVLB1T0HALR
36.03 fps +18%
KFA2 GeForce RTX 2080 Ti EX
GeForce RTX 2080 Ti (Desktop), R9 3900X, Corsair MP600
31.52 fps +3%
MSI WE75 9TK
Quadro RTX 3000 (Laptop), i7-9750H, Samsung SSD PM981 MZVLB512HAJQ
30.55 fps
Durchschnittliche NVIDIA Quadro RTX 3000 (Laptop)
  (25.8 - 30.6, n=2)
28.2 fps -8%
Dell Precision 7730
Quadro P3200, i7-8850H, Samsung SSD PM981 MZVLB512HAJQ
25.15 fps -18%
MSI RTX 2070 Gaming Z 8G
GeForce RTX 2070 (Desktop), R7 2700X
22.33 fps -27%
MSI WT75 8SM
Quadro P5200, E-2176G, Samsung SSD PM981 MZVLB512HAJQ
17.14 fps -44%
Schenker XMG Ultra 15
GeForce RTX 2060 Mobile, i7-9700K
15.04 fps -51%
Dell Precision 5540
Quadro T2000 Max-Q, i9-9980HK, SK hynix PC400 512 GB
14.87 fps -51%
Lenovo ThinkPad P1 2019-20QT000RGE
Quadro T1000 (Laptop), i7-9850H, WDC PC SN720 SDAQNTW-512G
12 fps -61%
MSI RTX 2060 Gaming Z 6G
GeForce RTX 2060 (Desktop), R7 2700X
7.62 fps -75%
MSI WP65
Quadro P620, i7-9750H, Samsung SSD PM981 MZVLB512HAJQ
7.29 fps -76%
Lenovo ThinkPad P53s-20N6001NGE
Quadro P520, i7-8565U, Intel SSD 760p SSDPEKKW256G8
0.83 fps -97%
Maya (maya-05)
KFA2 GeForce RTX 2080 Ti EX
GeForce RTX 2080 Ti (Desktop), R9 3900X, Corsair MP600
386.6 fps +99%
MSI RTX 2070 Gaming Z 8G
GeForce RTX 2070 (Desktop), R7 2700X
275.3 fps +41%
MSI WT75 8SM
Quadro P5200, E-2176G, Samsung SSD PM981 MZVLB512HAJQ
251.9 fps +29%
MSI RTX 2060 Gaming Z 6G
GeForce RTX 2060 (Desktop), R7 2700X
247 fps +27%
Schenker XMG Ultra 15
GeForce RTX 2060 Mobile, i7-9700K
217.1 fps +12%
MSI WS75 9TL-636
Quadro RTX 4000 (Laptop), i7-9750H, Samsung SSD PM981 MZVLB1T0HALR
207.9 fps +7%
Razer Blade 15 Studio Edition
Quadro RTX 5000 Max-Q, i7-9750H, Samsung SSD PM981 MZVLB1T0HALR
203.6 fps +5%
MSI WE75 9TK
Quadro RTX 3000 (Laptop), i7-9750H, Samsung SSD PM981 MZVLB512HAJQ
194.7 fps
Durchschnittliche NVIDIA Quadro RTX 3000 (Laptop)
  (155.4 - 194.7, n=4)
182.3 fps -6%
Dell Precision 7730
Quadro P3200, i7-8850H, Samsung SSD PM981 MZVLB512HAJQ
148.2 fps -24%
Dell Precision 5540
Quadro T2000 Max-Q, i9-9980HK, SK hynix PC400 512 GB
105.7 fps -46%
Lenovo ThinkPad P1 2019-20QT000RGE
Quadro T1000 (Laptop), i7-9850H, WDC PC SN720 SDAQNTW-512G
101 fps -48%
MSI WP65
Quadro P620, i7-9750H, Samsung SSD PM981 MZVLB512HAJQ
68.8 fps -65%
Lenovo ThinkPad P53s-20N6001NGE
Quadro P520, i7-8565U, Intel SSD 760p SSDPEKKW256G8
40.74 fps -79%
Medical (medical-02)
KFA2 GeForce RTX 2080 Ti EX
GeForce RTX 2080 Ti (Desktop), R9 3900X, Corsair MP600
82.1 fps +25%
Razer Blade 15 Studio Edition
Quadro RTX 5000 Max-Q, i7-9750H, Samsung SSD PM981 MZVLB1T0HALR
79.3 fps +21%
MSI WS75 9TL-636
Quadro RTX 4000 (Laptop), i7-9750H, Samsung SSD PM981 MZVLB1T0HALR
73.2 fps +12%
MSI WE75 9TK
Quadro RTX 3000 (Laptop), i7-9750H, Samsung SSD PM981 MZVLB512HAJQ
65.6 fps
MSI WT75 8SM
Quadro P5200, E-2176G, Samsung SSD PM981 MZVLB512HAJQ
61.5 fps -6%
Durchschnittliche NVIDIA Quadro RTX 3000 (Laptop)
  (53.9 - 65.6, n=2)
59.8 fps -9%
MSI RTX 2070 Gaming Z 8G
GeForce RTX 2070 (Desktop), R7 2700X
57.7 fps -12%
MSI RTX 2060 Gaming Z 6G
GeForce RTX 2060 (Desktop), R7 2700X
49.1 fps -25%
Schenker XMG Ultra 15
GeForce RTX 2060 Mobile, i7-9700K
42.83 fps -35%
Dell Precision 5540
Quadro T2000 Max-Q, i9-9980HK, SK hynix PC400 512 GB
41.71 fps -36%
Dell Precision 7730
Quadro P3200, i7-8850H, Samsung SSD PM981 MZVLB512HAJQ
37.93 fps -42%
Lenovo ThinkPad P1 2019-20QT000RGE
Quadro T1000 (Laptop), i7-9850H, WDC PC SN720 SDAQNTW-512G
33.45 fps -49%
MSI WP65
Quadro P620, i7-9750H, Samsung SSD PM981 MZVLB512HAJQ
13.05 fps -80%
Lenovo ThinkPad P53s-20N6001NGE
Quadro P520, i7-8565U, Intel SSD 760p SSDPEKKW256G8
9.85 fps -85%
Showcase (showcase-02)
KFA2 GeForce RTX 2080 Ti EX
GeForce RTX 2080 Ti (Desktop), R9 3900X, Corsair MP600
180.4 fps +123%
MSI RTX 2060 Gaming Z 6G
GeForce RTX 2060 (Desktop), R7 2700X
101.6 fps +26%
Razer Blade 15 Studio Edition
Quadro RTX 5000 Max-Q, i7-9750H, Samsung SSD PM981 MZVLB1T0HALR
94.6 fps +17%
MSI WS75 9TL-636
Quadro RTX 4000 (Laptop), i7-9750H, Samsung SSD PM981 MZVLB1T0HALR
94 fps +16%
MSI WE75 9TK
Quadro RTX 3000 (Laptop), i7-9750H, Samsung SSD PM981 MZVLB512HAJQ
80.9 fps
Durchschnittliche NVIDIA Quadro RTX 3000 (Laptop)
  (73.3 - 82.5, n=4)
79.3 fps -2%
Schenker XMG Ultra 15
GeForce RTX 2060 Mobile, i7-9700K
78 fps -4%
MSI WT75 8SM
Quadro P5200, E-2176G, Samsung SSD PM981 MZVLB512HAJQ
75.5 fps -7%
Dell Precision 7730
Quadro P3200, i7-8850H, Samsung SSD PM981 MZVLB512HAJQ
58.6 fps -28%
Dell Precision 5540
Quadro T2000 Max-Q, i9-9980HK, SK hynix PC400 512 GB
37.56 fps -54%
Lenovo ThinkPad P1 2019-20QT000RGE
Quadro T1000 (Laptop), i7-9850H, WDC PC SN720 SDAQNTW-512G
35.27 fps -56%
MSI WP65
Quadro P620, i7-9750H, Samsung SSD PM981 MZVLB512HAJQ
25.23 fps -69%
Lenovo ThinkPad P53s-20N6001NGE
Quadro P520, i7-8565U, Intel SSD 760p SSDPEKKW256G8
14.56 fps -82%
Siemens NX (snx-03)
MSI WT75 8SM
Quadro P5200, E-2176G, Samsung SSD PM981 MZVLB512HAJQ
386.7 fps +72%
Razer Blade 15 Studio Edition
Quadro RTX 5000 Max-Q, i7-9750H, Samsung SSD PM981 MZVLB1T0HALR
280.2 fps +24%
MSI WS75 9TL-636
Quadro RTX 4000 (Laptop), i7-9750H, Samsung SSD PM981 MZVLB1T0HALR
271.1 fps +20%
MSI WE75 9TK
Quadro RTX 3000 (Laptop), i7-9750H, Samsung SSD PM981 MZVLB512HAJQ
225.4 fps
Dell Precision 7730
Quadro P3200, i7-8850H, Samsung SSD PM981 MZVLB512HAJQ
204.4 fps -9%
Durchschnittliche NVIDIA Quadro RTX 3000 (Laptop)
  (160.6 - 225, n=4)
204 fps -9%
Dell Precision 5540
Quadro T2000 Max-Q, i9-9980HK, SK hynix PC400 512 GB
143.8 fps -36%
Lenovo ThinkPad P1 2019-20QT000RGE
Quadro T1000 (Laptop), i7-9850H, WDC PC SN720 SDAQNTW-512G
127.8 fps -43%
MSI WP65
Quadro P620, i7-9750H, Samsung SSD PM981 MZVLB512HAJQ
90.4 fps -60%
Lenovo ThinkPad P53s-20N6001NGE
Quadro P520, i7-8565U, Intel SSD 760p SSDPEKKW256G8
49.42 fps -78%
KFA2 GeForce RTX 2080 Ti EX
GeForce RTX 2080 Ti (Desktop), R9 3900X, Corsair MP600
21.99 fps -90%
MSI RTX 2070 Gaming Z 8G
GeForce RTX 2070 (Desktop), R7 2700X
15.6 fps -93%
Schenker XMG Ultra 15
GeForce RTX 2060 Mobile, i7-9700K
15.1 fps -93%
MSI RTX 2060 Gaming Z 6G
GeForce RTX 2060 (Desktop), R7 2700X
14.99 fps -93%
Solidworks (sw-04)
MSI WT75 8SM
Quadro P5200, E-2176G, Samsung SSD PM981 MZVLB512HAJQ
178.3 fps +46%
MSI WS75 9TL-636
Quadro RTX 4000 (Laptop), i7-9750H, Samsung SSD PM981 MZVLB1T0HALR
125.4 fps +3%
MSI WE75 9TK
Quadro RTX 3000 (Laptop), i7-9750H, Samsung SSD PM981 MZVLB512HAJQ
122.1 fps
Razer Blade 15 Studio Edition
Quadro RTX 5000 Max-Q, i7-9750H, Samsung SSD PM981 MZVLB1T0HALR
120.9 fps -1%
Durchschnittliche NVIDIA Quadro RTX 3000 (Laptop)
  (109.6 - 128, n=4)
120.2 fps -2%
KFA2 GeForce RTX 2080 Ti EX
GeForce RTX 2080 Ti (Desktop), R9 3900X, Corsair MP600
111.8 fps -8%
Dell Precision 7730
Quadro P3200, i7-8850H, Samsung SSD PM981 MZVLB512HAJQ
110.6 fps -9%
Dell Precision 5540
Quadro T2000 Max-Q, i9-9980HK, SK hynix PC400 512 GB
97.2 fps -20%
Lenovo ThinkPad P1 2019-20QT000RGE
Quadro T1000 (Laptop), i7-9850H, WDC PC SN720 SDAQNTW-512G
89.2 fps -27%
MSI RTX 2070 Gaming Z 8G
GeForce RTX 2070 (Desktop), R7 2700X
86.7 fps -29%
MSI RTX 2060 Gaming Z 6G
GeForce RTX 2060 (Desktop), R7 2700X
83.4 fps -32%
MSI WP65
Quadro P620, i7-9750H, Samsung SSD PM981 MZVLB512HAJQ
79.8 fps -35%
Schenker XMG Ultra 15
GeForce RTX 2060 Mobile, i7-9700K
77.4 fps -37%
Lenovo ThinkPad P53s-20N6001NGE
Quadro P520, i7-8565U, Intel SSD 760p SSDPEKKW256G8
56.4 fps -54%
SPECviewperf 12
1900x1060 3ds Max (3dsmax-05)
KFA2 GeForce RTX 2080 Ti EX
GeForce RTX 2080 Ti (Desktop), R9 3900X, Corsair MP600
258.1 fps
MSI RTX 2070 Gaming Z 8G
GeForce RTX 2070 (Desktop), R7 2700X
207.2 fps
MSI RTX 2060 Gaming Z 6G
GeForce RTX 2060 (Desktop), R7 2700X
183.6 fps
Razer Blade 15 Studio Edition
Quadro RTX 5000 Max-Q, i7-9750H, Samsung SSD PM981 MZVLB1T0HALR
177.6 fps
Durchschnittliche NVIDIA Quadro RTX 3000 (Laptop)
  (151 - 163, n=3)
157.3 fps
Dell Precision 7730
Quadro P3200, i7-8850H, Samsung SSD PM981 MZVLB512HAJQ
110.3 fps
Dell Precision 5540
Quadro T2000 Max-Q, i9-9980HK, SK hynix PC400 512 GB
93.7 fps
Lenovo ThinkPad P1 2019-20QT000RGE
Quadro T1000 (Laptop), i7-9850H, WDC PC SN720 SDAQNTW-512G
85.5 fps
Lenovo ThinkPad P53s-20N6001NGE
Quadro P520, i7-8565U, Intel SSD 760p SSDPEKKW256G8
26.05 fps
1900x1060 Catia (catia-04)
MSI WT75 8SM
Quadro P5200, E-2176G, Samsung SSD PM981 MZVLB512HAJQ
188.6 fps +45%
MSI WS75 9TL-636
Quadro RTX 4000 (Laptop), i7-9750H, Samsung SSD PM981 MZVLB1T0HALR
161.9 fps +25%
MSI WE75 9TK
Quadro RTX 3000 (Laptop), i7-9750H, Samsung SSD PM981 MZVLB512HAJQ
130 fps
Razer Blade 15 Studio Edition
Quadro RTX 5000 Max-Q, i7-9750H, Samsung SSD PM981 MZVLB1T0HALR
123 fps -5%
KFA2 GeForce RTX 2080 Ti EX
GeForce RTX 2080 Ti (Desktop), R9 3900X, Corsair MP600
118.5 fps -9%
Durchschnittliche NVIDIA Quadro RTX 3000 (Laptop)
  (108.8 - 130, n=4)
117.5 fps -10%
Dell Precision 7730
Quadro P3200, i7-8850H, Samsung SSD PM981 MZVLB512HAJQ
105.1 fps -19%
Dell Precision 5540
Quadro T2000 Max-Q, i9-9980HK, SK hynix PC400 512 GB
88.9 fps -32%
Lenovo ThinkPad P1 2019-20QT000RGE
Quadro T1000 (Laptop), i7-9850H, WDC PC SN720 SDAQNTW-512G
82.4 fps -37%
Eurocom Sky X4C
GeForce GTX 1080 Mobile, i7-8700K, Samsung SSD 960 Pro 1TB m.2 NVMe
82.3 fps -37%
MSI RTX 2070 Gaming Z 8G
GeForce RTX 2070 (Desktop), R7 2700X
81.9 fps -37%
MSI RTX 2060 Gaming Z 6G
GeForce RTX 2060 (Desktop), R7 2700X
74.8 fps -42%
MSI WP65
Quadro P620, i7-9750H, Samsung SSD PM981 MZVLB512HAJQ
55.1 fps -58%
Lenovo ThinkPad P53s-20N6001NGE
Quadro P520, i7-8565U, Intel SSD 760p SSDPEKKW256G8
34.14 fps -74%
1900x1060 Creo (creo-01)
MSI WT75 8SM
Quadro P5200, E-2176G, Samsung SSD PM981 MZVLB512HAJQ
152 fps +27%
MSI WS75 9TL-636
Quadro RTX 4000 (Laptop), i7-9750H, Samsung SSD PM981 MZVLB1T0HALR
140.7 fps +17%
MSI WE75 9TK
Quadro RTX 3000 (Laptop), i7-9750H, Samsung SSD PM981 MZVLB512HAJQ
120.1 fps
Razer Blade 15 Studio Edition
Quadro RTX 5000 Max-Q, i7-9750H, Samsung SSD PM981 MZVLB1T0HALR
118.5 fps -1%
Durchschnittliche NVIDIA Quadro RTX 3000 (Laptop)
  (113.6 - 121, n=4)
118.2 fps -2%
Dell Precision 7730
Quadro P3200, i7-8850H, Samsung SSD PM981 MZVLB512HAJQ
105.7 fps -12%
Dell Precision 5540
Quadro T2000 Max-Q, i9-9980HK, SK hynix PC400 512 GB
88.3 fps -26%
Lenovo ThinkPad P1 2019-20QT000RGE
Quadro T1000 (Laptop), i7-9850H, WDC PC SN720 SDAQNTW-512G
75 fps -38%
KFA2 GeForce RTX 2080 Ti EX
GeForce RTX 2080 Ti (Desktop), R9 3900X, Corsair MP600
63.1 fps -47%
Eurocom Sky X4C
GeForce GTX 1080 Mobile, i7-8700K, Samsung SSD 960 Pro 1TB m.2 NVMe
60.6 fps -50%
MSI WP65
Quadro P620, i7-9750H, Samsung SSD PM981 MZVLB512HAJQ
60.3 fps -50%
MSI RTX 2070 Gaming Z 8G
GeForce RTX 2070 (Desktop), R7 2700X
45.67 fps -62%
MSI RTX 2060 Gaming Z 6G
GeForce RTX 2060 (Desktop), R7 2700X
44.45 fps -63%
Lenovo ThinkPad P53s-20N6001NGE
Quadro P520, i7-8565U, Intel SSD 760p SSDPEKKW256G8
36.59 fps -70%
1900x1060 Energy (energy-01)
MSI WT75 8SM
Quadro P5200, E-2176G, Samsung SSD PM981 MZVLB512HAJQ
16.88 fps +39%
KFA2 GeForce RTX 2080 Ti EX
GeForce RTX 2080 Ti (Desktop), R9 3900X, Corsair MP600
15.86 fps +31%
Razer Blade 15 Studio Edition
Quadro RTX 5000 Max-Q, i7-9750H, Samsung SSD PM981 MZVLB1T0HALR
14.23 fps +17%
MSI WS75 9TL-636
Quadro RTX 4000 (Laptop), i7-9750H, Samsung SSD PM981 MZVLB1T0HALR
13.9 fps +15%
MSI WE75 9TK
Quadro RTX 3000 (Laptop), i7-9750H, Samsung SSD PM981 MZVLB512HAJQ
12.13 fps
Durchschnittliche NVIDIA Quadro RTX 3000 (Laptop)
  (11.5 - 12.1, n=2)
11.8 fps -3%
MSI RTX 2070 Gaming Z 8G
GeForce RTX 2070 (Desktop), R7 2700X
11.27 fps -7%
Dell Precision 7730
Quadro P3200, i7-8850H, Samsung SSD PM981 MZVLB512HAJQ
10.25 fps -15%
MSI RTX 2060 Gaming Z 6G
GeForce RTX 2060 (Desktop), R7 2700X
9.19 fps -24%
Eurocom Sky X4C
GeForce GTX 1080 Mobile, i7-8700K, Samsung SSD 960 Pro 1TB m.2 NVMe
8.98 fps -26%
Dell Precision 5540
Quadro T2000 Max-Q, i9-9980HK, SK hynix PC400 512 GB
7.79 fps -36%
Lenovo ThinkPad P1 2019-20QT000RGE
Quadro T1000 (Laptop), i7-9850H, WDC PC SN720 SDAQNTW-512G
5.79 fps -52%
MSI WP65
Quadro P620, i7-9750H, Samsung SSD PM981 MZVLB512HAJQ
3.93 fps -68%
Lenovo ThinkPad P53s-20N6001NGE
Quadro P520, i7-8565U, Intel SSD 760p SSDPEKKW256G8
0.75 fps -94%
1900x1060 Maya (maya-04)
KFA2 GeForce RTX 2080 Ti EX
GeForce RTX 2080 Ti (Desktop), R9 3900X, Corsair MP600
177.8 fps +91%
Eurocom Sky X4C
GeForce GTX 1080 Mobile, i7-8700K, Samsung SSD 960 Pro 1TB m.2 NVMe
168.3 fps +81%
MSI RTX 2070 Gaming Z 8G
GeForce RTX 2070 (Desktop), R7 2700X
146.2 fps +57%
MSI WS75 9TL-636
Quadro RTX 4000 (Laptop), i7-9750H, Samsung SSD PM981 MZVLB1T0HALR
144.1 fps +55%
MSI WT75 8SM
Quadro P5200, E-2176G, Samsung SSD PM981 MZVLB512HAJQ
143.4 fps +54%
MSI RTX 2060 Gaming Z 6G
GeForce RTX 2060 (Desktop), R7 2700X
127.4 fps +37%
MSI WE75 9TK
Quadro RTX 3000 (Laptop), i7-9750H, Samsung SSD PM981 MZVLB512HAJQ
92.9 fps
Razer Blade 15 Studio Edition
Quadro RTX 5000 Max-Q, i7-9750H, Samsung SSD PM981 MZVLB1T0HALR
86.8 fps -7%
Durchschnittliche NVIDIA Quadro RTX 3000 (Laptop)
  (72.4 - 92.9, n=4)
78.2 fps -16%
Dell Precision 7730
Quadro P3200, i7-8850H, Samsung SSD PM981 MZVLB512HAJQ
64.9 fps -30%
Dell Precision 5540
Quadro T2000 Max-Q, i9-9980HK, SK hynix PC400 512 GB
51 fps -45%
Lenovo ThinkPad P1 2019-20QT000RGE
Quadro T1000 (Laptop), i7-9850H, WDC PC SN720 SDAQNTW-512G
47.5 fps -49%
MSI WP65
Quadro P620, i7-9750H, Samsung SSD PM981 MZVLB512HAJQ
40.93 fps -56%
Lenovo ThinkPad P53s-20N6001NGE
Quadro P520, i7-8565U, Intel SSD 760p SSDPEKKW256G8
25.04 fps -73%
1900x1060 Medical (medical-01)
MSI WT75 8SM
Quadro P5200, E-2176G, Samsung SSD PM981 MZVLB512HAJQ
79.1 fps +61%
MSI WS75 9TL-636
Quadro RTX 4000 (Laptop), i7-9750H, Samsung SSD PM981 MZVLB1T0HALR
62.4 fps +27%
Razer Blade 15 Studio Edition
Quadro RTX 5000 Max-Q, i7-9750H, Samsung SSD PM981 MZVLB1T0HALR
62.1 fps +27%
Eurocom Sky X4C
GeForce GTX 1080 Mobile, i7-8700K, Samsung SSD 960 Pro 1TB m.2 NVMe
50.8 fps +4%
MSI WE75 9TK
Quadro RTX 3000 (Laptop), i7-9750H, Samsung SSD PM981 MZVLB512HAJQ
49 fps
KFA2 GeForce RTX 2080 Ti EX
GeForce RTX 2080 Ti (Desktop), R9 3900X, Corsair MP600
48.61 fps -1%
Durchschnittliche NVIDIA Quadro RTX 3000 (Laptop)
  (43 - 49, n=2)
46 fps -6%
Dell Precision 7730
Quadro P3200, i7-8850H, Samsung SSD PM981 MZVLB512HAJQ
43.68 fps -11%
MSI RTX 2070 Gaming Z 8G
GeForce RTX 2070 (Desktop), R7 2700X
39.61 fps -19%
Dell Precision 5540
Quadro T2000 Max-Q, i9-9980HK, SK hynix PC400 512 GB
35.53 fps -27%
MSI RTX 2060 Gaming Z 6G
GeForce RTX 2060 (Desktop), R7 2700X
35.22 fps -28%
Lenovo ThinkPad P1 2019-20QT000RGE
Quadro T1000 (Laptop), i7-9850H, WDC PC SN720 SDAQNTW-512G
24.99 fps -49%
MSI WP65
Quadro P620, i7-9750H, Samsung SSD PM981 MZVLB512HAJQ
14.65 fps -70%
Lenovo ThinkPad P53s-20N6001NGE
Quadro P520, i7-8565U, Intel SSD 760p SSDPEKKW256G8
13.48 fps -72%
1900x1060 Showcase (showcase-01)
KFA2 GeForce RTX 2080 Ti EX
GeForce RTX 2080 Ti (Desktop), R9 3900X, Corsair MP600
175.6 fps +114%
Eurocom Sky X4C
GeForce GTX 1080 Mobile, i7-8700K, Samsung SSD 960 Pro 1TB m.2 NVMe
103.5 fps +26%
MSI RTX 2060 Gaming Z 6G
GeForce RTX 2060 (Desktop), R7 2700X
101 fps +23%
MSI WS75 9TL-636
Quadro RTX 4000 (Laptop), i7-9750H, Samsung SSD PM981 MZVLB1T0HALR
98 fps +19%
Razer Blade 15 Studio Edition
Quadro RTX 5000 Max-Q, i7-9750H, Samsung SSD PM981 MZVLB1T0HALR
94.9 fps +16%
MSI WE75 9TK
Quadro RTX 3000 (Laptop), i7-9750H, Samsung SSD PM981 MZVLB512HAJQ
82.1 fps
Durchschnittliche NVIDIA Quadro RTX 3000 (Laptop)
  (76.9 - 83.2, n=4)
81 fps -1%
MSI WT75 8SM
Quadro P5200, E-2176G, Samsung SSD PM981 MZVLB512HAJQ
75.6 fps -8%
Dell Precision 7730
Quadro P3200, i7-8850H, Samsung SSD PM981 MZVLB512HAJQ
58.7 fps -29%
Dell Precision 5540
Quadro T2000 Max-Q, i9-9980HK, SK hynix PC400 512 GB
37.81 fps -54%
MSI WP65
Quadro P620, i7-9750H, Samsung SSD PM981 MZVLB512HAJQ
25.23 fps -69%
Lenovo ThinkPad P53s-20N6001NGE
Quadro P520, i7-8565U, Intel SSD 760p SSDPEKKW256G8
14.63 fps -82%
1900x1060 Siemens NX (snx-02)
MSI WT75 8SM
Quadro P5200, E-2176G, Samsung SSD PM981 MZVLB512HAJQ
213.7 fps +72%
MSI WS75 9TL-636
Quadro RTX 4000 (Laptop), i7-9750H, Samsung SSD PM981 MZVLB1T0HALR
186 fps +50%
Razer Blade 15 Studio Edition
Quadro RTX 5000 Max-Q, i7-9750H, Samsung SSD PM981 MZVLB1T0HALR
149.2 fps +20%
MSI WE75 9TK
Quadro RTX 3000 (Laptop), i7-9750H, Samsung SSD PM981 MZVLB512HAJQ
124.3 fps
Durchschnittliche NVIDIA Quadro RTX 3000 (Laptop)
  (99.6 - 124.3, n=4)
112.7 fps -9%
Dell Precision 7730
Quadro P3200, i7-8850H, Samsung SSD PM981 MZVLB512HAJQ
108.4 fps -13%
Dell Precision 5540
Quadro T2000 Max-Q, i9-9980HK, SK hynix PC400 512 GB
74.6 fps -40%
MSI WP65
Quadro P620, i7-9750H, Samsung SSD PM981 MZVLB512HAJQ
50.3 fps -60%
Lenovo ThinkPad P53s-20N6001NGE
Quadro P520, i7-8565U, Intel SSD 760p SSDPEKKW256G8
26.98 fps -78%
KFA2 GeForce RTX 2080 Ti EX
GeForce RTX 2080 Ti (Desktop), R9 3900X, Corsair MP600
12.16 fps -90%
Eurocom Sky X4C
GeForce GTX 1080 Mobile, i7-8700K, Samsung SSD 960 Pro 1TB m.2 NVMe
8.84 fps -93%
MSI RTX 2070 Gaming Z 8G
GeForce RTX 2070 (Desktop), R7 2700X
8.63 fps -93%
MSI RTX 2060 Gaming Z 6G
GeForce RTX 2060 (Desktop), R7 2700X
8.35 fps -93%
1900x1060 Solidworks (sw-03)
MSI WT75 8SM
Quadro P5200, E-2176G, Samsung SSD PM981 MZVLB512HAJQ
199.8 fps +66%
MSI WS75 9TL-636
Quadro RTX 4000 (Laptop), i7-9750H, Samsung SSD PM981 MZVLB1T0HALR
149.1 fps +24%
MSI WE75 9TK
Quadro RTX 3000 (Laptop), i7-9750H, Samsung SSD PM981 MZVLB512HAJQ
120.2 fps
Durchschnittliche NVIDIA Quadro RTX 3000 (Laptop)
  (107 - 120.2, n=4)
112.1 fps -7%
Razer Blade 15 Studio Edition
Quadro RTX 5000 Max-Q, i7-9750H, Samsung SSD PM981 MZVLB1T0HALR
106.8 fps -11%
Dell Precision 7730
Quadro P3200, i7-8850H, Samsung SSD PM981 MZVLB512HAJQ
102 fps -15%
Dell Precision 5540
Quadro T2000 Max-Q, i9-9980HK, SK hynix PC400 512 GB
100.8 fps -16%
MSI WP65
Quadro P620, i7-9750H, Samsung SSD PM981 MZVLB512HAJQ
78.7 fps -35%
KFA2 GeForce RTX 2080 Ti EX
GeForce RTX 2080 Ti (Desktop), R9 3900X, Corsair MP600
78.4 fps -35%
Eurocom Sky X4C
GeForce GTX 1080 Mobile, i7-8700K, Samsung SSD 960 Pro 1TB m.2 NVMe
68.1 fps -43%
MSI RTX 2070 Gaming Z 8G
GeForce RTX 2070 (Desktop), R7 2700X
60.6 fps -50%
MSI RTX 2060 Gaming Z 6G
GeForce RTX 2060 (Desktop), R7 2700X
57.6 fps -52%
Lenovo ThinkPad P53s-20N6001NGE
Quadro P520, i7-8565U, Intel SSD 760p SSDPEKKW256G8
54.2 fps -55%
3DMark 11 Performance
18138 Punkte
3DMark Cloud Gate Standard Score
36407 Punkte
3DMark Fire Strike Score
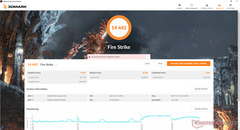
14442 Punkte
3DMark Time Spy Score
6080 Punkte
Hilfe
Shadow of the Tomb Raider
1920x1080 Highest Preset AA:T
KFA2 GeForce RTX 2080 Ti EX
AMD Ryzen 9 3900X, NVIDIA GeForce RTX 2080 Ti (Desktop)
130 fps +65%
MSI GE75 9SG
Intel Core i9-9880H, NVIDIA GeForce RTX 2080 Mobile
109 fps +38%
MSI RTX 2070 Gaming Z 8G
AMD Ryzen 7 2700X, NVIDIA GeForce RTX 2070 (Desktop)
104 fps +32%
MSI GE75 8SG Raider
Intel Core i7-8750H, NVIDIA GeForce RTX 2080 Mobile
99 fps +25%
AMD Radeon RX Vega 64
AMD Ryzen 9 3900X, AMD Radeon RX Vega 64
91 fps +15%
MSI RTX 2060 Gaming Z 6G
AMD Ryzen 7 2700X, NVIDIA GeForce RTX 2060 (Desktop)
90 fps +14%
Lenovo ThinkPad P53-20QN000YGE
Intel Core i7-9850H, NVIDIA Quadro RTX 5000 Max-Q
87 fps +10%
MSI WS75 9TL-636
Intel Core i7-9750H, NVIDIA Quadro RTX 4000 (Laptop)
85 fps +8%
Asus Strix Scar III G531GW-AZ062T
Intel Core i7-9750H, NVIDIA GeForce RTX 2070 Mobile
80 fps +1%
MSI WE75 9TK
Intel Core i7-9750H, NVIDIA Quadro RTX 3000 (Laptop)
79 fps
Eurocom Tornado F7W
Intel Core i9-9900K, NVIDIA Quadro P5200
72 fps -9%
Dell G5 15 5590-PCNJJ
Intel Core i5-9300H, NVIDIA GeForce GTX 1650 Mobile
43 (35min) fps -46%
Lenovo ThinkPad P1 2019-20QT000RGE
Intel Core i7-9850H, NVIDIA Quadro T1000 (Laptop)
35 fps -56%
Lenovo ThinkPad P1-20MD002LUS
Intel Xeon E-2176M, NVIDIA Quadro P2000 Max-Q
23 fps -71%
MSI WP65
Intel Core i7-9750H, NVIDIA Quadro P620
12 fps -85%
1920x1080 High Preset AA:SM
KFA2 GeForce RTX 2080 Ti EX
AMD Ryzen 9 3900X, NVIDIA GeForce RTX 2080 Ti (Desktop)
136 fps +55%
MSI GE75 9SG
Intel Core i9-9880H, NVIDIA GeForce RTX 2080 Mobile
115 fps +31%
MSI RTX 2070 Gaming Z 8G
AMD Ryzen 7 2700X, NVIDIA GeForce RTX 2070 (Desktop)
110 fps +25%
MSI GE75 8SG Raider
Intel Core i7-8750H, NVIDIA GeForce RTX 2080 Mobile
106 fps +20%
AMD Radeon RX Vega 64
AMD Ryzen 9 3900X, AMD Radeon RX Vega 64
103 fps +17%
MSI RTX 2060 Gaming Z 6G
AMD Ryzen 7 2700X, NVIDIA GeForce RTX 2060 (Desktop)
101 fps +15%
Lenovo ThinkPad P53-20QN000YGE
Intel Core i7-9850H, NVIDIA Quadro RTX 5000 Max-Q
98 fps +11%
Asus Strix Scar III G531GW-AZ062T
Intel Core i7-9750H, NVIDIA GeForce RTX 2070 Mobile
90 fps +2%
MSI WE75 9TK
Intel Core i7-9750H, NVIDIA Quadro RTX 3000 (Laptop)
88 fps
Eurocom Tornado F7W
Intel Core i9-9900K, NVIDIA Quadro P5200
84 fps -5%
MSI WS75 9TL-636
Intel Core i7-9750H, NVIDIA Quadro RTX 4000 (Laptop)
81.6 fps -7%
Dell G3 3590
Intel Core i5-9300H, NVIDIA GeForce GTX 1650 Mobile
51 fps -42%
Dell G5 15 5590-PCNJJ
Intel Core i5-9300H, NVIDIA GeForce GTX 1650 Mobile
48 (40min) fps -45%
Lenovo ThinkPad P1 2019-20QT000RGE
Intel Core i7-9850H, NVIDIA Quadro T1000 (Laptop)
40 fps -55%
Lenovo ThinkPad P1-20MD002LUS
Intel Xeon E-2176M, NVIDIA Quadro P2000 Max-Q
30 fps -66%
MSI WP65
Intel Core i7-9750H, NVIDIA Quadro P620
14 fps -84%
The Witcher 3
1024x768 Low Graphics & Postprocessing
KFA2 GeForce RTX 2080 Ti EX
AMD Ryzen 9 3900X, NVIDIA GeForce RTX 2080 Ti (Desktop)
403 (355min - 475max) fps +33%
MSI WT75 8SM
Intel Xeon E-2176G, NVIDIA Quadro P5200
327.2 fps +8%
AMD Radeon RX Vega 64
AMD Ryzen 9 3900X, AMD Radeon RX Vega 64
321 (297min - 343max) fps +6%
Lenovo ThinkPad P53-20QN000YGE
Intel Core i7-9850H, NVIDIA Quadro RTX 5000 Max-Q
320 fps +6%
Eurocom Tornado F7W
Intel Core i9-9900K, NVIDIA Quadro P5200
303.5 fps 0%
MSI WE75 9TK
Intel Core i7-9750H, NVIDIA Quadro RTX 3000 (Laptop)
303.2 fps
MSI WS75 9TL-636
Intel Core i7-9750H, NVIDIA Quadro RTX 4000 (Laptop)
303 fps 0%
MSI RTX 2070 Gaming Z 8G
AMD Ryzen 7 2700X, NVIDIA GeForce RTX 2070 (Desktop)
297.2 (263min - 335max) fps -2%
SCHENKER Key 16
Intel Core i7-8750H, NVIDIA GeForce RTX 2080 Max-Q
294.7 fps -3%
MSI GE75 9SG
Intel Core i9-9880H, NVIDIA GeForce RTX 2080 Mobile
289.7 fps -4%
Razer Blade Pro 17 RTX 2080 Max-Q
Intel Core i7-9750H, NVIDIA GeForce RTX 2080 Max-Q
287.9 fps -5%
Razer Blade 15 Studio Edition
Intel Core i7-9750H, NVIDIA Quadro RTX 5000 Max-Q
286.9 fps -5%
MSI RTX 2060 Gaming Z 6G
AMD Ryzen 7 2700X, NVIDIA GeForce RTX 2060 (Desktop)
286.7 (265min - 336max) fps -5%
MSI GE75 8SG Raider
Intel Core i7-8750H, NVIDIA GeForce RTX 2080 Mobile
276 fps -9%
Lenovo ThinkPad P73-20QR002DGE
Intel Core i7-9850H, NVIDIA Quadro RTX 3000 (Laptop)
274.9 fps -9%
Medion Erazer X15805
Intel Core i9-8950HK, NVIDIA GeForce RTX 2070 Max-Q
263.3 fps -13%
Asus Strix Scar III G531GW-AZ062T
Intel Core i7-9750H, NVIDIA GeForce RTX 2070 Mobile
258 (230min - 292max) fps -15%
Maingear Vector 15
Intel Core i7-9750H, NVIDIA GeForce GTX 1660 Ti Mobile
253 fps -17%
Dell Precision 7730
Intel Core i7-8850H, NVIDIA Quadro P3200
218.6 fps -28%
Dell G7 17 7790
Intel Core i7-8750H, NVIDIA GeForce RTX 2070 Max-Q
203 fps -33%
HP ZBook 17 G5-2ZC48EA
Intel Core i7-8850H, NVIDIA Quadro P3200
187.6 fps -38%
Dell G5 15 5590-PCNJJ
Intel Core i5-9300H, NVIDIA GeForce GTX 1650 Mobile
176 (138min) fps -42%
Dell G3 3590
Intel Core i5-9300H, NVIDIA GeForce GTX 1650 Mobile
175.1 fps -42%
Lenovo ThinkPad P1 2019-20QT000RGE
Intel Core i7-9850H, NVIDIA Quadro T1000 (Laptop)
156.2 fps -48%
MSI WE72 7RJ
Intel Core i7-7700HQ, NVIDIA Quadro M2200
116.6 fps -62%
Lenovo ThinkPad P1-20MD002LUS
Intel Xeon E-2176M, NVIDIA Quadro P2000 Max-Q
106 fps -65%
MSI WP65
Intel Core i7-9750H, NVIDIA Quadro P620
101 fps -67%
Lenovo ThinkPad P53s-20N6001NGE
Intel Core i7-8565U, NVIDIA Quadro P520
59.4 fps -80%
Dell XPS 13 7390 2-in-1 Core i7
Intel Core i7-1065G7, Intel Iris Plus Graphics G7 (Ice Lake 64 EU)
54.9 fps -82%
Apple MacBook 12 (Early 2016) 1.1 GHz
Intel Core m3-6Y30, Intel HD Graphics 515
7.4 fps -98%
1366x768 Medium Graphics & Postprocessing
KFA2 GeForce RTX 2080 Ti EX
AMD Ryzen 9 3900X, NVIDIA GeForce RTX 2080 Ti (Desktop)
341 (321min - 400max) fps +68%
MSI GE75 9SG
Intel Core i9-9880H, NVIDIA GeForce RTX 2080 Mobile
250.1 fps +23%
MSI RTX 2070 Gaming Z 8G
AMD Ryzen 7 2700X, NVIDIA GeForce RTX 2070 (Desktop)
237.9 (203min - 277max) fps +17%
Razer Blade Pro 17 RTX 2080 Max-Q
Intel Core i7-9750H, NVIDIA GeForce RTX 2080 Max-Q
237.3 fps +17%
SCHENKER Key 16
Intel Core i7-8750H, NVIDIA GeForce RTX 2080 Max-Q
236.6 fps +17%
Lenovo ThinkPad P53-20QN000YGE
Intel Core i7-9850H, NVIDIA Quadro RTX 5000 Max-Q
235 fps +16%
MSI GE75 8SG Raider
Intel Core i7-8750H, NVIDIA GeForce RTX 2080 Mobile
230 fps +13%
Razer Blade 15 Studio Edition
Intel Core i7-9750H, NVIDIA Quadro RTX 5000 Max-Q
229.5 fps +13%
MSI WT75 8SM
Intel Xeon E-2176G, NVIDIA Quadro P5200
228.7 fps +13%
MSI WS75 9TL-636
Intel Core i7-9750H, NVIDIA Quadro RTX 4000 (Laptop)
215 fps +6%
Eurocom Tornado F7W
Intel Core i9-9900K, NVIDIA Quadro P5200
211.6 fps +4%
Asus Strix Scar III G531GW-AZ062T
Intel Core i7-9750H, NVIDIA GeForce RTX 2070 Mobile
208 (187min - 228max) fps +3%
MSI RTX 2060 Gaming Z 6G
AMD Ryzen 7 2700X, NVIDIA GeForce RTX 2060 (Desktop)
204.5 (163min - 231max) fps +1%
MSI WE75 9TK
Intel Core i7-9750H, NVIDIA Quadro RTX 3000 (Laptop)
202.8 fps
Medion Erazer X15805
Intel Core i9-8950HK, NVIDIA GeForce RTX 2070 Max-Q
190.1 fps -6%
Lenovo ThinkPad P73-20QR002DGE
Intel Core i7-9850H, NVIDIA Quadro RTX 3000 (Laptop)
182.7 fps -10%
Maingear Vector 15
Intel Core i7-9750H, NVIDIA GeForce GTX 1660 Ti Mobile
176.3 fps -13%
Dell G7 17 7790
Intel Core i7-8750H, NVIDIA GeForce RTX 2070 Max-Q
165.1 fps -19%
Dell Precision 7730
Intel Core i7-8850H, NVIDIA Quadro P3200
148.2 fps -27%
HP ZBook 17 G5-2ZC48EA
Intel Core i7-8850H, NVIDIA Quadro P3200
137.5 fps -32%
Dell G3 3590
Intel Core i5-9300H, NVIDIA GeForce GTX 1650 Mobile
115.8 fps -43%
Dell G5 15 5590-PCNJJ
Intel Core i5-9300H, NVIDIA GeForce GTX 1650 Mobile
110 (89min) fps -46%
Lenovo ThinkPad P1 2019-20QT000RGE
Intel Core i7-9850H, NVIDIA Quadro T1000 (Laptop)
94.1 fps -54%
Lenovo ThinkPad P1-20MD002LUS
Intel Xeon E-2176M, NVIDIA Quadro P2000 Max-Q
73 fps -64%
MSI WE72 7RJ
Intel Core i7-7700HQ, NVIDIA Quadro M2200
68.4 fps -66%
MSI WP65
Intel Core i7-9750H, NVIDIA Quadro P620
57.7 fps -72%
Lenovo ThinkPad P53s-20N6001NGE
Intel Core i7-8565U, NVIDIA Quadro P520
51.8 fps -74%
Dell XPS 13 7390 2-in-1 Core i7
Intel Core i7-1065G7, Intel Iris Plus Graphics G7 (Ice Lake 64 EU)
34.4 fps -83%
1920x1080 High Graphics & Postprocessing (Nvidia HairWorks Off)
KFA2 GeForce RTX 2080 Ti EX
AMD Ryzen 9 3900X, NVIDIA GeForce RTX 2080 Ti (Desktop)
245 (224min - 266max) fps +109%
MSI GT76 Titan DT 9SG
Intel Core i9-9900K, NVIDIA GeForce RTX 2080 Mobile
186 fps +59%
MSI GE75 9SG
Intel Core i9-9880H, NVIDIA GeForce RTX 2080 Mobile
173 fps +48%
Asus ROG G703GXR
Intel Core i7-9750H, NVIDIA GeForce RTX 2080 Mobile
165 (129min) fps +41%
MSI RTX 2070 Gaming Z 8G
AMD Ryzen 7 2700X, NVIDIA GeForce RTX 2070 (Desktop)
164.3 (145min - 189max) fps +40%
MSI GE75 8SG Raider
Intel Core i7-8750H, NVIDIA GeForce RTX 2080 Mobile
162 fps +38%
Razer Blade Pro 17 RTX 2080 Max-Q
Intel Core i7-9750H, NVIDIA GeForce RTX 2080 Max-Q
152.2 fps +30%
SCHENKER Key 16
Intel Core i7-8750H, NVIDIA GeForce RTX 2080 Max-Q
146.6 fps +25%
Razer Blade 15 Studio Edition
Intel Core i7-9750H, NVIDIA Quadro RTX 5000 Max-Q
144.8 fps +24%
Lenovo ThinkPad P53-20QN000YGE
Intel Core i7-9850H, NVIDIA Quadro RTX 5000 Max-Q
141 fps +21%
AMD Radeon RX Vega 64
AMD Ryzen 9 3900X, AMD Radeon RX Vega 64
136 (119min - 150max) fps +16%
MSI RTX 2060 Gaming Z 6G
AMD Ryzen 7 2700X, NVIDIA GeForce RTX 2060 (Desktop)
135.7 (113min - 150max) fps +16%
MSI WS75 9TL-636
Intel Core i7-9750H, NVIDIA Quadro RTX 4000 (Laptop)
132 fps +13%
Asus Strix Scar III G531GW-AZ062T
Intel Core i7-9750H, NVIDIA GeForce RTX 2070 Mobile
130 (116min - 139max) fps +11%
MSI WT75 8SM
Intel Xeon E-2176G, NVIDIA Quadro P5200
120.2 fps +3%
Asus Zephyrus GX501
Intel Core i7-7700HQ, NVIDIA GeForce GTX 1080 Max-Q
118 fps +1%
MSI WE75 9TK
Intel Core i7-9750H, NVIDIA Quadro RTX 3000 (Laptop)
117 fps
Eurocom Tornado F7W
Intel Core i9-9900K, NVIDIA Quadro P5200
116.1 fps -1%
Dell G7 17 7790
Intel Core i7-8750H, NVIDIA GeForce RTX 2070 Max-Q
113.5 fps -3%
Medion Erazer X15805
Intel Core i9-8950HK, NVIDIA GeForce RTX 2070 Max-Q
112.2 fps -4%
Maingear Vector 15
Intel Core i7-9750H, NVIDIA GeForce GTX 1660 Ti Mobile
110.7 fps -5%
SCHENKER XMG Neo 17 XNE17M19
Intel Core i7-9750H, NVIDIA GeForce RTX 2060 Mobile
107 (90min) fps -9%
Lenovo ThinkPad P73-20QR002DGE
Intel Core i7-9850H, NVIDIA Quadro RTX 3000 (Laptop)
101.3 fps -13%
HP ZBook 17 G4-Y3J82AV
Intel Xeon E3-1535M v6, NVIDIA Quadro P5000
97.5 fps -17%
HP ZBook 17 G5-2ZC48EA
Intel Core i7-8850H, NVIDIA Quadro P3200
85 fps -27%
Dell Precision 7730
Intel Core i7-8850H, NVIDIA Quadro P3200
82.2 fps -30%
Dell G3 3590
Intel Core i5-9300H, NVIDIA GeForce GTX 1650 Mobile
65.9 fps -44%
Dell G5 15 5590-PCNJJ
Intel Core i5-9300H, NVIDIA GeForce GTX 1650 Mobile
59.8 (50min) fps -49%
Lenovo ThinkPad P1 2019-20QT000RGE
Intel Core i7-9850H, NVIDIA Quadro T1000 (Laptop)
52.7 fps -55%
MSI WE72 7RJ
Intel Core i7-7700HQ, NVIDIA Quadro M2200
37.8 fps -68%
Lenovo ThinkPad P53s-20N6001NGE
Intel Core i7-8565U, NVIDIA Quadro P520
33.53 fps -71%
MSI WP65
Intel Core i7-9750H, NVIDIA Quadro P620
33 fps -72%
Lenovo ThinkPad P1-20MD002LUS
Intel Xeon E-2176M, NVIDIA Quadro P2000 Max-Q
32 fps -73%
Dell XPS 13 7390 2-in-1 Core i7
Intel Core i7-1065G7, Intel Iris Plus Graphics G7 (Ice Lake 64 EU)
17 fps -85%
1920x1080 Ultra Graphics & Postprocessing (HBAO+)
KFA2 GeForce RTX 2080 Ti EX
AMD Ryzen 9 3900X, NVIDIA GeForce RTX 2080 Ti (Desktop)
135 (118min - 158max) fps +129%
MSI GT76 Titan DT 9SG
Intel Core i9-9900K, NVIDIA GeForce RTX 2080 Mobile
100 fps +69%
Asus ROG G703GXR
Intel Core i7-9750H, NVIDIA GeForce RTX 2080 Mobile
97.1 (80min) fps +65%
MSI GE75 9SG
Intel Core i9-9880H, NVIDIA GeForce RTX 2080 Mobile
95.3 fps +62%
MSI GE75 8SG Raider
Intel Core i7-8750H, NVIDIA GeForce RTX 2080 Mobile
92.1 fps +56%
MSI RTX 2070 Gaming Z 8G
AMD Ryzen 7 2700X, NVIDIA GeForce RTX 2070 (Desktop)
89.9 (81min - 101max) fps +52%
Razer Blade Pro 17 RTX 2080 Max-Q
Intel Core i7-9750H, NVIDIA GeForce RTX 2080 Max-Q
87.4 fps +48%
Razer Blade 15 Studio Edition
Intel Core i7-9750H, NVIDIA Quadro RTX 5000 Max-Q
83.3 fps +41%
SCHENKER Key 16
Intel Core i7-8750H, NVIDIA GeForce RTX 2080 Max-Q
77.4 fps +31%
AMD Radeon RX Vega 64
AMD Ryzen 9 3900X, AMD Radeon RX Vega 64
76 (67min - 84max) fps +29%
Eurocom Sky X4C
Intel Core i7-8700K, NVIDIA GeForce GTX 1080 Mobile
75.3 fps +28%
MSI RTX 2060 Gaming Z 6G
AMD Ryzen 7 2700X, NVIDIA GeForce RTX 2060 (Desktop)
72.7 (61min - 82max) fps +23%
Asus Strix Scar III G531GW-AZ062T
Intel Core i7-9750H, NVIDIA GeForce RTX 2070 Mobile
72 (61min - 84max) fps +22%
Lenovo ThinkPad P53-20QN000YGE
Intel Core i7-9850H, NVIDIA Quadro RTX 5000 Max-Q
71 (67min, 67P1 - 74max) fps +20%
MSI WS75 9TL-636
Intel Core i7-9750H, NVIDIA Quadro RTX 4000 (Laptop)
70 fps +19%
MSI WT75 8SM
Intel Xeon E-2176G, NVIDIA Quadro P5200
66.7 fps +13%
Dell G7 17 7790
Intel Core i7-8750H, NVIDIA GeForce RTX 2070 Max-Q
64.7 fps +10%
Medion Erazer X15805
Intel Core i9-8950HK, NVIDIA GeForce RTX 2070 Max-Q
63.6 fps +8%
Eurocom Tornado F7W
Intel Core i9-9900K, NVIDIA Quadro P5200
63.4 fps +7%
Asus Zephyrus GX501
Intel Core i7-7700HQ, NVIDIA GeForce GTX 1080 Max-Q
61.9 fps +5%
Maingear Vector 15
Intel Core i7-9750H, NVIDIA GeForce GTX 1660 Ti Mobile
61.3 fps +4%
MSI WE75 9TK
Intel Core i7-9750H, NVIDIA Quadro RTX 3000 (Laptop)
59 fps
SCHENKER XMG Neo 17 XNE17M19
Intel Core i7-9750H, NVIDIA GeForce RTX 2060 Mobile
56.9 (48min) fps -4%
Lenovo ThinkPad P73-20QR002DGE
Intel Core i7-9850H, NVIDIA Quadro RTX 3000 (Laptop)
53.9 (41min, 42P1 - 62max) fps -9%
HP ZBook 17 G4-Y3J82AV
Intel Xeon E3-1535M v6, NVIDIA Quadro P5000
51.5 fps -13%
Dell Precision 7730
Intel Core i7-8850H, NVIDIA Quadro P3200
46.4 fps -21%
HP ZBook 17 G5-2ZC48EA
Intel Core i7-8850H, NVIDIA Quadro P3200
45.4 fps -23%
Dell G3 3590
Intel Core i5-9300H, NVIDIA GeForce GTX 1650 Mobile
36.2 fps -39%
Dell G5 15 5590-PCNJJ
Intel Core i5-9300H, NVIDIA GeForce GTX 1650 Mobile
34.4 (26min) fps -42%
Dell Precision 5540
Intel Core i9-9980HK, NVIDIA Quadro T2000 Max-Q
32.4 (30min, 31P1 - 34max) fps -45%
Lenovo ThinkPad P1 2019-20QT000RGE
Intel Core i7-9850H, NVIDIA Quadro T1000 (Laptop)
30.9 (28min, 28P1 - 32max) fps -48%
Lenovo ThinkPad P1-20MD002LUS
Intel Xeon E-2176M, NVIDIA Quadro P2000 Max-Q
25 fps -58%
MSI WE72 7RJ
Intel Core i7-7700HQ, NVIDIA Quadro M2200
20.3 fps -66%
MSI WP65
Intel Core i7-9750H, NVIDIA Quadro P620
18.1 fps -69%
Lenovo ThinkPad P53s-20N6001NGE
Intel Core i7-8565U, NVIDIA Quadro P520
11.08 fps -81%
Dell XPS 13 7390 2-in-1 Core i7
Intel Core i7-1065G7, Intel Iris Plus Graphics G7 (Ice Lake 64 EU)
7.8 fps -87%