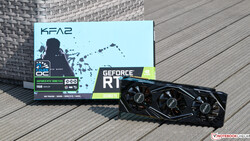
Test KFA2 GeForce RTX 2080 Ti EX - Nvidias High-End-Modell im Custom Design


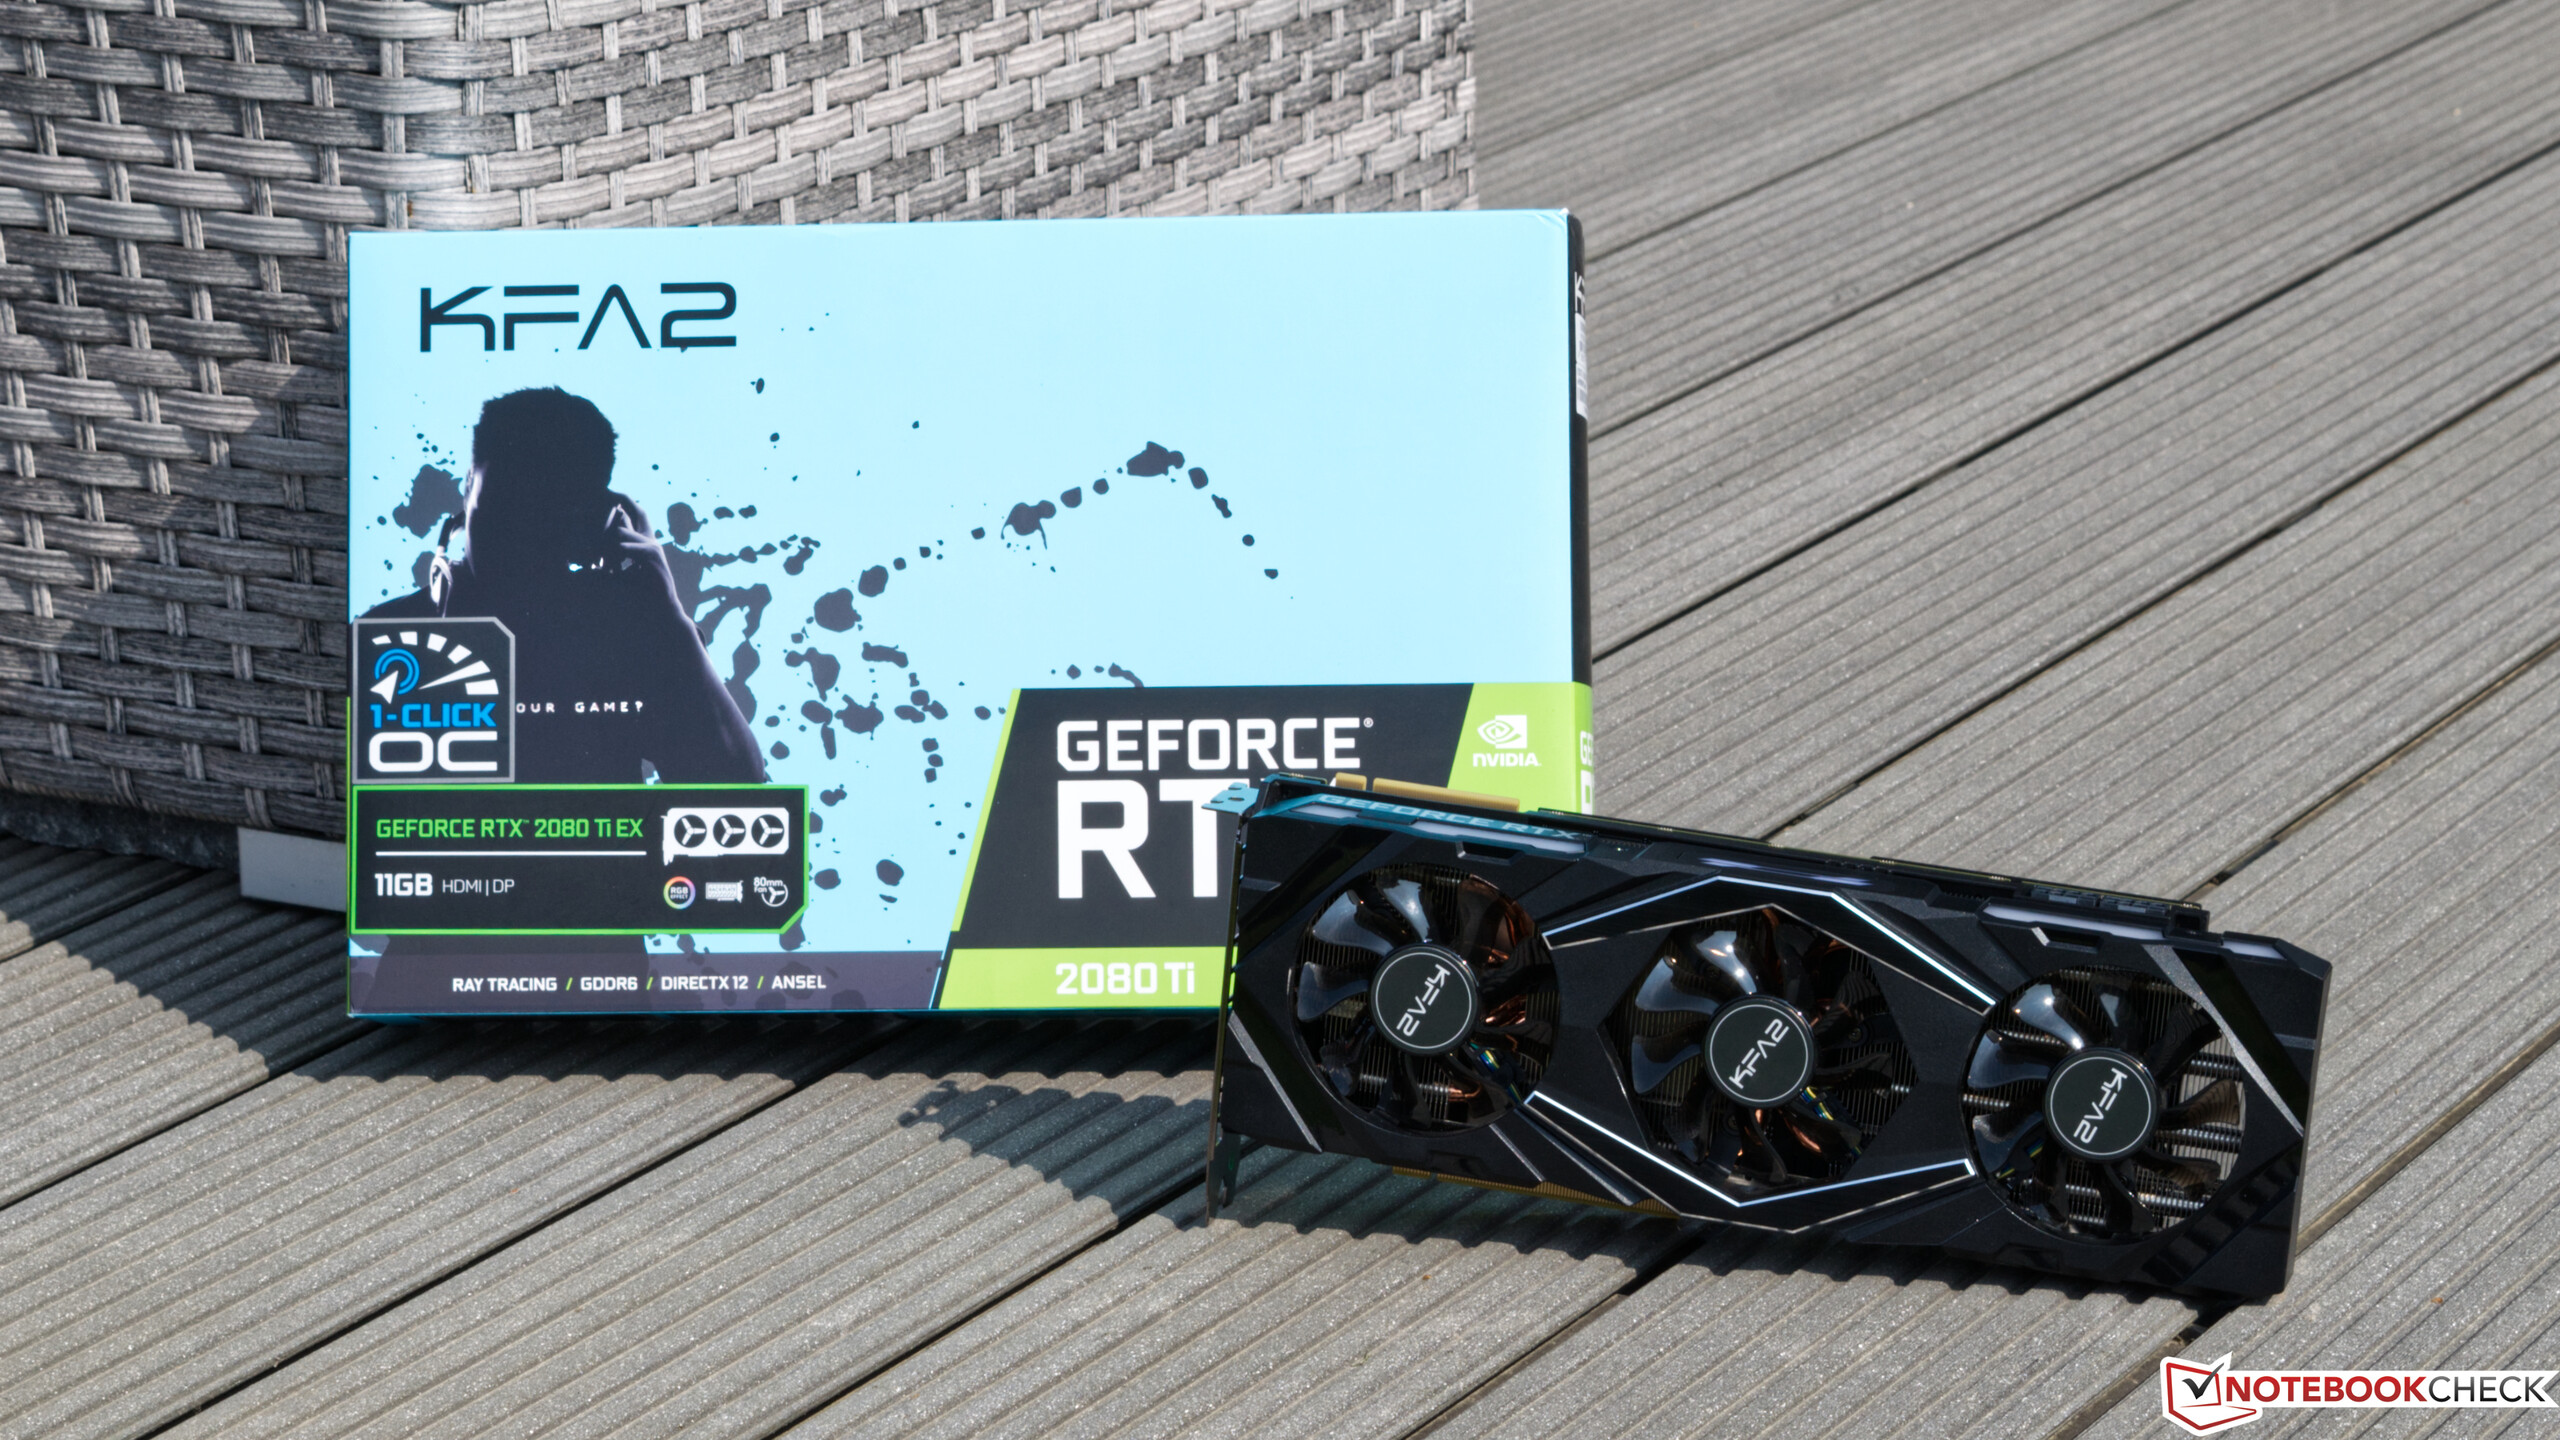
Nachdem Nvidia mit den Super-Karten bereits Facelift-Modelle der RTX 2060, RTX 2070 und RTX 2080 vorgestellt hat, bleibt das bisherige High-End-Modell die GeForce RTX 2080 Ti. Mit 11-GB-GDDR6-VRAM bietet auch nur dieses Modell mehr VRAM als alle anderen Modelle. Von KFA2 haben wir vor kurzem bereits ein Custom-Modell der GeForce RTX 2060 Super testen können und nun haben wir die Gelegenheit bekommen, uns die KFA 2 GeForce RTX 2080 Ti EX genauer anzuschauen.
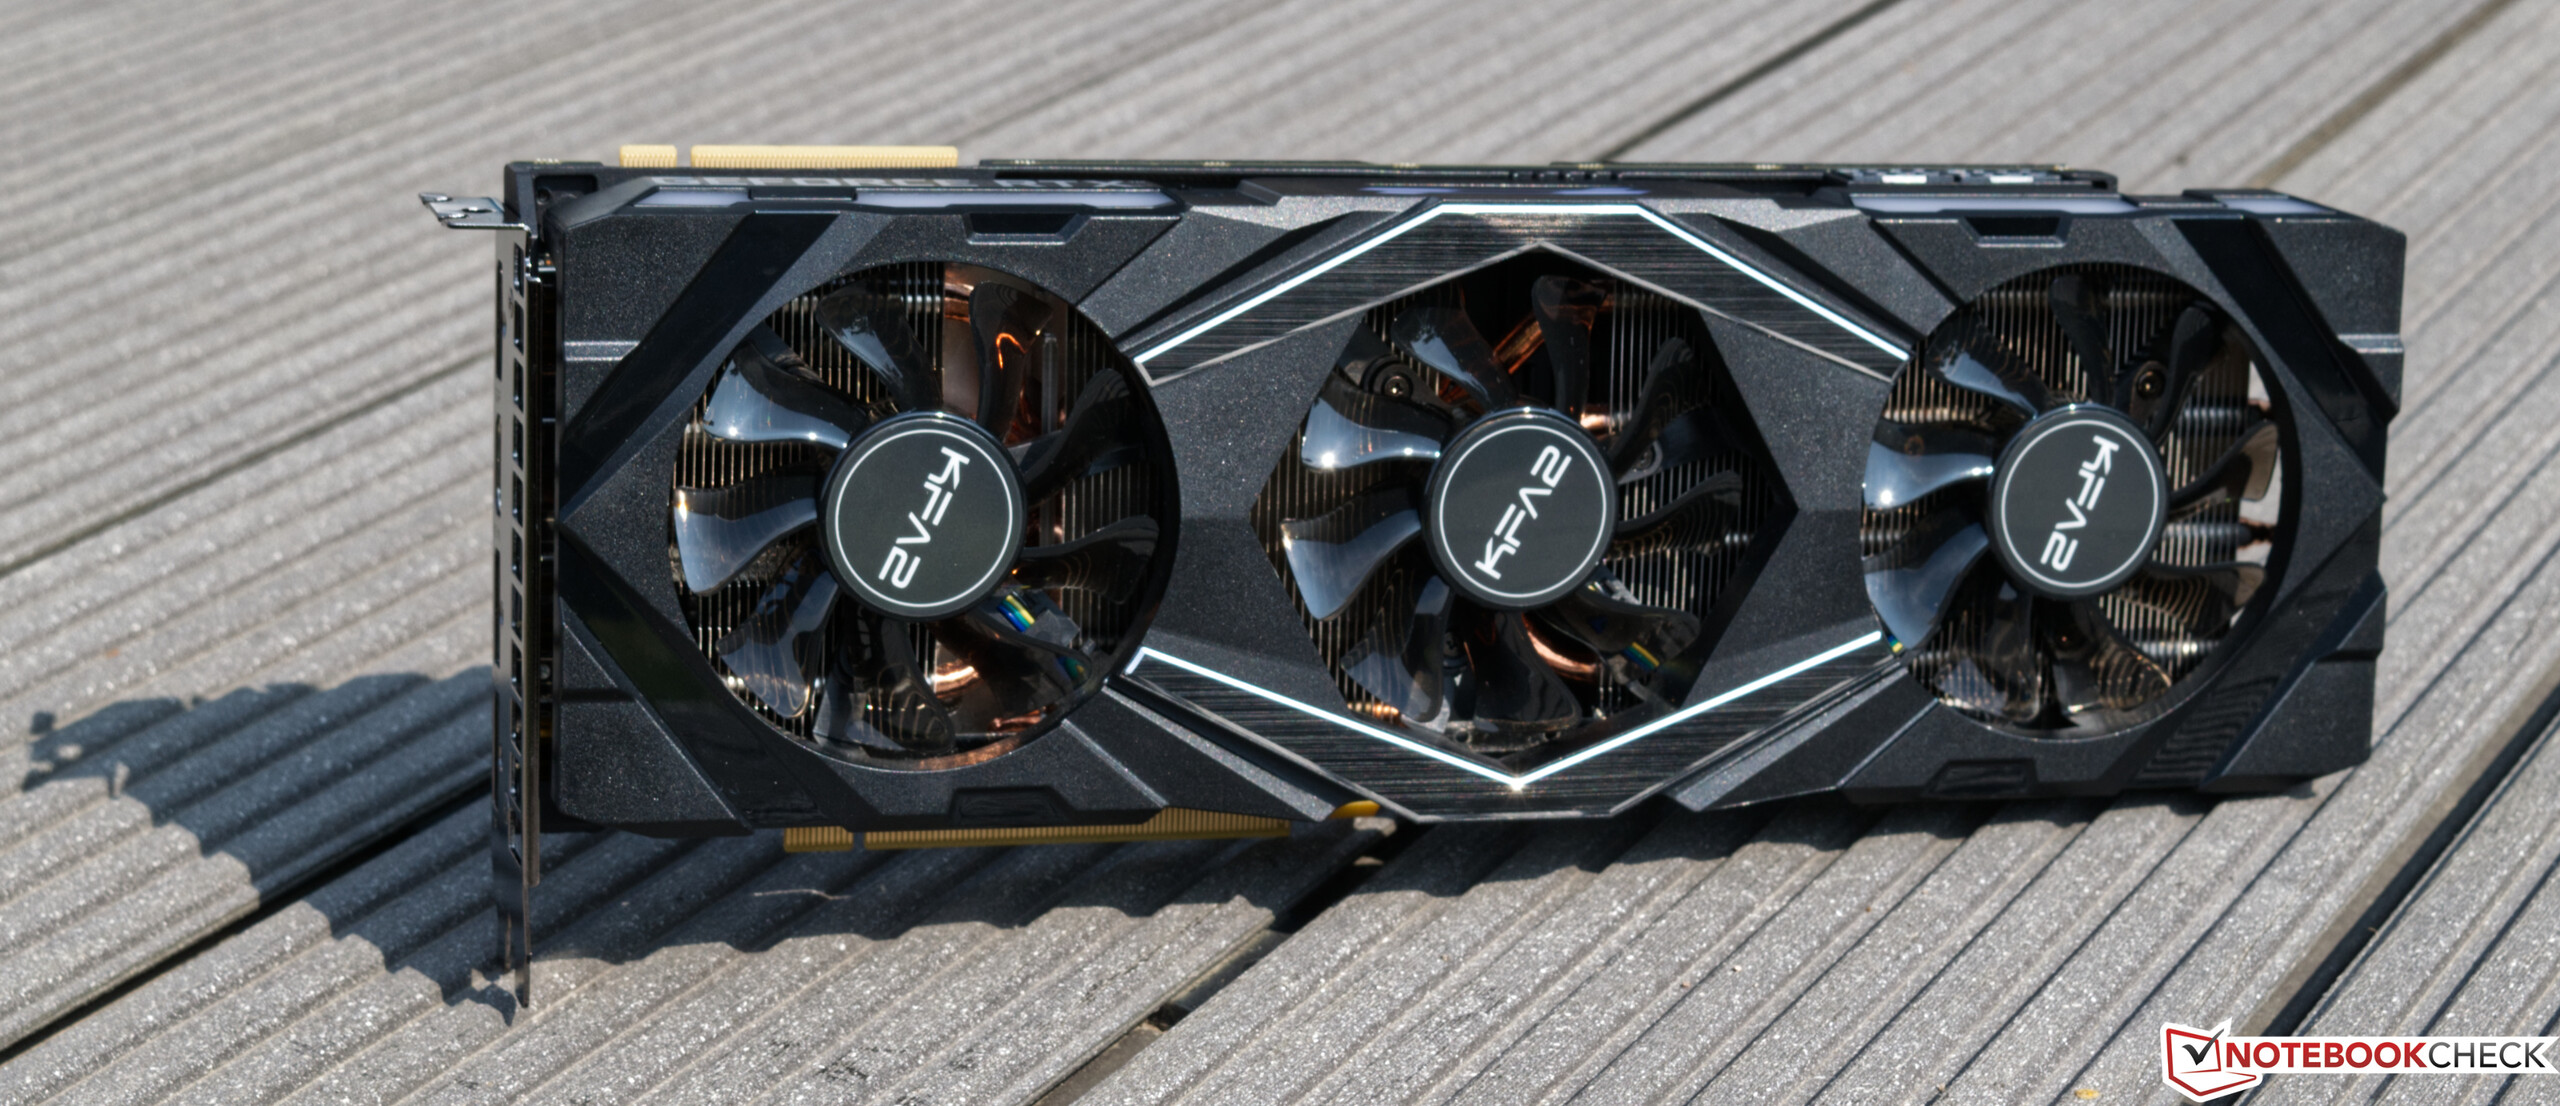
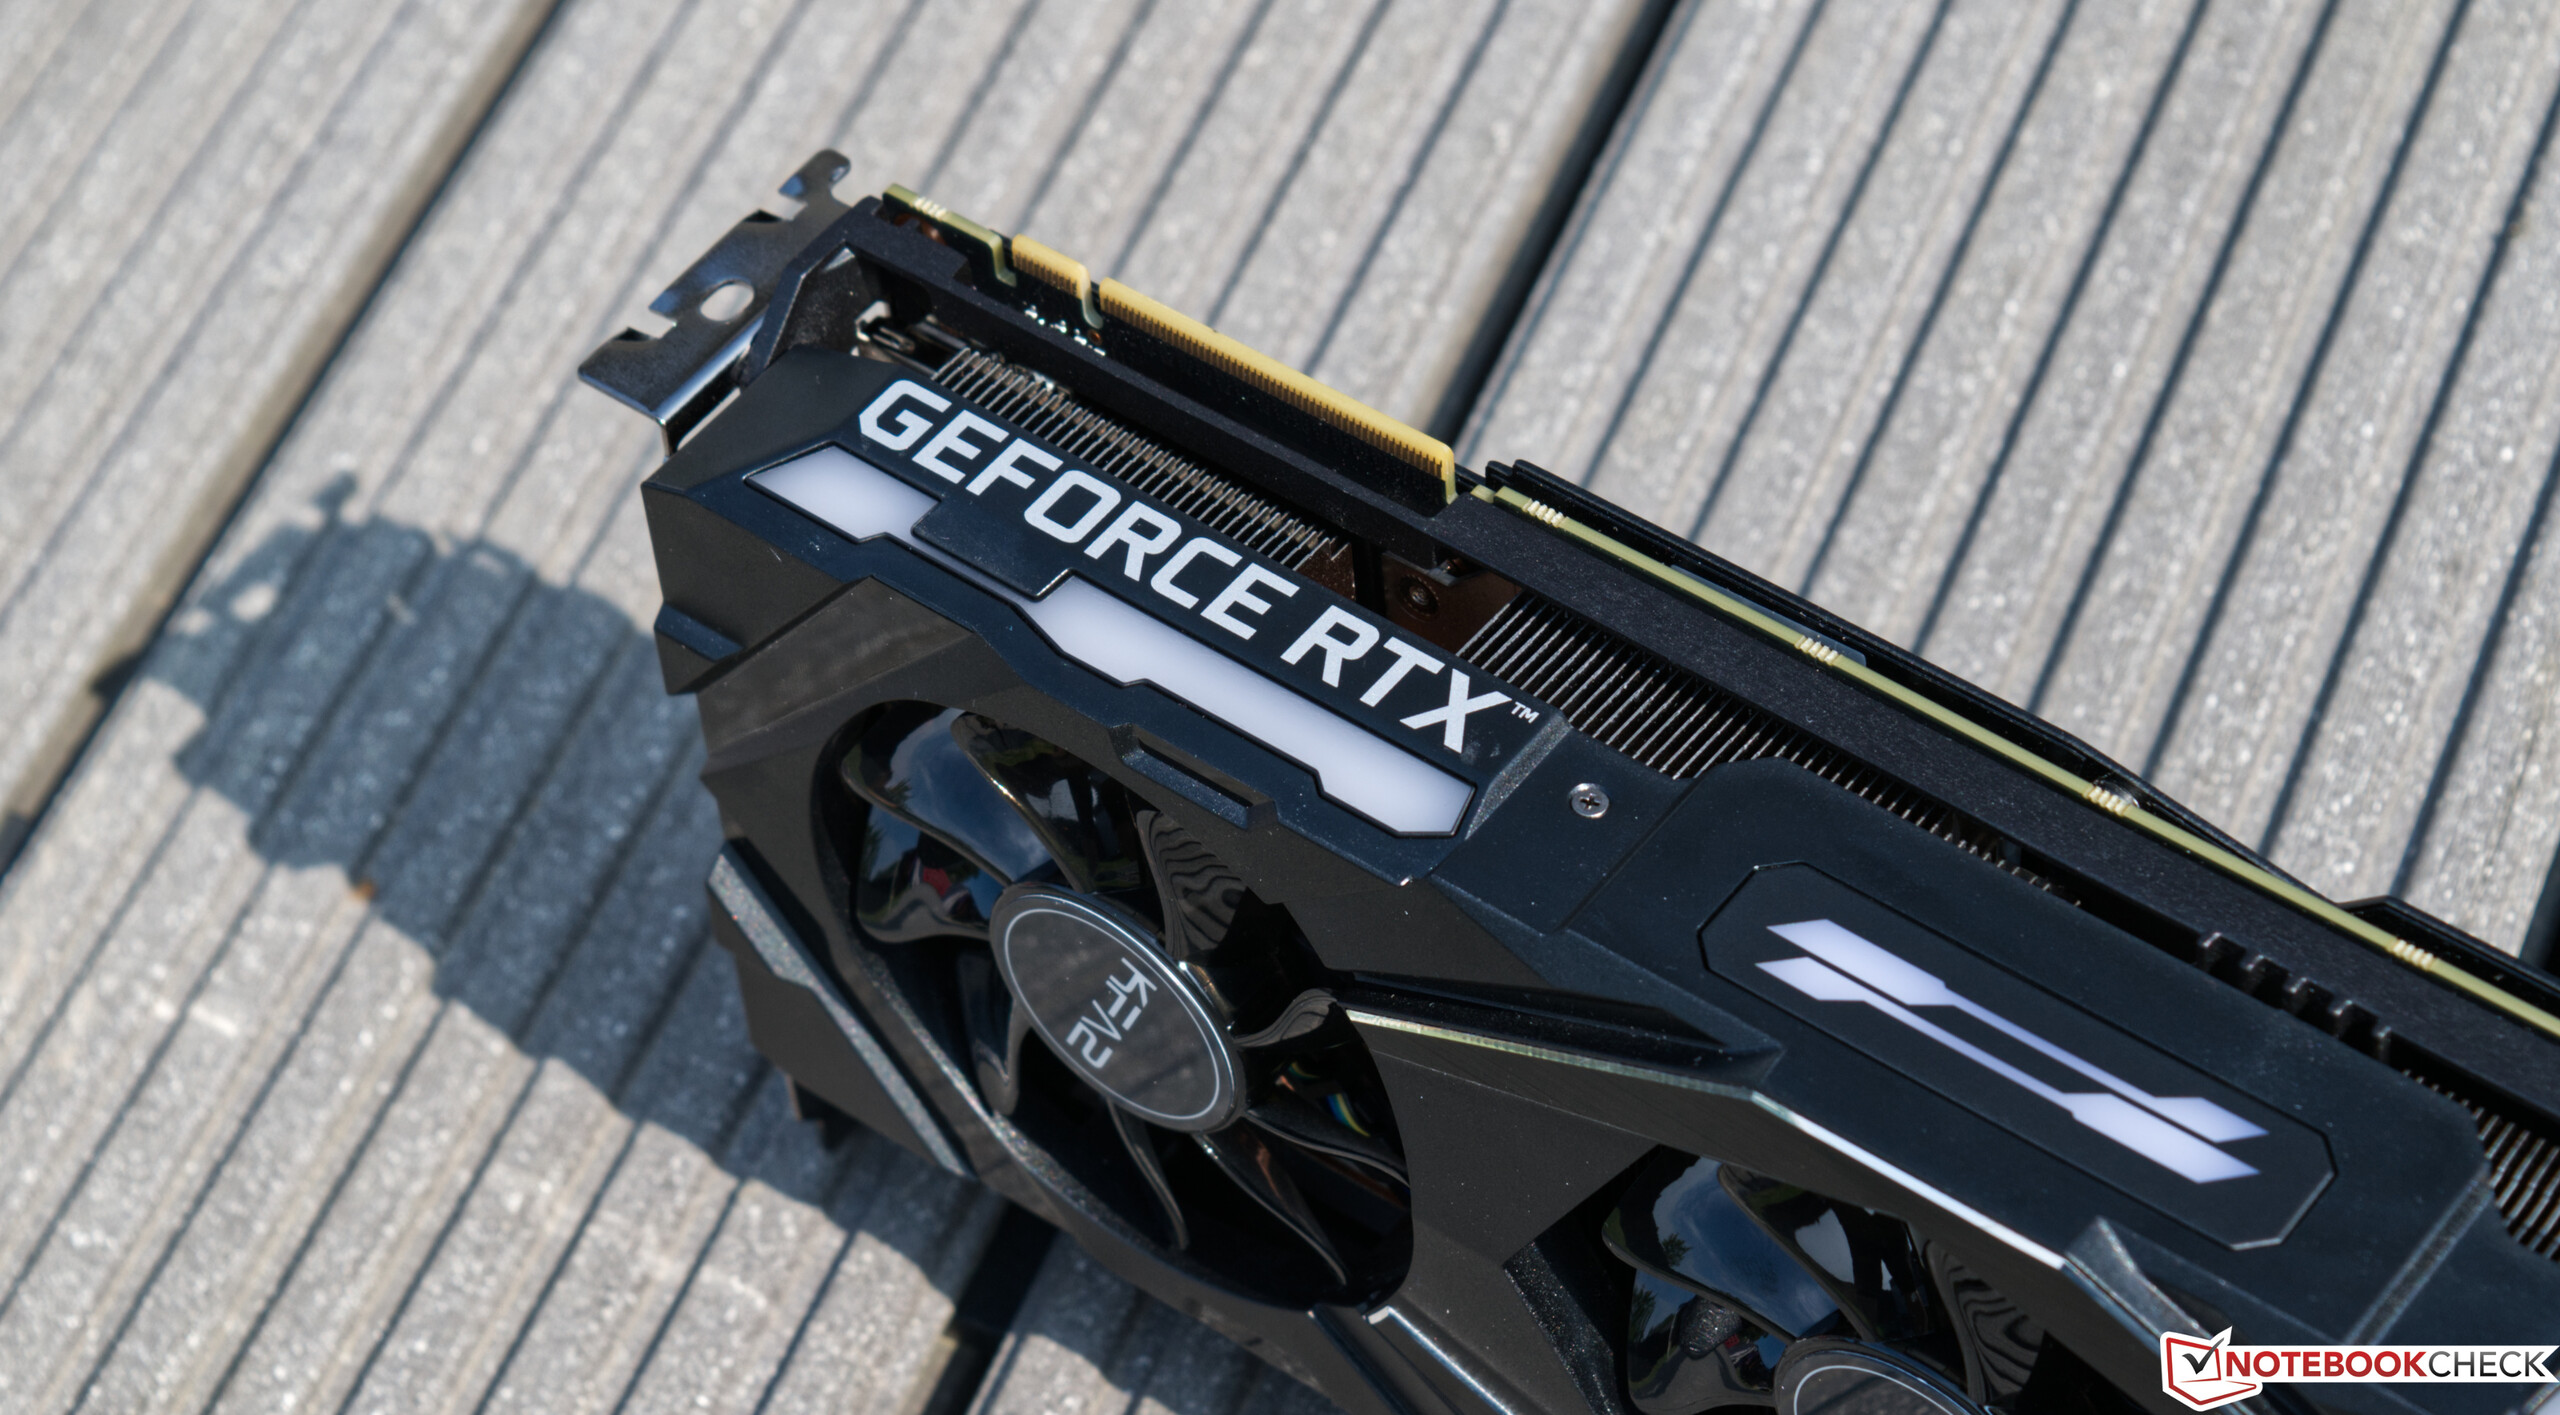
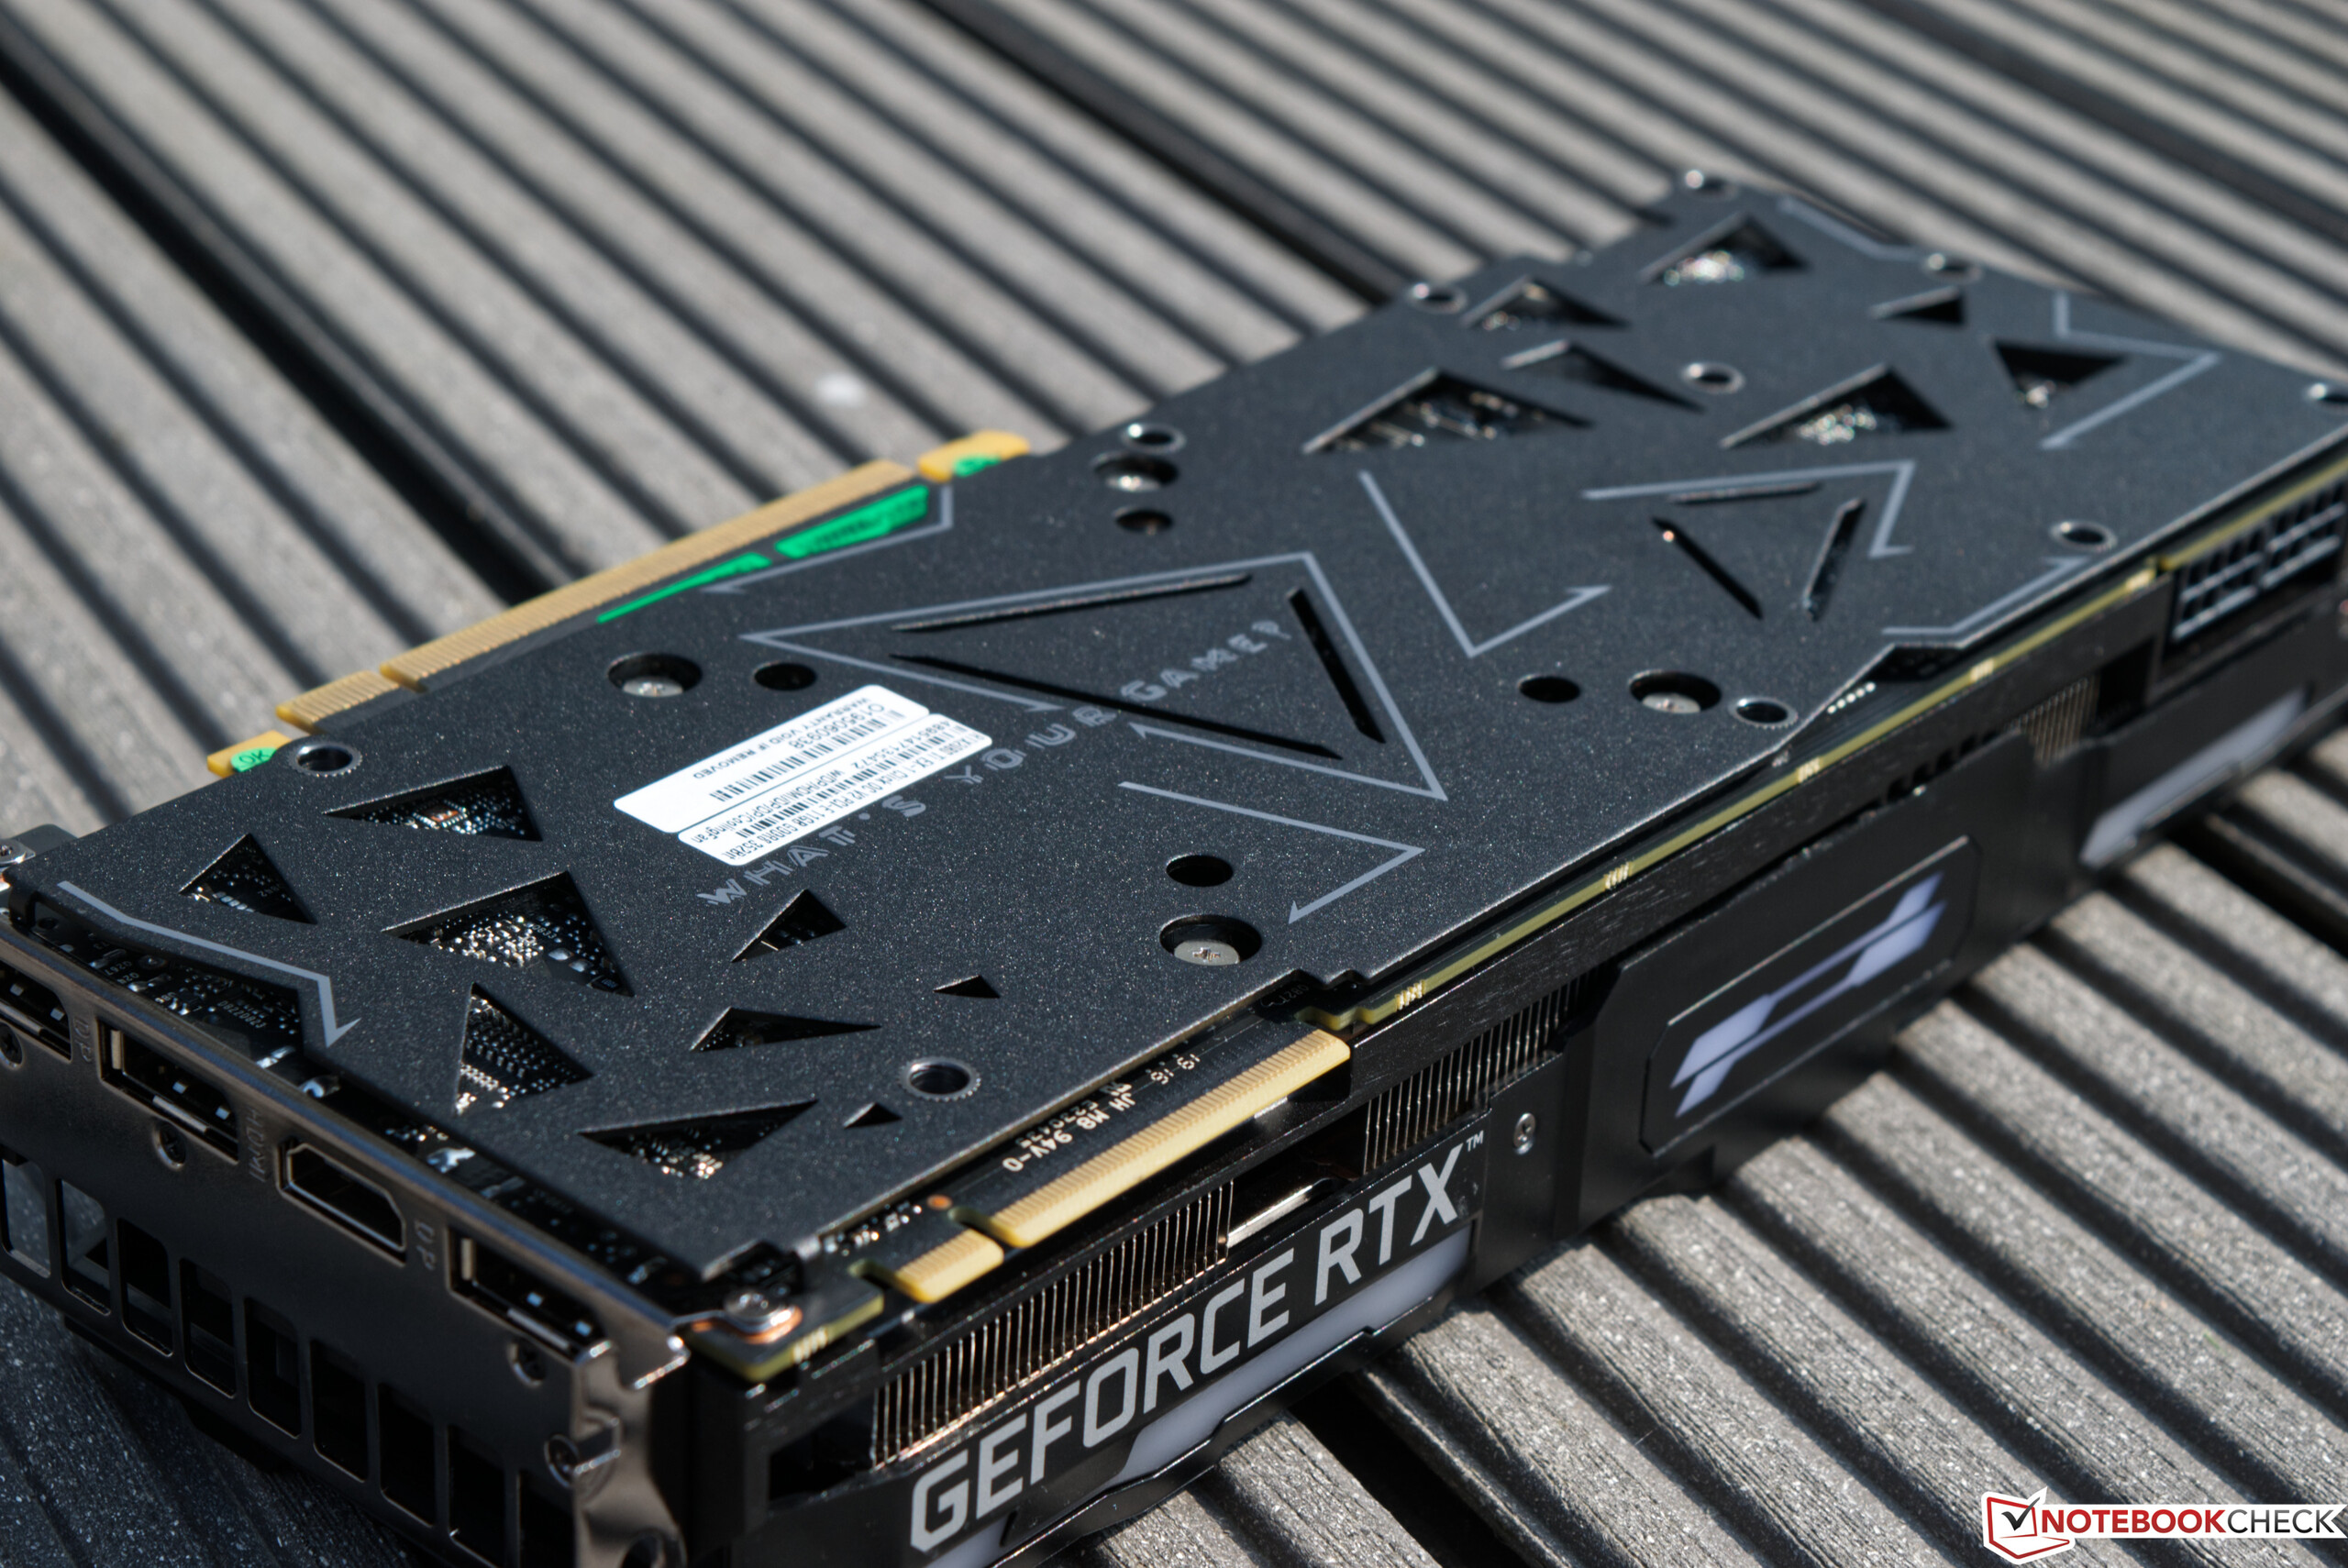
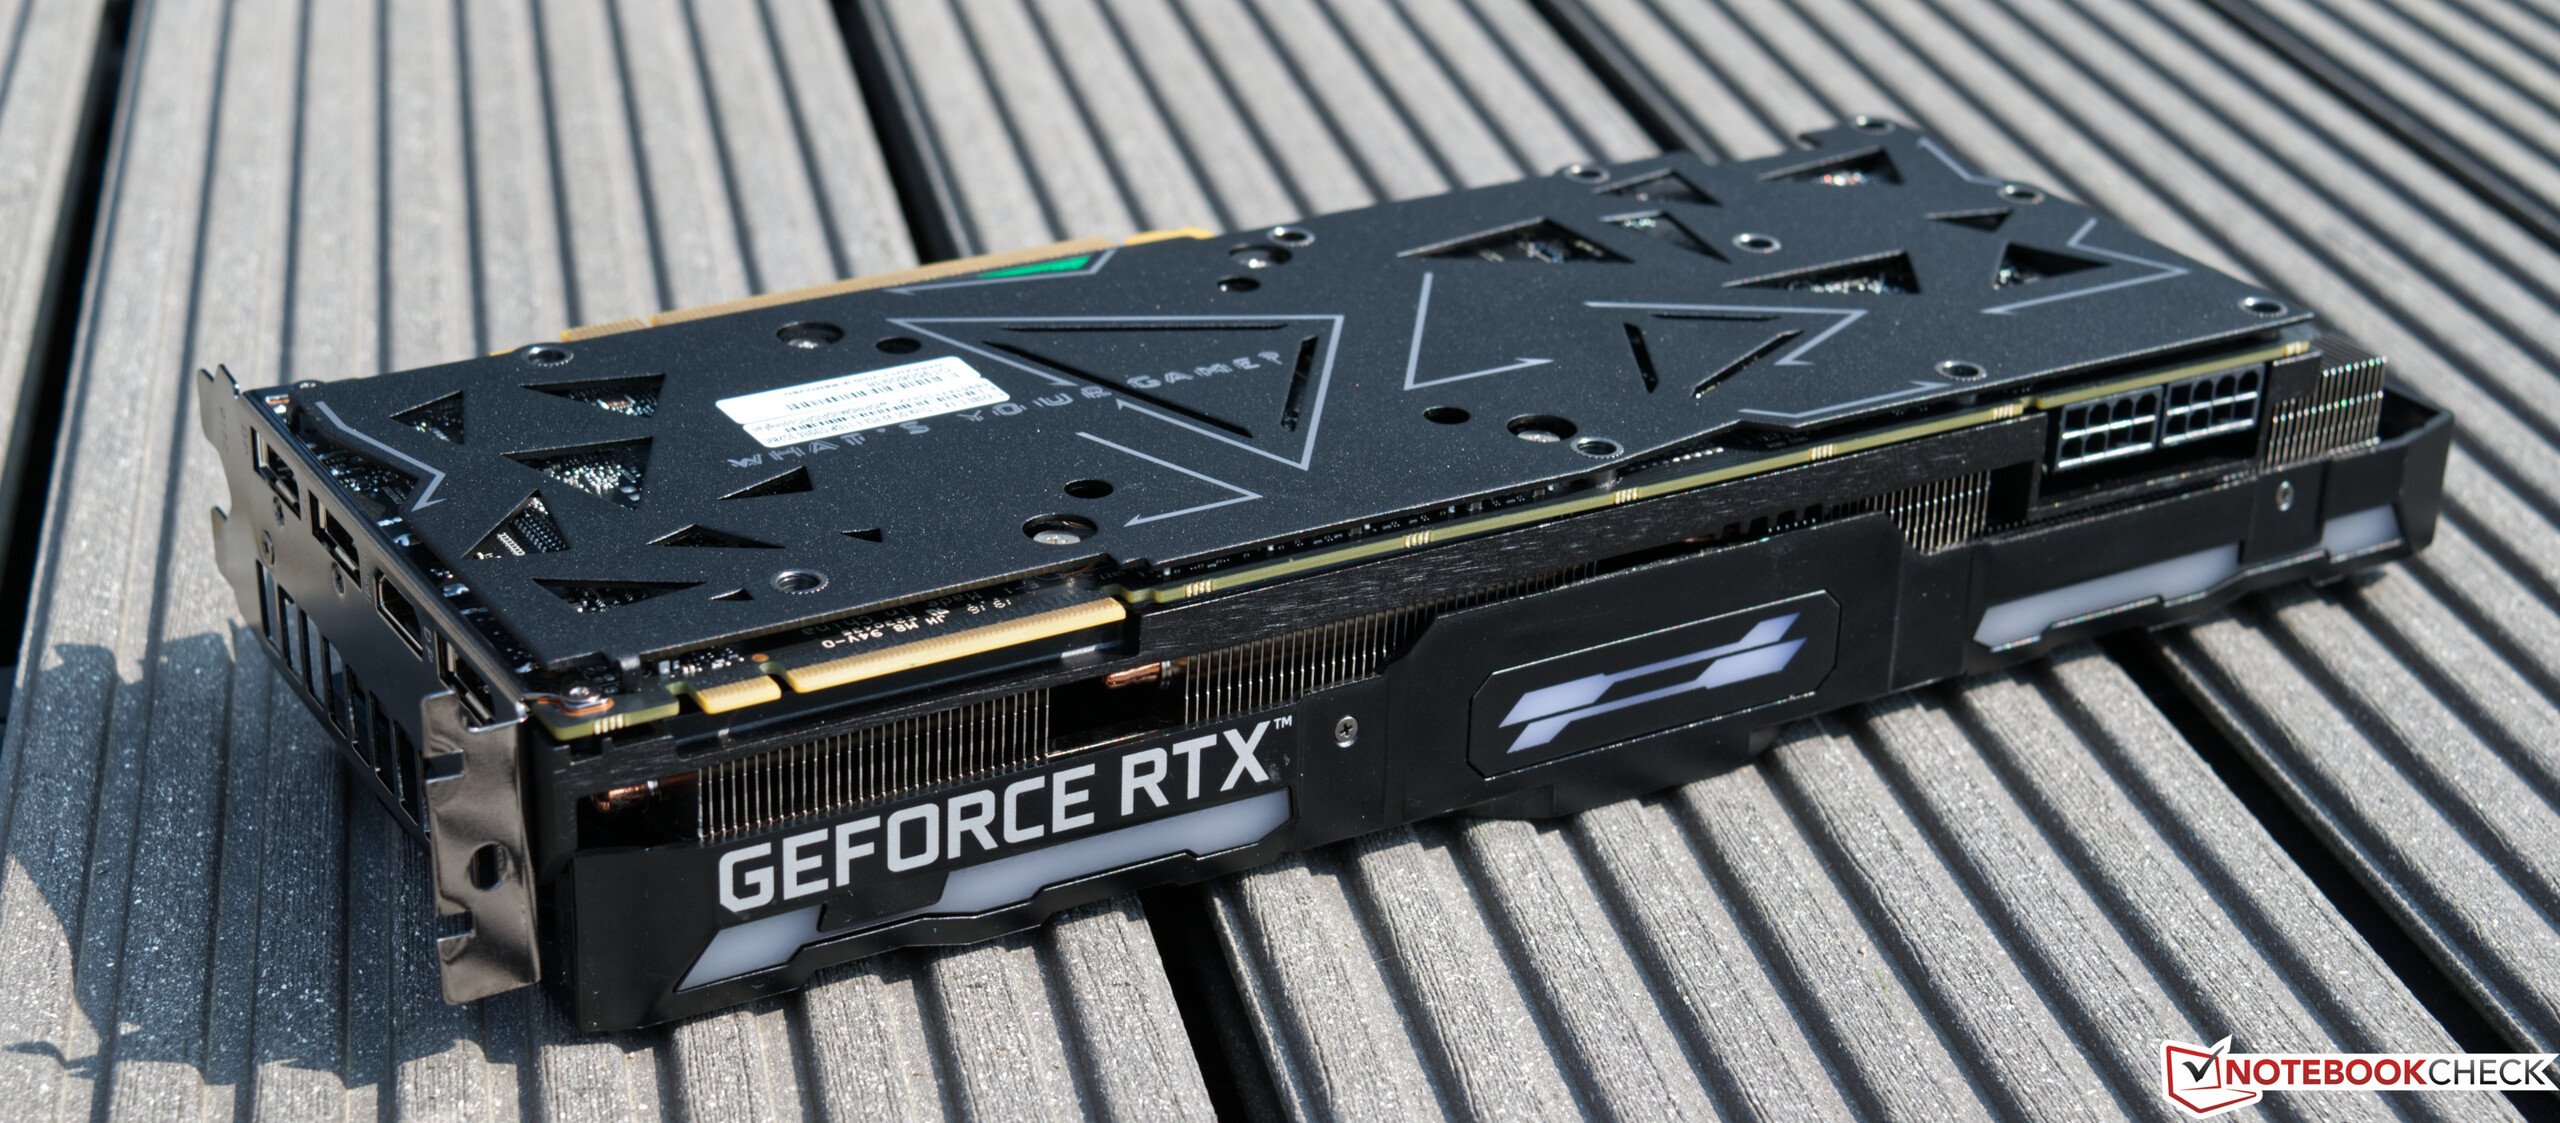
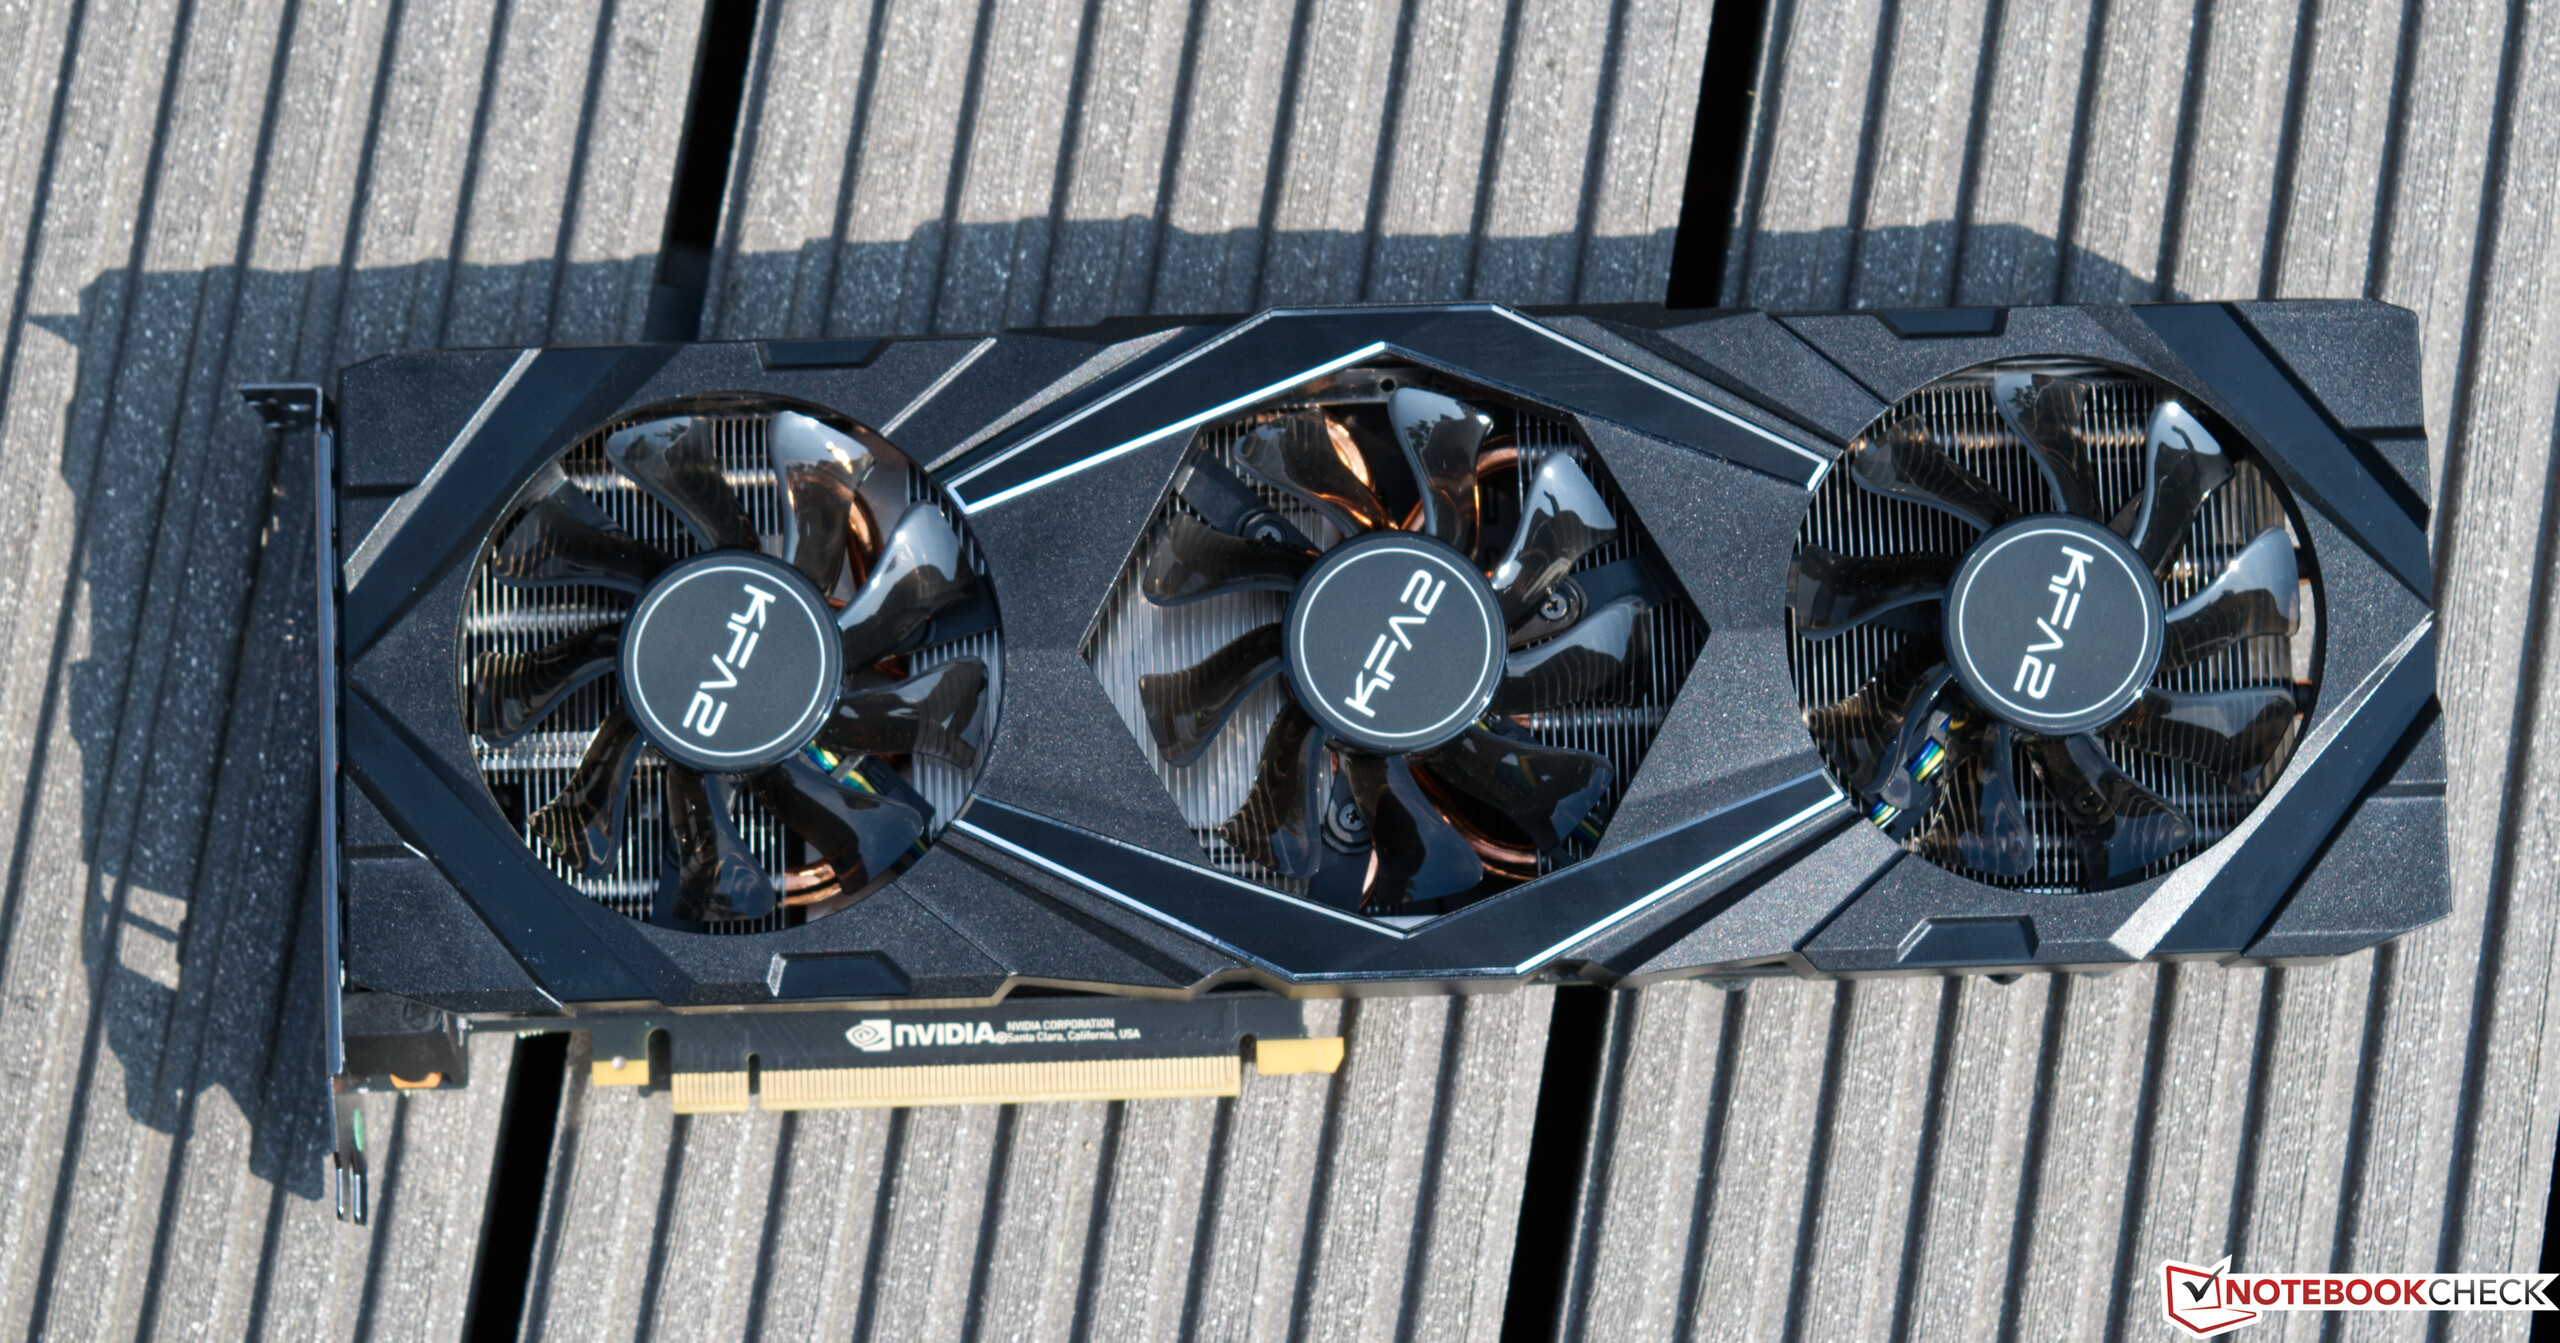
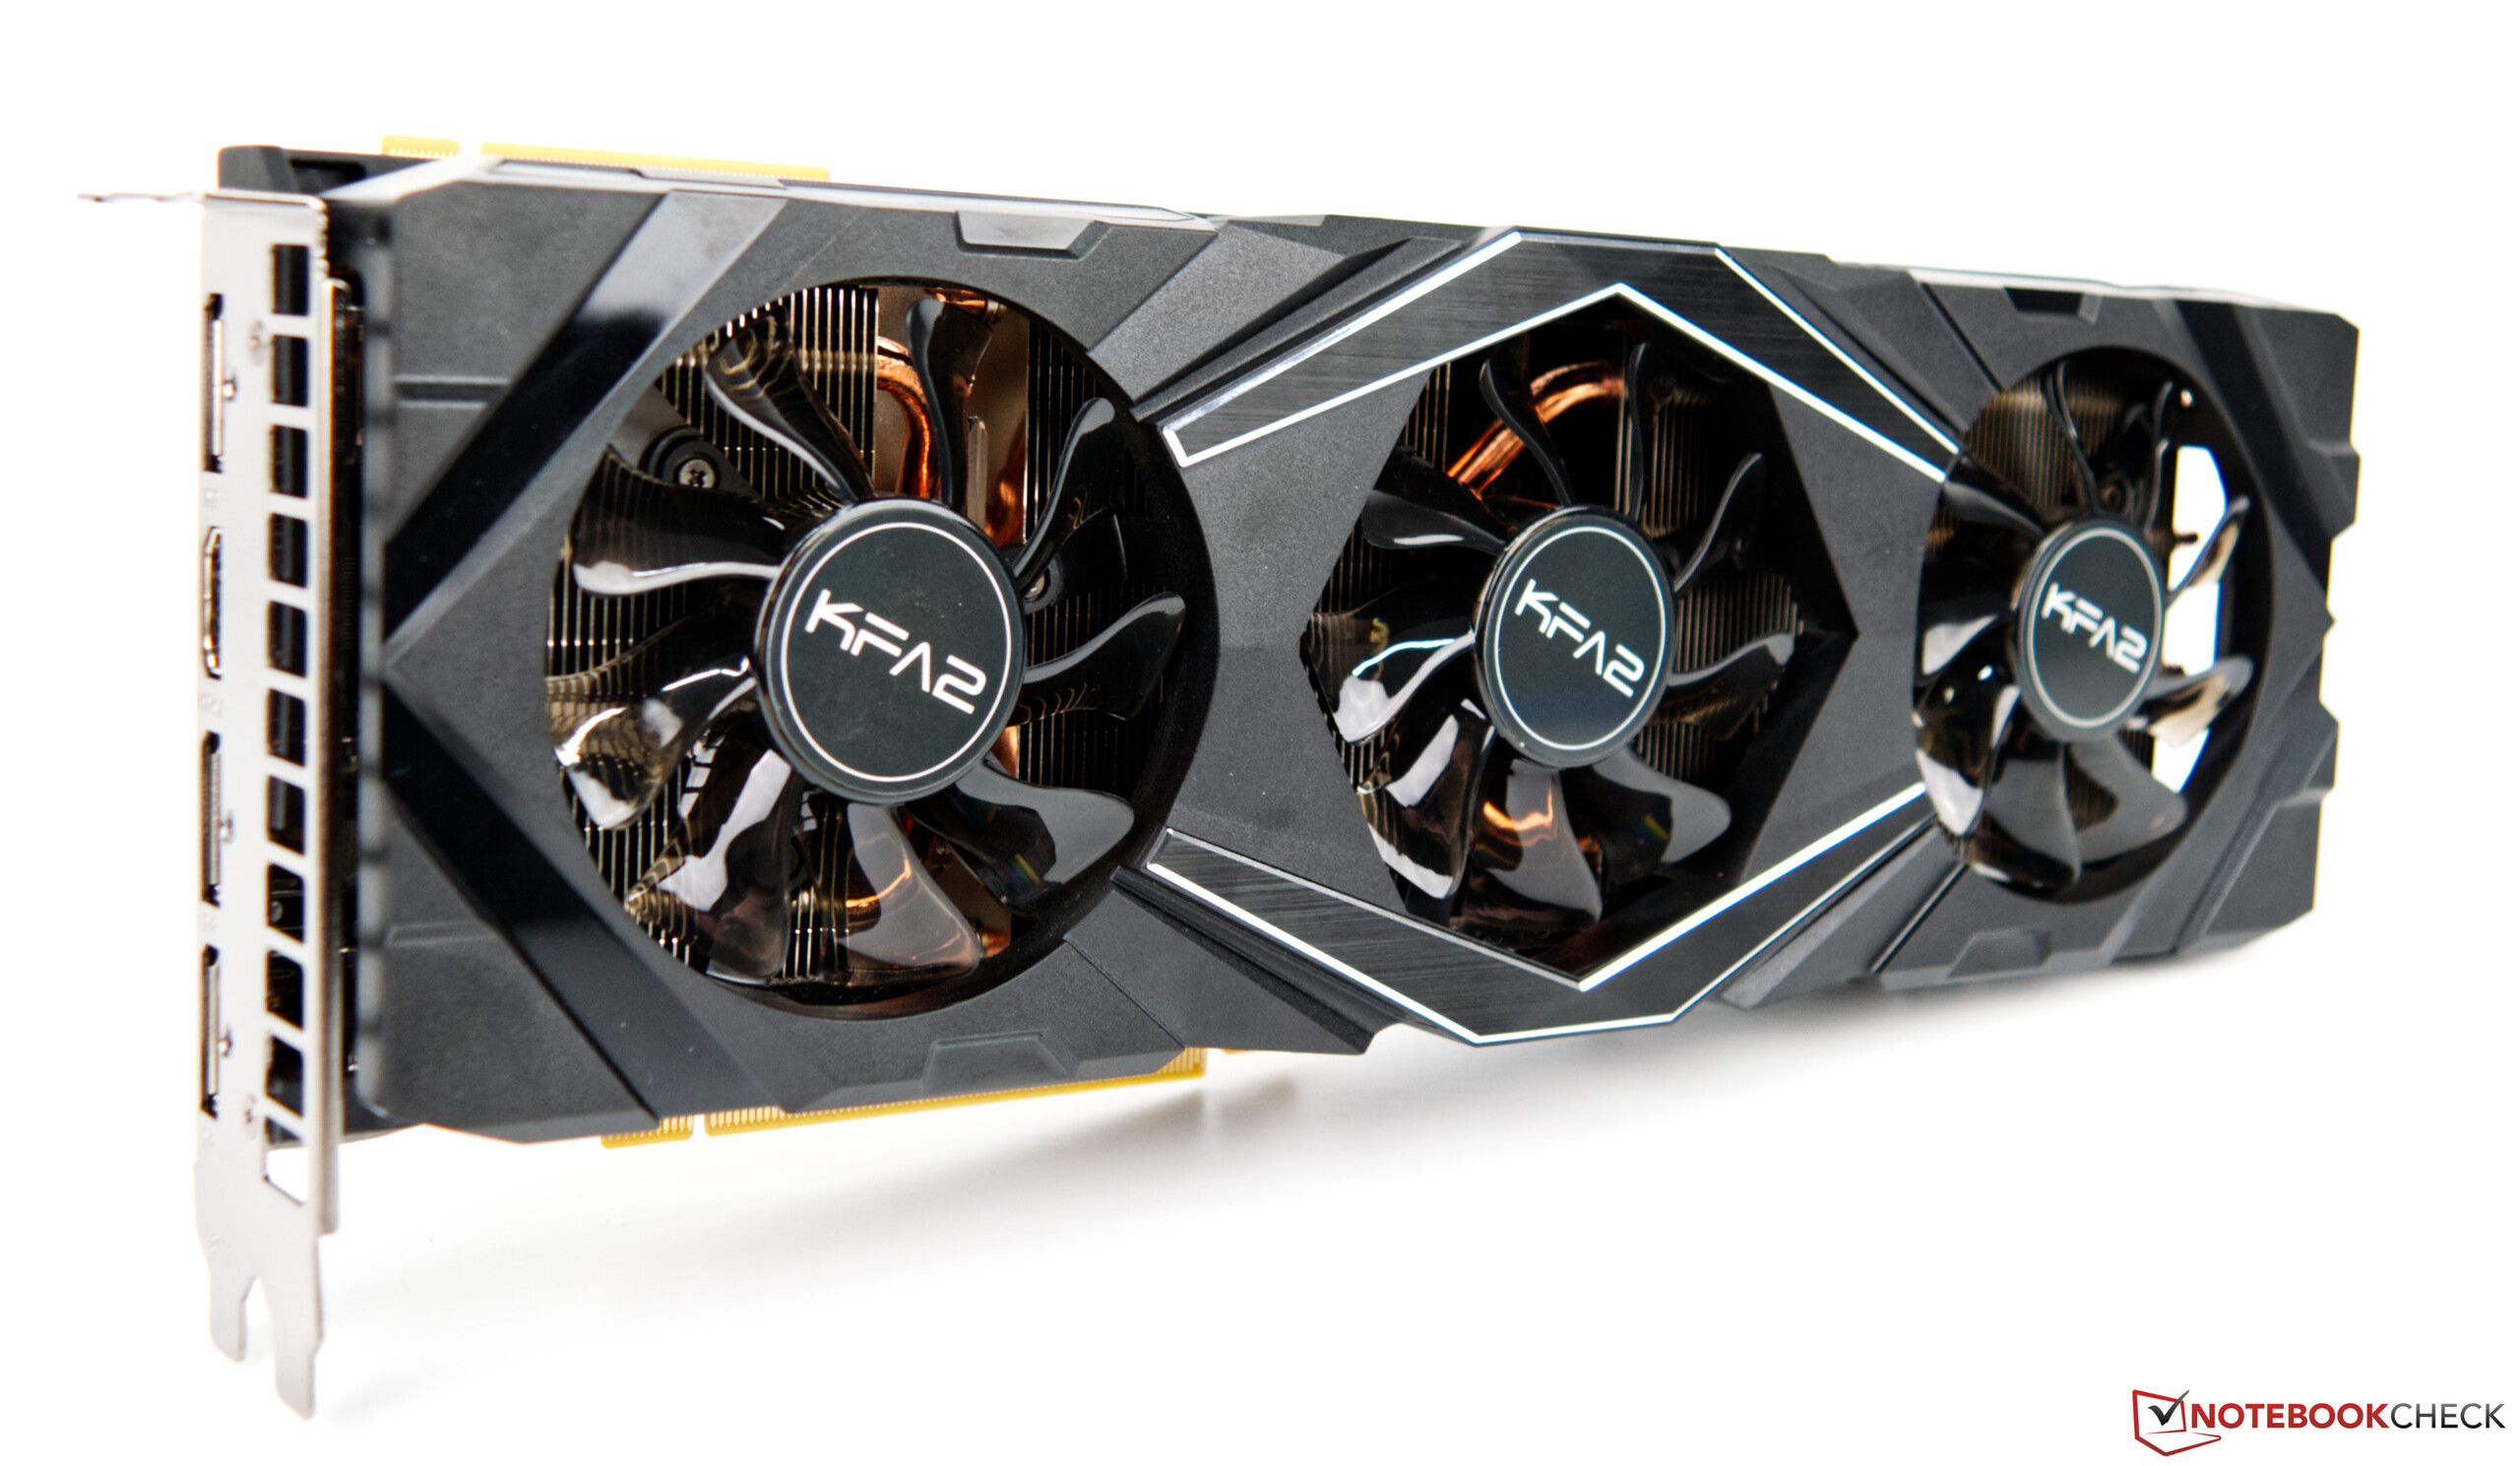
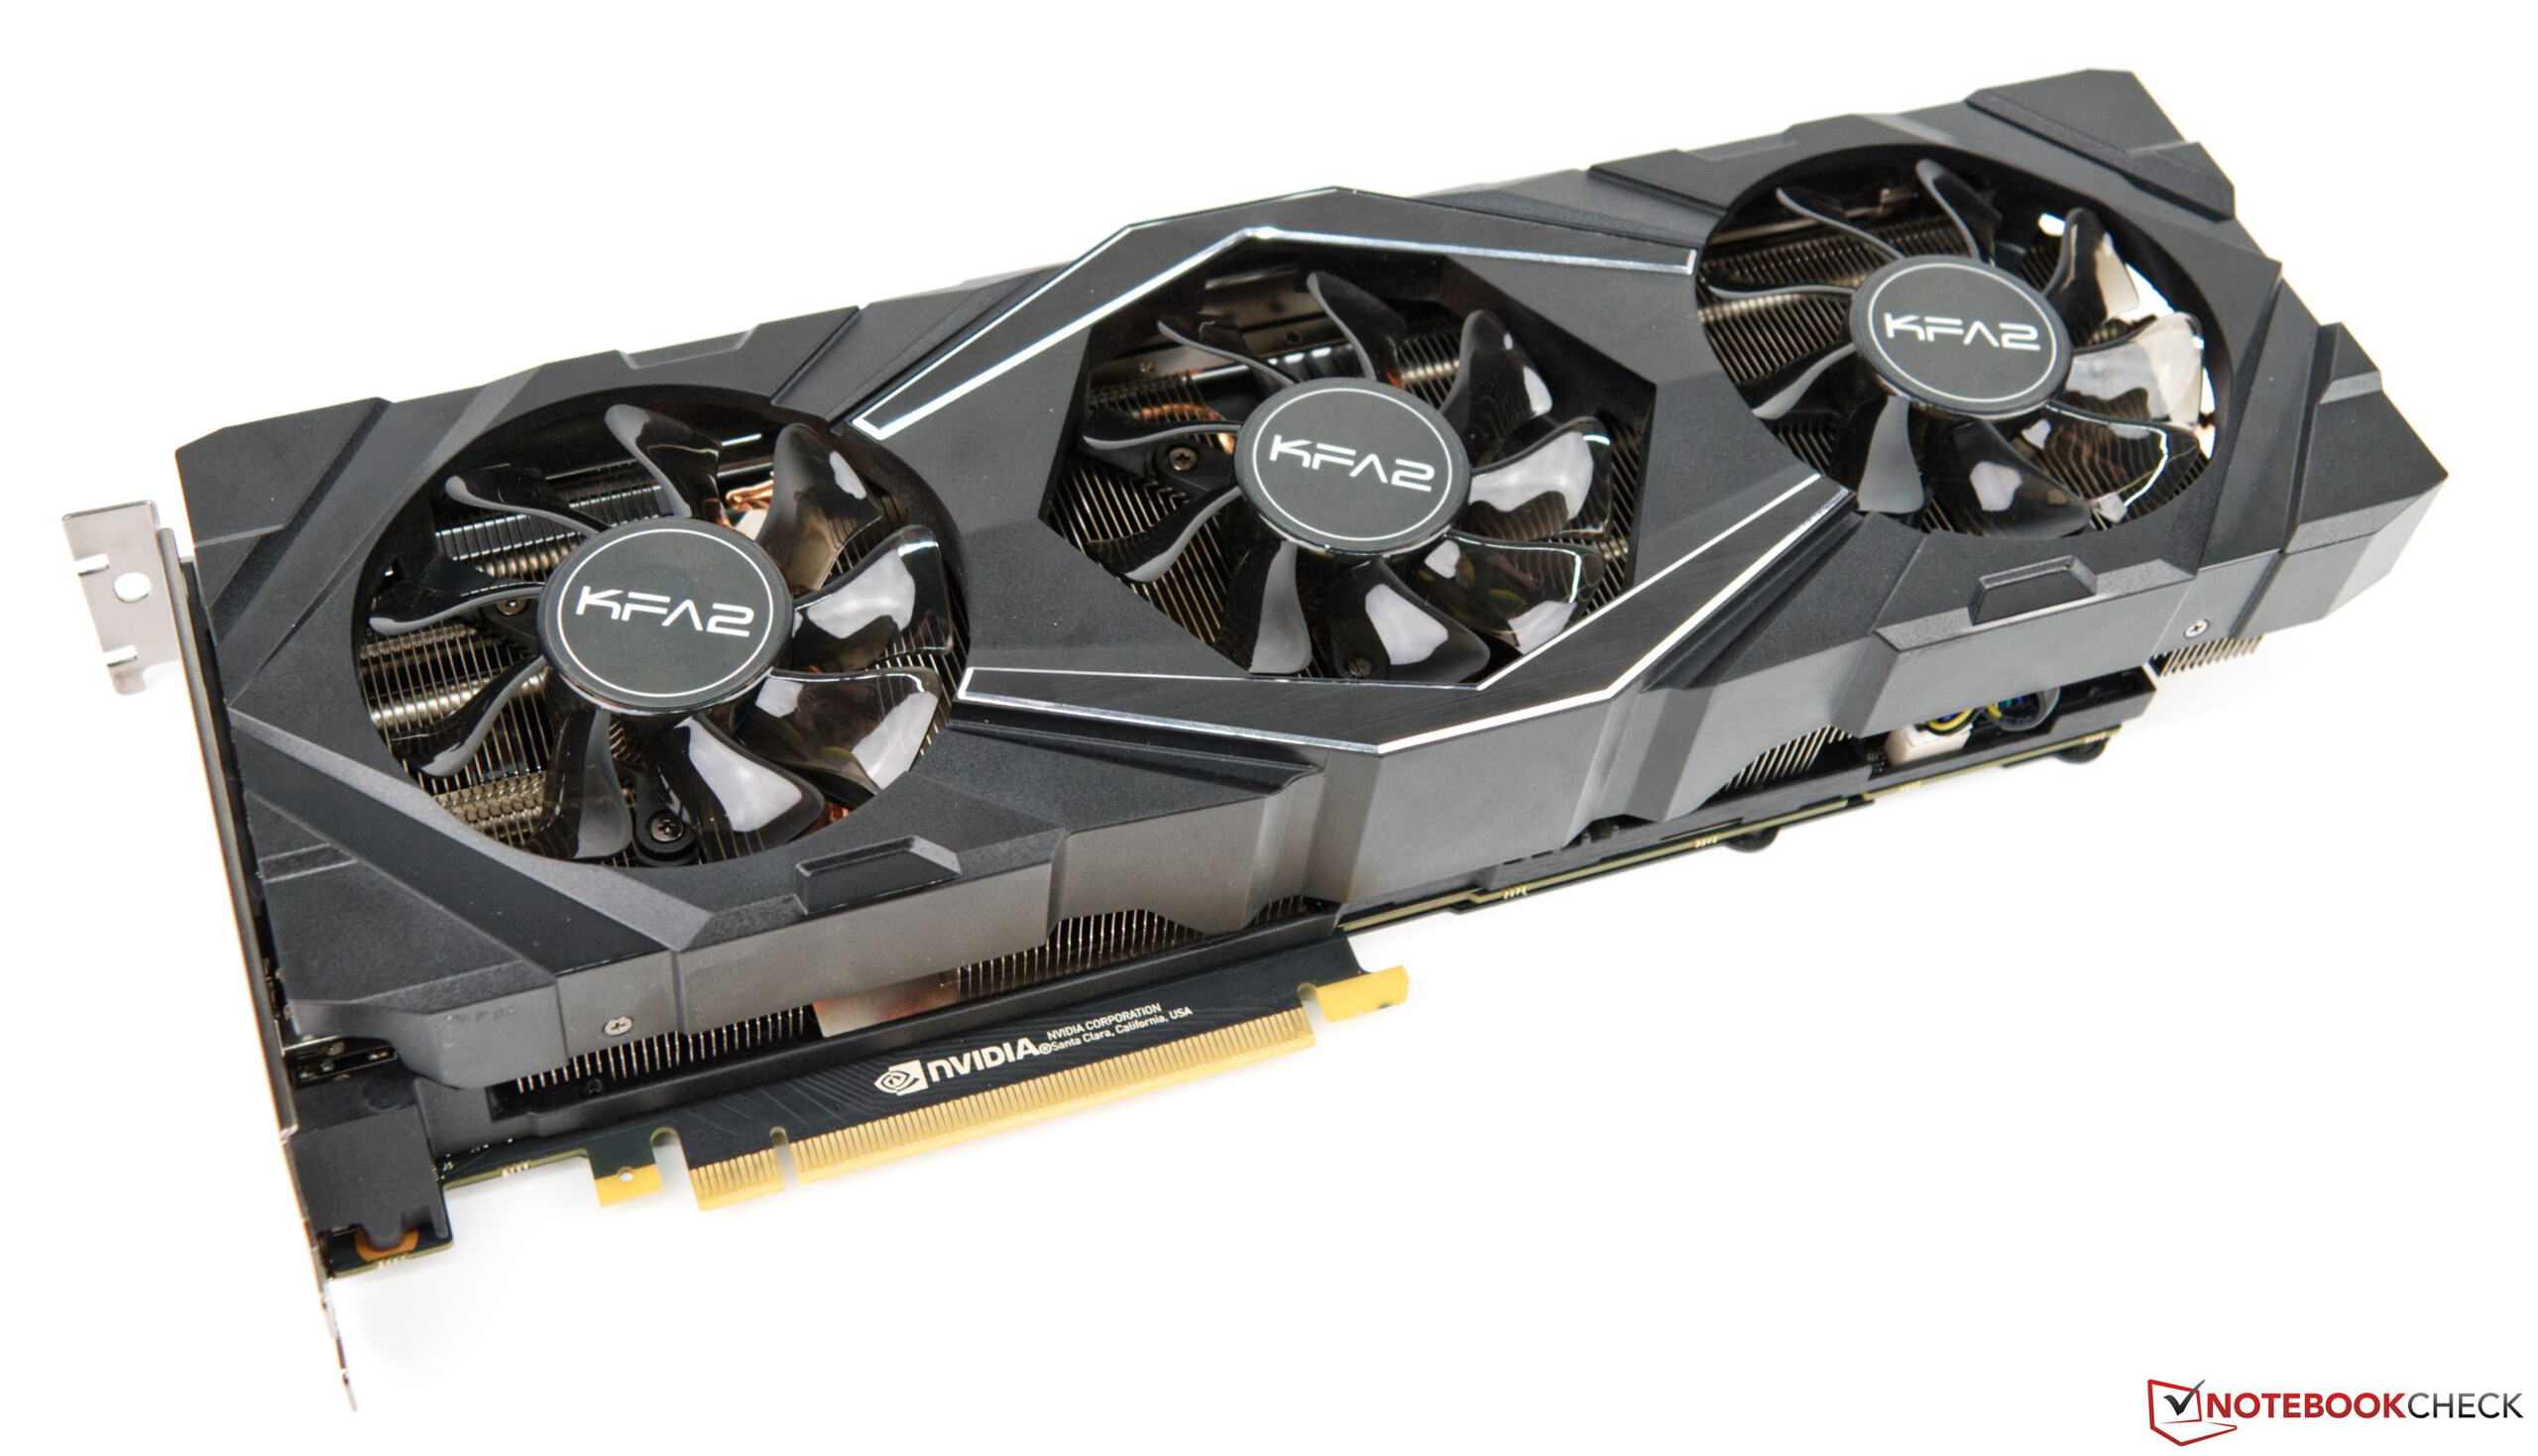
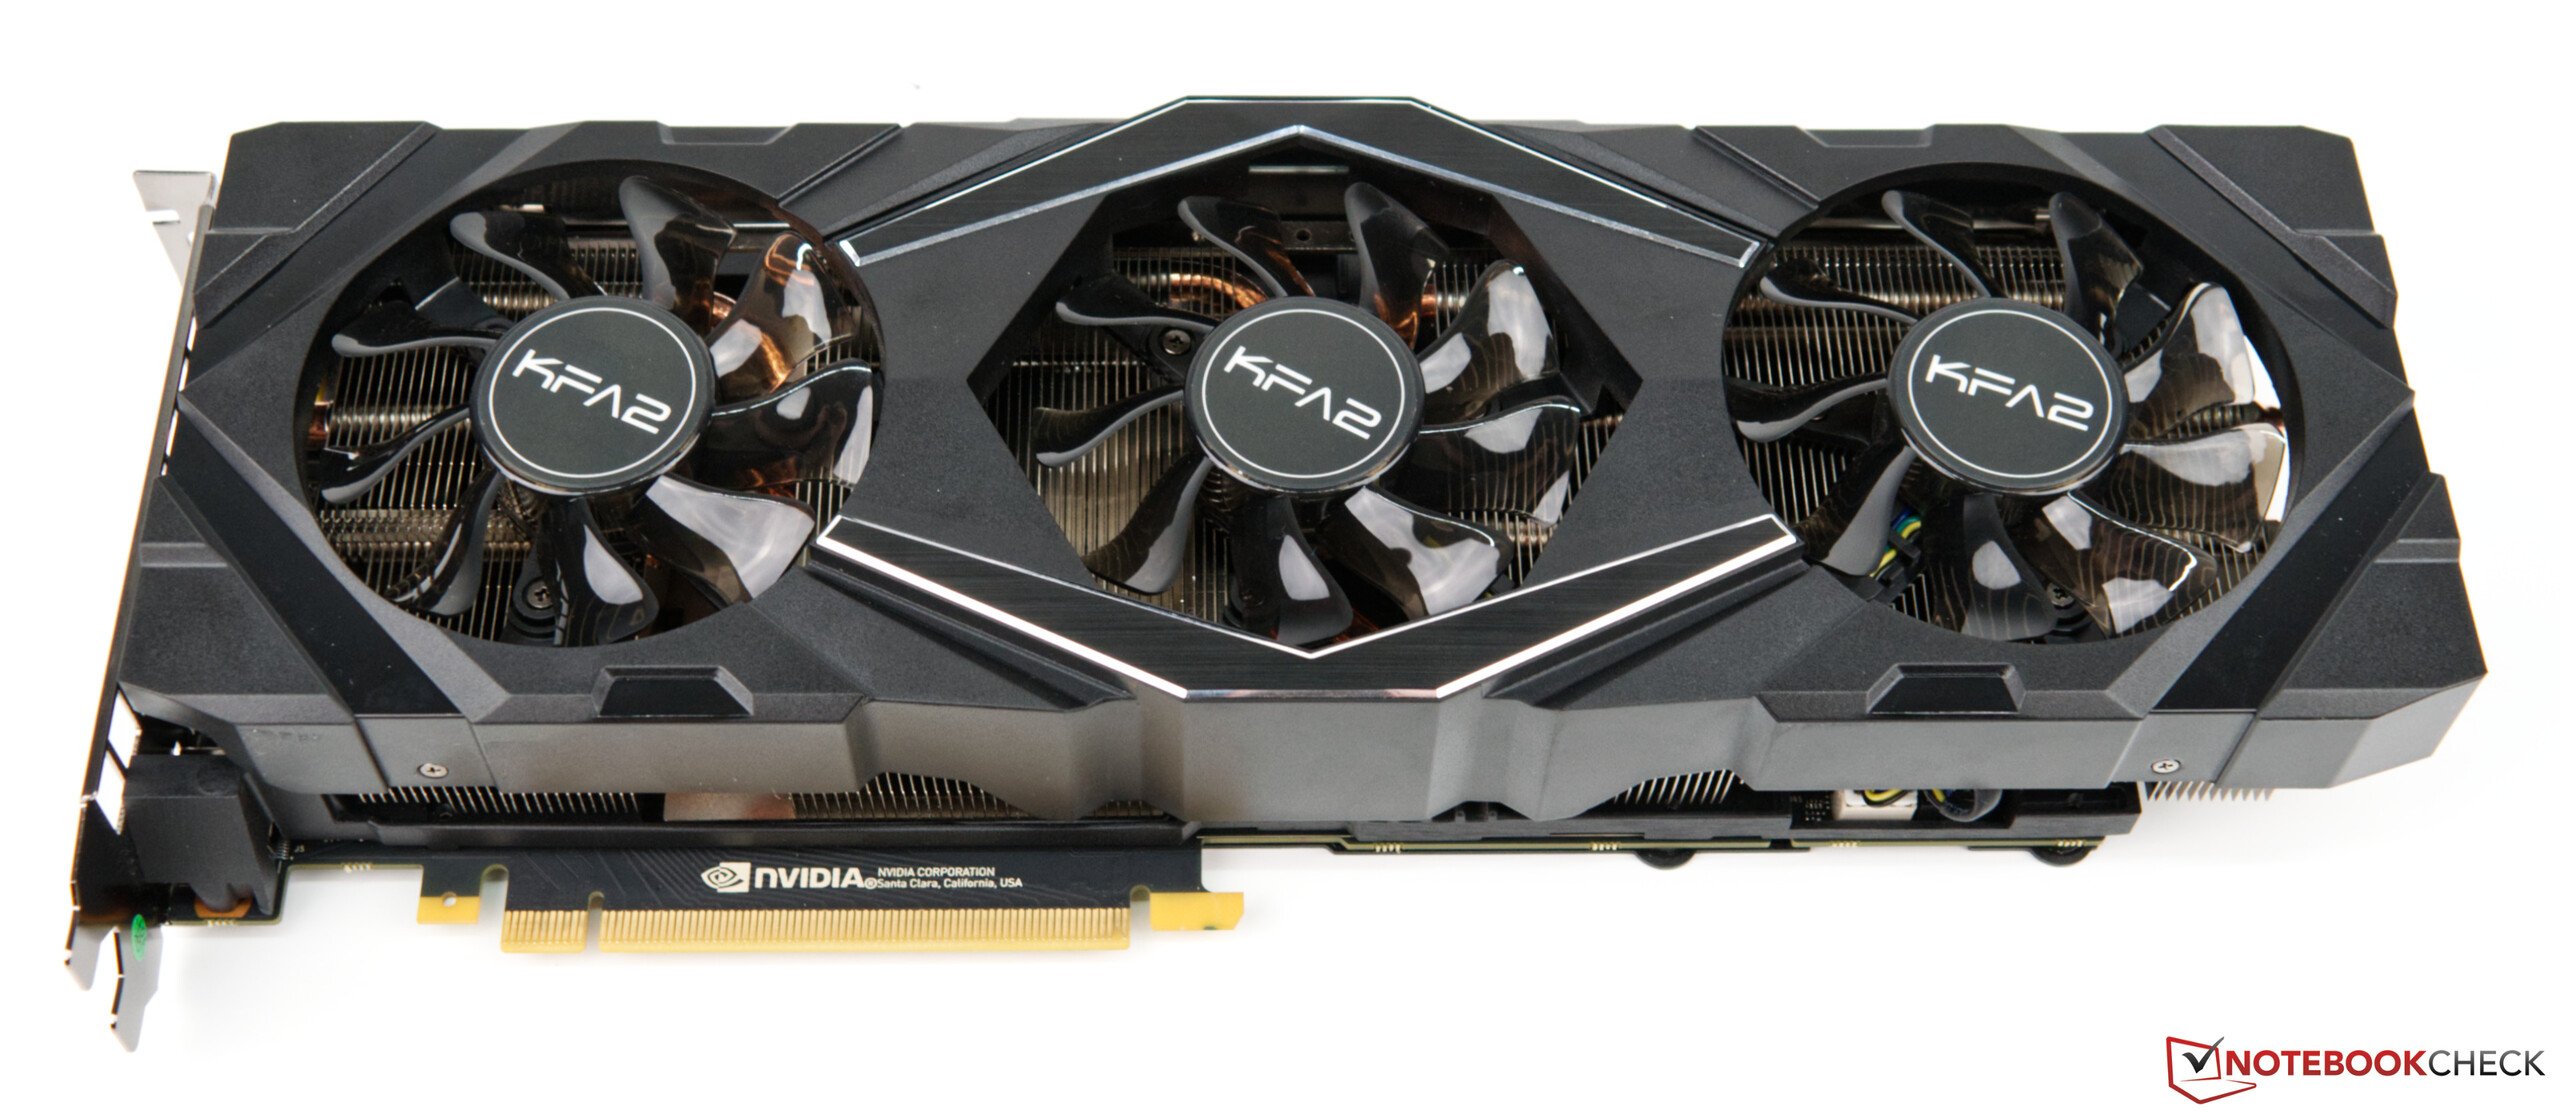
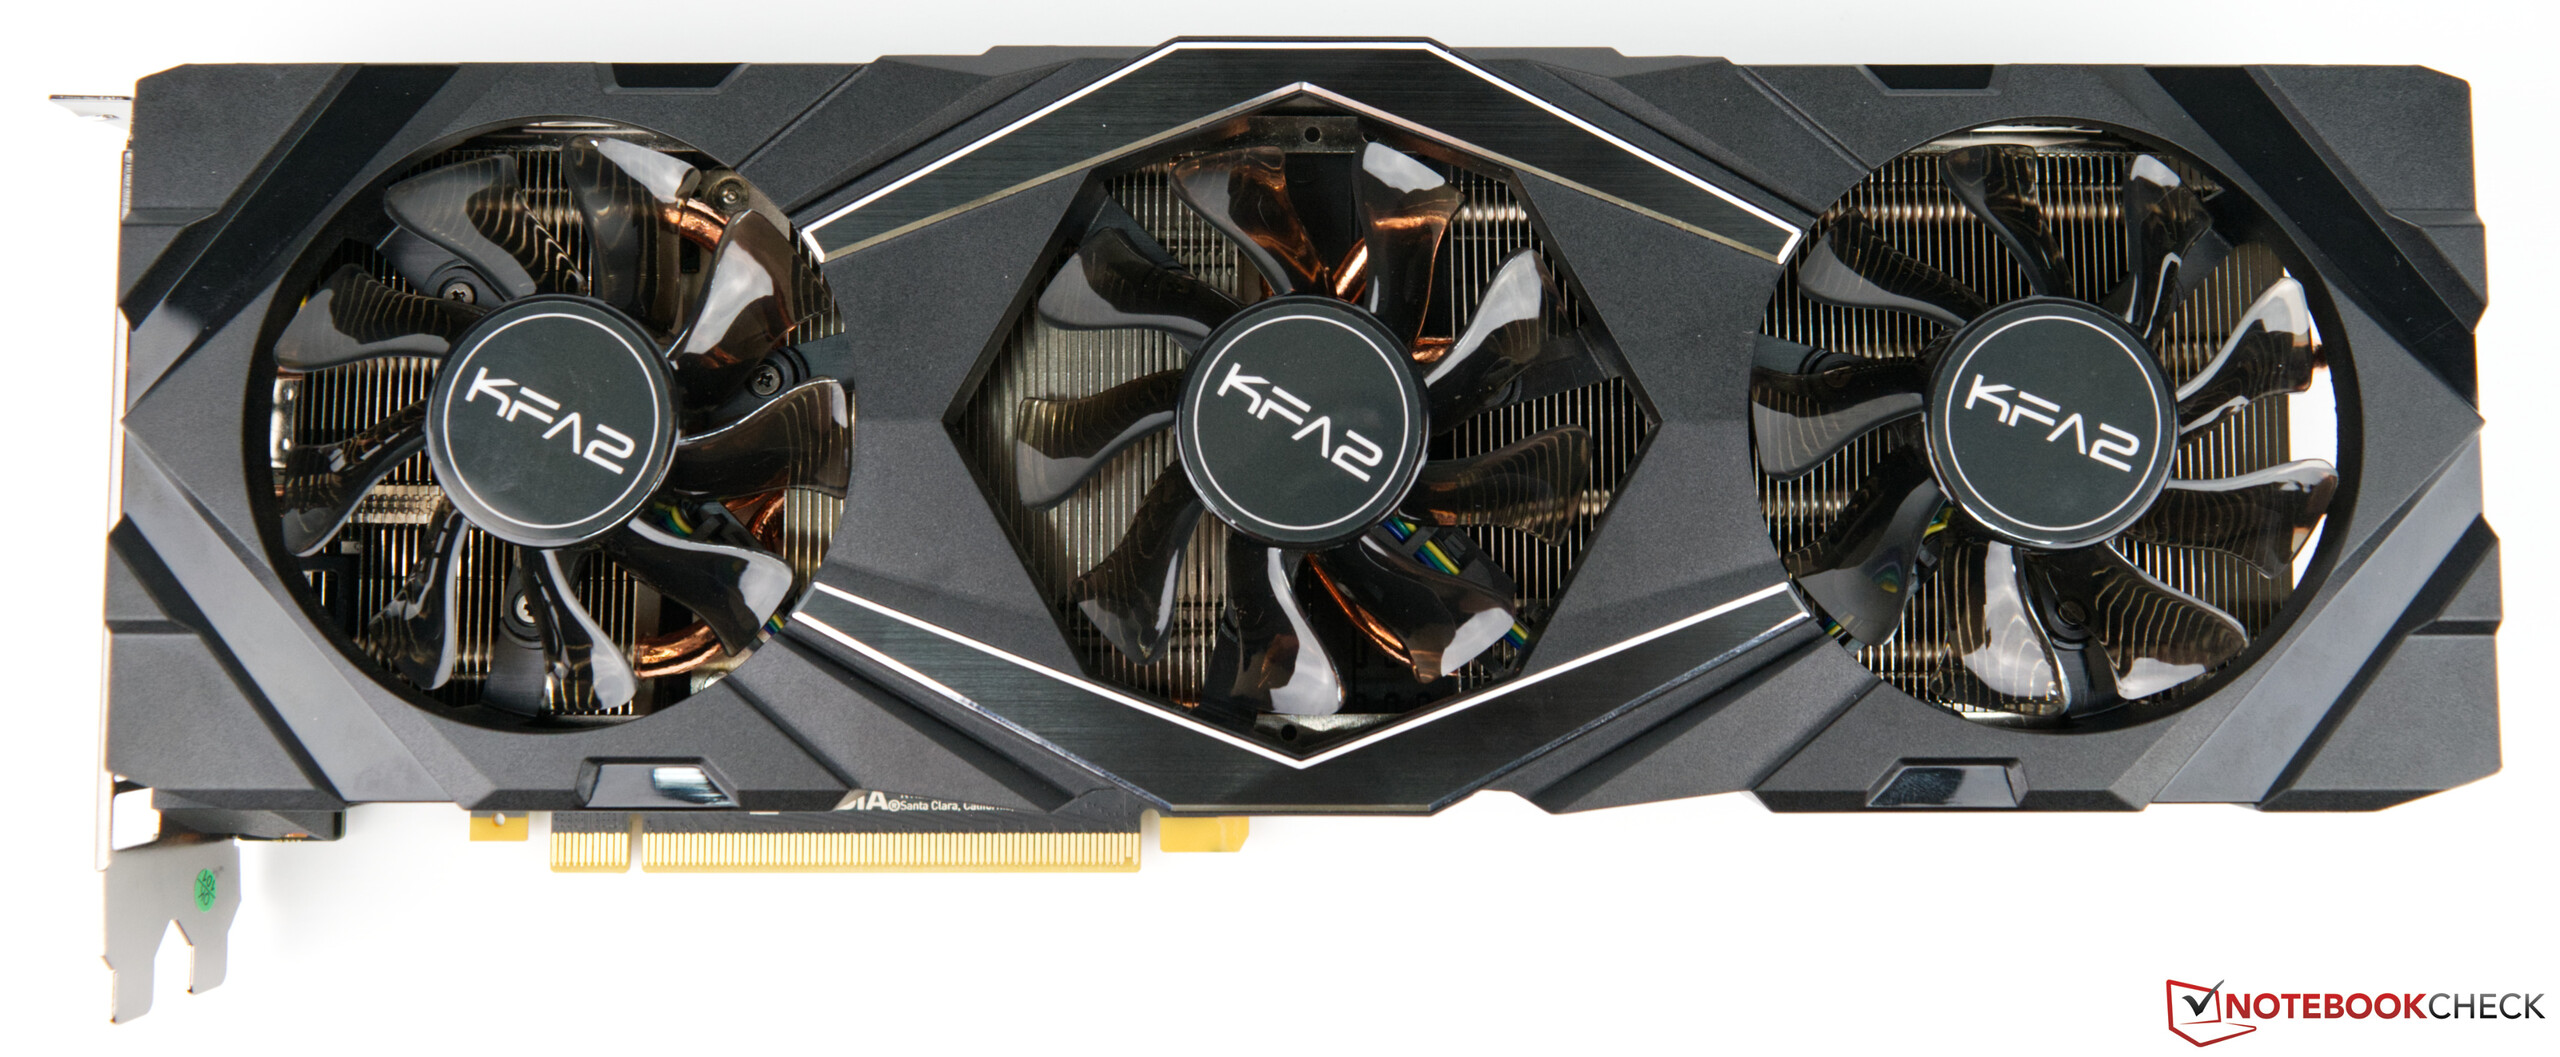
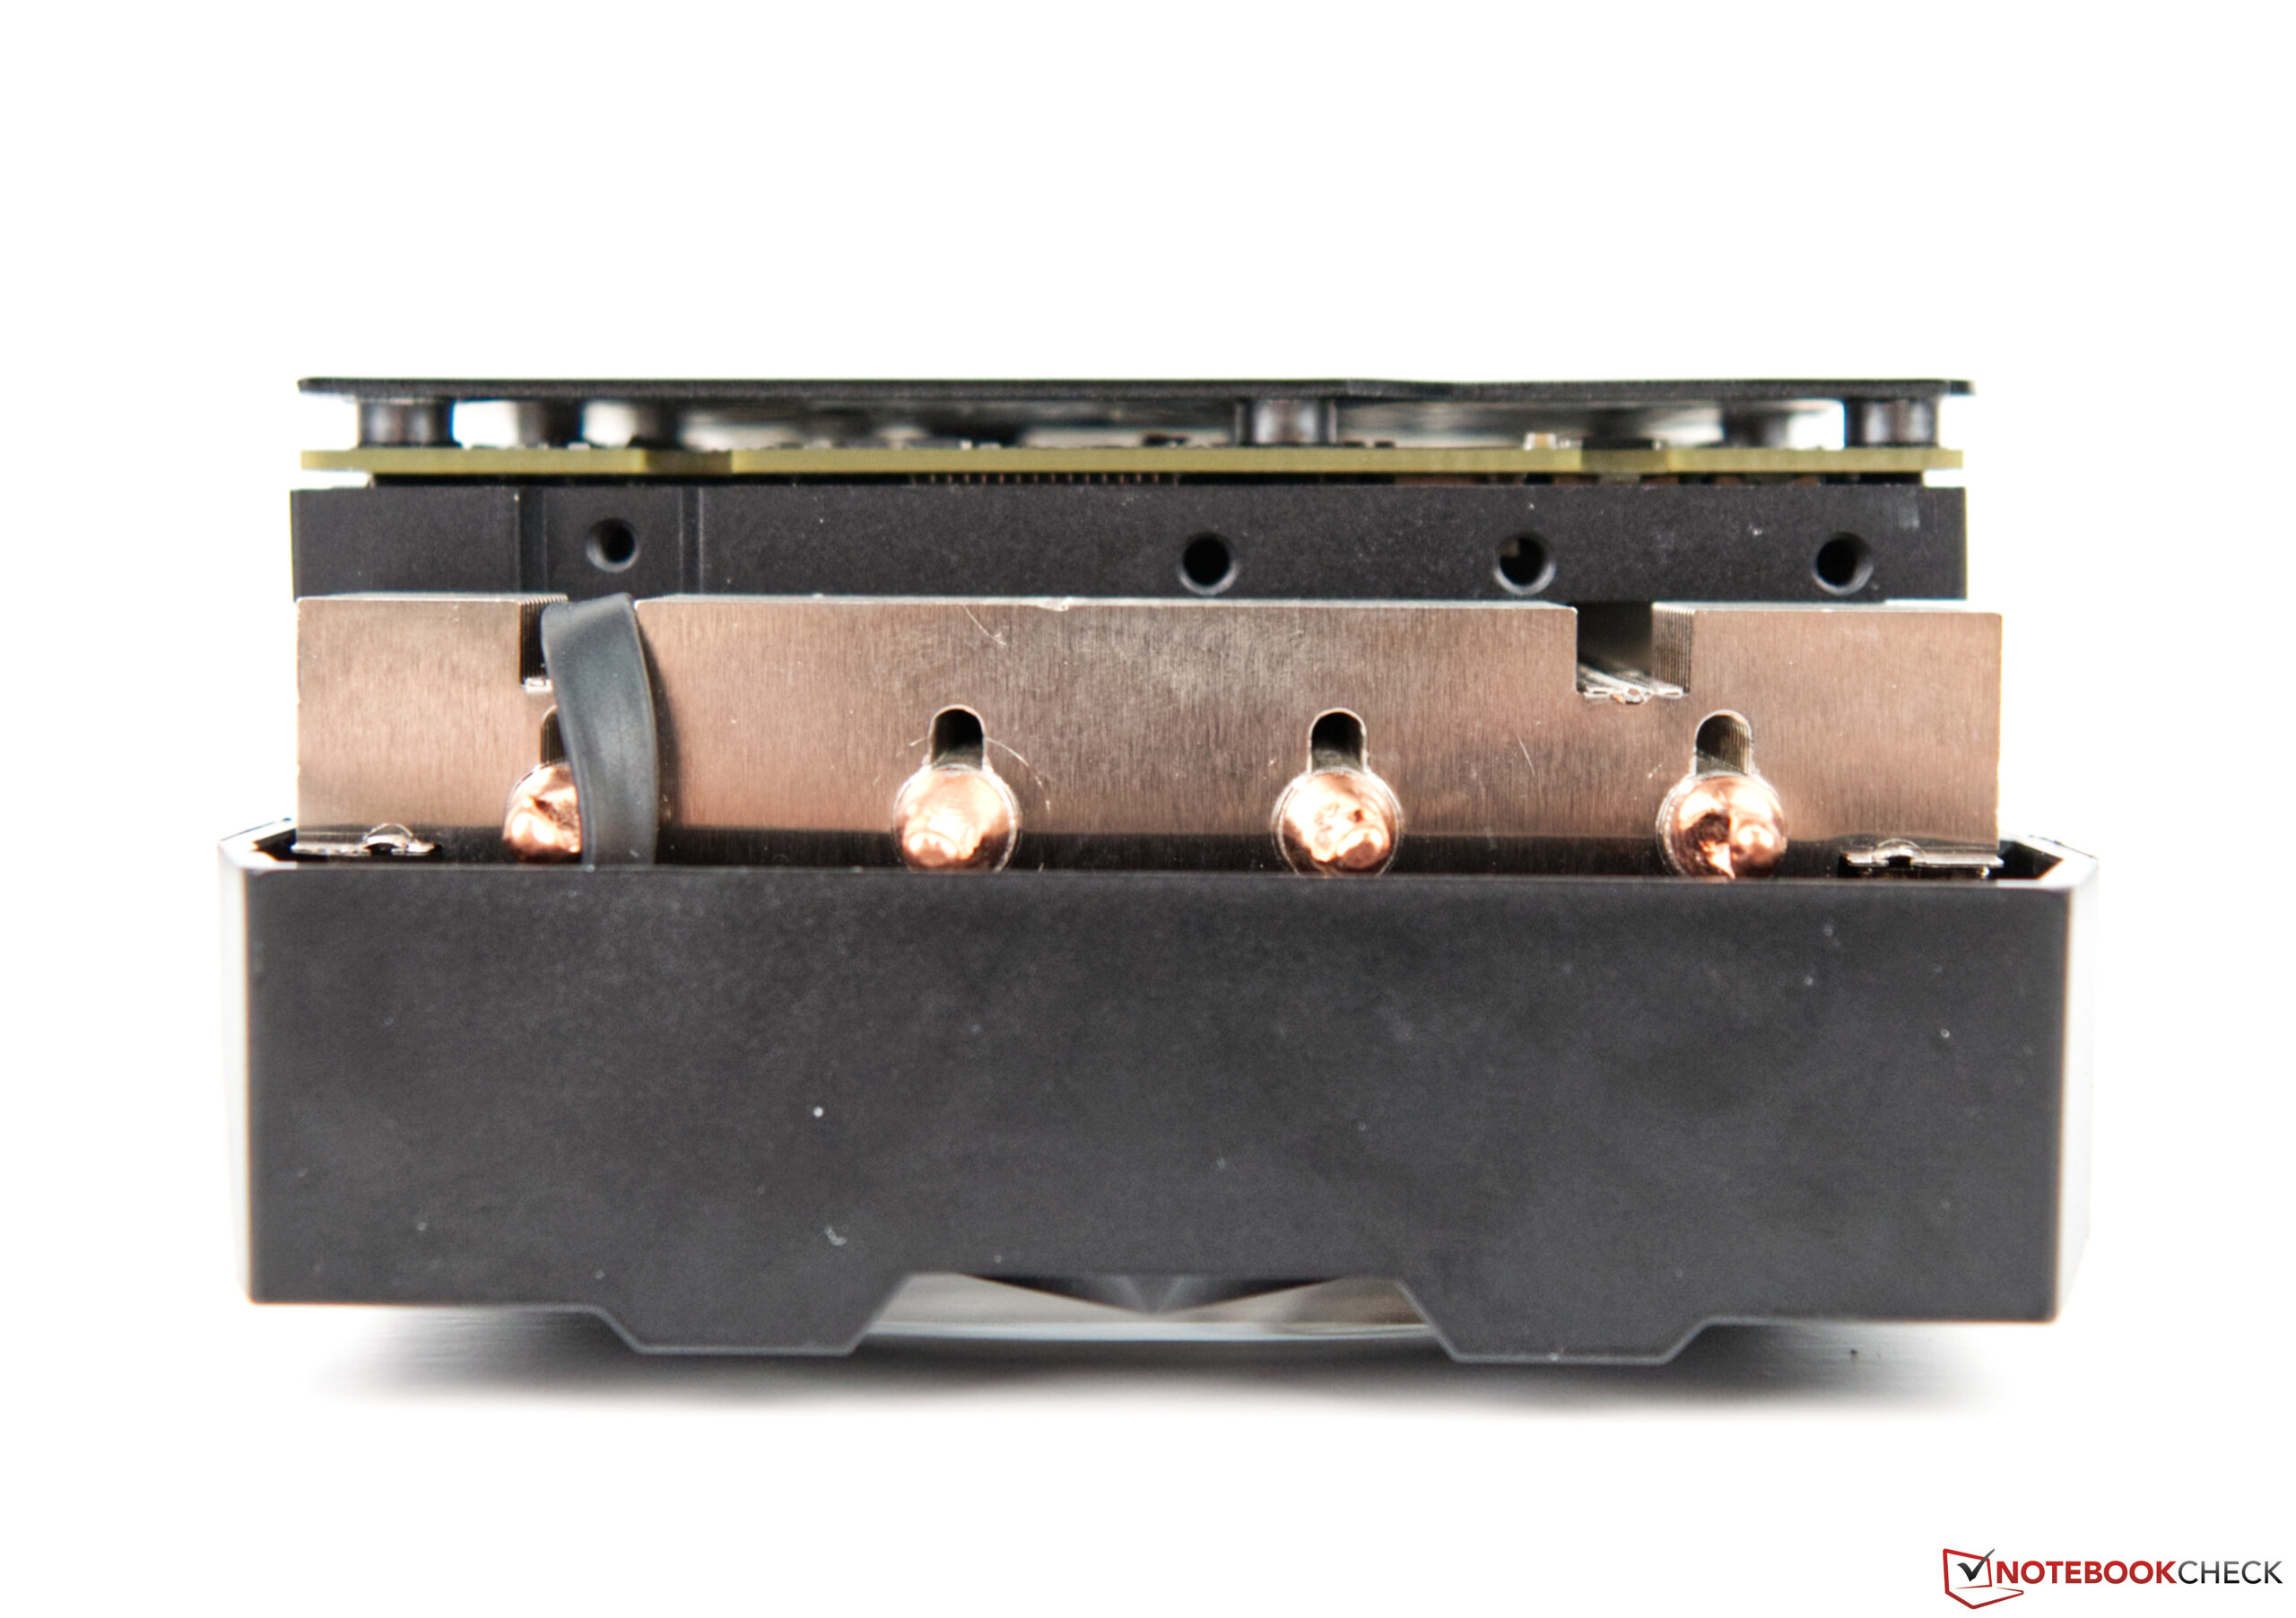
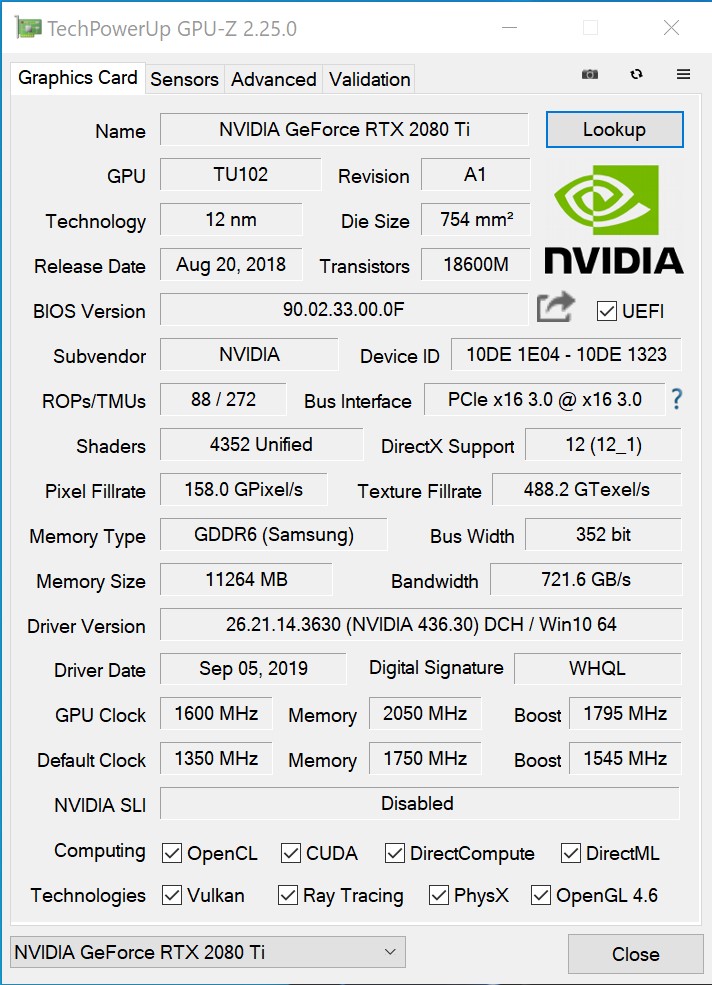
Bei den Hardwarespezifikationen ist die Grafikkarte aus dem Hause KFA2 ident mit den Referenzvorgaben von Nvidia. Optisch gibt es allerdings einige Unterscheidungen, denn das Kühldesign von KFA2 ist deutlich wuchtiger und mit drei Axiallüftern versehen. Bei der Platine bleibt aber alles beim Alten, was bedeutet, dass hier das Referenzmodell als Basis dient. Somit sollte es auch keine Kompatibilitätsprobleme geben, wenn man die Grafikkarte mit einem Full-Cover-Wasserblock bestücken möchte. Ein Blick in die Kompatibilitätsliste vor dem Kauf sollte dennoch gemacht werden.
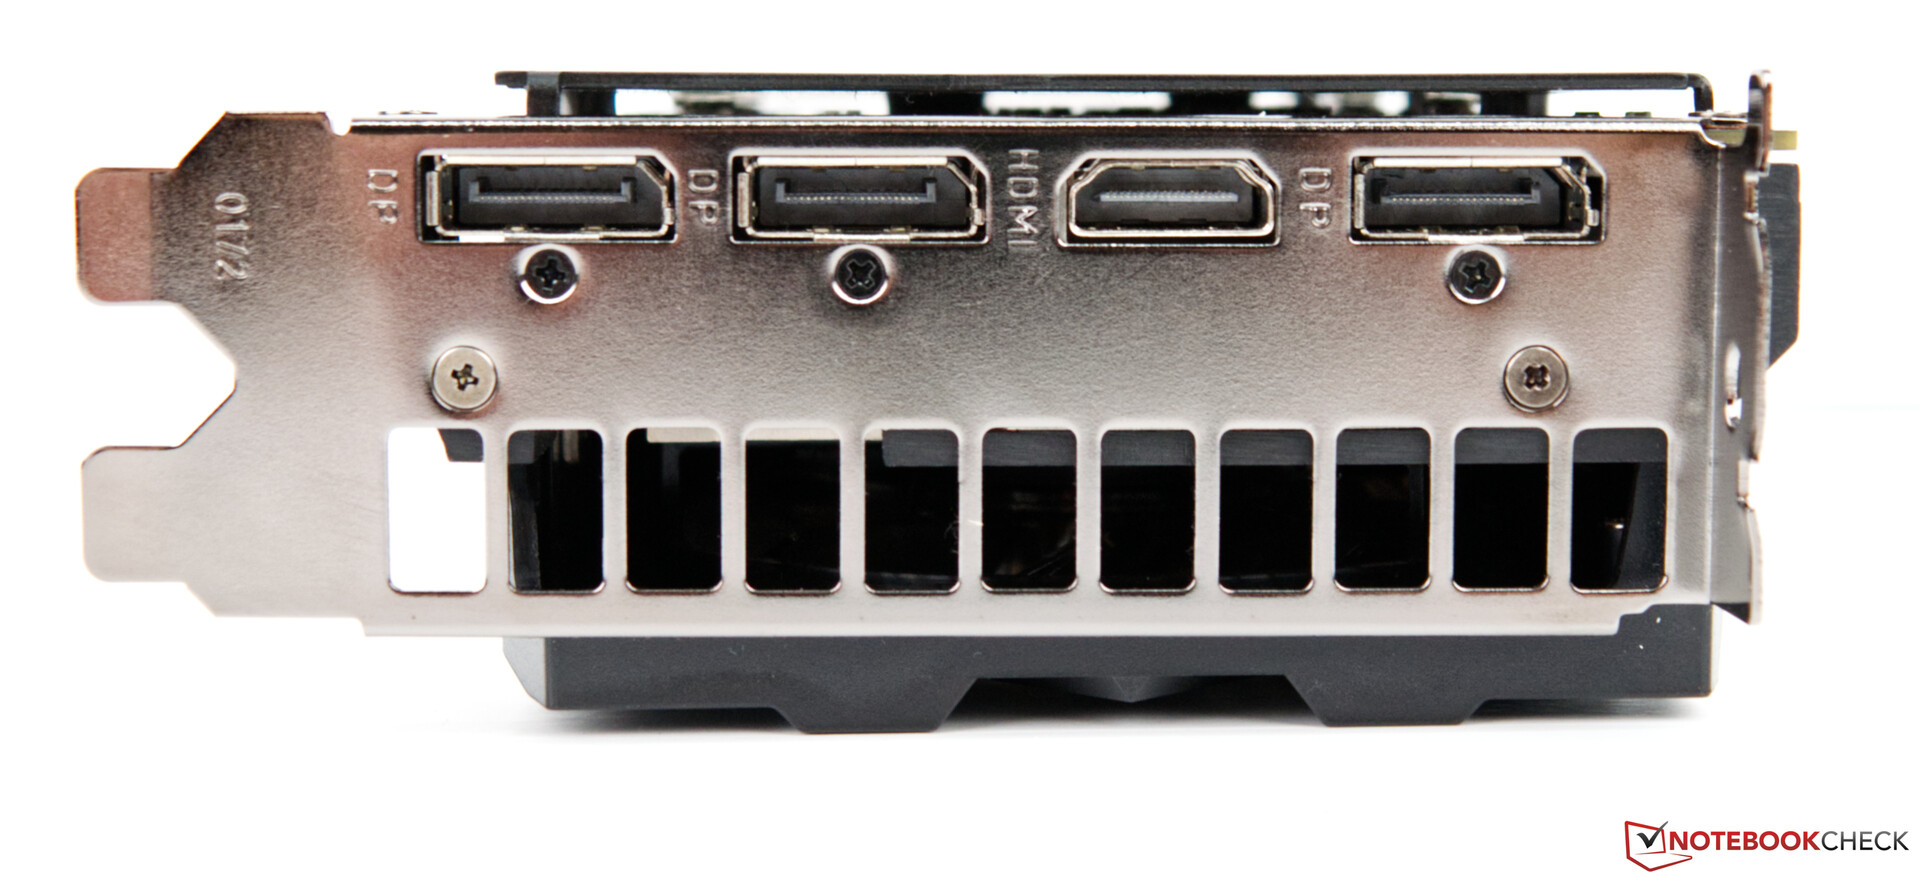
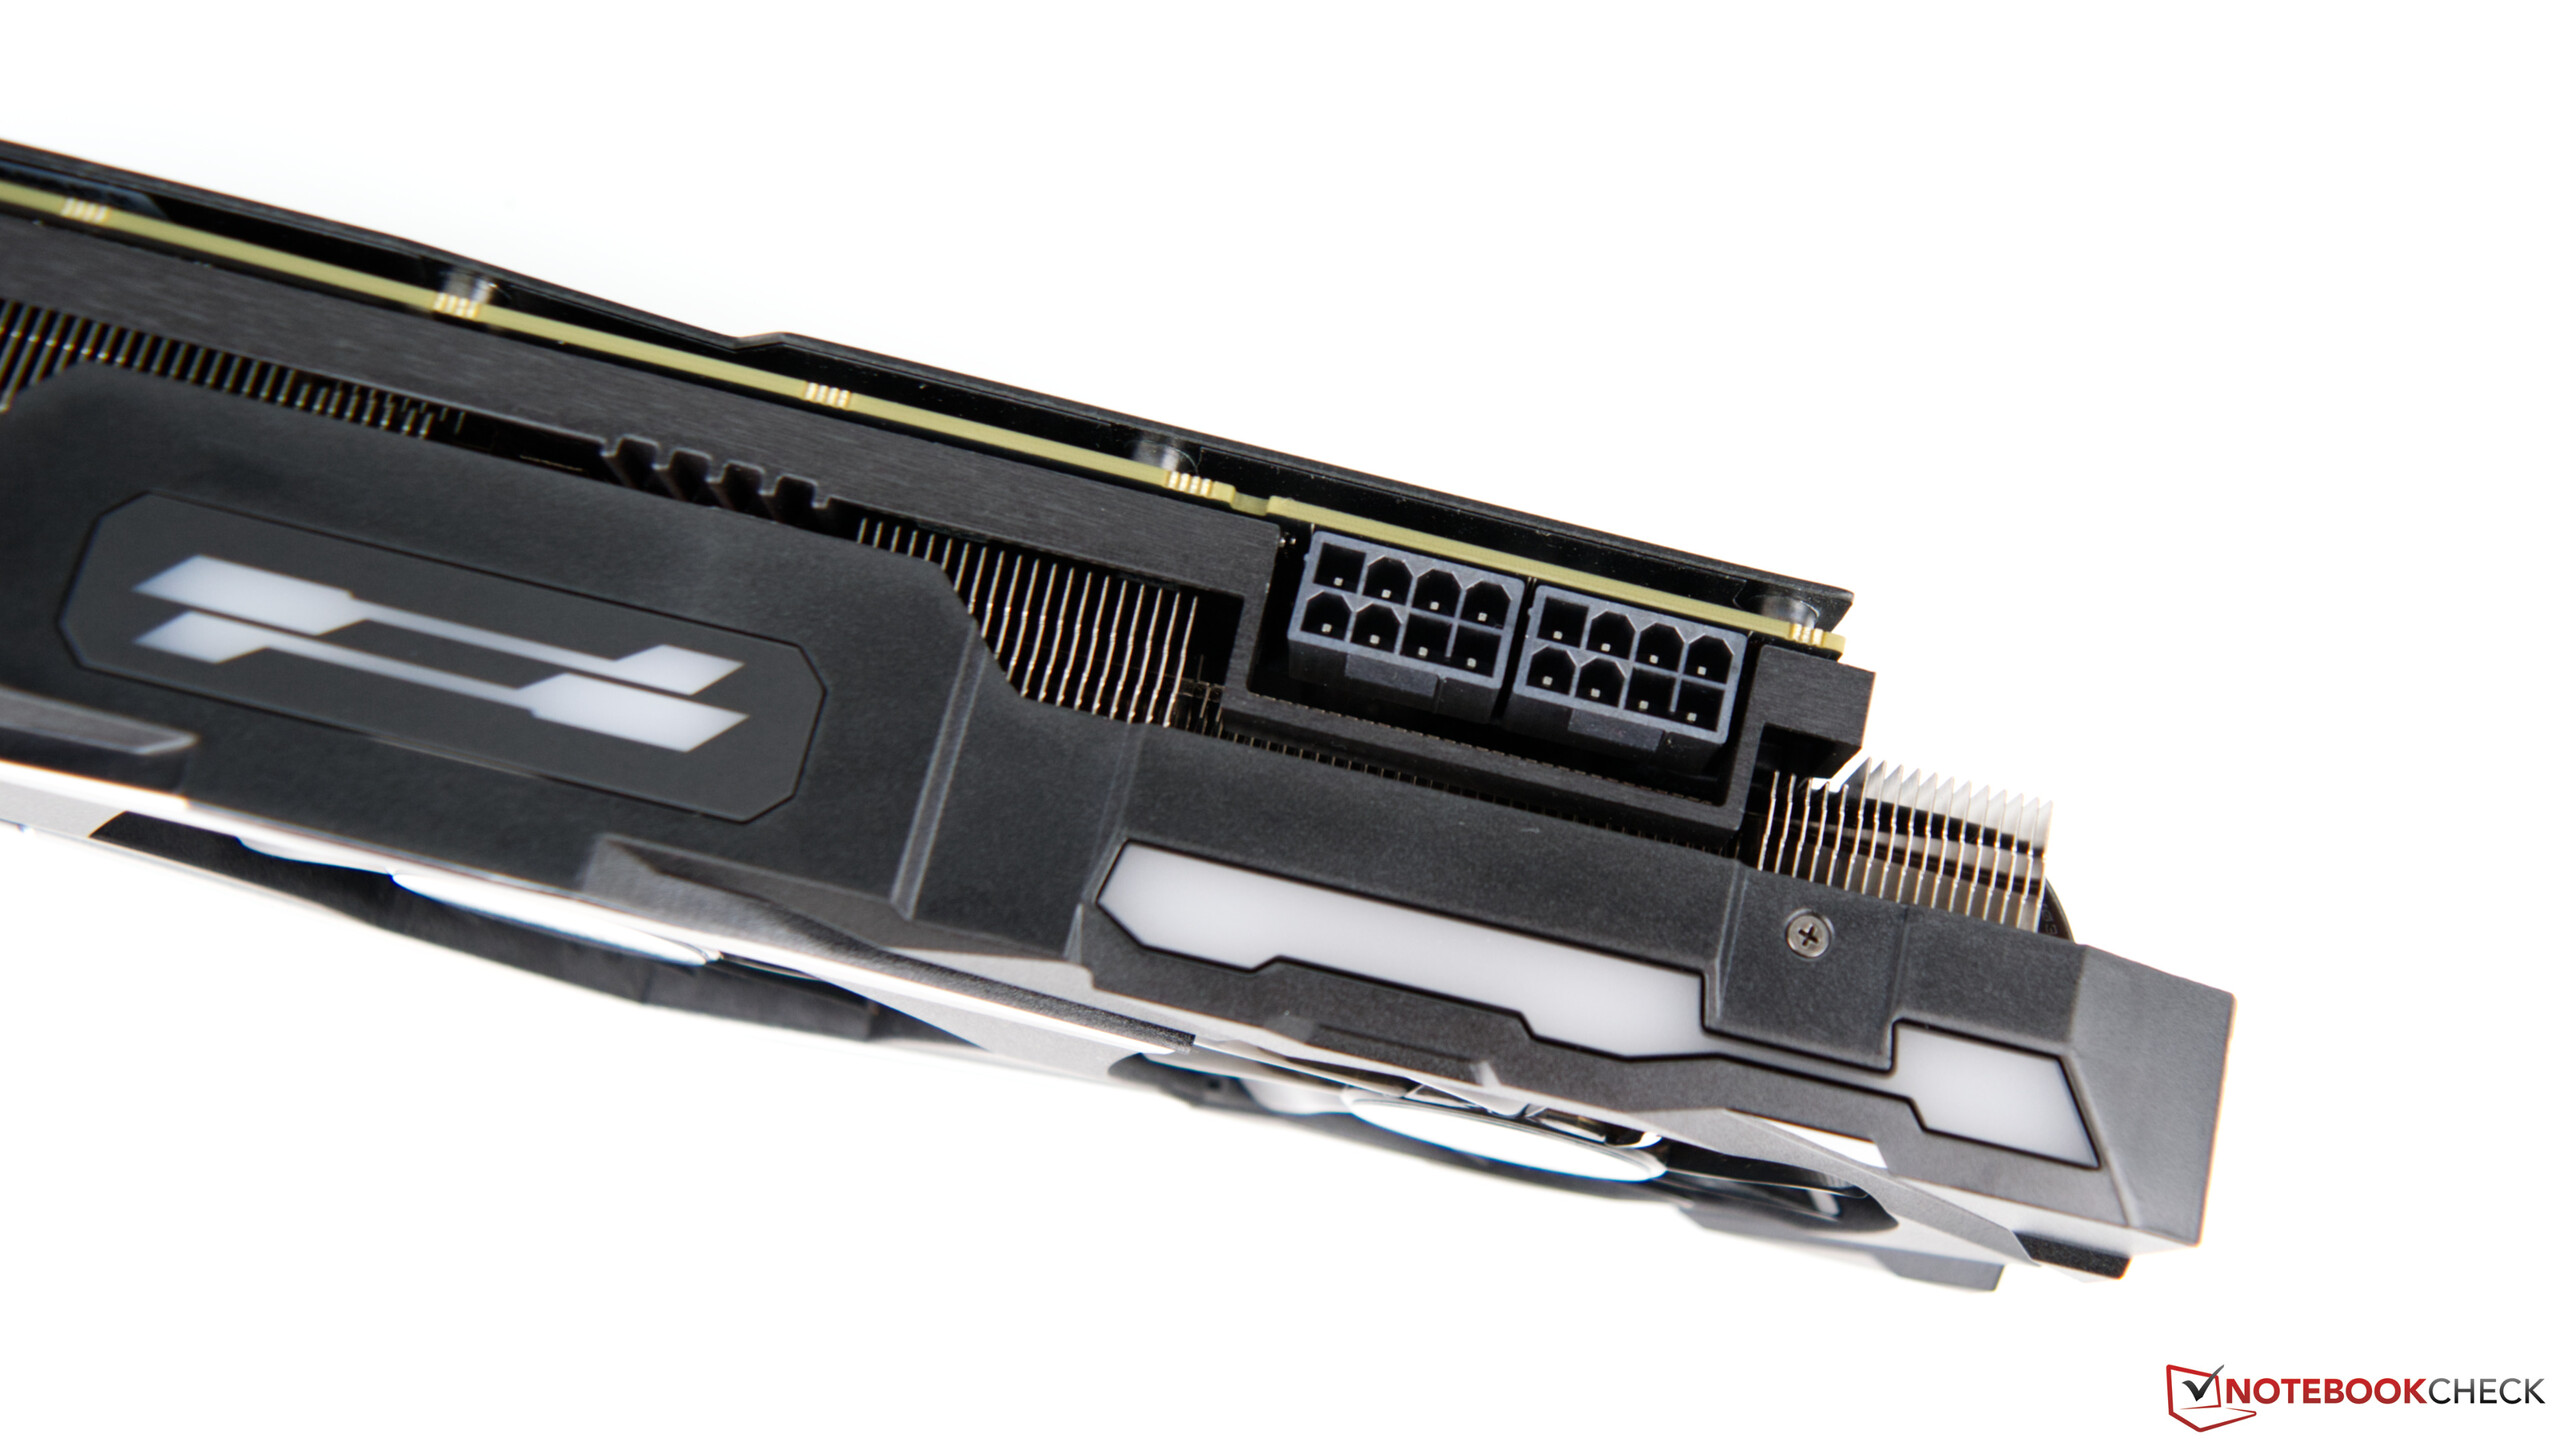
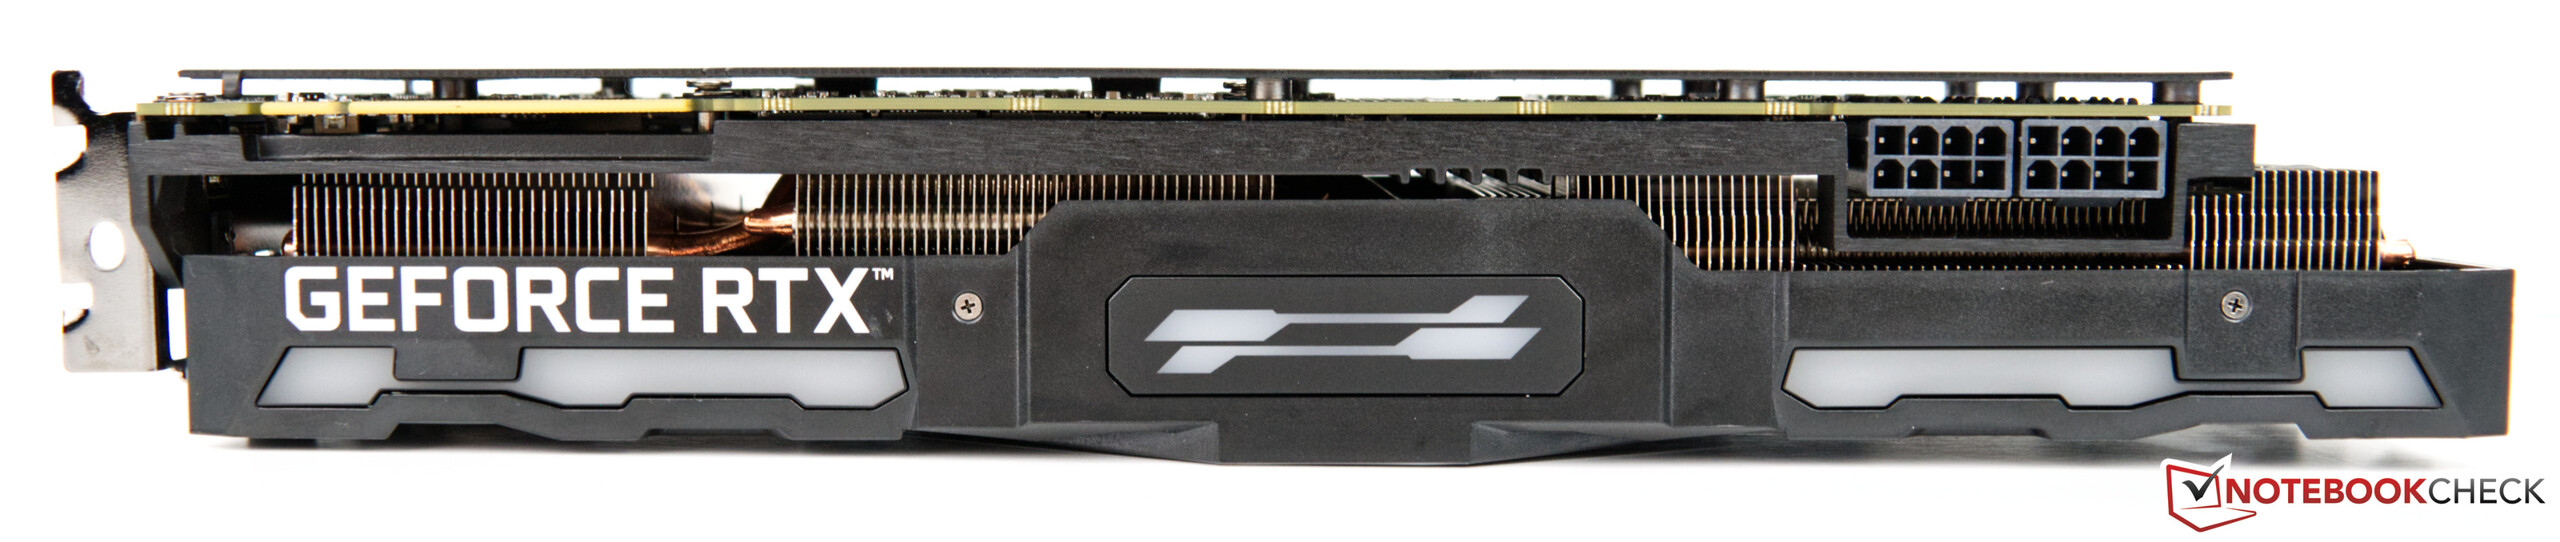
Zum Testzeitpunkt kostet die KFA 2 GeForce RTX 2080 Ti EX ca. 1.070 Euro, was immer noch ein stolzer Preis für eine Grafikkarte ist. Im Vergleich dazu kostet die Founders Edition allerdings deutlich mehr. Hier verlangt Nvidia 1.259 Euro. Somit relativiert sich der Preis etwas und das Modell von KAF2 ist damit sogar eine der günstigsten am Markt. Wer zum KFA2 Modell greifen möchte, bekommt eine sehr schnelle Grafikkarte mit einem guten Kühler, welcher im 2D-Betrieb fast lautlos arbeitet. Auch auf RGB muss nicht verzichtet werden, denn an der Seite befinden sich mehrere Elemente, die man per Xtreme Tuner konfigurieren kann. Extern verzichtet KFA2 allerdings auf einen Typ-C-Anschluss. Dieser wird vorrangig für VR benötigt. Wer keine VR-Hardware nutzt oder auch in absehbarer Zukunft nicht nutzen möchte, wird das Fehlen nicht missen. Weiterhin bietet die KFA2 GeForce RTX 2080 Ti EX viermal DisplayPort und einmal HDMI. Intern muss die 250-Watt-Platine mit zwei 8-Pin-Stromsteckern verbunden werden.
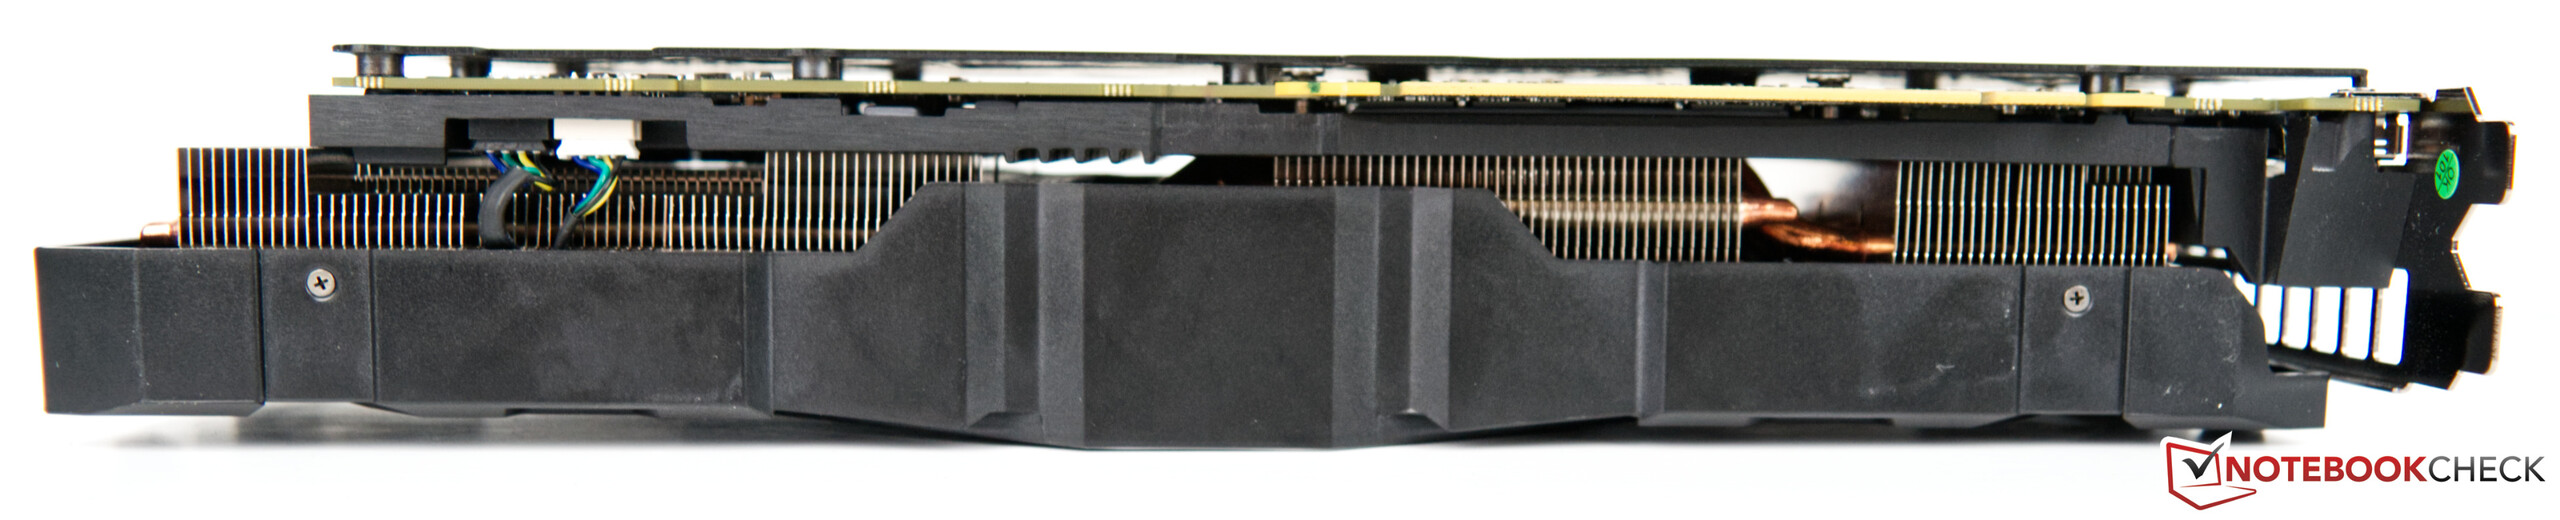
Da die sehr ausladende Kühlung deutlich über das PCB ragt, sollte das Gehäuse genügend Platz bieten. Im Vergleich zur Founders Edition ist die Karte von KFA2 ungefähr sechs Zentimeter länger.


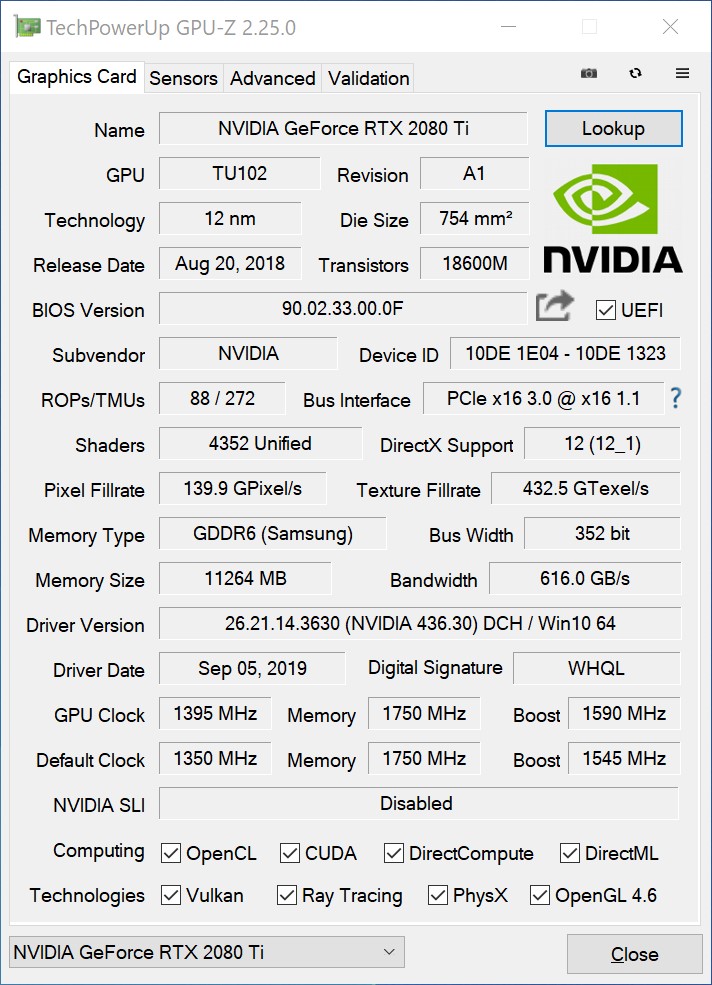
Die Turing-Spezifikationen im Detail
| Spezifikationen | RTX 2060 | RTX 2060S | RTX 2070 | RTX 2070S | RTX 2080 | RTX 2080S | RTX 2080 Ti | KFA2 RTX 2080 Ti | Titan RTX |
| Chip | TU106 | TU106 | TU106 | TU104 | TU104 | TU104 | TU102 | TU102 | TU102 |
| Manufactured | 12 nm | 12 nm | 12 nm | 12 nm | 12 nm | 12 nm | 12 nm | 12 nm | 12 nm |
| Shader | 1.920 | 2.176 | 2.304 | 2.560 | 2.944 | 3.072 | 4.352 | 4.352 | 4.608 |
| Texture Units | 120 | 136 | 144 | 160 | 184 | 192 | 272 | 272 | 288 |
| Tensor Cores | 240 | 272 | 288 | 320 | 368 | 384 | 544 | 544 | 572 |
| RT Cores | 30 | 34 | 36 | 40 | 46 | 48 | 68 | 68 | 72 |
| GPU Base Clock | 1.365 MHz | 1.470 MHz | 1.410 MHz | 1.605 MHz | 1.515 MHz | 1.650 MHz | 1.350 MHz | 1.350 MHz | 1.350 MHz |
| GPU Boost Clock | 1.680 MHz | 1.650 MHz | 1.620 MHz | 1.770 MHz | 1.710 MHz | 1.815 MHz | 1.545 MHz | 1.545 MHz | 1.770 MHz |
| Memory Bus | 192 Bit | 256 Bit | 256 Bit | 256 Bit | 256 Bit | 256 Bit | 352 Bit | 352 Bit | 384 Bit |
| Memory Bandwidth | 336 GB/s | 448 GB/s | 448 GB/s | 448 GB/s | 448 GB/s | 496,1 GB/s | 616 GB/s | 616 GB/s | 672 GB/s |
| Memory Size | 6 GB GDDR6 | 8 GB GDDR6 | 8 GB GDDR6 | 8 GB GDDR6 | 8 GB GDDR6 | 8 GB GDDR6 | 11 GB GDDR6 | 11 GB GDDR6 | 24 GB GDDR6 |
| Power (Watt) | 160 W | 175 W | 175 W | 215 W | 215 W | 250 W | 250 W | 250 W | 280 W |
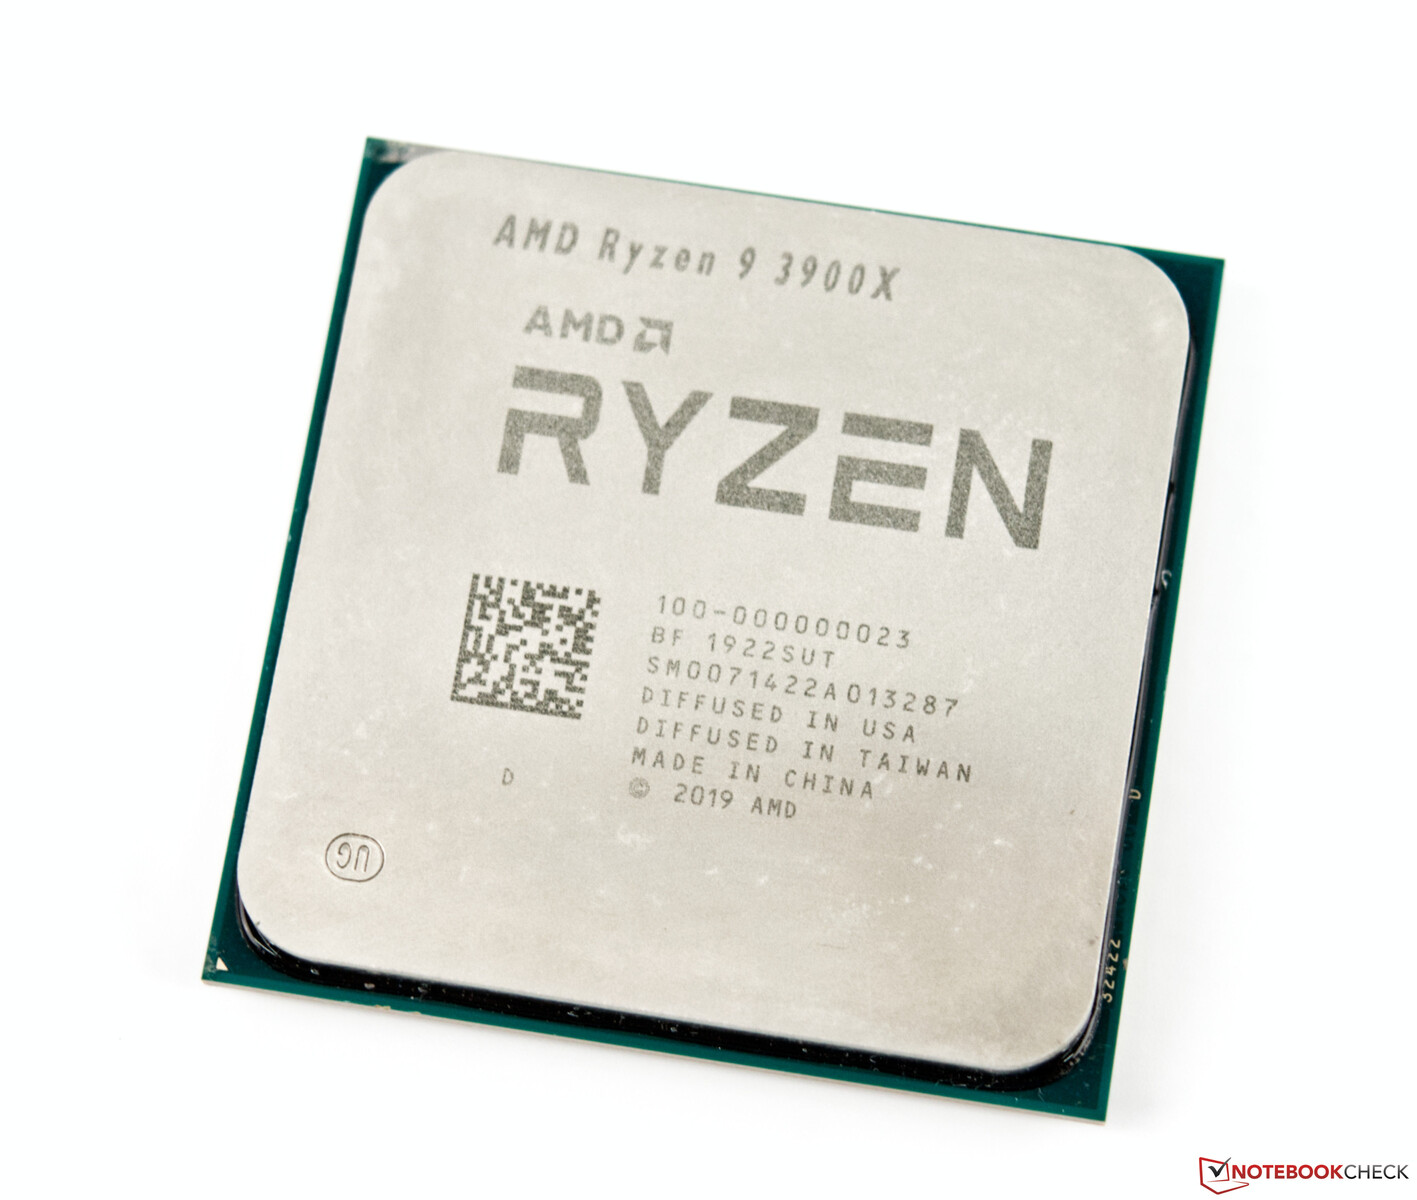
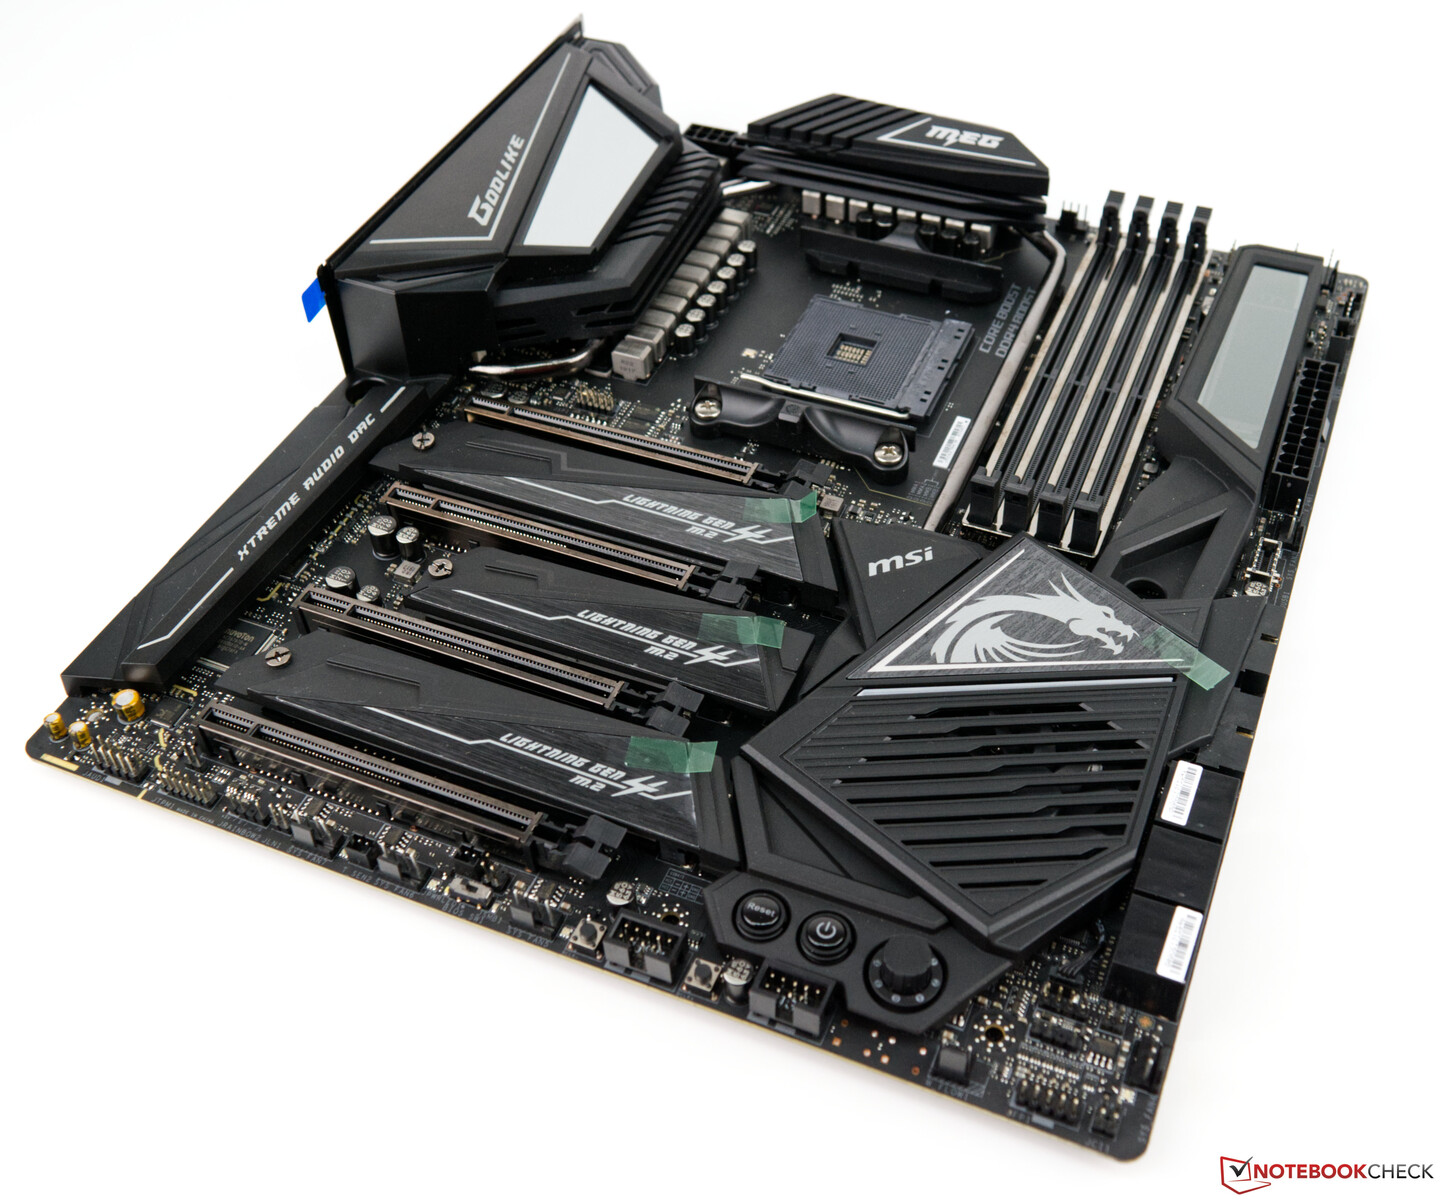
Unser Testsystem mit AMD Ryzen 9 3900X als Basis
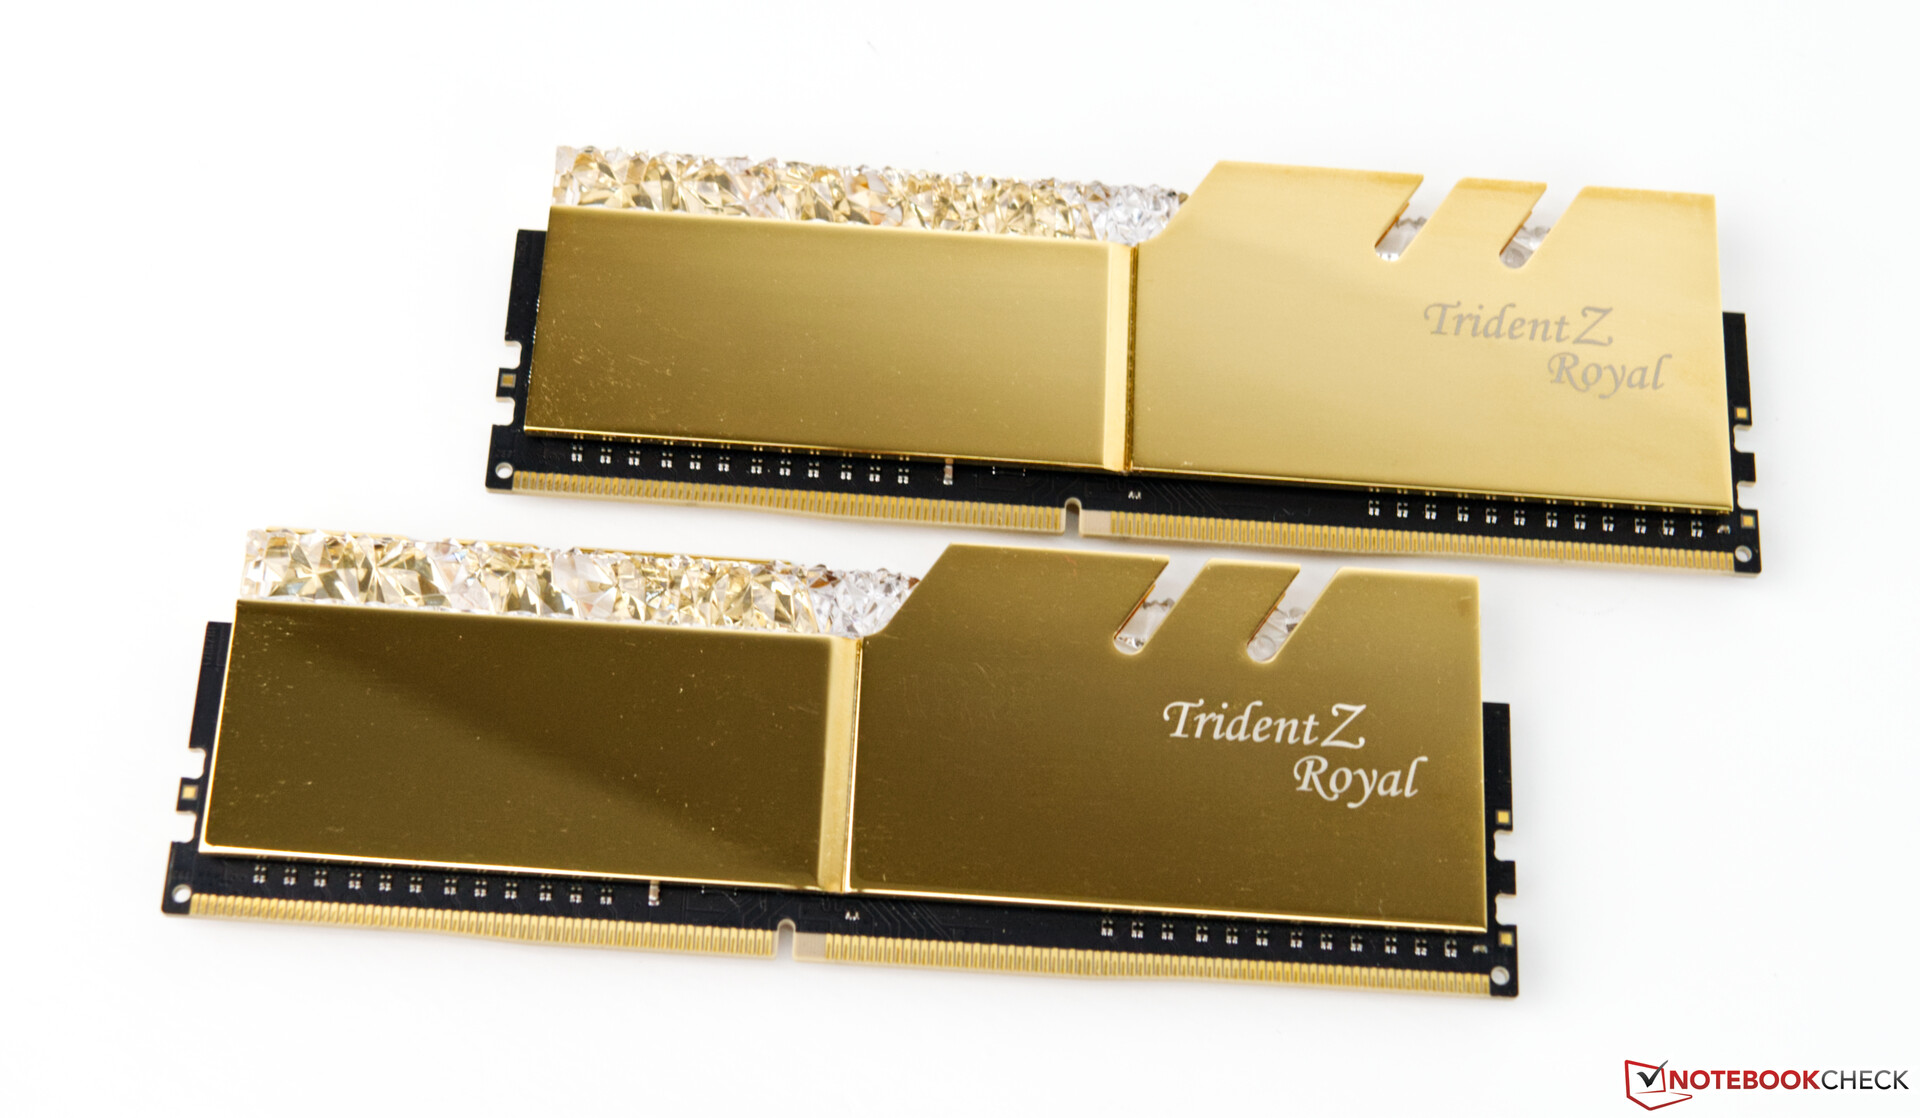
Als Testsystem dient eine aktuelle AMD-Plattform auf Basis des MSI MEG X570 Godlike. Die CPU (AMD Ryzen 9 3900X) bietet eine gute CPU-Leistung und als Kühlung nutzen wir eine AIO (Be Quiet Silent Loop 280mm). Der 16-GB-Arbeitsspeicher stammt von G-Skill und taktet mit 3.600 MHz. Als Monitor nutzen wir den Acer Predator XB321HK. Dieser schränkt uns aufgrund der UHD-Tauglichkeit nicht ein. Ein großer Dank geht an dieser Stelle an AMD für die Bereitstellung der Testplattform.
Für die folgenden Benchmarks und Tests nutzen wir folgendes System:
- Corsair Carbide Air 540 ATX Cube
- AMD Ryzen 9 3900X
- KFA2 GeForce RTX 2080 Ti EX 1-Click-OC (Treiber Nvidia 436.30)
- MSI MEG X570 Godlike (BIOS 1.20, Default Settings, XMP 1 für DDR4-3600 CL16)
- Antec-1200-Watt-Netzteil
- G-Skill Trident Z Royal gold DDR4-3600 Speicherkit 2 x 8 GB, eingestellt auf DDR4-3600 CL16-16-16-36
- Corsair MP600 2TB M.2 PCIe-4.0-SSD
- Crucial MX500 2TB (für Spiele)
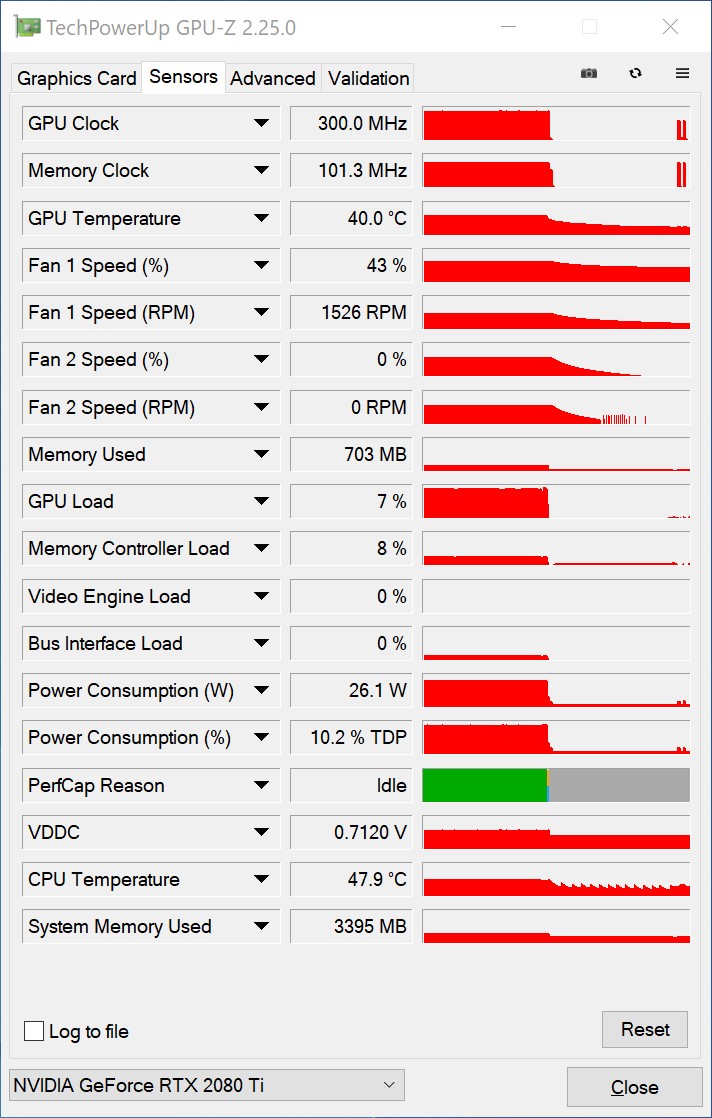
Die Taktraten der KFA2 GeForce RTX 2080 Ti EX
Bei den Taktraten ändert sich im Vergleich zum Referenzdesign der RTX 2080 Ti nichts. Der Basistakt ist mit 1.350 MHz angegeben und beim Boost gibt KFA2 1.545 MHz an. Dass der Boost-Takt jedoch nicht wirklich aussagekräftig ist, lässt sich unter Last beobachten. So wird dieser Wert in Spielen so gut wie immer überboten und erreicht locker 1.800 – 1.900 Mhz. Der 11 GB große VRAM taktet mit 1.750 MHz, was effektiv 14 GHz entspricht. Aufgrund des Speicherbusses von 352 Bit liegt die Speicherbandbreite bei 616 GB/s.
Das Power-Limit der Grafikkarte liegt bei 250 Watt. Das sind 10 Watt weniger als bei der Founders Edition. Fast immer erreicht die Grafikkarte das Power-Limit, sodass hier die Leistung der Karte beschränkt wird. Per Tool lässt sich dieses um maximal 8 Prozent erhöhen, wodurch beim Spielen ein höherer/stabilerer Boost erreicht werden kann. Die KFA2 GeForce RTX 2080 Ti EX ist mit dem 1-Click-OC-Feature ausgestattet, welches den Basistakt um 45 MHz anhebt. Gleichzeitig wird auch das Power-Limit auf 108 Prozent gesetzt.

Synthetische Benchmarks
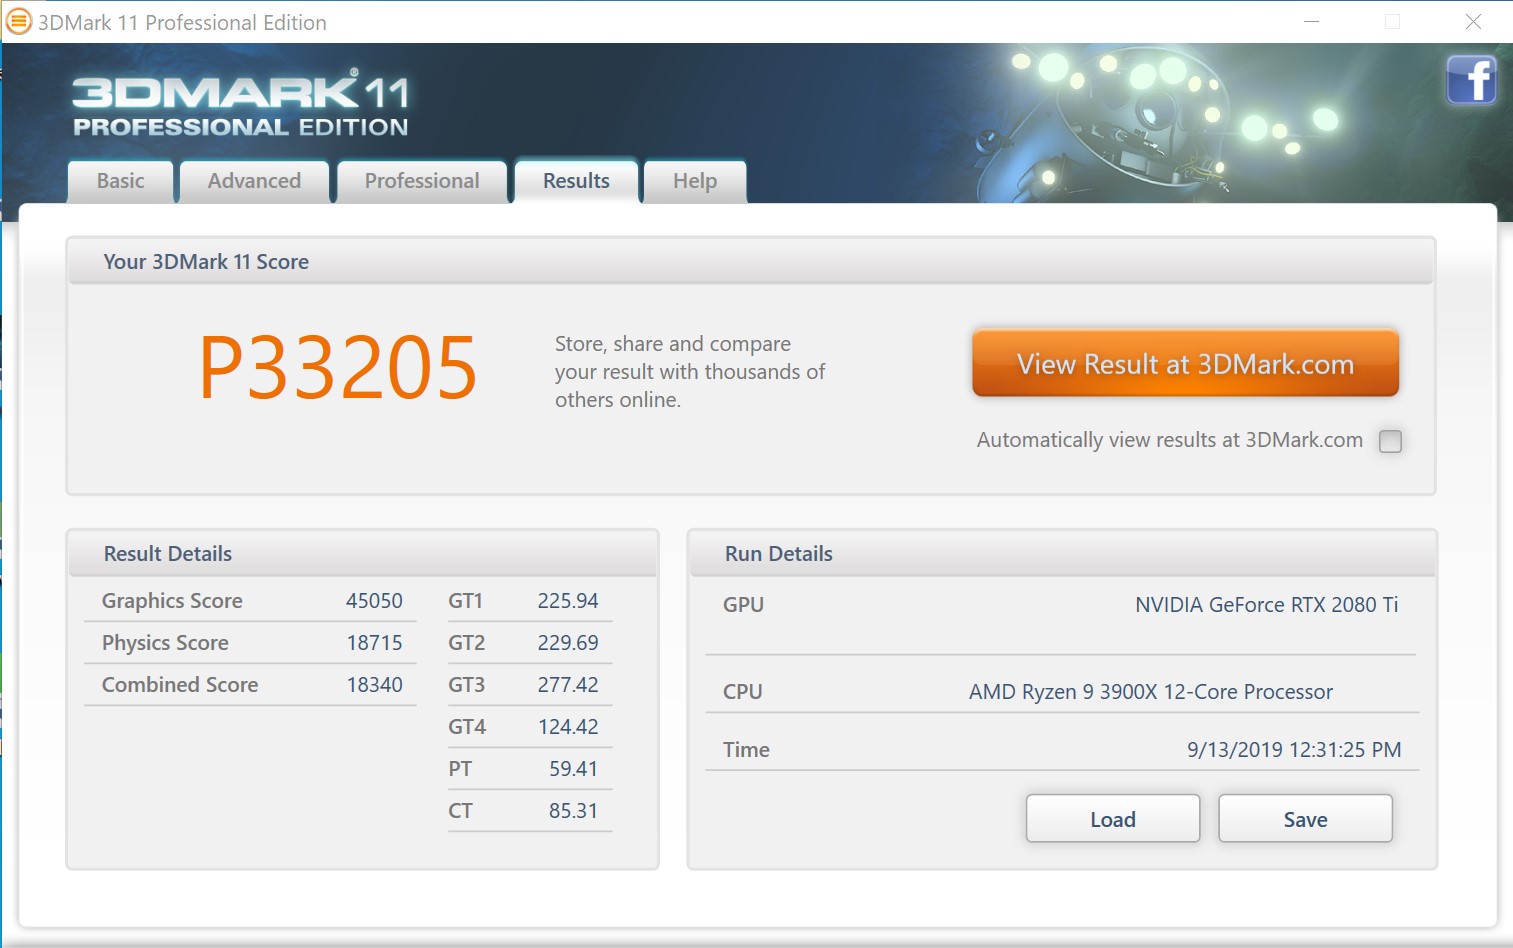
Schon bei den synthetischen Benchmarks können wir der KFA2 GeForce RTX 2080 Ti EX eine sehr gute Leistung attestieren. Gegenüber der GeForce RTX 2080 Ti aus dem Corsair One i160 muss sich unser Testsystem allerdings geschlagen geben. Dies zeigt einmal mehr, dass eine Intel Plattform noch immer die bessere Basis ist. Mit einem Rückstand von nur vier Prozent ist der Abstand unseres Testsystems auf AMD Ryzen 9 Basis allerdings fast gleichauf. Mit einem deutlichen Vorsprung von 23 Prozent ist die GeForce RTX 2080 Ti schneller als eine GeForce RTX 2080 Super.
| 3DMark 05 Standard | 52639 Punkte | |
| 3DMark 06 Standard Score | 44825 Punkte | |
| 3DMark Vantage P Result | 82093 Punkte | |
| 3DMark 11 Performance | 33205 Punkte | |
| 3DMark Ice Storm Standard Score | 209400 Punkte | |
| 3DMark Cloud Gate Standard Score | 57827 Punkte | |
| 3DMark Fire Strike Score | 25890 Punkte | |
| 3DMark Fire Strike Extreme Score | 15211 Punkte | |
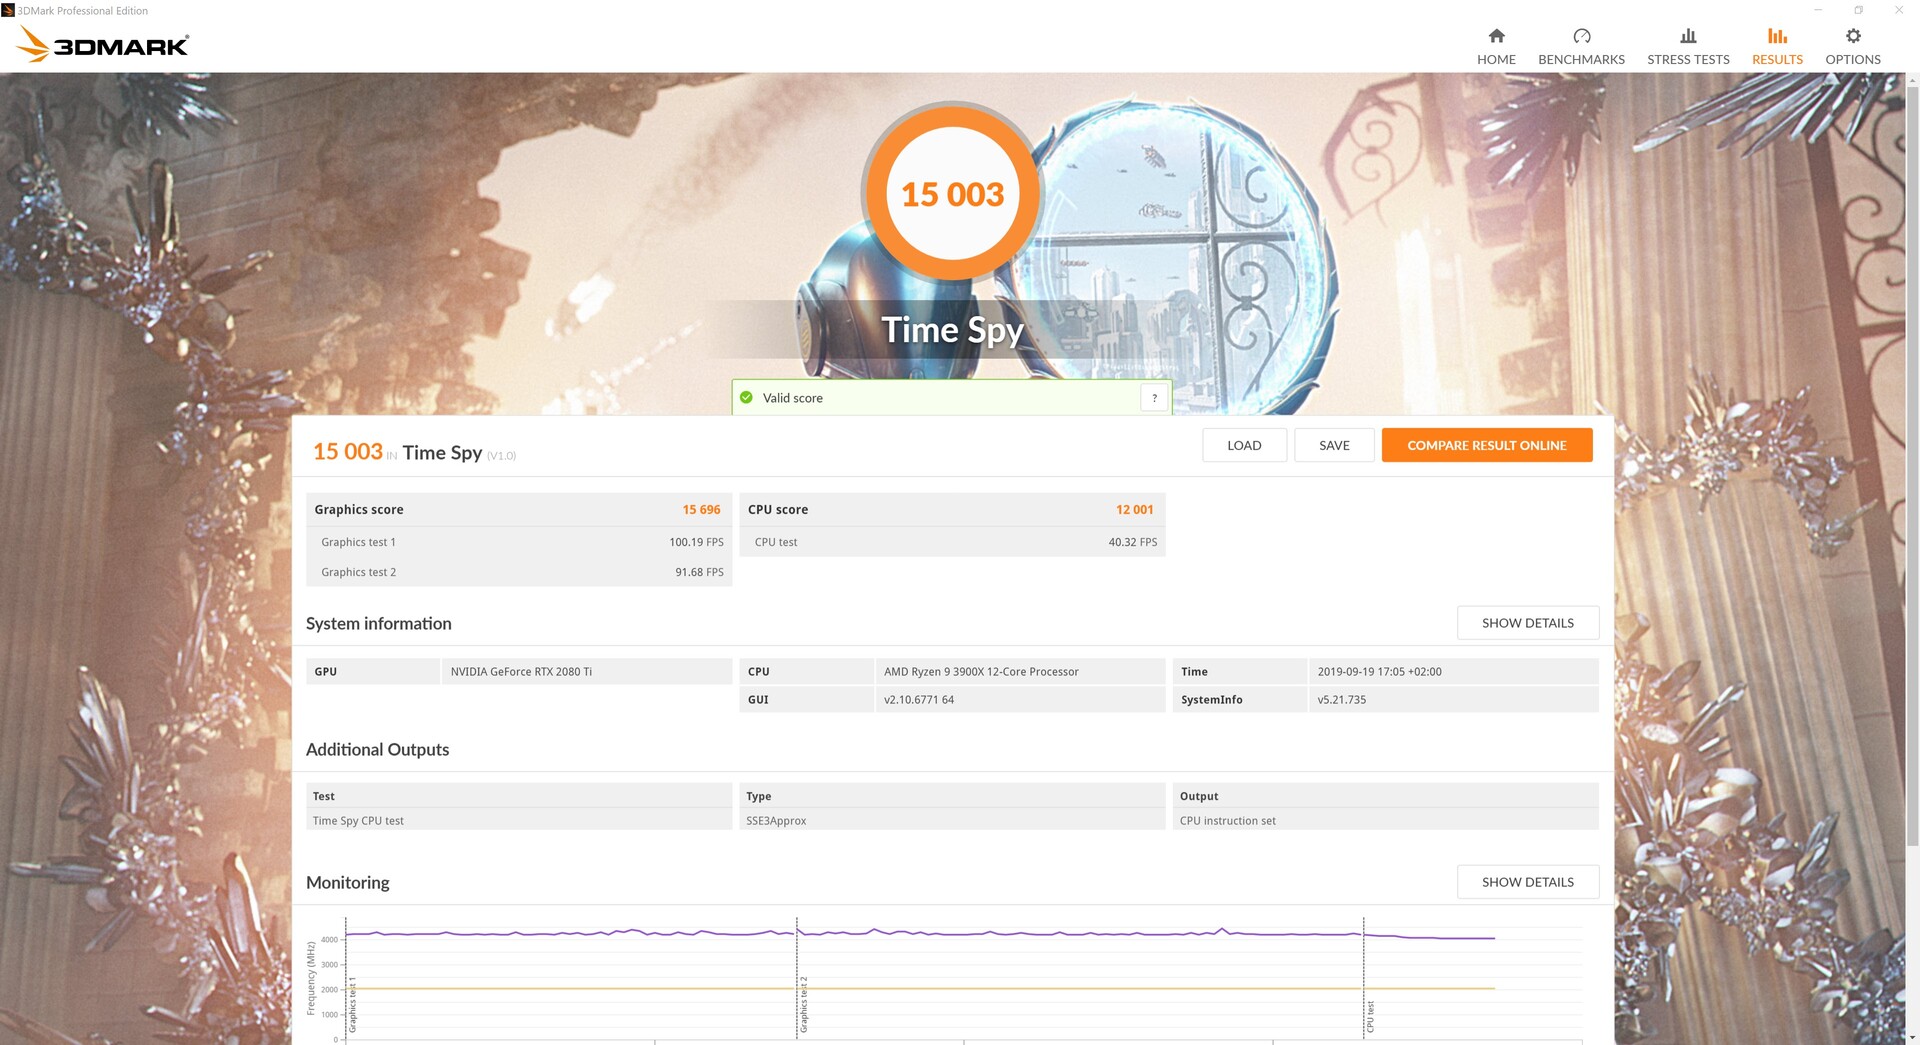
| 3DMark Time Spy Score | 13424 Punkte | |
Hilfe | ||
Spiele-Benchmarks

Die Spielebenchmarks zeigen eindeutig, dass die KFA2 GeForce RTX 2080 Ti eine sehr schnelle Grafikkarte ist. Dabei ist es egal, ob ein AMD Prozessor oder eine CPU von Intel im System steckt. Natürlich gibt es Spiele, welche auf einem der beiden Prozessoren mal besser und mal etwas schlechter performt. Da die Leistung der GeForce RTX 2080 Ti aber ohnehin nach sehr hohen Auflösungen verlangt, ist das CPU-Limit, welches bei geringen Auflösungen die Frameraten beeinflusst, nicht mehr gegeben. Mit der GeForce RTX 2080 Ti lassen sich alle gängigen Titel problemlos in 2160p genießen. Zudem sorgen die zusätzlichen RTX-Features für schöne Effekte im Spiel.
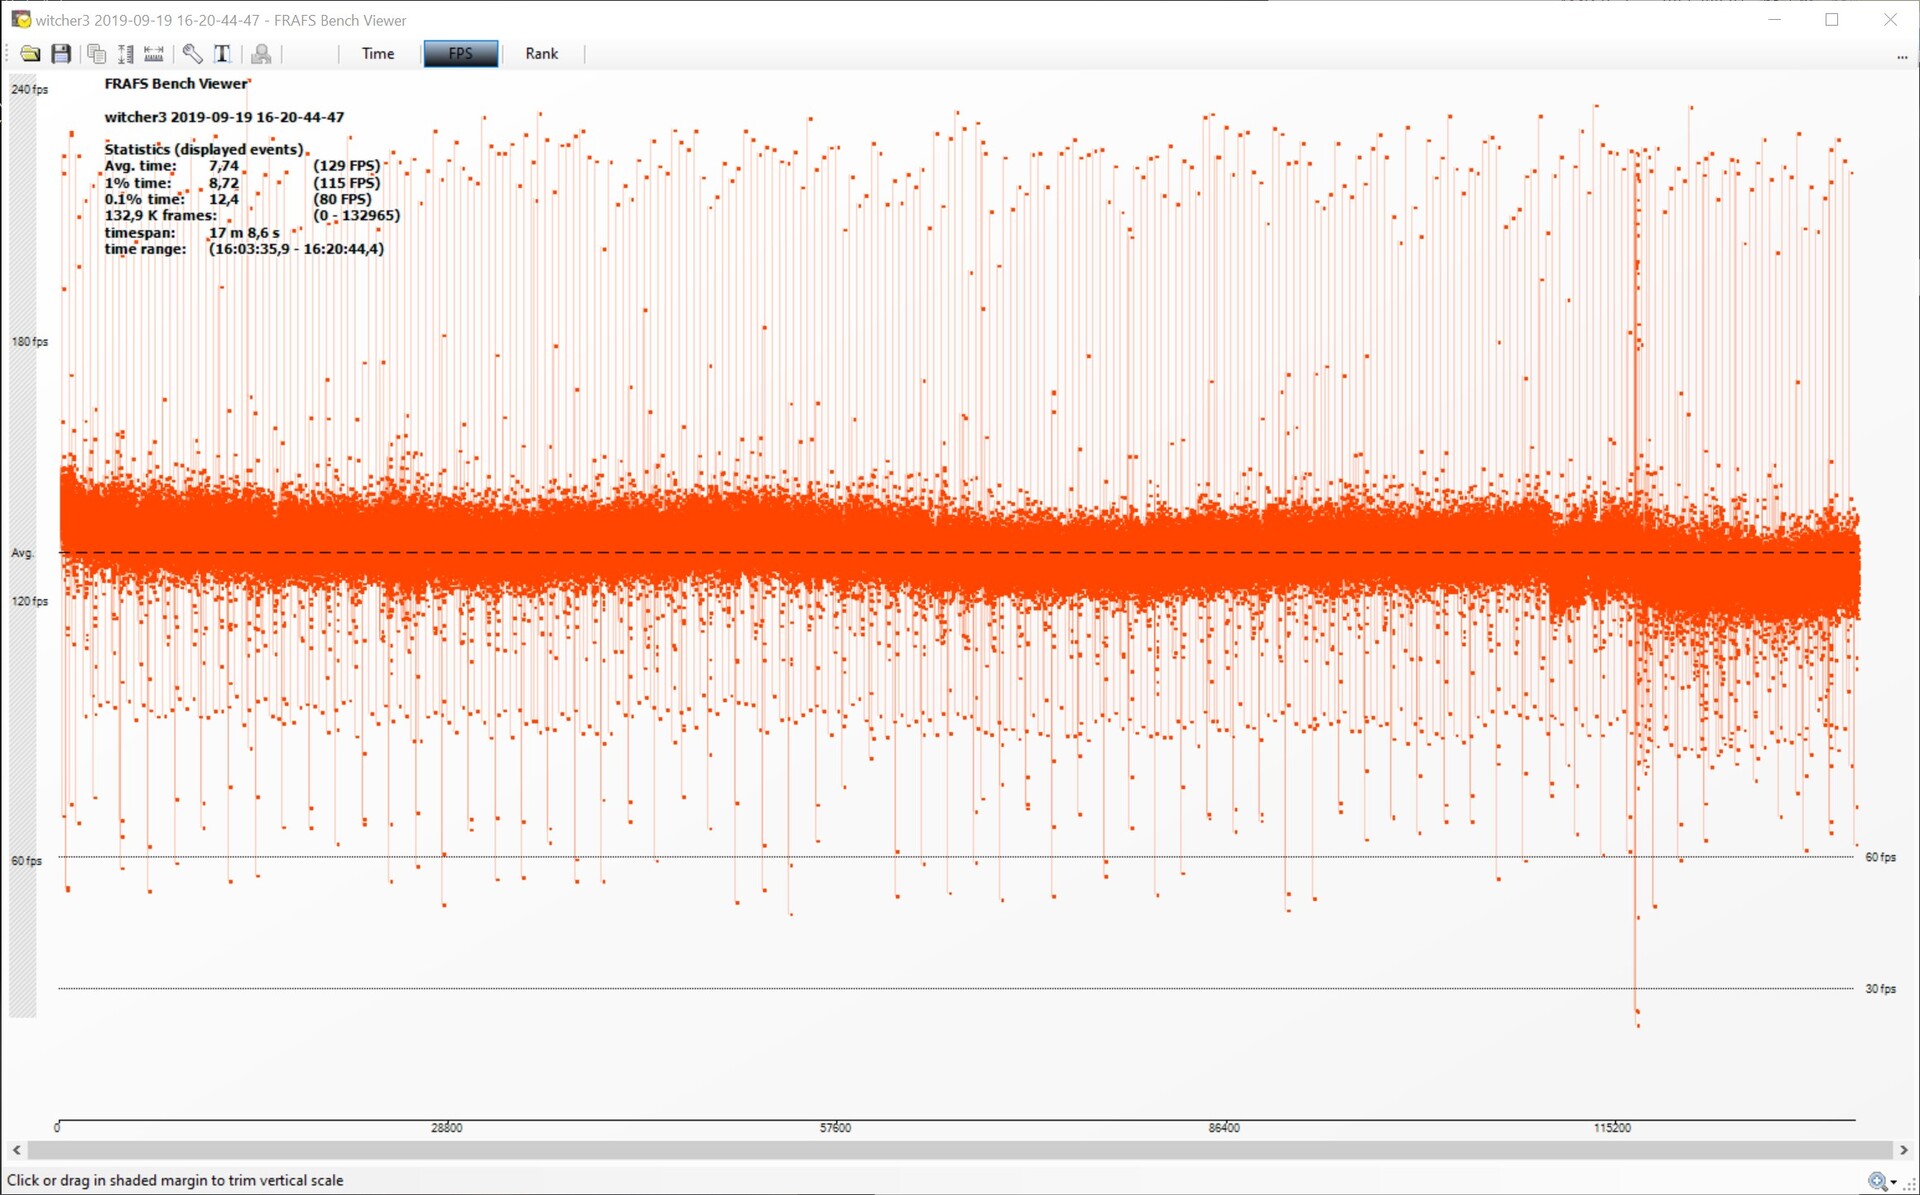
Bei den Frametimes und dem Frameverlauf verhält sich unsere Testkarte eher unauffällig. Zwischendurch gibt es immer wieder mal Spitzen, sowohl nach oben als auch nach unten. Diese sind aber nur von sehr kurzer Dauer, woraus kein Ruckeln beim Spielen resultiert. Ermittelt haben wir die Daten mit dem Spiel The Witcher 3 (Ultra-Preset). Beim Frameverlauf haben wir bei der Grafikkarte von KFA2 eine etwas nachlassende Performance festgestellt. Von anfänglichen 135 Bildern pro Sekunde pendelt sich die Leistung der GeForce RTX 2080 Ti EX bei durchschnittlich 130 FPS ein. Das ist immer noch ein Top-Ergebnis, was bedeutet, dass ruckelfreies Spielen auch bei ausgedehnten Spielesessions kein Problem darstellt.
The Witcher 3 Frameverlauf Ultra-Preset
| Rage 2 | |
| 3840x2160 Ultra Preset (Resolution Scale Off) | |
| Corsair One i160 | |
| KFA2 GeForce RTX 2080 Ti EX | |
| Nvidia Titan RTX 24 GB | |
| Nvidia GeForce RTX 2080 Super | |
| MSI RTX 2080 Gaming X Trio | |
| Nvidia GeForce RTX 2070 Super | |
| MSI RTX 2070 Gaming Z 8G | |
| AMD Radeon RX 5700 XT | |
| Nvidia GeForce RTX 2060 Super | |
| AMD Radeon RX Vega 64 | |
| AMD Radeon RX 5700 | |
| MSI RTX 2060 Gaming Z 6G | |
| 1920x1080 Ultra Preset (Resolution Scale Off) | |
| Corsair One i160 | |
| KFA2 GeForce RTX 2080 Ti EX | |
| Nvidia Titan RTX 24 GB | |
| Nvidia GeForce RTX 2080 Super | |
| MSI RTX 2080 Gaming X Trio | |
| Nvidia GeForce RTX 2070 Super | |
| MSI RTX 2070 Gaming Z 8G | |
| AMD Radeon RX Vega 64 | |
| Nvidia GeForce RTX 2060 Super | |
| AMD Radeon RX 5700 XT | |
| MSI RTX 2060 Gaming Z 6G | |
| 2560x1440 Ultra Preset (Resolution Scale Off) | |
| Corsair One i160 | |
| KFA2 GeForce RTX 2080 Ti EX | |
| Nvidia Titan RTX 24 GB | |
| Nvidia GeForce RTX 2080 Super | |
| MSI RTX 2080 Gaming X Trio | |
| Nvidia GeForce RTX 2070 Super | |
| MSI RTX 2070 Gaming Z 8G | |
| AMD Radeon RX Vega 64 | |
| Nvidia GeForce RTX 2060 Super | |
| AMD Radeon RX 5700 XT | |
| AMD Radeon RX 5700 | |
| MSI RTX 2060 Gaming Z 6G | |
| F1 2019 | |
| 3840x2160 Ultra High Preset AA:T AF:16x | |
| Nvidia Titan RTX 24 GB | |
| Corsair One i160 | |
| KFA2 GeForce RTX 2080 Ti EX | |
| Nvidia GeForce RTX 2080 Super | |
| Nvidia GeForce RTX 2070 Super | |
| AMD Radeon RX 5700 XT | |
| AMD Radeon RX 5700 | |
| Nvidia GeForce RTX 2060 Super | |
| AMD Radeon RX Vega 64 | |
| 1920x1080 Ultra High Preset AA:T AF:16x | |
| Corsair One i160 | |
| KFA2 GeForce RTX 2080 Ti EX | |
| AMD Radeon RX 5700 XT | |
| Nvidia GeForce RTX 2080 Super | |
| AMD Radeon RX 5700 XT | |
| Nvidia GeForce RTX 2070 Super | |
| Nvidia Titan RTX 24 GB | |
| AMD Radeon RX Vega 64 | |
| AMD Radeon RX 5700 | |
| Nvidia GeForce RTX 2060 Super | |
| 2560x1440 Ultra High Preset AA:T AF:16x | |
| KFA2 GeForce RTX 2080 Ti EX | |
| Corsair One i160 | |
| Nvidia Titan RTX 24 GB | |
| Nvidia GeForce RTX 2080 Super | |
| Nvidia GeForce RTX 2070 Super | |
| AMD Radeon RX 5700 XT | |
| AMD Radeon RX 5700 | |
| Nvidia GeForce RTX 2060 Super | |
| AMD Radeon RX Vega 64 | |
| Control | |
| 3840x2160 High Quality Preset | |
| Nvidia Titan RTX 24 GB | |
| KFA2 GeForce RTX 2080 Ti EX | |
| Nvidia GeForce RTX 2070 Super | |
| Nvidia GeForce RTX 2080 Super | |
| AMD Radeon RX 5700 XT | |
| Nvidia GeForce RTX 2060 Super | |
| AMD Radeon RX 5700 | |
| 2560x1440 High Quality Preset | |
| Nvidia Titan RTX 24 GB | |
| KFA2 GeForce RTX 2080 Ti EX | |
| Nvidia GeForce RTX 2070 Super | |
| Nvidia GeForce RTX 2080 Super | |
| AMD Radeon RX 5700 XT | |
| Nvidia GeForce RTX 2060 Super | |
| AMD Radeon RX 5700 | |
| 1920x1080 High Quality Preset | |
| Nvidia Titan RTX 24 GB | |
| KFA2 GeForce RTX 2080 Ti EX | |
| Nvidia GeForce RTX 2070 Super | |
| Nvidia GeForce RTX 2080 Super | |
| AMD Radeon RX 5700 XT | |
| Nvidia GeForce RTX 2060 Super | |
| AMD Radeon RX 5700 | |
| Borderlands 3 | |
| 3840x2160 Badass Overall Quality (DX11) | |
| Nvidia Titan RTX 24 GB | |
| KFA2 GeForce RTX 2080 Ti EX | |
| Nvidia GeForce RTX 2080 Super | |
| Nvidia GeForce RTX 2070 Super | |
| AMD Radeon RX 5700 XT | |
| Nvidia GeForce RTX 2060 Super | |
| AMD Radeon RX 5700 | |
| 2560x1440 Badass Overall Quality (DX11) | |
| KFA2 GeForce RTX 2080 Ti EX | |
| Nvidia Titan RTX 24 GB | |
| Nvidia GeForce RTX 2080 Super | |
| Nvidia GeForce RTX 2070 Super | |
| AMD Radeon RX 5700 XT | |
| Nvidia GeForce RTX 2060 Super | |
| AMD Radeon RX 5700 | |
| 1920x1080 Badass Overall Quality (DX11) | |
| KFA2 GeForce RTX 2080 Ti EX | |
| Nvidia GeForce RTX 2080 Super | |
| Nvidia GeForce RTX 2070 Super | |
| Nvidia Titan RTX 24 GB | |
| AMD Radeon RX 5700 XT | |
| Nvidia GeForce RTX 2060 Super | |
| AMD Radeon RX 5700 | |
| min. | mittel | hoch | max. | QHD | 4K | |
|---|---|---|---|---|---|---|
| BioShock Infinite (2013) | 394 | 349 | 325 | 233 | ||
| Battlefield 4 (2013) | 200 | 200 | 200 | 200 | 148.5 | |
| GTA V (2015) | 177 | 172 | 162 | 99 | 138 | |
| The Witcher 3 (2015) | 403 | 341 | 245 | 135 | 96 | |
| Dota 2 Reborn (2015) | 163.7 | 148.9 | 143.9 | 141.2 | 139.6 | |
| Rainbow Six Siege (2015) | 470 | 379 | 332 | 313 | 173 | |
| Rise of the Tomb Raider (2016) | 324 | 223 | 212 | 198 | 93 | |
| Far Cry Primal (2016) | 129 | 116 | 107 | 100 | 88 | |
| The Division (2016) | 328 | 279 | 196 | 160 | 86 | |
| Doom (2016) | 194 | 178 | 163 | 167 | 131 | |
| Overwatch (2016) | 300 | 300 | 300 | 295 | 188 | |
| Deus Ex Mankind Divided (2016) | 167 | 156 | 135 | 100 | 67 | |
| Battlefield 1 (2016) | 200 | 196 | 184 | 171 | 112 | |
| Dishonored 2 (2016) | 92 | 89 | 88 | 82 | 86 | |
| Watch Dogs 2 (2016) | 155 | 141 | 126 | 101 | 66 | |
| For Honor (2017) | 358 | 257 | 246 | 195 | 99 | |
| Ghost Recon Wildlands (2017) | 147 | 122 | 120 | 82 | 64 | |
| Rocket League (2017) | 250 | 250 | 249 | 209 | ||
| Dirt 4 (2017) | 269 | 207 | 183 | 170 | 123 | |
| Playerunknown's Battlegrounds (PUBG) (2017) | 214 | 190 | 183 | 180 | 86 | |
| Destiny 2 (2017) | 181 | 178 | 178 | 178 | 157 | 89 |
| Assassin´s Creed Origins (2017) | 145 | 127 | 121 | 104 | 89 | 62 |
| Call of Duty WWII (2017) | 305 | 302 | 221 | 200 | 166 | 110 |
| Fortnite (2018) | 349 | 290 | 218 | 197 | 141 | 76 |
| Final Fantasy XV Benchmark (2018) | 185 | 155 | 118 | 55.6 | ||
| Kingdom Come: Deliverance (2018) | 175 | 155 | 122 | 85 | 83 | 50 |
| X-Plane 11.11 (2018) | 127 | 113 | 91 | 79 | ||
| Far Cry 5 (2018) | 139 | 124 | 119 | 111 | 109 | 74 |
| The Crew 2 (2018) | 60 | 60 | 60 | 60 | 60 | 60 |
| F1 2018 (2018) | 201 | 172 | 143 | 116 | 114 | 95 |
| Shadow of the Tomb Raider (2018) | 148 | 138 | 136 | 130 | 108 | 60 |
| FIFA 19 (2018) | 364 | 358 | 330 | 323 | 319 | 298 |
| Forza Horizon 4 (2018) | 207 | 182 | 180 | 168 | 147 | 107 |
| Assassin´s Creed Odyssey (2018) | 135 | 121 | 105 | 80 | 71 | 46 |
| Call of Duty Black Ops 4 (2018) | 288 | 241 | 232 | 223 | 159 | 84 |
| Hitman 2 (2018) | 66 | 63 | 56.8 | 55.8 | 55.1 | 54.8 |
| Battlefield V (2018) | 181 | 147 | 137 | 127 | 108 | 73 |
| Farming Simulator 19 (2018) | 220 | 163 | 143 | 133 | 132 | 104 |
| Darksiders III (2018) | 159 | 100 | 96 | 91 | 91 | 68 |
| Just Cause 4 (2018) | 227 | 195 | 153 | 148 | 111 | 67 |
| Apex Legends (2019) | 144 | 144 | 144 | 144 | 144 | 109 |
| Far Cry New Dawn (2019) | 128 | 110 | 106 | 96 | 92 | 73 |
| Metro Exodus (2019) | 143.9 | 122.9 | 104.4 | 89.7 | 71.9 | 47.5 |
| Anthem (2019) | 127 | 121 | 120 | 113 | 105 | 65 |
| Dirt Rally 2.0 (2019) | 302 | 212 | 200 | 139 | 112 | 70 |
| The Division 2 (2019) | 208 | 172 | 124 | 123 | 92 | 53 |
| Anno 1800 (2019) | 100 | 100 | 77 | 43.3 | 41.8 | 37.6 |
| Rage 2 (2019) | 212 | 181 | 164 | 159 | 110 | 55.7 |
| F1 2019 (2019) | 238 | 217 | 178 | 164 | 147 | 95 |
| Control (2019) | 239 | 163 | 126 | 84 | 42.6 | |
| Borderlands 3 (2019) | 147.8 | 131.1 | 116.5 | 101.3 | 78 | 43.6 |
| FIFA 20 (2019) | 269 | 269 | 255 | 253 | 247 | 249 |
Compute Performance
Bei der Compute Performance kommt es wieder etwas auf die verwendete CPU an. Oftmals ist der Intel Core i9-9900K im Zusammenspiel die bessere Wahl. Somit wird unser Testmodell aus dem Hause KFA2 unter Wert geschlagen. Gegenüber der Nvidia Titan RTX fährt muss sich die GeForce RTX 2080 Ti jedoch teilweise deutlich geschlagen geben. Wer jedoch speziell auf die Compute Leistung einer Grafikkarte angewiesen ist, sollte sich die professionellen Quadro-Karten anschauen. Diese bieten aufgrund speziell angepasster Treiber nochmals deutlich bessere Werte.
Emissionen der KFA2 GeForce RTX 2080 Ti EX
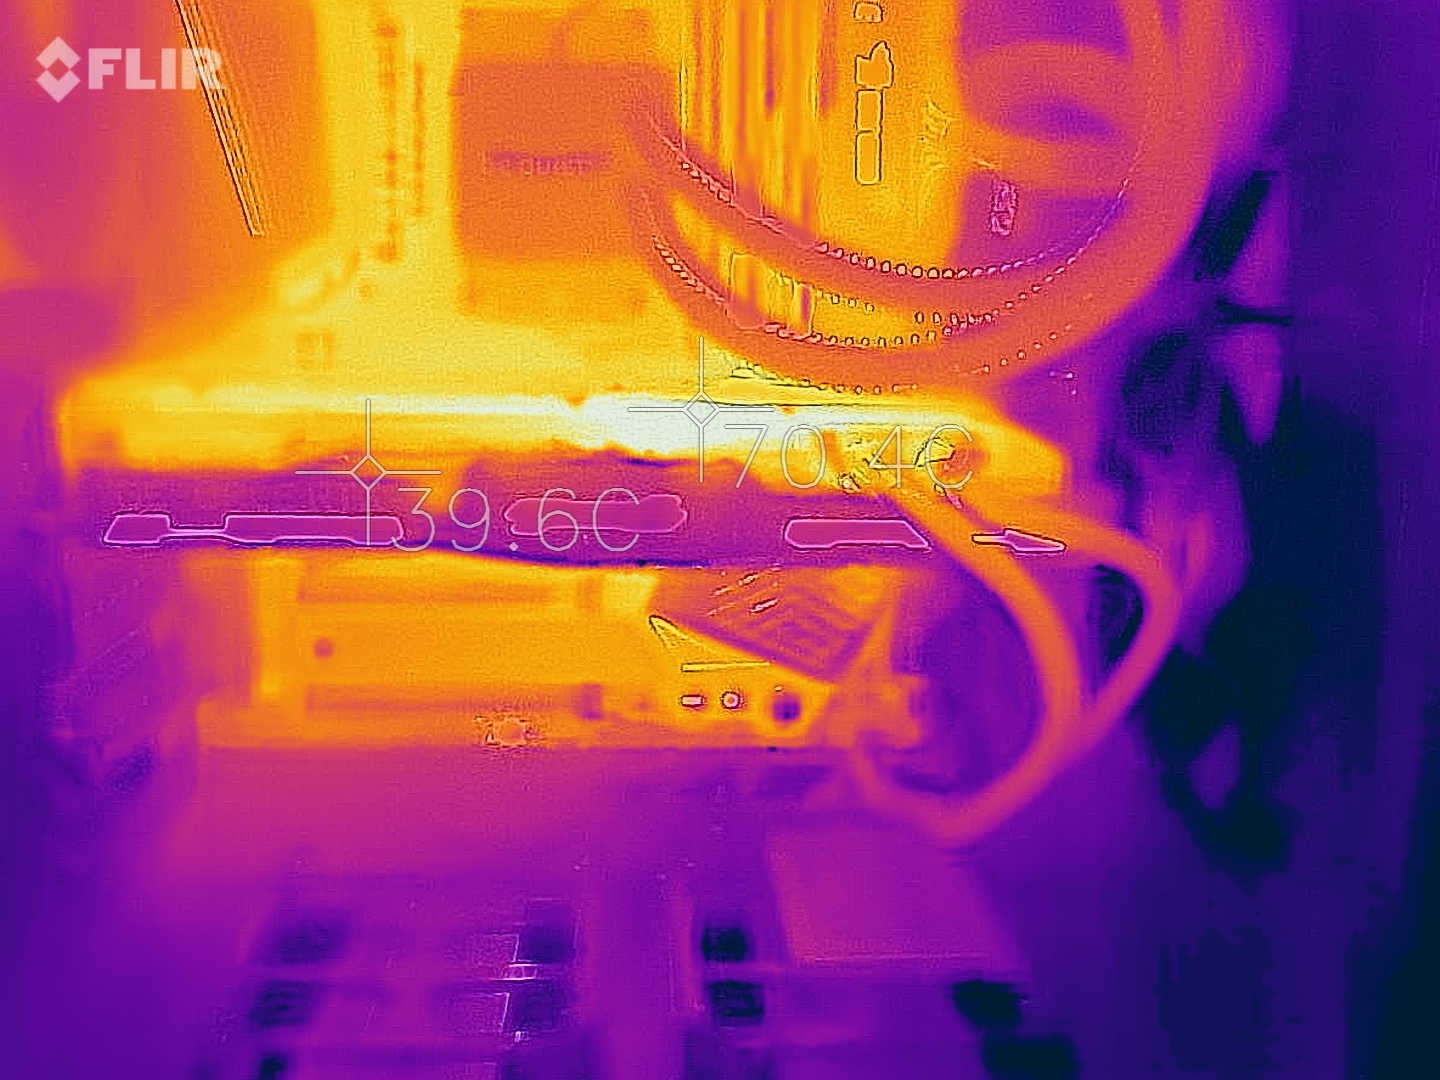
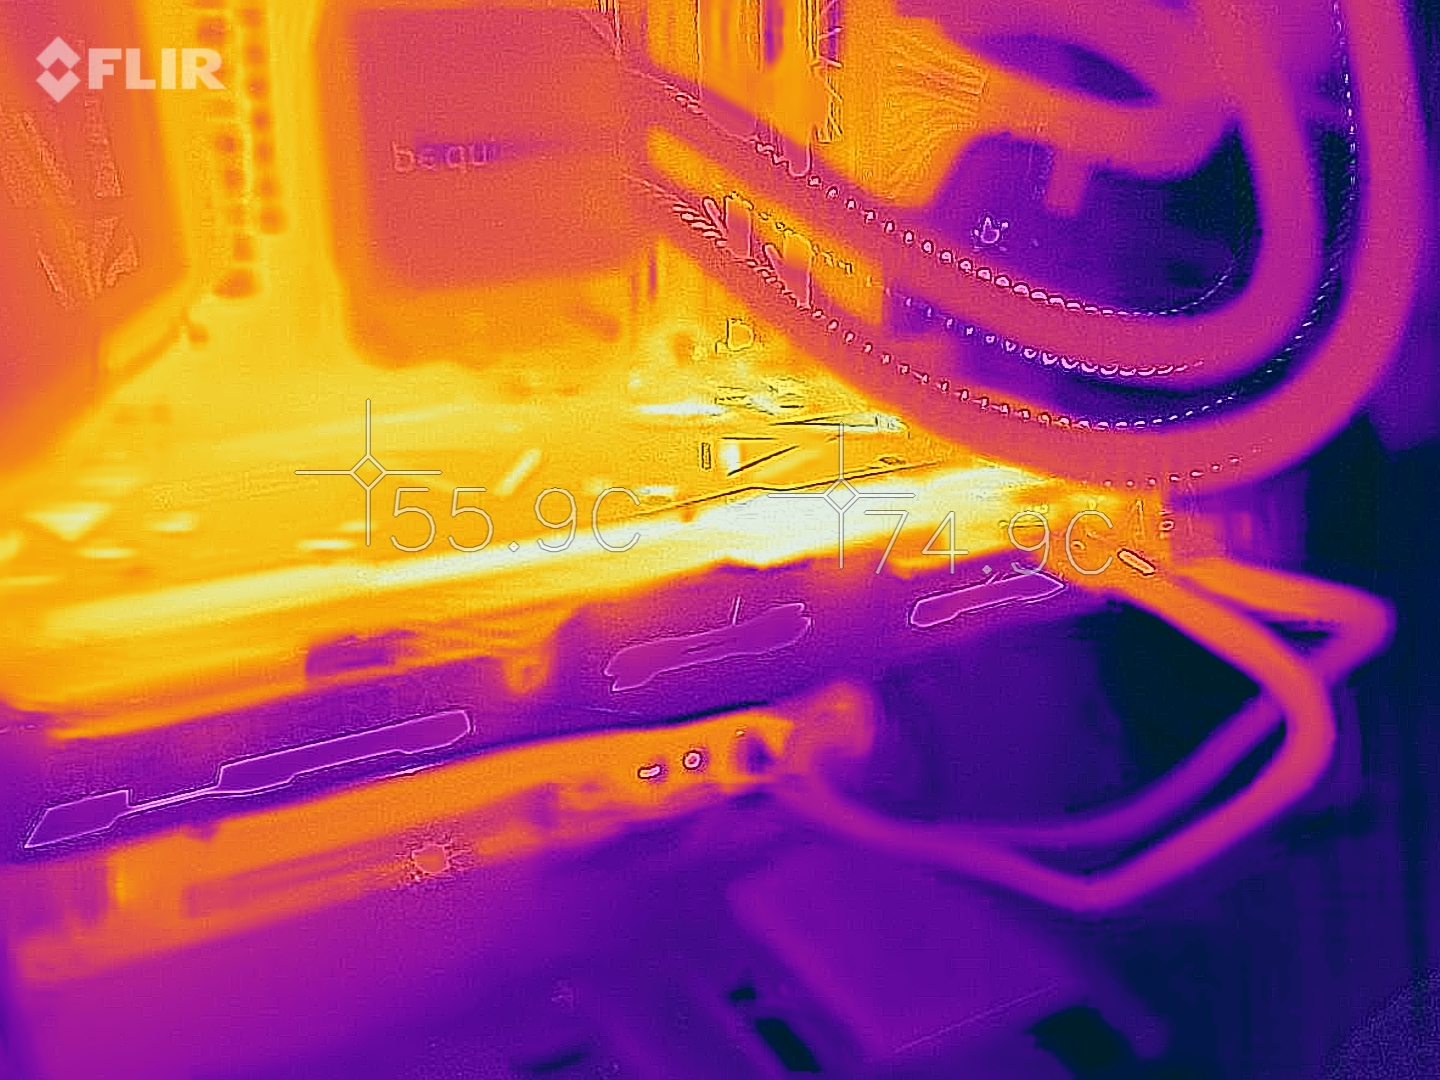
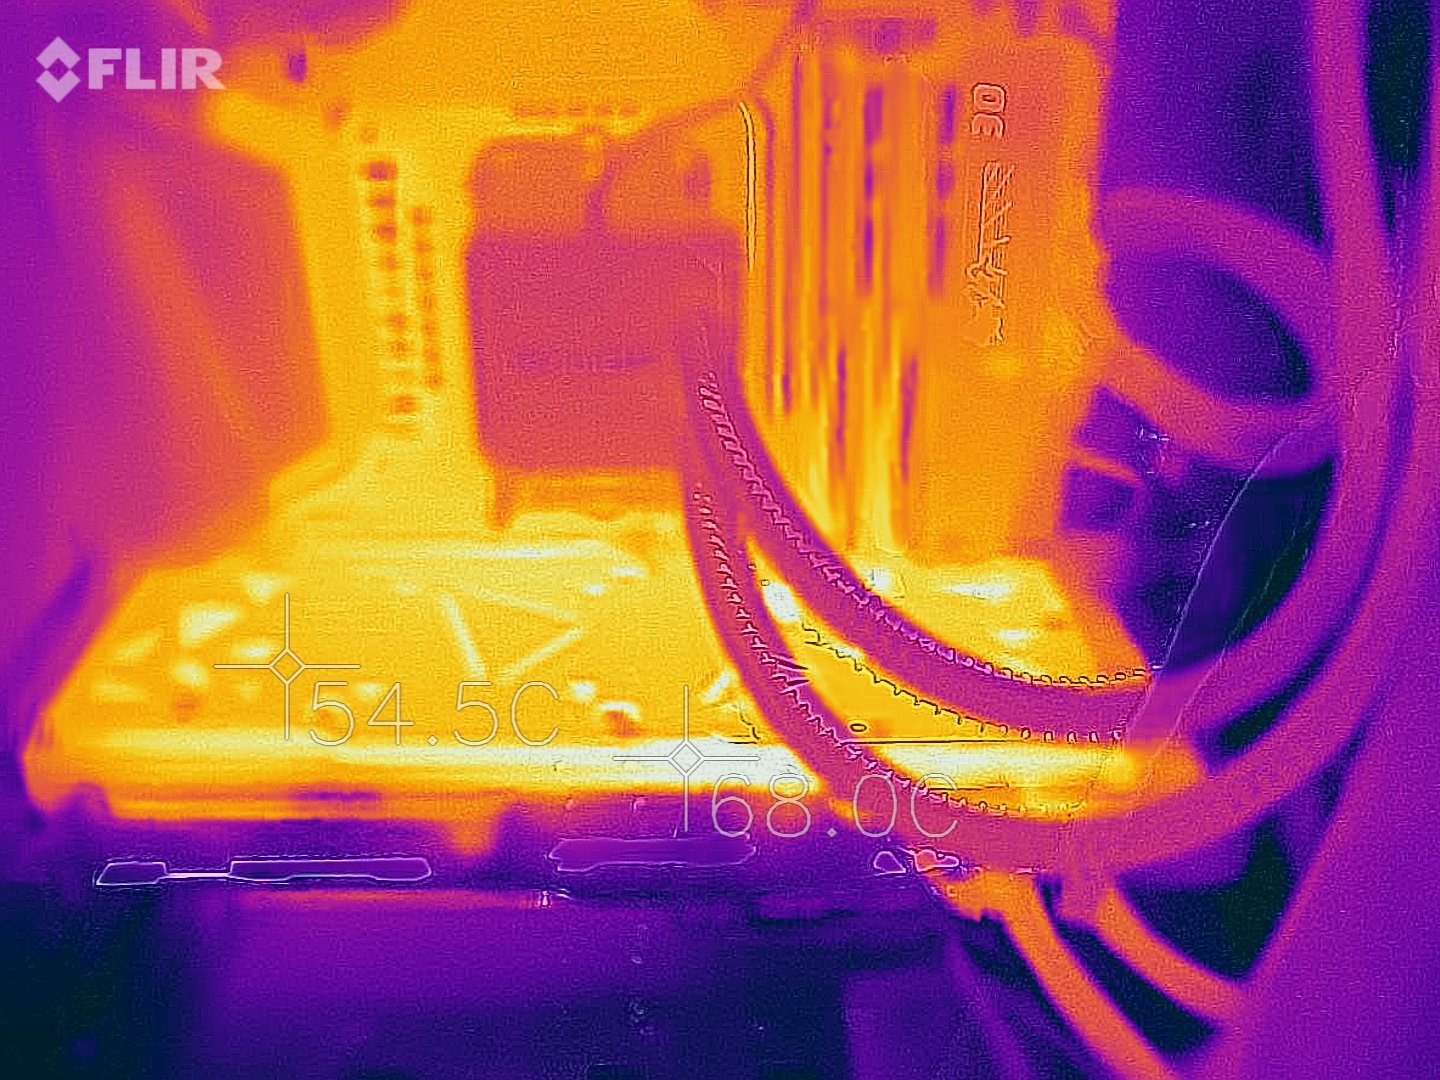
Die GeForce RTX 2080 Ti EX hält sich genau an die Spezifikationen von Nvidia. Nur beim Kühldesign weicht KFA2 vom Original ab. Anders als die Founders Edition verbaut KFA2 auf der GeForce RTX 2080 Ti EX gleich drei Axiallüfter. Die vorderen beiden Lüfter drehen sich immer, wenngleich sie im 2D-Betrieb mit 34 Prozent und 1.200 Umdrehungen trotzdem sehr leise sind. Der hintere Lüfter beginnt erst unter Last mit der Arbeit.
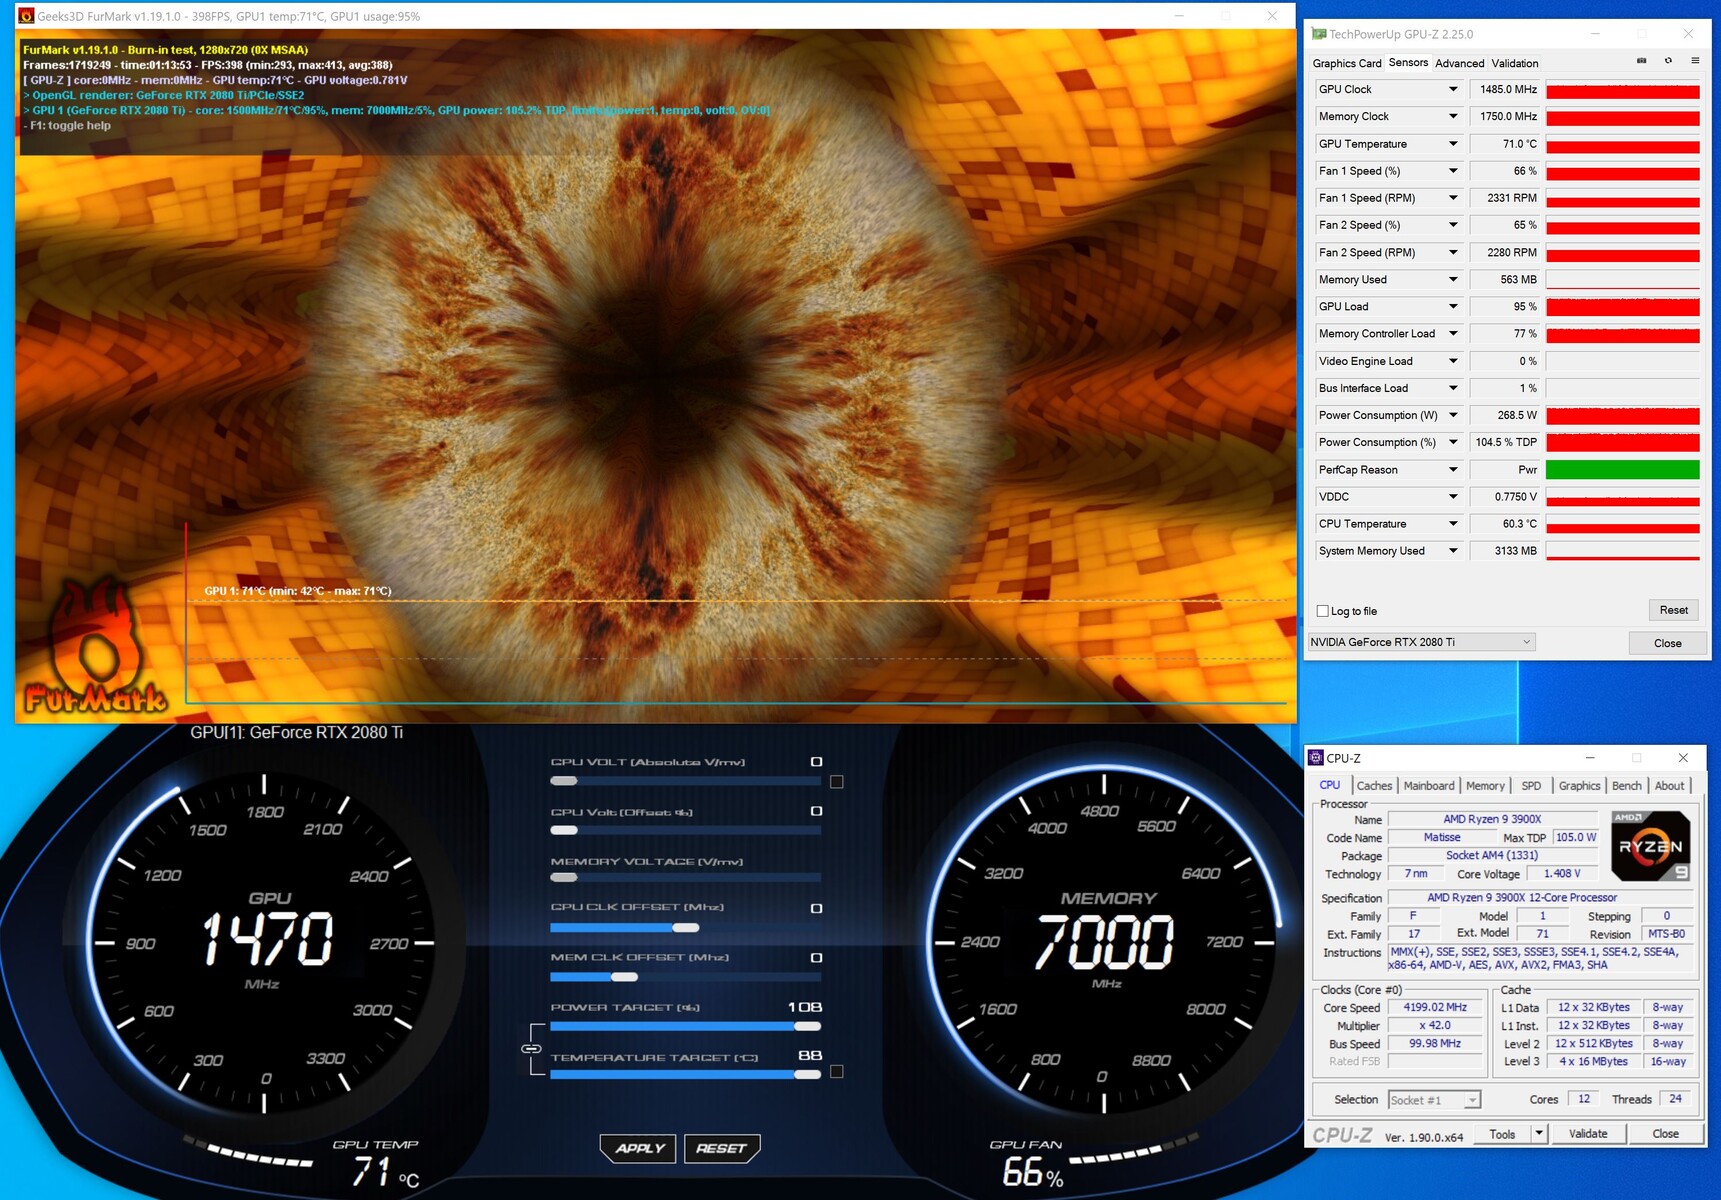
Bei der Stromaufnahme gibt sich die Grafikkarte mit 250 Watt zufrieden. Das sind 10 Watt weniger als bei der Founders Edition, für die Nvidia 260 Watt angibt. Das Power-Target (PT) lässt sich in unserem Fall um 8 Prozent erhöhen. Damit steht der Grafikkarte maximal 270 Watt zur Verfügung.
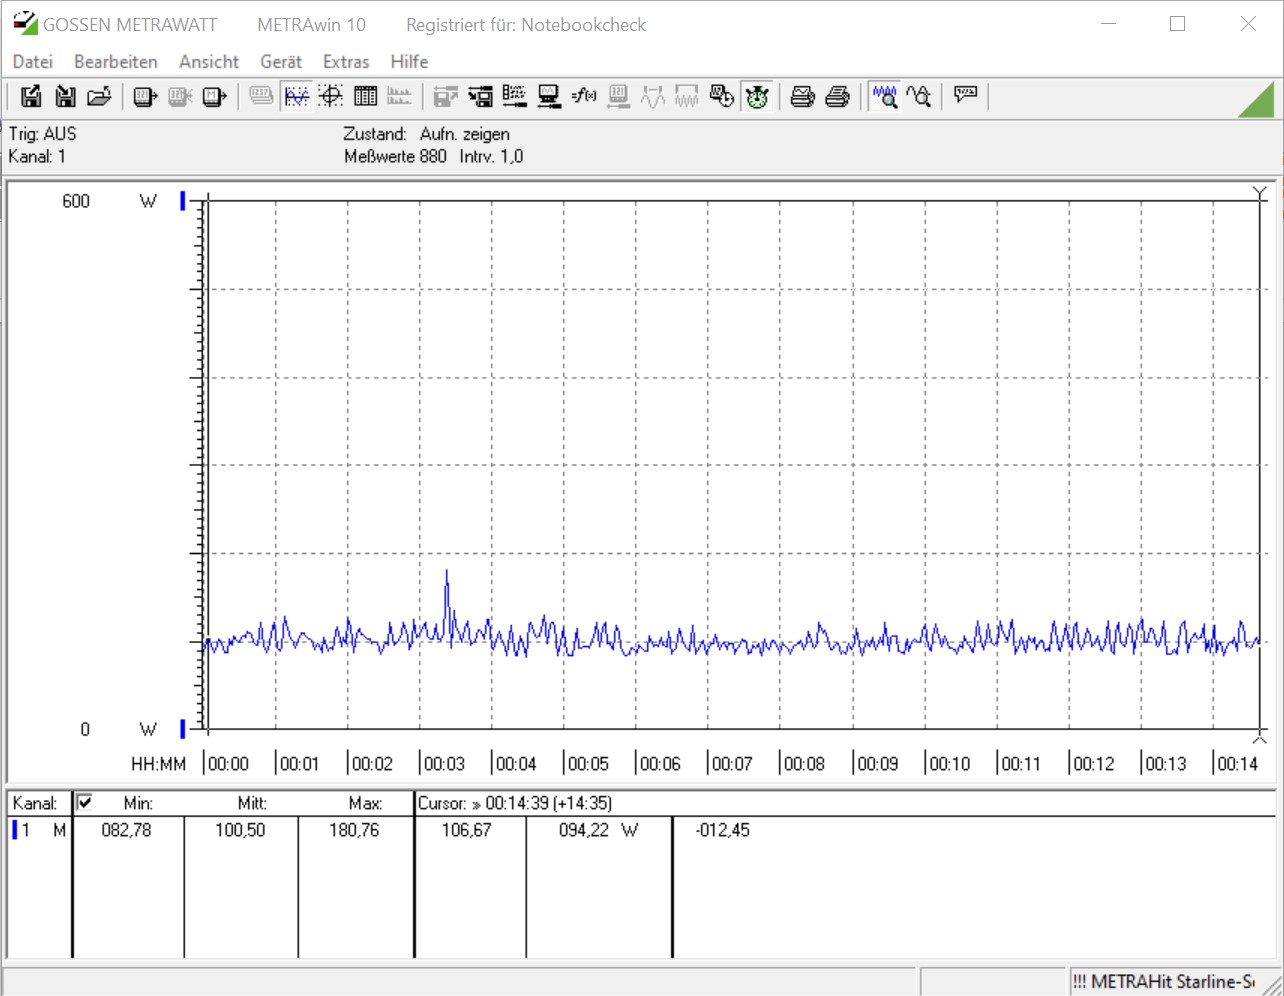
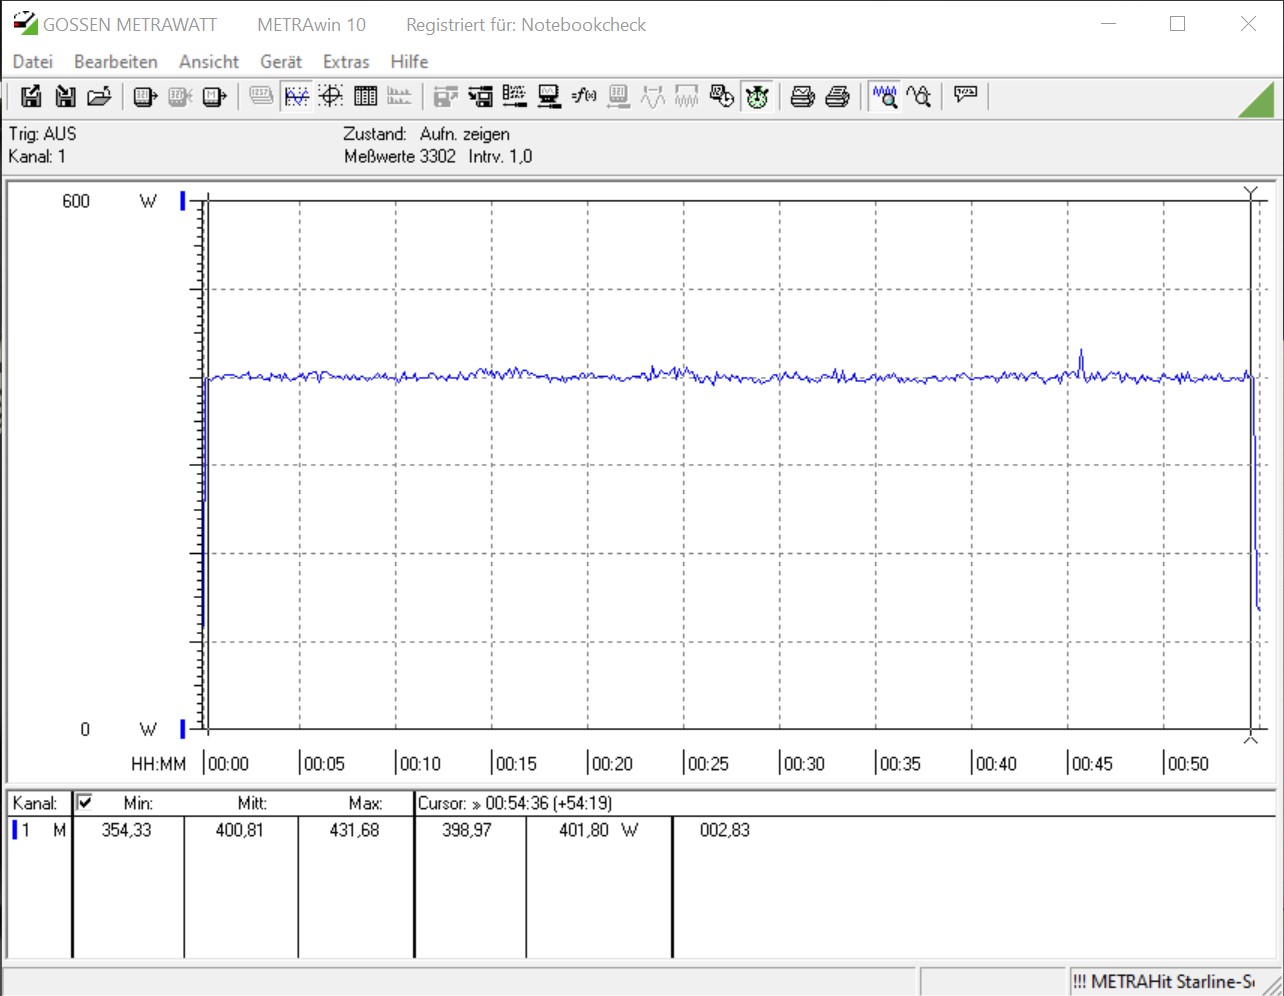
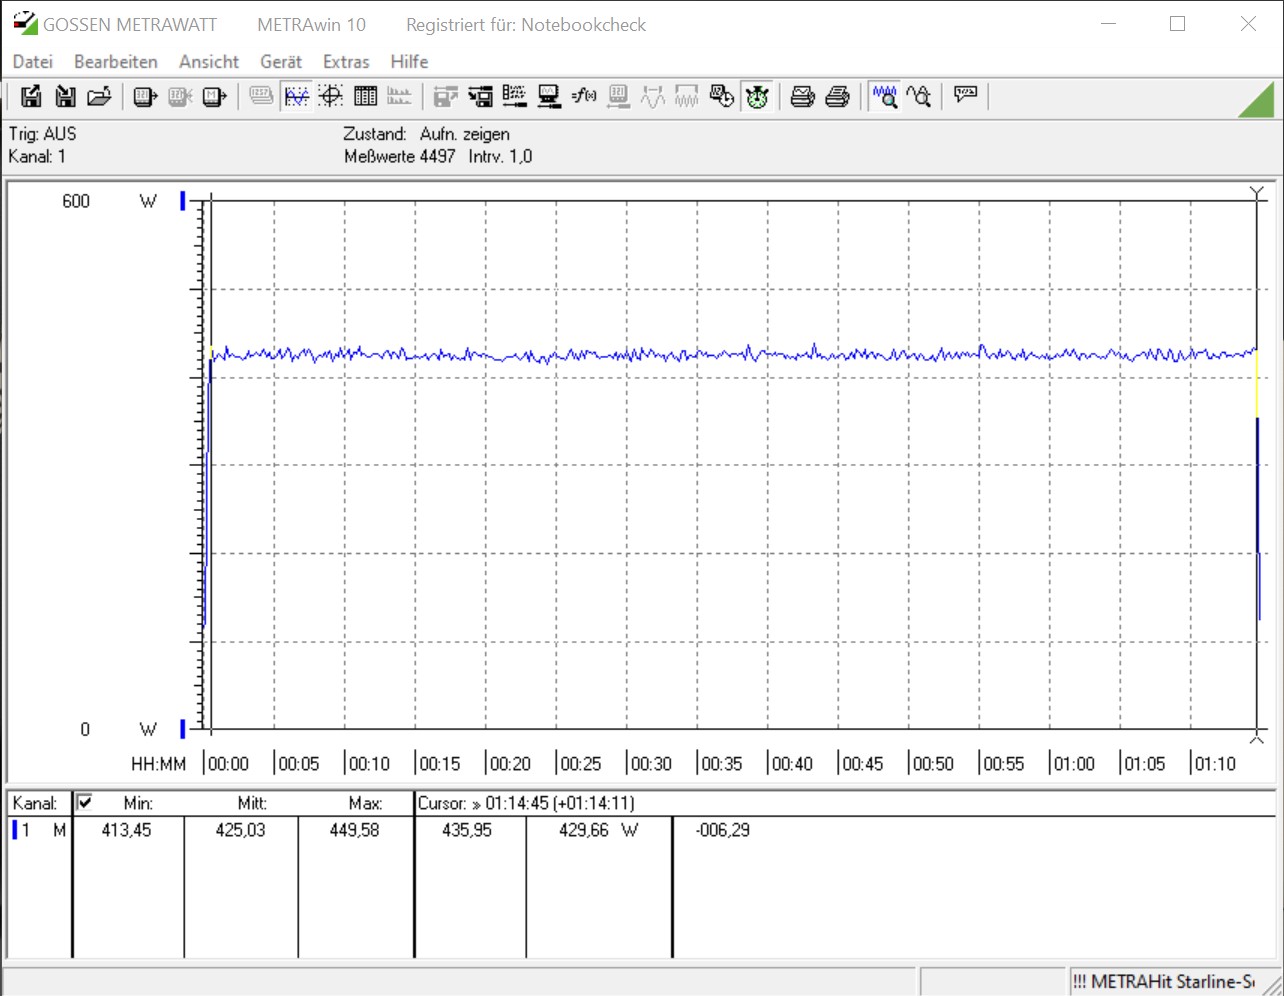
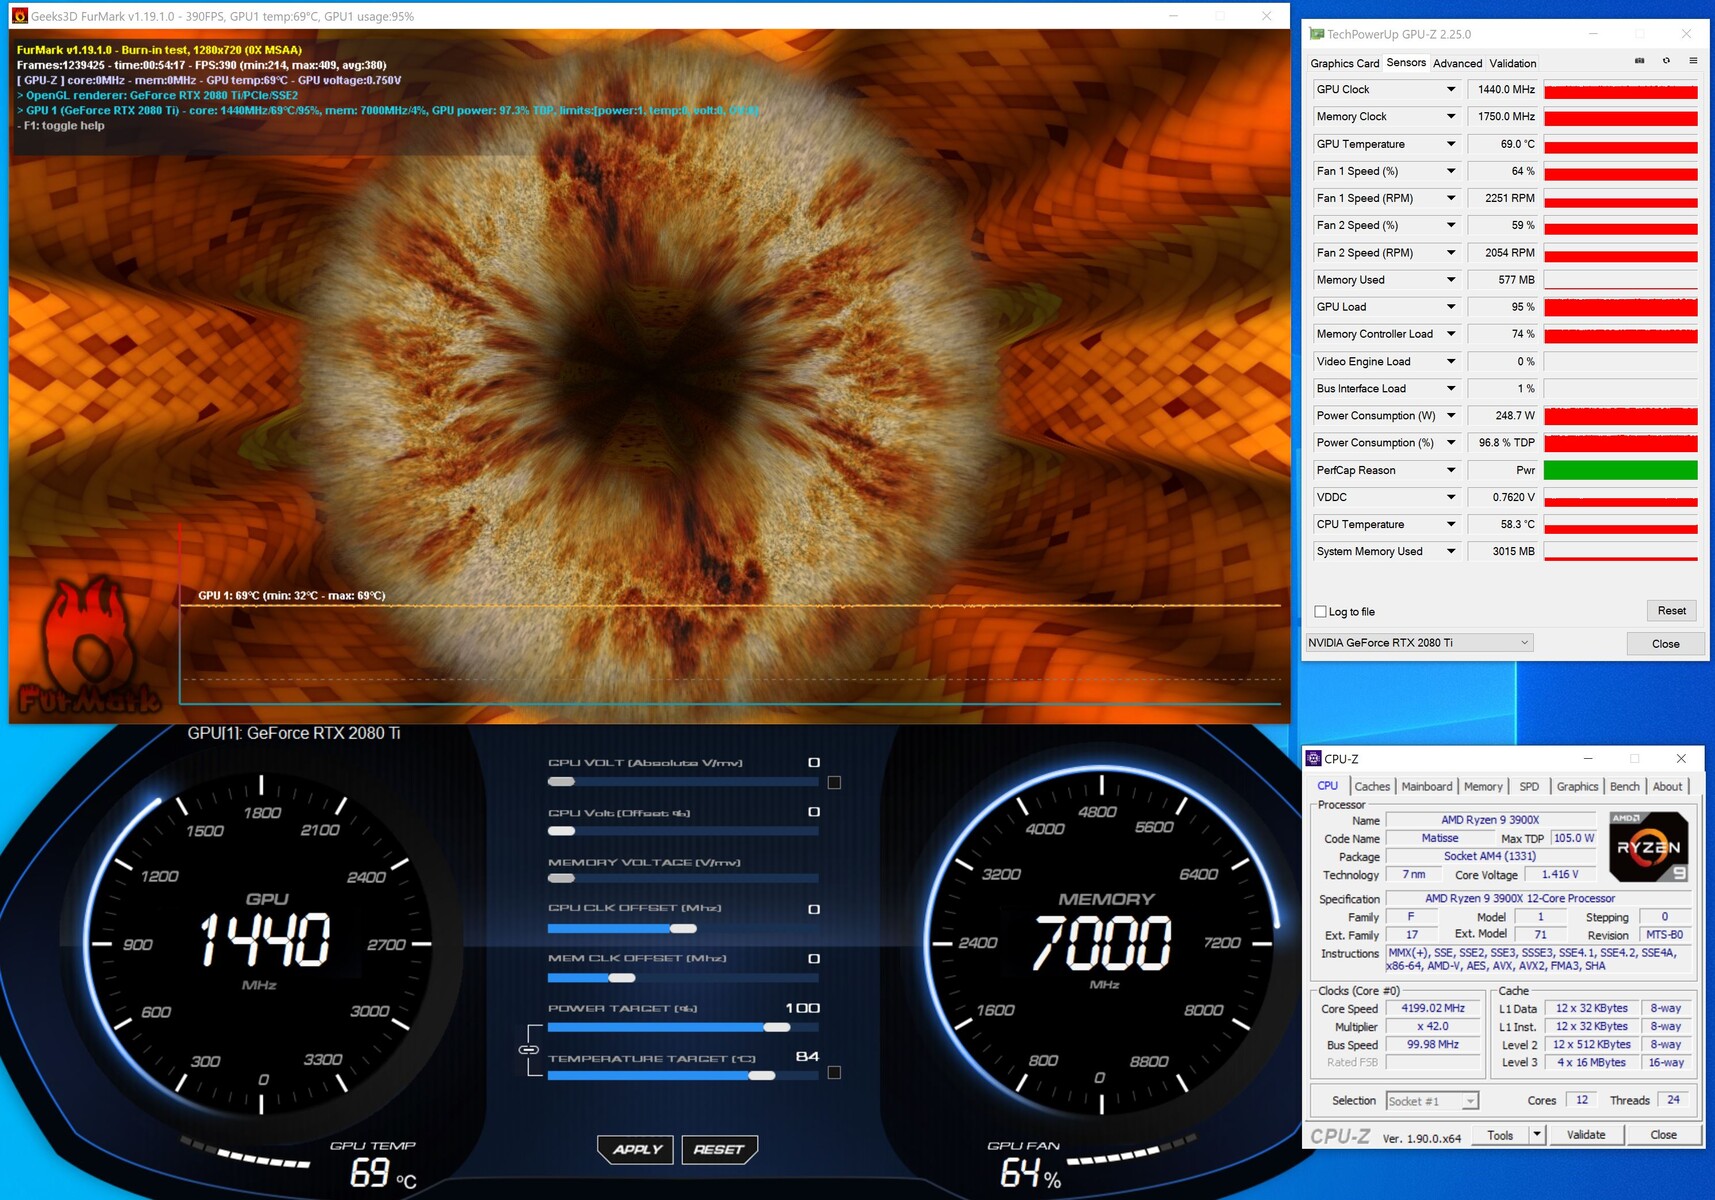
Beim Stromverbrauch messen wir im Leerlauf einen Energiebedarf von 100,5 Watt. Gleichwohl steigt dieser unter Last und beim Stresstest deutlich an und wir notieren rund 401 Watt für das Testsystem ohne Monitor. GPU-Z bestätigt dies und gibt ca. 250 Watt unter Last an. Beim erhöhten PT kommen wir unter Last auf 268,5 Watt. Mit den Temperaturen hat die Grafikkarte von KFA2 keine Probleme. Unter Last klettert diese auf maximal 69 °C, wenngleich wir bei erhöhter Last nur einen Anstieg um 2 °C beobachten konnten.
Alle Tests wurden außerdem in einem geschlossenen Gehäuse durchgeführt, um ein möglichst reales Einsatzfeld zu simulieren.
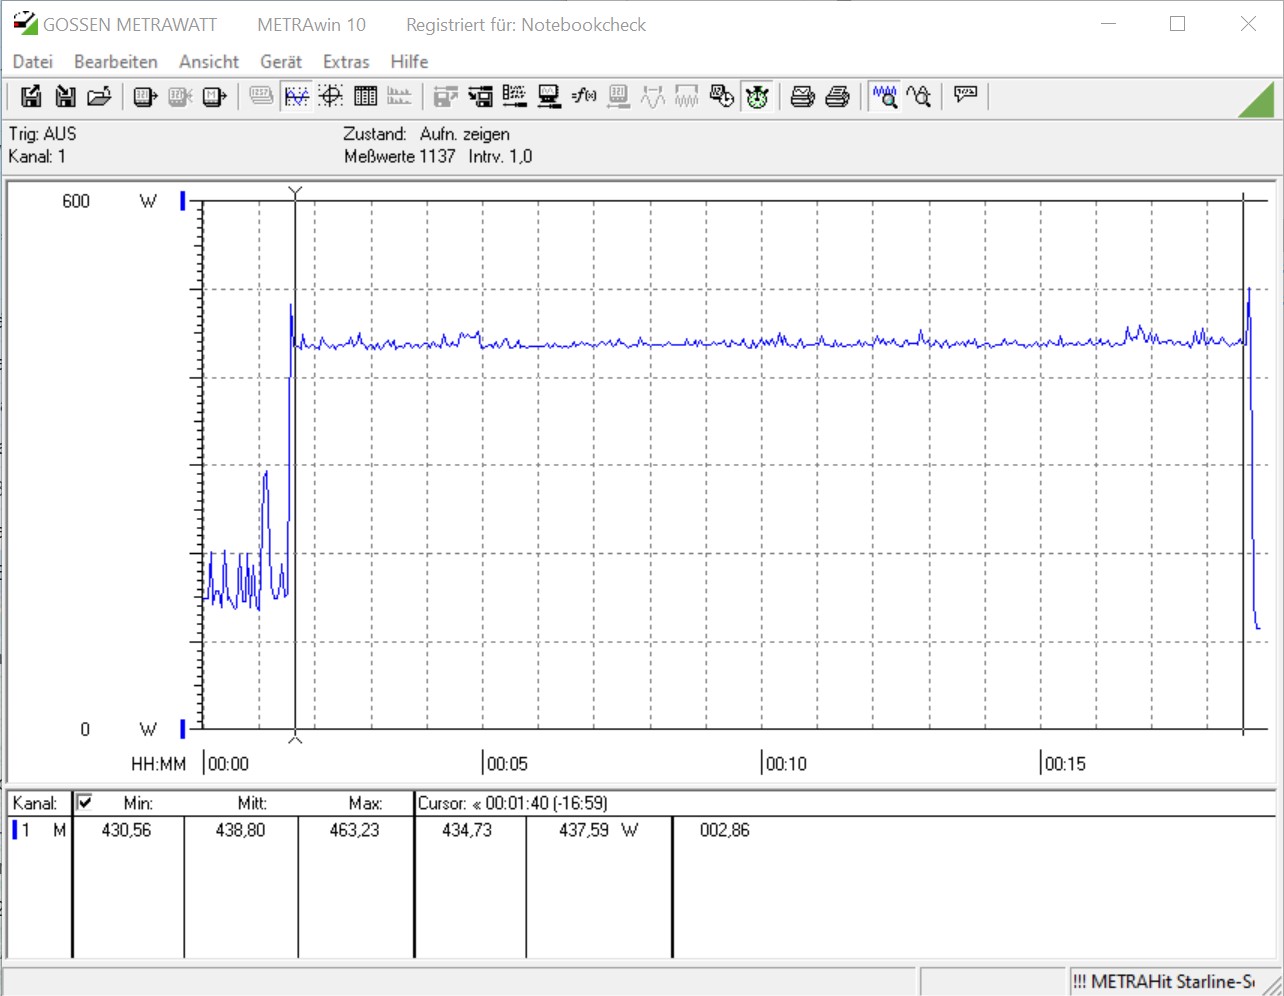
| Power Consumption | |
| 1920x1080 The Witcher 3 ultra (external Monitor) | |
| KFA2 GeForce RTX 2080 Ti EX (Idle: 100.5 W) | |
| Nvidia Titan RTX | |
| Nvidia GeForce RTX 2080 Super (Idle: 86.2 W) | |
| AMD Radeon RX Vega 64 (Idle: 81.56 W) | |
| Nvidia GeForce RTX 2070 Super (Idle: 92.6 W) | |
| AMD Radeon RX 5700 XT (Idle: 83.2 W) | |
| Corsair One i160 (Idle: 51.5 W) | |
| KFA2 GeForce RTX 2060 Super (81.7 fps, Idle: 93.8 W) | |
| Nvidia GeForce RTX 2060 Super (Idle: 86.7 W) | |
| AMD Radeon RX 5700 (Idle: 77.9 W) | |
| 1280x720 FurMark 1.19 GPU Stress Test (external Monitor) | |
| Nvidia GeForce RTX 2080 Super (Idle: 86.2 W) | |
| KFA2 GeForce RTX 2080 Ti EX (Idle: 100.5 W) | |
| Nvidia GeForce RTX 2070 Super (Idle: 92.6 W) | |
| AMD Radeon RX 5700 XT (Idle: 83.2 W) | |
| Corsair One i160 (Idle: 51.5 W) | |
| KFA2 GeForce RTX 2060 Super (234 fps, Idle: 93.8 W) | |
| Nvidia GeForce RTX 2060 Super (Idle: 86.7 W) | |
| AMD Radeon RX 5700 (Idle: 77.9 W) | |
* ... kleinere Werte sind besser
Overclocking - RTX 2080 Ti mit Reserven
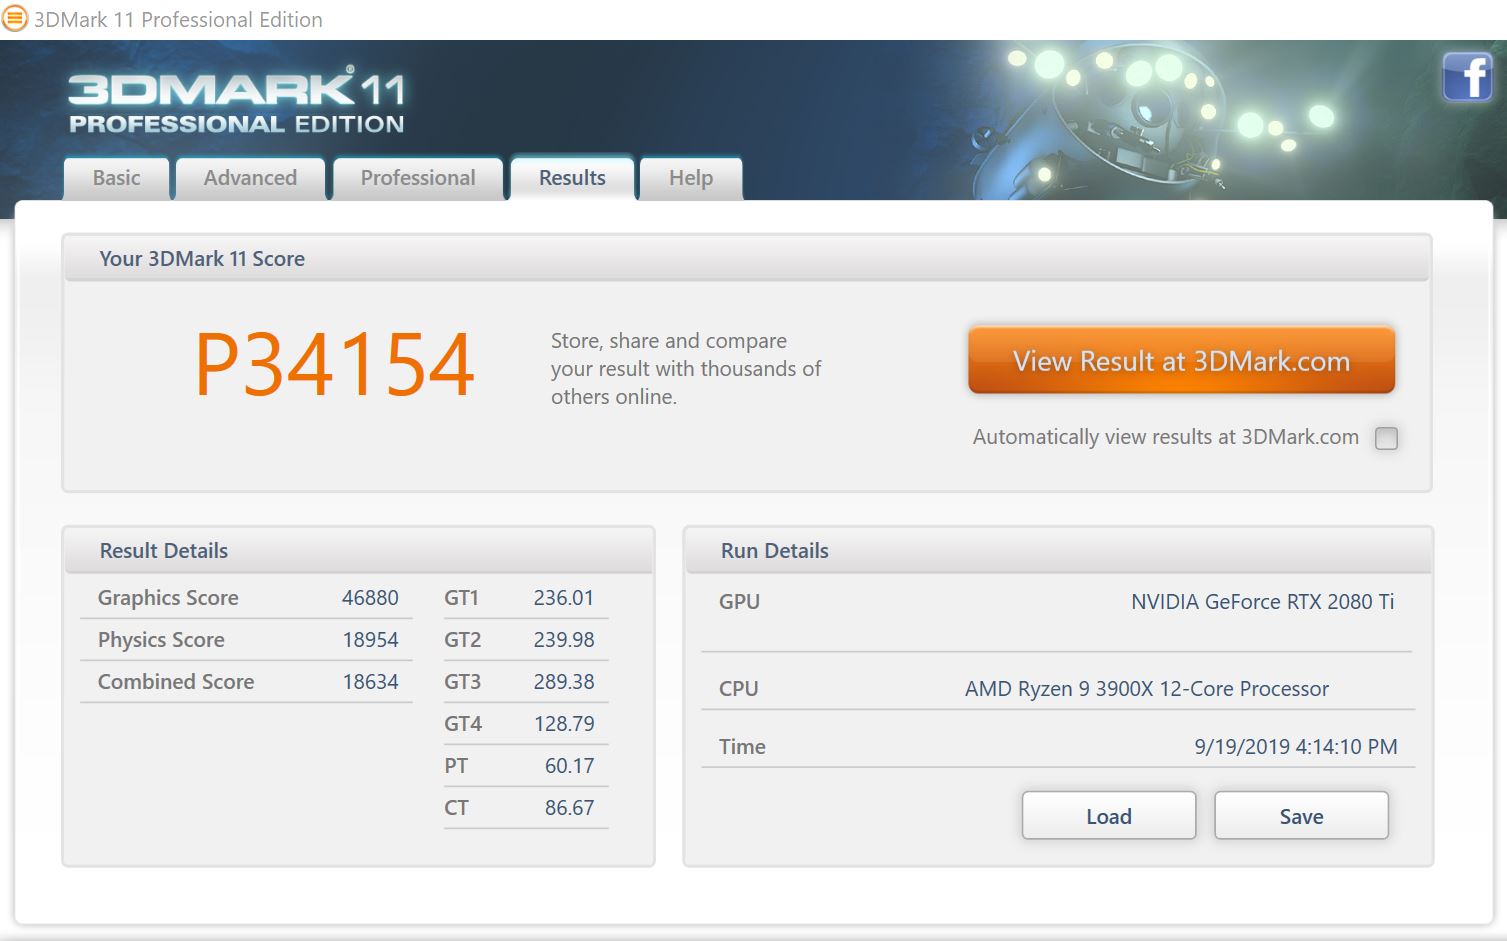
Obwohl die KFA2 GeForce RTX 2080 Ti EX im Test mit einer beeindruckenden Leistung überzeugen konnte, haben wir uns dem Thema Übertakten gewidmet. Von Haus aus bietet KFA2 die Möglichkeit, die Grafikkarte mit dem Feature 1-Click-OC zu übertakten. Beim Aktivieren wird der Basistakt um 45 MHz angehoben und gleichzeitig wird auch das PT auf 108 Prozent erhöht, um einen höheren und stabileren Boost-Takt zu bekommen. Beim Test mit 3DMark 11 konnte hiermit die 3D-Leistung um ca. 4 Prozent verbessert werden.
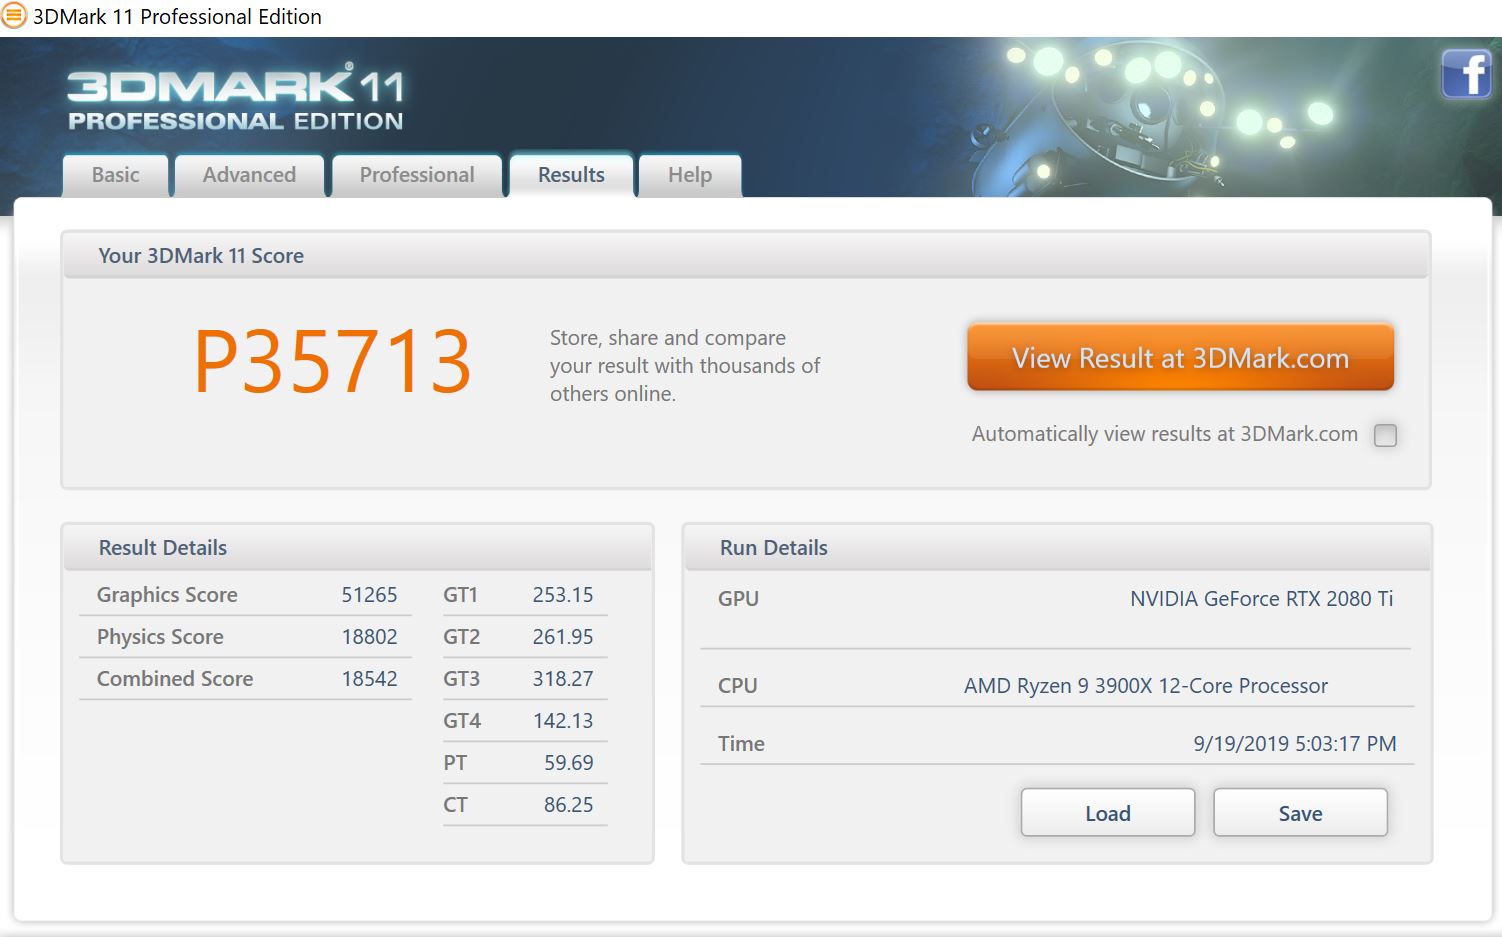
Das war uns allerdings nicht genug. Beim manuellen Übertakten gelang es uns den Grafikchip um 250 MHz und den VRAM um 1.250 MHz zu übertakten. Das Ergebnis kann sich durchaus sehen lassen. Im Vergleich zum Auslieferungszustand konnte die 3D-Leistung um 13 Prozent erhöht werden. Beim DirectX 12 basierten Time Spy Benchmark konnten wir sogar einen Zuwachs von 14 Prozent erreichen.
Natürlich ist die Grafikkarte schon im Auslieferungszustand sehr schnell, sodass hier keiner auf die zusätzlichen Reserven angewiesen ist. Es tut aber gut, noch ein paar Leistungsreserven in der Hinterhand zu haben. Ob die Grafikkarte unter Last nun 250 Watt oder 270 Watt verbraucht, macht unterm Strich kaum den Unterschied.
Wer nun noch auf eine Custom-Wasserkühlung setzt und auf die ganze RGB-Beleuchtung verzichtet, kann hier sogar noch mehr aus der Grafikkarte quetschen.
Pro
Contra
Fazit - Ein absolutes High-End-Modell
Ohne vorab über den Preis zu reden, handelt es sich bei der KFA2 GeForce RTX 2080 Ti EX um eine sehr schnelle Grafikkarte für Desktop PCs. Aufgrund der Länge sollte man aber im Vorfeld prüfen, ob dieses Monster auch in das Gehäuse passt. Ebenso sollte das Netzteil mindestes 650 Watt und zwei 8-Pin-Stromsnschlüsse liefern.
In puncto Leistung ist diese Grafikkarte nur durch andere GeForce RTX 2080 Ti Karten oder die deutlich teurere Nvidia RTX Titan zu schlagen. Wer sich solch eine Karte zulegen möchte, sollte jenseits der 1080p Grenze spielen, denn nur in sehr hohen Auflösungen kann die GeForce RTX 2080 Ti ihren Vorteil gegenüber den Kontrahenten ausspielen.
Über 1.000 Euro für eine Grafikkarte ist verdammt viel Geld. Wer aber unbedingt in 4K zocken möchte, kommt an dieser Grafikkarte nicht vorbei.
Nichtsdestotrotz wird es die KFA2 GeForce RTX 2080 Ti EX schwer haben, Käufer zu finden, denn ein vierstelliger Betrag ist allein für die Grafikkarte sehr viel Geld. Gegenüber der Founders Edition hat das Modell von KFA2 allerdings einen deutlichen Preisvorteil, denn Nvidia verlangt 1.259 Euro für die GeForce RTX 2080 Ti. Zudem bietet das KFA2 Modell eine größere Kühleinheit und wer auf Beleuchtung steht, wird den RGB-Spielkram lieben. Im Vergleich zählt die Grafikkarte von KFA2 allerdings zu den günstigsten auf dem Markt mit RTX 2080 Ti Chip.
Alles in allem steckt sehr viel Potenzial in der GeForce RTX 2080 Ti, welche momentan in der Lage ist, alle Spiele in 2160p flüssig auf den Schirm zu bringen. Wer nur alle paar Jahre ein GPU-Upgrade plant, für diejenigen könnte die GeForce RTX 2080 Ti eine Überlegung wert sein, denn auch in ein bis zwei Jahren sollte die Grafikkarte noch spielbare Frameraten auf den Bildschirm bringen, wenn man auch mit 1080p oder 1440p und ohne Raytracing leben kann.
Mit den RTX-Features punktet die GeForce RTX 2080 Ti zusätzlich, denn aktuelle Spiele wie Control verlangen schon heute eine sehr starke Grafikkarte, wenn Raytracing aktiviert wird. So erreicht die KFA2 GeForce RTX 2080 Ti EX in 1080p mit aktiviertem Raytracing ca. 72 FPS im Durchschnitt, wenngleich die GeForce RTX 2080 Super hier nur noch 53 FPS erreicht.
Warum bekommt die KFA2 GeForce RTX 2080 Ti EX den Editors Choise Award? Ganz einfach, weil die Leistung der Grafikkarte einfach top ist. Hier sollte man den Preis nicht als Kritik verstehen. Nvidia kann ja nichts dafür, dass AMD in dieser Leistungsklasse einfach nichts zu bieten hat.
Benchmarks aller GeForce RTX 2080 Ti Grafikkarten
Benchmarks
3DM Vant. Perf. total +
specvp12 sw-03 +
Cinebench R15 OpenGL 64 Bit +
* Kleinere Werte sind besser
Spiele-Benchmarks
Die folgenden Benchmarks basieren auf unseren Spieletests mit Testnotebooks. Die Performance dieser Grafikkarte bei den gelisteten Spielen ist abhängig von der verwendeten CPU, Speicherausstattung, Treiber und auch Betriebssystem. Dadurch müssen die untenstehenden Werte nicht repräsentativ sein. Detaillierte Informationen über das verwendete System sehen Sie nach einem Klick auf den fps-Wert.

F1 2021
2021
Days Gone
2021


Outriders
2021
Hitman 3
2021
Cyberpunk 2077 1.0
2020

Yakuza Like a Dragon
2020


Dirt 5
2020
Watch Dogs Legion
2020
FIFA 21
2020
Star Wars Squadrons
2020

Serious Sam 4
2020
Crysis Remastered
2020

Horizon Zero Dawn
2020
Death Stranding
2020
F1 2020
2020
Valorant
2020
Gears Tactics
2020
Doom Eternal
2020
Hunt Showdown
2020
Escape from Tarkov
2020


Need for Speed Heat
2019

GRID 2019
2019

FIFA 20
2019
Borderlands 3
2019
Control
2019
F1 2019
2019

Rage 2
2019
Anno 1800
2019
The Division 2
2019
Dirt Rally 2.0
2019
Anthem
2019
Far Cry New Dawn
2019
Metro Exodus
2019
Apex Legends
2019
Just Cause 4
2018
Darksiders III
2018
Battlefield V
2018
Farming Simulator 19
2018
Hitman 2
2018


Forza Horizon 4
2018
FIFA 19
2018

F1 2018
2018
Monster Hunter World
2018
The Crew 2
2018
Far Cry 5
2018
World of Tanks enCore
2018
X-Plane 11.11
2018


Fortnite
2018


Call of Duty WWII
2017

Destiny 2
2017
ELEX
2017

Dirt 4
2017Rocket League
2017Prey
2017For Honor
2017
Resident Evil 7
2017Watch Dogs 2
2016
Dishonored 2
2016
Battlefield 1
2016
Overwatch
2016
Doom
2016

The Division
2016
Far Cry Primal
2016

Rainbow Six Siege
2015
World of Warships
2015Dota 2 Reborn
2015
The Witcher 3
2015
GTA V
2015
Battlefield 4
2013BioShock Infinite
2013Counter-Strike: GO
2012| min. | mittel | hoch | max. | QHD | 4K | |
|---|---|---|---|---|---|---|
| F1 2021 | 254 | 237 | 147 | 119 | 68 | |
| Days Gone | 163 | 158 | 135 | 105 | 63.9 | |
| Mass Effect Legendary Edition | 132 | 126 | 125 | 115 | ||
| Resident Evil Village | 183 | 181 | 181 | 147 | 74.3 | |
| Outriders | 135 | 135 | 132 | 114 | 61.8 | |
| Hitman 3 | 171 | 164 | 162 | 147 | 85.2 | |
| Cyberpunk 2077 1.0 | 114 | 107 | 95.4 | 64 | 32.2 | |
| Immortals Fenyx Rising | 113 | 102 | 93 | 81 | 59 | |
| Yakuza Like a Dragon | 161 | 156 | 139 | 100 | 53.8 | |
| Call of Duty Black Ops Cold War | 155 | 133 | 118 | 89.2 | 54.4 | |
| Assassin´s Creed Valhalla | 107 | 91 | 80 | 67 | 46 | |
| Dirt 5 | 134 | 112 | 73.4 | 64.8 | 50 | |
| Watch Dogs Legion | 111 | 98.7 | 89.6 | 72.9 | 44 | |
| FIFA 21 | 269 | 266 | 255 | 254 | 251 | 247 |
| Star Wars Squadrons | 360 | 354 | 331 | 326 | 246 | 144 |
| Mafia Definitive Edition | 131 | 120 | 117 | 105 | 62.4 | |
| Serious Sam 4 | 185 | 123 | 117 | 108 | 107 | 86.3 |
| Crysis Remastered | 179 | 106 | 71.3 | 57.9 | 37.6 | |
| Flight Simulator 2020 | 84.4 | 70.8 | 58.6 | 47.3 | 46.5 | 32.7 |
| Horizon Zero Dawn | 159 | 146 | 133 | 115 | 94 | 54 |
| Death Stranding | 174 | 173 | 170 | 169 | 133 | 78.8 |
| F1 2020 | 289 | 247 | 240 | 202 | 162 | 100 |
| Valorant | 290 | 285 | 267 | 266 | 259 | |
| Gears Tactics | 321 | 243 | 166 | 126 | 101 | 64.7 |
| Doom Eternal | 315 | 290 | 266 | 259 | 204 | 113 |
| Hunt Showdown | 235 | 200 | 170 | 125 | 60.4 | |
| Escape from Tarkov | 121 | 121 | 121 | 121 | 120 | 73.4 |
| Red Dead Redemption 2 | 127 | 119 | 103 | 76 | 63 | 42.3 |
| Star Wars Jedi Fallen Order | 106 | 106 | 104 | 105 | 73 | |
| Need for Speed Heat | 93 | 91 | 67 | |||
| Call of Duty Modern Warfare 2019 | 162 | 127 | 77 | |||
| GRID 2019 | 141 | 118 | 77 | |||
| Ghost Recon Breakpoint | 103 | 82 | 52 | |||
| FIFA 20 | 269 | 269 | 255 | 253 | 247 | 249 |
| Borderlands 3 | 155 | 137 | 122 | 105 | 81 | 45 |
| Control | 240 | 166 | 129 | 87 | 44 | |
| F1 2019 | 269 | 243 | 192 | 171 | 145 | 96 |
| Total War: Three Kingdoms | 96.3 | 81.1 | 43.8 | |||
| Rage 2 | 287 | 195 | 171 | 166 | 114 | 58 |
| Anno 1800 | 108 | 106 | 81 | 45 | 43 | 40 |
| The Division 2 | 211 | 180 | 144 | 127 | 96 | 55 |
| Dirt Rally 2.0 | 304 | 228 | 220 | 166 | 133 | 83 |
| Anthem | 117 | 120 | 118 | 112 | 106 | 69 |
| Far Cry New Dawn | 133 | 114 | 110 | 100 | 98 | 76 |
| Metro Exodus | 154 | 131 | 109 | 94 | 75 | 50 |
| Apex Legends | 144 | 144 | 144 | 144 | 144 | 111 |
| Just Cause 4 | 232 | 197 | 156 | 149 | 112 | 66 |
| Darksiders III | 208 | 135 | 127 | 121 | 112 | 71 |
| Battlefield V | 189 | 170 | 164 | 159 | 134 | 86 |
| Farming Simulator 19 | 245 | 184 | 159 | 146 | 146 | 107 |
| Hitman 2 | 88 | 85 | 77 | 74 | 74 | 62 |
| Call of Duty Black Ops 4 | 285 | 244 | 235 | 213 | 166 | 87 |
| Assassin´s Creed Odyssey | 137 | 125 | 108 | 82 | 72 | 50 |
| Forza Horizon 4 | 212 | 184 | 182 | 163 | 143 | 105 |
| FIFA 19 | 361 | 346 | 321 | 317 | 313 | 300 |
| Shadow of the Tomb Raider | 158 | 144 | 143 | 136 | 110 | 61 |
| F1 2018 | 248 | 216 | 167 | 141 | 133 | 97 |
| Monster Hunter World | 188 | 182 | 179 | 145 | 102 | 49 |
| The Crew 2 | 60 | 60 | 60 | 60 | 60 | 60 |
| Far Cry 5 | 153 | 136 | 130 | 121 | 116 | 77 |
| World of Tanks enCore | 105 | |||||
| X-Plane 11.11 | 130 | 117 | 92 | 78 | ||
| Kingdom Come: Deliverance | 187 | 163 | 132 | 91 | 84 | 50 |
| Final Fantasy XV Benchmark | 198 | 162 | 121 | 57 | ||
| Fortnite | 381 | 302 | 232 | 216 | 151 | 79 |
| Star Wars Battlefront 2 | 198 | 190 | 179 | 138 | 76.9 | |
| Need for Speed Payback | 163 | 157 | 154 | 151 | 95.6 | |
| Call of Duty WWII | 313 | 308 | 224 | 203 | 172 | 113 |
| Assassin´s Creed Origins | 146 | 131 | 126 | 107 | 93 | 64 |
| Destiny 2 | 193 | 191 | 190 | 190 | 162 | 91 |
| ELEX | 121 | 121 | 121 | 116 | 62.3 | |
| Middle-earth: Shadow of War | 204 | 180 | 153 | 78 | ||
| Playerunknown's Battlegrounds (PUBG) | 221 | 201 | 193 | 191 | 88 | |
| Dirt 4 | 364 | 268 | 231 | 183 | 125 | |
| Rocket League | 250 | 250 | 249 | 209 | ||
| Prey | 144 | 144 | 144 | 123 | ||
| Ghost Recon Wildlands | 169 | 139 | 135 | 86 | 66 | |
| For Honor | 369 | 270 | 258 | 206 | 99 | |
| Resident Evil 7 | 599 | 382 | 316 | 117 | ||
| Watch Dogs 2 | 166 | 156 | 135 | 107 | 68 | |
| Dishonored 2 | 106 | 105 | 104 | 101 | 96 | |
| Battlefield 1 | 200 | 198 | 192 | 185 | 115 | |
| Deus Ex Mankind Divided | 177 | 165 | 143 | 103 | 69 | |
| Overwatch | 300 | 300 | 300 | 297 | 193 | |
| Doom | 191 | 176 | 164 | 162 | 138 | |
| Ashes of the Singularity | 89.4 | 83.4 | ||||
| The Division | 341 | 282 | 196 | 158 | 90 | |
| Far Cry Primal | 139 | 126 | 116 | 107 | 90 | |
| Rise of the Tomb Raider | 335 | 231 | 217 | 200 | 95 | |
| Rainbow Six Siege | 448 | 370 | 338 | 320 | 180 | |
| World of Warships | 168 | |||||
| Dota 2 Reborn | 154 | 145 | 146 | 140 | 137 | |
| The Witcher 3 | 399 | 342 | 247 | 134 | 98 | |
| GTA V | 180 | 174 | 165 | 103 | 142 | |
| Battlefield 4 | 200 | 200 | 200 | 200 | 152 | |
| BioShock Infinite | 419 | 384 | 355 | 246 | ||
| Counter-Strike: GO | 270 | |||||
| min. | mittel | hoch | max. | QHD | 4K | < 30 fps < 60 fps < 120 fps ≥ 120 fps | 6 62 | 13 74 | 1 21 66 | 2 29 55 | 3 38 27 | 23 57 16 |
Eine Liste mit weiteren Spielen und allen Grafikkarten finden Sie auf unserer Seite: Welches Spiel ist mit welcher Grafikkarte spielbar?
