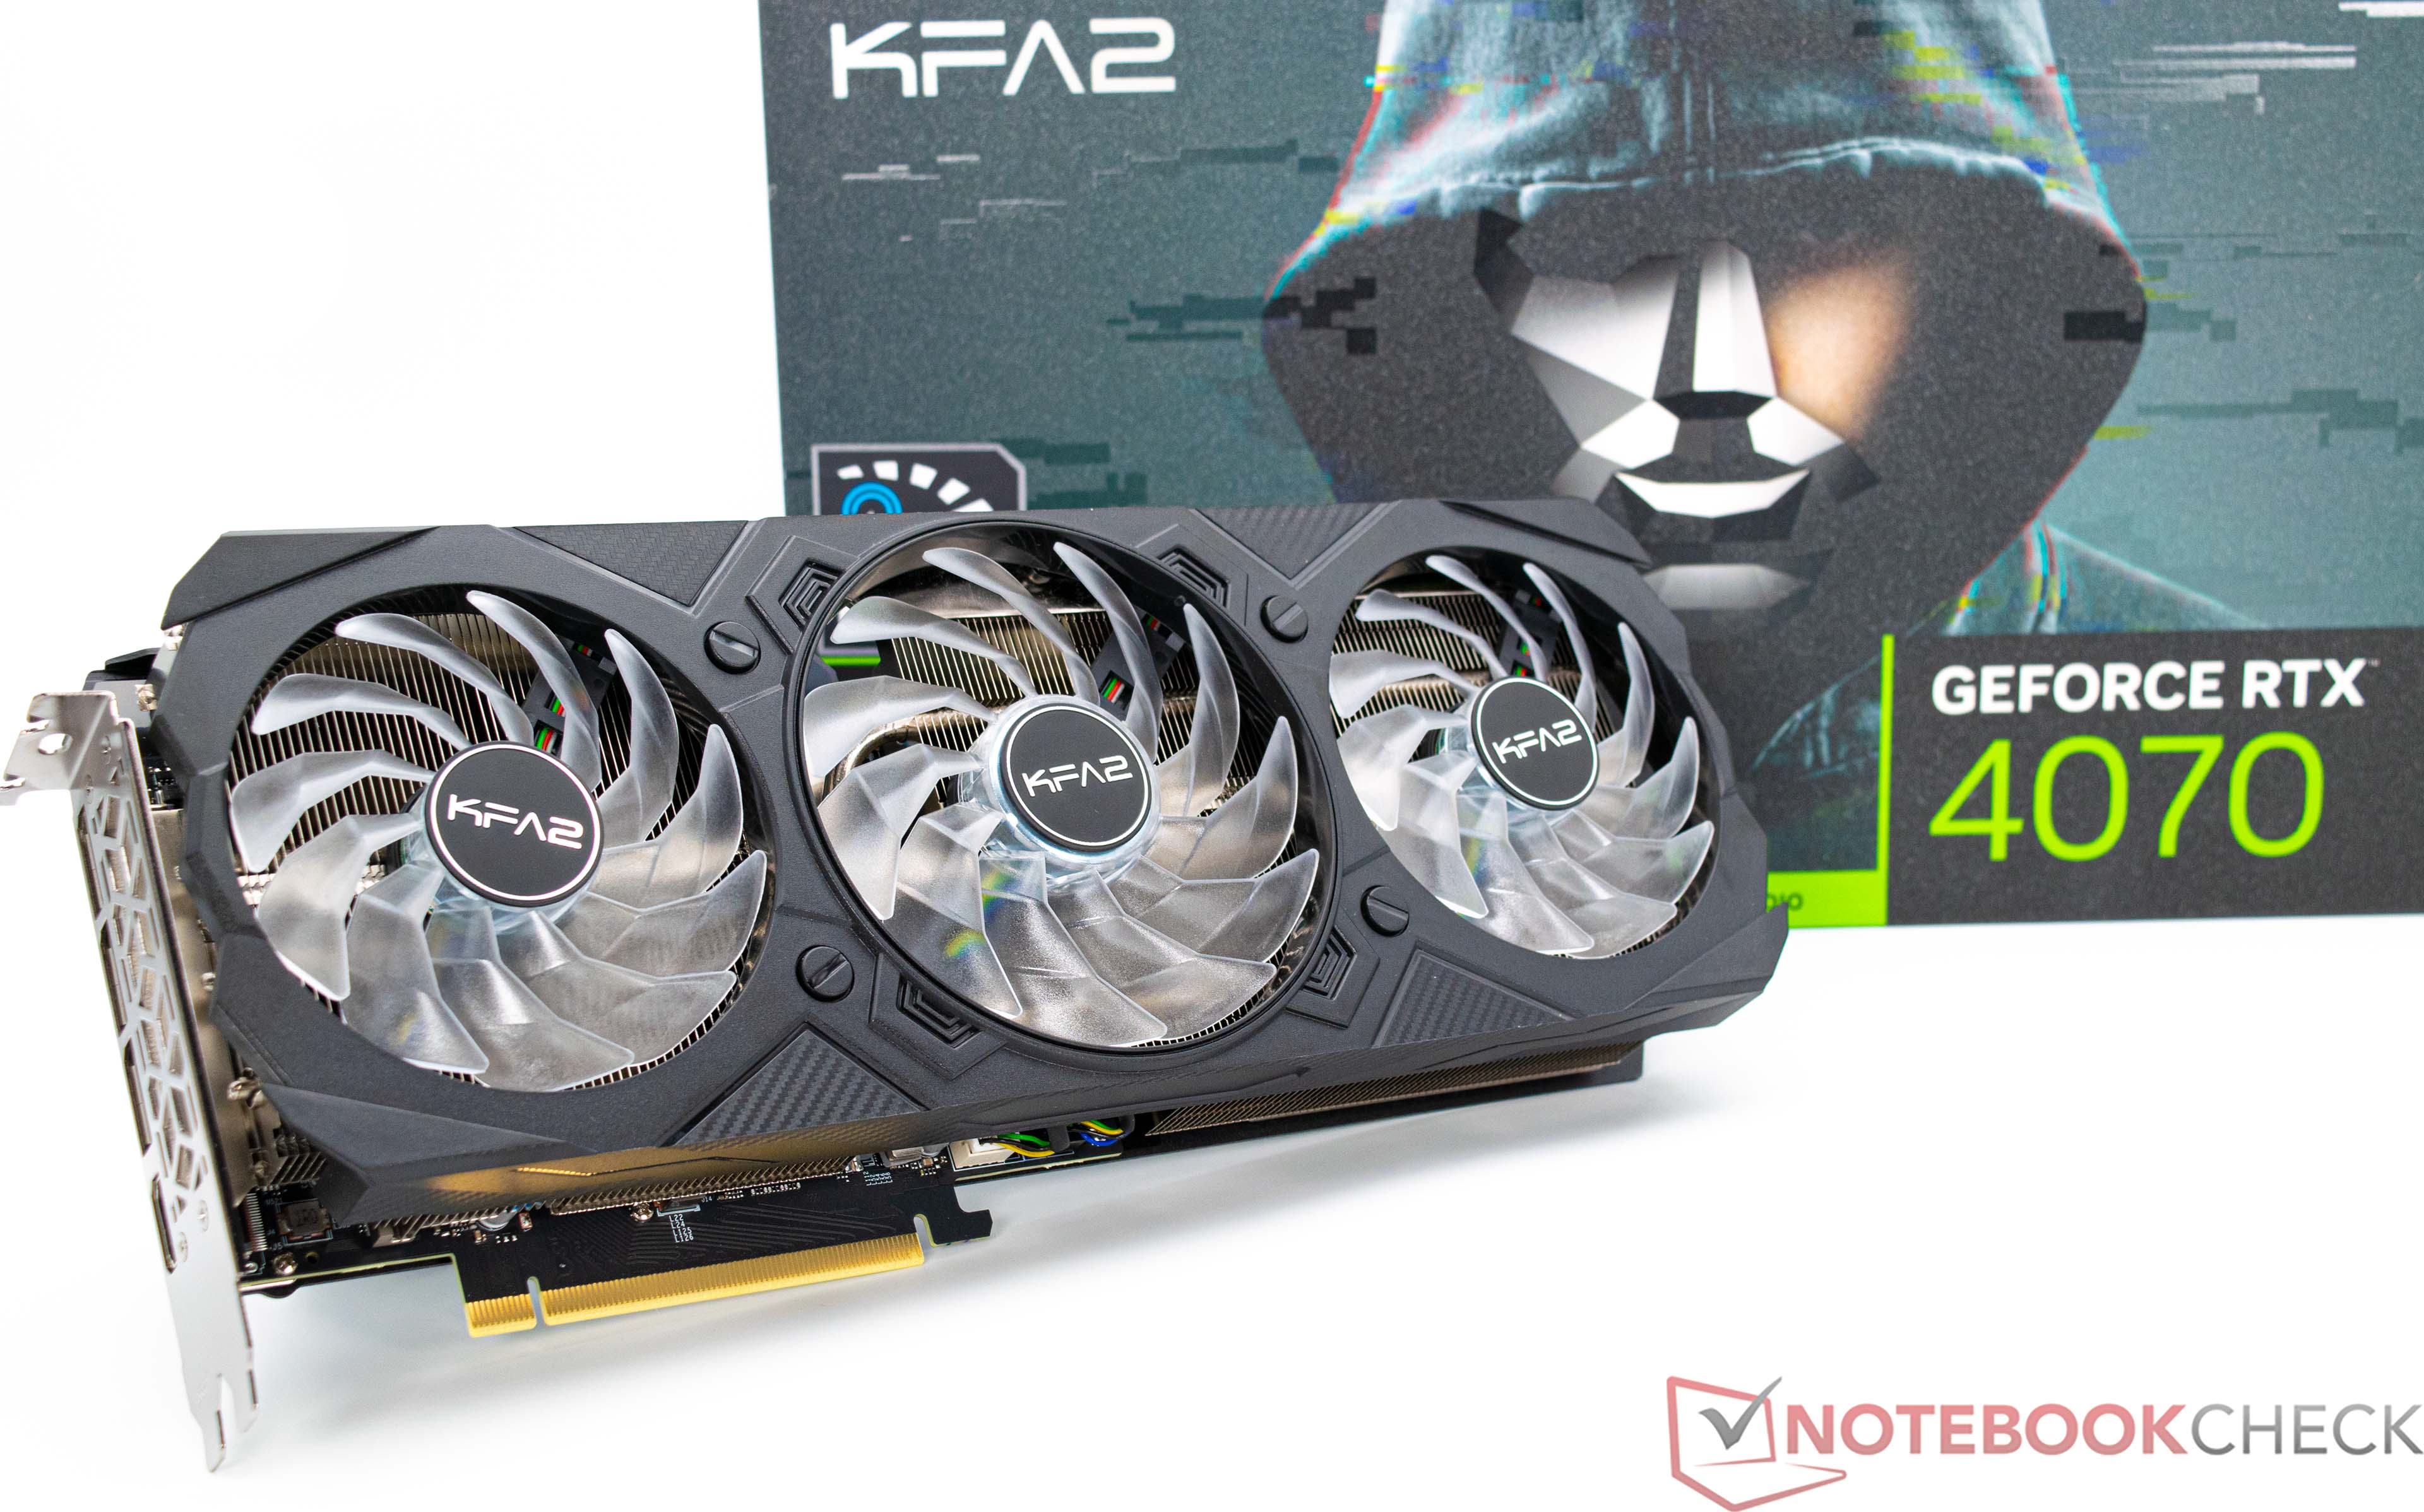
Notebookcheck Logo

NVIDIA GeForce RTX 4070

NVIDIA NVIDIA GeForce RTX 4070

Die Nvidia GeForce RTX 4070 ist eine High-End-Desktop-Grafikkarte basierend auf die Ada Lovelace Architektur. Sie nutzt den AD104 Chip und bietet 5.888 Kerne und 12 GB GDDR6X Grafikspeicher (192 Bit Bus mit 21 Gbits).

Die Gaming-Performance reicht auch bei anspruchsvollen Spielen wie bei Cyberpunk noch für 2k mit Ultra Settings. Mit Raytracing empfiehlt sich der Einsatz von DLSS und eventuell das Reduzieren der Auflösung. Im Konkurrenzvergleich ist die Performance vergleichbar mit der alten GeForce RTX 3080 bzw. der AMD Radeon 6800 XT. Im Vergleich zur mobilen GeForce RTX 4070 Laptop GPU, ist die Desktop-Version deutlich schneller.

Der AD104 Chip wird bei TSMC in 5 nm (4N mit EUV) produziert und ist mit einem TGP (Total Graphics Power) von 200 Watt spezifiziert.

GeForce RTX 4000 Serie

NVIDIA GeForce RTX 4090 compare 16384 @ 2.24 - 2.52 GHz384 Bit @ 21000 MHz
NVIDIA GeForce RTX 4080 Super compare 10240 @ 2.3 - 2.55 GHz? Bit @ 23000 MHz
NVIDIA GeForce RTX 4080 compare 9728 @ 2.21 - 2.51 GHz256 Bit @ 22400 MHz
NVIDIA GeForce RTX 4070 Ti SUPER compare 8448 @ 2.34 - 2.61 GHz256 Bit @ 21000 MHz
NVIDIA GeForce RTX 4070 Ti compare 7680 @ 2.31 - 2.61 GHz192 Bit @ 21000 MHz
NVIDIA GeForce RTX 4070 SUPER compare 7168 @ 1.98 - 2.48 GHz192 Bit @ 21000 MHz
NVIDIA GeForce RTX 4070 5888 @ 1.92 - 2.48 GHz192 Bit @ 21000 MHz
NVIDIA GeForce RTX 4060 Ti 16G compare 4352 @ 2.31 - 2.54 GHz128 Bit @ 18000 MHz
NVIDIA GeForce RTX 4060 Ti 8G compare 4352 @ 2.31 - 2.54 GHz128 Bit @ 18000 MHz
NVIDIA GeForce RTX 4060 compare 3072 @ 1.83 - 2.46 GHz128 Bit @ 17000 MHz
CodenameAD104
ArchitekturAda Lovelace
Pipelines5888 - unified
TMUs184
ROPs64
Raytracing Cores46
Tensor / AI Cores184
Kerntakt1920 - 2475 (Boost) MHz
Theoretical Performance29.1 TFLOPS FP16, 29.1 TFLOPS FP32, 0.63 TFLOPS FP64
CacheL2: 36 MB
Speichertakt21000 effective = 1313 MHz
Speicherbandbreite192 Bit
SpeichertypGDDR6X
Max. Speichergröße12 GB
Shared Memorynein
Memory Bandwidth504.2 GB/s
APIDirectX 12 Ultimate, Shader 6.7, OpenGL 4.6, OpenCL 3.0, Vulkan 1.3
Stromverbrauch200 Watt
Transistoren35.8 Billion
Chipgröße 295 mm²
Herstellungsprozess5 nm
PCIe4.0 x16
Displays4 Displays (max.), HDMI 2.1, DisplayPort 1.4a
Erscheinungsdatum13.04.2023
PredecessorNVIDIA GeForce RTX 3070

Benchmarks

Performance Rating - 3DMark 11 + Fire Strike + Time Spy
20 pt (60%)
3DMark Vantage
3DM Vant. Perf. total +
3DM Vant. Perf. GPU no PhysX +
3DMark 06 3DMark 06 - Standard 1280x1024 +
3DMark 06
69488 Points (91%)
SPECviewperf 12
specvp12 sw-03 +
specvp12 snx-02 +
specvp12 showcase-01 +
specvp12 mediacal-01 +
specvp12 maya-04 +
specvp12 energy-01 +
specvp12 creo-01 +
specvp12 catia-04 +
specvp12 3dsmax-05 +
SPECviewperf 13 specvp13 sw-04 +
specvp13 snx-03 +
specvp13 showcase-02 +
specvp13 medical-02 +
specvp13 maya-05 +
specvp13 energy-02 +
specvp13 creo-02 +
specvp13 catia-05 +
specvp13 3dsmax-06 +
SPECviewperf 2020 specvp2020 snx-04 4k +
specvp2020 medical-03 4k +
specvp2020 maya-06 4k +
specvp2020 energy-03 4k +
specvp2020 creo-03 4k +
specvp2020 catia-06 4k +
specvp2020 3dsmax-07 4k +
Power Consumption - Furmark Stress Test Power Consumption - external Monitor *
min: 311     avg: 330.3     median: 329 (47%)     max: 351 Watt
020406080100120140160180200220240260280300320340360380Tooltip
Power Consumption - The Witcher 3 Power Consumption - external Monitor *
min: 353     avg: 356.7     median: 358 (50%)     max: 359 Watt
0255075100125150175200225250275300325350375400425Tooltip
- Bereich der Benchmarkergebnisse für diese Grafikkarte
- Durchschnittliche Benchmarkergebnisse für diese Grafikkarte
* Smaller numbers mean a higher performance

Spiele-Benchmarks

Die folgenden Benchmarks basieren auf unseren Spieletests mit Testnotebooks. Die Performance dieser Grafikkarte bei den gelisteten Spielen ist abhängig von der verwendeten CPU, Speicherausstattung, Treiber und auch Betriebssystem. Dadurch müssen die untenstehenden Werte nicht repräsentativ sein. Detaillierte Informationen über das verwendete System sehen Sie nach einem Klick auf den fps-Wert.

F1 23

F1 23

2023
min. 1920x1080
438  fps    + Vergleich
mittel 1920x1080
415  fps    + Vergleich
hoch 1920x1080
302  fps    + Vergleich
max. 1920x1080
105  fps    + Vergleich
QHD 2560x1440
66  fps    + Vergleich
4K 3840x2160
32  fps    + Vergleich
» In Detailstufe max. mit allen getesteten Notebooks spielbar
Additional Benchmarks
Ultra Low Preset TAA 1280x720
397
Diablo 4

Diablo 4

2023
min. 1920x1080
397  fps    + Vergleich + 📈 Graph
mittel 1920x1080
378  fps    + Vergleich + 📈 Graph
hoch 1920x1080
338  fps    + Vergleich + 📈 Graph
max. 1920x1080
285  fps    + Vergleich + 📈 Graph
QHD 2560x1440
192.7  fps    + Vergleich + 📈 Graph
4K 3840x2160
97.2  fps    + Vergleich + 📈 Graph
3840x2160
128.5  fps    + Vergleich + 📈 Graph
» In Detailstufe max. mit allen getesteten Notebooks spielbar
Additional Benchmarks
Low Preset 1280x720
396
min. 1920x1080
127.7  fps    + Vergleich + 📈 Graph
mittel 1920x1080
130.2  fps    + Vergleich + 📈 Graph
hoch 1920x1080
121.2  fps    + Vergleich + 📈 Graph
max. 1920x1080
106.7  fps    + Vergleich + 📈 Graph
QHD 2560x1440
69.6  fps    + Vergleich + 📈 Graph
4K 3840x2160
34.3  fps    + Vergleich + 📈 Graph
» In Detailstufe max. mit allen getesteten Notebooks spielbar
Additional Benchmarks
Low Preset 1280x720
141.8
Epic Preset + Ray Tracing 1920x1080
83.9
min. 1920x1080
326  fps    + Vergleich + 📈 Graph
mittel 1920x1080
319  fps    + Vergleich + 📈 Graph
hoch 1920x1080
275  fps    + Vergleich + 📈 Graph
max. 1920x1080
249  fps    + Vergleich + 📈 Graph
QHD 2560x1440
168  fps    + Vergleich + 📈 Graph
4K 3840x2160
79.5  fps    + Vergleich + 📈 Graph
» In Detailstufe max. mit allen getesteten Notebooks spielbar
Additional Benchmarks
Low Preset Low TAA 1280x720
316
min. 1920x1080
164.7  fps    + Vergleich + 📈 Graph
mittel 1920x1080
138.7  fps    + Vergleich + 📈 Graph
hoch 1920x1080
122.7  fps    + Vergleich + 📈 Graph
max. 1920x1080
108.8  fps    + Vergleich + 📈 Graph
QHD 2560x1440
72.5  fps    + Vergleich + 📈 Graph
4K 3840x2160
35.2  fps    + Vergleich + 📈 Graph
3840x2160
58  fps    + Vergleich + 📈 Graph
» In Detailstufe max. mit allen getesteten Notebooks spielbar
Additional Benchmarks
Low Preset 1280x720
178
min. 1920x1080
252  fps    + Vergleich + 📈 Graph
mittel 1920x1080
190  fps    + Vergleich + 📈 Graph
hoch 1920x1080
175.9  fps    + Vergleich + 📈 Graph
max. 1920x1080
127.8  fps    + Vergleich + 📈 Graph
QHD 2560x1440
94.9  fps    + Vergleich + 📈 Graph
4K 3840x2160
52.8  fps    + Vergleich + 📈 Graph
» In Detailstufe max. mit allen getesteten Notebooks spielbar
Additional Benchmarks
Prioritize Performance Preset 1280x720
286
min. 1920x1080
333.9  fps    + Vergleich
mittel 1920x1080
297.1  fps    + Vergleich
hoch 1920x1080
227.4  fps    + Vergleich
max. 1920x1080
226.6  fps    + Vergleich
QHD 2560x1440
170.3  fps    + Vergleich
4K 3840x2160
97.5  fps    + Vergleich
» In Detailstufe max. mit allen getesteten Notebooks spielbar
Additional Benchmarks
Minimum Settings 1280x720
390.5
min. 1920x1080
133  fps    + Vergleich + 📈 Graph
mittel 1920x1080
126.3  fps    + Vergleich + 📈 Graph
hoch 1920x1080
122.5  fps    + Vergleich + 📈 Graph
max. 1920x1080
120.1  fps    + Vergleich + 📈 Graph
QHD 2560x1440
99.9  fps    + Vergleich + 📈 Graph
4K 3840x2160
59.7  fps    + Vergleich + 📈 Graph
» In Detailstufe max. mit allen getesteten Notebooks spielbar
Additional Benchmarks
Ultra Low Preset 1280x720
138.2
min. 1920x1080
320  fps    + Vergleich + 📈 Graph
mittel 1920x1080
250  fps    + Vergleich + 📈 Graph
hoch 1920x1080
148.3  fps    + Vergleich + 📈 Graph
max. 1920x1080
144.8  fps    + Vergleich + 📈 Graph
QHD 2560x1440
109.4  fps    + Vergleich + 📈 Graph
4K 3840x2160
62.4  fps    + Vergleich + 📈 Graph
» In Detailstufe max. mit allen getesteten Notebooks spielbar
Additional Benchmarks
Low Preset 1280x720
325
Returnal

Returnal

2023
min. 1920x1080
159  fps    + Vergleich
mittel 1920x1080
156  fps    + Vergleich
hoch 1920x1080
141  fps    + Vergleich
max. 1920x1080
121  fps    + Vergleich
QHD 2560x1440
90  fps    + Vergleich
4K 3840x2160
53  fps    + Vergleich
» In Detailstufe max. mit allen getesteten Notebooks spielbar
Additional Benchmarks
Low Preset 1280x720
197
Epic Preset + Epic Ray-Tracing 1920x1080
102
Epic Preset + Epic Ray-Tracing 3840x2160
40
min. 1920x1080
163.9  fps    + Vergleich + 📈 Graph
mittel 1920x1080
148.4  fps    + Vergleich + 📈 Graph
hoch 1920x1080
131  fps    + Vergleich + 📈 Graph
max. 1920x1080
112.8  fps    + Vergleich + 📈 Graph
QHD 2560x1440
84.2  fps    + Vergleich + 📈 Graph
4K 3840x2160
41.9  fps    + Vergleich + 📈 Graph
» In Detailstufe max. mit allen getesteten Notebooks spielbar
Additional Benchmarks
Low Preset Low TAA 1280x720
166.2
Ultra Preset + Full Ray Tracing High TAA 1920x1080
73.1
Ultra Preset + Full Ray Tracing High TAA 3840x2160
29.3
min. 1920x1080
167.7  fps    + Vergleich + 📈 Graph
mittel 1920x1080
159.2  fps    + Vergleich + 📈 Graph
hoch 1920x1080
139.5  fps    + Vergleich + 📈 Graph
max. 1920x1080
136.7  fps    + Vergleich + 📈 Graph
QHD 2560x1440
89.4  fps    + Vergleich + 📈 Graph
4K 3840x2160
44.8  fps    + Vergleich + 📈 Graph
» In Detailstufe max. mit allen getesteten Notebooks spielbar
Additional Benchmarks
Low Preset TAA 1280x720
236
min. 1920x1080
226 300 ~ 263 fps    + Vergleich + 📈 Graph
mittel 1920x1080
257  fps    + Vergleich + 📈 Graph
hoch 1920x1080
141.3 226 ~ 184 fps    + Vergleich + 📈 Graph
max. 1920x1080
120.4 193.2 ~ 157 fps    + Vergleich + 📈 Graph
QHD 2560x1440
75.2 141.7 ~ 108 fps    + Vergleich + 📈 Graph
4K 3840x2160
38.4 74.3 ~ 56 fps    + Vergleich + 📈 Graph
» In Detailstufe max. mit allen getesteten Notebooks spielbar
Additional Benchmarks
Low Preset / Off 1280x720
293
RT Ultra Preset / On FXAA 1920x1080
51.7
52.6
min. 1920x1080
406  fps    + Vergleich + 📈 Graph
mittel 1920x1080
267  fps    + Vergleich + 📈 Graph
hoch 1920x1080
213  fps    + Vergleich + 📈 Graph
max. 1920x1080
169.7  fps    + Vergleich + 📈 Graph
QHD 2560x1440
106.3  fps    + Vergleich + 📈 Graph
4K 3840x2160
45.7  fps    + Vergleich + 📈 Graph
» In Detailstufe max. mit allen getesteten Notebooks spielbar
Additional Benchmarks
Low Preset 1280x720
376
min. 1920x1080
228.3  fps    + Vergleich
mittel 1920x1080
189.3  fps    + Vergleich
hoch 1920x1080
181.9 185 ~ 183 fps    + Vergleich
max. 1920x1080
121.4 121.6 ~ 122 fps    + Vergleich
QHD 2560x1440
89.6 90.6 ~ 90 fps    + Vergleich
4K 3840x2160
52 52.4 ~ 52 fps    + Vergleich
» In Detailstufe max. mit allen getesteten Notebooks spielbar
Additional Benchmarks
Low Preset (without FSR Upscaling) 1280x720
240.6
Ultra Preset (without FSR Upscaling) + Full Ray-Tracing 1920x1080
82
78.6
min. 1920x1080
184.8  fps    + Vergleich + 📈 Graph
mittel 1920x1080
176.4  fps    + Vergleich + 📈 Graph
hoch 1920x1080
166.3  fps    + Vergleich + 📈 Graph
max. 1920x1080
160.3  fps    + Vergleich + 📈 Graph
QHD 2560x1440
124.2  fps    + Vergleich + 📈 Graph
4K 3840x2160
70.8  fps    + Vergleich + 📈 Graph
» In Detailstufe max. mit allen getesteten Notebooks spielbar
Additional Benchmarks
Very Low Preset 1280x720
208
Very High Preset + Ray-Tracing TAA 1920x0180
88.2
hoch 1920x1080
149  fps    + Vergleich
max. 1920x1080
143  fps    + Vergleich
QHD 2560x1440
103  fps    + Vergleich
4K 3840x2160
62  fps    + Vergleich
» In Detailstufe max. mit allen getesteten Notebooks spielbar
min. 1920x1080
135.4  fps    + Vergleich + 📈 Graph
mittel 1920x1080
132.7  fps    + Vergleich + 📈 Graph
hoch 1920x1080
124.7 127.2 ~ 126 fps    + Vergleich + 📈 Graph
max. 1920x1080
121.4 122.4 ~ 122 fps    + Vergleich + 📈 Graph
QHD 2560x1440
92.8 94.2 ~ 94 fps    + Vergleich + 📈 Graph
4K 3840x2160
54.8 55.1 ~ 55 fps    + Vergleich + 📈 Graph
» In Detailstufe max. mit allen getesteten Notebooks spielbar
Additional Benchmarks
Low Preset 1280x720
149.7
min. 1920x1080
179.6  fps    + Vergleich + 📈 Graph
mittel 1920x1080
147.3  fps    + Vergleich + 📈 Graph
hoch 1920x1080
111.6  fps    + Vergleich + 📈 Graph
max. 1920x1080
85.9  fps    + Vergleich + 📈 Graph
QHD 2560x1440
61  fps    + Vergleich + 📈 Graph
4K 3840x2160
34.6  fps    + Vergleich + 📈 Graph
3840x2160
68.5  fps    + Vergleich + 📈 Graph
» In Detailstufe max. mit allen getesteten Notebooks spielbar
Additional Benchmarks
Low Preset 1280x720
189.6
Ultra DLSS Quality 3840x2160
49.9
min. 1920x1080
277  fps    + Vergleich + 📈 Graph
mittel 1920x1080
204  fps    + Vergleich + 📈 Graph
hoch 1920x1080
167  fps    + Vergleich + 📈 Graph
max. 1920x1080
132.8  fps    + Vergleich + 📈 Graph
QHD 2560x1440
90.9  fps    + Vergleich + 📈 Graph
4K 3840x2160
32.5  fps    + Vergleich + 📈 Graph
» In Detailstufe max. mit allen getesteten Notebooks spielbar
Additional Benchmarks
Low Preset 1280x720
345
F1 22

F1 22

2022
min. 1920x1080
378 400 ~ 389 fps    + Vergleich
mittel 1920x1080
372 386 ~ 379 fps    + Vergleich
hoch 1920x1080
296 309 ~ 303 fps    + Vergleich
max. 1920x1080
111.8 113.3 ~ 113 fps    + Vergleich
QHD 2560x1440
71.9 73.7 ~ 73 fps    + Vergleich
4K 3840x2160
36.6 36.7 ~ 37 fps    + Vergleich
» In Detailstufe max. mit allen getesteten Notebooks spielbar
Additional Benchmarks
Ultra Low Preset 16xAF TAA 1280x720
475
508
min. 1920x1080
272  fps    + Vergleich + 📈 Graph
mittel 1920x1080
260  fps    + Vergleich + 📈 Graph
hoch 1920x1080
259 264 ~ 262 fps    + Vergleich + 📈 Graph
max. 1920x1080
252 261 ~ 257 fps    + Vergleich + 📈 Graph
QHD 2560x1440
165.4 165.7 ~ 166 fps    + Vergleich + 📈 Graph
4K 3840x2160
73.6 77.4 ~ 76 fps    + Vergleich + 📈 Graph
» In Detailstufe max. mit allen getesteten Notebooks spielbar
Additional Benchmarks
Lowest Settings 1280x720
272
Highest Settings + Maximum Ray Tracing 1920x1080
112.2
113.3
min. 1920x1080
363  fps    + Vergleich
mittel 1920x1080
293  fps    + Vergleich
hoch 1920x1080
196  fps    + Vergleich
max. 1920x1080
153.9  fps    + Vergleich
QHD 2560x1440
106.9  fps    + Vergleich
4K 3840x2160
56.4  fps    + Vergleich
» In Detailstufe max. mit allen getesteten Notebooks spielbar
Additional Benchmarks
Lowest Preset (DX12) 1280x720
441
min. 1920x1080
215.8  fps    + Vergleich
mittel 1920x1080
173.8  fps    + Vergleich
hoch 1920x1080
139.3 145.9 ~ 143 fps    + Vergleich
max. 1920x1080
124.9 131 ~ 128 fps    + Vergleich
QHD 2560x1440
80.3 80.9 ~ 81 fps    + Vergleich
4K 3840x2160
35.6 36.7 ~ 36 fps    + Vergleich
» In Detailstufe max. mit allen getesteten Notebooks spielbar
Additional Benchmarks
Low Preset 1280x720
231.9
Ray Tracing Ultra Preset (DLSS off) 1920x1080
60
63.1
Ray Tracing Ultra Preset (DLSS off) 3840x2160
15.3
17.9
min. 1920x1080
286  fps    + Vergleich
mittel 1920x1080
263  fps    + Vergleich
hoch 1920x1080
236  fps    + Vergleich
max. 1920x1080
207  fps    + Vergleich
QHD 2560x1440
166.8  fps    + Vergleich
4K 3840x2160
110.2  fps    + Vergleich
» In Detailstufe max. mit allen getesteten Notebooks spielbar
Additional Benchmarks
Low Preset 1280x720
288
hoch 1920x1080
135.2  fps    + Vergleich + 📈 Graph
QHD 2560x1440
92.7  fps    + Vergleich + 📈 Graph
4K 3840x2160
45.8  fps    + Vergleich + 📈 Graph
» In Detailstufe hoch mit allen getesteten Notebooks spielbar
Additional Benchmarks
High Quality Raytracing 1920x1080
59.4
min. 1920x1080
233  fps    + Vergleich + 📈 Graph
mittel 1920x1080
192.3  fps    + Vergleich + 📈 Graph
hoch 1920x1080
151.8  fps    + Vergleich + 📈 Graph
max. 1920x1080
105.6  fps    + Vergleich + 📈 Graph
QHD 2560x1440
92.6  fps    + Vergleich + 📈 Graph
4K 3840x2160
63.1  fps    + Vergleich + 📈 Graph
» In Detailstufe max. mit allen getesteten Notebooks spielbar
Additional Benchmarks
Low Preset 1280x720
268
min. 1280x720
219  fps    + Vergleich
mittel 1920x1080
223  fps    + Vergleich
hoch 1920x1080
222  fps    + Vergleich
max. 1920x1080
218  fps    + Vergleich
QHD 2560x1440
172  fps    + Vergleich
4K 3840x2160
92  fps    + Vergleich
» In Detailstufe max. mit allen getesteten Notebooks spielbar
Additional Benchmarks
Low Preset 1920x1080
221
Ultra Preset + Ultra Ray-Tracing 1920x1080
131
Far Cry 6

Far Cry 6

2021
min. 1280x720
227  fps    + Vergleich + 📈 Graph
mittel 1920x1080
195.7  fps    + Vergleich + 📈 Graph
hoch 1920x1080
173.9 188 ~ 181 fps    + Vergleich + 📈 Graph
max. 1920x1080
167.7 172 ~ 170 fps    + Vergleich + 📈 Graph
QHD 2560x1440
133 134.1 ~ 134 fps    + Vergleich + 📈 Graph
4K 3840x2160
73.9 74 ~ 74 fps    + Vergleich + 📈 Graph
» In Detailstufe max. mit allen getesteten Notebooks spielbar
Additional Benchmarks
Low Graphics Quality 1920x1080
218
Ultra Graphics Quality + HD Textures + DXR TAA 1920x1080
138
132
F1 2021

F1 2021

2021
min. 1280x720
617 637 ~ 627 fps    + Vergleich
mittel 1920x1080
530 556 ~ 543 fps    + Vergleich
hoch 1920x1080
421 435 ~ 428 fps    + Vergleich
max. 1920x1080
218 225 ~ 222 fps    + Vergleich
QHD 2560x1440
160.3 163.6 ~ 162 fps    + Vergleich
4K 3840x2160
89.7 91 ~ 90 fps    + Vergleich
» In Detailstufe max. mit allen getesteten Notebooks spielbar
hoch 1920x1080
163.7  fps    + Vergleich + 📈 Graph
max. 1920x1080
124.4  fps    + Vergleich + 📈 Graph
QHD 2560x1440
93.3  fps    + Vergleich + 📈 Graph
4K 3840x2160
49.5  fps    + Vergleich + 📈 Graph
» In Detailstufe max. mit allen getesteten Notebooks spielbar
Additional Benchmarks
Ultra Preset + Ultra Ray Tracing (DX12) 1920x1080
75.3
hoch 1920x1080
207  fps    + Vergleich + 📈 Graph
QHD 2560x1440
141.1  fps    + Vergleich + 📈 Graph
4K 3840x2160
72.3  fps    + Vergleich + 📈 Graph
» In Detailstufe hoch mit allen getesteten Notebooks spielbar
F1 2020

F1 2020

2020
min. 1280x720
529  fps    + Vergleich
mittel 1920x1080
470  fps    + Vergleich
hoch 1920x1080
418  fps    + Vergleich
max. 1920x1080
293  fps    + Vergleich
QHD 2560x1440
222  fps    + Vergleich
4K 3840x2160
129.6  fps    + Vergleich
» In Detailstufe max. mit allen getesteten Notebooks spielbar
min. 1280x720
251  fps    + Vergleich
mittel 1920x1080
228  fps    + Vergleich
hoch 1920x1080
183.2 187.8 ~ 186 fps    + Vergleich
max. 1920x1080
154.5 156.3 ~ 155 fps    + Vergleich
QHD 2560x1440
110.8 111.2 ~ 111 fps    + Vergleich
4K 3840x2160
58.6 58.8 ~ 59 fps    + Vergleich
» In Detailstufe max. mit allen getesteten Notebooks spielbar
Additional Benchmarks
Very Low Overall Quality (DX11) 1920x1080
253
Control

Control

2019
min. 1280x720
240  fps    + Vergleich + 📈 Graph
mittel 1920x1080
220  fps    + Vergleich + 📈 Graph
hoch 1920x1080
159.5 160.4 ~ 160 fps    + Vergleich + 📈 Graph
QHD 2560x1440
101.5 101.8 ~ 102 fps    + Vergleich + 📈 Graph
4K 3840x2160
49.8 50.2 ~ 50 fps    + Vergleich + 📈 Graph
3840x2160
60.7  fps    + Vergleich + 📈 Graph
» In Detailstufe hoch mit allen getesteten Notebooks spielbar
Additional Benchmarks
High Quality Preset & High Ray Tracing Preset (DX12) 1920x1080
101.8
102
High Quality Preset & High Ray Tracing Preset (DX12) 3840x2160
30.8
30.8
min. 1280x720
198  fps    + Vergleich + 📈 Graph
mittel 1920x1080
174  fps    + Vergleich + 📈 Graph
hoch 1920x1080
168  fps    + Vergleich + 📈 Graph
max. 1920x1080
152  fps    + Vergleich + 📈 Graph
QHD 2560x1440
143  fps    + Vergleich + 📈 Graph
4K 3840x2160
96  fps    + Vergleich + 📈 Graph
» In Detailstufe max. mit allen getesteten Notebooks spielbar
min. 1280x720
296  fps    + Vergleich
mittel 1920x1080
212  fps    + Vergleich
hoch 1920x1080
159.4 164.7 ~ 162 fps    + Vergleich
max. 1920x1080
129.4 130.2 ~ 130 fps    + Vergleich
QHD 2560x1440
103.7 103.8 ~ 104 fps    + Vergleich
4K 3840x2160
64.9 65 ~ 65 fps    + Vergleich
» In Detailstufe max. mit allen getesteten Notebooks spielbar
Additional Benchmarks
Ultra Quality DXR 16xAF 1920x1080
107.1
109.4
min. 1280x720
339  fps    + Vergleich
mittel 1920x1080
274  fps    + Vergleich
hoch 1920x1080
256 260 ~ 258 fps    + Vergleich
max. 1920x1080
236 239 ~ 238 fps    + Vergleich
QHD 2560x1440
160.7 162.6 ~ 162 fps    + Vergleich
4K 3840x2160
83.7 83.8 ~ 84 fps    + Vergleich
» In Detailstufe max. mit allen getesteten Notebooks spielbar
Additional Benchmarks
Lowest Preset 1920x1080
337
Strange Brigade

Strange Brigade

2018
min. 1280x720
611 696 ~ 654 fps    + Vergleich
mittel 1920x1080
478 486 ~ 482 fps    + Vergleich
hoch 1920x1080
375 376 ~ 376 fps    + Vergleich
max. 1920x1080
321 322 ~ 322 fps    + Vergleich
QHD 2560x1440
222 222 ~ 222 fps    + Vergleich
4K 3840x2160
121 121.9 ~ 121 fps    + Vergleich
» In Detailstufe max. mit allen getesteten Notebooks spielbar
Far Cry 5

Far Cry 5

2018
min. 1280x720
241  fps    + Vergleich + 📈 Graph
mittel 1920x1080
210  fps    + Vergleich + 📈 Graph
hoch 1920x1080
204  fps    + Vergleich + 📈 Graph
max. 1920x1080
189  fps    + Vergleich + 📈 Graph
QHD 2560x1440
171  fps    + Vergleich + 📈 Graph
4K 3840x2160
93  fps    + Vergleich + 📈 Graph
» In Detailstufe max. mit allen getesteten Notebooks spielbar
Additional Benchmarks
Low Preset TAA 1920x1080
236
min. 1280x720
223 244 ~ 234 fps    + Vergleich
mittel 1920x1080
189.1 214 ~ 202 fps    + Vergleich
hoch 1920x1080
150 162.9 ~ 156 fps    + Vergleich
4K 3840x2160
123.7 136.5 ~ 130 fps    + Vergleich
» In Detailstufe hoch mit allen getesteten Notebooks spielbar
min. 1280x720
235 237 ~ 236 fps    + Vergleich
mittel 1920x1080
230 236 ~ 233 fps    + Vergleich
hoch 1920x1080
175.8 182.6 ~ 179 fps    + Vergleich
QHD 2560x1440
133.7 135.2 ~ 134 fps    + Vergleich
4K 3840x2160
74 74.8 ~ 74 fps    + Vergleich
» In Detailstufe hoch mit allen getesteten Notebooks spielbar
min. 1280x720
281.8 297 ~ 289 fps    + Vergleich
mittel 1366x768
255.9 267 ~ 261 fps    + Vergleich
hoch 1920x1080
244.3 253.4 ~ 249 fps    + Vergleich
max. 1920x1080
229.9 238.1 ~ 234 fps    + Vergleich
4K 3840x2160
199.3 210.7 ~ 205 fps    + Vergleich
» In Detailstufe max. mit allen getesteten Notebooks spielbar
min. 1024x768
781.2  fps    + Vergleich
mittel 1366x768
569  fps    + Vergleich
hoch 1920x1080
350 351.4 ~ 351 fps    + Vergleich + 📈 Graph
max. 1920x1080
168.6 171.2 ~ 170 fps    + Vergleich + 📈 Graph
4K 3840x2160
112.5 116.9 ~ 115 fps    + Vergleich + 📈 Graph
» In Detailstufe max. mit allen getesteten Notebooks spielbar
Additional Benchmarks
Ultra Graphics & Postprocessing (HBAO+) 3840x2160
77.1
75.2
Medium Graphics & Postprocessing 1920x1080
420.1
GTA V

GTA V

2015
min. 1024x768
188 188.3 ~ 188 fps    + Vergleich
mittel 1366x768
187.8 188.1 ~ 188 fps    + Vergleich
hoch 1920x1080
187.3 187.4 ~ 187 fps    + Vergleich
max. 1920x1080
160.9 161.7 ~ 161 fps    + Vergleich
QHD 2560x1440
136.2 138.4 ~ 137 fps    + Vergleich
4K 3840x2160
145.7 146.6 ~ 146 fps    + Vergleich
» In Detailstufe max. mit allen getesteten Notebooks spielbar
Additional Benchmarks
Highest Settings possible 16xAF 4xMSAA + FXAA 3840x2160
59.6
59.9
Normal/Off 4xAF 1920x1080
188.1
187.8
Lowest Settings possible 1920x1080
187.8
min.mittelhochmax.QHD4K
F1 234384153021056632
Diablo 4397378338285192.797.2
Star Wars Jedi Survivor127.7130.2121.2106.769.634.3
Dead Island 232631927524916879.5
The Last of Us164.7138.7122.7108.872.535.2
Resident Evil 4 Remake252190175.9127.894.952.8
Company of Heroes 3333.9297.1227.4226.6170.397.5
Sons of the Forest133126.3122.5120.199.959.7
Atomic Heart320250148.3144.8109.462.4
Returnal1591561411219053
Hogwarts Legacy163.9148.4131112.884.241.9
Dead Space Remake167.7159.2139.5136.789.444.8
The Witcher 3 v4.0026325718415710856
High On Life406267213169.7106.345.7
The Callisto Protocol228.3189.31831229052
Spider-Man Miles Morales184.8176.4166.3160.3124.270.8
Call of Duty Modern Warfare 2 202214914310362
Uncharted Legacy of Thieves Collection135.4132.71261229455
A Plague Tale Requiem179.6147.3111.685.96134.6
The Quarry277204167132.890.932.5
F1 223893793031137337
Ghostwire Tokyo27226026225716676
Tiny Tina's Wonderlands363293196153.9106.956.4
Cyberpunk 2077 1.6215.8173.81431288136
GRID Legends286263236207166.8110.2
Dying Light 2135.292.745.8
God of War233192.3151.8105.692.663.1
Guardians of the Galaxy21922322221817292
Far Cry 6227195.718117013474
F1 202162754342822216290
Watch Dogs Legion163.7124.493.349.5
Mafia Definitive Edition207141.172.3
F1 2020529470418293222129.6
Borderlands 325122818615511159
Control24022016010250
Far Cry New Dawn19817416815214396
Metro Exodus29621216213010465
Shadow of the Tomb Raider33927425823816284
Strange Brigade654482376322222121
Far Cry 524121020418917193
X-Plane 11.11234202156130
Final Fantasy XV Benchmark23623317913474
Dota 2 Reborn289261249234205
The Witcher 3781.2569351170115
GTA V188188187161137146
< 30 fps
< 60 fps
< 120 fps
≥ 120 fps


41


41


1
44


7
33


25
17

21
19
5

Eine Liste mit weiteren Spielen und allen Grafikkarten finden Sie auf unserer Seite: Welches Spiel ist mit welcher Grafikkarte spielbar?

Ein oder mehrere Geräte zum Vergleich auswählen

In der folgenden Liste können sie Geräte suchen und für einen Vergleich auswählen.

Liste einschränken:

show all (including archived), 2024, 2023
v1.26
log 26. 03:00:06

#0 no ids found in url (should be separated by "_") +0s ... 0s

#1 not redirecting to Ajax server +0s ... 0s

#2 did not recreate cache, as it is less than 5 days old! Created at Thu, 25 Apr 2024 05:40:10 +0200 +0.001s ... 0.001s

#3 composed specs +0.063s ... 0.065s

#4 did output specs +0s ... 0.065s

#5 start showIntegratedCPUs +0s ... 0.065s

#6 getting avg benchmarks for device 11582 +0.038s ... 0.102s

#7 got single benchmarks 11582 +0.02s ... 0.122s

#8 got avg benchmarks for devices +0s ... 0.122s

#9 min, max, avg, median took s +1.177s ... 1.299s

#10 before gaming benchmark output +0s ... 1.299s

#11 Got 339 rows for game benchmarks. +0.114s ... 1.413s

#12 composed SQL query for gamebenchmarks +0s ... 1.413s

#13 got data and put it in $dataArray +0.034s ... 1.448s

#14 benchmarks composed for output. +2.766s ... 4.214s

#15 return log +0.049s ... 4.263s

Teilen Sie diesen Artikel, um uns zu unterstützen. Jeder Link hilft!

» Vergleich mobiler Grafikkarten
Liste aller mobiler Grafikkarten mit Kurzinformationen sortiert nach Leistung

» Mobile Grafikkarten - Benchmarkliste
Sortier- und filterbare Benchmark-Liste

» Spieleliste
Welche Spiele laufen mit welcher Grafikkarte

Leistungsklasse 1

Leistungsklasse 2

Leistungsklasse 3

UHD Graphics 750

Leistungsklasse 4

* Geschätzte Position

> Notebook Test, Laptop Test und News > Benchmarks / Technik > Benchmarks / Technik > Vergleich mobiler Grafikkarten > NVIDIA GeForce RTX 4070 Grafikkarte - Benchmarks und Spezifikationen
Autor: Sebastian Bade (Update: 13.07.2023)