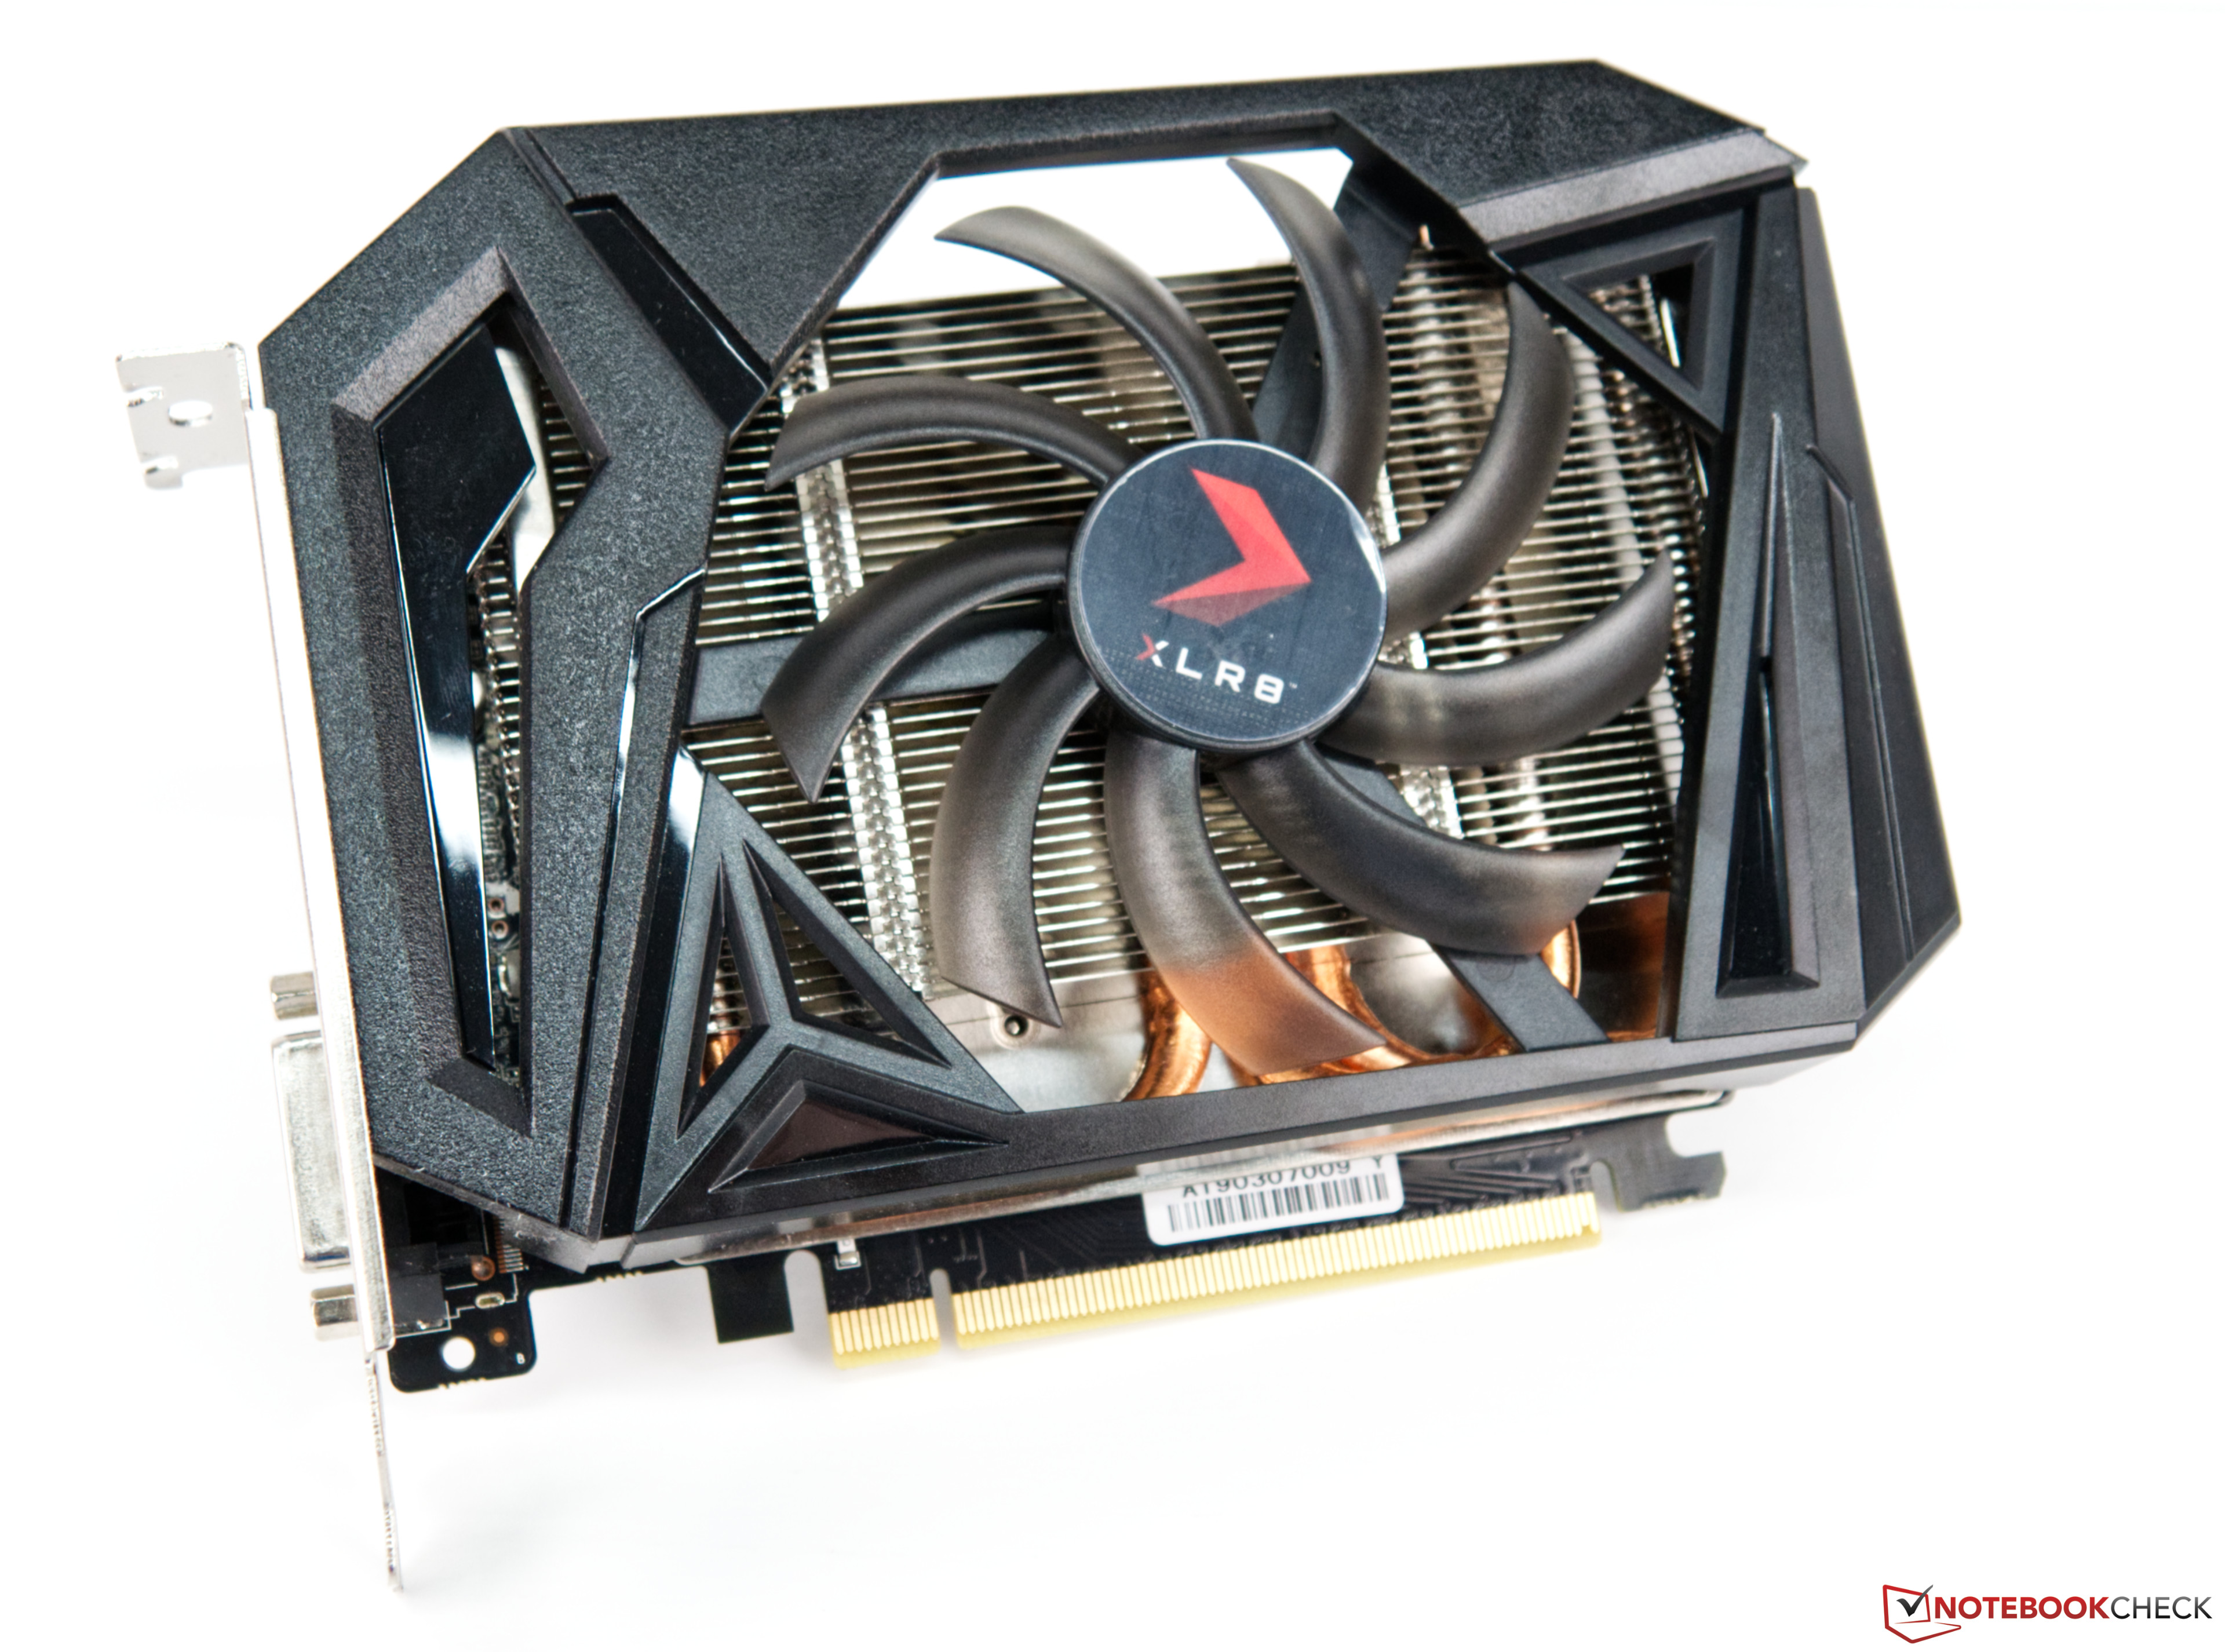
Notebookcheck Logo

NVIDIA GeForce GTX 1660 (Desktop)

NVIDIA GeForce GTX 1660 (Desktop)

Die Nvidia GeForce GTX 1660 ist eine schnelle Mittelklasse-Grafikkarte für Desktops und basiert auf der Turing-Architektur. Die GTX 1660 verwendet den TU116 Chip welcher auch bei der GeForce GTX 1660 Ti zum Einsatz kommt. Bei der GeForce GTX 1660 bietet der TU116 Chip 1.408 Shader-Einheiten, 48 ROPs, 88 TMUs und einen 192 Bit Speicherbus für den 6 GB großen GDDR5 VRAM (2 GHz Taktrate, 8  GHz effektiv führen zu 192,1 GB/s).

Features

Der TU116-Chip wird ebenfalls, wie auch die anderen Turing-GPUs, in 12nm gefertigt. Allerdings bietet die GeForce GTX 1660 nicht die neuen Features, wie DLSS (Deep Learning Super Sampling) und Real Time Ray Tracing. Trotzdem gab es im Bereich der Architektur Verbesserungen, wie Zum Beispiel bei den Float und INT Operationen. Diese können nun gleichzeitig ausgeführt werden und der Cache wurde vereinheitlicht Adaptive Shading eingeführt. Weiterhin gibt es Support für DisplayPort 1.4 (ready), HDMI 2.0b, HDR, Simultaneous Multi-Projection (SMP) sowie H.265 Video De- und Encoding (PlayReady 3.0). 

Performance

Die Performance der GeForce GTX 1660 ist in Full HD und maximalen Detailstufe etwas besser als eine eine GeForce GTX 1060, aber deutlich langsamer als eine GeForce GTX 1070. Dadurch eignet sie sich bei anspruchsvollen Spielen am besten für 1.080p mit vollen Details bzw. 1.440p bei weniger anspruchsvollen Spielen.

Leistungsaufnahme

Die Leistungsaufnahme der GeForce GTX 1660 wird vom Hersteller mit 120 Watt beziffert und liegt damit auf dem gleichen Niveau der älteren GeForce GTX 1060.

GeForce GTX 1600 Serie

GeForce GTX 1660 Ti (Desktop) compare 1536 @ 1.5 - 1.77 GHz192 Bit @ 12000 MHz
GeForce GTX 1660 Super (Desktop) compare 1408 @ 1.53 - 1.79 GHz192 Bit @ 14000 MHz
GeForce GTX 1660 Ti Mobile compare 1536 @ 1.46 - 1.59 GHz192 Bit @ 12000 MHz
GeForce GTX 1660 (Desktop) 1408 @ 1.53 - 1.79 GHz192 Bit @ 8000 MHz
GeForce GTX 1650 Super (Desktop) compare 1280 @ 1.53 GHz192 Bit @ 14000 MHz
GeForce GTX 1660 Ti Max-Q compare 1536 @ 1.14 - 1.34 GHz192 Bit @ 12000 MHz
GeForce GTX 1650 Ti Mobile compare 1024 @ 1.35 - 1.49 GHz128 Bit @ 12000 MHz
GeForce GTX 1650 (Desktop) compare 896 @ 1.49 - 1.67 GHz128 Bit @ 8000 MHz
GeForce GTX 1650 Mobile compare 1024 @ 1.38 - 1.56 GHz128 Bit @ 12000 MHz
GeForce GTX 1650 Ti Max-Q compare 1024 @ 1.04 - 1.2 GHz128 Bit @ 10000 MHz
GeForce GTX 1650 Max-Q compare 1024 @ 1.02 - 1.25 GHz128 Bit @ 8000 MHz
CodenameTuring TU116
ArchitekturTuring
Pipelines1408 - unified
Kerntakt1530 - 1785 (Boost) MHz
Speichertakt8000 MHz
Speicherbandbreite192 Bit
SpeichertypGDDR5
Max. Speichergröße6 GB
Shared Memorynein
APIDirectX 12_1, Shader 6.4, OpenGL 4.6
Stromverbrauch120 Watt
Transistoren6.6 Billion
Herstellungsprozess12 nm
Erscheinungsdatum14.03.2019
Herstellerseitewww.nvidia.com

Benchmarks

Performance Rating - 3DMark 11 + Fire Strike + Time Spy
6.4 pt (19%)
3DMark - 3DMark Time Spy Score
min: 5871     avg: 6002     median: 6013.5 (17%)     max: 6109 Points
3DMark - 3DMark Time Spy Graphics
min: 5422     avg: 5462     median: 5461.5 (14%)     max: 5502 Points
3DMark - 3DMark Ice Storm Unlimited Graphics
min: 470072     avg: 527165     median: 524782 (59%)     max: 589024 Points
3DMark - 3DMark Ice Storm Extreme Graphics
min: 224717     avg: 239475     median: 240380 (31%)     max: 252423 Points
3DMark - 3DMark Cloud Gate Score
min: 45665     avg: 51483     median: 51727.5 (55%)     max: 56812 Points
3DMark - 3DMark Cloud Gate Graphics
min: 74505     avg: 79816     median: 80889 (21%)     max: 82980 Points
3DMark - 3DMark Fire Strike Standard Score
min: 12524     avg: 12869     median: 12883.5 (23%)     max: 13184 Points
3DMark - 3DMark Fire Strike Standard Graphics
min: 13569     avg: 13992     median: 14055 (16%)     max: 14287 Points
3DMark - 3DMark Ice Storm Graphics
min: 276485     avg: 297810     median: 298872 (36%)     max: 317008 Points
3DMark 11 - 3DM11 Performance Score
min: 19912     avg: 21218     median: 21492 (30%)     max: 22250 Points
3DMark 11 - 3DM11 Performance GPU
min: 20696     avg: 21074     median: 21131 (18%)     max: 21396 Points
3DMark Vantage
3DM Vant. Perf. total +
3DMark Vantage - 3DM Vant. Perf. total
min: 57895     avg: 67040     median: 71229 (21%)     max: 71996 Points
3DM Vant. Perf. GPU no PhysX +
3DMark Vantage - 3DM Vant. Perf. GPU no PhysX
min: 55116     avg: 61609     median: 64718 (37%)     max: 64993 Points
3DMark 05 - 3DMark 05 - Standard
min: 53031     avg: 76129     median: 85619 (94%)     max: 89738 Points
3DMark 06 3DMark 06 - Standard 1280x1024 +
3DMark 06
min: 43633     avg: 58692     median: 65295 (85%)     max: 67147 Points
Unigine Valley 1.0 - Unigine Valley 1.0 DX
min: 63.8     avg: 64.5     median: 64.2 (21%)     max: 65.5 fps
SPECviewperf 12
specvp12 sw-03 +
SPECviewperf 12 - specvp12 sw-03
min: 43.33     avg: 54     median: 49.3 (12%)     max: 69.3 fps
specvp12 snx-02 +
specvp12 showcase-01 +
specvp12 mediacal-01 +
SPECviewperf 12 - specvp12 mediacal-01
min: 21.41     avg: 28.2     median: 27.1 (7%)     max: 36 fps
specvp12 maya-04 +
SPECviewperf 12 - specvp12 maya-04
min: 85.3     avg: 112.1     median: 120 (33%)     max: 131 fps
specvp12 energy-01 +
SPECviewperf 12 - specvp12 energy-01
min: 2.2     avg: 4.8     median: 5.8 (5%)     max: 6.31 fps
specvp12 creo-01 +
SPECviewperf 12 - specvp12 creo-01
min: 27.36     avg: 38     median: 40.4 (16%)     max: 46.1 fps
specvp12 catia-04 +
specvp12 3dsmax-05 +
SPECviewperf 12 - specvp12 3dsmax-05
min: 106.4     avg: 131.1     median: 134 (23%)     max: 153 fps
SPECviewperf 13 specvp13 sw-04 +
specvp13 snx-03 +
specvp13 showcase-02 +
specvp13 medical-02 +
SPECviewperf 13 - specvp13 medical-02
min: 27.66     avg: 36.2     median: 40.4 (8%)     max: 40.5 fps
specvp13 maya-05 +
specvp13 energy-02 +
SPECviewperf 13 - specvp13 energy-02
min: 2.88     avg: 7.6     median: 9.9 (3%)     max: 9.93 fps
specvp13 creo-02 +
specvp13 catia-05 +
specvp13 3dsmax-06 +
SPECviewperf 2020 specvp2020 solidworks-05 4k +
specvp2020 snx-04 4k +
specvp2020 medical-03 4k +
specvp2020 maya-06 4k +
specvp2020 energy-03 4k +
SPECviewperf 2020 - specvp2020 energy-03 4k
min: 12.5     avg: 12.5     median: 12.5 (3%)     max: 12.51 fps
specvp2020 creo-03 4k +
SPECviewperf 2020 - specvp2020 creo-03 4k
min: 51.2     avg: 53.2     median: 53.2 (25%)     max: 55.2 fps
specvp2020 catia-06 4k +
SPECviewperf 2020 - specvp2020 catia-06 4k
min: 19.02     avg: 19.1     median: 19.1 (12%)     max: 19.2 fps
specvp2020 3dsmax-07 4k +
SPECviewperf 2020 - specvp2020 3dsmax-07 4k
min: 42.91     avg: 44.2     median: 44.2 (18%)     max: 45.5 fps
- Bereich der Benchmarkergebnisse für diese Grafikkarte
- Durchschnittliche Benchmarkergebnisse für diese Grafikkarte
* Smaller numbers mean a higher performance

Spiele-Benchmarks

Die folgenden Benchmarks basieren auf unseren Spieletests mit Testnotebooks. Die Performance dieser Grafikkarte bei den gelisteten Spielen ist abhängig von der verwendeten CPU, Speicherausstattung, Treiber und auch Betriebssystem. Dadurch müssen die untenstehenden Werte nicht repräsentativ sein. Detaillierte Informationen über das verwendete System sehen Sie nach einem Klick auf den fps-Wert.

min. 1920x1080
138.8  fps    + Vergleich + 📈 Graph
mittel 1920x1080
113.7  fps    + Vergleich + 📈 Graph
hoch 1920x1080
107.6  fps    + Vergleich + 📈 Graph
max. 1920x1080
63.7  fps    + Vergleich + 📈 Graph
QHD 2560x1440
35.3  fps    + Vergleich + 📈 Graph
4K 3840x2160
10.9  fps    + Vergleich + 📈 Graph
» In Detailstufe max. mit allen getesteten Notebooks spielbar
min. 1920x1080
153.7  fps    + Vergleich + 📈 Graph
mittel 1920x1080
109.7  fps    + Vergleich + 📈 Graph
hoch 1920x1080
95.8  fps    + Vergleich + 📈 Graph
max. 1920x1080
70.1  fps    + Vergleich + 📈 Graph
QHD 2560x1440
42  fps    + Vergleich + 📈 Graph
4K 3840x2160
16.3  fps    + Vergleich + 📈 Graph
» In Detailstufe max. mit allen getesteten Notebooks spielbar
Additional Benchmarks
Low Preset 1280x720
249
min. 1920x1080
50  fps    + Vergleich
mittel 1920x1080
44  fps    + Vergleich
hoch 1920x1080
36  fps    + Vergleich
max. 1920x1080
27  fps    + Vergleich
QHD 2560x1440
21  fps    + Vergleich
4K 3840x2160
16  fps    + Vergleich
» In Detailstufe hoch mit allen getesteten Notebooks spielbar
Additional Benchmarks
Low Preset TAA 1280x720
69
min. 1920x1080
71  fps    + Vergleich
mittel 1920x1080
65  fps    + Vergleich
hoch 1920x1080
47  fps    + Vergleich
max. 1920x1080
45  fps    + Vergleich
QHD 2560x1440
30  fps    + Vergleich
4K 3840x2160
17  fps    + Vergleich
» In Detailstufe max. mit allen getesteten Notebooks spielbar
Additional Benchmarks
Minimum Preset 1280x720
120
min. 1920x1080
76.1  fps    + Vergleich + 📈 Graph
mittel 1920x1080
55  fps    + Vergleich + 📈 Graph
hoch 1920x1080
50.8  fps    + Vergleich + 📈 Graph
max. 1920x1080
47.1  fps    + Vergleich + 📈 Graph
QHD 2560x1440
27.8  fps    + Vergleich + 📈 Graph
4K 3840x2160
12.9  fps    + Vergleich + 📈 Graph
» In Detailstufe max. mit allen getesteten Notebooks spielbar
Additional Benchmarks
Ultra Low Preset LowAA 1280x720
176.3
min. 1920x1080
37.7  fps    + Vergleich + 📈 Graph
mittel 1920x1080
31.7  fps    + Vergleich + 📈 Graph
hoch 1920x1080
29.1  fps    + Vergleich + 📈 Graph
QHD 2560x1440
17.3  fps    + Vergleich + 📈 Graph
4K 3840x2160
9.2  fps    + Vergleich + 📈 Graph
» In Detailstufe min. mit allen getesteten Notebooks spielbar
Additional Benchmarks
Low Preset 1280x720
59.6
min. 1920x1080
50.8  fps    + Vergleich + 📈 Graph
mittel 1920x1080
40.7  fps    + Vergleich + 📈 Graph
hoch 1920x1080
29.5  fps    + Vergleich + 📈 Graph
max. 1920x1080
19.7  fps    + Vergleich + 📈 Graph
QHD 2560x1440
13  fps    + Vergleich + 📈 Graph
4K 3840x2160
4.9  fps    + Vergleich + 📈 Graph
» In Detailstufe mittel mit allen getesteten Notebooks spielbar
Additional Benchmarks
Low Preset 1280x720
81.6
min. 1920x1080
209.8  fps    + Vergleich
mittel 1920x1080
144.2  fps    + Vergleich
hoch 1920x1080
82.8  fps    + Vergleich
max. 1920x1080
65.9  fps    + Vergleich
QHD 2560x1440
43.5  fps    + Vergleich
4K 3840x2160
21.1  fps    + Vergleich
» In Detailstufe max. mit allen getesteten Notebooks spielbar
Additional Benchmarks
Low Preset 1280x720
374.8
min. 1920x1080
74  fps    + Vergleich
mittel 1920x1080
67  fps    + Vergleich
hoch 1920x1080
63  fps    + Vergleich
max. 1920x1080
48  fps    + Vergleich
QHD 2560x1440
35  fps    + Vergleich
4K 3840x2160
19  fps    + Vergleich
» In Detailstufe max. mit allen getesteten Notebooks spielbar
Additional Benchmarks
Low Preset (Adaptive Quality Off) 1280x720
111
min. 1920x1080
166.9  fps    + Vergleich + 📈 Graph
mittel 1920x1080
156.7  fps    + Vergleich + 📈 Graph
hoch 1920x1080
130  fps    + Vergleich + 📈 Graph
max. 1920x1080
107.2  fps    + Vergleich + 📈 Graph
QHD 2560x1440
77.9  fps    + Vergleich + 📈 Graph
4K 3840x2160
23.8  fps    + Vergleich + 📈 Graph
» In Detailstufe max. mit allen getesteten Notebooks spielbar
Additional Benchmarks
Low Preset 1280x720
276
min. 1920x1080
271  fps    + Vergleich + 📈 Graph
mittel 1920x1080
223  fps    + Vergleich + 📈 Graph
hoch 1920x1080
132.5  fps    + Vergleich + 📈 Graph
max. 1920x1080
81.2  fps    + Vergleich + 📈 Graph
QHD 2560x1440
62.3  fps    + Vergleich + 📈 Graph
4K 3840x2160
31.3  fps    + Vergleich + 📈 Graph
» In Detailstufe max. mit allen getesteten Notebooks spielbar
Additional Benchmarks
Low Preset 1280x720
316
min. 1920x1080
71.9  fps    + Vergleich
mittel 1920x1080
56.4  fps    + Vergleich
hoch 1920x1080
47.7  fps    + Vergleich
max. 1920x1080
43.1  fps    + Vergleich
QHD 2560x1440
26.1  fps    + Vergleich
4K 3840x2160
11.2  fps    + Vergleich
» In Detailstufe max. mit allen getesteten Notebooks spielbar
Additional Benchmarks
Low Preset (FSR off) 1280x720
116.3
Steam Deck 1280x720
126
Lies of P

Lies of P

2023
min. 1920x1080
106.6  fps    + Vergleich + 📈 Graph
mittel 1920x1080
92  fps    + Vergleich + 📈 Graph
hoch 1920x1080
77.1  fps    + Vergleich + 📈 Graph
max. 1920x1080
68.3  fps    + Vergleich + 📈 Graph
QHD 2560x1440
33.3  fps    + Vergleich + 📈 Graph
4K 3840x2160
24.9  fps    + Vergleich + 📈 Graph
» In Detailstufe max. mit allen getesteten Notebooks spielbar
Additional Benchmarks
Low Preset 1280x720
177.1
Starfield

Starfield

2023
min. 1920x1080
38.4  fps    + Vergleich + 📈 Graph
mittel 1920x1080
32.8  fps    + Vergleich + 📈 Graph
hoch 1920x1080
26.2  fps    + Vergleich + 📈 Graph
max. 1920x1080
23.5  fps    + Vergleich + 📈 Graph
QHD 2560x1440
18.6  fps    + Vergleich + 📈 Graph
4K 3840x2160
11.3  fps    + Vergleich + 📈 Graph
» In Detailstufe min. mit allen getesteten Notebooks spielbar
Additional Benchmarks
Low Preset 1280x720
50.1
min. 1920x1080
103  fps    + Vergleich + 📈 Graph
mittel 1920x1080
80.9  fps    + Vergleich + 📈 Graph
hoch 1920x1080
74.1  fps    + Vergleich + 📈 Graph
max. 1920x1080
54.8  fps    + Vergleich + 📈 Graph
QHD 2560x1440
60.5  fps    + Vergleich + 📈 Graph
4K 3840x2160
18.9  fps    + Vergleich + 📈 Graph
» In Detailstufe max. mit allen getesteten Notebooks spielbar
Additional Benchmarks
Low Preset 1280x720
119.4
min. 1920x1080
32.1  fps    + Vergleich + 📈 Graph
hoch 1920x1080
26.6  fps    + Vergleich + 📈 Graph
max. 1920x1080
19.9  fps    + Vergleich + 📈 Graph
QHD 2560x1440
12.6  fps    + Vergleich + 📈 Graph
» Mit den meisten getesteten Laptops in den getesteten Detailstufen nicht flüssig spielbar.
Additional Benchmarks
Low 1280x720
55.3
min. 1920x1080
82.4  fps    + Vergleich + 📈 Graph
mittel 1920x1080
78.1  fps    + Vergleich + 📈 Graph
hoch 1920x1080
72.8  fps    + Vergleich + 📈 Graph
max. 1920x1080
62.1  fps    + Vergleich + 📈 Graph
QHD 2560x1440
41.8  fps    + Vergleich + 📈 Graph
4K 3840x2160
20  fps    + Vergleich + 📈 Graph
» In Detailstufe max. mit allen getesteten Notebooks spielbar
Additional Benchmarks
Low Preset 1280x720
141.7
min. 1920x1080
67.7  fps    + Vergleich + 📈 Graph
mittel 1920x1080
54.6  fps    + Vergleich + 📈 Graph
hoch 1920x1080
45.2  fps    + Vergleich + 📈 Graph
max. 1920x1080
45  fps    + Vergleich + 📈 Graph
QHD 2560x1440
30.1  fps    + Vergleich + 📈 Graph
4K 3840x2160
15.7  fps    + Vergleich + 📈 Graph
» In Detailstufe max. mit allen getesteten Notebooks spielbar
Additional Benchmarks
Low Preset 1280x720
99.7
min. 1920x1080
59.6  fps    + Vergleich + 📈 Graph
mittel 1920x1080
49.3  fps    + Vergleich + 📈 Graph
hoch 1920x1080
36.4  fps    + Vergleich + 📈 Graph
max. 1920x1080
31.9  fps    + Vergleich + 📈 Graph
QHD 2560x1440
21.6  fps    + Vergleich + 📈 Graph
4K 3840x2160
13.5  fps    + Vergleich + 📈 Graph
» In Detailstufe hoch mit allen getesteten Notebooks spielbar
Additional Benchmarks
Very Low Preset 1280x720
83.2
F1 23

F1 23

2023
min. 1920x1080
179.9  fps    + Vergleich
mittel 1920x1080
159.5  fps    + Vergleich
hoch 1920x1080
109.3  fps    + Vergleich
max. 1920x1080
78.6  fps    + Vergleich
QHD 2560x1440
57  fps    + Vergleich
4K 3840x2160
29.4  fps    + Vergleich
» In Detailstufe max. mit allen getesteten Notebooks spielbar
Additional Benchmarks
Ultra Low Preset TAA 1280x720
317
Diablo 4

Diablo 4

2023
min. 1920x1080
141.5  fps    + Vergleich + 📈 Graph
mittel 1920x1080
122.3  fps    + Vergleich + 📈 Graph
hoch 1920x1080
107.8  fps    + Vergleich + 📈 Graph
max. 1920x1080
89.1  fps    + Vergleich + 📈 Graph
QHD 2560x1440
57.3  fps    + Vergleich + 📈 Graph
4K 3840x2160
29.1  fps    + Vergleich + 📈 Graph
» In Detailstufe max. mit allen getesteten Notebooks spielbar
Additional Benchmarks
Low Preset 1280x720
256
min. 1920x1080
48.4  fps    + Vergleich + 📈 Graph
mittel 1920x1080
41  fps    + Vergleich + 📈 Graph
hoch 1920x1080
38.6  fps    + Vergleich + 📈 Graph
max. 1920x1080
36.1  fps    + Vergleich + 📈 Graph
QHD 2560x1440
22.2  fps    + Vergleich + 📈 Graph
4K 3840x2160
10.2  fps    + Vergleich + 📈 Graph
» In Detailstufe max. mit allen getesteten Notebooks spielbar
Additional Benchmarks
Low Preset 1280x720
86.5
min. 1920x1080
156.4  fps    + Vergleich + 📈 Graph
mittel 1920x1080
135.1  fps    + Vergleich + 📈 Graph
hoch 1920x1080
92.3  fps    + Vergleich + 📈 Graph
max. 1920x1080
67.7  fps    + Vergleich + 📈 Graph
QHD 2560x1440
43.4  fps    + Vergleich + 📈 Graph
4K 3840x2160
18.2  fps    + Vergleich + 📈 Graph
» In Detailstufe max. mit allen getesteten Notebooks spielbar
Additional Benchmarks
Low Preset Low TAA 1280x720
265
min. 1920x1080
59.7  fps    + Vergleich + 📈 Graph
mittel 1920x1080
47.1  fps    + Vergleich + 📈 Graph
hoch 1920x1080
38.9  fps    + Vergleich + 📈 Graph
max. 1920x1080
31.6  fps    + Vergleich + 📈 Graph
QHD 2560x1440
18.9  fps    + Vergleich + 📈 Graph
» In Detailstufe hoch mit allen getesteten Notebooks spielbar
Additional Benchmarks
Low Preset 1280x720
93.7
min. 1920x1080
78.4  fps    + Vergleich + 📈 Graph
mittel 1920x1080
54.2  fps    + Vergleich + 📈 Graph
hoch 1920x1080
49.3  fps    + Vergleich + 📈 Graph
max. 1920x1080
42.2  fps    + Vergleich + 📈 Graph
QHD 2560x1440
29.5  fps    + Vergleich + 📈 Graph
4K 3840x2160
11.8  fps    + Vergleich + 📈 Graph
» In Detailstufe max. mit allen getesteten Notebooks spielbar
Additional Benchmarks
Prioritize Performance Preset 1280x720
125.3
min. 1920x1080
116.9  fps    + Vergleich
mittel 1920x1080
96.9  fps    + Vergleich
hoch 1920x1080
74  fps    + Vergleich
max. 1920x1080
73.7  fps    + Vergleich
QHD 2560x1440
52.5  fps    + Vergleich
4K 3840x2160
29.2  fps    + Vergleich
» In Detailstufe max. mit allen getesteten Notebooks spielbar
Additional Benchmarks
Minimum Settings 1280x720
201.1
min. 1920x1080
67.2  fps    + Vergleich + 📈 Graph
mittel 1920x1080
51.2  fps    + Vergleich + 📈 Graph
hoch 1920x1080
47.6  fps    + Vergleich + 📈 Graph
max. 1920x1080
47.1  fps    + Vergleich + 📈 Graph
QHD 2560x1440
33.2  fps    + Vergleich + 📈 Graph
4K 3840x2160
18.1  fps    + Vergleich + 📈 Graph
» In Detailstufe max. mit allen getesteten Notebooks spielbar
Additional Benchmarks
Ultra Low Preset 1280x720
97.6
min. 1920x1080
111.4  fps    + Vergleich + 📈 Graph
mittel 1920x1080
83.4  fps    + Vergleich + 📈 Graph
hoch 1920x1080
48.5  fps    + Vergleich + 📈 Graph
max. 1920x1080
38.4  fps    + Vergleich + 📈 Graph
QHD 2560x1440
28.1  fps    + Vergleich + 📈 Graph
4K 3840x2160
14.8  fps    + Vergleich + 📈 Graph
» In Detailstufe max. mit allen getesteten Notebooks spielbar
Additional Benchmarks
Low Preset 1280x720
174.9
Returnal

Returnal

2023
min. 1920x1080
60  fps    + Vergleich
mittel 1920x1080
58  fps    + Vergleich
hoch 1920x1080
51  fps    + Vergleich
max. 1920x1080
44  fps    + Vergleich
QHD 2560x1440
32  fps    + Vergleich
4K 3840x2160
16  fps    + Vergleich
» In Detailstufe max. mit allen getesteten Notebooks spielbar
Additional Benchmarks
Low Preset 1280x720
81
min. 1920x1080
78.9  fps    + Vergleich + 📈 Graph
mittel 1920x1080
59  fps    + Vergleich + 📈 Graph
hoch 1920x1080
45.5  fps    + Vergleich + 📈 Graph
max. 1920x1080
35.7  fps    + Vergleich + 📈 Graph
QHD 2560x1440
24.3  fps    + Vergleich + 📈 Graph
4K 3840x2160
12.8  fps    + Vergleich + 📈 Graph
» In Detailstufe max. mit allen getesteten Notebooks spielbar
Additional Benchmarks
Low Preset Low TAA 1280x720
127.4
min. 1920x1080
51.7 51.7 ~ 52 fps    + Vergleich + 📈 Graph
mittel 1920x1080
48.4 48.4 ~ 48 fps    + Vergleich + 📈 Graph
hoch 1920x1080
42.1 42.1 ~ 42 fps    + Vergleich + 📈 Graph
max. 1920x1080
41.8 41.8 ~ 42 fps    + Vergleich + 📈 Graph
QHD 2560x1440
27 27 ~ 27 fps    + Vergleich + 📈 Graph
» In Detailstufe max. mit allen getesteten Notebooks spielbar
Additional Benchmarks
Low Preset TAA 1280x720
84
84
min. 1920x1080
123.5  fps    + Vergleich + 📈 Graph
mittel 1920x1080
92.9  fps    + Vergleich + 📈 Graph
hoch 1920x1080
78  fps    + Vergleich + 📈 Graph
max. 1920x1080
63.9  fps    + Vergleich + 📈 Graph
QHD 2560x1440
44.2  fps    + Vergleich + 📈 Graph
4K 3840x2160
23.8  fps    + Vergleich + 📈 Graph
» In Detailstufe max. mit allen getesteten Notebooks spielbar
Additional Benchmarks
Low Preset / Off 1280x720
210
min. 1920x1080
157.3  fps    + Vergleich + 📈 Graph
mittel 1920x1080
89.9  fps    + Vergleich + 📈 Graph
hoch 1920x1080
72.6  fps    + Vergleich + 📈 Graph
max. 1920x1080
57.6  fps    + Vergleich + 📈 Graph
QHD 2560x1440
34.8  fps    + Vergleich + 📈 Graph
4K 3840x2160
14.3  fps    + Vergleich + 📈 Graph
» In Detailstufe max. mit allen getesteten Notebooks spielbar
Additional Benchmarks
Low Preset 1280x720
247
min. 1920x1080
92.8  fps    + Vergleich
mittel 1920x1080
67.4  fps    + Vergleich
hoch 1920x1080
42.6  fps    + Vergleich
max. 1920x1080
42.7  fps    + Vergleich
QHD 2560x1440
30.1  fps    + Vergleich
4K 3840x2160
12.6  fps    + Vergleich
» In Detailstufe max. mit allen getesteten Notebooks spielbar
Additional Benchmarks
Low Preset (without FSR Upscaling) 1280x720
148.5
Ultra Preset (without FSR Upscaling) + Full Ray-Tracing 1920x1080
8
min. 1920x1080
97.7  fps    + Vergleich + 📈 Graph
mittel 1920x1080
85.8  fps    + Vergleich + 📈 Graph
hoch 1920x1080
67.8  fps    + Vergleich + 📈 Graph
max. 1920x1080
53.7  fps    + Vergleich + 📈 Graph
QHD 2560x1440
31.9  fps    + Vergleich + 📈 Graph
4K 3840x2160
16.5  fps    + Vergleich + 📈 Graph
» In Detailstufe max. mit allen getesteten Notebooks spielbar
Additional Benchmarks
Low Preset 1280x720
147.3
min. 1920x1080
85.1  fps    + Vergleich + 📈 Graph
mittel 1920x1080
74.2  fps    + Vergleich + 📈 Graph
hoch 1920x1080
72.2  fps    + Vergleich + 📈 Graph
max. 1920x1080
62.3  fps    + Vergleich + 📈 Graph
QHD 2560x1440
41  fps    + Vergleich + 📈 Graph
4K 3840x2160
17.3  fps    + Vergleich + 📈 Graph
» In Detailstufe max. mit allen getesteten Notebooks spielbar
Additional Benchmarks
Very Low Preset 1280x720
124.6
min. 1920x1080
85  fps    + Vergleich
mittel 1920x1080
75  fps    + Vergleich
hoch 1920x1080
55  fps    + Vergleich
max. 1920x1080
50  fps    + Vergleich
QHD 2560x1440
35  fps    + Vergleich
4K 3840x2160
21  fps    + Vergleich
» In Detailstufe max. mit allen getesteten Notebooks spielbar
Additional Benchmarks
Basic Quality Preset T2X SMAA 1280x720
130
min. 1920x1080
55.1  fps    + Vergleich + 📈 Graph
mittel 1920x1080
52.1  fps    + Vergleich + 📈 Graph
hoch 1920x1080
40.5  fps    + Vergleich + 📈 Graph
max. 1920x1080
39  fps    + Vergleich + 📈 Graph
QHD 2560x1440
25  fps    + Vergleich + 📈 Graph
4K 3840x2160
9.4  fps    + Vergleich + 📈 Graph
» In Detailstufe max. mit allen getesteten Notebooks spielbar
Additional Benchmarks
Low Preset 1280x720
76.5
min. 1920x1080
67.7  fps    + Vergleich + 📈 Graph
mittel 1920x1080
50  fps    + Vergleich + 📈 Graph
hoch 1920x1080
36.6  fps    + Vergleich + 📈 Graph
max. 1920x1080
27.3  fps    + Vergleich + 📈 Graph
QHD 2560x1440
19  fps    + Vergleich + 📈 Graph
4K 3840x2160
10  fps    + Vergleich + 📈 Graph
» In Detailstufe hoch mit allen getesteten Notebooks spielbar
Additional Benchmarks
Low Preset 1280x720
95.6
FIFA 23

FIFA 23

2022
min. 1920x1080
185.2  fps    + Vergleich + 📈 Graph
mittel 1920x1080
174.1  fps    + Vergleich + 📈 Graph
hoch 1920x1080
117  fps    + Vergleich + 📈 Graph
max. 1920x1080
114.9  fps    + Vergleich + 📈 Graph
QHD 2560x1440
83.4  fps    + Vergleich + 📈 Graph
4K 3840x2160
47.2  fps    + Vergleich + 📈 Graph
» In Detailstufe max. mit allen getesteten Notebooks spielbar
Additional Benchmarks
Low Rendering Quality 1280x720
295
min. 1920x1080
89.4 91 ~ 90 fps    + Vergleich + 📈 Graph
mittel 1920x1080
66.8 68.1 ~ 67 fps    + Vergleich + 📈 Graph
hoch 1920x1080
54.3 54.9 ~ 55 fps    + Vergleich + 📈 Graph
max. 1920x1080
32.9 39.9 ~ 36 fps    + Vergleich + 📈 Graph
QHD 2560x1440
15.1 22 ~ 19 fps    + Vergleich + 📈 Graph
4K 3840x2160
5.3 6.8 ~ 6 fps    + Vergleich + 📈 Graph
» In Detailstufe max. mit den meisten getesteten Laptops spielbar
Additional Benchmarks
Low Preset 1280x720
136.8
F1 22

F1 22

2022
min. 1920x1080
176.4 187 ~ 182 fps    + Vergleich
mittel 1920x1080
156.1 167.6 ~ 162 fps    + Vergleich
hoch 1920x1080
112.1 121.3 ~ 117 fps    + Vergleich
max. 1920x1080
81.3 91.6 ~ 86 fps    + Vergleich
QHD 2560x1440
59.5 65.8 ~ 63 fps    + Vergleich
4K 3840x2160
32.7 35.6 ~ 34 fps    + Vergleich
» In Detailstufe max. mit allen getesteten Notebooks spielbar
Additional Benchmarks
Ultra Low Preset 16xAF TAA 1280x720
299
323
min. 1920x1080
216  fps    + Vergleich + 📈 Graph
mittel 1920x1080
115.7  fps    + Vergleich + 📈 Graph
hoch 1920x1080
111  fps    + Vergleich + 📈 Graph
max. 1920x1080
107.2  fps    + Vergleich + 📈 Graph
QHD 2560x1440
68.4  fps    + Vergleich + 📈 Graph
4K 3840x2160
29.6  fps    + Vergleich + 📈 Graph
» In Detailstufe max. mit allen getesteten Notebooks spielbar
Additional Benchmarks
Low Preset 1280x720
352
min. 1920x1080
84.1  fps    + Vergleich + 📈 Graph
mittel 1920x1080
83.8  fps    + Vergleich + 📈 Graph
hoch 1920x1080
83.1  fps    + Vergleich + 📈 Graph
max. 1920x1080
82.2  fps    + Vergleich + 📈 Graph
QHD 2560x1440
51.6  fps    + Vergleich + 📈 Graph
4K 3840x2160
22.3  fps    + Vergleich + 📈 Graph
» In Detailstufe max. mit allen getesteten Notebooks spielbar
Additional Benchmarks
Lowest Settings 1280x720
148.8
Highest Settings + Maximum Ray Tracing 1920x1080
13.9
min. 1920x1080
108 117.1 120.4 ~ 115 fps    + Vergleich
mittel 1920x1080
86.9 92.9 94.3 ~ 91 fps    + Vergleich
hoch 1920x1080
60.8 61.6 63.4 ~ 62 fps    + Vergleich
max. 1920x1080
47.8 47.9 49.1 ~ 48 fps    + Vergleich
QHD 2560x1440
32.3 33 33.1 ~ 33 fps    + Vergleich
4K 3840x2160
11.9 12 12.9 ~ 12 fps    + Vergleich
» In Detailstufe max. mit allen getesteten Notebooks spielbar
Additional Benchmarks
Lowest Preset (DX12) 1280x720
202
235
min. 1920x1080
69 73.9 ~ 71 fps    + Vergleich
mittel 1920x1080
54.6 61.4 ~ 58 fps    + Vergleich
hoch 1920x1080
46.4 47.9 ~ 47 fps    + Vergleich
max. 1920x1080
39.1 41.4 ~ 40 fps    + Vergleich
QHD 2560x1440
22.8 24.6 ~ 24 fps    + Vergleich
4K 3840x2160
9.6 10.1 ~ 10 fps    + Vergleich
» In Detailstufe max. mit allen getesteten Notebooks spielbar
Additional Benchmarks
Low Preset 1280x720
80.3
110.9
Elex 2

Elex 2

2022
min. 1920x1080
65.3  fps    + Vergleich + 📈 Graph
mittel 1920x1080
59.5  fps    + Vergleich + 📈 Graph
hoch 1920x1080
51.8  fps    + Vergleich + 📈 Graph
max. 1920x1080
46.7  fps    + Vergleich + 📈 Graph
QHD 2560x1440
33.1  fps    + Vergleich + 📈 Graph
4K 3840x2160
17.4  fps    + Vergleich + 📈 Graph
» In Detailstufe max. mit allen getesteten Notebooks spielbar
Additional Benchmarks
Low / Off 1280x720
84.2
min. 1920x1080
165.1 168.2 215 ~ 183 fps    + Vergleich
mittel 1920x1080
120.9 129.6 158.8 ~ 136 fps    + Vergleich
hoch 1920x1080
99.9 106 122.9 ~ 110 fps    + Vergleich
max. 1920x1080
70.6 78.1 88.5 ~ 79 fps    + Vergleich
QHD 2560x1440
53.4 59.9 65.9 ~ 60 fps    + Vergleich
4K 3840x2160
30.2 31.4 37.1 ~ 33 fps    + Vergleich
» In Detailstufe max. mit allen getesteten Notebooks spielbar
Additional Benchmarks
Low Preset 1280x720
221.2
297
min. 1920x1080
59.9  fps    + Vergleich + 📈 Graph
mittel 1920x1080
59.8  fps    + Vergleich + 📈 Graph
hoch 1920x1080
59.5  fps    + Vergleich + 📈 Graph
max. 1920x1080
54.9  fps    + Vergleich + 📈 Graph
QHD 2560x1440
41.8  fps    + Vergleich + 📈 Graph
4K 3840x2160
24.3  fps    + Vergleich + 📈 Graph
» In Detailstufe max. mit allen getesteten Notebooks spielbar
min. 1920x1080
51  fps    + Vergleich + 📈 Graph
mittel 1920x1080
39.1  fps    + Vergleich + 📈 Graph
hoch 1920x1080
32.1  fps    + Vergleich + 📈 Graph
QHD 2560x1440
21.8  fps    + Vergleich + 📈 Graph
4K 3840x2160
10.7  fps    + Vergleich + 📈 Graph
» In Detailstufe mittel mit allen getesteten Notebooks spielbar
Additional Benchmarks
Low Quality 1280x720
78.8
min. 1920x1080
102  fps    + Vergleich
mittel 1920x1080
97  fps    + Vergleich
hoch 1920x1080
95  fps    + Vergleich
max. 1920x1080
77  fps    + Vergleich
QHD 2560x1440
47  fps    + Vergleich
4K 3840x2160
21  fps    + Vergleich
» In Detailstufe max. mit allen getesteten Notebooks spielbar
Additional Benchmarks
Ultra Low Preset (with Fixed Resolution Quality) 1280x720
205
min. 1920x1080
73.3 83.7 85.9 ~ 81 fps    + Vergleich + 📈 Graph
mittel 1920x1080
60.2 70 70.2 ~ 67 fps    + Vergleich + 📈 Graph
hoch 1920x1080
47 53.7 54 ~ 52 fps    + Vergleich + 📈 Graph
max. 1920x1080
32 36.2 36.3 ~ 35 fps    + Vergleich + 📈 Graph
QHD 2560x1440
27.5 28.7 29 ~ 28 fps    + Vergleich + 📈 Graph
4K 3840x2160
18.3 18.6 18.7 ~ 19 fps    + Vergleich + 📈 Graph
» In Detailstufe hoch mit allen getesteten Notebooks spielbar
Additional Benchmarks
Low Preset 1280x720
111
121.2
mittel 1920x1080
74.6  fps    + Vergleich + 📈 Graph
hoch 1920x1080
67.7  fps    + Vergleich + 📈 Graph
max. 1920x1080
68  fps    + Vergleich + 📈 Graph
QHD 2560x1440
69.6  fps    + Vergleich + 📈 Graph
4K 3840x2160
49.3  fps    + Vergleich + 📈 Graph
» In Detailstufe max. mit allen getesteten Notebooks spielbar
Additional Benchmarks
Low Preset 1920x1080
89.2
min. 1280x720
288  fps    + Vergleich + 📈 Graph
mittel 1920x1080
154  fps    + Vergleich + 📈 Graph
hoch 1920x1080
114  fps    + Vergleich + 📈 Graph
max. 1920x1080
92  fps    + Vergleich + 📈 Graph
QHD 2560x1440
68.3  fps    + Vergleich + 📈 Graph
4K 3840x2160
40.9  fps    + Vergleich + 📈 Graph
» In Detailstufe max. mit allen getesteten Notebooks spielbar
Additional Benchmarks
Low Preset 1920x1080
262
min. 1280x720
142  fps    + Vergleich + 📈 Graph
mittel 1920x1080
79.4  fps    + Vergleich + 📈 Graph
hoch 1920x1080
66.5  fps    + Vergleich + 📈 Graph
max. 1920x1080
58.6  fps    + Vergleich + 📈 Graph
QHD 2560x1440
42.3  fps    + Vergleich + 📈 Graph
4K 3840x2160
22.6  fps    + Vergleich + 📈 Graph
» In Detailstufe max. mit allen getesteten Notebooks spielbar
Additional Benchmarks
Low Preset 1920x1080
93.5
min. 1280x720
185 201 216 ~ 201 fps    + Vergleich
mittel 1920x1080
92 100 106 ~ 99 fps    + Vergleich
hoch 1920x1080
82 88 92 ~ 87 fps    + Vergleich
max. 1920x1080
42 42 42 ~ 42 fps    + Vergleich
QHD 2560x1440
33 35 36 ~ 35 fps    + Vergleich
4K 3840x2160
22 24 24 ~ 23 fps    + Vergleich
» In Detailstufe max. mit allen getesteten Notebooks spielbar
Additional Benchmarks
Low Preset 1920x1080
116
131
min. 1280x720
89.8  fps    + Vergleich + 📈 Graph
mittel 1920x1080
80.5  fps    + Vergleich + 📈 Graph
hoch 1920x1080
62.7  fps    + Vergleich + 📈 Graph
max. 1920x1080
55.8  fps    + Vergleich + 📈 Graph
QHD 2560x1440
40.1  fps    + Vergleich + 📈 Graph
4K 3840x2160
21.6  fps    + Vergleich + 📈 Graph
» In Detailstufe max. mit allen getesteten Notebooks spielbar
Additional Benchmarks
Low Preset 1920x1080
92.9
min. 1280x720
149  fps    + Vergleich
mittel 1920x1080
86  fps    + Vergleich
hoch 1920x1080
68  fps    + Vergleich
max. 1920x1080
59  fps    + Vergleich
QHD 2560x1440
40  fps    + Vergleich
4K 3840x2160
20  fps    + Vergleich
» In Detailstufe max. mit allen getesteten Notebooks spielbar
Additional Benchmarks
Low Preset 1920x1080
105
min. 1280x720
128  fps    + Vergleich
mittel 1920x1080
83  fps    + Vergleich
hoch 1920x1080
80  fps    + Vergleich
max. 1920x1080
77  fps    + Vergleich
QHD 2560x1440
54  fps    + Vergleich
4K 3840x2160
28  fps    + Vergleich
» In Detailstufe max. mit allen getesteten Notebooks spielbar
Additional Benchmarks
Low Preset 1920x1080
86
mittel 1920x1080
140  fps    + Vergleich + 📈 Graph
hoch 1920x1080
124  fps    + Vergleich + 📈 Graph
max. 1920x1080
113  fps    + Vergleich + 📈 Graph
QHD 2560x1440
71.2  fps    + Vergleich + 📈 Graph
4K 3840x2160
34.6  fps    + Vergleich + 📈 Graph
» In Detailstufe max. mit allen getesteten Notebooks spielbar
Additional Benchmarks
Low Preset (DX12) 1920x1080
199
199
Far Cry 6

Far Cry 6

2021
min. 1280x720
153 155.6 158.1 ~ 156 fps    + Vergleich + 📈 Graph
mittel 1920x1080
85 88.1 88.9 ~ 87 fps    + Vergleich + 📈 Graph
hoch 1920x1080
75.5 76.5 77 ~ 76 fps    + Vergleich + 📈 Graph
max. 1920x1080
64.8 64.9 66 ~ 65 fps    + Vergleich + 📈 Graph
QHD 2560x1440
12.2 43.3 46 ~ 34 fps    + Vergleich + 📈 Graph
4K 3840x2160
1 1 7 ~ 3 fps    + Vergleich + 📈 Graph
» In Detailstufe max. mit allen getesteten Notebooks spielbar
Additional Benchmarks
Low Graphics Quality 1920x1080
99
105.1
mittel 1920x1080
92.6  fps    + Vergleich + 📈 Graph
hoch 1920x1080
88.2  fps    + Vergleich + 📈 Graph
QHD 2560x1440
85.9  fps    + Vergleich + 📈 Graph
4K 3840x2160
60  fps    + Vergleich + 📈 Graph
» In Detailstufe hoch mit allen getesteten Notebooks spielbar
Additional Benchmarks
Low Preset 1920x1080
97
New World

New World

2021
min. 1280x720
143  fps    + Vergleich + 📈 Graph
mittel 1920x1080
71.1  fps    + Vergleich + 📈 Graph
hoch 1920x1080
65  fps    + Vergleich + 📈 Graph
max. 1920x1080
55.4  fps    + Vergleich + 📈 Graph
QHD 2560x1440
36.8  fps    + Vergleich + 📈 Graph
4K 3840x2160
25.2  fps    + Vergleich + 📈 Graph
» In Detailstufe max. mit allen getesteten Notebooks spielbar
Additional Benchmarks
Low Video Quality 1920x1080
90.9
Deathloop

Deathloop

2021
min. 1280x720
117  fps    + Vergleich + 📈 Graph
mittel 1920x1080
74.2  fps    + Vergleich + 📈 Graph
hoch 1920x1080
60.1  fps    + Vergleich + 📈 Graph
max. 1920x1080
49  fps    + Vergleich + 📈 Graph
QHD 2560x1440
33.5  fps    + Vergleich + 📈 Graph
4K 3840x2160
16.8  fps    + Vergleich + 📈 Graph
» In Detailstufe max. mit allen getesteten Notebooks spielbar
Additional Benchmarks
Low Preset 1920x1080
95.1
F1 2021

F1 2021

2021
min. 1280x720
327 385 389 ~ 367 fps    + Vergleich
mittel 1920x1080
169 185.4 187.5 ~ 181 fps    + Vergleich
hoch 1920x1080
137 147.7 149 ~ 145 fps    + Vergleich
max. 1920x1080
95.3 100.2 102 ~ 99 fps    + Vergleich
QHD 2560x1440
72.4 75.4 75.9 ~ 75 fps    + Vergleich
4K 3840x2160
41.1 42.2 43.2 ~ 42 fps    + Vergleich
» In Detailstufe max. mit allen getesteten Notebooks spielbar
min. 1280x720
144  fps    + Vergleich + 📈 Graph
mittel 1920x1080
144  fps    + Vergleich + 📈 Graph
hoch 1920x1080
143  fps    + Vergleich + 📈 Graph
QHD 2560x1440
125  fps    + Vergleich + 📈 Graph
4K 3840x2160
75.1  fps    + Vergleich + 📈 Graph
» In Detailstufe hoch mit allen getesteten Notebooks spielbar
Additional Benchmarks
Low Preset 1920x1080
144
Days Gone

Days Gone

2021
min. 1280x720
156  fps    + Vergleich + 📈 Graph
mittel 1920x1080
90.3 90.3 ~ 90 fps    + Vergleich + 📈 Graph
hoch 1920x1080
80.6  fps    + Vergleich + 📈 Graph
max. 1920x1080
59.3  fps    + Vergleich + 📈 Graph
QHD 2560x1440
42.1  fps    + Vergleich + 📈 Graph
4K 3840x2160
23.3  fps    + Vergleich + 📈 Graph
» In Detailstufe max. mit allen getesteten Notebooks spielbar
Additional Benchmarks
Low Preset 1920x1080
111
min. 1280x720
114  fps    + Vergleich + 📈 Graph
max. 1920x1080
112  fps    + Vergleich + 📈 Graph
QHD 2560x1440
94.6  fps    + Vergleich + 📈 Graph
4K 3840x2160
47.9  fps    + Vergleich + 📈 Graph
» In Detailstufe max. mit allen getesteten Notebooks spielbar
min. 1280x720
259  fps    + Vergleich + 📈 Graph
mittel 1920x1080
110  fps    + Vergleich + 📈 Graph
hoch 1920x1080
99.6  fps    + Vergleich + 📈 Graph
max. 1920x1080
86.6  fps    + Vergleich + 📈 Graph
QHD 2560x1440
56  fps    + Vergleich + 📈 Graph
4K 3840x2160
27.8  fps    + Vergleich + 📈 Graph
» In Detailstufe max. mit allen getesteten Notebooks spielbar
Additional Benchmarks
Prioritize Performance Preset 1920x1080
177
Outriders

Outriders

2021
min. 1280x720
183  fps    + Vergleich + 📈 Graph
mittel 1920x1080
99.5  fps    + Vergleich + 📈 Graph
hoch 1920x1080
80.8  fps    + Vergleich + 📈 Graph
max. 1920x1080
68.3  fps    + Vergleich + 📈 Graph
QHD 2560x1440
44.8  fps    + Vergleich + 📈 Graph
4K 3840x2160
30.3  fps    + Vergleich + 📈 Graph
» In Detailstufe max. mit allen getesteten Notebooks spielbar
Hitman 3

Hitman 3

2021
min. 1280x720
195  fps    + Vergleich
mittel 1920x1080
110  fps    + Vergleich
hoch 1920x1080
93  fps    + Vergleich
max. 1920x1080
86  fps    + Vergleich
QHD 2560x1440
57  fps    + Vergleich
4K 3840x2160
31  fps    + Vergleich
» In Detailstufe max. mit allen getesteten Notebooks spielbar
min. 1280x720
97.6  fps    + Vergleich + 📈 Graph
mittel 1920x1080
51.9  fps    + Vergleich + 📈 Graph
hoch 1920x1080
42.6  fps    + Vergleich + 📈 Graph
max. 1920x1080
36.6  fps    + Vergleich + 📈 Graph
QHD 2560x1440
22.3  fps    + Vergleich + 📈 Graph
4K 3840x2160
9.6  fps    + Vergleich + 📈 Graph
» In Detailstufe max. mit allen getesteten Notebooks spielbar
Additional Benchmarks
Low Preset 1920x1080
62.9
min. 1280x720
96  fps    + Vergleich
mittel 1920x1080
58  fps    + Vergleich
hoch 1920x1080
49  fps    + Vergleich
max. 1920x1080
45  fps    + Vergleich
QHD 2560x1440
36  fps    + Vergleich
4K 3840x2160
21  fps    + Vergleich
» In Detailstufe max. mit allen getesteten Notebooks spielbar
min. 1280x720
110  fps    + Vergleich + 📈 Graph
mittel 1920x1080
68.9  fps    + Vergleich + 📈 Graph
hoch 1920x1080
66.8  fps    + Vergleich + 📈 Graph
max. 1920x1080
59  fps    + Vergleich + 📈 Graph
QHD 2560x1440
39  fps    + Vergleich + 📈 Graph
4K 3840x2160
19  fps    + Vergleich + 📈 Graph
» In Detailstufe max. mit allen getesteten Notebooks spielbar
min. 1280x720
151  fps    + Vergleich + 📈 Graph
mittel 1920x1080
91.7  fps    + Vergleich + 📈 Graph
hoch 1920x1080
70  fps    + Vergleich + 📈 Graph
max. 1920x1080
52.5  fps    + Vergleich + 📈 Graph
QHD 2560x1440
36.8  fps    + Vergleich + 📈 Graph
4K 3840x2160
2  fps    + Vergleich + 📈 Graph
» In Detailstufe max. mit allen getesteten Notebooks spielbar
Additional Benchmarks
Highest Settings + Ultra Ray Tracing 1920x1080
20.5
min. 1280x720
110  fps    + Vergleich
mittel 1920x1080
59  fps    + Vergleich
hoch 1920x1080
42  fps    + Vergleich
max. 1920x1080
37  fps    + Vergleich
QHD 2560x1440
27  fps    + Vergleich
4K 3840x2160
15  fps    + Vergleich
» In Detailstufe max. mit allen getesteten Notebooks spielbar
Dirt 5

Dirt 5

2020
min. 1280x720
151  fps    + Vergleich
mittel 1920x1080
78.6  fps    + Vergleich
hoch 1920x1080
60.7  fps    + Vergleich
max. 1920x1080
50  fps    + Vergleich
QHD 2560x1440
40.8  fps    + Vergleich
4K 3840x2160
25.7  fps    + Vergleich
» In Detailstufe max. mit allen getesteten Notebooks spielbar
min. 1280x720
114  fps    + Vergleich + 📈 Graph
mittel 1920x1080
77.9  fps    + Vergleich + 📈 Graph
hoch 1920x1080
65.9  fps    + Vergleich + 📈 Graph
max. 1920x1080
29.4  fps    + Vergleich + 📈 Graph
QHD 2560x1440
19.4  fps    + Vergleich + 📈 Graph
4K 3840x2160
12  fps    + Vergleich + 📈 Graph
» In Detailstufe hoch mit allen getesteten Notebooks spielbar
Additional Benchmarks
Ultra Preset + Ultra Ray Tracing (DX12) 1920x1080
11.2
FIFA 21

FIFA 21

2020
min. 1280x720
231  fps    + Vergleich + 📈 Graph
mittel 1920x1080
227  fps    + Vergleich + 📈 Graph
hoch 1920x1080
214  fps    + Vergleich + 📈 Graph
max. 1920x1080
214  fps    + Vergleich + 📈 Graph
QHD 2560x1440
187  fps    + Vergleich + 📈 Graph
4K 3840x2160
120  fps    + Vergleich + 📈 Graph
» In Detailstufe max. mit allen getesteten Notebooks spielbar
min. 1280x720
389  fps    + Vergleich + 📈 Graph
mittel 1920x1080
203  fps    + Vergleich + 📈 Graph
hoch 1920x1080
172  fps    + Vergleich + 📈 Graph
max. 1920x1080
157  fps    + Vergleich + 📈 Graph
QHD 2560x1440
103  fps    + Vergleich + 📈 Graph
4K 3840x2160
57.8  fps    + Vergleich + 📈 Graph
» In Detailstufe max. mit allen getesteten Notebooks spielbar
min. 1280x720
135.9  fps    + Vergleich
mittel 1920x1080
70.6  fps    + Vergleich
hoch 1920x1080
64.9  fps    + Vergleich
QHD 2560x1440
42.7  fps    + Vergleich
4K 3840x2160
21.8  fps    + Vergleich
» In Detailstufe hoch mit allen getesteten Notebooks spielbar
min. 1280x720
141.5  fps    + Vergleich
mittel 1920x1080
81.4  fps    + Vergleich
hoch 1920x1080
68  fps    + Vergleich
max. 1920x1080
50.5  fps    + Vergleich
QHD 2560x1440
38.8  fps    + Vergleich
4K 3840x2160
24.4  fps    + Vergleich
» In Detailstufe max. mit allen getesteten Notebooks spielbar
min. 1280x720
212  fps    + Vergleich + 📈 Graph
mittel 1920x1080
94.3  fps    + Vergleich + 📈 Graph
hoch 1920x1080
51.4  fps    + Vergleich + 📈 Graph
max. 1920x1080
40.8  fps    + Vergleich + 📈 Graph
QHD 2560x1440
28.9  fps    + Vergleich + 📈 Graph
4K 3840x2160
16.6  fps    + Vergleich + 📈 Graph
» In Detailstufe max. mit allen getesteten Notebooks spielbar
min. 1280x720
84.6  fps    + Vergleich
mittel 1920x1080
49.9  fps    + Vergleich
hoch 1920x1080
35.8  fps    + Vergleich
max. 1920x1080
23.7  fps    + Vergleich
QHD 2560x1440
18.4  fps    + Vergleich
4K 3840x2160
10.4  fps    + Vergleich
» In Detailstufe hoch mit allen getesteten Notebooks spielbar
min. 1280x720
130  fps    + Vergleich
mittel 1920x1080
82  fps    + Vergleich
hoch 1920x1080
67  fps    + Vergleich
max. 1920x1080
54  fps    + Vergleich
QHD 2560x1440
40  fps    + Vergleich
4K 3840x2160
21  fps    + Vergleich
» In Detailstufe max. mit allen getesteten Notebooks spielbar
min. 1280x720
138  fps    + Vergleich
mittel 1920x1080
86.7  fps    + Vergleich
hoch 1920x1080
79.3  fps    + Vergleich
max. 1920x1080
77.6  fps    + Vergleich
QHD 2560x1440
53.3  fps    + Vergleich
4K 3840x2160
28.6  fps    + Vergleich
» In Detailstufe max. mit allen getesteten Notebooks spielbar
F1 2020

F1 2020

2020
min. 1280x720
292 339 356 ~ 329 fps    + Vergleich
mittel 1920x1080
160 171.5 179.9 ~ 170 fps    + Vergleich
hoch 1920x1080
128 135.1 140.3 ~ 134 fps    + Vergleich
max. 1920x1080
89.8 93.3 95.9 ~ 93 fps    + Vergleich
QHD 2560x1440
66.1 67 69.1 ~ 67 fps    + Vergleich
4K 3840x2160
37.2 37.5 37.9 ~ 38 fps    + Vergleich
» In Detailstufe max. mit allen getesteten Notebooks spielbar
Valorant

Valorant

2020
min. 1280x720
324.5  fps    + Vergleich
mittel 1920x1080
306.2  fps    + Vergleich
hoch 1920x1080
287.1  fps    + Vergleich
QHD 2560x1440
226.3  fps    + Vergleich
4K 3840x2160
125.3  fps    + Vergleich
» In Detailstufe hoch mit allen getesteten Notebooks spielbar
min. 1280x720
297.9  fps    + Vergleich
mittel 1920x1080
141.7  fps    + Vergleich
hoch 1920x1080
92  fps    + Vergleich
max. 1920x1080
61.9  fps    + Vergleich
QHD 2560x1440
43  fps    + Vergleich
4K 3840x2160
22.8  fps    + Vergleich
» In Detailstufe max. mit allen getesteten Notebooks spielbar
min. 1280x720
257  fps    + Vergleich
mittel 1920x1080
138  fps    + Vergleich
hoch 1920x1080
121  fps    + Vergleich
max. 1920x1080
115  fps    + Vergleich
QHD 2560x1440
71.7  fps    + Vergleich
4K 3840x2160
38.2  fps    + Vergleich
» In Detailstufe max. mit allen getesteten Notebooks spielbar
min. 1280x720
211  fps    + Vergleich
mittel 1920x1080
82.1  fps    + Vergleich
hoch 1920x1080
64.8  fps    + Vergleich
QHD 2560x1440
39.7  fps    + Vergleich
4K 3840x2160
19.8  fps    + Vergleich
» In Detailstufe hoch mit allen getesteten Notebooks spielbar
min. 1280x720
121  fps    + Vergleich
mittel 1920x1080
121  fps    + Vergleich
hoch 1920x1080
93.2  fps    + Vergleich
max. 1920x1080
79.2  fps    + Vergleich
QHD 2560x1440
47.6  fps    + Vergleich
4K 3840x2160
23.9  fps    + Vergleich
» In Detailstufe max. mit allen getesteten Notebooks spielbar
min. 1280x720
130  fps    + Vergleich
mittel 1920x1080
73  fps    + Vergleich
hoch 1920x1080
49.1  fps    + Vergleich
max. 1920x1080
30.9  fps    + Vergleich
QHD 2560x1440
24.7  fps    + Vergleich
» In Detailstufe hoch mit allen getesteten Notebooks spielbar
mittel 1920x1080
112  fps    + Vergleich
hoch 1920x1080
90  fps    + Vergleich
max. 1920x1080
81  fps    + Vergleich
QHD 2560x1440
53.1  fps    + Vergleich
4K 3840x2160
26.4  fps    + Vergleich
» In Detailstufe max. mit allen getesteten Notebooks spielbar
min. 1280x720
111  fps    + Vergleich
mittel 1920x1080
89  fps    + Vergleich
hoch 1920x1080
79  fps    + Vergleich
max. 1920x1080
70  fps    + Vergleich
QHD 2560x1440
49.5  fps    + Vergleich
4K 3840x2160
23  fps    + Vergleich
» In Detailstufe max. mit allen getesteten Notebooks spielbar
min. 1280x720
159  fps    + Vergleich
mittel 1920x1080
112  fps    + Vergleich
hoch 1920x1080
90  fps    + Vergleich
max. 1920x1080
79  fps    + Vergleich
QHD 2560x1440
56.8  fps    + Vergleich
4K 3840x2160
31.6  fps    + Vergleich
» In Detailstufe max. mit allen getesteten Notebooks spielbar
Additional Benchmarks
Maximum Settings with Raytracing T2X Filmic SMAA 1920x1080
56.2
Maximum Settings with Raytracing T2X Filmic SMAA 3840x2160
12.6
GRID 2019

GRID 2019

2019
min. 1280x720
160  fps    + Vergleich
mittel 1920x1080
119  fps    + Vergleich
hoch 1920x1080
97  fps    + Vergleich
max. 1920x1080
67  fps    + Vergleich
QHD 2560x1440
51.4  fps    + Vergleich
4K 3840x2160
31.9  fps    + Vergleich
» In Detailstufe max. mit allen getesteten Notebooks spielbar
min. 1280x720
114  fps    + Vergleich
mittel 1920x1080
73  fps    + Vergleich
hoch 1920x1080
67  fps    + Vergleich
max. 1920x1080
49  fps    + Vergleich
QHD 2560x1440
34  fps    + Vergleich
4K 3840x2160
17  fps    + Vergleich
» In Detailstufe max. mit allen getesteten Notebooks spielbar
FIFA 20

FIFA 20

2019
min. 1280x720
265  fps    + Vergleich
mittel 1920x1080
262  fps    + Vergleich
hoch 1920x1080
241  fps    + Vergleich
max. 1920x1080
239  fps    + Vergleich
QHD 2560x1440
202  fps    + Vergleich
4K 3840x2160
127  fps    + Vergleich
» In Detailstufe max. mit allen getesteten Notebooks spielbar
min. 1280x720
143 219 226 ~ 196 fps    + Vergleich
mittel 1920x1080
91 98.1 99.7 ~ 96 fps    + Vergleich
hoch 1920x1080
61 64.4 65.1 ~ 64 fps    + Vergleich
max. 1920x1080
49 49 49.3 ~ 49 fps    + Vergleich
QHD 2560x1440
33.6 33.8 34 ~ 34 fps    + Vergleich
4K 3840x2160
14 15 15.1 ~ 15 fps    + Vergleich
» In Detailstufe max. mit allen getesteten Notebooks spielbar
Additional Benchmarks
Very Low Overall Quality (DX11) 1920x1080
152.1
Control

Control

2019
min. 1280x720
198  fps    + Vergleich
mittel 1920x1080
70  fps    + Vergleich
hoch 1920x1080
52.5  fps    + Vergleich
QHD 2560x1440
31.6  fps    + Vergleich
4K 3840x2160
15.8  fps    + Vergleich
» In Detailstufe hoch mit allen getesteten Notebooks spielbar
Additional Benchmarks
High Quality Preset & High Ray Tracing Preset (DX12) 1920x1080
16.8
F1 2019

F1 2019

2019
min. 1280x720
261  fps    + Vergleich
mittel 1920x1080
142  fps    + Vergleich
hoch 1920x1080
123  fps    + Vergleich
max. 1920x1080
82  fps    + Vergleich
QHD 2560x1440
64  fps    + Vergleich
4K 3840x2160
38  fps    + Vergleich
» In Detailstufe max. mit allen getesteten Notebooks spielbar
min. 1280x720
237.8  fps    + Vergleich
mittel 1920x1080
98.2  fps    + Vergleich
hoch 1920x1080
60.6  fps    + Vergleich
max. 1920x1080
42  fps    + Vergleich
QHD 2560x1440
25.8  fps    + Vergleich
» In Detailstufe max. mit allen getesteten Notebooks spielbar
Rage 2

Rage 2

2019
min. 1280x720
168  fps    + Vergleich
mittel 1920x1080
83  fps    + Vergleich
hoch 1920x1080
71  fps    + Vergleich
max. 1920x1080
71  fps    + Vergleich
QHD 2560x1440
45.3  fps    + Vergleich
4K 3840x2160
21.7  fps    + Vergleich
» In Detailstufe max. mit allen getesteten Notebooks spielbar
Anno 1800

Anno 1800

2019
min. 1280x720
94  fps    + Vergleich
mittel 1920x1080
92  fps    + Vergleich
hoch 1920x1080
69  fps    + Vergleich
max. 1920x1080
34.9  fps    + Vergleich
QHD 2560x1440
23.6  fps    + Vergleich
4K 3840x2160
14  fps    + Vergleich
» In Detailstufe hoch mit allen getesteten Notebooks spielbar
min. 1280x720
185  fps    + Vergleich
mittel 1920x1080
103  fps    + Vergleich
hoch 1920x1080
82  fps    + Vergleich
max. 1920x1080
59  fps    + Vergleich
QHD 2560x1440
40  fps    + Vergleich
4K 3840x2160
21  fps    + Vergleich
» In Detailstufe max. mit allen getesteten Notebooks spielbar
min. 1280x720
132 166 172 ~ 157 fps    + Vergleich + 📈 Graph
mittel 1920x1080
92 95 98 ~ 95 fps    + Vergleich + 📈 Graph
hoch 1920x1080
87 89 91 ~ 89 fps    + Vergleich + 📈 Graph
max. 1920x1080
80 82 85 ~ 82 fps    + Vergleich + 📈 Graph
QHD 2560x1440
58 59 60 ~ 59 fps    + Vergleich + 📈 Graph
4K 3840x2160
31 31 32 ~ 31 fps    + Vergleich + 📈 Graph
» In Detailstufe max. mit allen getesteten Notebooks spielbar
min. 1280x720
118 156.3 165.7 ~ 147 fps    + Vergleich
mittel 1920x1080
61 73.8 76 ~ 70 fps    + Vergleich
hoch 1920x1080
45 54.3 56.1 ~ 52 fps    + Vergleich
max. 1920x1080
38 42.9 44.1 ~ 42 fps    + Vergleich
QHD 2560x1440
29 33.1 33.9 ~ 32 fps    + Vergleich
4K 3840x2160
19 20 20.2 ~ 20 fps    + Vergleich
» In Detailstufe max. mit allen getesteten Notebooks spielbar
min. 1280x720
144  fps    + Vergleich
mittel 1920x1080
144  fps    + Vergleich
hoch 1920x1080
114  fps    + Vergleich
max. 1920x1080
111  fps    + Vergleich
QHD 2560x1440
77  fps    + Vergleich
4K 3840x2160
43.6  fps    + Vergleich
» In Detailstufe max. mit allen getesteten Notebooks spielbar
min. 1280x720
196  fps    + Vergleich
mittel 1920x1080
115  fps    + Vergleich
hoch 1920x1080
96  fps    + Vergleich
max. 1920x1080
83  fps    + Vergleich
QHD 2560x1440
54.5  fps    + Vergleich
4K 3840x2160
18.8  fps    + Vergleich
» In Detailstufe max. mit allen getesteten Notebooks spielbar
min. 1280x720
242  fps    + Vergleich
mittel 1920x1080
190  fps    + Vergleich
hoch 1920x1080
153  fps    + Vergleich
max. 1920x1080
116  fps    + Vergleich
QHD 2560x1440
80  fps    + Vergleich
4K 3840x2160
41.9  fps    + Vergleich
» In Detailstufe max. mit allen getesteten Notebooks spielbar
min. 1280x720
200  fps    + Vergleich
mittel 1920x1080
132  fps    + Vergleich
hoch 1920x1080
123  fps    + Vergleich
max. 1920x1080
98  fps    + Vergleich
QHD 2560x1440
76  fps    + Vergleich
4K 3840x2160
50  fps    + Vergleich
» In Detailstufe max. mit allen getesteten Notebooks spielbar
min. 1280x720
152 228 233 ~ 204 fps    + Vergleich
mittel 1920x1080
92 93.2 94.1 ~ 93 fps    + Vergleich
hoch 1920x1080
80 81.6 82.4 ~ 81 fps    + Vergleich
max. 1920x1080
72 73.8 74.4 ~ 73 fps    + Vergleich
QHD 2560x1440
47 48.4 49.3 ~ 48 fps    + Vergleich
4K 3840x2160
23 24.1 24.3 ~ 24 fps    + Vergleich
» In Detailstufe max. mit allen getesteten Notebooks spielbar
Additional Benchmarks
Lowest Preset 1920x1080
155.5
Strange Brigade

Strange Brigade

2018
min. 1280x720
313 320 334 ~ 322 fps    + Vergleich
mittel 1920x1080
129 131.5 132.7 ~ 131 fps    + Vergleich
hoch 1920x1080
105 109.5 110.1 ~ 108 fps    + Vergleich
max. 1920x1080
88.1 95 96.1 ~ 93 fps    + Vergleich
QHD 2560x1440
63.7 66.7 67.8 ~ 66 fps    + Vergleich
4K 3840x2160
34.5 35.6 36 ~ 35 fps    + Vergleich
» In Detailstufe max. mit allen getesteten Notebooks spielbar
Far Cry 5

Far Cry 5

2018
min. 1280x720
142 191 195 ~ 176 fps    + Vergleich + 📈 Graph
mittel 1920x1080
95 100 102 ~ 99 fps    + Vergleich + 📈 Graph
hoch 1920x1080
87 92 93 ~ 91 fps    + Vergleich + 📈 Graph
max. 1920x1080
82 86 87 ~ 85 fps    + Vergleich + 📈 Graph
QHD 2560x1440
57 59 59 ~ 58 fps    + Vergleich + 📈 Graph
4K 3840x2160
29 30 30 ~ 30 fps    + Vergleich + 📈 Graph
» In Detailstufe max. mit allen getesteten Notebooks spielbar
Additional Benchmarks
Low Preset TAA 1920x1080
116
min. 1280x720
127 211 233 ~ 190 fps    + Vergleich
mittel 1920x1080
114 180.5 203 ~ 166 fps    + Vergleich
hoch 1920x1080
93 144.9 154.9 ~ 131 fps    + Vergleich
4K 3840x2160
79 106.5 109.3 ~ 98 fps    + Vergleich
» In Detailstufe hoch mit allen getesteten Notebooks spielbar
min. 1280x720
157.2 159.8 ~ 159 fps    + Vergleich
mittel 1920x1080
79.7 80.4 ~ 80 fps    + Vergleich
hoch 1920x1080
56.1 56.6 ~ 56 fps    + Vergleich
QHD 2560x1440
41.2 41.4 ~ 41 fps    + Vergleich
4K 3840x2160
22.6 23.4 ~ 23 fps    + Vergleich
» In Detailstufe hoch mit allen getesteten Notebooks spielbar
min. 1280x720
249  fps    + Vergleich
mittel 1920x1080
249  fps    + Vergleich
hoch 1920x1080
183  fps    + Vergleich
QHD 2560x1440
129  fps    + Vergleich
4K 3840x2160
81  fps    + Vergleich
» In Detailstufe hoch mit allen getesteten Notebooks spielbar
Additional Benchmarks
Performance 1920x1080
249
min. 1280x720
163.7 296.4 297.7 ~ 253 fps    + Vergleich
mittel 1366x768
152.4 257.8 260.5 ~ 224 fps    + Vergleich
hoch 1920x1080
145.9 219.2 222.4 ~ 196 fps    + Vergleich
max. 1920x1080
136.7 197.2 200.9 ~ 178 fps    + Vergleich
4K 3840x2160
85.9 86.5 86.8 ~ 86 fps    + Vergleich
» In Detailstufe max. mit allen getesteten Notebooks spielbar
min. 1024x768
282 296 306 ~ 295 fps    + Vergleich + 📈 Graph
mittel 1366x768
181 186.5 193.2 ~ 187 fps    + Vergleich + 📈 Graph
hoch 1920x1080
99 101.6 103.1 ~ 101 fps    + Vergleich + 📈 Graph
max. 1920x1080
55.5 56.7 58.6 ~ 57 fps    + Vergleich + 📈 Graph
4K 3840x2160
34.9 35.4 36.3 ~ 36 fps    + Vergleich + 📈 Graph
» In Detailstufe max. mit allen getesteten Notebooks spielbar
Additional Benchmarks
Ultra Graphics & Postprocessing (HBAO+) 3840x2160
23.9
25
Medium Graphics & Postprocessing 1920x1080
121.1
GTA V

GTA V

2015
min. 1024x768
188  fps    + Vergleich
mittel 1366x768
187.5 187.7 ~ 188 fps    + Vergleich
hoch 1920x1080
153.4 157.4 ~ 155 fps    + Vergleich
max. 1920x1080
74.6 75.6 ~ 75 fps    + Vergleich
QHD 2560x1440
51.4 51.8 ~ 52 fps    + Vergleich
4K 3840x2160
49.1 49.3 ~ 49 fps    + Vergleich
» In Detailstufe max. mit allen getesteten Notebooks spielbar
Additional Benchmarks
Highest Settings possible 16xAF 4xMSAA + FXAA 3840x2160
24
24
Normal/Off 4xAF 1920x1080
187.5
187.7
Lowest Settings possible 1920x1080
187.5
187.8
min.mittelhochmax.QHD4K
Ready or Not138.8113.7107.663.735.310.9
The Finals153.7109.795.870.14216.3
Avatar Frontiers of Pandora504436272116
Call of Duty Modern Warfare 3 2023716547453017
EA Sports WRC76.15550.847.127.812.9
Alan Wake 237.731.729.117.39.2
Lords of the Fallen50.840.729.519.7134.9
Total War Pharaoh209.8144.282.865.943.521.1
Assassin's Creed Mirage746763483519
EA Sports FC 24166.9156.7130107.277.923.8
Counter-Strike 2271223132.581.262.331.3
Cyberpunk 2077 2.1 Phantom Liberty71.956.447.743.126.111.2
Lies of P106.69277.168.333.324.9
Starfield38.432.826.223.518.611.3
Armored Core 610380.974.154.860.518.9
Immortals of Aveum32.126.619.912.6
Atlas Fallen82.478.172.862.141.820
Baldur's Gate 367.754.645.24530.115.7
Ratchet & Clank Rift Apart59.649.336.431.921.613.5
F1 23179.9159.5109.378.65729.4
Diablo 4141.5122.3107.889.157.329.1
Star Wars Jedi Survivor48.44138.636.122.210.2
Dead Island 2156.4135.192.367.743.418.2
The Last of Us59.747.138.931.618.9
Resident Evil 4 Remake78.454.249.342.229.511.8
Company of Heroes 3116.996.97473.752.529.2
Sons of the Forest67.251.247.647.133.218.1
Atomic Heart111.483.448.538.428.114.8
Returnal605851443216
Hogwarts Legacy78.95945.535.724.312.8
Dead Space Remake5248424227
The Witcher 3 v4.00123.592.97863.944.223.8
High On Life157.389.972.657.634.814.3
The Callisto Protocol92.867.442.642.730.112.6
Need for Speed Unbound97.785.867.853.731.916.5
Spider-Man Miles Morales85.174.272.262.34117.3
Call of Duty Modern Warfare 2 2022857555503521
Uncharted Legacy of Thieves Collection55.152.140.539259.36
A Plague Tale Requiem67.75036.627.3199.97
FIFA 23185.2174.1117114.983.447.2
The Quarry90675536196
F1 22182162117866334
Vampire Bloodhunt216115.7111107.268.429.6
Ghostwire Tokyo84.183.883.182.251.622.3
Tiny Tina's Wonderlands1159162483312
Cyberpunk 2077 1.6715847402410
Elex 265.359.551.846.733.117.4
GRID Legends183136110796033
Elden Ring59.959.859.554.941.824.3
Dying Light 25139.132.121.810.7
Rainbow Six Extraction1029795774721
God of War816752352819
Halo Infinite74.667.76869.649.3
Farming Simulator 222881541149268.340.9
Battlefield 204214279.466.558.642.322.6
Forza Horizon 52019987423523
Call of Duty Vanguard89.880.562.755.840.121.6
Riders Republic1498668594020
Guardians of the Galaxy1288380775428
Back 4 Blood14012411371.234.6
Far Cry 6156877665343
Alan Wake Remastered92.688.285.960
New World14371.16555.436.825.2
Deathloop11774.260.14933.516.8
F1 2021367181145997542
Monster Hunter Stories 214414414312575.1
Days Gone1569080.659.342.123.3
Mass Effect Legendary Edition11411294.647.9
Resident Evil Village25911099.686.65627.8
Outriders18399.580.868.344.830.3
Hitman 319511093865731
Cyberpunk 2077 1.097.651.942.636.622.39.55
Immortals Fenyx Rising965849453621
Yakuza Like a Dragon11068.966.8593919
Call of Duty Black Ops Cold War15191.77052.536.82.01
Assassin´s Creed Valhalla1105942372715
Dirt 515178.660.75040.825.7
Watch Dogs Legion11477.965.929.419.412
FIFA 21231227214214187120
Star Wars Squadrons38920317215710357.8
Mafia Definitive Edition135.970.664.942.721.8
Serious Sam 4141.581.46850.538.824.4
Crysis Remastered21294.351.440.828.916.6
Flight Simulator 202084.649.935.823.718.410.4
Horizon Zero Dawn1308267544021
Death Stranding13886.779.377.653.328.6
F1 2020329170134936738
Valorant324.5306.2287.1226.3125.3
Gears Tactics297.9141.79261.94322.8
Doom Eternal25713812111571.738.2
Hunt Showdown21182.164.839.719.8
Escape from Tarkov12112193.279.247.623.9
Red Dead Redemption 21307349.130.924.7
Star Wars Jedi Fallen Order112908153.126.4
Need for Speed Heat11189797049.523
Call of Duty Modern Warfare 2019159112907956.831.6
GRID 2019160119976751.431.9
Ghost Recon Breakpoint1147367493417
FIFA 20265262241239202127
Borderlands 31969664493415
Control1987052.531.615.8
F1 2019261142123826438
Total War: Three Kingdoms237.898.260.64225.8
Rage 216883717145.321.7
Anno 180094926934.923.614
The Division 218510382594021
Far Cry New Dawn1579589825931
Metro Exodus1477052423220
Apex Legends1441441141117743.6
Darksiders III196115968354.518.8
Farming Simulator 192421901531168041.9
Forza Horizon 4200132123987650
Shadow of the Tomb Raider2049381734824
Strange Brigade322131108936635
Far Cry 51769991855830
X-Plane 11.1119016613198
Final Fantasy XV Benchmark15980564123
Rocket League24924918312981
Dota 2 Reborn25322419617886
The Witcher 32951871015736
GTA V188188155755249
< 30 fps
< 60 fps
< 120 fps
≥ 120 fps

12
38
67

25
63
31
4
33
65
18
7
50
49
4
28
64
21
5
83
25
5
3

Eine Liste mit weiteren Spielen und allen Grafikkarten finden Sie auf unserer Seite: Welches Spiel ist mit welcher Grafikkarte spielbar?

Ein oder mehrere Geräte zum Vergleich auswählen

In der folgenden Liste können sie Geräte suchen und für einen Vergleich auswählen.

Liste einschränken:

show all (including archived), 2024, 2023
v1.28
log 24. 14:12:55

#0 no ids found in url (should be separated by "_") +0s ... 0s

#1 not redirecting to Ajax server +0s ... 0s

#2 did not recreate cache, as it is less than 5 days old! Created at Tue, 23 Jul 2024 16:12:35 +0200 +0.001s ... 0.001s

#3 composed specs +0.036s ... 0.037s

#4 did output specs +0s ... 0.037s

#5 start showIntegratedCPUs +0s ... 0.037s

#6 getting avg benchmarks for device 9965 +0.027s ... 0.064s

#7 got single benchmarks 9965 +0.013s ... 0.077s

#8 got avg benchmarks for devices +0s ... 0.077s

#9 min, max, avg, median took s +0.806s ... 0.883s

#10 before gaming benchmark output +0s ... 0.883s

#11 Got 918 rows for game benchmarks. +0.064s ... 0.947s

#12 composed SQL query for gamebenchmarks +0s ... 0.947s

#13 got data and put it in $dataArray +0.071s ... 1.018s

#14 benchmarks composed for output. +5.757s ... 6.774s

#15 return log +0.051s ... 6.826s

Teilen Sie diesen Artikel, um uns zu unterstützen. Jeder Link hilft!

» Vergleich mobiler Grafikkarten
Liste aller mobiler Grafikkarten mit Kurzinformationen sortiert nach Leistung

» Mobile Grafikkarten - Benchmarkliste
Sortier- und filterbare Benchmark-Liste

» Spieleliste
Welche Spiele laufen mit welcher Grafikkarte

Leistungsklasse 1

Leistungsklasse 2

Leistungsklasse 3

UHD Graphics 750

* Geschätzte Position

> Notebook Test, Laptop Test und News > Benchmarks / Technik > Benchmarks / Technik > Vergleich mobiler Grafikkarten > NVIDIA GeForce GTX 1660 (Desktop) Grafikkarte - Benchmarks und Spezifikationen
Autor: Sebastian Bade (Update: 12.06.2023)