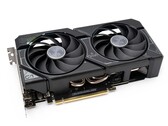
Notebookcheck Logo

NVIDIA GeForce RTX 4060 Ti 8G

NVIDIA NVIDIA GeForce RTX 4060 Ti 8G

Die Nvidia GeForce RTX 4060 Ti ist eine Mid-Range-Desktop-GPU und wird im 5 nm Verfahren bei TSMC gefertigt. Damit rundet der Hersteller sein aktuelles Line-up der Ada-Lovelace weiter in Richtung Mittelklasse ab. Als Chip kommt hier der AD106 zum Einsatz. Dieser vereint 4.352 Schadereinheiten und 8-GB-GDDR6 stehen hier zur Verfügung. Später soll eine Nvidia GeForce RTX 4060 Ti mit 16-GB-VRAM folgen. Das Speicherinterface beträgt 128 Bit, woraus eine Speicherbandbreite von 288 GB/s resultiert.

Features

Die bereits mit den High-End-Modellen der Ada-Lovelace-Generation Einzug gehaltenen Features, wie DLSS 3.0 mit Framegeneration, wird der Nvidia GeForce RTX 4060 Ti nicht vorenthalten. Damit hebt sich die neue Mittelklasse von der Nvidia GeForce RTX 3060 Ti deutlich ab und kann in Spielen, welche diese Features bieten, einen deutlichen Vorteil erlangen. 

Performance

Ohne DLSS ist die Leistung einer Nvidia GeForce RTX 4060 Ti etwa 10 Prozent besser als bei einer Nvidia GeForce RTX 3060 Ti. Gegenüber AMD positioniert sich die Nvidia GeForce RTX 4060 Ti genau zwischen einer AMD Radeon RX 6750 XT und einer AMD Radeon RX 6800, wenngleich AMD hier mit dem größeren VRAM einen kleinen Vorteil hat, wenn es über 1.080p hinausgeht. Doch das gar nicht das anvisierte Ziel der Nvidia GeForce RTX 4060 Ti, denn vielmehr handelt es sich hierbei um eine Grafikkarte für den 1.080p-Gaming-Bereich.

Leistungsaufnahme

Die Leistungsaufnahme der Nvidia GeForce RTX 4060 Ti wird vom Hersteller mit 160 Watt (TDP) angegeben. Das ist deutlich weniger als bei einer Nvidia GeForce RTX 3060 Ti, welche mit einer TDP von 200 Watt daherkommt. Das zeigt einmal mehr, wie effizient die aktuelle GPU-Architektur seitens Nvidia ist. Die Netzteilempfehlung seitens Nvidia lautet 450 Watt. Als Stromanschluss vertraut der Hersteller (Founders Edition) unterdessen weiterhin auf den 12VHPWR-Adapter, wenngleich Dritthersteller ihre Grafikkarte auch mit dem allseits bekannten 6+2-Pin-Anschluss ausstatten.

GeForce RTX 4000 Serie

NVIDIA GeForce RTX 4090 compare 16384 @ 2.24 - 2.52 GHz384 Bit @ 21000 MHz
NVIDIA GeForce RTX 4080 Super compare 10240 @ 2.3 - 2.55 GHz? Bit @ 23000 MHz
NVIDIA GeForce RTX 4080 compare 9728 @ 2.21 - 2.51 GHz256 Bit @ 22400 MHz
NVIDIA GeForce RTX 4070 Ti SUPER compare 8448 @ 2.34 - 2.61 GHz256 Bit @ 21000 MHz
NVIDIA GeForce RTX 4070 Ti compare 7680 @ 2.31 - 2.61 GHz192 Bit @ 21000 MHz
NVIDIA GeForce RTX 4070 SUPER compare 7168 @ 1.98 - 2.48 GHz192 Bit @ 21000 MHz
NVIDIA GeForce RTX 4070 compare 5888 @ 1.92 - 2.48 GHz192 Bit @ 21000 MHz
NVIDIA GeForce RTX 4060 Ti 16G compare 4352 @ 2.31 - 2.54 GHz128 Bit @ 18000 MHz
NVIDIA GeForce RTX 4060 Ti 8G 4352 @ 2.31 - 2.54 GHz128 Bit @ 18000 MHz
NVIDIA GeForce RTX 4060 compare 3072 @ 1.83 - 2.46 GHz128 Bit @ 17000 MHz
CodenameAD106
ArchitekturAda Lovelace
Pipelines4352 - unified
TMUs136
ROPs48
Raytracing Cores34
Tensor / AI Cores136
Kerntakt2310 - 2535 (Boost) MHz
Theoretical Performance22.06 TFLOPS FP16, 22.06 TFLOPS FP32
Speichertakt18000 effective = 2250 MHz
Speicherbandbreite128 Bit
SpeichertypGDDR6
Max. Speichergröße8 GB
Shared Memorynein
Memory Bandwidth288 GB/s
APIDirectX 12_2, Shader 6.7, OpenGL 4.6, OpenCL 3.0, Vulkan 1.3
Stromverbrauch160 Watt
Chipgröße 188 mm²
Herstellungsprozess5 nm
PCIe4.0
Displays4 Displays (max.), HDMI 2.1, DisplayPort 1.4a
FeaturesDLSS 3.0, Frame-Generation, Ray-Tracing
Erscheinungsdatum18.05.2023
PredecessorNVIDIA GeForce RTX 3060 Ti

Benchmarks

Performance Rating - 3DMark 11 + Fire Strike + Time Spy
15.6 pt (47%)
3DMark - 3DMark Ice Storm Unlimited Graphics
min: 780606     avg: 798683     median: 795061 (90%)     max: 820382 Points
3DMark - 3DMark Ice Storm Extreme Graphics
min: 458170     avg: 460977     median: 461008 (59%)     max: 463752 Points
3DMark - 3DMark Ice Storm Graphics
min: 524826     avg: 527239     median: 527469 (63%)     max: 529421 Points
3DMark - 3DMark Night Raid Graphics Score
min: 156144     avg: 158042     median: 158042 (61%)     max: 159940 Points
3DMark Vantage
3DM Vant. Perf. total +
3DMark Vantage - 3DM Vant. Perf. total
min: 116782     avg: 118133     median: 118567 (34%)     max: 119049 Points
3DM Vant. Perf. GPU no PhysX +
3DMark 06 3DMark 06 - Standard 1280x1024 +
3DMark 06
min: 66262     avg: 67150     median: 66598 (87%)     max: 68590 Points
SPECviewperf 12
specvp12 sw-03 +
specvp12 snx-02 +
specvp12 showcase-01 +
specvp12 mediacal-01 +
specvp12 maya-04 +
specvp12 energy-01 +
specvp12 creo-01 +
specvp12 catia-04 +
specvp12 3dsmax-05 +
SPECviewperf 13 specvp13 sw-04 +
specvp13 snx-03 +
specvp13 showcase-02 +
specvp13 medical-02 +
specvp13 maya-05 +
specvp13 energy-02 +
specvp13 creo-02 +
specvp13 catia-05 +
specvp13 3dsmax-06 +
SPECviewperf 2020 specvp2020 snx-04 4k +
specvp2020 medical-03 4k +
specvp2020 maya-06 4k +
specvp2020 energy-03 4k +
specvp2020 creo-03 4k +
specvp2020 catia-06 4k +
specvp2020 3dsmax-07 4k +
Power Consumption - Furmark Stress Test Power Consumption - external Monitor *
min: 306     avg: 307.3     median: 308 (44%)     max: 308 Watt
020406080100120140160180200220240260280300320340Tooltip
Power Consumption - The Witcher 3 Power Consumption - external Monitor *
min: 307     avg: 313     median: 311 (43%)     max: 321 Watt
020406080100120140160180200220240260280300320Tooltip
Power Consumption - Witcher 3 ultra Power Efficiency - external Monitor
min: 0.4243     avg: 0.4     median: 0.5 (37%)     max: 0.4577 fps per Watt
Emissions Witcher 3 Fan Noise +
- Bereich der Benchmarkergebnisse für diese Grafikkarte
- Durchschnittliche Benchmarkergebnisse für diese Grafikkarte
* Smaller numbers mean a higher performance

Spiele-Benchmarks

Die folgenden Benchmarks basieren auf unseren Spieletests mit Testnotebooks. Die Performance dieser Grafikkarte bei den gelisteten Spielen ist abhängig von der verwendeten CPU, Speicherausstattung, Treiber und auch Betriebssystem. Dadurch müssen die untenstehenden Werte nicht repräsentativ sein. Detaillierte Informationen über das verwendete System sehen Sie nach einem Klick auf den fps-Wert.

min. 1920x1080
119.7  fps    + Vergleich + 📈 Graph
mittel 1920x1080
119.4  fps    + Vergleich + 📈 Graph
hoch 1920x1080
119.5  fps    + Vergleich + 📈 Graph
max. 1920x1080
119.4  fps    + Vergleich + 📈 Graph
QHD 2560x1440
97.5  fps    + Vergleich + 📈 Graph
4K 3840x2160
51.2  fps    + Vergleich + 📈 Graph
» In Detailstufe max. mit allen getesteten Notebooks spielbar
Additional Benchmarks
Low Preset 1280x720
119.5
min. 1920x1080
82  fps    + Vergleich + 📈 Graph
hoch 1920x1080
71.6  fps    + Vergleich + 📈 Graph
max. 1920x1080
58.7  fps    + Vergleich + 📈 Graph
QHD 2560x1440
40.4  fps    + Vergleich + 📈 Graph
4K 3840x2160
22.1  fps    + Vergleich + 📈 Graph
3840x2160
43.8  fps    + Vergleich + 📈 Graph
» In Detailstufe max. mit allen getesteten Notebooks spielbar
Additional Benchmarks
Low 1280x720
124.1
min. 1920x1080
193.5  fps    + Vergleich + 📈 Graph
mittel 1920x1080
188.4  fps    + Vergleich + 📈 Graph
hoch 1920x1080
177.3  fps    + Vergleich + 📈 Graph
max. 1920x1080
152  fps    + Vergleich + 📈 Graph
QHD 2560x1440
105.9  fps    + Vergleich + 📈 Graph
4K 3840x2160
56.1  fps    + Vergleich + 📈 Graph
» In Detailstufe max. mit allen getesteten Notebooks spielbar
Additional Benchmarks
Low Preset 1280x720
193.7
min. 1920x1080
153.6  fps    + Vergleich + 📈 Graph
mittel 1920x1080
124.2  fps    + Vergleich + 📈 Graph
hoch 1920x1080
103.8  fps    + Vergleich + 📈 Graph
max. 1920x1080
100.6  fps    + Vergleich + 📈 Graph
QHD 2560x1440
67.4  fps    + Vergleich + 📈 Graph
4K 3840x2160
35.2  fps    + Vergleich + 📈 Graph
3840x2160
64.7  fps    + Vergleich + 📈 Graph
» In Detailstufe max. mit allen getesteten Notebooks spielbar
Additional Benchmarks
Low Preset 1280x720
234
min. 1920x1080
101.5  fps    + Vergleich + 📈 Graph
mittel 1920x1080
91.1  fps    + Vergleich + 📈 Graph
hoch 1920x1080
73.3  fps    + Vergleich + 📈 Graph
max. 1920x1080
68.3  fps    + Vergleich + 📈 Graph
QHD 2560x1440
63.7  fps    + Vergleich + 📈 Graph
4K 3840x2160
56.6  fps    + Vergleich + 📈 Graph
» In Detailstufe max. mit allen getesteten Notebooks spielbar
Additional Benchmarks
Very Low Preset 1280x720
124.1
Very High Preset + Very High Raytracing TAA 1920x1080
61.7
Very High Preset + Very High Raytracing + DLSS Quality + FG 3840x2160
15.6
F1 23

F1 23

2023
min. 1920x1080
379 386 ~ 383 fps    + Vergleich
mittel 1920x1080
337 353 ~ 345 fps    + Vergleich
hoch 1920x1080
243 250 ~ 247 fps    + Vergleich
max. 1920x1080
81 82.1 ~ 82 fps    + Vergleich
QHD 2560x1440
51 51.5 ~ 51 fps    + Vergleich
4K 3840x2160
24 24.8 ~ 24 fps    + Vergleich
3840x2160
43.4  fps    + Vergleich
» In Detailstufe max. mit allen getesteten Notebooks spielbar
Additional Benchmarks
Ultra Low Preset TAA 1280x720
382
380
Diablo 4

Diablo 4

2023
min. 1920x1080
269 341 342 ~ 317 fps    + Vergleich + 📈 Graph
mittel 1920x1080
253 287 290 ~ 277 fps    + Vergleich + 📈 Graph
hoch 1920x1080
242 255 256 ~ 251 fps    + Vergleich + 📈 Graph
max. 1920x1080
212 217 252 ~ 227 fps    + Vergleich + 📈 Graph
QHD 2560x1440
129.6 138.8 158.5 ~ 142 fps    + Vergleich + 📈 Graph
4K 3840x2160
66 66.2 67.4 ~ 67 fps    + Vergleich + 📈 Graph
3840x2160
91.7 91.9 92.8 ~ 92 fps    + Vergleich + 📈 Graph
» In Detailstufe max. mit allen getesteten Notebooks spielbar
Additional Benchmarks
Low Preset 1280x720
397
396
400
min. 1920x1080
109.6 114.2 117.5 ~ 114 fps    + Vergleich + 📈 Graph
mittel 1920x1080
95.8 98.6 101.1 ~ 99 fps    + Vergleich + 📈 Graph
hoch 1920x1080
89 91.3 94.2 ~ 92 fps    + Vergleich + 📈 Graph
max. 1920x1080
83.4 84.7 87 ~ 85 fps    + Vergleich + 📈 Graph
QHD 2560x1440
52.6 54.2 54.4 ~ 54 fps    + Vergleich + 📈 Graph
4K 3840x2160
25.3 25.4 25.7 ~ 25 fps    + Vergleich + 📈 Graph
» In Detailstufe max. mit allen getesteten Notebooks spielbar
Additional Benchmarks
Low Preset 1280x720
162.1
158.9
157.8
Epic Preset + Ray Tracing 1920x1080
66.9
65.5
59.8
min. 1920x1080
289 321 343 ~ 318 fps    + Vergleich + 📈 Graph
mittel 1920x1080
263 314 316 ~ 298 fps    + Vergleich + 📈 Graph
hoch 1920x1080
224 225 228 ~ 226 fps    + Vergleich + 📈 Graph
max. 1920x1080
160.2 162.5 165.9 ~ 163 fps    + Vergleich + 📈 Graph
QHD 2560x1440
104.1 110.5 110.7 ~ 108 fps    + Vergleich + 📈 Graph
4K 3840x2160
54.5 55.2 56.9 ~ 56 fps    + Vergleich + 📈 Graph
» In Detailstufe max. mit allen getesteten Notebooks spielbar
Additional Benchmarks
Low Preset Low TAA 1280x720
310
346
332
min. 1920x1080
126.1 143.8 145.4 ~ 138 fps    + Vergleich + 📈 Graph
mittel 1920x1080
102.1 116.1 118.6 ~ 112 fps    + Vergleich + 📈 Graph
hoch 1920x1080
89.6 101.4 102.7 ~ 98 fps    + Vergleich + 📈 Graph
max. 1920x1080
74.6 76.6 87 ~ 79 fps    + Vergleich + 📈 Graph
QHD 2560x1440
46.5 49.5 49.5 ~ 49 fps    + Vergleich + 📈 Graph
4K 3840x2160
19.6 21.1 23.7 ~ 21 fps    + Vergleich + 📈 Graph
3840x2160
36.5 38.4 39.1 ~ 38 fps    + Vergleich + 📈 Graph
» In Detailstufe max. mit allen getesteten Notebooks spielbar
Additional Benchmarks
Low Preset 1280x720
171.1
197.8
197.1
min. 1920x1080
204 207 207 ~ 206 fps    + Vergleich + 📈 Graph
mittel 1920x1080
135.7 146.3 147.8 ~ 143 fps    + Vergleich + 📈 Graph
hoch 1920x1080
132.8 135.6 150.4 ~ 140 fps    + Vergleich + 📈 Graph
max. 1920x1080
96.4 97.5 98.6 ~ 98 fps    + Vergleich + 📈 Graph
QHD 2560x1440
69.1 69.1 69.4 ~ 69 fps    + Vergleich + 📈 Graph
4K 3840x2160
36.4 37.1 37.9 ~ 37 fps    + Vergleich + 📈 Graph
» In Detailstufe max. mit allen getesteten Notebooks spielbar
Additional Benchmarks
Prioritize Performance Preset 1280x720
288
281
283
min. 1920x1080
288 290.1 293.5 ~ 291 fps    + Vergleich
mittel 1920x1080
242.1 243.8 253 ~ 246 fps    + Vergleich
hoch 1920x1080
178 180.6 183.4 ~ 181 fps    + Vergleich
max. 1920x1080
177 179.6 181.3 ~ 179 fps    + Vergleich
QHD 2560x1440
129.3 131.5 133.6 ~ 131 fps    + Vergleich
4K 3840x2160
56.7 72.3 72.7 ~ 67 fps    + Vergleich
» In Detailstufe max. mit allen getesteten Notebooks spielbar
Additional Benchmarks
Minimum Settings 1280x720
417.7
390.7
437.9
min. 1920x1080
118.1 120.4 139.2 ~ 126 fps    + Vergleich + 📈 Graph
mittel 1920x1080
107 109.9 120.5 ~ 112 fps    + Vergleich + 📈 Graph
hoch 1920x1080
103 105.6 115.4 ~ 108 fps    + Vergleich + 📈 Graph
max. 1920x1080
102.3 103.1 114.5 ~ 107 fps    + Vergleich + 📈 Graph
QHD 2560x1440
79 81.9 86.3 ~ 82 fps    + Vergleich + 📈 Graph
4K 3840x2160
48.8 49.6 51.1 ~ 50 fps    + Vergleich + 📈 Graph
» In Detailstufe max. mit allen getesteten Notebooks spielbar
Additional Benchmarks
Ultra Low Preset 1280x720
122
123.4
148.1
min. 1920x1080
259 264 264 ~ 262 fps    + Vergleich + 📈 Graph
mittel 1920x1080
200 202 202 ~ 201 fps    + Vergleich + 📈 Graph
hoch 1920x1080
116 117.3 117.4 ~ 117 fps    + Vergleich + 📈 Graph
max. 1920x1080
92.4 92.5 93.7 ~ 93 fps    + Vergleich + 📈 Graph
QHD 2560x1440
68 68.8 69.5 ~ 69 fps    + Vergleich + 📈 Graph
4K 3840x2160
38.1 38.4 38.9 ~ 38 fps    + Vergleich + 📈 Graph
» In Detailstufe max. mit allen getesteten Notebooks spielbar
Additional Benchmarks
Low Preset 1280x720
337
345
354
Returnal

Returnal

2023
min. 1920x1080
133 135 136 ~ 135 fps    + Vergleich
mittel 1920x1080
128 128 129 ~ 128 fps    + Vergleich
hoch 1920x1080
115 116 116 ~ 116 fps    + Vergleich
max. 1920x1080
98 100 101 ~ 100 fps    + Vergleich
QHD 2560x1440
72 73 73 ~ 73 fps    + Vergleich
4K 3840x2160
40 41 41 ~ 41 fps    + Vergleich
» In Detailstufe max. mit allen getesteten Notebooks spielbar
Additional Benchmarks
Low Preset 1280x720
171
137
165
Epic Preset + Epic Ray-Tracing 1920x1080
84
82
84
Epic Preset + Epic Ray-Tracing 3840x2160
32
28
32
min. 1920x1080
162.8 168.2 177.5 ~ 170 fps    + Vergleich + 📈 Graph
mittel 1920x1080
133.9 135.1 136.4 ~ 135 fps    + Vergleich + 📈 Graph
hoch 1920x1080
104.7 105.7 108 ~ 106 fps    + Vergleich + 📈 Graph
max. 1920x1080
79.6 82.8 85 ~ 82 fps    + Vergleich + 📈 Graph
QHD 2560x1440
54.7 56.9 57.1 ~ 56 fps    + Vergleich + 📈 Graph
4K 3840x2160
30.2 30.5 30.8 ~ 31 fps    + Vergleich + 📈 Graph
» In Detailstufe max. mit allen getesteten Notebooks spielbar
Additional Benchmarks
Low Preset Low TAA 1280x720
185.3
176.7
182.2
Ultra Preset + Full Ray Tracing High TAA 1920x1080
55.8
51.5
54.4
Ultra Preset + Full Ray Tracing High TAA 3840x2160
20.7
20.2
20
min. 1920x1080
121.7 126.6 128.5 ~ 126 fps    + Vergleich + 📈 Graph
mittel 1920x1080
115.6 122.9 123.5 ~ 121 fps    + Vergleich + 📈 Graph
hoch 1920x1080
99.7 105.9 106.2 ~ 104 fps    + Vergleich + 📈 Graph
max. 1920x1080
98 105.4 105.5 ~ 103 fps    + Vergleich + 📈 Graph
QHD 2560x1440
60.9 64.8 65.9 ~ 64 fps    + Vergleich + 📈 Graph
4K 3840x2160
32 32.2 ~ 32 fps    + Vergleich + 📈 Graph
» In Detailstufe max. mit allen getesteten Notebooks spielbar
Additional Benchmarks
Low Preset TAA 1280x720
193.7
198.2
183.8
min. 1920x1080
272.9 276 278 ~ 276 fps    + Vergleich + 📈 Graph
mittel 1920x1080
226 227.2 231 ~ 228 fps    + Vergleich + 📈 Graph
hoch 1920x1080
187.3 188.1 192.3 ~ 189 fps    + Vergleich + 📈 Graph
max. 1920x1080
150.9 151.8 157.2 ~ 153 fps    + Vergleich + 📈 Graph
QHD 2560x1440
98.9 99.8 102 ~ 100 fps    + Vergleich + 📈 Graph
4K 3840x2160
52.4 52.6 53.4 ~ 53 fps    + Vergleich + 📈 Graph
» In Detailstufe max. mit allen getesteten Notebooks spielbar
Additional Benchmarks
Low Preset / Off 1280x720
319
324
295.6
RT Ultra Preset / On FXAA 1920x1080
43.1
39.7
39.3
min. 1920x1080
335 338 346 ~ 340 fps    + Vergleich + 📈 Graph
mittel 1920x1080
220 220 225 ~ 222 fps    + Vergleich + 📈 Graph
hoch 1920x1080
160.9 164.3 167.3 ~ 164 fps    + Vergleich + 📈 Graph
max. 1920x1080
132.1 139 165.4 ~ 146 fps    + Vergleich + 📈 Graph
QHD 2560x1440
77.1 77.4 78.3 ~ 78 fps    + Vergleich + 📈 Graph
4K 3840x2160
32.1 32.2 32.3 ~ 32 fps    + Vergleich + 📈 Graph
» In Detailstufe max. mit allen getesteten Notebooks spielbar
Additional Benchmarks
Low Preset 1280x720
415
401
400
min. 1920x1080
180.6 230.2 232.1 ~ 214 fps    + Vergleich
mittel 1920x1080
175.2 175.4 178 ~ 176 fps    + Vergleich
hoch 1920x1080
165.4 165.5 167.8 ~ 166 fps    + Vergleich
max. 1920x1080
101.8 102.6 103.6 ~ 103 fps    + Vergleich
QHD 2560x1440
78 79.5 79.5 ~ 79 fps    + Vergleich
4K 3840x2160
47.7 48.1 48.8 ~ 48 fps    + Vergleich
» In Detailstufe max. mit allen getesteten Notebooks spielbar
Additional Benchmarks
Low Preset (without FSR Upscaling) 1280x720
247.9
250.4
246.4
Ultra Preset (without FSR Upscaling) + Full Ray-Tracing 1920x1080
66.8
85.8
90.7
min. 1920x1080
154.4 158.3 160.1 ~ 158 fps    + Vergleich + 📈 Graph
mittel 1920x1080
148.4 149.1 150.3 ~ 149 fps    + Vergleich + 📈 Graph
hoch 1920x1080
141.9 142.9 144.9 ~ 143 fps    + Vergleich + 📈 Graph
max. 1920x1080
129.8 130.8 131.7 ~ 131 fps    + Vergleich + 📈 Graph
QHD 2560x1440
96.6 97.9 99.2 ~ 98 fps    + Vergleich + 📈 Graph
4K 3840x2160
49.9 54.1 54.8 ~ 53 fps    + Vergleich + 📈 Graph
» In Detailstufe max. mit allen getesteten Notebooks spielbar
Additional Benchmarks
Very Low Preset 1280x720
205
197.2
203
Very High Preset + Ray-Tracing TAA 1920x0180
69
68
70.3
min. 1920x1080
112.2 113.1 113.6 ~ 113 fps    + Vergleich + 📈 Graph
mittel 1920x1080
109 109.8 110.3 ~ 110 fps    + Vergleich + 📈 Graph
hoch 1920x1080
101.6 102.7 102.9 ~ 102 fps    + Vergleich + 📈 Graph
max. 1920x1080
97.9 98.5 99.4 ~ 99 fps    + Vergleich + 📈 Graph
QHD 2560x1440
70.6 70.7 71.5 ~ 71 fps    + Vergleich + 📈 Graph
4K 3840x2160
29.4 29.9 30.3 ~ 30 fps    + Vergleich + 📈 Graph
» In Detailstufe max. mit allen getesteten Notebooks spielbar
Additional Benchmarks
Low Preset 1280x720
140
136.6
132.9
min. 1920x1080
151.4 151.5 153.7 ~ 152 fps    + Vergleich + 📈 Graph
mittel 1920x1080
117 117.4 120.1 ~ 118 fps    + Vergleich + 📈 Graph
hoch 1920x1080
87.6 88.3 88.8 ~ 88 fps    + Vergleich + 📈 Graph
max. 1920x1080
65 66.8 67.4 ~ 66 fps    + Vergleich + 📈 Graph
QHD 2560x1440
46.7 46.9 47.4 ~ 47 fps    + Vergleich + 📈 Graph
4K 3840x2160
24.8 25 25.2 ~ 25 fps    + Vergleich + 📈 Graph
3840x2160
50.5 50.8 50.8 ~ 51 fps    + Vergleich + 📈 Graph
» In Detailstufe max. mit allen getesteten Notebooks spielbar
Additional Benchmarks
Low Preset 1280x720
193.4
188.7
190.3
Ultra DLSS Quality 3840x2160
37.9
37.4
37.8
min. 1920x1080
224 225 228 ~ 226 fps    + Vergleich + 📈 Graph
mittel 1920x1080
164.5 164.6 167.4 ~ 166 fps    + Vergleich + 📈 Graph
hoch 1920x1080
134 135.2 137.2 ~ 135 fps    + Vergleich + 📈 Graph
max. 1920x1080
104.8 106 108.8 ~ 107 fps    + Vergleich + 📈 Graph
QHD 2560x1440
70.8 71.7 72.3 ~ 72 fps    + Vergleich + 📈 Graph
4K 3840x2160
22.4 22.4 23 ~ 23 fps    + Vergleich + 📈 Graph
» In Detailstufe max. mit allen getesteten Notebooks spielbar
Additional Benchmarks
Low Preset 1280x720
305
300
300
F1 22

F1 22

2022
min. 1920x1080
344 355 358 ~ 352 fps    + Vergleich
mittel 1920x1080
340 341 346 ~ 342 fps    + Vergleich
hoch 1920x1080
257 258 258 ~ 258 fps    + Vergleich
max. 1920x1080
87.8 89.2 89.6 ~ 89 fps    + Vergleich
QHD 2560x1440
55.4 56.1 56.5 ~ 56 fps    + Vergleich
4K 3840x2160
27.3 27.8 28.2 ~ 28 fps    + Vergleich
» In Detailstufe max. mit allen getesteten Notebooks spielbar
Additional Benchmarks
Ultra Low Preset 16xAF TAA 1280x720
521
492
572
min. 1920x1080
233 234 235 ~ 234 fps    + Vergleich + 📈 Graph
mittel 1920x1080
219 222 224 ~ 222 fps    + Vergleich + 📈 Graph
hoch 1920x1080
217 219 221 ~ 219 fps    + Vergleich + 📈 Graph
max. 1920x1080
207 213 217 ~ 212 fps    + Vergleich + 📈 Graph
QHD 2560x1440
119.9 126.3 128.8 ~ 125 fps    + Vergleich + 📈 Graph
4K 3840x2160
57.6 58.1 58.3 ~ 58 fps    + Vergleich + 📈 Graph
» In Detailstufe max. mit allen getesteten Notebooks spielbar
Additional Benchmarks
Lowest Settings 1280x720
291
295
293
Highest Settings + Maximum Ray Tracing 1920x1080
90.4
88
88.9
min. 1920x1080
297 300 303 ~ 300 fps    + Vergleich
mittel 1920x1080
233 234 237 ~ 235 fps    + Vergleich
hoch 1920x1080
153 154 155.3 ~ 154 fps    + Vergleich
max. 1920x1080
117.6 118.7 119.7 ~ 119 fps    + Vergleich
QHD 2560x1440
80.4 80.8 81.1 ~ 81 fps    + Vergleich
4K 3840x2160
36.7 36.9 37.2 ~ 37 fps    + Vergleich
» In Detailstufe max. mit allen getesteten Notebooks spielbar
Additional Benchmarks
Lowest Preset (DX12) 1280x720
470
472
488
min. 1920x1080
172 175 176.6 ~ 175 fps    + Vergleich
mittel 1920x1080
135.7 137 137.6 ~ 137 fps    + Vergleich
hoch 1920x1080
112.8 113 115.7 ~ 114 fps    + Vergleich
max. 1920x1080
100.3 100.5 102 ~ 101 fps    + Vergleich
QHD 2560x1440
59.7 59.9 60.2 ~ 60 fps    + Vergleich
4K 3840x2160
24.8 25.2 25.3 ~ 25 fps    + Vergleich
» In Detailstufe max. mit allen getesteten Notebooks spielbar
Additional Benchmarks
Low Preset 1280x720
222.3
231.2
243
Ray Tracing Ultra Preset (DLSS off) 1920x1080
49.6
49.1
48
Ray Tracing Ultra Preset (DLSS off) 3840x2160
2.4
3.2
2.2
min. 1920x1080
243 246 255 ~ 248 fps    + Vergleich
mittel 1920x1080
217 218 223 ~ 219 fps    + Vergleich
hoch 1920x1080
194.6 195.4 197.4 ~ 196 fps    + Vergleich
max. 1920x1080
162.8 163.8 164.2 ~ 164 fps    + Vergleich
QHD 2560x1440
134.8 136.5 137.3 ~ 136 fps    + Vergleich
4K 3840x2160
83.6 84.5 84.7 ~ 84 fps    + Vergleich
» In Detailstufe max. mit allen getesteten Notebooks spielbar
Additional Benchmarks
Low Preset 1280x720
243
246
257
min. 1920x1080
174.5 178.3 178.6 ~ 177 fps    + Vergleich + 📈 Graph
mittel 1920x1080
143.7 145.7 146.2 ~ 145 fps    + Vergleich + 📈 Graph
hoch 1920x1080
114.3 116.4 116.6 ~ 116 fps    + Vergleich + 📈 Graph
max. 1920x1080
85 85.1 85.2 ~ 85 fps    + Vergleich + 📈 Graph
QHD 2560x1440
69.7 69.9 70.1 ~ 70 fps    + Vergleich + 📈 Graph
4K 3840x2160
46.1 46.1 46.6 ~ 46 fps    + Vergleich + 📈 Graph
» In Detailstufe max. mit allen getesteten Notebooks spielbar
Additional Benchmarks
Low Preset 1280x720
256
251
236
min. 1280x720
201 201 225 ~ 209 fps    + Vergleich
mittel 1920x1080
194 196 197 ~ 196 fps    + Vergleich
hoch 1920x1080
194 195 196 ~ 195 fps    + Vergleich
max. 1920x1080
186 187 188 ~ 187 fps    + Vergleich
QHD 2560x1440
127 128 129 ~ 128 fps    + Vergleich
4K 3840x2160
66 67 67 ~ 67 fps    + Vergleich
» In Detailstufe max. mit allen getesteten Notebooks spielbar
Additional Benchmarks
Low Preset 1920x1080
216
224
201
Ultra Preset + Ultra Ray-Tracing 1920x1080
100
99
100
Far Cry 6

Far Cry 6

2021
min. 1280x720
213 233 238 ~ 228 fps    + Vergleich + 📈 Graph
mittel 1920x1080
180.1 189 190.4 ~ 187 fps    + Vergleich + 📈 Graph
hoch 1920x1080
157 163 163.2 ~ 161 fps    + Vergleich + 📈 Graph
max. 1920x1080
140.8 144.3 145 ~ 143 fps    + Vergleich + 📈 Graph
QHD 2560x1440
101.5 102 102.5 ~ 102 fps    + Vergleich + 📈 Graph
4K 3840x2160
2.7 20.9 21.4 ~ 15 fps    + Vergleich + 📈 Graph
» In Detailstufe max. mit allen getesteten Notebooks spielbar
Additional Benchmarks
Low Graphics Quality 1920x1080
216
201
Ultra Graphics Quality + HD Textures + DXR TAA 1920x1080
61.9
88
F1 2021

F1 2021

2021
min. 1280x720
595 671 726 ~ 664 fps    + Vergleich
mittel 1920x1080
460 463 471 ~ 465 fps    + Vergleich
hoch 1920x1080
348 355 359 ~ 354 fps    + Vergleich
max. 1920x1080
175.8 177.5 179.8 ~ 178 fps    + Vergleich
QHD 2560x1440
126.2 127.2 128.9 ~ 127 fps    + Vergleich
4K 3840x2160
66.5 67.2 68.1 ~ 67 fps    + Vergleich
» In Detailstufe max. mit allen getesteten Notebooks spielbar
F1 2020

F1 2020

2020
min. 1280x720
505 548 609 ~ 554 fps    + Vergleich
mittel 1920x1080
399 426 426 ~ 417 fps    + Vergleich
hoch 1920x1080
334 337 342 ~ 338 fps    + Vergleich
max. 1920x1080
229 230 232 ~ 230 fps    + Vergleich
QHD 2560x1440
173.8 174.3 177.8 ~ 175 fps    + Vergleich
4K 3840x2160
95.4 95.7 97 ~ 96 fps    + Vergleich
» In Detailstufe max. mit allen getesteten Notebooks spielbar
min. 1280x720
240 241 243 ~ 241 fps    + Vergleich
mittel 1920x1080
204 206 209 ~ 206 fps    + Vergleich
hoch 1920x1080
156 156.8 157.3 ~ 157 fps    + Vergleich
max. 1920x1080
121.5 121.8 123.5 ~ 122 fps    + Vergleich
QHD 2560x1440
83.9 84.2 85.2 ~ 84 fps    + Vergleich
4K 3840x2160
43.1 43.7 43.7 ~ 44 fps    + Vergleich
» In Detailstufe max. mit allen getesteten Notebooks spielbar
Additional Benchmarks
Very Low Overall Quality (DX11) 1920x1080
243
237
240
Control

Control

2019
min. 1280x720
234 239 239.9 ~ 238 fps    + Vergleich + 📈 Graph
mittel 1920x1080
159.8 160.8 162.4 ~ 161 fps    + Vergleich + 📈 Graph
hoch 1920x1080
115.7 118.3 120.2 ~ 118 fps    + Vergleich + 📈 Graph
QHD 2560x1440
69.2 75.2 75.3 ~ 73 fps    + Vergleich + 📈 Graph
4K 3840x2160
34.3 35.6 37.3 ~ 36 fps    + Vergleich + 📈 Graph
3840x2160
42.8 43.5 44.5 ~ 44 fps    + Vergleich + 📈 Graph
» In Detailstufe hoch mit allen getesteten Notebooks spielbar
Additional Benchmarks
High Quality Preset & High Ray Tracing Preset (DX12) 1920x1080
73.6
72.5
73
High Quality Preset & High Ray Tracing Preset (DX12) 3840x2160
17.8
16.9
16.6
min. 1280x720
197 198 199 ~ 198 fps    + Vergleich + 📈 Graph
mittel 1920x1080
173 173 173 ~ 173 fps    + Vergleich + 📈 Graph
hoch 1920x1080
166 166 166 ~ 166 fps    + Vergleich + 📈 Graph
max. 1920x1080
146 147 148 ~ 147 fps    + Vergleich + 📈 Graph
QHD 2560x1440
127 127 127 ~ 127 fps    + Vergleich + 📈 Graph
4K 3840x2160
69 70 70 ~ 70 fps    + Vergleich + 📈 Graph
» In Detailstufe max. mit allen getesteten Notebooks spielbar
min. 1280x720
305 308 311 ~ 308 fps    + Vergleich
mittel 1920x1080
170.6 171.3 173.6 ~ 172 fps    + Vergleich
hoch 1920x1080
127.9 129 130.8 ~ 129 fps    + Vergleich
max. 1920x1080
100.6 100.8 101.8 ~ 101 fps    + Vergleich
QHD 2560x1440
78.9 79.3 80.1 ~ 79 fps    + Vergleich
4K 3840x2160
48.4 48.6 49.3 ~ 49 fps    + Vergleich
» In Detailstufe max. mit allen getesteten Notebooks spielbar
Additional Benchmarks
Ultra Quality DXR 16xAF 1920x1080
86.1
84.6
84.8
min. 1280x720
339 342 342 ~ 341 fps    + Vergleich
mittel 1920x1080
221 222 225 ~ 223 fps    + Vergleich
hoch 1920x1080
202 203 204 ~ 203 fps    + Vergleich
max. 1920x1080
181.6 182.5 184 ~ 183 fps    + Vergleich
QHD 2560x1440
119.3 120.5 121.2 ~ 120 fps    + Vergleich
4K 3840x2160
58.1 58.6 58.7 ~ 58 fps    + Vergleich
» In Detailstufe max. mit allen getesteten Notebooks spielbar
Additional Benchmarks
Lowest Preset 1920x1080
325
317
313
Strange Brigade

Strange Brigade

2018
min. 1280x720
639 697 733 ~ 690 fps    + Vergleich
mittel 1920x1080
346 350 351 ~ 349 fps    + Vergleich
hoch 1920x1080
271 275 276 ~ 274 fps    + Vergleich
max. 1920x1080
236 237 239 ~ 237 fps    + Vergleich
QHD 2560x1440
152.7 154 154.3 ~ 154 fps    + Vergleich
4K 3840x2160
79.9 80.1 80.5 ~ 80 fps    + Vergleich
» In Detailstufe max. mit allen getesteten Notebooks spielbar
Far Cry 5

Far Cry 5

2018
min. 1280x720
236 238 246 ~ 240 fps    + Vergleich + 📈 Graph
mittel 1920x1080
200 201 205 ~ 202 fps    + Vergleich + 📈 Graph
hoch 1920x1080
191 193 195 ~ 193 fps    + Vergleich + 📈 Graph
max. 1920x1080
180 180 183 ~ 181 fps    + Vergleich + 📈 Graph
QHD 2560x1440
134 134 136 ~ 135 fps    + Vergleich + 📈 Graph
4K 3840x2160
67 67 68 ~ 67 fps    + Vergleich + 📈 Graph
» In Detailstufe max. mit allen getesteten Notebooks spielbar
Additional Benchmarks
Low Preset TAA 1920x1080
226
229
222
min. 1280x720
218 219 222 ~ 220 fps    + Vergleich
mittel 1920x1080
195.6 196.2 197.6 ~ 196 fps    + Vergleich
hoch 1920x1080
148.8 149.1 149.7 ~ 149 fps    + Vergleich
4K 3840x2160
125 126.2 127.4 ~ 126 fps    + Vergleich
» In Detailstufe hoch mit allen getesteten Notebooks spielbar
min. 1280x720
235 235 236 ~ 235 fps    + Vergleich
mittel 1920x1080
190.3 193.5 193.6 ~ 192 fps    + Vergleich
hoch 1920x1080
130.6 131.9 133.8 ~ 132 fps    + Vergleich
QHD 2560x1440
95.5 95.9 96.7 ~ 96 fps    + Vergleich
4K 3840x2160
51.5 52.4 52.7 ~ 52 fps    + Vergleich
» In Detailstufe hoch mit allen getesteten Notebooks spielbar
min. 1280x720
297.3 304 307 ~ 303 fps    + Vergleich
mittel 1366x768
262 266 267 ~ 265 fps    + Vergleich
hoch 1920x1080
252 254 257.4 ~ 254 fps    + Vergleich
max. 1920x1080
228.4 235 236 ~ 233 fps    + Vergleich
4K 3840x2160
165.5 165.8 167.8 ~ 166 fps    + Vergleich
» In Detailstufe max. mit allen getesteten Notebooks spielbar
min. 1024x768
691 706.5 706.6 ~ 701 fps    + Vergleich
mittel 1366x768
470.7 474.4 475.7 ~ 474 fps    + Vergleich
hoch 1920x1080
275.9 276.9 277.6 ~ 277 fps    + Vergleich
max. 1920x1080
136.2 140.5 140.6 ~ 139 fps    + Vergleich
QHD 2560x1440
100.7  fps    + Vergleich
4K 3840x2160
78.5 79.1 80.4 ~ 79 fps    + Vergleich
» In Detailstufe max. mit allen getesteten Notebooks spielbar
Additional Benchmarks
Ultra Graphics & Postprocessing (HBAO+) 3840x2160
54.3
53.9
54.1
Medium Graphics & Postprocessing 1920x1080
331.4
324.5
331.6
GTA V

GTA V

2015
min. 1024x768
187.8 187.8 188 ~ 188 fps    + Vergleich
mittel 1366x768
187.5 187.8 187.8 ~ 188 fps    + Vergleich
hoch 1920x1080
187.5 187.5 187.5 ~ 188 fps    + Vergleich
max. 1920x1080
141.8 143.1 144.2 ~ 143 fps    + Vergleich
QHD 2560x1440
102.4 103.4 103.4 ~ 103 fps    + Vergleich
4K 3840x2160
102.3 103.2 103.6 ~ 103 fps    + Vergleich
» In Detailstufe max. mit allen getesteten Notebooks spielbar
Additional Benchmarks
Highest Settings possible 16xAF 4xMSAA + FXAA 3840x2160
43.8
43.9
44.4
Normal/Off 4xAF 1920x1080
187.9
188
188
Lowest Settings possible 1920x1080
187.9
188.1
188
min.mittelhochmax.QHD4K
Armored Core 6119.7119.4119.5119.497.551.2
Immortals of Aveum8271.658.740.422.1
Atlas Fallen193.5188.4177.3152105.956.1
Baldur's Gate 3153.6124.2103.8100.667.435.2
Ratchet & Clank Rift Apart101.591.173.368.363.756.6
F1 23383345247825124
Diablo 431727725122714267
Star Wars Jedi Survivor1149992855425
Dead Island 231829822616310856
The Last of Us13811298794921
Resident Evil 4 Remake206143140986937
Company of Heroes 329124618117913167
Sons of the Forest1261121081078250
Atomic Heart262201117936938
Returnal1351281161007341
Hogwarts Legacy170135106825631
Dead Space Remake1261211041036432
The Witcher 3 v4.0027622818915310053
High On Life3402221641467832
The Callisto Protocol2141761661037948
Spider-Man Miles Morales1581491431319853
Uncharted Legacy of Thieves Collection113110102997130
A Plague Tale Requiem15211888664725
The Quarry2261661351077223
F1 22352342258895628
Ghostwire Tokyo23422221921212558
Tiny Tina's Wonderlands3002351541198137
Cyberpunk 2077 1.61751371141016025
GRID Legends24821919616413684
God of War177145116857046
Guardians of the Galaxy20919619518712867
Far Cry 622818716114310215
F1 202166446535417812767
F1 202055441733823017596
Borderlands 32412061571228444
Control2381611187336
Far Cry New Dawn19817316614712770
Metro Exodus3081721291017949
Shadow of the Tomb Raider34122320318312058
Strange Brigade69034927423715480
Far Cry 524020219318113567
X-Plane 11.11220196149126
Final Fantasy XV Benchmark2351921329652
Dota 2 Reborn303265254233166
The Witcher 3701474277139100.779
GTA V188188188143103103
< 30 fps
< 60 fps
< 120 fps
≥ 120 fps


5
41


7
38


16
30

1
21
21

7
26
11
9
24
11
2

Eine Liste mit weiteren Spielen und allen Grafikkarten finden Sie auf unserer Seite: Welches Spiel ist mit welcher Grafikkarte spielbar?

Ein oder mehrere Geräte zum Vergleich auswählen

In der folgenden Liste können sie Geräte suchen und für einen Vergleich auswählen.

Liste einschränken:

show all (including archived), 2024, 2023
v1.26
log 25. 23:18:36

#0 no ids found in url (should be separated by "_") +0s ... 0s

#1 not redirecting to Ajax server +0s ... 0s

#2 did not recreate cache, as it is less than 5 days old! Created at Thu, 25 Apr 2024 05:40:10 +0200 +0.001s ... 0.001s

#3 composed specs +0.039s ... 0.04s

#4 did output specs +0s ... 0.04s

#5 start showIntegratedCPUs +0s ... 0.04s

#6 getting avg benchmarks for device 11592 +0.027s ... 0.067s

#7 got single benchmarks 11592 +0.019s ... 0.087s

#8 got avg benchmarks for devices +0s ... 0.087s

#9 min, max, avg, median took s +0.85s ... 0.936s

#10 before gaming benchmark output +0s ... 0.936s

#11 Got 758 rows for game benchmarks. +0.124s ... 1.06s

#12 composed SQL query for gamebenchmarks +0s ... 1.06s

#13 got data and put it in $dataArray +0.038s ... 1.098s

#14 benchmarks composed for output. +2.432s ... 3.529s

#15 return log +0.048s ... 3.578s

Teilen Sie diesen Artikel, um uns zu unterstützen. Jeder Link hilft!

» Vergleich mobiler Grafikkarten
Liste aller mobiler Grafikkarten mit Kurzinformationen sortiert nach Leistung

» Mobile Grafikkarten - Benchmarkliste
Sortier- und filterbare Benchmark-Liste

» Spieleliste
Welche Spiele laufen mit welcher Grafikkarte

Leistungsklasse 1

Leistungsklasse 2

Leistungsklasse 3

UHD Graphics 750

Leistungsklasse 4

* Geschätzte Position

> Notebook Test, Laptop Test und News > Benchmarks / Technik > Benchmarks / Technik > Vergleich mobiler Grafikkarten > NVIDIA GeForce RTX 4060 Ti 8G Grafikkarte - Benchmarks und Spezifikationen
Autor: Sebastian Bade (Update: 18.06.2023)