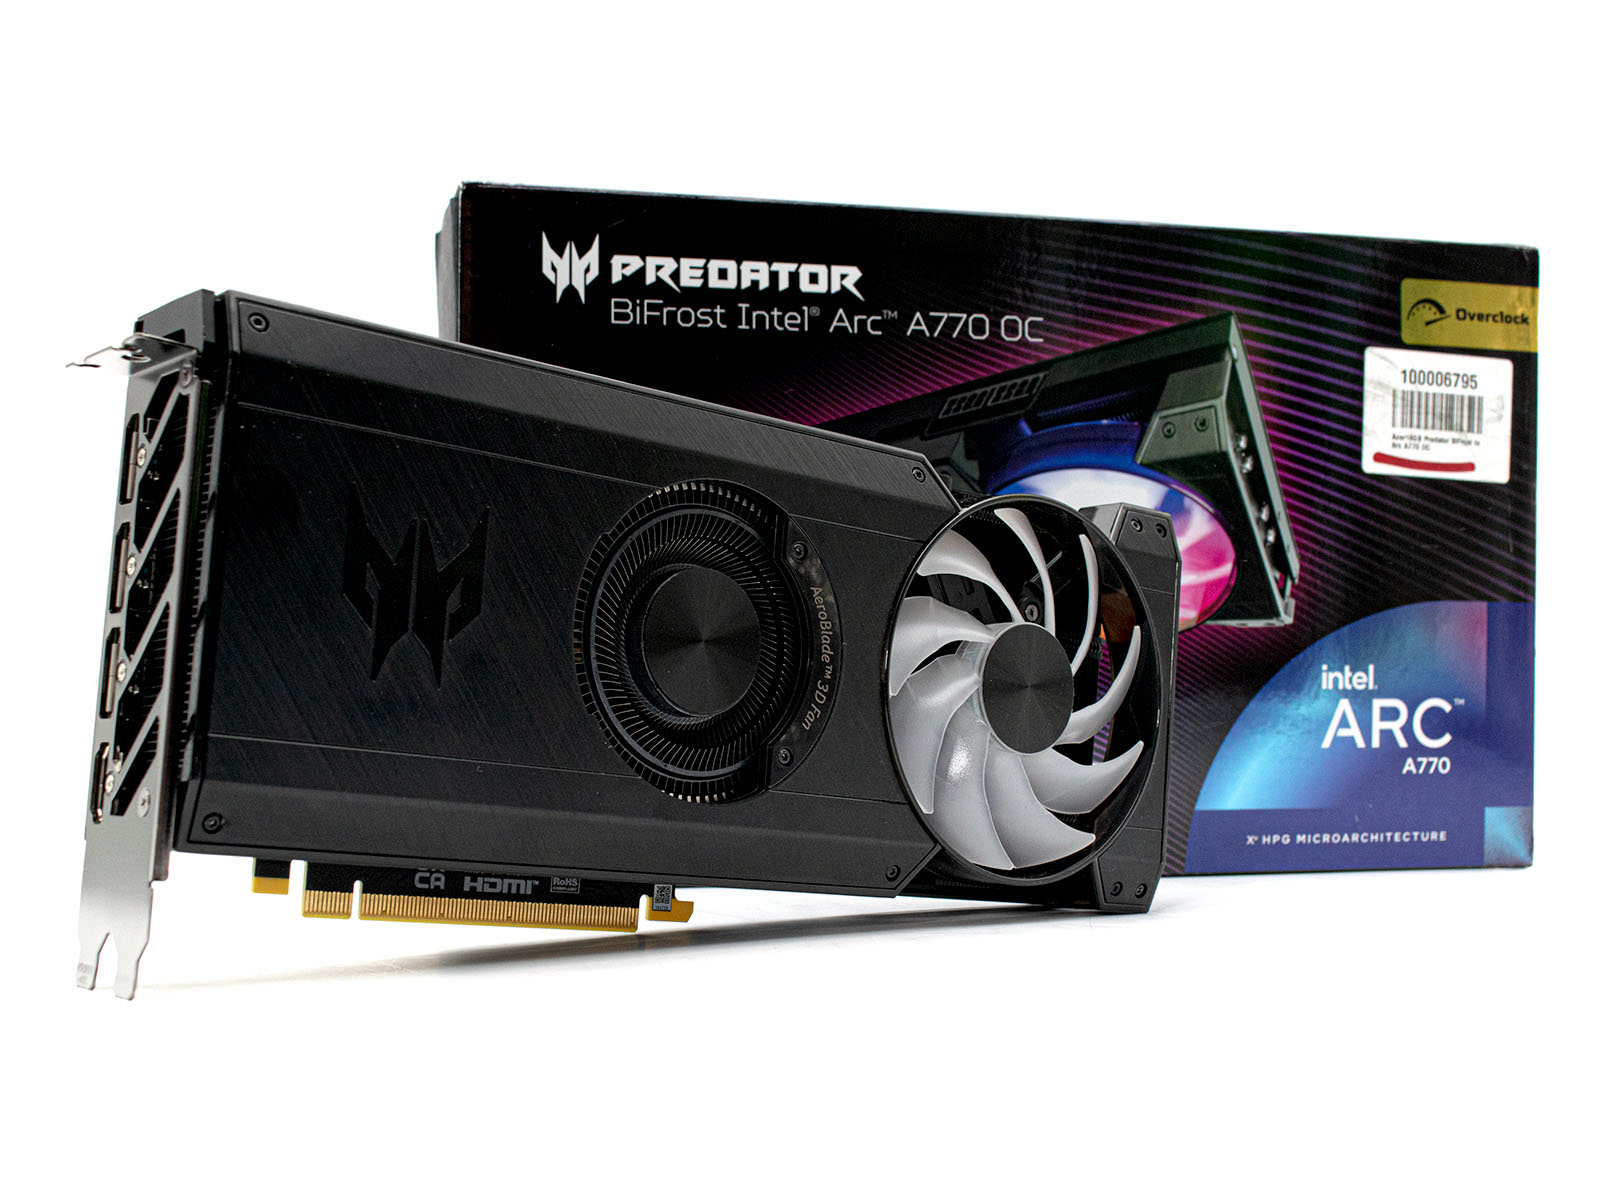
Notebookcheck Logo

Intel Arc A770

Intel Arc A770

Die Intel Arc A770 ist eine Mid-Range-Desktop-GPU und wird im 6 nm Verfahren bei TSMC gefertigt. Der Grafikprozessor verfügt über 4.096 Shadereinheiten, sowie über 8- oder 16 GB GDDR6-VRAM mit einem 256-Bit-Interface (16 Gbps, 512 GB/s).

Features

Als Topmodell auf Basis der Alchemist-Architektur bietet Intel mit der Arc A770 das Topmodell der Serie an. Als komplette Neuentwicklung will Intel mit den Grafikkarten AMD und auch Nvidia unter Druck setzen. Features wie Ray Tracing werden unterstützt und dafür bringt die Intel Arc A770 32 RT-Cores mit. Zudem implementiert Intel noch 512 Tensor Cores, welche wir auch schon bei den aktuellen Grafikkarten von Nvidia vorfinden. Mit der Unterstützung von AV1 ist die Grafikkarte vor allem für Content-Creator interessant. Das hardwareseitige Encodieren und Decodieren mit dem neuen Codec beherrschen aktuell nur die Ada Lovelace Modelle von Nvidia und die RDNA3-GPUs von AMD.

Performance

Die Leistung der Intel Arc A770 ist mit einer Nvidia GeForce RTX 4060 oder einer AMD Radeon RX 7600 vergleichbar. Mit neueren Spielen kommt das Modell aus dem Haus Intel deutlich besser zurecht. Mit aktivierten Raytracing kann sich die Intel Arc A770 sogar vor den beiden Kontrahenten platzieren. Aufgrund der gezeigten Leistung ist die Intel Arc A770 für das 1080p-Gaming im Jahre 2023 bestens geeignet.

Leistungsaufnahme

Die Leistungsaufnahme der Intel Arc A770 wird vom Hersteller mit 225 Watt (TGP) beziffert. Das ist etwas mehr als bei einer Nvidia GeForce RTX 4060 oder der AMD Radeon RX 7600.

Arc Serie

Arc B580 compare 2560 @ 2.67 - 2.67 GHz192 Bit @ 19000 MHz
Arc A770 4096 @ 2.1 - 2.4 GHz256 Bit @ 16000 MHz
Arc A750 compare 3584 @ 2.05 - 2.4 GHz256 Bit @ 16000 MHz
Arc A580 compare 3072 @ 1.7 - 2 GHz256 Bit @ 16000 MHz
A770M compare 4096 @ 1.65 GHz256 Bit @ 16000 MHz
A730M compare 3072 @ 1.1 GHz192 Bit @ 14000 MHz
A570M compare 16 @ 0.9 - 1.3 GHz128 Bit @ 14000 MHz
A550M compare 16 @ 0.9 - 2.01 GHz128 Bit @ 14000 MHz
A530M compare 12 @ 0.9 - 1.3 GHz128 Bit @ 14000 MHz
A370M compare 8 @ 1.55 GHz64 Bit @ 14000 MHz
Arc A380 compare 1024 @ 2 GHz96 Bit @ 15500 MHz
A310 compare 6 @ 2 GHz64 Bit @ 15500 MHz
A350M compare 6 @ 1.15 GHz64 Bit @ 14000 MHz
CodenameDG2-512
ArchitekturXe
Pipelines4096 - unified
TMUs256
ROPs128
Raytracing Cores32
Tensor / AI Cores512
Kerntakt2100 - 2400 (Boost) MHz
Theoretical Performance39.32 TFLOPS FP16, 19.66 TFLOPS FP32
CacheL2: 16 MB
Speichertakt16000 effective = 2000 MHz
Speicherbandbreite256 Bit
SpeichertypGDDR6
Max. Speichergröße16 GB
Shared Memorynein
Memory Bandwidth512 GB/s
APIDirectX 12 Ultimate (12_2), Shader 6.6, OpenGL 4.6, OpenCL 3.0, Vulkan 1.3
Stromverbrauch225 Watt
Transistoren21.7 Billion
Chipgröße 406 mm²
Herstellungsprozess6 nm
PCIe4.0 x16
Displays4 Displays (max.), HDMI 2.1, DisplayPort 2.0
Erscheinungsdatum12.10.2022

Benchmarks

Performance Rating - 3DMark 11 + Fire Strike + Time Spy
11.2 pt (34%)
Suchen: Modell: Max. Alter: Jahre
3DMark - 3DMark Speed Way Score
min: 2452     avg: 2464     median: 2463 (17%)     max: 2477 Points
3DMark - 3DMark Steel Nomad
min: 2540     avg: 2809     median: 2827 (19%)     max: 3041 Points
3DMark - 3DMark Solar Bay
min: 49731     avg: 52443     median: 52443 (24%)     max: 55155 Points
3DMark - 3DMark Fire Strike Standard Score
min: 26251     avg: 28447     median: 28336 (43%)     max: 30755 Points
3DMark - 3DMark Fire Strike Standard Graphics
min: 27035     avg: 29903     median: 30008 (28%)     max: 32666 Points
3DMark - 3DMark Ice Storm Graphics
min: 489026     avg: 564801     median: 597398 (66%)     max: 607978 Points
3DMark - 3DMark Time Spy Score
min: 14047     avg: 14189     median: 14057 (36%)     max: 14463 Points
3DMark - 3DMark Time Spy Graphics
min: 13779     avg: 13849     median: 13815 (28%)     max: 13953 Points
Suchen: Modell: Max. Alter: Jahre
3DMark - 3DMark Ice Storm Unlimited Graphics
min: 628292     avg: 685325     median: 699999 (71%)     max: 727683 Points
3DMark - 3DMark Ice Storm Extreme Graphics
min: 442457     avg: 493853     median: 516087 (60%)     max: 523016 Points
3DMark - 3DMark Cloud Gate Score
min: 69520     avg: 71173     median: 69692 (66%)     max: 74307 Points
3DMark - 3DMark Cloud Gate Graphics
min: 116619     avg: 129692     median: 133291 (33%)     max: 139166 Points
3DMark - 3DMark Night Raid
min: 72422     avg: 73990     median: 72638 (69%)     max: 76909 Points
3DMark - 3DMark Night Raid Graphics Score
min: 127190     avg: 129330     median: 129052 (50%)     max: 131749 Points
3DMark 11 - 3DM11 Performance Score
min: 32346     avg: 35240     median: 35386 (43%)     max: 37987 Points
3DMark 11 - 3DM11 Performance GPU
min: 34499     avg: 38352     median: 39253 (30%)     max: 41303 Points
Suchen: Modell: Max. Alter: Jahre
3DMark Vantage
3DM Vant. Perf. total +
3DMark Vantage - 3DM Vant. Perf. total
min: 103295     avg: 106563     median: 106563 (31%)     max: 109831 Points
3DM Vant. Perf. GPU no PhysX +
3DMark Vantage - 3DM Vant. Perf. GPU no PhysX
min: 102514     avg: 105977     median: 105976 (58%)     max: 109439 Points
Suchen: Modell: Max. Alter: Jahre
3DMark 05 - 3DMark 05 - Standard
min: 64907     avg: 68054     median: 68053.5 (75%)     max: 71200 Points
Suchen: Modell: Max. Alter: Jahre
3DMark 06 3DMark 06 - Standard 1280x1024 +
3DMark 06
min: 58321     avg: 61381     median: 61380.5 (80%)     max: 64440 Points
Unigine Valley 1.0 - Unigine Valley 1.0 DX
min: 83     avg: 91.9     median: 96.2 (29%)     max: 96.5 fps
SPECviewperf 12
specvp12 sw-03 +
SPECviewperf 12 - specvp12 sw-03
min: 72.2     avg: 72.8     median: 72.8 (18%)     max: 73.4 fps
specvp12 snx-02 +
SPECviewperf 12 - specvp12 snx-02
min: 1.42     avg: 1.5     median: 1.5 (0%)     max: 1.67 fps
specvp12 showcase-01 +
SPECviewperf 12 - specvp12 showcase-01
min: 119     avg: 130     median: 130 (23%)     max: 141 fps
specvp12 mediacal-01 +
SPECviewperf 12 - specvp12 mediacal-01
min: 46.7     avg: 47.3     median: 47.3 (12%)     max: 47.8 fps
specvp12 maya-04 +
SPECviewperf 12 - specvp12 maya-04
min: 172     avg: 177.5     median: 177.5 (48%)     max: 183 fps
specvp12 energy-01 +
SPECviewperf 12 - specvp12 energy-01
min: 2.24     avg: 2.3     median: 2.3 (2%)     max: 2.44 fps
specvp12 creo-01 +
SPECviewperf 12 - specvp12 creo-01
min: 45.3     avg: 45.6     median: 45.6 (18%)     max: 45.8 fps
specvp12 catia-04 +
SPECviewperf 12 - specvp12 catia-04
min: 174     avg: 174.5     median: 174.5 (29%)     max: 175 fps
specvp12 3dsmax-05 +
SPECviewperf 12 - specvp12 3dsmax-05
min: 179     avg: 183     median: 183 (28%)     max: 187 fps
SPECviewperf 13 specvp13 sw-04 +
SPECviewperf 13 - specvp13 sw-04
min: 77.5     avg: 78.4     median: 78.4 (21%)     max: 79.2 fps
specvp13 snx-03 +
SPECviewperf 13 - specvp13 snx-03
min: 2.55     avg: 2.8     median: 2.8 (0%)     max: 3.06 fps
specvp13 showcase-02 +
SPECviewperf 13 - specvp13 showcase-02
min: 119     avg: 129.5     median: 129.5 (22%)     max: 140 fps
specvp13 medical-02 +
SPECviewperf 13 - specvp13 medical-02
min: 80.8     avg: 88.2     median: 88.2 (15%)     max: 95.6 fps
specvp13 maya-05 +
SPECviewperf 13 - specvp13 maya-05
min: 319     avg: 324     median: 324 (37%)     max: 329 fps
specvp13 energy-02 +
SPECviewperf 13 - specvp13 energy-02
min: 22.3     avg: 22.4     median: 22.4 (7%)     max: 22.5 fps
specvp13 creo-02 +
SPECviewperf 13 - specvp13 creo-02
min: 90     avg: 90.8     median: 90.8 (13%)     max: 91.6 fps
specvp13 catia-05 +
SPECviewperf 13 - specvp13 catia-05
min: 258     avg: 259     median: 259 (29%)     max: 260 fps
specvp13 3dsmax-06 +
SPECviewperf 13 - specvp13 3dsmax-06
min: 179     avg: 181     median: 181 (28%)     max: 183 fps
SPECviewperf 2020 specvp2020 snx-04 1080p +
SPECviewperf 2020 - specvp2020 snx-04 1080p
3 fps (0%)
specvp2020 medical-03 1080p +
SPECviewperf 2020 - specvp2020 medical-03 1080p
48.5 fps (13%)
specvp2020 maya-06 1080p +
SPECviewperf 2020 - specvp2020 maya-06 1080p
358 fps (38%)
specvp2020 energy-03 1080p +
SPECviewperf 2020 - specvp2020 energy-03 1080p
22.3 fps (4%)
specvp2020 creo-03 1080p +
SPECviewperf 2020 - specvp2020 creo-03 1080p
70.3 fps (24%)
specvp2020 catia-06 1080p +
SPECviewperf 2020 - specvp2020 catia-06 1080p
64.4 fps (31%)
specvp2020 3dsmax-07 1080p +
SPECviewperf 2020 - specvp2020 3dsmax-07 1080p
96.3 fps (25%)
specvp2020 snx-04 4k +
SPECviewperf 2020 - specvp2020 snx-04 4k
min: 2.55     avg: 2.9     median: 3 (0%)     max: 3.08 fps
specvp2020 medical-03 4k +
SPECviewperf 2020 - specvp2020 medical-03 4k
min: 22.3     avg: 23.1     median: 23.5 (15%)     max: 23.5 fps
specvp2020 maya-06 4k +
SPECviewperf 2020 - specvp2020 maya-06 4k
min: 195     avg: 196.7     median: 197 (28%)     max: 198 fps
specvp2020 energy-03 4k +
SPECviewperf 2020 - specvp2020 energy-03 4k
min: 25     avg: 25.2     median: 25.2 (6%)     max: 25.3 fps
specvp2020 creo-03 4k +
SPECviewperf 2020 - specvp2020 creo-03 4k
min: 52.9     avg: 54.3     median: 55 (25%)     max: 55 fps
specvp2020 catia-06 4k +
SPECviewperf 2020 - specvp2020 catia-06 4k
min: 38.9     avg: 43.3     median: 44.5 (29%)     max: 46.5 fps
specvp2020 3dsmax-07 4k +
SPECviewperf 2020 - specvp2020 3dsmax-07 4k
min: 47.4     avg: 58.6     median: 64 (22%)     max: 64.3 fps
Basemark GPU 1.2 - Basemark GPU 1.2 Vulkan Official Medium Offscreen 1080
min: 104.6     avg: 641     median: 640.8 (16%)     max: 1177 fps
Basemark GPU 1.2 - Basemark GPU 1.2 Vulkan Official High Offscreen 2160
min: 3.64     avg: 54     median: 54 (10%)     max: 104.4 fps
Geekbench 6.5 - Geekbench 6.5 GPU OpenCL
min: 108692     avg: 113475     median: 113475 (29%)     max: 118258 Punkte
Geekbench 6.5 - Geekbench 6.5 GPU Vulkan
min: 103684     avg: 104221     median: 104220 (26%)     max: 104757 Punkte
LuxMark v2.0 64Bit - LuxMark v2.0 Room GPU
min: 3249     avg: 3287     median: 3287 (12%)     max: 3325 Samples/s
LuxMark v2.0 64Bit - LuxMark v2.0 Sala GPU
min: 10015     avg: 10468     median: 10468 (18%)     max: 10921 Samples/s
ComputeMark v2.1 - ComputeMark v2.1 Result
min: 22732     avg: 23165     median: 22765 (19%)     max: 23997 Punkte
Power Consumption - Furmark Stress Test Power Consumption - external Monitor *
min: 350     avg: 368     median: 368 (50%)     max: 386 Watt
0255075100125150175200225250275300325350375400425Tooltip
Power Consumption - The Witcher 3 Power Consumption - external Monitor *
min: 287     avg: 292.5     median: 292.5 (41%)     max: 298 Watt
020406080100120140160180200220240260280300320Tooltip
Power Consumption - Power Efficiency - Witcher 3 ultra external Monitor
0.2 fps per Watt (21%)
Power Consumption - Cyberpunk 2077 Power Consumption - external Monitor *
448 Watt (57%)
0306090120150180210240270300330360390420450480Tooltip
Emissions Witcher 3 Fan Noise +
Emissions - Witcher 3 Fan Noise
41.5 dB(A) (59%)
- Bereich der Benchmarkergebnisse
red legend - Durchschnittliche Benchmarkergebnisse
* Smaller numbers mean a higher performance

Spiele-Benchmarks

Die folgenden Benchmarks basieren auf unseren Spieletests mit Testnotebooks. Die Performance dieser Grafikkarte bei den gelisteten Spielen ist abhängig von der verwendeten CPU, Speicherausstattung, Treiber und auch Betriebssystem. Dadurch müssen die untenstehenden Werte nicht repräsentativ sein. Detaillierte Informationen über das verwendete System sehen Sie nach einem Klick auf den fps-Wert.

F1 25

F1 25

2025
min. 1920x1080
233  fps    + Vergleich
mittel 1920x1080
196.1  fps    + Vergleich
hoch 1920x1080
155.7  fps    + Vergleich
max. 1920x1080
20.5  fps    + Vergleich
QHD 2560x1440
11.1  fps    + Vergleich
4K 3840x2160
4.3  fps    + Vergleich
» In Detailstufe hoch mit allen getesteten Notebooks spielbar
Additional Benchmarks
Ultra High Preset 16xAF TAA 1920x1080
47.8
min. 1920x1080
49.8  fps    + Vergleich + 📈 Graph
mittel 1920x1080
43.6  fps    + Vergleich + 📈 Graph
hoch 1920x1080
38.7  fps    + Vergleich + 📈 Graph
max. 1920x1080
37.9  fps    + Vergleich + 📈 Graph
QHD 2560x1440
27  fps    + Vergleich + 📈 Graph
4K 3840x2160
14.6  fps    + Vergleich + 📈 Graph
» In Detailstufe max. mit allen getesteten Notebooks spielbar
min. 1920x1080
62.9  fps    + Vergleich + 📈 Graph
mittel 1920x1080
55.2  fps    + Vergleich + 📈 Graph
hoch 1920x1080
38.2  fps    + Vergleich + 📈 Graph
max. 1920x1080
21.8  fps    + Vergleich + 📈 Graph
QHD 2560x1440
16.2  fps    + Vergleich + 📈 Graph
4K 3840x2160
9.5  fps    + Vergleich + 📈 Graph
» In Detailstufe hoch mit allen getesteten Notebooks spielbar
min. 1920x1080
40  fps    + Vergleich
mittel 1920x1080
38  fps    + Vergleich
hoch 1920x1080
32  fps    + Vergleich
max. 1920x1080
26  fps    + Vergleich
QHD 2560x1440
22  fps    + Vergleich
» In Detailstufe mittel mit allen getesteten Notebooks spielbar
min. 1920x1080
347  fps    + Vergleich + 📈 Graph
mittel 1920x1080
184.6  fps    + Vergleich + 📈 Graph
hoch 1920x1080
112.1  fps    + Vergleich + 📈 Graph
QHD 2560x1440
76.6  fps    + Vergleich + 📈 Graph
4K 3840x2160
39.7  fps    + Vergleich + 📈 Graph
» In Detailstufe hoch mit allen getesteten Notebooks spielbar
min. 1920x1080
31.2  fps    + Vergleich
mittel 1920x1080
27.3  fps    + Vergleich
max. 1920x1080
22.2  fps    + Vergleich
» Mit den meisten getesteten Laptops in den getesteten Detailstufen nicht flüssig spielbar.
min. 1920x1080
125.6  fps    + Vergleich + 📈 Graph
mittel 1920x1080
95.8  fps    + Vergleich + 📈 Graph
hoch 1920x1080
80.5  fps    + Vergleich + 📈 Graph
max. 1920x1080
56.1  fps    + Vergleich + 📈 Graph
QHD 2560x1440
43.3  fps    + Vergleich + 📈 Graph
4K 3840x2160
26.1  fps    + Vergleich + 📈 Graph
» In Detailstufe max. mit allen getesteten Notebooks spielbar
min. 1920x1080
68  fps    + Vergleich + 📈 Graph
hoch 1920x1080
54.5  fps    + Vergleich + 📈 Graph
max. 1920x1080
49.4  fps    + Vergleich + 📈 Graph
QHD 2560x1440
37.9  fps    + Vergleich + 📈 Graph
4K 3840x2160
22.2  fps    + Vergleich + 📈 Graph
» In Detailstufe max. mit allen getesteten Notebooks spielbar
Stalker 2

Stalker 2

2024
min. 1920x1080
86.8  fps    + Vergleich + 📈 Graph
mittel 1920x1080
80.4  fps    + Vergleich + 📈 Graph
hoch 1920x1080
70.8  fps    + Vergleich + 📈 Graph
max. 1920x1080
61.5  fps    + Vergleich + 📈 Graph
QHD 2560x1440
47.1  fps    + Vergleich + 📈 Graph
4K 3840x2160
27.3  fps    + Vergleich + 📈 Graph
» In Detailstufe max. mit allen getesteten Notebooks spielbar
Additional Benchmarks
Low Preset 1280x720
112.9
min. 1920x1080
89  fps    + Vergleich
mittel 1920x1080
81  fps    + Vergleich
hoch 1920x1080
64  fps    + Vergleich
max. 1920x1080
61  fps    + Vergleich
QHD 2560x1440
47  fps    + Vergleich
4K 3840x2160
30  fps    + Vergleich
» In Detailstufe max. mit allen getesteten Notebooks spielbar
Additional Benchmarks
Minimum Preset 1280x720
113
min. 1920x1080
101.6  fps    + Vergleich + 📈 Graph
mittel 1920x1080
57.1  fps    + Vergleich + 📈 Graph
hoch 1920x1080
43.1  fps    + Vergleich + 📈 Graph
max. 1920x1080
35.9  fps    + Vergleich + 📈 Graph
QHD 2560x1440
26.2  fps    + Vergleich + 📈 Graph
4K 3840x2160
17  fps    + Vergleich + 📈 Graph
» In Detailstufe max. mit allen getesteten Notebooks spielbar
Additional Benchmarks
Low Preset 1280x720
123.1
min. 1920x1080
103.9  fps    + Vergleich + 📈 Graph
mittel 1920x1080
87.5  fps    + Vergleich + 📈 Graph
hoch 1920x1080
79.9  fps    + Vergleich + 📈 Graph
max. 1920x1080
75.1  fps    + Vergleich + 📈 Graph
QHD 2560x1440
58.8  fps    + Vergleich + 📈 Graph
4K 3840x2160
34.6  fps    + Vergleich + 📈 Graph
» In Detailstufe max. mit allen getesteten Notebooks spielbar
Additional Benchmarks
Low Preset TAA 1280x720
132.1
min. 1920x1080
55.6  fps    + Vergleich + 📈 Graph
mittel 1920x1080
54.6  fps    + Vergleich + 📈 Graph
hoch 1920x1080
46.9  fps    + Vergleich + 📈 Graph
max. 1920x1080
42.5  fps    + Vergleich + 📈 Graph
QHD 2560x1440
32.1  fps    + Vergleich + 📈 Graph
4K 3840x2160
19.1  fps    + Vergleich + 📈 Graph
» In Detailstufe max. mit allen getesteten Notebooks spielbar
Additional Benchmarks
Low Preset (Super Resolution off) 1280x720
65.1
min. 1920x1080
59.2  fps    + Vergleich + 📈 Graph
mittel 1920x1080
49.6  fps    + Vergleich + 📈 Graph
hoch 1920x1080
48.9  fps    + Vergleich + 📈 Graph
max. 1920x1080
45.9  fps    + Vergleich + 📈 Graph
QHD 2560x1440
36.1  fps    + Vergleich + 📈 Graph
4K 3840x2160
22.6  fps    + Vergleich + 📈 Graph
» In Detailstufe max. mit allen getesteten Notebooks spielbar
Additional Benchmarks
Low Preset TAA 1280x720
69.4
min. 1920x1080 cinem.
48  fps    + Vergleich + 📈 Graph
mittel 1920x1080 cinem.
46.8  fps    + Vergleich + 📈 Graph
hoch 1920x1080 cinem.
43.1  fps    + Vergleich + 📈 Graph
max. 1920x1080 cinem.
37.6  fps    + Vergleich + 📈 Graph
QHD 2560x1440 cinem.
27  fps    + Vergleich + 📈 Graph
4K 3840x2160 cinem.
14.5  fps    + Vergleich + 📈 Graph
» In Detailstufe max. mit allen getesteten Notebooks spielbar
Additional Benchmarks
low 1280x720 cinem.
66.3
min. 1920x1080
66  fps    + Vergleich
mittel 1920x1080
50  fps    + Vergleich
hoch 1920x1080
38  fps    + Vergleich
max. 1920x1080
24  fps    + Vergleich
QHD 2560x1440
19  fps    + Vergleich
4K 3840x2160
11  fps    + Vergleich
» In Detailstufe hoch mit allen getesteten Notebooks spielbar
Additional Benchmarks
low TSR 100 1280x720
90
low XeSS 68 1280x720
101
min. 1920x1080
96.2  fps    + Vergleich + 📈 Graph
mittel 1920x1080
95.9  fps    + Vergleich + 📈 Graph
hoch 1920x1080
88.3  fps    + Vergleich + 📈 Graph
max. 1920x1080
80.7  fps    + Vergleich + 📈 Graph
QHD 2560x1440
53.6  fps    + Vergleich + 📈 Graph
4K 3840x2160
27.6  fps    + Vergleich + 📈 Graph
» In Detailstufe max. mit allen getesteten Notebooks spielbar
Additional Benchmarks
Very Low Preset 1280x720
232
min. 1920x1080
124.7  fps    + Vergleich + 📈 Graph
mittel 1920x1080
83.4  fps    + Vergleich + 📈 Graph
hoch 1920x1080
69.5  fps    + Vergleich + 📈 Graph
max. 1920x1080
61  fps    + Vergleich + 📈 Graph
QHD 2560x1440
44.5  fps    + Vergleich + 📈 Graph
4K 3840x2160
25  fps    + Vergleich + 📈 Graph
» In Detailstufe max. mit allen getesteten Notebooks spielbar
Additional Benchmarks
Low Preset 1280x720
154.5
Ultra Preset + Ultra Ray Tracing + XeSS Quality 2560x1440
45.8
Ultra Preset + Ultra Ray Tracing + XeSS Quality 3840x2160
30.4
F1 24

F1 24

2024
min. 1920x1080
280 284 ~ 282 fps    + Vergleich
mittel 1920x1080
241 251 ~ 246 fps    + Vergleich
hoch 1920x1080
181.4 192.9 ~ 187 fps    + Vergleich
max. 1920x1080
61.9 64.3 ~ 63 fps    + Vergleich
QHD 2560x1440
42 43.4 ~ 43 fps    + Vergleich
4K 3840x2160
21.2 21.7 ~ 21 fps    + Vergleich
4K FSR 3840x2160
35.5  fps    + Vergleich
QHD FSR 2560x1440
63.6  fps    + Vergleich
» In Detailstufe max. mit allen getesteten Notebooks spielbar
min. 1920x1080
46.8  fps    + Vergleich + 📈 Graph
mittel 1920x1080
39.9  fps    + Vergleich + 📈 Graph
hoch 1920x1080
33.7  fps    + Vergleich + 📈 Graph
QHD 2560x1440
24.9  fps    + Vergleich + 📈 Graph
4K 3840x2160
14.8  fps    + Vergleich + 📈 Graph
4K FSR 3840x2160
24  fps    + Vergleich + 📈 Graph
QHD FSR 2560x1440
34.6  fps    + Vergleich + 📈 Graph
» In Detailstufe mittel mit allen getesteten Notebooks spielbar
Additional Benchmarks
High Preset + Quality XeSS 2560x1440
41.8
min. 1920x1080
99.5  fps    + Vergleich + 📈 Graph
mittel 1920x1080
85.6  fps    + Vergleich + 📈 Graph
hoch 1920x1080
77.5  fps    + Vergleich + 📈 Graph
max. 1920x1080
63.9  fps    + Vergleich + 📈 Graph
QHD 2560x1440
51.3  fps    + Vergleich + 📈 Graph
4K 3840x2160
32.5  fps    + Vergleich + 📈 Graph
4K FSR 3840x2160
42.9  fps    + Vergleich + 📈 Graph
» In Detailstufe max. mit allen getesteten Notebooks spielbar
Additional Benchmarks
Very High Preset + Quality FSR 2560x1440
59.8
Very High Preset + Quality XeSS 2560x1440
66.5
min. 1920x1080
80.9  fps    + Vergleich + 📈 Graph
mittel 1920x1080
76.5  fps    + Vergleich + 📈 Graph
hoch 1920x1080
56.3  fps    + Vergleich + 📈 Graph
max. 1920x1080
54.8  fps    + Vergleich + 📈 Graph
QHD 2560x1440
44.9  fps    + Vergleich + 📈 Graph
4K 3840x2160
28.4  fps    + Vergleich + 📈 Graph
4K FSR 3840x2160
33.5  fps    + Vergleich + 📈 Graph
» In Detailstufe max. mit allen getesteten Notebooks spielbar
Additional Benchmarks
Very Low Preset 1280x720
110
min. 1920x1080
188.4  fps    + Vergleich + 📈 Graph
mittel 1920x1080
162.7  fps    + Vergleich + 📈 Graph
hoch 1920x1080
145.4  fps    + Vergleich + 📈 Graph
max. 1920x1080
83.5  fps    + Vergleich + 📈 Graph
QHD 2560x1440
52.1  fps    + Vergleich + 📈 Graph
4K 3840x2160
22.6  fps    + Vergleich + 📈 Graph
4K FSR 3840x2160
52.4  fps    + Vergleich + 📈 Graph
» In Detailstufe max. mit allen getesteten Notebooks spielbar
Additional Benchmarks
Low Preset 1280x720
199.3
min. 1920x1080
52.1  fps    + Vergleich + 📈 Graph
hoch 1920x1080
47.8  fps    + Vergleich + 📈 Graph
QHD 2560x1440
39  fps    + Vergleich + 📈 Graph
4K 3840x2160
24.7  fps    + Vergleich + 📈 Graph
» In Detailstufe hoch mit allen getesteten Notebooks spielbar
Additional Benchmarks
Low Preset 1280x720
64.1
min. 1920x1080
233  fps    + Vergleich + 📈 Graph
mittel 1920x1080
189.6  fps    + Vergleich + 📈 Graph
hoch 1920x1080
163.7  fps    + Vergleich + 📈 Graph
max. 1920x1080
132.3  fps    + Vergleich + 📈 Graph
QHD 2560x1440
89.9  fps    + Vergleich + 📈 Graph
4K 3840x2160
44.1  fps    + Vergleich + 📈 Graph
» In Detailstufe max. mit allen getesteten Notebooks spielbar
Additional Benchmarks
Very Low Preset 1280x720
296
min. 1920x1080
81  fps    + Vergleich
mittel 1920x1080
76  fps    + Vergleich
hoch 1920x1080
64  fps    + Vergleich
max. 1920x1080
53  fps    + Vergleich
QHD 2560x1440
46  fps    + Vergleich
4K 3840x2160
32  fps    + Vergleich
4K FSR 3840x2160
40  fps    + Vergleich
» In Detailstufe max. mit allen getesteten Notebooks spielbar
Additional Benchmarks
Low Preset TAA 1280x720
94
min. 1920x1080
121.9  fps    + Vergleich + 📈 Graph
mittel 1920x1080
94.9  fps    + Vergleich + 📈 Graph
hoch 1920x1080
91.4  fps    + Vergleich + 📈 Graph
max. 1920x1080
90.1  fps    + Vergleich + 📈 Graph
QHD 2560x1440
69.2  fps    + Vergleich + 📈 Graph
4K 3840x2160
39.8  fps    + Vergleich + 📈 Graph
» In Detailstufe max. mit allen getesteten Notebooks spielbar
Additional Benchmarks
Low Preset 1280x720
151.6
min. 1920x1080
74.6  fps    + Vergleich + 📈 Graph
mittel 1920x1080
67  fps    + Vergleich + 📈 Graph
hoch 1920x1080
58.2  fps    + Vergleich + 📈 Graph
» In Detailstufe hoch mit allen getesteten Notebooks spielbar
Additional Benchmarks
Max. Performance 1280x720
112.1
Palworld

Palworld

2024
min. 1920x1080
127.4  fps    + Vergleich + 📈 Graph
mittel 1920x1080
105.8  fps    + Vergleich + 📈 Graph
hoch 1920x1080
82  fps    + Vergleich + 📈 Graph
max. 1920x1080
78.8  fps    + Vergleich + 📈 Graph
QHD 2560x1440
60.2  fps    + Vergleich + 📈 Graph
4K 3840x2160
33.5  fps    + Vergleich + 📈 Graph
» In Detailstufe max. mit allen getesteten Notebooks spielbar
Additional Benchmarks
Very Low Preset 1280x720
222
mittel 1920x1080
358  fps    + Vergleich + 📈 Graph
hoch 1920x1080
358  fps    + Vergleich + 📈 Graph
max. 1920x1080
359  fps    + Vergleich + 📈 Graph
QHD 2560x1440
351  fps    + Vergleich + 📈 Graph
4K 3840x2160
193.2  fps    + Vergleich + 📈 Graph
» In Detailstufe max. mit allen getesteten Notebooks spielbar
min. 1920x1080
202  fps    + Vergleich + 📈 Graph
mittel 1920x1080
198.3  fps    + Vergleich + 📈 Graph
hoch 1920x1080
190.6  fps    + Vergleich + 📈 Graph
max. 1920x1080
134.9  fps    + Vergleich + 📈 Graph
QHD 2560x1440
86.6  fps    + Vergleich + 📈 Graph
4K 3840x2160
38  fps    + Vergleich + 📈 Graph
» In Detailstufe max. mit allen getesteten Notebooks spielbar
min. 1920x1080
204  fps    + Vergleich + 📈 Graph
mittel 1920x1080
161.7  fps    + Vergleich + 📈 Graph
hoch 1920x1080
146.2  fps    + Vergleich + 📈 Graph
max. 1920x1080
121.5  fps    + Vergleich + 📈 Graph
QHD 2560x1440
83  fps    + Vergleich + 📈 Graph
4K 3840x2160
40.5  fps    + Vergleich + 📈 Graph
» In Detailstufe max. mit allen getesteten Notebooks spielbar
Additional Benchmarks
Low Preset 1280x720
277
min. 1920x1080
65  fps    + Vergleich
mittel 1920x1080
61  fps    + Vergleich
hoch 1920x1080
52  fps    + Vergleich
max. 1920x1080
42  fps    + Vergleich
QHD 2560x1440
30  fps    + Vergleich
4K 3840x2160
16  fps    + Vergleich
» In Detailstufe max. mit allen getesteten Notebooks spielbar
Additional Benchmarks
Low Preset TAA 1280x720
87
min. 1920x1080
106  fps    + Vergleich
mittel 1920x1080
97  fps    + Vergleich
hoch 1920x1080
79  fps    + Vergleich
max. 1920x1080
75  fps    + Vergleich
QHD 2560x1440
57  fps    + Vergleich
4K 3840x2160
36  fps    + Vergleich
» In Detailstufe max. mit allen getesteten Notebooks spielbar
Additional Benchmarks
Minimum Preset 1280x720
134
min. 1920x1080
107.1  fps    + Vergleich + 📈 Graph
mittel 1920x1080
77.7  fps    + Vergleich + 📈 Graph
hoch 1920x1080
70.1  fps    + Vergleich + 📈 Graph
max. 1920x1080
65.9  fps    + Vergleich + 📈 Graph
QHD 2560x1440
52.7  fps    + Vergleich + 📈 Graph
4K 3840x2160
33.2  fps    + Vergleich + 📈 Graph
» In Detailstufe max. mit allen getesteten Notebooks spielbar
Additional Benchmarks
Ultra Low Preset LowAA 1280x720
188
min. 1920x1080
56.5  fps    + Vergleich + 📈 Graph
mittel 1920x1080
55  fps    + Vergleich + 📈 Graph
hoch 1920x1080
51.6  fps    + Vergleich + 📈 Graph
QHD 2560x1440
36.1  fps    + Vergleich + 📈 Graph
4K 3840x2160
20.1  fps    + Vergleich + 📈 Graph
» In Detailstufe hoch mit allen getesteten Notebooks spielbar
Additional Benchmarks
Low Preset 1280x720
77.2
min. 1920x1080
100.4  fps    + Vergleich + 📈 Graph
mittel 1920x1080
89.8  fps    + Vergleich + 📈 Graph
hoch 1920x1080
73.1  fps    + Vergleich + 📈 Graph
max. 1920x1080
59.4  fps    + Vergleich + 📈 Graph
QHD 2560x1440
50.4  fps    + Vergleich + 📈 Graph
4K 3840x2160
35.1  fps    + Vergleich + 📈 Graph
» In Detailstufe max. mit allen getesteten Notebooks spielbar
Additional Benchmarks
Low Preset 1280x720
113.8
min. 1920x1080
386  fps    + Vergleich
mittel 1920x1080
244  fps    + Vergleich
hoch 1920x1080
151  fps    + Vergleich
max. 1920x1080
119  fps    + Vergleich
QHD 2560x1440
86  fps    + Vergleich
4K 3840x2160
46  fps    + Vergleich
» In Detailstufe max. mit allen getesteten Notebooks spielbar
Additional Benchmarks
Low Preset 1280x720
498
min. 1920x1080
77  fps    + Vergleich
mittel 1920x1080
70  fps    + Vergleich
hoch 1920x1080
70  fps    + Vergleich
max. 1920x1080
64  fps    + Vergleich
QHD 2560x1440
50  fps    + Vergleich
4K 3840x2160
34  fps    + Vergleich
» In Detailstufe max. mit allen getesteten Notebooks spielbar
Additional Benchmarks
Low Preset (Adaptive Quality Off) 1280x720
86
min. 1920x1080
221  fps    + Vergleich + 📈 Graph
mittel 1920x1080
201  fps    + Vergleich + 📈 Graph
hoch 1920x1080
161.3  fps    + Vergleich + 📈 Graph
max. 1920x1080
152.5  fps    + Vergleich + 📈 Graph
QHD 2560x1440
123  fps    + Vergleich + 📈 Graph
4K 3840x2160
77  fps    + Vergleich + 📈 Graph
» In Detailstufe max. mit allen getesteten Notebooks spielbar
Additional Benchmarks
Low Preset 1280x720
283
min. 1920x1080
317  fps    + Vergleich + 📈 Graph
mittel 1920x1080
270  fps    + Vergleich + 📈 Graph
hoch 1920x1080
168.1  fps    + Vergleich + 📈 Graph
max. 1920x1080
117  fps    + Vergleich + 📈 Graph
QHD 2560x1440
89.6  fps    + Vergleich + 📈 Graph
4K 3840x2160
46.7  fps    + Vergleich + 📈 Graph
» In Detailstufe max. mit allen getesteten Notebooks spielbar
Additional Benchmarks
Low Preset 1280x720
323
min. 1920x1080
116.3  fps    + Vergleich
mittel 1920x1080
99  fps    + Vergleich
hoch 1920x1080
88.3  fps    + Vergleich
max. 1920x1080
83.2  fps    + Vergleich
QHD 2560x1440
58.6  fps    + Vergleich
4K 3840x2160
30.4  fps    + Vergleich
4K DLSS 3840x2160
9.7  fps    + Vergleich
» In Detailstufe max. mit allen getesteten Notebooks spielbar
Additional Benchmarks
Low Preset (FSR off) 1280x720
154.2
Ray Tracing Ultra Preset (DLSS off) 1920x1080
31.3
30min Start Ultra Preset (FSR off) 1920x1080
72.6
min. 1920x1080
130.1  fps    + Vergleich + 📈 Graph
mittel 1920x1080
109.6  fps    + Vergleich + 📈 Graph
hoch 1920x1080
94.6  fps    + Vergleich + 📈 Graph
max. 1920x1080
90.9  fps    + Vergleich + 📈 Graph
QHD 2560x1440
63.8  fps    + Vergleich + 📈 Graph
4K 3840x2160
33.8  fps    + Vergleich + 📈 Graph
» In Detailstufe max. mit allen getesteten Notebooks spielbar
Additional Benchmarks
Low Preset SMAA 1280x720
189.1
Lies of P

Lies of P

2023
min. 1920x1080
174.5  fps    + Vergleich + 📈 Graph
mittel 1920x1080
154.5  fps    + Vergleich + 📈 Graph
hoch 1920x1080
136.8  fps    + Vergleich + 📈 Graph
max. 1920x1080
123.6  fps    + Vergleich + 📈 Graph
QHD 2560x1440
88.8  fps    + Vergleich + 📈 Graph
4K 3840x2160
47.5  fps    + Vergleich + 📈 Graph
» In Detailstufe max. mit allen getesteten Notebooks spielbar
Additional Benchmarks
Low Preset 1280x720
244
Starfield

Starfield

2023
min. 1920x1080
48.9  fps    + Vergleich + 📈 Graph
mittel 1920x1080
42.8  fps    + Vergleich + 📈 Graph
hoch 1920x1080
36.3  fps    + Vergleich + 📈 Graph
max. 1920x1080
33.6  fps    + Vergleich + 📈 Graph
QHD 2560x1440
28.8  fps    + Vergleich + 📈 Graph
4K 3840x2160
20.5  fps    + Vergleich + 📈 Graph
» In Detailstufe hoch mit allen getesteten Notebooks spielbar
Additional Benchmarks
Low Preset 1280x720
55.7
min. 1920x1080
71.6  fps    + Vergleich + 📈 Graph
mittel 1920x1080
69.3  fps    + Vergleich + 📈 Graph
hoch 1920x1080
68  fps    + Vergleich + 📈 Graph
max. 1920x1080
67.9  fps    + Vergleich + 📈 Graph
QHD 2560x1440
66.9  fps    + Vergleich + 📈 Graph
4K 3840x2160
46.7  fps    + Vergleich + 📈 Graph
» In Detailstufe max. mit allen getesteten Notebooks spielbar
Additional Benchmarks
Low Preset 1280x720
72.4
min. 1920x1080
56.6  fps    + Vergleich + 📈 Graph
hoch 1920x1080
49  fps    + Vergleich + 📈 Graph
max. 1920x1080
40.6  fps    + Vergleich + 📈 Graph
QHD 2560x1440
30.5  fps    + Vergleich + 📈 Graph
4K 3840x2160
18.3  fps    + Vergleich + 📈 Graph
» In Detailstufe max. mit allen getesteten Notebooks spielbar
Additional Benchmarks
Low 1280x720
74.2
min. 1920x1080
141.4  fps    + Vergleich + 📈 Graph
mittel 1920x1080
133.9  fps    + Vergleich + 📈 Graph
hoch 1920x1080
126.3  fps    + Vergleich + 📈 Graph
max. 1920x1080
108.9  fps    + Vergleich + 📈 Graph
QHD 2560x1440
79.4  fps    + Vergleich + 📈 Graph
4K 3840x2160
44.3  fps    + Vergleich + 📈 Graph
» In Detailstufe max. mit allen getesteten Notebooks spielbar
Additional Benchmarks
Low Preset 1280x720
186.2
min. 1920x1080
113  fps    + Vergleich + 📈 Graph
mittel 1920x1080
98  fps    + Vergleich + 📈 Graph
hoch 1920x1080
79.2  fps    + Vergleich + 📈 Graph
max. 1920x1080
68.5  fps    + Vergleich + 📈 Graph
QHD 2560x1440
56.4  fps    + Vergleich + 📈 Graph
4K 3840x2160
36.2  fps    + Vergleich + 📈 Graph
» In Detailstufe max. mit allen getesteten Notebooks spielbar
Additional Benchmarks
Very Low Preset 1280x720
141.4
Very High Preset + Very High Raytracing TAA 1920x1080
44.5
F1 23

F1 23

2023
min. 1920x1080
299  fps    + Vergleich
mittel 1920x1080
264  fps    + Vergleich
hoch 1920x1080
196.7  fps    + Vergleich
max. 1920x1080
67.2  fps    + Vergleich
QHD 2560x1440
44.2  fps    + Vergleich
4K 3840x2160
21.4  fps    + Vergleich
» In Detailstufe max. mit allen getesteten Notebooks spielbar
Additional Benchmarks
Ultra Low Preset TAA 1280x720
399
Diablo 4

Diablo 4

2023
min. 1920x1080
213  fps    + Vergleich + 📈 Graph
mittel 1920x1080
193.8  fps    + Vergleich + 📈 Graph
hoch 1920x1080
177.5  fps    + Vergleich + 📈 Graph
max. 1920x1080
157.1  fps    + Vergleich + 📈 Graph
QHD 2560x1440
112.6  fps    + Vergleich + 📈 Graph
4K 3840x2160
61.7  fps    + Vergleich + 📈 Graph
» In Detailstufe max. mit allen getesteten Notebooks spielbar
Additional Benchmarks
Low Preset 1280x720
299
min. 1920x1080
81.1  fps    + Vergleich + 📈 Graph
mittel 1920x1080
73.1  fps    + Vergleich + 📈 Graph
hoch 1920x1080
68.4  fps    + Vergleich + 📈 Graph
max. 1920x1080
65.1  fps    + Vergleich + 📈 Graph
QHD 2560x1440
44  fps    + Vergleich + 📈 Graph
4K 3840x2160
22.3  fps    + Vergleich + 📈 Graph
» In Detailstufe max. mit allen getesteten Notebooks spielbar
Additional Benchmarks
Low Preset 1280x720
124.1
Epic Preset + Ray Tracing 1920x1080
48.8
min. 1920x1080
217  fps    + Vergleich + 📈 Graph
mittel 1920x1080
187.3  fps    + Vergleich + 📈 Graph
hoch 1920x1080
149  fps    + Vergleich + 📈 Graph
max. 1920x1080
117.8  fps    + Vergleich + 📈 Graph
QHD 2560x1440
88.2  fps    + Vergleich + 📈 Graph
4K 3840x2160
46  fps    + Vergleich + 📈 Graph
» In Detailstufe max. mit allen getesteten Notebooks spielbar
Additional Benchmarks
Low Preset Low TAA 1280x720
220
min. 1920x1080
69.5  fps    + Vergleich + 📈 Graph
mittel 1920x1080
58.5  fps    + Vergleich + 📈 Graph
hoch 1920x1080
52.9  fps    + Vergleich + 📈 Graph
max. 1920x1080
45.4  fps    + Vergleich + 📈 Graph
QHD 2560x1440
34.3  fps    + Vergleich + 📈 Graph
4K 3840x2160
18.9  fps    + Vergleich + 📈 Graph
» In Detailstufe max. mit allen getesteten Notebooks spielbar
Additional Benchmarks
Low Preset 1280x720
84.7
min. 1920x1080
165.8  fps    + Vergleich + 📈 Graph
mittel 1920x1080
119.9  fps    + Vergleich + 📈 Graph
hoch 1920x1080
111  fps    + Vergleich + 📈 Graph
max. 1920x1080
75.2  fps    + Vergleich + 📈 Graph
QHD 2560x1440
60.7  fps    + Vergleich + 📈 Graph
4K 3840x2160
37.1  fps    + Vergleich + 📈 Graph
» In Detailstufe max. mit allen getesteten Notebooks spielbar
Additional Benchmarks
Prioritize Performance Preset 1280x720
192
min. 1920x1080
182.7  fps    + Vergleich
mittel 1920x1080
155.2  fps    + Vergleich
hoch 1920x1080
125.9  fps    + Vergleich
max. 1920x1080
123.8  fps    + Vergleich
QHD 2560x1440
94.4  fps    + Vergleich
4K 3840x2160
59  fps    + Vergleich
» In Detailstufe max. mit allen getesteten Notebooks spielbar
Additional Benchmarks
Minimum Settings 1280x720
274
min. 1920x1080
70.3  fps    + Vergleich + 📈 Graph
mittel 1920x1080
54.5  fps    + Vergleich + 📈 Graph
hoch 1920x1080
54.2  fps    + Vergleich + 📈 Graph
max. 1920x1080
54  fps    + Vergleich + 📈 Graph
QHD 2560x1440
39.5  fps    + Vergleich + 📈 Graph
4K 3840x2160
23  fps    + Vergleich + 📈 Graph
» In Detailstufe max. mit allen getesteten Notebooks spielbar
Additional Benchmarks
Ultra Low Preset 1280x720
95
min. 1920x1080
179.1  fps    + Vergleich + 📈 Graph
mittel 1920x1080
131.9  fps    + Vergleich + 📈 Graph
hoch 1920x1080
99.3  fps    + Vergleich + 📈 Graph
max. 1920x1080
72.2  fps    + Vergleich + 📈 Graph
QHD 2560x1440
58.3  fps    + Vergleich + 📈 Graph
4K 3840x2160
34.1  fps    + Vergleich + 📈 Graph
» In Detailstufe max. mit allen getesteten Notebooks spielbar
Additional Benchmarks
Low Preset 1280x720
236
Returnal

Returnal

2023
min. 1920x1080
93  fps    + Vergleich
mittel 1920x1080
90  fps    + Vergleich
hoch 1920x1080
83  fps    + Vergleich
max. 1920x1080
72  fps    + Vergleich
QHD 2560x1440
58  fps    + Vergleich
4K 3840x2160
37  fps    + Vergleich
» In Detailstufe max. mit allen getesteten Notebooks spielbar
Additional Benchmarks
Low Preset 1280x720
112
Epic Preset + Epic Ray-Tracing 1920x1080
50
Epic Preset + Epic Ray-Tracing 3840x2160
24
min. 1920x1080
125.1  fps    + Vergleich + 📈 Graph
mittel 1920x1080
92.2  fps    + Vergleich + 📈 Graph
hoch 1920x1080
74  fps    + Vergleich + 📈 Graph
max. 1920x1080
62.2  fps    + Vergleich + 📈 Graph
QHD 2560x1440
47  fps    + Vergleich + 📈 Graph
4K 3840x2160
27.4  fps    + Vergleich + 📈 Graph
» In Detailstufe max. mit allen getesteten Notebooks spielbar
Additional Benchmarks
Low Preset Low TAA 1280x720
153.5
Ultra Preset + Full Ray Tracing High TAA 1920x1080
41.3
Ultra Preset + Full Ray Tracing High TAA 3840x2160
16.4
min. 1920x1080
79.2  fps    + Vergleich + 📈 Graph
mittel 1920x1080
76  fps    + Vergleich + 📈 Graph
hoch 1920x1080
69.5  fps    + Vergleich + 📈 Graph
max. 1920x1080
67.7  fps    + Vergleich + 📈 Graph
QHD 2560x1440
48.8  fps    + Vergleich + 📈 Graph
4K 3840x2160
26.5  fps    + Vergleich + 📈 Graph
» In Detailstufe max. mit allen getesteten Notebooks spielbar
Additional Benchmarks
Low Preset TAA 1280x720
110.6
min. 1920x1080
154.9  fps    + Vergleich + 📈 Graph
mittel 1920x1080
129.7  fps    + Vergleich + 📈 Graph
hoch 1920x1080
115.6  fps    + Vergleich + 📈 Graph
max. 1920x1080
104.5  fps    + Vergleich + 📈 Graph
QHD 2560x1440
94.8  fps    + Vergleich + 📈 Graph
4K 3840x2160
52.1  fps    + Vergleich + 📈 Graph
» In Detailstufe max. mit allen getesteten Notebooks spielbar
Additional Benchmarks
Low Preset / Off 1280x720
157.9
min. 1920x1080
268  fps    + Vergleich + 📈 Graph
mittel 1920x1080
175.3  fps    + Vergleich + 📈 Graph
hoch 1920x1080
142.5  fps    + Vergleich + 📈 Graph
max. 1920x1080
113.7  fps    + Vergleich + 📈 Graph
QHD 2560x1440
73  fps    + Vergleich + 📈 Graph
4K 3840x2160
33.7  fps    + Vergleich + 📈 Graph
» In Detailstufe max. mit allen getesteten Notebooks spielbar
Additional Benchmarks
Low Preset 1280x720
308
min. 1920x1080
168.7  fps    + Vergleich
mittel 1920x1080
128.4  fps    + Vergleich
hoch 1920x1080
120.5  fps    + Vergleich
max. 1920x1080
85.8  fps    + Vergleich
QHD 2560x1440
68.8  fps    + Vergleich
4K 3840x2160
44.9  fps    + Vergleich
» In Detailstufe max. mit allen getesteten Notebooks spielbar
Additional Benchmarks
Low Preset (without FSR Upscaling) 1280x720
195.1
Ultra Preset (without FSR Upscaling) + Full Ray-Tracing 1920x1080
58.6
min. 1920x1080
114.3  fps    + Vergleich + 📈 Graph
mittel 1920x1080
103.4  fps    + Vergleich + 📈 Graph
hoch 1920x1080
84.5  fps    + Vergleich + 📈 Graph
max. 1920x1080
84.3  fps    + Vergleich + 📈 Graph
QHD 2560x1440
65.1  fps    + Vergleich + 📈 Graph
4K 3840x2160
39.1  fps    + Vergleich + 📈 Graph
» In Detailstufe max. mit allen getesteten Notebooks spielbar
Additional Benchmarks
Low Preset 1280x720
141.4
min. 1920x1080
137.3  fps    + Vergleich + 📈 Graph
mittel 1920x1080
124.4  fps    + Vergleich + 📈 Graph
hoch 1920x1080
117.4  fps    + Vergleich + 📈 Graph
max. 1920x1080
111.5  fps    + Vergleich + 📈 Graph
QHD 2560x1440
87.2  fps    + Vergleich + 📈 Graph
4K 3840x2160
47.2  fps    + Vergleich + 📈 Graph
» In Detailstufe max. mit allen getesteten Notebooks spielbar
Additional Benchmarks
Very Low Preset 1280x720
162.5
Very High Preset + Ray-Tracing TAA 1920x0180
64.6
min. 1920x1080
63.5  fps    + Vergleich + 📈 Graph
mittel 1920x1080
61.4  fps    + Vergleich + 📈 Graph
hoch 1920x1080
59.4  fps    + Vergleich + 📈 Graph
max. 1920x1080
57.5  fps    + Vergleich + 📈 Graph
QHD 2560x1440
47.8  fps    + Vergleich + 📈 Graph
4K 3840x2160
29.5  fps    + Vergleich + 📈 Graph
» In Detailstufe max. mit allen getesteten Notebooks spielbar
Additional Benchmarks
Low Preset 1280x720
69.4
min. 1920x1080
97.3  fps    + Vergleich + 📈 Graph
mittel 1920x1080
83.8  fps    + Vergleich + 📈 Graph
hoch 1920x1080
66.1  fps    + Vergleich + 📈 Graph
max. 1920x1080
51.1  fps    + Vergleich + 📈 Graph
QHD 2560x1440
39.5  fps    + Vergleich + 📈 Graph
4K 3840x2160
23.6  fps    + Vergleich + 📈 Graph
» In Detailstufe max. mit allen getesteten Notebooks spielbar
Additional Benchmarks
Low Preset 1280x720
98.4
min. 1920x1080
125.4  fps    + Vergleich + 📈 Graph
mittel 1920x1080
100  fps    + Vergleich + 📈 Graph
hoch 1920x1080
80.4  fps    + Vergleich + 📈 Graph
max. 1920x1080
61.5  fps    + Vergleich + 📈 Graph
QHD 2560x1440
43.4  fps    + Vergleich + 📈 Graph
4K 3840x2160
22.4  fps    + Vergleich + 📈 Graph
» In Detailstufe max. mit allen getesteten Notebooks spielbar
Additional Benchmarks
Low Preset 1280x720
158.9
F1 22

F1 22

2022
min. 1920x1080
296  fps    + Vergleich
mittel 1920x1080
267  fps    + Vergleich
hoch 1920x1080
216  fps    + Vergleich
max. 1920x1080
73.2  fps    + Vergleich
QHD 2560x1440
47.4  fps    + Vergleich
4K 3840x2160
22.7  fps    + Vergleich
» In Detailstufe max. mit allen getesteten Notebooks spielbar
Additional Benchmarks
Ultra Low Preset 16xAF TAA 1280x720
411
min. 1920x1080
148.8  fps    + Vergleich + 📈 Graph
mittel 1920x1080
146.7  fps    + Vergleich + 📈 Graph
hoch 1920x1080
146.3  fps    + Vergleich + 📈 Graph
max. 1920x1080
138.8  fps    + Vergleich + 📈 Graph
QHD 2560x1440
99.7  fps    + Vergleich + 📈 Graph
4K 3840x2160
50.3  fps    + Vergleich + 📈 Graph
» In Detailstufe max. mit allen getesteten Notebooks spielbar
Additional Benchmarks
Lowest Settings 1280x720
228
Highest Settings + Maximum Ray Tracing 1920x1080
63.5
min. 1920x1080
203  fps    + Vergleich
mittel 1920x1080
162.9  fps    + Vergleich
hoch 1920x1080
114.6  fps    + Vergleich
max. 1920x1080
94  fps    + Vergleich
QHD 2560x1440
65.8  fps    + Vergleich
4K 3840x2160
34.1  fps    + Vergleich
» In Detailstufe max. mit allen getesteten Notebooks spielbar
Additional Benchmarks
Lowest Preset (DX12) 1280x720
314
min. 1920x1080
78  fps    + Vergleich
mittel 1920x1080
70  fps    + Vergleich
hoch 1920x1080
61.3