AMD Radeon RX 7600 Desktop-Grafikkarte im Test: RDNA3 vs. Ada Lovelace in der Einsteigerklasse

Lange musste man warten, damit auch die Einsteigerklasse nun mit AMDs aktuellen RDNA3-GPUs bestückt werden. Als kleinstes Modell schickt AMD die Radeon RX 7600 ins Rennen, welche für 1.080p-Gaming konzipiert ist. Verbaut wird hier der Navi 33 Grafikchip mit 2.048 Shadereinheiten. Das ist etwas mehr als beim direkten Vorgänger (AMD Radeon RX 6600), wenngleich beim Videospeicher mit 8 GB genauso viel verbaut wird. Allerdings arbeitet dieser mit einem deutlich höheren Takt, woraus ebenfalls eine höhere Speicherbandbreite resultiert.
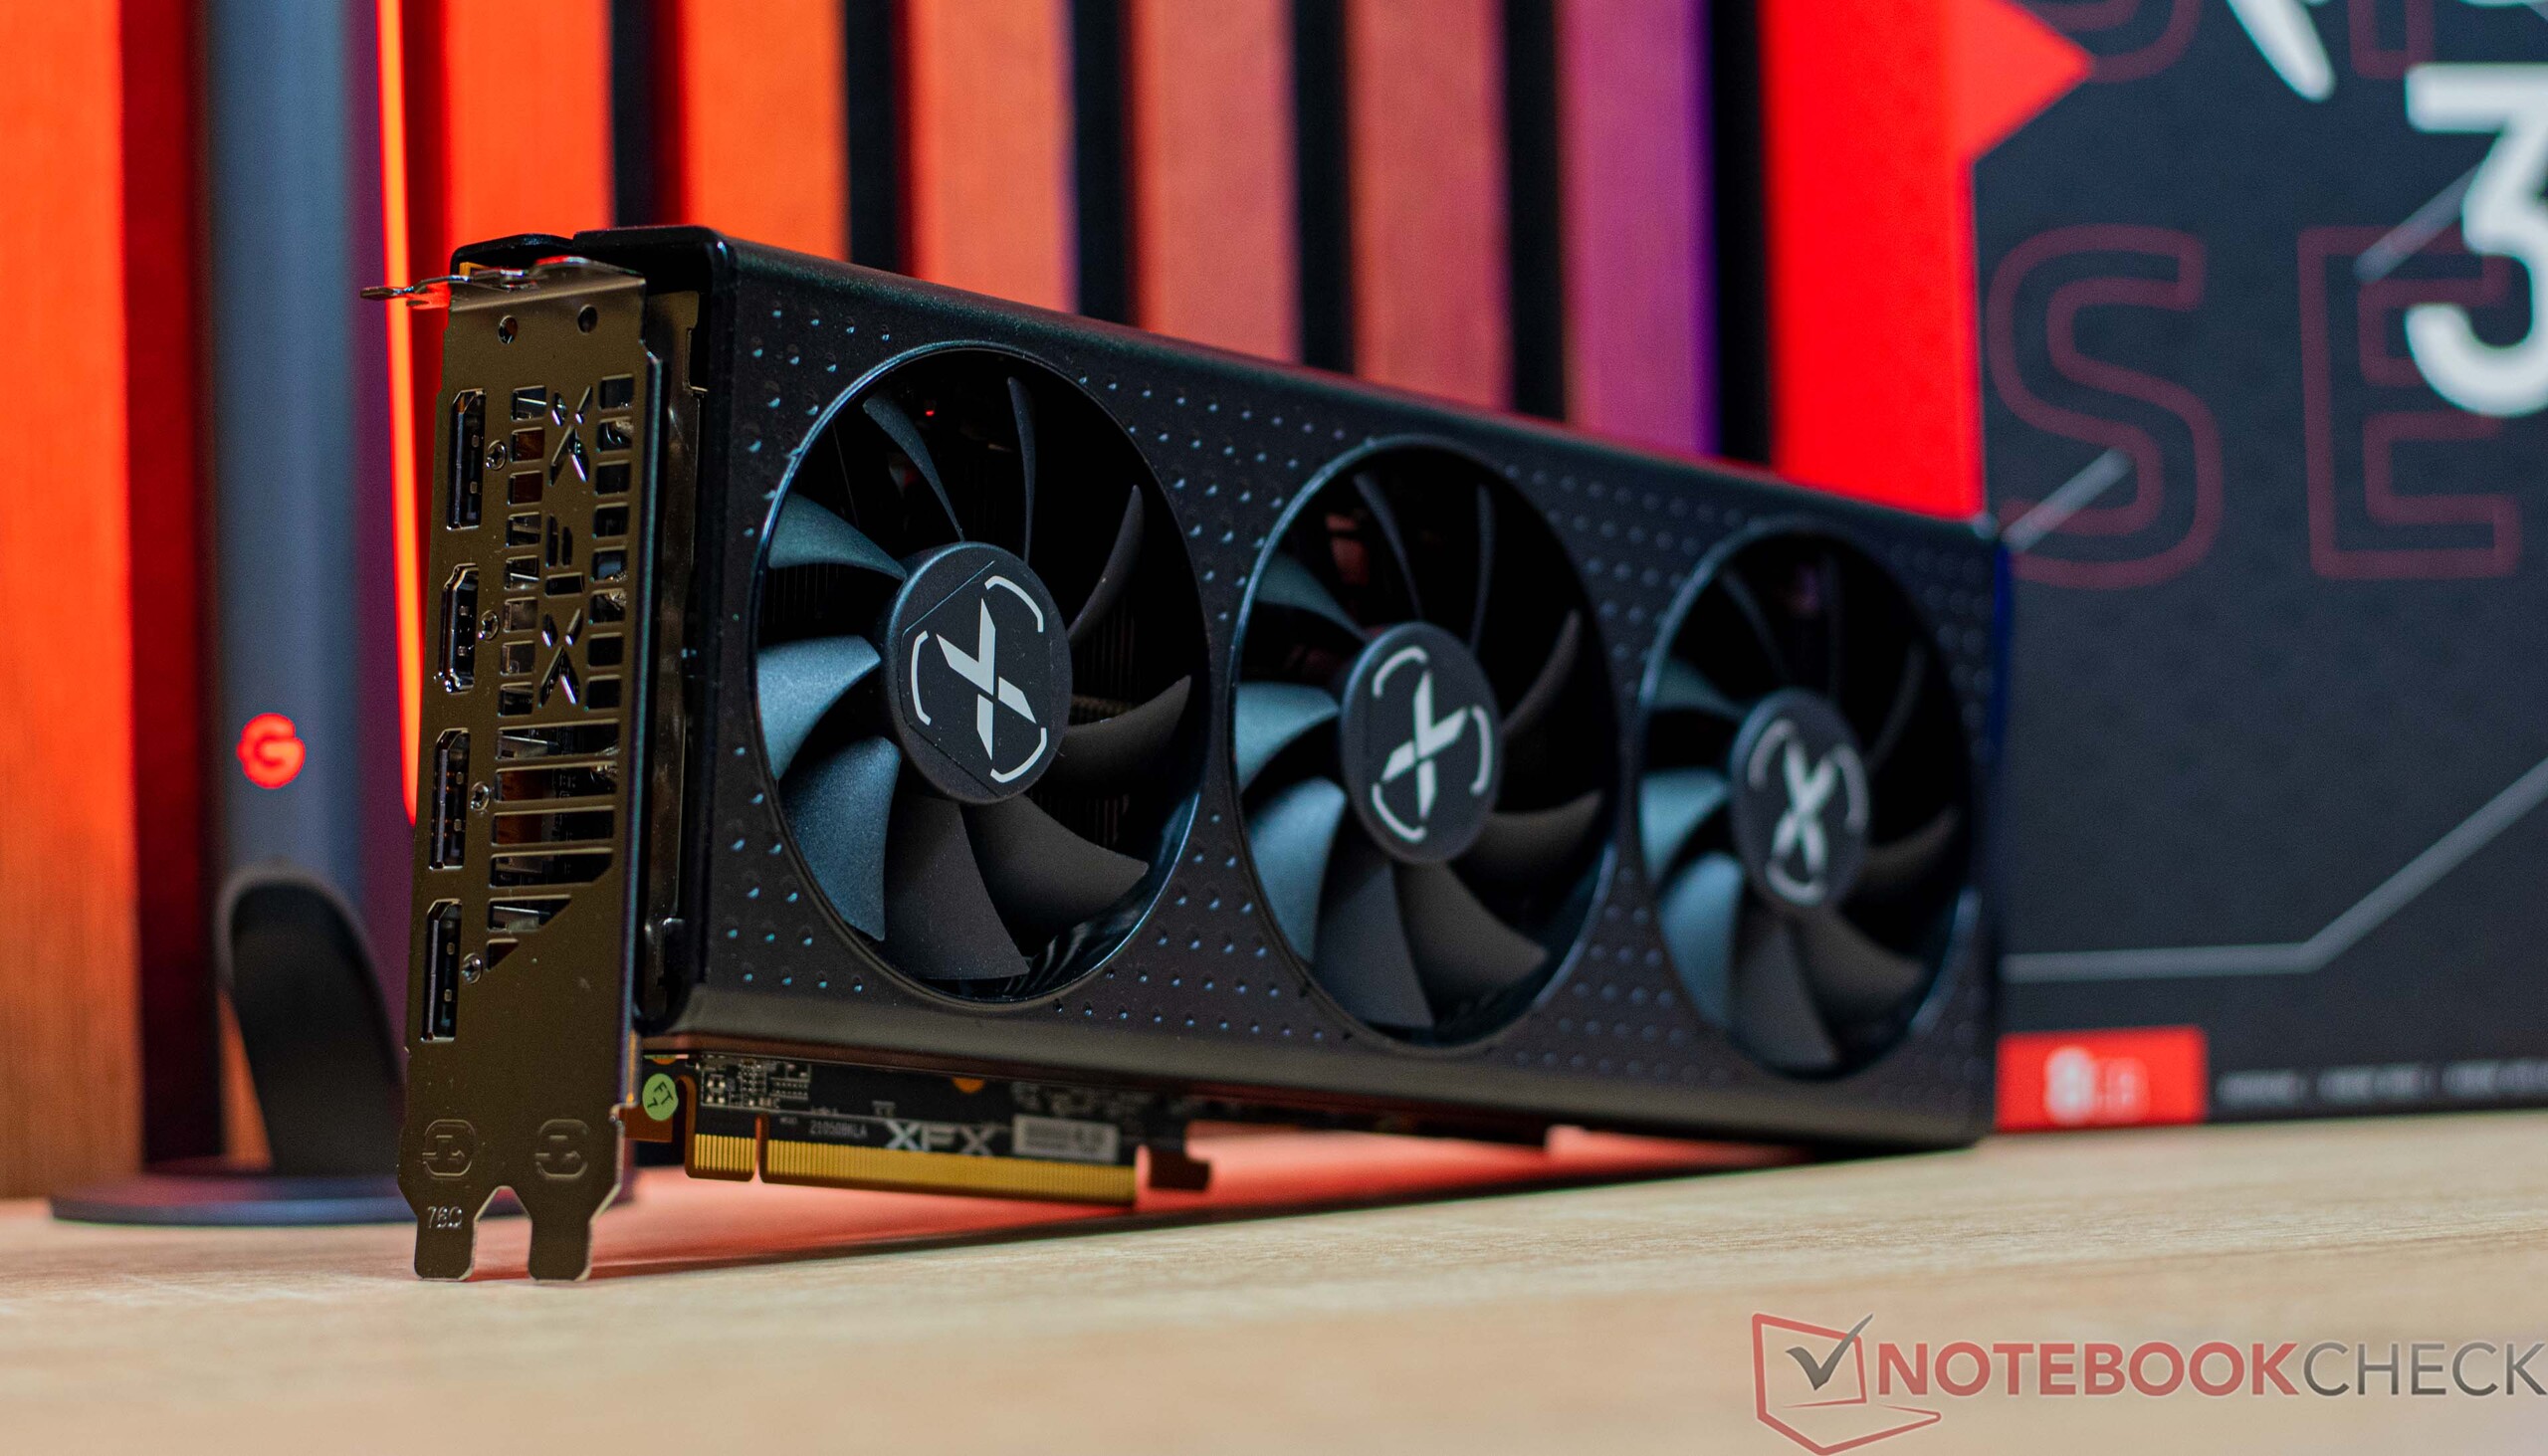
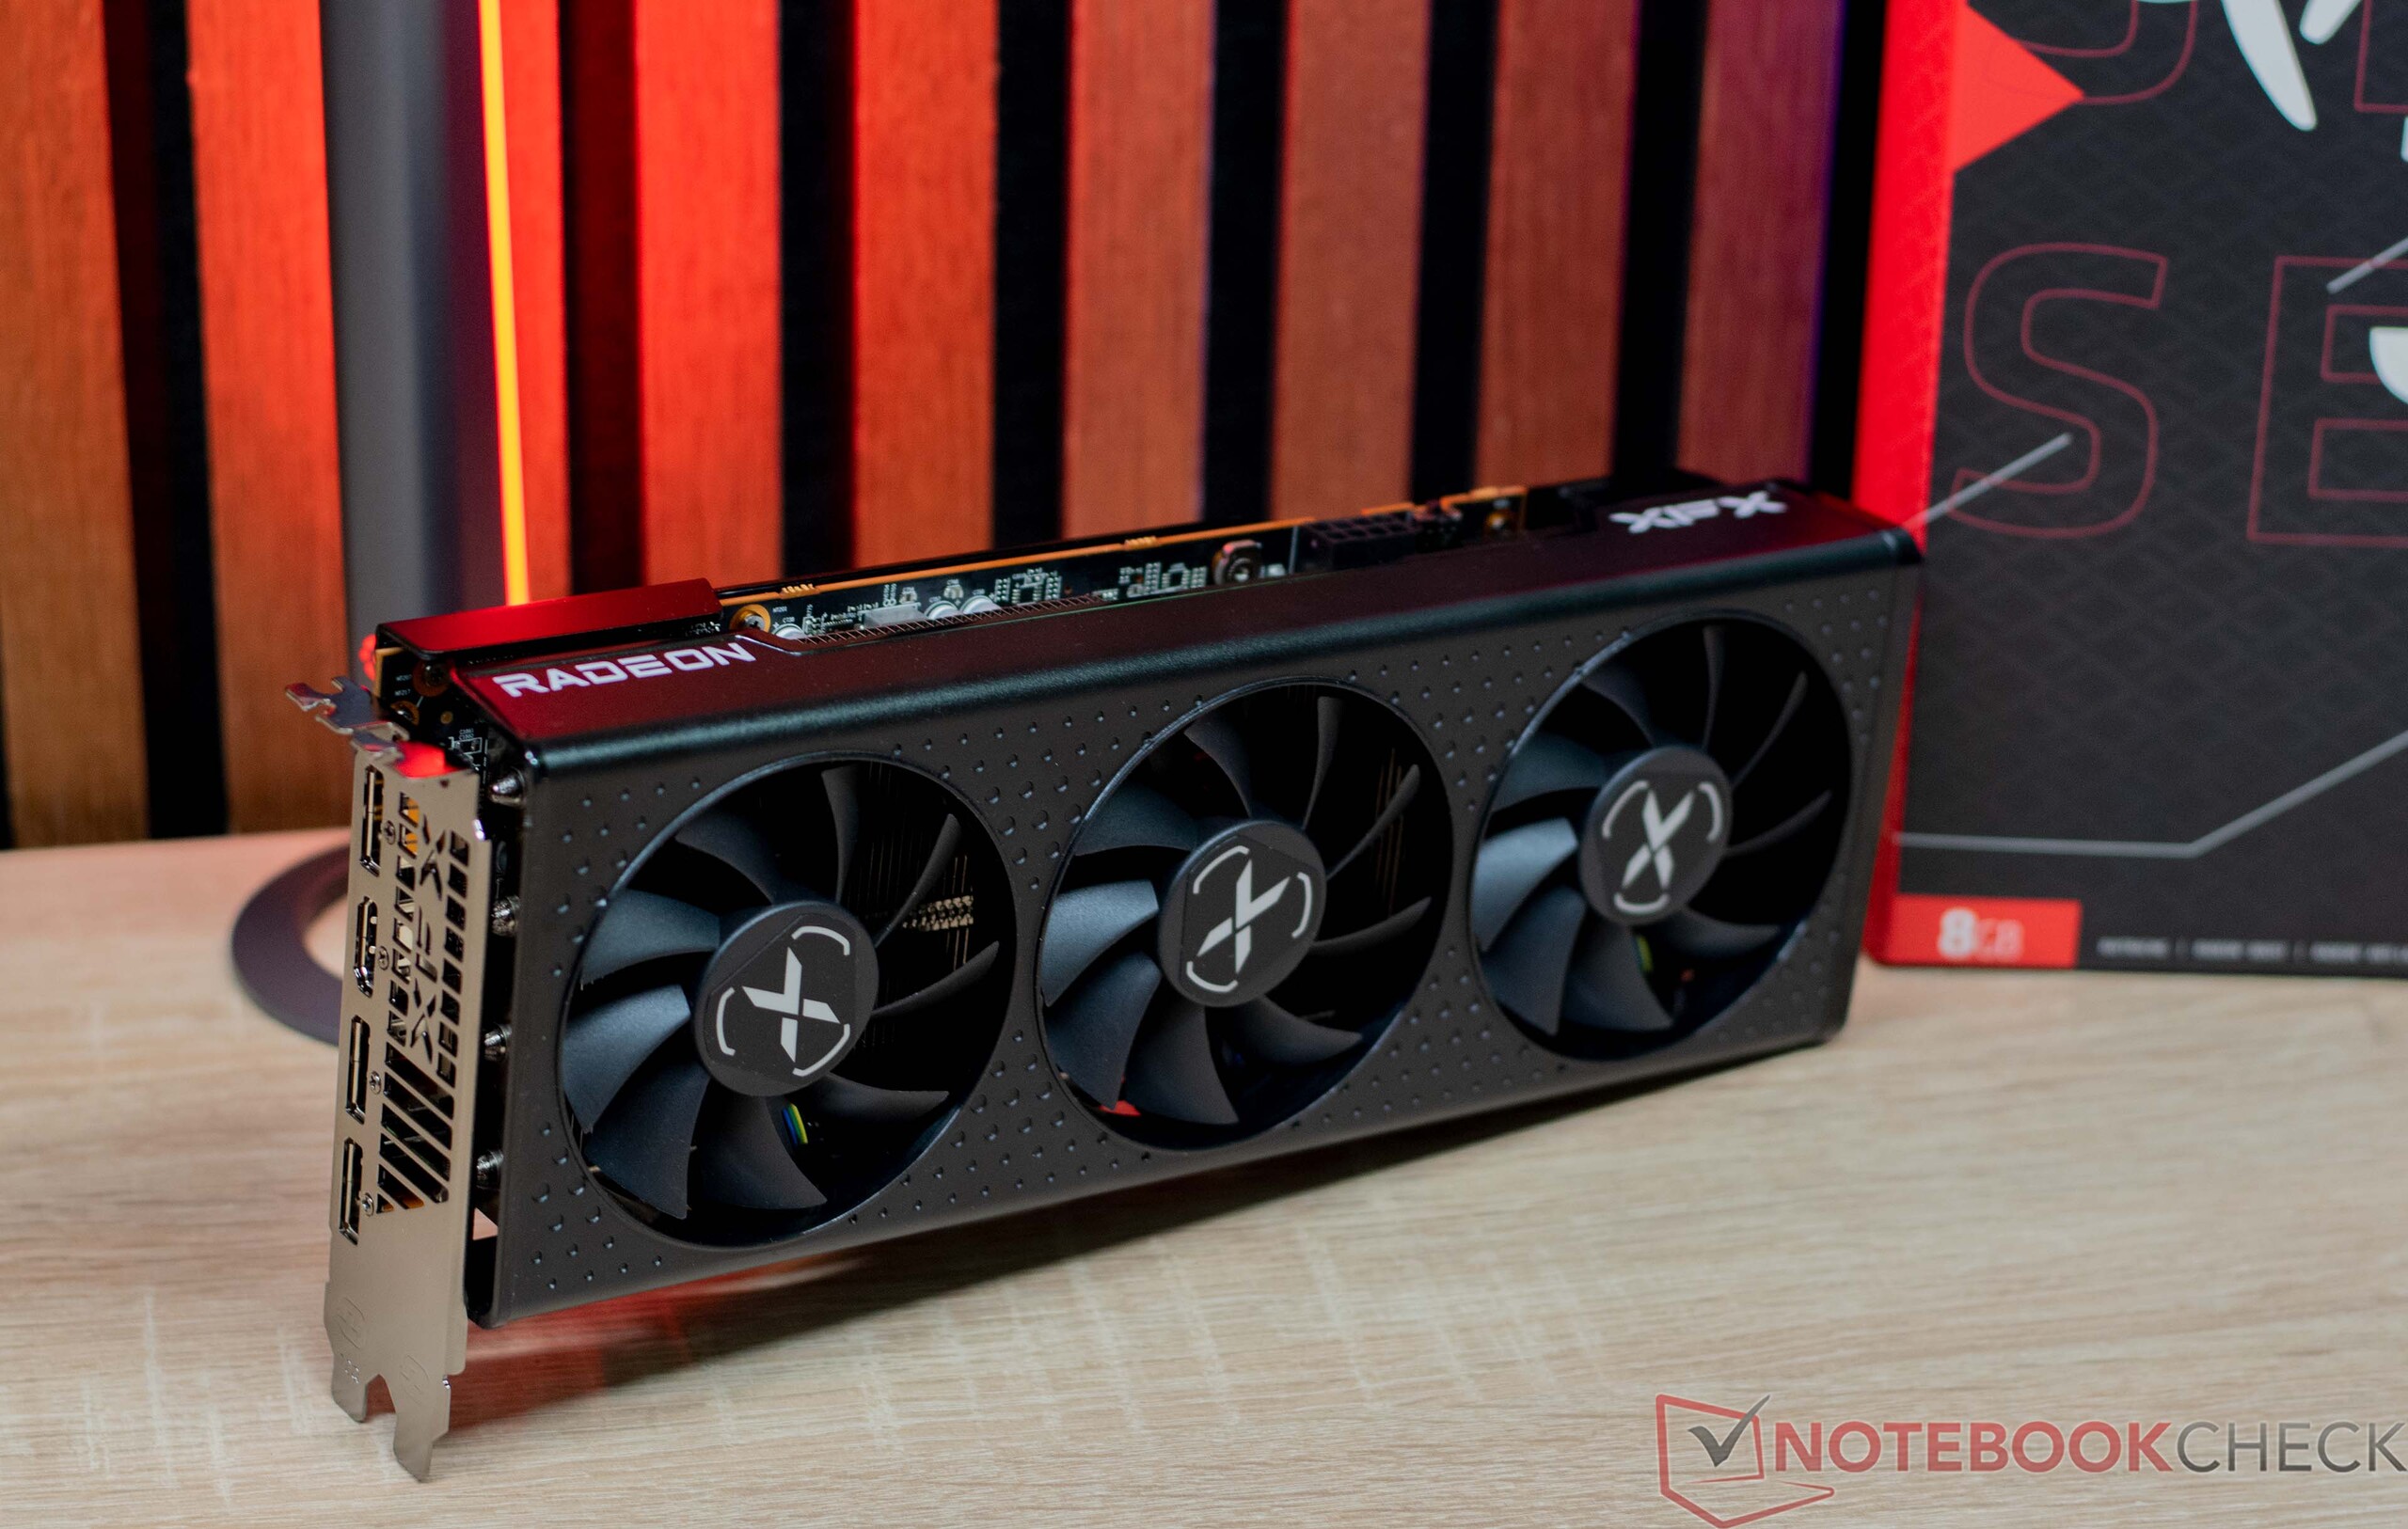
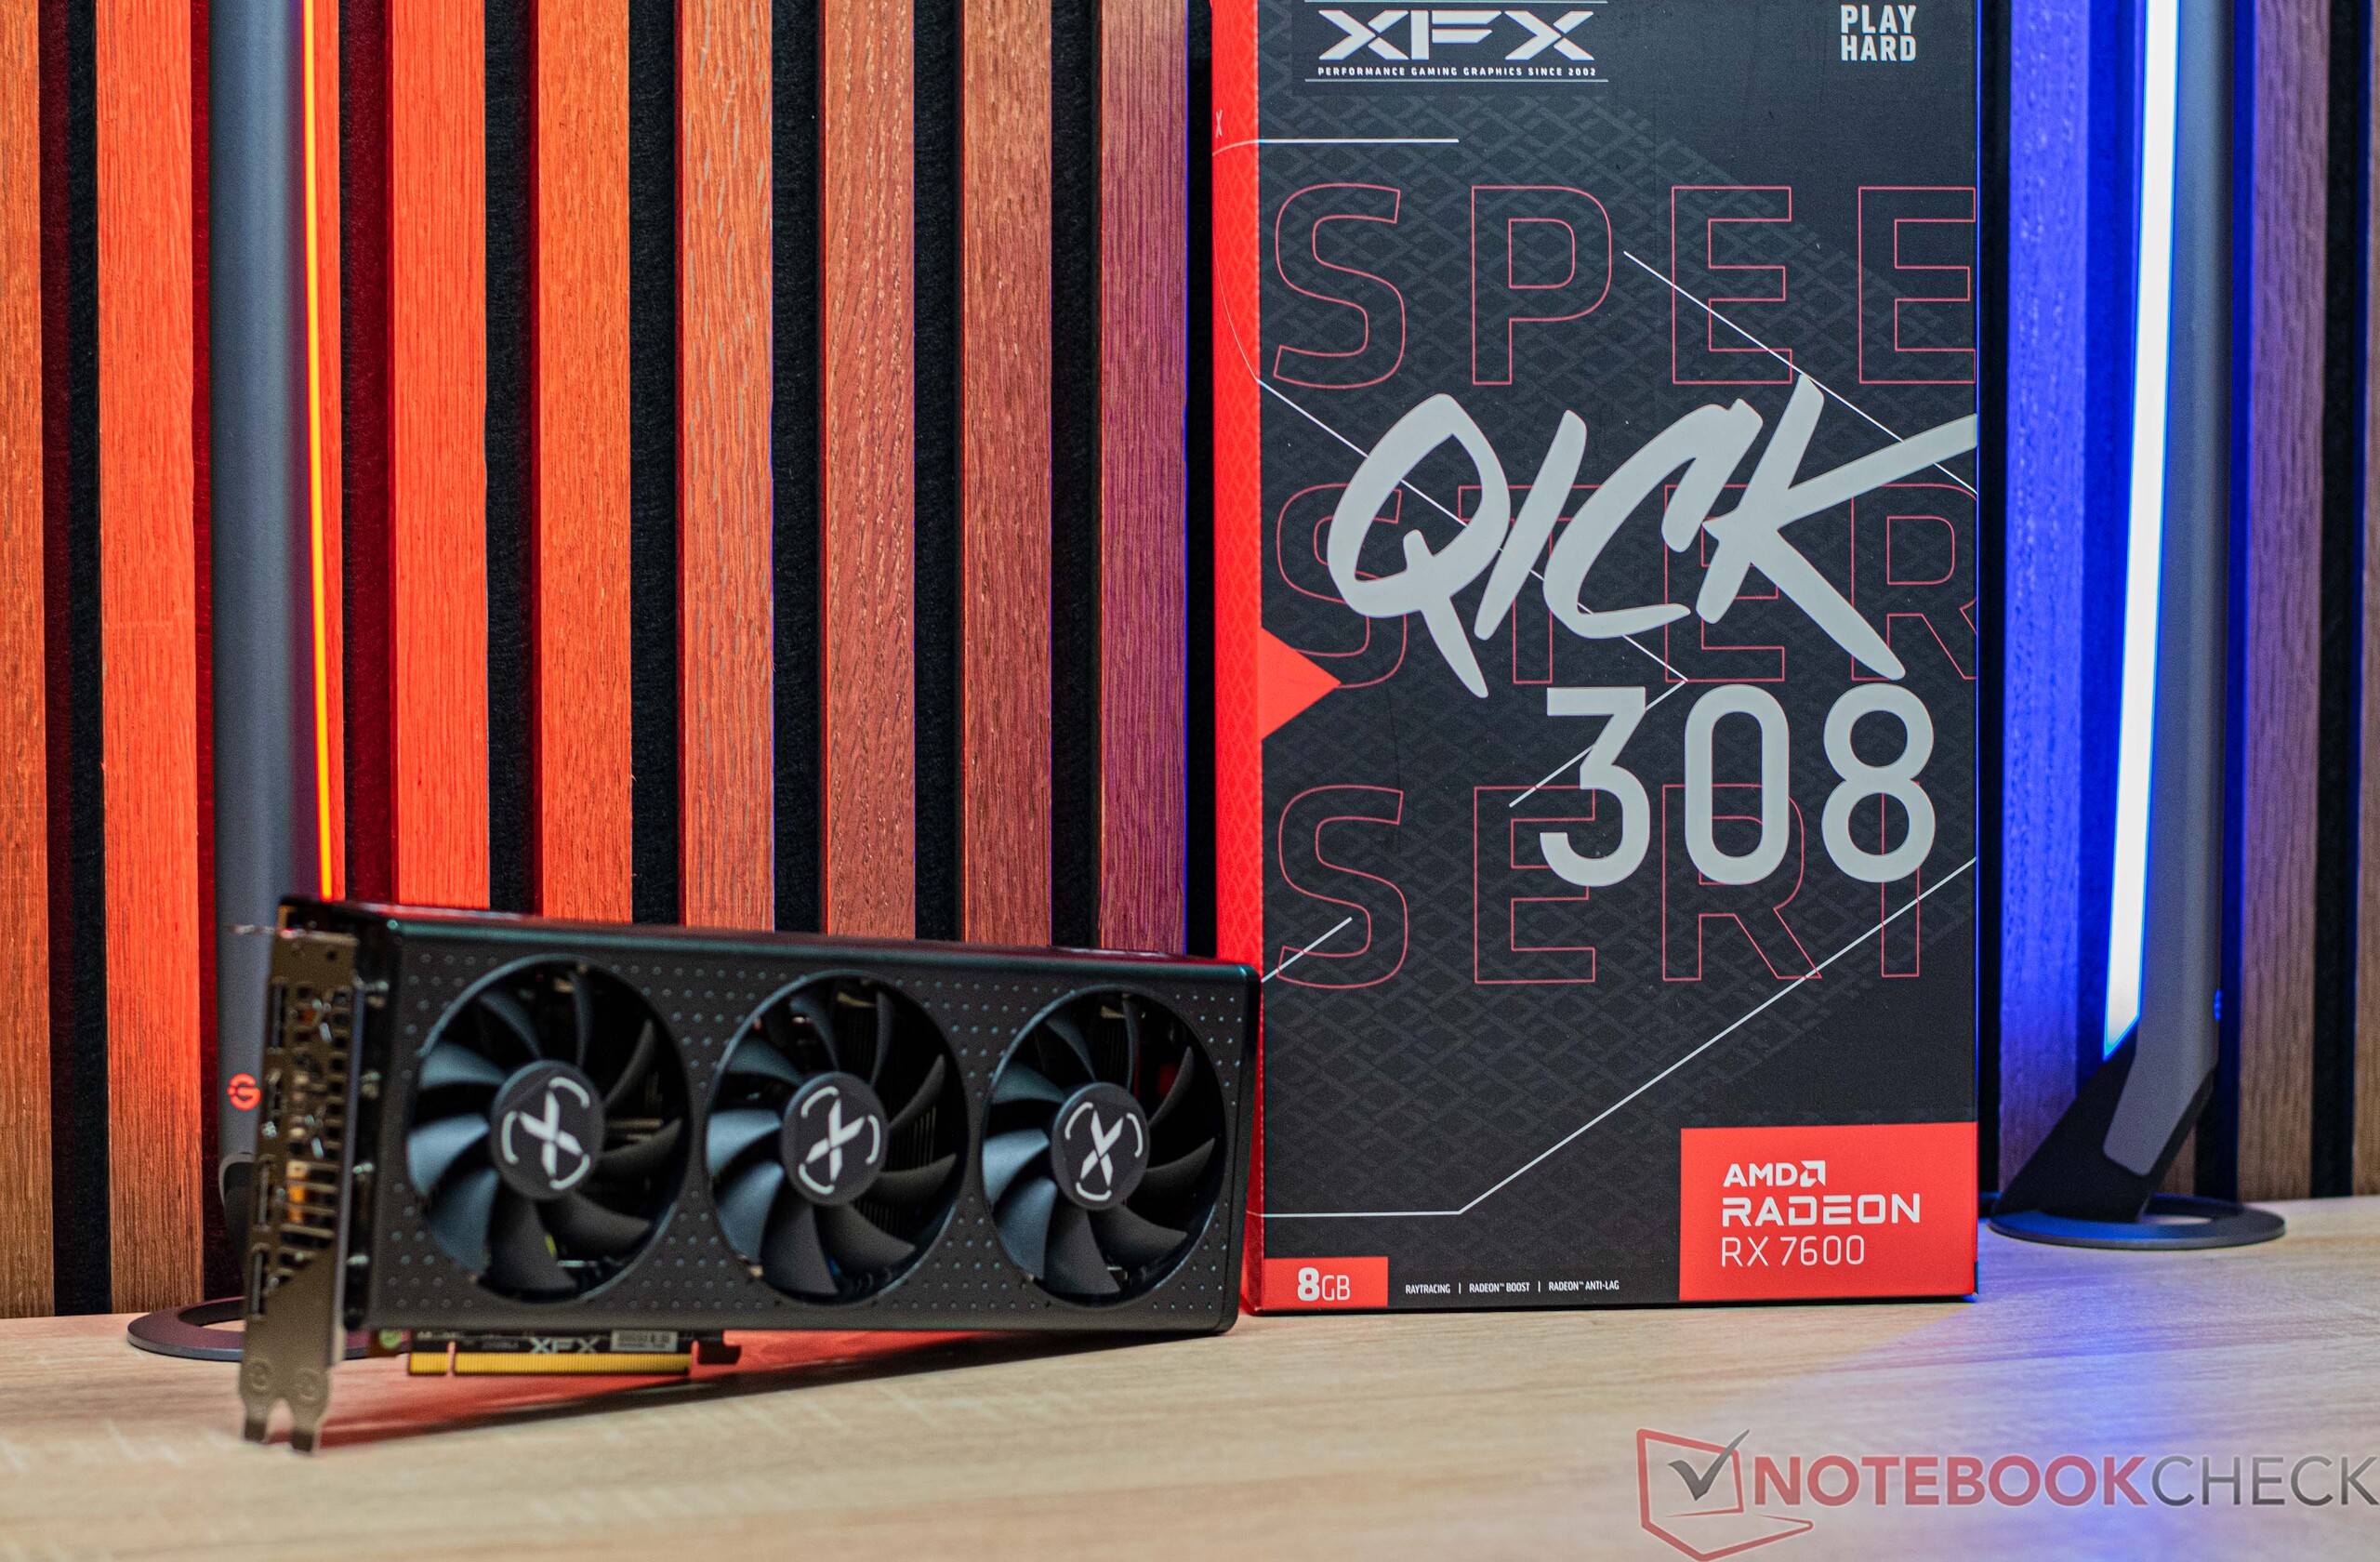
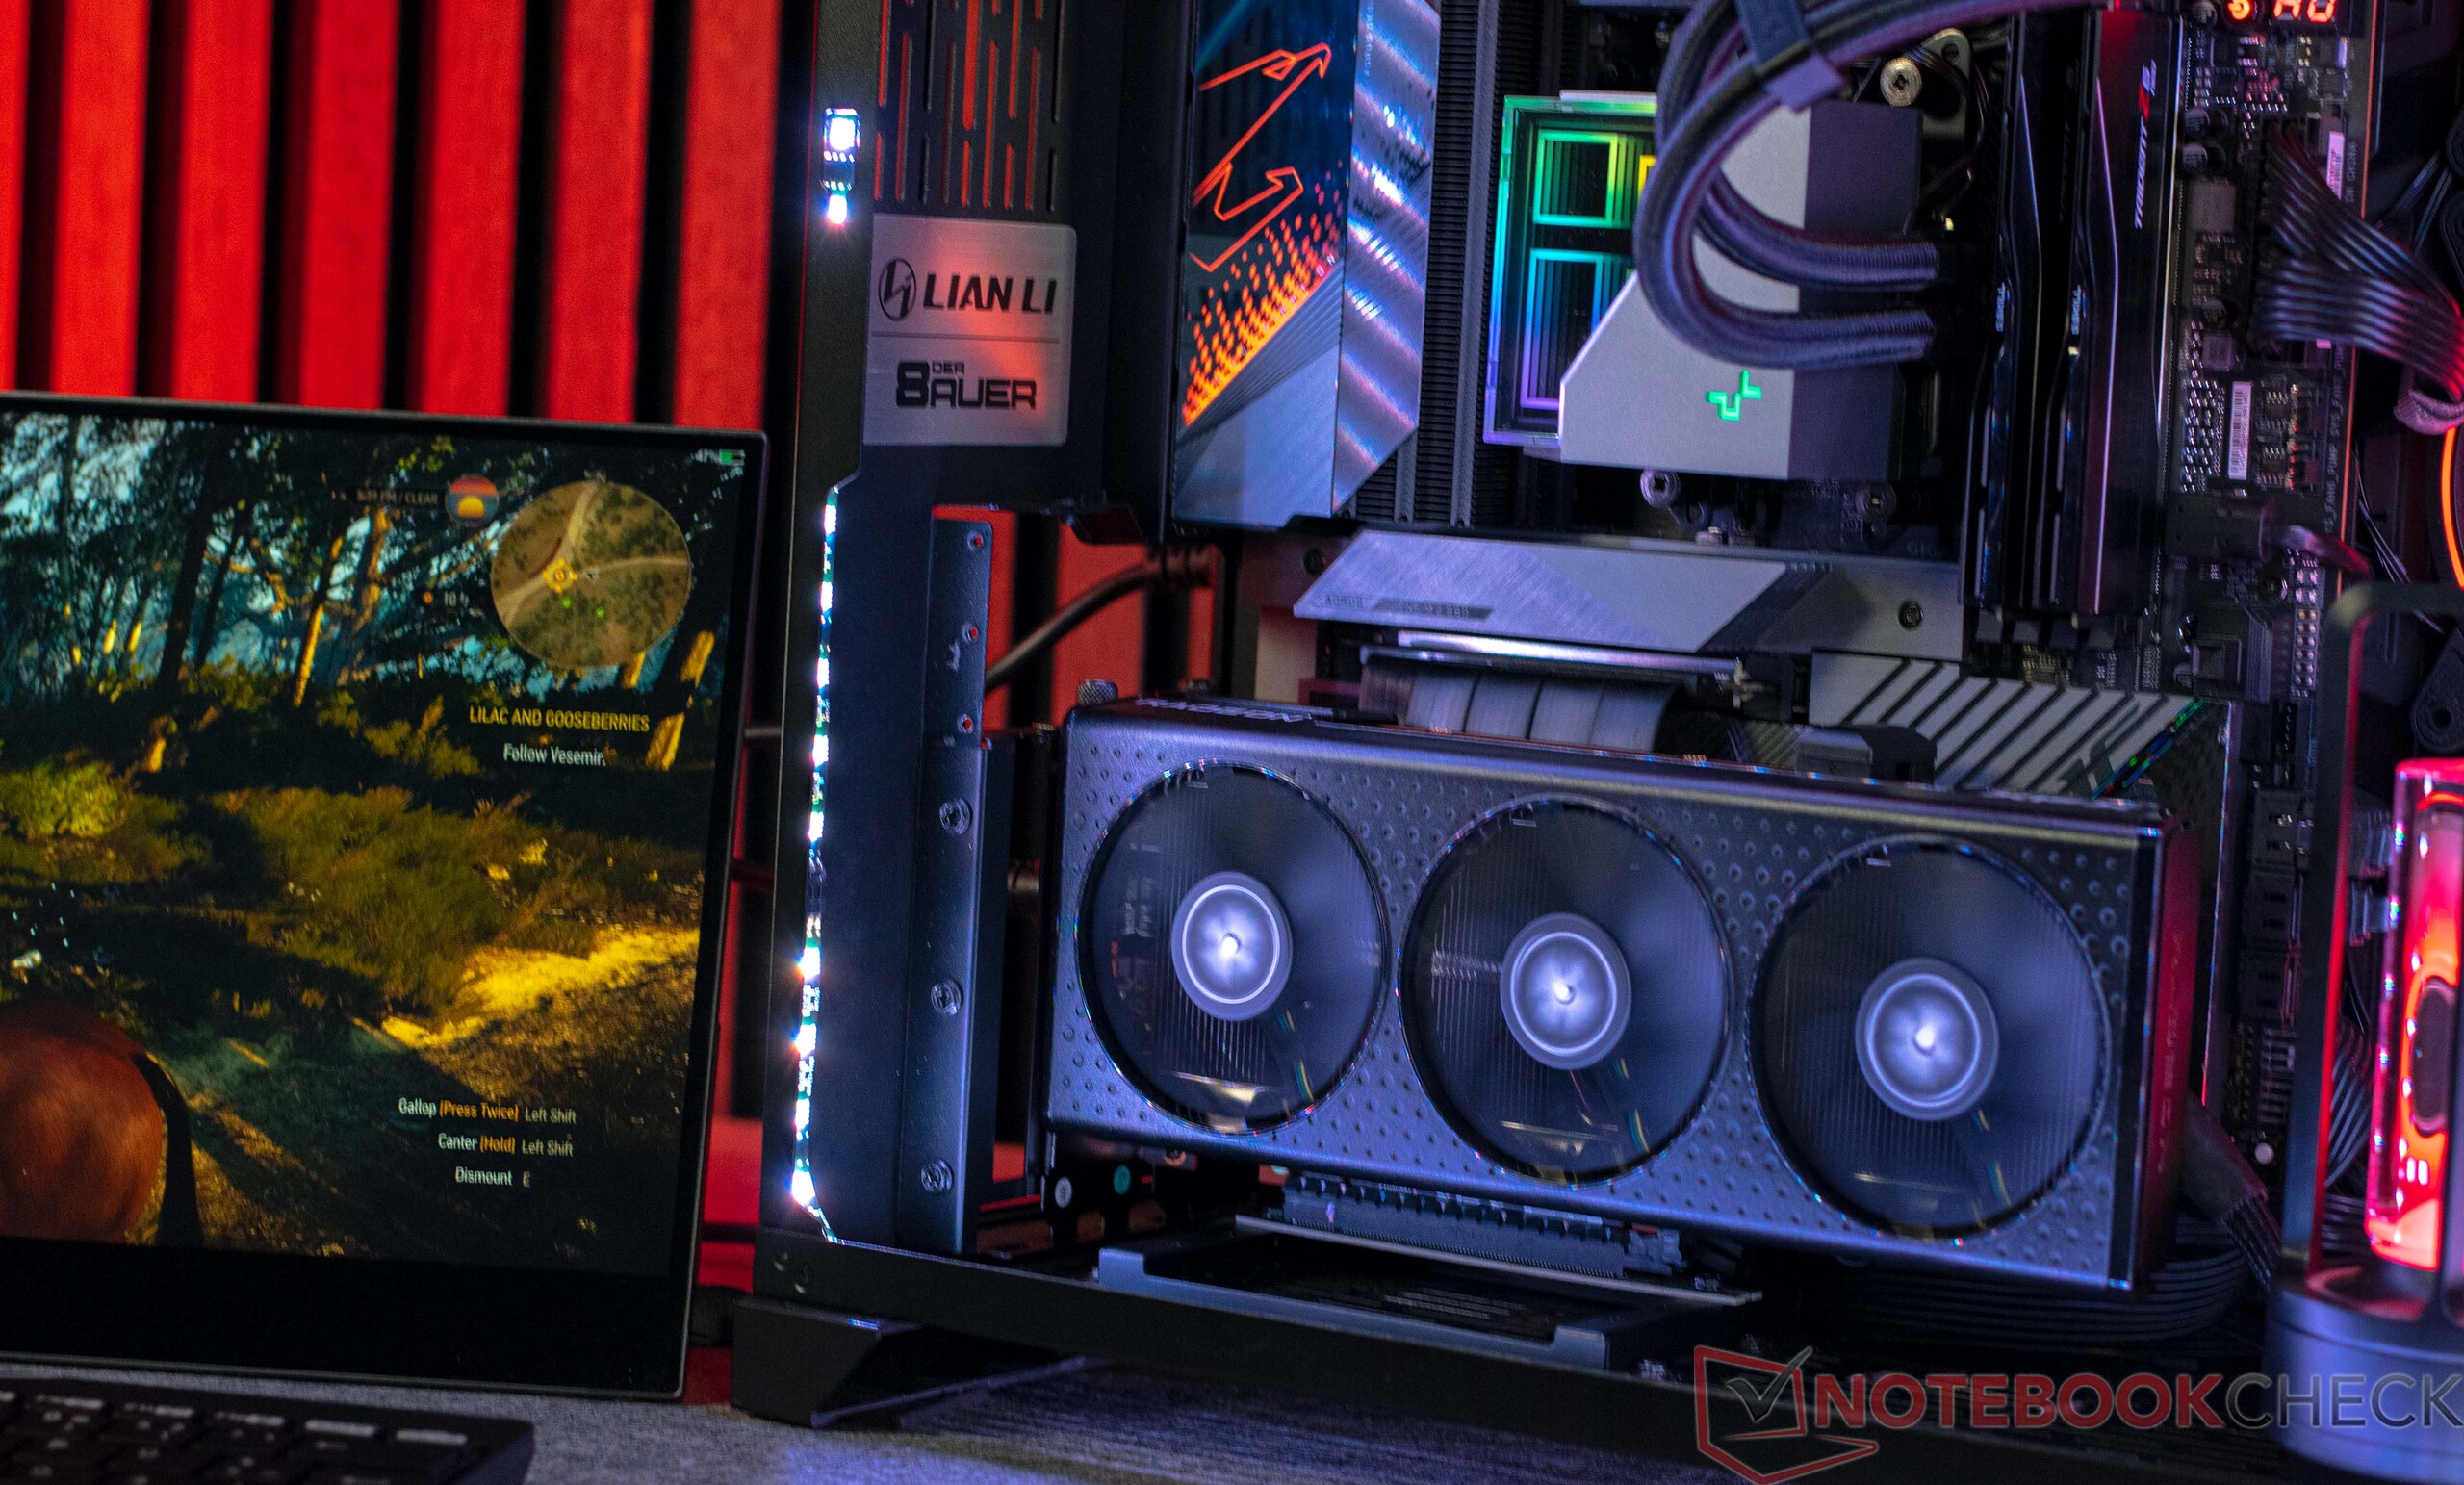
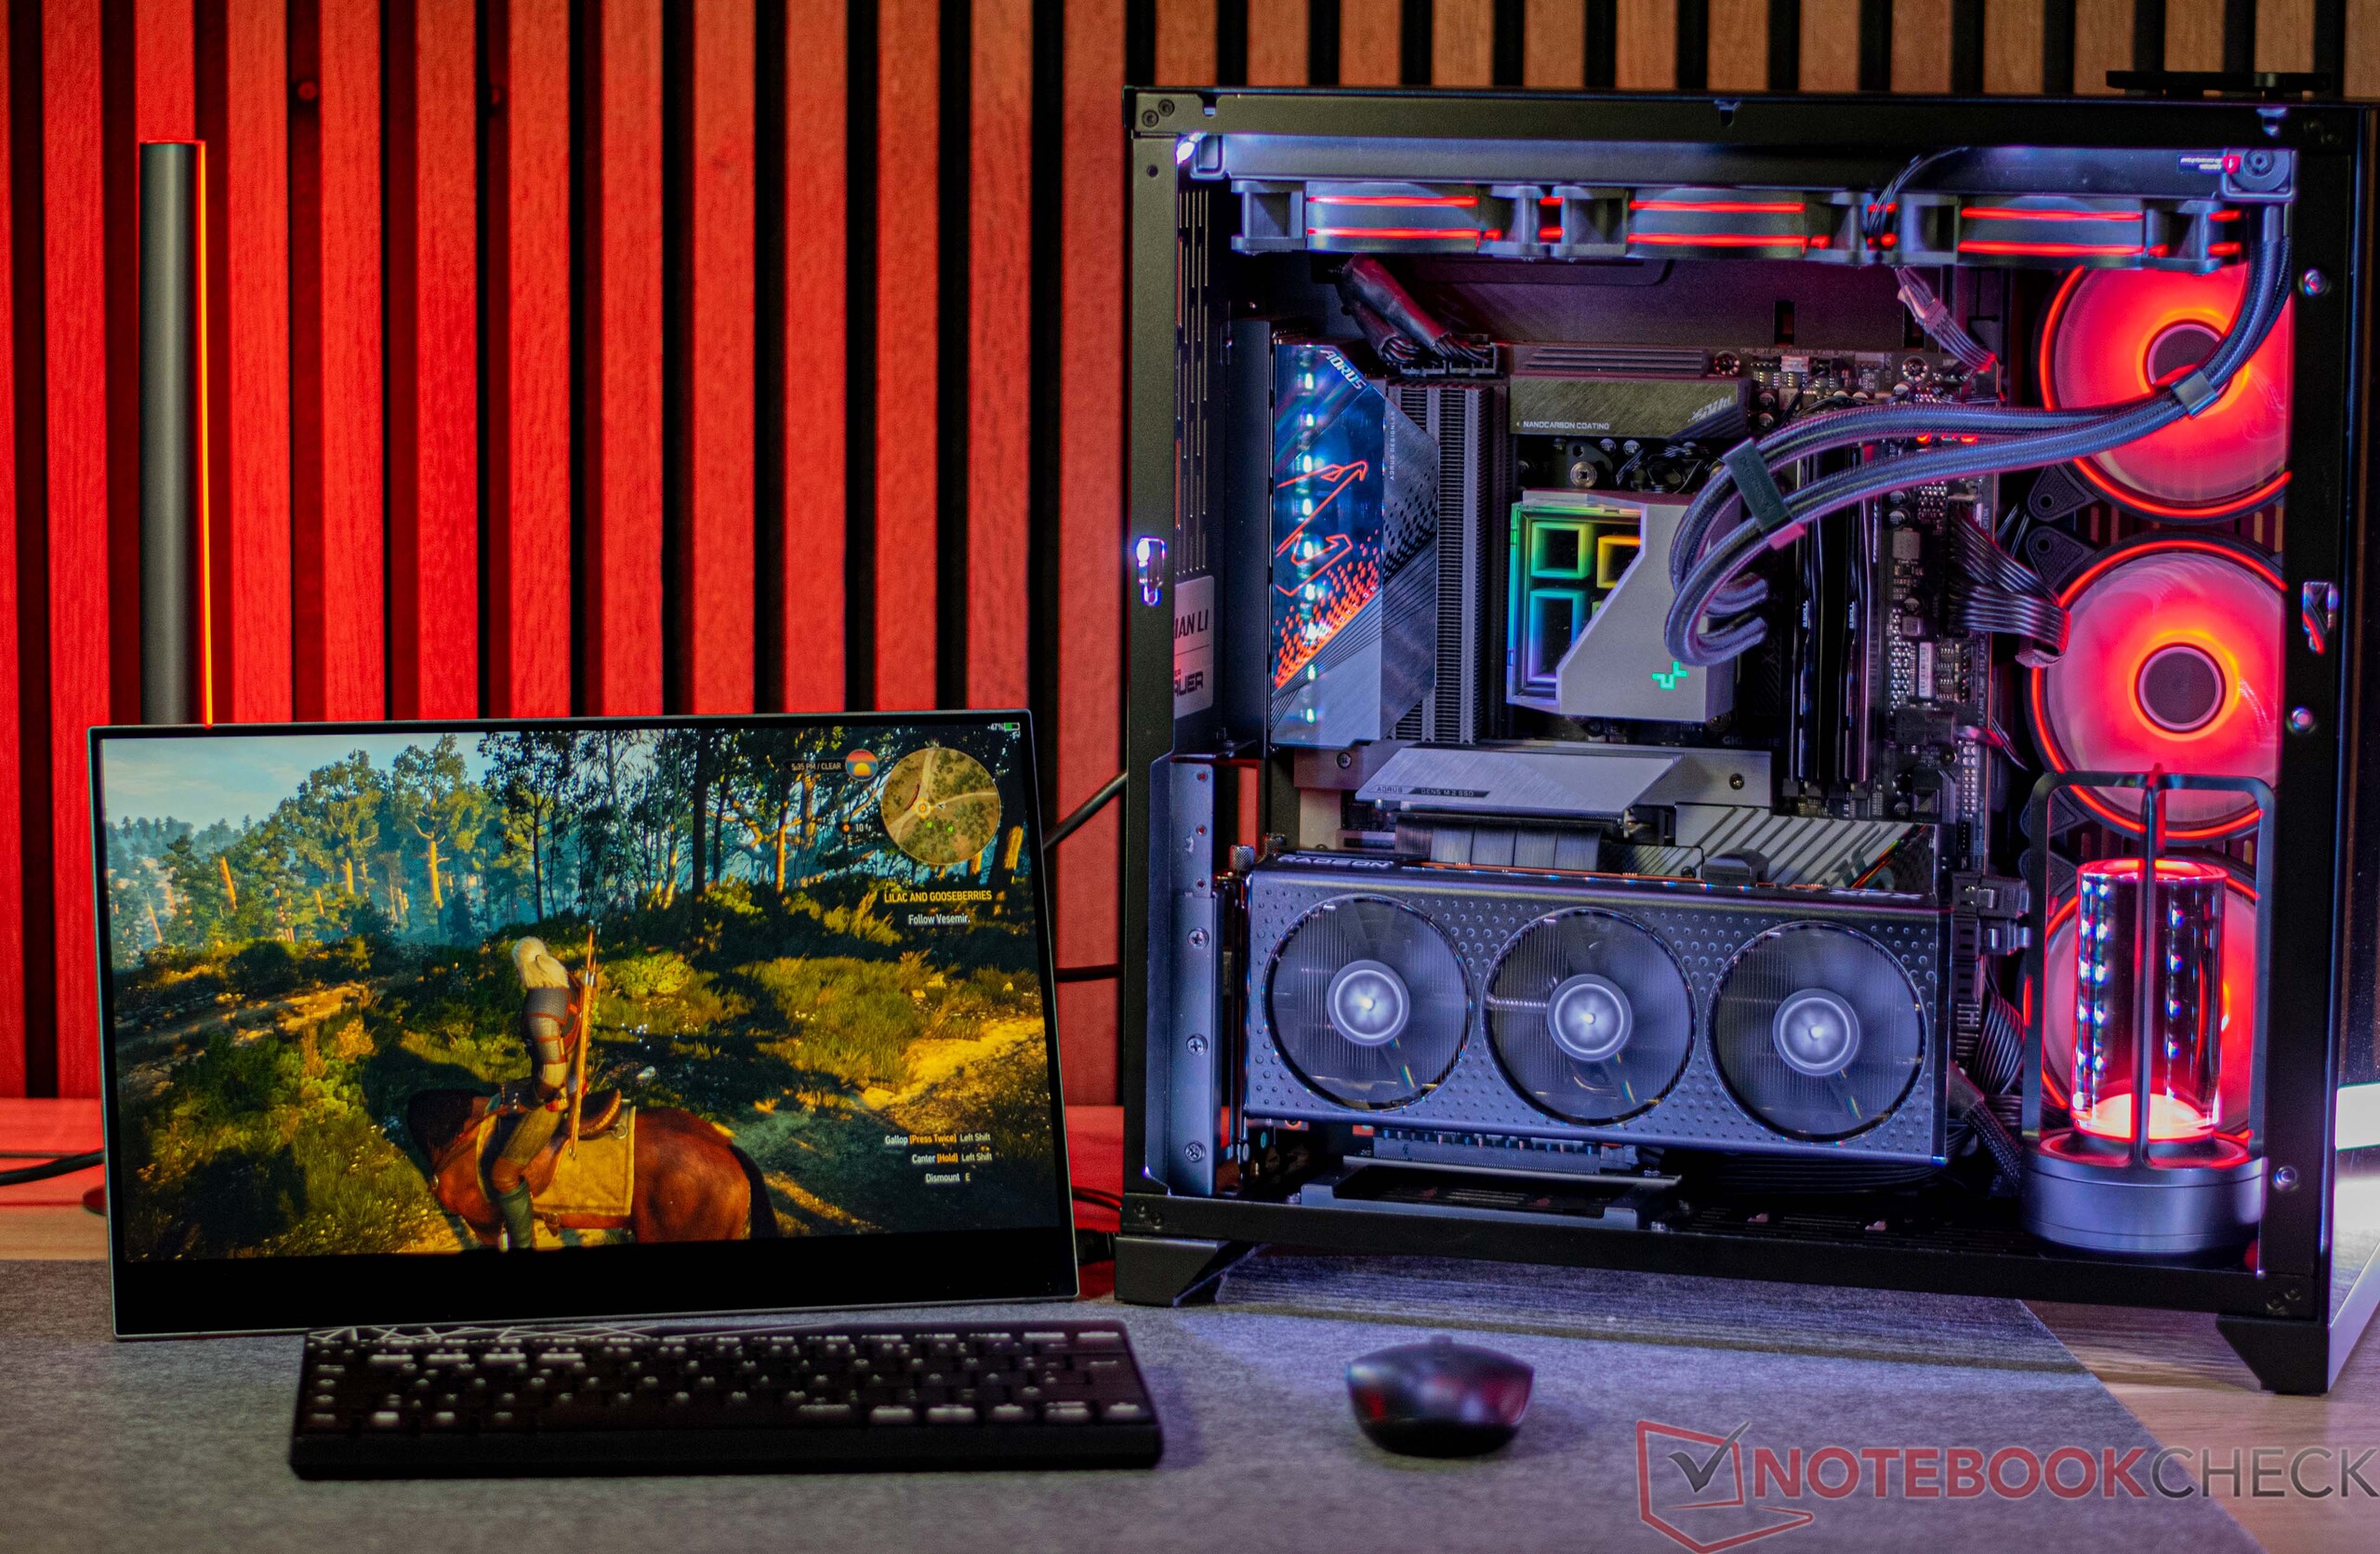
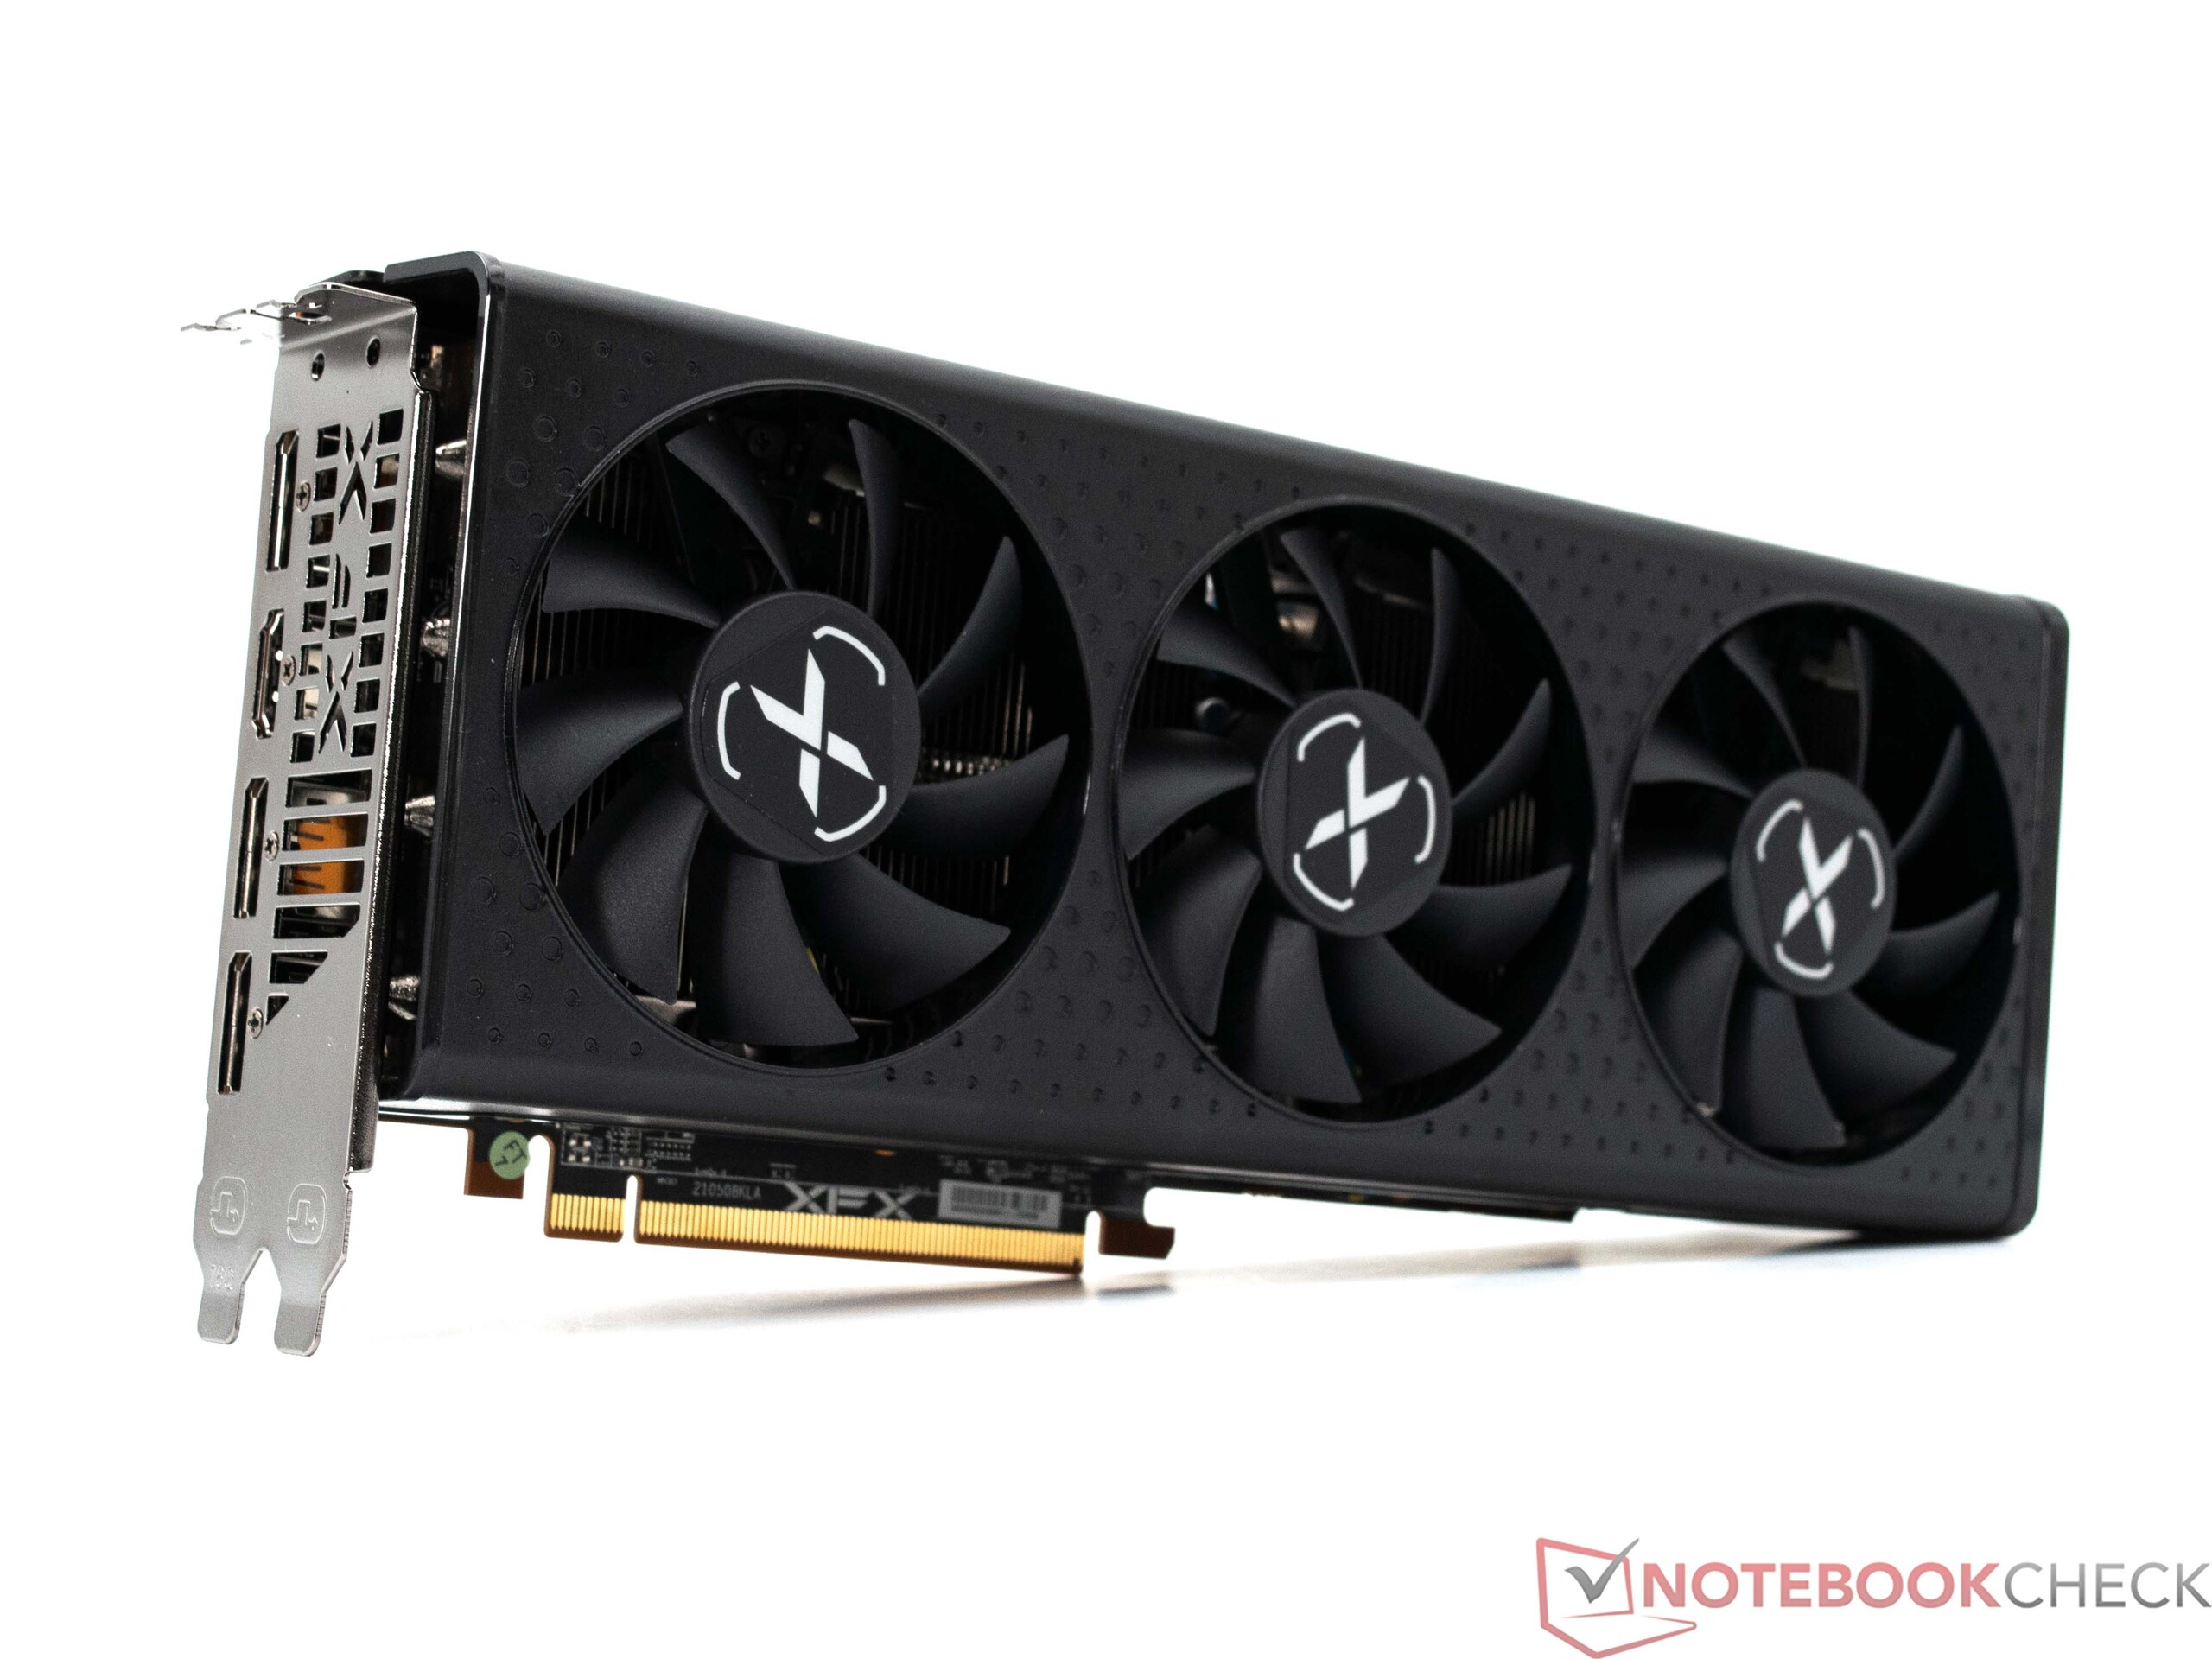
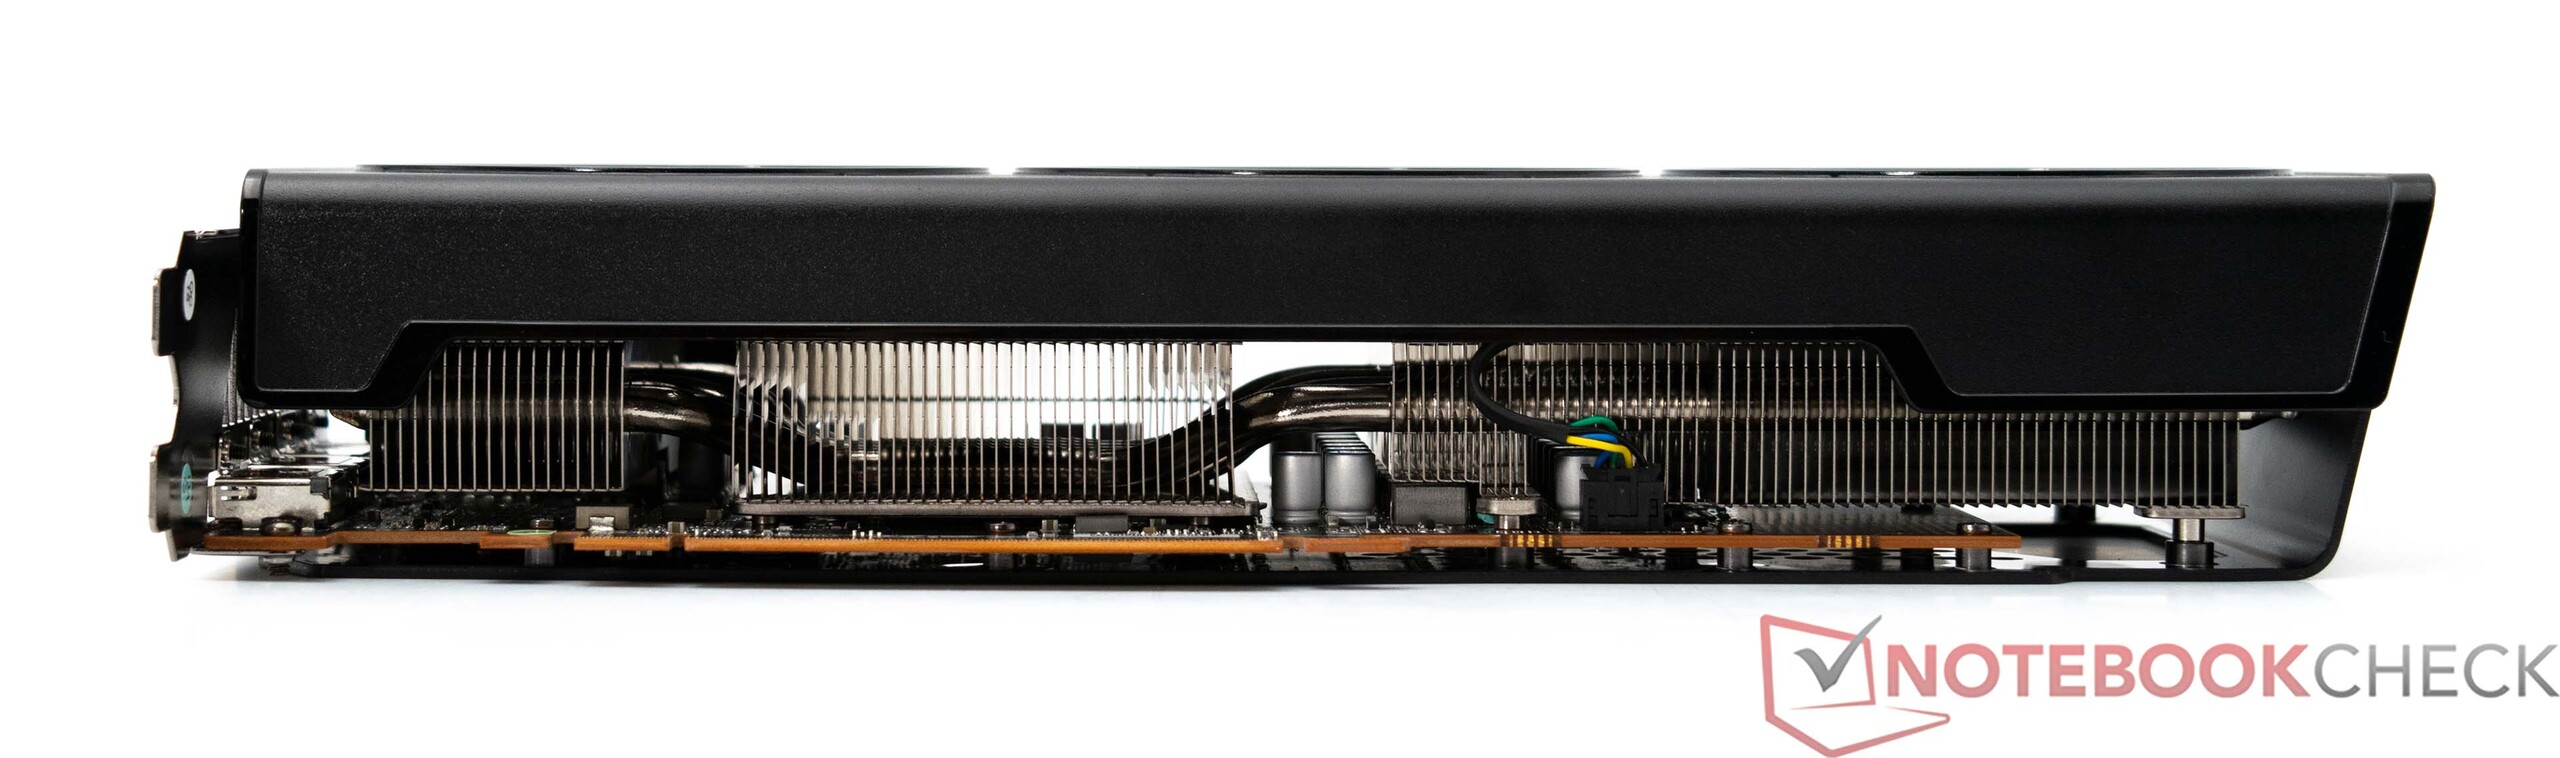
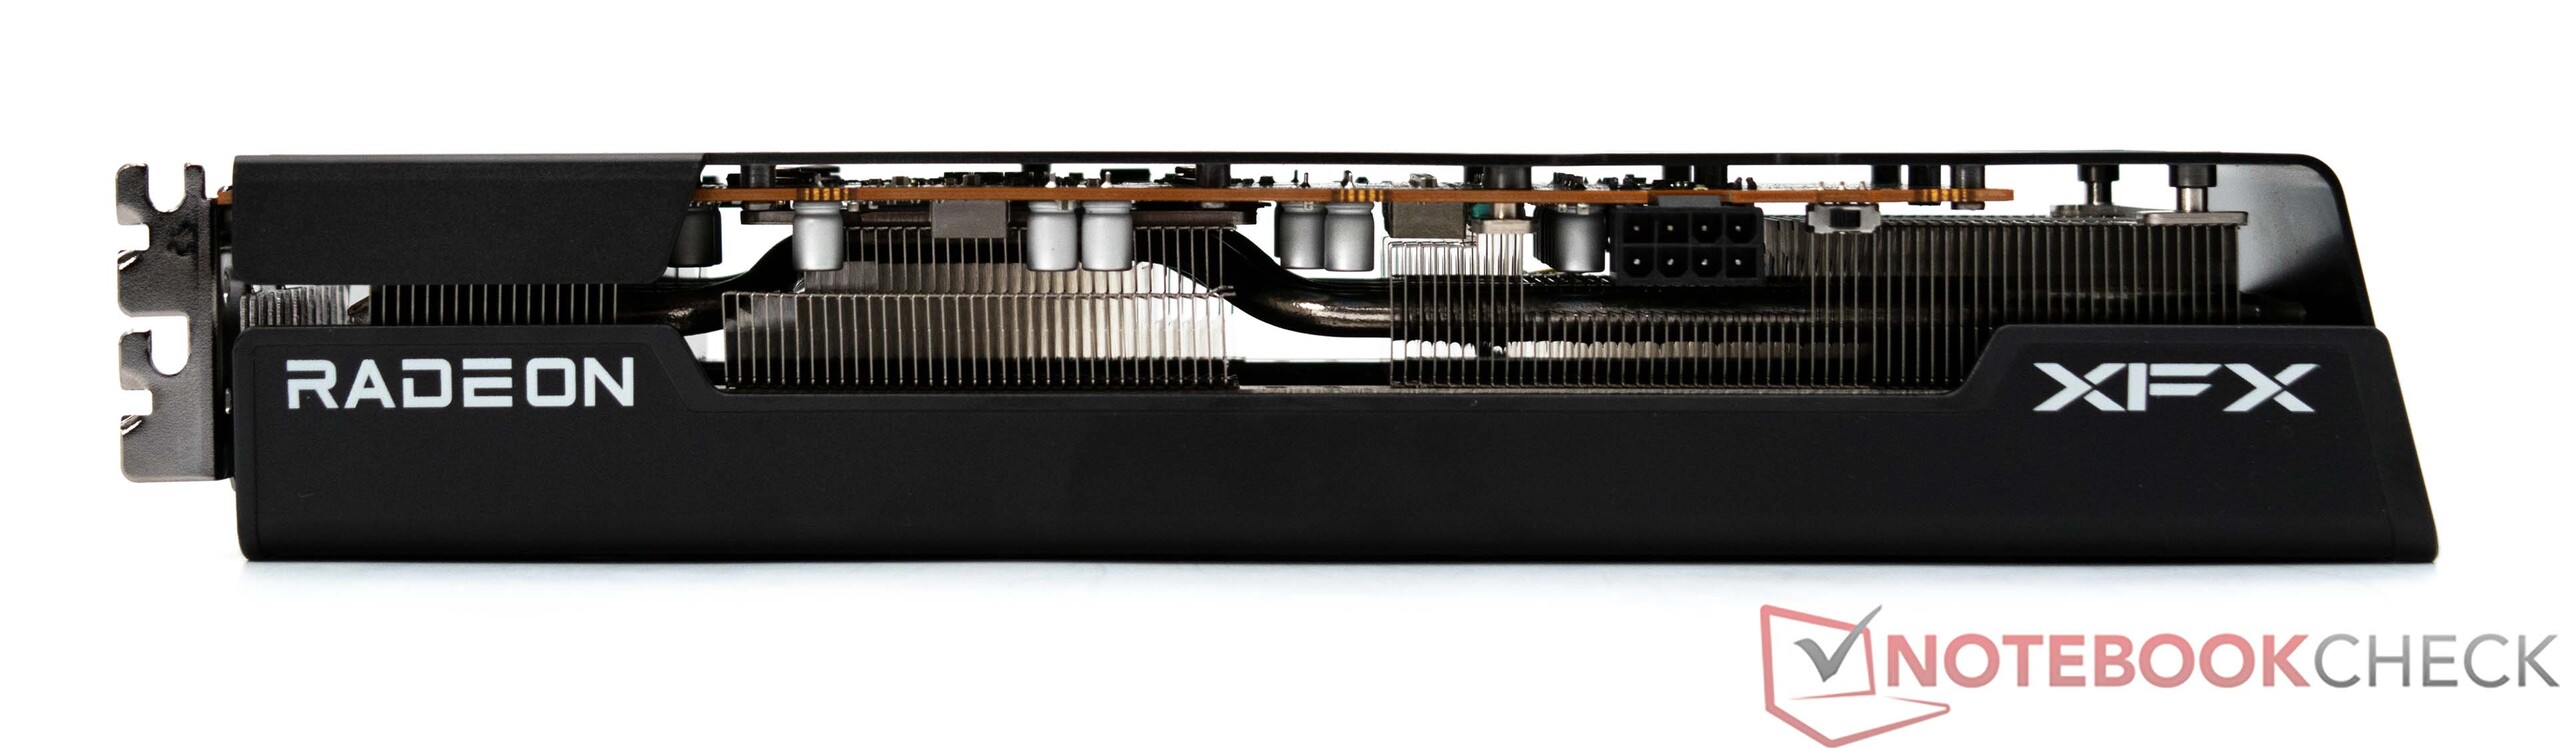
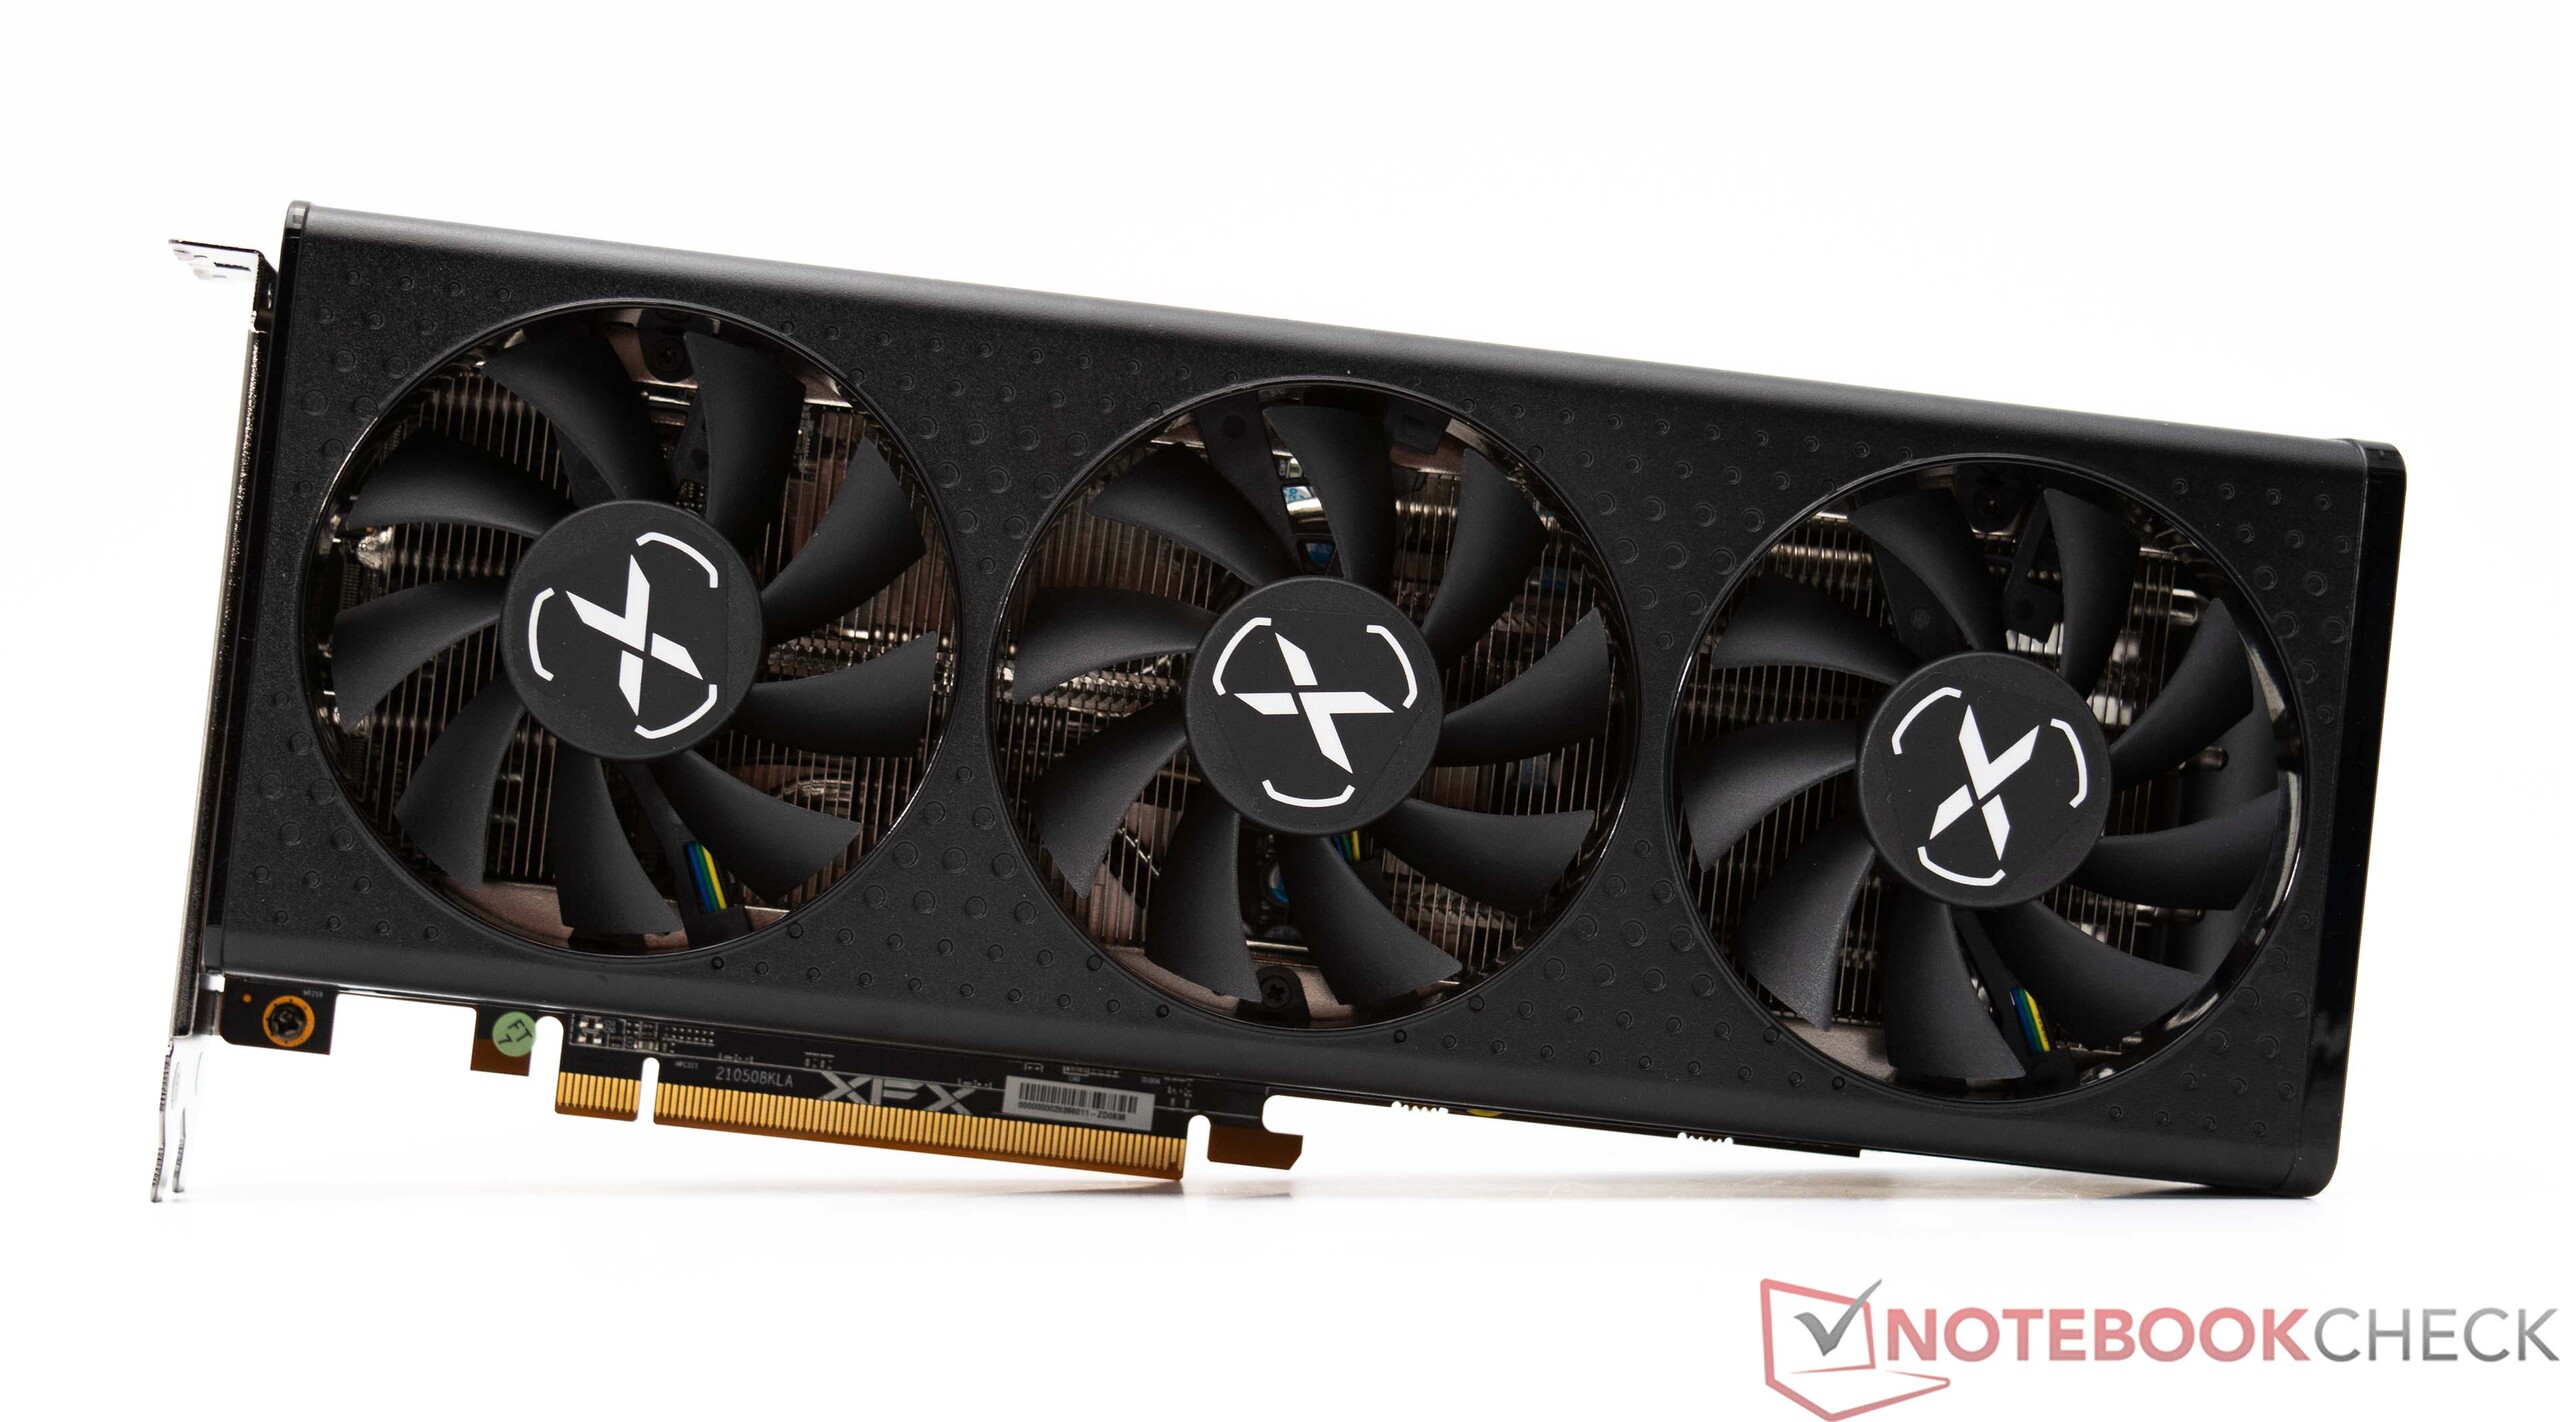
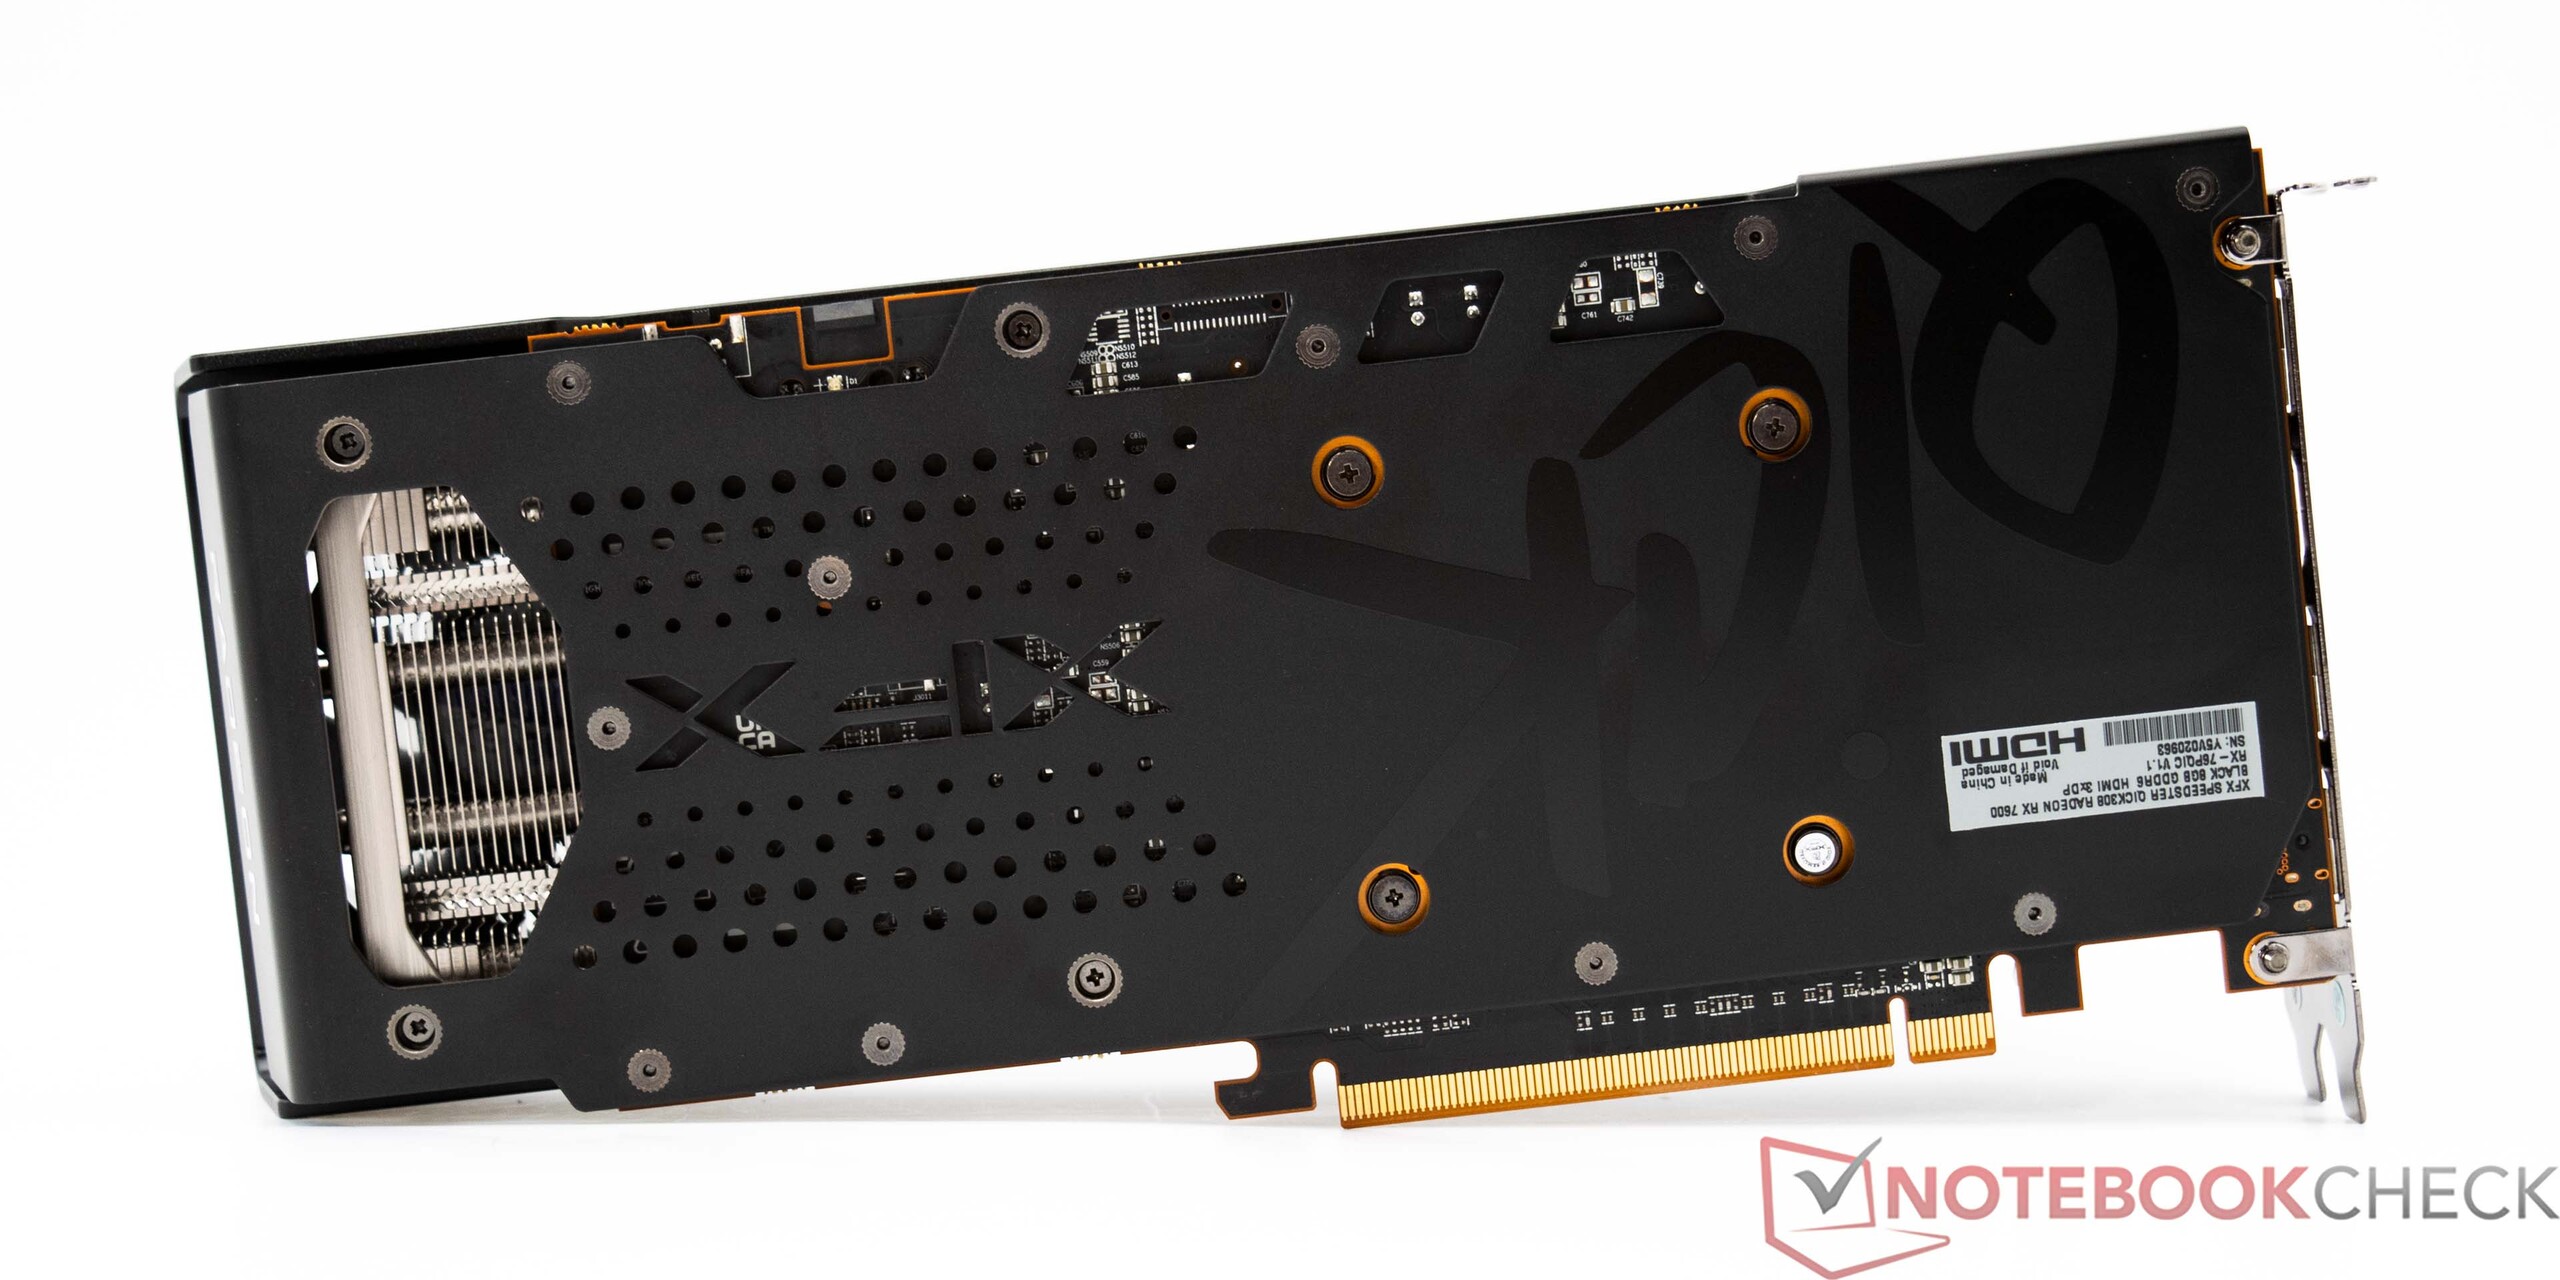
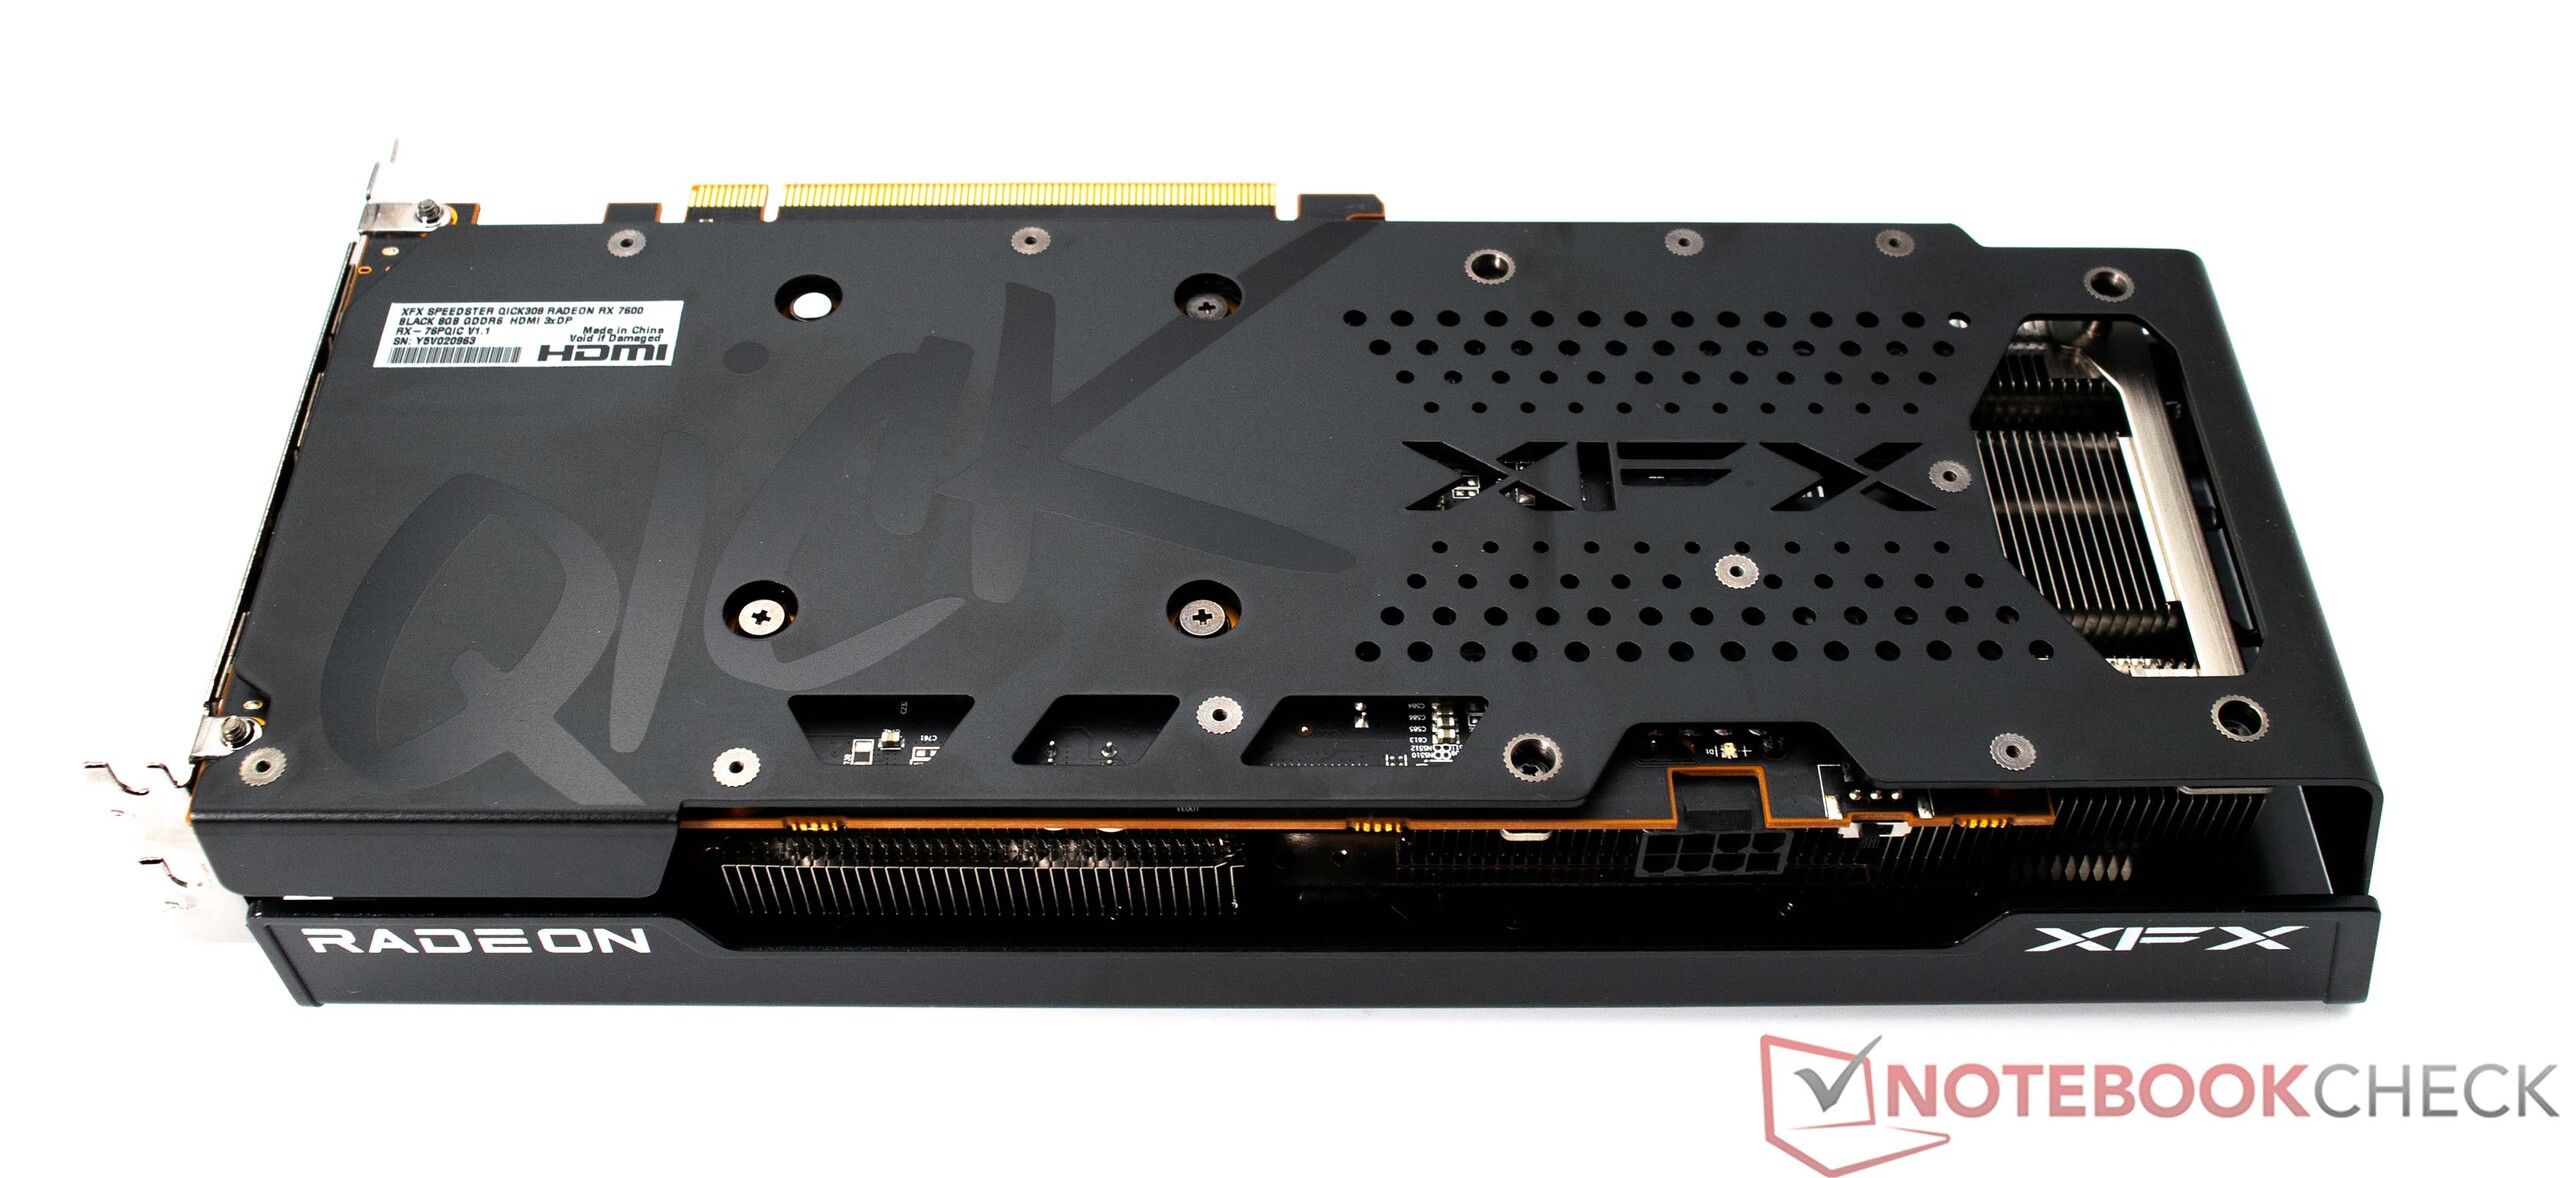
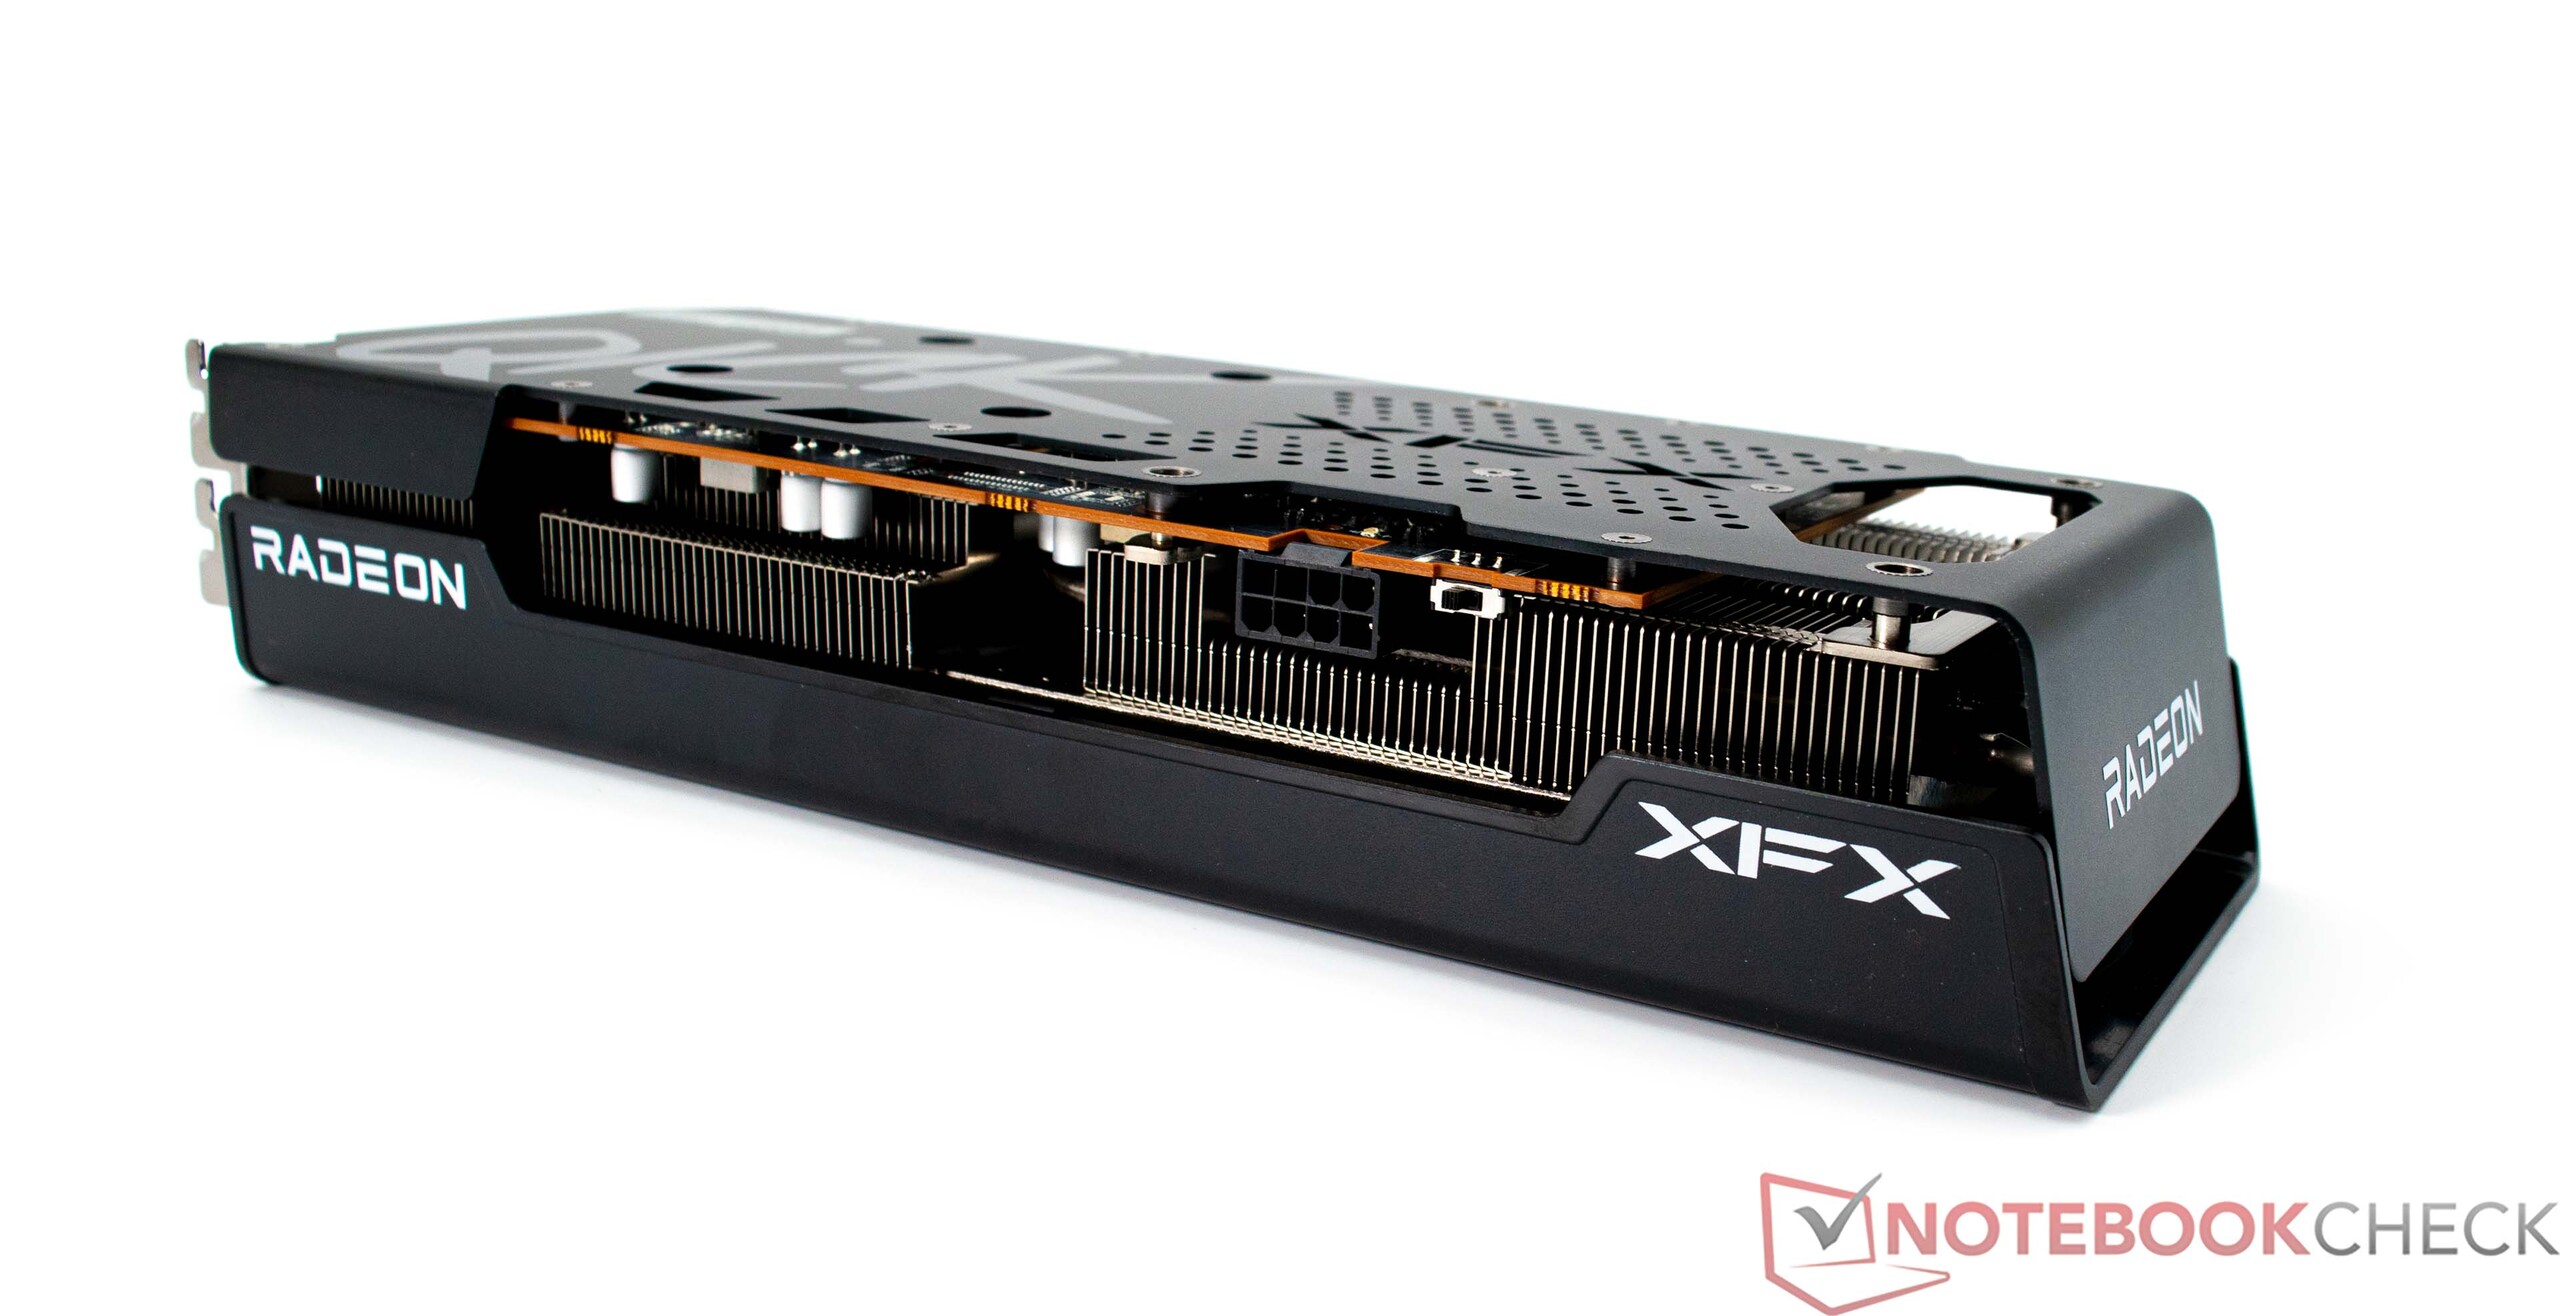
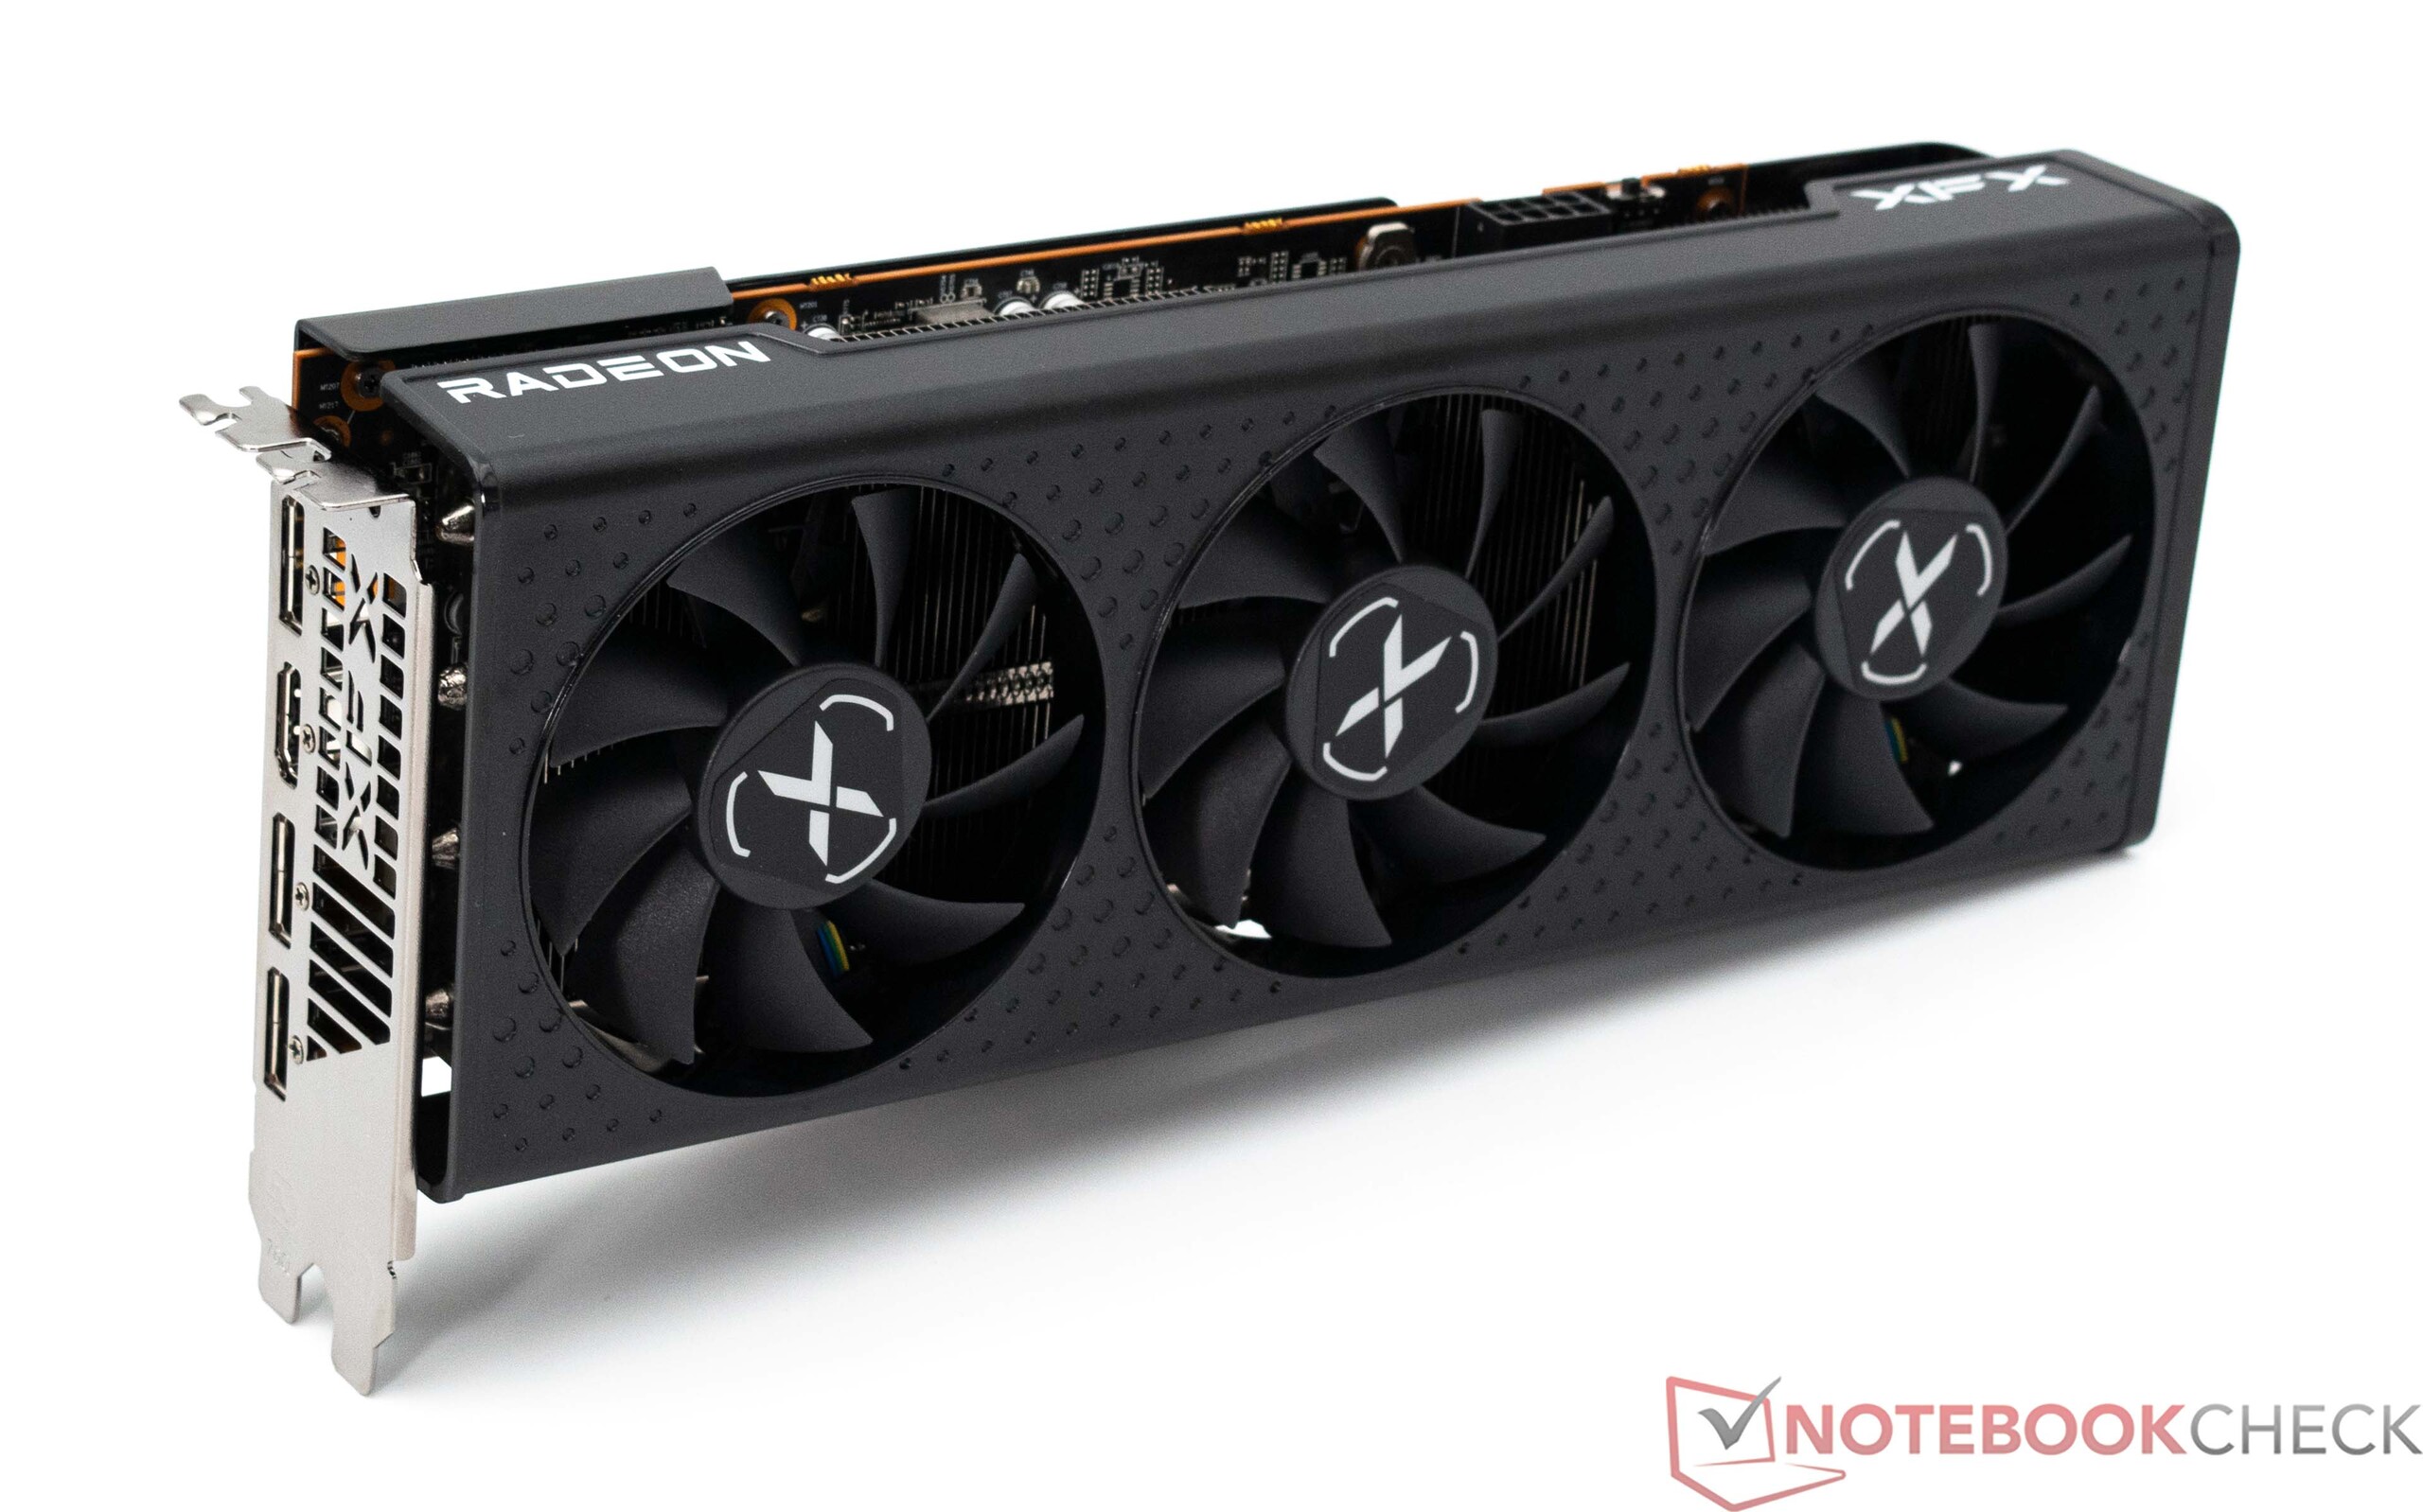
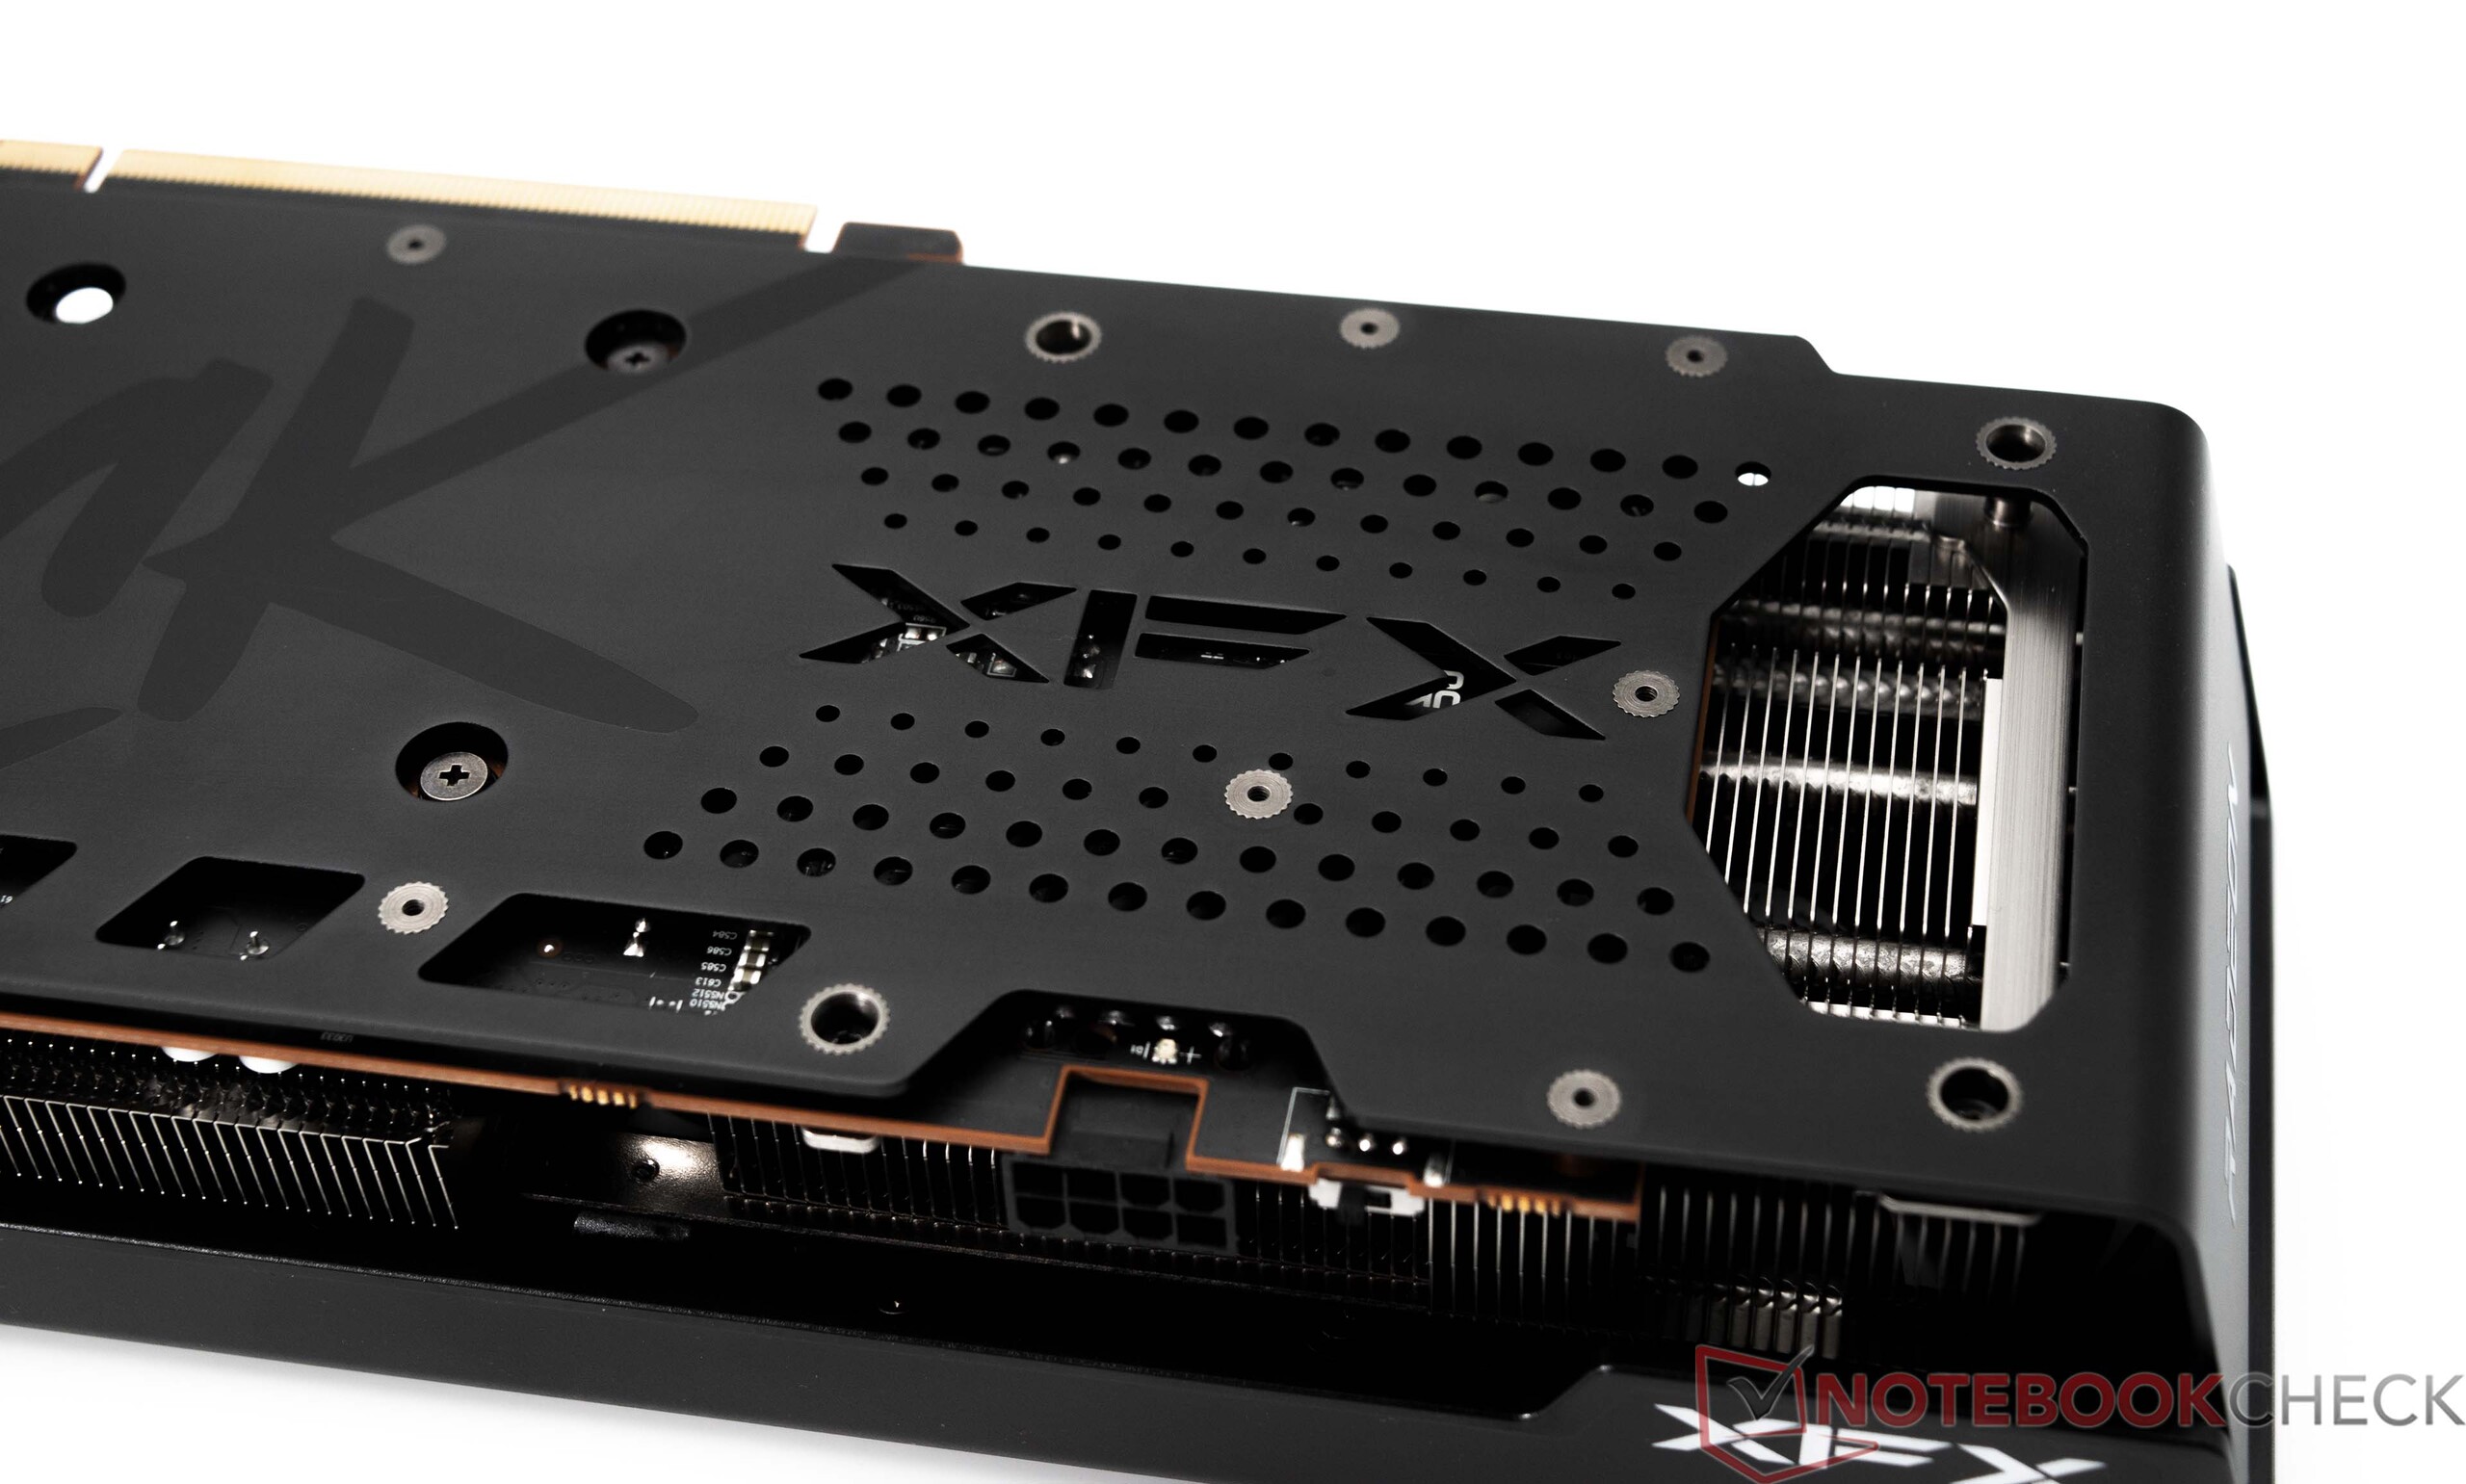
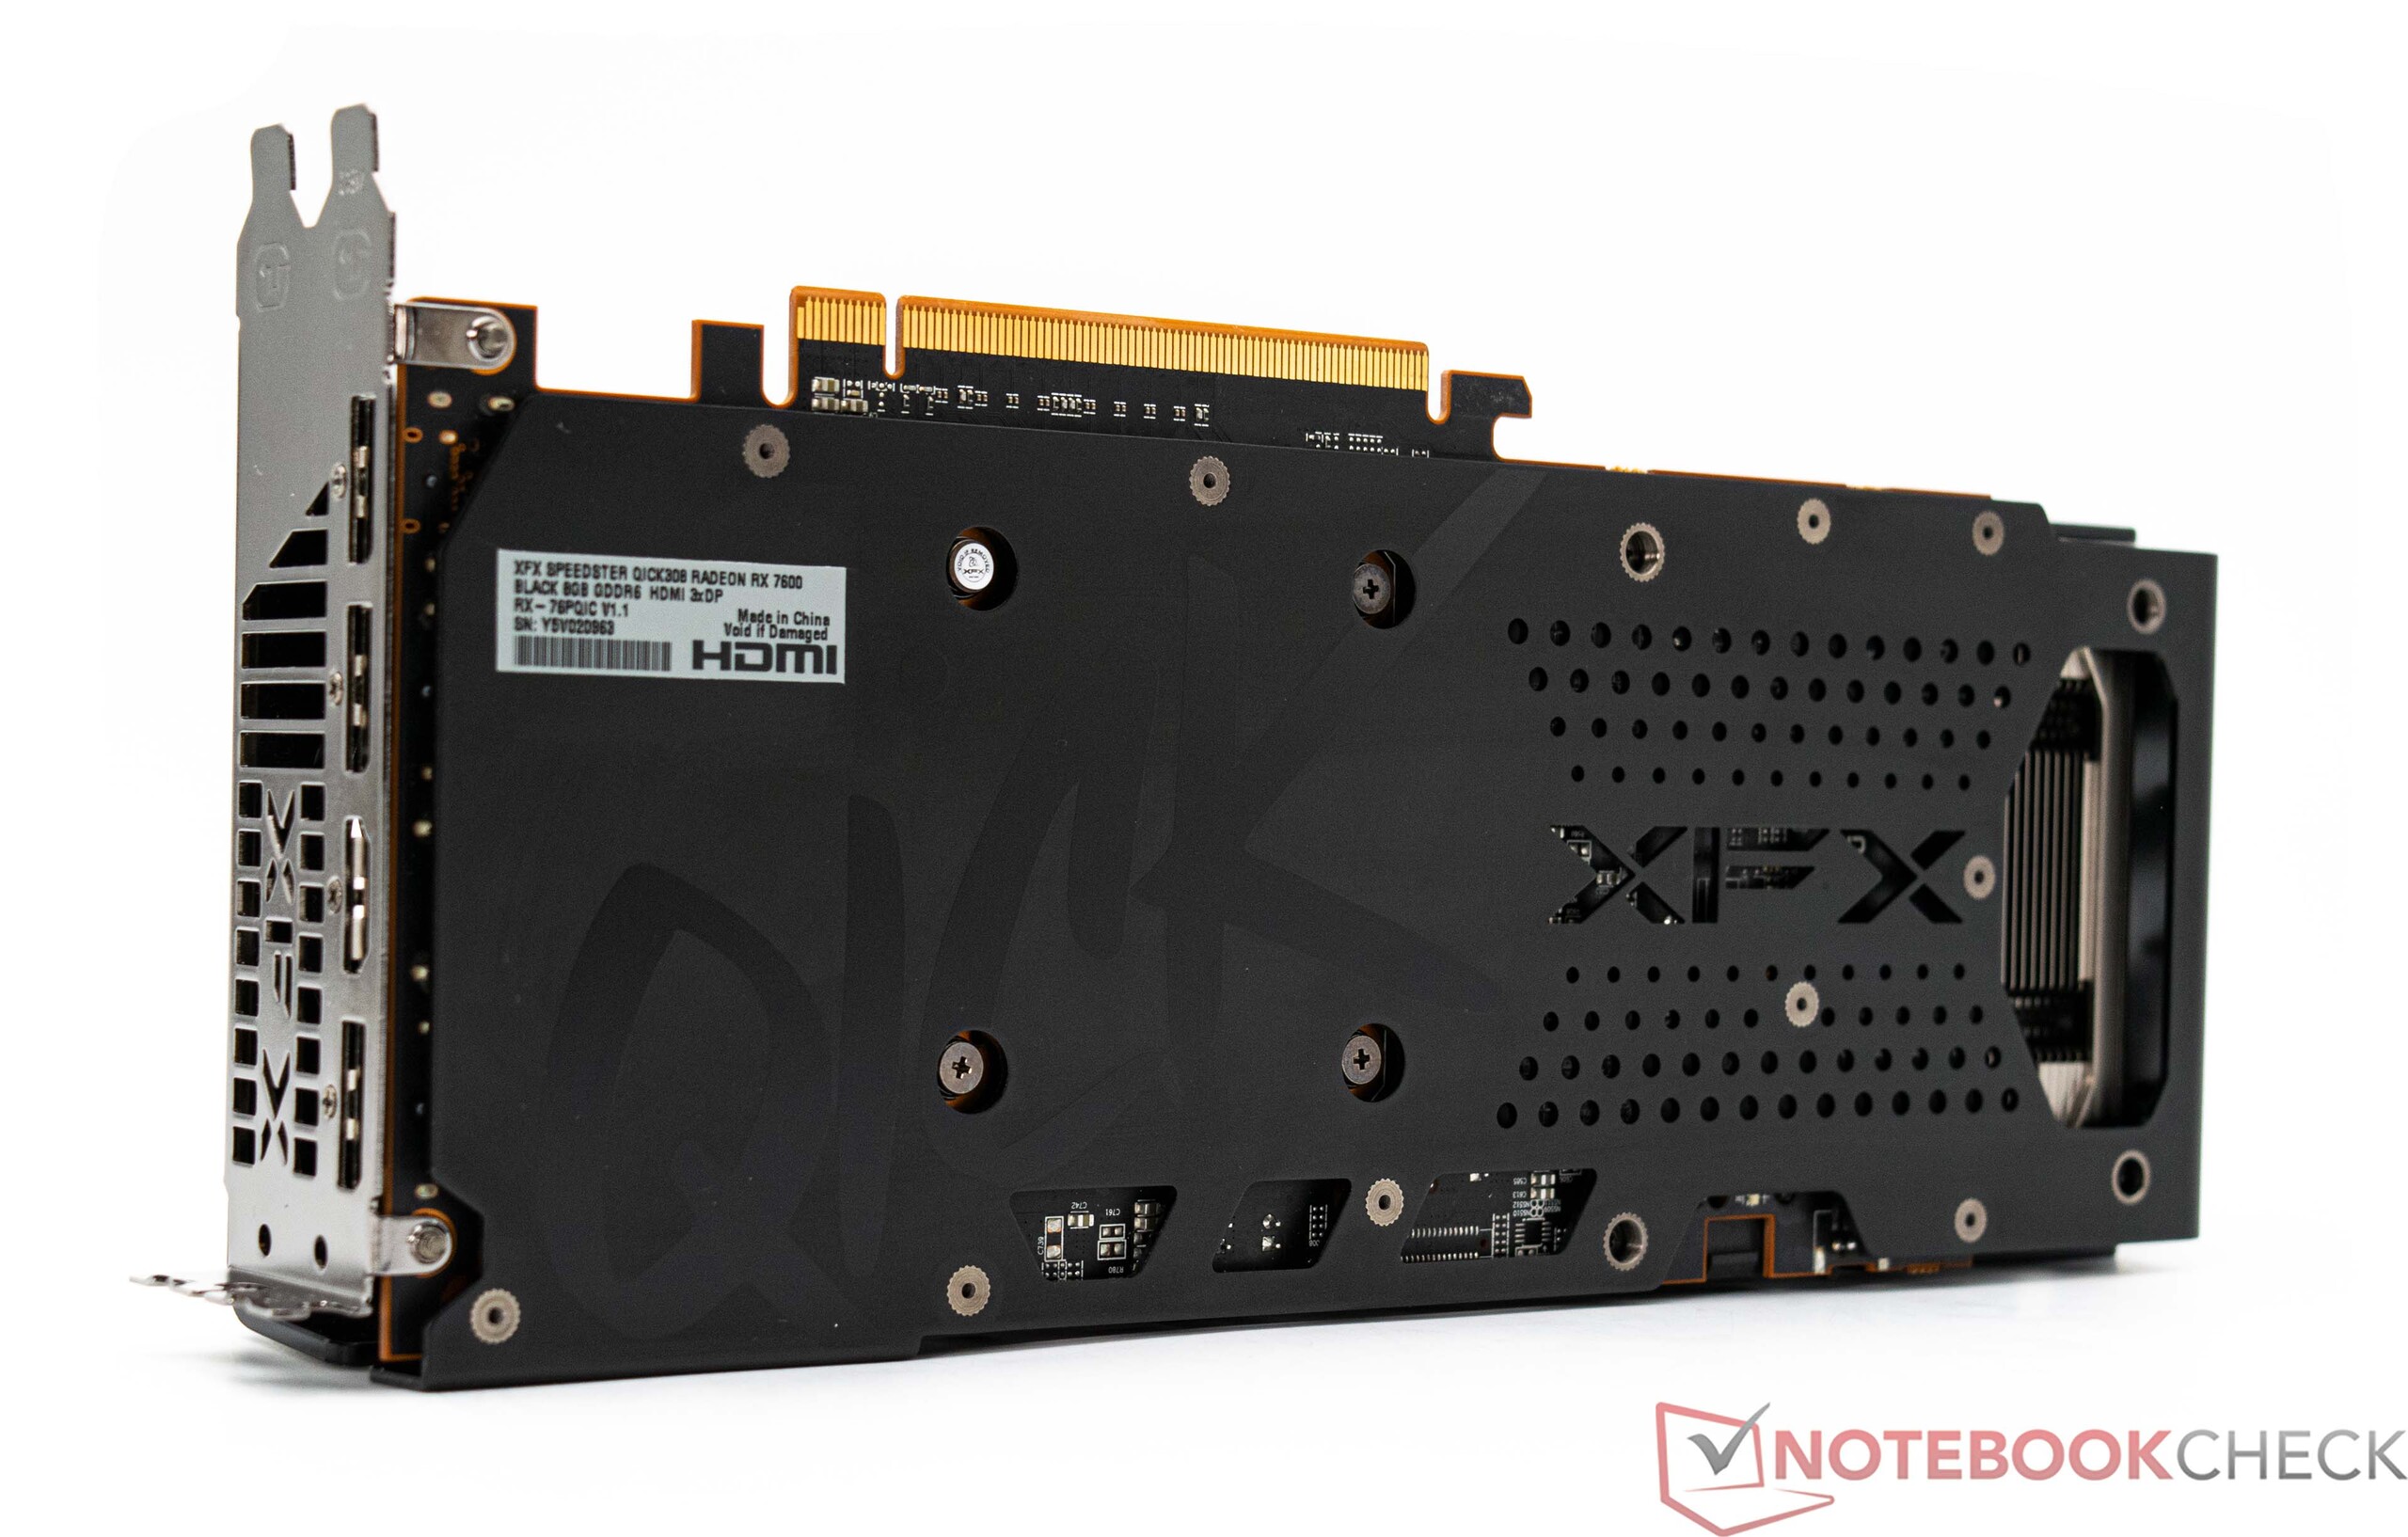
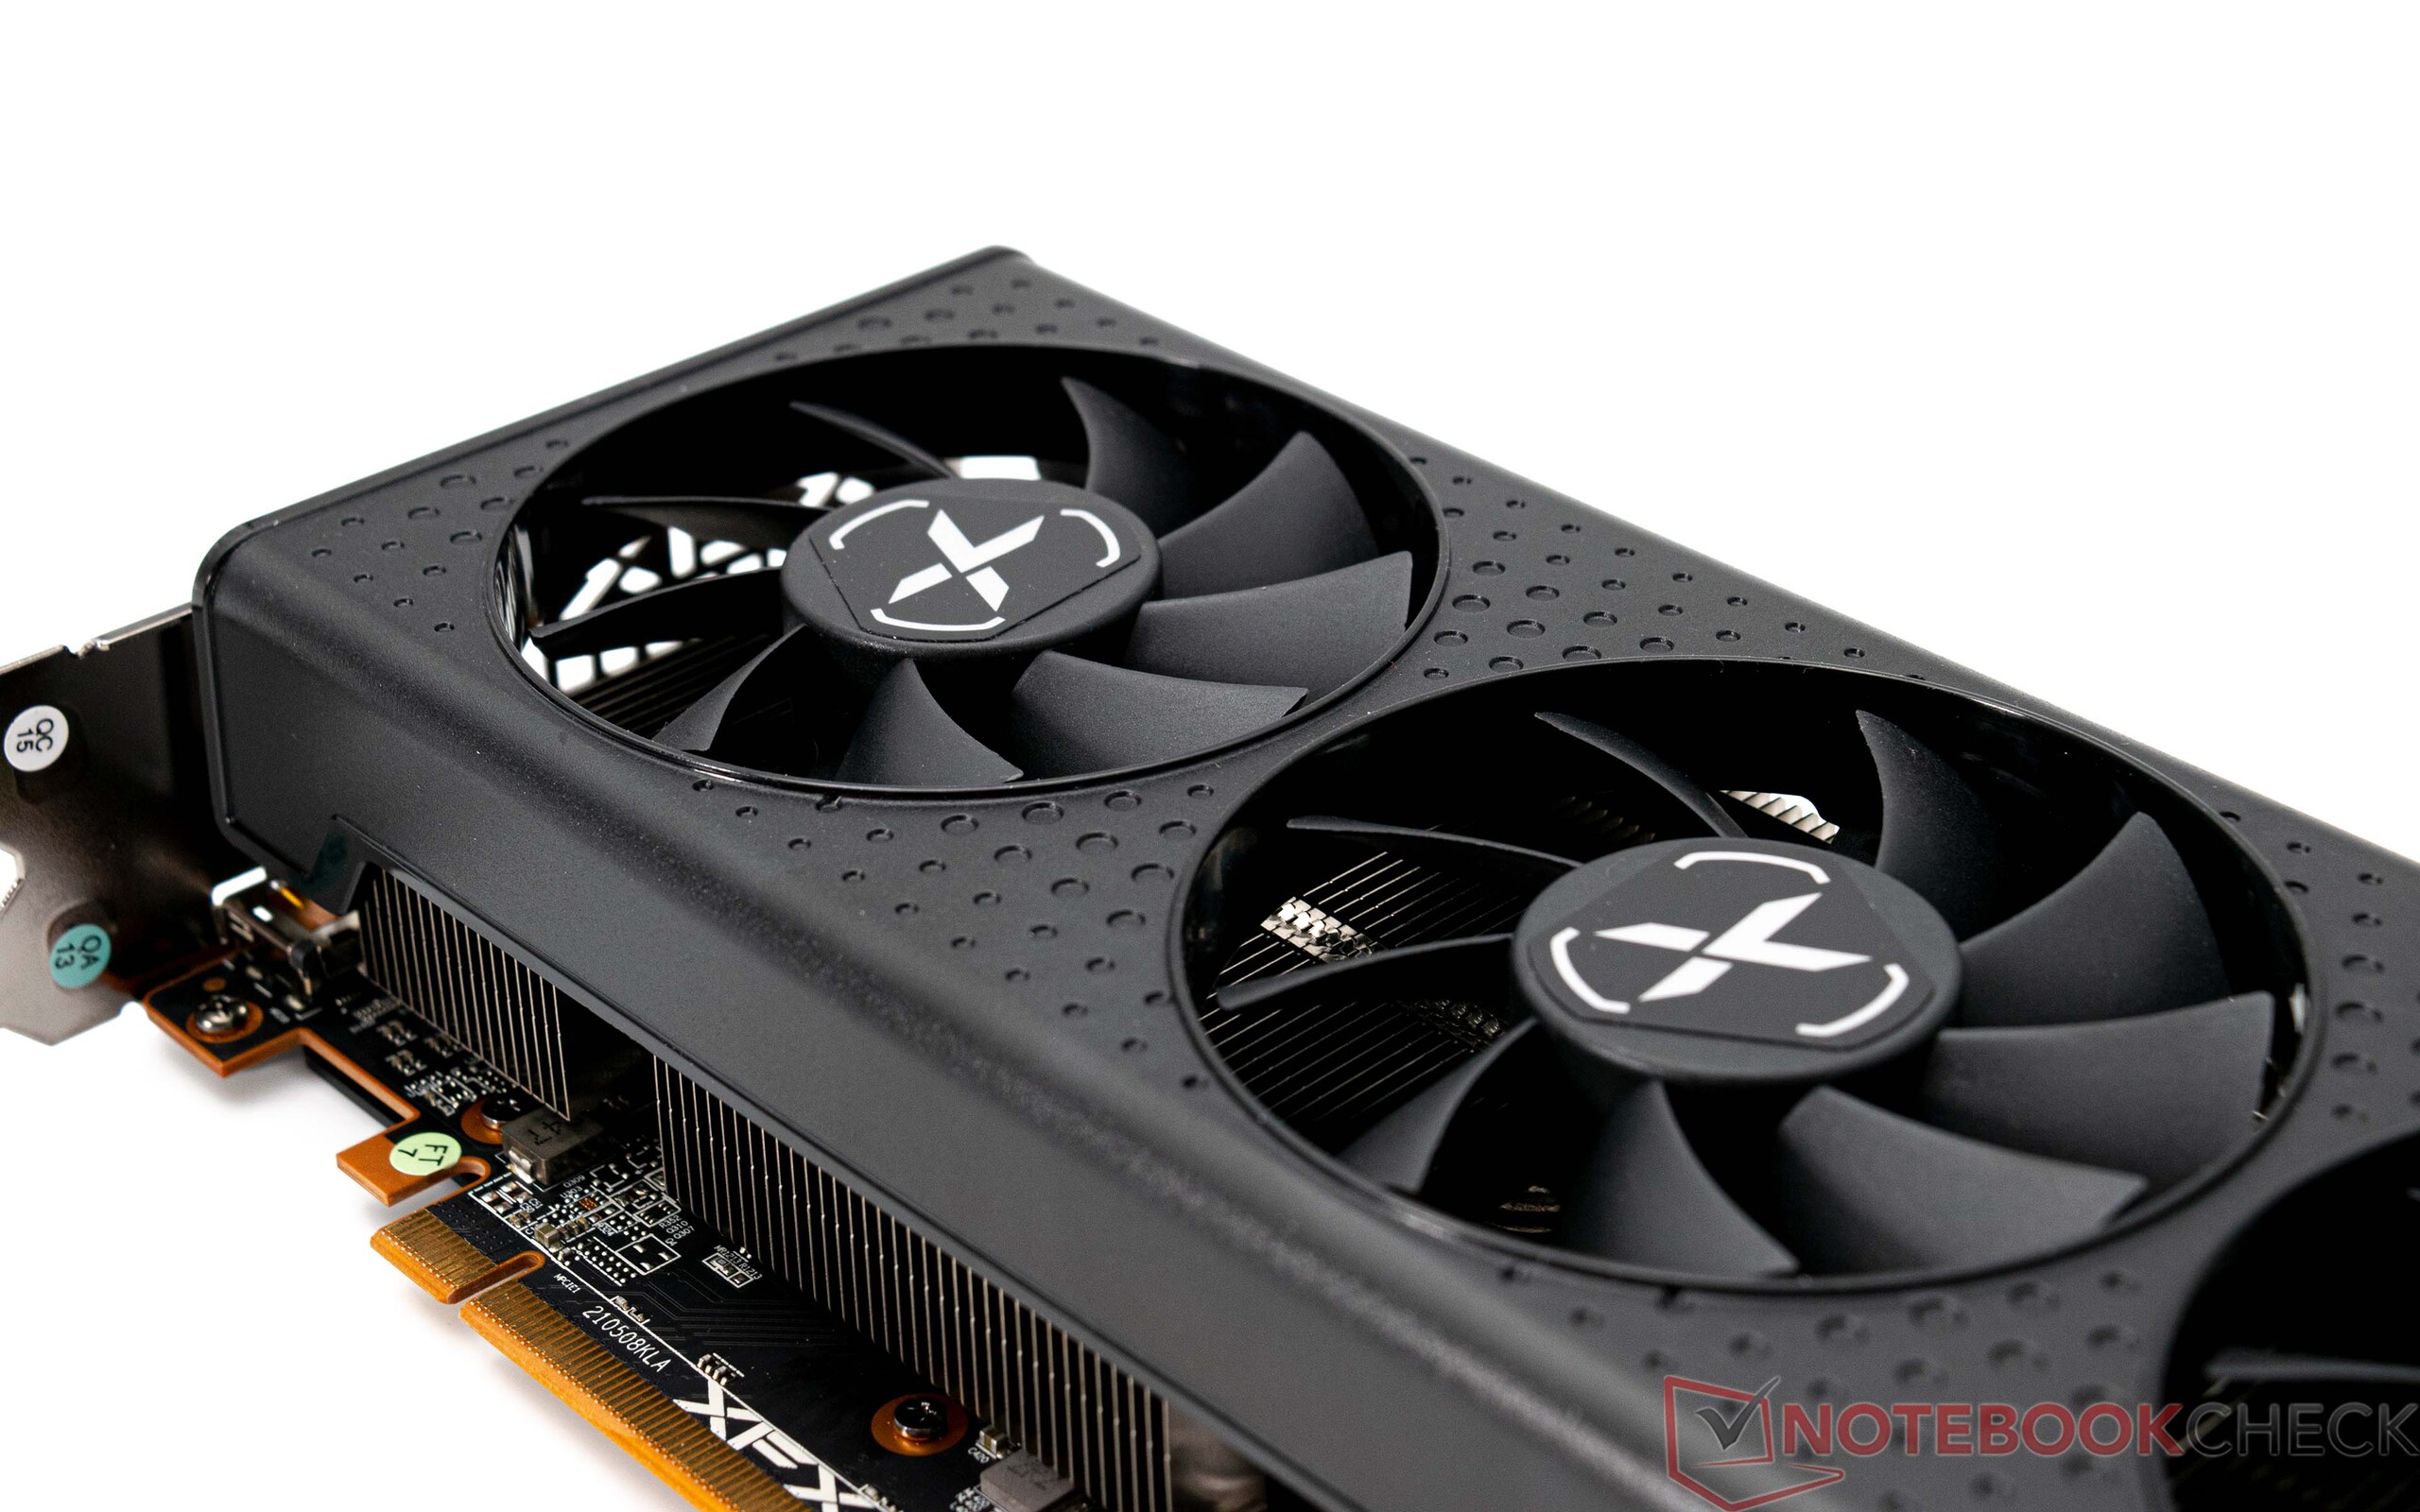
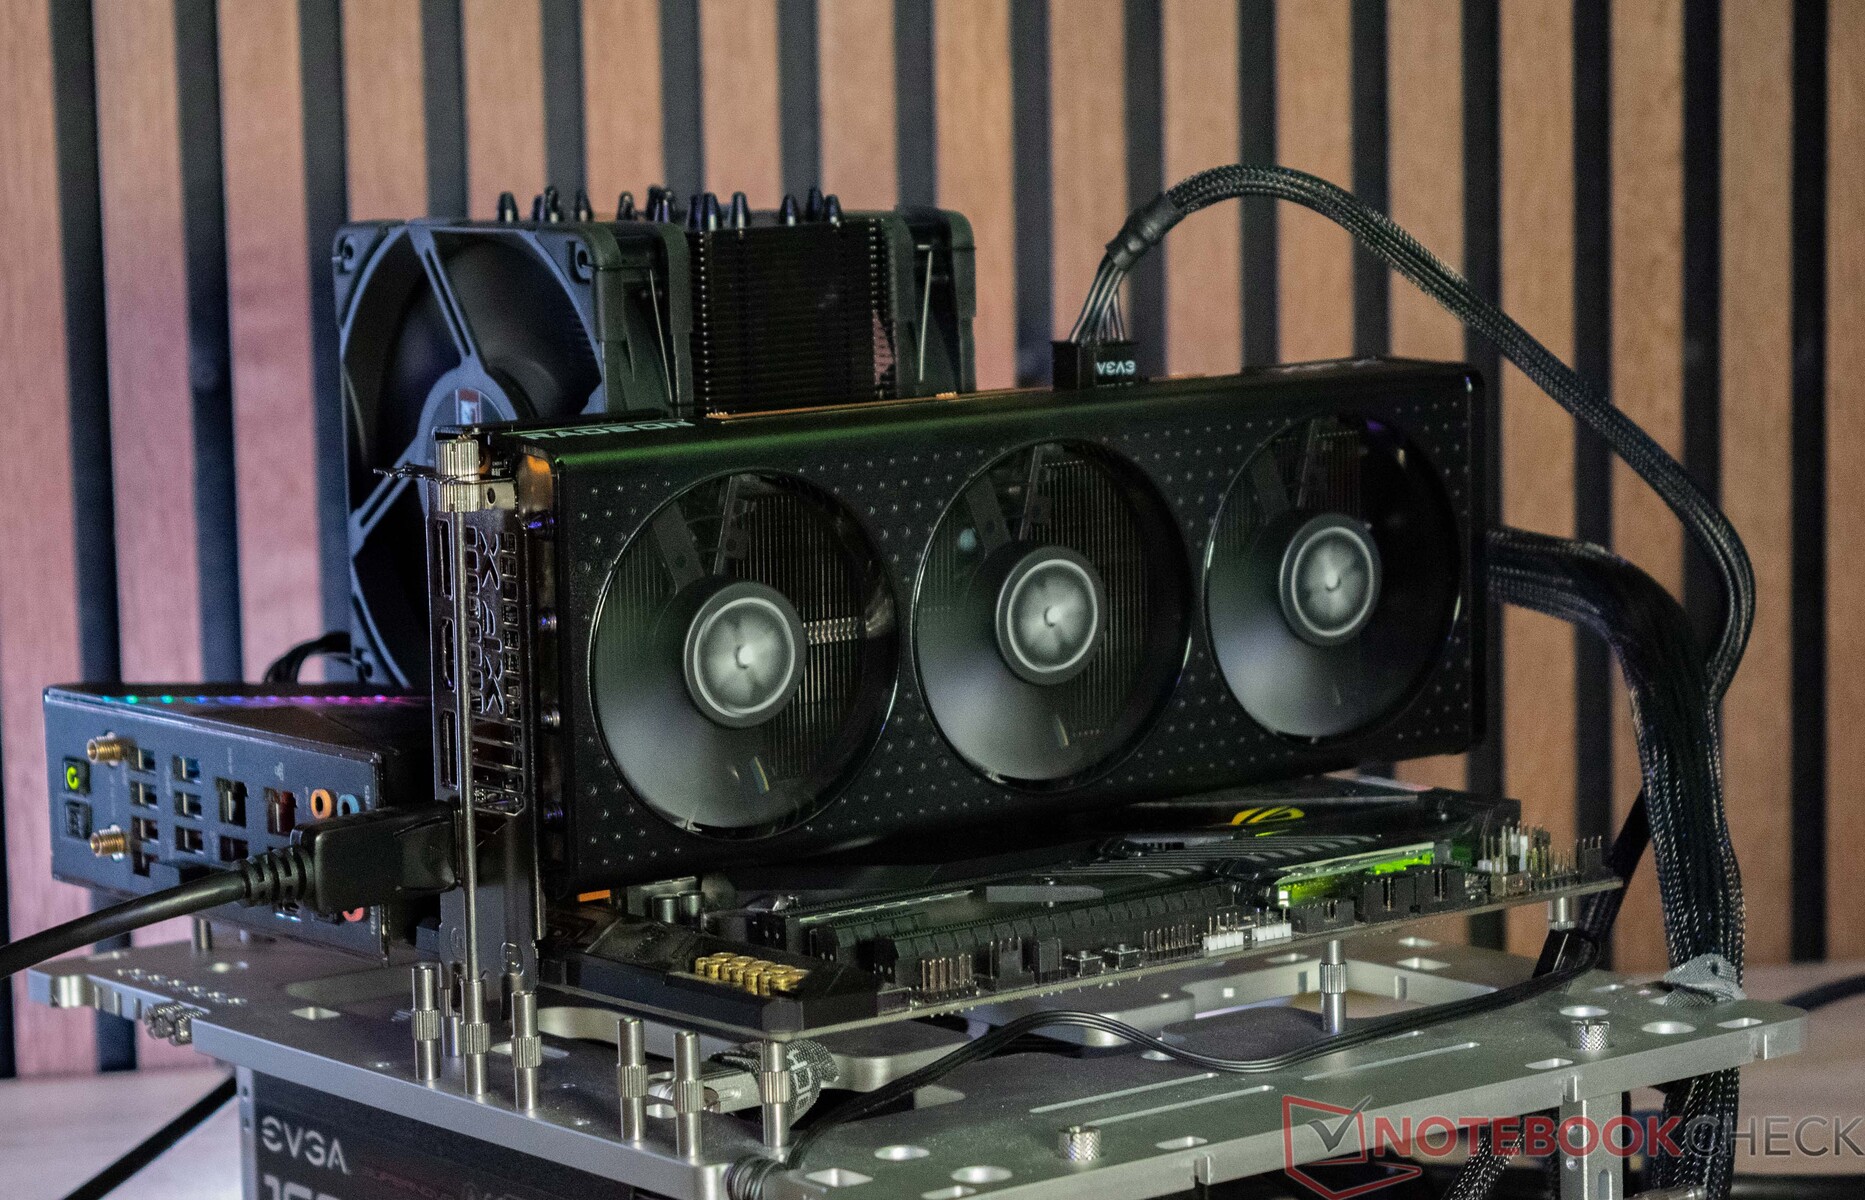
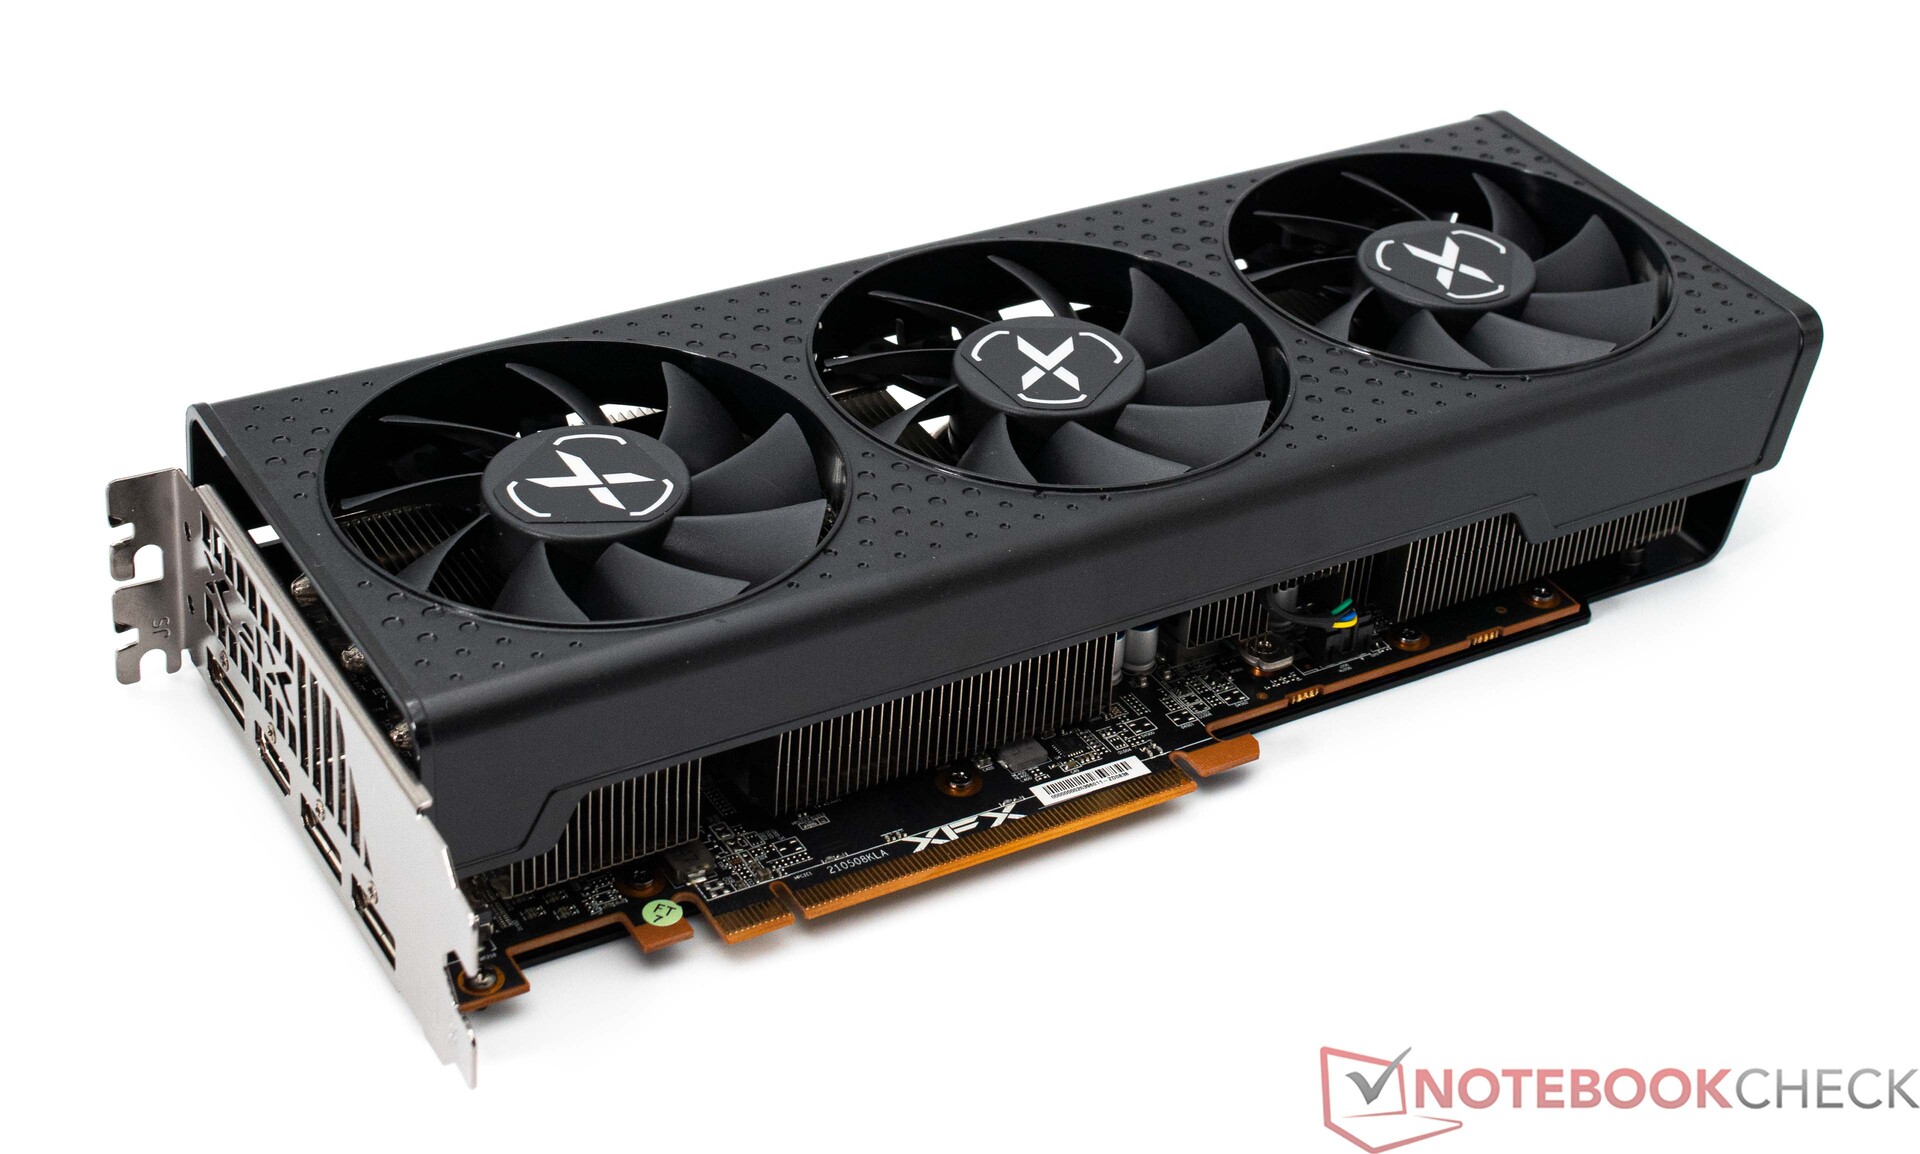
Für diesen Test nutzen wir die XFX Speedster QICK 308 Radeon RX 7600 Black Edition. Dieses Modell ist mit einem großen Triple-Slot-Kühler ausgestattet und benötigt daher viel Platz. Mit einer Länge von 27,4 Zentimetern ist die Grafikkarte recht lang. Ein großer Kühler hilft in der Regel, die Lautstärke unter Last auf einem geringen Level zu halten. Hier hat XFX mit der Speedster QICK 308 Radeon RX 7600 Black Edition eine gute Grafikkarte am Markt, welche nicht durch laute Kühlgeräusche auf sich aufmerksam macht. So viel können wir an dieser Stelle schon einmal verraten. Bei der Optik bietet die Grafikkarte keine signifikanten Highlights. Die Lüfterabdeckung besteht aus Kunststoff, wenngleich die Rückseite mit einer stabilen Backplate aus Metall bedeckt ist. Zur Kühlung der Grafikkarte wird diese aber nicht verwendet.
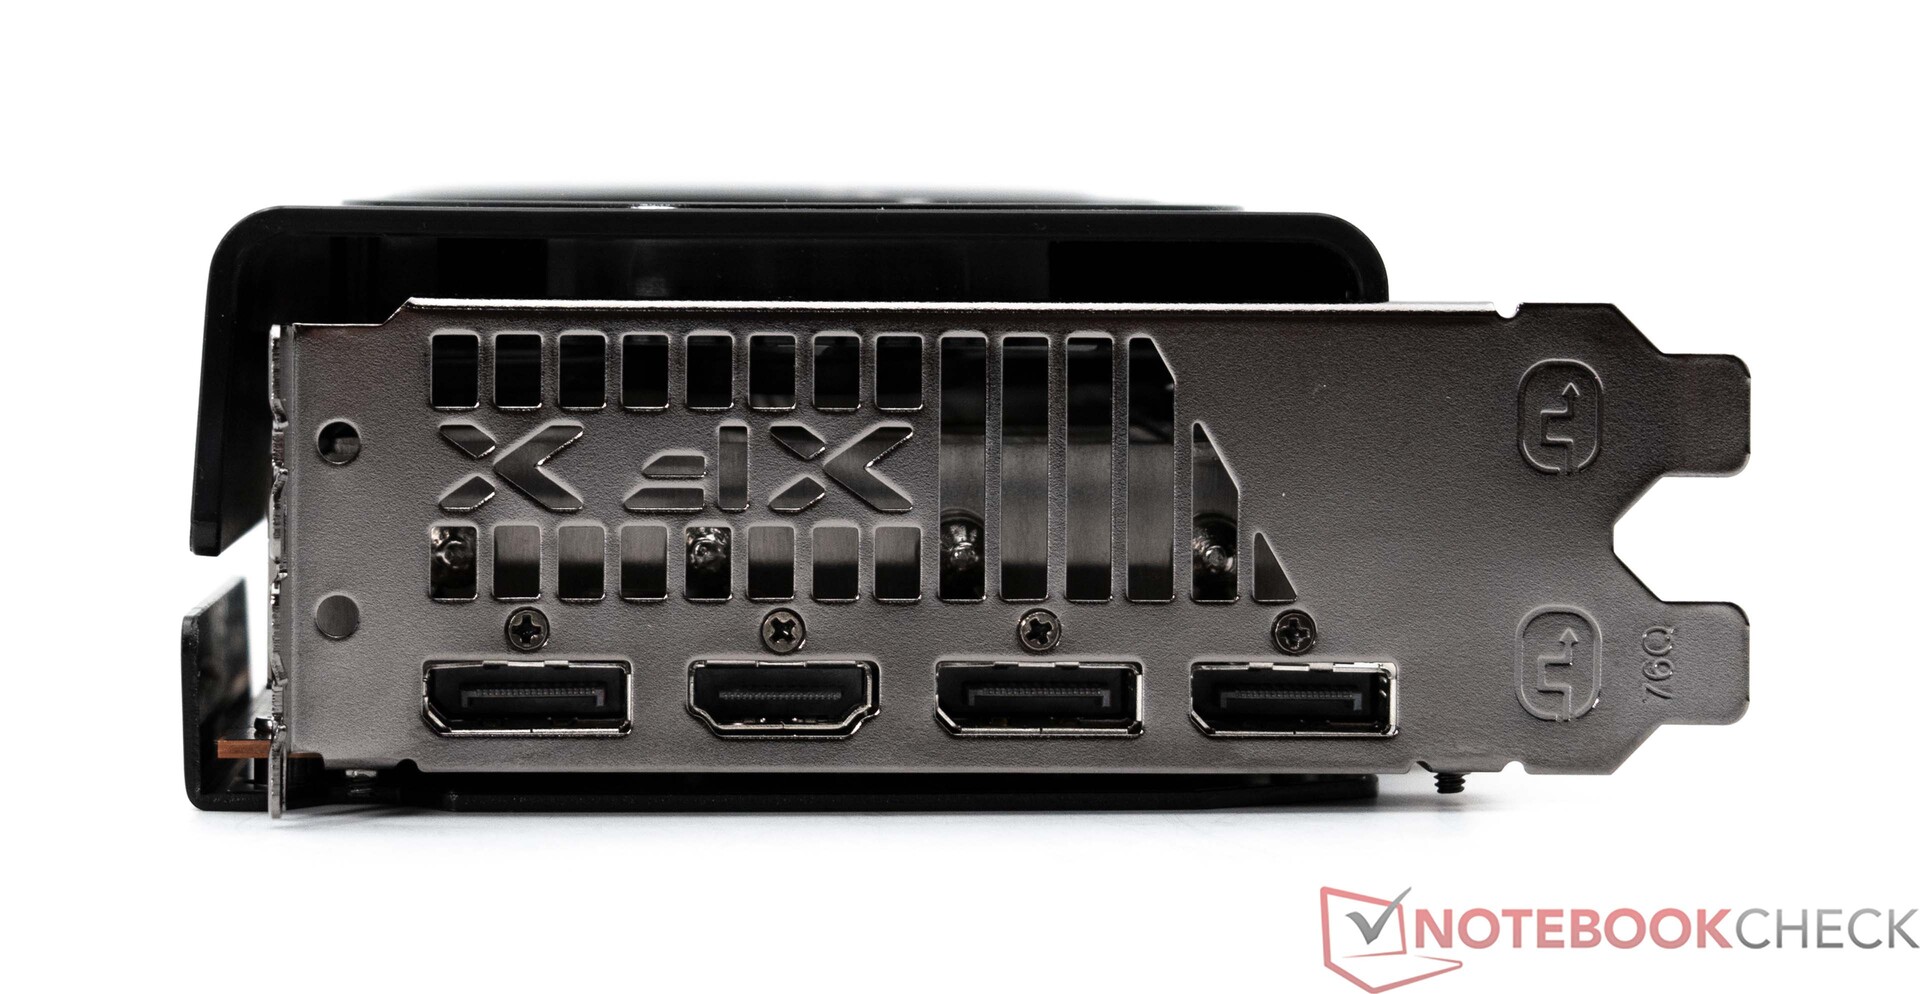
Aufgrund der RDNA-3-Architektur profitiert auch das neue Einsteigermodell von den Neuerungen. Etwas mehr Raytracing-Leistung kann man erwarten, wenngleich dieses Feature eigentlich nur bei den High-End-Modellen einen wirklichen Mehrwert bietet. Die Leistungsaufnahme steigt gegenüber der AMD Radeon RX 6600 leicht, von 132 Watt auf nun 165 Watt. Für die Energieversorgung reicht aber ein 8-Pin-Stromanschluss. Bei den externen Anschlüssen gibt 3x DisplayPort (2.1) und 1x HDMI (2.1). Damit kann sich AMD gegenüber der Konkurrenz abheben, denn Nvidia und auch Intel bieten unterdessen nur DisplayPort 1.4a respektive DisplayPort 2.0.
Infos zu unserem Testsystem
XFX Speedster QICK 308 Radeon RX 7600 Black Edition


Vergleich der Radeon AMD-GPUs
| Spezifikationen | Radeon RX 7900 XTX | Radeon RX 7900 XT | Radeon RX 7900 GRE | Radeon RX 7600 | Radeon RX 6650 XT | Radeon RX 6600 XT | Radeon RX 6600 |
| GPU | Navi 31 XTX | Navi 31 XT | Navi 31 XT | Navi 33 | Navi 23 | Navi 23 | Navi 23 |
| Manufacturing Process | 5/6 nm | 5/6 nm | 5/6 nm | 6 nm | 7 nm | 7 nm | 7 nm |
| Compute Units | 96 | 84 | 80 | 32 | 32 | 32 | 28 |
| Shading Units | 6.144 | 5.376 | 5.120 | 2.048 | 2.048 | 2.048 | 1.792 |
| Texture Mapping Units | 384 | 336 | 320 | 128 | 128 | 128 | 112 |
| Ray Accelerators | 96 | 84 | 80 | 32 | 32 | 32 | 28 |
| Base Clock | 2.270 MHz | 2.000 MHz | 1.880 MHz | 1.720 MHz | 2.055 MHz | 1.968 MHz | 1.626 MHz |
| Game Clock | 2.300 MHz | 2.000 MHz | 1.880 MHz | 2.250 MHz | 2.410 MHz | 2.359 MHz | 2.044 MHz |
| Boost Clock | 2.500 MHz | 2.400 MHz | 2.245 MHz | 2.655 MHz | 2.635 MHz | 2.589 MHz | 2.491 MHz |
| Infinity Cache | 96 MB | 80 MB | 64 MB | 32 MB | 32 MB | 32 MB | 32 MB |
| Memory Bus Width | 384-bit | 320-bit | 256-bit | 128-bit | 128-bit | 128-bit | 128-bit |
| Memory Bandwidth | 960 GB/s | 800 GB/s | 576 GB/s | 288 GB/s | 280.3 GB/s | 256 GB/s | 224 GB/s |
| Memory Size | 24 GB GDDR6 | 20 GB GDDR6 | 16 GB GDDR6 | 8 GB GDDR6 | 8 GB GDDR6 | 8 GB GDDR6 | 8 GB GDDR6 |
| TBP | 355 W | 315 W | 260 W | 165 W | 176 W | 160 W | 132 W |
Die Taktraten der XFX Speedster QICK 308 Radeon RX 7600 Black Edition
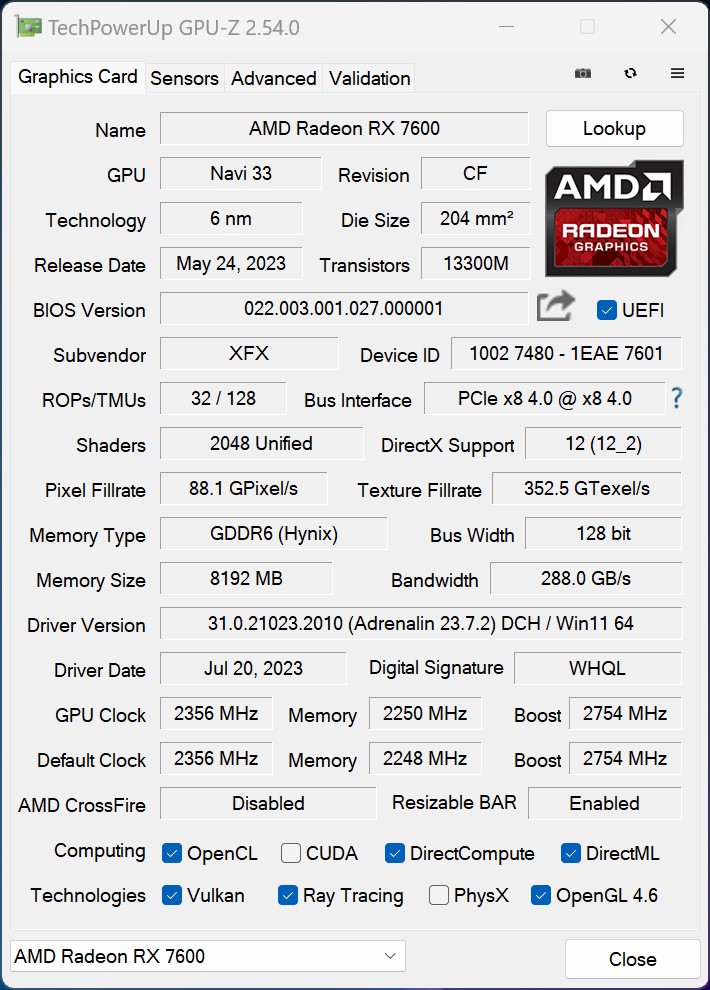
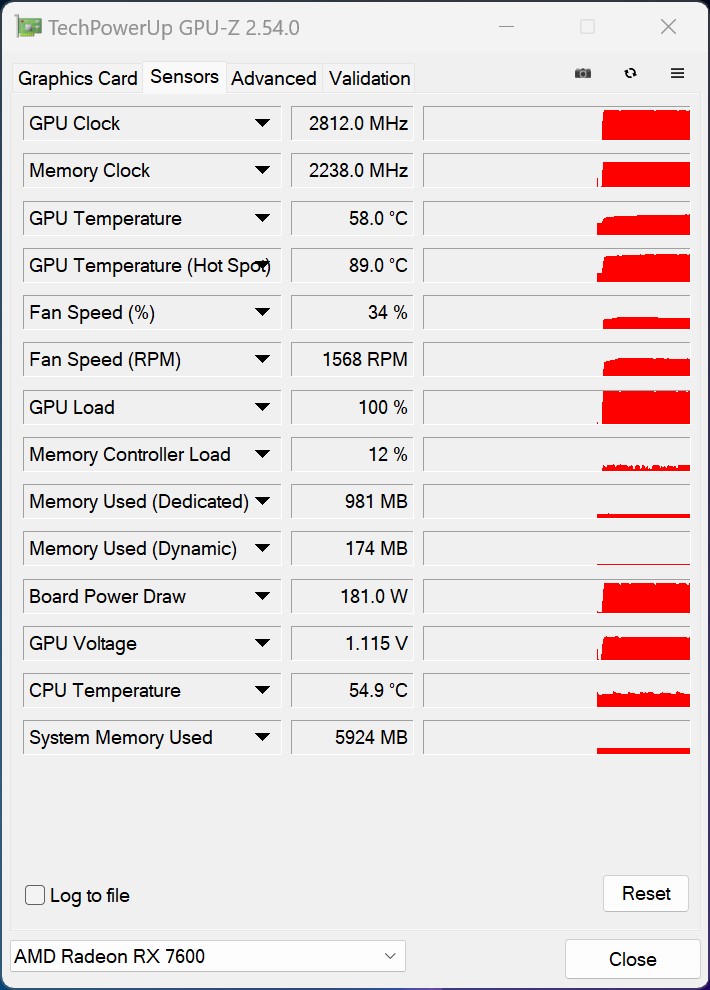
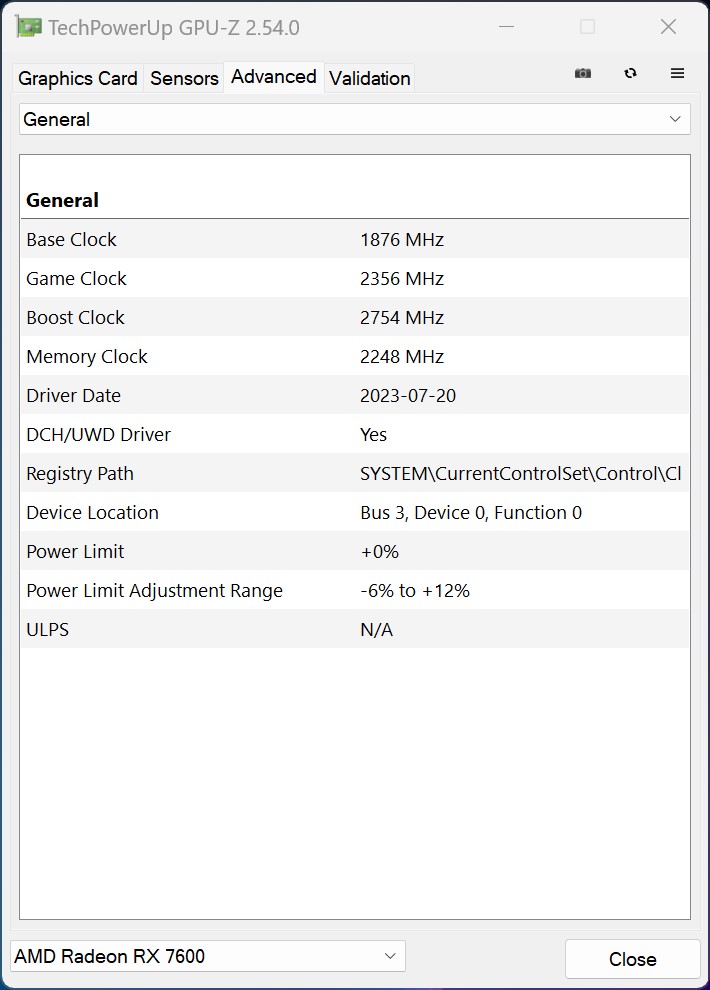
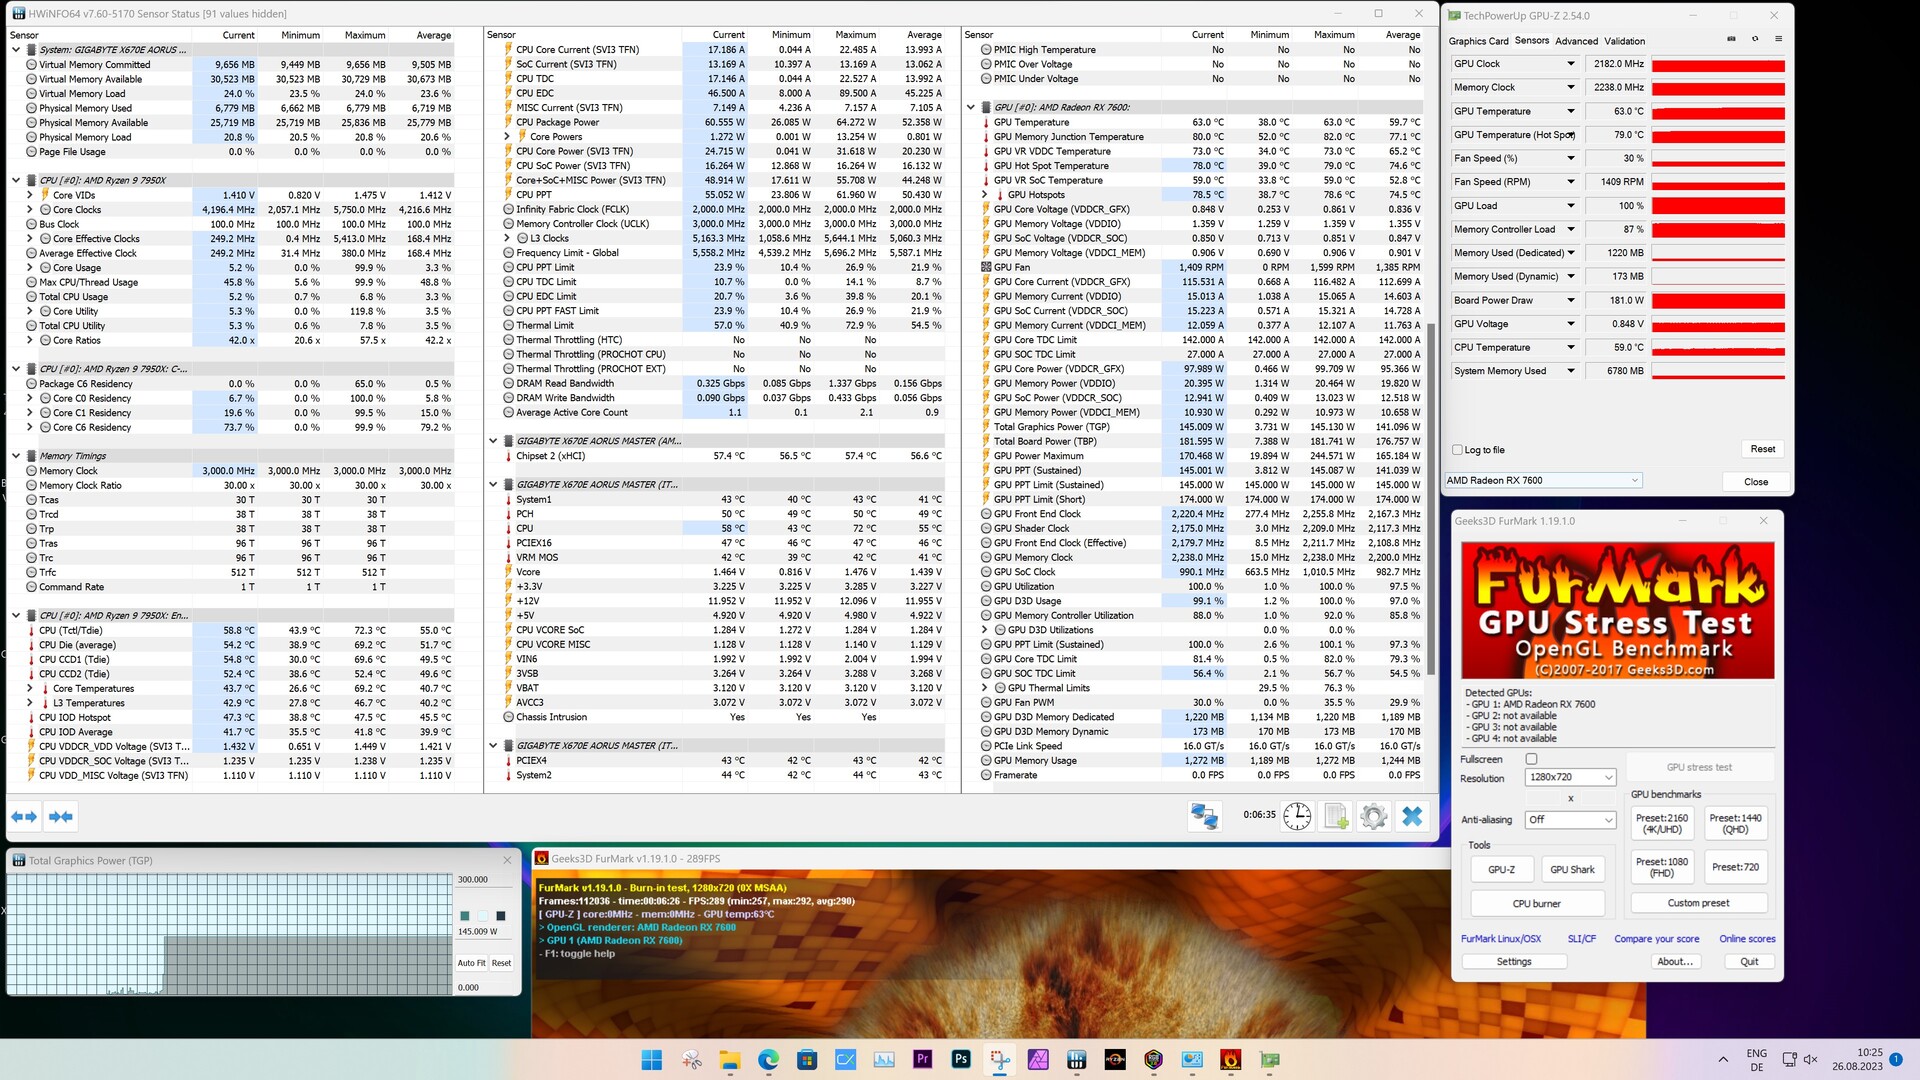
Bei der XFX Speedster QICK 308 Radeon RX 7600 Black Edition handelt es sich um ein Bordpartnermodell, welches sich optisch und auch technisch von dem Referenzmodell von AMD unterscheidet. Aufgrund des größeren Kühlers hebt XFX die Taktraten der GPU um etwa 100 MHz an. Damit steigt auch der maximale Boost-Takt auf mindestens 2.754 MHz. Während der Benchmarks wird der Boost-Takt jedoch ohne Probleme übertroffen. In Spitzen durchbricht unser Testsample sogar die 2.900 MHz.
Synthetische Benchmarks
Bevor wir uns den Spieletests widmen, werfen wir zunächst einen Blick auf die Leistung anhand der synthetischen Benchmarks. Hier duelliert sich die XFX Speedster QICK 308 Radeon RX 7600 Black Edition mit der AMD Radeon RX 6650 XT, welche uns als Sapphire Nitro+ Modell vorliegt. Das direkte Vorgängermodell, welche hier als Sapphire Pulse Radeon RX 6600 zum Vergleich dient, kann um etwa 25 Prozent abgehängt werden. Gegenüber Nvidia findet sich unser Testmuster allerdings hinter der ASUS Dual GeForce RTX 4060 Ti OC wieder. Verglichen mit der KFA2 GeForce RTX 4060 1-Click-OC 2X hat jedoch die XFX Speedster QICK 308 Radeon RX 7600 Black Edition die Nase vorn. Somit reiht sich unsere Testkarte direkt zwischen den beiden RTX-4060-Modellen aus dem grünen Lager ein.
| Performance Rating - Percent | |
| KFA2 GeForce RTX 4070 Ti EX Gamer | |
| KFA2 GeForce RTX 4070 EX Gamer | |
| AMD Radeon RX 6700 XT | |
| ASUS Dual GeForce RTX 4060 Ti OC | |
| Nvidia GeForce RTX 3060 Ti FE | |
| XFX Speedster QICK 308 Radeon RX 7600 Black Edition | |
| Sapphire Nitro+ Radeon RX 6650 XT | |
| Nvidia GeForce RTX 2070 Super | |
| KFA2 GeForce RTX 4060 1-Click-OC 2X | |
| Nvidia GeForce RTX 2060 Super | |
| Sapphire Pulse Radeon RX 6600 | |
| 3DMark | |
| 2560x1440 Time Spy Graphics | |
| KFA2 GeForce RTX 4070 Ti EX Gamer | |
| KFA2 GeForce RTX 4070 EX Gamer | |
| ASUS Dual GeForce RTX 4060 Ti OC | |
| AMD Radeon RX 6700 XT | |
| Nvidia GeForce RTX 3060 Ti FE | |
| XFX Speedster QICK 308 Radeon RX 7600 Black Edition | |
| KFA2 GeForce RTX 4060 1-Click-OC 2X | |
| Sapphire Nitro+ Radeon RX 6650 XT | |
| Nvidia GeForce RTX 2070 Super | |
| Nvidia GeForce RTX 2060 Super | |
| Sapphire Pulse Radeon RX 6600 | |
| Fire Strike Extreme Graphics | |
| KFA2 GeForce RTX 4070 Ti EX Gamer | |
| KFA2 GeForce RTX 4070 EX Gamer | |
| AMD Radeon RX 6700 XT | |
| ASUS Dual GeForce RTX 4060 Ti OC | |
| XFX Speedster QICK 308 Radeon RX 7600 Black Edition | |
| Nvidia GeForce RTX 3060 Ti FE | |
| Sapphire Nitro+ Radeon RX 6650 XT | |
| KFA2 GeForce RTX 4060 1-Click-OC 2X | |
| Nvidia GeForce RTX 2070 Super | |
| Nvidia GeForce RTX 2060 Super | |
| Sapphire Pulse Radeon RX 6600 | |
| 3840x2160 Fire Strike Ultra Graphics | |
| KFA2 GeForce RTX 4070 Ti EX Gamer | |
| KFA2 GeForce RTX 4070 EX Gamer | |
| AMD Radeon RX 6700 XT | |
| Nvidia GeForce RTX 3060 Ti FE | |
| XFX Speedster QICK 308 Radeon RX 7600 Black Edition | |
| ASUS Dual GeForce RTX 4060 Ti OC | |
| Sapphire Nitro+ Radeon RX 6650 XT | |
| Nvidia GeForce RTX 2070 Super | |
| KFA2 GeForce RTX 4060 1-Click-OC 2X | |
| Sapphire Pulse Radeon RX 6600 | |
| Nvidia GeForce RTX 2060 Super | |
| 1920x1080 Fire Strike Graphics | |
| KFA2 GeForce RTX 4070 Ti EX Gamer | |
| KFA2 GeForce RTX 4070 EX Gamer | |
| AMD Radeon RX 6700 XT | |
| ASUS Dual GeForce RTX 4060 Ti OC | |
| XFX Speedster QICK 308 Radeon RX 7600 Black Edition | |
| Nvidia GeForce RTX 3060 Ti FE | |
| Sapphire Nitro+ Radeon RX 6650 XT | |
| KFA2 GeForce RTX 4060 1-Click-OC 2X | |
| Nvidia GeForce RTX 2070 Super | |
| Sapphire Pulse Radeon RX 6600 | |
| Nvidia GeForce RTX 2060 Super | |
| Unigine Superposition | |
| 7680x4320 8k Optimized | |
| KFA2 GeForce RTX 4070 Ti EX Gamer | |
| KFA2 GeForce RTX 4070 EX Gamer | |
| Nvidia GeForce RTX 3060 Ti FE | |
| AMD Radeon RX 6700 XT | |
| ASUS Dual GeForce RTX 4060 Ti OC | |
| Nvidia GeForce RTX 2070 Super | |
| KFA2 GeForce RTX 4060 1-Click-OC 2X | |
| XFX Speedster QICK 308 Radeon RX 7600 Black Edition | |
| Sapphire Nitro+ Radeon RX 6650 XT | |
| Nvidia GeForce RTX 2060 Super | |
| Sapphire Pulse Radeon RX 6600 | |
| 3840x2160 4k Optimized | |
| KFA2 GeForce RTX 4070 Ti EX Gamer | |
| KFA2 GeForce RTX 4070 EX Gamer | |
| ASUS Dual GeForce RTX 4060 Ti OC | |
| Nvidia GeForce RTX 3060 Ti FE | |
| AMD Radeon RX 6700 XT | |
| Nvidia GeForce RTX 2070 Super | |
| KFA2 GeForce RTX 4060 1-Click-OC 2X | |
| XFX Speedster QICK 308 Radeon RX 7600 Black Edition | |
| Sapphire Nitro+ Radeon RX 6650 XT | |
| Nvidia GeForce RTX 2060 Super | |
| Sapphire Pulse Radeon RX 6600 | |
| 1920x1080 1080p Extreme | |
| KFA2 GeForce RTX 4070 Ti EX Gamer | |
| KFA2 GeForce RTX 4070 EX Gamer | |
| Nvidia GeForce RTX 3060 Ti FE | |
| ASUS Dual GeForce RTX 4060 Ti OC | |
| AMD Radeon RX 6700 XT | |
| XFX Speedster QICK 308 Radeon RX 7600 Black Edition | |
| Nvidia GeForce RTX 2070 Super | |
| KFA2 GeForce RTX 4060 1-Click-OC 2X | |
| Sapphire Nitro+ Radeon RX 6650 XT | |
| Nvidia GeForce RTX 2060 Super | |
| Sapphire Pulse Radeon RX 6600 | |
| 1920x1080 1080p High | |
| KFA2 GeForce RTX 4070 Ti EX Gamer | |
| KFA2 GeForce RTX 4070 EX Gamer | |
| ASUS Dual GeForce RTX 4060 Ti OC | |
| AMD Radeon RX 6700 XT | |
| Nvidia GeForce RTX 3060 Ti FE | |
| XFX Speedster QICK 308 Radeon RX 7600 Black Edition | |
| Nvidia GeForce RTX 2070 Super | |
| KFA2 GeForce RTX 4060 1-Click-OC 2X | |
| Sapphire Nitro+ Radeon RX 6650 XT | |
| Nvidia GeForce RTX 2060 Super | |
| Sapphire Pulse Radeon RX 6600 | |
| 1280x720 720p Low | |
| KFA2 GeForce RTX 4070 Ti EX Gamer | |
| KFA2 GeForce RTX 4070 EX Gamer | |
| Nvidia GeForce RTX 3060 Ti FE | |
| ASUS Dual GeForce RTX 4060 Ti OC | |
| KFA2 GeForce RTX 4060 1-Click-OC 2X | |
| Nvidia GeForce RTX 2070 Super | |
| AMD Radeon RX 6700 XT | |
| XFX Speedster QICK 308 Radeon RX 7600 Black Edition | |
| Nvidia GeForce RTX 2060 Super | |
| Sapphire Nitro+ Radeon RX 6650 XT | |
| Sapphire Pulse Radeon RX 6600 | |
| Unigine Heaven 4.0 | |
| Extreme Preset DX11 | |
| KFA2 GeForce RTX 4070 Ti EX Gamer | |
| KFA2 GeForce RTX 4070 EX Gamer | |
| Nvidia GeForce RTX 3060 Ti FE | |
| AMD Radeon RX 6700 XT | |
| ASUS Dual GeForce RTX 4060 Ti OC | |
| Nvidia GeForce RTX 2070 Super | |
| Sapphire Nitro+ Radeon RX 6650 XT | |
| KFA2 GeForce RTX 4060 1-Click-OC 2X | |
| XFX Speedster QICK 308 Radeon RX 7600 Black Edition | |
| Nvidia GeForce RTX 2060 Super | |
| Sapphire Pulse Radeon RX 6600 | |
| Extreme Preset OpenGL | |
| KFA2 GeForce RTX 4070 Ti EX Gamer | |
| KFA2 GeForce RTX 4070 EX Gamer | |
| AMD Radeon RX 6700 XT | |
| Nvidia GeForce RTX 3060 Ti FE | |
| ASUS Dual GeForce RTX 4060 Ti OC | |
| Sapphire Nitro+ Radeon RX 6650 XT | |
| Nvidia GeForce RTX 2070 Super | |
| XFX Speedster QICK 308 Radeon RX 7600 Black Edition | |
| KFA2 GeForce RTX 4060 1-Click-OC 2X | |
| Sapphire Pulse Radeon RX 6600 | |
| Nvidia GeForce RTX 2060 Super | |
| Unigine Valley 1.0 | |
| 1920x1080 Extreme HD DirectX AA:x8 | |
| KFA2 GeForce RTX 4070 Ti EX Gamer | |
| KFA2 GeForce RTX 4070 EX Gamer | |
| Nvidia GeForce RTX 3060 Ti FE | |
| AMD Radeon RX 6700 XT | |
| ASUS Dual GeForce RTX 4060 Ti OC | |
| Nvidia GeForce RTX 2070 Super | |
| Sapphire Nitro+ Radeon RX 6650 XT | |
| KFA2 GeForce RTX 4060 1-Click-OC 2X | |
| Nvidia GeForce RTX 2060 Super | |
| XFX Speedster QICK 308 Radeon RX 7600 Black Edition | |
| Sapphire Pulse Radeon RX 6600 | |
| 1920x1080 Extreme HD Preset OpenGL AA:x8 | |
| KFA2 GeForce RTX 4070 Ti EX Gamer | |
| KFA2 GeForce RTX 4070 EX Gamer | |
| AMD Radeon RX 6700 XT | |
| Nvidia GeForce RTX 3060 Ti FE | |
| ASUS Dual GeForce RTX 4060 Ti OC | |
| Sapphire Nitro+ Radeon RX 6650 XT | |
| Nvidia GeForce RTX 2070 Super | |
| KFA2 GeForce RTX 4060 1-Click-OC 2X | |
| Nvidia GeForce RTX 2060 Super | |
| XFX Speedster QICK 308 Radeon RX 7600 Black Edition | |
| Sapphire Pulse Radeon RX 6600 | |
| 3DMark 11 | |
| 1280x720 Performance GPU | |
| KFA2 GeForce RTX 4070 Ti EX Gamer | |
| KFA2 GeForce RTX 4070 EX Gamer | |
| ASUS Dual GeForce RTX 4060 Ti OC | |
| AMD Radeon RX 6700 XT | |
| XFX Speedster QICK 308 Radeon RX 7600 Black Edition | |
| Sapphire Nitro+ Radeon RX 6650 XT | |
| Nvidia GeForce RTX 3060 Ti FE | |
| KFA2 GeForce RTX 4060 1-Click-OC 2X | |
| Nvidia GeForce RTX 2070 Super | |
| Sapphire Pulse Radeon RX 6600 | |
| Nvidia GeForce RTX 2060 Super | |
| 1280x720 Performance | |
| KFA2 GeForce RTX 4070 Ti EX Gamer | |
| KFA2 GeForce RTX 4070 EX Gamer | |
| ASUS Dual GeForce RTX 4060 Ti OC | |
| AMD Radeon RX 6700 XT | |
| Nvidia GeForce RTX 3060 Ti FE | |
| XFX Speedster QICK 308 Radeon RX 7600 Black Edition | |
| Sapphire Nitro+ Radeon RX 6650 XT | |
| KFA2 GeForce RTX 4060 1-Click-OC 2X | |
| Nvidia GeForce RTX 2070 Super | |
| Nvidia GeForce RTX 2060 Super | |
| Sapphire Pulse Radeon RX 6600 | |
| LuxMark v2.0 64Bit | |
| Room GPUs-only | |
| NVIDIA GeForce RTX 4070 Ti | |
| NVIDIA GeForce RTX 4070 | |
| NVIDIA GeForce RTX 4060 | |
| AMD Radeon RX 6700 XT | |
| AMD Radeon RX 6750 XT | |
| AMD Radeon RX 7600 | |
| AMD Radeon RX 6650 XT | |
| AMD Radeon RX 6600 | |
| Sala GPUs-only | |
| NVIDIA GeForce RTX 4070 Ti | |
| NVIDIA GeForce RTX 4070 | |
| NVIDIA GeForce RTX 4060 | |
| AMD Radeon RX 6700 XT | |
| AMD Radeon RX 6750 XT | |
| AMD Radeon RX 7600 | |
| AMD Radeon RX 6650 XT | |
| AMD Radeon RX 6600 | |
| ComputeMark v2.1 | |
| 1024x600 Normal, QJuliaRayTrace | |
| NVIDIA GeForce RTX 4070 Ti | |
| NVIDIA GeForce RTX 4070 | |
| NVIDIA GeForce RTX 4060 | |
| AMD Radeon RX 7600 | |
| AMD Radeon RX 6750 XT | |
| AMD Radeon RX 6700 XT | |
| AMD Radeon RX 6650 XT | |
| NVIDIA GeForce RTX 2070 Super (Desktop) | |
| AMD Radeon RX 6600 | |
| NVIDIA GeForce RTX 2060 Super (Desktop) | |
| 1024x600 Normal, Score | |
| NVIDIA GeForce RTX 4070 Ti | |
| NVIDIA GeForce RTX 4070 | |
| AMD Radeon RX 6750 XT | |
| AMD Radeon RX 7600 | |
| AMD Radeon RX 6700 XT | |
| NVIDIA GeForce RTX 4060 | |
| AMD Radeon RX 6650 XT | |
| NVIDIA GeForce RTX 2070 Super (Desktop) | |
| AMD Radeon RX 6600 | |
| NVIDIA GeForce RTX 2060 Super (Desktop) | |
| 1024x600 Normal, Fluid 3DTex | |
| NVIDIA GeForce RTX 4070 Ti | |
| NVIDIA GeForce RTX 4070 | |
| AMD Radeon RX 6750 XT | |
| AMD Radeon RX 6700 XT | |
| NVIDIA GeForce RTX 2070 Super (Desktop) | |
| NVIDIA GeForce RTX 2060 Super (Desktop) | |
| NVIDIA GeForce RTX 4060 | |
| AMD Radeon RX 7600 | |
| AMD Radeon RX 6650 XT | |
| AMD Radeon RX 6600 | |
| 1024x600 Normal, Fluid 2DTexArr | |
| NVIDIA GeForce RTX 4070 Ti | |
| NVIDIA GeForce RTX 4070 | |
| AMD Radeon RX 6750 XT | |
| NVIDIA GeForce RTX 2070 Super (Desktop) | |
| AMD Radeon RX 6700 XT | |
| NVIDIA GeForce RTX 2060 Super (Desktop) | |
| NVIDIA GeForce RTX 4060 | |
| AMD Radeon RX 7600 | |
| AMD Radeon RX 6650 XT | |
| AMD Radeon RX 6600 | |
| 1024x600 Normal, Mandel Vector | |
| NVIDIA GeForce RTX 4070 Ti | |
| NVIDIA GeForce RTX 4070 | |
| AMD Radeon RX 6750 XT | |
| AMD Radeon RX 7600 | |
| AMD Radeon RX 6700 XT | |
| AMD Radeon RX 6650 XT | |
| NVIDIA GeForce RTX 4060 | |
| AMD Radeon RX 6600 | |
| NVIDIA GeForce RTX 2070 Super (Desktop) | |
| NVIDIA GeForce RTX 2060 Super (Desktop) | |
| 1024x600 Normal, Mandel Scalar | |
| NVIDIA GeForce RTX 4070 Ti | |
| NVIDIA GeForce RTX 4070 | |
| AMD Radeon RX 6750 XT | |
| AMD Radeon RX 7600 | |
| AMD Radeon RX 6700 XT | |
| AMD Radeon RX 6650 XT | |
| NVIDIA GeForce RTX 4060 | |
| AMD Radeon RX 6600 | |
| NVIDIA GeForce RTX 2070 Super (Desktop) | |
| NVIDIA GeForce RTX 2060 Super (Desktop) | |
| Photoshop PugetBench | |
| GPU Score | |
| AMD Radeon RX 6750 XT | |
| AMD Radeon RX 6700 XT | |
| AMD Radeon RX 6650 XT | |
| AMD Radeon RX 7600 | |
| NVIDIA GeForce RTX 2060 Super (Desktop) | |
| NVIDIA GeForce RTX 3060 Ti | |
| NVIDIA GeForce RTX 2070 Super (Desktop) | |
| AMD Radeon RX 6600 | |
| NVIDIA GeForce RTX 4070 | |
| NVIDIA GeForce RTX 4060 | |
| NVIDIA GeForce RTX 4070 Ti | |
| Overall Score | |
| AMD Radeon RX 6750 XT | |
| AMD Radeon RX 7600 | |
| AMD Radeon RX 6700 XT | |
| NVIDIA GeForce RTX 2060 Super (Desktop) | |
| AMD Radeon RX 6650 XT | |
| NVIDIA GeForce RTX 2070 Super (Desktop) | |
| NVIDIA GeForce RTX 4060 | |
| NVIDIA GeForce RTX 3060 Ti | |
| NVIDIA GeForce RTX 4070 | |
| AMD Radeon RX 6600 | |
| NVIDIA GeForce RTX 4070 Ti | |
| Premiere Pro PugetBench | |
| GPU 0.9 | |
| NVIDIA GeForce RTX 4070 Ti | |
| NVIDIA GeForce RTX 4070 | |
| NVIDIA GeForce RTX 2070 Super (Desktop) | |
| NVIDIA GeForce RTX 3060 Ti | |
| NVIDIA GeForce RTX 2060 Super (Desktop) | |
| AMD Radeon RX 6750 XT | |
| AMD Radeon RX 6700 XT | |
| NVIDIA GeForce RTX 4060 | |
| AMD Radeon RX 7600 | |
| AMD Radeon RX 6650 XT | |
| AMD Radeon RX 6600 | |
| Overall Score 0.9 | |
| NVIDIA GeForce RTX 4070 | |
| NVIDIA GeForce RTX 4070 Ti | |
| NVIDIA GeForce RTX 2060 Super (Desktop) | |
| NVIDIA GeForce RTX 4060 | |
| NVIDIA GeForce RTX 3060 Ti | |
| NVIDIA GeForce RTX 2070 Super (Desktop) | |
| AMD Radeon RX 6750 XT | |
| AMD Radeon RX 7600 | |
| AMD Radeon RX 6650 XT | |
| AMD Radeon RX 6700 XT | |
| AMD Radeon RX 6600 | |
| Affinity Photo 2 - Combined (Single / Multi GPU) | |
| NVIDIA GeForce RTX 4070 | |
| NVIDIA GeForce RTX 4070 Ti | |
| NVIDIA GeForce RTX 2070 Super (Desktop) | |
| NVIDIA GeForce RTX 2060 Super (Desktop) | |
| AMD Radeon RX 6750 XT | |
| NVIDIA GeForce RTX 3060 Ti | |
| NVIDIA GeForce RTX 4060 | |
| AMD Radeon RX 7600 | |
| AMD Radeon RX 6650 XT | |
| AMD Radeon RX 6700 XT | |
| AMD Radeon RX 6600 | |
| 3DMark 05 Standard | 81832 Punkte | |
| 3DMark 06 Standard Score | 66506 Punkte | |
| 3DMark Vantage P Result | 114647 Punkte | |
| 3DMark 11 Performance | 38744 Punkte | |
| 3DMark Ice Storm Standard Score | 271021 Punkte | |
| 3DMark Cloud Gate Standard Score | 78794 Punkte | |
| 3DMark Fire Strike Score | 30440 Punkte | |
| 3DMark Fire Strike Extreme Score | 14730 Punkte | |
| 3DMark Time Spy Score | 11682 Punkte | |
Hilfe | ||
Professionelle Anwendungen
Professionelle Rendersoftware profitiert vorrangig von speziellen Treibern, welche nur bei bestimmten Grafikkarten zum Tragen kommen. Bei AMD gibt dafür die PRO-Serie und bei Nvidia werden die professionellen Grafikkarten als Quadro-Serie vermarktet. Herkömmliche Grafikkarten bieten unterdessen nur eine geringere Leistung bei den Rendertests. Dennoch hat AMD gegenüber Nvidia hier einen deutlichen Vorteil, welchen auch die XFX Speedster QICK 308 Radeon RX 7600 Black Edition zu nutzen weiß. Gegenüber einer Nvidia GeForce RTX 4060 Ti kann sich unser AMD-Sample einen Vorsprung von knapp 30 Prozent erarbeiten. Für kleinere Projekte im privaten oder semiprofessionellen Umfeld kann man auf eine AMD Radeon RX 7600 zurückgreifen.
| AMD Radeon RX 7600 R9 7950X | AMD Radeon RX 6600 R9 7950X | AMD Radeon RX 6650 XT R9 7950X | AMD Radeon RX 6700 XT R9 7950X | AMD Radeon RX 6800 XT R9 5950X | AMD Radeon RX 6950 XT R9 7950X | AMD Radeon RX 7900 GRE R9 7950X | AMD Radeon RX 7900 XT R9 7950X | AMD Radeon RX 7900 XTX R9 7950X | NVIDIA GeForce RTX 4060 R9 7950X | NVIDIA GeForce RTX 4060 Ti 8G R9 7950X | NVIDIA GeForce RTX 4070 R9 7950X | NVIDIA GeForce RTX 4070 Ti R9 7950X | NVIDIA GeForce RTX 4080 R9 7950X | NVIDIA GeForce RTX 4090 R9 7950X | Durchschnitt der Klasse | |
|---|---|---|---|---|---|---|---|---|---|---|---|---|---|---|---|---|
| SPECviewperf 12 | -0% | 16% | 29% | -18% | 17% | 57% | 91% | 114% | -40% | -29% | -8% | 11% | 31% | 41% | -46% | |
| 1900x1060 3ds Max (3dsmax-05) (fps) | 279 | 258 -8% | 310 11% | 363 30% | 167 -40% | 418 50% | 444 59% | 502 80% | 553 98% | 251 -10% | 286 3% | 382 37% | 436 56% | 502 80% | 571 105% | 206 ? -26% |
| 1900x1060 Catia (catia-04) (fps) | 273 | 256 -6% | 314 15% | 339 24% | 238 -13% | 368 35% | 448 64% | 481 76% | 536 96% | 113 -59% | 128 -53% | 161 -41% | 192 -30% | 221 -19% | 257 -6% | 113.6 ? -58% |
| 1900x1060 Creo (creo-01) (fps) | 115 | 133 16% | 142 23% | 152 32% | 119 3% | 163 42% | 155 35% | 176 53% | 187 63% | 60.6 -47% | 74.3 -35% | 89.1 -23% | 99.4 -14% | 110 -4% | 115 0% | 66.6 ? -42% |
| 1900x1060 Energy (energy-01) (fps) | 25.5 | 31.3 23% | 37.6 47% | 40.6 59% | 28.39 11% | 34.3 35% | 40.3 58% | 72.4 184% | 85.2 234% | 15.9 -38% | 22.8 -11% | 31.7 24% | 48 88% | 58.8 131% | 54.7 115% | 16.9 ? -34% |
| 1900x1060 Maya (maya-04) (fps) | 236 | 218 -8% | 246 4% | 268 14% | 118 -50% | 195 -17% | 323 37% | 347 47% | 367 56% | 233 -1% | 252 7% | 284 20% | 287 22% | 309 31% | 317 34% | 117.7 ? -50% |
| 1900x1060 Medical (medical-01) (fps) | 128 | 102 -20% | 137 7% | 150 17% | 77.3 -40% | 95.2 -26% | 226 77% | 288 125% | 347 171% | 82.4 -36% | 107 -16% | 132 3% | 157 23% | 171 34% | 119 -7% | 59.2 ? -54% |
| 1900x1060 Showcase (showcase-01) (fps) | 127 | 125 -2% | 151 19% | 176 39% | 223 76% | 264 108% | 222 75% | 278 119% | 322 154% | 109 -14% | 122 -4% | 190 50% | 244 92% | 333 162% | 457 260% | 103.7 ? -18% |
| 1900x1060 Siemens NX (snx-02) (fps) | 210 | 203 -3% | 230 10% | 257 22% | 45.07 -79% | 56.4 -73% | 341 62% | 373 78% | 400 90% | 14.2 -93% | 14.5 -93% | 16.4 -92% | 19 -91% | 21.6 -90% | 27.1 -87% | 60.9 ? -71% |
| 1900x1060 Solidworks (sw-03) (fps) | 221 | 232 5% | 242 10% | 275 24% | 150 -32% | 218 -1% | 319 44% | 342 55% | 360 63% | 91.2 -59% | 94.8 -57% | 109 -51% | 118 -47% | 113 -49% | 126 -43% | 89.4 ? -60% |
| SPECviewperf 13 | -13% | 3% | 19% | -8% | 24% | 65% | 77% | 98% | -40% | -29% | -8% | 10% | 32% | 56% | -37% | |
| 3ds Max (3dsmax-06) (fps) | 280 | 258 -8% | 310 11% | 360 29% | 284 1% | 416 49% | 439 57% | 506 81% | 564 101% | 252 -10% | 286 2% | 381 36% | 433 55% | 497 78% | 563 101% | 196.9 ? -30% |
| Catia (catia-05) (fps) | 410 | 387 -6% | 482 18% | 528 29% | 412 0% | 588 43% | 661 61% | 728 78% | 825 101% | 163 -60% | 187 -54% | 241 -41% | 290 -29% | 340 -17% | 402 -2% | 211 ? -49% |
| Creo (creo-02) (fps) | 294 | 279 -5% | 317 8% | 353 20% | 276 -6% | 374 27% | 470 60% | 567 93% | 613 109% | 230 -22% | 298 1% | 375 28% | 455 55% | 529 80% | 552 88% | 216 ? -27% |
| Energy (energy-02) (fps) | 82.9 | 44 -47% | 59.8 -28% | 74.3 -10% | 58.4 -30% | 60.8 -27% | 150 81% | 147 77% | 187 126% | 34.6 -58% | 45.3 -45% | 54.2 -35% | 72.8 -12% | 92.6 12% | 126 52% | 39.7 ? -52% |
| Maya (maya-05) (fps) | 333 | 348 5% | 403 21% | 462 39% | 348 5% | 460 38% | 580 74% | 670 101% | 735 121% | 343 3% | 395 19% | 510 53% | 591 77% | 678 104% | 715 115% | 278 ? -17% |
| Medical (medical-02) (fps) | 226 | 88.8 -61% | 105 -54% | 148 -35% | 130 -42% | 372 65% | 237 5% | 263 16% | 76.5 -66% | 92 -59% | 112 -50% | 132 -42% | 150 -34% | 186 -18% | 88.4 ? -61% | |
| Showcase (showcase-02) (fps) | 127 | 125 -2% | 151 19% | 176 39% | 232 83% | 264 108% | 221 74% | 279 120% | 323 154% | 108 -15% | 121 -5% | 191 50% | 244 92% | 334 163% | 455 258% | 126.2 ? -1% |
| Siemens NX (snx-03) (fps) | 379 | 366 -3% | 417 10% | 465 23% | 81.4 -79% | 101 -73% | 617 63% | 675 78% | 725 91% | 25.6 -93% | 26.3 -93% | 29.5 -92% | 34.1 -91% | 39 -90% | 49.1 -87% | 136.6 ? -64% |
| Solidworks (sw-04) (fps) | 195 | 220 13% | 231 18% | 272 39% | 193 -1% | 254 30% | 287 47% | 307 57% | 323 66% | 127 -35% | 135 -31% | 157 -19% | 168 -14% | 179 -8% | 186 -5% | 124.1 ? -36% |
| SPECviewperf 2020 | -25% | -10% | 10% | -13% | 12% | 80% | 78% | 106% | -39% | -29% | -3% | 16% | 38% | 73% | -19% | |
| 3840x2160 Siemens NX (snx-04) (fps) | 240 | 236 -2% | 265 10% | 287 20% | 81.7 -66% | 98.4 -59% | 402 68% | 476 98% | 514 114% | 19.5 -92% | 20.1 -92% | 23.9 -90% | 27.5 -89% | 31.9 -87% | 41.3 -83% | 88.5 ? -63% |
| 3840x2160 Medical (medical-03) (fps) | 36.1 | 20.9 -42% | 27.3 -24% | 30.1 -17% | 27.84 -23% | 35 -3% | 76.1 111% | 53.9 49% | 62.3 73% | 13.7 -62% | 17.5 -52% | 22.2 -39% | 26.9 -25% | 32.2 -11% | 45.9 27% | 24 ? -34% |
| 3840x2160 Maya (maya-06) (fps) | 178 | 161 -10% | 192 8% | 258 45% | 224 26% | 315 77% | 346 94% | 401 125% | 481 170% | 196 10% | 226 27% | 305 71% | 372 109% | 447 151% | 498 180% | 220 ? 24% |
| 3840x2160 Energy (energy-03) (fps) | 67 | 29.5 -56% | 44.2 -34% | 52.2 -22% | 60.8 -9% | 69.3 3% | 133 99% | 99.6 49% | 129 93% | 33.2 -50% | 44.8 -33% | 57.6 -14% | 75.7 13% | 90.4 35% | 141 110% | 50 ? -25% |
| 3840x2160 Creo (creo-03) (fps) | 106 | 93.4 -12% | 105 -1% | 123 16% | 65 -39% | 92.4 -13% | 159 50% | 173 63% | 187 76% | 85.9 -19% | 95.8 -10% | 112 6% | 121 14% | 128 21% | 133 25% | 78.2 ? -26% |
| 3840x2160 CATIA (catia-06) (fps) | 68 | 60.8 -11% | 70.1 3% | 77.2 14% | 42.4 -38% | 59.7 -12% | 107 57% | 113 66% | 127 87% | 34 -50% | 39.1 -42% | 51.6 -24% | 61.2 -10% | 75.5 11% | 95.3 40% | 48.9 ? -28% |
| 3840x2160 3ds Max (3dsmax-07) (fps) | 72.9 | 42.4 -42% | 51.5 -29% | 85.4 17% | 114 56% | 140 92% | 134 84% | 143 96% | 167 129% | 67.4 -8% | 74.5 2% | 122 67% | 147 102% | 179 146% | 228 213% | 84.8 ? 16% |
| Durchschnitt gesamt (Programm / Settings) | -13% /
-12% | 3% /
4% | 19% /
20% | -13% /
-13% | 18% /
18% | 67% /
66% | 82% /
82% | 106% /
106% | -40% /
-39% | -29% /
-29% | -6% /
-7% | 12% /
12% | 34% /
33% | 57% /
55% | -34% /
-35% |
Gaming Performance
Schauen wir einmal die Tabelle aller getesteten Spiele an, so sehen wir, dass mit der XFX Speedster QICK 308 Radeon RX 7600 Black Edition die meisten Spiele in Full-HD-Auflösung problemlos gespielt werden können. Genau dafür ist die Grafikkarte konzipiert, wenngleich die Grafikkarte bei den neuesten Spielen aber schnell an ihre Grenzen stößt. Mitunter muss man auf einige Details verzichten und mit dem High-Preset vorliebnehmen. Hierzu zählen F1 23, Ratchet & Clank Rift Apart und Immortals of Aveum.
Betrachten wir einmal die aktuelle Steam-Hardware-Umfrage aus dem Juli 2023, so sehen wir, dass die Mehrheit der Nutzer (über 60 Prozent) die Full-HD-Auflösung nutzt. Damit positioniert sich die XFX Speedster QICK 308 Radeon RX 7600 Black Edition in der guten Mittelklasse. Letztlich entscheidet hier der Preis, denn die wenigsten Gamer sind gewillt vierstellige Preise für Grafikkarten auf den Tisch zu legen. Mit unter 300 Euro bietet unser Testsample eine bessere Leistung als eine Nvidia GeForce RTX 4060, welche aktuell, je nach Modell, gleichviel kostet. Schon 100 Euro mehr muss man für eine Nvidia GeForce RTX 4060 Ti einplanen. Wer zu einem älteren Modell greifen möchte, bekommt mit der AMD Radeon RX 6650 XT eine ähnliche Leistung für knapp 250 Euro.
| F1 2021 | |
| 2560x1440 Ultra High Preset + Raytracing AA:T AF:16x | |
| Palit GeForce RTX 4090 GameRock OC (874931) | |
| KFA2 GeForce RTX 4080 SG (874931) | |
| AMD Radeon RX 7900 XTX (874931) | |
| KFA2 GeForce RTX 4070 Ti EX Gamer (874931) | |
| AMD Radeon RX 7900 XT (874931) | |
| MSI Radeon RX 6950 XT Gaming X Trio (874931) | |
| NVIDIA GeForce RTX 3090 Founders Edition (874931) | |
| KFA2 GeForce RTX 4070 EX Gamer (874931) | |
| AMD Radeon RX 7900 GRE (874931) | |
| KFA2 GeForce RTX 3070 Ti SG (874931) | |
| AMD Radeon RX 6800 (874931) | |
| Nvidia Titan RTX (874931) | |
| ASUS Dual GeForce RTX 4060 Ti OC (874931) | |
| Sapphire Pulse Radeon RX 6750 XT (874931) | |
| Nvidia GeForce RTX 3060 Ti FE (874931) | |
| XFX Speedster QICK 308 Radeon RX 7600 Black Edition (874931) | |
| Nvidia GeForce RTX 2070 Super (874931) | |
| KFA2 GeForce GTX 1660 Super (874931) | |
| Sapphire Nitro+ Radeon RX 6650 XT (874931) | |
| PNY GeForce GTX 1660 (874931) | |
| Nvidia GeForce RTX 2060 Super (874931) | |
| Sapphire Pulse Radeon RX 6600 (874931) | |
| 1920x1080 Ultra High Preset + Raytracing AA:T AF:16x | |
| Palit GeForce RTX 4090 GameRock OC (874931) | |
| AMD Radeon RX 7900 XTX (874931) | |
| KFA2 GeForce RTX 4080 SG (874931) | |
| KFA2 GeForce RTX 4070 Ti EX Gamer (874931) | |
| AMD Radeon RX 7900 XT (874931) | |
| MSI Radeon RX 6950 XT Gaming X Trio (874931) | |
| NVIDIA GeForce RTX 3090 Founders Edition (874931) | |
| KFA2 GeForce RTX 4070 EX Gamer (874931) | |
| AMD Radeon RX 7900 GRE (874931) | |
| KFA2 GeForce RTX 3070 Ti SG (874931) | |
| ASUS Dual GeForce RTX 4060 Ti OC (874931) | |
| AMD Radeon RX 6800 (874931) | |
| Nvidia Titan RTX (874931) | |
| Sapphire Pulse Radeon RX 6750 XT (874931) | |
| Nvidia GeForce RTX 3060 Ti FE (874931) | |
| XFX Speedster QICK 308 Radeon RX 7600 Black Edition (874931) | |
| Nvidia GeForce RTX 2070 Super (874931) | |
| Sapphire Nitro+ Radeon RX 6650 XT (874931) | |
| KFA2 GeForce GTX 1660 Super (874931) | |
| Nvidia GeForce RTX 2060 Super (874931) | |
| PNY GeForce GTX 1660 (874931) | |
| Sapphire Pulse Radeon RX 6600 (874931) | |
| F1 22 | |
| 2560x1440 Ultra High Preset AA:T AF:16x | |
| Palit GeForce RTX 4090 GameRock OC (923662) | |
| KFA2 GeForce RTX 4080 SG (939134) | |
| AMD Radeon RX 7900 XTX (939134) | |
| KFA2 GeForce RTX 4070 Ti EX Gamer (959964) | |
| AMD Radeon RX 7900 XT (939134) | |
| NVIDIA GeForce RTX 3090 Founders Edition (923650) | |
| AMD Radeon RX 7900 GRE (959964) | |
| MSI Radeon RX 6950 XT Gaming X Trio (939134) | |
| KFA2 GeForce RTX 4070 EX Gamer (959964) | |
| KFA2 GeForce GTX 1660 Super (928484) | |
| PNY GeForce GTX 1660 (928484) | |
| KFA2 GeForce RTX 3070 Ti SG (939134) | |
| Nvidia Titan RTX (923650) | |
| ASUS Dual GeForce RTX 4060 Ti OC (959964) | |
| AMD Radeon RX 6800 (928484) | |
| Nvidia GeForce RTX 3060 Ti FE (923650) | |
| Sapphire Pulse Radeon RX 6750 XT (959964) | |
| KFA2 GeForce RTX 4060 1-Click-OC 2X (959964) | |
| Nvidia GeForce RTX 2070 Super (923662) | |
| XFX Speedster QICK 308 Radeon RX 7600 Black Edition (959964) | |
| Nvidia GeForce RTX 2060 Super (923662) | |
| Sapphire Nitro+ Radeon RX 6650 XT (946728) | |
| Sapphire Pulse Radeon RX 6600 (946728) | |
| 1920x1080 Ultra High Preset AA:T AF:16x | |
| Palit GeForce RTX 4090 GameRock OC | |
| KFA2 GeForce RTX 4080 SG (939134) | |
| AMD Radeon RX 7900 XTX (939134) | |
| KFA2 GeForce RTX 4070 Ti EX Gamer (959964) | |
| NVIDIA GeForce RTX 3090 Founders Edition (923650) | |
| AMD Radeon RX 7900 XT (939134) | |
| MSI Radeon RX 6950 XT Gaming X Trio (939134) | |
| KFA2 GeForce RTX 4070 EX Gamer (959964) | |
| AMD Radeon RX 7900 GRE (959964) | |
| KFA2 GeForce GTX 1660 Super (928484) | |
| KFA2 GeForce RTX 3070 Ti SG (939134) | |
| PNY GeForce GTX 1660 (928484) | |
| Nvidia Titan RTX (923650) | |
| ASUS Dual GeForce RTX 4060 Ti OC (959964) | |
| Nvidia GeForce RTX 3060 Ti FE (923650) | |
| AMD Radeon RX 6800 | |
| Sapphire Pulse Radeon RX 6750 XT (959964) | |
| KFA2 GeForce RTX 4060 1-Click-OC 2X (959964) | |
| XFX Speedster QICK 308 Radeon RX 7600 Black Edition (959964) | |
| Nvidia GeForce RTX 2070 Super (923662) | |
| Nvidia GeForce RTX 2060 Super (923662) | |
| Sapphire Nitro+ Radeon RX 6650 XT (946728) | |
| Sapphire Pulse Radeon RX 6600 (946728) | |
| Cyberpunk 2077 1.6 | |
| 2560x1440 Ultra Preset | |
| Palit GeForce RTX 4090 GameRock OC (1.6) | |
| AMD Radeon RX 7900 XTX (1.61) | |
| KFA2 GeForce RTX 4080 SG (1.61) | |
| AMD Radeon RX 7900 XT (1.61) | |
| MSI Radeon RX 6950 XT Gaming X Trio (1.61) | |
| AMD Radeon RX 7900 GRE (1.6) | |
| KFA2 GeForce RTX 4070 Ti EX Gamer | |
| KFA2 GeForce RTX 4070 EX Gamer | |
| AMD Radeon RX 6800 (1.61) | |
| KFA2 GeForce RTX 3070 Ti SG (1.61) | |
| Sapphire Pulse Radeon RX 6750 XT | |
| ASUS Dual GeForce RTX 4060 Ti OC (1.6) | |
| Nvidia GeForce RTX 3060 Ti FE (1.5) | |
| XFX Speedster QICK 308 Radeon RX 7600 Black Edition (1.6) | |
| Nvidia GeForce RTX 2070 Super (1.6) | |
| KFA2 GeForce RTX 4060 1-Click-OC 2X (1.6) | |
| Sapphire Nitro+ Radeon RX 6650 XT (1.5) | |
| Nvidia GeForce RTX 2060 Super (1.6) | |
| Sapphire Pulse Radeon RX 6600 (1.5) | |
| KFA2 GeForce GTX 1660 Super (1.6) | |
| PNY GeForce GTX 1660 (1.6) | |
| 1920x1080 Ultra Preset | |
| Palit GeForce RTX 4090 GameRock OC (1.6) | |
| AMD Radeon RX 7900 XTX (1.61) | |
| KFA2 GeForce RTX 4080 SG (1.61) | |
| AMD Radeon RX 7900 XT (1.61) | |
| MSI Radeon RX 6950 XT Gaming X Trio (1.61) | |
| KFA2 GeForce RTX 4070 Ti EX Gamer | |
| AMD Radeon RX 7900 GRE (1.6) | |
| KFA2 GeForce RTX 4070 EX Gamer | |
| AMD Radeon RX 6800 (1.61) | |
| KFA2 GeForce RTX 3070 Ti SG (1.61) | |
| ASUS Dual GeForce RTX 4060 Ti OC (1.6) | |
| Sapphire Pulse Radeon RX 6750 XT | |
| Nvidia GeForce RTX 3060 Ti FE (1.5) | |
| XFX Speedster QICK 308 Radeon RX 7600 Black Edition (1.6) | |
| KFA2 GeForce RTX 4060 1-Click-OC 2X (1.6) | |
| Sapphire Nitro+ Radeon RX 6650 XT (1.5) | |
| Nvidia GeForce RTX 2070 Super (1.6) | |
| Nvidia GeForce RTX 2060 Super (1.6) | |
| Sapphire Pulse Radeon RX 6600 (1.5) | |
| KFA2 GeForce GTX 1660 Super (1.6) | |
| PNY GeForce GTX 1660 (1.6) | |
| GRID Legends | |
| 2560x1440 Ultra Preset | |
| AMD Radeon RX 7900 XTX (643827) | |
| Palit GeForce RTX 4090 GameRock OC (591708) | |
| AMD Radeon RX 7900 XT (643827) | |
| MSI Radeon RX 6950 XT Gaming X Trio (643827) | |
| KFA2 GeForce RTX 4080 SG (643827) | |
| KFA2 GeForce RTX 4070 Ti EX Gamer (712825) | |
| NVIDIA GeForce RTX 3090 Founders Edition (591708) | |
| AMD Radeon RX 7900 GRE (800660) | |
| AMD Radeon RX 6800 (643827) | |
| KFA2 GeForce RTX 3070 Ti SG (643827) | |
| KFA2 GeForce RTX 4070 EX Gamer (712825) | |
| Sapphire Pulse Radeon RX 6750 XT (712825) | |
| Nvidia Titan RTX (591708) | |
| ASUS Dual GeForce RTX 4060 Ti OC (800660) | |
| Nvidia GeForce RTX 3060 Ti FE (591708) | |
| XFX Speedster QICK 308 Radeon RX 7600 Black Edition (800660) | |
| Sapphire Nitro+ Radeon RX 6650 XT (643827) | |
| KFA2 GeForce RTX 4060 1-Click-OC 2X (800660) | |
| Nvidia GeForce RTX 2070 Super (591708) | |
| Nvidia GeForce RTX 2060 Super (623651) | |
| Sapphire Pulse Radeon RX 6600 (683088) | |
| KFA2 GeForce GTX 1660 Super (623651) | |
| PNY GeForce GTX 1660 (623651) | |
| 1920x1080 Ultra Preset | |
| AMD Radeon RX 7900 XTX (643827) | |
| MSI Radeon RX 6950 XT Gaming X Trio (643827) | |
| AMD Radeon RX 7900 XT (643827) | |
| Palit GeForce RTX 4090 GameRock OC (591708) | |
| KFA2 GeForce RTX 4080 SG (643827) | |
| AMD Radeon RX 6800 (643827) | |
| KFA2 GeForce RTX 4070 Ti EX Gamer (712825) | |
| NVIDIA GeForce RTX 3090 Founders Edition (591708) | |
| KFA2 GeForce RTX 4070 EX Gamer (712825) | |
| AMD Radeon RX 7900 GRE (800660) | |
| Sapphire Pulse Radeon RX 6750 XT (712825) | |
| KFA2 GeForce RTX 3070 Ti SG (643827) | |
| Nvidia Titan RTX (591708) | |
| Nvidia GeForce RTX 3060 Ti FE (591708) | |
| Sapphire Nitro+ Radeon RX 6650 XT (643827) | |
| ASUS Dual GeForce RTX 4060 Ti OC (800660) | |
| XFX Speedster QICK 308 Radeon RX 7600 Black Edition (800660) | |
| KFA2 GeForce RTX 4060 1-Click-OC 2X (800660) | |
| Nvidia GeForce RTX 2070 Super (591708) | |
| Sapphire Pulse Radeon RX 6600 (683088) | |
| Nvidia GeForce RTX 2060 Super (623651) | |
| KFA2 GeForce GTX 1660 Super (623651) | |
| PNY GeForce GTX 1660 (623651) | |
| Final Fantasy XV Benchmark | |
| 1920x1080 High Quality | |
| Palit GeForce RTX 4090 GameRock OC (1.3) | |
| KFA2 GeForce RTX 4080 SG (1.3) | |
| AMD Radeon RX 7900 XTX (1.3) | |
| KFA2 GeForce RTX 4070 Ti EX Gamer (1.3) | |
| AMD Radeon RX 7900 XT (1.3) | |
| MSI Radeon RX 6950 XT Gaming X Trio (1.3) | |
| NVIDIA GeForce RTX 3090 Founders Edition (1.3) | |
| KFA2 GeForce RTX 4070 EX Gamer (1.3) | |
| AMD Radeon RX 7900 GRE (1.3) | |
| AMD Radeon RX 6800 (1.3) | |
| Nvidia Titan RTX (1.3) | |
| KFA2 GeForce RTX 3070 Ti SG (1.3) | |
| ASUS Dual GeForce RTX 4060 Ti OC (1.3) | |
| Sapphire Pulse Radeon RX 6750 XT (1.3) | |
| Nvidia GeForce RTX 3060 Ti FE (1.3) | |
| KFA2 GeForce RTX 4060 1-Click-OC 2X (1.3) | |
| Nvidia GeForce RTX 2070 Super (1.3) | |
| XFX Speedster QICK 308 Radeon RX 7600 Black Edition (1.3) | |
| Sapphire Nitro+ Radeon RX 6650 XT (1.3) | |
| Nvidia GeForce RTX 2060 Super (1.3) | |
| Sapphire Pulse Radeon RX 6600 (1.3) | |
| KFA2 GeForce GTX 1660 Super (1.3) | |
| PNY GeForce GTX 1660 (1.3) | |
| 2560x1440 High Quality | |
| Palit GeForce RTX 4090 GameRock OC (1.3) | |
| KFA2 GeForce RTX 4080 SG (1.3) | |
| AMD Radeon RX 7900 XTX (1.3) | |
| KFA2 GeForce RTX 4070 Ti EX Gamer (1.3) | |
| MSI Radeon RX 6950 XT Gaming X Trio (1.3) | |
| AMD Radeon RX 7900 XT (1.3) | |
| NVIDIA GeForce RTX 3090 Founders Edition (1.3) | |
| KFA2 GeForce RTX 4070 EX Gamer (1.3) | |
| AMD Radeon RX 7900 GRE (1.3) | |
| AMD Radeon RX 6800 (1.3) | |
| KFA2 GeForce RTX 3070 Ti SG (1.3) | |
| Nvidia Titan RTX (1.3) | |
| ASUS Dual GeForce RTX 4060 Ti OC (1.3) | |
| Sapphire Pulse Radeon RX 6750 XT (1.3) | |
| Nvidia GeForce RTX 3060 Ti FE (1.3) | |
| KFA2 GeForce RTX 4060 1-Click-OC 2X (1.3) | |
| Nvidia GeForce RTX 2070 Super (1.3) | |
| XFX Speedster QICK 308 Radeon RX 7600 Black Edition (1.3) | |
| Sapphire Nitro+ Radeon RX 6650 XT (1.3) | |
| Nvidia GeForce RTX 2060 Super (1.3) | |
| Sapphire Pulse Radeon RX 6600 (1.3) | |
| KFA2 GeForce GTX 1660 Super (1.3) | |
| PNY GeForce GTX 1660 (1.3) | |
| The Last of Us | |
| 1920x1080 Ultra Preset | |
| Palit GeForce RTX 4090 GameRock OC | |
| KFA2 GeForce RTX 4070 Ti EX Gamer | |
| AMD Radeon RX 7900 GRE | |
| MSI Radeon RX 6950 XT Gaming X Trio | |
| KFA2 GeForce RTX 4070 EX Gamer | |
| ASUS Dual GeForce RTX 4060 Ti OC | |
| Sapphire Pulse Radeon RX 6750 XT | |
| AMD Radeon RX 6800 | |
| Nvidia Titan RTX | |
| KFA2 GeForce RTX 4060 1-Click-OC 2X | |
| Nvidia GeForce RTX 3060 Ti FE | |
| XFX Speedster QICK 308 Radeon RX 7600 Black Edition | |
| Sapphire Nitro+ Radeon RX 6650 XT | |
| Sapphire Pulse Radeon RX 6600 | |
| Nvidia GeForce RTX 2070 Super | |
| Nvidia GeForce RTX 2060 Super | |
| KFA2 GeForce GTX 1660 Super | |
| PNY GeForce GTX 1660 | |
| 2560x1440 Ultra Preset | |
| Palit GeForce RTX 4090 GameRock OC | |
| AMD Radeon RX 7900 GRE | |
| KFA2 GeForce RTX 4070 Ti EX Gamer | |
| MSI Radeon RX 6950 XT Gaming X Trio | |
| KFA2 GeForce RTX 4070 EX Gamer | |
| AMD Radeon RX 6800 | |
| Nvidia Titan RTX | |
| Sapphire Pulse Radeon RX 6750 XT | |
| ASUS Dual GeForce RTX 4060 Ti OC | |
| Nvidia GeForce RTX 3060 Ti FE | |
| KFA2 GeForce RTX 4060 1-Click-OC 2X | |
| XFX Speedster QICK 308 Radeon RX 7600 Black Edition | |
| Nvidia GeForce RTX 2070 Super | |
| Sapphire Nitro+ Radeon RX 6650 XT | |
| Nvidia GeForce RTX 2060 Super | |
| Sapphire Pulse Radeon RX 6600 | |
| KFA2 GeForce GTX 1660 Super | |
| PNY GeForce GTX 1660 | |
| F1 23 | |
| 1920x1080 Ultra High Preset AA:T AF:16x | |
| Palit GeForce RTX 4090 GameRock OC (1022189) | |
| KFA2 GeForce RTX 4070 EX Gamer | |
| AMD Radeon RX 7900 GRE (1016022) | |
| MSI Radeon RX 6950 XT Gaming X Trio (1016022) | |
| KFA2 GeForce GTX 1660 Super (1016022) | |
| ASUS Dual GeForce RTX 4060 Ti OC (1012607) | |
| Nvidia Titan RTX (1021115) | |
| PNY GeForce GTX 1660 (1016022) | |
| Nvidia GeForce RTX 3060 Ti FE (1021115) | |
| AMD Radeon RX 6800 (1016022) | |
| KFA2 GeForce RTX 4060 1-Click-OC 2X (1008687) | |
| Sapphire Pulse Radeon RX 6750 XT (1016022) | |
| Nvidia GeForce RTX 2070 Super (1021115) | |
| XFX Speedster QICK 308 Radeon RX 7600 Black Edition (1016022) | |
| Nvidia GeForce RTX 2060 Super (1021115) | |
| Sapphire Nitro+ Radeon RX 6650 XT (1016022) | |
| Sapphire Pulse Radeon RX 6600 (1016022) | |
| 2560x1440 Ultra High Preset AA:T AF:16x | |
| Palit GeForce RTX 4090 GameRock OC (1022189) | |
| KFA2 GeForce RTX 4070 EX Gamer | |
| AMD Radeon RX 7900 GRE (1016022) | |
| MSI Radeon RX 6950 XT Gaming X Trio (1016022) | |
| KFA2 GeForce GTX 1660 Super (1016022) | |
| PNY GeForce GTX 1660 (1016022) | |
| Nvidia Titan RTX (1021115) | |
| ASUS Dual GeForce RTX 4060 Ti OC (1012607) | |
| Nvidia GeForce RTX 3060 Ti FE (1021115) | |
| AMD Radeon RX 6800 (1016022) | |
| KFA2 GeForce RTX 4060 1-Click-OC 2X (1008687) | |
| Sapphire Pulse Radeon RX 6750 XT (1016022) | |
| Nvidia GeForce RTX 2070 Super (1021115) | |
| XFX Speedster QICK 308 Radeon RX 7600 Black Edition (1016022) | |
| Nvidia GeForce RTX 2060 Super (1021115) | |
| Sapphire Nitro+ Radeon RX 6650 XT (1016022) | |
| Sapphire Pulse Radeon RX 6600 (1016022) | |
| Hogwarts Legacy | |
| 1920x1080 Ultra Preset AA:High T | |
| MSI Radeon RX 6950 XT Gaming X Trio | |
| Palit GeForce RTX 4090 GameRock OC | |
| AMD Radeon RX 7900 GRE | |
| KFA2 GeForce RTX 4070 Ti EX Gamer | |
| KFA2 GeForce RTX 4070 EX Gamer | |
| AMD Radeon RX 6800 | |
| Nvidia Titan RTX | |
| Nvidia GeForce RTX 3060 Ti FE | |
| ASUS Dual GeForce RTX 4060 Ti OC | |
| Sapphire Pulse Radeon RX 6750 XT | |
| XFX Speedster QICK 308 Radeon RX 7600 Black Edition | |
| Nvidia GeForce RTX 2070 Super | |
| KFA2 GeForce RTX 4060 1-Click-OC 2X | |
| Sapphire Nitro+ Radeon RX 6650 XT | |
| Nvidia GeForce RTX 2060 Super | |
| Sapphire Pulse Radeon RX 6600 | |
| PNY GeForce GTX 1660 | |
| KFA2 GeForce GTX 1660 Super | |
| 2560x1440 Ultra Preset AA:High T | |
| Palit GeForce RTX 4090 GameRock OC | |
| MSI Radeon RX 6950 XT Gaming X Trio | |
| AMD Radeon RX 7900 GRE | |
| KFA2 GeForce RTX 4070 Ti EX Gamer | |
| KFA2 GeForce RTX 4070 EX Gamer | |
| AMD Radeon RX 6800 | |
| Nvidia Titan RTX | |
| Sapphire Pulse Radeon RX 6750 XT | |
| ASUS Dual GeForce RTX 4060 Ti OC | |
| Nvidia GeForce RTX 3060 Ti FE | |
| XFX Speedster QICK 308 Radeon RX 7600 Black Edition | |
| Nvidia GeForce RTX 2070 Super | |
| KFA2 GeForce RTX 4060 1-Click-OC 2X | |
| Sapphire Nitro+ Radeon RX 6650 XT | |
| Nvidia GeForce RTX 2060 Super | |
| KFA2 GeForce GTX 1660 Super | |
| Sapphire Pulse Radeon RX 6600 | |
| PNY GeForce GTX 1660 | |
Raytracing Performance
Wer auf die tollen Raytracing-Features nicht verzichten möchte, muss mit spürbaren Leistungseinbußen leben. Gegenüber RDNA 2 konnte die Raytracing-Leistung bei der neueren RDNA-3-Architektur leicht verbessert werden. Mit Nvidia kann AMD in dem aktuellen Vergleich nicht mithalten. Bei den getesteten Spielen bietet die KFA2 GeForce RTX 4060 1-Click-OC 2X gegenüber der XFX Speedster QICK 308 Radeon RX 7600 Black Edition mehr Leistung.
| Spider-Man Miles Morales - 1920x0180 Very High Preset + Ray-Tracing AA:T | |
| KFA2 GeForce RTX 4070 Ti EX Gamer | |
| KFA2 GeForce RTX 4070 EX Gamer | |
| MSI Radeon RX 6950 XT Gaming X Trio | |
| KFA2 GeForce RTX 3070 Ti SG | |
| AMD Radeon RX 7900 GRE | |
| ASUS Dual GeForce RTX 4060 Ti OC | |
| Nvidia GeForce RTX 3060 Ti FE | |
| KFA2 GeForce RTX 4060 1-Click-OC 2X | |
| Sapphire Pulse Radeon RX 6750 XT | |
| Nvidia GeForce RTX 2070 Super | |
| XFX Speedster QICK 308 Radeon RX 7600 Black Edition | |
| Nvidia GeForce RTX 2060 Super | |
| Sapphire Nitro+ Radeon RX 6650 XT | |
| Sapphire Pulse Radeon RX 6600 | |
| Metro Exodus - 1920x1080 Ultra Quality DXR AF:16x | |
| KFA2 GeForce RTX 4070 Ti EX Gamer | |
| MSI Radeon RX 6950 XT Gaming X Trio | |
| KFA2 GeForce RTX 4070 EX Gamer | |
| AMD Radeon RX 7900 GRE | |
| KFA2 GeForce RTX 3070 Ti SG | |
| ASUS Dual GeForce RTX 4060 Ti OC | |
| Nvidia GeForce RTX 3060 Ti FE | |
| Sapphire Pulse Radeon RX 6750 XT | |
| KFA2 GeForce RTX 4060 1-Click-OC 2X | |
| XFX Speedster QICK 308 Radeon RX 7600 Black Edition | |
| Nvidia GeForce RTX 2070 Super | |
| Nvidia GeForce RTX 2060 Super | |
| Sapphire Pulse Radeon RX 6600 | |
| Far Cry 6 - 1920x1080 Ultra Graphics Quality + HD Textures + DXR AA:T | |
| KFA2 GeForce RTX 4070 Ti EX Gamer | |
| AMD Radeon RX 7900 GRE | |
| MSI Radeon RX 6950 XT Gaming X Trio | |
| KFA2 GeForce RTX 4070 EX Gamer | |
| Sapphire Pulse Radeon RX 6750 XT | |
| XFX Speedster QICK 308 Radeon RX 7600 Black Edition | |
| KFA2 GeForce RTX 3070 Ti SG | |
| Nvidia GeForce RTX 2070 Super | |
| Nvidia GeForce RTX 2060 Super | |
| KFA2 GeForce RTX 4060 1-Click-OC 2X | |
| Cyberpunk 2077 1.6 - 1920x1080 Ray Tracing Ultra Preset (DLSS off) | |
| KFA2 GeForce RTX 4070 Ti EX Gamer | |
| KFA2 GeForce RTX 4070 EX Gamer | |
| AMD Radeon RX 7900 GRE (1.6) | |
| ASUS Dual GeForce RTX 4060 Ti OC (1.6) | |
| MSI Radeon RX 6950 XT Gaming X Trio (1.61) | |
| KFA2 GeForce RTX 3070 Ti SG (1.61) | |
| Nvidia GeForce RTX 3060 Ti FE (1.5) | |
| KFA2 GeForce RTX 4060 1-Click-OC 2X (1.6) | |
| Nvidia GeForce RTX 2070 Super (1.6) | |
| Sapphire Pulse Radeon RX 6750 XT | |
| Nvidia GeForce RTX 2060 Super (1.6) | |
| XFX Speedster QICK 308 Radeon RX 7600 Black Edition (1.6) | |
| Sapphire Nitro+ Radeon RX 6650 XT (1.5) | |
| The Callisto Protocol - 1920x1080 Ultra Preset (without FSR Upscaling) + Full Ray-Tracing | |
| AMD Radeon RX 7900 GRE | |
| KFA2 GeForce RTX 4070 Ti EX Gamer | |
| ASUS Dual GeForce RTX 4060 Ti OC | |
| MSI Radeon RX 6950 XT Gaming X Trio | |
| Nvidia GeForce RTX 3060 Ti FE | |
| KFA2 GeForce RTX 4070 EX Gamer | |
| XFX Speedster QICK 308 Radeon RX 7600 Black Edition | |
| KFA2 GeForce RTX 3070 Ti SG | |
| Sapphire Nitro+ Radeon RX 6650 XT | |
| Nvidia GeForce RTX 2070 Super | |
| Sapphire Pulse Radeon RX 6600 | |
| Nvidia GeForce RTX 2060 Super | |
| Sapphire Pulse Radeon RX 6750 XT | |
| PNY GeForce GTX 1660 | |
| KFA2 GeForce GTX 1660 Super | |
| Guardians of the Galaxy - 1920x1080 Ultra Preset + Ultra Ray-Tracing | |
| KFA2 GeForce RTX 4070 Ti EX Gamer | |
| KFA2 GeForce RTX 4070 EX Gamer | |
| AMD Radeon RX 7900 GRE | |
| MSI Radeon RX 6950 XT Gaming X Trio | |
| ASUS Dual GeForce RTX 4060 Ti OC | |
| Nvidia GeForce RTX 3060 Ti FE | |
| KFA2 GeForce RTX 4060 1-Click-OC 2X | |
| Nvidia GeForce RTX 2070 Super | |
| Sapphire Pulse Radeon RX 6750 XT | |
| Nvidia GeForce RTX 2060 Super | |
| XFX Speedster QICK 308 Radeon RX 7600 Black Edition | |
| Sapphire Nitro+ Radeon RX 6650 XT | |
| Control - 1920x1080 High Quality Preset & High Ray Tracing Preset (DX12) | |
| KFA2 GeForce RTX 4070 Ti EX Gamer | |
| MSI Radeon RX 6950 XT Gaming X Trio | |
| KFA2 GeForce RTX 4070 EX Gamer | |
| AMD Radeon RX 7900 GRE | |
| ASUS Dual GeForce RTX 4060 Ti OC | |
| Nvidia GeForce RTX 3060 Ti FE | |
| Sapphire Pulse Radeon RX 6750 XT | |
| KFA2 GeForce RTX 4060 1-Click-OC 2X | |
| Nvidia GeForce RTX 2070 Super | |
| XFX Speedster QICK 308 Radeon RX 7600 Black Edition | |
| Nvidia GeForce RTX 2060 Super | |
| Sapphire Nitro+ Radeon RX 6650 XT | |
| Sapphire Pulse Radeon RX 6600 | |
| Returnal - 1920x1080 Epic Preset + Epic Ray-Tracing | |
| KFA2 GeForce RTX 4070 Ti EX Gamer | |
| KFA2 GeForce RTX 4070 EX Gamer | |
| AMD Radeon RX 7900 GRE | |
| ASUS Dual GeForce RTX 4060 Ti OC | |
| Nvidia GeForce RTX 3060 Ti FE | |
| KFA2 GeForce RTX 4060 1-Click-OC 2X | |
| Nvidia GeForce RTX 2070 Super | |
| Sapphire Pulse Radeon RX 6750 XT | |
| Nvidia GeForce RTX 2060 Super | |
| XFX Speedster QICK 308 Radeon RX 7600 Black Edition | |
| Sapphire Nitro+ Radeon RX 6650 XT | |
| F1 23 - 1920x1080 Ultra High Preset AA:T AF:16x | |
| KFA2 GeForce RTX 4070 EX Gamer | |
| AMD Radeon RX 7900 GRE (1016022) | |
| MSI Radeon RX 6950 XT Gaming X Trio (1016022) | |
| KFA2 GeForce GTX 1660 Super (1016022) | |
| ASUS Dual GeForce RTX 4060 Ti OC (1012607) | |
| PNY GeForce GTX 1660 (1016022) | |
| Nvidia GeForce RTX 3060 Ti FE (1021115) | |
| KFA2 GeForce RTX 4060 1-Click-OC 2X (1008687) | |
| Sapphire Pulse Radeon RX 6750 XT (1016022) | |
| Nvidia GeForce RTX 2070 Super (1021115) | |
| XFX Speedster QICK 308 Radeon RX 7600 Black Edition (1016022) | |
| Nvidia GeForce RTX 2060 Super (1021115) | |
| Sapphire Nitro+ Radeon RX 6650 XT (1016022) | |
| Sapphire Pulse Radeon RX 6600 (1016022) | |
| min. | mittel | hoch | max. | QHD | 4K | |
|---|---|---|---|---|---|---|
| GTA V (2015) | 187.8 | 188 | 186.7 | 112.9 | 77.4 | 82.3 |
| The Witcher 3 (2015) | 593.3 | 392.9 | 209.5 | 122.5 | 85.5 | 58.7 |
| Dota 2 Reborn (2015) | 296.6 | 205.8 | 239.7 | 168.5 | 108.8 | |
| Final Fantasy XV Benchmark (2018) | 235 | 146.9 | 103.6 | 74.2 | 39.3 | |
| Far Cry 5 (2018) | 220 | 183 | 174 | 163 | 115 | 57 |
| Strange Brigade (2018) | 697 | 284 | 230 | 198.7 | 129.4 | 69.3 |
| Shadow of the Tomb Raider (2018) | 345 | 180.7 | 167.2 | 142.2 | 89.3 | 41.6 |
| Far Cry New Dawn (2019) | 182 | 161 | 154 | 138 | 118 | 62 |
| Metro Exodus (2019) | 266 | 148.7 | 107.3 | 83.5 | 64.9 | 38.1 |
| Control (2019) | 240 | 139.7 | 100.3 | 63.6 | 31.3 | |
| Borderlands 3 (2019) | 253 | 182.6 | 125 | 96.2 | 65.7 | 34.5 |
| F1 2020 (2020) | 589 | 323 | 255 | 171.5 | 127.1 | 71.5 |
| Death Stranding (2020) | 239 | 179.8 | 166.1 | 161.6 | 111.2 | 57.8 |
| F1 2021 (2021) | 671 | 397 | 291 | 124.9 | 88.7 | 27.3 |
| Far Cry 6 (2021) | 238 | 189.2 | 161 | 123.6 | 82.7 | 25.1 |
| Guardians of the Galaxy (2021) | 207 | 146 | 145 | 136 | 96 | 52 |
| God of War (2022) | 154.5 | 127.7 | 103.9 | 73.2 | 56.5 | 34.8 |
| GRID Legends (2022) | 253 | 214 | 178.8 | 152.6 | 126.3 | 77.2 |
| Cyberpunk 2077 1.6 (2022) | 147.5 | 117.4 | 100.1 | 89.9 | 55.9 | 24 |
| Ghostwire Tokyo (2022) | 176.9 | 170.1 | 169.9 | 161 | 98.9 | 46.2 |
| Tiny Tina's Wonderlands (2022) | 267 | 205 | 130.1 | 100 | 65.8 | 29.7 |
| F1 22 (2022) | 365 | 323 | 237 | 61.6 | 37.8 | 12.6 |
| The Quarry (2022) | 168.5 | 124.5 | 101.3 | 74.6 | 49.4 | 22.8 |
| A Plague Tale Requiem (2022) | 129.3 | 97.4 | 70.9 | 53.4 | 38.4 | 20.9 |
| Uncharted Legacy of Thieves Collection (2022) | 95 | 89.9 | 83.5 | 79.3 | 77.8 | 23.9 |
| Spider-Man Miles Morales (2022) | 116 | 135.7 | 121.3 | 107.9 | 74.5 | 38.6 |
| The Callisto Protocol (2022) | 172.5 | 124.6 | 105.6 | 68.1 | 54.5 | 33.3 |
| High On Life (2023) | 283 | 180.7 | 141.2 | 106.2 | 62.9 | 26.2 |
| The Witcher 3 v4 (2023) | 210.4 | 175.1 | 149.9 | 121.3 | 77.3 | 40.1 |
| Dead Space Remake (2023) | 85.8 | 81.4 | 69.1 | 69.3 | 45.5 | 18.4 |
| Hogwarts Legacy (2023) | 161.1 | 119.6 | 94.4 | 71 | 49.6 | 22.4 |
| Returnal (2023) | 115 | 109 | 98 | 82 | 59 | 32 |
| Atomic Heart (2023) | 213 | 158.3 | 92.6 | 70.7 | 52 | 30.5 |
| Sons of the Forest (2023) | 125.4 | 112 | 105.2 | 104.8 | 71.6 | 41.2 |
| Resident Evil 4 Remake (2023) | 149.1 | 112.5 | 98.5 | 66.8 | 49.4 | 27.3 |
| The Last of Us (2023) | 114.2 | 93.6 | 75.8 | 64.3 | 36.5 | 15.2 |
| Dead Island 2 (2023) | 285 | 245 | 181.9 | 129.7 | 88 | 44.9 |
| Star Wars Jedi Survivor (2023) | 87.6 | 78.8 | 73.6 | 68.4 | 43 | 20.3 |
| Diablo 4 (2023) | 267 | 226 | 202 | 161.7 | 96.5 | 50.1 |
| F1 23 (2023) | 365 | 314 | 221 | 48.8 | 31.8 | 10.7 |
| Ratchet & Clank Rift Apart (2023) | 84.5 | 71.2 | 50.2 | 40.9 | 33.4 | 20.2 |
| Atlas Fallen (2023) | 144.7 | 138.6 | 127.9 | 100.3 | 67 | 38.4 |
| Immortals of Aveum (2023) | 86.3 | 72.1 | 54.4 | 34.2 | 17.6 | |
| Armored Core 6 (2023) | 119.8 | 118.4 | 114.6 | 100.7 | 74.5 | 40.6 |
| Starfield (2023) | 80.2 | 76 | 61.2 | 55.5 | 43.6 | 26.7 |
| Lies of P (2023) | 196.7 | 170.9 | 145 | 129.3 | 86.7 | 42.3 |
| Baldur's Gate 3 (2023) | 135.8 | 112.8 | 93.7 | 90.9 | 64.2 | 33 |
| Cyberpunk 2077 (2023) | 135.2 | 107.5 | 90.1 | 81 | 50.5 | 21.6 |
| Counter-Strike 2 (2023) | 348 | 336 | 219 | 138 | 89.6 | 44.1 |
| EA Sports FC 24 (2023) | 304 | 274 | 215 | 180.4 | 144.7 | 87.8 |
| Assassin's Creed Mirage (2023) | 157 | 139 | 128 | 84 | 67 | 35 |
| Total War Pharaoh (2023) | 402.9 | 271.5 | 163.1 | 129.1 | 83.3 | 40.8 |
| Lords of the Fallen (2023) | 98 | 80.8 | 55 | 38.1 | 25.1 | 12.3 |
| Alan Wake 2 (2023) | 77.9 | 69.3 | 62.8 | 40.3 | 20.3 | |
| EA Sports WRC (2023) | 158.8 | 107.4 | 95.8 | 86.1 | 61.2 | 33.8 |
| Call of Duty Modern Warfare 3 2023 (2023) | 179 | 162 | 120 | 112 | 75 | 41 |
| Avatar Frontiers of Pandora (2023) | 72 | 65 | 57 | 42 | 28 | 14 |
| The Finals (2023) | 291 | 210 | 186.4 | 135.6 | 81.9 | 35.3 |
| Ready or Not (2023) | 212 | 194.7 | 194.5 | 133.6 | 76.7 | 33.8 |
Emissionen - Leise und kühl dank großem Kühler
Für die Lautstärkemessungen stecken wir die XFX Speedster QICK 308 Radeon RX 7600 Black Edition auf unser Lautstärketestsystem im offenen Aufbau. Während der Messungen sind alle zusätzlichen Lüfter deaktiviert. Da XFX unser Testsample mit einem Fan-Stop-Mode versehen hat, arbeitet das Modell im Leerlauf komplett lautlos. Bei durchschnittlicher Last messen wir 29,6 dB(A) wenngleich unter Volllast 39,4 dB(A) erreicht werden. Damit ist die XFX Speedster QICK 308 Radeon RX 7600 Black Edition etwas leiser als die Kontrahenten. Allerdings ist die MSI GeForce RTX 4060 Ti Gaming X Trio 8G in dieser Disziplin unschlagbar. Subjektiv können wir aber sagen, dass die drei Lüfter der XFX Speedster QICK 308 Radeon RX 7600 Black Edition keine nervigen Frequenzen erzeugen. Aus dem geschlossenen Gehäuse ist die Grafikkarte praktisch nicht hörbar.
Lautstärkediagramm
| Idle |
| 26.3 / 26.3 / 26.3 dB(A) |
| Last |
| 29.6 / 39.4 dB(A) |
 | ||
30 dB leise 40 dB(A) deutlich hörbar 50 dB(A) störend |
||
min: | ||
| XFX Speedster QICK 308 Radeon RX 7600 Black Edition R9 7950X, Radeon RX 7600 | MSI GeForce RTX 4060 Ti Gaming X Trio 8G R9 7950X, GeForce RTX 4060 Ti 8G | KFA2 GeForce RTX 4060 Ti EX R9 7950X, GeForce RTX 4060 Ti 8G | KFA2 GeForce RTX 4060 1-Click-OC 2X R9 7950X, GeForce RTX 4060 | KFA2 GeForce RTX 4070 EX Gamer R9 7950X, GeForce RTX 4070 | |
|---|---|---|---|---|---|
| Geräuschentwicklung | -7% | -8% | -3% | -12% | |
| aus / Umgebung * (dB) | 25.4 | 29.7 -17% | 29.7 -17% | 25.8 -2% | 30 -18% |
| Idle min * (dB) | 26.3 | 30.1 -14% | 30.1 -14% | 25.9 2% | 30.2 -15% |
| Idle avg * (dB) | 26.3 | 30.1 -14% | 30.1 -14% | 25.9 2% | 30.2 -15% |
| Idle max * (dB) | 26.3 | 30.1 -14% | 30.1 -14% | 25.9 2% | 30.2 -15% |
| Last avg * (dB) | 29.6 | 30.15 -2% | 30.3 -2% | 30.3 -2% | 31.8 -7% |
| Witcher 3 ultra * (dB) | 39.6 | 35.8 10% | 45.2 -14% | ||
| Last max * (dB) | 39.4 | 31 21% | 40 -2% | 43.5 -10% | 41.1 -4% |
* ... kleinere Werte sind besser
Temperaturen und Energiebedarf
XFX verbaut auf der Speedster QICK 308 Radeon RX 7600 Black Edition einen großen Kühler, welcher mit drei 80-Millimeter-Axiallüftern die Grafikkarte zuverlässig kühlt. Aufgrund der geringen Leistungsaufnahme von nur 165 Watt hat der Kühler im Test keine Probleme, die Grafikkarte im definierten Temperaturfenster zu halten, ohne dabei Krach zu machen. Den wärmsten Punkt gibt uns HWiNFO64 mit dem GPU-Hot-Spot an, welcher beim Stresstest nur bei 79 °C lag. Der VRAM wurde bei gleicher Belastung mit 82 °C etwas wärmer. Jedoch ist man auch hier noch weit von der thermischen Grenze der verbauten Komponenten entfernt.
Die Effizienzkrone können wir AMD bei der aktuellen Einsteigerklasse der RDNA-3-GPUs nicht verleihen. Beim Energiebedarf des Testsystems notieren wir 346 Watt beim Spielen, wenngleich beim Stresstest mit FurMark 333 Watt gemessen wurden. Die etwas schnellere KFA2 GeForce RTX 4060 Ti EX ist im Vergleich deutlich sparsamer. XFX gibt für die Speedster QICK 308 Radeon RX 7600 Black Edition eine Netzteilempfehlung von 550 Watt an.

| Power Consumption / The Witcher 3 ultra (external Monitor) | |
| AMD Radeon RX 7900 XTX (Idle: 86.5 W) | |
| NVIDIA GeForce RTX 3090 Founders Edition | |
| Palit GeForce RTX 4090 GameRock OC | |
| KFA2 GeForce RTX 3080 SG | |
| KFA2 GeForce RTX 4080 SG (Idle: 86.4 W) | |
| AMD Radeon RX 7900 XT (Idle: 84.6 W) | |
| KFA2 GeForce RTX 3070 Ti SG (Idle: 88.9 W) | |
| KFA2 GeForce RTX 4070 Ti EX Gamer | |
| Sapphire Pulse Radeon RX 6750 XT | |
| NVIDIA GeForce RTX 3060 Ti Founders Edition (Idle: 111.39 W) | |
| KFA2 GeForce RTX 4070 EX Gamer | |
| XFX Speedster QICK 308 Radeon RX 7600 Black Edition | |
| Sapphire Nitro+ Radeon RX 6650 XT | |
| KFA2 GeForce RTX 4060 Ti EX | |
| KFA2 GeForce RTX 4060 1-Click-OC 2X | |
| Power Consumption / FurMark 1.19 GPU Stress Test (external Monitor) | |
| Palit GeForce RTX 4090 GameRock OC | |
| AMD Radeon RX 7900 XTX (Idle: 86.5 W) | |
| NVIDIA GeForce RTX 3090 Founders Edition | |
| AMD Radeon RX 7900 XT (Idle: 84.6 W) | |
| KFA2 GeForce RTX 3080 SG | |
| KFA2 GeForce RTX 3070 Ti SG (Idle: 88.9 W) | |
| KFA2 GeForce RTX 4080 SG (Idle: 86.4 W) | |
| KFA2 GeForce RTX 4070 Ti EX Gamer | |
| Sapphire Pulse Radeon RX 6750 XT | |
| NVIDIA GeForce RTX 3060 Ti Founders Edition (Idle: 111.39 W) | |
| XFX Speedster QICK 308 Radeon RX 7600 Black Edition | |
| Sapphire Nitro+ Radeon RX 6650 XT | |
| KFA2 GeForce RTX 4070 EX Gamer | |
| KFA2 GeForce RTX 4060 Ti EX | |
| KFA2 GeForce RTX 4060 1-Click-OC 2X | |
| Power Consumption / Witcher 3 ultra Efficiency (external Monitor) | |
| Palit GeForce RTX 4090 GameRock OC | |
| KFA2 GeForce RTX 4080 SG | |
| AMD Radeon RX 7900 XT | |
| AMD Radeon RX 7900 XTX | |
| KFA2 GeForce RTX 4070 Ti EX Gamer | |
| KFA2 GeForce RTX 4070 EX Gamer | |
| KFA2 GeForce RTX 4060 Ti EX | |
| KFA2 GeForce RTX 4060 1-Click-OC 2X | |
| Sapphire Pulse Radeon RX 6750 XT | |
| NVIDIA GeForce RTX 3090 Founders Edition | |
| XFX Speedster QICK 308 Radeon RX 7600 Black Edition | |
| KFA2 GeForce RTX 3070 Ti SG | |
| KFA2 GeForce RTX 3080 SG | |
| Sapphire Nitro+ Radeon RX 6650 XT | |
| NVIDIA GeForce RTX 3060 Ti Founders Edition | |
* ... kleinere Werte sind besser
Energieaufnahme mit externem Monitor
Pro
Contra
Fazit - Solide 1.080p-Gaming-Grafikkarte
Mit der XFX Speedster QICK 308 Radeon RX 7600 Black Edition haben wir uns AMDs aktuelles Einsteigermodell der Radeon RX-7000-Grafikkarten angeschaut. Mit etwas höheren Taktraten hebt sich das Modell aus dem Hause XFX etwas von dem Referenzmodell ab. Auch bei der Optik und der verbauten Kühlung setzt XFX auf eine Eigenkreation. Das Konzept geht auf, denn die Grafikkarte arbeitet zu jeder Zeit relativ leise und im 2D-Betrieb sogar völlig lautlos. Der große Kühler hat keine Probleme, die Abwärme zuverlässig abzuleiten und die Grafikkarte auch unter Last zu kühlen.
Die XFX Speedster QICK 308 Radeon RX 7600 Black Edition bietet eine adäquate Leistung zu einem fairen Preis.
Im Test hatte die XFX Speedster QICK 308 Radeon RX 7600 Black Edition keine Probleme mit den getesteten Spielen. Als beworbene 1.080p Grafikkarte hinterlässt das getestete Modell einen soliden Eindruck. Dennoch muss beachtet werden, dass die Grafikkarte bei den aktuellsten Spielen Probleme hat, die 60 FPS bei maximalen Details auf den Bildschirm zu bringen. Eine Verringerung der Detailstufe sorgt hier für Abhilfe, könnte aber in naher Zukunft zunehmend mehr und mehr zum Problem werden. Mit der AMD Radeon RX 7700 XT wird AMD in Kürze aber eine weitere Mittelklasse-Grafikkarte auf den Markt bringen, welche als Kontrahent zur Nvidia GeForce RTX 4060 Ti ins Rennen geht.
Sollte aktuell der Kauf eines neuen Grafikbeschleunigers anstehen, so kann man auch getrost zur 6000er-Serie greifen. Mit der Sapphire Radeon RX 6700 gibt es derzeit ein etwas schnelleres Modell mit 10-GB-VRAM. Allerdings kostet die Grafikkarte auch 30 Euro mehr als eine XFX Speedster QICK 308 Radeon RX 7600 Black Edition, welche aktuell bereits ab 279 Euro zu haben ist.
Preie und Verfügbarkeit
Aktuell kann man die XFX Speedster QICK 308 Radeon RX 7600 Black Edition bei Notebooksbilliger.de (293 Euro) bekommen. Ein ähnliches Modell aus dem Hause Sapphire gibt es bei Notebooksbillliger.de sogar schon ab 249 Euro.
Transparenz
Die Auswahl der zu testenden Geräte erfolgt innerhalb der Redaktion. Das vorliegende Testmuster wurde vom Autor auf eigene Kosten im freien Handel erworben. Der Hersteller erhielt keine Version des Reviews vor der Veröffentlichung, es bestand keine Verpflichtung zur Publikation. Als eigenständiges, unabhängiges Unternehmen unterliegt Notebookcheck keiner Diktion von Herstellern, Shops und Verlagen.
So testet Notebookcheck
Pro Jahr werden von Notebookcheck hunderte Laptops und Smartphones unabhängig in von uns standardisierten technischen Verfahren getestet, um eine Vergleichbarkeit aller Testergebnisse zu gewährleisten. Seit rund 20 Jahren entwickeln wir diese Testmethoden kontinuierlich weiter und setzen damit Branchenstandards. In unseren Testlaboren kommt ausschließlich hochwertiges Messequipment in die Hände erfahrener Techniker und Redakteure. Die Tests unterliegen einer mehrstufigen Kontrolle. Unsere komplexe Gesamtbewertung basiert auf hunderten fundierten Messergebnissen und Benchmarks, womit Ihnen Objektivität garantiert ist. Weitere Informationen zu unseren Testmethoden gibt es hier.
