Notebookcheck Logo

NVIDIA GeForce RTX 3060 Ti Founders Edition im Test: 1440p-Ultra und 4K-Gaming für 400 US-Dollar

Für den Rest von uns. Die NVIDIA RTX 3060 Ti setzt die Tradition fort, High-End-Leistung der vorherigen Generation zu niedrigeren Preisen zu garantieren. Die RTX 3060 Ti ist eigentlich der Nachfolger der RTX 2060 Super, zielt aber darauf ab, DIE Karte für 1440p-Ultra-Gaming zu werden, indem sie die Leistung einer eine RTX-2080-Super für nur 400 US-Dollar bietet. Wir testen die NVIDIA RTX 3060 Ti Founders Edition, um zu sehen, ob sie das auch schafft.

Bereits im Dezember 2020 kündigte NVIDIA offiziell die GeForce RTX 3060 Ti an, die sich an die große Mehrheit der 1080p- und 1440p-Gamer richtet. Die RTX 3060 Ti basiert auf der gleichen 8-nm-GA104-GPU wie die RTX 3070, ermöglicht aber nur 4.864 CUDA-Kerne.

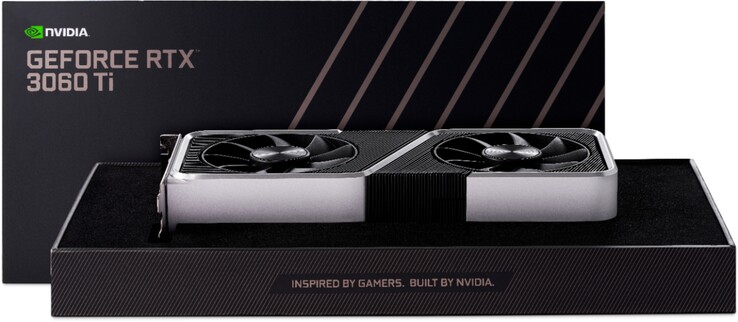
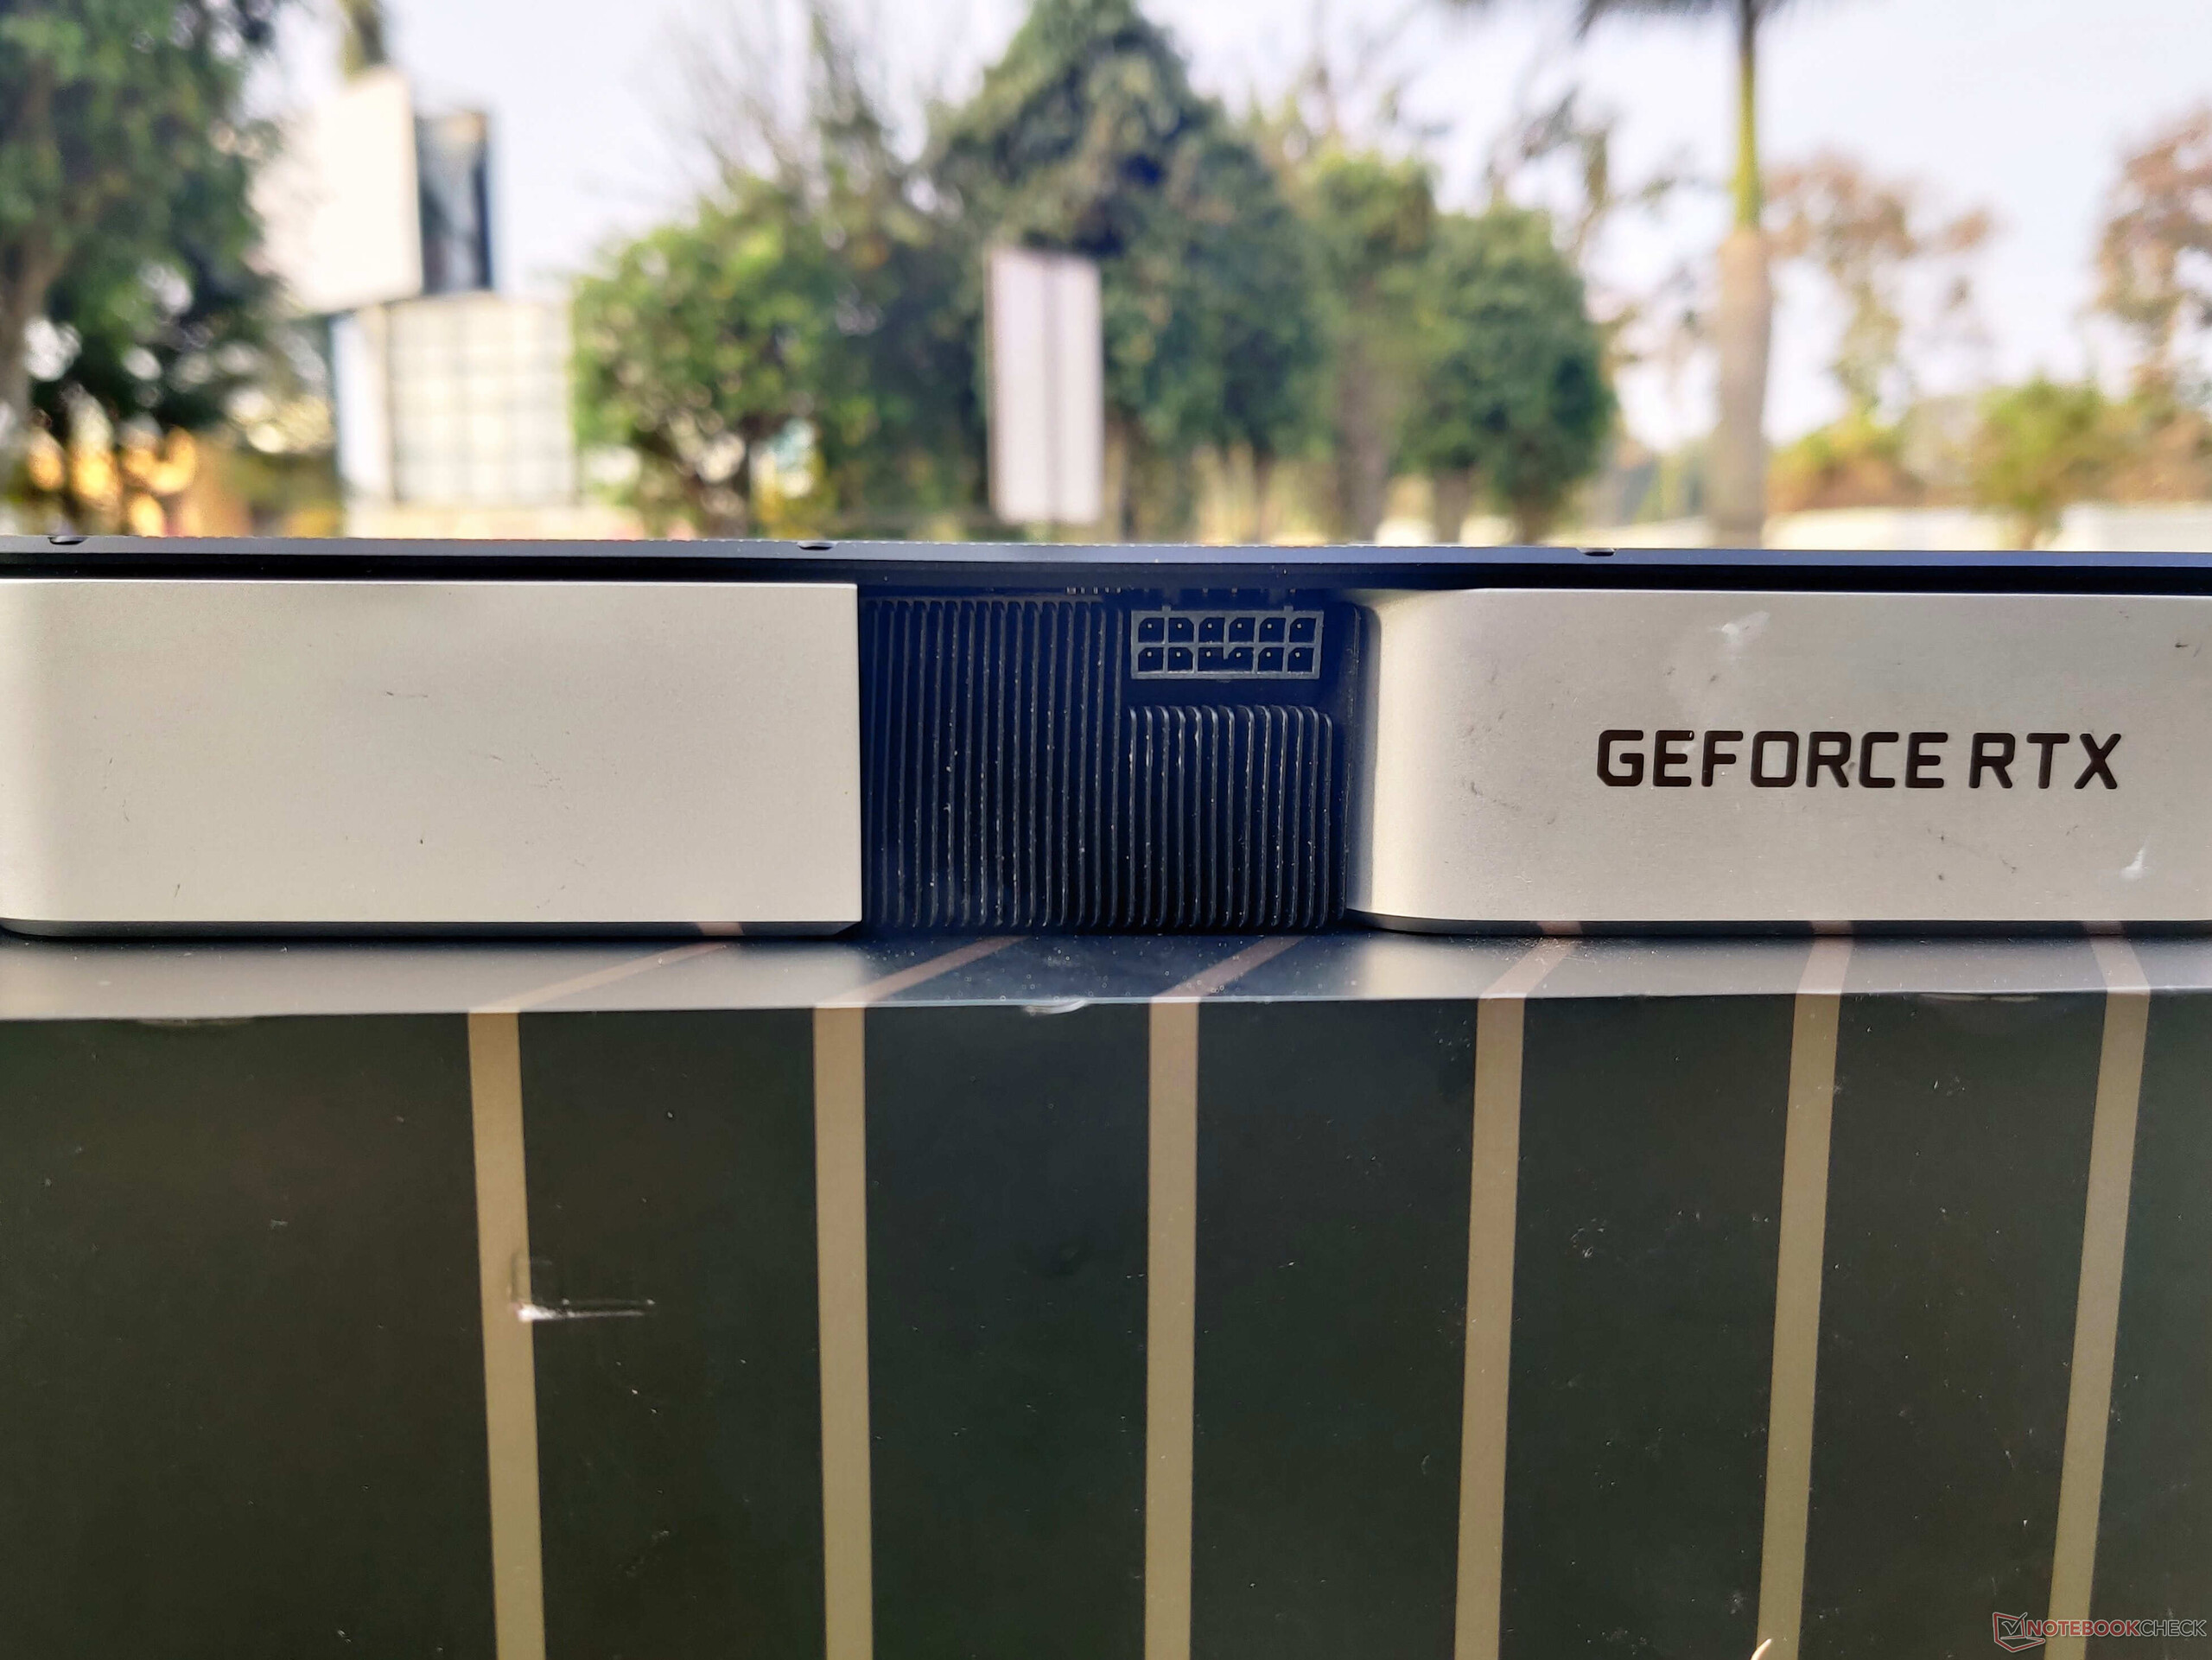
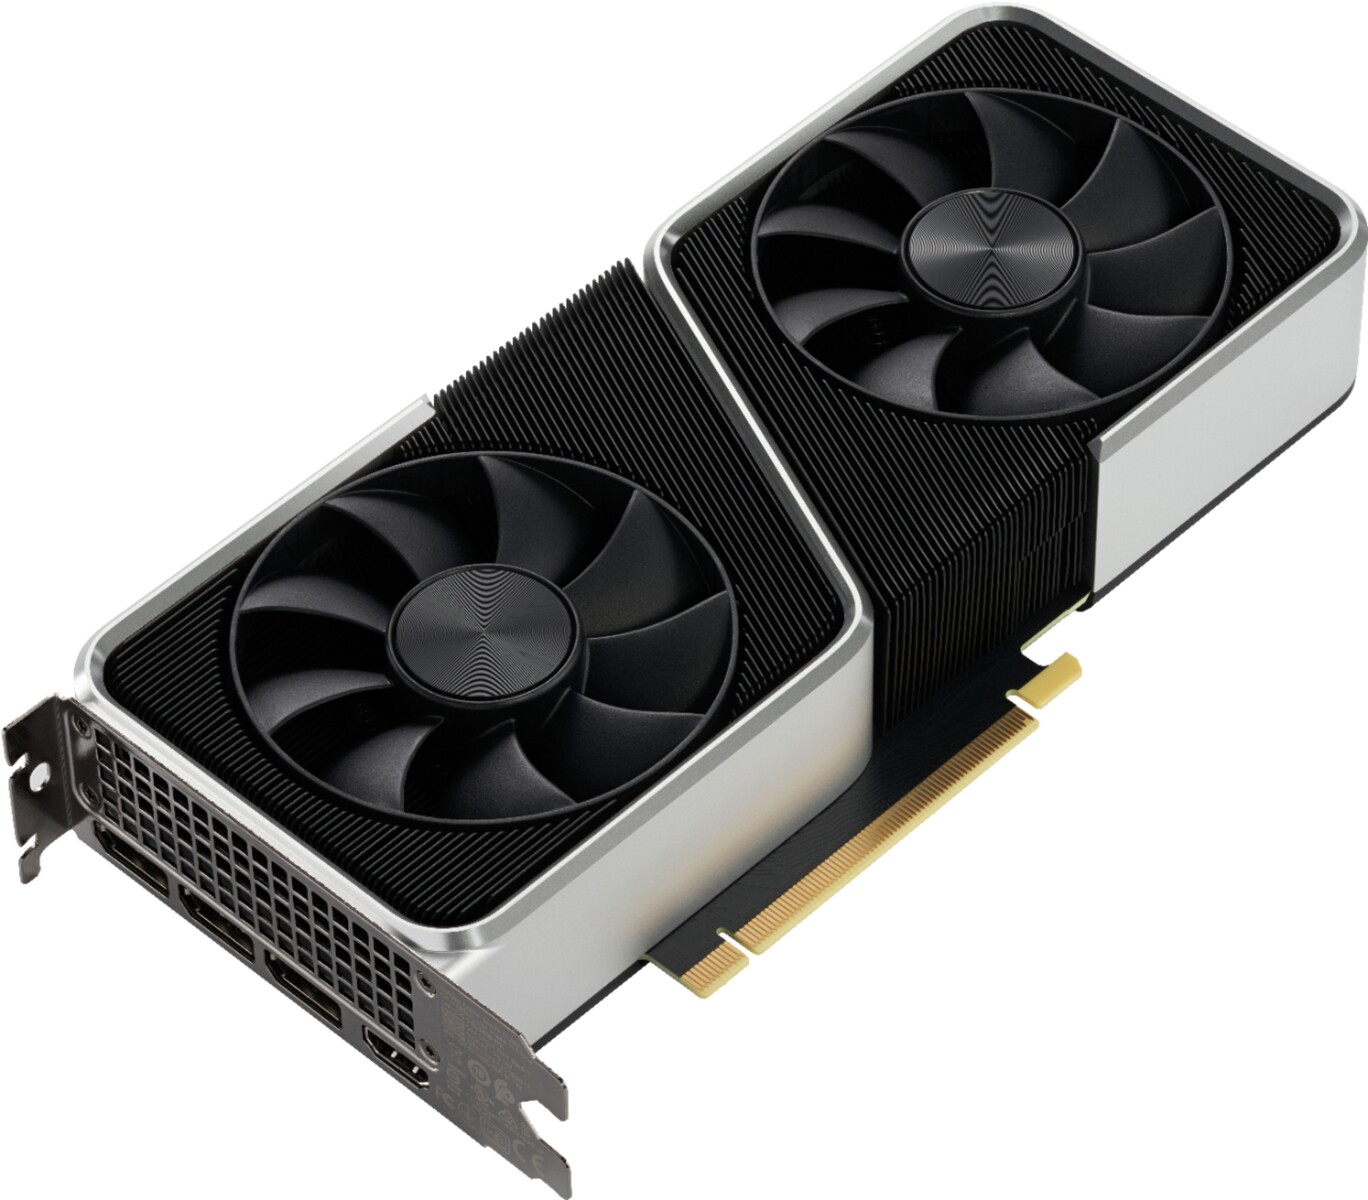
Uns liegt die RTX 3060 Ti Founders Edition (FE) von NVIDIA zum Test vor. Die RTX 3060 Ti FE verfügt über ein ähnliches Design wie die anderen Ampere-FE-Karten, einschließlich der Verwendung eines 12-poligen Molex-MicroFit-3.0-Stromanschlusses. Im Gegensatz zu den anderen bisherigen Ampere-FE-Karten hat es jedoch ein helles, silbriges Metallic-Finish, das für einen hochwertigen Look sorgt.

Mit einer UVP von 400 US-Dollar kann die RTX 3060 Ti als geistiger Nachfolger der RTX 2060 Super angesehen werden. Allerdings soll die Karte mehr Leistung als die RTX 2080 Super für 300 US-Dollar weniger bieten, was sie in mehr als einer Hinsicht zu einem potenziellen Schnäppchen für 1440p-Ultra- und 1080p-High-Refresh-Rate-Gamer macht.

In diesem Test prüfen wir die RTX 3060 Ti FE auf Herz und Nieren und bewerten, ob sie wirklich die von NVIDIA versprochene Leistung für das Geld bietet.

Vergleich der RTX 3060 Ti mit anderen NVIDIA-GPUs

Spezifikation RTX3090 RTX3080 FE RTX3070 FE RTX3060 Ti FE TitanRTX RTX2080 Ti RTX2080 Super RTX2070 Super TITANX Pascal
Chip GA102 GA102 GA104 GA104 TU102 TU102 TU104 TU104 GP102
FinFET-Prozess 8 nm 8 nm 8 nm 8nm 12 nm 12 nm 12 nm 12 nm 16 nm
CUDA cores 10,496 8,704 5,888 4,864 4,608 4,352 3,072 2,560 3,584
Textureunits 328 272 184 152 288 272 192 160 224
Tensor-Kerne 328 3. Gen. 272 3. Gen. 184 3. Gen. 1523. Gen. 576 2. Gen. 544 2. Gen. 384 2. Gen. 320 2. Gen. -
RTcores 82 68 46 38 72 68 48 40 -
GPU Basistakt 1.395 MHz 1.440 MHz 1.500 MHz 1.410 MHz 1.350 MHz 1.350 MHz 1.650 MHz 1.605 MHz 1.417 MHz
GPU Boost-Takt 1.695 MHz 1.710 MHz 1.750 MHz 1.665 MHz 1.770 MHz 1.545 MHz 1.815 MHz 1.770 MHz 1.531 MHz
Memorybus 384-bit 320-bit 256-bit 256-bit 384-bit 352-bit 256-bit 256-bit 384-bit
Speicherbandbreite 936 GB/s 760 GB/s 448 GB/s 448GB/s 672 GB/s 616 GB/s 495,9 GB/s 448 GB/s 480,4 GB/s
Videospeicher 24 GB GDDR6X 10 GB GDDR6X 8 GB GDDR6 8 GBGDDR6 24 GB GDDR6 11 GB GDDR6 8 GB GDDR6 8 GB GDDR6 12 GB GDDR5X
Leistungsaufnahme 350 W 320 W 220 W 200W 280 W 250 W 250 W 215 W 250 W

NVIDIA GeForce RTX 3060 Ti Founders Edition Basics

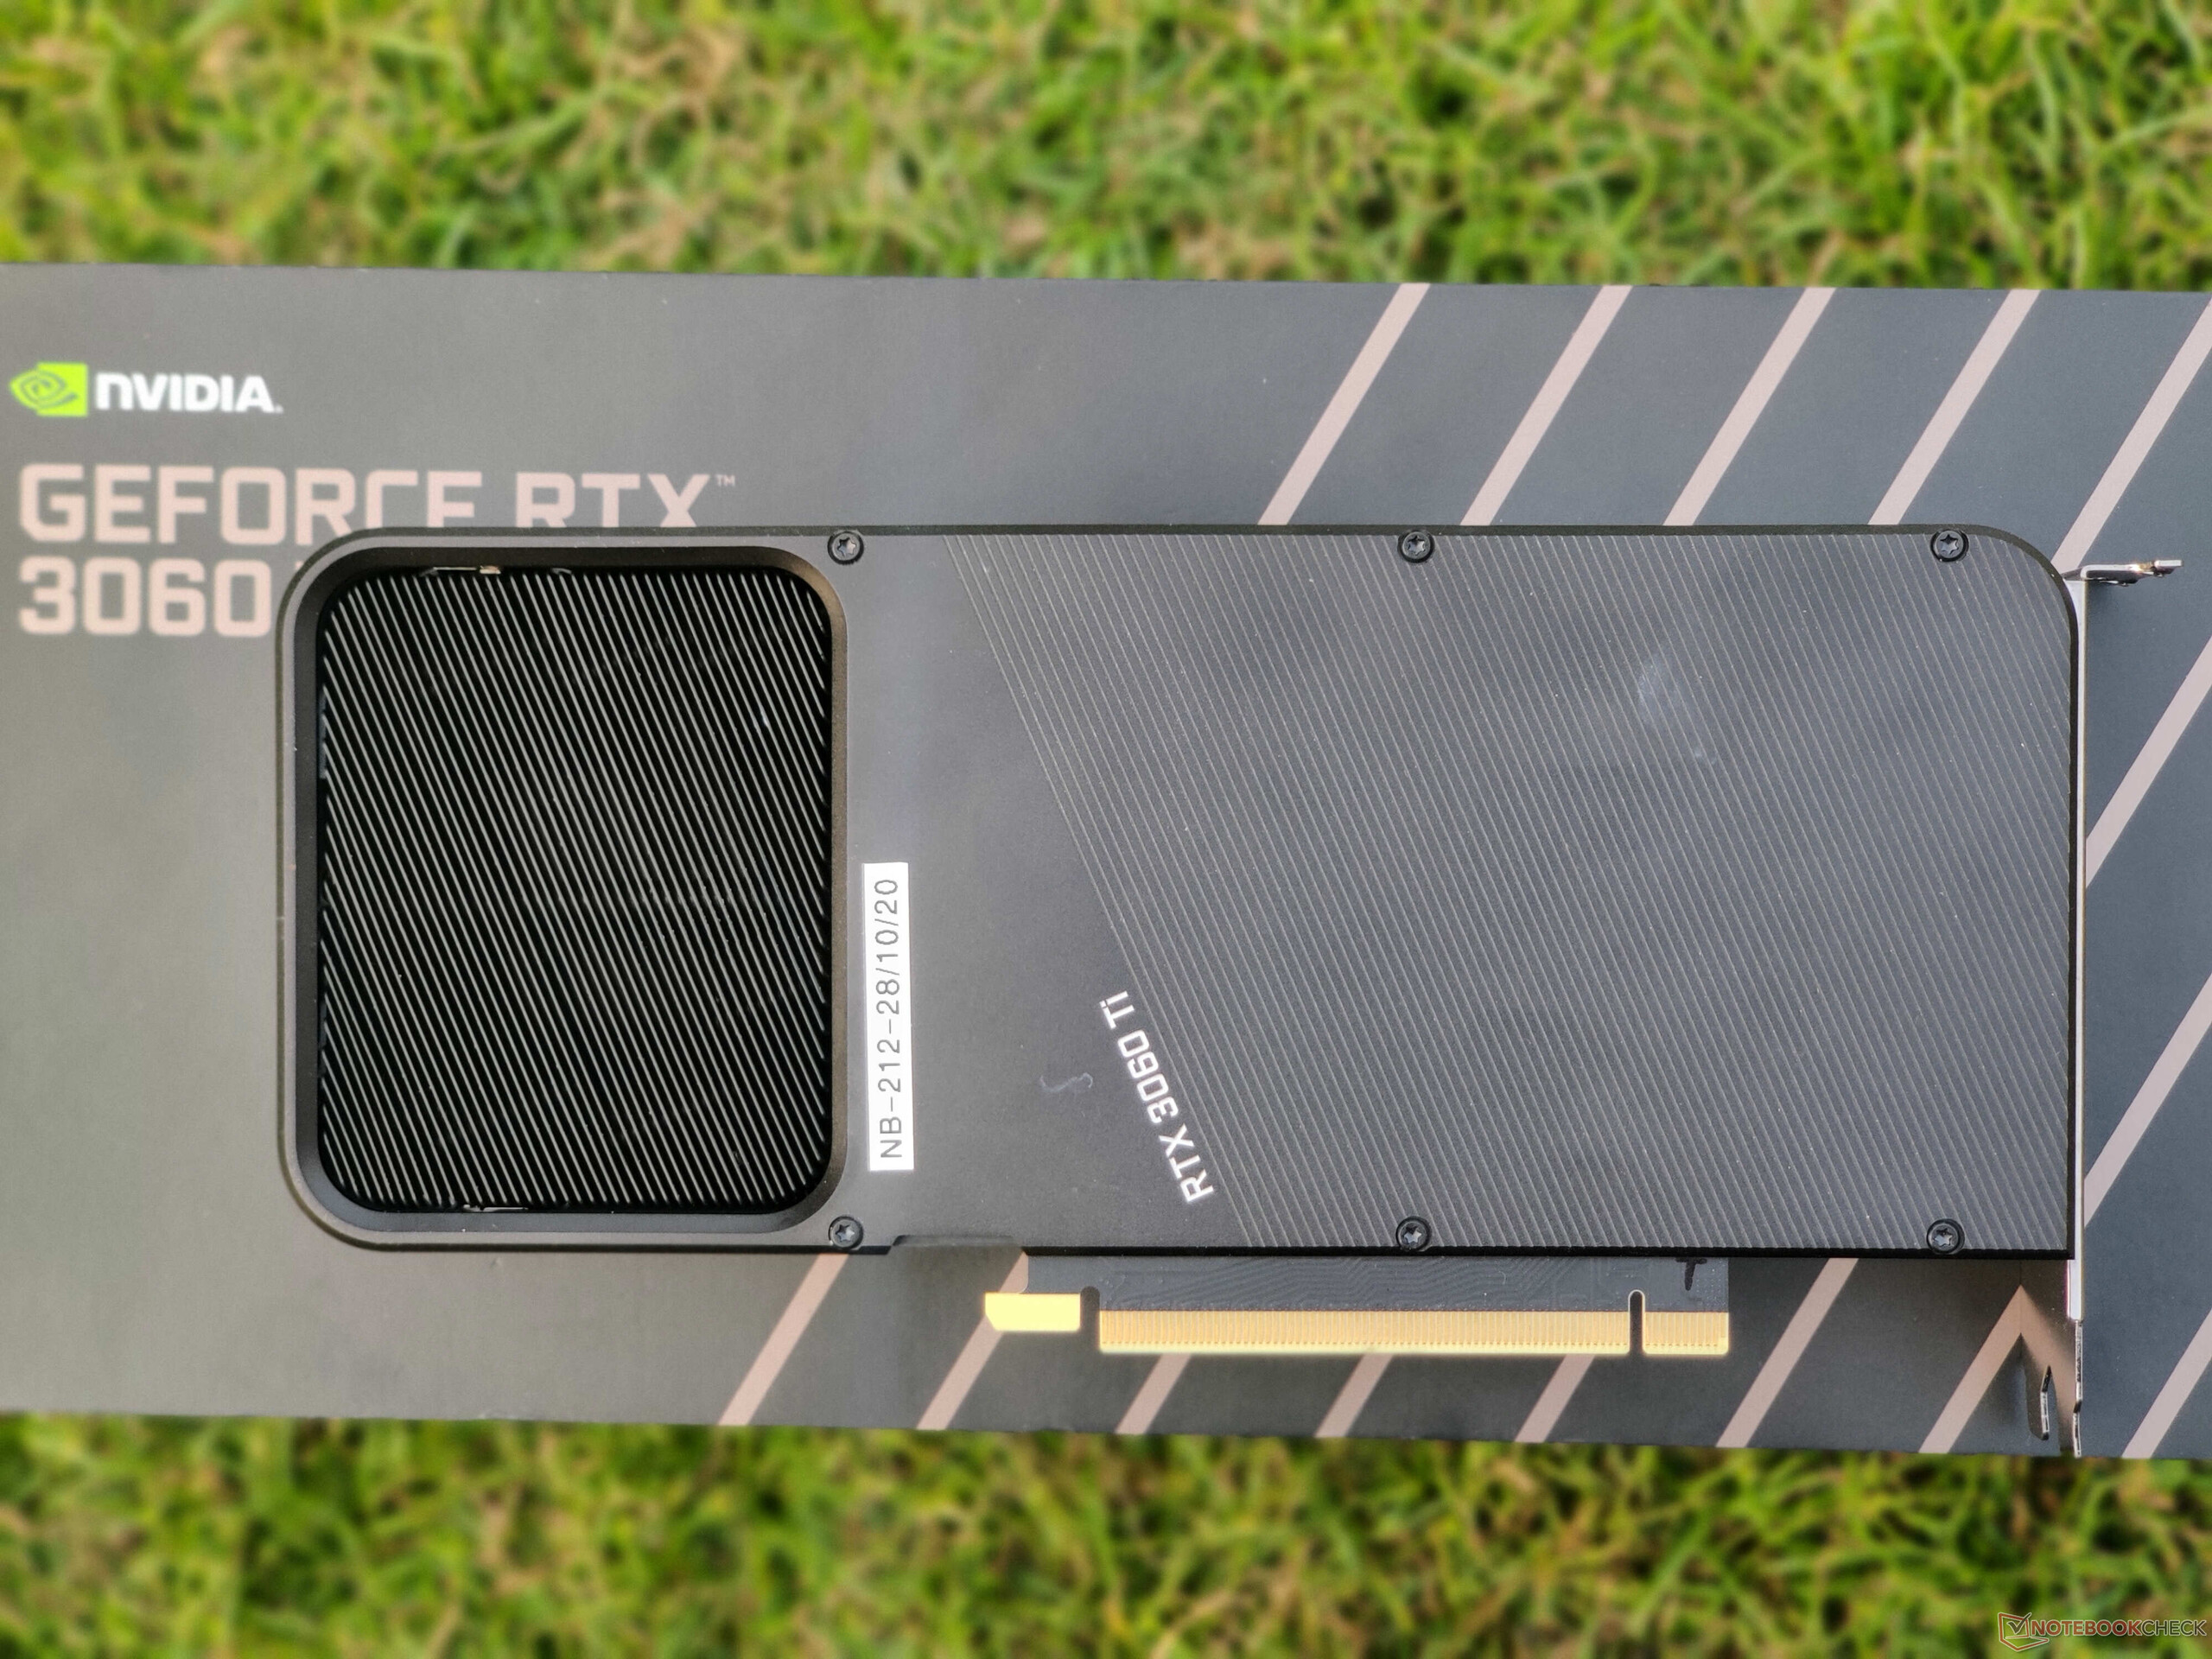
Die RTX 3060 Ti Founders Edition verkörpert NVIDIAs neue Designsprache, die zu einer besseren Wärmeableitung und einem niedrigeren Geräuschpegel beiträgt, zumindest im Vergleich zu FE-Karten der vorherigen Generation. Die Karte sieht unspektakulär aus, der helle silberne Metallrahmen verleiht ihr einen wertigen Look. Weiters ist sie gut verarbeitet, ohne mögliche Verwindungen, Knarren oder fadenscheinige Plastikabdeckungen.

Ähnlich wie der Rest der NVIDIA Ampere Founders Edition Karten kommt auch die RTX 3060 Ti FE mit einem 12-poligen Molex MicroFit 3.0 Stromanschluss, der sich zur Mitte hin befindet. NVIDIA legt einen 8-Pin auf 12-Pin Adapter mit in die Schachtel.
Der 12-Pin-Anschluss scheint hier etwas überflüssig und ist ein definitiver Minuspunkt für die Ästhetik (ganz zu schweigen von den Problemen beim Kabelmanagement), da die RTX 3060 Ti weniger als 300 W verbraucht und problemlos mit dem Standard 8-Pin-Netzteilanschluss auskommen kann.

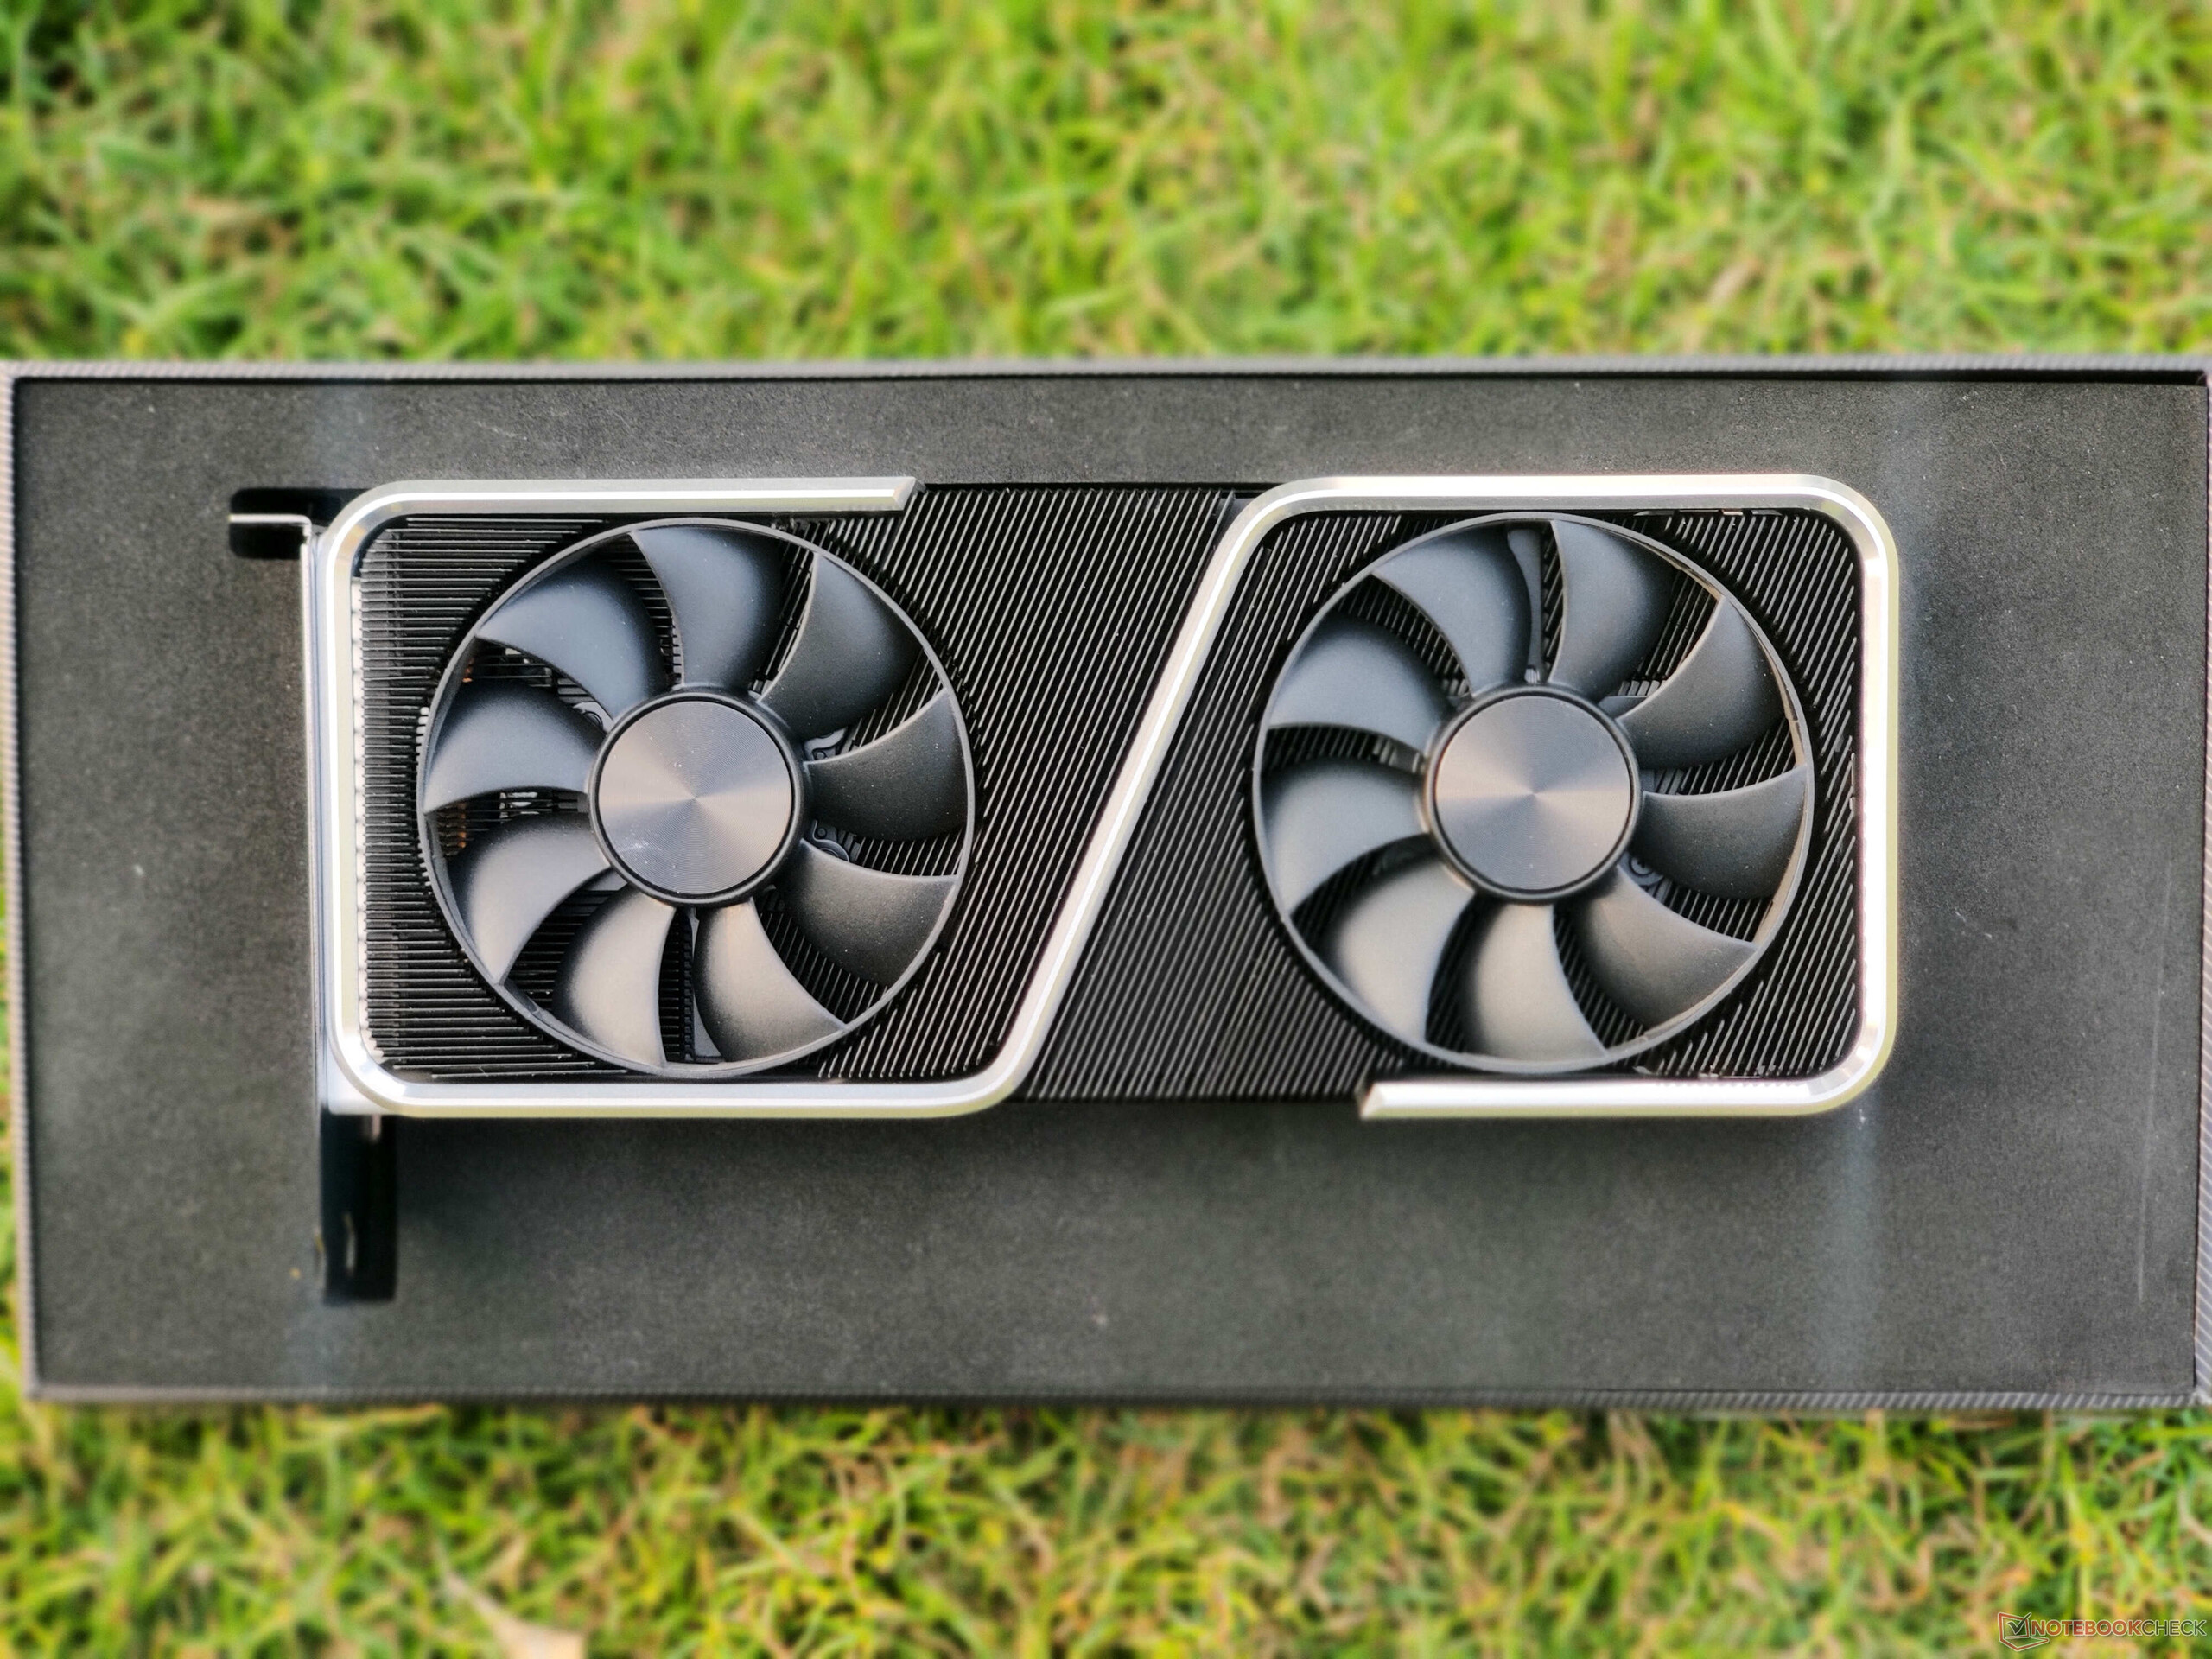
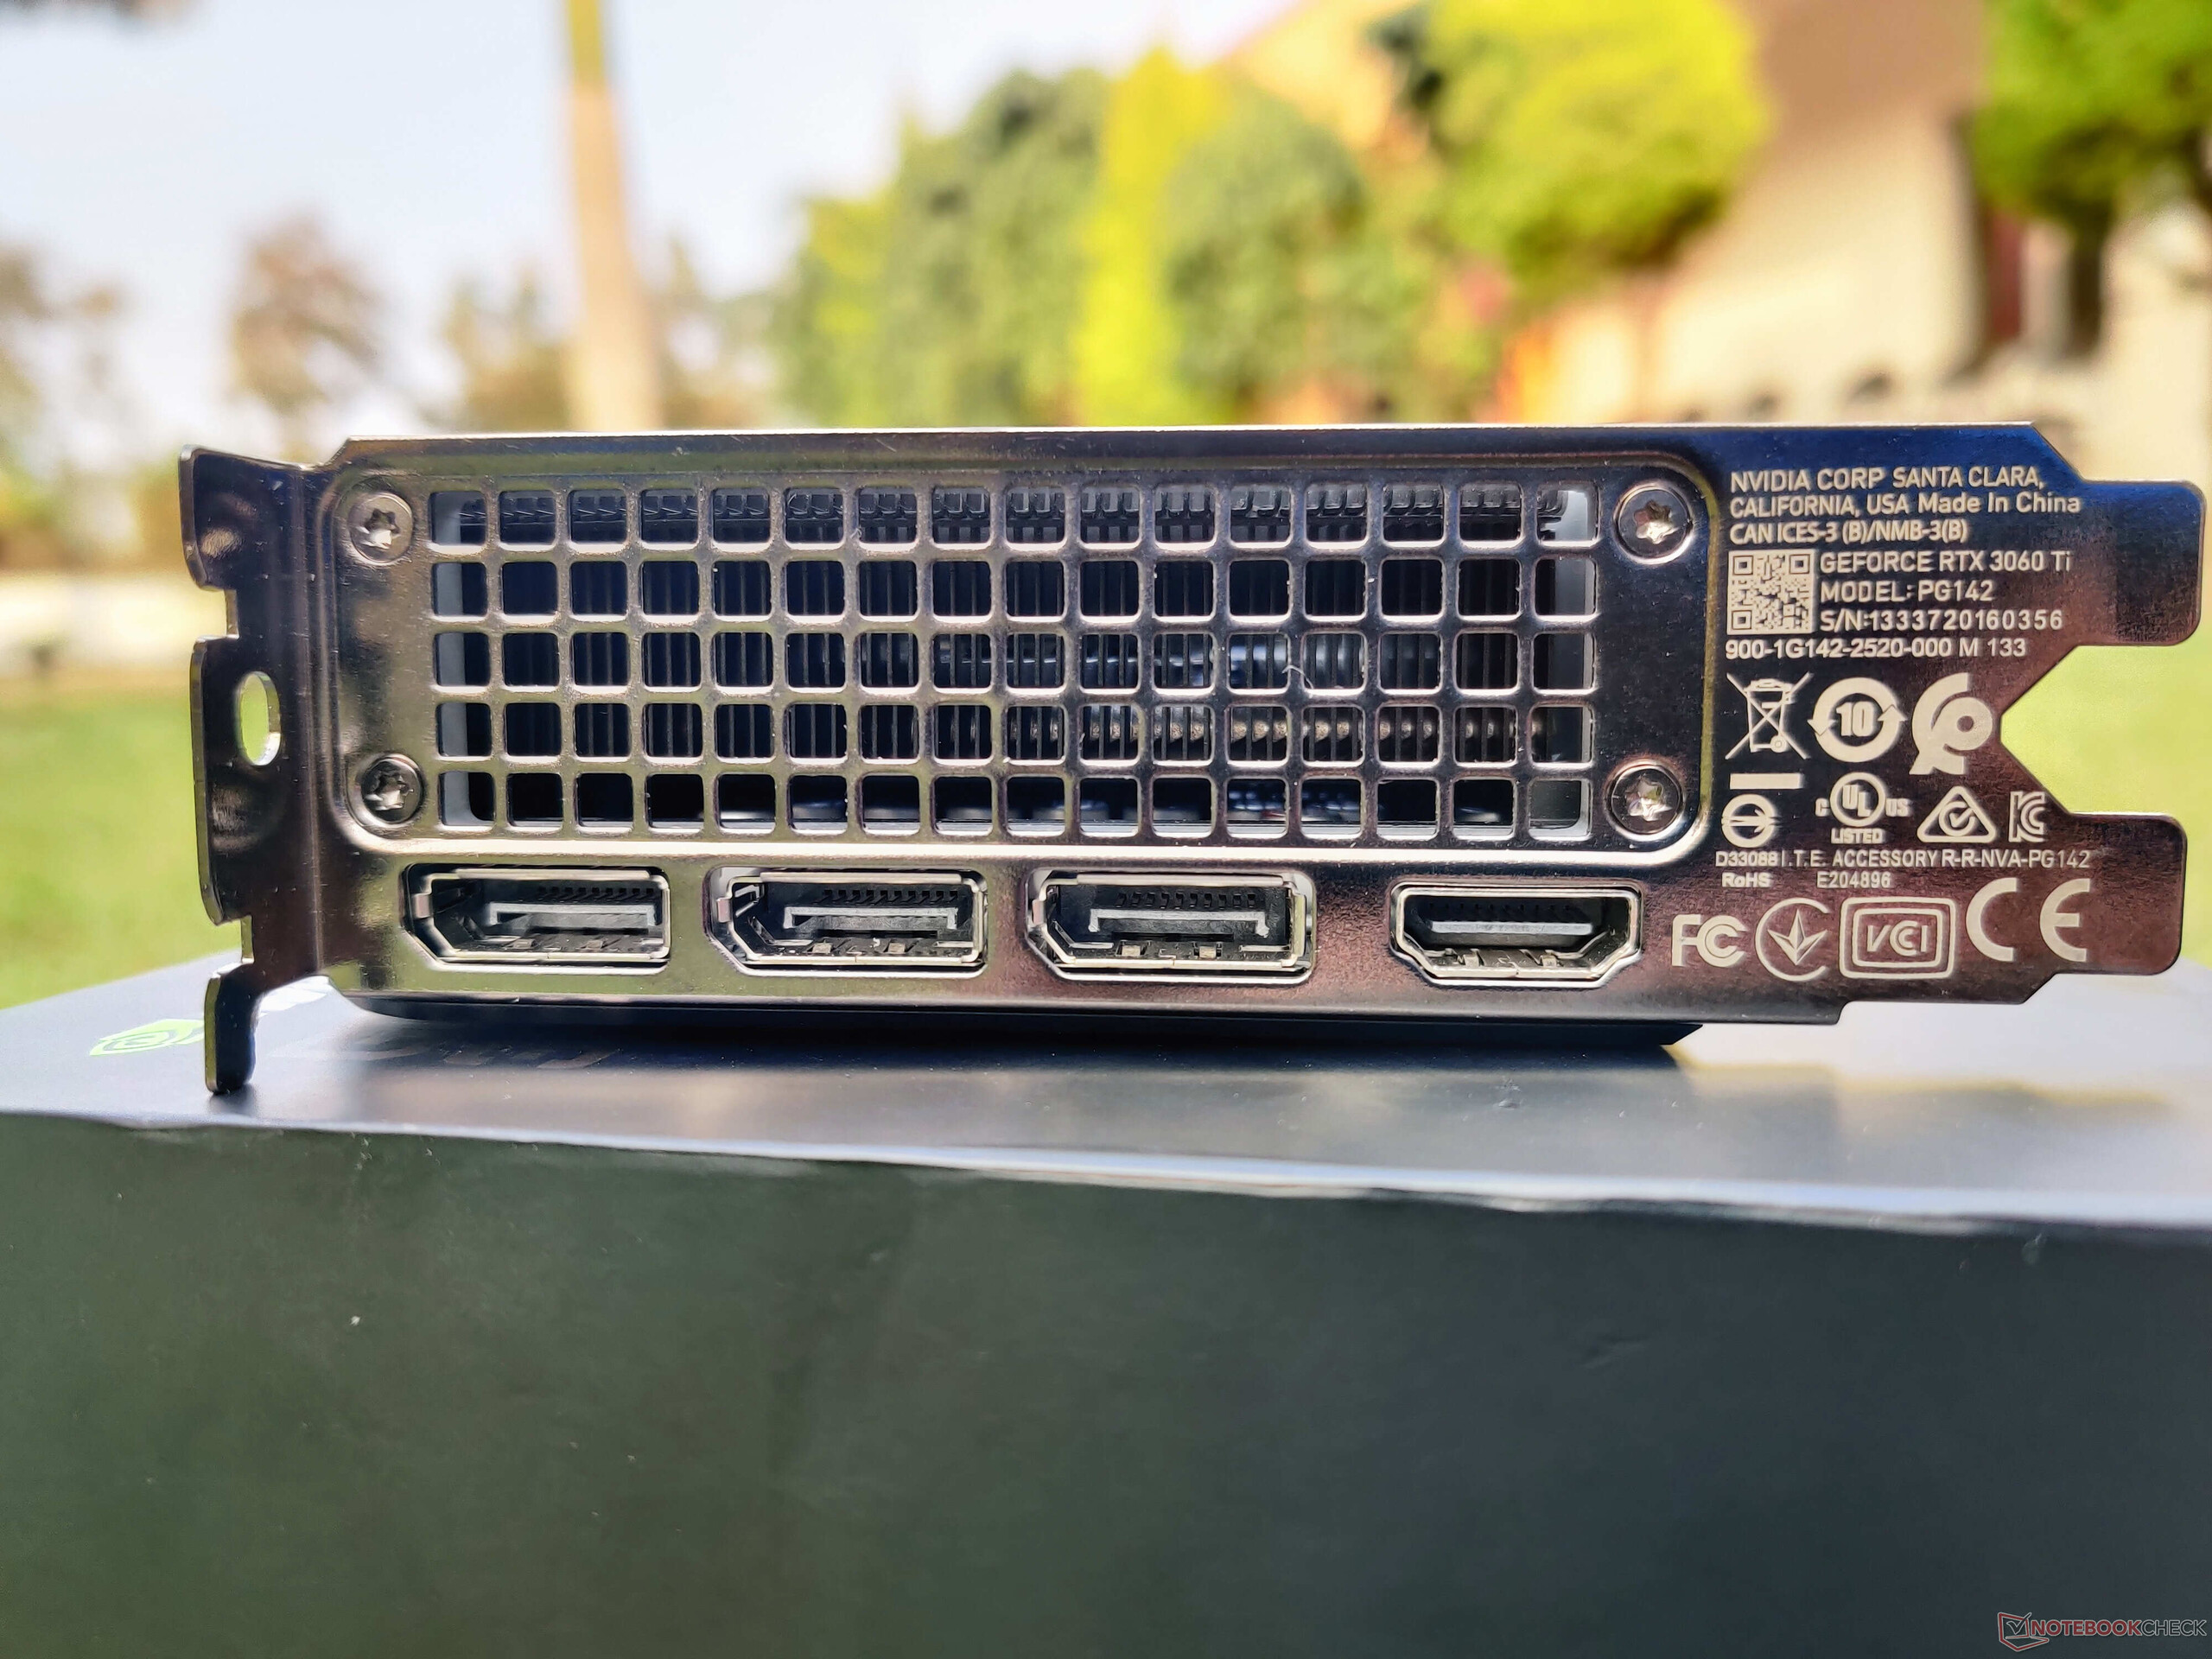
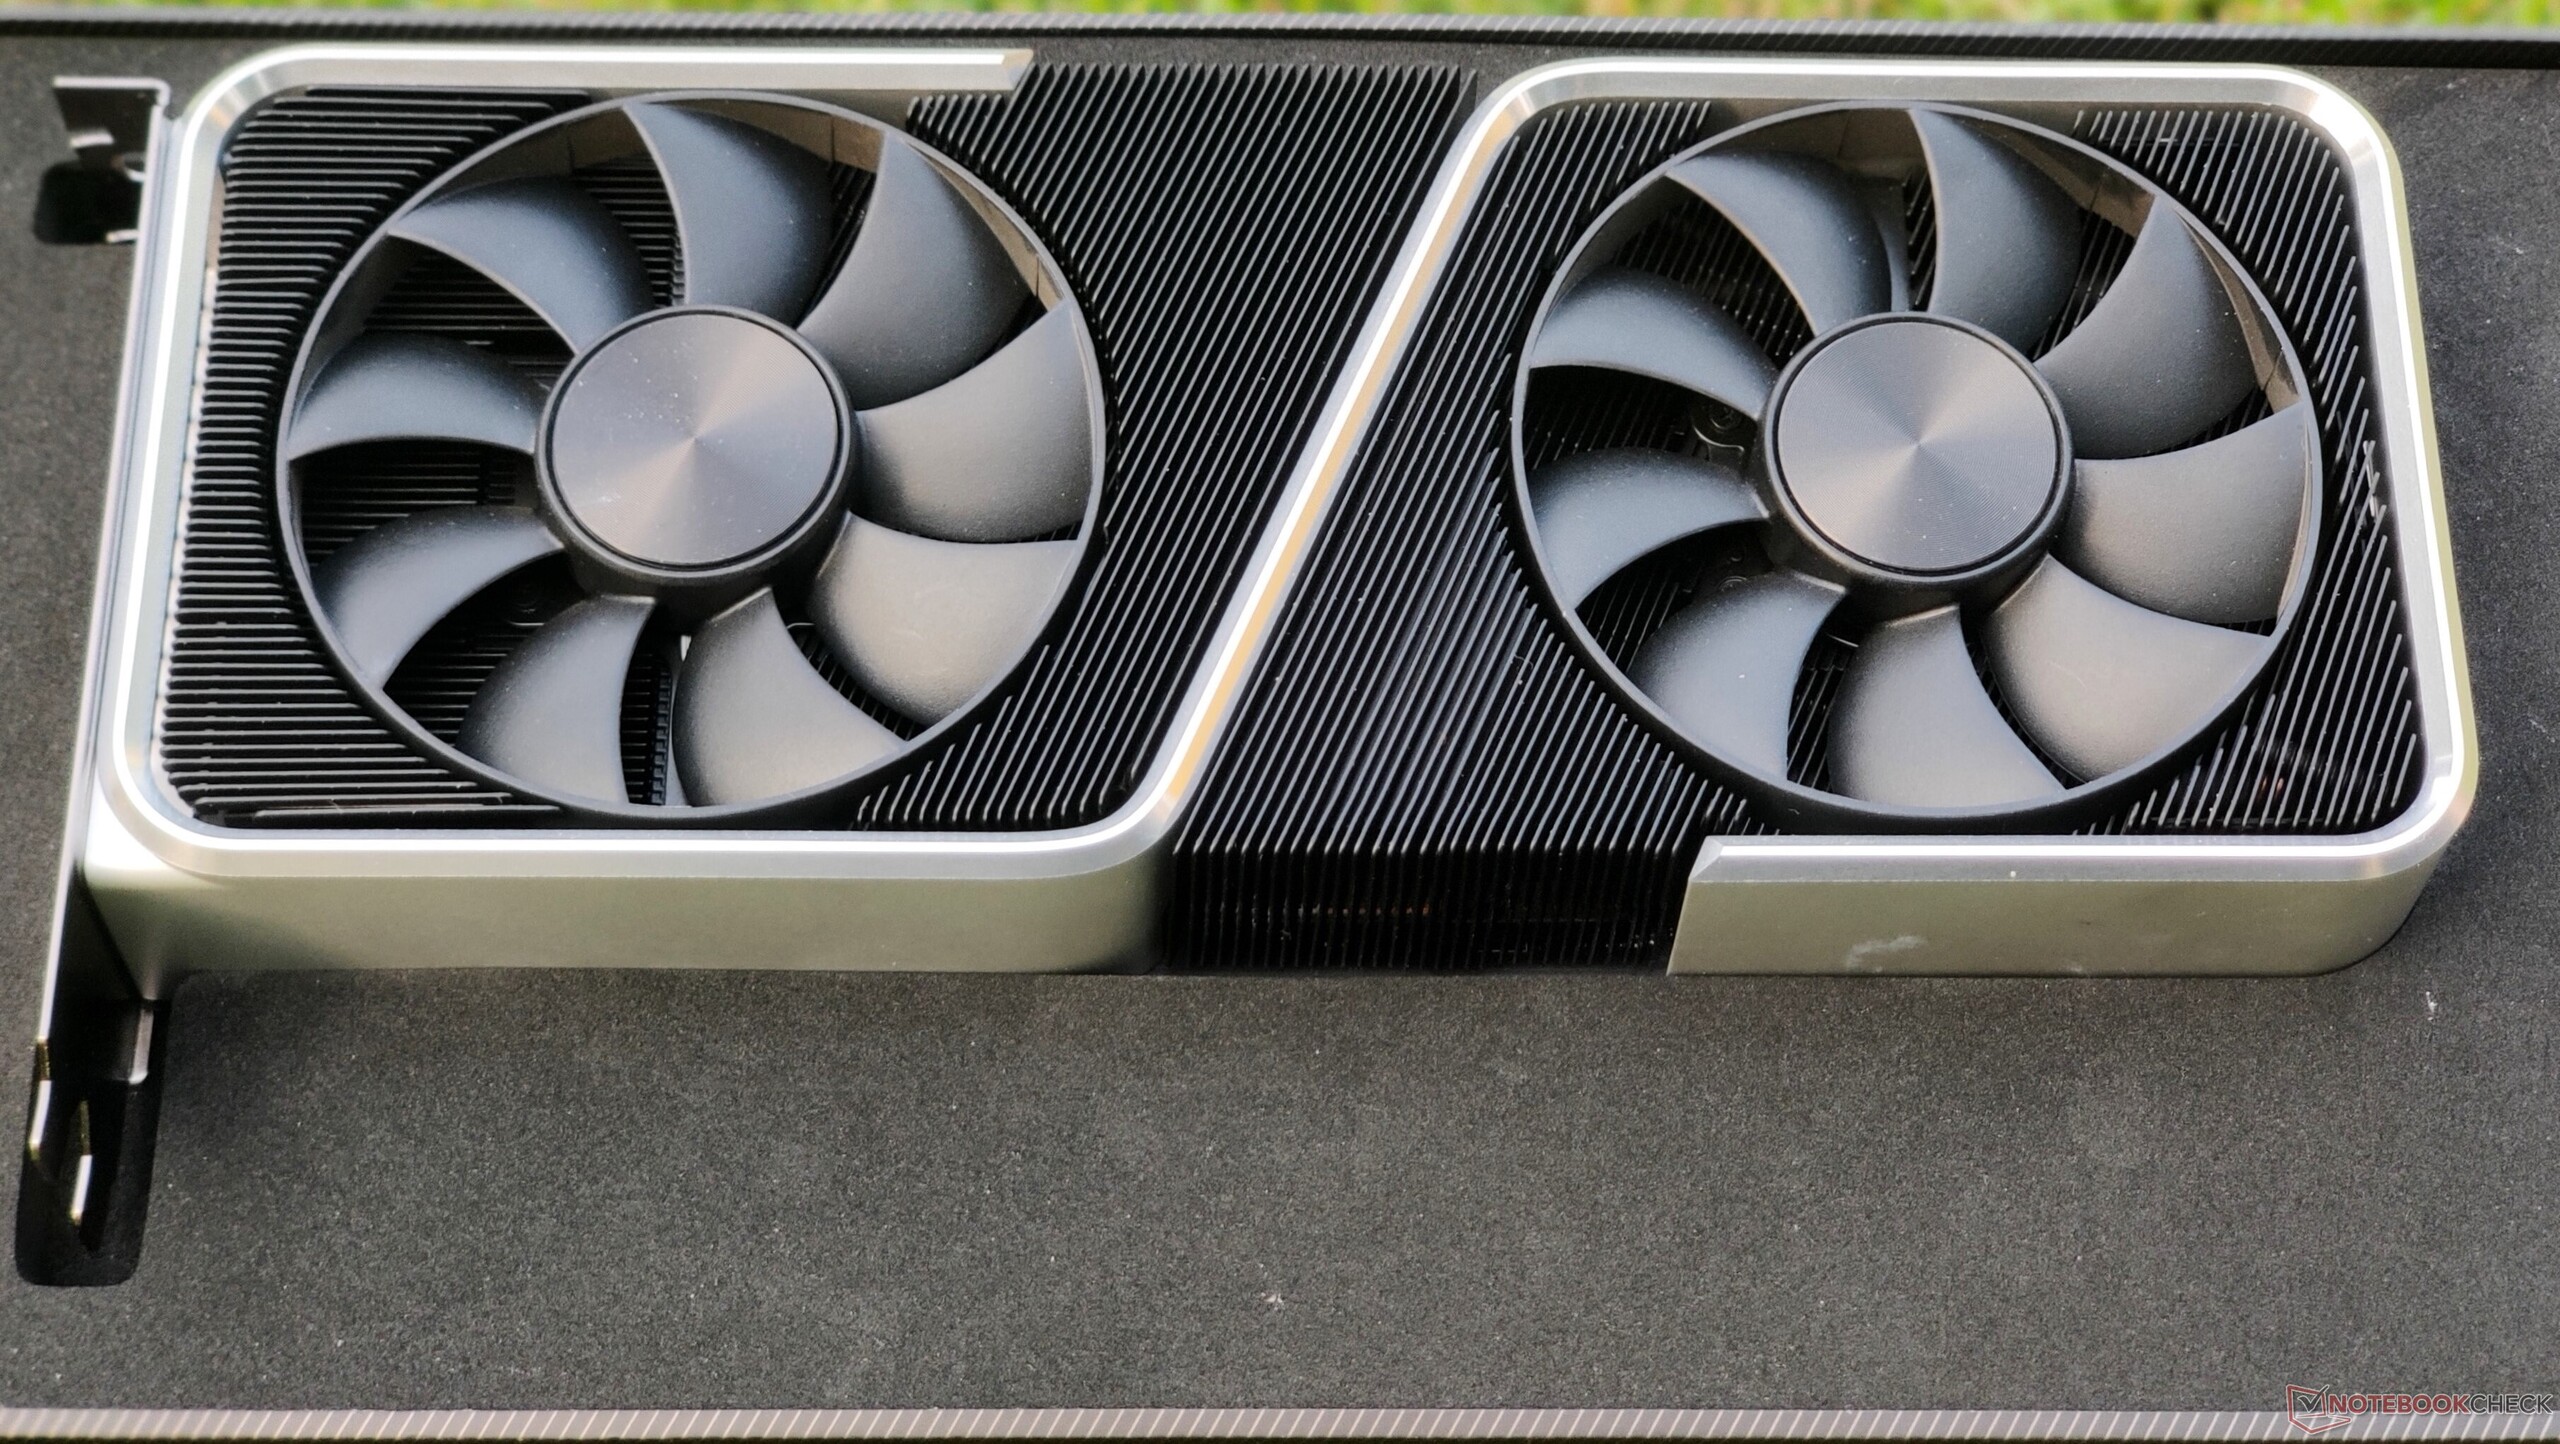
Die Anschlussmöglichkeiten sind Standard und umfassen drei DisplayPort 1.4a-Anschlüsse und einen HDMI 2.1-Anschluss. Die beiden 9-Blatt-Lüfter bieten eine effektive Kühlung und haben ein sehr gutes Geräuschprofil unter Last, wie wir später im Test sehen werden. Eine Metal-Backplate ist vorhanden, die nicht nur zum Schutz beiträgt, sondern auch ein paar Wärmeleitpads zur Ableitung der Wärme von den Speicher-VRMs auf der Rückseite des PCBs enthält.

Die NVIDIA GeForce RTX 3060 Ti Founders Edition ist für 399,99 US-Dollar erhältlich und wird mit einer dreijährigen Garantie geliefert.

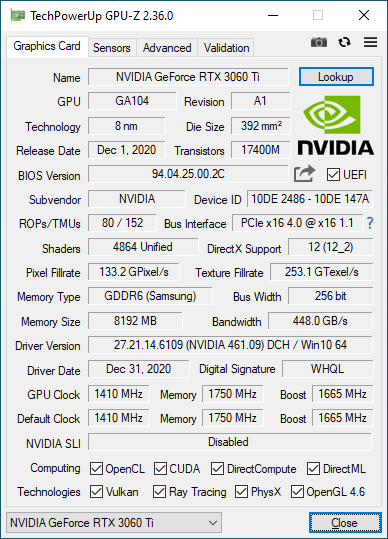
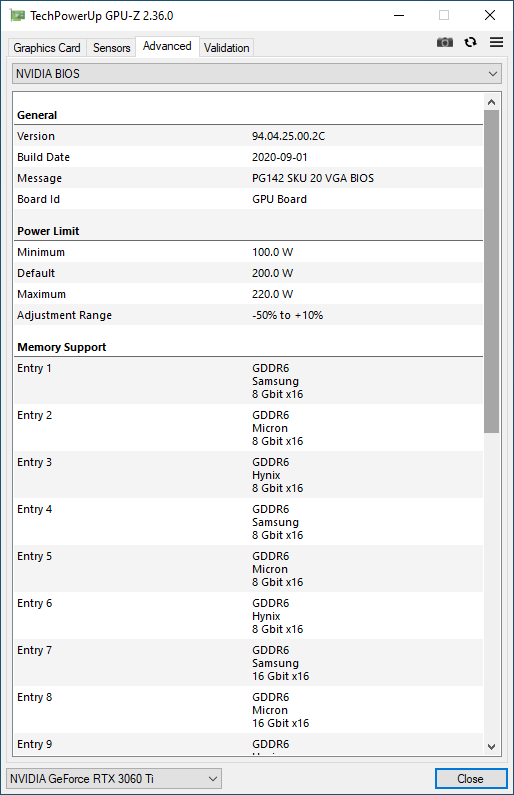
Die RTX 3060 Ti FE bietet einen Basistakt von 1.410 MHz und kann auf bis zu 1.665 MHz boosten. Es ist möglich, die 200-Watt-Zielleistung um weitere 20 Watt zu erhöhen. Da der Karte jegliche Form von RGB-Bling-Bling fehlt, wird die zusätzliche Leistung größtenteils von der GPU selbst genutzt. Abgesehen davon ist der tatsächliche Headroom für die Übertaktung nicht sehr groß.

Die RTX 3060 Ti bietet 8 GB GDDR6 VRAM an einem 256-Bit Speicherbus mit einer maximalen Bandbreite von 448 GB/s. Während dies im Vergleich zu High-End-Angeboten von NVIDIA und allen bisherigen Radeon RX 6000-Karten von AMD niedrig erscheinen mag, sollten die 8 GB VRAM angesichts der Fähigkeiten der RTX 3060 Ti ausreichend sein, es sei denn, Sie beschäftigen sich mit Profi-Apps oder speziellen rechenintensiven Workloads, die möglicherweise einen höheren Video-Arbeitsspeicher benötigen. Während unseres gesamten Tests hatten wir keine Probleme mit der Speicherbegrenzung.

Testsetup

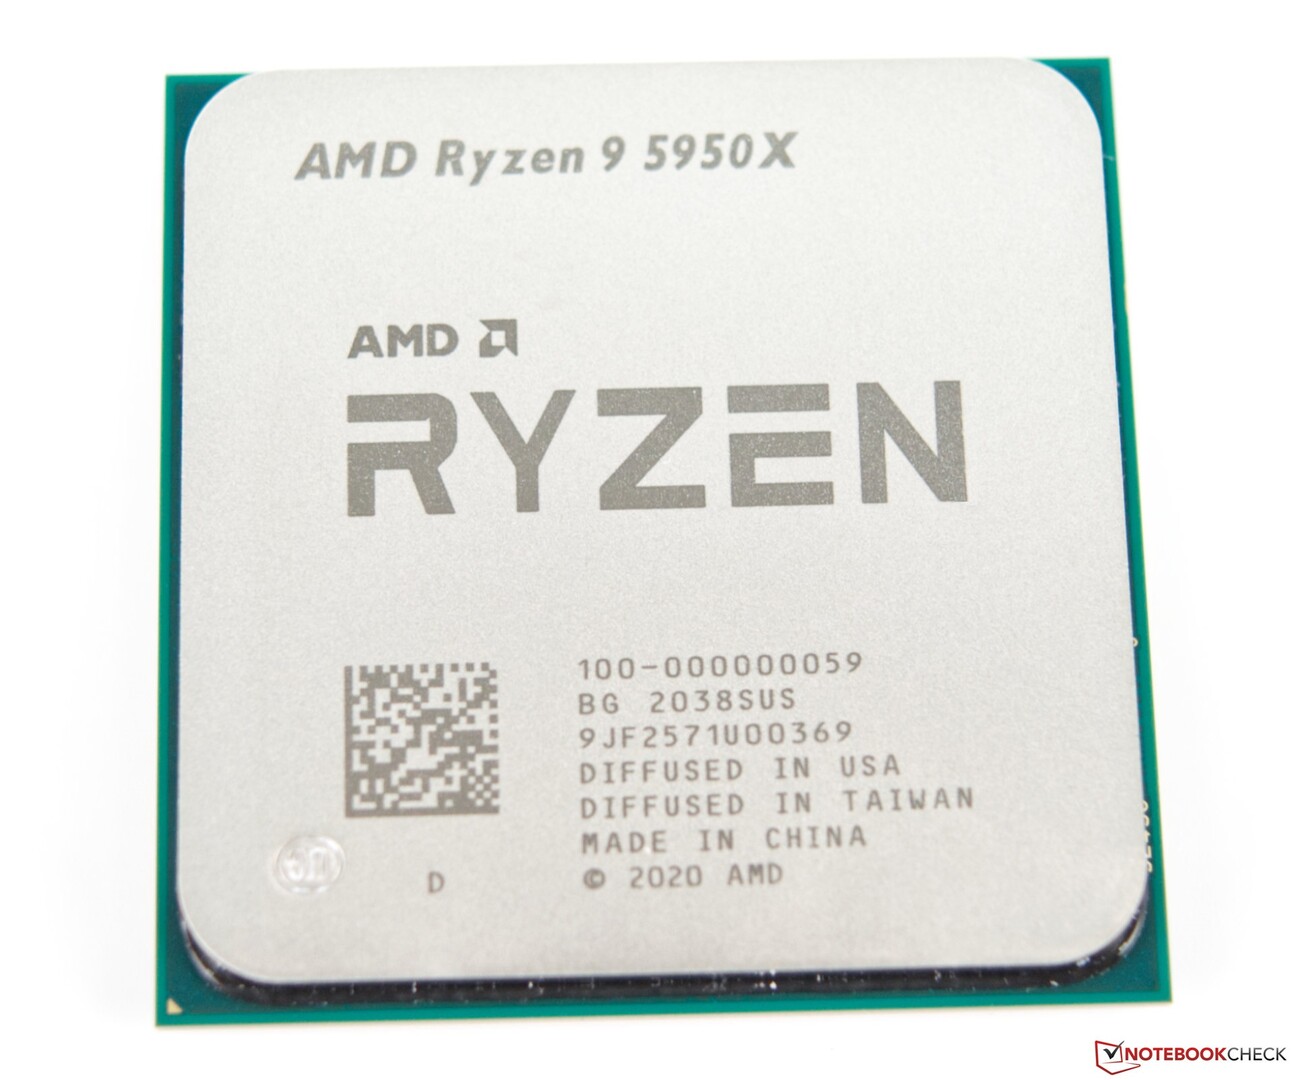
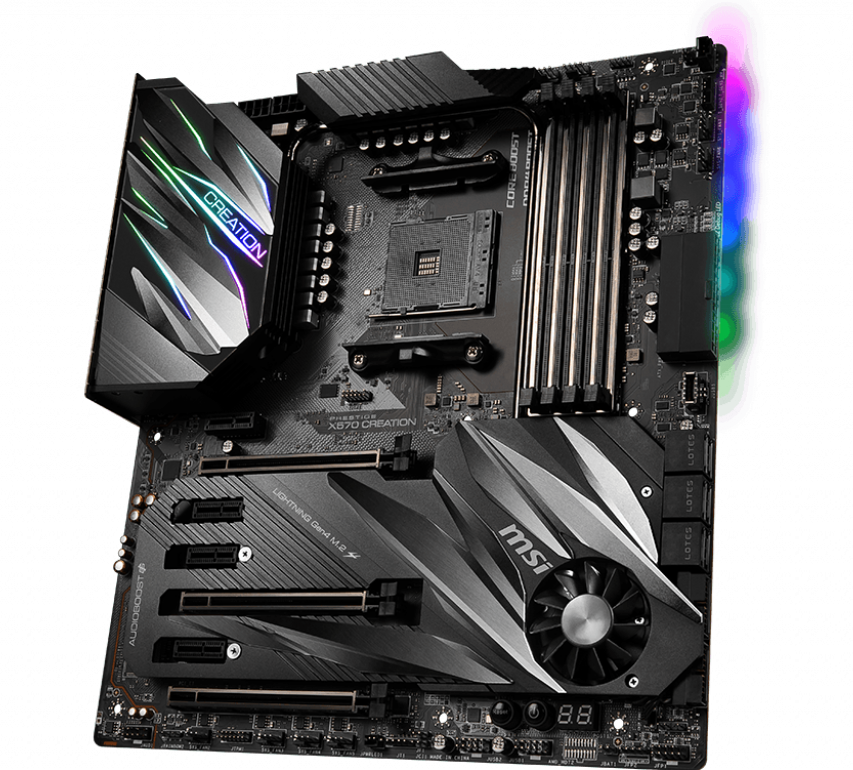
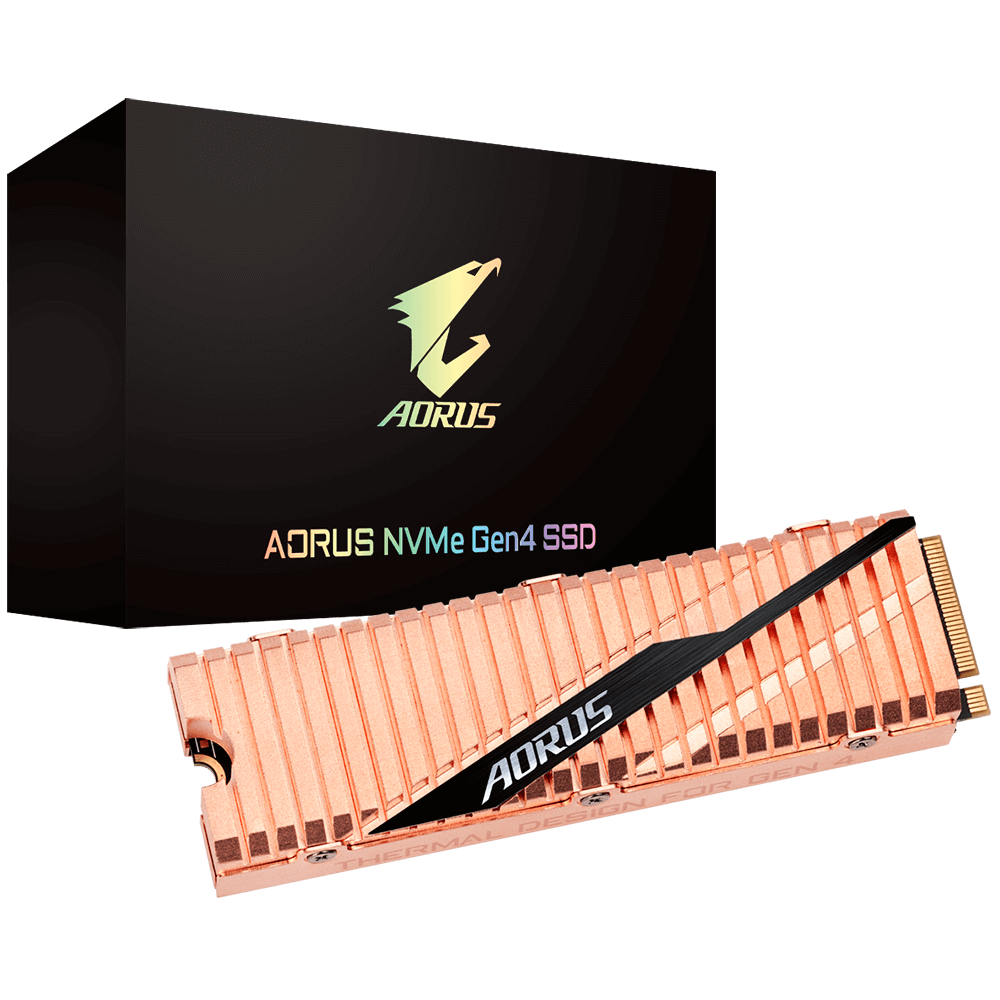
Unser Setup besteht aus einem AMD Ryzen 9 5950X 16-Kern 32-Thread Prozessor, einem MSI Prestige X570 Creation Mainboard, 32 GB (16 GB x2) G.SKILL Trident Z Neo DDR4-3200 RAM (Timings 16-19-19-39) und einer Gigabyte Aorus NVMe Gen4 1 TB SSD.

Windows 10 20H2 mit den neuesten Updates (Build 19041.746) wurde auf der Aorus NVMe Gen4 PCIe SSD installiert, während zwei 1 TB Crucial MX500 SATA SSDs für die Ausführung von Benchmarks und Spielen verwendet wurden.

Ein Corsair iCUE H115i Elite Capellix AIO-Kühler half, den riesigen Ryzen 9 5950X kühl zu halten. Der gesamte Aufbau befand sich in einem Corsair iCUE 4000X RGB-Gehäuse mit einem Thermaltake Toughpower 850W 80 Plus Gold als Netzteil. Wir haben alle Tests mit geschlossenem Gehäuse durchgeführt, um den typischen Einsatz zu repräsentieren.

Die RTX 3060 Ti FE wurde mit einem OnePlus U Series 55U1 Smart TV gepaart, der mit 4K 60 Hz lief. Die Farbausgabe war in der NVIDIA Systemsteuerung auf volles 32-Bit-RGB eingestellt, während die Skalierung des Windows-Desktops auf 100 % gesetzt war.

Wir bedanken uns bei AMD für die Bereitstellung der Ryzen-9-5950X-CPU, bei Corsair für den iCUE Elite Capellix AIO-Kühler und das iCUE 4000X-Gehäuse sowie bei OnePlus für den 4K-Fernseher der U-Serie 55U1.

AMD Ryzen 9 5950X CPU
MSI Prestige X570 Creation Mainboard (Bildquelle: MSI)
Gigabyte Aorus NVMe Gen4 SSD (Bildquelle: Gigabyte)
G.SKILL Trident Z Neo DDR4-3600 RAM (Bildquelle: G.SKILL)

Synthetische Benchmarks

Die Leistung der RTX 3060 Ti liegt im Bereich einer RTX 2080 Super und kann bis zu 32% schneller sein als eine RTX 2060 Super, während sie in den 3DMark-Tests etwa 10% hinter der RTX 3070 liegt.

Ein ähnlicher Trend ist auch bei den Unigine Heaven und Valley Benchmarks zu erkennen. Wir sehen, dass das Leistungsdelta zwischen den Karten in DirectX-Tests höher ist als in OpenGL-Tests. Während die RTX 3060 Ti in Heaven 4.0 DirectX nur etwa 8% schneller ist als die RTX 2080 Super, steigt dieser Unterschied in Valley 1.0 DirectX auf signifikante 27%. Unigine Superposition zeigt, dass die RTX 3060 Ti 12% bis 14% langsamer als die RTX 3070 ist, aber praktisch gleichauf mit der durchschnittlichen RTX 2080 Super in allen Tests außer beim 720p Low.

3DMark
2560x1440 Time Spy Graphics
MSI GeForce RTX 3090 Suprim X
NVIDIA GeForce RTX 3090, R9 5900X
19571 Points +69%
Durchschnittliche NVIDIA GeForce RTX 3090
  (18685 - 20433, n=16)
19254 Points +66%
MSI GeForce RTX 3080 Gaming X Trio
NVIDIA GeForce RTX 3080, R9 5900X
17604 Points +52%
AMD Radeon RX 6800 XT
AMD Radeon RX 6800 XT, R9 5950X
17603 Points +52%
Durchschnittliche NVIDIA GeForce RTX 3080
  (17467 - 17604, n=2)
17536 Points +51%
AMD Ryzen 9 5900X
NVIDIA Titan RTX, R9 5900X
15283 Points +32%
KFA2 GeForce RTX 2080 Ti EX
NVIDIA GeForce RTX 2080 Ti (Desktop), R9 3900X
13744 Points +19%
Zotac Gaming GeForce RTX 3070 Twin Edge
NVIDIA GeForce RTX 3070, R9 5950X
13024 Points +12%
Durchschnittliche NVIDIA GeForce RTX 3070
  (11043 - 13579, n=7)
12616 Points +9%
NVIDIA GeForce RTX 3060 Ti FE
NVIDIA GeForce RTX 3060 Ti, R9 5950X
11590 Points
Nvidia GeForce RTX 2080 Super
NVIDIA GeForce RTX 2080 Super (Desktop), R7 2700X
11477 Points -1%
Durchschnittliche NVIDIA GeForce RTX 2080 Super (Desktop)
  (11313 - 11542, n=4)
11439 Points -1%
Nvidia GeForce RTX 2070 Super
NVIDIA GeForce RTX 2070 Super (Desktop), R7 2700X
10094 Points -13%
Durchschnittliche NVIDIA GeForce RTX 2070 Super (Desktop)
  (9564 - 10094, n=8)
9846 Points -15%
Nvidia GeForce RTX 2060 Super
NVIDIA GeForce RTX 2060 Super (Desktop), R7 2700X
8795 Points -24%
AMD Radeon RX 5700 XT
AMD Radeon RX 5700 XT (Desktop), R7 2700X
8673 Points -25%
Durchschnittliche NVIDIA GeForce RTX 2060 Super (Desktop)
  (8396 - 8795, n=7)
8631 Points -26%
KFA 2 GeForce GTX 1660 Super
NVIDIA GeForce GTX 1660 Super (Desktop), R9 3900X
6021 Points -48%
KFA2 GeForce GTX 1650 Super EX One Click OC
NVIDIA GeForce GTX 1650 Super (Desktop), R9 5900X
4632 Points -60%
3840x2160 Fire Strike Ultra Graphics
AMD Radeon RX 6800 XT
AMD Radeon RX 6800 XT, R9 5950X
12626 Points +77%
MSI GeForce RTX 3090 Suprim X
NVIDIA GeForce RTX 3090, R9 5900X
12371 Points +74%
Durchschnittliche NVIDIA GeForce RTX 3090
  (11613 - 12587, n=13)
12305 Points +73%
Durchschnittliche NVIDIA GeForce RTX 3080
  (10645 - 10793, n=2)
10719 Points +50%
MSI GeForce RTX 3080 Gaming X Trio
NVIDIA GeForce RTX 3080, R9 5900X
10645 Points +49%
AMD Ryzen 9 5900X
NVIDIA Titan RTX, R9 5900X
8649 Points +21%
Durchschnittliche NVIDIA GeForce RTX 3070
  (8043 - 8483, n=5)
8250 Points +16%
Zotac Gaming GeForce RTX 3070 Twin Edge
NVIDIA GeForce RTX 3070, R9 5950X
8043 Points +13%
KFA2 GeForce RTX 2080 Ti EX
NVIDIA GeForce RTX 2080 Ti (Desktop), R9 3900X
7925 Points +11%
NVIDIA GeForce RTX 3060 Ti FE
NVIDIA GeForce RTX 3060 Ti, R9 5950X
7126 Points
Durchschnittliche NVIDIA GeForce RTX 2080 Super (Desktop)
  (6500 - 6700, n=3)
6585 Points -8%
Nvidia GeForce RTX 2080 Super
NVIDIA GeForce RTX 2080 Super (Desktop), R7 2700X
6500 Points -9%
AMD Radeon RX 5700 XT
AMD Radeon RX 5700 XT (Desktop), R7 2700X
5955 Points -16%
Nvidia GeForce RTX 2070 Super
NVIDIA GeForce RTX 2070 Super (Desktop), R7 2700X
5786 Points -19%
Durchschnittliche NVIDIA GeForce RTX 2070 Super (Desktop)
  (2290 - 5882, n=7)
5313 Points -25%
Nvidia GeForce RTX 2060 Super
NVIDIA GeForce RTX 2060 Super (Desktop), R7 2700X
5175 Points -27%
Durchschnittliche NVIDIA GeForce RTX 2060 Super (Desktop)
  (5067 - 5224, n=6)
5164 Points -28%
KFA 2 GeForce GTX 1660 Super
NVIDIA GeForce GTX 1660 Super (Desktop), R9 3900X
3088 Points -57%
KFA2 GeForce GTX 1650 Super EX One Click OC
NVIDIA GeForce GTX 1650 Super (Desktop), R9 5900X
2186 Points -69%
Fire Strike Extreme Graphics
AMD Radeon RX 6800 XT
AMD Radeon RX 6800 XT, R9 5950X
25015 Points +80%
Durchschnittliche NVIDIA GeForce RTX 3090
  (22075 - 24730, n=13)
23822 Points +71%
MSI GeForce RTX 3090 Suprim X
NVIDIA GeForce RTX 3090, R9 5900X
23114 Points +66%
Durchschnittliche NVIDIA GeForce RTX 3080
  (20007 - 20861, n=2)
20434 Points +47%
MSI GeForce RTX 3080 Gaming X Trio
NVIDIA GeForce RTX 3080, R9 5900X
20007 Points +44%
AMD Ryzen 9 5900X
NVIDIA Titan RTX, R9 5900X
17176 Points +24%
Durchschnittliche NVIDIA GeForce RTX 3070
  (15503 - 16276, n=5)
15859 Points +14%
KFA2 GeForce RTX 2080 Ti EX
NVIDIA GeForce RTX 2080 Ti (Desktop), R9 3900X
15603 Points +12%
Zotac Gaming GeForce RTX 3070 Twin Edge
NVIDIA GeForce RTX 3070, R9 5950X
15503 Points +12%
NVIDIA GeForce RTX 3060 Ti FE
NVIDIA GeForce RTX 3060 Ti, R9 5950X
13898 Points
Durchschnittliche NVIDIA GeForce RTX 2080 Super (Desktop)
  (12968 - 13551, n=3)
13172 Points -5%
Nvidia GeForce RTX 2080 Super
NVIDIA GeForce RTX 2080 Super (Desktop), R7 2700X
12968 Points -7%
AMD Radeon RX 5700 XT
AMD Radeon RX 5700 XT (Desktop), R7 2700X
12209 Points -12%
Durchschnittliche NVIDIA GeForce RTX 2070 Super (Desktop)
  (11382 - 12044, n=7)
11850 Points -15%
Nvidia GeForce RTX 2070 Super
NVIDIA GeForce RTX 2070 Super (Desktop), R7 2700X
11634 Points -16%
Durchschnittliche NVIDIA GeForce RTX 2060 Super (Desktop)
  (10182 - 10726, n=6)
10498 Points -24%
Nvidia GeForce RTX 2060 Super
NVIDIA GeForce RTX 2060 Super (Desktop), R7 2700X
10481 Points -25%
KFA 2 GeForce GTX 1660 Super
NVIDIA GeForce GTX 1660 Super (Desktop), R9 3900X
6935 Points -50%
KFA2 GeForce GTX 1650 Super EX One Click OC
NVIDIA GeForce GTX 1650 Super (Desktop), R9 5900X
5135 Points -63%
1920x1080 Fire Strike Graphics
AMD Radeon RX 6800 XT
AMD Radeon RX 6800 XT, R9 5950X
49735 Points +77%
Durchschnittliche NVIDIA GeForce RTX 3090
  (41298 - 49282, n=16)
46854 Points +66%
MSI GeForce RTX 3090 Suprim X
NVIDIA GeForce RTX 3090, R9 5900X
42688 Points +52%
Durchschnittliche NVIDIA GeForce RTX 3080
  (37604 - 40910, n=2)
39257 Points +39%
MSI GeForce RTX 3080 Gaming X Trio
NVIDIA GeForce RTX 3080, R9 5900X
37604 Points +34%
AMD Ryzen 9 5900X
NVIDIA Titan RTX, R9 5900X
34722 Points +23%
KFA2 GeForce RTX 2080 Ti EX
NVIDIA GeForce RTX 2080 Ti (Desktop), R9 3900X
32081 Points +14%
Zotac Gaming GeForce RTX 3070 Twin Edge
NVIDIA GeForce RTX 3070, R9 5950X
31252 Points +11%
Durchschnittliche NVIDIA GeForce RTX 3070
  (20357 - 33270, n=7)
28949 Points +3%
NVIDIA GeForce RTX 3060 Ti FE
NVIDIA GeForce RTX 3060 Ti, R9 5950X
28145 Points
Durchschnittliche NVIDIA GeForce RTX 2080 Super (Desktop)
  (26824 - 28968, n=4)
27647 Points -2%
Nvidia GeForce RTX 2080 Super
NVIDIA GeForce RTX 2080 Super (Desktop), R7 2700X
27075 Points -4%
AMD Radeon RX 5700 XT
AMD Radeon RX 5700 XT (Desktop), R7 2700X
25383 Points -10%
Durchschnittliche NVIDIA GeForce RTX 2070 Super (Desktop)
  (22819 - 25799, n=8)
24645 Points -12%
Nvidia GeForce RTX 2070 Super
NVIDIA GeForce RTX 2070 Super (Desktop), R7 2700X
24151 Points -14%
Nvidia GeForce RTX 2060 Super
NVIDIA GeForce RTX 2060 Super (Desktop), R7 2700X
21970 Points -22%
Durchschnittliche NVIDIA GeForce RTX 2060 Super (Desktop)
  (20522 - 22764, n=7)
21970 Points -22%
KFA 2 GeForce GTX 1660 Super
NVIDIA GeForce GTX 1660 Super (Desktop), R9 3900X
15498 Points -45%
KFA2 GeForce GTX 1650 Super EX One Click OC
NVIDIA GeForce GTX 1650 Super (Desktop), R9 5900X
11688 Points -58%
Unigine Heaven 4.0
Extreme Preset DX11
Durchschnittliche NVIDIA GeForce RTX 3090
  (272 - 315, n=10)
299 fps +59%
MSI GeForce RTX 3090 Suprim X
NVIDIA GeForce RTX 3090, R9 5900X
283.5 fps +50%
MSI GeForce RTX 3080 Gaming X Trio
NVIDIA GeForce RTX 3080, R9 5900X
252.5 fps +34%
AMD Radeon RX 6800 XT
AMD Radeon RX 6800 XT, R9 5950X
247.9 fps +31%
Durchschnittliche NVIDIA GeForce RTX 3080
  (233 - 253, n=2)
243 fps +29%
AMD Ryzen 9 5900X
NVIDIA Titan RTX, R9 5900X
237.1 fps +26%
KFA2 GeForce RTX 2080 Ti EX
NVIDIA GeForce RTX 2080 Ti (Desktop), R9 3900X
215.2 fps +14%
Zotac Gaming GeForce RTX 3070 Twin Edge
NVIDIA GeForce RTX 3070, R9 5950X
213.7 fps +13%
Durchschnittliche NVIDIA GeForce RTX 3070
  (196.4 - 214, n=5)
206 fps +9%
NVIDIA GeForce RTX 3060 Ti FE
NVIDIA GeForce RTX 3060 Ti, R9 5950X
188.6 (43.6min - 434.5max) fps
Nvidia GeForce RTX 2080 Super
NVIDIA GeForce RTX 2080 Super (Desktop), R7 2700X
175.2 fps -7%
Durchschnittliche NVIDIA GeForce RTX 2080 Super (Desktop)
  ()
175.2 fps -7%
Durchschnittliche NVIDIA GeForce RTX 2070 Super (Desktop)
  (160.1 - 172.3, n=4)
167.1 fps -11%
Nvidia GeForce RTX 2070 Super
NVIDIA GeForce RTX 2070 Super (Desktop), R7 2700X
160.1 fps -15%
Durchschnittliche NVIDIA GeForce RTX 2060 Super (Desktop)
  (140.4 - 146.1, n=4)
143.3 fps -24%
Nvidia GeForce RTX 2060 Super
NVIDIA GeForce RTX 2060 Super (Desktop), R7 2700X
141.7 fps -25%
AMD Radeon RX 5700 XT
AMD Radeon RX 5700 XT (Desktop), R7 2700X
132.5 fps -30%
KFA 2 GeForce GTX 1660 Super
NVIDIA GeForce GTX 1660 Super (Desktop), R9 3900X
98.3 fps -48%
KFA2 GeForce GTX 1650 Super EX One Click OC
NVIDIA GeForce GTX 1650 Super (Desktop), R9 5900X
71.9 fps -62%
Extreme Preset OpenGL
MSI GeForce RTX 3090 Suprim X
NVIDIA GeForce RTX 3090, R9 5900X
273.7 fps +59%
Durchschnittliche NVIDIA GeForce RTX 3090
  (188.2 - 284, n=9)
268 fps +56%
MSI GeForce RTX 3080 Gaming X Trio
NVIDIA GeForce RTX 3080, R9 5900X
243.2 fps +41%
Durchschnittliche NVIDIA GeForce RTX 3080
  (232 - 243, n=2)
238 fps +38%
AMD Ryzen 9 5900X
NVIDIA Titan RTX, R9 5900X
215.1 fps +25%
KFA2 GeForce RTX 2080 Ti EX
NVIDIA GeForce RTX 2080 Ti (Desktop), R9 3900X
204.4 fps +19%
AMD Radeon RX 6800 XT
AMD Radeon RX 6800 XT, R9 5950X
204 fps +18%
Durchschnittliche NVIDIA GeForce RTX 3070
  (187.5 - 196.1, n=4)
192.5 fps +12%
NVIDIA GeForce RTX 3060 Ti FE
NVIDIA GeForce RTX 3060 Ti, R9 5950X
172.3 (11.4min - 371.5max) fps
Nvidia GeForce RTX 2080 Super
NVIDIA GeForce RTX 2080 Super (Desktop), R7 2700X
167.5 fps -3%
Durchschnittliche NVIDIA GeForce RTX 2080 Super (Desktop)
  ()
167.5 fps -3%
Durchschnittliche NVIDIA GeForce RTX 2070 Super (Desktop)
  (153.5 - 157.1, n=4)
155.4 fps -10%
Nvidia GeForce RTX 2070 Super
NVIDIA GeForce RTX 2070 Super (Desktop), R7 2700X
153.5 fps -11%
Durchschnittliche NVIDIA GeForce RTX 2060 Super (Desktop)
  (132.3 - 133.9, n=4)
133.1 fps -23%
Nvidia GeForce RTX 2060 Super
NVIDIA GeForce RTX 2060 Super (Desktop), R7 2700X
132.3 fps -23%
AMD Radeon RX 5700 XT
AMD Radeon RX 5700 XT (Desktop), R7 2700X
110.2 fps -36%
KFA 2 GeForce GTX 1660 Super
NVIDIA GeForce GTX 1660 Super (Desktop), R9 3900X
92.2 fps -46%
KFA2 GeForce GTX 1650 Super EX One Click OC
NVIDIA GeForce GTX 1650 Super (Desktop), R9 5900X
68.9 fps -60%
Unigine Valley 1.0
1920x1080 Extreme HD DirectX AA:x8
Durchschnittliche NVIDIA GeForce RTX 3090
  (184.2 - 245, n=10)
223 fps +46%
MSI GeForce RTX 3090 Suprim X
NVIDIA GeForce RTX 3090, R9 5900X
196 fps +28%
AMD Radeon RX 6800 XT
AMD Radeon RX 6800 XT, R9 5950X
190.6 fps +24%
MSI GeForce RTX 3080 Gaming X Trio
NVIDIA GeForce RTX 3080, R9 5900X
181.8 fps +19%
AMD Ryzen 9 5900X
NVIDIA Titan RTX, R9 5900X
180.1 fps +18%
Durchschnittliche NVIDIA GeForce RTX 3080
  (176.2 - 181.8, n=2)
179 fps +17%
Zotac Gaming GeForce RTX 3070 Twin Edge
NVIDIA GeForce RTX 3070, R9 5950X
168.1 fps +10%
Durchschnittliche NVIDIA GeForce RTX 3070
  (155.1 - 168.5, n=5)
161.2 fps +5%
KFA2 GeForce RTX 2080 Ti EX
NVIDIA GeForce RTX 2080 Ti (Desktop), R9 3900X
159.4 fps +4%
NVIDIA GeForce RTX 3060 Ti FE
NVIDIA GeForce RTX 3060 Ti, R9 5950X
153.2 (48.2min - 297.9max) fps
Durchschnittliche NVIDIA GeForce RTX 2070 Super (Desktop)
  (113.7 - 127.4, n=4)
122.5 fps -20%
Nvidia GeForce RTX 2080 Super
NVIDIA GeForce RTX 2080 Super (Desktop), R7 2700X
120.2 fps -22%
Durchschnittliche NVIDIA GeForce RTX 2080 Super (Desktop)
  ()
120.2 fps -22%
Nvidia GeForce RTX 2070 Super
NVIDIA GeForce RTX 2070 Super (Desktop), R7 2700X
113.7 fps -26%
Durchschnittliche NVIDIA GeForce RTX 2060 Super (Desktop)
  (106.9 - 114.1, n=4)
111.3 fps -27%
Nvidia GeForce RTX 2060 Super
NVIDIA GeForce RTX 2060 Super (Desktop), R7 2700X
106.9 fps -30%
AMD Radeon RX 5700 XT
AMD Radeon RX 5700 XT (Desktop), R7 2700X
106.3 fps -31%
KFA 2 GeForce GTX 1660 Super
NVIDIA GeForce GTX 1660 Super (Desktop), R9 3900X
77.6 fps -49%
KFA2 GeForce GTX 1650 Super EX One Click OC
NVIDIA GeForce GTX 1650 Super (Desktop), R9 5900X
54.1 fps -65%
1920x1080 Extreme HD Preset OpenGL AA:x8
Durchschnittliche NVIDIA GeForce RTX 3090
  (158.8 - 211, n=9)
201 fps +51%
MSI GeForce RTX 3090 Suprim X
NVIDIA GeForce RTX 3090, R9 5900X
187.8 fps +41%
MSI GeForce RTX 3080 Gaming X Trio
NVIDIA GeForce RTX 3080, R9 5900X
172 fps +29%
Durchschnittliche NVIDIA GeForce RTX 3080
  (163.8 - 172, n=2)
167.9 fps +26%
AMD Ryzen 9 5900X
NVIDIA Titan RTX, R9 5900X
158.5 fps +19%
AMD Radeon RX 6800 XT
AMD Radeon RX 6800 XT, R9 5950X
158.2 fps +19%
KFA2 GeForce RTX 2080 Ti EX
NVIDIA GeForce RTX 2080 Ti (Desktop), R9 3900X
145.1 fps +9%
Durchschnittliche NVIDIA GeForce RTX 3070
  (140.2 - 144.9, n=4)
142.7 fps +7%
NVIDIA GeForce RTX 3060 Ti FE
NVIDIA GeForce RTX 3060 Ti, R9 5950X
132.9 (48.3min - 236.1max) fps
Nvidia GeForce RTX 2080 Super
NVIDIA GeForce RTX 2080 Super (Desktop), R7 2700X
114.5 fps -14%
Durchschnittliche NVIDIA GeForce RTX 2080 Super (Desktop)
  ()
114.5 fps -14%
Durchschnittliche NVIDIA GeForce RTX 2070 Super (Desktop)
  (105.6 - 112, n=4)
109.5 fps -18%
Nvidia GeForce RTX 2070 Super
NVIDIA GeForce RTX 2070 Super (Desktop), R7 2700X
105.6 fps -21%
Durchschnittliche NVIDIA GeForce RTX 2060 Super (Desktop)
  (97.6 - 101.5, n=4)
99.5 fps -25%
Nvidia GeForce RTX 2060 Super
NVIDIA GeForce RTX 2060 Super (Desktop), R7 2700X
98.3 fps -26%
AMD Radeon RX 5700 XT
AMD Radeon RX 5700 XT (Desktop), R7 2700X
89.1 fps -33%
KFA 2 GeForce GTX 1660 Super
NVIDIA GeForce GTX 1660 Super (Desktop), R9 3900X
70.4 fps -47%
KFA2 GeForce GTX 1650 Super EX One Click OC
NVIDIA GeForce GTX 1650 Super (Desktop), R9 5900X
51.1 fps -62%
Unigine Superposition
7680x4320 8k Optimized
MSI GeForce RTX 3090 Suprim X
NVIDIA GeForce RTX 3090, R9 5900X
7521 Points +85%
Durchschnittliche NVIDIA GeForce RTX 3090
  (6969 - 7521, n=10)
7160 Points +77%
MSI GeForce RTX 3080 Gaming X Trio
NVIDIA GeForce RTX 3080, R9 5900X
6346 Points +56%
Durchschnittliche NVIDIA GeForce RTX 3080
  (6243 - 6346, n=2)
6295 Points +55%
AMD Ryzen 9 5900X
NVIDIA Titan RTX, R9 5900X
5402 Points +33%
AMD Radeon RX 6800 XT
AMD Radeon RX 6800 XT, R9 5950X
5256 Points +30%
Durchschnittliche NVIDIA GeForce RTX 3070
  (4587 - 4695, n=5)
4624 Points +14%
Zotac Gaming GeForce RTX 3070 Twin Edge
NVIDIA GeForce RTX 3070, R9 5950X
4602 Points +13%
NVIDIA GeForce RTX 3060 Ti FE
NVIDIA GeForce RTX 3060 Ti, R9 5950X
4056 Points
Durchschnittliche NVIDIA GeForce RTX 2080 Super (Desktop)
  ()
3989 Points -2%
Durchschnittliche NVIDIA GeForce RTX 2070 Super (Desktop)
  (3419 - 3435, n=3)
3429 Points -15%
Durchschnittliche NVIDIA GeForce RTX 2060 Super (Desktop)
  (2873 - 2914, n=3)
2900 Points -29%
KFA 2 GeForce GTX 1660 Super
NVIDIA GeForce GTX 1660 Super (Desktop), R9 3900X
1964 Points -52%
KFA2 GeForce GTX 1650 Super EX One Click OC
NVIDIA GeForce GTX 1650 Super (Desktop), R9 5900X
1087 Points -73%
3840x2160 4k Optimized
MSI GeForce RTX 3090 Suprim X
NVIDIA GeForce RTX 3090, R9 5900X
16868 Points +83%
Durchschnittliche NVIDIA GeForce RTX 3090
  (15794 - 16868, n=10)
16352 Points +77%
MSI GeForce RTX 3080 Gaming X Trio
NVIDIA GeForce RTX 3080, R9 5900X
14243 Points +54%
Durchschnittliche NVIDIA GeForce RTX 3080
  (13984 - 14243, n=2)
14114 Points +53%
AMD Radeon RX 6800 XT
AMD Radeon RX 6800 XT, R9 5950X
13471 Points +46%
AMD Ryzen 9 5900X
NVIDIA Titan RTX, R9 5900X
12186 Points +32%
Zotac Gaming GeForce RTX 3070 Twin Edge
NVIDIA GeForce RTX 3070, R9 5950X
10704 Points +16%
Durchschnittliche NVIDIA GeForce RTX 3070
  (10544 - 10755, n=5)
10667 Points +16%
Durchschnittliche NVIDIA GeForce RTX 2080 Super (Desktop)
  ()
9338 Points +1%
NVIDIA GeForce RTX 3060 Ti FE
NVIDIA GeForce RTX 3060 Ti, R9 5950X
9224 Points
Durchschnittliche NVIDIA GeForce RTX 2070 Super (Desktop)
  (8096 - 8111, n=3)
8101 Points -12%
Durchschnittliche NVIDIA GeForce RTX 2060 Super (Desktop)
  (6747 - 6863, n=3)
6811 Points -26%
KFA 2 GeForce GTX 1660 Super
NVIDIA GeForce GTX 1660 Super (Desktop), R9 3900X
4755 Points -48%
KFA2 GeForce GTX 1650 Super EX One Click OC
NVIDIA GeForce GTX 1650 Super (Desktop), R9 5900X
3724 Points -60%
1920x1080 1080p Extreme
MSI GeForce RTX 3090 Suprim X
NVIDIA GeForce RTX 3090, R9 5900X
12694 Points +78%
Durchschnittliche NVIDIA GeForce RTX 3090
  (11806 - 12694, n=10)
12227 Points +71%
MSI GeForce RTX 3080 Gaming X Trio
NVIDIA GeForce RTX 3080, R9 5900X
10822 Points +52%
Durchschnittliche NVIDIA GeForce RTX 3080
  (10572 - 10822, n=2)
10697 Points +50%
AMD Radeon RX 6800 XT
AMD Radeon RX 6800 XT, R9 5950X
10046 Points +41%
AMD Ryzen 9 5900X
NVIDIA Titan RTX, R9 5900X
9056 Points +27%
Durchschnittliche NVIDIA GeForce RTX 3070
  (8276 - 8507, n=5)
8354 Points +17%
Zotac Gaming GeForce RTX 3070 Twin Edge
NVIDIA GeForce RTX 3070, R9 5950X
8336 Points +17%
NVIDIA GeForce RTX 3060 Ti FE
NVIDIA GeForce RTX 3060 Ti, R9 5950X
7142 Points
Durchschnittliche NVIDIA GeForce RTX 2080 Super (Desktop)
  ()
7080 Points -1%
Durchschnittliche NVIDIA GeForce RTX 2070 Super (Desktop)
  (6161 - 6178, n=3)
6169 Points -14%
Durchschnittliche NVIDIA GeForce RTX 2060 Super (Desktop)
  (5049 - 5143, n=3)
5105 Points -29%
KFA 2 GeForce GTX 1660 Super
NVIDIA GeForce GTX 1660 Super (Desktop), R9 3900X
3171 Points -56%
KFA2 GeForce GTX 1650 Super EX One Click OC
NVIDIA GeForce GTX 1650 Super (Desktop), R9 5900X
2305 Points -68%
1920x1080 1080p High
Durchschnittliche NVIDIA GeForce RTX 3090
  (23626 - 27207, n=10)
25978 Points +68%
MSI GeForce RTX 3090 Suprim X
NVIDIA GeForce RTX 3090, R9 5900X
25953 Points +68%
AMD Radeon RX 6800 XT
AMD Radeon RX 6800 XT, R9 5950X
22265 Points +44%
MSI GeForce RTX 3080 Gaming X Trio
NVIDIA GeForce RTX 3080, R9 5900X
21912 Points +42%
Durchschnittliche NVIDIA GeForce RTX 3080
  (21333 - 21912, n=2)
21623 Points +40%
AMD Ryzen 9 5900X
NVIDIA Titan RTX, R9 5900X
20315 Points +31%
Zotac Gaming GeForce RTX 3070 Twin Edge
NVIDIA GeForce RTX 3070, R9 5950X
17491 Points +13%
Durchschnittliche NVIDIA GeForce RTX 3070
  (17054 - 17491, n=5)
17312 Points +12%
Durchschnittliche NVIDIA GeForce RTX 2080 Super (Desktop)
  ()
15558 Points +1%
NVIDIA GeForce RTX 3060 Ti FE
NVIDIA GeForce RTX 3060 Ti, R9 5950X
15479 Points
Durchschnittliche NVIDIA GeForce RTX 2070 Super (Desktop)
  (13655 - 13832, n=3)
13765 Points -11%
Durchschnittliche NVIDIA GeForce RTX 2060 Super (Desktop)
  (11421 - 11785, n=3)
11649 Points -25%
KFA 2 GeForce GTX 1660 Super
NVIDIA GeForce GTX 1660 Super (Desktop), R9 3900X
8212 Points -47%
KFA2 GeForce GTX 1650 Super EX One Click OC
NVIDIA GeForce GTX 1650 Super (Desktop), R9 5900X
6468 Points -58%
1280x720 720p Low
Durchschnittliche NVIDIA GeForce RTX 3090
  (33329 - 54879, n=9)
45093 Points +17%
AMD Ryzen 9 5900X
NVIDIA Titan RTX, R9 5900X
40994 Points +7%
Zotac Gaming GeForce RTX 3070 Twin Edge
NVIDIA GeForce RTX 3070, R9 5950X
39277 Points +2%
Durchschnittliche NVIDIA GeForce RTX 2070 Super (Desktop)
  (26742 - 45424, n=3)
38495 Points 0%
NVIDIA GeForce RTX 3060 Ti FE
NVIDIA GeForce RTX 3060 Ti, R9 5950X
38414 Points
AMD Radeon RX 6800 XT
AMD Radeon RX 6800 XT, R9 5950X
36452 Points -5%
Durchschnittliche NVIDIA GeForce RTX 2060 Super (Desktop)
  (26634 - 40961, n=3)
35859 Points -7%
Durchschnittliche NVIDIA GeForce RTX 3070
  (27330 - 40007, n=5)
34576 Points -10%
MSI GeForce RTX 3090 Suprim X
NVIDIA GeForce RTX 3090, R9 5900X
33329 Points -13%
MSI GeForce RTX 3080 Gaming X Trio
NVIDIA GeForce RTX 3080, R9 5900X
32183 Points -16%
Durchschnittliche NVIDIA GeForce RTX 3080
  (30851 - 32183, n=2)
31517 Points -18%
Durchschnittliche NVIDIA GeForce RTX 2080 Super (Desktop)
  ()
26907 Points -30%
KFA 2 GeForce GTX 1660 Super
NVIDIA GeForce GTX 1660 Super (Desktop), R9 3900X
25313 Points -34%
KFA2 GeForce GTX 1650 Super EX One Click OC
NVIDIA GeForce GTX 1650 Super (Desktop), R9 5900X
22323 Points -42%
3DMark 11 Performance
33117 Punkte
3DMark Cloud Gate Standard Score
66922 Punkte
3DMark Fire Strike Score
27043 Punkte
3DMark Fire Strike Extreme Score
13790 Punkte
3DMark Time Spy Score
11520 Punkte
Hilfe

Compute-Benchmarks

Die RTX 3060 Ti FE bietet eine anständige Rechenleistung mit etwa 25% höheren Scores im ComputeMark im Vergleich zur durchschnittlichen RTX 2080 Super. LuxMark zeigt ebenfalls anständige Vorteile, wobei die RTX 3060 Ti FE nur etwa 6% langsamer ist als die durchschnittliche RTX 3070.

ComputeMark v2.1
1024x600 Normal, QJuliaRayTrace
Durchschnittliche NVIDIA GeForce RTX 3090
  (16403 - 18223, n=9)
17439 Points +73%
MSI GeForce RTX 3090 Suprim X
NVIDIA GeForce RTX 3090, R9 5900X
17058 Points +69%
MSI GeForce RTX 3080 Gaming X Trio
NVIDIA GeForce RTX 3080, R9 5900X
15508 Points +54%
Durchschnittliche NVIDIA GeForce RTX 3080
  (14718 - 15508, n=2)
15113 Points +50%
Durchschnittliche NVIDIA GeForce RTX 3070
  (11510 - 11816, n=3)
11665 Points +16%
AMD Radeon RX 6800 XT
AMD Radeon RX 6800 XT, R9 5950X
11304 Points +12%
NVIDIA GeForce RTX 3060 Ti FE
NVIDIA GeForce RTX 3060 Ti, R9 5950X
10072 Points
KFA2 GeForce RTX 2080 Ti EX
NVIDIA GeForce RTX 2080 Ti (Desktop), R9 3900X
9104 Points -10%
Nvidia GeForce RTX 2080 Super
NVIDIA GeForce RTX 2080 Super (Desktop), R7 2700X
7258 Points -28%
Durchschnittliche NVIDIA GeForce RTX 2080 Super (Desktop)
  ()
7258 Points -28%
Durchschnittliche NVIDIA GeForce RTX 2070 Super (Desktop)
  (6155 - 6158, n=2)
6157 Points -39%
Nvidia GeForce RTX 2070 Super
NVIDIA GeForce RTX 2070 Super (Desktop), R7 2700X
6155 Points -39%
AMD Radeon RX 5700 XT
AMD Radeon RX 5700 XT (Desktop), R7 2700X
5761 Points -43%
Nvidia GeForce RTX 2060 Super
NVIDIA GeForce RTX 2060 Super (Desktop), R7 2700X
5271 Points -48%
Durchschnittliche NVIDIA GeForce RTX 2060 Super (Desktop)
  (5270 - 5271, n=2)
5271 Points -48%
KFA 2 GeForce GTX 1660 Super
NVIDIA GeForce GTX 1660 Super (Desktop), R9 3900X
3656 Points -64%
KFA2 GeForce GTX 1650 Super EX One Click OC
NVIDIA GeForce GTX 1650 Super (Desktop), R9 5900X
3419 Points -66%
1024x600 Normal, Mandel Scalar
MSI GeForce RTX 3090 Suprim X
NVIDIA GeForce RTX 3090, R9 5900X
11197 Points +84%
Durchschnittliche NVIDIA GeForce RTX 3090
  (10650 - 11564, n=9)
11171 Points +84%
AMD Radeon RX 6800 XT
AMD Radeon RX 6800 XT, R9 5950X
10018 Points +65%
MSI GeForce RTX 3080 Gaming X Trio
NVIDIA GeForce RTX 3080, R9 5900X
9938 Points +63%
Durchschnittliche NVIDIA GeForce RTX 3080
  (9554 - 9938, n=2)
9746 Points +60%
Durchschnittliche NVIDIA GeForce RTX 3070
  (7042 - 7314, n=3)
7169 Points +18%
NVIDIA GeForce RTX 3060 Ti FE
NVIDIA GeForce RTX 3060 Ti, R9 5950X
6087 Points
KFA2 GeForce RTX 2080 Ti EX
NVIDIA GeForce RTX 2080 Ti (Desktop), R9 3900X
5679 Points -7%
AMD Radeon RX 5700 XT
AMD Radeon RX 5700 XT (Desktop), R7 2700X
4869 Points -20%
Nvidia GeForce RTX 2080 Super
NVIDIA GeForce RTX 2080 Super (Desktop), R7 2700X
4525 Points -26%
Durchschnittliche NVIDIA GeForce RTX 2080 Super (Desktop)
  ()
4525 Points -26%
Nvidia GeForce RTX 2070 Super
NVIDIA GeForce RTX 2070 Super (Desktop), R7 2700X
3782 Points -38%
Durchschnittliche NVIDIA GeForce RTX 2070 Super (Desktop)
  (3748 - 3782, n=2)
3765 Points -38%
Nvidia GeForce RTX 2060 Super
NVIDIA GeForce RTX 2060 Super (Desktop), R7 2700X
3185 Points -48%
Durchschnittliche NVIDIA GeForce RTX 2060 Super (Desktop)
  (3169 - 3185, n=2)
3177 Points -48%
KFA 2 GeForce GTX 1660 Super
NVIDIA GeForce GTX 1660 Super (Desktop), R9 3900X
2149 Points -65%
KFA2 GeForce GTX 1650 Super EX One Click OC
NVIDIA GeForce GTX 1650 Super (Desktop), R9 5900X
1984 Points -67%
1024x600 Normal, Mandel Vector
Durchschnittliche NVIDIA GeForce RTX 3090
  (8038 - 10097, n=9)
9437 Points +97%
AMD Radeon RX 6800 XT
AMD Radeon RX 6800 XT, R9 5950X
8399 Points +76%
MSI GeForce RTX 3090 Suprim X
NVIDIA GeForce RTX 3090, R9 5900X
8341 Points +74%
MSI GeForce RTX 3080 Gaming X Trio
NVIDIA GeForce RTX 3080, R9 5900X
7540 Points +58%
Durchschnittliche NVIDIA GeForce RTX 3080
  (7148 - 7540, n=2)
7344 Points +54%
Durchschnittliche NVIDIA GeForce RTX 3070
  (5364 - 6266, n=3)
5707 Points +19%
NVIDIA GeForce RTX 3060 Ti FE
NVIDIA GeForce RTX 3060 Ti, R9 5950X
4782 Points
KFA2 GeForce RTX 2080 Ti EX
NVIDIA GeForce RTX 2080 Ti (Desktop), R9 3900X
4695 Points -2%
AMD Radeon RX 5700 XT
AMD Radeon RX 5700 XT (Desktop), R7 2700X
4246 Points -11%
Nvidia GeForce RTX 2080 Super
NVIDIA GeForce RTX 2080 Super (Desktop), R7 2700X
3835 Points -20%
Durchschnittliche NVIDIA GeForce RTX 2080 Super (Desktop)
  ()
3835 Points -20%
Nvidia GeForce RTX 2070 Super
NVIDIA GeForce RTX 2070 Super (Desktop), R7 2700X
3358 Points -30%
Durchschnittliche NVIDIA GeForce RTX 2070 Super (Desktop)
  (3348 - 3358, n=2)
3353 Points -30%
Durchschnittliche NVIDIA GeForce RTX 2060 Super (Desktop)
  (2939 - 2948, n=2)
2944 Points -38%
Nvidia GeForce RTX 2060 Super
NVIDIA GeForce RTX 2060 Super (Desktop), R7 2700X
2939 Points -39%
KFA 2 GeForce GTX 1660 Super
NVIDIA GeForce GTX 1660 Super (Desktop), R9 3900X
2169 Points -55%
KFA2 GeForce GTX 1650 Super EX One Click OC
NVIDIA GeForce GTX 1650 Super (Desktop), R9 5900X
2060 Points -57%
1024x600 Normal, Fluid 2DTexArr
MSI GeForce RTX 3090 Suprim X
NVIDIA GeForce RTX 3090, R9 5900X
4560 Points +74%
Durchschnittliche NVIDIA GeForce RTX 3090
  (4344 - 4608, n=9)
4497 Points +72%
MSI GeForce RTX 3080 Gaming X Trio
NVIDIA GeForce RTX 3080, R9 5900X
4159 Points +59%
Durchschnittliche NVIDIA GeForce RTX 3080
  (4087 - 4159, n=2)
4123 Points +57%
AMD Radeon RX 6800 XT
AMD Radeon RX 6800 XT, R9 5950X
3947 Points +51%
KFA2 GeForce RTX 2080 Ti EX
NVIDIA GeForce RTX 2080 Ti (Desktop), R9 3900X
3444 Points +32%
Durchschnittliche NVIDIA GeForce RTX 3070
  (2666 - 2706, n=3)
2692 Points +3%
Nvidia GeForce RTX 2080 Super
NVIDIA GeForce RTX 2080 Super (Desktop), R7 2700X
2655 Points +1%
Durchschnittliche NVIDIA GeForce RTX 2080 Super (Desktop)
  ()
2655 Points +1%
NVIDIA GeForce RTX 3060 Ti FE
NVIDIA GeForce RTX 3060 Ti, R9 5950X
2619 Points
Durchschnittliche NVIDIA GeForce RTX 2070 Super (Desktop)
  (2331 - 2354, n=2)
2343 Points -11%
Nvidia GeForce RTX 2070 Super
NVIDIA GeForce RTX 2070 Super (Desktop), R7 2700X
2331 Points -11%
Durchschnittliche NVIDIA GeForce RTX 2060 Super (Desktop)
  (2064 - 2101, n=2)
2083 Points -20%
Nvidia GeForce RTX 2060 Super
NVIDIA GeForce RTX 2060 Super (Desktop), R7 2700X
2064 Points -21%
AMD Radeon RX 5700 XT
AMD Radeon RX 5700 XT (Desktop), R7 2700X
1960 Points -25%
KFA 2 GeForce GTX 1660 Super
NVIDIA GeForce GTX 1660 Super (Desktop), R9 3900X
1488 Points -43%
KFA2 GeForce GTX 1650 Super EX One Click OC
NVIDIA GeForce GTX 1650 Super (Desktop), R9 5900X
1015 Points -61%
1024x600 Normal, Fluid 3DTex
Durchschnittliche NVIDIA GeForce RTX 3090
  (5246 - 5520, n=9)
5444 Points +103%
MSI GeForce RTX 3090 Suprim X
NVIDIA GeForce RTX 3090, R9 5900X
5391 Points +101%
AMD Radeon RX 6800 XT
AMD Radeon RX 6800 XT, R9 5950X
5154 Points +92%
MSI GeForce RTX 3080 Gaming X Trio
NVIDIA GeForce RTX 3080, R9 5900X
4450 Points +66%
Durchschnittliche NVIDIA GeForce RTX 3080
  (4417 - 4450, n=2)
4434 Points +65%
KFA2 GeForce RTX 2080 Ti EX
NVIDIA GeForce RTX 2080 Ti (Desktop), R9 3900X
3589 Points +34%
Durchschnittliche NVIDIA GeForce RTX 3070
  (2749 - 2791, n=3)
2772 Points +3%
Nvidia GeForce RTX 2080 Super
NVIDIA GeForce RTX 2080 Super (Desktop), R7 2700X
2736 Points +2%
Durchschnittliche NVIDIA GeForce RTX 2080 Super (Desktop)
  ()
2736 Points +2%
NVIDIA GeForce RTX 3060 Ti FE
NVIDIA GeForce RTX 3060 Ti, R9 5950X
2685 Points
Durchschnittliche NVIDIA GeForce RTX 2070 Super (Desktop)
  (2456 - 2486, n=2)
2471 Points -8%
Nvidia GeForce RTX 2070 Super
NVIDIA GeForce RTX 2070 Super (Desktop), R7 2700X
2456 Points -9%
AMD Radeon RX 5700 XT
AMD Radeon RX 5700 XT (Desktop), R7 2700X
2349 Points -13%
Durchschnittliche NVIDIA GeForce RTX 2060 Super (Desktop)
  (2289 - 2290, n=2)
2290 Points -15%
Nvidia GeForce RTX 2060 Super
NVIDIA GeForce RTX 2060 Super (Desktop), R7 2700X
2289 Points -15%
KFA 2 GeForce GTX 1660 Super
NVIDIA GeForce GTX 1660 Super (Desktop), R9 3900X
1636 Points -39%
KFA2 GeForce GTX 1650 Super EX One Click OC
NVIDIA GeForce GTX 1650 Super (Desktop), R9 5900X
1032 Points -62%
1024x600 Normal, Score
Durchschnittliche NVIDIA GeForce RTX 3090
  (44948 - 49118, n=8)
47736 Points +82%
MSI GeForce RTX 3090 Suprim X
NVIDIA GeForce RTX 3090, R9 5900X
46547 Points +77%
MSI GeForce RTX 3080 Gaming X Trio
NVIDIA GeForce RTX 3080, R9 5900X
41594 Points +58%
Durchschnittliche NVIDIA GeForce RTX 3080
  (39924 - 41594, n=2)
40759 Points +55%
AMD Radeon RX 6800 XT
AMD Radeon RX 6800 XT, R9 5950X
38823 Points +48%
Durchschnittliche NVIDIA GeForce RTX 3070
  (29330 - 30581, n=3)
30004 Points +14%
KFA2 GeForce RTX 2080 Ti EX
NVIDIA GeForce RTX 2080 Ti (Desktop), R9 3900X
26510 Points +1%
NVIDIA GeForce RTX 3060 Ti FE
NVIDIA GeForce RTX 3060 Ti, R9 5950X
26245 Points
Nvidia GeForce RTX 2080 Super
NVIDIA GeForce RTX 2080 Super (Desktop), R7 2700X
21009 Points -20%
Durchschnittliche NVIDIA GeForce RTX 2080 Super (Desktop)
  ()
21009 Points -20%
AMD Radeon RX 5700 XT
AMD Radeon RX 5700 XT (Desktop), R7 2700X
19184 Points -27%
Durchschnittliche NVIDIA GeForce RTX 2070 Super (Desktop)
  (18083 - 18095, n=2)
18089 Points -31%
Nvidia GeForce RTX 2070 Super
NVIDIA GeForce RTX 2070 Super (Desktop), R7 2700X
18083 Points -31%
Durchschnittliche NVIDIA GeForce RTX 2060 Super (Desktop)
  (15749 - 15776, n=2)
15763 Points -40%
Nvidia GeForce RTX 2060 Super
NVIDIA GeForce RTX 2060 Super (Desktop), R7 2700X
15749 Points -40%
KFA 2 GeForce GTX 1660 Super
NVIDIA GeForce GTX 1660 Super (Desktop), R9 3900X
11098 Points -58%
KFA2 GeForce GTX 1650 Super EX One Click OC
NVIDIA GeForce GTX 1650 Super (Desktop), R9 5900X
9510 Points -64%
LuxMark v2.0 64Bit
Room GPUs-only
Durchschnittliche NVIDIA GeForce RTX 3090
  (5727 - 5974, n=8)
5881 Samples/s +45%
MSI GeForce RTX 3090 Suprim X
NVIDIA GeForce RTX 3090, R9 5900X
5727 Samples/s +42%
MSI GeForce RTX 3080 Gaming X Trio
NVIDIA GeForce RTX 3080, R9 5900X
5198 Samples/s +28%
Durchschnittliche NVIDIA GeForce RTX 3080
  (5112 - 5198, n=2)
5155 Samples/s +27%
AMD Radeon RX 6800 XT
AMD Radeon RX 6800 XT, R9 5950X
5057 Samples/s +25%
KFA2 GeForce RTX 2080 Ti EX
NVIDIA GeForce RTX 2080 Ti (Desktop), R9 3900X
4429 Samples/s +9%
NVIDIA GeForce RTX 3060 Ti FE
NVIDIA GeForce RTX 3060 Ti, R9 5950X
4046 Samples/s
Durchschnittliche NVIDIA GeForce RTX 3070
  (2187 - 4293, n=3)
3588 Samples/s -11%
Nvidia GeForce RTX 2080 Super
NVIDIA GeForce RTX 2080 Super (Desktop), R7 2700X
3430 Samples/s -15%
Durchschnittliche NVIDIA GeForce RTX 2080 Super (Desktop)
  ()
3430 Samples/s -15%
Nvidia GeForce RTX 2070 Super
NVIDIA GeForce RTX 2070 Super (Desktop), R7 2700X
3404 Samples/s -16%
Durchschnittliche NVIDIA GeForce RTX 2070 Super (Desktop)
  ()
3404 Samples/s -16%
Durchschnittliche NVIDIA GeForce RTX 2060 Super (Desktop)
  (3274 - 3278, n=2)
3276 Samples/s -19%
Nvidia GeForce RTX 2060 Super
NVIDIA GeForce RTX 2060 Super (Desktop), R7 2700X
3274 Samples/s -19%
KFA 2 GeForce GTX 1660 Super
NVIDIA GeForce GTX 1660 Super (Desktop), R9 3900X
2286 Samples/s -43%
AMD Radeon RX 5700 XT
AMD Radeon RX 5700 XT (Desktop), R7 2700X
2104 Samples/s -48%
KFA2 GeForce GTX 1650 Super EX One Click OC
NVIDIA GeForce GTX 1650 Super (Desktop), R9 5900X
1405 Samples/s -65%
Sala GPUs-only
AMD Radeon RX 6800 XT
AMD Radeon RX 6800 XT, R9 5950X
28023 Samples/s +211%
Durchschnittliche NVIDIA GeForce RTX 3090
  (14590 - 15088, n=8)
14908 Samples/s +65%
MSI GeForce RTX 3090 Suprim X
NVIDIA GeForce RTX 3090, R9 5900X
14590 Samples/s +62%
MSI GeForce RTX 3080 Gaming X Trio
NVIDIA GeForce RTX 3080, R9 5900X
12980 Samples/s +44%
Durchschnittliche NVIDIA GeForce RTX 3080
  (12797 - 12980, n=2)
12889 Samples/s +43%
Durchschnittliche NVIDIA GeForce RTX 3070
  (10096 - 10115, n=3)
10107 Samples/s +12%
KFA2 GeForce RTX 2080 Ti EX
NVIDIA GeForce RTX 2080 Ti (Desktop), R9 3900X
9999 Samples/s +11%
NVIDIA GeForce RTX 3060 Ti FE
NVIDIA GeForce RTX 3060 Ti, R9 5950X
9010 Samples/s
Nvidia GeForce RTX 2080 Super
NVIDIA GeForce RTX 2080 Super (Desktop), R7 2700X
7878 Samples/s -13%
Durchschnittliche NVIDIA GeForce RTX 2080 Super (Desktop)
  ()
7878 Samples/s -13%
Nvidia GeForce RTX 2070 Super
NVIDIA GeForce RTX 2070 Super (Desktop), R7 2700X
7594 Samples/s -16%
Durchschnittliche NVIDIA GeForce RTX 2070 Super (Desktop)
  ()
7594 Samples/s -16%
Durchschnittliche NVIDIA GeForce RTX 2060 Super (Desktop)
  (6980 - 7010, n=2)
6995 Samples/s -22%
Nvidia GeForce RTX 2060 Super
NVIDIA GeForce RTX 2060 Super (Desktop), R7 2700X
6980 Samples/s -23%
AMD Radeon RX 5700 XT
AMD Radeon RX 5700 XT (Desktop), R7 2700X
6188 Samples/s -31%
KFA 2 GeForce GTX 1660 Super
NVIDIA GeForce GTX 1660 Super (Desktop), R9 3900X
4490 Samples/s -50%
KFA2 GeForce GTX 1650 Super EX One Click OC
NVIDIA GeForce GTX 1650 Super (Desktop), R9 5900X
2972 Samples/s -67%
Geekbench 5.5
OpenCL Score
Durchschnittliche NVIDIA GeForce RTX 3090
  (199930 - 224611, n=19)
214008 Points +74%
MSI GeForce RTX 3090 Suprim X
NVIDIA GeForce RTX 3090, R9 5900X
212914 Points +73%
Durchschnittliche NVIDIA GeForce RTX 3080
  (164477 - 192091, n=2)
178284 Points +45%
MSI GeForce RTX 3080 Gaming X Trio
NVIDIA GeForce RTX 3080, R9 5900X
164477 Points +34%
AMD Radeon RX 6800 XT
AMD Radeon RX 6800 XT, R9 5950X
159072 Points +29%
AMD Ryzen 9 5900X
NVIDIA Titan RTX, R9 5900X
149070 Points +21%
Durchschnittliche NVIDIA GeForce RTX 3070
  (134961 - 138625, n=4)
136574 Points +11%
NVIDIA GeForce RTX 3060 Ti FE
NVIDIA GeForce RTX 3060 Ti, R9 5950X
123036 Points
Durchschnittliche NVIDIA GeForce RTX 2080 Super (Desktop)
  (118695 - 127035, n=3)
122884 Points 0%
Durchschnittliche NVIDIA GeForce RTX 2070 Super (Desktop)
  (102914 - 132850, n=2)
117882 Points -4%
Durchschnittliche NVIDIA GeForce RTX 2060 Super (Desktop)
  ()
88698 Points -28%
KFA2 GeForce GTX 1650 Super EX One Click OC
NVIDIA GeForce GTX 1650 Super (Desktop), R9 5900X
54745 Points -56%
Vulkan Score
Durchschnittliche NVIDIA GeForce RTX 3090
  (62516 - 168974, n=19)
128422 Points +45%
NVIDIA GeForce RTX 3060 Ti FE
NVIDIA GeForce RTX 3060 Ti, R9 5950X
88442 Points
MSI GeForce RTX 3080 Gaming X Trio
NVIDIA GeForce RTX 3080, R9 5900X
83486 Points -6%
AMD Radeon RX 6800 XT
AMD Radeon RX 6800 XT, R9 5950X
81098 Points -8%
Durchschnittliche NVIDIA GeForce RTX 3080
  (76596 - 83486, n=2)
80041 Points -9%
Durchschnittliche NVIDIA GeForce RTX 2080 Super (Desktop)
  (62324 - 91321, n=3)
78667 Points -11%
Durchschnittliche NVIDIA GeForce RTX 2070 Super (Desktop)
  (76596 - 80530, n=2)
78563 Points -11%
AMD Ryzen 9 5900X
NVIDIA Titan RTX, R9 5900X
76596 Points -13%
Durchschnittliche NVIDIA GeForce RTX 3070
  (27460 - 107958, n=4)
71908 Points -19%
Durchschnittliche NVIDIA GeForce RTX 2060 Super (Desktop)
  ()
65260 Points -26%
MSI GeForce RTX 3090 Suprim X
NVIDIA GeForce RTX 3090, R9 5900X
62516 Points -29%
KFA2 GeForce GTX 1650 Super EX One Click OC
NVIDIA GeForce GTX 1650 Super (Desktop), R9 5900X
0 Points -100%

Professionelle Anwendungen

Die GeForce-Karten sind nicht wirklich auf professionelle Workloads wie CAD/CAM, Energie, Automobil oder medizinische Anwendungen ausgerichtet. Diese Einschränkung kommt in erster Linie vom Treiber, denn NVIDIA würde bevorzugen, dass Profis in diesen Bereichen das Quadro-Lineup nutzen. Die Titan RTX schafft es jedoch, sich in SPECviewperf-Tests zu behaupten, obwohl sie auf regulären GeForce-Treibern läuft.

Ein Blick auf die SPECviewperf 12 und 13 Benchmarks zeigt, dass die RTX 3060 Ti in spezialisierten professionellen Workloads deutlich hinter einer Quadro RTX 5000 (Laptop) zurückbleibt, obwohl letztere im Wesentlichen ein RTX 2080 TU104 Chip ist. Diejenigen, die an 3D Studio Max und Maya Projekten arbeiten, werden jedoch feststellen, dass die RTX 3060 Ti eine anständige Leistung erbringt.

SPECviewperf 2020 schien etwas anstrengend für die RTX 3060 Ti FE zu sein, da es ein 4K-Benchmark ist. Die RTX 3080 und RTX 3090 zeigen offensichtliche Vorteile, aber die AMD Radeon RX 6800 XT ist eindeutig die leistungsstärkere Mainstream-GPU, wenn es um Profi-Anwendungen geht.

NVIDIA GeForce RTX 3060 Ti Founders Edition
NVIDIA GeForce RTX 3060 Ti, R9 5950X
MSI GeForce RTX 3080 Gaming X Trio
NVIDIA GeForce RTX 3080, R9 5900X
MSI GeForce RTX 3090 Suprim X
NVIDIA GeForce RTX 3090, R9 5900X
Nvidia GeForce RTX 2080 Super
GeForce RTX 2080 Super (Desktop), R7 2700X
AMD Ryzen 9 5900X
NVIDIA Titan RTX, R9 5900X
AMD Radeon RX 6800 XT
Radeon RX 6800 XT, R9 5950X
Acer ConceptD 9 Pro
Quadro RTX 5000 (Laptop), i9-9980HK
SPECviewperf 12
1%
20%
-9%
312%
80%
296%
1900x1060 Solidworks (sw-03)
71.1
66
-7%
72.3
2%
70.8
0%
174.9
146%
150
111%
230.1
224%
1900x1060 Siemens NX (snx-02)
12.3
12.85
4%
14.91
21%
12.26
0%
273.2
2121%
45.07
266%
258.1
1998%
1900x1060 Showcase (showcase-01)
144
180
25%
236
64%
143.6
0%
191.1
33%
223
55%
126.4
-12%
1900x1060 Medical (medical-01)
59.4
36.93
-38%
42.91
-28%
45
-24%
90.7
53%
77.3
30%
109.3
84%
1900x1060 Maya (maya-04)
197
146
-26%
184
-7%
134.8
-32%
188.3
-4%
118
-40%
179
-9%
1900x1060 Energy (energy-01)
13.9
16.35
18%
20.41
47%
13.09
-6%
28.31
104%
28.39
104%
26
87%
1900x1060 Creo (creo-01)
57.8
65.6
13%
75.4
30%
52.7
-9%
173
199%
119
106%
172.1
198%
1900x1060 Catia (catia-04)
109
116
6%
134
23%
104.2
-4%
262.7
141%
238
118%
220
102%
1900x1060 3ds Max (3dsmax-05)
252
276
10%
322
28%
225.8
-10%
292.6
16%
167
-34%
235.8
-6%
SPECviewperf 13
25%
36%
-3%
290%
91%
270%
Solidworks (sw-04)
99.6
96.5
-3%
95.3
-4%
99.6
0%
196.4
97%
193
94%
203.8
105%
Siemens NX (snx-03)
22.3
24.26
9%
27.03
21%
21.94
-2%
493.4
2113%
81.4
265%
465.3
1987%
Showcase (showcase-02)
145
204
41%
241
66%
144.5
0%
190.5
31%
232
60%
127.1
-12%
Medical (medical-02)
72.2
99
37%
105
45%
71.6
-1%
90.8
26%
130
80%
133.4
85%
Maya (maya-05)
344
440
28%
469
36%
328.7
-4%
458
33%
348
1%
340.8
-1%
Energy (energy-02)
25.6
37.87
48%
45.21
77%
23.78
-7%
52
103%
58.4
128%
57.3
124%
Creo (creo-02)
225
295
31%
316
40%
220.1
-2%
346.5
54%
276
23%
319.8
42%
Catia (catia-05)
161
190
18%
206
28%
157.7
-2%
374.8
133%
412
156%
338.9
110%
3ds Max (3dsmax-06)
252
294
17%
298
18%
227.8
-10%
291.3
16%
284
13%
232.2
-8%
SPECviewperf 2020
58%
85%
300%
107%
3840x2160 Solidworks (solidworks-05)
109
158
45%
180
65%
153
40%
108
-1%
3840x2160 Siemens NX (snx-04)
18.2
19.8
9%
22.6
24%
347
1807%
81.7
349%
3840x2160 Medical (medical-03)
11.4
18.47
62%
21.19
86%
16.42
44%
27.84
144%
3840x2160 Maya (maya-06)
215
293
36%
330
53%
257
20%
224
4%
3840x2160 Energy (energy-03)
14.5
51.7
257%
61.1
321%
58.2
301%
60.8
319%
3840x2160 Creo (creo-03)
76.6
77.6
1%
85.1
11%
113
48%
65
-15%
3840x2160 CATIA (catia-06)
37.9
50
32%
56.6
49%
78.2
106%
42.4
12%
3840x2160 3ds Max (3dsmax-07)
80.1
100
25%
135
69%
108
35%
114
42%
Durchschnitt gesamt (Programm / Settings)
28% / 27%
47% / 46%
-6% / -6%
301% / 301%
93% / 92%
283% / 283%

Spiele-Benchmarks

Auf Anhieb zeigt die RTX 3060 Ti FE in den meisten Spielen eine gute Leistung bis zur QHD-Ultra-Auflösung. eSports-Spieler, die höhere Frameraten  bevorzugen, können die Karte auch bei 1080p gut nutzen, um Monitore mit hohen Bildwiederholraten anzusteuern. Es ist auch möglich, mit 60 fps+ in 4K Ultra in mehreren Titeln zu spielen, wie z. B. Battlefield V, Far Cry New Dawn, Doom Eternal, und F1 2020. Eine gute Mehrheit der Titel kann auch auf 60 fps+ in 4K gebracht werden, indem man die In-Game-Einstellungen optimiert, ohne große Kompromisse bei der visuellen Wiedergabetreue einzugehen.

Die Raytracing (RT)-Leistung liegt innerhalb von 7% einer durchschnittlichen RTX 3070, solange das Spiel RT nicht für die globale Beleuchtung verwendet, wie die Ergebnisse von Call of Duty: Black Ops und Watch Dogs Legion 1080p-Ultra-Raytracing-Benchmarks zeigen. Dieses Leistungsdelta verdoppelt sich in Spielen, die ausgiebig Raytracing-Global Illumination verwenden, wie Metro: Exodus und Cyberpunk 2077.

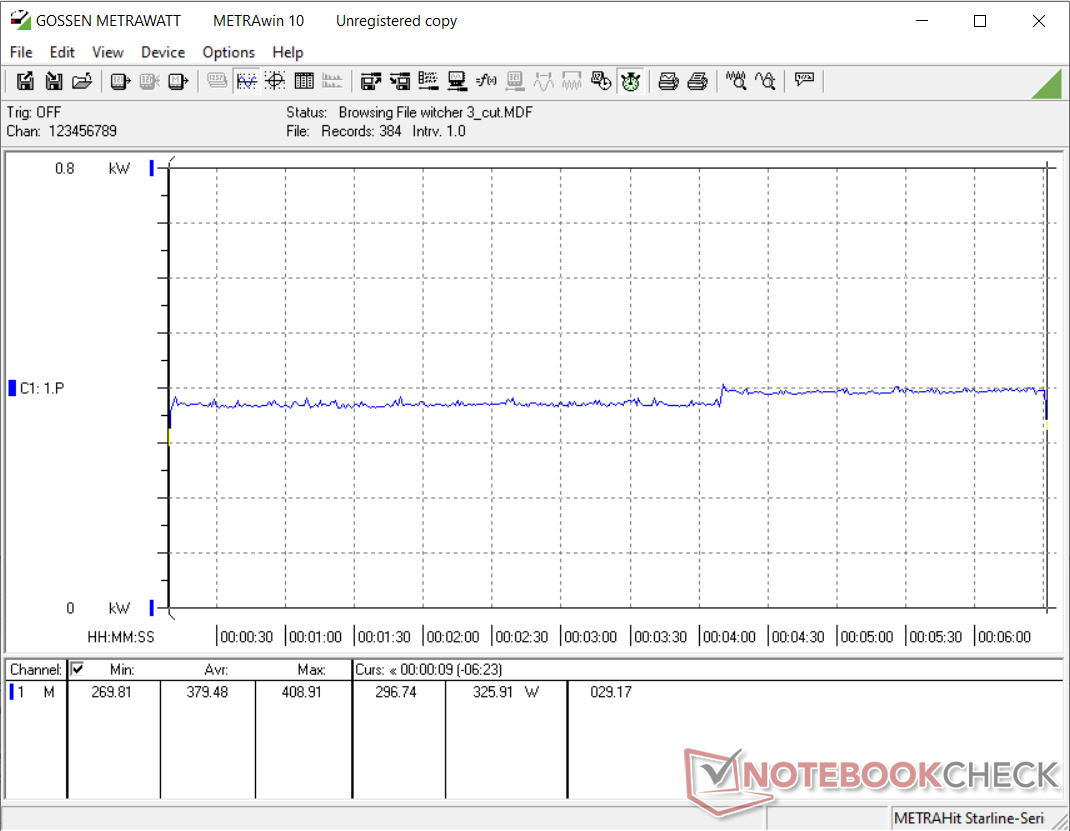
Im Witcher-3-Ultra-Stresstest erweist sich die RTX 3060 Ti FE insgesamt als recht stabil. Wir sehen zwar einen Einbruch der Frames um etwa 5 fps nach der Hälfte der Strecke in der Grafik unten, aber das Gesamterlebnis wird nicht wesentlich beeinträchtigt. Dies deutet darauf hin, dass die Kühlung der Karte der Aufgabe gewachsen ist und thermisches Throttling verhindern kann.

0102030405060708090100110Tooltip
NVIDIA GeForce RTX 3060 Ti Founders Edition NVIDIA GeForce RTX 3060 Ti, R9 5950X: Ø108.8 (103-113)
The Witcher 3
1920x1080 Ultra Graphics & Postprocessing (HBAO+)
Durchschnittliche NVIDIA GeForce RTX 3090
  (160 - 192.6, n=16)
179.9 fps +65%
MSI GeForce RTX 3090 Suprim X
NVIDIA GeForce RTX 3090, R9 5900X
160 (140min - 184max) fps +47%
AMD Radeon RX 6800 XT
AMD Radeon RX 6800 XT, R9 5950X
160 (138min - 179max) fps +47%
Durchschnittliche NVIDIA GeForce RTX 3080
  (145 - 152, n=2)
148.5 fps +36%
MSI GeForce RTX 3080 Gaming X Trio
NVIDIA GeForce RTX 3080, R9 5900X
145 (123min - 154max) fps +33%
AMD Ryzen 9 5900X
NVIDIA Titan RTX, R9 5900X
141 (127min - 154max) fps +29%
KFA2 GeForce RTX 2080 Ti EX
NVIDIA GeForce RTX 2080 Ti (Desktop), R9 3900X
135 (118min - 158max) fps +24%
Zotac Gaming GeForce RTX 3070 Twin Edge
NVIDIA GeForce RTX 3070, R9 5950X
123 (120min, 121P1 - 126max) fps +13%
Nvidia GeForce RTX 2080 Super
NVIDIA GeForce RTX 2080 Super (Desktop), R7 2700X
109 (81min - 123max) fps 0%
NVIDIA GeForce RTX 3060 Ti FE
NVIDIA GeForce RTX 3060 Ti, R9 5950X
109 (103min, 105P1 - 113max) fps
Durchschnittliche NVIDIA GeForce RTX 2080 Super (Desktop)
  ()
109 fps 0%
Durchschnittliche NVIDIA GeForce RTX 3070
  (52.8 - 132.2, n=7)
106.1 fps -3%
Durchschnittliche NVIDIA GeForce RTX 2070 Super (Desktop)
  (95.6 - 109.6, n=6)
100.9 fps -7%
Nvidia GeForce RTX 2070 Super
NVIDIA GeForce RTX 2070 Super (Desktop), R7 2700X
97 (83min - 109max) fps -11%
AMD Radeon RX 5700 XT
AMD Radeon RX 5700 XT (Desktop), R7 2700X
92 (79min - 99max) fps -16%
Durchschnittliche NVIDIA GeForce RTX 2060 Super (Desktop)
  (79 - 91.1, n=5)
84.8 fps -22%
Nvidia GeForce RTX 2060 Super
NVIDIA GeForce RTX 2060 Super (Desktop), R7 2700X
79 (67min - 89max) fps -28%
KFA 2 GeForce GTX 1660 Super
NVIDIA GeForce GTX 1660 Super (Desktop), R9 3900X
59.5 (53min - 68max) fps -45%
KFA2 GeForce GTX 1650 Super EX One Click OC
NVIDIA GeForce GTX 1650 Super (Desktop), R9 5900X
43.6 fps -60%
3840x2160 High Graphics & Postprocessing (Nvidia HairWorks Off)
Durchschnittliche NVIDIA GeForce RTX 3090
  (128 - 160.2, n=12)
151.5 fps +86%
MSI GeForce RTX 3090 Suprim X
NVIDIA GeForce RTX 3090, R9 5900X
128 (117min - 138max) fps +57%
Durchschnittliche NVIDIA GeForce RTX 3080
  (114 - 115, n=2)
114.5 fps +41%
MSI GeForce RTX 3080 Gaming X Trio
NVIDIA GeForce RTX 3080, R9 5900X
114 (106min - 122max) fps +40%
AMD Radeon RX 6800 XT
AMD Radeon RX 6800 XT, R9 5950X
110 (97min - 117max) fps +35%
AMD Ryzen 9 5900X
NVIDIA Titan RTX, R9 5900X
104 (97min - 112max) fps +28%
KFA2 GeForce RTX 2080 Ti EX
NVIDIA GeForce RTX 2080 Ti (Desktop), R9 3900X
96 (87min - 109max) fps +18%
Zotac Gaming GeForce RTX 3070 Twin Edge
NVIDIA GeForce RTX 3070, R9 5950X
89.6 (81min, 81P1 - 96max) fps +10%
Durchschnittliche NVIDIA GeForce RTX 3070
  (84 - 93.9, n=5)
89.3 fps +10%
NVIDIA GeForce RTX 3060 Ti FE
NVIDIA GeForce RTX 3060 Ti, R9 5950X
81.3 (74min, 74.57P1 - 88max) fps
Nvidia GeForce RTX 2080 Super
NVIDIA GeForce RTX 2080 Super (Desktop), R7 2700X
79 (71min - 87max) fps -3%
Durchschnittliche NVIDIA GeForce RTX 2080 Super (Desktop)
  ()
79 fps -3%
Nvidia GeForce RTX 2070 Super
NVIDIA GeForce RTX 2070 Super (Desktop), R7 2700X
68 (61min - 74max) fps -16%
Durchschnittliche NVIDIA GeForce RTX 2070 Super (Desktop)
  (65.5 - 71, n=5)
68 fps -16%
Durchschnittliche NVIDIA GeForce RTX 2060 Super (Desktop)
  (57 - 61, n=4)
58.8 fps -28%
Nvidia GeForce RTX 2060 Super
NVIDIA GeForce RTX 2060 Super (Desktop), R7 2700X
57 (51min - 62max) fps -30%
AMD Radeon RX 5700 XT
AMD Radeon RX 5700 XT (Desktop), R7 2700X
52.1 (47min - 57max) fps -36%
KFA 2 GeForce GTX 1660 Super
NVIDIA GeForce GTX 1660 Super (Desktop), R9 3900X
40 (36min - 44max) fps -51%
KFA2 GeForce GTX 1650 Super EX One Click OC
NVIDIA GeForce GTX 1650 Super (Desktop), R9 5900X
29.5 fps -64%
3840x2160 Ultra Graphics & Postprocessing (HBAO+)
Durchschnittliche NVIDIA GeForce RTX 3090
  (85.4 - 98.5, n=8)
93.4 fps +75%
MSI GeForce RTX 3080 Gaming X Trio
NVIDIA GeForce RTX 3080, R9 5900X
85.7 (80min - 93max) fps +60%
MSI GeForce RTX 3090 Suprim X
NVIDIA GeForce RTX 3090, R9 5900X
85.4 (79min - 92max) fps +60%
Durchschnittliche NVIDIA GeForce RTX 3080
  (78 - 85.7, n=2)
81.9 fps +53%
KFA2 GeForce RTX 2080 Ti EX
NVIDIA GeForce RTX 2080 Ti (Desktop), R9 3900X
65 (59min - 71max) fps +21%
Durchschnittliche NVIDIA GeForce RTX 3070
  (59 - 60.3, n=2)
59.7 fps +12%
Zotac Gaming GeForce RTX 3070 Twin Edge
NVIDIA GeForce RTX 3070, R9 5950X
59 (53min, 53.59P1 - 64max) fps +10%
Nvidia GeForce RTX 2080 Super
NVIDIA GeForce RTX 2080 Super (Desktop), R7 2700X
55.2 (49min - 61max) fps +3%
Durchschnittliche NVIDIA GeForce RTX 2080 Super (Desktop)
  (55.2 - 55.2, n=2)
55.2 fps +3%
NVIDIA GeForce RTX 3060 Ti FE
NVIDIA GeForce RTX 3060 Ti, R9 5950X
53.5 (49min, 49P1 - 57max) fps
Durchschnittliche NVIDIA GeForce RTX 2070 Super (Desktop)
  (46.3 - 49.3, n=4)
47.4 fps -11%
Nvidia GeForce RTX 2070 Super
NVIDIA GeForce RTX 2070 Super (Desktop), R7 2700X
46.3 (41min - 50max) fps -13%
AMD Radeon RX 5700 XT
AMD Radeon RX 5700 XT (Desktop), R7 2700X
39.7 (35min - 43max) fps -26%
Durchschnittliche NVIDIA GeForce RTX 2060 Super (Desktop)
  (38.4 - 42.3, n=4)
39.6 fps -26%
Nvidia GeForce RTX 2060 Super
NVIDIA GeForce RTX 2060 Super (Desktop), R7 2700X
38.4 (32min - 42max) fps -28%
KFA 2 GeForce GTX 1660 Super
NVIDIA GeForce GTX 1660 Super (Desktop), R9 3900X
27 (24min - 31max) fps -50%
Shadow of the Tomb Raider
3840x2160 Highest Preset AA:T
Durchschnittliche NVIDIA GeForce RTX 3090
  (89.3 - 99.7, n=12)
96.4 fps +72%
MSI GeForce RTX 3090 Suprim X
NVIDIA GeForce RTX 3090, R9 5900X
95.6 fps +71%
MSI GeForce RTX 3080 Gaming X Trio
NVIDIA GeForce RTX 3080, R9 5900X
87.9 fps +57%
Durchschnittliche NVIDIA GeForce RTX 3080
  (83.9 - 87.9, n=2)
85.9 fps +53%
AMD Radeon RX 6800 XT
AMD Radeon RX 6800 XT, R9 5950X
79.6 fps +42%
AMD Ryzen 9 5900X
NVIDIA Titan RTX, R9 5900X
66.3 fps +18%
Durchschnittliche NVIDIA GeForce RTX 3070
  (61 - 63.5, n=4)
62.3 fps +11%
Zotac Gaming GeForce RTX 3070 Twin Edge
NVIDIA GeForce RTX 3070, R9 5950X
62 fps +11%
KFA2 GeForce RTX 2080 Ti EX
NVIDIA GeForce RTX 2080 Ti (Desktop), R9 3900X
60 fps +7%
NVIDIA GeForce RTX 3060 Ti FE
NVIDIA GeForce RTX 3060 Ti, R9 5950X
56 fps
Nvidia GeForce RTX 2080 Super
NVIDIA GeForce RTX 2080 Super (Desktop), R7 2700X
49 fps -12%
Durchschnittliche NVIDIA GeForce RTX 2080 Super (Desktop)
  (49 - 49, n=2)
49 fps -12%
Durchschnittliche NVIDIA GeForce RTX 2070 Super (Desktop)
  (43 - 47.9, n=5)
45.5 fps -19%
Nvidia GeForce RTX 2070 Super
NVIDIA GeForce RTX 2070 Super (Desktop), R7 2700X
43 fps -23%
Durchschnittliche NVIDIA GeForce RTX 2060 Super (Desktop)
  (36 - 40.2, n=4)
38.2 fps -32%
AMD Radeon RX 5700 XT
AMD Radeon RX 5700 XT (Desktop), R7 2700X
38 fps -32%
Nvidia GeForce RTX 2060 Super
NVIDIA GeForce RTX 2060 Super (Desktop), R7 2700X
36 fps -36%
KFA 2 GeForce GTX 1660 Super
NVIDIA GeForce GTX 1660 Super (Desktop), R9 3900X
26 fps -54%
KFA2 GeForce GTX 1650 Super EX One Click OC
NVIDIA GeForce GTX 1650 Super (Desktop), R9 5900X
19 fps -66%
2560x1440 Highest Preset AA:T
Durchschnittliche NVIDIA GeForce RTX 3090
  (137 - 172.3, n=12)
165.6 fps +61%
MSI GeForce RTX 3090 Suprim X
NVIDIA GeForce RTX 3090, R9 5900X
162 fps +57%
MSI GeForce RTX 3080 Gaming X Trio
NVIDIA GeForce RTX 3080, R9 5900X
152 fps +48%
Durchschnittliche NVIDIA GeForce RTX 3080
  (147 - 152, n=2)
149.5 fps +45%
AMD Radeon RX 6800 XT
AMD Radeon RX 6800 XT, R9 5950X
148 fps +44%
AMD Ryzen 9 5900X
NVIDIA Titan RTX, R9 5900X
120 fps +17%
Zotac Gaming GeForce RTX 3070 Twin Edge
NVIDIA GeForce RTX 3070, R9 5950X
114 fps +11%
Durchschnittliche NVIDIA GeForce RTX 3070
  (108 - 116, n=4)
113.2 fps +10%
KFA2 GeForce RTX 2080 Ti EX
NVIDIA GeForce RTX 2080 Ti (Desktop), R9 3900X
108 fps +5%
NVIDIA GeForce RTX 3060 Ti FE
NVIDIA GeForce RTX 3060 Ti, R9 5950X
103 fps
Durchschnittliche NVIDIA GeForce RTX 2080 Super (Desktop)
  (91 - 92, n=2)
91.5 fps -11%
Nvidia GeForce RTX 2080 Super
NVIDIA GeForce RTX 2080 Super (Desktop), R7 2700X
91 fps -12%
Durchschnittliche NVIDIA GeForce RTX 2070 Super (Desktop)
  (81 - 89.6, n=5)
85.4 fps -17%
Nvidia GeForce RTX 2070 Super
NVIDIA GeForce RTX 2070 Super (Desktop), R7 2700X
81 fps -21%
AMD Radeon RX 5700 XT
AMD Radeon RX 5700 XT (Desktop), R7 2700X
76 fps -26%
Durchschnittliche NVIDIA GeForce RTX 2060 Super (Desktop)
  (69 - 75.7, n=4)
72.3 fps -30%
Nvidia GeForce RTX 2060 Super
NVIDIA GeForce RTX 2060 Super (Desktop), R7 2700X
69 fps -33%
KFA 2 GeForce GTX 1660 Super
NVIDIA GeForce GTX 1660 Super (Desktop), R9 3900X
53 fps -49%
KFA2 GeForce GTX 1650 Super EX One Click OC
NVIDIA GeForce GTX 1650 Super (Desktop), R9 5900X
40 fps -61%
1920x1080 Highest Preset AA:T
Durchschnittliche NVIDIA GeForce RTX 3090
  (145 - 240, n=14)
204 fps +41%
AMD Radeon RX 6800 XT
AMD Radeon RX 6800 XT, R9 5950X
194 fps +34%
MSI GeForce RTX 3090 Suprim X
NVIDIA GeForce RTX 3090, R9 5900X
188 fps +30%
Durchschnittliche NVIDIA GeForce RTX 3080
  (177 - 185, n=2)
181 fps +25%
MSI GeForce RTX 3080 Gaming X Trio
NVIDIA GeForce RTX 3080, R9 5900X
177 fps +22%
AMD Ryzen 9 5900X
NVIDIA Titan RTX, R9 5900X
166 fps +14%
Durchschnittliche NVIDIA GeForce RTX 3070
  (138 - 160, n=4)
151.3 fps +4%
Zotac Gaming GeForce RTX 3070 Twin Edge
NVIDIA GeForce RTX 3070, R9 5950X
150 fps +3%
NVIDIA GeForce RTX 3060 Ti FE
NVIDIA GeForce RTX 3060 Ti, R9 5950X
145 fps
KFA2 GeForce RTX 2080 Ti EX
NVIDIA GeForce RTX 2080 Ti (Desktop), R9 3900X
130 fps -10%
Durchschnittliche NVIDIA GeForce RTX 2070 Super (Desktop)
  (104 - 131.1, n=5)
119.7 fps -17%
Durchschnittliche NVIDIA GeForce RTX 2080 Super (Desktop)
  (110 - 118, n=2)
114 fps -21%
Nvidia GeForce RTX 2080 Super
NVIDIA GeForce RTX 2080 Super (Desktop), R7 2700X
110 fps -24%
AMD Radeon RX 5700 XT
AMD Radeon RX 5700 XT (Desktop), R7 2700X
110 fps -24%
Durchschnittliche NVIDIA GeForce RTX 2060 Super (Desktop)
  (96 - 111.4, n=4)
105.2 fps -27%
Nvidia GeForce RTX 2070 Super
NVIDIA GeForce RTX 2070 Super (Desktop), R7 2700X
104 fps -28%
Nvidia GeForce RTX 2060 Super
NVIDIA GeForce RTX 2060 Super (Desktop), R7 2700X
96 fps -34%
KFA 2 GeForce GTX 1660 Super
NVIDIA GeForce GTX 1660 Super (Desktop), R9 3900X
80 fps -45%
KFA2 GeForce GTX 1650 Super EX One Click OC
NVIDIA GeForce GTX 1650 Super (Desktop), R9 5900X
63 fps -57%
Borderlands 3
3840x2160 Badass Overall Quality (DX11)
MSI GeForce RTX 3090 Suprim X
NVIDIA GeForce RTX 3090, R9 5900X
73.4 fps +91%
Durchschnittliche NVIDIA GeForce RTX 3090
  (68 - 75.3, n=12)
72.8 fps +90%
MSI GeForce RTX 3080 Gaming X Trio
NVIDIA GeForce RTX 3080, R9 5900X
61.9 fps +61%
Durchschnittliche NVIDIA GeForce RTX 3080
  (61.5 - 61.9, n=2)
61.7 fps +61%
AMD Radeon RX 6800 XT
AMD Radeon RX 6800 XT, R9 5950X
53.6 fps +40%
AMD Ryzen 9 5900X
NVIDIA Titan RTX, R9 5900X
46.7 fps +22%
Zotac Gaming GeForce RTX 3070 Twin Edge
NVIDIA GeForce RTX 3070, R9 5950X
44.5 fps +16%
Durchschnittliche NVIDIA GeForce RTX 3070
  (42.7 - 46.3, n=5)
44.3 fps +15%
KFA2 GeForce RTX 2080 Ti EX
NVIDIA GeForce RTX 2080 Ti (Desktop), R9 3900X
43.6 fps +14%
NVIDIA GeForce RTX 3060 Ti FE
NVIDIA GeForce RTX 3060 Ti, R9 5950X
38.4 fps
Durchschnittliche NVIDIA GeForce RTX 2080 Super (Desktop)
  ()
35.9 fps -7%
Durchschnittliche NVIDIA GeForce RTX 2070 Super (Desktop)
  (29.5 - 32.7, n=5)
31.3 fps -18%
Durchschnittliche NVIDIA GeForce RTX 2060 Super (Desktop)
  (26.3 - 27.8, n=4)
27.3 fps -29%
KFA 2 GeForce GTX 1660 Super
NVIDIA GeForce GTX 1660 Super (Desktop), R9 3900X
12 fps -69%
KFA2 GeForce GTX 1650 Super EX One Click OC
NVIDIA GeForce GTX 1650 Super (Desktop), R9 5900X
7.87 fps -80%
2560x1440 Badass Overall Quality (DX11)
Durchschnittliche NVIDIA GeForce RTX 3090
  (105 - 131.6, n=12)
123.2 fps +75%
MSI GeForce RTX 3090 Suprim X
NVIDIA GeForce RTX 3090, R9 5900X
117 fps +67%
Durchschnittliche NVIDIA GeForce RTX 3080
  (95.7 - 103, n=2)
99.4 fps +42%
MSI GeForce RTX 3080 Gaming X Trio
NVIDIA GeForce RTX 3080, R9 5900X
95.7 fps +36%
AMD Radeon RX 6800 XT
AMD Radeon RX 6800 XT, R9 5950X
93.6 fps +33%
AMD Ryzen 9 5900X
NVIDIA Titan RTX, R9 5900X
84.7 fps +21%
Zotac Gaming GeForce RTX 3070 Twin Edge
NVIDIA GeForce RTX 3070, R9 5950X
79 fps +13%
KFA2 GeForce RTX 2080 Ti EX
NVIDIA GeForce RTX 2080 Ti (Desktop), R9 3900X
78 fps +11%
Durchschnittliche NVIDIA GeForce RTX 3070
  (75.1 - 82.9, n=5)
77.7 fps +11%
NVIDIA GeForce RTX 3060 Ti FE
NVIDIA GeForce RTX 3060 Ti, R9 5950X
70.2 fps
Durchschnittliche NVIDIA GeForce RTX 2080 Super (Desktop)
  ()
65.5 fps -7%
Durchschnittliche NVIDIA GeForce RTX 2070 Super (Desktop)
  (53.7 - 60.3, n=5)
57.3 fps -18%
Durchschnittliche NVIDIA GeForce RTX 2060 Super (Desktop)
  (48.8 - 51.7, n=4)
50.2 fps -28%
KFA 2 GeForce GTX 1660 Super
NVIDIA GeForce GTX 1660 Super (Desktop), R9 3900X
33 fps -53%
KFA2 GeForce GTX 1650 Super EX One Click OC
NVIDIA GeForce GTX 1650 Super (Desktop), R9 5900X
23.3 fps -67%
1920x1080 Badass Overall Quality (DX11)
Durchschnittliche NVIDIA GeForce RTX 3090
  (117 - 165, n=12)
149.1 fps +55%
MSI GeForce RTX 3090 Suprim X
NVIDIA GeForce RTX 3090, R9 5900X
135 fps +41%
Durchschnittliche NVIDIA GeForce RTX 3080
  (117 - 128, n=2)
122.5 fps +28%
AMD Radeon RX 6800 XT
AMD Radeon RX 6800 XT, R9 5950X
120 fps +25%
AMD Ryzen 9 5900X
NVIDIA Titan RTX, R9 5900X
118 fps +23%
MSI GeForce RTX 3080 Gaming X Trio
NVIDIA GeForce RTX 3080, R9 5900X
117 fps +22%
Zotac Gaming GeForce RTX 3070 Twin Edge
NVIDIA GeForce RTX 3070, R9 5950X
104 fps +8%
KFA2 GeForce RTX 2080 Ti EX
NVIDIA GeForce RTX 2080 Ti (Desktop), R9 3900X
101.3 fps +6%
Durchschnittliche NVIDIA GeForce RTX 3070
  (95.3 - 108.9, n=5)
100.6 fps +5%
NVIDIA GeForce RTX 3060 Ti FE
NVIDIA GeForce RTX 3060 Ti, R9 5950X
96 fps
Durchschnittliche NVIDIA GeForce RTX 2080 Super (Desktop)
  ()
91 fps -5%
Durchschnittliche NVIDIA GeForce RTX 2070 Super (Desktop)
  (74.3 - 86, n=5)
80.9 fps -16%
Durchschnittliche NVIDIA GeForce RTX 2060 Super (Desktop)
  (68.6 - 74.1, n=4)
71.2 fps -26%
KFA 2 GeForce GTX 1660 Super
NVIDIA GeForce GTX 1660 Super (Desktop), R9 3900X
50 fps -48%
KFA2 GeForce GTX 1650 Super EX One Click OC
NVIDIA GeForce GTX 1650 Super (Desktop), R9 5900X
39.8 fps -59%
Call of Duty Black Ops Cold War
1920x1080 Highest Settings + Ultra Ray Tracing
AMD Ryzen 9 5900X
NVIDIA Titan RTX, R9 5900X
119 fps +79%
Durchschnittliche NVIDIA GeForce RTX 3090
  (88.3 - 89, n=2)
88.7 fps +33%
MSI GeForce RTX 3090 Suprim X
NVIDIA GeForce RTX 3090, R9 5900X
88.3 (22.4min, 29.5P0.1, 44.8P1 - 267max) fps +33%
MSI GeForce RTX 3080 Gaming X Trio
NVIDIA GeForce RTX 3080, R9 5900X
81.9 (17.3min, 30.1P0.1, 42.6P1 - 248max) fps +23%
Durchschnittliche NVIDIA GeForce RTX 3080
  ()
81.9 fps +23%
Zotac Gaming GeForce RTX 3070 Twin Edge
NVIDIA GeForce RTX 3070, R9 5950X
70.1 (23.8min, 27.5P0.1, 42.6P1 - 217max) fps +5%
NVIDIA GeForce RTX 3060 Ti FE
NVIDIA GeForce RTX 3060 Ti, R9 5950X
66.5 (32.4min, 39.6P0.1, 45.3P1 - 224max) fps
Durchschnittliche NVIDIA GeForce RTX 3070
  (49.8 - 70.1, n=3)
62.8 fps -6%
Durchschnittliche NVIDIA GeForce RTX 2080 Super (Desktop)
  ()
59 fps -11%
Durchschnittliche NVIDIA GeForce RTX 2070 Super (Desktop)
  ()
55.6 fps -16%
Durchschnittliche NVIDIA GeForce RTX 2060 Super (Desktop)
  ()
44.7 fps -33%
AMD Radeon RX 6800 XT
AMD Radeon RX 6800 XT, R9 5950X
21.8 (8.8min, 9.61P0.1, 16.2P1 - 49.5max) fps -67%
3840x2160 Highest Settings
MSI GeForce RTX 3090 Suprim X
NVIDIA GeForce RTX 3090, R9 5900X
76.1 (42.1min, 58.7P0.1, 61.9P1 - 221max) fps +69%
Durchschnittliche NVIDIA GeForce RTX 3090
  (74.6 - 76.1, n=2)
75.4 fps +68%
MSI GeForce RTX 3080 Gaming X Trio
NVIDIA GeForce RTX 3080, R9 5900X
65.6 (13.8min, 17.5P0.1, 51.4P1 - 229max) fps +46%
Durchschnittliche NVIDIA GeForce RTX 3080
  ()
65.6 fps +46%
AMD Radeon RX 6800 XT
AMD Radeon RX 6800 XT, R9 5950X
64 (10.8min, 11.6P0.1, 50.8P1 - 159max) fps +43%
Durchschnittliche NVIDIA GeForce RTX 3070
  (43.8 - 74, n=3)
56 fps +25%
AMD Ryzen 9 5900X
NVIDIA Titan RTX, R9 5900X
52.9 fps +18%
NVIDIA GeForce RTX 3060 Ti FE
NVIDIA GeForce RTX 3060 Ti, R9 5950X
44.9 (17.1min, 19.2P0.1, 34.5P1 - 84.4max) fps
Zotac Gaming GeForce RTX 3070 Twin Edge
NVIDIA GeForce RTX 3070, R9 5950X
43.8 (16.7min, 17.4P0.1, 33.8P1 - 80.3max) fps -2%
Durchschnittliche NVIDIA GeForce RTX 2080 Super (Desktop)
  (38 - 44.5, n=2)
41.3 fps -8%
Durchschnittliche NVIDIA GeForce RTX 2070 Super (Desktop)
  ()
37.6 fps -16%
Durchschnittliche NVIDIA GeForce RTX 2060 Super (Desktop)
  ()
17.3 fps -61%
KFA2 GeForce GTX 1650 Super EX One Click OC
NVIDIA GeForce GTX 1650 Super (Desktop), R9 5900X
2 fps -96%
2560x1440 Highest Settings
Durchschnittliche NVIDIA GeForce RTX 3090
  (122 - 124.7, n=2)
123.4 fps +50%
MSI GeForce RTX 3090 Suprim X
NVIDIA GeForce RTX 3090, R9 5900X
122 (54.5min, 84.4P0.1, 93.9P1 - 258max) fps +49%
MSI GeForce RTX 3080 Gaming X Trio
NVIDIA GeForce RTX 3080, R9 5900X
104 (19.1min, 20.4P0.1, 77.7P1 - 258max) fps +27%
Durchschnittliche NVIDIA GeForce RTX 3080
  ()
104 fps +27%
Durchschnittliche NVIDIA GeForce RTX 3070
  (83 - 107, n=3)
93.2 fps +14%
Zotac Gaming GeForce RTX 3070 Twin Edge
NVIDIA GeForce RTX 3070, R9 5950X
89.5 (40.5min, 65.1P0.1, 70.3P1 - 219max) fps +9%
AMD Ryzen 9 5900X
NVIDIA Titan RTX, R9 5900X
87.6 fps +7%
NVIDIA GeForce RTX 3060 Ti FE
NVIDIA GeForce RTX 3060 Ti, R9 5950X
82.1 (38.4min, 57P0.1, 63.5P1 - 233max) fps
AMD Radeon RX 6800 XT
AMD Radeon RX 6800 XT, R9 5950X
80.4 (16.5min, 31.8P0.1, 64.3P1 - 285max) fps -2%
Durchschnittliche NVIDIA GeForce RTX 2070 Super (Desktop)
  ()
67.7 fps -18%
Durchschnittliche NVIDIA GeForce RTX 2080 Super (Desktop)
  (51 - 77.6, n=2)
64.3 fps -22%
Durchschnittliche NVIDIA GeForce RTX 2060 Super (Desktop)
  ()
53.2 fps -35%
KFA2 GeForce GTX 1650 Super EX One Click OC
NVIDIA GeForce GTX 1650 Super (Desktop), R9 5900X
26 fps -68%
1920x1080 Highest Settings
Durchschnittliche NVIDIA GeForce RTX 3090
  (161 - 161.1, n=2)
161.1 fps +46%
MSI GeForce RTX 3090 Suprim X
NVIDIA GeForce RTX 3090, R9 5900X
161 (59.8min, 96.1P0.1, 111P1 - 312max) fps +46%
AMD Ryzen 9 5900X
NVIDIA Titan RTX, R9 5900X
144 fps +31%
AMD Radeon RX 6800 XT
AMD Radeon RX 6800 XT, R9 5950X
144 (58.7min, 90.7P0.1, 105P1 - 365max) fps +31%
MSI GeForce RTX 3080 Gaming X Trio
NVIDIA GeForce RTX 3080, R9 5900X
127 (21.9min, 24.4P0.1, 83.5P1 - 285max) fps +15%
Durchschnittliche NVIDIA GeForce RTX 3080
  ()
127 fps +15%
Zotac Gaming GeForce RTX 3070 Twin Edge
NVIDIA GeForce RTX 3070, R9 5950X
120 (49.7min, 76.4P0.1, 85.7P1 - 245max) fps +9%
Durchschnittliche NVIDIA GeForce RTX 3070
  (95.7 - 122, n=3)
112.6 fps +2%
NVIDIA GeForce RTX 3060 Ti FE
NVIDIA GeForce RTX 3060 Ti, R9 5950X
110 (46.1min, 67.8P0.1, 79.3P1 - 288max) fps
Durchschnittliche NVIDIA GeForce RTX 2070 Super (Desktop)
  ()
92.7 fps -16%
Durchschnittliche NVIDIA GeForce RTX 2080 Super (Desktop)
  (59 - 106, n=2)
82.5 fps -25%
Durchschnittliche NVIDIA GeForce RTX 2060 Super (Desktop)
  ()
73 fps -34%
KFA2 GeForce GTX 1650 Super EX One Click OC
NVIDIA GeForce GTX 1650 Super (Desktop), R9 5900X
37 fps -66%
Watch Dogs Legion
1920x1080 Ultra Preset + Ultra Ray Tracing (DX12)
MSI GeForce RTX 3090 Suprim X
NVIDIA GeForce RTX 3090, R9 5900X
78.2 (53.58min, 63.39P1 - 115.63max) fps +62%
Durchschnittliche NVIDIA GeForce RTX 3090
  (75.7 - 78.2, n=2)
77 fps +59%
AMD Radeon RX 6800 XT
AMD Radeon RX 6800 XT, R9 5950X
71.4 (47.71min, 55.63P1 - 113.42max) fps +48%
MSI GeForce RTX 3080 Gaming X Trio
NVIDIA GeForce RTX 3080, R9 5900X
71.3 (24.22min, 56.02P1 - 112.08max) fps +48%
Durchschnittliche NVIDIA GeForce RTX 3080
  (70.9 - 71.3, n=2)
71.1 fps +47%
Durchschnittliche NVIDIA GeForce RTX 3070
  (51.7 - 61, n=4)
55.1 fps +14%
Zotac Gaming GeForce RTX 3070 Twin Edge
NVIDIA GeForce RTX 3070, R9 5950X
51.7 (15.03min, 25.28P1 - 71.97max) fps +7%
NVIDIA GeForce RTX 3060 Ti FE
NVIDIA GeForce RTX 3060 Ti, R9 5950X
48.3 (26.43min, 38.03P1 - 84.29max) fps
Durchschnittliche NVIDIA GeForce RTX 2080 Super (Desktop)
  ()
45.4 fps -6%
Durchschnittliche NVIDIA GeForce RTX 2070 Super (Desktop)
  ()
39.2 fps -19%
Durchschnittliche NVIDIA GeForce RTX 2060 Super (Desktop)
  ()
33.7 fps -30%
KFA 2 GeForce GTX 1660 Super
NVIDIA GeForce GTX 1660 Super (Desktop), R9 3900X
11.7 (7.26min, 8.31P1 - 16.29max) fps -76%
3840x2160 Ultra Preset (DX12)
MSI GeForce RTX 3090 Suprim X
NVIDIA GeForce RTX 3090, R9 5900X
60.3 (34.68min, 51.05P1 - 78.14max) fps +83%
Durchschnittliche NVIDIA GeForce RTX 3090
  (57.6 - 60.3, n=2)
59 fps +79%
Durchschnittliche NVIDIA GeForce RTX 3080
  (53.5 - 54.1, n=2)
53.8 fps +63%
MSI GeForce RTX 3080 Gaming X Trio
NVIDIA GeForce RTX 3080, R9 5900X
53.5 (33.98min, 42.85P1 - 79.6max) fps +62%
AMD Radeon RX 6800 XT
AMD Radeon RX 6800 XT, R9 5950X
49.3 (32.85min, 41.54P1 - 76.12max) fps +49%
Zotac Gaming GeForce RTX 3070 Twin Edge
NVIDIA GeForce RTX 3070, R9 5950X
38.9 (22.74min, 31.31P1 - 54.01max) fps +18%
Durchschnittliche NVIDIA GeForce RTX 3070
  (37 - 39.2, n=4)
38 fps +15%
Durchschnittliche NVIDIA GeForce RTX 2080 Super (Desktop)
  ()
34.4 fps +4%
NVIDIA GeForce RTX 3060 Ti FE
NVIDIA GeForce RTX 3060 Ti, R9 5950X
33 (17.58min, 22.09P1 - 51.23max) fps
Durchschnittliche NVIDIA GeForce RTX 2070 Super (Desktop)
  ()
29.2 fps -12%
Durchschnittliche NVIDIA GeForce RTX 2060 Super (Desktop)
  ()
24.7 fps -25%
KFA 2 GeForce GTX 1660 Super
NVIDIA GeForce GTX 1660 Super (Desktop), R9 3900X
12.3 (6.74min, 8.44P1 - 72.77max) fps -63%
KFA2 GeForce GTX 1650 Super EX One Click OC
NVIDIA GeForce GTX 1650 Super (Desktop), R9 5900X
8.09 (4.22min, 5.13P1 - 78.77max) fps -75%
2560x1440 Ultra Preset (DX12)
MSI GeForce RTX 3090 Suprim X
NVIDIA GeForce RTX 3090, R9 5900X
89.7 (59.87min, 73.02P1 - 132.92max) fps +52%
Durchschnittliche NVIDIA GeForce RTX 3090
  (88.3 - 89.7, n=2)
89 fps +51%
AMD Radeon RX 6800 XT
AMD Radeon RX 6800 XT, R9 5950X
84.5 (58.88min, 69.45P1 - 137.16max) fps +43%
Durchschnittliche NVIDIA GeForce RTX 3080
  (81.1 - 81.6, n=2)
81.4 fps +38%
MSI GeForce RTX 3080 Gaming X Trio
NVIDIA GeForce RTX 3080, R9 5900X
81.1 (46.24min, 61.45P1 - 140.66max) fps +37%
Durchschnittliche NVIDIA GeForce RTX 3070
  (65.3 - 67, n=4)
66.1 fps +12%
Zotac Gaming GeForce RTX 3070 Twin Edge
NVIDIA GeForce RTX 3070, R9 5950X
65.3 (41.29min, 53.17P1 - 88.97max) fps +10%
NVIDIA GeForce RTX 3060 Ti FE
NVIDIA GeForce RTX 3060 Ti, R9 5950X
59.1 (34.72min, 48.11P1 - 97.67max) fps
Durchschnittliche NVIDIA GeForce RTX 2080 Super (Desktop)
  ()
57.3 fps -3%
Durchschnittliche NVIDIA GeForce RTX 2070 Super (Desktop)
  ()
51.4 fps -13%
Durchschnittliche NVIDIA GeForce RTX 2060 Super (Desktop)
  ()
43.7 fps -26%
KFA 2 GeForce GTX 1660 Super
NVIDIA GeForce GTX 1660 Super (Desktop), R9 3900X
23.5 (14.14min, 15.64P1 - 42max) fps -60%
KFA2 GeForce GTX 1650 Super EX One Click OC
NVIDIA GeForce GTX 1650 Super (Desktop), R9 5900X
14.3 (6.88min, 8.73P1 - 63.4max) fps -76%
1920x1080 Ultra Preset (DX12)
AMD Radeon RX 6800 XT
AMD Radeon RX 6800 XT, R9 5950X
112 (75.12min, 87.97P1 - 181.69max) fps +46%
Durchschnittliche NVIDIA GeForce RTX 3090
  (103 - 107, n=2)
105 fps +37%
MSI GeForce RTX 3090 Suprim X
NVIDIA GeForce RTX 3090, R9 5900X
103 (30.26min, 75.96P1 - 155.81max) fps +34%
Durchschnittliche NVIDIA GeForce RTX 3080
  (99.3 - 103, n=2)
101.2 fps +32%
MSI GeForce RTX 3080 Gaming X Trio
NVIDIA GeForce RTX 3080, R9 5900X
99.3 (13.98min, 73.29P1 - 167.32max) fps +30%
Zotac Gaming GeForce RTX 3070 Twin Edge
NVIDIA GeForce RTX 3070, R9 5950X
84.9 (55.86min, 67.74P1 - 127.49max) fps +11%
Durchschnittliche NVIDIA GeForce RTX 3070
  (79 - 89, n=4)
84.7 fps +11%
NVIDIA GeForce RTX 3060 Ti FE
NVIDIA GeForce RTX 3060 Ti, R9 5950X
76.6 (48.47min, 62.15P1 - 115.84max) fps
Durchschnittliche NVIDIA GeForce RTX 2080 Super (Desktop)
  ()
75.4 fps -2%
Durchschnittliche NVIDIA GeForce RTX 2070 Super (Desktop)
  ()
68.3 fps -11%
Durchschnittliche NVIDIA GeForce RTX 2060 Super (Desktop)
  ()
59.1 fps -23%
KFA 2 GeForce GTX 1660 Super
NVIDIA GeForce GTX 1660 Super (Desktop), R9 3900X
31.4 (16.64min, 21.23P1 - 82max) fps -59%
KFA2 GeForce GTX 1650 Super EX One Click OC
NVIDIA GeForce GTX 1650 Super (Desktop), R9 5900X
20.9 (10.71min, 12.73P1 - 75.52max) fps -73%
Metro Exodus
1920x1080 Ultra Quality DXR AF:16x
MSI GeForce RTX 3090 Suprim X
NVIDIA GeForce RTX 3090, R9 5900X
116 (59.68min - 166.06max) fps +64%
Durchschnittliche NVIDIA GeForce RTX 3090
  (68.6 - 122.2, n=12)
111.4 fps +57%
MSI GeForce RTX 3080 Gaming X Trio
NVIDIA GeForce RTX 3080, R9 5900X
102 (54.36min - 150.53max) fps +44%
Durchschnittliche NVIDIA GeForce RTX 3080
  (91.5 - 102, n=2)
96.8 fps +37%
AMD Ryzen 9 5900X
NVIDIA Titan RTX, R9 5900X
87.9 (49.32min - 136.76max) fps +24%
AMD Radeon RX 6800 XT
AMD Radeon RX 6800 XT, R9 5950X
85.5 (52.71min - 120.38max) fps +21%
Zotac Gaming GeForce RTX 3070 Twin Edge
NVIDIA GeForce RTX 3070, R9 5950X
82.1 (47.4min - 134.03max) fps +16%
Durchschnittliche NVIDIA GeForce RTX 3070
  (80.4 - 83, n=5)
81.6 fps +15%
KFA2 GeForce RTX 2080 Ti EX
NVIDIA GeForce RTX 2080 Ti (Desktop), R9 3900X
78.6 (43min - 115max) fps +11%
NVIDIA GeForce RTX 3060 Ti FE
NVIDIA GeForce RTX 3060 Ti, R9 5950X
70.8 (38.7min - 118.79max) fps
Nvidia GeForce RTX 2080 Super
NVIDIA GeForce RTX 2080 Super (Desktop), R7 2700X
65 (37.62min - 97.62max) fps -8%
Durchschnittliche NVIDIA GeForce RTX 2080 Super (Desktop)
  ()
65 fps -8%
Durchschnittliche NVIDIA GeForce RTX 2070 Super (Desktop)
  (56.3 - 62.1, n=4)
58.5 fps -17%
Nvidia GeForce RTX 2070 Super
NVIDIA GeForce RTX 2070 Super (Desktop), R7 2700X
57.5 (34min - 85max) fps -19%
Durchschnittliche NVIDIA GeForce RTX 2060 Super (Desktop)
  (50 - 53.3, n=3)
51.1 fps -28%
Nvidia GeForce RTX 2060 Super
NVIDIA GeForce RTX 2060 Super (Desktop), R7 2700X
50.1 (30min - 72max) fps -29%
3840x2160 Ultra Quality AF:16x
MSI GeForce RTX 3090 Suprim X
NVIDIA GeForce RTX 3090, R9 5900X
76.3 (45.25min - 131.44max) fps +79%
Durchschnittliche NVIDIA GeForce RTX 3090
  (70.6 - 77.3, n=12)
75 fps +76%
MSI GeForce RTX 3080 Gaming X Trio
NVIDIA GeForce RTX 3080, R9 5900X
65.9 (38.48min - 122.03max) fps +54%
Durchschnittliche NVIDIA GeForce RTX 3080
  (64.1 - 65.9, n=2)
65 fps +52%
AMD Radeon RX 6800 XT
AMD Radeon RX 6800 XT, R9 5950X
56.3 (40.14min - 64.28max) fps +32%
AMD Ryzen 9 5900X
NVIDIA Titan RTX, R9 5900X
54.9 (34.88min - 89.73max) fps +29%
Durchschnittliche NVIDIA GeForce RTX 3070
  (48.3 - 49.7, n=5)
48.9 fps +15%
Zotac Gaming GeForce RTX 3070 Twin Edge
NVIDIA GeForce RTX 3070, R9 5950X
48.3 (29.65min - 105.2max) fps +13%
KFA2 GeForce RTX 2080 Ti EX
NVIDIA GeForce RTX 2080 Ti (Desktop), R9 3900X
47.5 (31min - 69max) fps +11%
NVIDIA GeForce RTX 3060 Ti FE
NVIDIA GeForce RTX 3060 Ti, R9 5950X
42.7 (25.98min - 91.32max) fps
Durchschnittliche NVIDIA GeForce RTX 2080 Super (Desktop)
  (40 - 40.4, n=2)
40.2 fps -6%
Nvidia GeForce RTX 2080 Super
NVIDIA GeForce RTX 2080 Super (Desktop), R7 2700X
40 (25.84min - 59.35max) fps -6%
Durchschnittliche NVIDIA GeForce RTX 2070 Super (Desktop)
  (35 - 38.1, n=5)
36.8 fps -14%
Nvidia GeForce RTX 2070 Super
NVIDIA GeForce RTX 2070 Super (Desktop), R7 2700X
35 (23min - 51max) fps -18%
Durchschnittliche NVIDIA GeForce RTX 2060 Super (Desktop)
  (29.7 - 32.2, n=4)
30.9 fps -28%
Nvidia GeForce RTX 2060 Super
NVIDIA GeForce RTX 2060 Super (Desktop), R7 2700X
29.7 (20min - 42max) fps -30%
AMD Radeon RX 5700 XT
AMD Radeon RX 5700 XT (Desktop), R7 2700X
29.6 (20.7min - 36.64max) fps -31%
KFA 2 GeForce GTX 1660 Super
NVIDIA GeForce GTX 1660 Super (Desktop), R9 3900X
21 (13min - 29max) fps -51%
KFA2 GeForce GTX 1650 Super EX One Click OC
NVIDIA GeForce GTX 1650 Super (Desktop), R9 5900X
16.1 (9.6min - 26.07max) fps -62%
2560x1440 Ultra Quality AF:16x
Durchschnittliche NVIDIA GeForce RTX 3090
  (102 - 118.2, n=12)
113.2 fps +71%
MSI GeForce RTX 3090 Suprim X
NVIDIA GeForce RTX 3090, R9 5900X
112 (58.69min - 182.42max) fps +69%
MSI GeForce RTX 3080 Gaming X Trio
NVIDIA GeForce RTX 3080, R9 5900X
97.4 (51.56min - 162.47max) fps +47%
Durchschnittliche NVIDIA GeForce RTX 3080
  (92.2 - 97.4, n=2)
94.8 fps +43%
AMD Radeon RX 6800 XT
AMD Radeon RX 6800 XT, R9 5950X
94.6 (55.44min - 143.68max) fps +43%
AMD Ryzen 9 5900X
NVIDIA Titan RTX, R9 5900X
84.9 (46.03min - 152.65max) fps +28%
Durchschnittliche NVIDIA GeForce RTX 3070
  (74.4 - 78.3, n=5)
75.8 fps +15%
Zotac Gaming GeForce RTX 3070 Twin Edge
NVIDIA GeForce RTX 3070, R9 5950X
75.4 (39.91min - 127.26max) fps +14%
KFA2 GeForce RTX 2080 Ti EX
NVIDIA GeForce RTX 2080 Ti (Desktop), R9 3900X
71.9 (40min - 108max) fps +9%
NVIDIA GeForce RTX 3060 Ti FE
NVIDIA GeForce RTX 3060 Ti, R9 5950X
66.2 (36.92min - 129.84max) fps
Durchschnittliche NVIDIA GeForce RTX 2080 Super (Desktop)
  (61 - 65, n=2)
63 fps -5%
Nvidia GeForce RTX 2080 Super
NVIDIA GeForce RTX 2080 Super (Desktop), R7 2700X
61 (35.51min - 95.82max) fps -8%
Durchschnittliche NVIDIA GeForce RTX 2070 Super (Desktop)
  (54.3 - 61.9, n=5)
57.6 fps -13%
AMD Radeon RX 5700 XT
AMD Radeon RX 5700 XT (Desktop), R7 2700X
54.5 (31.85min - 78.06max) fps -18%
Nvidia GeForce RTX 2070 Super
NVIDIA GeForce RTX 2070 Super (Desktop), R7 2700X
54.3 (32min - 83max) fps -18%
Durchschnittliche NVIDIA GeForce RTX 2060 Super (Desktop)
  (46 - 52.2, n=4)
49 fps -26%
Nvidia GeForce RTX 2060 Super
NVIDIA GeForce RTX 2060 Super (Desktop), R7 2700X
46.5 (28min - 69max) fps -30%
KFA 2 GeForce GTX 1660 Super
NVIDIA GeForce GTX 1660 Super (Desktop), R9 3900X
32 (19min - 47max) fps -52%
KFA2 GeForce GTX 1650 Super EX One Click OC
NVIDIA GeForce GTX 1650 Super (Desktop), R9 5900X
28.5 (16.88min - 51.46max) fps -57%
1920x1080 Ultra Quality AF:16x
Durchschnittliche NVIDIA GeForce RTX 3090
  (108 - 145, n=12)
135.3 fps +59%
MSI GeForce RTX 3090 Suprim X
NVIDIA GeForce RTX 3090, R9 5900X
132 (72.24min - 199.88max) fps +55%
MSI GeForce RTX 3080 Gaming X Trio
NVIDIA GeForce RTX 3080, R9 5900X
116 (56.76min - 185.19max) fps +37%
AMD Radeon RX 6800 XT
AMD Radeon RX 6800 XT, R9 5950X
115 (64.52min - 181.92max) fps +35%
Durchschnittliche NVIDIA GeForce RTX 3080
  (111 - 116, n=2)
113.5 fps +34%
AMD Ryzen 9 5900X
NVIDIA Titan RTX, R9 5900X
106 (52.66min - 176.55max) fps +25%
Durchschnittliche NVIDIA GeForce RTX 3070
  (91.3 - 97.7, n=5)
93.9 fps +11%
Zotac Gaming GeForce RTX 3070 Twin Edge
NVIDIA GeForce RTX 3070, R9 5950X
93.6 (45.01min - 161.08max) fps +10%
KFA2 GeForce RTX 2080 Ti EX
NVIDIA GeForce RTX 2080 Ti (Desktop), R9 3900X
89.7 (46min - 140max) fps +6%
NVIDIA GeForce RTX 3060 Ti FE
NVIDIA GeForce RTX 3060 Ti, R9 5950X
84.9 (43.89min - 144.89max) fps
Durchschnittliche NVIDIA GeForce RTX 2080 Super (Desktop)
  (76 - 82, n=2)
79 fps -7%
Nvidia GeForce RTX 2080 Super
NVIDIA GeForce RTX 2080 Super (Desktop), R7 2700X
76 (38.54min - 122.4max) fps -10%
Durchschnittliche NVIDIA GeForce RTX 2070 Super (Desktop)
  (67.8 - 79.1, n=5)
72.3 fps -15%
Nvidia GeForce RTX 2070 Super
NVIDIA GeForce RTX 2070 Super (Desktop), R7 2700X
67.8 (36min - 110max) fps -20%
Durchschnittliche NVIDIA GeForce RTX 2060 Super (Desktop)
  (58 - 67.4, n=4)
62.3 fps -27%
AMD Radeon RX 5700 XT
AMD Radeon RX 5700 XT (Desktop), R7 2700X
61 (36.09min - 86.1max) fps -28%
Nvidia GeForce RTX 2060 Super
NVIDIA GeForce RTX 2060 Super (Desktop), R7 2700X
58.9 (32min - 92max) fps -31%
KFA 2 GeForce GTX 1660 Super
NVIDIA GeForce GTX 1660 Super (Desktop), R9 3900X
41 (23min - 61max) fps -52%
KFA2 GeForce GTX 1650 Super EX One Click OC
NVIDIA GeForce GTX 1650 Super (Desktop), R9 5900X
36.6 (20.42min - 76.72max) fps -57%
Cyberpunk 2077 1.0
1920x1080 Ray Tracing Ultra Preset (DLSS off)
Durchschnittliche NVIDIA GeForce RTX 3090
  (59.6 - 65.4, n=2)
62.5 fps +73%
MSI GeForce RTX 3080 Gaming X Trio
NVIDIA GeForce RTX 3080, R9 5900X
56.6 (20.9min, 44.1P0.1, 48.3P1 - 98.2max) fps +56%
Durchschnittliche NVIDIA GeForce RTX 3080
  ()
56.6 fps +56%
Durchschnittliche NVIDIA GeForce RTX 3070
  (41.9 - 42.3, n=2)
42.1 fps +16%
Zotac Gaming GeForce RTX 3070 Twin Edge
NVIDIA GeForce RTX 3070, R9 5950X
41.9 (20.3min, 32.1P0.1, 35.3P1 - 74max) fps +16%
AMD Ryzen 9 5900X
NVIDIA Titan RTX, R9 5900X
40.4 fps +12%
NVIDIA GeForce RTX 3060 Ti FE
NVIDIA GeForce RTX 3060 Ti, R9 5950X
36.2 (20.3min, 29.8P0.1, 31.6P1 - 68.1max) fps
Durchschnittliche NVIDIA GeForce RTX 2080 Super (Desktop)
  ()
33 fps -9%
Durchschnittliche NVIDIA GeForce RTX 2070 Super (Desktop)
  ()
28.9 fps -20%
Durchschnittliche NVIDIA GeForce RTX 2060 Super (Desktop)
  ()
21.3 fps -41%
3840x2160 Ultra Preset
Durchschnittliche NVIDIA GeForce RTX 3090
  (41.5 - 45.3, n=2)
43.4 fps +80%
MSI GeForce RTX 3080 Gaming X Trio
NVIDIA GeForce RTX 3080, R9 5900X
38.9 (20.9min, 31.3P0.1, 34.3P1 - 86.6max) fps +61%
Durchschnittliche NVIDIA GeForce RTX 3080
  ()
38.9 fps +61%
AMD Ryzen 9 5900X
NVIDIA Titan RTX, R9 5900X
30.9 fps +28%
Durchschnittliche NVIDIA GeForce RTX 3070
  (26.6 - 27.9, n=2)
27.3 fps +13%
Zotac Gaming GeForce RTX 3070 Twin Edge
NVIDIA GeForce RTX 3070, R9 5950X
26.6 (19min, 20.8P0.1, 23.4P1 - 46.6max) fps +10%
NVIDIA GeForce RTX 3060 Ti FE
NVIDIA GeForce RTX 3060 Ti, R9 5950X
24.1 (16.8min, 19.8P0.1, 21.8P1 - 27.1max) fps
Durchschnittliche NVIDIA GeForce RTX 2080 Super (Desktop)
  ()
24.1 fps 0%
Durchschnittliche NVIDIA GeForce RTX 2070 Super (Desktop)
  ()
21.5 fps -11%
Durchschnittliche NVIDIA GeForce RTX 2060 Super (Desktop)
  (17.3 - 17.5, n=2)
17.4 fps -28%
KFA2 GeForce GTX 1650 Super EX One Click OC
NVIDIA GeForce GTX 1650 Super (Desktop), R9 5900X
7 fps -71%
2560x1440 Ultra Preset
Durchschnittliche NVIDIA GeForce RTX 3090
  (78.1 - 85.3, n=2)
81.7 fps +70%
MSI GeForce RTX 3080 Gaming X Trio
NVIDIA GeForce RTX 3080, R9 5900X
72.5 (22.2min, 46.6P0.1, 57.1P1 - 159max) fps +51%
Durchschnittliche NVIDIA GeForce RTX 3080
  ()
72.5 fps +51%
AMD Ryzen 9 5900X
NVIDIA Titan RTX, R9 5900X
58.4 fps +22%
Durchschnittliche NVIDIA GeForce RTX 3070
  (53.7 - 54.8, n=2)
54.3 fps +13%
Zotac Gaming GeForce RTX 3070 Twin Edge
NVIDIA GeForce RTX 3070, R9 5950X
53.7 (20min, 39.9P0.1, 45.2P1 - 102max) fps +12%
Durchschnittliche NVIDIA GeForce RTX 2080 Super (Desktop)
  ()
49.1 fps +2%
NVIDIA GeForce RTX 3060 Ti FE
NVIDIA GeForce RTX 3060 Ti, R9 5950X
48 (21.3min, 34.3P0.1, 41.9P1 - 94.6max) fps
Durchschnittliche NVIDIA GeForce RTX 2070 Super (Desktop)
  ()
43.7 fps -9%
Durchschnittliche NVIDIA GeForce RTX 2060 Super (Desktop)
  (35.3 - 35.7, n=2)
35.5 fps -26%
KFA2 GeForce GTX 1650 Super EX One Click OC
NVIDIA GeForce GTX 1650 Super (Desktop), R9 5900X
18 fps -62%
1920x1080 Ultra Preset
Durchschnittliche NVIDIA GeForce RTX 3090
  (108 - 109.7, n=2)
108.9 fps +48%
MSI GeForce RTX 3080 Gaming X Trio
NVIDIA GeForce RTX 3080, R9 5900X
103 (23.3min, 60.3P0.1, 75.7P1 - 176max) fps +40%
Durchschnittliche NVIDIA GeForce RTX 3080
  ()
103 fps +40%
AMD Ryzen 9 5900X
NVIDIA Titan RTX, R9 5900X
82.3 fps +12%
Durchschnittliche NVIDIA GeForce RTX 3070
  (80.6 - 81, n=2)
80.8 fps +10%
Zotac Gaming GeForce RTX 3070 Twin Edge
NVIDIA GeForce RTX 3070, R9 5950X
80.6 (19.6min, 58.2P0.1, 65.3P1 - 111max) fps +10%
NVIDIA GeForce RTX 3060 Ti FE
NVIDIA GeForce RTX 3060 Ti, R9 5950X
73.6 (21.2min, 53.8P0.1, 61.6P1 - 102max) fps
Durchschnittliche NVIDIA GeForce RTX 2080 Super (Desktop)
  ()
72.1 fps -2%
Durchschnittliche NVIDIA GeForce RTX 2070 Super (Desktop)
  ()
65.4 fps -11%
Durchschnittliche NVIDIA GeForce RTX 2060 Super (Desktop)
  (52.1 - 54.2, n=2)
53.2 fps -28%
KFA2 GeForce GTX 1650 Super EX One Click OC
NVIDIA GeForce GTX 1650 Super (Desktop), R9 5900X
30 fps -59%
min. mittel hoch max.QHD4K
The Witcher 3 (2015) 479 342 218 109 81.3
Shadow of the Tomb Raider (2018) 185 157 153 145 103 56
Forza Horizon 4 (2018) 246 200 196 173 150 103
Assassin´s Creed Odyssey (2018) 142 121 104 75 65 45
Battlefield V (2018) 181 145 124 114 97.9 64.9
Far Cry New Dawn (2019) 123 111 108 99 94 65
Metro Exodus (2019) 193 139 105 84.9 66.2 42.7
The Division 2 (2019) 225 172 142 109 77.3 43.7
Anno 1800 (2019) 134 135 94.1 54.2 40.6 34.4
Total War: Three Kingdoms (2019) 367.4 195.6 127.3 92.8 59 28.8
Control (2019) 240 147 110 71.9 36.1
Borderlands 3 (2019) 172 149 118 96 70.2 38.4
Red Dead Redemption 2 (2019) 170 154 108 69.9 57.3 37.5
Doom Eternal (2020) 508 320 283 274 219 122
Gears Tactics (2020) 332.3 208.8 162.4 128.9 91.9 49.4
F1 2020 (2020) 369 252 174 135 80
Horizon Zero Dawn (2020) 181 139 122 109 92 53
Mafia Definitive Edition (2020) 159 130 124 90.1 49.7
FIFA 21 (2020) 242 247 230
Watch Dogs Legion (2020) 124 122 109 76.6 59.1 33
Assassin´s Creed Valhalla (2020) 126 95 81 74 60 40
Call of Duty Black Ops Cold War (2020) 243 133 123 110 82.1 44.9
Immortals Fenyx Rising (2020) 166 119 110 101 84 57
Cyberpunk 2077 1.0 (2020) 122 101 85.2 73.6 48 24.1

Emissionen

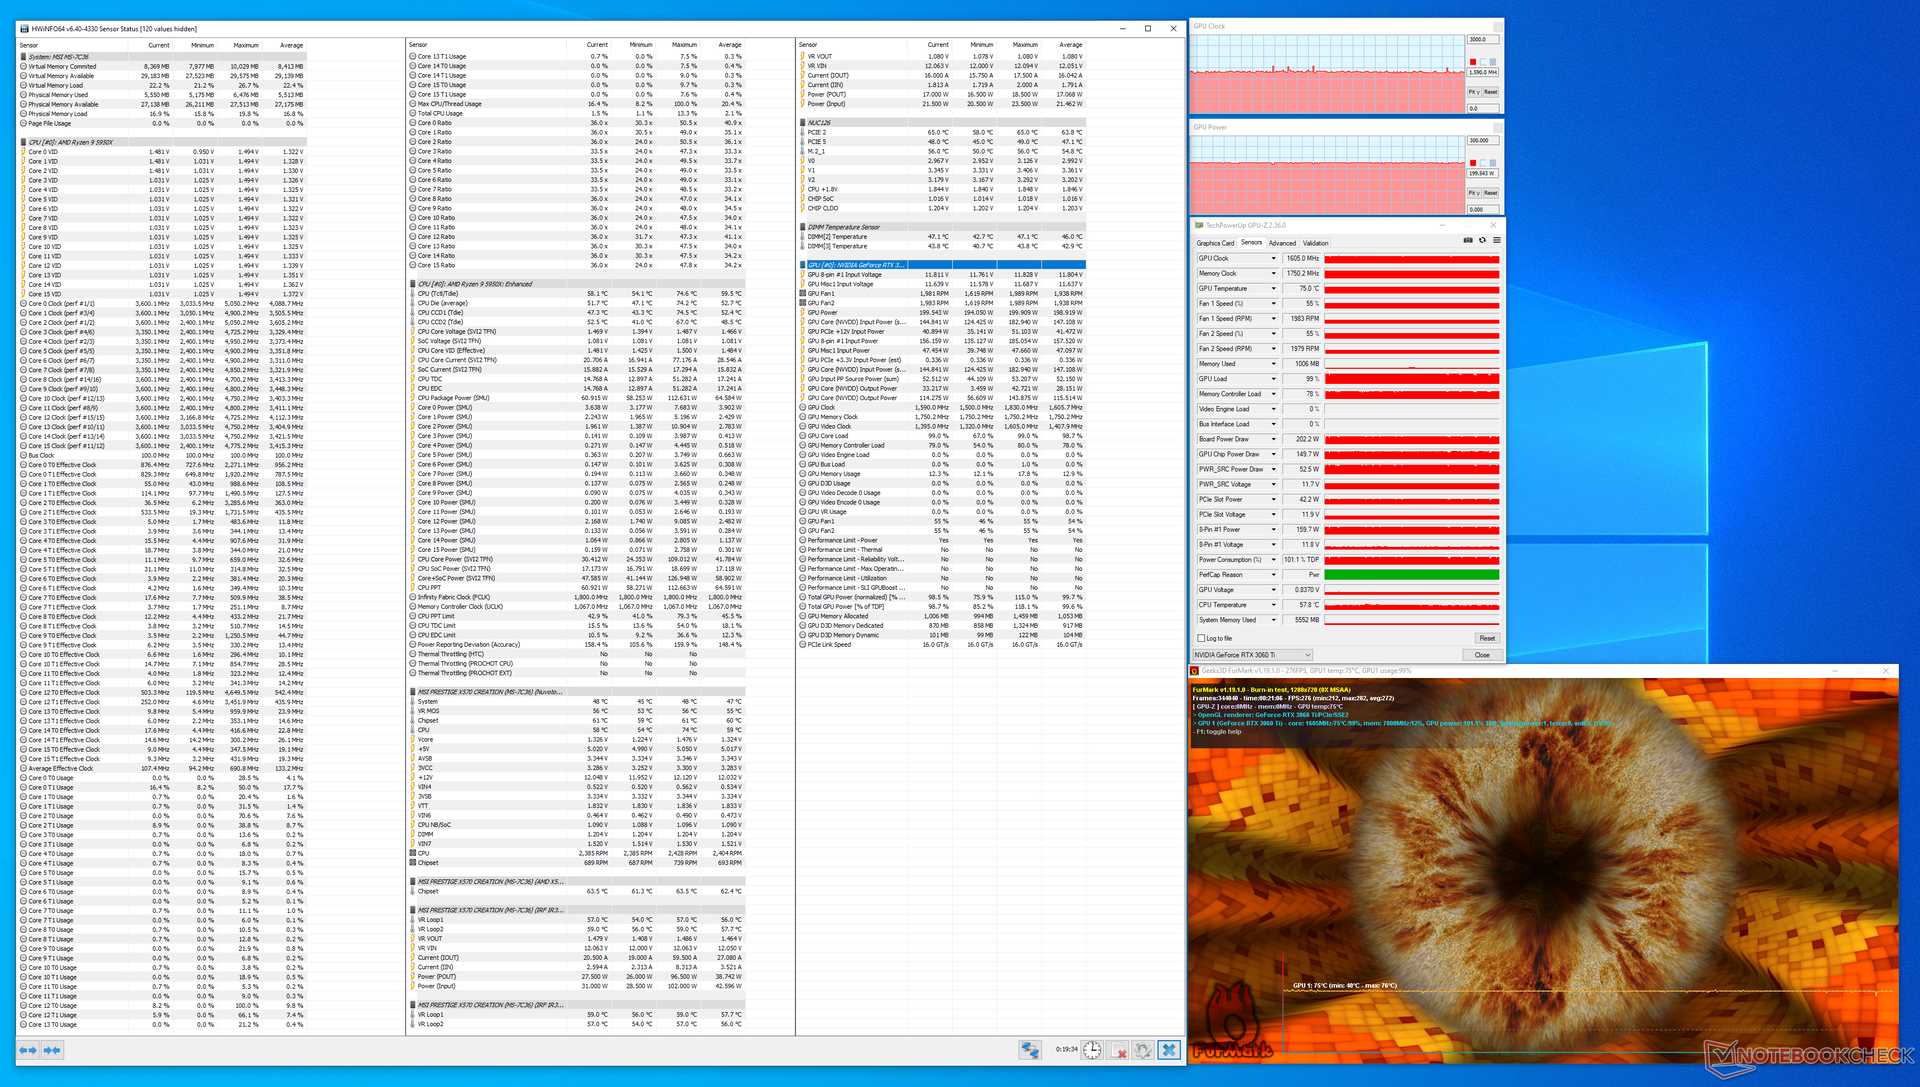
Dank NVIDIAs verbessertem Kühlerdesign verhält sich die RTX 3060 Ti FE auch unter Stress sehr gut. Während des FurMark-Stresstests konnten wir beobachten, dass der GPU-Kern konstant 75 °C hält und die Leistungsaufnahme des Boards bei der Nenn-TGP von 200 W liegt.

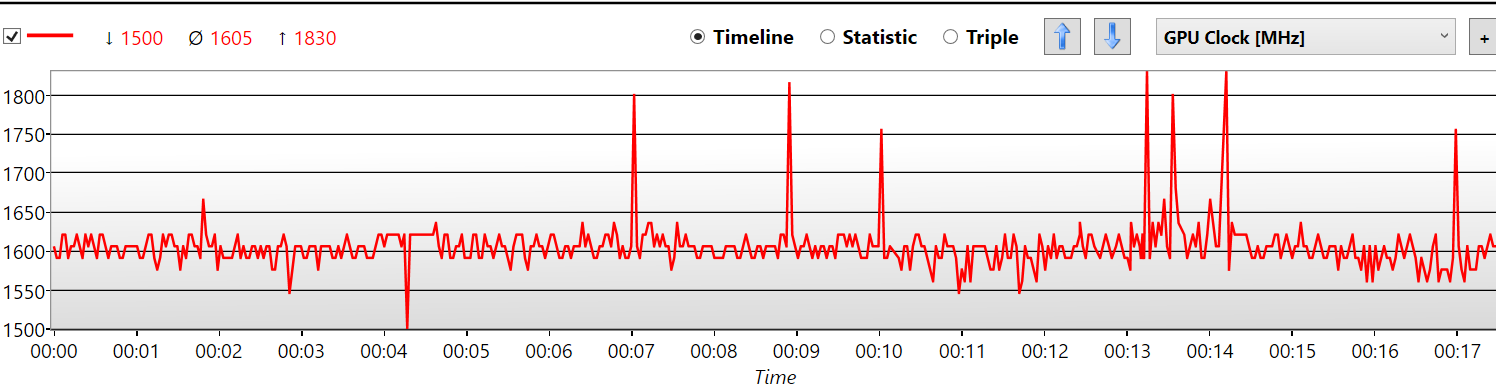
Während des größten Teils des Stresstests arbeitet die RTX 3060 Ti FE in der Nähe ihres Nenn-Boost-Taktes von 1.665 MHz, obwohl wir gelegentliche Spitzen bis zu 1.830 MHz beobachten.

Mit FurMark-Stress haben wir die Temperatur- und Geräuschpegel ermittelt. Die Gesamtleistungsaufnahme des Systems wurde während des Stressens mit FurMark und dem Preset The Witcher 3 bei 1080p Ultra gemessen.

FurMark Belastung
FurMark Belastung
GPU-Boost-Takte während FurMark-Stress

Temperatur

NVIDIA RTX 3060 Ti FE Heatmap

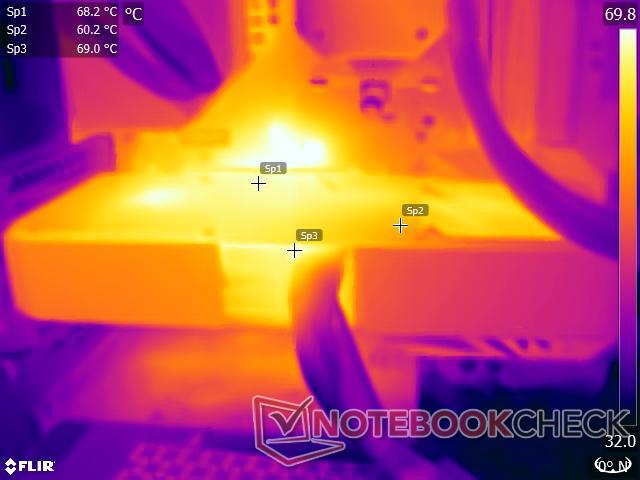
Während NVIDIAs neues Kühlsystem ausreichend Leistung bietet, um die Karte vor Throttling zu bewahren, neigt die Karte selbst dazu, unter Last sehr warm zu werden. Während des FurMark-Stresstests konnten wir beobachten, dass die Oberflächentemperaturen im Bereich der GPU und der Stromanschlüsse nahe der 70 °C-Marke lagen.

Dies ist zu erwarten, da der GPU-Kern selbst unter Last bis zu 75 °C erreichen kann und die metallische Konstruktion nur dazu dient, einen großen Teil dieser Wärme an die Oberfläche abzugeben.

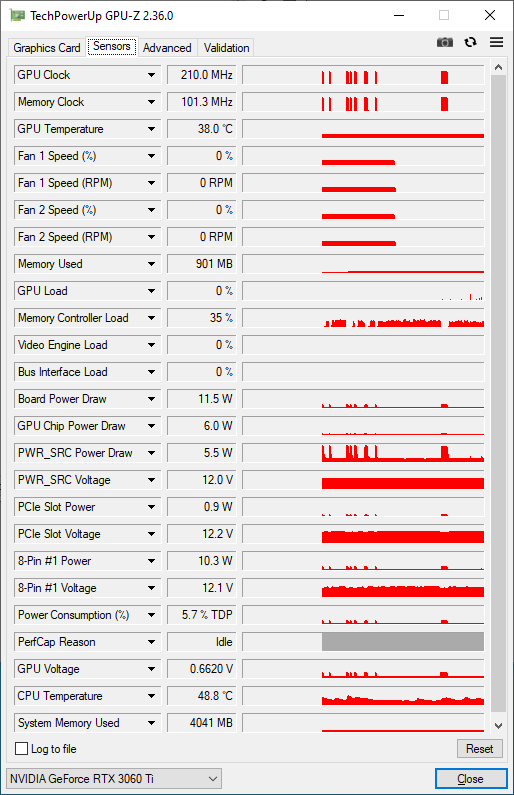
Der Bereich in der Nähe des hinteren Lüfterauslasses ist mit 60 °C ebenfalls recht warm, wie Sie auf der Heatmap sehen können. Abgesehen davon läuft die GPU im Leerlauf zwischen 38 °C und 42 °C. In dieser Zeit stehen die Lüfter komplett still.
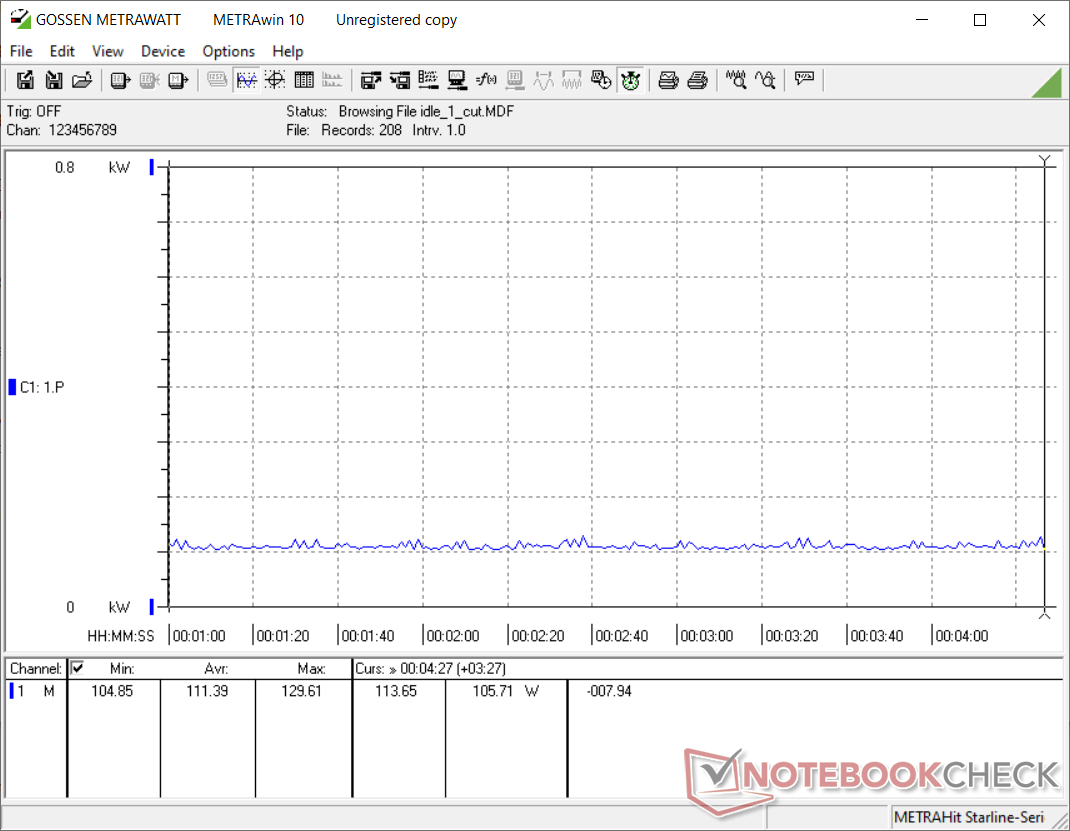
Leistungsaufnahme

Unser Testsystem verbraucht etwa 111 W im Leerlauf, wobei alle RGB-Beleuchtungen ausgeschaltet sind und insgesamt fünf Lüfter (drei Corsair SP 120-mm-Gehäuselüfter und zwei Corsair ML 120-mm-Radiatorlüfter) und die Elite Capellix AIO-Pumpe im Profil "Ausbalanciert" laufen.

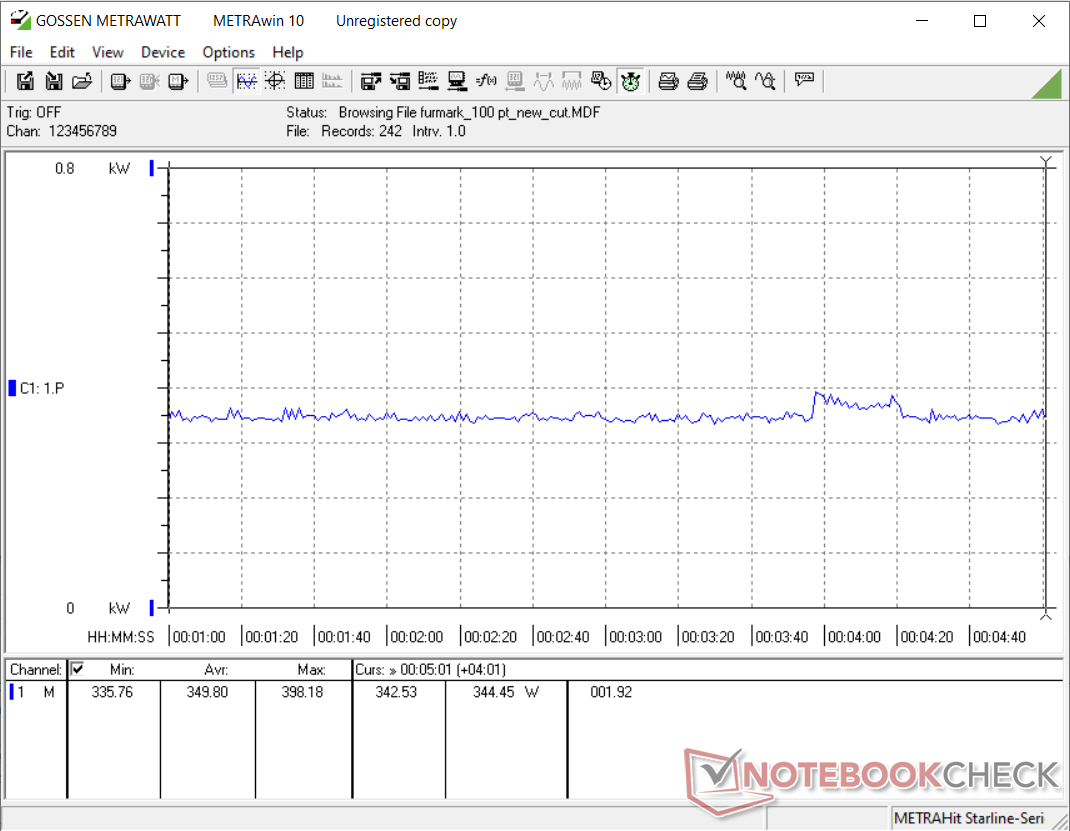
Wir beobachteten eine durchschnittliche Gesamtleistungsaufnahme des Systems von 350 W und 379 W während des FurMark- bzw. The Witcher 3 Ultra-Stresstests.

Wie in den Stromverbrauchsgrafiken unten zu sehen ist, wird ein leichter Anstieg des Stromverbrauchs nahe der 4-Minuten-Marke beobachtet. Dies könnte auf die kurzzeitige Erhöhung des Boost-Taktes zurückzuführen sein, die wir zuvor beschrieben haben.

Insgesamt ist die RTX 3060 Ti FE im Vergleich zur durchschnittlichen RTX 2080 Super in Bezug auf die Leistungsaufnahme mehr oder weniger sparsam.

Systemleistungsaufnahme - Leerlauf
Systemleistungsaufnahme - FurMark-Stress
Systemleistungsaufnahme - The Witcher 3 1080p Ultra preset
Power Consumption
1280x720 FurMark 1.19 GPU Stress Test (external Monitor)
MSI GeForce RTX 3090 Suprim X
NVIDIA GeForce RTX 3090, R9 5900X (Idle: 105.9 W)
551 (521min - 582max) Watt * -57%
Durchschnittliche NVIDIA GeForce RTX 3080
  (Idle: 492 - 505, n=2 W)
499 Watt * -43%
MSI GeForce RTX 3080 Gaming X Trio
NVIDIA GeForce RTX 3080, R9 5900X (Idle: 103 W)
492 (485min - 514max) Watt * -41%
Durchschnittliche NVIDIA GeForce RTX 3090
  (Idle: 281 - 551, n=8 W)
469 Watt * -34%
AMD Radeon RX 6800 XT
AMD Radeon RX 6800 XT, R9 5950X (Idle: 99.5 W)
447.9 (413min - 484max) Watt * -28%
KFA2 GeForce RTX 2080 Ti EX
NVIDIA GeForce RTX 2080 Ti (Desktop), R9 3900X (Idle: 100.5 W)
400.8 (354min - 432max) Watt * -15%
Zotac Gaming GeForce RTX 3070 Twin Edge
NVIDIA GeForce RTX 3070, R9 5950X (Idle: 114.96 W)
393 (384min, 385P1 - 406max) Watt * -12%
Zotac Gaming GeForce RTX 3070 Twin Edge
NVIDIA GeForce RTX 3070, R9 5950X (Idle: 114.96 W)
375 (365min, 366P1 - 421max) Watt * -7%
Nvidia GeForce RTX 2080 Super
NVIDIA GeForce RTX 2080 Super (Desktop), R7 2700X (Idle: 78.87 W)
376.8 (331min - 409max) Watt * -8%
Durchschnittliche NVIDIA GeForce RTX 2080 Super (Desktop)
  (Idle: 328 - 414, n=4 W)
362 Watt * -3%
NVIDIA GeForce RTX 3060 Ti FE
NVIDIA GeForce RTX 3060 Ti, R9 5950X (Idle: 111.39 W)
350 (336min, 336P1 - 398max) Watt *
Durchschnittliche NVIDIA GeForce RTX 3070
  (Idle: 281 - 393, n=6 W)
348 Watt * +1%
Durchschnittliche NVIDIA GeForce RTX 2070 Super (Desktop)
  (Idle: 280 - 358, n=6 W)
329 Watt * +6%
AMD Radeon RX 5700 XT
AMD Radeon RX 5700 XT (Desktop), R7 2700X (239 fps, Idle: 69.8 W)
326.6 (313min - 351max) Watt * +7%
Nvidia GeForce RTX 2070 Super
NVIDIA GeForce RTX 2070 Super (Desktop), R7 2700X (283 fps, Idle: 80.5 W)
326 (315min - 348max) Watt * +7%
Durchschnittliche NVIDIA GeForce RTX 2060 Super (Desktop)
  (Idle: 235 - 315, n=5 W)
290 Watt * +17%
Nvidia GeForce RTX 2060 Super
NVIDIA GeForce RTX 2060 Super (Desktop), R7 2700X (237 fps, Idle: 77.12 W)
281.4 (275min - 321max) Watt * +20%
KFA 2 GeForce GTX 1660 Super
NVIDIA GeForce GTX 1660 Super (Desktop), R9 3900X (Idle: 84.76 W)
247.6 (241min - 322max) Watt * +29%
KFA2 GeForce GTX 1650 Super EX One Click OC
NVIDIA GeForce GTX 1650 Super (Desktop), R9 5900X (Idle: 86.5 W)
228.7 (223min - 271max) Watt * +35%
1920x1080 The Witcher 3 ultra (external Monitor)
MSI GeForce RTX 3090 Suprim X
NVIDIA GeForce RTX 3090, R9 5900X (Idle: 105.9 W)
597 (577min - 618max) Watt * -58%
Durchschnittliche NVIDIA GeForce RTX 3090
  (Idle: 464 - 597, n=17 W)
524 Watt * -38%
AMD Radeon RX 6800 XT
AMD Radeon RX 6800 XT, R9 5950X (Idle: 99.5 W)
505 (389min - 543max) Watt * -33%
Durchschnittliche NVIDIA GeForce RTX 3080
  (Idle: 498 - 505, n=2 W)
502 Watt * -32%
MSI GeForce RTX 3080 Gaming X Trio
NVIDIA GeForce RTX 3080, R9 5900X (Idle: 103 W)
498.3 (487min - 523max) Watt * -31%
AMD Ryzen 9 5900X
NVIDIA Titan RTX, R9 5900X (Idle: 78.1 W)
439.6 (419min - 497max) Watt * -16%
KFA2 GeForce RTX 2080 Ti EX
NVIDIA GeForce RTX 2080 Ti (Desktop), R9 3900X (Idle: 100.5 W)
438.8 (431min - 463max) Watt * -16%
Zotac Gaming GeForce RTX 3070 Twin Edge
NVIDIA GeForce RTX 3070, R9 5950X (Idle: 114.96 W)
406 (397min, 399P1 - 421max) Watt * -7%
Durchschnittliche NVIDIA GeForce RTX 3070
  (Idle: 317 - 550, n=5 W)
401 Watt * -6%
Nvidia GeForce RTX 2080 Super
NVIDIA GeForce RTX 2080 Super (Desktop), R7 2700X (Idle: 78.87 W)
382.8 (360min - 410max) Watt * -1%
NVIDIA GeForce RTX 3060 Ti FE
NVIDIA GeForce RTX 3060 Ti, R9 5950X (Idle: 111.39 W)
379 (270min, 364P1 - 409max) Watt *
Durchschnittliche NVIDIA GeForce RTX 2080 Super (Desktop)
  (Idle: 336 - 416, n=5 W)
363 Watt * +4%
AMD Radeon RX 5700 XT
AMD Radeon RX 5700 XT (Desktop), R7 2700X (Idle: 69.8 W)
348.7 (341min - 359max) Watt * +8%
Nvidia GeForce RTX 2070 Super
NVIDIA GeForce RTX 2070 Super (Desktop), R7 2700X (96.8 fps, Idle: 80.5 W)
344.7 (335min - 370max) Watt * +9%
Durchschnittliche NVIDIA GeForce RTX 2070 Super (Desktop)
  (Idle: 296 - 377, n=6 W)
342 Watt * +10%
Durchschnittliche NVIDIA GeForce RTX 2060 Super (Desktop)
  (Idle: 246 - 331, n=5 W)
304 Watt * +20%
Nvidia GeForce RTX 2060 Super
NVIDIA GeForce RTX 2060 Super (Desktop), R7 2700X (82.7 fps, Idle: 77.12 W)
298.2 (293min - 322max) Watt * +21%
KFA 2 GeForce GTX 1660 Super
NVIDIA GeForce GTX 1660 Super (Desktop), R9 3900X (Idle: 84.76 W)
260.4 (255min - 277max) Watt * +31%
KFA2 GeForce GTX 1650 Super EX One Click OC
NVIDIA GeForce GTX 1650 Super (Desktop), R9 5900X (Idle: 86.5 W)
240.7 (237min - 247max) Watt * +36%

* ... kleinere Werte sind besser
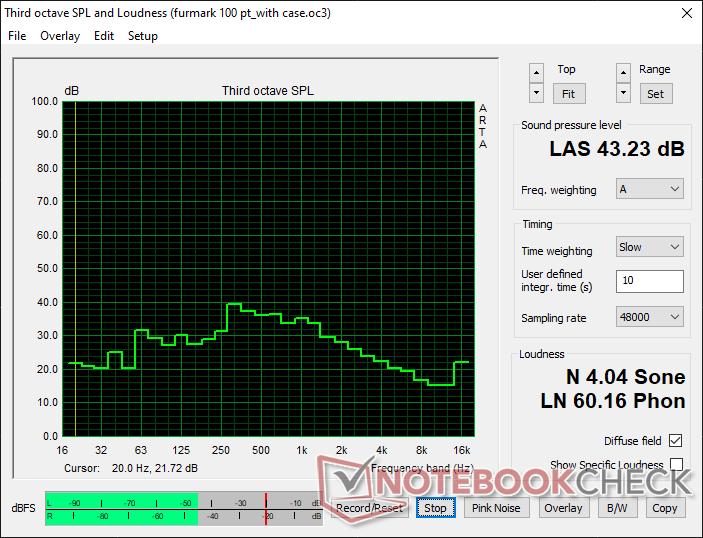
Geräuschpegel

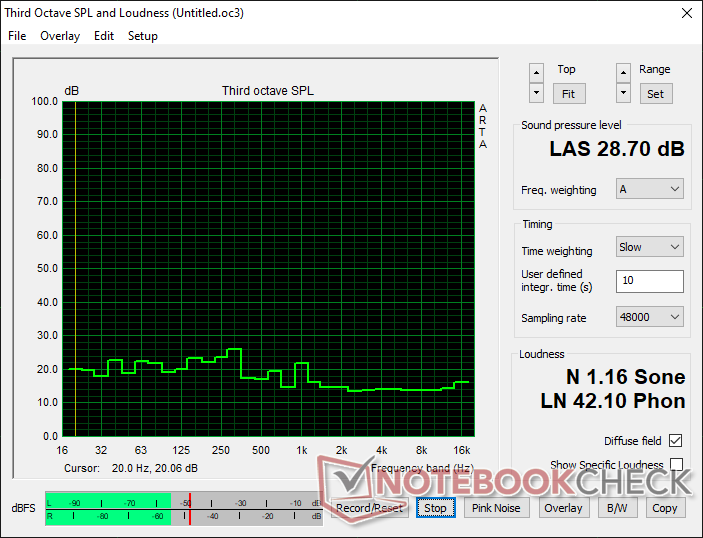
Eine der Annehmlichkeiten von NVIDIAs neuem Kühlmechanismus ist, dass der Geräuschpegel der Lüfter gut unter Kontrolle gehalten wird.

Da NVIDIA bei den Ampere-FE-Karten einen kompletten Lüfter-Stopp-Modus implementiert hat, entspricht der Schalldruckpegel (SPL) im Leerlauf mit 28,70 db(A) in einem Abstand von 20 cm zum geschlossenen Gehäuse in etwa dem Umgebungswert.

Während des FurMark-Stresstests steigt der SPL auf 43,23 db(A) an, was vor allem bei geschlossenem Gehäuse sehr gut tolerierbar ist. Ein weiteres Tuning der Lüfterkurve ist mit Hilfe von Drittanbieter-Programmen wie MSI Afterburner möglich.

Geräuschpegel - Leerlauf mit ausgeschalteten Gehäuselüftern
Geräuschpegel - FurMark-Stress bei ausgeschalteten Gehäuselüftern

Pro

+ Robuste Metallkonstruktion
+ Hochwertige Optik
+ Metall-backplate
+ Performance gleichauf oder leicht höher als bei der RTX 2080 Super
+ Unterstützung von Raytracing und DLSS 2.0 in kompatiblen Spielen
+ Anständige Leistung in professionellen 3D-Programmen
+ Minimale Frame-Einbrüche im Dauerstress
+ Vollständiger Lüfterstopp im Leerlauf
+ Wenig Geräuschentwicklung unter Stress

Contra

- 12-Pin-Stecker fühlt sich redundant an
- Begrenzte Übertaktungsmöglichkeiten
- Nur 8 GB VRAM
- Höhere Oberflächentemperaturen unter Last
- Stromverbrauch nur geringfügig besser als bei der RTX 2080 Super
- Sehr begrenzter Vorrat

Fazit

NVIDIA GeForce RTX 3060 Ti Founders Edition. Testgerät zur Verfügung gestellt von NVIDIA Indien

Die NVIDIA GeForce RTX 3060 Ti Founders Edition macht Vieles richtig. Die Karte sieht hochwertig aus und fühlt sich auch so an. Sie ist gut verarbeitet und nimmt eine relativ kompakte 2-Slot-Fläche ein. Das einzige Ärgernis ist der zentral angeordnete 12-polige Stromanschluss, der keine zusätzliche Funktionalität bietet, sondern das Kabelmanagement umständlich macht.

NVIDIAs neuer Kühlmechanismus mit kompletter Lüfterabschaltung bietet einen wichtigen Vorteil, wodurch die Founders Edition ein besonders gutes Schnäppchen im Vergleich zu Add-in-Board (AiB) Varianten darstellt. Wir beobachteten eine reduzierte Leistungsaufnahme (wenn auch nur marginal) im Vergleich zur RTX 2080 Super zusammen mit einem überschaubaren Geräuschpegel unter Last, was eine willkommene Entwicklung ist.

Die NVIDIA GeForce RTX 3060 Ti Founders Edition bietet die Leistung der RTX 2080 Super für 399,99 US-Dollar. Sie hätte das Potenzial, eine der beliebtesten GPUs dieser Generation zu werden, aber anhaltende Lieferengpässe dämpfen weiterhin die Aussichten...

Die RTX 3060 Ti FE sollte Ihre Karte sein, wenn Sie hauptsächlich mit 1080p Ultra und QHD Ultra Auflösungen spielen. Flüssiges 4K-Gaming ist mit ein paar visuellen Optimierungen definitiv möglich. Die Verbesserungen bei der Raytracing (RT) Leistung gegenüber der RTX 2080 Super sind nicht sehr signifikant.

Die Karte ist auch zu einer anständigen Rechen- und 3D-Modellierungsleistung fähig, ist aber nicht wirklich für professionelle CAD/CAM-, Medizin-, Automobil- oder Energie-Workflows geeignet.

NVIDIA hat es geschafft, die RTX 2080 Super-Performance für 300 US-Dollar weniger und mit einem 50 W niedrigeren TGP anzubieten. Diejenigen, die eine GTX 1070 hatten, werden feststellen, dass die RTX 3060 Ti FE das beste Schnäppchen zu MSRP-Preisen bietet. Käufer, die ihr Budget ein wenig erweitern können, sollten jedoch auch einen Blick auf die RTX 3070 FE werfen, wenn diese für 499 US$ MSRP zu haben ist.

Preis und Verfügbarkeit

Die Verfügbarkeit der NVIDIA GeForce RTX 3060 Ti Founders Edition, einschließlich derer von Partnerkarten, ist zum Zeitpunkt der Erstellung dieses Testberichts ungewiss. Derzeit ist diese Karte nur bei Best Buy mit einem UVP von 399,99 US-Dollar (etwa 330 Euro) gelistet. Es überrascht nicht, dass sie zum Zeitpunkt der Veröffentlichung komplett ausverkauft ist. Wir empfehlen jedoch, den angegebenen Link im Auge zu behalten, da die Bestände voraussichtlich regelmäßig aufgefüllt werden.

Preisvergleich

static version load dynamic
Loading Comments
Diesen Artikel kommentieren / Antworten
Teilen Sie diesen Artikel, um uns zu unterstützen. Jeder Link hilft!
> Notebook Test, Laptop Test und News > Tests > Notebook Testberichte > NVIDIA GeForce RTX 3060 Ti Founders Edition im Test: 1440p-Ultra und 4K-Gaming für 400 US-Dollar
Autor: Vaidyanathan Subramaniam,  9.02.2021 (Update: 21.07.2022)