Notebookcheck Logo

NVIDIA GeForce RTX 3080 Ti Founders Edition Test: Günstigere RTX-3090-Leistung, aber immer noch ein Angebot von geringem Wert

Verbandelt mit der 3090. Die NVIDIA GeForce RTX 3080 Ti kommt als Mid-Cycle-Refresh, um die RTX 3080 als schnellste Gaming-GPU des Unternehmens abzulösen, neun Monate nachdem das Unternehmen die Ampere-Architektur eingeführt hat. Die RTX 3080 Ti verfügt über eine leicht abgespeckte Variante der GA102-GPU, die in der RTX 3090 zu finden ist, mit der Hälfte des VRAM. Wir nehmen die RTX 3080 Ti FE auf eine Testfahrt mit und bewerten, wie sich die 1.199 US-Dollar teure Karte gegen die RTX 3080 und die AMD Radeon RX 6900 XT schlägt.

NVIDIA hat dieNVIDIA launches RTX 3080 Ti — a scaled-down RTX 3090, for US$1,199 and RTX 3070 Ti for US$599 GeForce RTX 3080 Ti während der Computex 2021 letzten Monat neben der RTX 3070 Ti vorgestellt. Die RTX 3080 Ti ist eine leicht abgespeckte Version der "BFGPU" RTX 3090 und ist eher eine Auffrischung in der Mitte des Zyklus als etwas Revolutionäres. Im Wesentlichen handelt es sich um einen besser gebinnten Ampere-GA102-Chip als die RTX 3080.

Die RTX 3080 Ti löst nun die RTX 3080 als NVIDIAs Flaggschiff-Gaming-GPU ab. Sie kommt zu einer Zeit, in der die Verfügbarkeit von GPUs immer noch ein Problem darstellt, da die meisten Karten schnell ausverkauft sind und einen deutlichen Aufschlag auf den UVP haben. Die RTX 3080 Ti kann auch als NVIDIAs Antwort auf das wiedererstarkte AMD gesehen werden, das mit der Einführung der RDNA-2-basierten GPUs sein Mojo wiedergefunden zu haben scheint. Die Radeon RX 6900 XT kommt in mehreren Titeln in Schlagdistanz zur RTX 3090, was bedeutet, dass Gamer für ein Flaggschiff-Gaming-Erlebnis nicht allein zu NVIDIA aufschauen müssen, solange die Raytracing-Leistung nicht das Hauptkaufkriterium ist.

Obwohl sie zwischen der RTX 3080 und der RTX 3090 positioniert ist, lehnt sich die RTX 3080 Ti mehr an das Leistungsniveau der RTX 3090 an und ist dementsprechend mit einer UVP von 1.199 US-Dollar bepreist. Dies ist zwar 300 US-Dollar weniger als die UVP der RTX 3090 (1.499 US-Dollar), aber auch 500 US-Dollar teurer als die RTX 3080 (699 US-Dollar). In Indien wird die RTX 3080 Ti Founders Edition (FE) für 1.22.000 Indische Rupien verkauft.

In diesem Test prüfen wir die RTX 3080 Ti Founders Edition auf Herz und Nieren und sehen, wie gut dieses Mid-Cycle-Refresh für Gamer geeignet ist, die eine neue GPU kaufen möchten.

Vergleich der RTX 3080 Ti mit anderen NVIDIA GPUs

Specification RTX 3090 FE RTX 3080 Ti FE RTX 3080 FE RTX 3070 FE RTX 3060 Ti FE Titan RTX RTX 2080 Ti TITAN X Pascal
Chip GA102 GA102 GA102 GA104 GA104 TU102 TU102 GP102
FinFET-Prozess 8 nm 8 nm 8 nm 8 nm 8 nm 12 nm 12 nm 16 nm
CUDA cores 10,496 10,240 8,704 5,888 4,864 4,608 4,352 3,584
Texture units 328 320 272 184 152 288 272 224
Tensor-Kerne 328 3rd Gen. 320 3rd Gen. 272 3rd Gen. 184 3rd Gen. 152 3rd Gen. 576 2nd Gen. 544 2nd Gen.
RT-Kerne 82 80 68 46 38 72 68
GPU Basistakt 1,395 MHz 1,365 MHz 1,440 MHz 1,500 MHz 1,410 MHz 1,350 MHz 1,350 MHz 1,417 MHz
GPU Boost-Takt 1,695 MHz 1,665 MHz 1,710 MHz 1,750 MHz 1,665 MHz 1,770 MHz 1,545 MHz 1,531 MHz
Memory bus 384-bit 384-bit 320-bit 256-bit 256-bit 384-bit 352-bit 384-bit
Speicherbandbreite 936 GB/s 912 GB/s 760 GB/s 448 GB/s 448 GB/s 672 GB/s 616 GB/s 480.4 GB/s
Videospeicher 24 GB GDDR6X 12 GB GDDR6X 10 GB GDDR6X 8 GB GDDR6 8 GB GDDR6 24 GB GDDR6 11 GB GDDR6 12 GB GDDR5X
Leistungsaufnahme 350 W 350 W 320 W 220 W 200 W 280 W 250 W 250 W

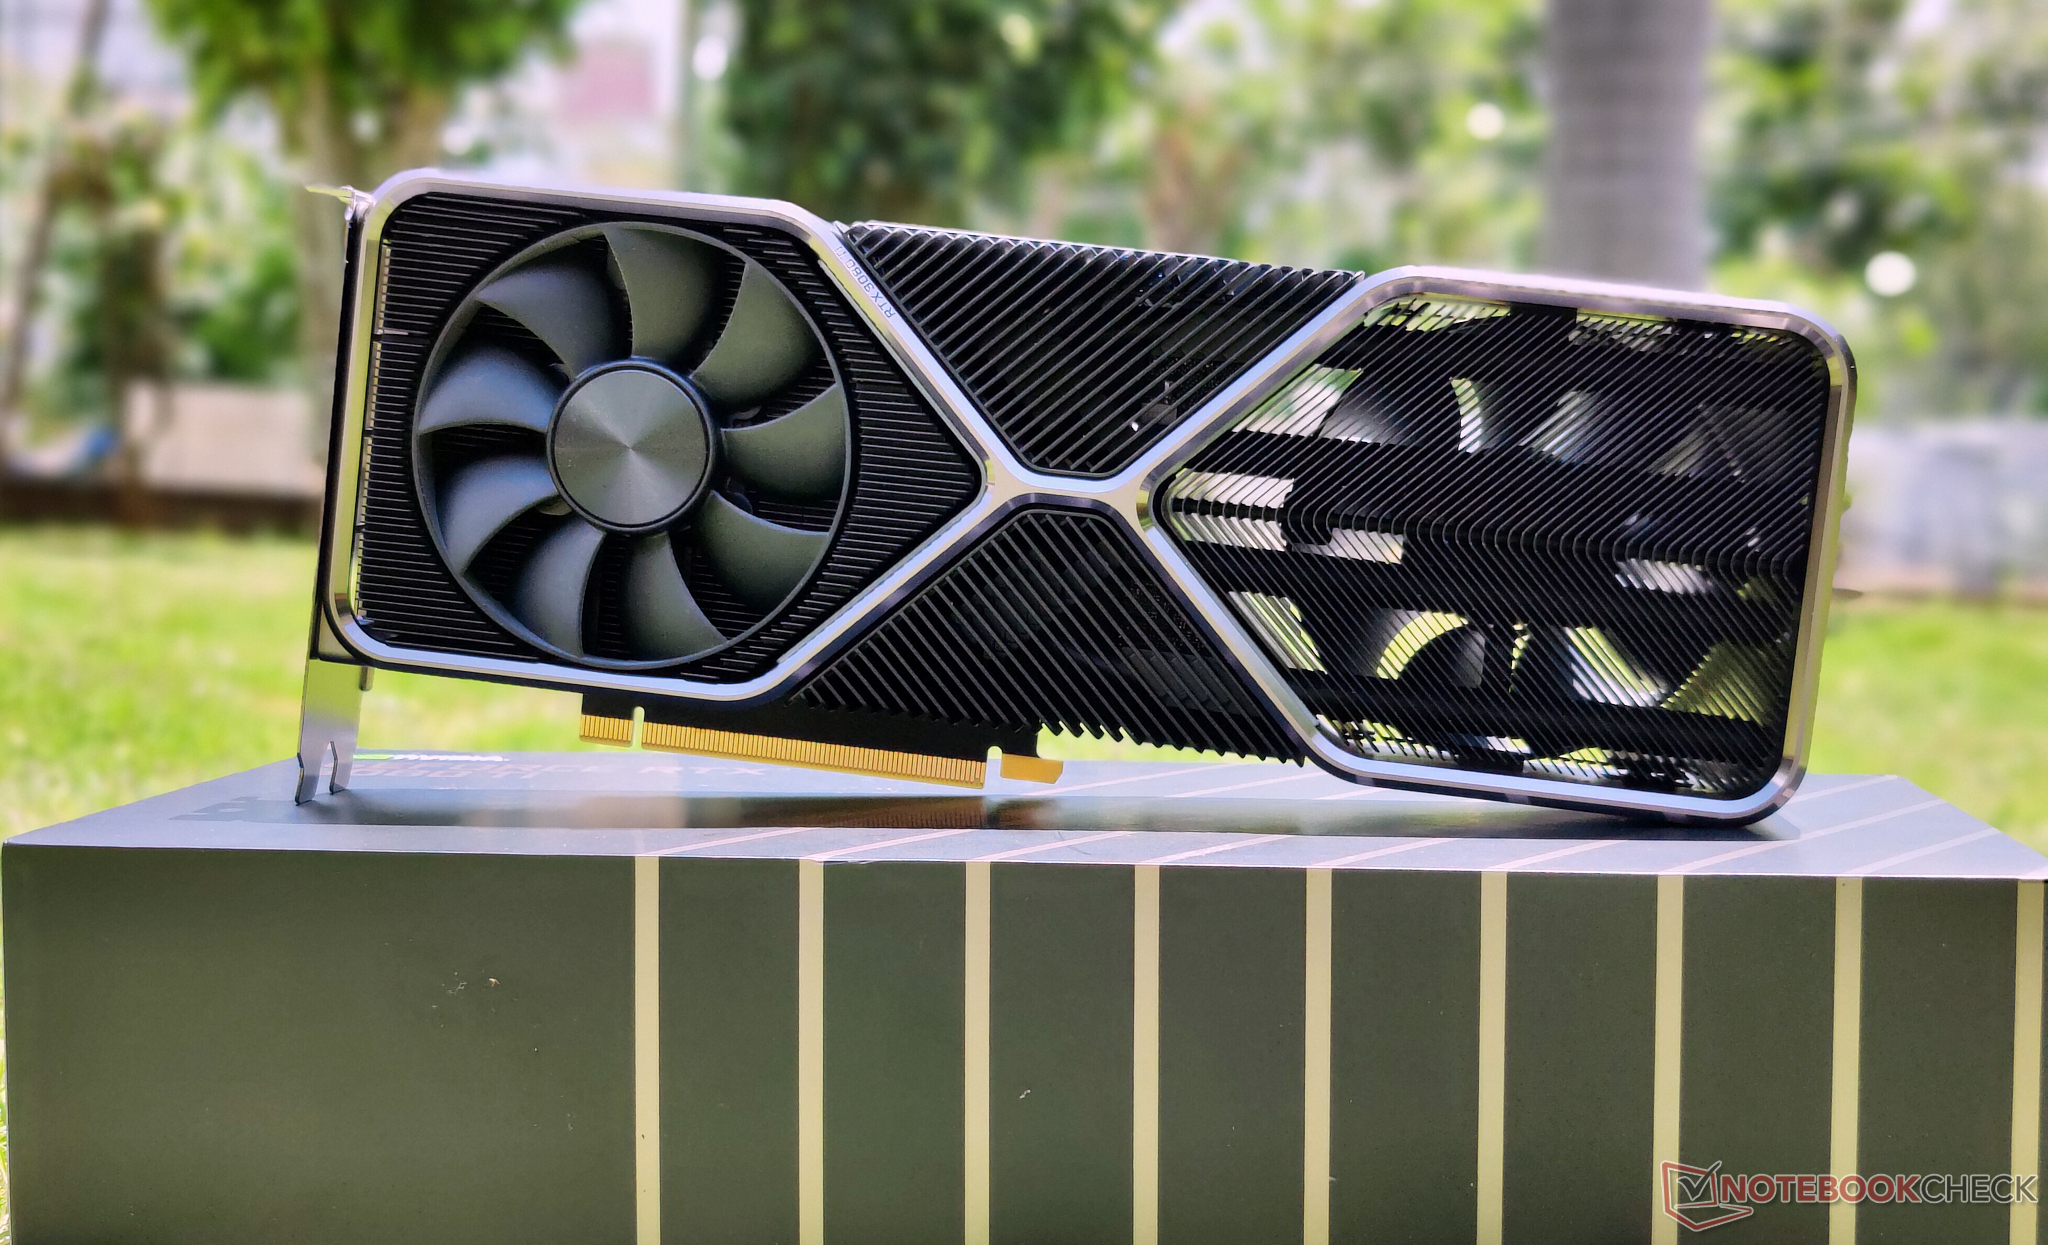
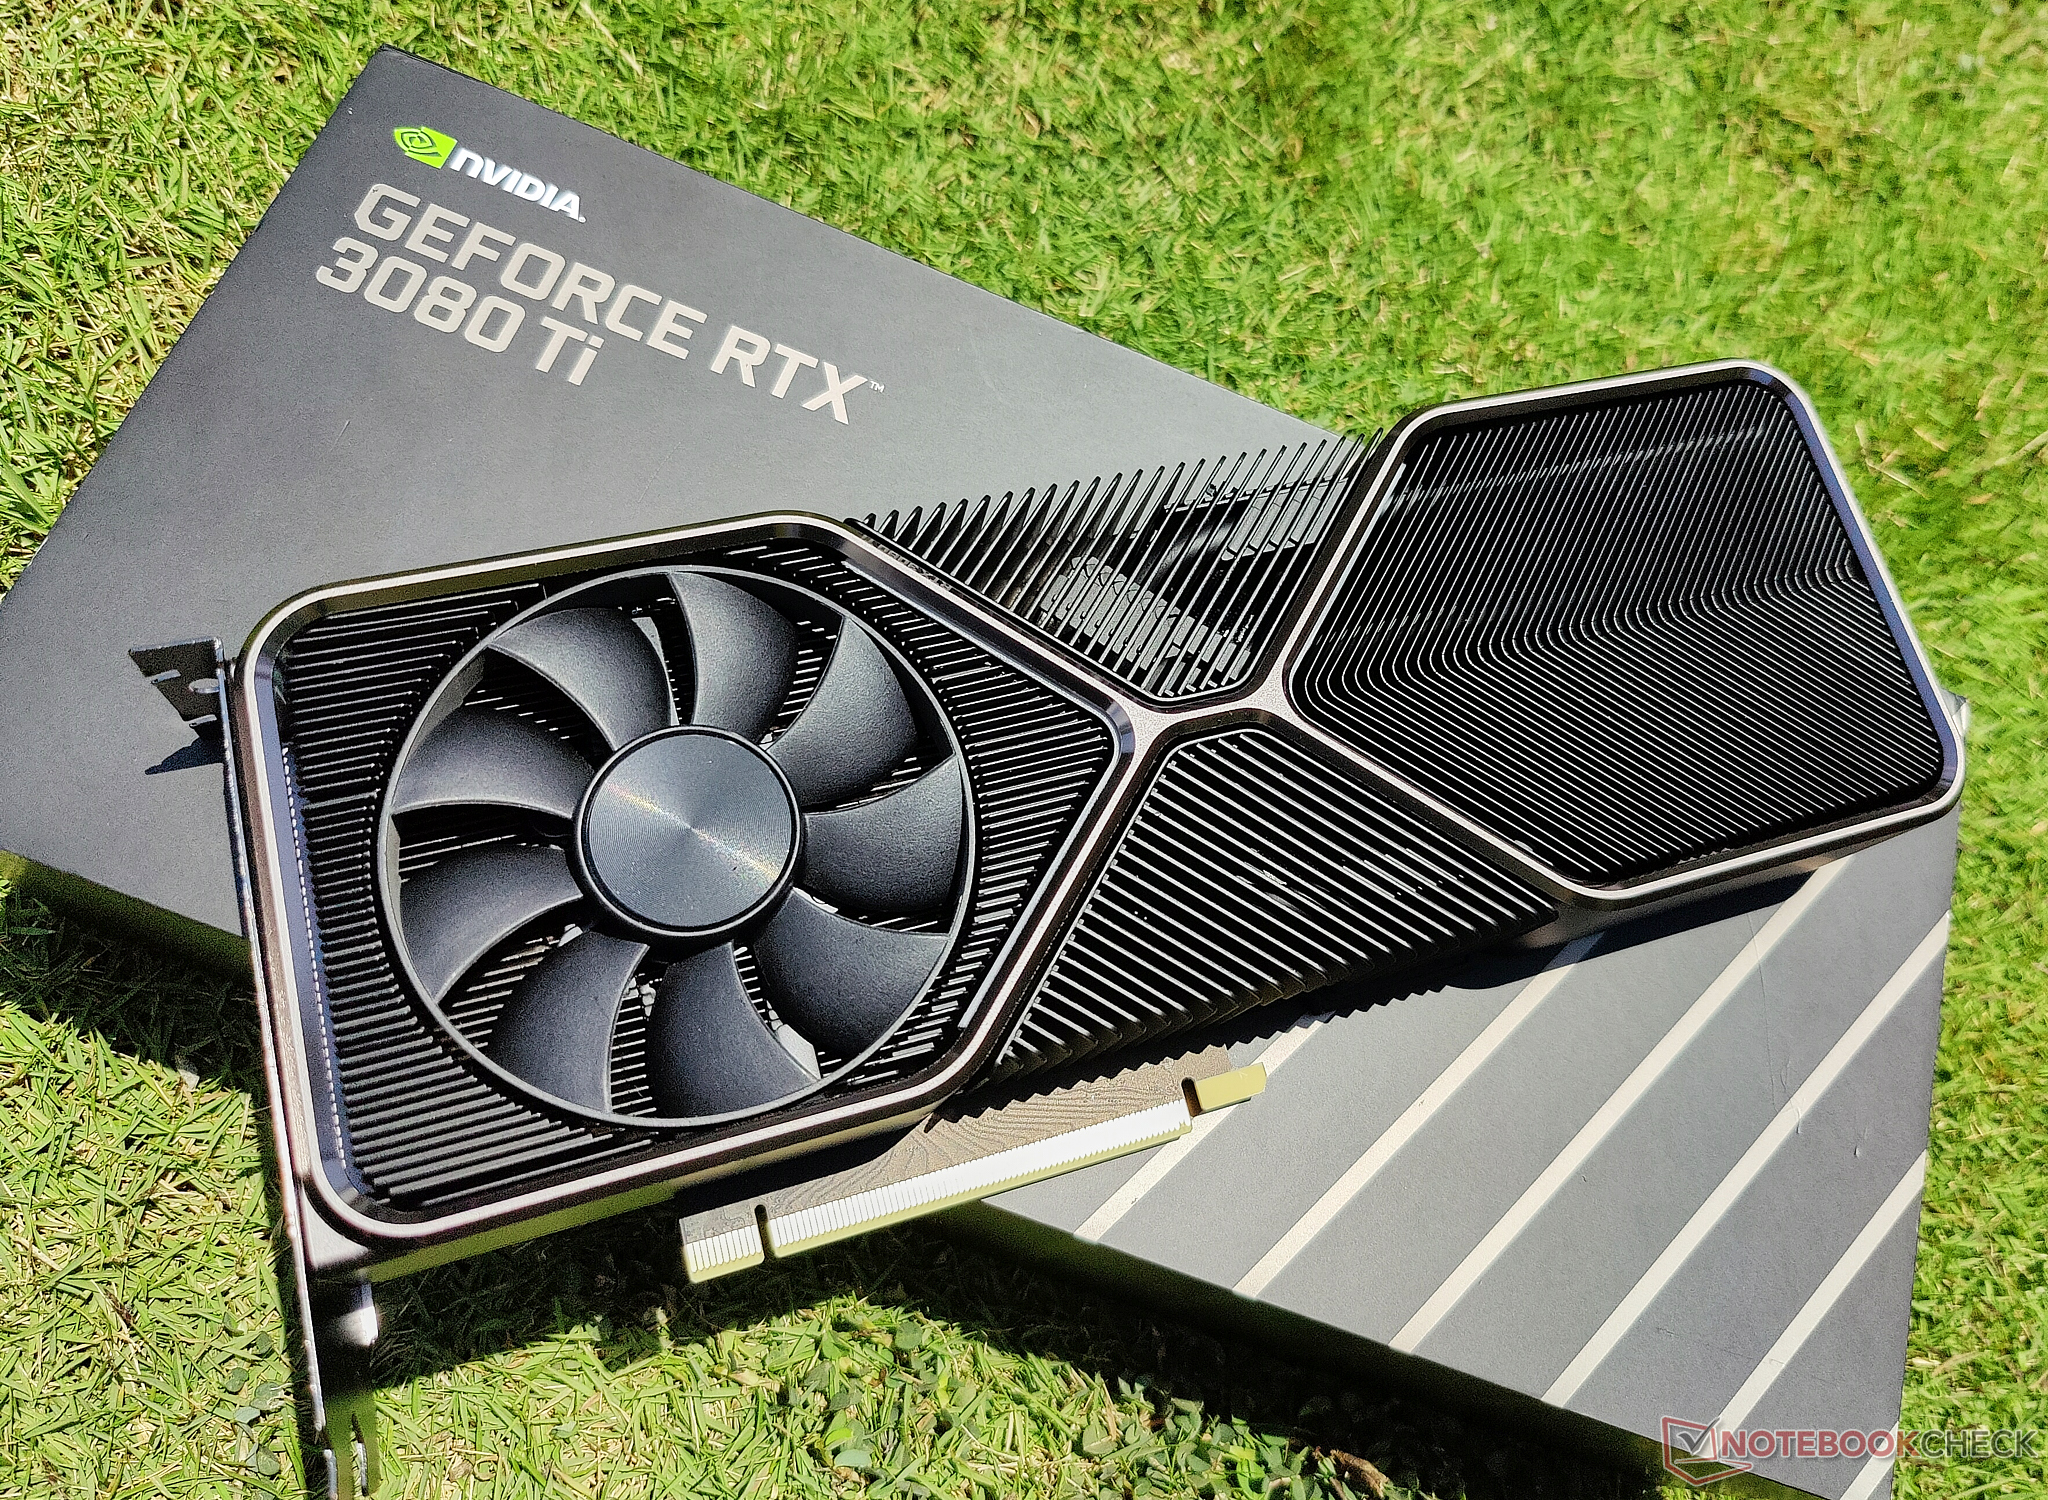
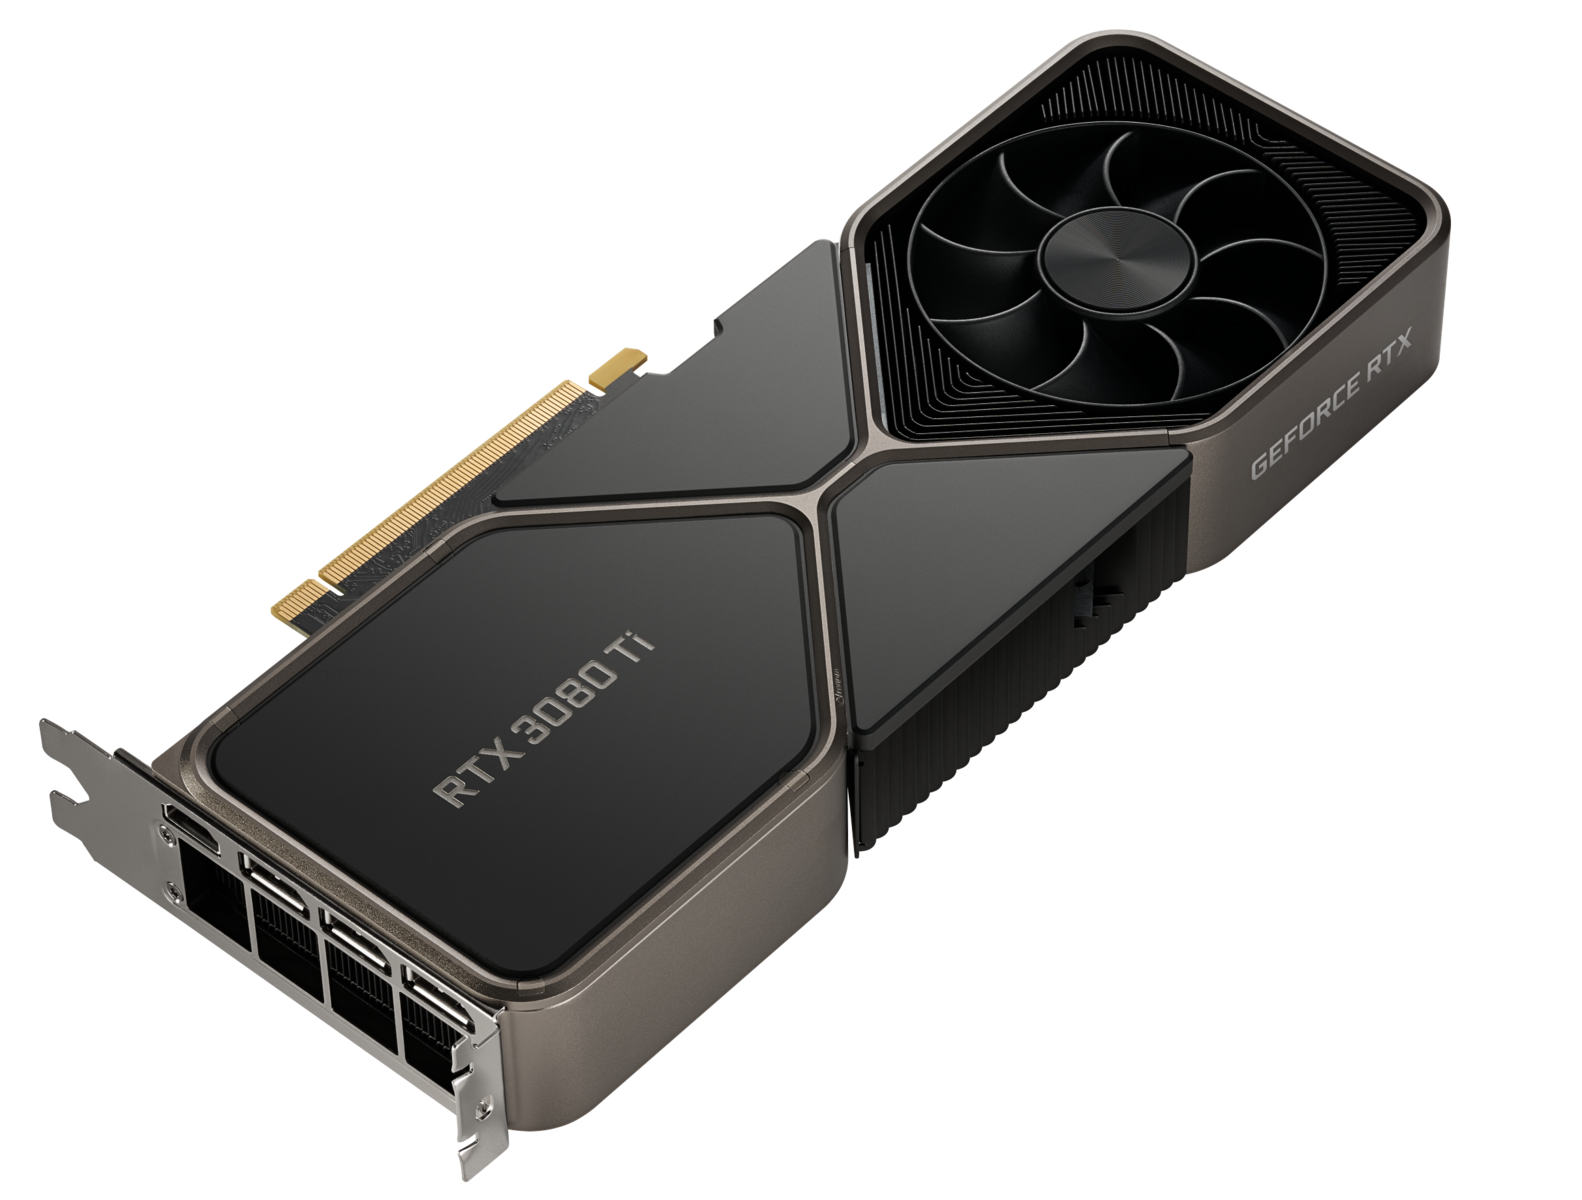
Ein Rundgang durch die NVIDIA GeForce RTX 3080 Ti FE

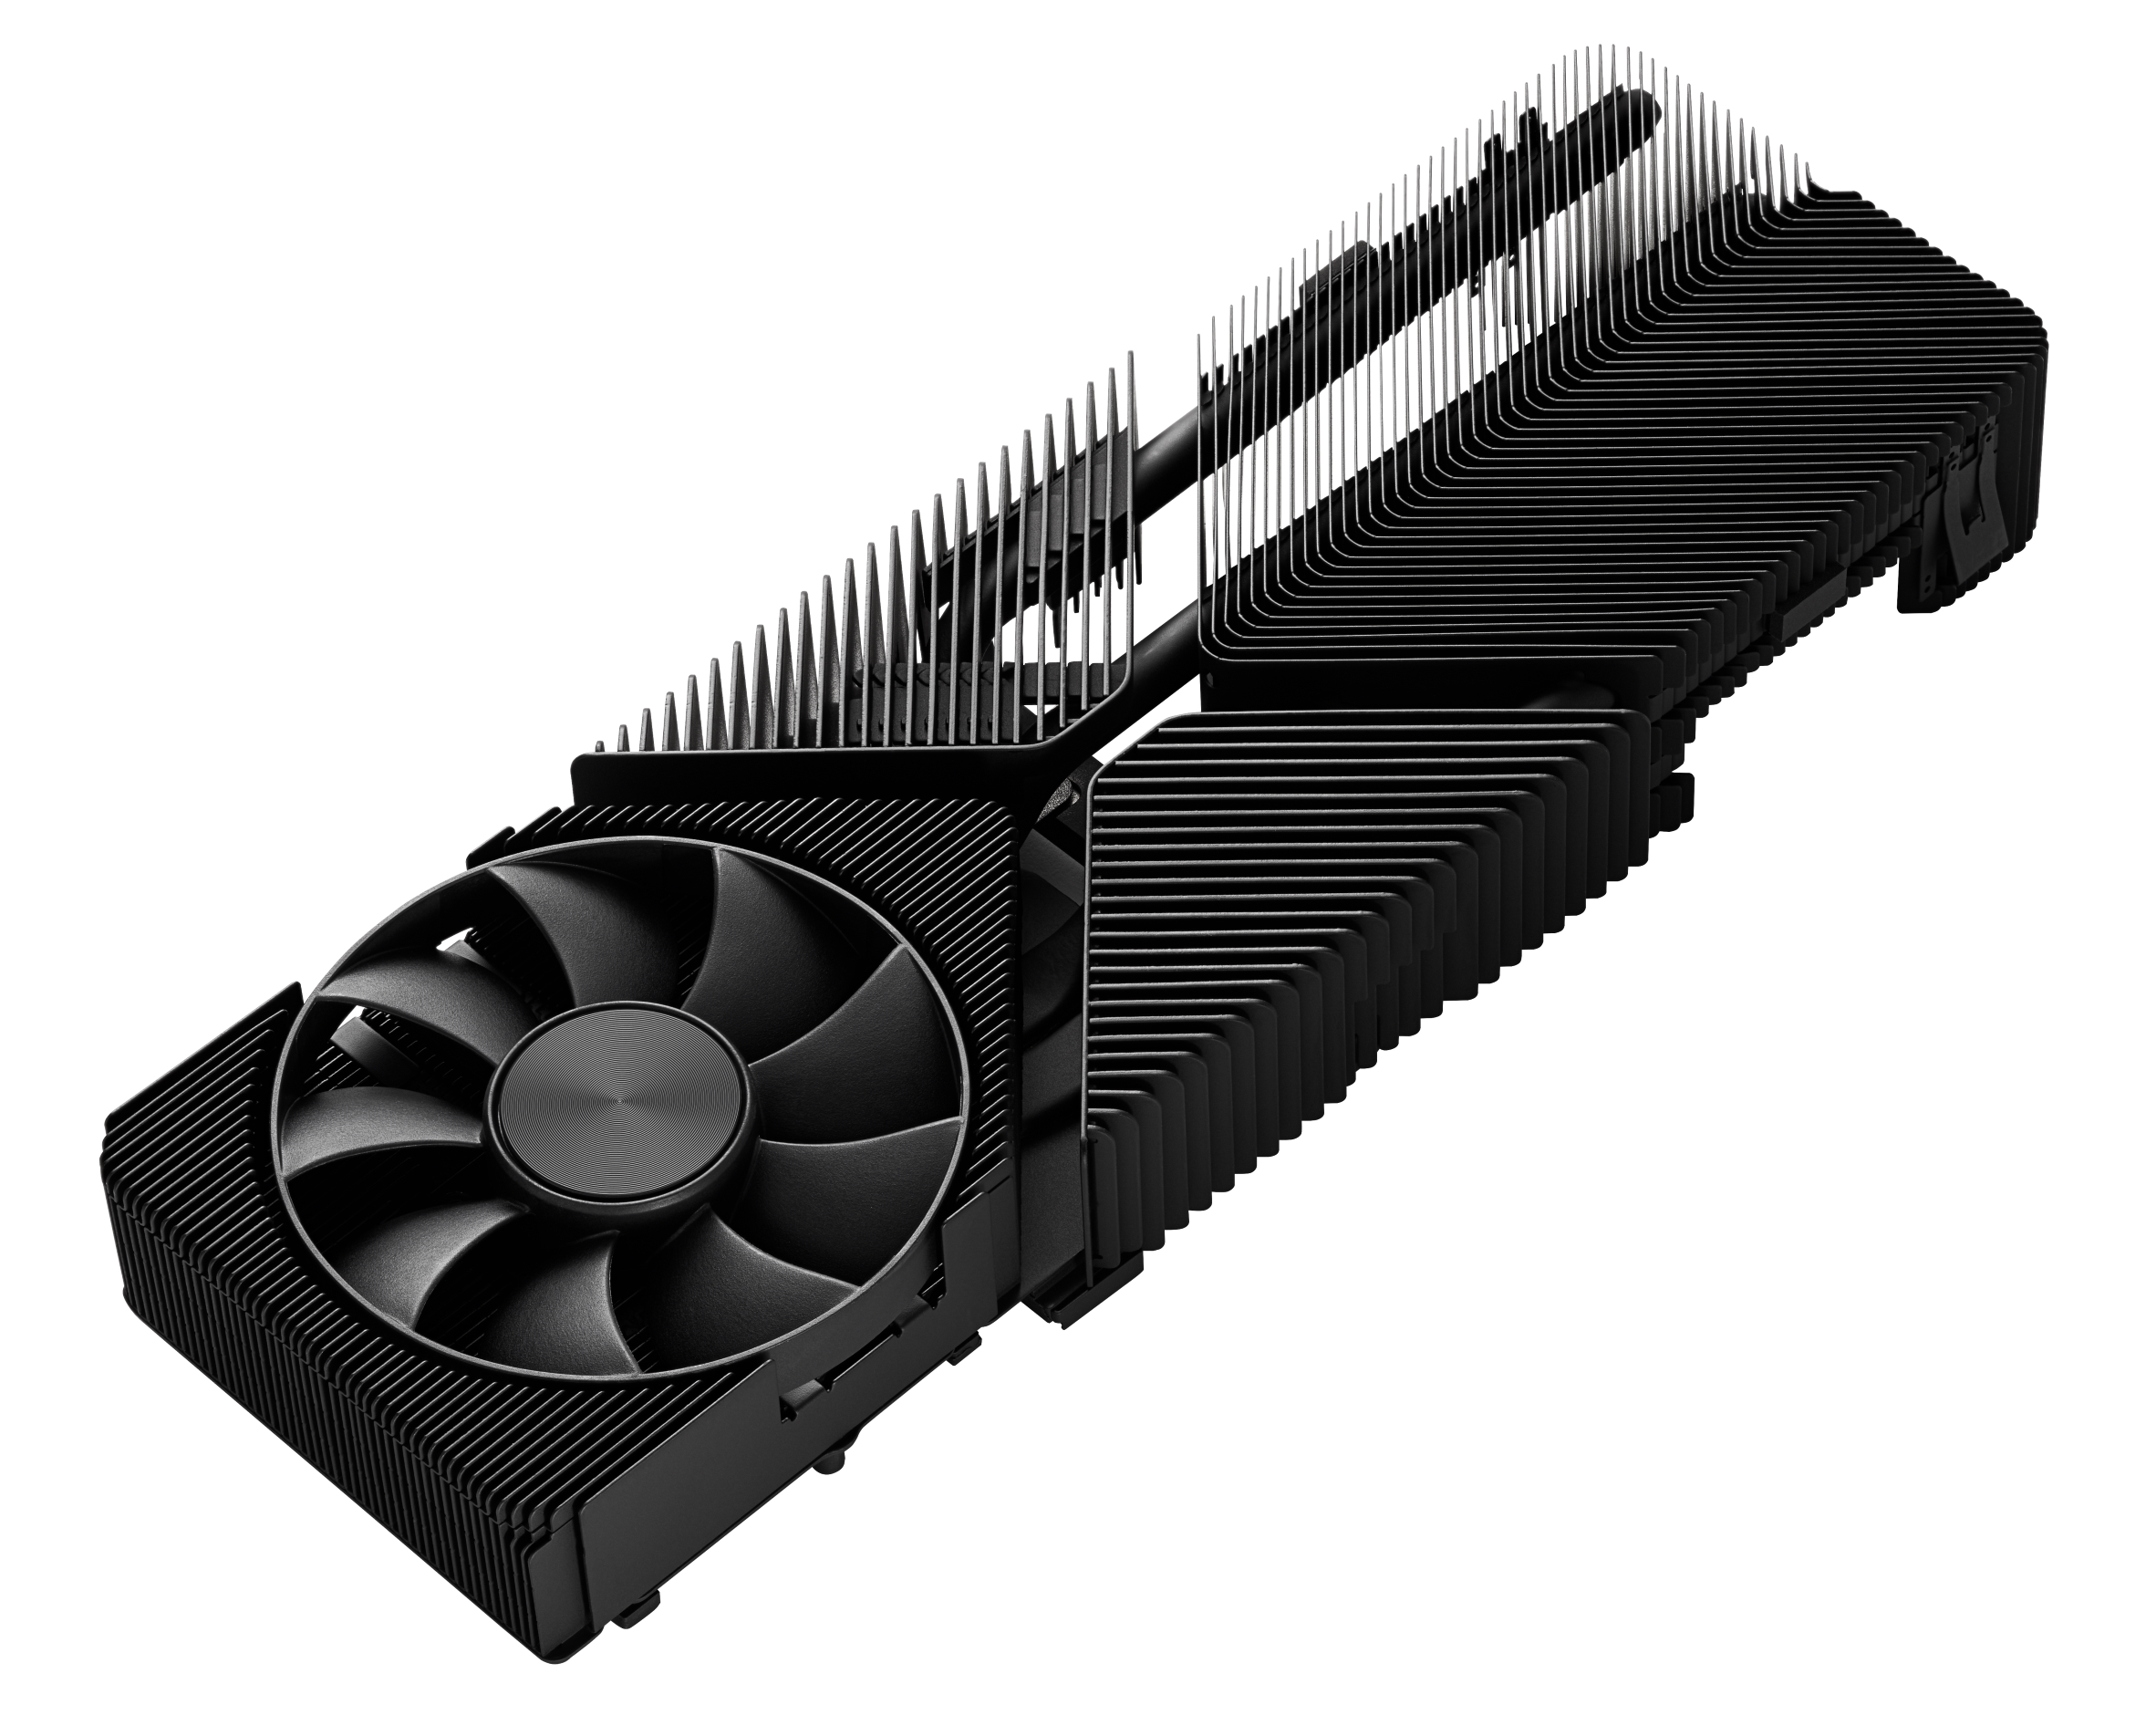
Vom Design her gibt es keinen Unterschied zwischen den Founders Editions der RTX 3080 und der RTX 3080 Ti, außer dem neuen SKU-Namen. Trotz der RTX-3090-ähnlichen Spezifikationen hat NVIDIA das 2-Slot-Design der RTX 3080 beibehalten.

Während dies gut für die Gehäuseästhetik ist, ist es nicht gerade förderlich für die Kühlung und das Lüftergeräusch, wie wir unten sehen werden. Die beiden 9-Blatt-85-mm-Lüfter leisten gute Arbeit, um die Karte einigermaßen kühl zu halten, und die Metall-Rückplatte hilft bei der besseren Wärmeableitung an die Umgebung. Die thermische Lösung ist leistungsfähig genug, aber sie scheint nicht ganz in der gleichen Liga wie die der RTX 3090 zu spielen.

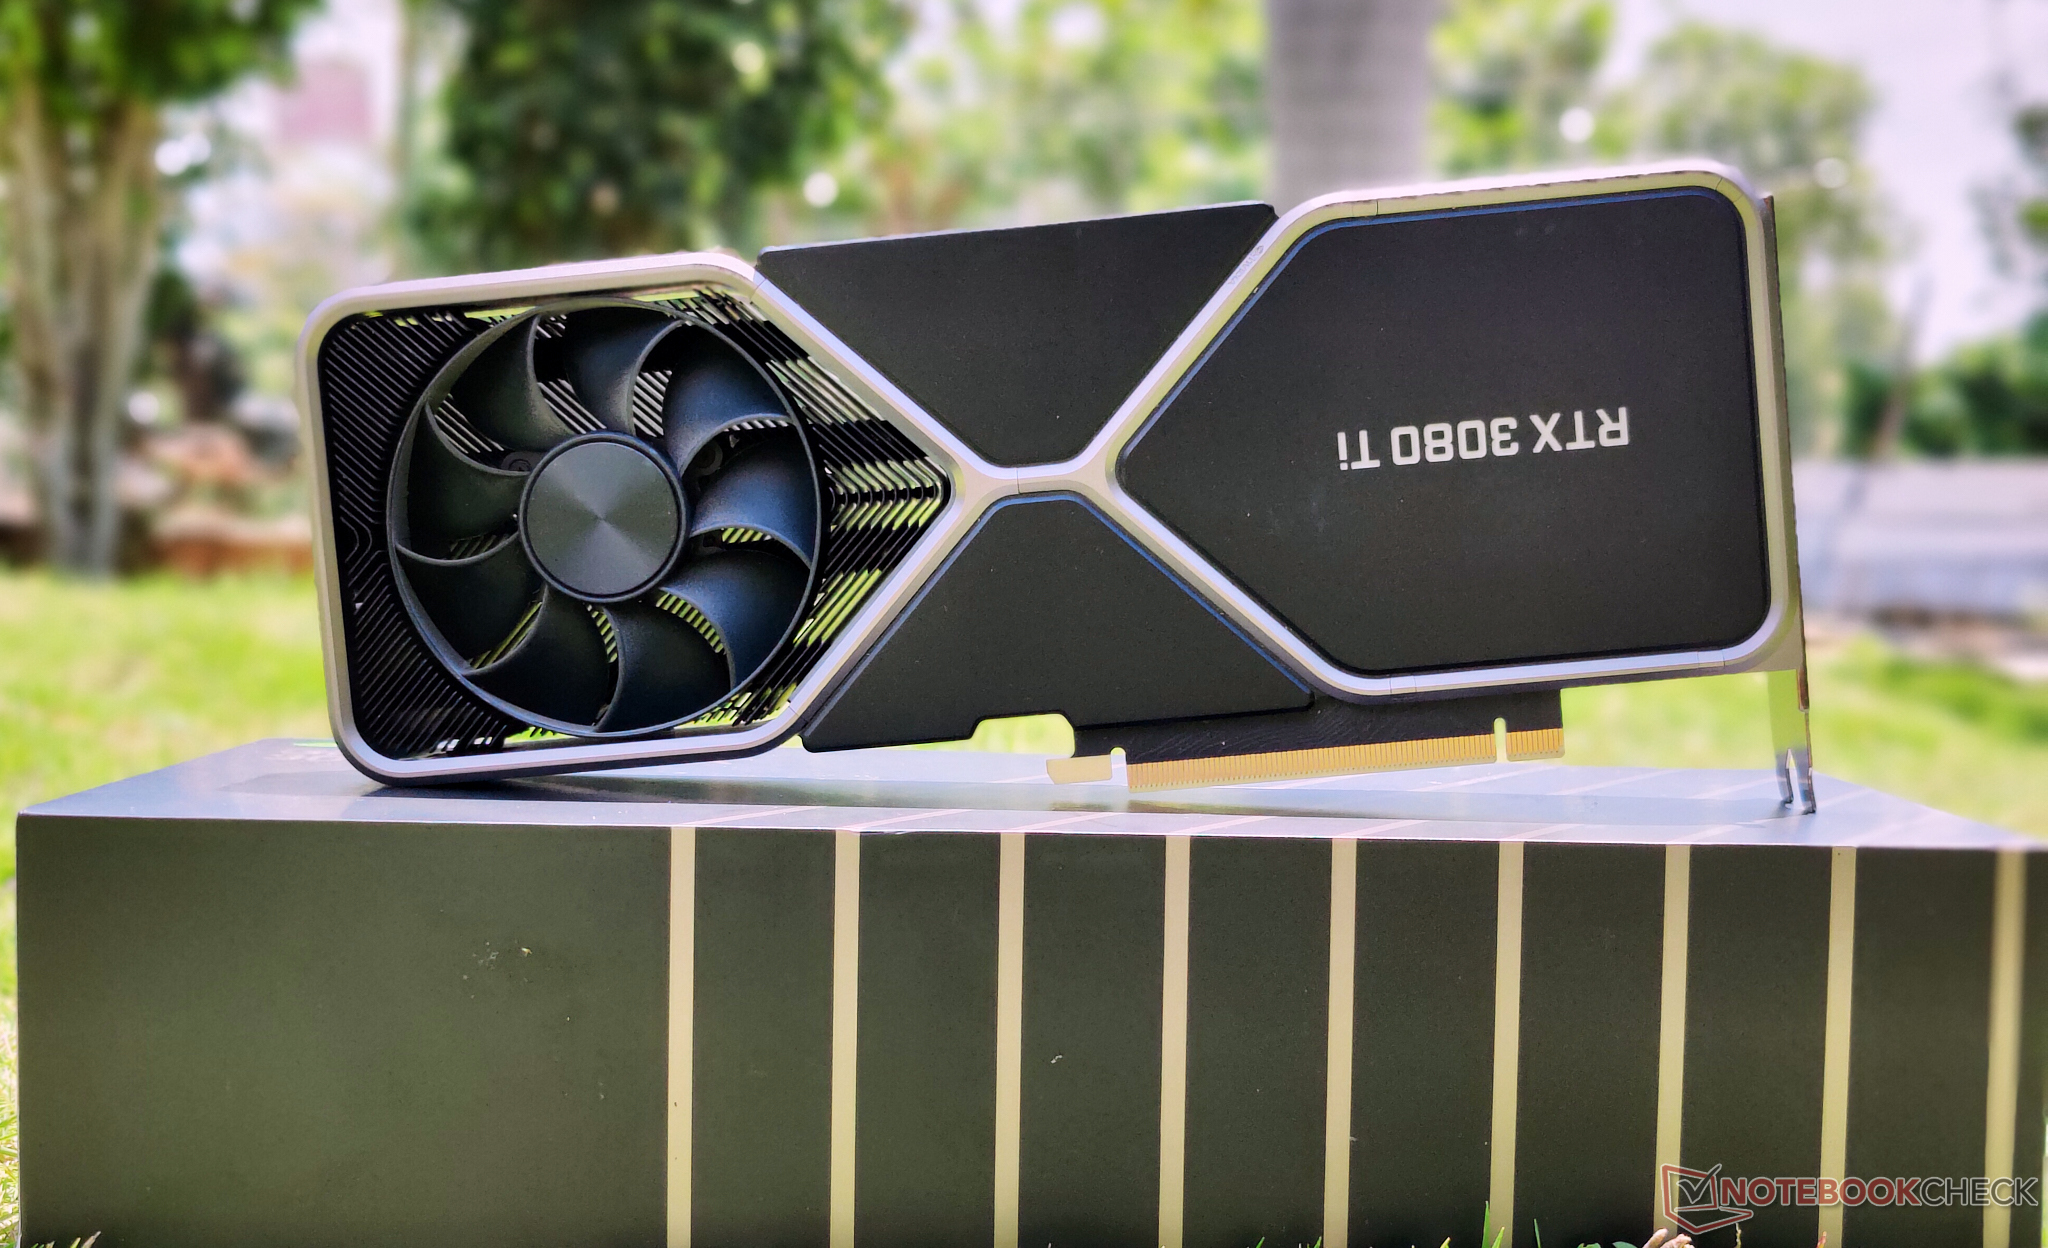
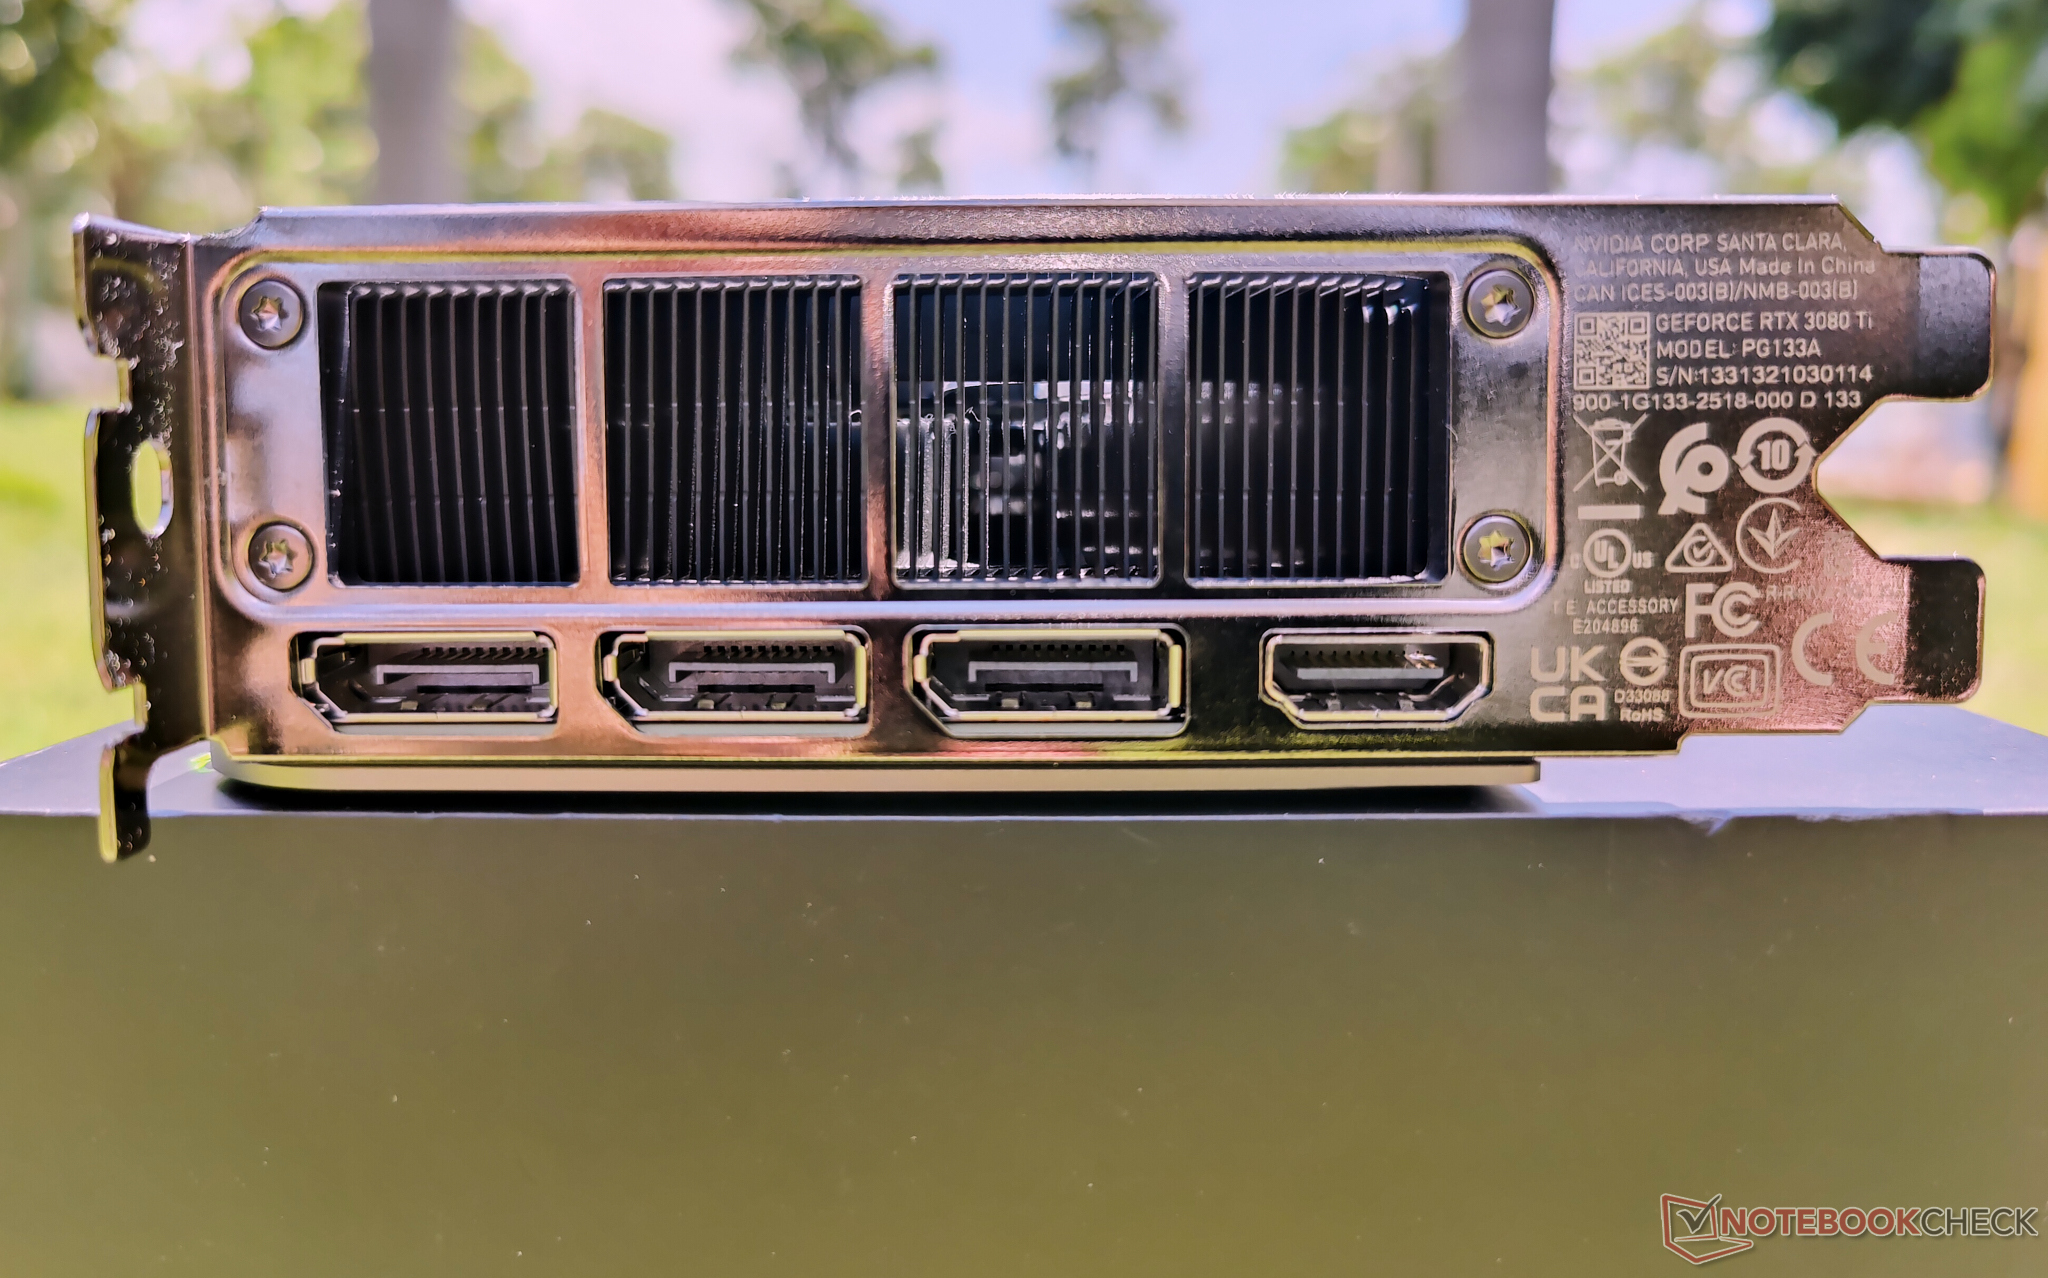
Wie bei Ampere-FE-Karten üblich, sehen wir den 12-Pin-Molex-MicroFit-3.0-Stromanschluss in der oberen Mitte; ein Dual-8-Pin-auf-12-Pin-Anschluss ist im Lieferumfang enthalten. Die Anschlussausstattung ist Standardkost und umfasst einen HDMI-2.1-Ausgang und drei DisplayPort-1.4a-Ausgänge. DisplayPort 1.4a ermöglicht es der RTX 3080 Ti, zwei 8K-60-Hz-Displays mit jeweils einem einzigen Kabel anzusteuern, ohne dabei ins Schwitzen zu kommen, während HDMI 2.1 die Ausgabe von 4K 144 Hz und 8K 30 Hz ermöglicht.

Wie bei den meisten FE-Karten (Gehäuse) leuchtet das GeForce-RTX-Logo in Weiß und kann nicht per RGB-Software gesteuert werden. Es ist jedoch möglich, einige der Beleuchtungen am inneren Rahmen über Corsair iCUE oder andere RGB-Apps von Drittanbietern zu steuern.

NVIDIA bietet standardmäßig eine dreijährige Garantie auf alle GeForce-Founders-Editions-Karten.

RTX 3080 Ti FE PCB - Vorderseite (Bildquelle: NVIDIA)
RTX 3080 Ti FE PCB - Rückseite (Bildquelle: NVIDIA)
RTX 3080 Ti FE Kühlsystem (Bildquelle: NVIDIA)

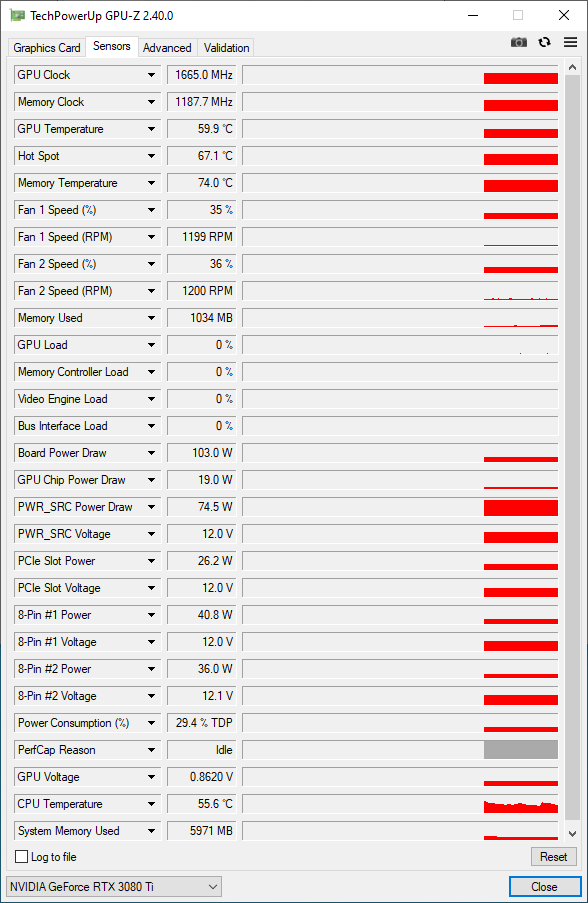
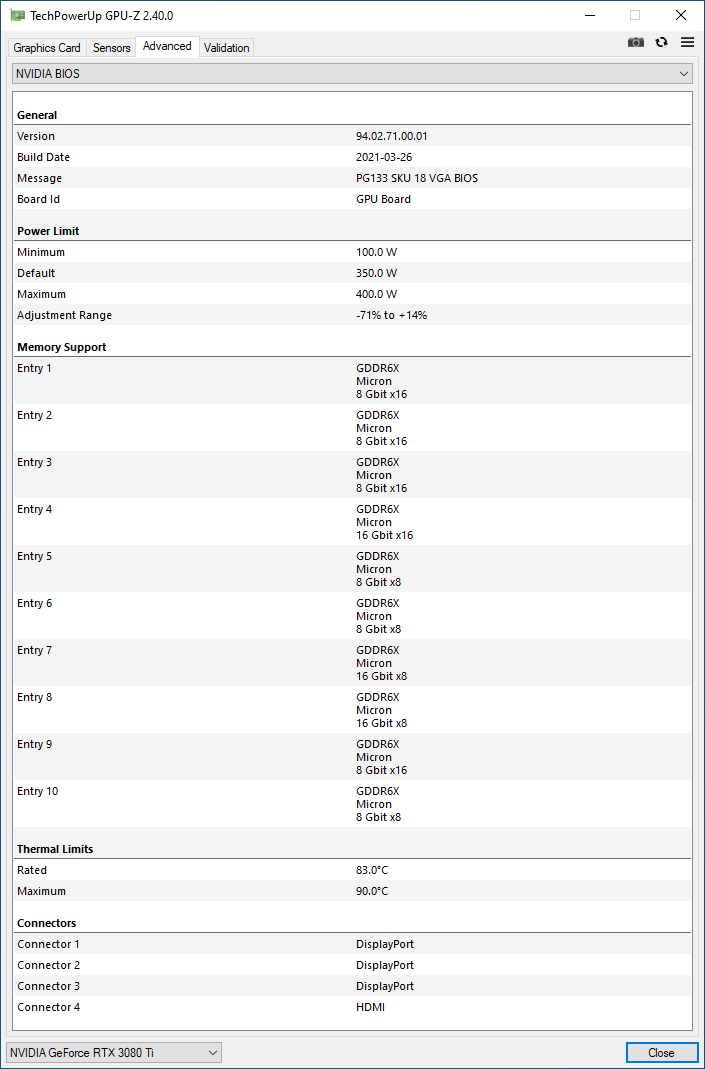
Die RTX 3080 Ti FE bietet einen Basistakt von 1.365 MHz und 1.665 MHz Boost. Es besteht die Möglichkeit, einen Boost über diesen Wert hinaus zu erreichen, obwohl wir nicht in der Lage waren, die 2.000-MHz-Marke wie bei der RTX 3090 zu überschreiten. Die RTX 3080 Ti ist mit einer TGP von 350 W angegeben. Es ist möglich, das Leistungsziel um weitere 14 % auf etwa 400 W zu erhöhen, aber wir hatten während der Stresstests Probleme mit der Stabilität.

Bei der RTX 3080 Ti FE ist der 384-Bit-Bus des GDDR6X-Speichers ausgereizt, was nur zwei VRAM-Kapazitäten ermöglicht - 12 GB und 24 GB. NVIDIA hat das 24-GB-Angebot für die RTX 3090 reserviert, mit dem Ziel, kreative Profis anzulocken, die auch spielen, während die RTX 3080 Ti mit 12 GB auskommen muss. Während die Karte im Vergleich zur RTX 3080 Ti nur 2 GB zusätzlichen VRAM zu haben scheint, sehen wir eine 20 %ige Steigerung der Speicherbandbreite bei 912 GB/s, was zumindest bei den aktuellen AAA-Titeln ziemlich gut für den Umgang mit schweren In-Game-Texturen sein sollte.

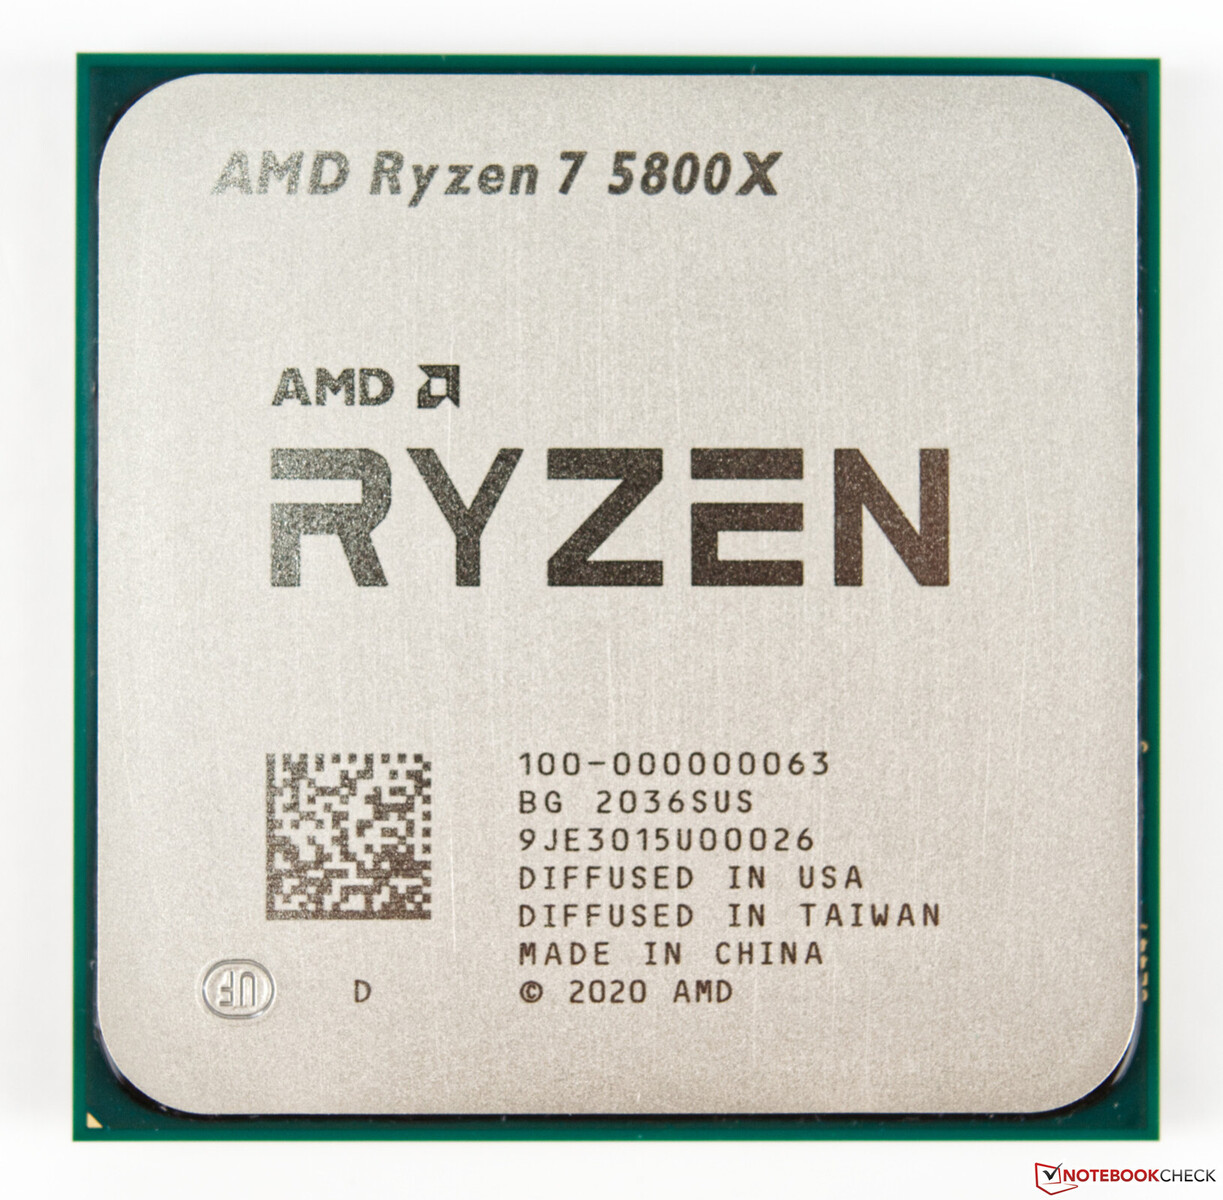
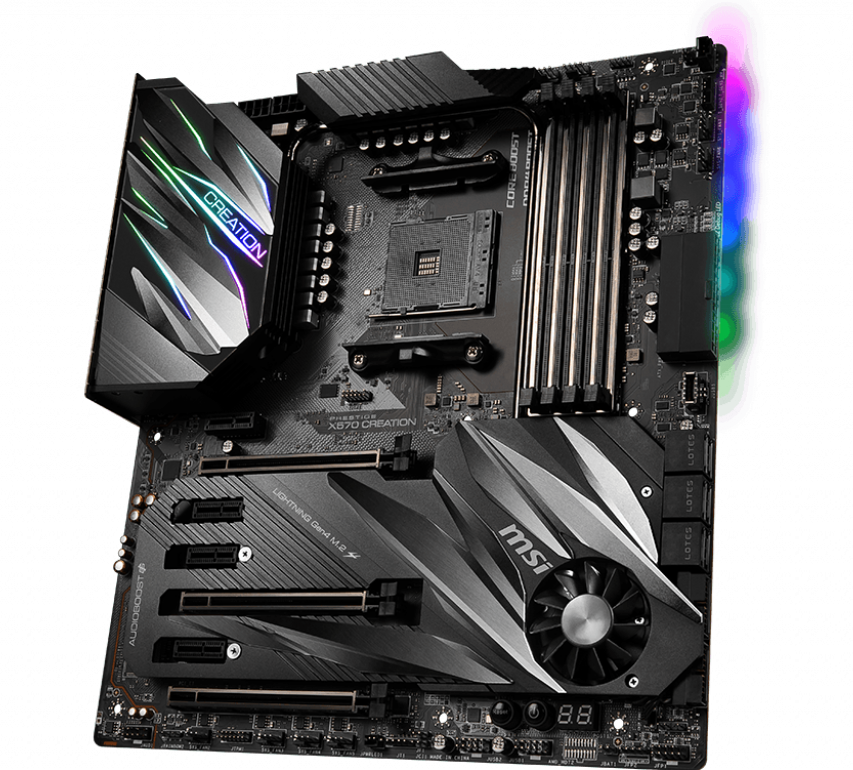
Der Prüfstand - basierend auf der AMD Ryzen 7 5800X und X570 Plattform

Wir haben einen AMD Ryzen 7 5800X als Prozessor der Wahl. Der Ryzen 7 5800X wurde mit einem MSI Prestige X570 Creation Mainboard, 32 GB (16 GB x2) G.SKILL Trident Z Neo DDR4-3200 RAM (Timings 16-19-19-39) und einer Gigabyte Aorus NVMe Gen4 1 TB SSD gepaart.

Windows 10 21H1 mit den neuesten kumulativen Updates (Build 19043.1081) wurde auf der Aorus NVMe Gen4 PCIe SSD installiert, während zwei 1 TB Crucial MX500 SATA SSDs für die Ausführung von Benchmarks und Spielen verwendet wurden. Das größenveränderliche BAR wurde im UEFI aktiviert, was bei ausgewählten Titeln für eine leichte Leistungssteigerung sorgen kann.

Gekühlt wurde der Ryzen 7 5800X mit einem Corsair iCUE H115i Elite Capellix AIO-Kühler. Der Aufbau war in einem Corsair iCUE 4000X RGB Gehäuse mit einem Thermaltake Toughpower 850 W 80 Plus Gold als Netzteil der Wahl untergebracht. Alle Tests wurden mit geschlossenem Gehäuse durchgeführt, um eine typische Nutzung darzustellen.

Ein OnePlus U Series 55U1 Smart TV, der mit 4K 60 Hz im Spielemodus läuft, wurde über HDMI mit der RTX 3080 Ti verbunden. Die Farbausgabe war in der NVIDIA Systemsteuerung auf volles 32-Bit-RGB eingestellt, und die Skalierung des WindowsDesktops war auf 100 % gesetzt.

Wir bedanken uns bei AMD für die Bereitstellung der Ryzen 7 5800X CPU, bei Corsair für den iCUE Elite Capellix AIO-Kühler und den iCUE 4000X Gehäuse und bei OnePlus für den 4K-Fernseher der U-Serie 55U1.

AMD Ryzen 7 5800X CPU
MSI Prestige X570 Creation Mainboard (Bildquelle: MSI)
Gigabyte Aorus NVMe Gen4 SSD (Bildquelle: Gigabyte)
G.SKILL Trident Z Neo DDR4-3600 RAM (Bildquelle: G.SKILL)

Synthetische Benchmarks - Auf Augenhöhe mit der RTX 3090

Die NVIDIA RTX 3080 Ti bietet ein interessantes Bild, wenn es um Benchmark-Ergebnisse geht - sowohl synthetisch als auch in der realen Welt. Im Grunde genommen haben wir es hier tatsächlich mit einer RTX 3090 zu tun. Der RTX 3080 Ti fehlen nur zwei Streaming-Multiprozessoren (SMs) im Vergleich zur RTX 3090, und das scheint in den meisten Benchmarks wenig bis gar keinen Einfluss zu haben. Wir sehen, dass die RTX 3080 Ti in einer Handvoll Tests besser abschneidet als die RTX 3090, wahrscheinlich weil sich Software und Treiber im Laufe der Zeit verbessert haben könnten.

Im 3DMark hat AMDs RDNA-2-basierte RX 6800 XT und RX 6900 XT einen spürbaren Vorsprung in allen Fire Strike Graphics Tests, obwohl die RTX 3080 Ti mehr oder weniger mit der RTX 3090 in Time Spy Graphics gleichzieht. Im Vergleich zur RTX 3080 kann die RTX 3080 Ti in Fire Strike Graphics je nach Auflösung zwischen 13 und 17 % schneller sein, während sie in Time Spy Graphics nur 9 % besser ist.

Wie erwartet schlagen die NVIDIA Karten ihre RDNA-2-Konkurrenten im Port Royal Raytracing Benchmark mit Leichtigkeit, wobei die RTX 3080 Ti auf Augenhöhe mit der RTX 3090 ist und etwa 13 bzw. 34% schneller ist als die RTX 3080 und die Radeon RX 6900 XT.

Die Leistungslücke zwischen der RTX 3080 Ti und der RTX 3090 scheint sich in Unigine etwas zu vergrößern, besonders in den OpenGL Versionen der Heaven und Valley Benchmarks. In der Überlagerung liegen die RTX 3090 und RTX 3080 Ti gleichauf. Die einzige Ausnahme ist hier in der 720p-Low-Komponente des Tests zu sehen, wo die RTX 3080 Ti fast 25 % vor der RTX 3090 liegt, wahrscheinlich weil diese Auflösung stärker CPU-gebunden ist. Generell sehen wir, dass die RTX 3080 Ti bei Auflösungen von 1080p und höher etwa 14 % schneller ist als die durchschnittliche RTX 3080.

Beachten Sie, dass wir dieses Mal eine andere CPU verwendet haben, den Ryzen 7 5800X, was einige der synthetischen Benchmark-Ergebnisse beeinflussen kann.

3DMark
2560x1440 Time Spy Graphics
Durchschnittliche NVIDIA GeForce RTX 3090
  (18685 - 20433, n=17)
19266 Points +1%
NVIDIA GeForce RTX 3080 Ti Founders Edition
NVIDIA GeForce RTX 3080 Ti, R7 5800X
19081 Points
Nvidia GeForce RTX 3090 Founders Edition
NVIDIA GeForce RTX 3090, R9 5900X
18685 Points -2%
AMD Radeon RX 6900 XT
AMD Radeon RX 6900 XT, R9 5950X
18210 Points -5%
AMD Radeon RX 6800 XT
AMD Radeon RX 6800 XT, R9 5950X
17603 Points -8%
Durchschnittliche NVIDIA GeForce RTX 3080
  (17467 - 17604, n=2)
17536 Points -8%
ASUS GeForce RTX 3080 ROG STRIX OC GAMING
NVIDIA GeForce RTX 3080, R9 5900X
17467 Points -8%
AMD Ryzen 9 5900X
NVIDIA Titan RTX, R9 5900X
15283 Points -20%
Durchschnittliche NVIDIA Titan RTX
  (14216 - 15283, n=29)
14884 Points -22%
Durchschnittliche NVIDIA GeForce RTX 2080 Ti (Desktop)
  (13744 - 14645, n=4)
14283 Points -25%
KFA2 GeForce RTX 2080 Ti EX
NVIDIA GeForce RTX 2080 Ti (Desktop), R9 3900X
13744 Points -28%
MSI GeForce RTX 3070 Gaming X Trio
NVIDIA GeForce RTX 3070, R9 5900X
13579 Points -29%
Durchschnittliche NVIDIA GeForce RTX 3070
  (11043 - 13579, n=7)
12616 Points -34%
Nvidia GeForce RTX 2080 Super
NVIDIA GeForce RTX 2080 Super (Desktop), R7 2700X
11477 Points -40%
Durchschnittliche NVIDIA GeForce RTX 2080 Super (Desktop)
  (11313 - 11542, n=4)
11439 Points -40%
1920x1080 Fire Strike Graphics
AMD Radeon RX 6900 XT
AMD Radeon RX 6900 XT, R9 5950X
50587 Points +10%
AMD Radeon RX 6800 XT
AMD Radeon RX 6800 XT, R9 5950X
49735 Points +9%
Durchschnittliche NVIDIA GeForce RTX 3090
  (41298 - 49282, n=17)
46856 Points +2%
NVIDIA GeForce RTX 3080 Ti Founders Edition
NVIDIA GeForce RTX 3080 Ti, R7 5800X
45785 Points
Nvidia GeForce RTX 3090 Founders Edition
NVIDIA GeForce RTX 3090, R9 5900X
41298 Points -10%
ASUS GeForce RTX 3080 ROG STRIX OC GAMING
NVIDIA GeForce RTX 3080, R9 5900X
40910 Points -11%
Durchschnittliche NVIDIA GeForce RTX 3080
  (37604 - 40910, n=2)
39257 Points -14%
Durchschnittliche NVIDIA Titan RTX
  (33377 - 40910, n=30)
36062 Points -21%
AMD Ryzen 9 5900X
NVIDIA Titan RTX, R9 5900X
34722 Points -24%
Durchschnittliche NVIDIA GeForce RTX 2080 Ti (Desktop)
  (32081 - 35851, n=4)
34141 Points -25%
KFA2 GeForce RTX 2080 Ti EX
NVIDIA GeForce RTX 2080 Ti (Desktop), R9 3900X
32081 Points -30%
MSI GeForce RTX 3070 Gaming X Trio
NVIDIA GeForce RTX 3070, R9 5900X
31096 Points -32%
Durchschnittliche NVIDIA GeForce RTX 3070
  (20357 - 33270, n=7)
28949 Points -37%
Durchschnittliche NVIDIA GeForce RTX 2080 Super (Desktop)
  (26824 - 28968, n=4)
27647 Points -40%
Nvidia GeForce RTX 2080 Super
NVIDIA GeForce RTX 2080 Super (Desktop), R7 2700X
27075 Points -41%
3840x2160 Fire Strike Ultra Graphics
AMD Radeon RX 6900 XT
AMD Radeon RX 6900 XT, R9 5950X
13370 Points +11%
AMD Radeon RX 6800 XT
AMD Radeon RX 6800 XT, R9 5950X
12626 Points +5%
Durchschnittliche NVIDIA GeForce RTX 3090
  (11613 - 12587, n=14)
12289 Points +2%
NVIDIA GeForce RTX 3080 Ti Founders Edition
NVIDIA GeForce RTX 3080 Ti, R7 5800X
12074 Points
Nvidia GeForce RTX 3090 Founders Edition
NVIDIA GeForce RTX 3090, R9 5900X
11613 Points -4%
ASUS GeForce RTX 3080 ROG STRIX OC GAMING
NVIDIA GeForce RTX 3080, R9 5900X
10793 Points -11%
Durchschnittliche NVIDIA GeForce RTX 3080
  (10645 - 10793, n=2)
10719 Points -11%
Durchschnittliche NVIDIA Titan RTX
  (8461 - 10793, n=29)
8868 Points -27%
AMD Ryzen 9 5900X
NVIDIA Titan RTX, R9 5900X
8649 Points -28%
MSI GeForce RTX 3070 Gaming X Trio
NVIDIA GeForce RTX 3070, R9 5900X
8483 Points -30%
Durchschnittliche NVIDIA GeForce RTX 3070
  (8043 - 8483, n=5)
8250 Points -32%
Durchschnittliche NVIDIA GeForce RTX 2080 Ti (Desktop)
  (7925 - 8504, n=4)
8226 Points -32%
KFA2 GeForce RTX 2080 Ti EX
NVIDIA GeForce RTX 2080 Ti (Desktop), R9 3900X
7925 Points -34%
Durchschnittliche NVIDIA GeForce RTX 2080 Super (Desktop)
  (6500 - 6700, n=3)
6585 Points -45%
Nvidia GeForce RTX 2080 Super
NVIDIA GeForce RTX 2080 Super (Desktop), R7 2700X
6500 Points -46%
Fire Strike Extreme Graphics
AMD Radeon RX 6900 XT
AMD Radeon RX 6900 XT, R9 5950X
26650 Points +15%
AMD Radeon RX 6800 XT
AMD Radeon RX 6800 XT, R9 5950X
25015 Points +8%
Durchschnittliche NVIDIA GeForce RTX 3090
  (22075 - 24730, n=14)
23806 Points +3%
NVIDIA GeForce RTX 3080 Ti Founders Edition
NVIDIA GeForce RTX 3080 Ti, R7 5800X
23127 Points
Nvidia GeForce RTX 3090 Founders Edition
NVIDIA GeForce RTX 3090, R9 5900X
22075 Points -5%
ASUS GeForce RTX 3080 ROG STRIX OC GAMING
NVIDIA GeForce RTX 3080, R9 5900X
20861 Points -10%
Durchschnittliche NVIDIA GeForce RTX 3080
  (20007 - 20861, n=2)
20434 Points -12%
Durchschnittliche NVIDIA Titan RTX
  (16484 - 20861, n=29)
17649 Points -24%
AMD Ryzen 9 5900X
NVIDIA Titan RTX, R9 5900X
17176 Points -26%
Durchschnittliche NVIDIA GeForce RTX 2080 Ti (Desktop)
  (15603 - 16856, n=3)
16416 Points -29%
MSI GeForce RTX 3070 Gaming X Trio
NVIDIA GeForce RTX 3070, R9 5900X
16196 Points -30%
Durchschnittliche NVIDIA GeForce RTX 3070
  (15503 - 16276, n=5)
15859 Points -31%
KFA2 GeForce RTX 2080 Ti EX
NVIDIA GeForce RTX 2080 Ti (Desktop), R9 3900X
15603 Points -33%
Durchschnittliche NVIDIA GeForce RTX 2080 Super (Desktop)
  (12968 - 13551, n=3)
13172 Points -43%
Nvidia GeForce RTX 2080 Super
NVIDIA GeForce RTX 2080 Super (Desktop), R7 2700X
12968 Points -44%
2560x1440 Port Royal Graphics
NVIDIA GeForce RTX 3080 Ti Founders Edition
NVIDIA GeForce RTX 3080 Ti, R7 5800X
12798 Points
Durchschnittliche NVIDIA GeForce RTX 3090
  (12255 - 13075, n=6)
12767 Points 0%
Nvidia GeForce RTX 3090 Founders Edition
NVIDIA GeForce RTX 3090, R9 5900X
12384 Points -3%
Durchschnittliche NVIDIA GeForce RTX 3080
  (11238 - 11433, n=2)
11336 Points -11%
ASUS GeForce RTX 3080 ROG STRIX OC GAMING
NVIDIA GeForce RTX 3080, R9 5900X
11238 Points -12%
AMD Radeon RX 6900 XT
AMD Radeon RX 6900 XT, R9 5950X
9585 Points -25%
AMD Ryzen 9 5900X
NVIDIA Titan RTX, R9 5900X
9335 Points -27%
AMD Ryzen 9 5900X
NVIDIA Titan RTX, R9 5900X
9239 Points -28%
Durchschnittliche NVIDIA Titan RTX
  (8945 - 9528, n=24)
9303 Points -27%
Durchschnittliche NVIDIA GeForce RTX 2080 Ti (Desktop)
  (8537 - 9021, n=2)
8779 Points -31%
KFA2 GeForce RTX 2080 Ti EX
NVIDIA GeForce RTX 2080 Ti (Desktop), R9 3900X
8537 Points -33%
MSI GeForce RTX 3070 Gaming X Trio
NVIDIA GeForce RTX 3070, R9 5900X
8191 Points -36%
Durchschnittliche NVIDIA GeForce RTX 3070
  (7796 - 8191, n=5)
7941 Points -38%
Durchschnittliche NVIDIA GeForce RTX 2080 Super (Desktop)
  (6745 - 6947, n=3)
6873 Points -46%
Nvidia GeForce RTX 2080 Super
NVIDIA GeForce RTX 2080 Super (Desktop), R7 2700X
6745 Points -47%
Unigine Heaven 4.0
Extreme Preset DX11
Durchschnittliche NVIDIA GeForce RTX 3090
  (272 - 315, n=11)
300 fps +3%
NVIDIA GeForce RTX 3080 Ti Founders Edition
NVIDIA GeForce RTX 3080 Ti, R7 5800X
290.2 (50.9min - 582.7max) fps
Nvidia GeForce RTX 3090 Founders Edition
NVIDIA GeForce RTX 3090, R9 5900X
274 fps -6%
AMD Radeon RX 6900 XT
AMD Radeon RX 6900 XT, R9 5950X
259.5 (49.3min - 537.2max) fps -11%
AMD Radeon RX 6800 XT
AMD Radeon RX 6800 XT, R9 5950X
247.9 fps -15%
Durchschnittliche NVIDIA GeForce RTX 3080
  (233 - 253, n=2)
243 fps -16%
AMD Ryzen 9 5900X
NVIDIA Titan RTX, R9 5900X
237.1 fps -18%
Durchschnittliche NVIDIA Titan RTX
  (207 - 248, n=12)
236 fps -19%
ASUS GeForce RTX 3080 ROG STRIX OC GAMING
NVIDIA GeForce RTX 3080, R9 5900X
232.6 fps -20%
Durchschnittliche NVIDIA GeForce RTX 2080 Ti (Desktop)
  (215 - 226, n=3)
222 fps -24%
KFA2 GeForce RTX 2080 Ti EX
NVIDIA GeForce RTX 2080 Ti (Desktop), R9 3900X
215.2 fps -26%
Durchschnittliche NVIDIA GeForce RTX 3070
  (196.4 - 214, n=5)
206 fps -29%
MSI GeForce RTX 3070 Gaming X Trio
NVIDIA GeForce RTX 3070, R9 5900X
202.5 fps -30%
Nvidia GeForce RTX 2080 Super
NVIDIA GeForce RTX 2080 Super (Desktop), R7 2700X
175.2 fps -40%
Durchschnittliche NVIDIA GeForce RTX 2080 Super (Desktop)
  ()
175.2 fps -40%
Extreme Preset OpenGL
Durchschnittliche NVIDIA GeForce RTX 3090
  (188.2 - 284, n=10)
270 fps +2%
NVIDIA GeForce RTX 3080 Ti Founders Edition
NVIDIA GeForce RTX 3080 Ti, R7 5800X
263.6 (12.2min - 543.3max) fps
Durchschnittliche NVIDIA GeForce RTX 3080
  (232 - 243, n=2)
238 fps -10%
ASUS GeForce RTX 3080 ROG STRIX OC GAMING
NVIDIA GeForce RTX 3080, R9 5900X
232.4 fps -12%
Durchschnittliche NVIDIA Titan RTX
  (203 - 299, n=12)
223 fps -15%
AMD Ryzen 9 5900X
NVIDIA Titan RTX, R9 5900X
215.1 fps -18%
AMD Radeon RX 6900 XT
AMD Radeon RX 6900 XT, R9 5950X
206.5 (8.2min - 453.7max) fps -22%
Durchschnittliche NVIDIA GeForce RTX 2080 Ti (Desktop)
  (202 - 213, n=3)
206 fps -22%
KFA2 GeForce RTX 2080 Ti EX
NVIDIA GeForce RTX 2080 Ti (Desktop), R9 3900X
204.4 fps -22%
AMD Radeon RX 6800 XT
AMD Radeon RX 6800 XT, R9 5950X
204 fps -23%
MSI GeForce RTX 3070 Gaming X Trio
NVIDIA GeForce RTX 3070, R9 5900X
196.1 fps -26%
Durchschnittliche NVIDIA GeForce RTX 3070
  (187.5 - 196.1, n=4)
192.5 fps -27%
Nvidia GeForce RTX 3090 Founders Edition
NVIDIA GeForce RTX 3090, R9 5900X
188.2 fps -29%
Nvidia GeForce RTX 2080 Super
NVIDIA GeForce RTX 2080 Super (Desktop), R7 2700X
167.5 fps -36%
Durchschnittliche NVIDIA GeForce RTX 2080 Super (Desktop)
  ()
167.5 fps -36%
Unigine Valley 1.0
1920x1080 Extreme HD DirectX AA:x8
Durchschnittliche NVIDIA GeForce RTX 3090
  (184.2 - 247, n=11)
225 fps +9%
NVIDIA GeForce RTX 3080 Ti Founders Edition
NVIDIA GeForce RTX 3080 Ti, R7 5800X
206 (51.6min - 350.7max) fps
AMD Radeon RX 6900 XT
AMD Radeon RX 6900 XT, R9 5950X
200.8 (53.4min - 359.1max) fps -3%
Nvidia GeForce RTX 3090 Founders Edition
NVIDIA GeForce RTX 3090, R9 5900X
192.4 fps -7%
AMD Radeon RX 6800 XT
AMD Radeon RX 6800 XT, R9 5950X
190.6 fps -7%
AMD Ryzen 9 5900X
NVIDIA Titan RTX, R9 5900X
180.1 fps -13%
Durchschnittliche NVIDIA GeForce RTX 3080
  (176.2 - 181.8, n=2)
179 fps -13%
ASUS GeForce RTX 3080 ROG STRIX OC GAMING
NVIDIA GeForce RTX 3080, R9 5900X
176.2 fps -14%
Durchschnittliche NVIDIA Titan RTX
  (135 - 191.4, n=12)
173.3 fps -16%
Durchschnittliche NVIDIA GeForce RTX 2080 Ti (Desktop)
  (159.4 - 164.1, n=3)
162.2 fps -21%
Durchschnittliche NVIDIA GeForce RTX 3070
  (155.1 - 168.5, n=5)
161.2 fps -22%
KFA2 GeForce RTX 2080 Ti EX
NVIDIA GeForce RTX 2080 Ti (Desktop), R9 3900X
159.4 fps -23%
MSI GeForce RTX 3070 Gaming X Trio
NVIDIA GeForce RTX 3070, R9 5900X
155.1 fps -25%
Nvidia GeForce RTX 2080 Super
NVIDIA GeForce RTX 2080 Super (Desktop), R7 2700X
120.2 fps -42%
Durchschnittliche NVIDIA GeForce RTX 2080 Super (Desktop)
  ()
120.2 fps -42%
1920x1080 Extreme HD Preset OpenGL AA:x8
Durchschnittliche NVIDIA GeForce RTX 3090
  (158.8 - 226, n=10)
203 fps +4%
NVIDIA GeForce RTX 3080 Ti Founders Edition
NVIDIA GeForce RTX 3080 Ti, R7 5800X
195.1 (46.1min - 342.7max) fps
Durchschnittliche NVIDIA GeForce RTX 3080
  (163.8 - 172, n=2)
167.9 fps -14%
AMD Radeon RX 6900 XT
AMD Radeon RX 6900 XT, R9 5950X
167.4 (56.7min - 375.7max) fps -14%
ASUS GeForce RTX 3080 ROG STRIX OC GAMING
NVIDIA GeForce RTX 3080, R9 5900X
163.8 fps -16%
Nvidia GeForce RTX 3090 Founders Edition
NVIDIA GeForce RTX 3090, R9 5900X
158.8 fps -19%
AMD Ryzen 9 5900X
NVIDIA Titan RTX, R9 5900X
158.5 fps -19%
AMD Radeon RX 6800 XT
AMD Radeon RX 6800 XT, R9 5950X
158.2 fps -19%
Durchschnittliche NVIDIA Titan RTX
  (139.2 - 181.2, n=12)
158.1 fps -19%
Durchschnittliche NVIDIA GeForce RTX 2080 Ti (Desktop)
  (144.5 - 147.8, n=3)
145.8 fps -25%
KFA2 GeForce RTX 2080 Ti EX
NVIDIA GeForce RTX 2080 Ti (Desktop), R9 3900X
145.1 fps -26%
MSI GeForce RTX 3070 Gaming X Trio
NVIDIA GeForce RTX 3070, R9 5900X
142.9 fps -27%
Durchschnittliche NVIDIA GeForce RTX 3070
  (140.2 - 144.9, n=4)
142.7 fps -27%
Nvidia GeForce RTX 2080 Super
NVIDIA GeForce RTX 2080 Super (Desktop), R7 2700X
114.5 fps -41%
Durchschnittliche NVIDIA GeForce RTX 2080 Super (Desktop)
  ()
114.5 fps -41%
Unigine Superposition
1280x720 720p Low
Durchschnittliche NVIDIA GeForce RTX 3090
  (33329 - 54879, n=10)
46049 Points +7%
NVIDIA GeForce RTX 3080 Ti Founders Edition
NVIDIA GeForce RTX 3080 Ti, R7 5800X
43163 Points
AMD Ryzen 9 5900X
NVIDIA Titan RTX, R9 5900X
40994 Points -5%
Durchschnittliche NVIDIA Titan RTX
  (25622 - 50876, n=9)
40891 Points -5%
AMD Radeon RX 6900 XT
AMD Radeon RX 6900 XT, R9 5950X
37023 Points -14%
AMD Radeon RX 6800 XT
AMD Radeon RX 6800 XT, R9 5950X
36452 Points -16%
Nvidia GeForce RTX 3090 Founders Edition
NVIDIA GeForce RTX 3090, R9 5900X
34649 Points -20%
Durchschnittliche NVIDIA GeForce RTX 3070
  (27330 - 40007, n=5)
34576 Points -20%
MSI GeForce RTX 3070 Gaming X Trio
NVIDIA GeForce RTX 3070, R9 5900X
31666 Points -27%
Durchschnittliche NVIDIA GeForce RTX 3080
  (30851 - 32183, n=2)
31517 Points -27%
ASUS GeForce RTX 3080 ROG STRIX OC GAMING
NVIDIA GeForce RTX 3080, R9 5900X
30851 Points -29%
Durchschnittliche NVIDIA GeForce RTX 2080 Super (Desktop)
  ()
26907 Points -38%
1920x1080 1080p High
Durchschnittliche NVIDIA GeForce RTX 3090
  (23626 - 27207, n=11)
26018 Points +4%
AMD Radeon RX 6900 XT
AMD Radeon RX 6900 XT, R9 5950X
25029 Points 0%
NVIDIA GeForce RTX 3080 Ti Founders Edition
NVIDIA GeForce RTX 3080 Ti, R7 5800X
24997 Points
Nvidia GeForce RTX 3090 Founders Edition
NVIDIA GeForce RTX 3090, R9 5900X
23853 Points -5%
AMD Radeon RX 6800 XT
AMD Radeon RX 6800 XT, R9 5950X
22265 Points -11%
Durchschnittliche NVIDIA GeForce RTX 3080
  (21333 - 21912, n=2)
21623 Points -13%
ASUS GeForce RTX 3080 ROG STRIX OC GAMING
NVIDIA GeForce RTX 3080, R9 5900X
21333 Points -15%
AMD Ryzen 9 5900X
NVIDIA Titan RTX, R9 5900X
20315 Points -19%
Durchschnittliche NVIDIA Titan RTX
  (19460 - 20658, n=9)
20301 Points -19%
MSI GeForce RTX 3070 Gaming X Trio
NVIDIA GeForce RTX 3070, R9 5900X
17346 Points -31%
Durchschnittliche NVIDIA GeForce RTX 3070
  (17054 - 17491, n=5)
17312 Points -31%
Durchschnittliche NVIDIA GeForce RTX 2080 Super (Desktop)
  ()
15558 Points -38%
1920x1080 1080p Extreme
Durchschnittliche NVIDIA GeForce RTX 3090
  (11806 - 12694, n=11)
12209 Points +1%
NVIDIA GeForce RTX 3080 Ti Founders Edition
NVIDIA GeForce RTX 3080 Ti, R7 5800X
12038 Points
Nvidia GeForce RTX 3090 Founders Edition
NVIDIA GeForce RTX 3090, R9 5900X
11806 Points -2%
Durchschnittliche NVIDIA GeForce RTX 3080
  (10572 - 10822, n=2)
10697 Points -11%
AMD Radeon RX 6900 XT
AMD Radeon RX 6900 XT, R9 5950X
10683 Points -11%
ASUS GeForce RTX 3080 ROG STRIX OC GAMING
NVIDIA GeForce RTX 3080, R9 5900X
10572 Points -12%
AMD Radeon RX 6800 XT
AMD Radeon RX 6800 XT, R9 5950X
10046 Points -17%
AMD Ryzen 9 5900X
NVIDIA Titan RTX, R9 5900X
9056 Points -25%
Durchschnittliche NVIDIA Titan RTX
  (8916 - 9285, n=9)
9051 Points -25%
MSI GeForce RTX 3070 Gaming X Trio
NVIDIA GeForce RTX 3070, R9 5900X
8507 Points -29%
Durchschnittliche NVIDIA GeForce RTX 3070
  (8276 - 8507, n=5)
8354 Points -31%
Durchschnittliche NVIDIA GeForce RTX 2080 Super (Desktop)
  ()
7080 Points -41%
3840x2160 4k Optimized
Durchschnittliche NVIDIA GeForce RTX 3090
  (15794 - 16868, n=11)
16326 Points +1%
NVIDIA GeForce RTX 3080 Ti Founders Edition
NVIDIA GeForce RTX 3080 Ti, R7 5800X
16153 Points
Nvidia GeForce RTX 3090 Founders Edition
NVIDIA GeForce RTX 3090, R9 5900X
15794 Points -2%
AMD Radeon RX 6900 XT
AMD Radeon RX 6900 XT, R9 5950X
14955 Points -7%
Durchschnittliche NVIDIA GeForce RTX 3080
  (13984 - 14243, n=2)
14114 Points -13%
ASUS GeForce RTX 3080 ROG STRIX OC GAMING
NVIDIA GeForce RTX 3080, R9 5900X
13984 Points -13%
AMD Radeon RX 6800 XT
AMD Radeon RX 6800 XT, R9 5950X
13471 Points -17%
Durchschnittliche NVIDIA Titan RTX
  (11937 - 12644, n=9)
12203 Points -24%
AMD Ryzen 9 5900X
NVIDIA Titan RTX, R9 5900X
12186 Points -25%
MSI GeForce RTX 3070 Gaming X Trio
NVIDIA GeForce RTX 3070, R9 5900X
10755 Points -33%
Durchschnittliche NVIDIA GeForce RTX 3070
  (10544 - 10755, n=5)
10667 Points -34%
Durchschnittliche NVIDIA GeForce RTX 2080 Super (Desktop)
  ()
9338 Points -42%
7680x4320 8k Optimized
Durchschnittliche NVIDIA GeForce RTX 3090
  (6969 - 7521, n=11)
7144 Points +1%
NVIDIA GeForce RTX 3080 Ti Founders Edition
NVIDIA GeForce RTX 3080 Ti, R7 5800X
7095 Points
Nvidia GeForce RTX 3090 Founders Edition
NVIDIA GeForce RTX 3090, R9 5900X
7002 Points -1%
Durchschnittliche NVIDIA GeForce RTX 3080
  (6243 - 6346, n=2)
6295 Points -11%
ASUS GeForce RTX 3080 ROG STRIX OC GAMING
NVIDIA GeForce RTX 3080, R9 5900X
6243 Points -12%
AMD Radeon RX 6900 XT
AMD Radeon RX 6900 XT, R9 5950X
5764 Points -19%
AMD Ryzen 9 5900X
NVIDIA Titan RTX, R9 5900X
5402 Points -24%
Durchschnittliche NVIDIA Titan RTX
  (5255 - 5571, n=9)
5393 Points -24%
AMD Radeon RX 6800 XT
AMD Radeon RX 6800 XT, R9 5950X
5256 Points -26%
MSI GeForce RTX 3070 Gaming X Trio
NVIDIA GeForce RTX 3070, R9 5900X
4695 Points -34%
Durchschnittliche NVIDIA GeForce RTX 3070
  (4587 - 4695, n=5)
4624 Points -35%
Durchschnittliche NVIDIA GeForce RTX 2080 Super (Desktop)
  ()
3989 Points -44%
3DMark 11 Performance
41396 Punkte
3DMark Fire Strike Score
32491 Punkte
3DMark Fire Strike Extreme Score
21605 Punkte
3DMark Time Spy Score
17433 Punkte
Hilfe

Compute-Benchmarks - Gute Zugewinne gegenüber der RTX 3080 und RX 6900 XT

Die RTX 3080 Ti hat im ComputeMark insgesamt nur einen sehr geringen Vorsprung gegenüber der durchschnittlichen RTX 3090, ist aber 16 % schneller als die durchschnittliche RTX 3080 und die RX 6900 XT. Ein ähnlicher Trend ist auch im LuxMark Room GPU Test zu sehen. Im LuxMark Sala GPU Test hat AMD jedoch einen sehr deutlichen Vorsprung vor allen NVIDIA Angeboten. Während die RTX 3080 Ti im Sala GPU Test etwa 15 % schneller ist als der Durchschnitt, liegt sie 53 % hinter der Radeon RX 6900 XT.

In den Geekbench-Compute-Tests liegt die RTX 3080 Ti insgesamt gut in Führung. In OpenCL befindet sie sich gleichauf mit der RTX 3090, ist aber interessanterweise 27 % schneller in der Vulkan Version des Tests.

ComputeMark v2.1
1024x600 Normal, QJuliaRayTrace
Durchschnittliche NVIDIA GeForce RTX 3090
  (16403 - 18223, n=10)
17454 Points +2%
NVIDIA GeForce RTX 3080 Ti Founders Edition
NVIDIA GeForce RTX 3080 Ti, R7 5800X
17050 Points
Nvidia GeForce RTX 3090 Founders Edition
NVIDIA GeForce RTX 3090, R9 5900X
16543 Points -3%
Durchschnittliche NVIDIA GeForce RTX 3080
  (14718 - 15508, n=2)
15113 Points -11%
ASUS GeForce RTX 3080 ROG STRIX OC GAMING
NVIDIA GeForce RTX 3080, R9 5900X
14718 Points -14%
AMD Radeon RX 6900 XT
AMD Radeon RX 6900 XT, R9 5950X
12255 Points -28%
MSI GeForce RTX 3070 Gaming X Trio
NVIDIA GeForce RTX 3070, R9 5900X
11816 Points -31%
Durchschnittliche NVIDIA GeForce RTX 3070
  (11510 - 11816, n=3)
11665 Points -32%
AMD Radeon RX 6800 XT
AMD Radeon RX 6800 XT, R9 5950X
11304 Points -34%
Durchschnittliche NVIDIA Titan RTX
  (9418 - 10129, n=3)
9748 Points -43%
Durchschnittliche NVIDIA GeForce RTX 2080 Ti (Desktop)
  (9104 - 9690, n=3)
9492 Points -44%
KFA2 GeForce RTX 2080 Ti EX
NVIDIA GeForce RTX 2080 Ti (Desktop), R9 3900X
9104 Points -47%
Nvidia GeForce RTX 2080 Super
NVIDIA GeForce RTX 2080 Super (Desktop), R7 2700X
7258 Points -57%
1024x600 Normal, Mandel Scalar
Durchschnittliche NVIDIA GeForce RTX 3090
  (10650 - 11564, n=10)
11162 Points +1%
NVIDIA GeForce RTX 3080 Ti Founders Edition
NVIDIA GeForce RTX 3080 Ti, R7 5800X
11049 Points
AMD Radeon RX 6900 XT
AMD Radeon RX 6900 XT, R9 5950X
10834 Points -2%
Nvidia GeForce RTX 3090 Founders Edition
NVIDIA GeForce RTX 3090, R9 5900X
10650 Points -4%
AMD Radeon RX 6800 XT
AMD Radeon RX 6800 XT, R9 5950X
10018 Points -9%
Durchschnittliche NVIDIA GeForce RTX 3080
  (9554 - 9938, n=2)
9746 Points -12%
ASUS GeForce RTX 3080 ROG STRIX OC GAMING
NVIDIA GeForce RTX 3080, R9 5900X
9554 Points -14%
MSI GeForce RTX 3070 Gaming X Trio
NVIDIA GeForce RTX 3070, R9 5900X
7314 Points -34%
Durchschnittliche NVIDIA GeForce RTX 3070
  (7042 - 7314, n=3)
7169 Points -35%
Durchschnittliche NVIDIA Titan RTX
  (5977 - 6406, n=3)
6184 Points -44%
Durchschnittliche NVIDIA GeForce RTX 2080 Ti (Desktop)
  (5679 - 6226, n=3)
6010 Points -46%
KFA2 GeForce RTX 2080 Ti EX
NVIDIA GeForce RTX 2080 Ti (Desktop), R9 3900X
5679 Points -49%
Nvidia GeForce RTX 2080 Super
NVIDIA GeForce RTX 2080 Super (Desktop), R7 2700X
4525 Points -59%
1024x600 Normal, Mandel Vector
NVIDIA GeForce RTX 3080 Ti Founders Edition
NVIDIA GeForce RTX 3080 Ti, R7 5800X
9513 Points
Durchschnittliche NVIDIA GeForce RTX 3090
  (8038 - 10097, n=10)
9467 Points 0%
Nvidia GeForce RTX 3090 Founders Edition
NVIDIA GeForce RTX 3090, R9 5900X
9236 Points -3%
AMD Radeon RX 6900 XT
AMD Radeon RX 6900 XT, R9 5950X
8690 Points -9%
AMD Radeon RX 6800 XT
AMD Radeon RX 6800 XT, R9 5950X
8399 Points -12%
Durchschnittliche NVIDIA GeForce RTX 3080
  (7148 - 7540, n=2)
7344 Points -23%
ASUS GeForce RTX 3080 ROG STRIX OC GAMING
NVIDIA GeForce RTX 3080, R9 5900X
7148 Points -25%
Durchschnittliche NVIDIA GeForce RTX 3070
  (5364 - 6266, n=3)
5707 Points -40%
MSI GeForce RTX 3070 Gaming X Trio
NVIDIA GeForce RTX 3070, R9 5900X
5490 Points -42%
Durchschnittliche NVIDIA Titan RTX
  (4944 - 5440, n=3)
5158 Points -46%
Durchschnittliche NVIDIA GeForce RTX 2080 Ti (Desktop)
  (4695 - 5092, n=3)
4941 Points -48%
KFA2 GeForce RTX 2080 Ti EX
NVIDIA GeForce RTX 2080 Ti (Desktop), R9 3900X
4695 Points -51%
Nvidia GeForce RTX 2080 Super
NVIDIA GeForce RTX 2080 Super (Desktop), R7 2700X
3835 Points -60%
1024x600 Normal, Fluid 2DTexArr
Durchschnittliche NVIDIA GeForce RTX 3090
  (4344 - 4608, n=10)
4492 Points +1%
NVIDIA GeForce RTX 3080 Ti Founders Edition
NVIDIA GeForce RTX 3080 Ti, R7 5800X
4453 Points
Nvidia GeForce RTX 3090 Founders Edition
NVIDIA GeForce RTX 3090, R9 5900X
4344 Points -2%
Durchschnittliche NVIDIA GeForce RTX 3080
  (4087 - 4159, n=2)
4123 Points -7%
ASUS GeForce RTX 3080 ROG STRIX OC GAMING
NVIDIA GeForce RTX 3080, R9 5900X
4087 Points -8%
AMD Radeon RX 6800 XT
AMD Radeon RX 6800 XT, R9 5950X
3947 Points -11%
AMD Radeon RX 6900 XT
AMD Radeon RX 6900 XT, R9 5950X
3924 Points -12%
Durchschnittliche NVIDIA Titan RTX
  (3691 - 3828, n=3)
3757 Points -16%
Durchschnittliche NVIDIA GeForce RTX 2080 Ti (Desktop)
  (3444 - 3539, n=3)
3499 Points -21%
KFA2 GeForce RTX 2080 Ti EX
NVIDIA GeForce RTX 2080 Ti (Desktop), R9 3900X
3444 Points -23%
MSI GeForce RTX 3070 Gaming X Trio
NVIDIA GeForce RTX 3070, R9 5900X
2704 Points -39%
Durchschnittliche NVIDIA GeForce RTX 3070
  (2666 - 2706, n=3)
2692 Points -40%
Nvidia GeForce RTX 2080 Super
NVIDIA GeForce RTX 2080 Super (Desktop), R7 2700X
2655 Points -40%
1024x600 Normal, Fluid 3DTex
Durchschnittliche NVIDIA GeForce RTX 3090
  (5246 - 5520, n=10)
5448 Points +3%
NVIDIA GeForce RTX 3080 Ti Founders Edition
NVIDIA GeForce RTX 3080 Ti, R7 5800X
5312 Points
Nvidia GeForce RTX 3090 Founders Edition
NVIDIA GeForce RTX 3090, R9 5900X
5246 Points -1%
AMD Radeon RX 6800 XT
AMD Radeon RX 6800 XT, R9 5950X
5154 Points -3%
AMD Radeon RX 6900 XT
AMD Radeon RX 6900 XT, R9 5950X
5154 Points -3%
Durchschnittliche NVIDIA GeForce RTX 3080
  (4417 - 4450, n=2)
4434 Points -17%
ASUS GeForce RTX 3080 ROG STRIX OC GAMING
NVIDIA GeForce RTX 3080, R9 5900X
4417 Points -17%
Durchschnittliche NVIDIA Titan RTX
  (3877 - 4027, n=3)
3955 Points -26%
Durchschnittliche NVIDIA GeForce RTX 2080 Ti (Desktop)
  (3589 - 3653, n=3)
3625 Points -32%
KFA2 GeForce RTX 2080 Ti EX
NVIDIA GeForce RTX 2080 Ti (Desktop), R9 3900X
3589 Points -32%
MSI GeForce RTX 3070 Gaming X Trio
NVIDIA GeForce RTX 3070, R9 5900X
2776 Points -48%
Durchschnittliche NVIDIA GeForce RTX 3070
  (2749 - 2791, n=3)
2772 Points -48%
Nvidia GeForce RTX 2080 Super
NVIDIA GeForce RTX 2080 Super (Desktop), R7 2700X
2736 Points -48%
1024x600 Normal, Score
Durchschnittliche NVIDIA GeForce RTX 3090
  (44948 - 49118, n=9)
47804 Points +1%
NVIDIA GeForce RTX 3080 Ti Founders Edition
NVIDIA GeForce RTX 3080 Ti, R7 5800X
47377 Points
Nvidia GeForce RTX 3090 Founders Edition
NVIDIA GeForce RTX 3090, R9 5900X
46018 Points -3%
AMD Radeon RX 6900 XT
AMD Radeon RX 6900 XT, R9 5950X
40857 Points -14%
Durchschnittliche NVIDIA GeForce RTX 3080
  (39924 - 41594, n=2)
40759 Points -14%
ASUS GeForce RTX 3080 ROG STRIX OC GAMING
NVIDIA GeForce RTX 3080, R9 5900X
39924 Points -16%
AMD Radeon RX 6800 XT
AMD Radeon RX 6800 XT, R9 5950X
38823 Points -18%
MSI GeForce RTX 3070 Gaming X Trio
NVIDIA GeForce RTX 3070, R9 5900X
30100 Points -36%
Durchschnittliche NVIDIA GeForce RTX 3070
  (29330 - 30581, n=3)
30004 Points -37%
Durchschnittliche NVIDIA Titan RTX
  (27907 - 29830, n=3)
28802 Points -39%
Durchschnittliche NVIDIA GeForce RTX 2080 Ti (Desktop)
  (26510 - 28145, n=3)
27567 Points -42%
KFA2 GeForce RTX 2080 Ti EX
NVIDIA GeForce RTX 2080 Ti (Desktop), R9 3900X
26510 Points -44%
Nvidia GeForce RTX 2080 Super
NVIDIA GeForce RTX 2080 Super (Desktop), R7 2700X
21009 Points -56%
LuxMark v2.0 64Bit
Room GPUs-only
Durchschnittliche NVIDIA GeForce RTX 3090
  (5727 - 5985, n=9)
5893 Samples/s +2%
Nvidia GeForce RTX 3090 Founders Edition
NVIDIA GeForce RTX 3090, R9 5900X
5808 Samples/s +1%
NVIDIA GeForce RTX 3080 Ti Founders Edition
NVIDIA GeForce RTX 3080 Ti, R7 5800X
5772 Samples/s
Durchschnittliche NVIDIA GeForce RTX 3080
  (5112 - 5198, n=2)
5155 Samples/s -11%
ASUS GeForce RTX 3080 ROG STRIX OC GAMING
NVIDIA GeForce RTX 3080, R9 5900X
5112 Samples/s -11%
AMD Radeon RX 6900 XT
AMD Radeon RX 6900 XT, R9 5950X
5084 Samples/s -12%
AMD Radeon RX 6800 XT
AMD Radeon RX 6800 XT, R9 5950X
5057 Samples/s -12%
Durchschnittliche NVIDIA Titan RTX
  (4643 - 4703, n=2)
4673 Samples/s -19%
Durchschnittliche NVIDIA GeForce RTX 2080 Ti (Desktop)
  (4425 - 4494, n=3)
4449 Samples/s -23%
KFA2 GeForce RTX 2080 Ti EX
NVIDIA GeForce RTX 2080 Ti (Desktop), R9 3900X
4429 Samples/s -23%
MSI GeForce RTX 3070 Gaming X Trio
NVIDIA GeForce RTX 3070, R9 5900X
4293 Samples/s -26%
Durchschnittliche NVIDIA GeForce RTX 3070
  (2187 - 4293, n=3)
3588 Samples/s -38%
Nvidia GeForce RTX 2080 Super
NVIDIA GeForce RTX 2080 Super (Desktop), R7 2700X
3430 Samples/s -41%
Sala GPUs-only
AMD Radeon RX 6900 XT
AMD Radeon RX 6900 XT, R9 5950X
31400 Samples/s +111%
AMD Radeon RX 6800 XT
AMD Radeon RX 6800 XT, R9 5950X
28023 Samples/s +88%
Durchschnittliche NVIDIA GeForce RTX 3090
  (14590 - 15242, n=9)
14945 Samples/s 0%
NVIDIA GeForce RTX 3080 Ti Founders Edition
NVIDIA GeForce RTX 3080 Ti, R7 5800X
14871 Samples/s
Nvidia GeForce RTX 3090 Founders Edition
NVIDIA GeForce RTX 3090, R9 5900X
14670 Samples/s -1%
Durchschnittliche NVIDIA GeForce RTX 3080
  (12797 - 12980, n=2)
12889 Samples/s -13%
ASUS GeForce RTX 3080 ROG STRIX OC GAMING
NVIDIA GeForce RTX 3080, R9 5900X
12797 Samples/s -14%
Durchschnittliche NVIDIA Titan RTX
  (10799 - 10996, n=2)
10898 Samples/s -27%
Durchschnittliche NVIDIA GeForce RTX 2080 Ti (Desktop)
  (9999 - 10291, n=3)
10156 Samples/s -32%
MSI GeForce RTX 3070 Gaming X Trio
NVIDIA GeForce RTX 3070, R9 5900X
10115 Samples/s -32%
Durchschnittliche NVIDIA GeForce RTX 3070
  (10096 - 10115, n=3)
10107 Samples/s -32%
KFA2 GeForce RTX 2080 Ti EX
NVIDIA GeForce RTX 2080 Ti (Desktop), R9 3900X
9999 Samples/s -33%
Nvidia GeForce RTX 2080 Super
NVIDIA GeForce RTX 2080 Super (Desktop), R7 2700X
7878 Samples/s -47%
Geekbench 5.5
OpenCL Score
Durchschnittliche NVIDIA GeForce RTX 3090
  (199930 - 224611, n=19)
214008 Points 0%
NVIDIA GeForce RTX 3080 Ti Founders Edition
NVIDIA GeForce RTX 3080 Ti, R7 5800X
213283 Points
Nvidia GeForce RTX 3090 Founders Edition
NVIDIA GeForce RTX 3090, R9 5900X
199930 Points -6%
ASUS GeForce RTX 3080 ROG STRIX OC GAMING
NVIDIA GeForce RTX 3080, R9 5900X
192091 Points -10%
Durchschnittliche NVIDIA GeForce RTX 3080
  (164477 - 192091, n=2)
178284 Points -16%
AMD Radeon RX 6900 XT
AMD Radeon RX 6900 XT, R9 5950X
172661 Points -19%
AMD Radeon RX 6800 XT
AMD Radeon RX 6800 XT, R9 5950X
159072 Points -25%
AMD Ryzen 9 5900X
NVIDIA Titan RTX, R9 5900X
149070 Points -30%
Durchschnittliche NVIDIA Titan RTX
  (132850 - 153940, n=20)
140450 Points -34%
Durchschnittliche NVIDIA GeForce RTX 3070
  (134961 - 138625, n=4)
136574 Points -36%
MSI GeForce RTX 3070 Gaming X Trio
NVIDIA GeForce RTX 3070, R9 5900X
136521 Points -36%
Vulkan Score
NVIDIA GeForce RTX 3080 Ti Founders Edition
NVIDIA GeForce RTX 3080 Ti, R7 5800X
187800 Points
Nvidia GeForce RTX 3090 Founders Edition
NVIDIA GeForce RTX 3090, R9 5900X
147831 Points -21%
Durchschnittliche NVIDIA GeForce RTX 3090
  (62516 - 168974, n=19)
128422 Points -32%
Durchschnittliche NVIDIA Titan RTX
  (70085 - 138172, n=20)
92754 Points -51%
AMD Radeon RX 6900 XT
AMD Radeon RX 6900 XT, R9 5950X
88587 Points -53%
AMD Radeon RX 6800 XT
AMD Radeon RX 6800 XT, R9 5950X
81098 Points -57%
Durchschnittliche NVIDIA GeForce RTX 3080
  (76596 - 83486, n=2)
80041 Points -57%
AMD Ryzen 9 5900X
NVIDIA Titan RTX, R9 5900X
76596 Points -59%
ASUS GeForce RTX 3080 ROG STRIX OC GAMING
NVIDIA GeForce RTX 3080, R9 5900X
76596 Points -59%
Durchschnittliche NVIDIA GeForce RTX 3070
  (27460 - 107958, n=4)
71908 Points -62%
MSI GeForce RTX 3070 Gaming X Trio
NVIDIA GeForce RTX 3070, R9 5900X
62516 Points -67%

Spiele-Benchmarks - RTX 3080 Ti erzielt einen Homerun bei 4K Ultra

NVIDIA bewirbt die RTX 3080 Ti als das Flaggschiff unter den Gaming-GPUs, und sie enttäuscht nicht. Eine ganze Reihe von Titeln sind bei 4K mit voll ausgeschöpften Einstellungen nahe der 100-fps-Marke spielbar. Nur eine Handvoll Spiele wie Cyberpunk 2077 (DLSS aus), Total War: Three Kingdoms und Watch Dogs: Legion (DLSS aus) kämpfen damit, den 60-fps-Sweet-Spot bei 4K Ultra zu erreichen. Diejenigen, die das Beste aus ihren Displays mit hoher Bildwiederholrate herausholen wollen, können die Auflösung auf 1.440p reduzieren.

Im Großen und Ganzen liegt die RTX 3080 Ti FE innerhalb der Fehlergrenze der RTX 3090 Gaming Performance. Die leichte Reduzierung der CUDA-Kerne und die Halbierung des Speichers der RTX 3090 scheint bei aktuellen Titeln vernachlässigbare Auswirkungen zu haben. Das ist eine gute Sache, da es eine direkte Einsparung von 300 US-Dollar (bei MSRP!) gegenüber der RTX 3090 bedeutet, wenn das primär genutzte Gehäuse 4K Ultra 60 fps+ Gaming ist.

Wir haben festgestellt, dass die RTX 3080 Ti zwischen 11 und 22% schneller ist als die Radeon RX 6900 XT in unserer Spiele-Test-Suite. Allerdings hatten die Radeon-RDNA-2-Karten einen Vorteil in Assassin's Creed Walhalla (+11 %, 6900 XT) und Hitman 3 (+7 %, 6900 XT).

Wir testeten die Raytracing-Leistung in Titeln wie Call of Duty: Black Ops Cold War, Metro Exodus, Resident Evil Village und Control mit ausgeschaltetem DLSS, und interessanterweise schien die RTX 3080 Ti sogar gegenüber der RTX 3090 mit RT On spürbare Vorteile zu bieten. Im Vergleich zur RTX 3080 sehen wir je nach Auflösung einen Anstieg der RT-Leistung zwischen 12 und 21 %.

NVIDIA scheint einen guten Job mit der Thermik gemacht zu haben, wie die ziemlich konstante Leistung nahe der 174-fps-Marke zeigt, die im The Witcher 3 Stresstest bei 1080p Ultra beobachtet wird. Allerdings stellen wir fest, dass die Karte es sich leisten kann, höhere fps zu erreichen, wenn auch nur für einen kurzen Zeitraum von etwa fünf Minuten, bevor sie wieder auf den ursprünglichen Wert zurückfällt. Dies könnte wahrscheinlich auf eine opportunistische Takterhöhung an dieser Stelle während des Stresstests zurückzuführen sein.

163173183Tooltip
NVIDIA GeForce RTX 3080 Ti Founders Edition NVIDIA GeForce RTX 3080 Ti, R7 5800X: Ø169.6 (163-187)
The Witcher 3
3840x2160 High Graphics & Postprocessing (Nvidia HairWorks Off)
Durchschnittliche NVIDIA GeForce RTX 3090
  (128 - 160.2, n=12)
151.5 fps +2%
NVIDIA GeForce RTX 3080 Ti Founders Edition
NVIDIA GeForce RTX 3080 Ti, R7 5800X
149 (132min, 132.59P1 - 161max) fps
Nvidia GeForce RTX 3090 Founders Edition
NVIDIA GeForce RTX 3090, R9 5900X
148 fps -1%
AMD Radeon RX 6900 XT
AMD Radeon RX 6900 XT, R9 5950X
122 (105min, 105P1 - 134max) fps -18%
ASUS GeForce RTX 3080 ROG STRIX OC GAMING
NVIDIA GeForce RTX 3080, R9 5900X
115 (107min - 124max) fps -23%
Durchschnittliche NVIDIA GeForce RTX 3080
  (114 - 115, n=2)
114.5 fps -23%
AMD Radeon RX 6800 XT
AMD Radeon RX 6800 XT, R9 5950X
110 (97min - 117max) fps -26%
AMD Ryzen 9 5900X
NVIDIA Titan RTX, R9 5900X
104 (97min - 112max) fps -30%
Durchschnittliche NVIDIA Titan RTX
  (94 - 107.1, n=28)
102.4 fps -31%
Durchschnittliche NVIDIA GeForce RTX 2080 Ti (Desktop)
  (96 - 101, n=3)
98.3 fps -34%
KFA2 GeForce RTX 2080 Ti EX
NVIDIA GeForce RTX 2080 Ti (Desktop), R9 3900X
96 (87min - 109max) fps -36%
Durchschnittliche NVIDIA GeForce RTX 3070
  (84 - 93.9, n=5)
89.3 fps -40%
MSI GeForce RTX 3070 Gaming X Trio
NVIDIA GeForce RTX 3070, R9 5900X
88.2 (82min - 97max) fps -41%
Nvidia GeForce RTX 2080 Super
NVIDIA GeForce RTX 2080 Super (Desktop), R7 2700X
79 (71min - 87max) fps -47%
Durchschnittliche NVIDIA GeForce RTX 2080 Super (Desktop)
  ()
79 fps -47%
Nvidia GeForce RTX 2070 Super
NVIDIA GeForce RTX 2070 Super (Desktop), R7 2700X
68 (61min - 74max) fps -54%
3840x2160 Ultra Graphics & Postprocessing (HBAO+)
Durchschnittliche NVIDIA GeForce RTX 3090
  (85.4 - 98.5, n=8)
93.4 fps 0%
NVIDIA GeForce RTX 3080 Ti Founders Edition
NVIDIA GeForce RTX 3080 Ti, R7 5800X
93.2 (86min, 86P1 - 103max) fps
Nvidia GeForce RTX 3090 Founders Edition
NVIDIA GeForce RTX 3090, R9 5900X
91.8 fps -2%
Durchschnittliche NVIDIA GeForce RTX 3080
  (78 - 85.7, n=2)
81.9 fps -12%
ASUS GeForce RTX 3080 ROG STRIX OC GAMING
NVIDIA GeForce RTX 3080, R9 5900X
78 (72min - 83max) fps -16%
AMD Radeon RX 6900 XT
AMD Radeon RX 6900 XT, R9 5950X
76.6 (70min, 70P1 - 84max) fps -18%
Durchschnittliche NVIDIA Titan RTX
  ()
71.8 fps -23%
Durchschnittliche NVIDIA GeForce RTX 2080 Ti (Desktop)
  (65 - 67, n=3)
65.7 fps -30%
KFA2 GeForce RTX 2080 Ti EX
NVIDIA GeForce RTX 2080 Ti (Desktop), R9 3900X
65 (59min - 71max) fps -30%
Durchschnittliche NVIDIA GeForce RTX 3070
  (59 - 60.3, n=2)
59.7 fps -36%
Nvidia GeForce RTX 2080 Super
NVIDIA GeForce RTX 2080 Super (Desktop), R7 2700X
55.2 (49min - 61max) fps -41%
Durchschnittliche NVIDIA GeForce RTX 2080 Super (Desktop)
  (55.2 - 55.2, n=2)
55.2 fps -41%
Nvidia GeForce RTX 2070 Super
NVIDIA GeForce RTX 2070 Super (Desktop), R7 2700X
46.3 (41min - 50max) fps -50%
1920x1080 Ultra Graphics & Postprocessing (HBAO+)
Durchschnittliche NVIDIA GeForce RTX 3090
  (160 - 192.6, n=16)
179.9 fps +3%
NVIDIA GeForce RTX 3080 Ti Founders Edition
NVIDIA GeForce RTX 3080 Ti, R7 5800X
174 (163min, 165P1 - 187max) fps
Nvidia GeForce RTX 3090 Founders Edition
NVIDIA GeForce RTX 3090, R9 5900X
171.5 fps -1%
AMD Radeon RX 6900 XT
AMD Radeon RX 6900 XT, R9 5950X
163.6 (139min - 179max) fps -6%
AMD Radeon RX 6800 XT
AMD Radeon RX 6800 XT, R9 5950X
160 (138min - 179max) fps -8%
ASUS GeForce RTX 3080 ROG STRIX OC GAMING
NVIDIA GeForce RTX 3080, R9 5900X
152 (138min - 171max) fps -13%
Durchschnittliche NVIDIA GeForce RTX 3080
  (145 - 152, n=2)
148.5 fps -15%
AMD Ryzen 9 5900X
NVIDIA Titan RTX, R9 5900X
141 (127min - 154max) fps -19%
Durchschnittliche NVIDIA Titan RTX
  (124 - 150, n=28)
137.7 fps -21%
KFA2 GeForce RTX 2080 Ti EX
NVIDIA GeForce RTX 2080 Ti (Desktop), R9 3900X
135 (118min - 158max) fps -22%
Durchschnittliche NVIDIA GeForce RTX 2080 Ti (Desktop)
  (131 - 136, n=3)
134 fps -23%
MSI GeForce RTX 3070 Gaming X Trio
NVIDIA GeForce RTX 3070, R9 5900X
122 (110min - 138max) fps -30%
Nvidia GeForce RTX 2080 Super
NVIDIA GeForce RTX 2080 Super (Desktop), R7 2700X
109 (81min - 123max) fps -37%
Durchschnittliche NVIDIA GeForce RTX 2080 Super (Desktop)
  ()
109 fps -37%
Durchschnittliche NVIDIA GeForce RTX 3070
  (52.8 - 132.2, n=7)
106.1 fps -39%
Nvidia GeForce RTX 2070 Super
NVIDIA GeForce RTX 2070 Super (Desktop), R7 2700X
97 (83min - 109max) fps -44%
Assassin´s Creed Valhalla
3840x2160 Ultra High Preset
AMD Radeon RX 6900 XT
AMD Radeon RX 6900 XT, R9 5950X (SAM ENABLED)
68 (33min - 230max) fps +11%
AMD Radeon RX 6900 XT
AMD Radeon RX 6900 XT, R9 5950X
63 (32min - 219max) fps +3%
AMD Radeon RX 6800 XT
AMD Radeon RX 6800 XT, R9 5950X
65 (33min - 179max) fps +7%
Durchschnittliche NVIDIA GeForce RTX 3090
  (55 - 74, n=3)
62 fps +2%
NVIDIA GeForce RTX 3080 Ti Founders Edition
NVIDIA GeForce RTX 3080 Ti, R7 5800X
61 (26min - 135max) fps
Nvidia GeForce RTX 3090 Founders Edition
NVIDIA GeForce RTX 3090, R9 5900X
57 (36min - 113max) fps -7%
Durchschnittliche NVIDIA GeForce RTX 3080
  ()
52 fps -15%
MSI GeForce RTX 3070 Gaming X Trio
NVIDIA GeForce RTX 3070, R9 5900X
47 (31min - 92max) fps -23%
Durchschnittliche NVIDIA GeForce RTX 2080 Ti (Desktop)
  ()
46 fps -25%
Durchschnittliche NVIDIA GeForce RTX 3070
  (42 - 47, n=3)
44 fps -28%
AMD Ryzen 9 5900X
NVIDIA Titan RTX, R9 5900X
43 fps -30%
Durchschnittliche NVIDIA Titan RTX
  ()
43 fps -30%
Durchschnittliche NVIDIA GeForce RTX 2080 Super (Desktop)
  ()
36 fps -41%
2560x1440 Ultra High Preset
AMD Radeon RX 6900 XT
AMD Radeon RX 6900 XT, R9 5950X (SAM ENABLED)
115 (41min - 242max) fps +34%
AMD Radeon RX 6900 XT
AMD Radeon RX 6900 XT, R9 5950X
102 (40min - 239max) fps +19%
AMD Radeon RX 6800 XT
AMD Radeon RX 6800 XT, R9 5950X
98 (25min - 211max) fps +14%
Durchschnittliche NVIDIA GeForce RTX 3090
  (76 - 120, n=3)
91.7 fps +7%
NVIDIA GeForce RTX 3080 Ti Founders Edition
NVIDIA GeForce RTX 3080 Ti, R7 5800X
86 (43min - 145max) fps
Nvidia GeForce RTX 3090 Founders Edition
NVIDIA GeForce RTX 3090, R9 5900X
79 (44min - 135max) fps -8%
Durchschnittliche NVIDIA GeForce RTX 3080
  ()
76 fps -12%
MSI GeForce RTX 3070 Gaming X Trio
NVIDIA GeForce RTX 3070, R9 5900X
67 (39min - 124max) fps -22%
Durchschnittliche NVIDIA GeForce RTX 2080 Ti (Desktop)
  ()
67 fps -22%
AMD Ryzen 9 5900X
NVIDIA Titan RTX, R9 5900X
66 fps -23%
Durchschnittliche NVIDIA Titan RTX
  ()
66 fps -23%
Durchschnittliche NVIDIA GeForce RTX 3070
  (65 - 67, n=3)
65.7 fps -24%
Durchschnittliche NVIDIA GeForce RTX 2080 Super (Desktop)
  ()
57 fps -34%
1920x1080 Ultra High Preset
AMD Radeon RX 6900 XT
AMD Radeon RX 6900 XT, R9 5950X (SAM ENABLED)
148 (44min - 248max) fps +48%
AMD Radeon RX 6900 XT
AMD Radeon RX 6900 XT, R9 5950X
125 (43min - 252max) fps +25%
AMD Radeon RX 6800 XT
AMD Radeon RX 6800 XT, R9 5950X
118 (29min - 255max) fps +18%
Durchschnittliche NVIDIA GeForce RTX 3090
  (88 - 152, n=3)
110.3 fps +10%
NVIDIA GeForce RTX 3080 Ti Founders Edition
NVIDIA GeForce RTX 3080 Ti, R7 5800X
100 (50min - 150max) fps
Nvidia GeForce RTX 3090 Founders Edition
NVIDIA GeForce RTX 3090, R9 5900X
91 (48min - 158max) fps -9%
Durchschnittliche NVIDIA GeForce RTX 3080
  ()
88 fps -12%
AMD Ryzen 9 5900X
NVIDIA Titan RTX, R9 5900X
80 fps -20%
Durchschnittliche NVIDIA Titan RTX
  ()
80 fps -20%
Durchschnittliche NVIDIA GeForce RTX 2080 Ti (Desktop)
  ()
80 fps -20%
Durchschnittliche NVIDIA GeForce RTX 3070
  (77 - 80, n=3)
78.3 fps -22%
MSI GeForce RTX 3070 Gaming X Trio
NVIDIA GeForce RTX 3070, R9 5900X
78 (15min - 139max) fps -22%
Durchschnittliche NVIDIA GeForce RTX 2080 Super (Desktop)
  ()
70 fps -30%
The Division 2
3840x2160 Ultra Preset
NVIDIA GeForce RTX 3080 Ti Founders Edition
NVIDIA GeForce RTX 3080 Ti, R7 5800X
76.6 (36.8min, 55.9P1) fps
Durchschnittliche NVIDIA GeForce RTX 3090
  (71.9 - 78, n=4)
74.9 fps -2%
Nvidia GeForce RTX 3090 Founders Edition
NVIDIA GeForce RTX 3090, R9 5900X
72 fps -6%
AMD Radeon RX 6900 XT
AMD Radeon RX 6900 XT, R9 5950X
66.6 (40.2min, 54.6P1) fps -13%
ASUS GeForce RTX 3080 ROG STRIX OC GAMING
NVIDIA GeForce RTX 3080, R9 5900X
65 fps -15%
Durchschnittliche NVIDIA GeForce RTX 3080
  ()
65 fps -15%
AMD Radeon RX 6800 XT
AMD Radeon RX 6800 XT, R9 5950X
63.2 (34.5min, 54.1P1) fps -17%
Durchschnittliche NVIDIA Titan RTX
  ()
62 fps -19%
Durchschnittliche NVIDIA GeForce RTX 2080 Ti (Desktop)
  (53 - 57, n=3)
55.3 fps -28%
KFA2 GeForce RTX 2080 Ti EX
NVIDIA GeForce RTX 2080 Ti (Desktop), R9 3900X
53 fps -31%
MSI GeForce RTX 3070 Gaming X Trio
NVIDIA GeForce RTX 3070, R9 5900X
49 fps -36%
Durchschnittliche NVIDIA GeForce RTX 3070
  ()
49 fps -36%
Nvidia GeForce RTX 2080 Super
NVIDIA GeForce RTX 2080 Super (Desktop), R7 2700X
45 fps -41%
Durchschnittliche NVIDIA GeForce RTX 2080 Super (Desktop)
  (43 - 45, n=2)
44 fps -43%
Nvidia GeForce RTX 2070 Super
NVIDIA GeForce RTX 2070 Super (Desktop), R7 2700X
39 fps -49%
2560x1440 Ultra Preset
Durchschnittliche NVIDIA GeForce RTX 3090
  (120 - 136, n=4)
126.3 fps +4%
Nvidia GeForce RTX 3090 Founders Edition
NVIDIA GeForce RTX 3090, R9 5900X
121 fps 0%
NVIDIA GeForce RTX 3080 Ti Founders Edition
NVIDIA GeForce RTX 3080 Ti, R7 5800X
121 (43.3min, 63.3P1) fps
AMD Radeon RX 6900 XT
AMD Radeon RX 6900 XT, R9 5950X
118 (51.3min, 70.9P1) fps -2%
AMD Radeon RX 6800 XT
AMD Radeon RX 6800 XT, R9 5950X
114 (52.4min, 73P1) fps -6%
ASUS GeForce RTX 3080 ROG STRIX OC GAMING
NVIDIA GeForce RTX 3080, R9 5900X
107 fps -12%
Durchschnittliche NVIDIA GeForce RTX 3080
  ()
107 fps -12%
Durchschnittliche NVIDIA Titan RTX
  ()
102 fps -16%
Durchschnittliche NVIDIA GeForce RTX 2080 Ti (Desktop)
  (92 - 100, n=3)
96.3 fps -20%
KFA2 GeForce RTX 2080 Ti EX
NVIDIA GeForce RTX 2080 Ti (Desktop), R9 3900X
92 fps -24%
MSI GeForce RTX 3070 Gaming X Trio
NVIDIA GeForce RTX 3070, R9 5900X
82 fps -32%
Durchschnittliche NVIDIA GeForce RTX 3070
  ()
82 fps -32%
Nvidia GeForce RTX 2080 Super
NVIDIA GeForce RTX 2080 Super (Desktop), R7 2700X
79 fps -35%
Durchschnittliche NVIDIA GeForce RTX 2080 Super (Desktop)
  ()
79 fps -35%
Nvidia GeForce RTX 2070 Super
NVIDIA GeForce RTX 2070 Super (Desktop), R7 2700X
69 fps -43%
1920x1080 Ultra Preset
Durchschnittliche NVIDIA GeForce RTX 3090
  (140 - 180, n=4)
158 fps +10%
Nvidia GeForce RTX 3090 Founders Edition
NVIDIA GeForce RTX 3090, R9 5900X
152 fps +6%
NVIDIA GeForce RTX 3080 Ti Founders Edition
NVIDIA GeForce RTX 3080 Ti, R7 5800X
143 (43.5min, 71.9P1) fps
ASUS GeForce RTX 3080 ROG STRIX OC GAMING
NVIDIA GeForce RTX 3080, R9 5900X
140 fps -2%
Durchschnittliche NVIDIA GeForce RTX 3080
  ()
140 fps -2%
AMD Radeon RX 6800 XT
AMD Radeon RX 6800 XT, R9 5950X
138 (45.5min, 74.1P1) fps -3%
AMD Radeon RX 6900 XT
AMD Radeon RX 6900 XT, R9 5950X
138 (54.9min, 75.2P1) fps -3%
Durchschnittliche NVIDIA GeForce RTX 2080 Ti (Desktop)
  (123 - 133, n=3)
127 fps -11%
KFA2 GeForce RTX 2080 Ti EX
NVIDIA GeForce RTX 2080 Ti (Desktop), R9 3900X
123 fps -14%
Durchschnittliche NVIDIA Titan RTX
  ()
113 fps -21%
MSI GeForce RTX 3070 Gaming X Trio
NVIDIA GeForce RTX 3070, R9 5900X
112 fps -22%
Durchschnittliche NVIDIA GeForce RTX 3070
  ()
112 fps -22%
Nvidia GeForce RTX 2080 Super
NVIDIA GeForce RTX 2080 Super (Desktop), R7 2700X
106 fps -26%
Durchschnittliche NVIDIA GeForce RTX 2080 Super (Desktop)
  ()
106 fps -26%
Nvidia GeForce RTX 2070 Super
NVIDIA GeForce RTX 2070 Super (Desktop), R7 2700X
90 fps -37%
Red Dead Redemption 2
3840x2160 Maximum Settings
Durchschnittliche NVIDIA GeForce RTX 3090
  (61.9 - 67, n=3)
64.1 fps +2%
Nvidia GeForce RTX 3090 Founders Edition
NVIDIA GeForce RTX 3090, R9 5900X
63.5 (29min - 85max) fps +1%
NVIDIA GeForce RTX 3080 Ti Founders Edition
NVIDIA GeForce RTX 3080 Ti, R7 5800X
62.7 (35.4min, 55.6P1 - 90.3max) fps
Durchschnittliche NVIDIA GeForce RTX 3080
  (56 - 56.4, n=2)
56.2 fps -10%
ASUS GeForce RTX 3080 ROG STRIX OC GAMING
NVIDIA GeForce RTX 3080, R9 5900X
56 fps -11%
AMD Radeon RX 6900 XT
AMD Radeon RX 6900 XT, R9 5950X
54.6 (36.2min, 47.6P1 - 67max) fps -13%
AMD Radeon RX 6800 XT
AMD Radeon RX 6800 XT, R9 5950X
52.9 (41min, 45.5P1 - 65.3max) fps -16%
MSI GeForce RTX 3070 Gaming X Trio
NVIDIA GeForce RTX 3070, R9 5900X
44 (32min - 55max) fps -30%
Durchschnittliche NVIDIA GeForce RTX 3070
  (42.1 - 44, n=3)
42.9 fps -32%
Durchschnittliche NVIDIA GeForce RTX 2080 Ti (Desktop)
  ()
42.3 fps -33%
Durchschnittliche NVIDIA Titan RTX
  ()
41 fps -35%
Durchschnittliche NVIDIA GeForce RTX 2080 Super (Desktop)
  ()
33 fps -47%
2560x1440 Maximum Settings
Durchschnittliche NVIDIA GeForce RTX 3090
  (91.9 - 96, n=3)
93.4 fps +1%
NVIDIA GeForce RTX 3080 Ti Founders Edition
NVIDIA GeForce RTX 3080 Ti, R7 5800X
92.5 (33.8min, 76.9P1 - 155max) fps
Nvidia GeForce RTX 3090 Founders Edition
NVIDIA GeForce RTX 3090, R9 5900X
92.3 (33min - 132max) fps 0%
Durchschnittliche NVIDIA GeForce RTX 3080
  (81 - 86.4, n=2)
83.7 fps -10%
AMD Radeon RX 6800 XT
AMD Radeon RX 6800 XT, R9 5950X
82.7 (59min, 66.7P1 - 103max) fps -11%
AMD Radeon RX 6900 XT
AMD Radeon RX 6900 XT, R9 5950X
82.1 (34min, 66.7P1 - 104max) fps -11%
ASUS GeForce RTX 3080 ROG STRIX OC GAMING
NVIDIA GeForce RTX 3080, R9 5900X
81 fps -12%
MSI GeForce RTX 3070 Gaming X Trio
NVIDIA GeForce RTX 3070, R9 5900X
65 (33min - 100max) fps -30%
Durchschnittliche NVIDIA GeForce RTX 3070
  (63.2 - 65, n=3)
63.9 fps -31%
Durchschnittliche NVIDIA Titan RTX
  ()
63 fps -32%
Durchschnittliche NVIDIA GeForce RTX 2080 Ti (Desktop)
  ()
63 fps -32%
Durchschnittliche NVIDIA GeForce RTX 2080 Super (Desktop)
  ()
50.6 fps -45%
1920x1080 Maximum Settings
NVIDIA GeForce RTX 3080 Ti Founders Edition
NVIDIA GeForce RTX 3080 Ti, R7 5800X
112 (39.2min, 90.9P1 - 148max) fps
Durchschnittliche NVIDIA GeForce RTX 3090
  (109.9 - 115, n=3)
111.6 fps 0%
Nvidia GeForce RTX 3090 Founders Edition
NVIDIA GeForce RTX 3090, R9 5900X
109.9 (37min - 148max) fps -2%
AMD Radeon RX 6800 XT
AMD Radeon RX 6800 XT, R9 5950X
102 (68.7min, 76.9P1 - 129max) fps -9%
Durchschnittliche NVIDIA GeForce RTX 3080
  (96 - 103, n=2)
99.5 fps -11%
AMD Radeon RX 6900 XT
AMD Radeon RX 6900 XT, R9 5950X
98 (34.2min, 76.9P1 - 125max) fps -12%
ASUS GeForce RTX 3080 ROG STRIX OC GAMING
NVIDIA GeForce RTX 3080, R9 5900X
96 fps -14%
MSI GeForce RTX 3070 Gaming X Trio
NVIDIA GeForce RTX 3070, R9 5900X
78 (38min - 126max) fps -30%
Durchschnittliche NVIDIA GeForce RTX 3070
  (76.2 - 78, n=3)
77.4 fps -31%
Durchschnittliche NVIDIA Titan RTX
  ()
76 fps -32%
Durchschnittliche NVIDIA GeForce RTX 2080 Ti (Desktop)
  ()
76 fps -32%
Durchschnittliche NVIDIA GeForce RTX 2080 Super (Desktop)
  ()
61 fps -46%
Mafia Definitive Edition
3840x2160 High Preset
Durchschnittliche NVIDIA GeForce RTX 3090
  (84.5 - 89.1, n=2)
86.8 fps 0%
NVIDIA GeForce RTX 3080 Ti Founders Edition
NVIDIA GeForce RTX 3080 Ti, R7 5800X
86.6 (39.4min, 52.6P0.1, 64P1 - 179max) fps
Nvidia GeForce RTX 3090 Founders Edition
NVIDIA GeForce RTX 3090, R9 5900X
84.5 fps -2%
ASUS GeForce RTX 3080 ROG STRIX OC GAMING
NVIDIA GeForce RTX 3080, R9 5900X
78.2 (17.9min, 31P0.1, 59.3P1 - 292max) fps -10%
Durchschnittliche NVIDIA GeForce RTX 3080
  (78.1 - 78.2, n=2)
78.2 fps -10%
AMD Radeon RX 6900 XT
AMD Radeon RX 6900 XT, R9 5950X
67 (32.3min, 41.7P0.1, 44.7P1 - 211max) fps -23%
Durchschnittliche NVIDIA Titan RTX
  ()
63.4 fps -27%
AMD Radeon RX 6800 XT
AMD Radeon RX 6800 XT, R9 5950X
62.6 (28min, 37.6P0.1, 49.2P1 - 87.3max) fps -28%
Durchschnittliche NVIDIA GeForce RTX 2080 Ti (Desktop)
  ()
62.4 fps -28%
MSI GeForce RTX 3070 Gaming X Trio
NVIDIA GeForce RTX 3070, R9 5900X
56.6 (34.7min, 37.9P0.1, 44.2P1 - 177max) fps -35%
Durchschnittliche NVIDIA GeForce RTX 3070
  (55.2 - 56.6, n=2)
55.9 fps -35%
Durchschnittliche NVIDIA GeForce RTX 2080 Super (Desktop)
  ()
48.5 fps -44%
2560x1440 High Preset
Durchschnittliche NVIDIA GeForce RTX 3090
  (142.3 - 149, n=2)
145.7 fps +3%
Nvidia GeForce RTX 3090 Founders Edition
NVIDIA GeForce RTX 3090, R9 5900X
142.3 fps 0%
NVIDIA GeForce RTX 3080 Ti Founders Edition
NVIDIA GeForce RTX 3080 Ti, R7 5800X
142 (48.1min, 63.2P0.1, 83P1 - 222max) fps
ASUS GeForce RTX 3080 ROG STRIX OC GAMING
NVIDIA GeForce RTX 3080, R9 5900X
137 (26.5min, 66.2P0.1, 95.7P1 - 265max) fps -4%
Durchschnittliche NVIDIA GeForce RTX 3080
  (127 - 137, n=2)
132 fps -7%
AMD Radeon RX 6900 XT
AMD Radeon RX 6900 XT, R9 5950X
120 (17.6min, 61.2P0.1, 83.1P1 - 238max) fps -15%
AMD Radeon RX 6800 XT
AMD Radeon RX 6800 XT, R9 5950X
112 (23.5min, 64P0.1, 80.8P1 - 169max) fps -21%
Durchschnittliche NVIDIA Titan RTX
  ()
109 fps -23%
Durchschnittliche NVIDIA GeForce RTX 2080 Ti (Desktop)
  ()
105 fps -26%
MSI GeForce RTX 3070 Gaming X Trio
NVIDIA GeForce RTX 3070, R9 5900X
98.7 (45.2min, 55.9P0.1, 69.4P1 - 191max) fps -30%
Durchschnittliche NVIDIA GeForce RTX 3070
  (98.1 - 98.7, n=2)
98.4 fps -31%
Durchschnittliche NVIDIA GeForce RTX 2080 Super (Desktop)
  ()
88.8 fps -37%
1920x1080 High Preset
ASUS GeForce RTX 3080 ROG STRIX OC GAMING
NVIDIA GeForce RTX 3080, R9 5900X
169 (32.7min, 75.7P0.1, 112P1 - 361max) fps +4%
NVIDIA GeForce RTX 3080 Ti Founders Edition
NVIDIA GeForce RTX 3080 Ti, R7 5800X
163 (45.1min, 70.3P0.1, 91.6P1 - 335max) fps
Nvidia GeForce RTX 3090 Founders Edition
NVIDIA GeForce RTX 3090, R9 5900X
158.8 fps -3%
Durchschnittliche NVIDIA GeForce RTX 3090
  (157 - 158.8, n=2)
157.9 fps -3%
Durchschnittliche NVIDIA GeForce RTX 3080
  (144 - 169, n=2)
156.5 fps -4%
AMD Radeon RX 6900 XT
AMD Radeon RX 6900 XT, R9 5950X
138 (32.8min, 68.1P0.1, 90.2P1 - 334max) fps -15%
Durchschnittliche NVIDIA GeForce RTX 3070
  (124 - 132, n=2)
128 fps -21%
MSI GeForce RTX 3070 Gaming X Trio
NVIDIA GeForce RTX 3070, R9 5900X
124 (57.4min, 62.8P0.1, 82P1 - 251max) fps -24%
Durchschnittliche NVIDIA Titan RTX
  ()
123.7 fps -24%
AMD Radeon RX 6800 XT
AMD Radeon RX 6800 XT, R9 5950X
121 (23.7min, 68P0.1, 83.3P1 - 223max) fps -26%
Durchschnittliche NVIDIA GeForce RTX 2080 Super (Desktop)
  ()
118.1 fps -28%
Durchschnittliche NVIDIA GeForce RTX 2080 Ti (Desktop)
  ()
117 fps -28%
Cyberpunk 2077 1.0
3840x2160 Ultra Preset
Durchschnittliche NVIDIA GeForce RTX 3090
  (41.5 - 45.3, n=2)
43.4 fps +3%
NVIDIA GeForce RTX 3080 Ti Founders Edition
NVIDIA GeForce RTX 3080 Ti, R7 5800X
42.3 (27.8min, 35.1P0.1, 37.6P1 - 61.2max) fps
Nvidia GeForce RTX 3090 Founders Edition
NVIDIA GeForce RTX 3090, R9 5900X
41.5 fps -2%
Durchschnittliche NVIDIA GeForce RTX 3080
  ()
38.9 fps -8%
AMD Radeon RX 6900 XT
AMD Radeon RX 6900 XT, R9 5950X
34.8 (19.4min, 22.8P0.1, 29.7P1 - 177max) fps -18%
Durchschnittliche NVIDIA GeForce RTX 2080 Ti (Desktop)
  ()
32.2 fps -24%
AMD Ryzen 9 5900X
NVIDIA Titan RTX, R9 5900X
30.9 fps -27%
Durchschnittliche NVIDIA Titan RTX
  ()
30.9 fps -27%
Durchschnittliche NVIDIA GeForce RTX 3070
  (26.6 - 27.9, n=2)
27.3 fps -35%
Durchschnittliche NVIDIA GeForce RTX 2080 Super (Desktop)
  ()
24.1 fps -43%
2560x1440 Ultra Preset
NVIDIA GeForce RTX 3080 Ti Founders Edition
NVIDIA GeForce RTX 3080 Ti, R7 5800X
84.3 (62.5min, 63.4P0.1, 71.2P1 - 108max) fps
Durchschnittliche NVIDIA GeForce RTX 3090
  (78.1 - 85.3, n=2)
81.7 fps -3%
Nvidia GeForce RTX 3090 Founders Edition
NVIDIA GeForce RTX 3090, R9 5900X
78.1 fps -7%
Durchschnittliche NVIDIA GeForce RTX 3080
  ()
72.5 fps -14%
AMD Radeon RX 6900 XT
AMD Radeon RX 6900 XT, R9 5950X
72.3 (21min, 36.7P0.1, 58.6P1 - 231max) fps -14%
Durchschnittliche NVIDIA GeForce RTX 2080 Ti (Desktop)
  ()
64 fps -24%
AMD Ryzen 9 5900X
NVIDIA Titan RTX, R9 5900X
58.4 fps -31%
Durchschnittliche NVIDIA Titan RTX
  ()
58.4 fps -31%
Durchschnittliche NVIDIA GeForce RTX 3070
  (53.7 - 54.8, n=2)
54.3 fps -36%
Durchschnittliche NVIDIA GeForce RTX 2080 Super (Desktop)
  ()
49.1 fps -42%
1920x1080 Ultra Preset
NVIDIA GeForce RTX 3080 Ti Founders Edition
NVIDIA GeForce RTX 3080 Ti, R7 5800X
125 (74.1min, 81.2P0.1, 91P1 - 179max) fps
Nvidia GeForce RTX 3090 Founders Edition
NVIDIA GeForce RTX 3090, R9 5900X
109.7 fps -12%
Durchschnittliche NVIDIA GeForce RTX 3090
  (108 - 109.7, n=2)
108.9 fps -13%
AMD Radeon RX 6900 XT
AMD Radeon RX 6900 XT, R9 5950X
106 (23.2min, 48.3P0.1, 76.1P1 - 189max) fps -15%
Durchschnittliche NVIDIA GeForce RTX 3080
  ()
103 fps -18%
Durchschnittliche NVIDIA GeForce RTX 2080 Ti (Desktop)
  ()
95.4 fps -24%
AMD Ryzen 9 5900X
NVIDIA Titan RTX, R9 5900X
82.3 fps -34%
Durchschnittliche NVIDIA Titan RTX
  ()
82.3 fps -34%
Durchschnittliche NVIDIA GeForce RTX 3070
  (80.6 - 81, n=2)
80.8 fps -35%
Durchschnittliche NVIDIA GeForce RTX 2080 Super (Desktop)
  ()
72.1 fps -42%
1920x1080 Ray Tracing Ultra Preset (DLSS off)
NVIDIA GeForce RTX 3080 Ti Founders Edition
NVIDIA GeForce RTX 3080 Ti, R7 5800X
67.7 (46.3min, 51P0.1, 55P1 - 87.5max) fps
Durchschnittliche NVIDIA GeForce RTX 3090
  (59.6 - 65.4, n=2)
62.5 fps -8%
Nvidia GeForce RTX 3090 Founders Edition
NVIDIA GeForce RTX 3090, R9 5900X
59.6 fps -12%
Durchschnittliche NVIDIA GeForce RTX 3080
  ()
56.6 fps -16%
Durchschnittliche NVIDIA GeForce RTX 2080 Ti (Desktop)
  ()
43.1 fps -36%
Durchschnittliche NVIDIA GeForce RTX 3070
  (41.9 - 42.3, n=2)
42.1 fps -38%
AMD Ryzen 9 5900X
NVIDIA Titan RTX, R9 5900X
40.4 fps -40%
Durchschnittliche NVIDIA Titan RTX
  ()
40.4 fps -40%
Durchschnittliche NVIDIA GeForce RTX 2080 Super (Desktop)
  ()
33 fps -51%
3840x2160 Ray Tracing Ultra Preset (DLSS off)
NVIDIA GeForce RTX 3080 Ti Founders Edition
NVIDIA GeForce RTX 3080 Ti, R7 5800X
21.2 (17.3min, 17.3P0.1, 17.9P1 - 24.5max) fps
Durchschnittliche NVIDIA GeForce RTX 3090
  (19.7 - 22.2, n=2)
21 fps -1%
Nvidia GeForce RTX 3090 Founders Edition
NVIDIA GeForce RTX 3090, R9 5900X
19.7 fps -7%
Durchschnittliche NVIDIA GeForce RTX 3080
  ()
19 fps -10%
Durchschnittliche NVIDIA GeForce RTX 2080 Ti (Desktop)
  ()
13.6 fps -36%
AMD Ryzen 9 5900X
NVIDIA Titan RTX, R9 5900X
13.1 fps -38%
Durchschnittliche NVIDIA Titan RTX
  ()
13.1 fps -38%
Durchschnittliche NVIDIA GeForce RTX 3070
  (10.9 - 12.2, n=2)
11.6 fps -45%
Durchschnittliche NVIDIA GeForce RTX 2080 Super (Desktop)
  ()
7.09 fps -67%
Call of Duty Black Ops Cold War
1920x1080 Highest Settings + Ultra Ray Tracing
AMD Ryzen 9 5900X
NVIDIA Titan RTX, R9 5900X
119 fps +25%
Durchschnittliche NVIDIA Titan RTX
  ()
119 fps +25%
NVIDIA GeForce RTX 3080 Ti Founders Edition
NVIDIA GeForce RTX 3080 Ti, R7 5800X
95.2 (44.1min, 47.7P0.1, 52.9P1 - 250max) fps
Nvidia GeForce RTX 3090 Founders Edition
NVIDIA GeForce RTX 3090, R9 5900X
89 fps -7%
Durchschnittliche NVIDIA GeForce RTX 3090
  (88.3 - 89, n=2)
88.7 fps -7%
Durchschnittliche NVIDIA GeForce RTX 3080
  ()
81.9 fps -14%
Durchschnittliche NVIDIA GeForce RTX 2080 Ti (Desktop)
  ()
77.2 fps -19%
AMD Radeon RX 6900 XT
AMD Radeon RX 6900 XT, R9 5950X
69.5 (40.4min, 48.2P0.1, 54.5P1 - 302max) fps -27%
MSI GeForce RTX 3070 Gaming X Trio
NVIDIA GeForce RTX 3070, R9 5900X
68.5 (19.1min, 22.3P0.1, 30.4P1 - 229max) fps -28%
Durchschnittliche NVIDIA GeForce RTX 3070
  (49.8 - 70.1, n=3)
62.8 fps -34%
Durchschnittliche NVIDIA GeForce RTX 2080 Super (Desktop)
  ()
59 fps -38%
AMD Radeon RX 6800 XT
AMD Radeon RX 6800 XT, R9 5950X
21.8 (8.8min, 9.61P0.1, 16.2P1 - 49.5max) fps -77%
3840x2160 Highest Settings
NVIDIA GeForce RTX 3080 Ti Founders Edition
NVIDIA GeForce RTX 3080 Ti, R7 5800X
76.5 (46.5min, 58.5P0.1, 63.1P1 - 212max) fps
Durchschnittliche NVIDIA GeForce RTX 3090
  (74.6 - 76.1, n=2)
75.4 fps -1%
Nvidia GeForce RTX 3090 Founders Edition
NVIDIA GeForce RTX 3090, R9 5900X
74.6 fps -2%
MSI GeForce RTX 3070 Gaming X Trio
NVIDIA GeForce RTX 3070, R9 5900X
74 (32.6min, 43.5P0.1, 50.6P1 - 270max) fps -3%
AMD Radeon RX 6900 XT
AMD Radeon RX 6900 XT, R9 5950X
68.1 (42.2min, 50.7P0.1, 56.8P1 - 172max) fps -11%
Durchschnittliche NVIDIA GeForce RTX 3080
  ()
65.6 fps -14%
AMD Radeon RX 6800 XT
AMD Radeon RX 6800 XT, R9 5950X
64 (10.8min, 11.6P0.1, 50.8P1 - 159max) fps -16%
Durchschnittliche NVIDIA GeForce RTX 3070
  (43.8 - 74, n=3)
56 fps -27%
Durchschnittliche NVIDIA GeForce RTX 2080 Ti (Desktop)
  ()
54.4 fps -29%
AMD Ryzen 9 5900X
NVIDIA Titan RTX, R9 5900X
52.9 fps -31%
Durchschnittliche NVIDIA Titan RTX
  ()
52.9 fps -31%
Durchschnittliche NVIDIA GeForce RTX 2080 Super (Desktop)
  (38 - 44.5, n=2)
41.3 fps -46%
2560x1440 Highest Settings
NVIDIA GeForce RTX 3080 Ti Founders Edition
NVIDIA GeForce RTX 3080 Ti, R7 5800X
131 (59.4min, 79.8P0.1, 92P1 - 272max) fps
Nvidia GeForce RTX 3090 Founders Edition
NVIDIA GeForce RTX 3090, R9 5900X
124.7 fps -5%
Durchschnittliche NVIDIA GeForce RTX 3090
  (122 - 124.7, n=2)
123.4 fps -6%
AMD Radeon RX 6900 XT
AMD Radeon RX 6900 XT, R9 5950X
115 (54.9min, 82.8P0.1, 92.3P1 - 314max) fps -12%
MSI GeForce RTX 3070 Gaming X Trio
NVIDIA GeForce RTX 3070, R9 5900X
107 (43.6min, 54P0.1, 62.7P1 - 272max) fps -18%
Durchschnittliche NVIDIA GeForce RTX 3080
  ()
104 fps -21%
Durchschnittliche NVIDIA GeForce RTX 3070
  (83 - 107, n=3)
93.2 fps -29%
Durchschnittliche NVIDIA GeForce RTX 2080 Ti (Desktop)
  ()
89.2 fps -32%
AMD Ryzen 9 5900X
NVIDIA Titan RTX, R9 5900X
87.6 fps -33%
Durchschnittliche NVIDIA Titan RTX
  ()
87.6 fps -33%
AMD Radeon RX 6800 XT
AMD Radeon RX 6800 XT, R9 5950X
80.4 (16.5min, 31.8P0.1, 64.3P1 - 285max) fps -39%
Durchschnittliche NVIDIA GeForce RTX 2080 Super (Desktop)
  (51 - 77.6, n=2)
64.3 fps -51%
1920x1080 Highest Settings
NVIDIA GeForce RTX 3080 Ti Founders Edition
NVIDIA GeForce RTX 3080 Ti, R7 5800X
162 (66.2min, 97.6P0.1, 111P1 - 288max) fps
Nvidia GeForce RTX 3090 Founders Edition
NVIDIA GeForce RTX 3090, R9 5900X
161.1 fps -1%
Durchschnittliche NVIDIA GeForce RTX 3090
  (161 - 161.1, n=2)
161.1 fps -1%
AMD Radeon RX 6900 XT
AMD Radeon RX 6900 XT, R9 5950X
153 (60.9min, 98.1P0.1, 117P1 - 437max) fps -6%
AMD Ryzen 9 5900X
NVIDIA Titan RTX, R9 5900X
144 fps -11%
AMD Radeon RX 6800 XT
AMD Radeon RX 6800 XT, R9 5950X
144 (58.7min, 90.7P0.1, 105P1 - 365max) fps -11%
Durchschnittliche NVIDIA Titan RTX
  ()
144 fps -11%
Durchschnittliche NVIDIA GeForce RTX 3080
  ()
127 fps -22%
MSI GeForce RTX 3070 Gaming X Trio
NVIDIA GeForce RTX 3070, R9 5900X
122 (45min, 57.3P0.1, 67.9P1 - 301max) fps -25%
Durchschnittliche NVIDIA GeForce RTX 2080 Ti (Desktop)
  ()
118 fps -27%
Durchschnittliche NVIDIA GeForce RTX 3070
  (95.7 - 122, n=3)
112.6 fps -30%
Durchschnittliche NVIDIA GeForce RTX 2080 Super (Desktop)
  (59 - 106, n=2)
82.5 fps -49%
Metro Exodus
1920x1080 Ultra Quality DXR AF:16x
NVIDIA GeForce RTX 3080 Ti Founders Edition
NVIDIA GeForce RTX 3080 Ti, R7 5800X
112 (53.98min - 169.75max) fps
Durchschnittliche NVIDIA GeForce RTX 3090
  (68.6 - 122.2, n=12)
111.4 fps -1%
Durchschnittliche NVIDIA GeForce RTX 3080
  (91.5 - 102, n=2)
96.8 fps -14%
ASUS GeForce RTX 3080 ROG STRIX OC GAMING
NVIDIA GeForce RTX 3080, R9 5900X
91.5 (51.03min - 134.52max) fps -18%
AMD Radeon RX 6900 XT
AMD Radeon RX 6900 XT, R9 5950X
90.5 (55.53min - 126.79max) fps -19%
AMD Ryzen 9 5900X
NVIDIA Titan RTX, R9 5900X
87.9 (49.32min - 136.76max) fps -22%
Durchschnittliche NVIDIA Titan RTX
  (69 - 95.5, n=23)
86.1 fps -23%
AMD Radeon RX 6800 XT
AMD Radeon RX 6800 XT, R9 5950X
85.5 (52.71min - 120.38max) fps -24%
Durchschnittliche NVIDIA GeForce RTX 2080 Ti (Desktop)
  (78.6 - 84.9, n=3)
81.8 fps -27%
Durchschnittliche NVIDIA GeForce RTX 3070
  (80.4 - 83, n=5)
81.6 fps -27%
MSI GeForce RTX 3070 Gaming X Trio
NVIDIA GeForce RTX 3070, R9 5900X
80.4 (43.5min - 124.3max) fps -28%
KFA2 GeForce RTX 2080 Ti EX
NVIDIA GeForce RTX 2080 Ti (Desktop), R9 3900X
78.6 (43min - 115max) fps -30%
Nvidia GeForce RTX 3090 Founders Edition
NVIDIA GeForce RTX 3090, R9 5900X
68.6 (37.68min - 117.88max) fps -39%
Nvidia GeForce RTX 2080 Super
NVIDIA GeForce RTX 2080 Super (Desktop), R7 2700X
65 (37.62min - 97.62max) fps -42%
Durchschnittliche NVIDIA GeForce RTX 2080 Super (Desktop)
  ()
65 fps -42%
Nvidia GeForce RTX 2070 Super
NVIDIA GeForce RTX 2070 Super (Desktop), R7 2700X
57.5 (34min - 85max) fps -49%
3840x2160 Ultra Quality AF:16x
Durchschnittliche NVIDIA GeForce RTX 3090
  (70.6 - 77.3, n=12)
75 fps +1%
NVIDIA GeForce RTX 3080 Ti Founders Edition
NVIDIA GeForce RTX 3080 Ti, R7 5800X
74.2 (43.62min - 125.9max) fps
Nvidia GeForce RTX 3090 Founders Edition
NVIDIA GeForce RTX 3090, R9 5900X
70.6 (41.43min - 118.98max) fps -5%
AMD Radeon RX 6900 XT
AMD Radeon RX 6900 XT, R9 5950X
66.7 (42.71min - 92.25max) fps -10%
Durchschnittliche NVIDIA GeForce RTX 3080
  (64.1 - 65.9, n=2)
65 fps -12%
ASUS GeForce RTX 3080 ROG STRIX OC GAMING
NVIDIA GeForce RTX 3080, R9 5900X
64.1 (36.54min - 108.57max) fps -14%
AMD Radeon RX 6800 XT
AMD Radeon RX 6800 XT, R9 5950X
56.3 (40.14min - 64.28max) fps -24%
AMD Ryzen 9 5900X
NVIDIA Titan RTX, R9 5900X
54.9 (34.88min - 89.73max) fps -26%
Durchschnittliche NVIDIA Titan RTX
  (51.3 - 57.9, n=27)
54.9 fps -26%
Durchschnittliche NVIDIA GeForce RTX 2080 Ti (Desktop)
  (47.5 - 51, n=3)
49.7 fps -33%
MSI GeForce RTX 3070 Gaming X Trio
NVIDIA GeForce RTX 3070, R9 5900X
49.1 (30.24min - 89.89max) fps -34%
Durchschnittliche NVIDIA GeForce RTX 3070
  (48.3 - 49.7, n=5)
48.9 fps -34%
KFA2 GeForce RTX 2080 Ti EX
NVIDIA GeForce RTX 2080 Ti (Desktop), R9 3900X
47.5 (31min - 69max) fps -36%
Durchschnittliche NVIDIA GeForce RTX 2080 Super (Desktop)
  (40 - 40.4, n=2)
40.2 fps -46%
Nvidia GeForce RTX 2080 Super
NVIDIA GeForce RTX 2080 Super (Desktop), R7 2700X
40 (25.84min - 59.35max) fps -46%
Nvidia GeForce RTX 2070 Super
NVIDIA GeForce RTX 2070 Super (Desktop), R7 2700X
35 (23min - 51max) fps -53%
2560x1440 Ultra Quality AF:16x
Durchschnittliche NVIDIA GeForce RTX 3090
  (102 - 118.2, n=12)
113.2 fps +3%
NVIDIA GeForce RTX 3080 Ti Founders Edition
NVIDIA GeForce RTX 3080 Ti, R7 5800X
110 (55.44min - 188.15max) fps
Nvidia GeForce RTX 3090 Founders Edition
NVIDIA GeForce RTX 3090, R9 5900X
106 (54.88min - 173.25max) fps -4%
AMD Radeon RX 6900 XT
AMD Radeon RX 6900 XT, R9 5950X
102 (59.52min - 156.84max) fps -7%
Durchschnittliche NVIDIA GeForce RTX 3080
  (92.2 - 97.4, n=2)
94.8 fps -14%
AMD Radeon RX 6800 XT
AMD Radeon RX 6800 XT, R9 5950X
94.6 (55.44min - 143.68max) fps -14%
ASUS GeForce RTX 3080 ROG STRIX OC GAMING
NVIDIA GeForce RTX 3080, R9 5900X
92.2 (46.62min - 155.93max) fps -16%
AMD Ryzen 9 5900X
NVIDIA Titan RTX, R9 5900X
84.9 (46.03min - 152.65max) fps -23%
Durchschnittliche NVIDIA Titan RTX
  (69 - 92.9, n=26)
84 fps -24%
Durchschnittliche NVIDIA GeForce RTX 3070
  (74.4 - 78.3, n=5)
75.8 fps -31%
Durchschnittliche NVIDIA GeForce RTX 2080 Ti (Desktop)
  (71.9 - 77.9, n=3)
75.3 fps -32%
MSI GeForce RTX 3070 Gaming X Trio
NVIDIA GeForce RTX 3070, R9 5900X
74.4 (38.95min - 129.85max) fps -32%
KFA2 GeForce RTX 2080 Ti EX
NVIDIA GeForce RTX 2080 Ti (Desktop), R9 3900X
71.9 (40min - 108max) fps -35%
Durchschnittliche NVIDIA GeForce RTX 2080 Super (Desktop)
  (61 - 65, n=2)
63 fps -43%
Nvidia GeForce RTX 2080 Super
NVIDIA GeForce RTX 2080 Super (Desktop), R7 2700X
61 (35.51min - 95.82max) fps -45%
Nvidia GeForce RTX 2070 Super
NVIDIA GeForce RTX 2070 Super (Desktop), R7 2700X
54.3 (32min - 83max) fps -51%
1920x1080 Ultra Quality AF:16x
Durchschnittliche NVIDIA GeForce RTX 3090
  (108 - 145, n=12)
135.3 fps +3%
NVIDIA GeForce RTX 3080 Ti Founders Edition
NVIDIA GeForce RTX 3080 Ti, R7 5800X
131 (62.29min - 206.31max) fps
NVIDIA GeForce RTX 3080 Ti Founders Edition
NVIDIA GeForce RTX 3080 Ti, R7 5800X
131 (62.29min - 206.31max) fps 0%
Nvidia GeForce RTX 3090 Founders Edition
NVIDIA GeForce RTX 3090, R9 5900X
124 (65.58min - 188.71max) fps -5%
AMD Radeon RX 6900 XT
AMD Radeon RX 6900 XT, R9 5950X
123 (67.67min - 199.52max) fps -6%
AMD Radeon RX 6800 XT
AMD Radeon RX 6800 XT, R9 5950X
115 (64.52min - 181.92max) fps -12%
Durchschnittliche NVIDIA GeForce RTX 3080
  (111 - 116, n=2)
113.5 fps -13%
ASUS GeForce RTX 3080 ROG STRIX OC GAMING
NVIDIA GeForce RTX 3080, R9 5900X
111 (57.16min - 183.25max) fps -15%
AMD Ryzen 9 5900X
NVIDIA Titan RTX, R9 5900X
106 (52.66min - 176.55max) fps -19%
Durchschnittliche NVIDIA Titan RTX
  (73 - 116, n=27)
102.2 fps -22%
Durchschnittliche NVIDIA GeForce RTX 3070
  (91.3 - 97.7, n=5)
93.9 fps -28%
Durchschnittliche NVIDIA GeForce RTX 2080 Ti (Desktop)
  (89.7 - 98.6, n=3)
93.8 fps -28%
MSI GeForce RTX 3070 Gaming X Trio
NVIDIA GeForce RTX 3070, R9 5900X
91.3 (46.36min - 152.74max) fps -30%
KFA2 GeForce RTX 2080 Ti EX
NVIDIA GeForce RTX 2080 Ti (Desktop), R9 3900X
89.7 (46min - 140max) fps -32%
Durchschnittliche NVIDIA GeForce RTX 2080 Super (Desktop)
  (76 - 82, n=2)
79 fps -40%
Nvidia GeForce RTX 2080 Super
NVIDIA GeForce RTX 2080 Super (Desktop), R7 2700X
76 (38.54min - 122.4max) fps -42%
Nvidia GeForce RTX 2070 Super
NVIDIA GeForce RTX 2070 Super (Desktop), R7 2700X
67.8 (36min - 110max) fps -48%
Hitman 3
3840x2160 Maximum Settings AF:16x
AMD Radeon RX 6900 XT
AMD Radeon RX 6900 XT, R9 5950X
128.4 fps +7%
AMD Radeon RX 6900 XT
AMD Radeon RX 6900 XT, R9 5950X (SAM ENABLED)
127.8 fps +7%
NVIDIA GeForce RTX 3080 Ti Founders Edition
NVIDIA GeForce RTX 3080 Ti, R7 5800X
119.6 fps
Durchschnittliche NVIDIA GeForce RTX 3090
  (115 - 122, n=2)
118.5 fps -1%
Nvidia GeForce RTX 3090 Founders Edition
NVIDIA GeForce RTX 3090, R9 5900X
115 fps -4%
Durchschnittliche NVIDIA GeForce RTX 3080
  ()
109 fps -9%
Durchschnittliche NVIDIA GeForce RTX 2080 Ti (Desktop)
  ()
85.2 fps -29%
AMD Ryzen 9 5900X
NVIDIA Titan RTX, R9 5900X
82 fps -31%
Durchschnittliche NVIDIA Titan RTX
  ()
82 fps -31%
Durchschnittliche NVIDIA GeForce RTX 3070
  ()
77.5 fps -35%
Durchschnittliche NVIDIA GeForce RTX 2080 Super (Desktop)
  ()
64 fps -46%
2560x1440 Maximum Settings AF:16x
AMD Radeon RX 6900 XT
AMD Radeon RX 6900 XT, R9 5950X
213.1 fps +1%
AMD Radeon RX 6900 XT
AMD Radeon RX 6900 XT, R9 5950X (SAM ENABLED)
213.1 fps +1%
NVIDIA GeForce RTX 3080 Ti Founders Edition
NVIDIA GeForce RTX 3080 Ti, R7 5800X
210.4 fps
Nvidia GeForce RTX 3090 Founders Edition
NVIDIA GeForce RTX 3090, R9 5900X
190 fps -10%
Durchschnittliche NVIDIA GeForce RTX 3090
  (166 - 190, n=2)
178 fps -15%
Durchschnittliche NVIDIA GeForce RTX 3080
  ()
164 fps -22%
Durchschnittliche NVIDIA GeForce RTX 2080 Ti (Desktop)
  ()
147 fps -30%
AMD Ryzen 9 5900X
NVIDIA Titan RTX, R9 5900X
145 fps -31%
Durchschnittliche NVIDIA Titan RTX
  ()
145 fps -31%
Durchschnittliche NVIDIA GeForce RTX 3070
  ()
140 fps -33%
Durchschnittliche NVIDIA GeForce RTX 2080 Super (Desktop)
  ()
115 fps -45%
1920x1080 Maximum Settings AF:16x
AMD Radeon RX 6900 XT
AMD Radeon RX 6900 XT, R9 5950X
276.2 fps +3%
AMD Radeon RX 6900 XT
AMD Radeon RX 6900 XT, R9 5950X (SAM ENABLED)
269.4 fps +1%
NVIDIA GeForce RTX 3080 Ti Founders Edition
NVIDIA GeForce RTX 3080 Ti, R7 5800X
267 fps
Nvidia GeForce RTX 3090 Founders Edition
NVIDIA GeForce RTX 3090, R9 5900X
223 fps -16%
AMD Ryzen 9 5900X
NVIDIA Titan RTX, R9 5900X
202 fps -24%
Durchschnittliche NVIDIA Titan RTX
  ()
202 fps -24%
Durchschnittliche NVIDIA GeForce RTX 3090
  (167 - 223, n=2)
195 fps -27%
Durchschnittliche NVIDIA GeForce RTX 3080
  ()
166 fps -38%
Durchschnittliche NVIDIA GeForce RTX 2080 Super (Desktop)
  ()
166 fps -38%
Durchschnittliche NVIDIA GeForce RTX 3070
  ()
165 fps -38%
Durchschnittliche NVIDIA GeForce RTX 2080 Ti (Desktop)
  ()
162 fps -39%
Outriders
3840x2160 Ultra Preset
Durchschnittliche NVIDIA GeForce RTX 3090
  (85.7 - 89.3, n=2)
87.5 fps +5%
Nvidia GeForce RTX 3090 Founders Edition
NVIDIA GeForce RTX 3090, R9 5900X
85.7 (14.7min, 22.5P0.1, 46.9P1 - 251max) fps +2%
NVIDIA GeForce RTX 3080 Ti Founders Edition
NVIDIA GeForce RTX 3080 Ti, R7 5800X
83.7 (43.7min, 47.1P0.1, 63.2P1 - 197max) fps
Durchschnittliche NVIDIA GeForce RTX 3080
  ()
79.1 fps -5%
AMD Ryzen 9 5900X
NVIDIA Titan RTX, R9 5900X
64 (19.5min, 27.6P0.1, 34.8P1 - 242max) fps -24%
Durchschnittliche NVIDIA Titan RTX
  ()
64 fps -24%
Durchschnittliche NVIDIA GeForce RTX 2080 Ti (Desktop)
  ()
61.8 fps -26%
2560x1440 Ultra Preset
NVIDIA GeForce RTX 3080 Ti Founders Edition
NVIDIA GeForce RTX 3080 Ti, R7 5800X
151 (48.6min, 55.6P0.1, 72.9P1 - 232max) fps
Nvidia GeForce RTX 3090 Founders Edition
NVIDIA GeForce RTX 3090, R9 5900X
150 (18.9min, 38.2P0.1, 79.9P1 - 274max) fps -1%
Durchschnittliche NVIDIA GeForce RTX 3090
  (125 - 150, n=2)
137.5 fps -9%
Durchschnittliche NVIDIA GeForce RTX 3080
  ()
125 fps -17%
AMD Ryzen 9 5900X
NVIDIA Titan RTX, R9 5900X
119 (18.3min, 24.7P0.1, 65.9P1 - 236max) fps -21%
Durchschnittliche NVIDIA Titan RTX
  ()
119 fps -21%
Durchschnittliche NVIDIA GeForce RTX 2080 Ti (Desktop)
  ()
114 fps -25%
1920x1080 Ultra Preset
Nvidia GeForce RTX 3090 Founders Edition
NVIDIA GeForce RTX 3090, R9 5900X
168 (20.9min, 40.1P0.1, 86.5P1 - 275max) fps +14%
AMD Ryzen 9 5900X
NVIDIA Titan RTX, R9 5900X
156 (15.2min, 19.3P0.1, 82.3P1 - 265max) fps +5%
Durchschnittliche NVIDIA Titan RTX
  ()
156 fps +5%
NVIDIA GeForce RTX 3080 Ti Founders Edition
NVIDIA GeForce RTX 3080 Ti, R7 5800X
148 (46.9min, 49.5P0.1, 68.8P1 - 250max) fps
Durchschnittliche NVIDIA GeForce RTX 3090
  (125 - 168, n=2)
146.5 fps -1%
Durchschnittliche NVIDIA GeForce RTX 2080 Ti (Desktop)
  ()
132 fps -11%
Durchschnittliche NVIDIA GeForce RTX 3080
  ()
126 fps -15%
Resident Evil Village
1920x1080 Ray Tracing Preset
Nvidia GeForce RTX 3090 Founders Edition
NVIDIA GeForce RTX 3090, R9 5900X
197 (122min, 151P0.1, 167P1 - 247max) fps +6%
NVIDIA GeForce RTX 3080 Ti Founders Edition
NVIDIA GeForce RTX 3080 Ti, R7 5800X
185 (59.9min, 132P0.1, 146P1 - 260max) fps
Durchschnittliche NVIDIA GeForce RTX 3090
  (144 - 197, n=2)
170.5 fps -8%
Durchschnittliche NVIDIA GeForce RTX 3080
  ()
150 fps -19%
AMD Ryzen 9 5900X
NVIDIA Titan RTX, R9 5900X
138 (84.7min, 95.4P0.1, 105P1 - 185max) fps -25%
Durchschnittliche NVIDIA Titan RTX
  ()
138 fps -25%
Durchschnittliche NVIDIA GeForce RTX 2080 Ti (Desktop)
  ()
138 fps -25%
Durchschnittliche NVIDIA GeForce RTX 3070
  ()
129 fps -30%
3840x2160 Max Preset
Durchschnittliche NVIDIA GeForce RTX 3090
  (116 - 117, n=2)
116.5 fps +2%
Nvidia GeForce RTX 3090 Founders Edition
NVIDIA GeForce RTX 3090, R9 5900X
116 (74.7min, 97.9P0.1, 100P1 - 155max) fps +2%
NVIDIA GeForce RTX 3080 Ti Founders Edition
NVIDIA GeForce RTX 3080 Ti, R7 5800X
114 (60.9min, 95.6P0.1, 99.4P1 - 151max) fps
Durchschnittliche NVIDIA GeForce RTX 3080
  ()
103 fps -10%
Durchschnittliche NVIDIA GeForce RTX 2080 Ti (Desktop)
  ()
74.3 fps -35%
AMD Ryzen 9 5900X
NVIDIA Titan RTX, R9 5900X
74.2 (52.5min, 56.1P0.1, 59.9P1 - 108max) fps -35%
Durchschnittliche NVIDIA Titan RTX
  ()
74.2 fps -35%
Durchschnittliche NVIDIA GeForce RTX 3070
  ()
70.8 fps -38%
2560x1440 Max Preset
Nvidia GeForce RTX 3090 Founders Edition
NVIDIA GeForce RTX 3090, R9 5900X
213 (144min, 170P0.1, 177P1 - 288max) fps +7%
NVIDIA GeForce RTX 3080 Ti Founders Edition
NVIDIA GeForce RTX 3080 Ti, R7 5800X
199 (93min, 150P0.1, 167P1 - 262max) fps
Durchschnittliche NVIDIA GeForce RTX 3090
  (179 - 213, n=2)
196 fps -2%
Durchschnittliche NVIDIA GeForce RTX 3080
  ()
182 fps -9%
Durchschnittliche NVIDIA GeForce RTX 2080 Ti (Desktop)
  ()
147 fps -26%
AMD Ryzen 9 5900X
NVIDIA Titan RTX, R9 5900X
142 (43.4min, 102P0.1, 109P1 - 201max) fps -29%
Durchschnittliche NVIDIA GeForce RTX 3070
  ()
142 fps -29%
Durchschnittliche NVIDIA Titan RTX
  ()
142 fps -29%
1920x1080 Max Preset
Nvidia GeForce RTX 3090 Founders Edition
NVIDIA GeForce RTX 3090, R9 5900X
285 (152min, 198P0.1, 217P1 - 395max) fps +22%
NVIDIA GeForce RTX 3080 Ti Founders Edition
NVIDIA GeForce RTX 3080 Ti, R7 5800X
234 (92.3min, 159P0.1, 175P1 - 298max) fps
Durchschnittliche NVIDIA GeForce RTX 3090
  (180 - 285, n=2)
233 fps 0%
AMD Ryzen 9 5900X
NVIDIA Titan RTX, R9 5900X
212 (117min, 132P0.1, 155P1 - 307max) fps -9%
Durchschnittliche NVIDIA Titan RTX
  ()
212 fps -9%
Durchschnittliche NVIDIA GeForce RTX 3080
  ()
186 fps -21%
Durchschnittliche NVIDIA GeForce RTX 3070
  ()
183 fps -22%
Durchschnittliche NVIDIA GeForce RTX 2080 Ti (Desktop)
  ()
181 fps -23%
Days Gone
3840x2160 Very High Preset
Durchschnittliche NVIDIA GeForce RTX 3090
  (81.2 - 88.7, n=2)
85 fps +2%
NVIDIA GeForce RTX 3080 Ti Founders Edition
NVIDIA GeForce RTX 3080 Ti, R7 5800X
83.3 (24.2min, 39.7P0.1, 58.5P1 - 229max) fps
Nvidia GeForce RTX 3090 Founders Edition
NVIDIA GeForce RTX 3090, R9 5900X
81.2 (30.6min, 39.4P0.1, 55.6P1 - 168max) fps -3%
Durchschnittliche NVIDIA GeForce RTX 3080
  ()
78.6 fps -6%
AMD Ryzen 9 5900X
NVIDIA Titan RTX, R9 5900X
64.9 (32min, 34.4P0.1, 48.3P1 - 168max) fps -22%
Durchschnittliche NVIDIA Titan RTX
  ()
64.9 fps -22%
Durchschnittliche NVIDIA GeForce RTX 2080 Ti (Desktop)
  ()
63.9 fps -23%
Durchschnittliche NVIDIA GeForce RTX 3070
  ()
57.8 fps -31%
2560x1440 Very High Preset
NVIDIA GeForce RTX 3080 Ti Founders Edition
NVIDIA GeForce RTX 3080 Ti, R7 5800X
137 (32.9min, 55.8P0.1, 81.9P1 - 376max) fps
Durchschnittliche NVIDIA GeForce RTX 3090
  (133 - 139, n=2)
136 fps -1%
Nvidia GeForce RTX 3090 Founders Edition
NVIDIA GeForce RTX 3090, R9 5900X
133 (34.2min, 47.6P0.1, 71.1P1 - 307max) fps -3%
Durchschnittliche NVIDIA GeForce RTX 3080
  ()
131 fps -4%
AMD Ryzen 9 5900X
NVIDIA Titan RTX, R9 5900X
108 (35.4min, 45.8P0.1, 62.8P1 - 276max) fps -21%
Durchschnittliche NVIDIA Titan RTX
  ()
108 fps -21%
Durchschnittliche NVIDIA GeForce RTX 2080 Ti (Desktop)
  ()
105 fps -23%
Durchschnittliche NVIDIA GeForce RTX 3070
  ()
99.3 fps -28%
1920x1080 Very High Preset
NVIDIA GeForce RTX 3080 Ti Founders Edition
NVIDIA GeForce RTX 3080 Ti, R7 5800X
178 (22min, 64.2P0.1, 106P1 - 378max) fps
Nvidia GeForce RTX 3090 Founders Edition
NVIDIA GeForce RTX 3090, R9 5900X
164 (30.3min, 46.6P0.1, 78.1P1 - 336max) fps -8%
Durchschnittliche NVIDIA GeForce RTX 3090
  (159 - 164, n=2)
161.5 fps -9%
Durchschnittliche NVIDIA GeForce RTX 3080
  ()
158 fps -11%
AMD Ryzen 9 5900X
NVIDIA Titan RTX, R9 5900X
141 (26.3min, 48.7P0.1, 74.9P1 - 300max) fps -21%
Durchschnittliche NVIDIA Titan RTX
  ()
141 fps -21%
Durchschnittliche NVIDIA GeForce RTX 2080 Ti (Desktop)
  ()
135 fps -24%
Durchschnittliche NVIDIA GeForce RTX 3070
  ()
131 fps -26%
Control
1920x1080 High Quality Preset & High Ray Tracing Preset (DX12)
NVIDIA GeForce RTX 3080 Ti Founders Edition
NVIDIA GeForce RTX 3080 Ti, R7 5800X
114 (5.37min, 73.8P0.1, 94.6P1 - 164max) fps
Durchschnittliche NVIDIA GeForce RTX 3090
  (91.4 - 122.6, n=5)
111.1 fps -3%
Nvidia GeForce RTX 3090 Founders Edition
NVIDIA GeForce RTX 3090, R9 5900X
106.9 fps -6%
ASUS GeForce RTX 3080 ROG STRIX OC GAMING
NVIDIA GeForce RTX 3080, R9 5900X
103 (94min - 116max) fps -10%
Durchschnittliche NVIDIA GeForce RTX 3080
  (98.1 - 103, n=2)
100.6 fps -12%
Durchschnittliche NVIDIA Titan RTX
  (63 - 120, n=3)
88.1 fps -23%
AMD Radeon RX 6900 XT
AMD Radeon RX 6900 XT, R9 5950X (SAM ENABLED)
76.2 (38.7min, 43.3P0.1, 62.8P1 - 142max) fps -33%
AMD Radeon RX 6900 XT
AMD Radeon RX 6900 XT, R9 5950X
73.1 (31.6min, 40.9P0.1, 62.6P1 - 149max) fps -36%
Durchschnittliche NVIDIA GeForce RTX 2080 Ti (Desktop)
  (72 - 76, n=2)
74 fps -35%
KFA2 GeForce RTX 2080 Ti EX
NVIDIA GeForce RTX 2080 Ti (Desktop), R9 3900X
72 (67min - 80max) fps -37%
Durchschnittliche NVIDIA GeForce RTX 3070
  (57.9 - 75.1, n=3)
68.5 fps -40%
AMD Radeon RX 6800 XT
AMD Radeon RX 6800 XT, R9 5950X
66.9 (60min - 75max) fps -41%
MSI GeForce RTX 3070 Gaming X Trio
NVIDIA GeForce RTX 3070, R9 5900X
57.9 (29min - 79max) fps -49%
Durchschnittliche NVIDIA GeForce RTX 2080 Super (Desktop)
  ()
53.2 fps -53%
3840x2160 High Quality Preset (DX11)
NVIDIA GeForce RTX 3080 Ti Founders Edition
NVIDIA GeForce RTX 3080 Ti, R7 5800X
64.9 (41.3min, 50.5P0.1, 55.3P1 - 127max) fps
Durchschnittliche NVIDIA GeForce RTX 3090
  (61.3 - 66, n=5)
62.9 fps -3%
Nvidia GeForce RTX 3090 Founders Edition
NVIDIA GeForce RTX 3090, R9 5900X
61.3 fps -6%
Durchschnittliche NVIDIA GeForce RTX 3080
  (56.2 - 56.7, n=2)
56.5 fps -13%
ASUS GeForce RTX 3080 ROG STRIX OC GAMING
NVIDIA GeForce RTX 3080, R9 5900X
56.2 (49min - 64max) fps -13%
AMD Radeon RX 6900 XT
AMD Radeon RX 6900 XT, R9 5950X
54.7 (39.8min, 41.7P0.1, 44.9P1 - 65.8max) fps -16%
AMD Radeon RX 6900 XT
AMD Radeon RX 6900 XT, R9 5950X (SAM ENABLED)
53.9 (36.6min, 41.7P0.1, 43.5P1 - 64.9max) fps -17%
AMD Radeon RX 6800 XT
AMD Radeon RX 6800 XT, R9 5950X
51.6 (46min - 58max) fps -20%
Durchschnittliche NVIDIA Titan RTX
  (45.2 - 47.3, n=3)
46.5 fps -28%
Durchschnittliche NVIDIA GeForce RTX 2080 Ti (Desktop)
  (42.6 - 45.8, n=2)
44.2 fps -32%
KFA2 GeForce RTX 2080 Ti EX
NVIDIA GeForce RTX 2080 Ti (Desktop), R9 3900X
42.6 (37min - 49max) fps -34%
MSI GeForce RTX 3070 Gaming X Trio
NVIDIA GeForce RTX 3070, R9 5900X
42.3 (37min - 49max) fps -35%
Durchschnittliche NVIDIA GeForce RTX 3070
  (40.6 - 42.3, n=3)
41.3 fps -36%
Durchschnittliche NVIDIA GeForce RTX 2080 Super (Desktop)
  ()
30.4 fps -53%
2560x1440 High Quality Preset (DX11)
NVIDIA GeForce RTX 3080 Ti Founders Edition
NVIDIA GeForce RTX 3080 Ti, R7 5800X
122 (52.6min, 86.2P0.1, 99.3P1 - 392max) fps
Durchschnittliche NVIDIA GeForce RTX 3090
  (115.8 - 123.7, n=5)
120.4 fps -1%
Nvidia GeForce RTX 3090 Founders Edition
NVIDIA GeForce RTX 3090, R9 5900X
115.8 fps -5%
AMD Radeon RX 6900 XT
AMD Radeon RX 6900 XT, R9 5950X
113 (71.5min, 73.2P0.1, 79.6P1 - 164max) fps -7%
AMD Radeon RX 6900 XT
AMD Radeon RX 6900 XT, R9 5950X (SAM ENABLED)
113 (68min, 71.3P0.1, 81.1P1 - 193max) fps -7%
AMD Radeon RX 6800 XT
AMD Radeon RX 6800 XT, R9 5950X
108 (93min - 123max) fps -11%
ASUS GeForce RTX 3080 ROG STRIX OC GAMING
NVIDIA GeForce RTX 3080, R9 5900X
106 (92min - 123max) fps -13%
Durchschnittliche NVIDIA GeForce RTX 3080
  (105 - 106, n=2)
105.5 fps -14%
Durchschnittliche NVIDIA Titan RTX
  (89 - 93.6, n=3)
91.5 fps -25%
Durchschnittliche NVIDIA GeForce RTX 2080 Ti (Desktop)
  (84 - 89, n=2)
86.5 fps -29%
KFA2 GeForce RTX 2080 Ti EX
NVIDIA GeForce RTX 2080 Ti (Desktop), R9 3900X
84 (75min - 95max) fps -31%
MSI GeForce RTX 3070 Gaming X Trio
NVIDIA GeForce RTX 3070, R9 5900X
82.5 (72min - 96max) fps -32%
Durchschnittliche NVIDIA GeForce RTX 3070
  (79.8 - 82.5, n=3)
81.2 fps -33%
Durchschnittliche NVIDIA GeForce RTX 2080 Super (Desktop)
  ()
62 fps -49%
1920x1080 High Quality Preset (DX11)
NVIDIA GeForce RTX 3080 Ti Founders Edition
NVIDIA GeForce RTX 3080 Ti, R7 5800X
181 (49.7min, 115P0.1, 140P1 - 509max) fps
Durchschnittliche NVIDIA GeForce RTX 3090
  (172.2 - 189.2, n=5)
179.9 fps -1%
AMD Radeon RX 6900 XT
AMD Radeon RX 6900 XT, R9 5950X
175 (56.8min, 96P0.1, 112P1 - 314max) fps -3%
AMD Radeon RX 6900 XT
AMD Radeon RX 6900 XT, R9 5950X (SAM ENABLED)
174 (54min, 99P0.1, 112P1 - 335max) fps -4%
Nvidia GeForce RTX 3090 Founders Edition
NVIDIA GeForce RTX 3090, R9 5900X
172.2 fps -5%
AMD Radeon RX 6800 XT
AMD Radeon RX 6800 XT, R9 5950X
168 (145min - 194max) fps -7%
ASUS GeForce RTX 3080 ROG STRIX OC GAMING
NVIDIA GeForce RTX 3080, R9 5900X
155 (133min - 178max) fps -14%
Durchschnittliche NVIDIA GeForce RTX 3080
  (151 - 155, n=2)
153 fps -15%
Durchschnittliche NVIDIA Titan RTX
  (135 - 141.9, n=3)
137.3 fps -24%
Durchschnittliche NVIDIA GeForce RTX 2080 Ti (Desktop)
  (126 - 132, n=2)
129 fps -29%
KFA2 GeForce RTX 2080 Ti EX
NVIDIA GeForce RTX 2080 Ti (Desktop), R9 3900X
126 (111min - 143max) fps -30%
MSI GeForce RTX 3070 Gaming X Trio
NVIDIA GeForce RTX 3070, R9 5900X
122 (103min - 138max) fps -33%
Durchschnittliche NVIDIA GeForce RTX 3070
  (117 - 124.9, n=3)
121.3 fps -33%
Durchschnittliche NVIDIA GeForce RTX 2080 Super (Desktop)
  ()
95 fps -48%
min. mittel hoch max.QHD4K
The Witcher 3 (2015) 174 149
Shadow of the Tomb Raider (2018) 178 157 93
Battlefield V (2018) 196 192 136
Far Cry New Dawn (2019) 122 118 100
Metro Exodus (2019) 131 110 74.2
The Division 2 (2019) 143 121 76.6
Total War: Three Kingdoms (2019) 151.2 103.4 51.4
Control (2019) 181 122 64.9
Borderlands 3 (2019) 129 114 71.2
Red Dead Redemption 2 (2019) 112 92.5 62.7
Doom Eternal (2020) 388 316 191
Gears Tactics (2020) 141.1 147.5 88.3
Mafia Definitive Edition (2020) 163 142 86.6
Watch Dogs Legion (2020) 97 88.5 58.7
Dirt 5 (2020) 163 136 92.4
Assassin´s Creed Valhalla (2020) 100 86 61
Call of Duty Black Ops Cold War (2020) 162 131 76.5
Cyberpunk 2077 1.0 (2020) 125 84.3 42.3
Hitman 3 (2021) 267 210.4 119.6
Outriders (2021) 148 151 83.7
Resident Evil Village (2021) 234 199 114
Days Gone (2021) 178 137 83.3

Emissionen - Inkonsistent bei 350 W TGP

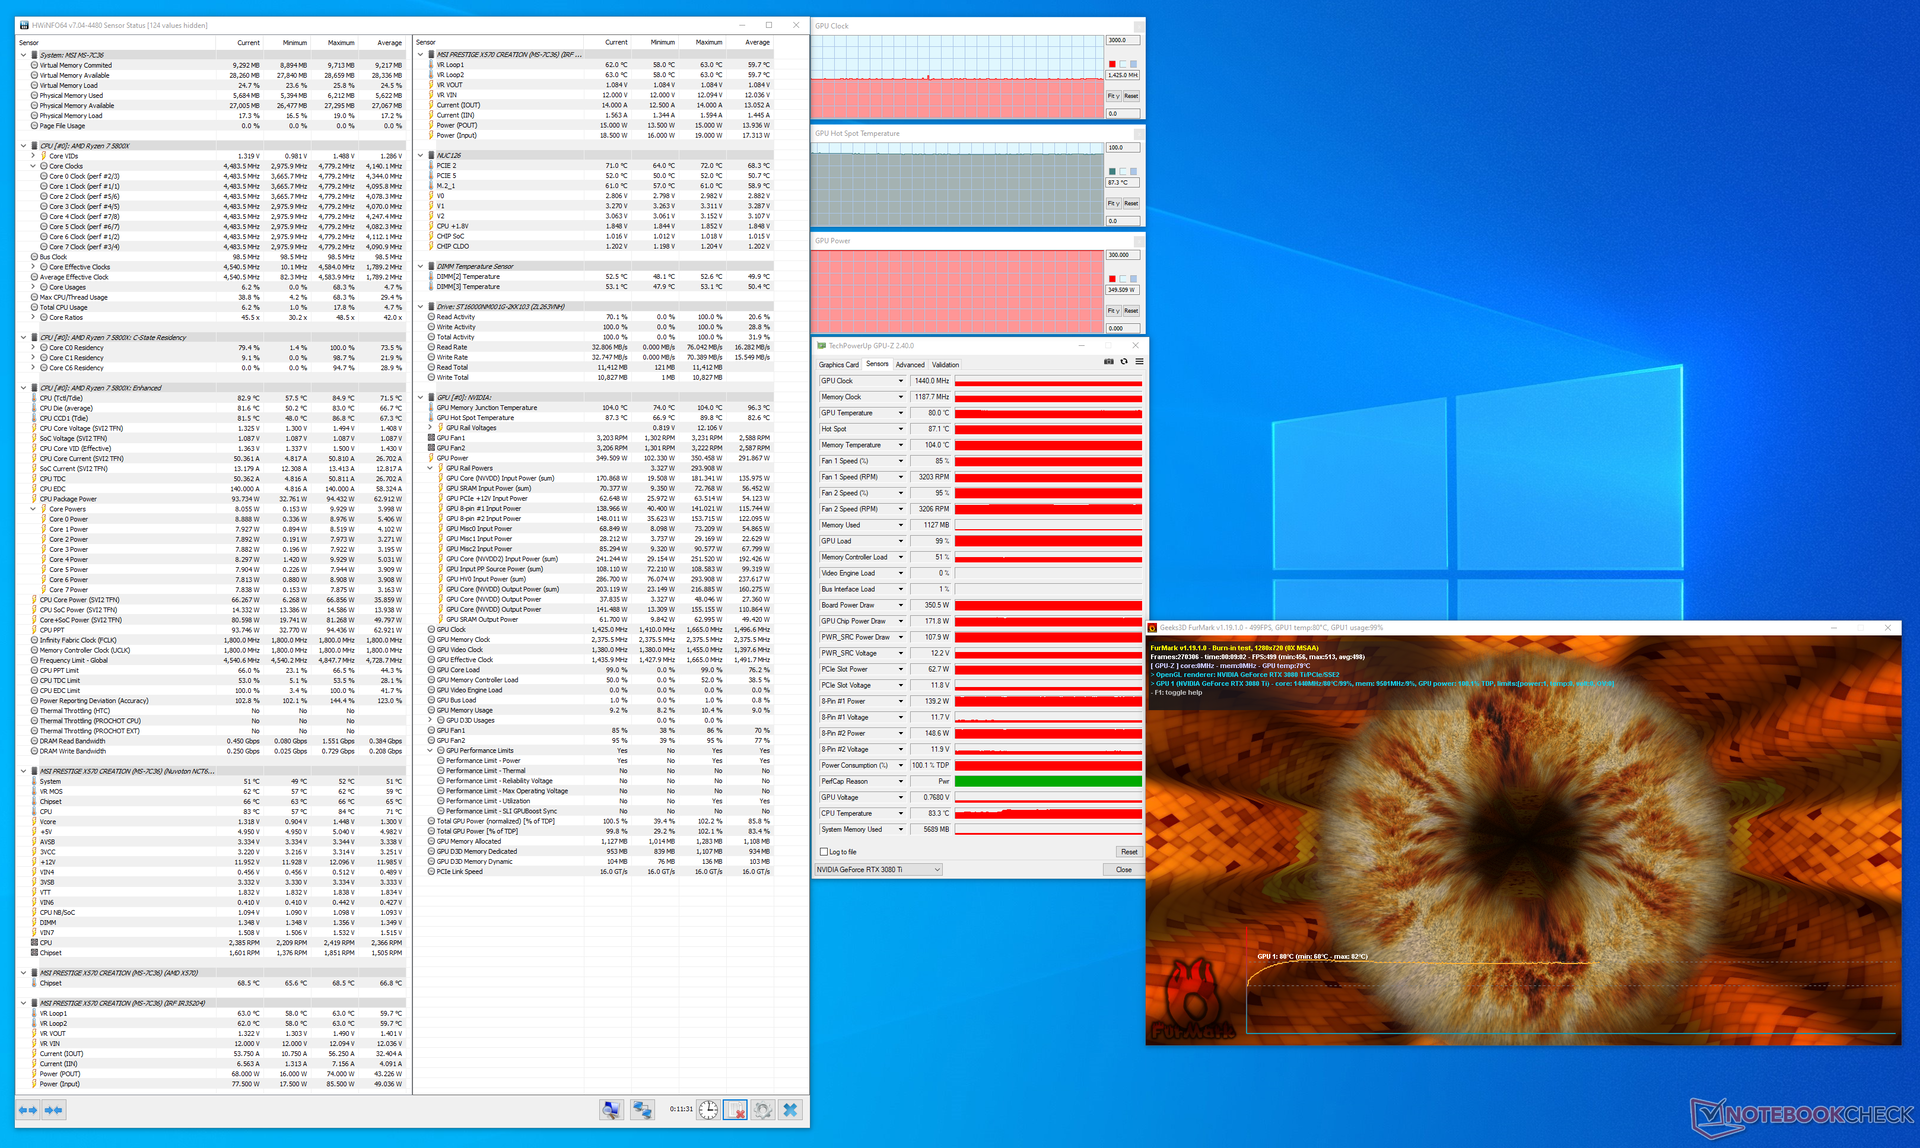
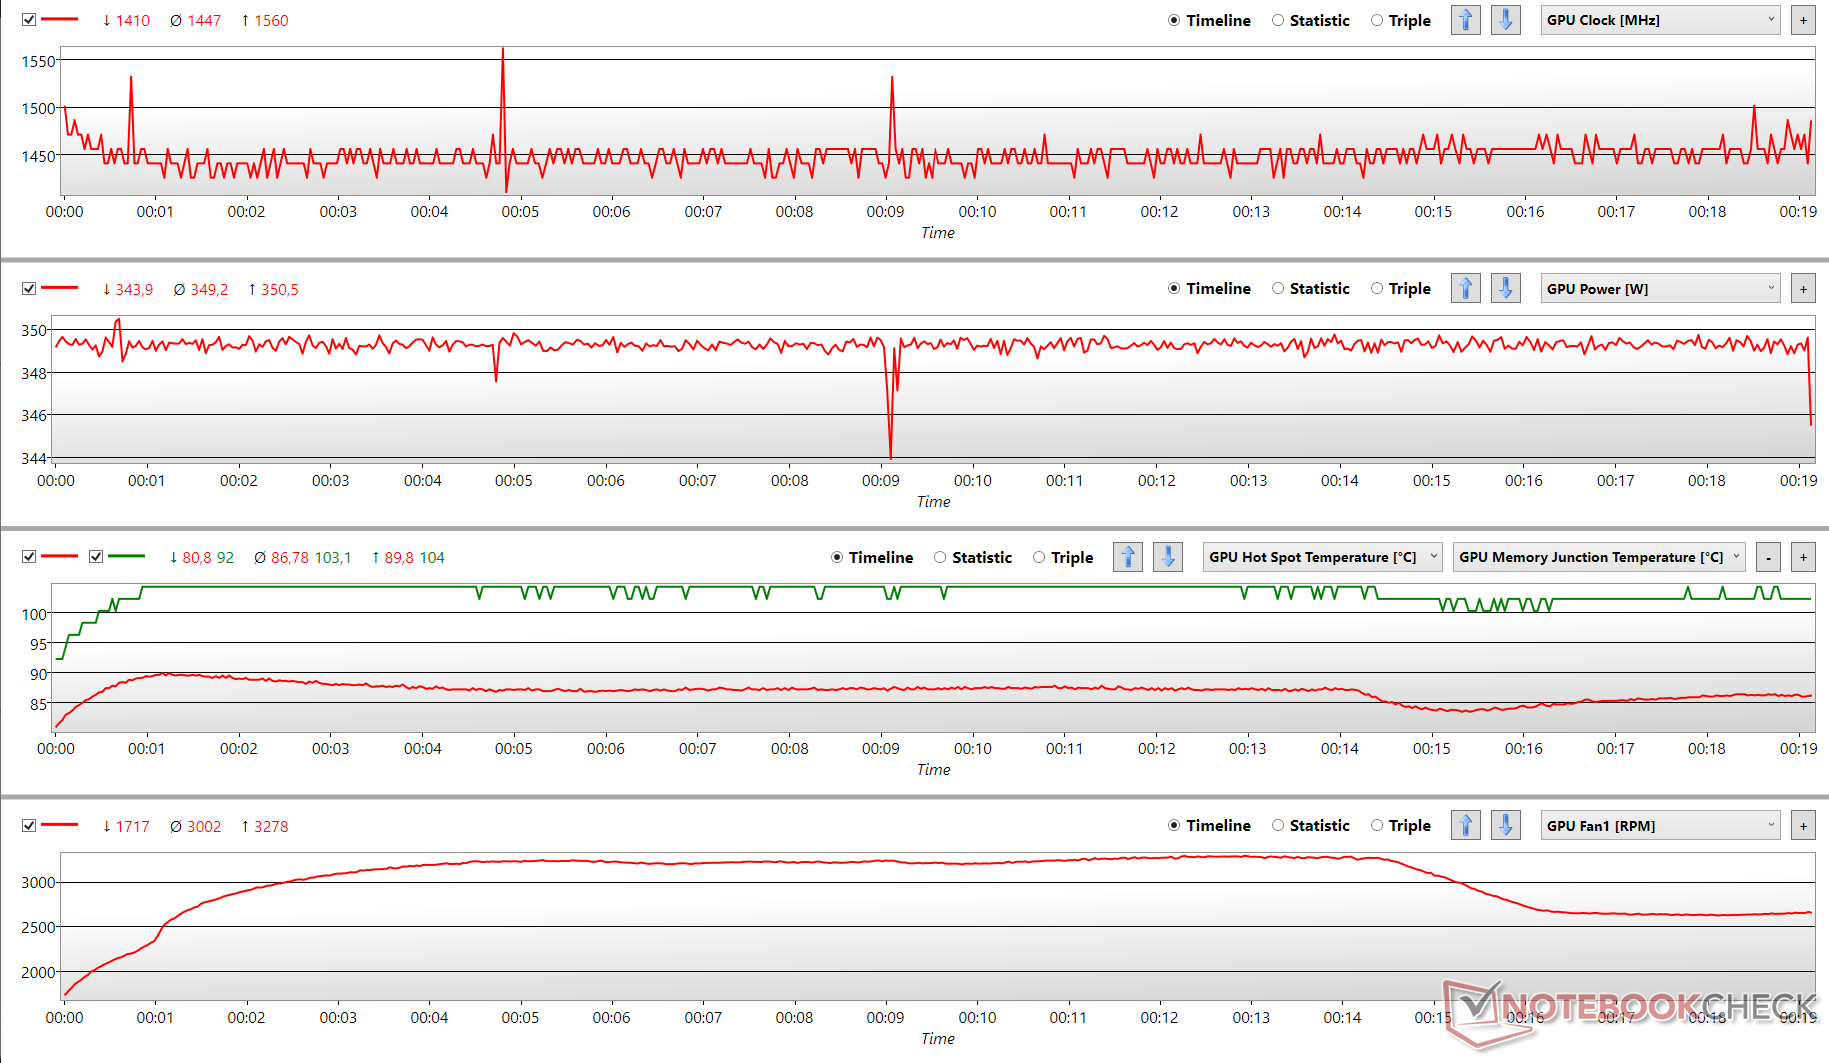
Die RTX 3080 Ti ist mit einem TGP von 350 W spezifiziert, der laut VBIOS um weitere 14 % auf 400 W erhöht werden kann. Die Belastung der Karte mit FurMark bei 350 W (100 % Leistungsziel) führt dazu, dass der GPU-Kern 80 °C erreicht und die Takte um 1.440 MHz pendeln. Wir konnten beobachten, dass die Karte aufgrund des gesetzten Temperaturziels von 83 °C ihr Leistungsziel teilweise auf 345 W absenkt, wobei die Takte kurzzeitig bis auf maximal 1.550 MHz ansteigen. NVIDIA hätte allerdings einen besseren Job mit dem Kühlsystem machen können, denn die Lüfter schienen gegen Ende des Laufs um fast 1.000 RPM zu drosseln, was einen kurzzeitigen Abfall der Hot-Spot-Temperaturen zur Folge hatte.

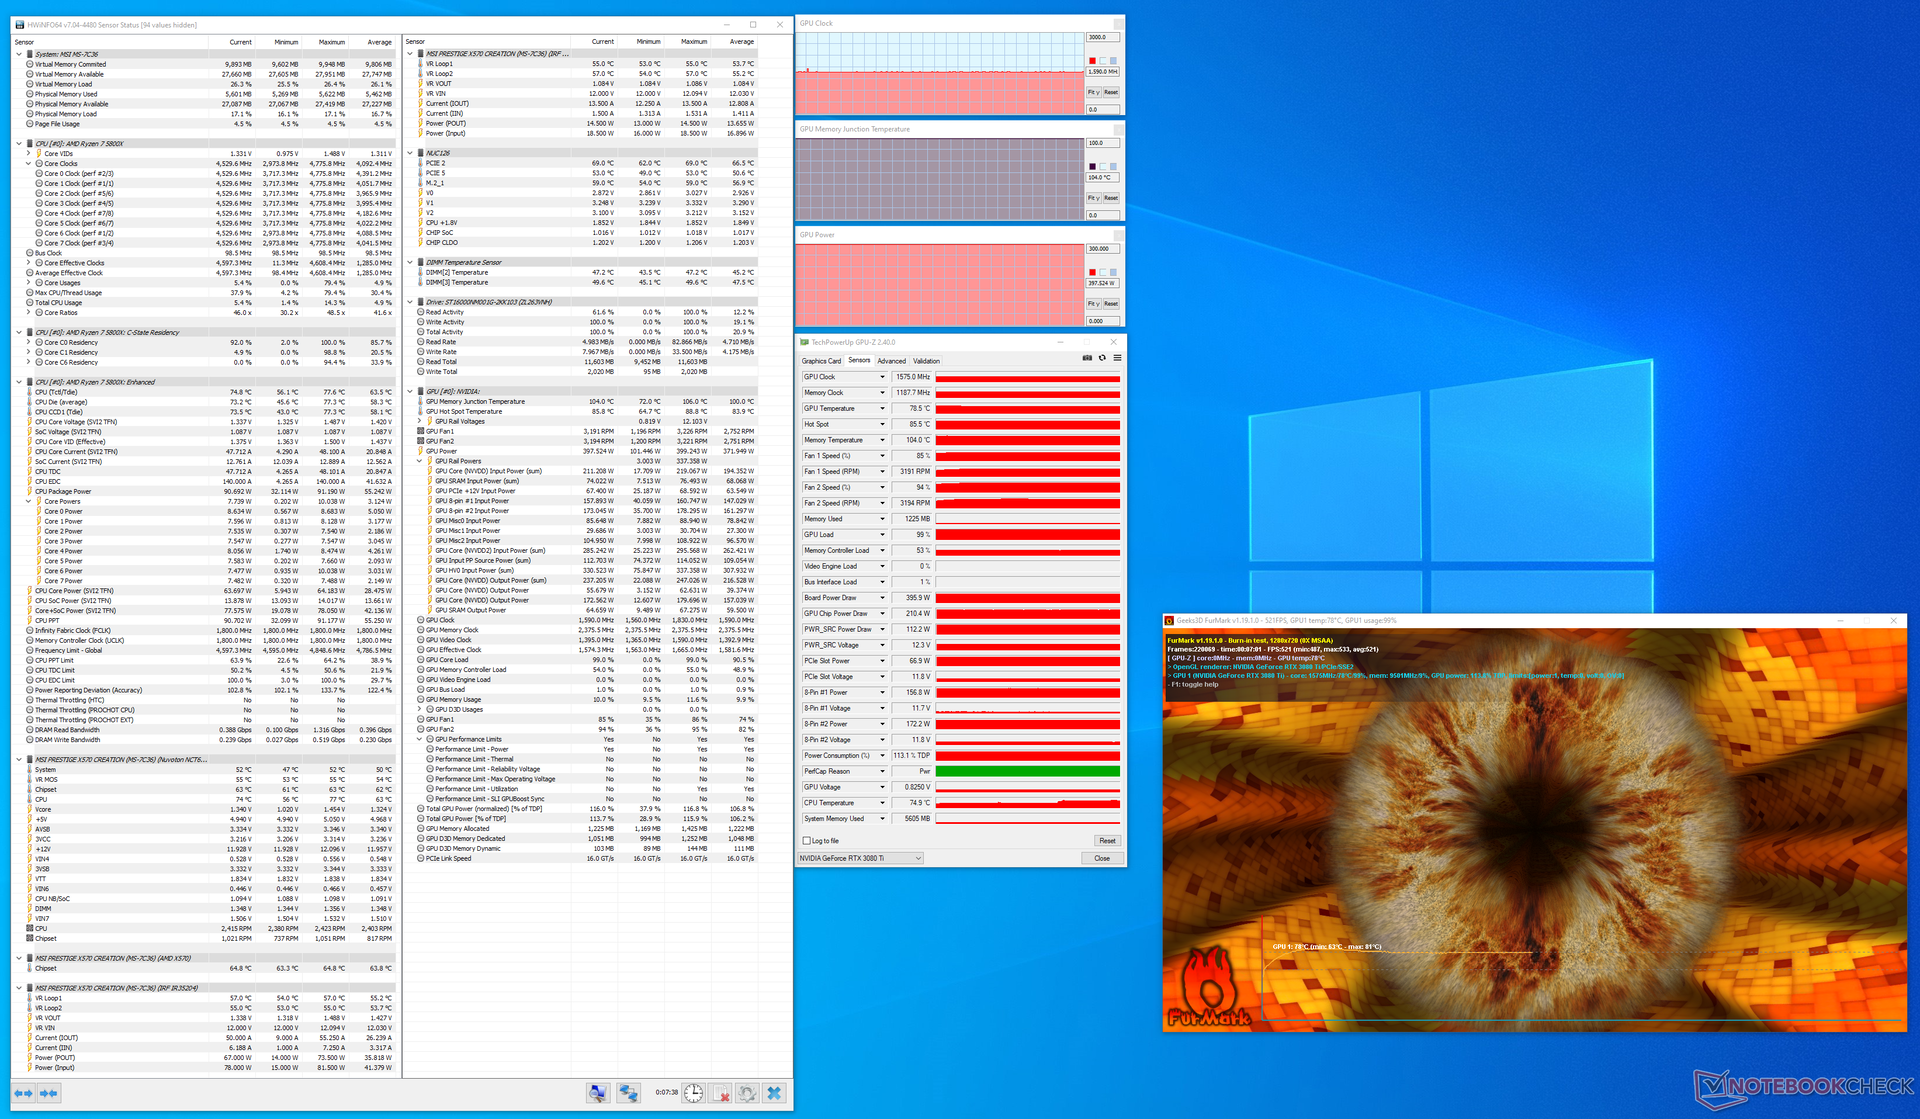
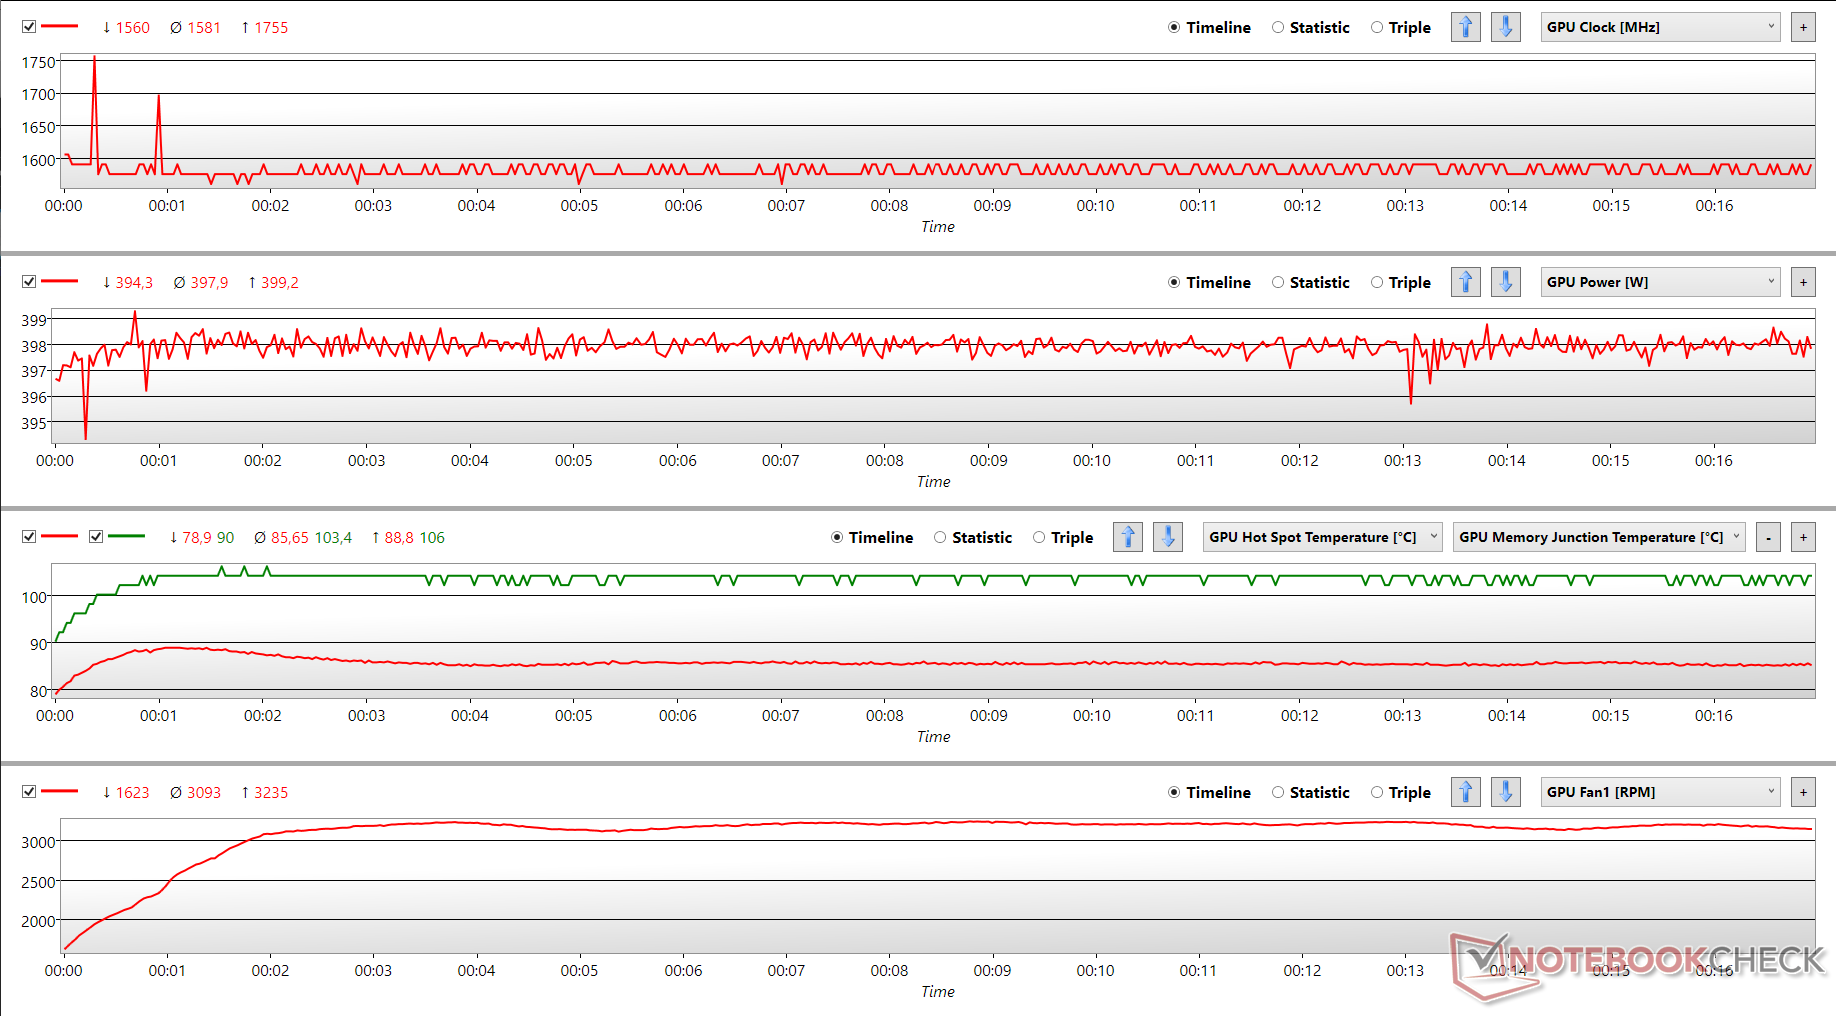
Die Erhöhung des Leistungsziels auf 114 % (400 W) über das eingebaute Leistungstool in GeForce Experience bietet ein deutlich anderes Bild: Wir sehen nicht nur höhere Takte (1.590 MHz), sondern auch einen besseren anhaltenden Boost ohne größere Spikes, obwohl der Kern ähnliche Temperaturwerte erreicht. Auch die automatische Absenkung des TGP ist mit 114 % Power Target deutlich weniger ausgeprägt als zuvor, und auch die Lüfter scheinen ganz gut mithalten zu können. Allerdings haben wir festgestellt, dass die Karte bei 400 Watt manchmal ziemlich instabil ist, was zu Abstürzen führen kann.

Ein 350-W-TGP ist die Standardkonfiguration, aber die Karte zeigt kein konsistentes Taktprofil während Stress. Enthusiasten könnten den Vorteil darin sehen, das Leistungsziel im Interesse höherer und stabilerer Boosts ein wenig anzuheben.

Insgesamt scheint es, als ob NVIDIA eine fast volle RTX 3090 GA102 GPU in eine RTX-3080-Gehäuse gezwängt hat, was zu thermischen und Stabilitätsproblemen führt, wenn man sie bis zum Anschlag ausreizt. Allerdings hatten wir während des Spielens keine Throttling-Probleme, so dass diese Ungereimtheiten im realen Betrieb vielleicht nicht sofort auffallen.

FurMark Stress bei 100 % PT
FurMark Stress bei 114 % PT
GPU-Parameter während FurMark Stress bei 100 % PT (GPU-Hotspot-Temp. - rot, GPU-Speicheranschlusstemp. - grün)
GPU-Parameter während FurMark Stress bei 114 % PT (GPU-Hotspot-Temp. - rot, GPU-Speicheranschlusstemp. - grün)

Leistungsaufnahme

Im Leerlauf hat die RTX 3080 Ti eine Gesamtleistungsaufnahme von etwa 103 W, wobei der GA102-Chip 21 W zieht. Unter Last kann die GA102-GPU 172 W für sich beanspruchen, wenn die Karte auf einen TGP von 350 W eingestellt ist. Diese Zahlen gleichen dem, was wir zuvor gesehen haben bei der MSI GeForce RTX 3080 Gaming X Trio GPU, die einen TGP von 340 W aufweist. Die RTX 3090 FE ist in der Tat die sparsamere Variante, wenn man die Leistungsaufnahme unter Stress betrachtet. Die Erhöhung des Leistungsziels auf 400 W führt dazu, dass der GPU-Kern unter Last 210 W zieht. Zum Vergleich: Der Kern der RX 6900 XT zieht während des FurMark Stresstests etwa 255 W bei einem Leistungsziel von 100 %.

Temperatur

Hohe GPU-Kerntemperatur auch bei 0 % Last

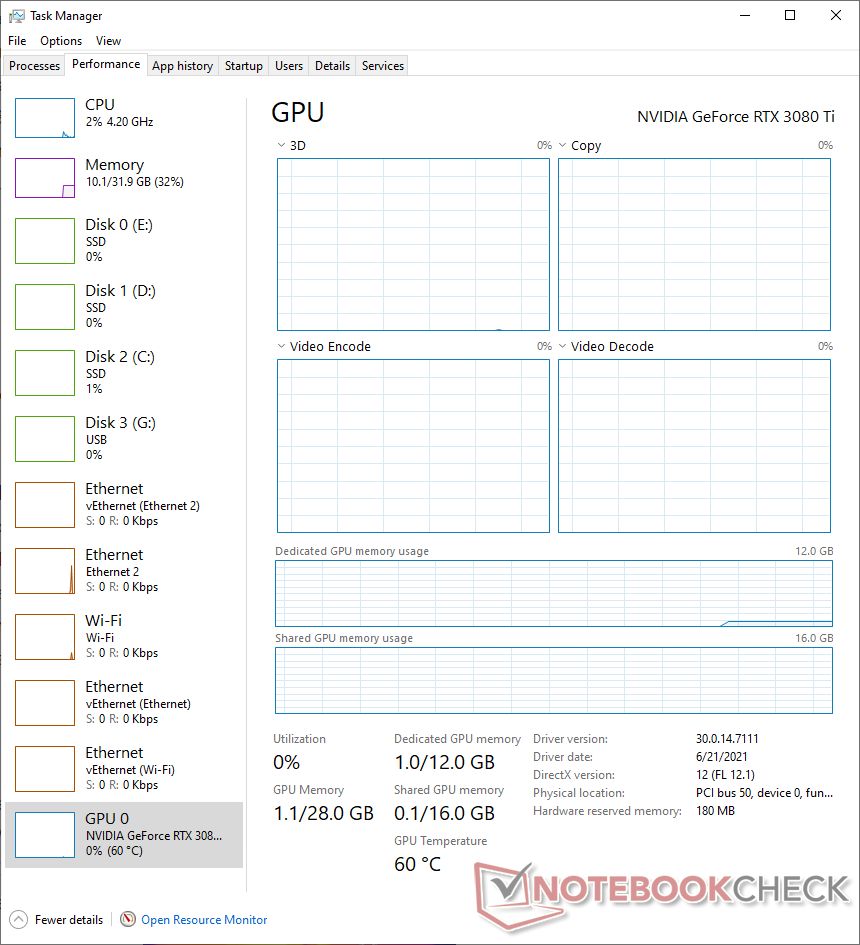
Aus irgendeinem Grund verzeichnete unsere RTX 3080 Ti FE Einheit auch im Idle immer eine Kerntemperatur von 60 °C. Obwohl NVIDIA bei allen Ampere-FE-Karten einen kompletten Lüfter-Stopp-Modus implementiert hat, stellten wir aufgrund solcher Idle-Temperaturen fest, dass die Lüfter immer mit 36 % (~1.230 RPM) drehten. Und das, obwohl der Windows Task Manager bei allen GPU-Parametern 0 % Aktivität meldet. Wir haben auch versucht, den Energieverwaltungsmodus in der NVIDIA Systemsteuerung auf "Normal" zu setzen, aber das schien keinen Effekt zu haben. Es ist möglich, dass es sich um ein isoliertes Problem mit unserem Gerät handelt, daher haben wir uns an NVIDIA gewandt, um weitere Informationen zu erhalten.

NVIDIA GeForce RTX 3080 Ti FE Heatmap während FurMark Stress

Während der Kern selbst unter Last etwa 80 °C erreicht, sind die Oberflächentemperaturen etwa so wie erwartet. Im Bereich des GPU-Kerns messen wir 66 °C und im Bereich der VRMs und des Speichers etwa 62 °C bei einer Umgebungstemperatur von etwa 23 °C. Das Vorhandensein einer Metall-Rückwand scheint hier ein Vorteil bei der effizienten Oberflächenwärmeabfuhr zu sein. Nichtsdestotrotz können wir angesichts des neuen NVIDIA-Lüfterdesigns nicht genug betonen, wie wichtig eine gute Gehäusekühlung ist, um die heiße Luft nach draußen zu befördern.

Da der hintere Lüfter in Richtung des AIO-Kühlers und des System-RAMs ausströmt, kann eine gute Gehäusekühlung dazu beitragen, einen Wärmestau auf den Komponenten oberhalb der Karte zu verhindern, wie in der nebenstehenden Heatmap zu sehen ist. Ein Untervolten der Karte mit Hilfe von Dienstprogrammen von Drittanbietern kann helfen, die Temperaturen weiter zu senken. Eine angemessene Kühlung der Umgebung hilft ebenfalls.
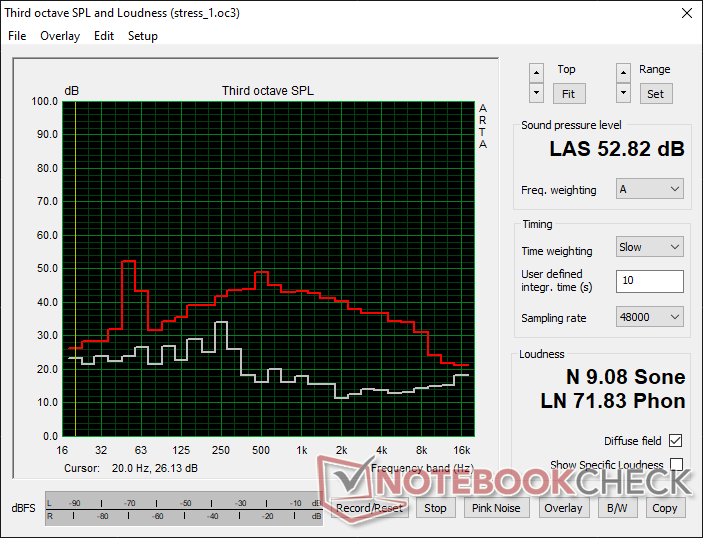
Geräuschpegel

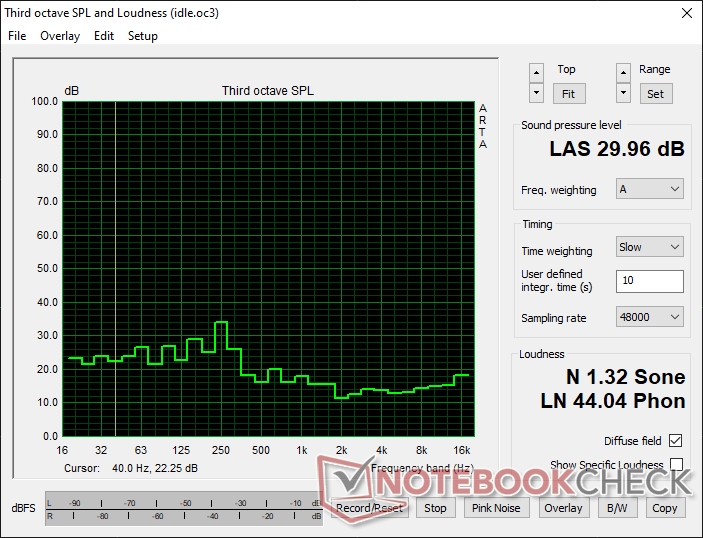
Wir haben die Lüftergeräusche in einem Abstand von 20 cm vom geschlossenen Gehäuse bewertet, wobei alle anderen Systemlüfter ausgeschaltet waren, mit Ausnahme der Corsair H115i Capellix AIO-Pumpe, die auf das Profil "Leise" eingestellt war. Wie bereits angedeutet, haben wir bei unserem Gerät nie einen kompletten Lüfterstopp erlebt. Daher schienen die Geräuschpegel im Leerlauf etwas höher zu sein und lagen nahe bei 30 dB(A).

Nach dem Start von FurMark Stress bei 100 % Leistungsvorgabe haben wir festgestellt, dass die Geräuschpegel auf bis zu 50 dB(A) ansteigen können. Wir verzeichneten einen maximalen Schalldruckpegel von 53 dB(A) während der Dauer des Tests.

Im realen Betrieb ist das wahrscheinlich nicht so anstrengend, aber beim Spielen kann die hohe Lautstärke durchaus störend sein. Bei voller Lüfterdrehzahl konnten wir auch ein Spulenfiepen feststellen. Auch hier ist es möglich, dass es sich nur um ein schlechtes Testgerät handelt. Es ist jedoch klar ersichtlich, dass die beiden 85-mm-Lüfter mehr Arbeit leisten müssen, um die fast volle GA102-GPU richtig zu kühlen, was zu einem wahrnehmbar höheren Lüftergeräusch als bei einer typischen RTX 3080 FE-Karte führt.

Geräuschpegel - Leerlauf mit Gehäuselüftern aus
Geräuschpegel - FurMark Stress bei 100 % PT mit Gehäusefüftern aus

Pro

+ Gute, robuste Konstruktion und Verarbeitungsqualität
+ Ausgezeichnete 4K Ultra 60 fps+ Gaming Performance
+ Performance fast nicht von einer RTX 3090 zu unterscheiden
+ DLSS 2.0 und Raytracing-Unterstützung in kompatiblen Spielen
+ Überschaubare Oberflächentemperaturen unter Last

Contra

- Niedriger getaktet als die RTX 3090 FE und RTX 3080 FE
- Hohe Emissionen unter Last
- Nicht sehr stabil bei höheren Leistungszielen
- Hohe Lüfterlautstärke unter Last
- Kostet fast das Doppelte der RTX 3080 MSRP für nur etwa 15% mehr Leistung

Fazit - Performance-Gewinne und Preise passen nicht gut zusammen

NVIDIA GeForce RTX 3080 Ti Founders Edition. Testgerät mit freundlicher Genehmigung von NVIDIA Indien.

Zum ersten Mal sehen sich Gamer mit einem dreifachen Problem konfrontiert: Engpässe in der Lieferkette, überhöhte Preise und der flüchtige Kryptowährungs-Mining-Wahn. Die positive Seite ist, dass AMDs Wiederaufstieg eine dringend benötigte Konkurrenz im Bereich der Flaggschiff-GPUs zurückgebracht hat. Die NVIDIA GeForce RTX 3080 Ti Founders Edition kommt zu einem solch entscheidenden Zeitpunkt in der Geschichte der GPUs an.

Die RTX 3080 Ti FE bringt alle Vorzüge des Founders Edition Designs von Ampere mit, das den Add-in-Board (AiB)-Karten den Rang abzulaufen scheint. Das Gehäuse ist hochwertig, und im Gegensatz zur Mammut-RTX 3090 FE verfügt sie über ein schlankes 2-Slot-Design. NVIDIA verwendet weiterhin den 12-poligen Stromanschluss, was das Kabelmanagement zu einer umständlichen Angelegenheit machen kann, wenn man kein modernes Netzteil mit einem 12-poligen PCIe-Anschluss hat.

Allerdings haben wir beobachtet, dass die RTX 3080 Ti FE nicht ganz von NVIDIAs neuem Founders Edition Design zu profitieren scheint. Während des Tests beobachteten wir häufige Taktanhebungen, hohe Temperaturen und hohe Geräuschpegel. Abgesehen von der Möglichkeit, dass dies ein isoliertes Problem mit unserem Testgerät sein könnte, ist die RTX 3080 Ti im Grunde genommen fast eine RTX 3090. Die Verwendung dieses Chips in einem Gehäuse, das für die RTX 3080 gedacht ist, wird also zwangsläufig zu ein paar Unstimmigkeiten führen, wenn es um die Thermik geht.

Die NVIDIA GeForce RTX 3080 Ti bietet Gaming Performance auf RTX 3090 Level zu einem um 300 US-Dollar niedrigeren UVP. Während dies zweifelsohne die Vorzeige-GPU ist, die sich Hardcore-Gamer ersehnen, ist sie aber auch fast doppelt so teuer wie die RTX 3080 für nominelle Leistungssteigerungen in den meisten Titeln. 

Die RTX 3080 Ti zielt darauf ab, die RTX 3080 als das Flaggschiff der Ampere-GPUs für Spiele zu verdrängen, und das kann sie auch ganz leicht. Allerdings sehen wir nur etwa weniger als 15 % Vorteil in 4K Ultra in den meisten Titeln. Die andere Sichtweise ist, dass die RTX 3090 in den meisten Spielen einen Vorsprung von weniger als 5 % gegenüber der RTX 3080 Ti hat, so dass man mit der RTX 3080 Ti ein wenig sparen kann, wenn Gaming die primäre Nutzung darstellt - vorausgesetzt man ist in der Lage, die Karte tatsächlich zu kaufen. In Anbetracht der Tatsache, dass die RTX 3080 Ti sowohl in synthetischen Tests als auch in Spielen fast gleichauf mit der RTX 3090 ist, macht es nur dann Sinn, sich für Letztere zu entscheiden, wenn man wirklich die ganze 24-GB-VRAM-Größe für kreative Aufgaben benötigen.

Wenn Sie sich nicht um Raytracing-Performance oder DLSS kümmern, sind AMDs Radeon RX 6800 XT und RX 6900 XT immer noch höchst relevante Konkurrenten für die RTX 3080 Ti FE und zu viel geringeren Preisen erhältlich. Davon abgesehen ist AMDs Raytracing-Performance bereits auf RTX-2080-Ti-Niveau, und das Unternehmen bringt auch seine eigene DLSS-Alternative namens FidelityFX Super Resolution (FSR) heraus, was die Aussichten von RDNA 2 weiter verbessern sollte.

Diejenigen, die mit QHD-Auflösungen oder darunter spielen wollen, sind besser mit der RTX 3070 und RTX 3060 Ti bedient, es sei denn, man benötigt wirklich hohe Bildraten, um mit Displays mit hoher Bildwiederholrate Schritt zu halten.

Preis und Verfügbarkeit

Die Verfügbarkeit von GPUs zu UVPs ist noch bis weit ins Jahr 2021 hinein ein Thema. Die RTX 3080 Ti Founders Edition ist bei den meisten Online-Händlern vergriffen. AiB-Karten von Herstellern wie MSI, Asus, EVGA, Zotac und Gigabyte scheinen eine viel bessere Verfügbarkeit zu haben, allerdings zu einem deutlich höheren Aufpreis. Zum Beispiel kostet die MSI Gaming GeForce RTX 3080 Ti Gaming X Trio derzeit fast 2.400 US-Dollar auf Newegg und Amazon. Best Buy hingegen listet sowohl die RTX 3080 Ti FE als auch andere AiB-Varianten als ausverkauft. Die Situation bei Walmart ist auch nicht besser, wo Karten wie die Zotac AMP Holo GeForce RTX 3080 Ti für stolze 3.399 US-Dollar verkauft werden. Wir empfehlen, noch ein wenig zu warten, bis sich die Preise normalisiert haben, bevor man sich für einen Kauf entscheidet.

Preisvergleich

Alle 2 Beträge lesen / Antworten
static version load dynamic
Loading Comments
Diesen Artikel kommentieren / Antworten
Teilen Sie diesen Artikel, um uns zu unterstützen. Jeder Link hilft!
> Notebook Test, Laptop Test und News > Tests > Notebook Testberichte > NVIDIA GeForce RTX 3080 Ti Founders Edition Test: Günstigere RTX-3090-Leistung, aber immer noch ein Angebot von geringem Wert
Autor: Vaidyanathan Subramaniam, 13.07.2021 (Update: 21.07.2022)