Notebookcheck Logo

AMD Radeon RX 6900 XT im Test: Performance fast auf RTX-3090-Niveau für 550 € weniger, aber nur marginal besser als eine RX 6800 XT

Radeon meldet sich zurück. Die Radeon RX 6900 XT kündigt AMDs Wiedereinstieg in den Bereich der Flaggschiff-GPUs seit der R9 Fury X aus dem Jahr 2015 an. Die RX 6900 XT bietet eine ausgezeichnete Rasterperformance, welche sie in die Nähe einer NVIDIA GeForce RTX 3090 katapultiert, trotz einiger Unzulänglichkeiten beim Ray Tracing und dem Fehlen von KI-basiertem Super Sampling. Wir nehmen die AMD Radeon RX 6900 XT mit auf unseren Testparkour und schauen wie sich Team Red mit RDNA 2 bislang weiterentwickelt hat.

AMD bereitet Intel im CPU-Markt richtig Probleme mit seinen starken Ryzen-CPUs, aber AMDs Radeon-GPUs lagen bislang noch deutlich hinter der Konkurrenz von Nvidia. Die letzte AMD-Grafikkarte, die zumindest in Reichweite von Nvidias Flaggschiff-GPUs geriet, war die Fiji-basierte Radeon R9 Fury X, die mit der NVIDIA Maxwell GeForce 980 Ti im Jahr 2015 um die Leistungskrone kämpfte.

Seitdem wurden NVIDIAs Turing-Flaggschiffe nicht mehr herausgefordert. AMDs Vega 56, Vega 64 und die Radeon VII werden NVIDIA kaum schlaflose Nächte verursacht haben. Erst im Juli 2019 hatte AMD wieder moderaten Erfolg mit der Navi-10-basierten Radeon RX 5700 XT, aber auch diese war eher vergleichbar mit einer GeForce RTX 2070 Super, nicht aber mit dem damaligen Nvidia-Flaggschiff.

Aber das alles ist ab jetzt Geschichte. Letzten Oktober hat AMD offiziell die Radeon-RX-6000-Serie enthüllt, bestehend aus der RX 6800, der RX 6800 XT, der RX 6900 XT und kürzlich auch der RX 6700 XT. Das Versprechen: Die Serie soll NVIDIAs High-End-Ampere-Serie rund um die RTX 3070, RTX 3080 und RTX 3090 im Bereich 1440p- und 4K-Gaming endlich wieder Paroli bieten.

Dabei markiert die RX 6900 XT den RTX-3090-Herausforderer, zumindest in Sachen reiner Rasterperformance (unter Vorbehalt natürlich). NVIDIA-Karten haben hingegen die Oberhand bei Zusatzfeatures wie Ray Tracing und KI-basiertem Super Sampling. Allerdings hat die RX 6900 XT auch noch ein paar Asse im Ärmel.

In diesem Test nehmen wir das Top-Modell der Navi-21-XTX-Karten unter die Lupe und schauen, ob es den Mumm hat es mit NVIDIAs Ampere-Goliath aufzunehmen.

Vergleich der Radeon RX 6900 XT mit anderen AMD-GPUs

Specifications Radeon RX 6900 XT Radeon RX 6800 XT Radeon RX 6800 Radeon RX 6700 XT Radeon RX 5700 XT Radeon RX 5700 Radeon VII
GPU Navi 21 XTX Navi 21 XT Navi 21 XL Navi 22 Navi 10 XT Navi 10 XL Vega 20 XT
Manufacturing Process 7 nm 7 nm 7 nm 7 nm 7 nm 7 nm 7 nm
Compute Units 80 72 60 40 40 36 60
Shading Units 5,120 4,608 3,840 2,560 2,560 2,304 3,840
Texture Mapping Units 320 288 240 160 160 144 240
Ray Accelerators 80 72 60 40 -- -- --
Base Clock 1,825 MHz 1,825 MHz 1,700 MHz 2,321 MHz 1,605 MHz 1,465 MHz 1,400 MHz
Game Clock 2,015 MHz 2,015 MHz 1,815 MHz 2,424 MHz 1,755 MHz 1,625 MHz 1,750 MHz
Boost Clock 2,250 MHz 2,250 MHz 2,105 MHz 2,581 MHz 1,905 MHz 1,725 MHz 1,802 MHz
Infinity Cache 128 MB 128 MB 128 MB 96 MB -- -- --
Memory Bus Width 256-bit 256-bit 256-bit 192-bit 256-bit 256-bit 4096-bit
Memory Bandwidth 512 GB/s 512 GB/s 512 GB/s 384 GB/s 448 GB/s 448 GB/s 1,024 GB/s
Memory Size 16 GB GDDR6 16 GB GDDR6 16 GB GDDR6 12 GB GDDR6 8 GB GDDR6 8 GB GDDR6 16 GB HBM2
TBP 300 W 300 W 250 W 230 W 225 W 180 W 295 W

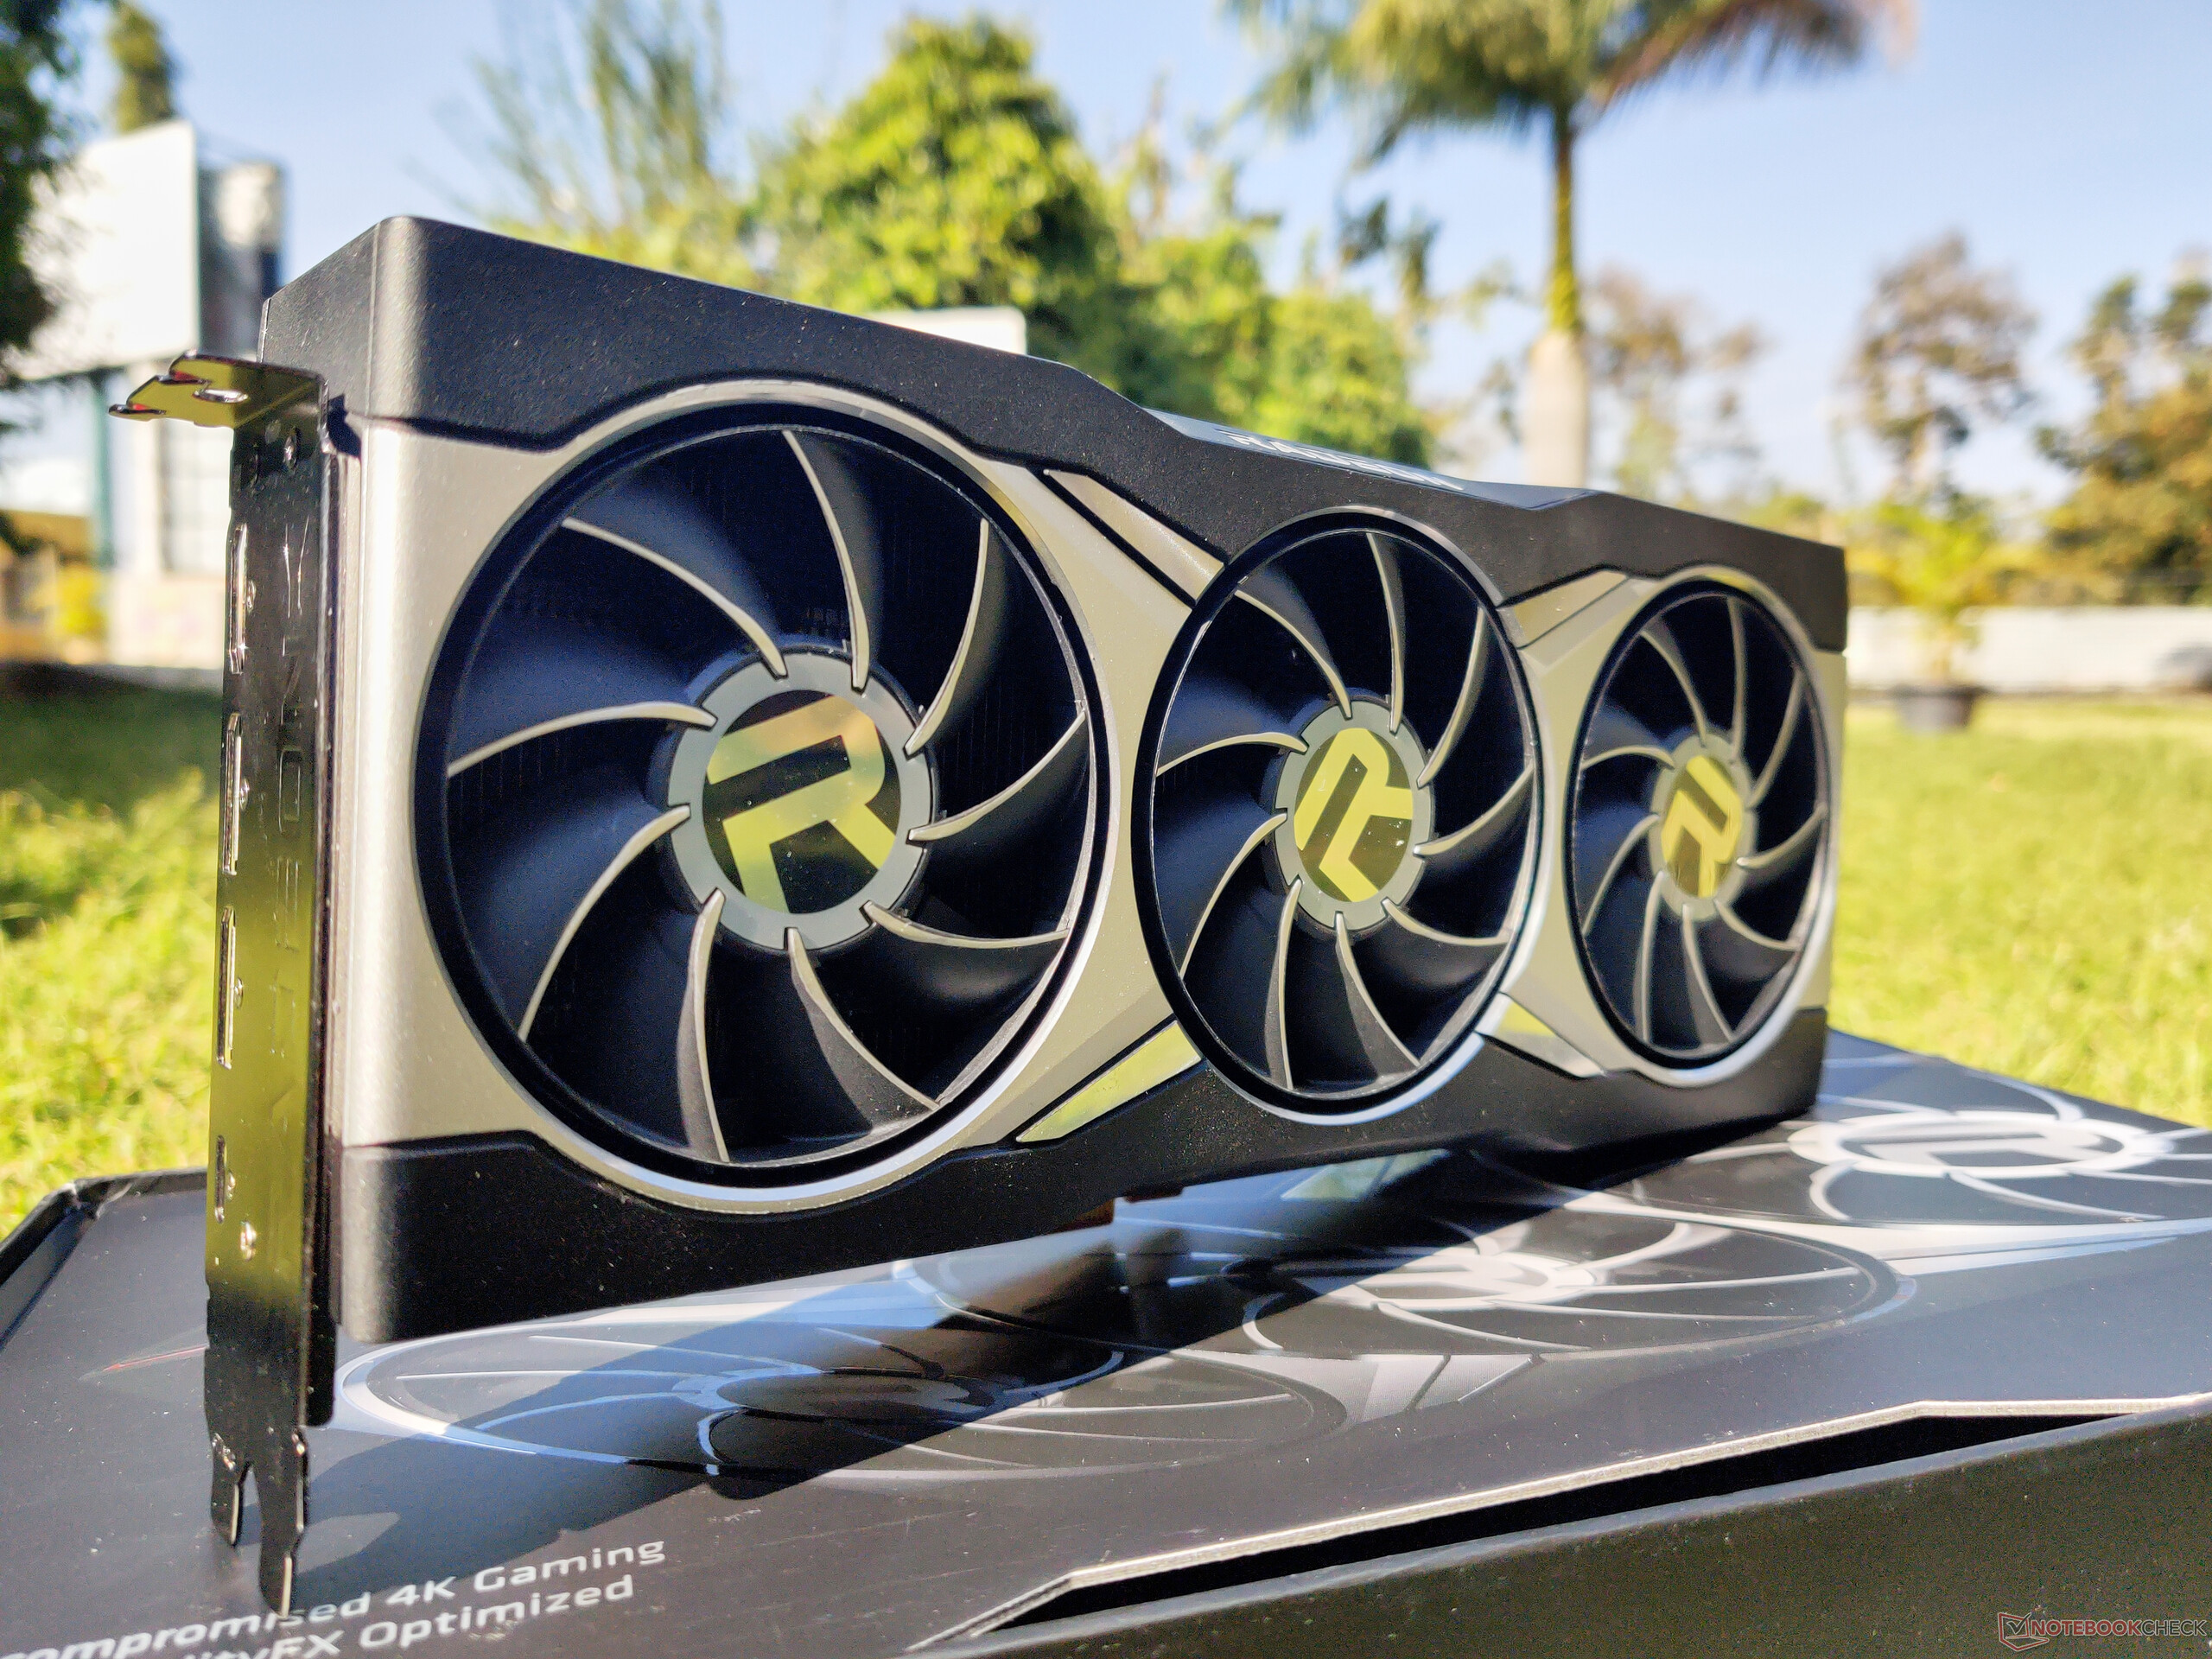
Ein Überblick zur AMD Radeon RX 6900 XT

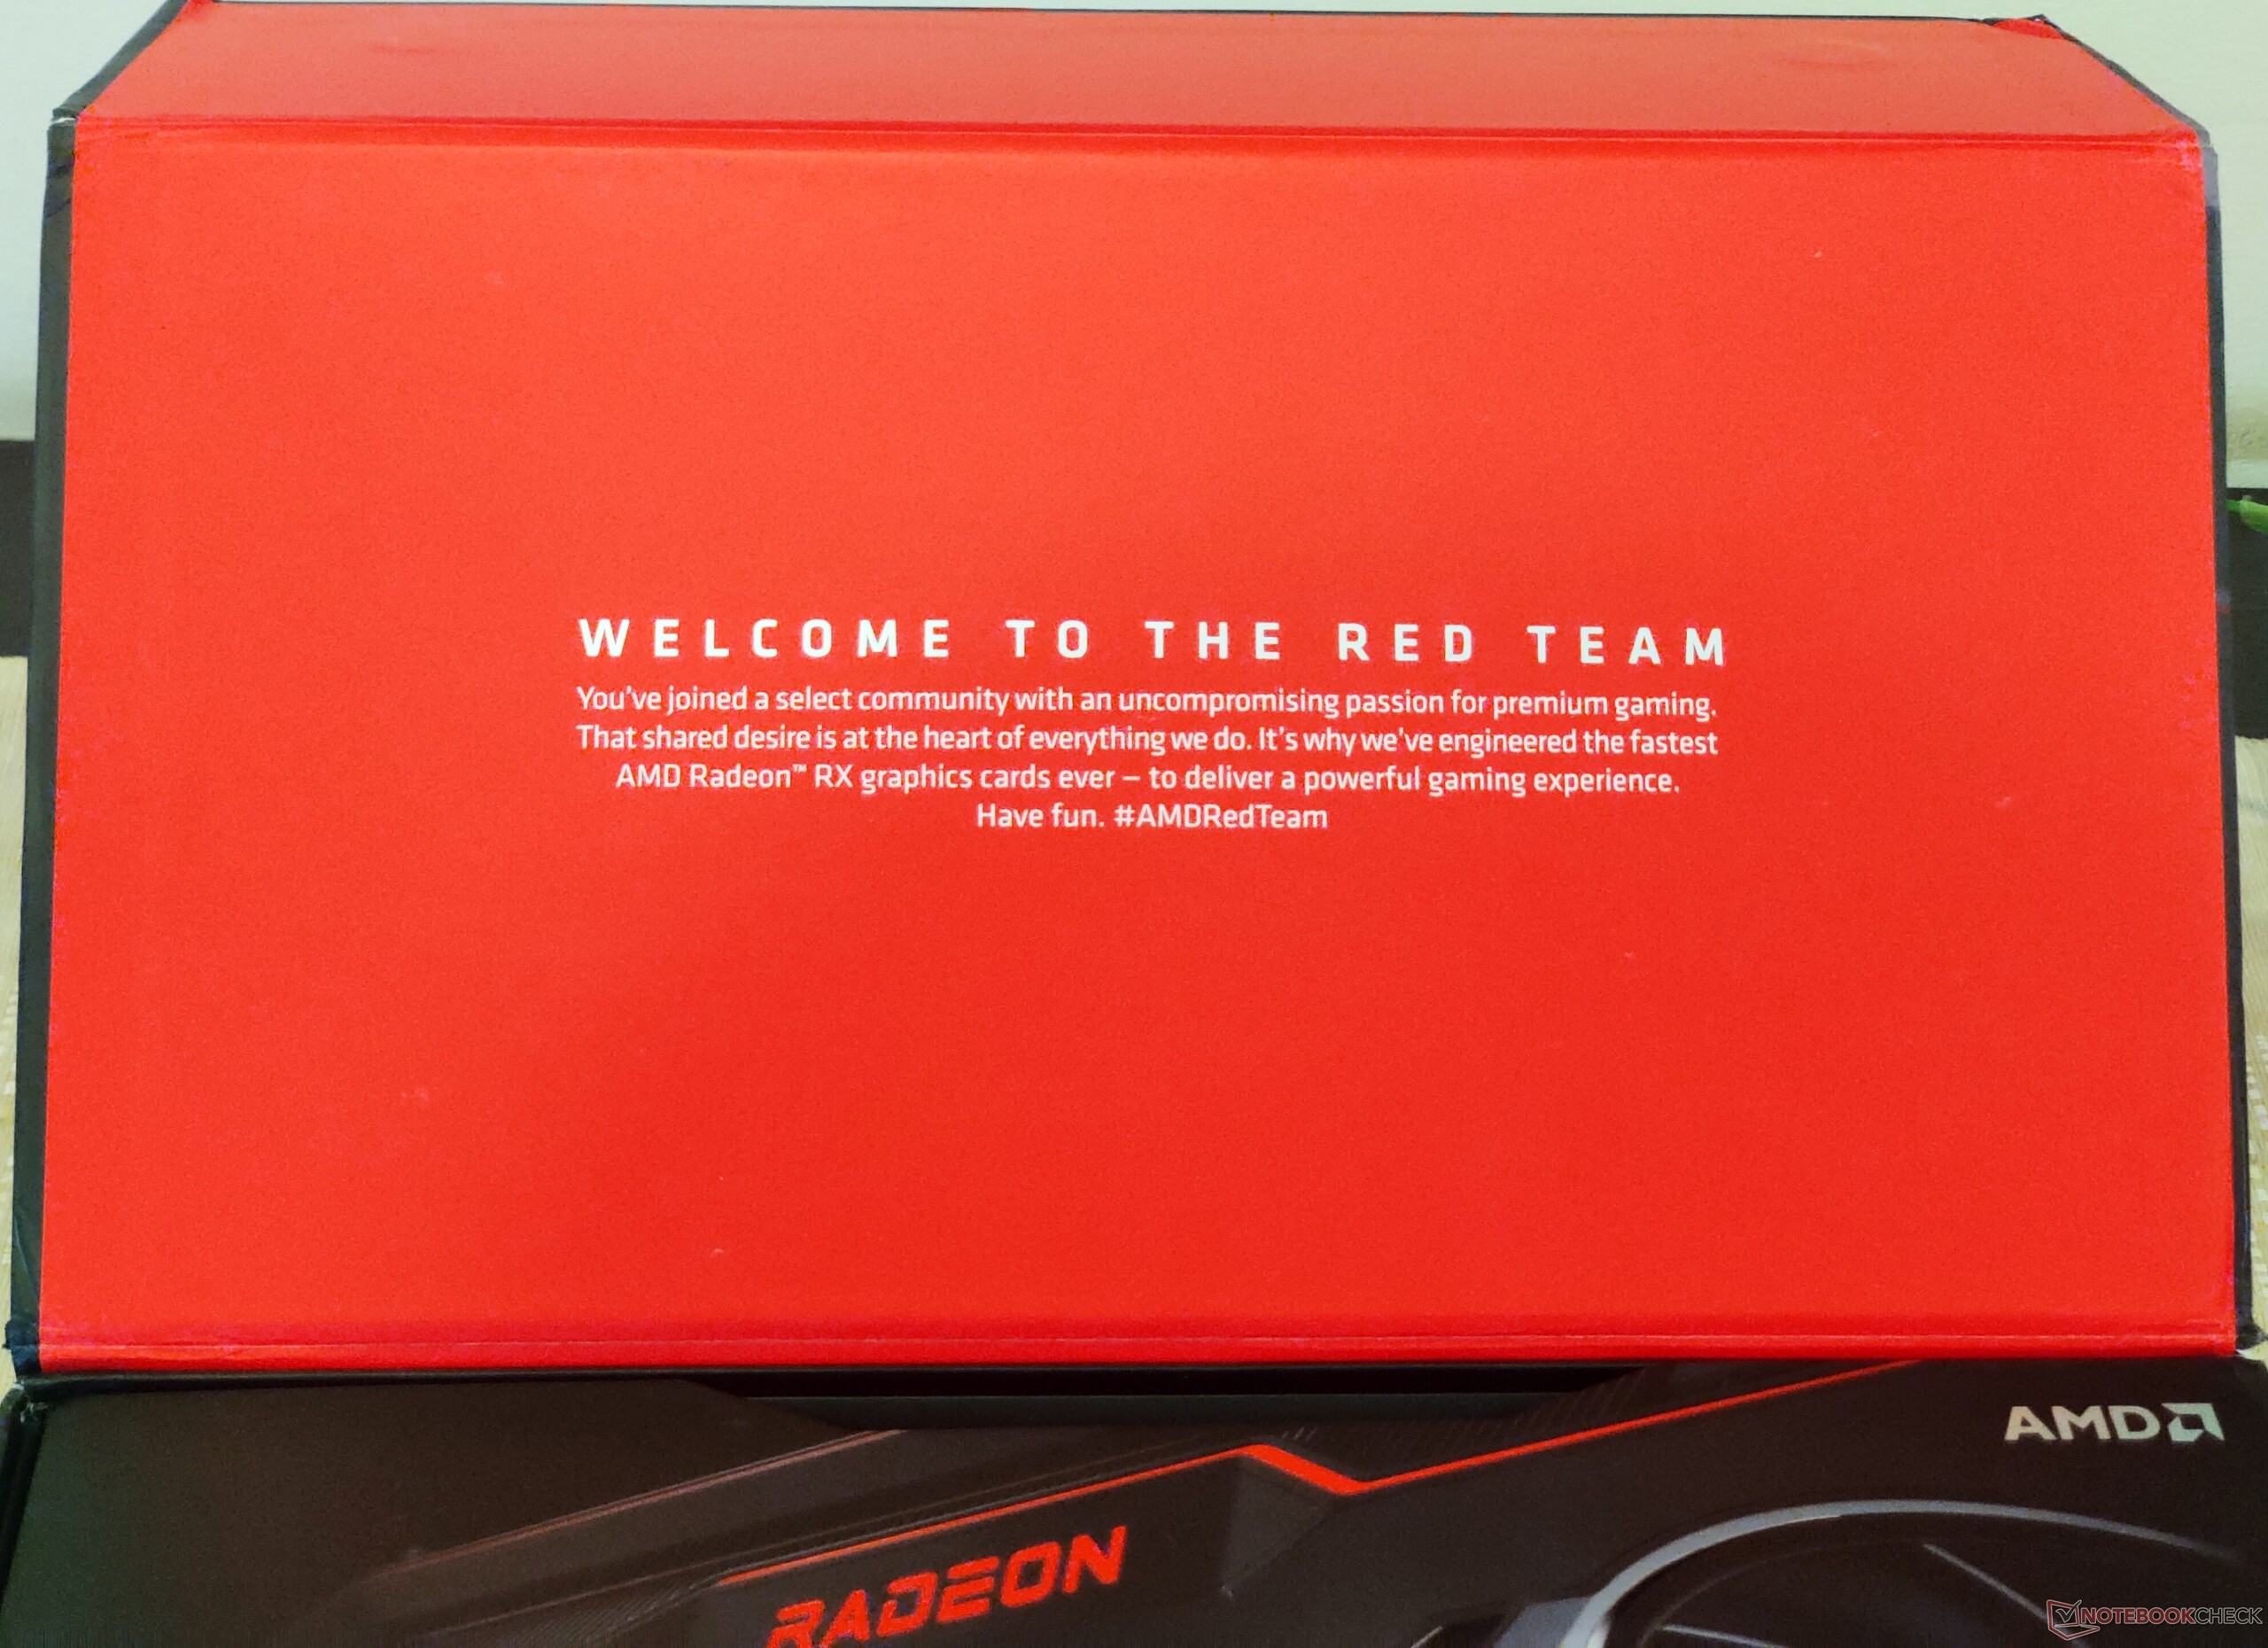
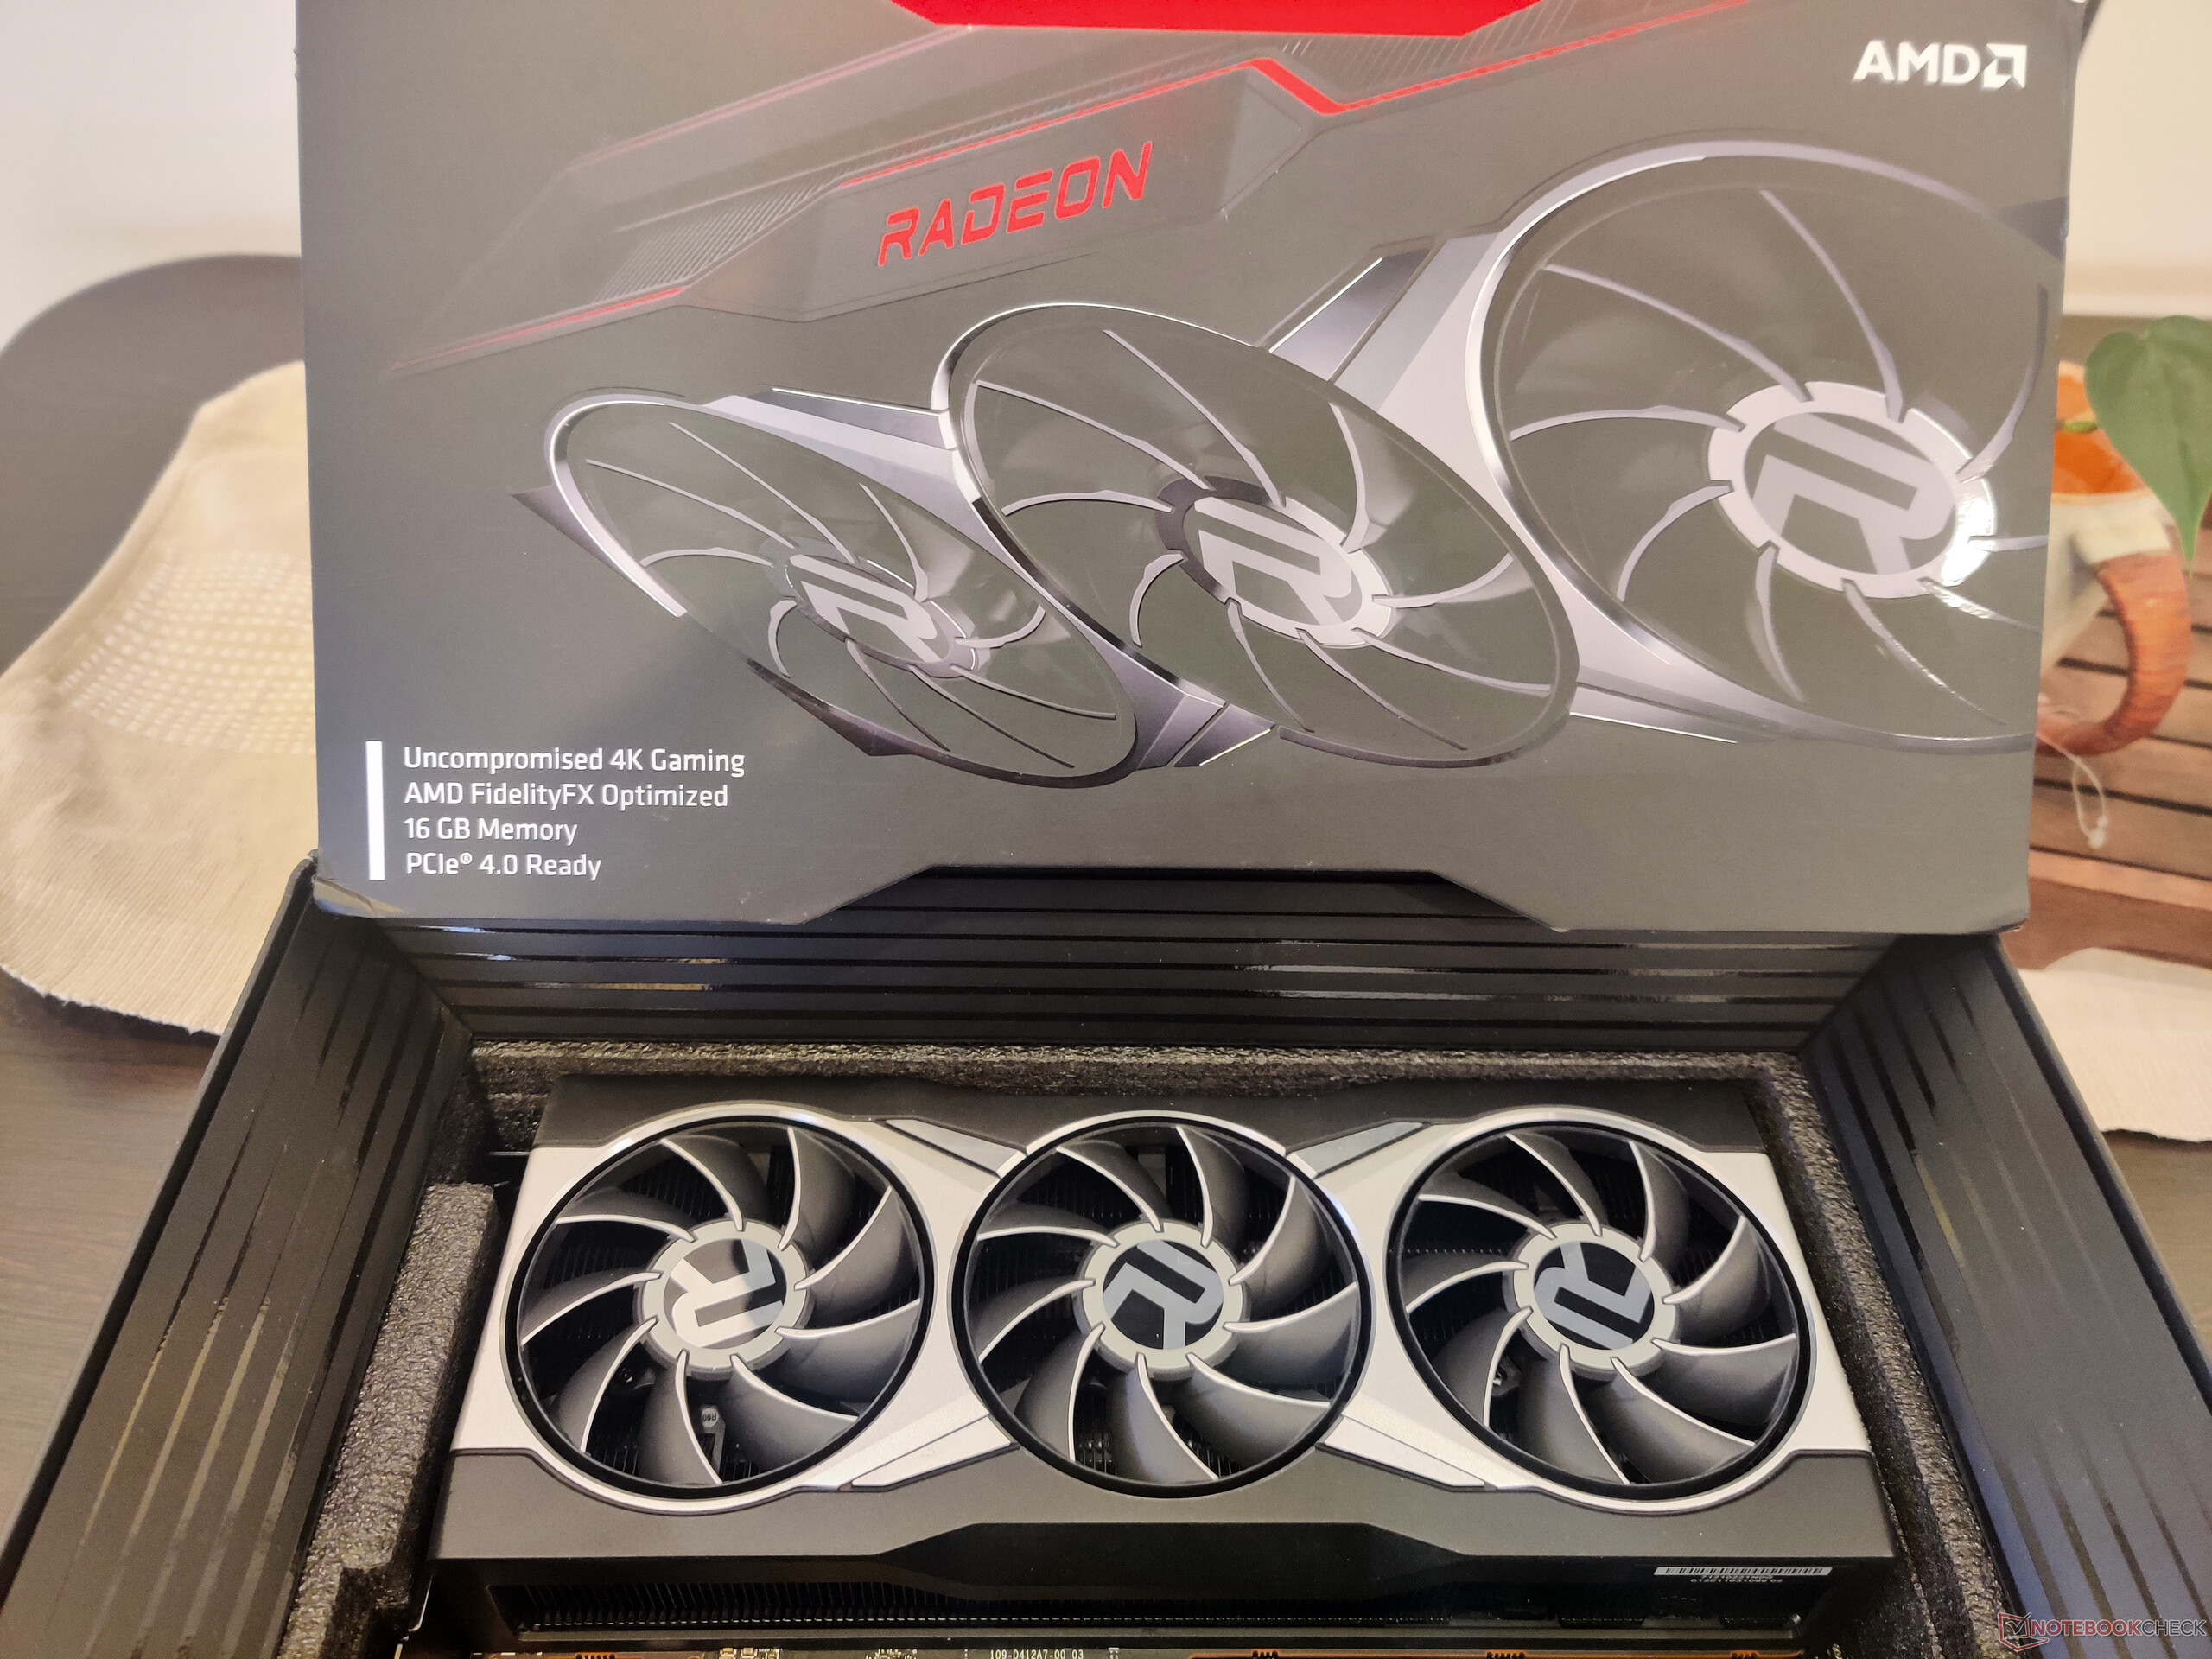
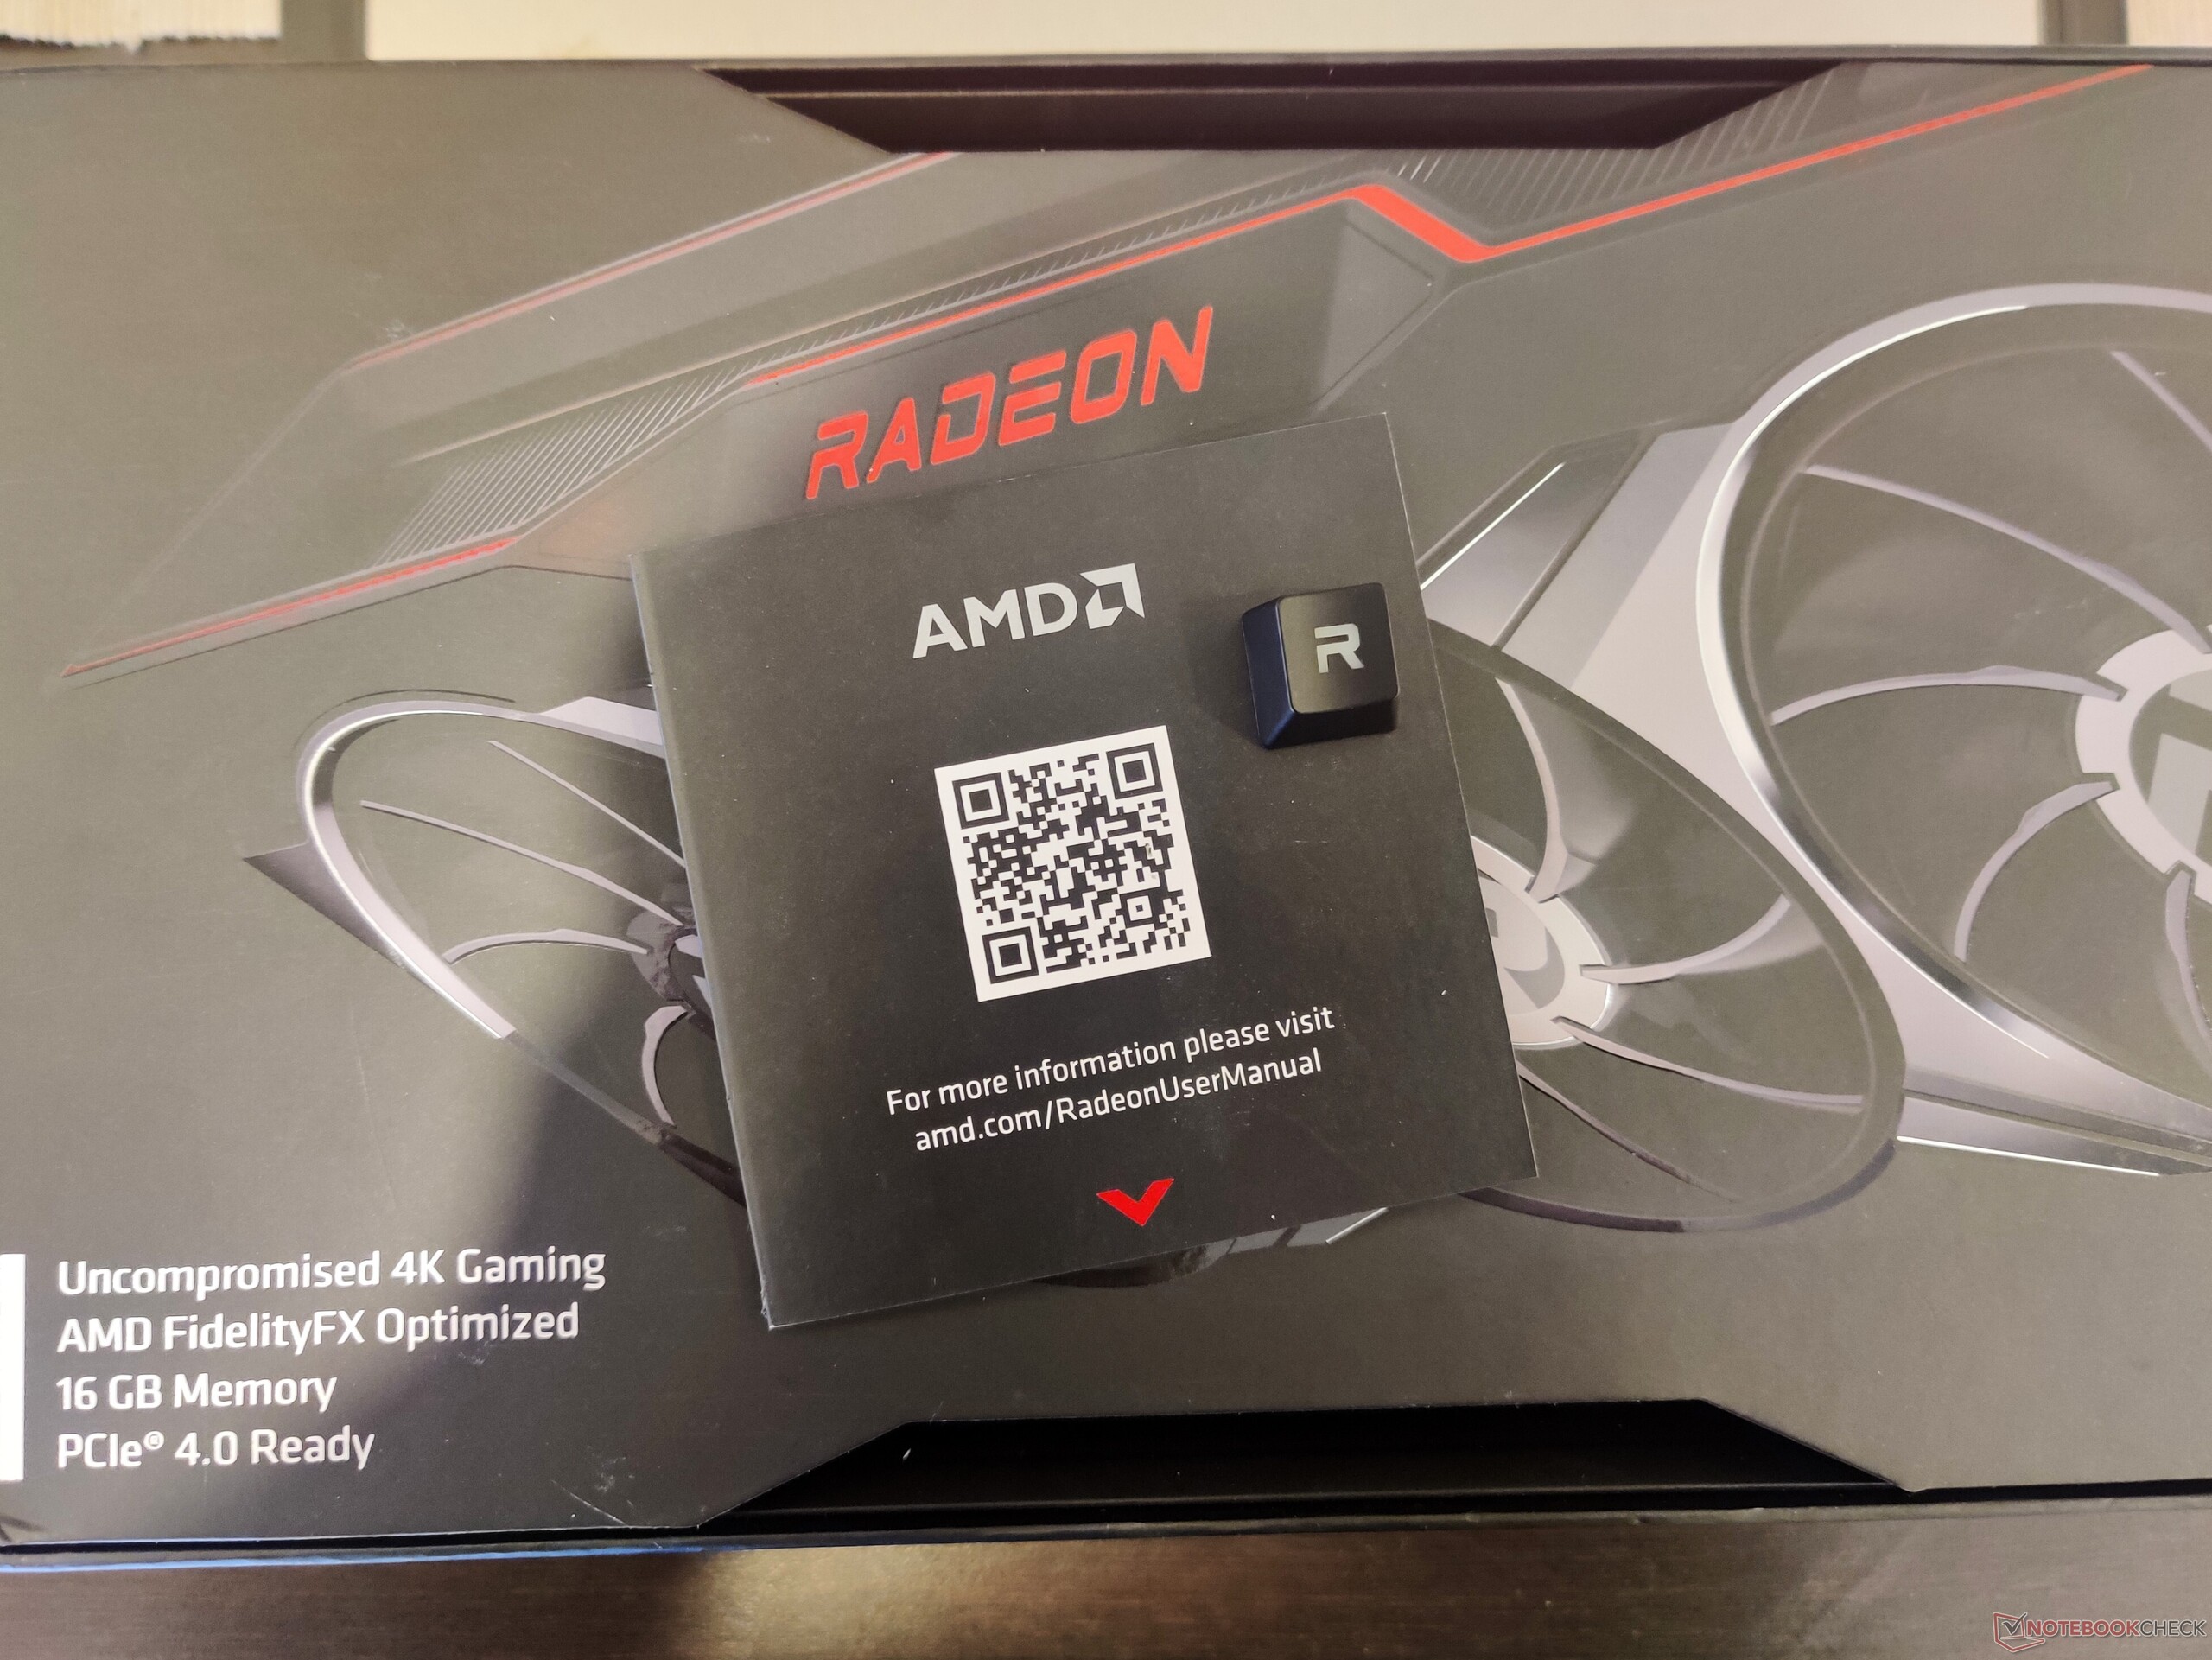
Beim Öffnen der Verpackung werden wir mit der Nachricht "Welcome to the Red Team" ("Willkommen bei Team Rot") begrüßt. Das Paket beinhaltet eine Radeon-Pappschachtel mit einem Schnellstartanleitung sowie einer AMD-designten "R"-Taste für eine Tastatur. Die "R"-Taste ist natürlich in der typischen Radeon-Schriftart designt und erlaubt die Beleuchtung mittels RGB-Licht. Leider fand sich in unserer Verpackung kein Mauspad mit AMD-Branding, aber das sollte in der endgültigen Verkaufspackung mit dabei sein.

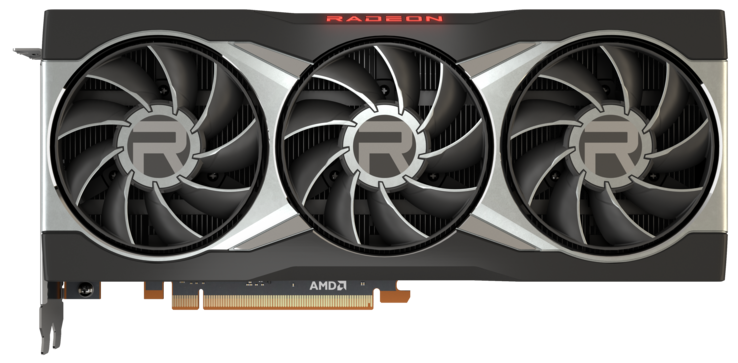
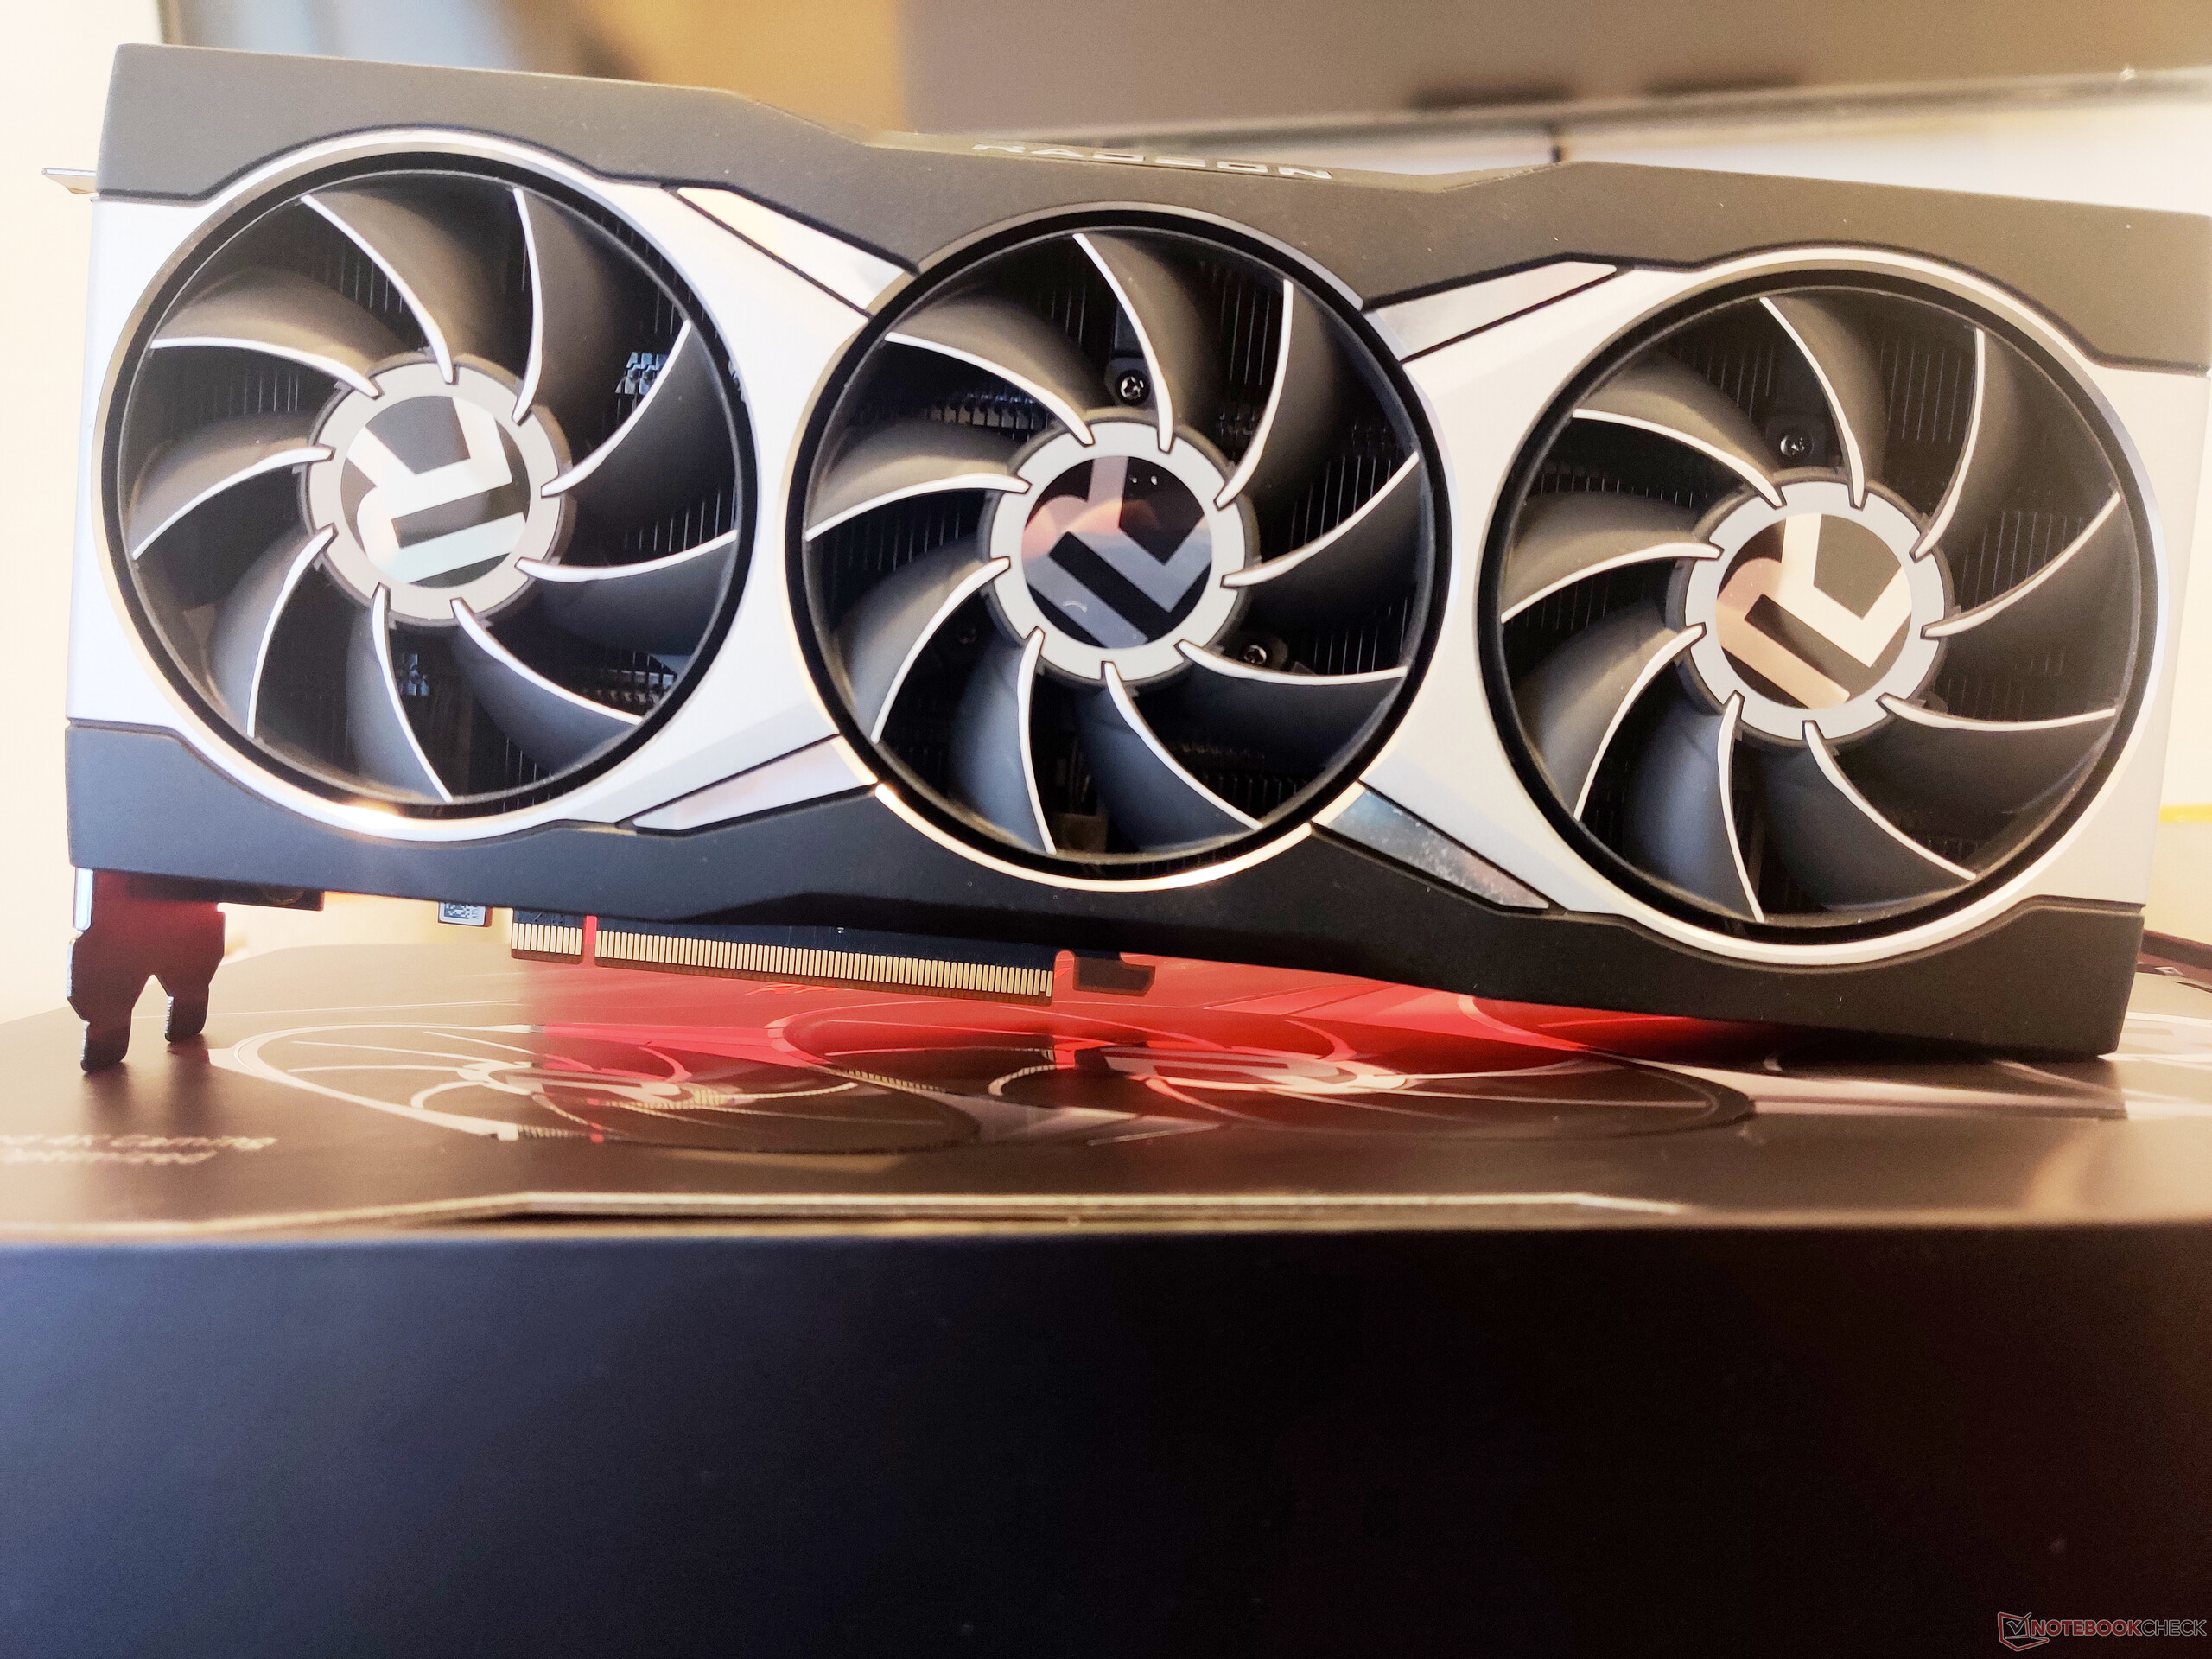
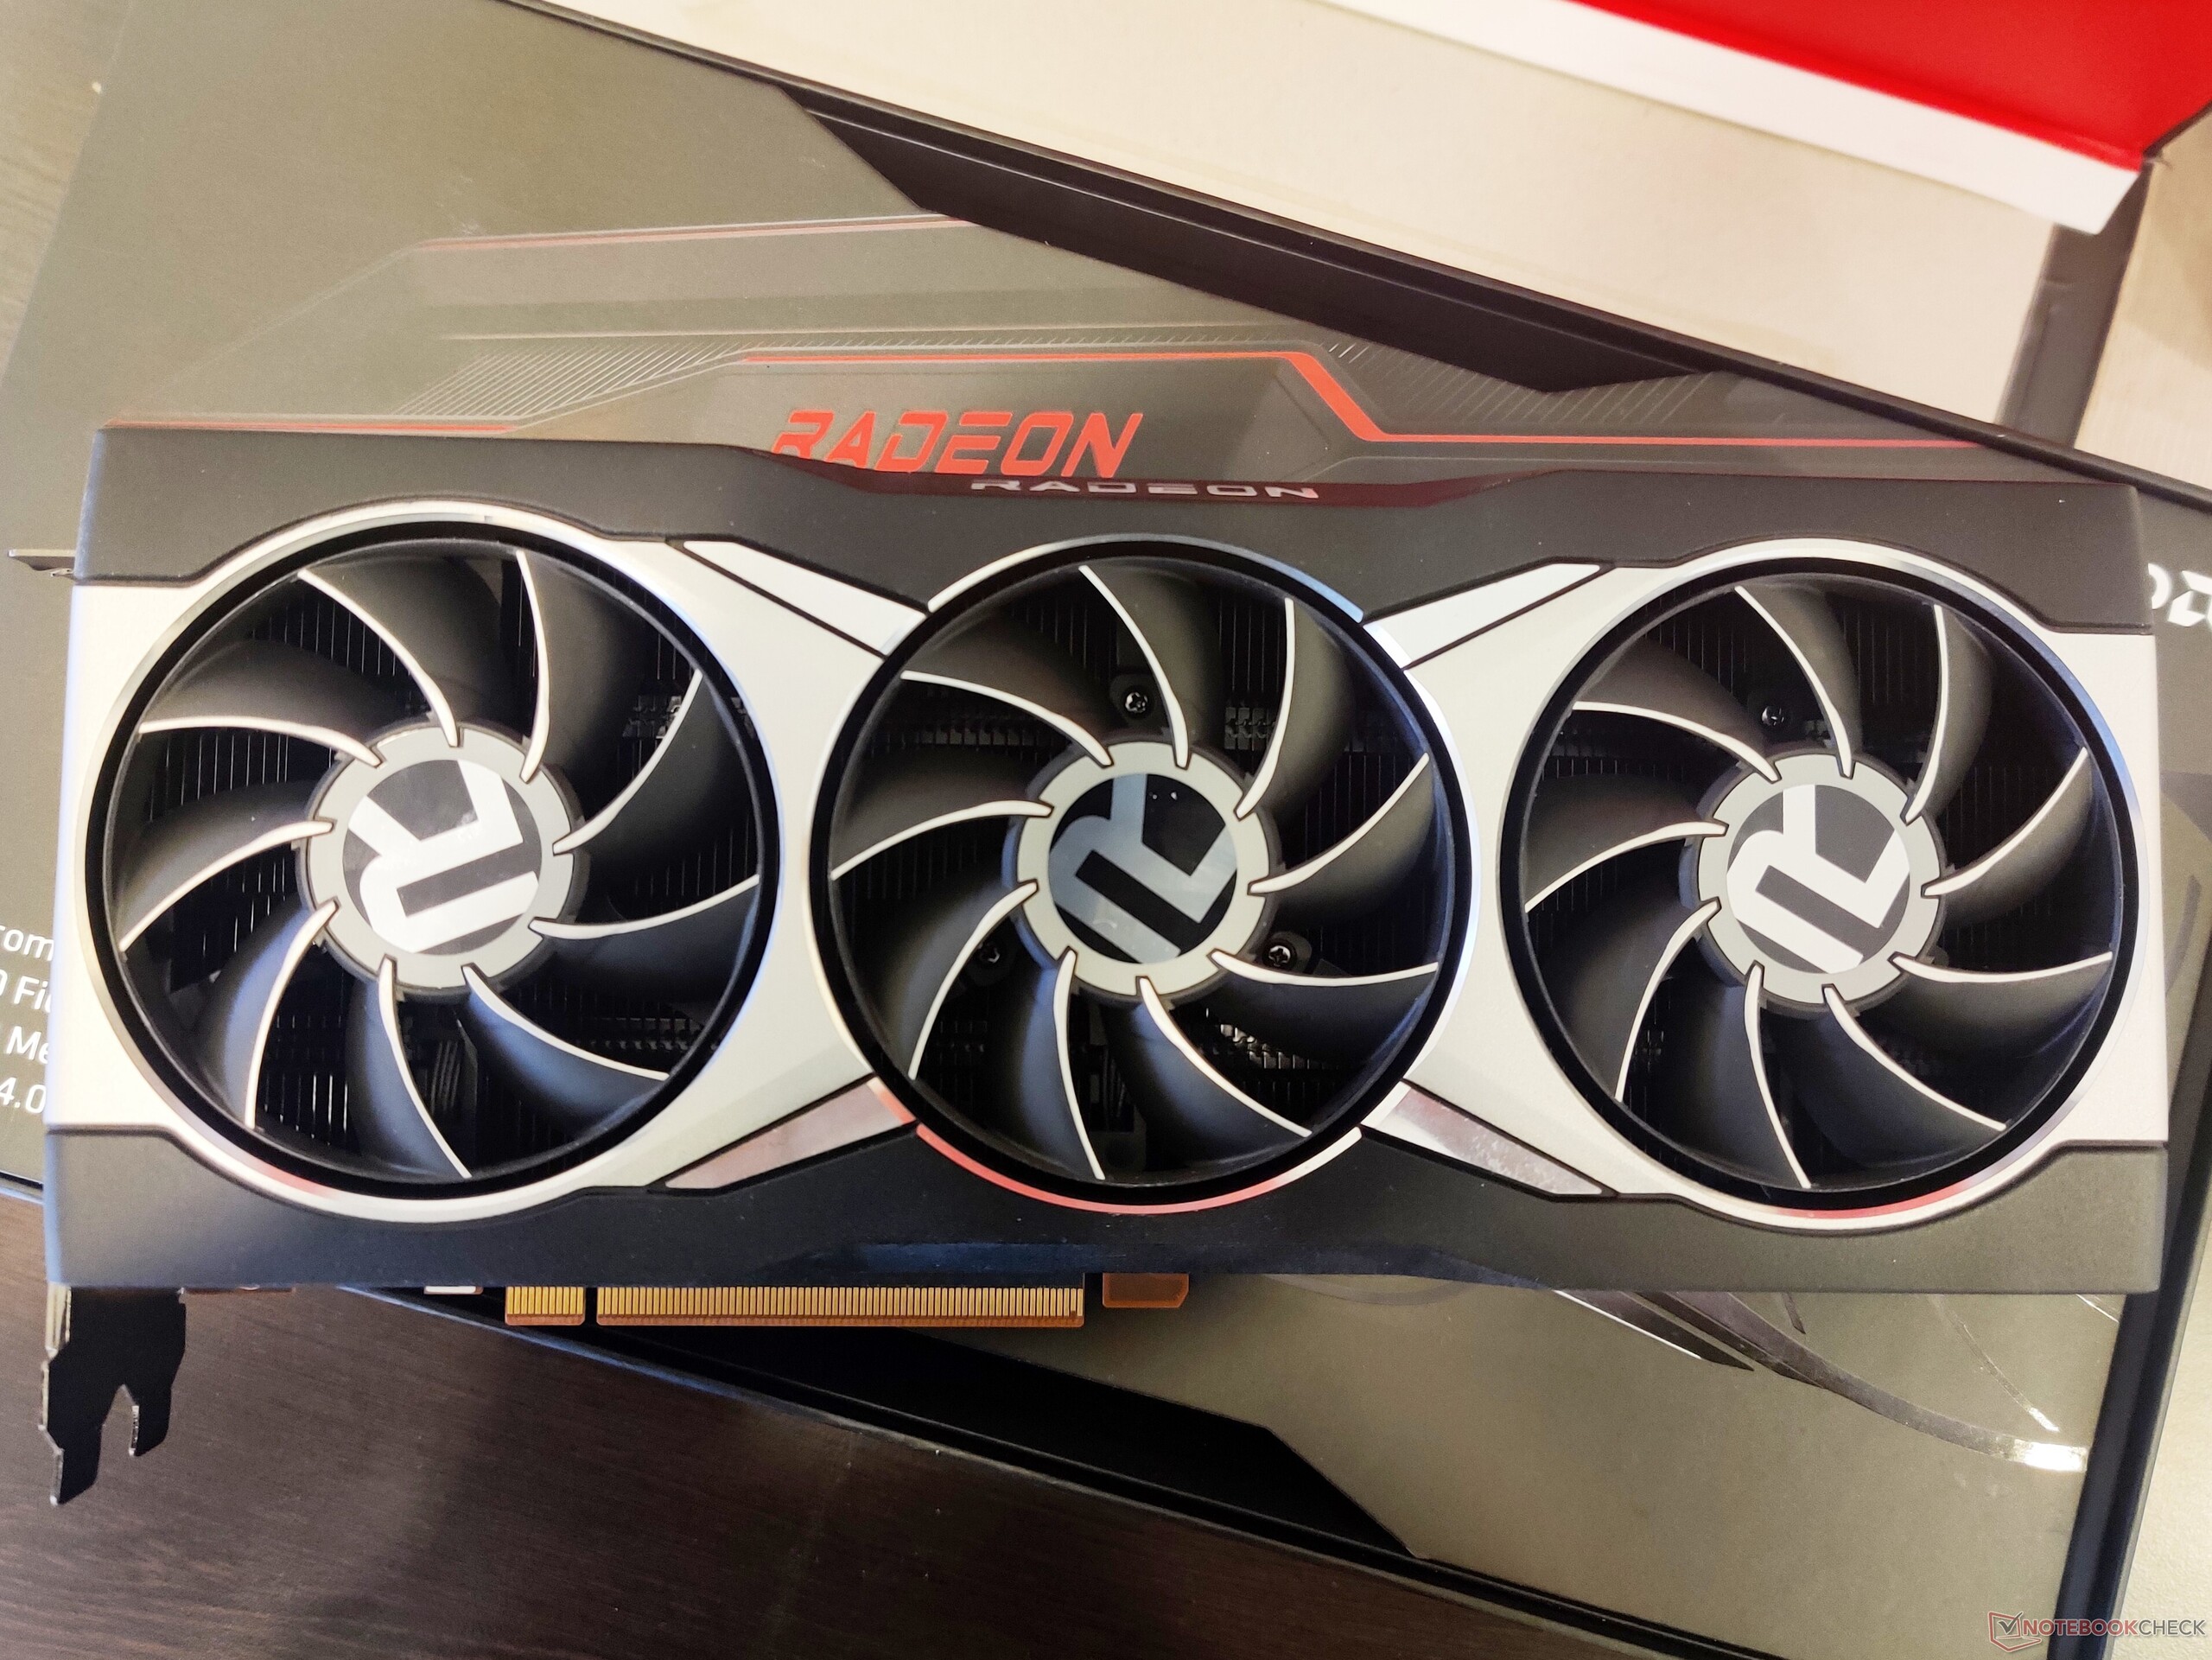
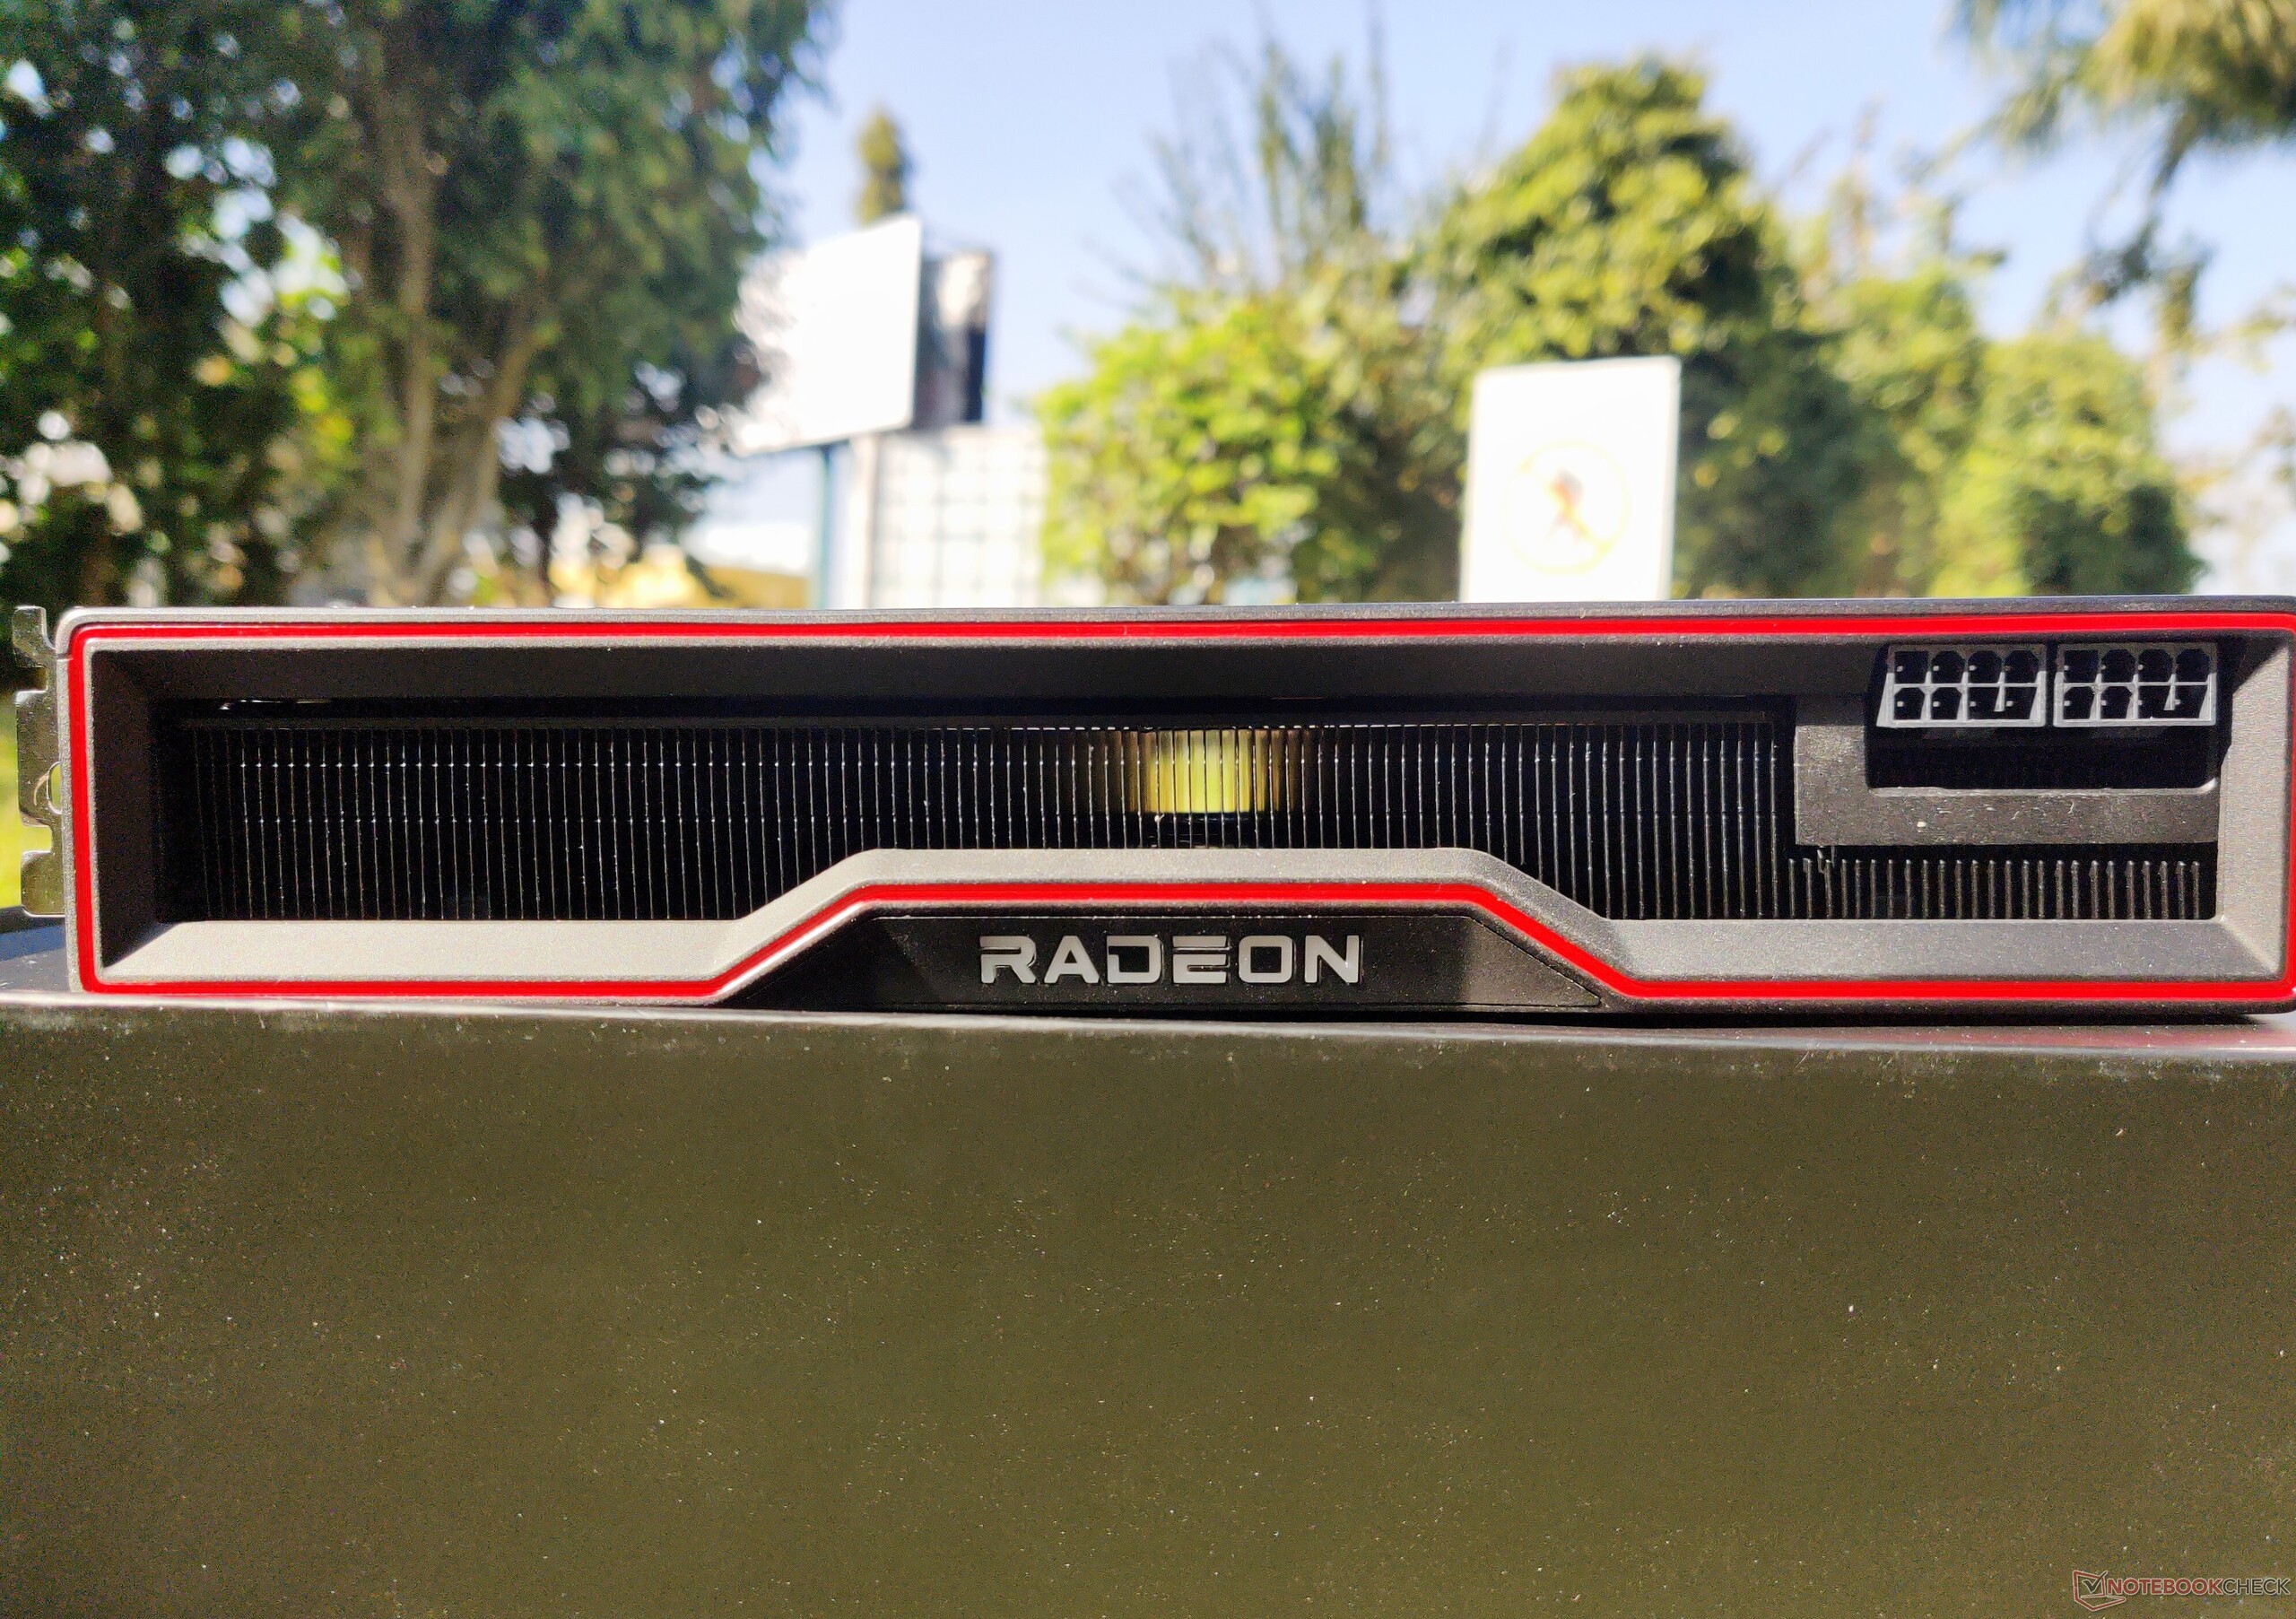
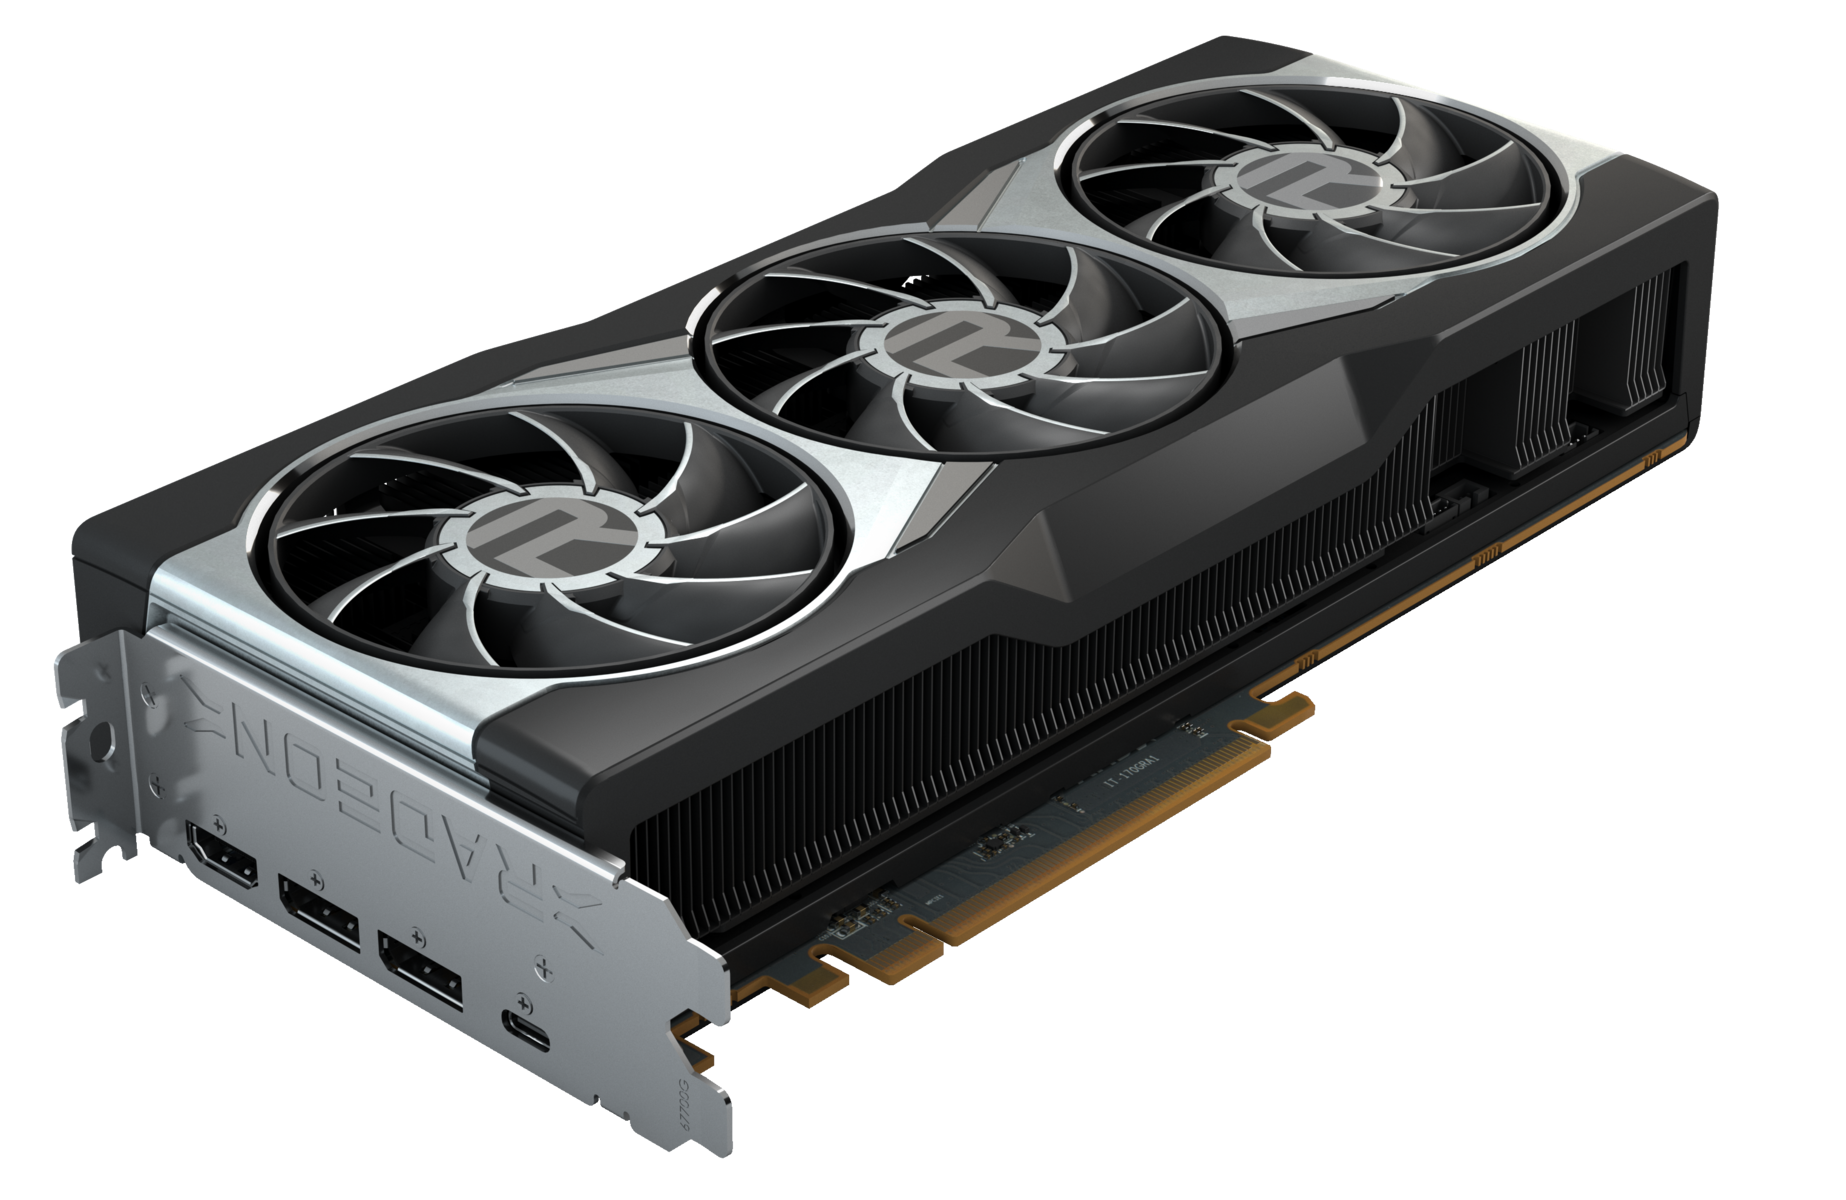
Was die Karte selbst betrifft, können wir sehen, dass AMD den ventilatorartigen Kühler der RX 5700 XT in die Tonne getreten hat und stattdessen nun auf einen Triple-Lüfter-Design setzt. Die Lüfter sind auch mit dem "R"-Logo verziert und sind in das helle, silberne Metallgehäuse integriert. Oben befindet sich ein roter Rand sowie ein RGB-beleuchtetes Radeon-Logo.

Das Radeon-Logo leuchtet standardmäßig in Rot, Nutzer können jedoch das CoolerMaster RGB LED Tool herunterladen, wodurch die Farbe auch gewechselt werden kann. Wir riskieren die Vermutung, dass CoolerMaster irgendwie in die Designfindung des Kühlsystems eingebunden war, auch angesichts dessen, was wir zuvor beim Ryzen-Wraith-Prism-Kühler gesehen haben.

Ebenfalls oben befinden sich zwei 8-Pin-Power-Konnektoren, welche sich zur rechten Seite hin orientieren - keine ausgefallenen 12-Pin-Alien-Antennen wie bei NVIDIA, was je nach eigenen Vorlieben gut oder weniger gut sein kann. 

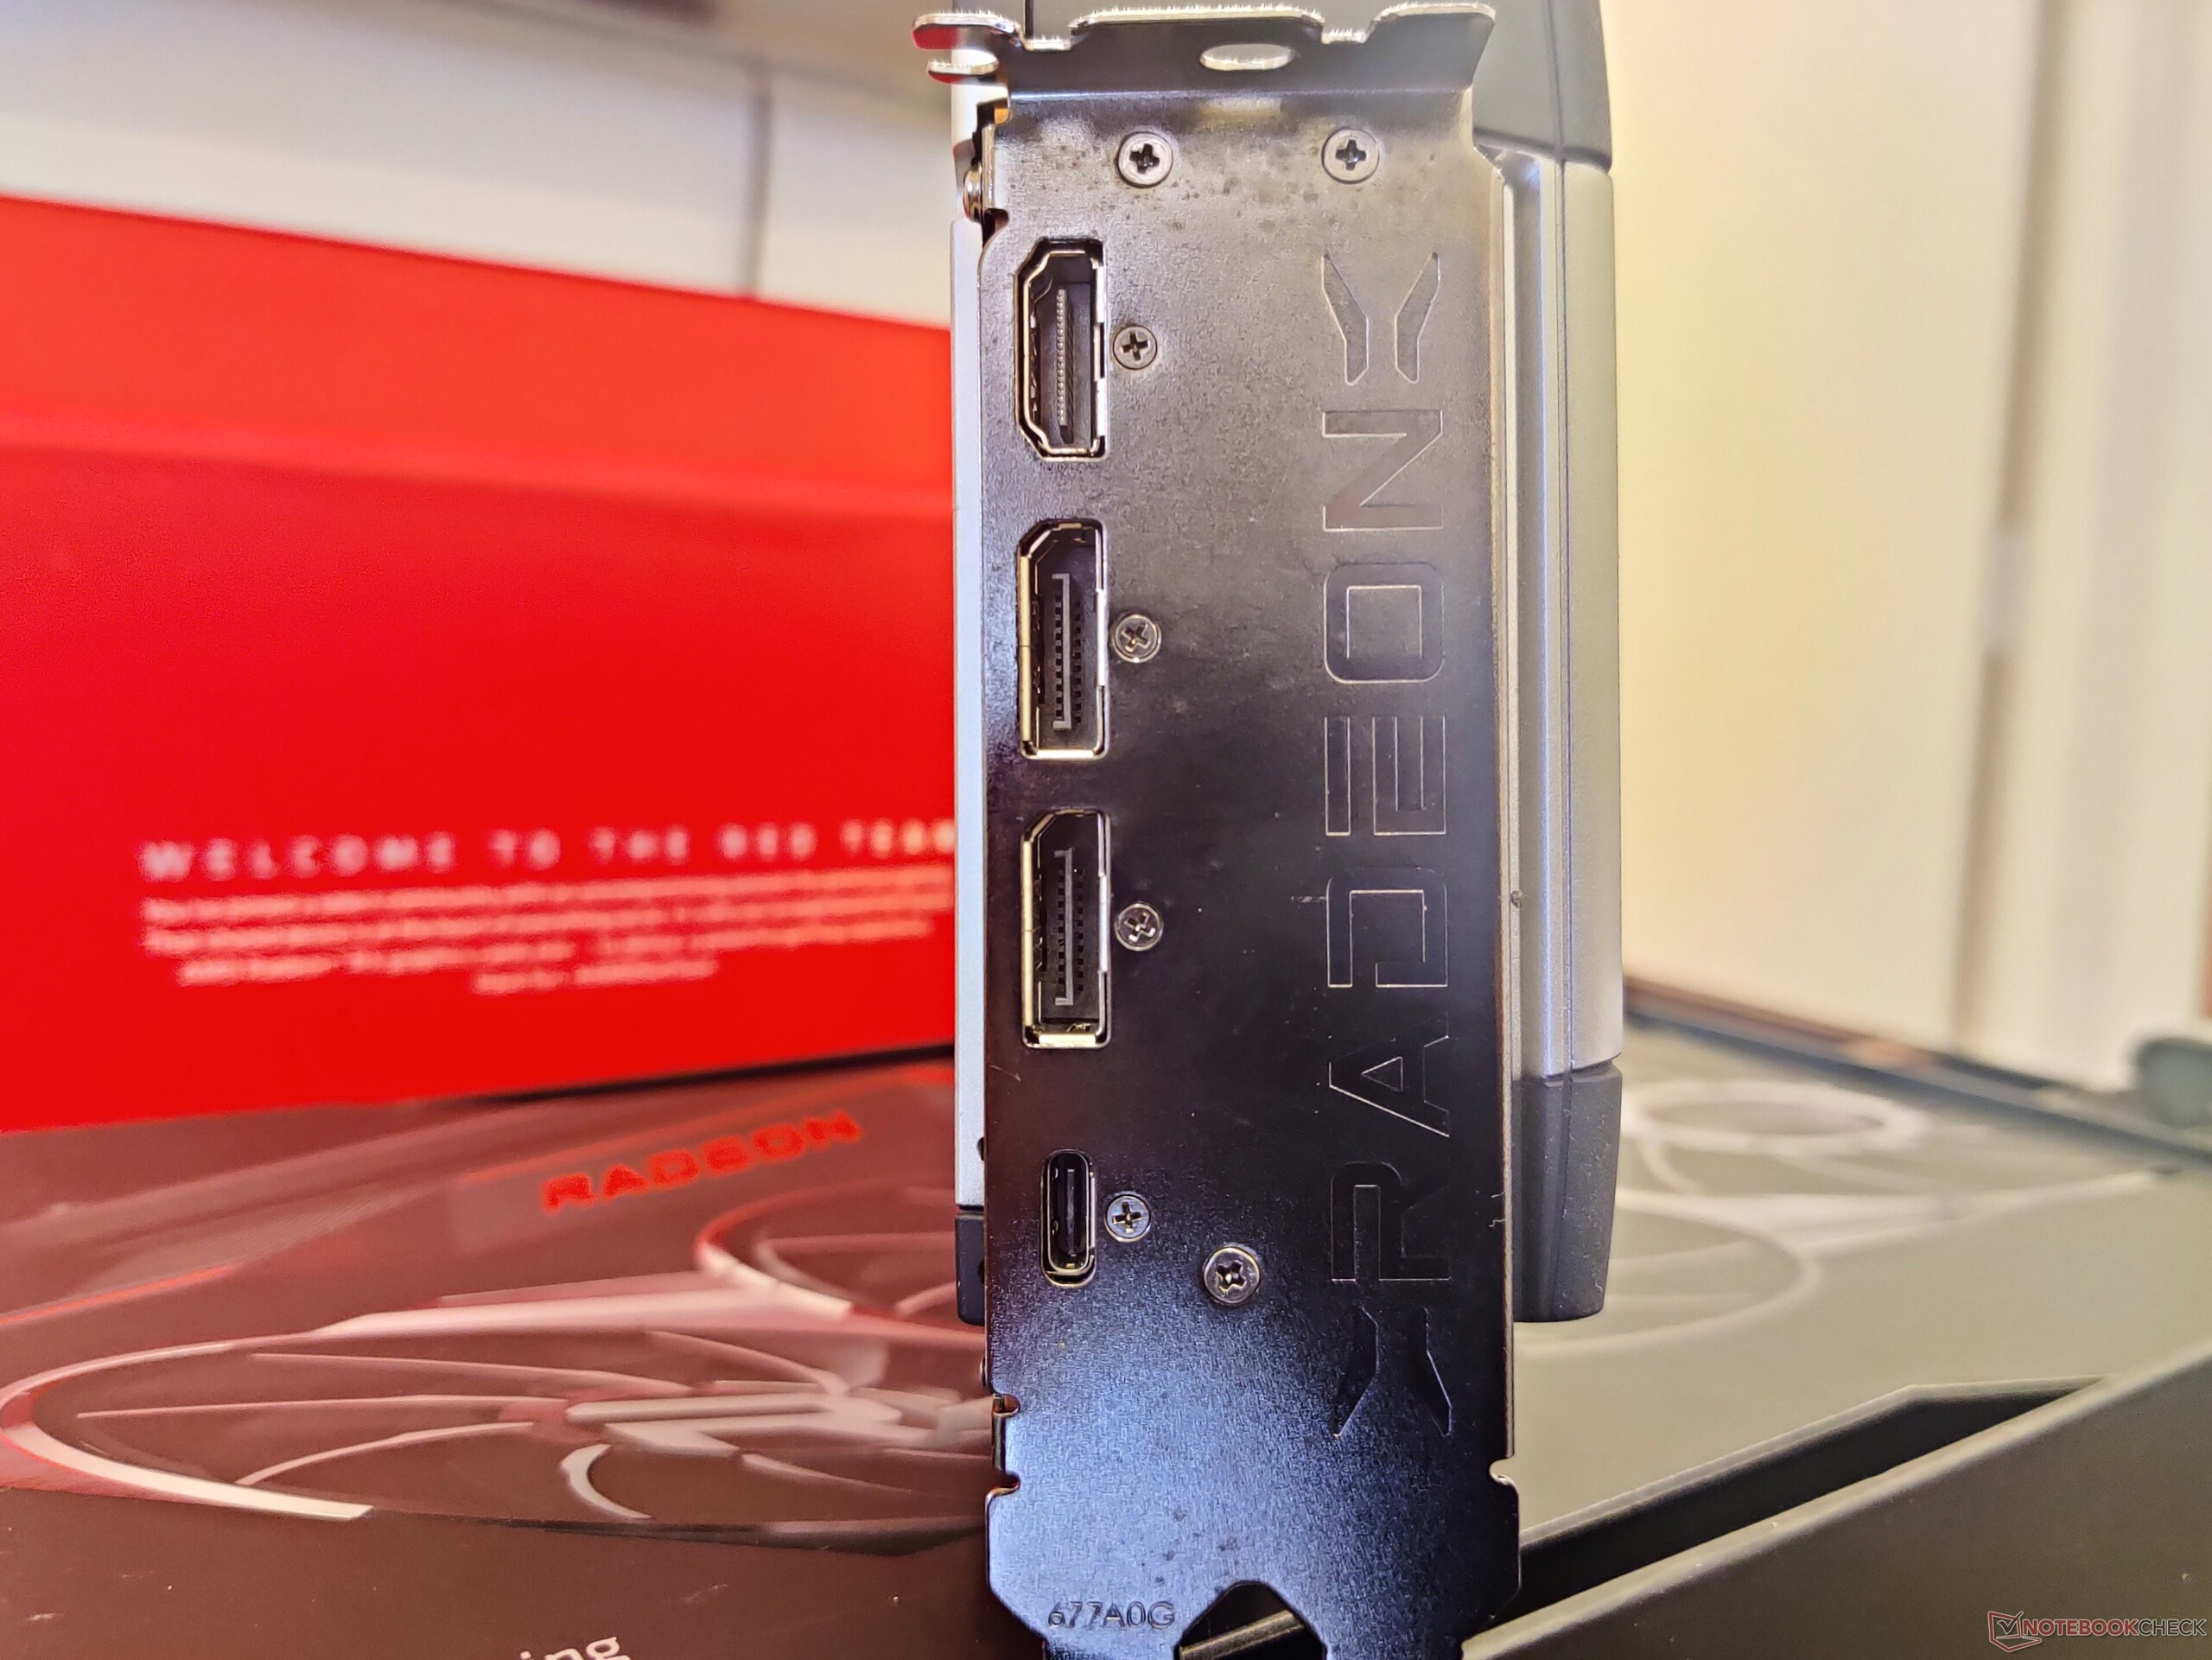
Auf der Rückseite befinden sich zwei DisplayPort-1.4-Ausgänge, einmal HDMI 2.1 und ein USB-C-Port mit DisplayPort. Wir begrüßen, dass AMD einen USB-C-Port zu einer Zeit anbietet, in der NVIDIA darauf verzichtet, um etwas Energie auf den Ampere-Karten zu sparen.

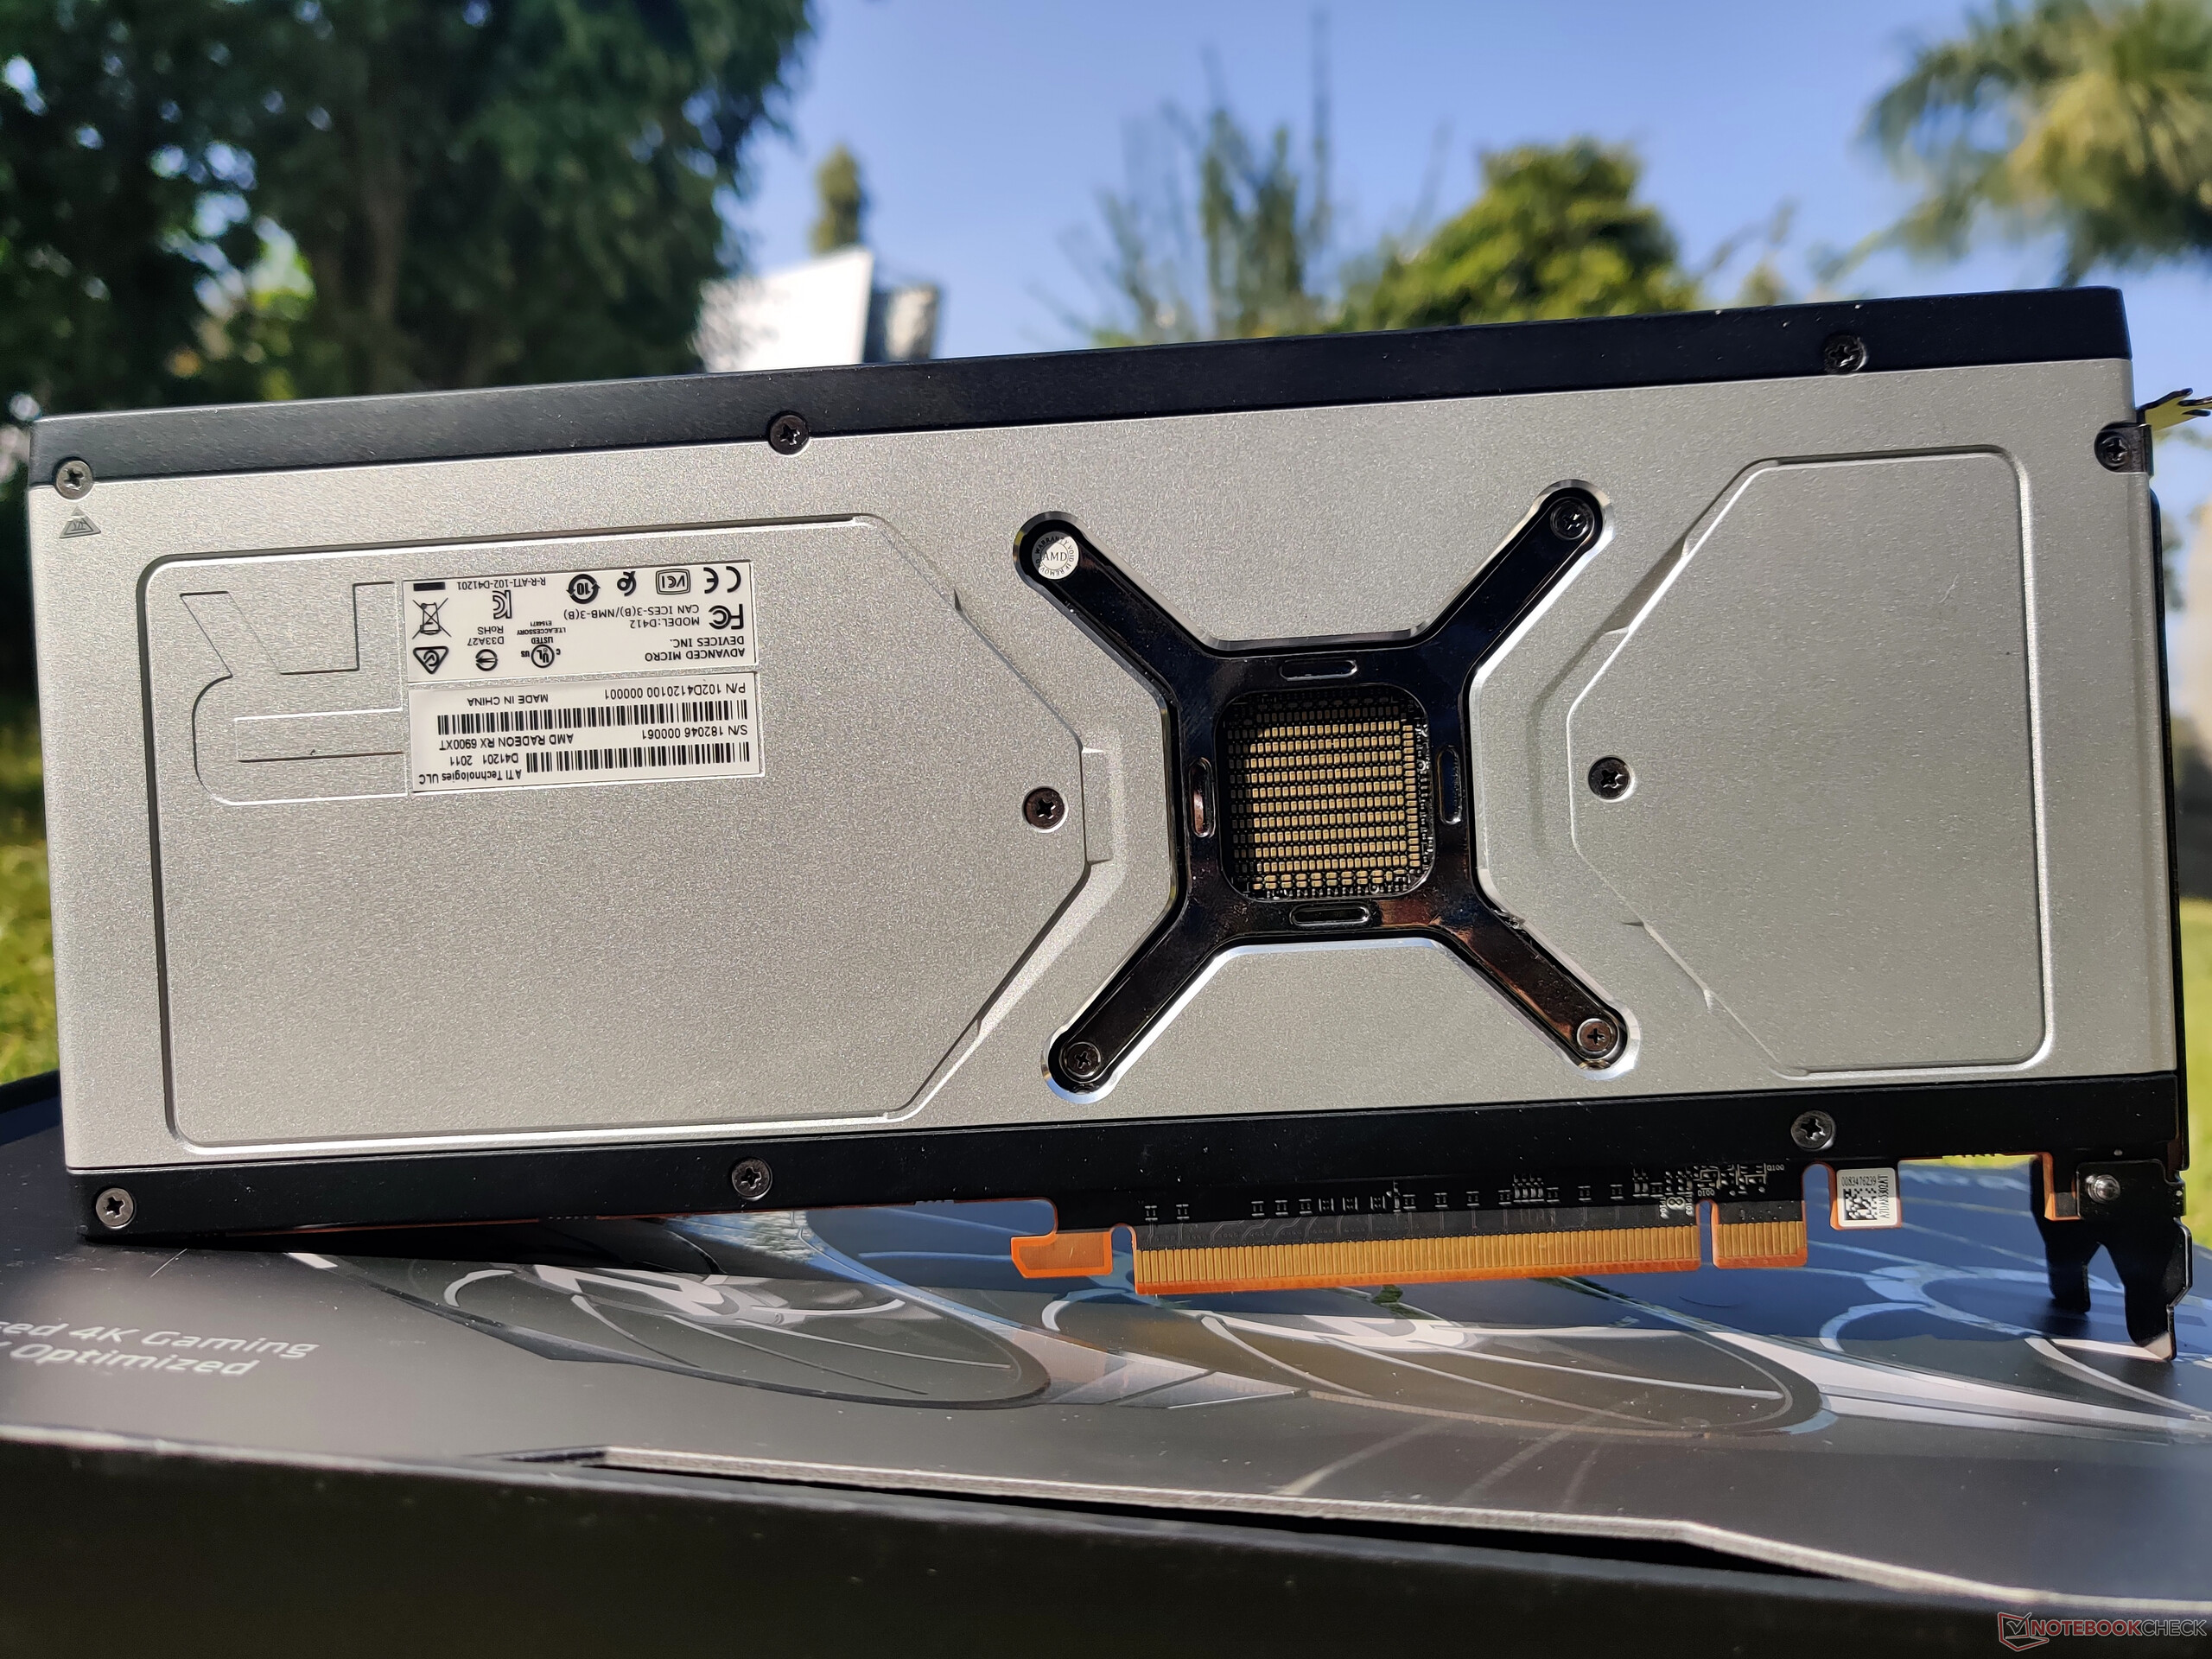
Wirklich neu ist es nicht, aber es sei dennoch erwähnt: AMD hat sich vom CrossFire-Support verabschiedet, dementsprechend gibt es keinen CrossFire-Bridge-Port mehr. NVIDIA bietet hingegen noch immer einen NVLink-Konnektor auf der RTX 3090 an. 

Insgesamt verfügt die RX 6900 XT über ein ordentliches 2,7-Slot-Referenz-Design, welches nahezu universell anwendbar sein sollte.

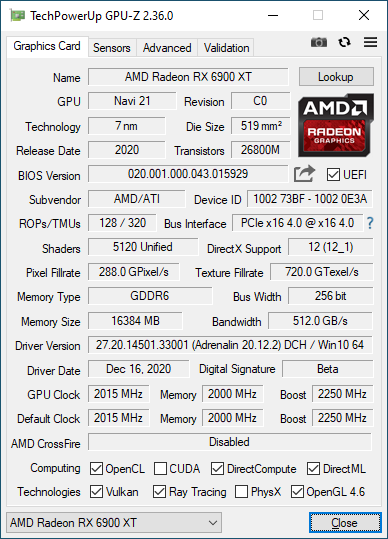
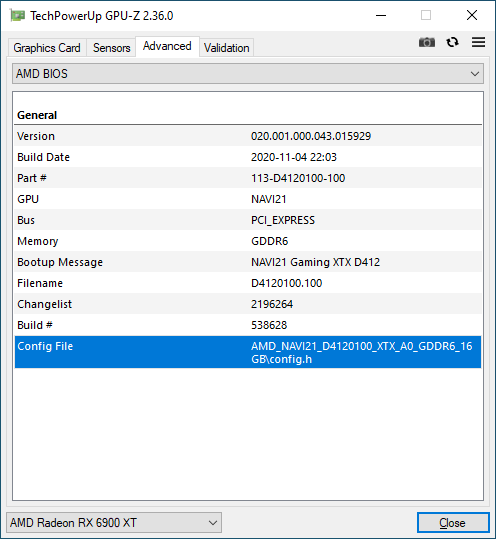
Die Radeon RX 6900 XT basiert auf der RDNA-2-Navi-21-XTX-GPU, welche in 7 nm gefertigt wird und 80 Compute Units (CUs) und damit 5.120 Shading Units beherbergt. Die Basistaktrate beträgt 1.825 MHz. In den meisten Anwendungen läuft die GPU mit 2.015 MHz, was AMD auch als die "Gaming-Taktrate" anpreist, und boostet auf bis zu 2.250 MHz hoch. Abhängig vom Workload und dem thermischen Spielraum sind sogar noch höhere Boostraten möglich.

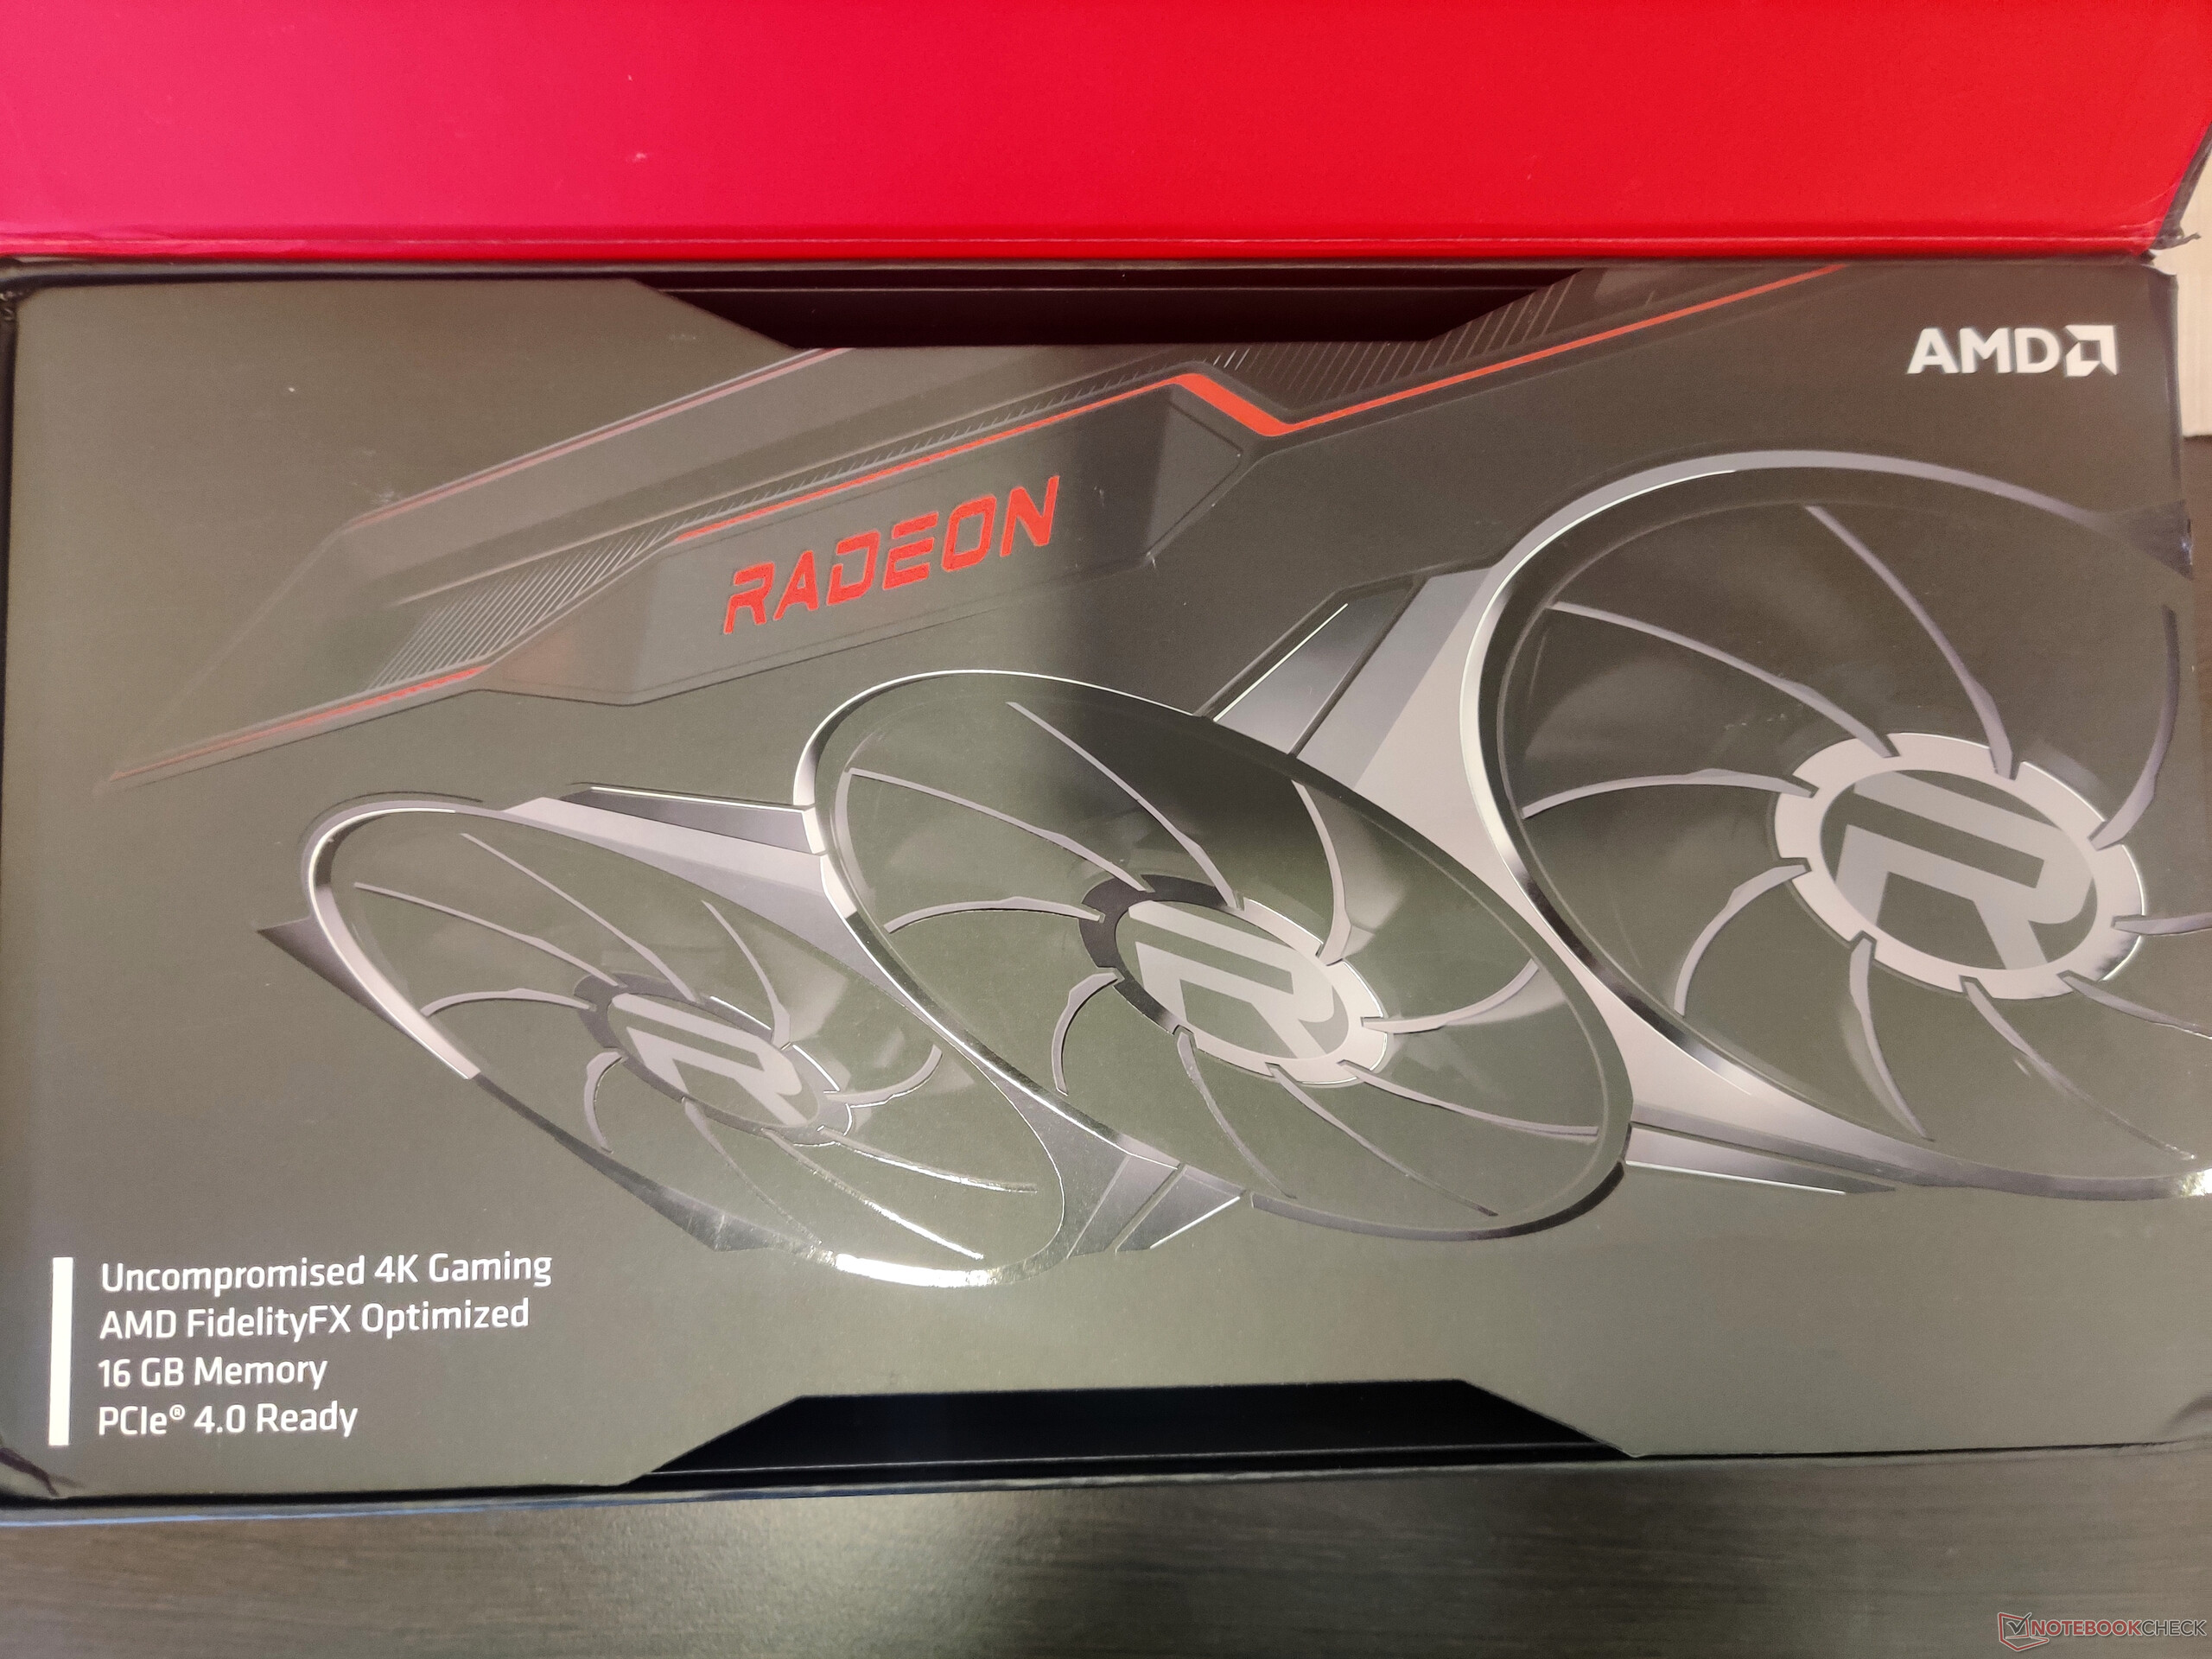
Wie die RX 6800 XT ist auch die RX 6900 XT mit 16 GB GDDR6 VRAM auf einem 256-Bit-Interface ausgestattet und kommt so auf eine Speicherbandbreite von bis zu 512 GB/s. AMD hat die Radeon RX 6900 XT mit einem 128 MB großen "Infinity Cache" ausgerüstet, welcher das langsamere, aber einfacher verfügbare GDDR6-VRAM sowie das kleinere 256-Bit-Speicherinterface unterstützt und wett machen soll. Dadurch erreicht AMD eine Leistung, die auf einem ähnlichen Niveau liegt wie bei NVIDIA mit deren höherem Speicherinterface, teureren GDDR6X-VRAM und höherer Speicherbandbreite.

Die Radeon RX 6900 XT ist für eine Gesamtplatinenleistung von 300 W ausgelegt. Während des Stresstests konnten wir beobachten, dass alleine der Kern bis zu 255 W ziehen kann.

Unser Testsystem

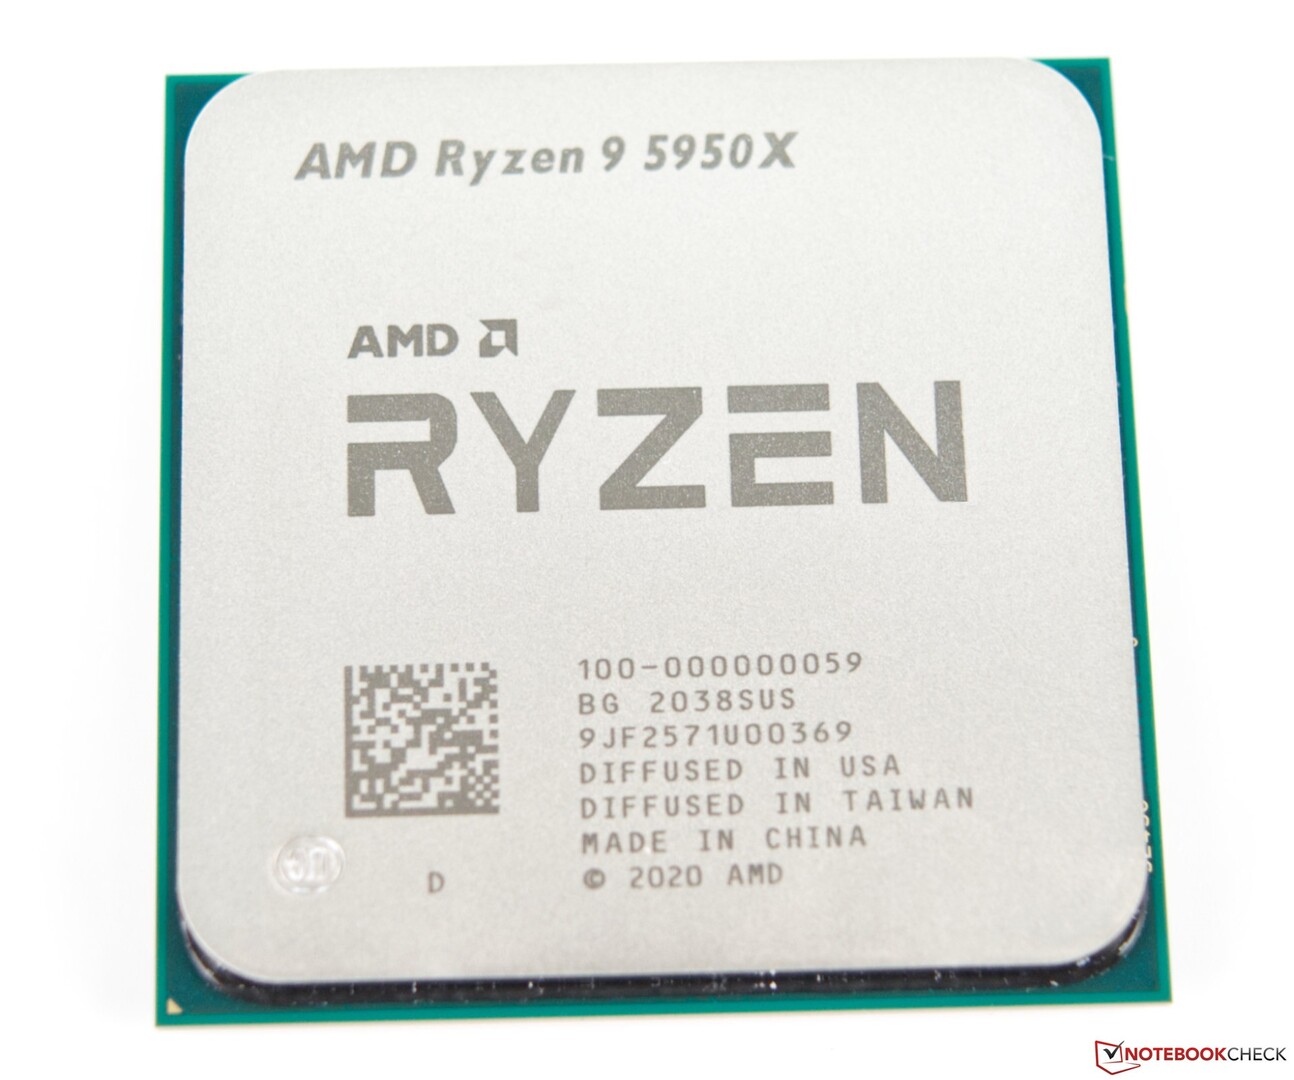
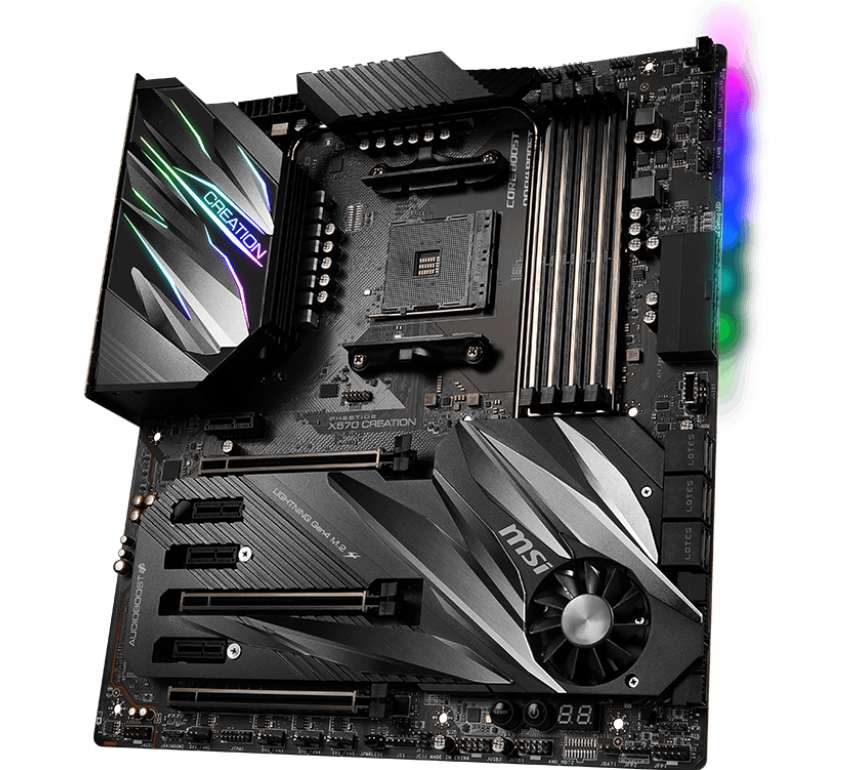
Wir nutzen die AMD-X570-Plattform als Testsystem für die Beurteilung der RX 6900 XT. Unser Setup beinhaltet einen AMD Ryzen 9 5950X, kombiniert mit 32 GB (16 GB x2) RAM in Form der G.SKILL Trident Z Neo DDR4-3200 (Timings: 16-19-19-39) auf einem MSI-Prestige-X570-Creation-Mainboard.

Auf einer Gigabyte Aorus NVMe-SSD Gen4 mit 1 TB lief Windows 10 20H2 mit den neuesten kumulativen Patches. Benchmarks und Spiele wurden auf zwei jeweils 1 TB großen Crucial-MX500-SATA-SSDs installiert.

Für die Kühlung des 16C/32T-Ryzen-9-5950X war ein Corsair iCUE H115i Capellix AIO zuständig. Das System war in dem Gehäuse Corsair iCUE 4000X RGB mit einem Thermaltake-Toughpower-850-W-80-Plus-Gold-Netzteil untergebracht.

An der RX 6900 XT hing der SmartTV OnePlus U Series 55U1 bei 4K und 60 Hz. Der Farbausgang war in der Radeon-Software auf Full-RGB 4:4:4 eingestellt und Windows-Desktop-Scaling war auf 100% festgelegt.

An dieser Stelle möchten wir AMD für die Bereitstellung der RX 6900 XT und des Ryzen 9 5950X, Corsair für den Kühler iCUE Elite Capellix AIO und das Gehäuse iCUE 4000X sowie OnePlus für den U-Series-55U1-4K-TV unseren Dank aussprechen.

AMD Ryzen 9 5950X
AMD Ryzen 9 5950X
Mainboard MSI Prestige X570 Creation. (Bildquelle: MSI)
Gigabyte Aorus NVMe Gen4 SSD. (Bildquelle: Gigabyte)
G.SKILL Trident Z Neo DDR4-3600 RAM. (Bildquelle: G.SKILL)

Synthetische Benchmarks

In der Mehrheit der 3DMark-Tests schneidet die RX 6900 XT gleich gut oder gar besser ab als eine NVIDIA RTX 3090. Den größten Vorsprung sehen wir im 3DMark Fire Strike bis zu 1440p. Im 4K Fire Strike Ultra sinkt der Vorsprung gegenüber einer durchschnittlichen RTX 3090 auf etwa 11%. Time Spy hingegen bescheinigt beiden Flaggschiff-Karten eine nahezu gleiche Leistung.

Die Fähigkeiten der RDNA2-Architektur im Bereich Ray Tracing sind zwar nicht per se schlecht, aber das Defizit wird vor allem im Port-Royal-Test deutlich, wo unsere RX 6900 XT bereits 15 Prozent hinter einer RTX 3080 liegt, bis zur RTX 3090 trennen sie 24 Prozent. Insgesamt ist die Ray-Tracing-Performance der RX 6900 XT etwa 9 Prozent besser als die einer durchschnittlichen RTX 2080 Ti in unseren Benchmarks.

Unigine-Benchmark zeigt bessere Ergebnisse in den DirectX-Tests verglichen mit OpenGL, insbesondere in den Valley- und Heaven-Benchmarks. In Superposition wird die RX 6900 XT klar geschlagen und hechelt der RTX 3090 im 8K-optimierten Test 20 Prozent hinterher. Die Lücke schließt sich Zusehens bei niedrigeren Auflösungen, im 4K-optimierten Benchmark beträgt der Rückstand nur noch 8 Prozent.

3DMark
2560x1440 Time Spy Graphics
Durchschnittliche NVIDIA GeForce RTX 3090
  (18685 - 20433, n=16)
19254 Points +6%
Nvidia GeForce RTX 3090 Founders Edition
NVIDIA GeForce RTX 3090, R9 5900X
18685 Points +3%
AMD Radeon RX 6900 XT
AMD Radeon RX 6900 XT, R9 5950X
18210 Points
AMD Radeon RX 6800 XT
AMD Radeon RX 6800 XT, R9 5950X
17603 Points -3%
Durchschnittliche NVIDIA GeForce RTX 3080
  (17467 - 17604, n=2)
17536 Points -4%
ASUS GeForce RTX 3080 ROG STRIX OC GAMING
NVIDIA GeForce RTX 3080, R9 5900X
17467 Points -4%
AMD Ryzen 9 5900X
NVIDIA Titan RTX, R9 5900X
15283 Points -16%
Durchschnittliche NVIDIA Titan RTX
  (14216 - 15283, n=29)
14884 Points -18%
Durchschnittliche NVIDIA GeForce RTX 2080 Ti (Desktop)
  (13744 - 14645, n=4)
14283 Points -22%
KFA2 GeForce RTX 2080 Ti EX
NVIDIA GeForce RTX 2080 Ti (Desktop), R9 3900X
13744 Points -25%
MSI GeForce RTX 3070 Gaming X Trio
NVIDIA GeForce RTX 3070, R9 5900X
13579 Points -25%
Durchschnittliche NVIDIA GeForce RTX 3070
  (11043 - 13579, n=7)
12616 Points -31%
Nvidia GeForce RTX 2080 Super
NVIDIA GeForce RTX 2080 Super (Desktop), R7 2700X
11477 Points -37%
Durchschnittliche NVIDIA GeForce RTX 2080 Super (Desktop)
  (11313 - 11542, n=4)
11439 Points -37%
Nvidia GeForce RTX 2070 Super
NVIDIA GeForce RTX 2070 Super (Desktop), R7 2700X
10094 Points -45%
Durchschnittliche NVIDIA GeForce RTX 2070 Super (Desktop)
  (9564 - 10094, n=8)
9846 Points -46%
AMD Radeon RX 5700 XT
AMD Radeon RX 5700 XT (Desktop), R7 2700X
8673 Points -52%
Durchschnittliche AMD Radeon RX 5700 XT (Desktop)
  (6050 - 9371, n=7)
8574 Points -53%
AMD Radeon RX 5700
AMD Radeon RX 5700 (Desktop), R7 2700X
7675 Points -58%
1920x1080 Fire Strike Graphics
AMD Radeon RX 6900 XT
AMD Radeon RX 6900 XT, R9 5950X
50587 Points
AMD Radeon RX 6800 XT
AMD Radeon RX 6800 XT, R9 5950X
49735 Points -2%
Durchschnittliche NVIDIA GeForce RTX 3090
  (41298 - 49282, n=16)
46854 Points -7%
Nvidia GeForce RTX 3090 Founders Edition
NVIDIA GeForce RTX 3090, R9 5900X
41298 Points -18%
ASUS GeForce RTX 3080 ROG STRIX OC GAMING
NVIDIA GeForce RTX 3080, R9 5900X
40910 Points -19%
Durchschnittliche NVIDIA GeForce RTX 3080
  (37604 - 40910, n=2)
39257 Points -22%
Durchschnittliche NVIDIA Titan RTX
  (33377 - 40910, n=30)
36062 Points -29%
AMD Ryzen 9 5900X
NVIDIA Titan RTX, R9 5900X
34722 Points -31%
Durchschnittliche NVIDIA GeForce RTX 2080 Ti (Desktop)
  (32081 - 35851, n=4)
34141 Points -33%
KFA2 GeForce RTX 2080 Ti EX
NVIDIA GeForce RTX 2080 Ti (Desktop), R9 3900X
32081 Points -37%
MSI GeForce RTX 3070 Gaming X Trio
NVIDIA GeForce RTX 3070, R9 5900X
31096 Points -39%
Durchschnittliche NVIDIA GeForce RTX 3070
  (20357 - 33270, n=7)
28949 Points -43%
Durchschnittliche NVIDIA GeForce RTX 2080 Super (Desktop)
  (26824 - 28968, n=4)
27647 Points -45%
Nvidia GeForce RTX 2080 Super
NVIDIA GeForce RTX 2080 Super (Desktop), R7 2700X
27075 Points -46%
AMD Radeon RX 5700 XT
AMD Radeon RX 5700 XT (Desktop), R7 2700X
25383 Points -50%
Durchschnittliche AMD Radeon RX 5700 XT (Desktop)
  (19850 - 27164, n=7)
25322 Points -50%
Durchschnittliche NVIDIA GeForce RTX 2070 Super (Desktop)
  (22819 - 25799, n=8)
24645 Points -51%
Nvidia GeForce RTX 2070 Super
NVIDIA GeForce RTX 2070 Super (Desktop), R7 2700X
24151 Points -52%
AMD Radeon RX 5700
AMD Radeon RX 5700 (Desktop), R7 2700X
22457 Points -56%
3840x2160 Fire Strike Ultra Graphics
AMD Radeon RX 6900 XT
AMD Radeon RX 6900 XT, R9 5950X
13370 Points
AMD Radeon RX 6800 XT
AMD Radeon RX 6800 XT, R9 5950X
12626 Points -6%
Durchschnittliche NVIDIA GeForce RTX 3090
  (11613 - 12587, n=13)
12305 Points -8%
Nvidia GeForce RTX 3090 Founders Edition
NVIDIA GeForce RTX 3090, R9 5900X
11613 Points -13%
ASUS GeForce RTX 3080 ROG STRIX OC GAMING
NVIDIA GeForce RTX 3080, R9 5900X
10793 Points -19%
Durchschnittliche NVIDIA GeForce RTX 3080
  (10645 - 10793, n=2)
10719 Points -20%
Durchschnittliche NVIDIA Titan RTX
  (8461 - 10793, n=29)
8868 Points -34%
AMD Ryzen 9 5900X
NVIDIA Titan RTX, R9 5900X
8649 Points -35%
MSI GeForce RTX 3070 Gaming X Trio
NVIDIA GeForce RTX 3070, R9 5900X
8483 Points -37%
Durchschnittliche NVIDIA GeForce RTX 3070
  (8043 - 8483, n=5)
8250 Points -38%
Durchschnittliche NVIDIA GeForce RTX 2080 Ti (Desktop)
  (7925 - 8504, n=4)
8226 Points -38%
KFA2 GeForce RTX 2080 Ti EX
NVIDIA GeForce RTX 2080 Ti (Desktop), R9 3900X
7925 Points -41%
Durchschnittliche NVIDIA GeForce RTX 2080 Super (Desktop)
  (6500 - 6700, n=3)
6585 Points -51%
Nvidia GeForce RTX 2080 Super
NVIDIA GeForce RTX 2080 Super (Desktop), R7 2700X
6500 Points -51%
Durchschnittliche AMD Radeon RX 5700 XT (Desktop)
  (4989 - 6500, n=7)
6119 Points -54%
AMD Radeon RX 5700 XT
AMD Radeon RX 5700 XT (Desktop), R7 2700X
5955 Points -55%
Nvidia GeForce RTX 2070 Super
NVIDIA GeForce RTX 2070 Super (Desktop), R7 2700X
5786 Points -57%
Durchschnittliche NVIDIA GeForce RTX 2070 Super (Desktop)
  (2290 - 5882, n=7)
5313 Points -60%
AMD Radeon RX 5700
AMD Radeon RX 5700 (Desktop), R7 2700X
5292 Points -60%
Fire Strike Extreme Graphics
AMD Radeon RX 6900 XT
AMD Radeon RX 6900 XT, R9 5950X
26650 Points
AMD Radeon RX 6800 XT
AMD Radeon RX 6800 XT, R9 5950X
25015 Points -6%
Durchschnittliche NVIDIA GeForce RTX 3090
  (22075 - 24730, n=13)
23822 Points -11%
Nvidia GeForce RTX 3090 Founders Edition
NVIDIA GeForce RTX 3090, R9 5900X
22075 Points -17%
ASUS GeForce RTX 3080 ROG STRIX OC GAMING
NVIDIA GeForce RTX 3080, R9 5900X
20861 Points -22%
Durchschnittliche NVIDIA GeForce RTX 3080
  (20007 - 20861, n=2)
20434 Points -23%
Durchschnittliche NVIDIA Titan RTX
  (16484 - 20861, n=29)
17649 Points -34%
AMD Ryzen 9 5900X
NVIDIA Titan RTX, R9 5900X
17176 Points -36%
Durchschnittliche NVIDIA GeForce RTX 2080 Ti (Desktop)
  (15603 - 16856, n=3)
16416 Points -38%
MSI GeForce RTX 3070 Gaming X Trio
NVIDIA GeForce RTX 3070, R9 5900X
16196 Points -39%
Durchschnittliche NVIDIA GeForce RTX 3070
  (15503 - 16276, n=5)
15859 Points -40%
KFA2 GeForce RTX 2080 Ti EX
NVIDIA GeForce RTX 2080 Ti (Desktop), R9 3900X
15603 Points -41%
Durchschnittliche NVIDIA GeForce RTX 2080 Super (Desktop)
  (12968 - 13551, n=3)
13172 Points -51%
Nvidia GeForce RTX 2080 Super
NVIDIA GeForce RTX 2080 Super (Desktop), R7 2700X
12968 Points -51%
Durchschnittliche AMD Radeon RX 5700 XT (Desktop)
  (12178 - 12921, n=6)
12611 Points -53%
AMD Radeon RX 5700 XT
AMD Radeon RX 5700 XT (Desktop), R7 2700X
12209 Points -54%
Durchschnittliche NVIDIA GeForce RTX 2070 Super (Desktop)
  (11382 - 12044, n=7)
11850 Points -56%
Nvidia GeForce RTX 2070 Super
NVIDIA GeForce RTX 2070 Super (Desktop), R7 2700X
11634 Points -56%
AMD Radeon RX 5700
AMD Radeon RX 5700 (Desktop), R7 2700X
10876 Points -59%
2560x1440 Port Royal Graphics
Durchschnittliche NVIDIA GeForce RTX 3090
  (12255 - 13075, n=5)
12728 Points +33%
Nvidia GeForce RTX 3090 Founders Edition
NVIDIA GeForce RTX 3090, R9 5900X
12384 Points +29%
Durchschnittliche NVIDIA GeForce RTX 3080
  (11238 - 11433, n=2)
11336 Points +18%
ASUS GeForce RTX 3080 ROG STRIX OC GAMING
NVIDIA GeForce RTX 3080, R9 5900X
11238 Points +17%
AMD Radeon RX 6900 XT
AMD Radeon RX 6900 XT, R9 5950X
9585 Points
AMD Ryzen 9 5900X
NVIDIA Titan RTX, R9 5900X
9335 Points -3%
AMD Ryzen 9 5900X
NVIDIA Titan RTX, R9 5900X
9239 Points -4%
Durchschnittliche NVIDIA Titan RTX
  (8945 - 9528, n=24)
9303 Points -3%
Durchschnittliche NVIDIA GeForce RTX 2080 Ti (Desktop)
  (8537 - 9021, n=2)
8779 Points -8%
KFA2 GeForce RTX 2080 Ti EX
NVIDIA GeForce RTX 2080 Ti (Desktop), R9 3900X
8537 Points -11%
MSI GeForce RTX 3070 Gaming X Trio
NVIDIA GeForce RTX 3070, R9 5900X
8191 Points -15%
Durchschnittliche NVIDIA GeForce RTX 3070
  (7796 - 8191, n=5)
7941 Points -17%
Durchschnittliche NVIDIA GeForce RTX 2080 Super (Desktop)
  (6745 - 6947, n=3)
6873 Points -28%
Nvidia GeForce RTX 2080 Super
NVIDIA GeForce RTX 2080 Super (Desktop), R7 2700X
6745 Points -30%
Nvidia GeForce RTX 2070 Super
NVIDIA GeForce RTX 2070 Super (Desktop), R7 2700X
5840 Points -39%
Durchschnittliche NVIDIA GeForce RTX 2070 Super (Desktop)
  (5725 - 5988, n=5)
5838 Points -39%
Unigine Heaven 4.0
Extreme Preset DX11
Durchschnittliche NVIDIA GeForce RTX 3090
  (272 - 315, n=10)
299 fps +15%
Nvidia GeForce RTX 3090 Founders Edition
NVIDIA GeForce RTX 3090, R9 5900X
274 fps +6%
AMD Radeon RX 6900 XT
AMD Radeon RX 6900 XT, R9 5950X
259.5 (49.3min - 537.2max) fps
AMD Radeon RX 6800 XT
AMD Radeon RX 6800 XT, R9 5950X
247.9 fps -4%
Durchschnittliche NVIDIA GeForce RTX 3080
  (233 - 253, n=2)
243 fps -6%
AMD Ryzen 9 5900X
NVIDIA Titan RTX, R9 5900X
237.1 fps -9%
Durchschnittliche NVIDIA Titan RTX
  (207 - 248, n=12)
236 fps -9%
ASUS GeForce RTX 3080 ROG STRIX OC GAMING
NVIDIA GeForce RTX 3080, R9 5900X
232.6 fps -10%
Durchschnittliche NVIDIA GeForce RTX 2080 Ti (Desktop)
  (215 - 226, n=3)
222 fps -14%
KFA2 GeForce RTX 2080 Ti EX
NVIDIA GeForce RTX 2080 Ti (Desktop), R9 3900X
215.2 fps -17%
Durchschnittliche NVIDIA GeForce RTX 3070
  (196.4 - 214, n=5)
206 fps -21%
MSI GeForce RTX 3070 Gaming X Trio
NVIDIA GeForce RTX 3070, R9 5900X
202.5 fps -22%
Nvidia GeForce RTX 2080 Super
NVIDIA GeForce RTX 2080 Super (Desktop), R7 2700X
175.2 fps -32%
Durchschnittliche NVIDIA GeForce RTX 2080 Super (Desktop)
 
175.2 fps -32%
Durchschnittliche NVIDIA GeForce RTX 2070 Super (Desktop)
  (160.1 - 172.3, n=4)
167.1 fps -36%
Nvidia GeForce RTX 2070 Super
NVIDIA GeForce RTX 2070 Super (Desktop), R7 2700X
160.1 fps -38%
Durchschnittliche AMD Radeon RX 5700 XT (Desktop)
  (132.5 - 144.7, n=5)
136.8 fps -47%
AMD Radeon RX 5700 XT
AMD Radeon RX 5700 XT (Desktop), R7 2700X
132.5 fps -49%
AMD Radeon RX 5700
AMD Radeon RX 5700 (Desktop), R7 2700X
119.9 fps -54%
Extreme Preset OpenGL
Durchschnittliche NVIDIA GeForce RTX 3090
  (188.2 - 284, n=9)
268 fps +30%
Durchschnittliche NVIDIA GeForce RTX 3080
  (232 - 243, n=2)
238 fps +15%
ASUS GeForce RTX 3080 ROG STRIX OC GAMING
NVIDIA GeForce RTX 3080, R9 5900X
232.4 fps +13%
Durchschnittliche NVIDIA Titan RTX
  (203 - 299, n=12)
223 fps +8%
AMD Ryzen 9 5900X
NVIDIA Titan RTX, R9 5900X
215.1 fps +4%
AMD Radeon RX 6900 XT
AMD Radeon RX 6900 XT, R9 5950X
206.5 (8.2min - 453.7max) fps
Durchschnittliche NVIDIA GeForce RTX 2080 Ti (Desktop)
  (202 - 213, n=3)
206 fps 0%
KFA2 GeForce RTX 2080 Ti EX
NVIDIA GeForce RTX 2080 Ti (Desktop), R9 3900X
204.4 fps -1%
AMD Radeon RX 6800 XT
AMD Radeon RX 6800 XT, R9 5950X
204 fps -1%
MSI GeForce RTX 3070 Gaming X Trio
NVIDIA GeForce RTX 3070, R9 5900X
196.1 fps -5%
Durchschnittliche NVIDIA GeForce RTX 3070
  (187.5 - 196.1, n=4)
192.5 fps -7%
Nvidia GeForce RTX 3090 Founders Edition
NVIDIA GeForce RTX 3090, R9 5900X
188.2 fps -9%
Nvidia GeForce RTX 2080 Super
NVIDIA GeForce RTX 2080 Super (Desktop), R7 2700X
167.5 fps -19%
Durchschnittliche NVIDIA GeForce RTX 2080 Super (Desktop)
 
167.5 fps -19%
Durchschnittliche NVIDIA GeForce RTX 2070 Super (Desktop)
  (153.5 - 157.1, n=4)
155.4 fps -25%
Nvidia GeForce RTX 2070 Super
NVIDIA GeForce RTX 2070 Super (Desktop), R7 2700X
153.5 fps -26%
Durchschnittliche AMD Radeon RX 5700 XT (Desktop)
  (97.8 - 161.9, n=6)
124.7 fps -40%
AMD Radeon RX 5700 XT
AMD Radeon RX 5700 XT (Desktop), R7 2700X
110.2 fps -47%
AMD Radeon RX 5700
AMD Radeon RX 5700 (Desktop), R7 2700X
100.7 fps -51%
Unigine Valley 1.0
1920x1080 Extreme HD DirectX AA:x8
Durchschnittliche NVIDIA GeForce RTX 3090
  (184.2 - 245, n=10)
223 fps +11%
AMD Radeon RX 6900 XT
AMD Radeon RX 6900 XT, R9 5950X
200.8 (53.4min - 359.1max) fps
Nvidia GeForce RTX 3090 Founders Edition
NVIDIA GeForce RTX 3090, R9 5900X
192.4 fps -4%
AMD Radeon RX 6800 XT
AMD Radeon RX 6800 XT, R9 5950X
190.6 fps -5%
AMD Ryzen 9 5900X
NVIDIA Titan RTX, R9 5900X
180.1 fps -10%
Durchschnittliche NVIDIA GeForce RTX 3080
  (176.2 - 181.8, n=2)
179 fps -11%
ASUS GeForce RTX 3080 ROG STRIX OC GAMING
NVIDIA GeForce RTX 3080, R9 5900X
176.2 fps -12%
Durchschnittliche NVIDIA Titan RTX
  (135 - 191.4, n=12)
173.3 fps -14%
Durchschnittliche NVIDIA GeForce RTX 2080 Ti (Desktop)
  (159.4 - 164.1, n=3)
162.2 fps -19%
Durchschnittliche NVIDIA GeForce RTX 3070
  (155.1 - 168.5, n=5)
161.2 fps -20%
KFA2 GeForce RTX 2080 Ti EX
NVIDIA GeForce RTX 2080 Ti (Desktop), R9 3900X
159.4 fps -21%
MSI GeForce RTX 3070 Gaming X Trio
NVIDIA GeForce RTX 3070, R9 5900X
155.1 fps -23%
Durchschnittliche NVIDIA GeForce RTX 2070 Super (Desktop)
  (113.7 - 127.4, n=4)
122.5 fps -39%
Nvidia GeForce RTX 2080 Super
NVIDIA GeForce RTX 2080 Super (Desktop), R7 2700X
120.2 fps -40%
Durchschnittliche NVIDIA GeForce RTX 2080 Super (Desktop)
 
120.2 fps -40%
Nvidia GeForce RTX 2070 Super
NVIDIA GeForce RTX 2070 Super (Desktop), R7 2700X
113.7 fps -43%
Durchschnittliche AMD Radeon RX 5700 XT (Desktop)
  (106.3 - 116, n=4)
111.5 fps -44%
AMD Radeon RX 5700 XT
AMD Radeon RX 5700 XT (Desktop), R7 2700X
106.3 fps -47%
AMD Radeon RX 5700
AMD Radeon RX 5700 (Desktop), R7 2700X
99.3 fps -51%
1920x1080 Extreme HD Preset OpenGL AA:x8
Durchschnittliche NVIDIA GeForce RTX 3090
  (158.8 - 211, n=9)
201 fps +20%
Durchschnittliche NVIDIA GeForce RTX 3080
  (163.8 - 172, n=2)
167.9 fps 0%
AMD Radeon RX 6900 XT
AMD Radeon RX 6900 XT, R9 5950X
167.4 (56.7min - 375.7max) fps
ASUS GeForce RTX 3080 ROG STRIX OC GAMING
NVIDIA GeForce RTX 3080, R9 5900X
163.8 fps -2%
Nvidia GeForce RTX 3090 Founders Edition
NVIDIA GeForce RTX 3090, R9 5900X
158.8 fps -5%
AMD Ryzen 9 5900X
NVIDIA Titan RTX, R9 5900X
158.5 fps -5%
AMD Radeon RX 6800 XT
AMD Radeon RX 6800 XT, R9 5950X
158.2 fps -5%
Durchschnittliche NVIDIA Titan RTX
  (139.2 - 181.2, n=12)
158.1 fps -6%
Durchschnittliche NVIDIA GeForce RTX 2080 Ti (Desktop)
  (144.5 - 147.8, n=3)
145.8 fps -13%
KFA2 GeForce RTX 2080 Ti EX
NVIDIA GeForce RTX 2080 Ti (Desktop), R9 3900X
145.1 fps -13%
MSI GeForce RTX 3070 Gaming X Trio
NVIDIA GeForce RTX 3070, R9 5900X
142.9 fps -15%
Durchschnittliche NVIDIA GeForce RTX 3070
  (140.2 - 144.9, n=4)
142.7 fps -15%
Nvidia GeForce RTX 2080 Super
NVIDIA GeForce RTX 2080 Super (Desktop), R7 2700X
114.5 fps -32%
Durchschnittliche NVIDIA GeForce RTX 2080 Super (Desktop)
 
114.5 fps -32%
Durchschnittliche NVIDIA GeForce RTX 2070 Super (Desktop)
  (105.6 - 112, n=4)
109.5 fps -35%
Nvidia GeForce RTX 2070 Super
NVIDIA GeForce RTX 2070 Super (Desktop), R7 2700X
105.6 fps -37%
Durchschnittliche AMD Radeon RX 5700 XT (Desktop)
  (88.5 - 108.5, n=5)
92.8 fps -45%
AMD Radeon RX 5700 XT
AMD Radeon RX 5700 XT (Desktop), R7 2700X
89.1 fps -47%
AMD Radeon RX 5700
AMD Radeon RX 5700 (Desktop), R7 2700X
82.7 fps -51%
Unigine Superposition
1280x720 720p Low
Durchschnittliche NVIDIA GeForce RTX 3090
  (33329 - 54879, n=9)
45093 Points +22%
AMD Ryzen 9 5900X
NVIDIA Titan RTX, R9 5900X
40994 Points +11%
Durchschnittliche NVIDIA Titan RTX
  (25622 - 50876, n=9)
40891 Points +10%
Durchschnittliche NVIDIA GeForce RTX 2070 Super (Desktop)
  (26742 - 45424, n=3)
38495 Points +4%
Durchschnittliche AMD Radeon RX 5700 XT (Desktop)
  (28674 - 42884, n=3)
37187 Points 0%
AMD Radeon RX 6900 XT
AMD Radeon RX 6900 XT, R9 5950X
37023 Points
AMD Radeon RX 6800 XT
AMD Radeon RX 6800 XT, R9 5950X
36452 Points -2%
Nvidia GeForce RTX 3090 Founders Edition
NVIDIA GeForce RTX 3090, R9 5900X
34649 Points -6%
Durchschnittliche NVIDIA GeForce RTX 3070
  (27330 - 40007, n=5)
34576 Points -7%
MSI GeForce RTX 3070 Gaming X Trio
NVIDIA GeForce RTX 3070, R9 5900X
31666 Points -14%
Durchschnittliche NVIDIA GeForce RTX 3080
  (30851 - 32183, n=2)
31517 Points -15%
ASUS GeForce RTX 3080 ROG STRIX OC GAMING
NVIDIA GeForce RTX 3080, R9 5900X
30851 Points -17%
Durchschnittliche NVIDIA GeForce RTX 2080 Super (Desktop)
 
26907 Points -27%
1920x1080 1080p High
Durchschnittliche NVIDIA GeForce RTX 3090
  (23626 - 27207, n=10)
25978 Points +4%
AMD Radeon RX 6900 XT
AMD Radeon RX 6900 XT, R9 5950X
25029 Points
Nvidia GeForce RTX 3090 Founders Edition
NVIDIA GeForce RTX 3090, R9 5900X
23853 Points -5%
AMD Radeon RX 6800 XT
AMD Radeon RX 6800 XT, R9 5950X
22265 Points -11%
Durchschnittliche NVIDIA GeForce RTX 3080
  (21333 - 21912, n=2)
21623 Points -14%
ASUS GeForce RTX 3080 ROG STRIX OC GAMING
NVIDIA GeForce RTX 3080, R9 5900X
21333 Points -15%
AMD Ryzen 9 5900X
NVIDIA Titan RTX, R9 5900X
20315 Points -19%
Durchschnittliche NVIDIA Titan RTX
  (19460 - 20658, n=9)
20301 Points -19%
MSI GeForce RTX 3070 Gaming X Trio
NVIDIA GeForce RTX 3070, R9 5900X
17346 Points -31%
Durchschnittliche NVIDIA GeForce RTX 3070
  (17054 - 17491, n=5)
17312 Points -31%
Durchschnittliche NVIDIA GeForce RTX 2080 Super (Desktop)
 
15558 Points -38%
Durchschnittliche NVIDIA GeForce RTX 2070 Super (Desktop)
  (13655 - 13832, n=3)
13765 Points -45%
Durchschnittliche AMD Radeon RX 5700 XT (Desktop)
  (11874 - 11902, n=3)
11886 Points -53%
1920x1080 1080p Extreme
Durchschnittliche NVIDIA GeForce RTX 3090
  (11806 - 12694, n=10)
12227 Points +14%
Nvidia GeForce RTX 3090 Founders Edition
NVIDIA GeForce RTX 3090, R9 5900X
11806 Points +11%
Durchschnittliche NVIDIA GeForce RTX 3080
  (10572 - 10822, n=2)
10697 Points 0%
AMD Radeon RX 6900 XT
AMD Radeon RX 6900 XT, R9 5950X
10683 Points
ASUS GeForce RTX 3080 ROG STRIX OC GAMING
NVIDIA GeForce RTX 3080, R9 5900X
10572 Points -1%
AMD Radeon RX 6800 XT
AMD Radeon RX 6800 XT, R9 5950X
10046 Points -6%
AMD Ryzen 9 5900X
NVIDIA Titan RTX, R9 5900X
9056 Points -15%
Durchschnittliche NVIDIA Titan RTX
  (8916 - 9285, n=9)
9051 Points -15%
MSI GeForce RTX 3070 Gaming X Trio
NVIDIA GeForce RTX 3070, R9 5900X
8507 Points -20%
Durchschnittliche NVIDIA GeForce RTX 3070
  (8276 - 8507, n=5)
8354 Points -22%
Durchschnittliche NVIDIA GeForce RTX 2080 Super (Desktop)
 
7080 Points -34%
Durchschnittliche NVIDIA GeForce RTX 2070 Super (Desktop)
  (6161 - 6178, n=3)
6169 Points -42%
Durchschnittliche AMD Radeon RX 5700 XT (Desktop)
  (4901 - 4967, n=3)
4927 Points -54%
3840x2160 4k Optimized
Durchschnittliche NVIDIA GeForce RTX 3090
  (15794 - 16868, n=10)
16352 Points +9%
Nvidia GeForce RTX 3090 Founders Edition
NVIDIA GeForce RTX 3090, R9 5900X
15794 Points +6%
AMD Radeon RX 6900 XT
AMD Radeon RX 6900 XT, R9 5950X
14955 Points
Durchschnittliche NVIDIA GeForce RTX 3080
  (13984 - 14243, n=2)
14114 Points -6%
ASUS GeForce RTX 3080 ROG STRIX OC GAMING
NVIDIA GeForce RTX 3080, R9 5900X
13984 Points -6%
AMD Radeon RX 6800 XT
AMD Radeon RX 6800 XT, R9 5950X
13471 Points -10%
Durchschnittliche NVIDIA Titan RTX
  (11937 - 12644, n=9)
12203 Points -18%
AMD Ryzen 9 5900X
NVIDIA Titan RTX, R9 5900X
12186 Points -19%
MSI GeForce RTX 3070 Gaming X Trio
NVIDIA GeForce RTX 3070, R9 5900X
10755 Points -28%
Durchschnittliche NVIDIA GeForce RTX 3070
  (10544 - 10755, n=5)
10667 Points -29%
Durchschnittliche NVIDIA GeForce RTX 2080 Super (Desktop)
 
9338 Points -38%
Durchschnittliche NVIDIA GeForce RTX 2070 Super (Desktop)
  (8096 - 8111, n=3)
8101 Points -46%
Durchschnittliche AMD Radeon RX 5700 XT (Desktop)
  (6885 - 7034, n=3)
6973 Points -53%
7680x4320 8k Optimized
Durchschnittliche NVIDIA GeForce RTX 3090
  (6969 - 7521, n=10)
7160 Points +24%
Nvidia GeForce RTX 3090 Founders Edition
NVIDIA GeForce RTX 3090, R9 5900X
7002 Points +21%
Durchschnittliche NVIDIA GeForce RTX 3080
  (6243 - 6346, n=2)
6295 Points +9%
ASUS GeForce RTX 3080 ROG STRIX OC GAMING
NVIDIA GeForce RTX 3080, R9 5900X
6243 Points +8%
AMD Radeon RX 6900 XT
AMD Radeon RX 6900 XT, R9 5950X
5764 Points
AMD Ryzen 9 5900X
NVIDIA Titan RTX, R9 5900X
5402 Points -6%
Durchschnittliche NVIDIA Titan RTX
  (5255 - 5571, n=9)
5393 Points -6%
AMD Radeon RX 6800 XT
AMD Radeon RX 6800 XT, R9 5950X
5256 Points -9%
MSI GeForce RTX 3070 Gaming X Trio
NVIDIA GeForce RTX 3070, R9 5900X
4695 Points -19%
Durchschnittliche NVIDIA GeForce RTX 3070
  (4587 - 4695, n=5)
4624 Points -20%
Durchschnittliche NVIDIA GeForce RTX 2080 Super (Desktop)
 
3989 Points -31%
Durchschnittliche NVIDIA GeForce RTX 2070 Super (Desktop)
  (3419 - 3435, n=3)
3429 Points -41%
Durchschnittliche AMD Radeon RX 5700 XT (Desktop)
  (2867 - 2887, n=3)
2877 Points -50%
3DMark 11 Performance
42418 Punkte
3DMark Fire Strike Score
39057 Punkte
3DMark Fire Strike Extreme Score
25197 Punkte
3DMark Time Spy Score
17549 Punkte
Hilfe

Compute-Benchmarks

In den Compute-Benchmarks schlägt sich die RX 6900 XT ordentlich gegen die RTX 3090. In ComputeMark liegt sie je nach Test zwischen 3 und 26 Prozent hinter einer RTX 3090. Interessanterweise scheint erst LuxMark die volle Kraft der RDNA-2-Rechenkraft aufzuzeigen, hier wird im Sala-GPU-Only-Test ein Vorsprung der RX 6900 XT gegenüber einer RTX 3090 von 114 Prozent angezeigt, andererseits liegt sie im Room-GPU-Only-Benchmark wieder rund 12 Prozent hinter der Rivalin von Nvidia.

Die Leistung in Geekbench 5.3 Compute via OpenCL und Vulkan scheint nicht besonders beeindruckend zu sein, immerhin bietet selbst eine RTX 3080 eine minimal bessere Performance in OpenCL als die RX 6900 XT. Und auch wenn sich das Glück im reinen Vulkan-Teil des Tests gegenüber der RTX 3080 zugunsten der RTX 3090 Founders Edition wendet, hat die RTX 3090 noch immer einen komfortablen Vorsprung von 67 Prozent gegenüber der RX 6900 XT.

ComputeMark v2.1
1024x600 Normal, QJuliaRayTrace
Durchschnittliche NVIDIA GeForce RTX 3090
  (16403 - 18223, n=9)
17439 Points +42%
Nvidia GeForce RTX 3090 Founders Edition
NVIDIA GeForce RTX 3090, R9 5900X
16543 Points +35%
Durchschnittliche NVIDIA GeForce RTX 3080
  (14718 - 15508, n=2)
15113 Points +23%
ASUS GeForce RTX 3080 ROG STRIX OC GAMING
NVIDIA GeForce RTX 3080, R9 5900X
14718 Points +20%
AMD Radeon RX 6900 XT
AMD Radeon RX 6900 XT, R9 5950X
12255 Points
MSI GeForce RTX 3070 Gaming X Trio
NVIDIA GeForce RTX 3070, R9 5900X
11816 Points -4%
Durchschnittliche NVIDIA GeForce RTX 3070
  (11510 - 11816, n=3)
11665 Points -5%
AMD Radeon RX 6800 XT
AMD Radeon RX 6800 XT, R9 5950X
11304 Points -8%
Durchschnittliche NVIDIA Titan RTX
  (9418 - 10129, n=3)
9748 Points -20%
Durchschnittliche NVIDIA GeForce RTX 2080 Ti (Desktop)
  (9104 - 9690, n=3)
9492 Points -23%
KFA2 GeForce RTX 2080 Ti EX
NVIDIA GeForce RTX 2080 Ti (Desktop), R9 3900X
9104 Points -26%
Nvidia GeForce RTX 2080 Super
NVIDIA GeForce RTX 2080 Super (Desktop), R7 2700X
7258 Points -41%
Durchschnittliche NVIDIA GeForce RTX 2080 Super (Desktop)
 
7258 Points -41%
Durchschnittliche NVIDIA GeForce RTX 2070 Super (Desktop)
  (6155 - 6158, n=2)
6157 Points -50%
Nvidia GeForce RTX 2070 Super
NVIDIA GeForce RTX 2070 Super (Desktop), R7 2700X
6155 Points -50%
AMD Radeon RX 5700 XT
AMD Radeon RX 5700 XT (Desktop), R7 2700X
5761 Points -53%
Durchschnittliche AMD Radeon RX 5700 XT (Desktop)
  (5677 - 5761, n=2)
5719 Points -53%
AMD Radeon RX 5700
AMD Radeon RX 5700 (Desktop), R7 2700X
4703 Points -62%
1024x600 Normal, Mandel Scalar
Durchschnittliche NVIDIA GeForce RTX 3090
  (10650 - 11564, n=9)
11171 Points +3%
AMD Radeon RX 6900 XT
AMD Radeon RX 6900 XT, R9 5950X
10834 Points
Nvidia GeForce RTX 3090 Founders Edition
NVIDIA GeForce RTX 3090, R9 5900X
10650 Points -2%
AMD Radeon RX 6800 XT
AMD Radeon RX 6800 XT, R9 5950X
10018 Points -8%
Durchschnittliche NVIDIA GeForce RTX 3080
  (9554 - 9938, n=2)
9746 Points -10%
ASUS GeForce RTX 3080 ROG STRIX OC GAMING
NVIDIA GeForce RTX 3080, R9 5900X
9554 Points -12%
MSI GeForce RTX 3070 Gaming X Trio
NVIDIA GeForce RTX 3070, R9 5900X
7314 Points -32%
Durchschnittliche NVIDIA GeForce RTX 3070
  (7042 - 7314, n=3)
7169 Points -34%
Durchschnittliche NVIDIA Titan RTX
  (5977 - 6406, n=3)
6184 Points -43%
Durchschnittliche NVIDIA GeForce RTX 2080 Ti (Desktop)
  (5679 - 6226, n=3)
6010 Points -45%
KFA2 GeForce RTX 2080 Ti EX
NVIDIA GeForce RTX 2080 Ti (Desktop), R9 3900X
5679 Points -48%
AMD Radeon RX 5700 XT
AMD Radeon RX 5700 XT (Desktop), R7 2700X
4869 Points -55%
Durchschnittliche AMD Radeon RX 5700 XT (Desktop)
  (4846 - 4869, n=2)
4858 Points -55%
Nvidia GeForce RTX 2080 Super
NVIDIA GeForce RTX 2080 Super (Desktop), R7 2700X
4525 Points -58%
Durchschnittliche NVIDIA GeForce RTX 2080 Super (Desktop)
 
4525 Points -58%
AMD Radeon RX 5700
AMD Radeon RX 5700 (Desktop), R7 2700X
4043 Points -63%
Nvidia GeForce RTX 2070 Super
NVIDIA GeForce RTX 2070 Super (Desktop), R7 2700X
3782 Points -65%
Durchschnittliche NVIDIA GeForce RTX 2070 Super (Desktop)
  (3748 - 3782, n=2)
3765 Points -65%
1024x600 Normal, Mandel Vector
Durchschnittliche NVIDIA GeForce RTX 3090
  (8038 - 10097, n=9)
9437 Points +9%
Nvidia GeForce RTX 3090 Founders Edition
NVIDIA GeForce RTX 3090, R9 5900X
9236 Points +6%
AMD Radeon RX 6900 XT
AMD Radeon RX 6900 XT, R9 5950X
8690 Points
AMD Radeon RX 6800 XT
AMD Radeon RX 6800 XT, R9 5950X
8399 Points -3%
Durchschnittliche NVIDIA GeForce RTX 3080
  (7148 - 7540, n=2)
7344 Points -15%
ASUS GeForce RTX 3080 ROG STRIX OC GAMING
NVIDIA GeForce RTX 3080, R9 5900X
7148 Points -18%
Durchschnittliche NVIDIA GeForce RTX 3070
  (5364 - 6266, n=3)
5707 Points -34%
MSI GeForce RTX 3070 Gaming X Trio
NVIDIA GeForce RTX 3070, R9 5900X
5490 Points -37%
Durchschnittliche NVIDIA Titan RTX
  (4944 - 5440, n=3)
5158 Points -41%
Durchschnittliche NVIDIA GeForce RTX 2080 Ti (Desktop)
  (4695 - 5092, n=3)
4941 Points -43%
KFA2 GeForce RTX 2080 Ti EX
NVIDIA GeForce RTX 2080 Ti (Desktop), R9 3900X
4695 Points -46%
Durchschnittliche AMD Radeon RX 5700 XT (Desktop)
  (4246 - 4371, n=2)
4309 Points -50%
AMD Radeon RX 5700 XT
AMD Radeon RX 5700 XT (Desktop), R7 2700X
4246 Points -51%
Nvidia GeForce RTX 2080 Super
NVIDIA GeForce RTX 2080 Super (Desktop), R7 2700X
3835 Points -56%
Durchschnittliche NVIDIA GeForce RTX 2080 Super (Desktop)
 
3835 Points -56%
AMD Radeon RX 5700
AMD Radeon RX 5700 (Desktop), R7 2700X
3532 Points -59%
Nvidia GeForce RTX 2070 Super
NVIDIA GeForce RTX 2070 Super (Desktop), R7 2700X
3358 Points -61%
Durchschnittliche NVIDIA GeForce RTX 2070 Super (Desktop)
  (3348 - 3358, n=2)
3353 Points -61%
1024x600 Normal, Fluid 2DTexArr
Durchschnittliche NVIDIA GeForce RTX 3090
  (4344 - 4608, n=9)
4497 Points +15%
Nvidia GeForce RTX 3090 Founders Edition
NVIDIA GeForce RTX 3090, R9 5900X
4344 Points +11%
Durchschnittliche NVIDIA GeForce RTX 3080
  (4087 - 4159, n=2)
4123 Points +5%
ASUS GeForce RTX 3080 ROG STRIX OC GAMING
NVIDIA GeForce RTX 3080, R9 5900X
4087 Points +4%
AMD Radeon RX 6800 XT
AMD Radeon RX 6800 XT, R9 5950X
3947 Points +1%
AMD Radeon RX 6900 XT
AMD Radeon RX 6900 XT, R9 5950X
3924 Points
Durchschnittliche NVIDIA Titan RTX
  (3691 - 3828, n=3)
3757 Points -4%
Durchschnittliche NVIDIA GeForce RTX 2080 Ti (Desktop)
  (3444 - 3539, n=3)
3499 Points -11%
KFA2 GeForce RTX 2080 Ti EX
NVIDIA GeForce RTX 2080 Ti (Desktop), R9 3900X
3444 Points -12%
MSI GeForce RTX 3070 Gaming X Trio
NVIDIA GeForce RTX 3070, R9 5900X
2704 Points -31%
Durchschnittliche NVIDIA GeForce RTX 3070
  (2666 - 2706, n=3)
2692 Points -31%
Nvidia GeForce RTX 2080 Super
NVIDIA GeForce RTX 2080 Super (Desktop), R7 2700X
2655 Points -32%
Durchschnittliche NVIDIA GeForce RTX 2080 Super (Desktop)
 
2655 Points -32%
Durchschnittliche NVIDIA GeForce RTX 2070 Super (Desktop)
  (2331 - 2354, n=2)
2343 Points -40%
Nvidia GeForce RTX 2070 Super
NVIDIA GeForce RTX 2070 Super (Desktop), R7 2700X
2331 Points -41%
Durchschnittliche AMD Radeon RX 5700 XT (Desktop)
  (1960 - 2005, n=2)
1983 Points -49%
AMD Radeon RX 5700 XT
AMD Radeon RX 5700 XT (Desktop), R7 2700X
1960 Points -50%
AMD Radeon RX 5700
AMD Radeon RX 5700 (Desktop), R7 2700X
1810 Points -54%
1024x600 Normal, Fluid 3DTex
Durchschnittliche NVIDIA GeForce RTX 3090
  (5246 - 5520, n=9)
5444 Points +6%
Nvidia GeForce RTX 3090 Founders Edition
NVIDIA GeForce RTX 3090, R9 5900X
5246 Points +2%
AMD Radeon RX 6800 XT
AMD Radeon RX 6800 XT, R9 5950X
5154 Points 0%
AMD Radeon RX 6900 XT
AMD Radeon RX 6900 XT, R9 5950X
5154 Points
Durchschnittliche NVIDIA GeForce RTX 3080
  (4417 - 4450, n=2)
4434 Points -14%
ASUS GeForce RTX 3080 ROG STRIX OC GAMING
NVIDIA GeForce RTX 3080, R9 5900X
4417 Points -14%
Durchschnittliche NVIDIA Titan RTX
  (3877 - 4027, n=3)
3955 Points -23%
Durchschnittliche NVIDIA GeForce RTX 2080 Ti (Desktop)
  (3589 - 3653, n=3)
3625 Points -30%
KFA2 GeForce RTX 2080 Ti EX
NVIDIA GeForce RTX 2080 Ti (Desktop), R9 3900X
3589 Points -30%
MSI GeForce RTX 3070 Gaming X Trio
NVIDIA GeForce RTX 3070, R9 5900X
2776 Points -46%
Durchschnittliche NVIDIA GeForce RTX 3070
  (2749 - 2791, n=3)
2772 Points -46%
Nvidia GeForce RTX 2080 Super
NVIDIA GeForce RTX 2080 Super (Desktop), R7 2700X
2736 Points -47%
Durchschnittliche NVIDIA GeForce RTX 2080 Super (Desktop)
 
2736 Points -47%
Durchschnittliche NVIDIA GeForce RTX 2070 Super (Desktop)
  (2456 - 2486, n=2)
2471 Points -52%
Nvidia GeForce RTX 2070 Super
NVIDIA GeForce RTX 2070 Super (Desktop), R7 2700X
2456 Points -52%
Durchschnittliche AMD Radeon RX 5700 XT (Desktop)
  (2349 - 2376, n=2)
2363 Points -54%
AMD Radeon RX 5700 XT
AMD Radeon RX 5700 XT (Desktop), R7 2700X
2349 Points -54%
AMD Radeon RX 5700
AMD Radeon RX 5700 (Desktop), R7 2700X
2294 Points -55%
1024x600 Normal, Score
Durchschnittliche NVIDIA GeForce RTX 3090
  (44948 - 49118, n=8)
47736 Points +17%
Nvidia GeForce RTX 3090 Founders Edition
NVIDIA GeForce RTX 3090, R9 5900X
46018 Points +13%
AMD Radeon RX 6900 XT
AMD Radeon RX 6900 XT, R9 5950X
40857 Points
Durchschnittliche NVIDIA GeForce RTX 3080
  (39924 - 41594, n=2)
40759 Points 0%
ASUS GeForce RTX 3080 ROG STRIX OC GAMING
NVIDIA GeForce RTX 3080, R9 5900X
39924 Points -2%
AMD Radeon RX 6800 XT
AMD Radeon RX 6800 XT, R9 5950X
38823 Points -5%
MSI GeForce RTX 3070 Gaming X Trio
NVIDIA GeForce RTX 3070, R9 5900X
30100 Points -26%
Durchschnittliche NVIDIA GeForce RTX 3070
  (29330 - 30581, n=3)
30004 Points -27%
Durchschnittliche NVIDIA Titan RTX
  (27907 - 29830, n=3)
28802 Points -30%
Durchschnittliche NVIDIA GeForce RTX 2080 Ti (Desktop)
  (26510 - 28145, n=3)
27567 Points -33%
KFA2 GeForce RTX 2080 Ti EX
NVIDIA GeForce RTX 2080 Ti (Desktop), R9 3900X
26510 Points -35%
Nvidia GeForce RTX 2080 Super
NVIDIA GeForce RTX 2080 Super (Desktop), R7 2700X
21009 Points -49%
Durchschnittliche NVIDIA GeForce RTX 2080 Super (Desktop)
 
21009 Points -49%
Durchschnittliche AMD Radeon RX 5700 XT (Desktop)
  (19184 - 19274, n=2)
19229 Points -53%
AMD Radeon RX 5700 XT
AMD Radeon RX 5700 XT (Desktop), R7 2700X
19184 Points -53%
Durchschnittliche NVIDIA GeForce RTX 2070 Super (Desktop)
  (18083 - 18095, n=2)
18089 Points -56%
Nvidia GeForce RTX 2070 Super
NVIDIA GeForce RTX 2070 Super (Desktop), R7 2700X
18083 Points -56%
AMD Radeon RX 5700
AMD Radeon RX 5700 (Desktop), R7 2700X
16383 Points -60%
LuxMark v2.0 64Bit
Room GPUs-only
Durchschnittliche NVIDIA GeForce RTX 3090
  (5727 - 5974, n=8)
5881 Samples/s +16%
Nvidia GeForce RTX 3090 Founders Edition
NVIDIA GeForce RTX 3090, R9 5900X
5808 Samples/s +14%
Durchschnittliche NVIDIA GeForce RTX 3080
  (5112 - 5198, n=2)
5155 Samples/s +1%
ASUS GeForce RTX 3080 ROG STRIX OC GAMING
NVIDIA GeForce RTX 3080, R9 5900X
5112 Samples/s +1%
AMD Radeon RX 6900 XT
AMD Radeon RX 6900 XT, R9 5950X
5084 Samples/s
AMD Radeon RX 6800 XT
AMD Radeon RX 6800 XT, R9 5950X
5057 Samples/s -1%
Durchschnittliche NVIDIA Titan RTX
  (4643 - 4703, n=2)
4673 Samples/s -8%
Durchschnittliche NVIDIA GeForce RTX 2080 Ti (Desktop)
  (4425 - 4494, n=3)
4449 Samples/s -12%
KFA2 GeForce RTX 2080 Ti EX
NVIDIA GeForce RTX 2080 Ti (Desktop), R9 3900X
4429 Samples/s -13%
MSI GeForce RTX 3070 Gaming X Trio
NVIDIA GeForce RTX 3070, R9 5900X
4293 Samples/s -16%
Durchschnittliche NVIDIA GeForce RTX 3070
  (2187 - 4293, n=3)
3588 Samples/s -29%
Nvidia GeForce RTX 2080 Super
NVIDIA GeForce RTX 2080 Super (Desktop), R7 2700X
3430 Samples/s -33%
Durchschnittliche NVIDIA GeForce RTX 2080 Super (Desktop)
 
3430 Samples/s -33%
Nvidia GeForce RTX 2070 Super
NVIDIA GeForce RTX 2070 Super (Desktop), R7 2700X
3404 Samples/s -33%
Durchschnittliche NVIDIA GeForce RTX 2070 Super (Desktop)
 
3404 Samples/s -33%
AMD Radeon RX 5700 XT
AMD Radeon RX 5700 XT (Desktop), R7 2700X
2104 Samples/s -59%
Durchschnittliche AMD Radeon RX 5700 XT (Desktop)
  (1915 - 2104, n=2)
2010 Samples/s -60%
AMD Radeon RX 5700
AMD Radeon RX 5700 (Desktop), R7 2700X
1856 Samples/s -63%
Sala GPUs-only
AMD Radeon RX 6900 XT
AMD Radeon RX 6900 XT, R9 5950X
31400 Samples/s
AMD Radeon RX 6800 XT
AMD Radeon RX 6800 XT, R9 5950X
28023 Samples/s -11%
Durchschnittliche NVIDIA GeForce RTX 3090
  (14590 - 15088, n=8)
14908 Samples/s -53%
Nvidia GeForce RTX 3090 Founders Edition
NVIDIA GeForce RTX 3090, R9 5900X
14670 Samples/s -53%
Durchschnittliche NVIDIA GeForce RTX 3080
  (12797 - 12980, n=2)
12889 Samples/s -59%
ASUS GeForce RTX 3080 ROG STRIX OC GAMING
NVIDIA GeForce RTX 3080, R9 5900X
12797 Samples/s -59%
Durchschnittliche NVIDIA Titan RTX
  (10799 - 10996, n=2)
10898 Samples/s -65%
Durchschnittliche NVIDIA GeForce RTX 2080 Ti (Desktop)
  (9999 - 10291, n=3)
10156 Samples/s -68%
MSI GeForce RTX 3070 Gaming X Trio
NVIDIA GeForce RTX 3070, R9 5900X
10115 Samples/s -68%
Durchschnittliche NVIDIA GeForce RTX 3070
  (10096 - 10115, n=3)
10107 Samples/s -68%
KFA2 GeForce RTX 2080 Ti EX
NVIDIA GeForce RTX 2080 Ti (Desktop), R9 3900X
9999 Samples/s -68%
Nvidia GeForce RTX 2080 Super
NVIDIA GeForce RTX 2080 Super (Desktop), R7 2700X
7878 Samples/s -75%
Durchschnittliche NVIDIA GeForce RTX 2080 Super (Desktop)
 
7878 Samples/s -75%
Nvidia GeForce RTX 2070 Super
NVIDIA GeForce RTX 2070 Super (Desktop), R7 2700X
7594 Samples/s -76%
Durchschnittliche NVIDIA GeForce RTX 2070 Super (Desktop)
 
7594 Samples/s -76%
AMD Radeon RX 5700 XT
AMD Radeon RX 5700 XT (Desktop), R7 2700X
6188 Samples/s -80%
Durchschnittliche AMD Radeon RX 5700 XT (Desktop)
  (4650 - 6188, n=2)
5419 Samples/s -83%
AMD Radeon RX 5700
AMD Radeon RX 5700 (Desktop), R7 2700X
5312 Samples/s -83%
Geekbench 5.5
OpenCL Score
Durchschnittliche NVIDIA GeForce RTX 3090
  (199930 - 224611, n=19)
214008 Points +24%
Nvidia GeForce RTX 3090 Founders Edition
NVIDIA GeForce RTX 3090, R9 5900X
199930 Points +16%
ASUS GeForce RTX 3080 ROG STRIX OC GAMING
NVIDIA GeForce RTX 3080, R9 5900X
192091 Points +11%
Durchschnittliche NVIDIA GeForce RTX 3080
  (164477 - 192091, n=2)
178284 Points +3%
AMD Radeon RX 6900 XT
AMD Radeon RX 6900 XT, R9 5950X
172661 Points
AMD Radeon RX 6800 XT
AMD Radeon RX 6800 XT, R9 5950X
159072 Points -8%
AMD Ryzen 9 5900X
NVIDIA Titan RTX, R9 5900X
149070 Points -14%
Durchschnittliche NVIDIA Titan RTX
  (132850 - 153940, n=20)
140450 Points -19%
Durchschnittliche NVIDIA GeForce RTX 3070
  (134961 - 138625, n=4)
136574 Points -21%
MSI GeForce RTX 3070 Gaming X Trio
NVIDIA GeForce RTX 3070, R9 5900X
136521 Points -21%
Durchschnittliche NVIDIA GeForce RTX 2080 Super (Desktop)
  (118695 - 127035, n=3)
122884 Points -29%
Durchschnittliche NVIDIA GeForce RTX 2070 Super (Desktop)
  (102914 - 132850, n=2)
117882 Points -32%
Durchschnittliche AMD Radeon RX 5700 XT (Desktop)
  (56327 - 84682, n=2)
70505 Points -59%
Vulkan Score
Nvidia GeForce RTX 3090 Founders Edition
NVIDIA GeForce RTX 3090, R9 5900X
147831 Points +67%
Durchschnittliche NVIDIA GeForce RTX 3090
  (62516 - 168974, n=19)
128422 Points +45%
Durchschnittliche NVIDIA Titan RTX
  (70085 - 138172, n=20)
92754 Points +5%
AMD Radeon RX 6900 XT
AMD Radeon RX 6900 XT, R9 5950X
88587 Points
AMD Radeon RX 6800 XT
AMD Radeon RX 6800 XT, R9 5950X
81098 Points -8%
Durchschnittliche NVIDIA GeForce RTX 3080
  (76596 - 83486, n=2)
80041 Points -10%
Durchschnittliche NVIDIA GeForce RTX 2080 Super (Desktop)
  (62324 - 91321, n=3)
78667 Points -11%
Durchschnittliche NVIDIA GeForce RTX 2070 Super (Desktop)
  (76596 - 80530, n=2)
78563 Points -11%
AMD Ryzen 9 5900X
NVIDIA Titan RTX, R9 5900X
76596 Points -14%
ASUS GeForce RTX 3080 ROG STRIX OC GAMING
NVIDIA GeForce RTX 3080, R9 5900X
76596 Points -14%
Durchschnittliche NVIDIA GeForce RTX 3070
  (27460 - 107958, n=4)
71908 Points -19%
MSI GeForce RTX 3070 Gaming X Trio
NVIDIA GeForce RTX 3070, R9 5900X
62516 Points -29%
Durchschnittliche AMD Radeon RX 5700 XT (Desktop)
  (14776 - 57117, n=2)
35947 Points -59%

Professionelle Anwendungen

Navi 2x scheint seine Leistung bei professionellen Anwendungen gegenüber Navi 1x ordentlich gesteigert zu haben, ja sogar gegenüber den besten Ampere-Angeboten von NVIDIA im Consumer-Bereich. Zwar sind die Titan RTX und die Quadro RTX 5000 in CAD/CAM weiterhin die bessere Wahl, aber die Ergebnisse in Energie-, Automobil- und medizinischen Anwendungen sowie in den individuellen Komponenten des SPECviewperf-Tests zeigen, dass die RX 6900 XT eine gute Figur abgibt, zumindest im Bereich 3D-Authoring und CAD-Workflows.

AMD Radeon RX 6900 XT
AMD Radeon RX 6900 XT, R9 5950X
AMD Radeon RX 6800 XT
AMD Radeon RX 6800 XT, R9 5950X
AMD Radeon RX 5700 XT
AMD Radeon RX 5700 XT (Desktop), R7 2700X
Nvidia GeForce RTX 3090 Founders Edition
NVIDIA GeForce RTX 3090, R9 5900X
ASUS GeForce RTX 3080 ROG STRIX OC GAMING
NVIDIA GeForce RTX 3080, R9 5900X
AMD Ryzen 9 5900X
NVIDIA Titan RTX, R9 5900X
Acer ConceptD 9 Pro
NVIDIA Quadro RTX 5000 (Laptop), i9-9980HK
SPECviewperf 12
-15%
-45%
-31%
-35%
55%
49%
1900x1060 Solidworks (sw-03)
167
150
-10%
89.6
-46%
71.4
-57%
71.1
-57%
174.9
5%
230.1
38%
1900x1060 Siemens NX (snx-02)
47.7
45.07
-6%
35.27
-26%
14.8
-69%
13.27
-72%
273.2
473%
258.1
441%
1900x1060 Showcase (showcase-01)
241
223
-7%
137.8
-43%
239
-1%
199.9
-17%
191.1
-21%
126.4
-48%
1900x1060 Medical (medical-01)
88.4
77.3
-13%
46.9
-47%
47.2
-47%
50.8
-43%
90.7
3%
109.3
24%
1900x1060 Maya (maya-04)
151
118
-22%
86.5
-43%
190
26%
184.6
22%
188.3
25%
179
19%
1900x1060 Energy (energy-01)
30.8
28.39
-8%
12.72
-59%
20.6
-33%
18.47
-40%
28.31
-8%
26
-16%
1900x1060 Creo (creo-01)
127
119
-6%
66.9
-47%
74.8
-41%
74.2
-42%
173
36%
172.1
36%
1900x1060 Catia (catia-04)
292
238
-18%
158.8
-46%
127
-57%
126.1
-57%
262.7
-10%
220
-25%
1900x1060 3ds Max (3dsmax-05)
318
167
-47%
173.8
-45%
320
1%
275.6
-13%
292.6
-8%
235.8
-26%
SPECviewperf 13
-8%
-45%
-57%
-38%
44%
35%
Solidworks (sw-04)
214
193
-10%
114.4
-47%
82.9
-61%
92.4
-57%
196.4
-8%
203.8
-5%
Siemens NX (snx-03)
85.8
81.4
-5%
61.3
-29%
15.6
-82%
23.22
-73%
493.4
475%
465.3
442%
Showcase (showcase-02)
241
232
-4%
137.6
-43%
114
-53%
190.5
-21%
127.1
-47%
Medical (medical-02)
148
130
-12%
82.8
-44%
49.3
-67%
91.8
-38%
90.8
-39%
133.4
-10%
Maya (maya-05)
395
348
-12%
220.3
-44%
253
-36%
360.2
-9%
458
16%
340.8
-14%
Energy (energy-02)
60.6
58.4
-4%
26.82
-56%
26.6
-56%
36.08
-40%
52
-14%
57.3
-5%
Creo (creo-02)
292
276
-5%
157
-46%
176
-40%
281.2
-4%
346.5
19%
319.8
10%
Catia (catia-05)
468
412
-12%
242.8
-48%
111
-76%
190.4
-59%
374.8
-20%
338.9
-28%
3ds Max (3dsmax-06)
317
284
-10%
175.6
-45%
180
-43%
238.2
-25%
291.3
-8%
232.2
-27%
SPECviewperf 2020
5%
-37%
64%
3840x2160 Solidworks (solidworks-05)
112
108
-4%
93.1
-17%
153
37%
3840x2160 Siemens NX (snx-04)
85
81.7
-4%
13.2
-84%
347
308%
3840x2160 Medical (medical-03)
30.4
27.84
-8%
9.95
-67%
16.42
-46%
3840x2160 Maya (maya-06)
266
224
-16%
181
-32%
257
-3%
3840x2160 Energy (energy-03)
32.6
60.8
87%
22.3
-32%
58.2
79%
3840x2160 Creo (creo-03)
65.4
65
-1%
68.1
4%
113
73%
3840x2160 CATIA (catia-06)
44.6
42.4
-5%
32.3
-28%
78.2
75%
3840x2160 3ds Max (3dsmax-07)
121
114
-6%
70.2
-42%
108
-11%
Durchschnitt gesamt (Programm / Settings)
-6% / -6%
-45% / -45%
-42% / -42%
-37% / -37%
54% / 54%
42% / 42%

Game-Benchmarks

In der großen Mehrheit aller getesteten Spiele verhält sich die RX 6900 XT unter 4K Ultra wie erwartet. Offensichtlich hat sie einen Vorteil gegenüber den NVIDIA-Karten bei Titeln, die extra für AMD-Hardware optimiert wurden, wie zum Beispiel Assassin's Creed Odyssey und Assassin's Creed Valhalla. AMDs Flaggschiff-Karte führt das Ranking zudem bei den Titeln Battlefield V, Hitman 3, F1 2020 und Forza Horizon 4 an.

Dennoch hat die RTX 3090 in den meisten getesteten Spielen einen Vorteil zwischen 9 und 20 Prozent, teils sogar bis zu 30 Prozent unter 4K Ultra in Mafia Definitive Edition. Die Präsenz von acht zusätzlichen Compute Units (CUs) gegenüber einer RX 6800 XT scheint sich beim Gaming nicht signifikant positiv auszuwirken.  

Ray Tracing steht zwar zur Verfügung, verblasst jedoch angesichts der aktuellen Generation an Ampere-Karten. Dennoch gebührt AMD Respekt dafür, dass sie die Ray-Tracing-Performance aus dem Stand heraus auf das Level einer RTX 2080 Ti gehoben haben, teils ist es sogar besser. 

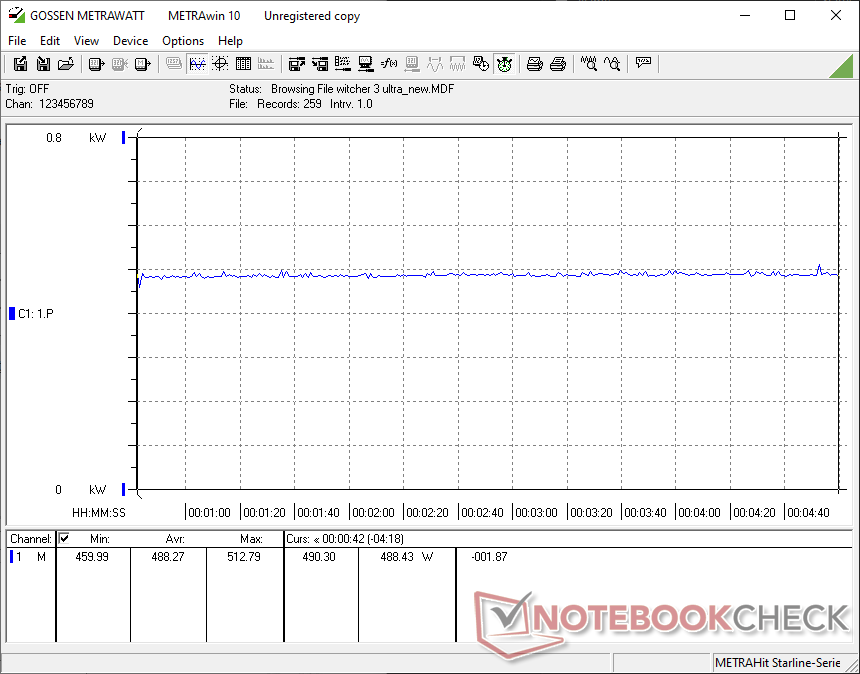
Im The-Witcher-3-Stresstest bei 1080p Ultra bietet die RX 6900 XT eine recht stabile Leistung bei nahezu 172 fps in den meisten Szenen. Allerdings können wir gelegentliches Drosseln beobachten, das die Frameraten spürbar sinken lässt. Das liegt vermutlich an sinkenden Taktraten wenn die Karte in den Bereich kritischer Temperaturen von um die 110 °C kommt.

0102030405060708090100110120130140150160170Tooltip
AMD Radeon RX 6900 XT Radeon RX 6900 XT, R9 5950X: Ø171.1 (125-176)
The Witcher 3
3840x2160 High Graphics & Postprocessing (Nvidia HairWorks Off)
Durchschnittliche NVIDIA GeForce RTX 3090
  (128 - 160.2, n=12)
151.5 fps +24%
Nvidia GeForce RTX 3090 Founders Edition
NVIDIA GeForce RTX 3090, R9 5900X
148 fps +21%
AMD Radeon RX 6900 XT
AMD Radeon RX 6900 XT, R9 5950X
122 (105min, 105P1 - 134max) fps
ASUS GeForce RTX 3080 ROG STRIX OC GAMING
NVIDIA GeForce RTX 3080, R9 5900X
115 (107min - 124max) fps -6%
Durchschnittliche NVIDIA GeForce RTX 3080
  (114 - 115, n=2)
114.5 fps -6%
AMD Radeon RX 6800 XT
AMD Radeon RX 6800 XT, R9 5950X
110 (97min - 117max) fps -10%
AMD Ryzen 9 5900X
NVIDIA Titan RTX, R9 5900X
104 (97min - 112max) fps -15%
Durchschnittliche NVIDIA Titan RTX
  (94 - 107.1, n=28)
102.4 fps -16%
Durchschnittliche NVIDIA GeForce RTX 2080 Ti (Desktop)
  (96 - 101, n=3)
98.3 fps -19%
KFA2 GeForce RTX 2080 Ti EX
NVIDIA GeForce RTX 2080 Ti (Desktop), R9 3900X
96 (87min - 109max) fps -21%
Durchschnittliche NVIDIA GeForce RTX 3070
  (84 - 93.9, n=5)
89.3 fps -27%
MSI GeForce RTX 3070 Gaming X Trio
NVIDIA GeForce RTX 3070, R9 5900X
88.2 (82min - 97max) fps -28%
Nvidia GeForce RTX 2080 Super
NVIDIA GeForce RTX 2080 Super (Desktop), R7 2700X
79 (71min - 87max) fps -35%
Durchschnittliche NVIDIA GeForce RTX 2080 Super (Desktop)
 
79 fps -35%
Nvidia GeForce RTX 2070 Super
NVIDIA GeForce RTX 2070 Super (Desktop), R7 2700X
68 (61min - 74max) fps -44%
Durchschnittliche NVIDIA GeForce RTX 2070 Super (Desktop)
  (65.5 - 71, n=5)
68 fps -44%
AMD Radeon RX 5700 XT
AMD Radeon RX 5700 XT (Desktop), R7 2700X
52.1 (47min - 57max) fps -57%
Durchschnittliche AMD Radeon RX 5700 XT (Desktop)
  (44 - 55.9, n=5)
52.1 fps -57%
AMD Radeon RX 5700
AMD Radeon RX 5700 (Desktop), R7 2700X
46.8 (42min - 51max) fps -62%
3840x2160 Ultra Graphics & Postprocessing (HBAO+)
Durchschnittliche NVIDIA GeForce RTX 3090
  (85.4 - 98.5, n=8)
93.4 fps +22%
Nvidia GeForce RTX 3090 Founders Edition
NVIDIA GeForce RTX 3090, R9 5900X
91.8 fps +20%
Durchschnittliche NVIDIA GeForce RTX 3080
  (78 - 85.7, n=2)
81.9 fps +7%
ASUS GeForce RTX 3080 ROG STRIX OC GAMING
NVIDIA GeForce RTX 3080, R9 5900X
78 (72min - 83max) fps +2%
AMD Radeon RX 6900 XT
AMD Radeon RX 6900 XT, R9 5950X
76.6 (70min, 70P1 - 84max) fps
Durchschnittliche NVIDIA Titan RTX
 
71.8 fps -6%
Durchschnittliche NVIDIA GeForce RTX 2080 Ti (Desktop)
  (65 - 67, n=3)
65.7 fps -14%
KFA2 GeForce RTX 2080 Ti EX
NVIDIA GeForce RTX 2080 Ti (Desktop), R9 3900X
65 (59min - 71max) fps -15%
Durchschnittliche NVIDIA GeForce RTX 3070
  (59 - 60.3, n=2)
59.7 fps -22%
Nvidia GeForce RTX 2080 Super
NVIDIA GeForce RTX 2080 Super (Desktop), R7 2700X
55.2 (49min - 61max) fps -28%
Durchschnittliche NVIDIA GeForce RTX 2080 Super (Desktop)
  (55.2 - 55.2, n=2)
55.2 fps -28%
Durchschnittliche NVIDIA GeForce RTX 2070 Super (Desktop)
  (46.3 - 49.3, n=4)
47.4 fps -38%
Nvidia GeForce RTX 2070 Super
NVIDIA GeForce RTX 2070 Super (Desktop), R7 2700X
46.3 (41min - 50max) fps -40%
AMD Radeon RX 5700 XT
AMD Radeon RX 5700 XT (Desktop), R7 2700X
39.7 (35min - 43max) fps -48%
Durchschnittliche AMD Radeon RX 5700 XT (Desktop)
  (38.9 - 40.4, n=3)
39.7 fps -48%
AMD Radeon RX 5700
AMD Radeon RX 5700 (Desktop), R7 2700X
35.6 (32min - 40max) fps -54%
1920x1080 Ultra Graphics & Postprocessing (HBAO+)
Durchschnittliche NVIDIA GeForce RTX 3090
  (160 - 192.6, n=16)
179.9 fps +10%
Nvidia GeForce RTX 3090 Founders Edition
NVIDIA GeForce RTX 3090, R9 5900X
171.5 fps +5%
AMD Radeon RX 6900 XT
AMD Radeon RX 6900 XT, R9 5950X
163.6 (139min - 179max) fps
AMD Radeon RX 6800 XT
AMD Radeon RX 6800 XT, R9 5950X
160 (138min - 179max) fps -2%
ASUS GeForce RTX 3080 ROG STRIX OC GAMING
NVIDIA GeForce RTX 3080, R9 5900X
152 (138min - 171max) fps -7%
Durchschnittliche NVIDIA GeForce RTX 3080
  (145 - 152, n=2)
148.5 fps -9%
AMD Ryzen 9 5900X
NVIDIA Titan RTX, R9 5900X
141 (127min - 154max) fps -14%
Durchschnittliche NVIDIA Titan RTX
  (124 - 150, n=28)
137.7 fps -16%
KFA2 GeForce RTX 2080 Ti EX
NVIDIA GeForce RTX 2080 Ti (Desktop), R9 3900X
135 (118min - 158max) fps -17%
Durchschnittliche NVIDIA GeForce RTX 2080 Ti (Desktop)
  (131 - 136, n=3)
134 fps -18%
MSI GeForce RTX 3070 Gaming X Trio
NVIDIA GeForce RTX 3070, R9 5900X
122 (110min - 138max) fps -25%
Nvidia GeForce RTX 2080 Super
NVIDIA GeForce RTX 2080 Super (Desktop), R7 2700X
109 (81min - 123max) fps -33%
Durchschnittliche NVIDIA GeForce RTX 2080 Super (Desktop)
 
109 fps -33%
Durchschnittliche NVIDIA GeForce RTX 3070
  (52.8 - 132.2, n=7)
106.1 fps -35%
Durchschnittliche NVIDIA GeForce RTX 2070 Super (Desktop)
  (95.6 - 109.6, n=6)
100.9 fps -38%
Nvidia GeForce RTX 2070 Super
NVIDIA GeForce RTX 2070 Super (Desktop), R7 2700X
97 (83min - 109max) fps -41%
AMD Radeon RX 5700 XT
AMD Radeon RX 5700 XT (Desktop), R7 2700X
92 (79min - 99max) fps -44%
Durchschnittliche AMD Radeon RX 5700 XT (Desktop)
  (71.6 - 102.4, n=6)
92 fps -44%
AMD Radeon RX 5700
AMD Radeon RX 5700 (Desktop), R7 2700X
80 (70min - 87max) fps -51%
Assassin´s Creed Odyssey
3840x2160 Ultra High Preset
AMD Radeon RX 6900 XT
AMD Radeon RX 6900 XT, R9 5950X
68 (14min - 149max) fps
Durchschnittliche NVIDIA GeForce RTX 3090
 
65 fps -4%
Durchschnittliche NVIDIA Titan RTX
 
52 fps -24%
Durchschnittliche NVIDIA GeForce RTX 2080 Ti (Desktop)
  (46 - 53, n=2)
49.5 fps -27%
Durchschnittliche NVIDIA GeForce RTX 3070
 
48 fps -29%
KFA2 GeForce RTX 2080 Ti EX
NVIDIA GeForce RTX 2080 Ti (Desktop), R9 3900X
46 fps -32%
Nvidia GeForce RTX 2080 Super
NVIDIA GeForce RTX 2080 Super (Desktop), R7 2700X
41 fps -40%
Durchschnittliche NVIDIA GeForce RTX 2080 Super (Desktop)
 
41 fps -40%
Nvidia GeForce RTX 2070 Super
NVIDIA GeForce RTX 2070 Super (Desktop), R7 2700X
39 fps -43%
Durchschnittliche NVIDIA GeForce RTX 2070 Super (Desktop)
  (38 - 39, n=2)
38.5 fps -43%
AMD Radeon RX 5700 XT
AMD Radeon RX 5700 XT (Desktop), R7 2700X
35 fps -49%
Durchschnittliche AMD Radeon RX 5700 XT (Desktop)
 
35 fps -49%
AMD Radeon RX 5700
AMD Radeon RX 5700 (Desktop), R7 2700X
31 fps -54%
2560x1440 Ultra High Preset
AMD Radeon RX 6900 XT
AMD Radeon RX 6900 XT, R9 5950X
99 (37min - 156max) fps
Durchschnittliche NVIDIA GeForce RTX 3090
 
82 fps -17%
Durchschnittliche NVIDIA GeForce RTX 2080 Ti (Desktop)
  (71 - 72, n=2)
71.5 fps -28%
KFA2 GeForce RTX 2080 Ti EX
NVIDIA GeForce RTX 2080 Ti (Desktop), R9 3900X
71 fps -28%
Durchschnittliche NVIDIA GeForce RTX 3070
 
68 fps -31%
Nvidia GeForce RTX 2080 Super
NVIDIA GeForce RTX 2080 Super (Desktop), R7 2700X
58 fps -41%
Durchschnittliche NVIDIA GeForce RTX 2080 Super (Desktop)
 
58 fps -41%
Durchschnittliche NVIDIA GeForce RTX 2070 Super (Desktop)
  (56 - 57, n=2)
56.5 fps -43%
Nvidia GeForce RTX 2070 Super
NVIDIA GeForce RTX 2070 Super (Desktop), R7 2700X
56 fps -43%
AMD Radeon RX 5700 XT
AMD Radeon RX 5700 XT (Desktop), R7 2700X
53 fps -46%
Durchschnittliche AMD Radeon RX 5700 XT (Desktop)
 
53 fps -46%
AMD Radeon RX 5700
AMD Radeon RX 5700 (Desktop), R7 2700X
51 fps -48%
1920x1080 Ultra High Preset
AMD Radeon RX 6900 XT
AMD Radeon RX 6900 XT, R9 5950X
98 (37min - 162max) fps
Durchschnittliche NVIDIA GeForce RTX 3090
 
92 fps -6%
Durchschnittliche NVIDIA GeForce RTX 2080 Ti (Desktop)
  (80 - 83, n=2)
81.5 fps -17%
Durchschnittliche NVIDIA GeForce RTX 3070
 
81 fps -17%
KFA2 GeForce RTX 2080 Ti EX
NVIDIA GeForce RTX 2080 Ti (Desktop), R9 3900X
80 fps -18%
Durchschnittliche NVIDIA Titan RTX
 
79 fps -19%
Nvidia GeForce RTX 2080 Super
NVIDIA GeForce RTX 2080 Super (Desktop), R7 2700X
68 fps -31%
Durchschnittliche NVIDIA GeForce RTX 2080 Super (Desktop)
 
68 fps -31%
Durchschnittliche NVIDIA GeForce RTX 2070 Super (Desktop)
  (64 - 66, n=2)
65 fps -34%
Nvidia GeForce RTX 2070 Super
NVIDIA GeForce RTX 2070 Super (Desktop), R7 2700X
64 fps -35%
AMD Radeon RX 5700 XT
AMD Radeon RX 5700 XT (Desktop), R7 2700X
62 fps -37%
Durchschnittliche AMD Radeon RX 5700 XT (Desktop)
 
62 fps -37%
AMD Radeon RX 5700
AMD Radeon RX 5700 (Desktop), R7 2700X
60 fps -39%
Battlefield V
1920x1080 Ultra Preset DXR
ASUS GeForce RTX 3080 ROG STRIX OC GAMING
NVIDIA GeForce RTX 3080, R9 5900X
128 (95min - 161max) fps +27%
Durchschnittliche NVIDIA GeForce RTX 3080
  (122.1 - 128, n=2)
125.1 fps +24%
Nvidia GeForce RTX 3090 Founders Edition
NVIDIA GeForce RTX 3090, R9 5900X
124.8 fps +24%
Durchschnittliche NVIDIA GeForce RTX 3090
  (106 - 128, n=3)
119.6 fps +18%
AMD Radeon RX 6900 XT
AMD Radeon RX 6900 XT, R9 5950X
101 (18.7min, 50.6P0.1, 65.1P1 - 290max) fps
Durchschnittliche NVIDIA GeForce RTX 3070
  (87.7 - 104.5, n=2)
96.1 fps -5%
Durchschnittliche NVIDIA GeForce RTX 2080 Ti (Desktop)
  (94 - 96, n=2)
95 fps -6%
AMD Radeon RX 6800 XT
AMD Radeon RX 6800 XT, R9 5950X
94.5 fps -6%
KFA2 GeForce RTX 2080 Ti EX
NVIDIA GeForce RTX 2080 Ti (Desktop), R9 3900X
94 (74min - 129max) fps -7%
MSI GeForce RTX 3070 Gaming X Trio
NVIDIA GeForce RTX 3070, R9 5900X
87.7 fps -13%
Nvidia GeForce RTX 2070 Super
NVIDIA GeForce RTX 2070 Super (Desktop), R7 2700X
80 (57min - 103max) fps -21%
Nvidia GeForce RTX 2080 Super
NVIDIA GeForce RTX 2080 Super (Desktop), R7 2700X
80 (47min - 111max) fps -21%
Durchschnittliche NVIDIA GeForce RTX 2080 Super (Desktop)
 
80 fps -21%
Durchschnittliche NVIDIA GeForce RTX 2070 Super (Desktop)
  (70.8 - 80, n=3)
75.6 fps -25%
3840x2160 Ultra Preset
AMD Radeon RX 6900 XT
AMD Radeon RX 6900 XT, R9 5950X
134 (28.5min, 44.9P0.1, 89P1 - 463max) fps
Durchschnittliche NVIDIA GeForce RTX 3090
  (94 - 130, n=4)
112.5 fps -16%
AMD Radeon RX 6800 XT
AMD Radeon RX 6800 XT, R9 5950X
102.5 fps -24%
Durchschnittliche NVIDIA Titan RTX
 
97.3 fps -27%
Nvidia GeForce RTX 3090 Founders Edition
NVIDIA GeForce RTX 3090, R9 5900X
95.8 fps -29%
ASUS GeForce RTX 3080 ROG STRIX OC GAMING
NVIDIA GeForce RTX 3080, R9 5900X
94.2 (78min - 135max) fps -30%
Durchschnittliche NVIDIA GeForce RTX 3080
  (87.2 - 94.2, n=2)
90.7 fps -32%
Durchschnittliche NVIDIA GeForce RTX 2080 Ti (Desktop)
  (73 - 99, n=2)
86 fps -36%
KFA2 GeForce RTX 2080 Ti EX
NVIDIA GeForce RTX 2080 Ti (Desktop), R9 3900X
73 (61min - 110max) fps -46%
Durchschnittliche NVIDIA GeForce RTX 3070
  (69 - 70.9, n=2)
70 fps -48%
MSI GeForce RTX 3070 Gaming X Trio
NVIDIA GeForce RTX 3070, R9 5900X
69 fps -49%
Durchschnittliche NVIDIA GeForce RTX 2080 Super (Desktop)
  (55.7 - 80, n=2)
67.9 fps -49%
AMD Radeon RX 5700 XT
AMD Radeon RX 5700 XT (Desktop), R7 2700X
59.5 (49min - 92max) fps -56%
Durchschnittliche AMD Radeon RX 5700 XT (Desktop)
 
59.5 fps -56%
Nvidia GeForce RTX 2080 Super
NVIDIA GeForce RTX 2080 Super (Desktop), R7 2700X
55.7 (33min - 81max) fps -58%
AMD Radeon RX 5700
AMD Radeon RX 5700 (Desktop), R7 2700X
53.5 (44min - 83max) fps -60%
Durchschnittliche NVIDIA GeForce RTX 2070 Super (Desktop)
  (50.9 - 54.4, n=3)
52.7 fps -61%
Nvidia GeForce RTX 2070 Super
NVIDIA GeForce RTX 2070 Super (Desktop), R7 2700X
50.9 (41min - 73max) fps -62%
2560x1440 Ultra Preset
AMD Radeon RX 6900 XT
AMD Radeon RX 6900 XT, R9 5950X
196 (24.2min, 63.2P0.1, 120P1 - 512max) fps
AMD Radeon RX 6800 XT
AMD Radeon RX 6800 XT, R9 5950X
153.7 fps -22%
Durchschnittliche NVIDIA GeForce RTX 3090
  (124 - 178, n=3)
143.8 fps -27%
Durchschnittliche NVIDIA GeForce RTX 2080 Ti (Desktop)
  (108 - 159, n=2)
133.5 fps -32%
ASUS GeForce RTX 3080 ROG STRIX OC GAMING
NVIDIA GeForce RTX 3080, R9 5900X
132 (109min - 179max) fps -33%
Nvidia GeForce RTX 3090 Founders Edition
NVIDIA GeForce RTX 3090, R9 5900X
129.5 fps -34%
Durchschnittliche NVIDIA GeForce RTX 3080
  (116.1 - 132, n=2)
124.1 fps -37%
KFA2 GeForce RTX 2080 Ti EX
NVIDIA GeForce RTX 2080 Ti (Desktop), R9 3900X
108 (87min - 153max) fps -45%
Durchschnittliche NVIDIA GeForce RTX 2080 Super (Desktop)
  (85 - 131, n=2)
108 fps -45%
Durchschnittliche NVIDIA GeForce RTX 3070
  (98.8 - 106.8, n=2)
102.8 fps -48%
MSI GeForce RTX 3070 Gaming X Trio
NVIDIA GeForce RTX 3070, R9 5900X
98.8 fps -50%
AMD Radeon RX 5700 XT
AMD Radeon RX 5700 XT (Desktop), R7 2700X
89 (70min - 130max) fps -55%
Durchschnittliche AMD Radeon RX 5700 XT (Desktop)
 
89 fps -55%
Nvidia GeForce RTX 2080 Super
NVIDIA GeForce RTX 2080 Super (Desktop), R7 2700X
85 (43min - 122max) fps -57%
Durchschnittliche NVIDIA GeForce RTX 2070 Super (Desktop)
  (78 - 94, n=3)
85 fps -57%
AMD Radeon RX 5700
AMD Radeon RX 5700 (Desktop), R7 2700X
81 (64min - 122max) fps -59%
Nvidia GeForce RTX 2070 Super
NVIDIA GeForce RTX 2070 Super (Desktop), R7 2700X
78 (65min - 110max) fps -60%
1920x1080 Ultra Preset
AMD Radeon RX 6900 XT
AMD Radeon RX 6900 XT, R9 5950X
197 (46.7min, 68.3P0.1, 114P1 - 501max) fps
AMD Radeon RX 6800 XT
AMD Radeon RX 6800 XT, R9 5950X
175.4 fps -11%
Durchschnittliche NVIDIA Titan RTX
 
160.4 fps -19%
Durchschnittliche NVIDIA GeForce RTX 2080 Ti (Desktop)
  (127 - 190, n=2)
158.5 fps -20%
Durchschnittliche NVIDIA GeForce RTX 3090
  (141 - 187, n=3)
157.9 fps -20%
ASUS GeForce RTX 3080 ROG STRIX OC GAMING
NVIDIA GeForce RTX 3080, R9 5900X
152 (126min - 199max) fps -23%
Nvidia GeForce RTX 3090 Founders Edition
NVIDIA GeForce RTX 3090, R9 5900X
145.8 fps -26%
Durchschnittliche NVIDIA GeForce RTX 3080
  (137.9 - 152, n=2)
145 fps -26%
Durchschnittliche NVIDIA GeForce RTX 2080 Super (Desktop)
  (101 - 160, n=2)
130.5 fps -34%
KFA2 GeForce RTX 2080 Ti EX
NVIDIA GeForce RTX 2080 Ti (Desktop), R9 3900X
127 (102min - 175max) fps -36%
Durchschnittliche NVIDIA GeForce RTX 3070
  (113.6 - 125.2, n=2)
119.4 fps -39%
MSI GeForce RTX 3070 Gaming X Trio
NVIDIA GeForce RTX 3070, R9 5900X
113.6 fps -42%
AMD Radeon RX 5700 XT
AMD Radeon RX 5700 XT (Desktop), R7 2700X
105 (81min - 150max) fps -47%
Durchschnittliche AMD Radeon RX 5700 XT (Desktop)
 
105 fps -47%
Durchschnittliche NVIDIA GeForce RTX 2070 Super (Desktop)
  (93.2 - 123, n=3)
103.7 fps -47%
Nvidia GeForce RTX 2080 Super
NVIDIA GeForce RTX 2080 Super (Desktop), R7 2700X
101 (63min - 139max) fps -49%
AMD Radeon RX 5700
AMD Radeon RX 5700 (Desktop), R7 2700X
97 (76min - 140max) fps -51%
Nvidia GeForce RTX 2070 Super
NVIDIA GeForce RTX 2070 Super (Desktop), R7 2700X
95 (77min - 133max) fps -52%
The Division 2
3840x2160 Ultra Preset
Durchschnittliche NVIDIA GeForce RTX 3090
  (71.9 - 77.5, n=3)
73.8 fps +11%
Nvidia GeForce RTX 3090 Founders Edition
NVIDIA GeForce RTX 3090, R9 5900X
72 fps +8%
AMD Radeon RX 6900 XT
AMD Radeon RX 6900 XT, R9 5950X
66.6 (40.2min, 54.6P1) fps
ASUS GeForce RTX 3080 ROG STRIX OC GAMING
NVIDIA GeForce RTX 3080, R9 5900X
65 fps -2%
Durchschnittliche NVIDIA GeForce RTX 3080
 
65 fps -2%
AMD Radeon RX 6800 XT
AMD Radeon RX 6800 XT, R9 5950X
63.2 (34.5min, 54.1P1) fps -5%
Durchschnittliche NVIDIA Titan RTX
 
62 fps -7%
Durchschnittliche NVIDIA GeForce RTX 2080 Ti (Desktop)
  (53 - 57, n=3)
55.3 fps -17%
KFA2 GeForce RTX 2080 Ti EX
NVIDIA GeForce RTX 2080 Ti (Desktop), R9 3900X
53 fps -20%
MSI GeForce RTX 3070 Gaming X Trio
NVIDIA GeForce RTX 3070, R9 5900X
49 fps -26%
Durchschnittliche NVIDIA GeForce RTX 3070
 
49 fps -26%
Nvidia GeForce RTX 2080 Super
NVIDIA GeForce RTX 2080 Super (Desktop), R7 2700X
45 fps -32%
Durchschnittliche NVIDIA GeForce RTX 2080 Super (Desktop)
  (43 - 45, n=2)
44 fps -34%
Nvidia GeForce RTX 2070 Super
NVIDIA GeForce RTX 2070 Super (Desktop), R7 2700X
39 fps -41%
Durchschnittliche NVIDIA GeForce RTX 2070 Super (Desktop)
  (37 - 39, n=2)
38 fps -43%
AMD Radeon RX 5700 XT
AMD Radeon RX 5700 XT (Desktop), R7 2700X
34.1 (16.9min, 21.4P1) fps -49%
Durchschnittliche AMD Radeon RX 5700 XT (Desktop)
  (26 - 34.1, n=2)
30.1 fps -55%
AMD Radeon RX 5700
AMD Radeon RX 5700 (Desktop), R7 2700X
30 (2.5min, 24.3P1) fps -55%
2560x1440 Ultra Preset
Durchschnittliche NVIDIA GeForce RTX 3090
  (120 - 128, n=3)
123 fps +4%
Nvidia GeForce RTX 3090 Founders Edition
NVIDIA GeForce RTX 3090, R9 5900X
121 fps +3%
AMD Radeon RX 6900 XT
AMD Radeon RX 6900 XT, R9 5950X
118 (51.3min, 70.9P1) fps
AMD Radeon RX 6800 XT
AMD Radeon RX 6800 XT, R9 5950X
114 (52.4min, 73P1) fps -3%
ASUS GeForce RTX 3080 ROG STRIX OC GAMING
NVIDIA GeForce RTX 3080, R9 5900X
107 fps -9%
Durchschnittliche NVIDIA GeForce RTX 3080
 
107 fps -9%
Durchschnittliche NVIDIA Titan RTX
 
102 fps -14%
Durchschnittliche NVIDIA GeForce RTX 2080 Ti (Desktop)
  (92 - 100, n=3)
96.3 fps -18%
KFA2 GeForce RTX 2080 Ti EX
NVIDIA GeForce RTX 2080 Ti (Desktop), R9 3900X
92 fps -22%
MSI GeForce RTX 3070 Gaming X Trio
NVIDIA GeForce RTX 3070, R9 5900X
82 fps -31%
Durchschnittliche NVIDIA GeForce RTX 3070
 
82 fps -31%
Nvidia GeForce RTX 2080 Super
NVIDIA GeForce RTX 2080 Super (Desktop), R7 2700X
79 fps -33%
Durchschnittliche NVIDIA GeForce RTX 2080 Super (Desktop)
 
79 fps -33%
Nvidia GeForce RTX 2070 Super
NVIDIA GeForce RTX 2070 Super (Desktop), R7 2700X
69 fps -42%
Durchschnittliche NVIDIA GeForce RTX 2070 Super (Desktop)
  (67 - 69, n=2)
68 fps -42%
AMD Radeon RX 5700 XT
AMD Radeon RX 5700 XT (Desktop), R7 2700X
64 (33.2min, 45.2P1) fps -46%
AMD Radeon RX 5700
AMD Radeon RX 5700 (Desktop), R7 2700X
56.9 (22.8min, 39.8P1) fps -52%
Durchschnittliche AMD Radeon RX 5700 XT (Desktop)
  (49 - 64, n=2)
56.5 fps -52%
1920x1080 Ultra Preset
Nvidia GeForce RTX 3090 Founders Edition
NVIDIA GeForce RTX 3090, R9 5900X
152 fps +10%
Durchschnittliche NVIDIA GeForce RTX 3090
  (140 - 160, n=3)
150.7 fps +9%
ASUS GeForce RTX 3080 ROG STRIX OC GAMING
NVIDIA GeForce RTX 3080, R9 5900X
140 fps +1%
Durchschnittliche NVIDIA GeForce RTX 3080
 
140 fps +1%
AMD Radeon RX 6800 XT
AMD Radeon RX 6800 XT, R9 5950X
138 (45.5min, 74.1P1) fps 0%
AMD Radeon RX 6900 XT
AMD Radeon RX 6900 XT, R9 5950X
138 (54.9min, 75.2P1) fps
Durchschnittliche NVIDIA GeForce RTX 2080 Ti (Desktop)
  (123 - 133, n=3)
127 fps -8%
KFA2 GeForce RTX 2080 Ti EX
NVIDIA GeForce RTX 2080 Ti (Desktop), R9 3900X
123 fps -11%
Durchschnittliche NVIDIA Titan RTX
 
113 fps -18%
MSI GeForce RTX 3070 Gaming X Trio
NVIDIA GeForce RTX 3070, R9 5900X
112 fps -19%
Durchschnittliche NVIDIA GeForce RTX 3070
 
112 fps -19%
Nvidia GeForce RTX 2080 Super
NVIDIA GeForce RTX 2080 Super (Desktop), R7 2700X
106 fps -23%
Durchschnittliche NVIDIA GeForce RTX 2080 Super (Desktop)
 
106 fps -23%
Durchschnittliche NVIDIA GeForce RTX 2070 Super (Desktop)
  (90 - 96, n=2)
93 fps -33%
Nvidia GeForce RTX 2070 Super
NVIDIA GeForce RTX 2070 Super (Desktop), R7 2700X
90 fps -35%
AMD Radeon RX 5700 XT
AMD Radeon RX 5700 XT (Desktop), R7 2700X
88 (30.2min, 50P1) fps -36%
Durchschnittliche AMD Radeon RX 5700 XT (Desktop)
  (69 - 88, n=2)
78.5 fps -43%
AMD Radeon RX 5700
AMD Radeon RX 5700 (Desktop), R7 2700X
78 (14.6min, 42.2P1) fps -43%
Red Dead Redemption 2
3840x2160 Maximum Settings
Durchschnittliche NVIDIA GeForce RTX 3090
  (61.9 - 67, n=3)
64.1 fps +17%
Nvidia GeForce RTX 3090 Founders Edition
NVIDIA GeForce RTX 3090, R9 5900X
63.5 (29min - 85max) fps +16%
Durchschnittliche NVIDIA GeForce RTX 3080
  (56 - 56.4, n=2)
56.2 fps +3%
ASUS GeForce RTX 3080 ROG STRIX OC GAMING
NVIDIA GeForce RTX 3080, R9 5900X
56 fps +3%
AMD Radeon RX 6900 XT
AMD Radeon RX 6900 XT, R9 5950X
54.6 (36.2min, 47.6P1 - 67max) fps
AMD Radeon RX 6800 XT
AMD Radeon RX 6800 XT, R9 5950X
52.9 (41min, 45.5P1 - 65.3max) fps -3%
MSI GeForce RTX 3070 Gaming X Trio
NVIDIA GeForce RTX 3070, R9 5900X
44 (32min - 55max) fps -19%
Durchschnittliche NVIDIA GeForce RTX 3070
  (42.1 - 44, n=3)
42.9 fps -21%
Durchschnittliche NVIDIA GeForce RTX 2080 Ti (Desktop)
 
42.3 fps -23%
Durchschnittliche NVIDIA Titan RTX
 
41 fps -25%
Durchschnittliche NVIDIA GeForce RTX 2080 Super (Desktop)
 
33 fps -40%
Durchschnittliche NVIDIA GeForce RTX 2070 Super (Desktop)
  (28 - 28.7, n=2)
28.4 fps -48%
Durchschnittliche AMD Radeon RX 5700 XT (Desktop)
 
27 fps -51%
2560x1440 Maximum Settings
Durchschnittliche NVIDIA GeForce RTX 3090
  (91.9 - 96, n=3)
93.4 fps +14%
Nvidia GeForce RTX 3090 Founders Edition
NVIDIA GeForce RTX 3090, R9 5900X
92.3 (33min - 132max) fps +12%
Durchschnittliche NVIDIA GeForce RTX 3080
  (81 - 86.4, n=2)
83.7 fps +2%
AMD Radeon RX 6800 XT
AMD Radeon RX 6800 XT, R9 5950X
82.7 (59min, 66.7P1 - 103max) fps +1%
AMD Radeon RX 6900 XT
AMD Radeon RX 6900 XT, R9 5950X
82.1 (34min, 66.7P1 - 104max) fps
ASUS GeForce RTX 3080 ROG STRIX OC GAMING
NVIDIA GeForce RTX 3080, R9 5900X
81 fps -1%
MSI GeForce RTX 3070 Gaming X Trio
NVIDIA GeForce RTX 3070, R9 5900X
65 (33min - 100max) fps -21%
Durchschnittliche NVIDIA GeForce RTX 3070
  (63.2 - 65, n=3)
63.9 fps -22%
Durchschnittliche NVIDIA GeForce RTX 2080 Ti (Desktop)
 
63 fps -23%
Durchschnittliche NVIDIA Titan RTX
 
63 fps -23%
Durchschnittliche NVIDIA GeForce RTX 2080 Super (Desktop)
 
50.6 fps -38%
Durchschnittliche NVIDIA GeForce RTX 2070 Super (Desktop)
  (43.3 - 44, n=2)
43.7 fps -47%
Durchschnittliche AMD Radeon RX 5700 XT (Desktop)
 
41.8 fps -49%
1920x1080 Maximum Settings
Durchschnittliche NVIDIA GeForce RTX 3090
  (109.9 - 115, n=3)
111.6 fps +14%
Nvidia GeForce RTX 3090 Founders Edition
NVIDIA GeForce RTX 3090, R9 5900X
109.9 (37min - 148max) fps +12%
AMD Radeon RX 6800 XT
AMD Radeon RX 6800 XT, R9 5950X
102 (68.7min, 76.9P1 - 129max) fps +4%
Durchschnittliche NVIDIA GeForce RTX 3080
  (96 - 103, n=2)
99.5 fps +2%
AMD Radeon RX 6900 XT
AMD Radeon RX 6900 XT, R9 5950X
98 (34.2min, 76.9P1 - 125max) fps
ASUS GeForce RTX 3080 ROG STRIX OC GAMING
NVIDIA GeForce RTX 3080, R9 5900X
96 fps -2%
MSI GeForce RTX 3070 Gaming X Trio
NVIDIA GeForce RTX 3070, R9 5900X
78 (38min - 126max) fps -20%
Durchschnittliche NVIDIA GeForce RTX 3070
  (76.2 - 78, n=3)
77.4 fps -21%
Durchschnittliche NVIDIA GeForce RTX 2080 Ti (Desktop)
 
76 fps -22%
Durchschnittliche NVIDIA Titan RTX
 
76 fps -22%
Durchschnittliche NVIDIA GeForce RTX 2080 Super (Desktop)
 
61 fps -38%
Durchschnittliche NVIDIA GeForce RTX 2070 Super (Desktop)
  (53 - 54.6, n=2)
53.8 fps -45%
Durchschnittliche AMD Radeon RX 5700 XT (Desktop)
 
51.5 fps -47%
Mafia Definitive Edition
3840x2160 High Preset
Durchschnittliche NVIDIA GeForce RTX 3090
  (84.5 - 89.1, n=2)
86.8 fps +30%
Nvidia GeForce RTX 3090 Founders Edition
NVIDIA GeForce RTX 3090, R9 5900X
84.5 fps +26%
ASUS GeForce RTX 3080 ROG STRIX OC GAMING
NVIDIA GeForce RTX 3080, R9 5900X
78.2 (17.9min, 31P0.1, 59.3P1 - 292max) fps +17%
Durchschnittliche NVIDIA GeForce RTX 3080
  (78.1 - 78.2, n=2)
78.2 fps +17%
AMD Radeon RX 6900 XT
AMD Radeon RX 6900 XT, R9 5950X
67 (32.3min, 41.7P0.1, 44.7P1 - 211max) fps
Durchschnittliche NVIDIA Titan RTX
 
63.4 fps -5%
AMD Radeon RX 6800 XT
AMD Radeon RX 6800 XT, R9 5950X
62.6 (28min, 37.6P0.1, 49.2P1 - 87.3max) fps -7%
Durchschnittliche NVIDIA GeForce RTX 2080 Ti (Desktop)
 
62.4 fps -7%
MSI GeForce RTX 3070 Gaming X Trio
NVIDIA GeForce RTX 3070, R9 5900X
56.6 (34.7min, 37.9P0.1, 44.2P1 - 177max) fps -16%
Durchschnittliche NVIDIA GeForce RTX 3070
  (55.2 - 56.6, n=2)
55.9 fps -17%
Durchschnittliche NVIDIA GeForce RTX 2080 Super (Desktop)
 
48.5 fps -28%
Durchschnittliche NVIDIA GeForce RTX 2070 Super (Desktop)
 
41.8 fps -38%
Durchschnittliche AMD Radeon RX 5700 XT (Desktop)
 
36.4 fps -46%
2560x1440 High Preset
Durchschnittliche NVIDIA GeForce RTX 3090
  (142.3 - 149, n=2)
145.7 fps +21%
Nvidia GeForce RTX 3090 Founders Edition
NVIDIA GeForce RTX 3090, R9 5900X
142.3 fps +19%
ASUS GeForce RTX 3080 ROG STRIX OC GAMING
NVIDIA GeForce RTX 3080, R9 5900X
137 (26.5min, 66.2P0.1, 95.7P1 - 265max) fps +14%
Durchschnittliche NVIDIA GeForce RTX 3080
  (127 - 137, n=2)
132 fps +10%
AMD Radeon RX 6900 XT
AMD Radeon RX 6900 XT, R9 5950X
120 (17.6min, 61.2P0.1, 83.1P1 - 238max) fps
AMD Radeon RX 6800 XT
AMD Radeon RX 6800 XT, R9 5950X
112 (23.5min, 64P0.1, 80.8P1 - 169max) fps -7%
Durchschnittliche NVIDIA Titan RTX
 
109 fps -9%
Durchschnittliche NVIDIA GeForce RTX 2080 Ti (Desktop)
 
105 fps -12%
MSI GeForce RTX 3070 Gaming X Trio
NVIDIA GeForce RTX 3070, R9 5900X
98.7 (45.2min, 55.9P0.1, 69.4P1 - 191max) fps -18%
Durchschnittliche NVIDIA GeForce RTX 3070
  (98.1 - 98.7, n=2)
98.4 fps -18%
Durchschnittliche NVIDIA GeForce RTX 2080 Super (Desktop)
 
88.8 fps -26%
Durchschnittliche NVIDIA GeForce RTX 2070 Super (Desktop)
 
78.1 fps -35%
Durchschnittliche AMD Radeon RX 5700 XT (Desktop)
 
67.7 fps -44%
1920x1080 High Preset
ASUS GeForce RTX 3080 ROG STRIX OC GAMING
NVIDIA GeForce RTX 3080, R9 5900X
169 (32.7min, 75.7P0.1, 112P1 - 361max) fps +22%
Nvidia GeForce RTX 3090 Founders Edition
NVIDIA GeForce RTX 3090, R9 5900X
158.8 fps +15%
Durchschnittliche NVIDIA GeForce RTX 3090
  (157 - 158.8, n=2)
157.9 fps +14%
Durchschnittliche NVIDIA GeForce RTX 3080
  (144 - 169, n=2)
156.5 fps +13%
AMD Radeon RX 6900 XT
AMD Radeon RX 6900 XT, R9 5950X
138 (32.8min, 68.1P0.1, 90.2P1 - 334max) fps
Durchschnittliche NVIDIA GeForce RTX 3070
  (124 - 132, n=2)
128 fps -7%
MSI GeForce RTX 3070 Gaming X Trio
NVIDIA GeForce RTX 3070, R9 5900X
124 (57.4min, 62.8P0.1, 82P1 - 251max) fps -10%
Durchschnittliche NVIDIA Titan RTX
 
123.7 fps -10%
AMD Radeon RX 6800 XT
AMD Radeon RX 6800 XT, R9 5950X
121 (23.7min, 68P0.1, 83.3P1 - 223max) fps -12%
Durchschnittliche NVIDIA GeForce RTX 2080 Super (Desktop)
 
118.1 fps -14%
Durchschnittliche NVIDIA GeForce RTX 2080 Ti (Desktop)
 
117 fps -15%
Durchschnittliche NVIDIA GeForce RTX 2070 Super (Desktop)
 
111.6 fps -19%
Durchschnittliche AMD Radeon RX 5700 XT (Desktop)
 
92.3 fps -33%
Cyberpunk 2077 1.0
3840x2160 Ultra Preset
Durchschnittliche NVIDIA GeForce RTX 3090
  (41.5 - 45.3, n=2)
43.4 fps +25%
Nvidia GeForce RTX 3090 Founders Edition
NVIDIA GeForce RTX 3090, R9 5900X
41.5 fps +19%
Durchschnittliche NVIDIA GeForce RTX 3080
 
38.9 fps +12%
AMD Radeon RX 6900 XT
AMD Radeon RX 6900 XT, R9 5950X
34.8 (19.4min, 22.8P0.1, 29.7P1 - 177max) fps
Durchschnittliche NVIDIA GeForce RTX 2080 Ti (Desktop)
 
32.2 fps -7%
AMD Ryzen 9 5900X
NVIDIA Titan RTX, R9 5900X
30.9 fps -11%
Durchschnittliche NVIDIA Titan RTX
 
30.9 fps -11%
Durchschnittliche NVIDIA GeForce RTX 3070
  (26.6 - 27.9, n=2)
27.3 fps -22%
Durchschnittliche NVIDIA GeForce RTX 2080 Super (Desktop)
 
24.1 fps -31%
Durchschnittliche NVIDIA GeForce RTX 2070 Super (Desktop)
 
21.5 fps -38%
Durchschnittliche AMD Radeon RX 5700 XT (Desktop)
 
16.5 fps -53%
2560x1440 Ultra Preset
Durchschnittliche NVIDIA GeForce RTX 3090
  (78.1 - 85.3, n=2)
81.7 fps +13%
Nvidia GeForce RTX 3090 Founders Edition
NVIDIA GeForce RTX 3090, R9 5900X
78.1 fps +8%
Durchschnittliche NVIDIA GeForce RTX 3080
 
72.5 fps 0%
AMD Radeon RX 6900 XT
AMD Radeon RX 6900 XT, R9 5950X
72.3 (21min, 36.7P0.1, 58.6P1 - 231max) fps
Durchschnittliche NVIDIA GeForce RTX 2080 Ti (Desktop)
 
64 fps -11%
AMD Ryzen 9 5900X
NVIDIA Titan RTX, R9 5900X
58.4 fps -19%
Durchschnittliche NVIDIA Titan RTX
 
58.4 fps -19%
Durchschnittliche NVIDIA GeForce RTX 3070
  (53.7 - 54.8, n=2)
54.3 fps -25%
Durchschnittliche NVIDIA GeForce RTX 2080 Super (Desktop)
 
49.1 fps -32%
Durchschnittliche NVIDIA GeForce RTX 2070 Super (Desktop)
 
43.7 fps -40%
Durchschnittliche AMD Radeon RX 5700 XT (Desktop)
 
36.9 fps -49%
1920x1080 Ultra Preset
Nvidia GeForce RTX 3090 Founders Edition
NVIDIA GeForce RTX 3090, R9 5900X
109.7 fps +3%
Durchschnittliche NVIDIA GeForce RTX 3090
  (108 - 109.7, n=2)
108.9 fps +3%
AMD Radeon RX 6900 XT
AMD Radeon RX 6900 XT, R9 5950X
106 (23.2min, 48.3P0.1, 76.1P1 - 189max) fps
Durchschnittliche NVIDIA GeForce RTX 3080
 
103 fps -3%
Durchschnittliche NVIDIA GeForce RTX 2080 Ti (Desktop)
 
95.4 fps -10%
AMD Ryzen 9 5900X
NVIDIA Titan RTX, R9 5900X
82.3 fps -22%
Durchschnittliche NVIDIA Titan RTX
 
82.3 fps -22%
Durchschnittliche NVIDIA GeForce RTX 3070
  (80.6 - 81, n=2)
80.8 fps -24%
Durchschnittliche NVIDIA GeForce RTX 2080 Super (Desktop)
 
72.1 fps -32%
Durchschnittliche NVIDIA GeForce RTX 2070 Super (Desktop)
 
65.4 fps -38%
Durchschnittliche AMD Radeon RX 5700 XT (Desktop)
 
58.9 fps -44%
Call of Duty Black Ops Cold War
1920x1080 Highest Settings + Ultra Ray Tracing
AMD Ryzen 9 5900X
NVIDIA Titan RTX, R9 5900X
119 fps +71%
Durchschnittliche NVIDIA Titan RTX
 
119 fps +71%
Nvidia GeForce RTX 3090 Founders Edition
NVIDIA GeForce RTX 3090, R9 5900X
89 fps +28%
Durchschnittliche NVIDIA GeForce RTX 3090
  (88.3 - 89, n=2)
88.7 fps +28%
Durchschnittliche NVIDIA GeForce RTX 3080
 
81.9 fps +18%
Durchschnittliche NVIDIA GeForce RTX 2080 Ti (Desktop)
 
77.2 fps +11%
AMD Radeon RX 6900 XT
AMD Radeon RX 6900 XT, R9 5950X
69.5 (40.4min, 48.2P0.1, 54.5P1 - 302max) fps
MSI GeForce RTX 3070 Gaming X Trio
NVIDIA GeForce RTX 3070, R9 5900X
68.5 (19.1min, 22.3P0.1, 30.4P1 - 229max) fps -1%
Durchschnittliche NVIDIA GeForce RTX 3070
  (49.8 - 70.1, n=3)
62.8 fps -10%
Durchschnittliche NVIDIA GeForce RTX 2080 Super (Desktop)
 
59 fps -15%
Durchschnittliche NVIDIA GeForce RTX 2070 Super (Desktop)
 
55.6 fps -20%
AMD Radeon RX 6800 XT
AMD Radeon RX 6800 XT, R9 5950X
21.8 (8.8min, 9.61P0.1, 16.2P1 - 49.5max) fps -69%
3840x2160 Highest Settings
Durchschnittliche NVIDIA GeForce RTX 3090
  (74.6 - 76.1, n=2)
75.4 fps +11%
Nvidia GeForce RTX 3090 Founders Edition
NVIDIA GeForce RTX 3090, R9 5900X
74.6 fps +10%
MSI GeForce RTX 3070 Gaming X Trio
NVIDIA GeForce RTX 3070, R9 5900X
74 (32.6min, 43.5P0.1, 50.6P1 - 270max) fps +9%
AMD Radeon RX 6900 XT
AMD Radeon RX 6900 XT, R9 5950X
68.1 (42.2min, 50.7P0.1, 56.8P1 - 172max) fps
Durchschnittliche NVIDIA GeForce RTX 3080
 
65.6 fps -4%
AMD Radeon RX 6800 XT
AMD Radeon RX 6800 XT, R9 5950X
64 (10.8min, 11.6P0.1, 50.8P1 - 159max) fps -6%
Durchschnittliche NVIDIA GeForce RTX 3070
  (43.8 - 74, n=3)
56 fps -18%
Durchschnittliche NVIDIA GeForce RTX 2080 Ti (Desktop)
 
54.4 fps -20%
AMD Ryzen 9 5900X
NVIDIA Titan RTX, R9 5900X
52.9 fps -22%
Durchschnittliche NVIDIA Titan RTX
 
52.9 fps -22%
Durchschnittliche NVIDIA GeForce RTX 2080 Super (Desktop)
  (38 - 44.5, n=2)
41.3 fps -39%
Durchschnittliche NVIDIA GeForce RTX 2070 Super (Desktop)
 
37.6 fps -45%
Durchschnittliche AMD Radeon RX 5700 XT (Desktop)
 
33.3 fps -51%
2560x1440 Highest Settings
Nvidia GeForce RTX 3090 Founders Edition
NVIDIA GeForce RTX 3090, R9 5900X
124.7 fps +8%
Durchschnittliche NVIDIA GeForce RTX 3090
  (122 - 124.7, n=2)
123.4 fps +7%
AMD Radeon RX 6900 XT
AMD Radeon RX 6900 XT, R9 5950X
115 (54.9min, 82.8P0.1, 92.3P1 - 314max) fps
MSI GeForce RTX 3070 Gaming X Trio
NVIDIA GeForce RTX 3070, R9 5900X
107 (43.6min, 54P0.1, 62.7P1 - 272max) fps -7%
Durchschnittliche NVIDIA GeForce RTX 3080
 
104 fps -10%
Durchschnittliche NVIDIA GeForce RTX 3070
  (83 - 107, n=3)
93.2 fps -19%
Durchschnittliche NVIDIA GeForce RTX 2080 Ti (Desktop)
 
89.2 fps -22%
AMD Ryzen 9 5900X
NVIDIA Titan RTX, R9 5900X
87.6 fps -24%
Durchschnittliche NVIDIA Titan RTX
 
87.6 fps -24%
AMD Radeon RX 6800 XT
AMD Radeon RX 6800 XT, R9 5950X
80.4 (16.5min, 31.8P0.1, 64.3P1 - 285max) fps -30%
Durchschnittliche NVIDIA GeForce RTX 2070 Super (Desktop)
 
67.7 fps -41%
Durchschnittliche NVIDIA GeForce RTX 2080 Super (Desktop)
  (51 - 77.6, n=2)
64.3 fps -44%
Durchschnittliche AMD Radeon RX 5700 XT (Desktop)
 
59.6 fps -48%
1920x1080 Highest Settings
Nvidia GeForce RTX 3090 Founders Edition
NVIDIA GeForce RTX 3090, R9 5900X
161.1 fps +5%
Durchschnittliche NVIDIA GeForce RTX 3090
  (161 - 161.1, n=2)
161.1 fps +5%
AMD Radeon RX 6900 XT
AMD Radeon RX 6900 XT, R9 5950X
153 (60.9min, 98.1P0.1, 117P1 - 437max) fps
AMD Ryzen 9 5900X
NVIDIA Titan RTX, R9 5900X
144 fps -6%
AMD Radeon RX 6800 XT
AMD Radeon RX 6800 XT, R9 5950X
144 (58.7min, 90.7P0.1, 105P1 - 365max) fps -6%
Durchschnittliche NVIDIA Titan RTX
 
144 fps -6%
Durchschnittliche NVIDIA GeForce RTX 3080
 
127 fps -17%
MSI GeForce RTX 3070 Gaming X Trio
NVIDIA GeForce RTX 3070, R9 5900X
122 (45min, 57.3P0.1, 67.9P1 - 301max) fps -20%
Durchschnittliche NVIDIA GeForce RTX 2080 Ti (Desktop)
 
118 fps -23%
Durchschnittliche NVIDIA GeForce RTX 3070
  (95.7 - 122, n=3)
112.6 fps -26%
Durchschnittliche NVIDIA GeForce RTX 2070 Super (Desktop)
 
92.7 fps -39%
Durchschnittliche NVIDIA GeForce RTX 2080 Super (Desktop)
  (59 - 106, n=2)
82.5 fps -46%
Durchschnittliche AMD Radeon RX 5700 XT (Desktop)
 
81.3 fps -47%
Metro Exodus
1920x1080 Ultra Quality DXR AF:16x
Durchschnittliche NVIDIA GeForce RTX 3090
  (68.6 - 122.2, n=12)
111.4 fps +23%
Durchschnittliche NVIDIA GeForce RTX 3080
  (91.5 - 102, n=2)
96.8 fps +7%
ASUS GeForce RTX 3080 ROG STRIX OC GAMING
NVIDIA GeForce RTX 3080, R9 5900X
91.5 (51.03min - 134.52max) fps +1%
AMD Radeon RX 6900 XT
AMD Radeon RX 6900 XT, R9 5950X
90.5 (55.53min - 126.79max) fps
AMD Ryzen 9 5900X
NVIDIA Titan RTX, R9 5900X
87.9 (49.32min - 136.76max) fps -3%
Durchschnittliche NVIDIA Titan RTX
  (69 - 95.5, n=23)
86.1 fps -5%
AMD Radeon RX 6800 XT
AMD Radeon RX 6800 XT, R9 5950X
85.5 (52.71min - 120.38max) fps -6%
Durchschnittliche NVIDIA GeForce RTX 2080 Ti (Desktop)
  (78.6 - 84.9, n=3)
81.8 fps -10%
Durchschnittliche NVIDIA GeForce RTX 3070
  (80.4 - 83, n=5)
81.6 fps -10%
MSI GeForce RTX 3070 Gaming X Trio
NVIDIA GeForce RTX 3070, R9 5900X
80.4 (43.5min - 124.3max) fps -11%
KFA2 GeForce RTX 2080 Ti EX
NVIDIA GeForce RTX 2080 Ti (Desktop), R9 3900X
78.6 (43min - 115max) fps -13%
Nvidia GeForce RTX 3090 Founders Edition
NVIDIA GeForce RTX 3090, R9 5900X
68.6 (37.68min - 117.88max) fps -24%
Nvidia GeForce RTX 2080 Super
NVIDIA GeForce RTX 2080 Super (Desktop), R7 2700X
65 (37.62min - 97.62max) fps -28%
Durchschnittliche NVIDIA GeForce RTX 2080 Super (Desktop)
 
65 fps -28%
Durchschnittliche NVIDIA GeForce RTX 2070 Super (Desktop)
  (56.3 - 62.1, n=4)
58.5 fps -35%
Nvidia GeForce RTX 2070 Super
NVIDIA GeForce RTX 2070 Super (Desktop), R7 2700X
57.5 (34min - 85max) fps -36%
3840x2160 Ultra Quality AF:16x
Durchschnittliche NVIDIA GeForce RTX 3090
  (70.6 - 77.3, n=12)
75 fps +12%
Nvidia GeForce RTX 3090 Founders Edition
NVIDIA GeForce RTX 3090, R9 5900X
70.6 (41.43min - 118.98max) fps +6%
AMD Radeon RX 6900 XT
AMD Radeon RX 6900 XT, R9 5950X
66.7 (42.71min - 92.25max) fps
Durchschnittliche NVIDIA GeForce RTX 3080
  (64.1 - 65.9, n=2)
65 fps -3%
ASUS GeForce RTX 3080 ROG STRIX OC GAMING
NVIDIA GeForce RTX 3080, R9 5900X
64.1 (36.54min - 108.57max) fps -4%
AMD Radeon RX 6800 XT
AMD Radeon RX 6800 XT, R9 5950X
56.3 (40.14min - 64.28max) fps -16%
AMD Ryzen 9 5900X
NVIDIA Titan RTX, R9 5900X
54.9 (34.88min - 89.73max) fps -18%
Durchschnittliche NVIDIA Titan RTX
  (51.3 - 57.9, n=27)
54.9 fps -18%
Durchschnittliche NVIDIA GeForce RTX 2080 Ti (Desktop)
  (47.5 - 51, n=3)
49.7 fps -25%
MSI GeForce RTX 3070 Gaming X Trio
NVIDIA GeForce RTX 3070, R9 5900X
49.1 (30.24min - 89.89max) fps -26%
Durchschnittliche NVIDIA GeForce RTX 3070
  (48.3 - 49.7, n=5)
48.9 fps -27%
KFA2 GeForce RTX 2080 Ti EX
NVIDIA GeForce RTX 2080 Ti (Desktop), R9 3900X
47.5 (31min - 69max) fps -29%
Durchschnittliche NVIDIA GeForce RTX 2080 Super (Desktop)
  (40 - 40.4, n=2)
40.2 fps -40%
Nvidia GeForce RTX 2080 Super
NVIDIA GeForce RTX 2080 Super (Desktop), R7 2700X
40 (25.84min - 59.35max) fps -40%
Durchschnittliche NVIDIA GeForce RTX 2070 Super (Desktop)
  (35 - 38.1, n=5)
36.8 fps -45%
Nvidia GeForce RTX 2070 Super
NVIDIA GeForce RTX 2070 Super (Desktop), R7 2700X
35 (23min - 51max) fps -48%
Durchschnittliche AMD Radeon RX 5700 XT (Desktop)
  (29.6 - 35.7, n=3)
33.6 fps -50%
AMD Radeon RX 5700 XT
AMD Radeon RX 5700 XT (Desktop), R7 2700X
29.6 (20.7min - 36.64max) fps -56%
AMD Radeon RX 5700
AMD Radeon RX 5700 (Desktop), R7 2700X
28.6 (19.67min - 36.24max) fps -57%
2560x1440 Ultra Quality AF:16x
Durchschnittliche NVIDIA GeForce RTX 3090
  (102 - 118.2, n=12)
113.2 fps +11%
Nvidia GeForce RTX 3090 Founders Edition
NVIDIA GeForce RTX 3090, R9 5900X
106 (54.88min - 173.25max) fps +4%
AMD Radeon RX 6900 XT
AMD Radeon RX 6900 XT, R9 5950X
102 (59.52min - 156.84max) fps
Durchschnittliche NVIDIA GeForce RTX 3080
  (92.2 - 97.4, n=2)
94.8 fps -7%
AMD Radeon RX 6800 XT
AMD Radeon RX 6800 XT, R9 5950X
94.6 (55.44min - 143.68max) fps -7%
ASUS GeForce RTX 3080 ROG STRIX OC GAMING
NVIDIA GeForce RTX 3080, R9 5900X
92.2 (46.62min - 155.93max) fps -10%
AMD Ryzen 9 5900X
NVIDIA Titan RTX, R9 5900X
84.9 (46.03min - 152.65max) fps -17%
Durchschnittliche NVIDIA Titan RTX
  (69 - 92.9, n=26)
84 fps -18%
Durchschnittliche NVIDIA GeForce RTX 3070
  (74.4 - 78.3, n=5)
75.8 fps -26%
Durchschnittliche NVIDIA GeForce RTX 2080 Ti (Desktop)
  (71.9 - 77.9, n=3)
75.3 fps -26%
MSI GeForce RTX 3070 Gaming X Trio
NVIDIA GeForce RTX 3070, R9 5900X
74.4 (38.95min - 129.85max) fps -27%
KFA2 GeForce RTX 2080 Ti EX
NVIDIA GeForce RTX 2080 Ti (Desktop), R9 3900X
71.9 (40min - 108max) fps -30%
Durchschnittliche NVIDIA GeForce RTX 2080 Super (Desktop)
  (61 - 65, n=2)
63 fps -38%
Nvidia GeForce RTX 2080 Super
NVIDIA GeForce RTX 2080 Super (Desktop), R7 2700X
61 (35.51min - 95.82max) fps -40%
Durchschnittliche NVIDIA GeForce RTX 2070 Super (Desktop)
  (54.3 - 61.9, n=5)
57.6 fps -44%
Durchschnittliche AMD Radeon RX 5700 XT (Desktop)
  (54.5 - 57.7, n=3)
56.4 fps -45%
AMD Radeon RX 5700 XT
AMD Radeon RX 5700 XT (Desktop), R7 2700X
54.5 (31.85min - 78.06max) fps -47%
Nvidia GeForce RTX 2070 Super
NVIDIA GeForce RTX 2070 Super (Desktop), R7 2700X
54.3 (32min - 83max) fps -47%
AMD Radeon RX 5700
AMD Radeon RX 5700 (Desktop), R7 2700X
48.4 (28.7min - 68.51max) fps -53%
1920x1080 Ultra Quality AF:16x
Durchschnittliche NVIDIA GeForce RTX 3090
  (108 - 145, n=12)
135.3 fps +10%
Nvidia GeForce RTX 3090 Founders Edition
NVIDIA GeForce RTX 3090, R9 5900X
124 (65.58min - 188.71max) fps +1%
AMD Radeon RX 6900 XT
AMD Radeon RX 6900 XT, R9 5950X
123 (67.67min - 199.52max) fps
AMD Radeon RX 6800 XT
AMD Radeon RX 6800 XT, R9 5950X
115 (64.52min - 181.92max) fps -7%
Durchschnittliche NVIDIA GeForce RTX 3080
  (111 - 116, n=2)
113.5 fps -8%
ASUS GeForce RTX 3080 ROG STRIX OC GAMING
NVIDIA GeForce RTX 3080, R9 5900X
111 (57.16min - 183.25max) fps -10%
AMD Ryzen 9 5900X
NVIDIA Titan RTX, R9 5900X
106 (52.66min - 176.55max) fps -14%
Durchschnittliche NVIDIA Titan RTX
  (73 - 116, n=27)
102.2 fps -17%
Durchschnittliche NVIDIA GeForce RTX 3070
  (91.3 - 97.7, n=5)
93.9 fps -24%
Durchschnittliche NVIDIA GeForce RTX 2080 Ti (Desktop)
  (89.7 - 98.6, n=3)
93.8 fps -24%
MSI GeForce RTX 3070 Gaming X Trio
NVIDIA GeForce RTX 3070, R9 5900X
91.3 (46.36min - 152.74max) fps -26%
KFA2 GeForce RTX 2080 Ti EX
NVIDIA GeForce RTX 2080 Ti (Desktop), R9 3900X
89.7 (46min - 140max) fps -27%
Durchschnittliche NVIDIA GeForce RTX 2080 Super (Desktop)
  (76 - 82, n=2)
79 fps -36%
Nvidia GeForce RTX 2080 Super
NVIDIA GeForce RTX 2080 Super (Desktop), R7 2700X
76 (38.54min - 122.4max) fps -38%
Durchschnittliche NVIDIA GeForce RTX 2070 Super (Desktop)
  (67.8 - 79.1, n=5)
72.3 fps -41%
Durchschnittliche AMD Radeon RX 5700 XT (Desktop)
  (61 - 73.8, n=3)
69.3 fps -44%
Nvidia GeForce RTX 2070 Super
NVIDIA GeForce RTX 2070 Super (Desktop), R7 2700X
67.8 (36min - 110max) fps -45%
AMD Radeon RX 5700 XT
AMD Radeon RX 5700 XT (Desktop), R7 2700X
61 (36.09min - 86.1max) fps -50%
AMD Radeon RX 5700
AMD Radeon RX 5700 (Desktop), R7 2700X
58.6 (32.67min - 85.8max) fps -52%

AMD Smart Access Memory

Einstellungen zum Resizable BAR auf dem Mainboard MSI Prestige X570 Creation

Mit Smart Access Memory (SAM) bezeichnet AMD hochtrabenden das größenveränderbare Base Address Register (BAR), einer PCIe-Specifikation die es der CPU erlaubt den kompletten GPU-VRAM allzeit zu nutzen (ursprünglich begrenzt auf 256 MB zwecks Kompatibilität mit einem 32-Bit OS). Zwar haben alle RDNA-2-GPUs SAM per se integriert, für die Verwendung müssen die GPUs aber mit einer Ryzen-5000-CPU und einem Motherboard mit einem B550- oder X570-Chipsatz kombiniert werden (Ryzen-3000-CPUs werden auf diesen Mainboards mittlerweile auch unterstützt). Unter Umständen ist auch ein BIOS-Update (AGESA 1.1.0.0 oder neuer) des Mainboardherstellers vonnöten, um die Funktion zu aktivieren. 

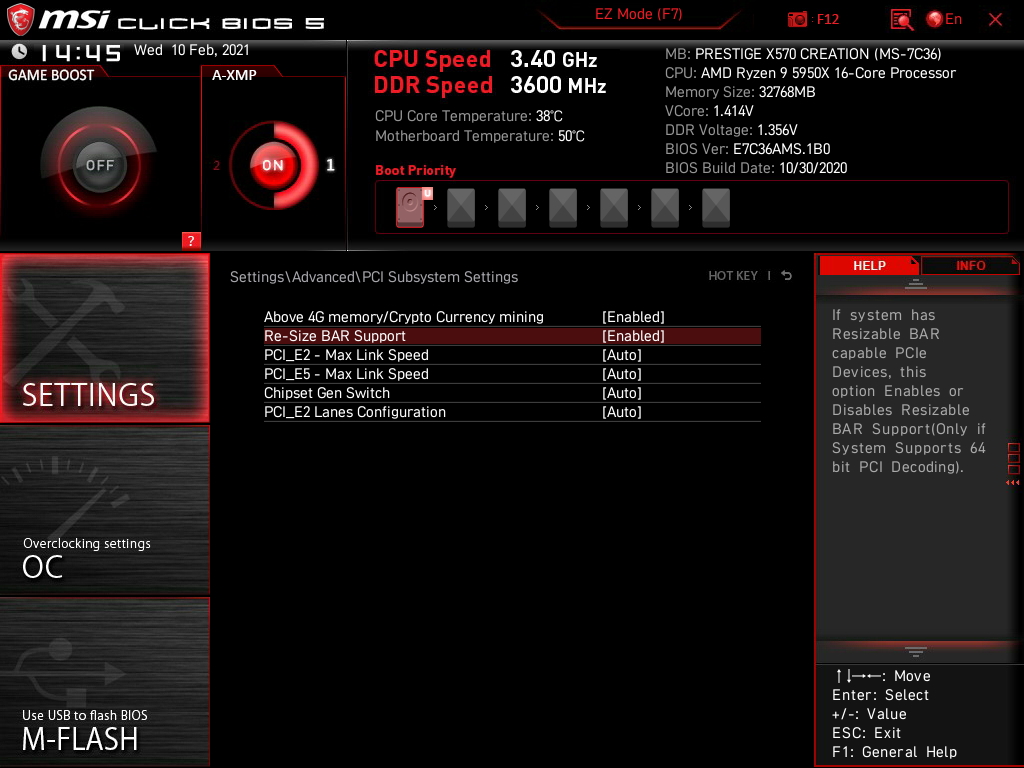
Um SAM zu aktivieren geht man in das BIOS und aktiviert dort jeweils "Above 4G Memory/Crypto Currency Mining" und "Re-Size BAR Support" unter den PCIe-Untereinstellungen. Leider gibt es keine Möglichkeit den SAM-Status über den Treiber zu überprüfen.

Während sich AMD während der großen Navi Launch Keynote ziemlich begeistert über SAM gegeben hat, sind die realen Performancegewinne beim Gaming, wenn überhaupt, momentan nur bei einer Handvoll Spiele spürbar. In unseren Tests war SAM für minimal höhere FPS in den Titeln Borderlands 3 und Shadow of the Tomb Raider (QHD Ultra und 4K Ultra) verantwortlich.

Zusätzliche sorgte SAM für +18 Prozent unter 1080p Ultra, +13 Prozent unter 1440p Ultra und +8 Prozent Gewinn unter 4K Ultra in Assassin's Creed Valhalla. In Forza Horizon 4 machte SAM bei 1080p Ultra keinen Unterschied, dafür aber +11 Prozent und +13 Prozent Gewinn in 1440p Ultra und 4K Ultra. In F1 2020 gab es bei 1080p Ultra nur minimale Steigerungen. Games wie Control, Hitman 3 und Watch Dogs Legion zeigten keine Performanceverbesserungen oder -veränderungen durch aktiviertes SAM.

Da mittlerweile alle neuen GPUs und Motherboards das Resizable BAR beherrschen, dürften in Zukunft auch mehr Spiele mit dem Feature erscheinen.

Borderlands 3
3840x2160 Badass Overall Quality (DX11)
Durchschnittliche NVIDIA GeForce RTX 3090
  (68 - 75.3, n=12)
72.8 fps +22%
Nvidia GeForce RTX 3090 Founders Edition
NVIDIA GeForce RTX 3090, R9 5900X
68 fps +14%
Durchschnittliche NVIDIA GeForce RTX 3080
  (61.5 - 61.9, n=2)
61.7 fps +3%
ASUS GeForce RTX 3080 ROG STRIX OC GAMING
NVIDIA GeForce RTX 3080, R9 5900X
61.5 fps +3%
AMD Radeon RX 6900 XT
AMD Radeon RX 6900 XT, R9 5950X (SAM ENABLED)
59.8 fps
AMD Radeon RX 6900 XT
AMD Radeon RX 6900 XT, R9 5950X
57.1 fps -5%
AMD Radeon RX 6800 XT
AMD Radeon RX 6800 XT, R9 5950X
53.6 fps -10%
Durchschnittliche NVIDIA Titan RTX
  (46 - 52.8, n=29)
47.3 fps -21%
AMD Ryzen 9 5900X
NVIDIA Titan RTX, R9 5900X
46.7 fps -22%
Durchschnittliche NVIDIA GeForce RTX 2080 Ti (Desktop)
  (43.6 - 47, n=2)
45.3 fps -24%
Durchschnittliche NVIDIA GeForce RTX 3070
  (42.7 - 46.3, n=5)
44.3 fps -26%
MSI GeForce RTX 3070 Gaming X Trio
NVIDIA GeForce RTX 3070, R9 5900X
44.2 fps -26%
KFA2 GeForce RTX 2080 Ti EX
NVIDIA GeForce RTX 2080 Ti (Desktop), R9 3900X
43.6 fps -27%
Durchschnittliche NVIDIA GeForce RTX 2080 Super (Desktop)
 
35.9 fps -40%
Durchschnittliche NVIDIA GeForce RTX 2070 Super (Desktop)
  (29.5 - 32.7, n=5)
31.3 fps -48%
Durchschnittliche AMD Radeon RX 5700 XT (Desktop)
  (28.1 - 30.5, n=3)
29.6 fps -51%
2560x1440 Badass Overall Quality (DX11)
Durchschnittliche NVIDIA GeForce RTX 3090
  (105 - 131.6, n=12)
123.2 fps +15%
AMD Radeon RX 6900 XT
AMD Radeon RX 6900 XT, R9 5950X (SAM ENABLED)
107 fps
AMD Radeon RX 6900 XT
AMD Radeon RX 6900 XT, R9 5950X
105 fps -2%
Nvidia GeForce RTX 3090 Founders Edition
NVIDIA GeForce RTX 3090, R9 5900X
105 fps -2%
ASUS GeForce RTX 3080 ROG STRIX OC GAMING
NVIDIA GeForce RTX 3080, R9 5900X
103 fps -4%
Durchschnittliche NVIDIA GeForce RTX 3080
  (95.7 - 103, n=2)
99.4 fps -7%
AMD Radeon RX 6800 XT
AMD Radeon RX 6800 XT, R9 5950X
93.6 fps -13%
AMD Ryzen 9 5900X
NVIDIA Titan RTX, R9 5900X
84.7 fps -21%
Durchschnittliche NVIDIA Titan RTX
  (74 - 93.1, n=29)
84.7 fps -21%
Durchschnittliche NVIDIA GeForce RTX 2080 Ti (Desktop)
  (78 - 83, n=2)
80.5 fps -25%
KFA2 GeForce RTX 2080 Ti EX
NVIDIA GeForce RTX 2080 Ti (Desktop), R9 3900X
78 fps -27%
Durchschnittliche NVIDIA GeForce RTX 3070
  (75.1 - 82.9, n=5)
77.7 fps -27%
MSI GeForce RTX 3070 Gaming X Trio
NVIDIA GeForce RTX 3070, R9 5900X
75.9 fps -29%
Durchschnittliche NVIDIA GeForce RTX 2080 Super (Desktop)
 
65.5 fps -39%
Durchschnittliche NVIDIA GeForce RTX 2070 Super (Desktop)
  (53.7 - 60.3, n=5)
57.3 fps -46%
Durchschnittliche AMD Radeon RX 5700 XT (Desktop)
  (51.1 - 56.1, n=3)
54.3 fps -49%
1920x1080 Badass Overall Quality (DX11)
Durchschnittliche NVIDIA GeForce RTX 3090
  (117 - 165, n=12)
149.1 fps +14%
AMD Radeon RX 6900 XT
AMD Radeon RX 6900 XT, R9 5950X (SAM ENABLED)
131 fps
AMD Radeon RX 6900 XT
AMD Radeon RX 6900 XT, R9 5950X
130 fps -1%
ASUS GeForce RTX 3080 ROG STRIX OC GAMING
NVIDIA GeForce RTX 3080, R9 5900X
128 fps -2%
Durchschnittliche NVIDIA GeForce RTX 3080
  (117 - 128, n=2)
122.5 fps -6%
AMD Radeon RX 6800 XT
AMD Radeon RX 6800 XT, R9 5950X
120 fps -8%
Nvidia GeForce RTX 3090 Founders Edition
NVIDIA GeForce RTX 3090, R9 5900X
119 fps -9%
AMD Ryzen 9 5900X
NVIDIA Titan RTX, R9 5900X
118 fps -10%
Durchschnittliche NVIDIA Titan RTX
  (77.2 - 128.7, n=29)
112 fps -15%
Durchschnittliche NVIDIA GeForce RTX 2080 Ti (Desktop)
  (101.3 - 109, n=2)
105.2 fps -20%
KFA2 GeForce RTX 2080 Ti EX
NVIDIA GeForce RTX 2080 Ti (Desktop), R9 3900X
101.3 fps -23%
Durchschnittliche NVIDIA GeForce RTX 3070
  (95.3 - 108.9, n=5)
100.6 fps -23%
MSI GeForce RTX 3070 Gaming X Trio
NVIDIA GeForce RTX 3070, R9 5900X
95.8 fps -27%
Durchschnittliche NVIDIA GeForce RTX 2080 Super (Desktop)
 
91 fps -31%
Durchschnittliche NVIDIA GeForce RTX 2070 Super (Desktop)
  (74.3 - 86, n=5)
80.9 fps -38%
Durchschnittliche AMD Radeon RX 5700 XT (Desktop)
  (71.7 - 79.1, n=3)
76.6 fps -42%
Control
1920x1080 High Quality Preset & High Ray Tracing Preset (DX12)
Durchschnittliche NVIDIA GeForce RTX 3090
  (91.4 - 120.4, n=4)
108.2 fps +42%
Nvidia GeForce RTX 3090 Founders Edition
NVIDIA GeForce RTX 3090, R9 5900X
106.9 fps +40%
ASUS GeForce RTX 3080 ROG STRIX OC GAMING
NVIDIA GeForce RTX 3080, R9 5900X
103 (94min - 116max) fps +35%
Durchschnittliche NVIDIA GeForce RTX 3080
  (98.1 - 103, n=2)
100.6 fps +32%
Durchschnittliche NVIDIA Titan RTX
  (63 - 120, n=3)
88.1 fps +16%
AMD Radeon RX 6900 XT
AMD Radeon RX 6900 XT, R9 5950X (SAM ENABLED)
76.2 (38.7min, 43.3P0.1, 62.8P1 - 142max) fps
AMD Radeon RX 6900 XT
AMD Radeon RX 6900 XT, R9 5950X
73.1 (31.6min, 40.9P0.1, 62.6P1 - 149max) fps -4%
Durchschnittliche NVIDIA GeForce RTX 2080 Ti (Desktop)
  (72 - 76, n=2)
74 fps -3%
KFA2 GeForce RTX 2080 Ti EX
NVIDIA GeForce RTX 2080 Ti (Desktop), R9 3900X
72 (67min - 80max) fps -6%
Durchschnittliche NVIDIA GeForce RTX 3070
  (57.9 - 75.1, n=3)
68.5 fps -10%
AMD Radeon RX 6800 XT
AMD Radeon RX 6800 XT, R9 5950X
66.9 (60min - 75max) fps -12%
MSI GeForce RTX 3070 Gaming X Trio
NVIDIA GeForce RTX 3070, R9 5900X
57.9 (29min - 79max) fps -24%
Durchschnittliche NVIDIA GeForce RTX 2080 Super (Desktop)
 
53.2 fps -30%
Durchschnittliche NVIDIA GeForce RTX 2070 Super (Desktop)
  (51.1 - 54.2, n=4)
52.7 fps -31%
3840x2160 High Quality Preset (DX11)
Durchschnittliche NVIDIA GeForce RTX 3090
  (61.3 - 66, n=4)
63 fps +15%
Nvidia GeForce RTX 3090 Founders Edition
NVIDIA GeForce RTX 3090, R9 5900X
61.3 fps +12%
Durchschnittliche NVIDIA GeForce RTX 3080
  (56.2 - 56.7, n=2)
56.5 fps +3%
ASUS GeForce RTX 3080 ROG STRIX OC GAMING
NVIDIA GeForce RTX 3080, R9 5900X
56.2 (49min - 64max) fps +3%
AMD Radeon RX 6900 XT
AMD Radeon RX 6900 XT, R9 5950X
54.7 (39.8min, 41.7P0.1, 44.9P1 - 65.8max) fps
AMD Radeon RX 6900 XT
AMD Radeon RX 6900 XT, R9 5950X (SAM ENABLED)
53.9 (36.6min, 41.7P0.1, 43.5P1 - 64.9max) fps -1%
AMD Radeon RX 6800 XT
AMD Radeon RX 6800 XT, R9 5950X
51.6 (46min - 58max) fps -6%
Durchschnittliche NVIDIA Titan RTX
  (45.2 - 47.3, n=3)
46.5 fps -15%
Durchschnittliche NVIDIA GeForce RTX 2080 Ti (Desktop)
  (42.6 - 45.8, n=2)
44.2 fps -19%
KFA2 GeForce RTX 2080 Ti EX
NVIDIA GeForce RTX 2080 Ti (Desktop), R9 3900X
42.6 (37min - 49max) fps -22%
MSI GeForce RTX 3070 Gaming X Trio
NVIDIA GeForce RTX 3070, R9 5900X
42.3 (37min - 49max) fps -23%
Durchschnittliche NVIDIA GeForce RTX 3070
  (40.6 - 42.3, n=3)
41.3 fps -24%
Durchschnittliche AMD Radeon RX 5700 XT (Desktop)
  (26.3 - 55.2, n=2)
40.8 fps -25%
Durchschnittliche NVIDIA GeForce RTX 2080 Super (Desktop)
 
30.4 fps -44%
Durchschnittliche NVIDIA GeForce RTX 2070 Super (Desktop)
  (29.2 - 30.7, n=4)
30.1 fps -45%
2560x1440 High Quality Preset (DX11)
Durchschnittliche NVIDIA GeForce RTX 3090
  (115.8 - 123.7, n=4)
120.1 fps +6%
Nvidia GeForce RTX 3090 Founders Edition
NVIDIA GeForce RTX 3090, R9 5900X
115.8 fps +2%
AMD Radeon RX 6900 XT
AMD Radeon RX 6900 XT, R9 5950X
113 (71.5min, 73.2P0.1, 79.6P1 - 164max) fps
AMD Radeon RX 6900 XT
AMD Radeon RX 6900 XT, R9 5950X (SAM ENABLED)
113 (68min, 71.3P0.1, 81.1P1 - 193max) fps 0%
AMD Radeon RX 6800 XT
AMD Radeon RX 6800 XT, R9 5950X
108 (93min - 123max) fps -4%
ASUS GeForce RTX 3080 ROG STRIX OC GAMING
NVIDIA GeForce RTX 3080, R9 5900X
106 (92min - 123max) fps -6%
Durchschnittliche NVIDIA GeForce RTX 3080
  (105 - 106, n=2)
105.5 fps -7%
Durchschnittliche NVIDIA Titan RTX
  (89 - 93.6, n=3)
91.5 fps -19%
Durchschnittliche NVIDIA GeForce RTX 2080 Ti (Desktop)
  (84 - 89, n=2)
86.5 fps -23%
KFA2 GeForce RTX 2080 Ti EX
NVIDIA GeForce RTX 2080 Ti (Desktop), R9 3900X
84 (75min - 95max) fps -26%
MSI GeForce RTX 3070 Gaming X Trio
NVIDIA GeForce RTX 3070, R9 5900X
82.5 (72min - 96max) fps -27%
Durchschnittliche NVIDIA GeForce RTX 3070
  (79.8 - 82.5, n=3)
81.2 fps -28%
Durchschnittliche AMD Radeon RX 5700 XT (Desktop)
  (53.4 - 91, n=2)
72.2 fps -36%
Durchschnittliche NVIDIA GeForce RTX 2080 Super (Desktop)
 
62 fps -45%
Durchschnittliche NVIDIA GeForce RTX 2070 Super (Desktop)
  (56.9 - 62.6, n=4)
60.6 fps -46%
1920x1080 High Quality Preset (DX11)
Durchschnittliche NVIDIA GeForce RTX 3090
  (172.2 - 189.2, n=4)
178.1 fps +2%
AMD Radeon RX 6900 XT
AMD Radeon RX 6900 XT, R9 5950X
175 (56.8min, 96P0.1, 112P1 - 314max) fps
AMD Radeon RX 6900 XT
AMD Radeon RX 6900 XT, R9 5950X (SAM ENABLED)
174 (54min, 99P0.1, 112P1 - 335max) fps -1%
Nvidia GeForce RTX 3090 Founders Edition
NVIDIA GeForce RTX 3090, R9 5900X
172.2 fps -2%
AMD Radeon RX 6800 XT
AMD Radeon RX 6800 XT, R9 5950X
168 (145min - 194max) fps -4%
ASUS GeForce RTX 3080 ROG STRIX OC GAMING
NVIDIA GeForce RTX 3080, R9 5900X
155 (133min - 178max) fps -11%
Durchschnittliche NVIDIA GeForce RTX 3080
  (151 - 155, n=2)
153 fps -13%
Durchschnittliche NVIDIA Titan RTX
  (135 - 141.9, n=3)
137.3 fps -22%
Durchschnittliche NVIDIA GeForce RTX 2080 Ti (Desktop)
  (126 - 132, n=2)
129 fps -26%
KFA2 GeForce RTX 2080 Ti EX
NVIDIA GeForce RTX 2080 Ti (Desktop), R9 3900X
126 (111min - 143max) fps -28%
MSI GeForce RTX 3070 Gaming X Trio
NVIDIA GeForce RTX 3070, R9 5900X
122 (103min - 138max) fps -30%
Durchschnittliche NVIDIA GeForce RTX 3070
  (117 - 124.9, n=3)
121.3 fps -31%
Durchschnittliche AMD Radeon RX 5700 XT (Desktop)
  (83 - 121.9, n=2)
102.5 fps -41%
Durchschnittliche NVIDIA GeForce RTX 2080 Super (Desktop)
 
95 fps -46%
Durchschnittliche NVIDIA GeForce RTX 2070 Super (Desktop)
  (88 - 97.3, n=4)
93.3 fps -47%
Assassin´s Creed Valhalla
3840x2160 Ultra High Preset
AMD Radeon RX 6900 XT
AMD Radeon RX 6900 XT, R9 5950X (SAM ENABLED)
68 (33min - 230max) fps
AMD Radeon RX 6900 XT
AMD Radeon RX 6900 XT, R9 5950X
63 (32min - 219max) fps -7%
AMD Radeon RX 6800 XT
AMD Radeon RX 6800 XT, R9 5950X
65 (33min - 179max) fps -4%
Nvidia GeForce RTX 3090 Founders Edition
NVIDIA GeForce RTX 3090, R9 5900X
57 (36min - 113max) fps -16%
Durchschnittliche NVIDIA GeForce RTX 3090
  (55 - 57, n=2)
56 fps -18%
Durchschnittliche NVIDIA GeForce RTX 3080
 
52 fps -24%
MSI GeForce RTX 3070 Gaming X Trio
NVIDIA GeForce RTX 3070, R9 5900X
47 (31min - 92max) fps -31%
Durchschnittliche NVIDIA GeForce RTX 2080 Ti (Desktop)
 
46 fps -32%
Durchschnittliche NVIDIA GeForce RTX 3070
  (42 - 47, n=3)
44 fps -35%
AMD Ryzen 9 5900X
NVIDIA Titan RTX, R9 5900X
43 fps -37%
Durchschnittliche NVIDIA Titan RTX
 
43 fps -37%
Durchschnittliche NVIDIA GeForce RTX 2080 Super (Desktop)
 
36 fps -47%
Durchschnittliche AMD Radeon RX 5700 XT (Desktop)
 
33 fps -51%
Durchschnittliche NVIDIA GeForce RTX 2070 Super (Desktop)
 
32 fps -53%
2560x1440 Ultra High Preset
AMD Radeon RX 6900 XT
AMD Radeon RX 6900 XT, R9 5950X (SAM ENABLED)
115 (41min - 242max) fps
AMD Radeon RX 6900 XT
AMD Radeon RX 6900 XT, R9 5950X
102 (40min - 239max) fps -11%
AMD Radeon RX 6800 XT
AMD Radeon RX 6800 XT, R9 5950X
98 (25min - 211max) fps -15%
Nvidia GeForce RTX 3090 Founders Edition
NVIDIA GeForce RTX 3090, R9 5900X
79 (44min - 135max) fps -31%
Durchschnittliche NVIDIA GeForce RTX 3090
  (76 - 79, n=2)
77.5 fps -33%
Durchschnittliche NVIDIA GeForce RTX 3080
 
76 fps -34%
MSI GeForce RTX 3070 Gaming X Trio
NVIDIA GeForce RTX 3070, R9 5900X
67 (39min - 124max) fps -42%
Durchschnittliche NVIDIA GeForce RTX 2080 Ti (Desktop)
 
67 fps -42%
AMD Ryzen 9 5900X
NVIDIA Titan RTX, R9 5900X
66 fps -43%
Durchschnittliche NVIDIA Titan RTX
 
66 fps -43%
Durchschnittliche NVIDIA GeForce RTX 3070
  (65 - 67, n=3)
65.7 fps -43%
Durchschnittliche AMD Radeon RX 5700 XT (Desktop)
 
59 fps -49%
Durchschnittliche NVIDIA GeForce RTX 2080 Super (Desktop)
 
57 fps -50%
Durchschnittliche NVIDIA GeForce RTX 2070 Super (Desktop)
 
53 fps -54%
1920x1080 Ultra High Preset
AMD Radeon RX 6900 XT
AMD Radeon RX 6900 XT, R9 5950X (SAM ENABLED)
148 (44min - 248max) fps
AMD Radeon RX 6900 XT
AMD Radeon RX 6900 XT, R9 5950X
125 (43min - 252max) fps -16%
AMD Radeon RX 6800 XT
AMD Radeon RX 6800 XT, R9 5950X
118 (29min - 255max) fps -20%
Nvidia GeForce RTX 3090 Founders Edition
NVIDIA GeForce RTX 3090, R9 5900X
91 (48min - 158max) fps -39%
Durchschnittliche NVIDIA GeForce RTX 3090
  (88 - 91, n=2)
89.5 fps -40%
Durchschnittliche NVIDIA GeForce RTX 3080
 
88 fps -41%
AMD Ryzen 9 5900X
NVIDIA Titan RTX, R9 5900X
80 fps -46%
Durchschnittliche NVIDIA GeForce RTX 2080 Ti (Desktop)
 
80 fps -46%
Durchschnittliche NVIDIA Titan RTX
 
80 fps -46%
Durchschnittliche NVIDIA GeForce RTX 3070
  (77 - 80, n=3)
78.3 fps -47%
MSI GeForce RTX 3070 Gaming X Trio
NVIDIA GeForce RTX 3070, R9 5900X
78 (15min - 139max) fps -47%
Durchschnittliche AMD Radeon RX 5700 XT (Desktop)
 
78 fps -47%
Durchschnittliche NVIDIA GeForce RTX 2080 Super (Desktop)
 
70 fps -53%
Durchschnittliche NVIDIA GeForce RTX 2070 Super (Desktop)
 
66 fps -55%
Shadow of the Tomb Raider
3840x2160 Highest Preset AA:T
Durchschnittliche NVIDIA GeForce RTX 3090
  (89.3 - 99.7, n=12)
96.4 fps +12%
Nvidia GeForce RTX 3090 Founders Edition
NVIDIA GeForce RTX 3090, R9 5900X
94 fps +9%
AMD Radeon RX 6900 XT
AMD Radeon RX 6900 XT, R9 5950X (SAM ENABLED)
86 fps
AMD Radeon RX 6900 XT
AMD Radeon RX 6900 XT, R9 5950X
84 fps -2%
Durchschnittliche NVIDIA GeForce RTX 3080
  (83.9 - 87.9, n=2)
85.9 fps 0%
ASUS GeForce RTX 3080 ROG STRIX OC GAMING
NVIDIA GeForce RTX 3080, R9 5900X
83.9 fps -2%
AMD Radeon RX 6800 XT
AMD Radeon RX 6800 XT, R9 5950X
79.6 fps -7%
Durchschnittliche NVIDIA Titan RTX
  (59 - 71.1, n=24)
66.9 fps -22%
AMD Ryzen 9 5900X
NVIDIA Titan RTX, R9 5900X
66.3 fps -23%
Durchschnittliche NVIDIA GeForce RTX 3070
  (61 - 63.5, n=4)
62.3 fps -28%
MSI GeForce RTX 3070 Gaming X Trio
NVIDIA GeForce RTX 3070, R9 5900X
61 fps -29%
Durchschnittliche NVIDIA GeForce RTX 2080 Ti (Desktop)
  (60 - 61, n=2)
60.5 fps -30%
KFA2 GeForce RTX 2080 Ti EX
NVIDIA GeForce RTX 2080 Ti (Desktop), R9 3900X
60 fps -30%
Nvidia GeForce RTX 2080 Super
NVIDIA GeForce RTX 2080 Super (Desktop), R7 2700X
49 fps -43%
Durchschnittliche NVIDIA GeForce RTX 2080 Super (Desktop)
  (49 - 49, n=2)
49 fps -43%
Durchschnittliche NVIDIA GeForce RTX 2070 Super (Desktop)
  (43 - 47.9, n=5)
45.5 fps -47%
Nvidia GeForce RTX 2070 Super
NVIDIA GeForce RTX 2070 Super (Desktop), R7 2700X
43 fps -50%
AMD Radeon RX 5700 XT
AMD Radeon RX 5700 XT (Desktop), R7 2700X
38 fps -56%
Durchschnittliche AMD Radeon RX 5700 XT (Desktop)
  (32 - 40.9, n=4)
37.9 fps -56%
AMD Radeon RX 5700
AMD Radeon RX 5700 (Desktop), R7 2700X
34 fps -60%
2560x1440 Highest Preset AA:T
Durchschnittliche NVIDIA GeForce RTX 3090
  (137 - 172.3, n=12)
165.6 fps +2%
AMD Radeon RX 6900 XT
AMD Radeon RX 6900 XT, R9 5950X (SAM ENABLED)
163 fps
AMD Radeon RX 6900 XT
AMD Radeon RX 6900 XT, R9 5950X
155 fps -5%
Nvidia GeForce RTX 3090 Founders Edition
NVIDIA GeForce RTX 3090, R9 5900X
159 fps -2%
Durchschnittliche NVIDIA GeForce RTX 3080
  (147 - 152, n=2)
149.5 fps -8%
AMD Radeon RX 6800 XT
AMD Radeon RX 6800 XT, R9 5950X
148 fps -9%
ASUS GeForce RTX 3080 ROG STRIX OC GAMING
NVIDIA GeForce RTX 3080, R9 5900X
147 fps -10%
AMD Ryzen 9 5900X
NVIDIA Titan RTX, R9 5900X
120 fps -26%
Durchschnittliche NVIDIA Titan RTX
  (98 - 128, n=23)
117.8 fps -28%
Durchschnittliche NVIDIA GeForce RTX 3070
  (108 - 116, n=4)
113.2 fps -31%
Durchschnittliche NVIDIA GeForce RTX 2080 Ti (Desktop)
  (108 - 112, n=2)
110 fps -33%
KFA2 GeForce RTX 2080 Ti EX
NVIDIA GeForce RTX 2080 Ti (Desktop), R9 3900X
108 fps -34%
MSI GeForce RTX 3070 Gaming X Trio
NVIDIA GeForce RTX 3070, R9 5900X
108 fps -34%
Durchschnittliche NVIDIA GeForce RTX 2080 Super (Desktop)
  (91 - 92, n=2)
91.5 fps -44%
Nvidia GeForce RTX 2080 Super
NVIDIA GeForce RTX 2080 Super (Desktop), R7 2700X
91 fps -44%
Durchschnittliche NVIDIA GeForce RTX 2070 Super (Desktop)
  (81 - 89.6, n=5)
85.4 fps -48%
Nvidia GeForce RTX 2070 Super
NVIDIA GeForce RTX 2070 Super (Desktop), R7 2700X
81 fps -50%
AMD Radeon RX 5700 XT
AMD Radeon RX 5700 XT (Desktop), R7 2700X
76 fps -53%
Durchschnittliche AMD Radeon RX 5700 XT (Desktop)
  (61 - 79.2, n=4)
73.8 fps -55%
AMD Radeon RX 5700
AMD Radeon RX 5700 (Desktop), R7 2700X
68 fps -58%
1920x1080 Highest Preset AA:T
Durchschnittliche NVIDIA GeForce RTX 3090
  (145 - 240, n=14)
204 fps +1%
AMD Radeon RX 6900 XT
AMD Radeon RX 6900 XT, R9 5950X
202 fps
AMD Radeon RX 6900 XT
AMD Radeon RX 6900 XT, R9 5950X (SAM ENABLED)
199 fps -1%
AMD Radeon RX 6800 XT
AMD Radeon RX 6800 XT, R9 5950X
194 fps -4%
Nvidia GeForce RTX 3090 Founders Edition
NVIDIA GeForce RTX 3090, R9 5900X
187 fps -7%
ASUS GeForce RTX 3080 ROG STRIX OC GAMING
NVIDIA GeForce RTX 3080, R9 5900X
185 fps -8%
Durchschnittliche NVIDIA GeForce RTX 3080
  (177 - 185, n=2)
181 fps -10%
AMD Ryzen 9 5900X
NVIDIA Titan RTX, R9 5900X
166 fps -18%
Durchschnittliche NVIDIA GeForce RTX 3070
  (138 - 160, n=4)
151.3 fps -25%
Durchschnittliche NVIDIA Titan RTX
  (106 - 178.8, n=24)
149.5 fps -26%
MSI GeForce RTX 3070 Gaming X Trio
NVIDIA GeForce RTX 3070, R9 5900X
138 fps -32%
Durchschnittliche NVIDIA GeForce RTX 2080 Ti (Desktop)
  (130 - 142, n=2)
136 fps -33%
KFA2 GeForce RTX 2080 Ti EX
NVIDIA GeForce RTX 2080 Ti (Desktop), R9 3900X
130 fps -36%
Durchschnittliche NVIDIA GeForce RTX 2070 Super (Desktop)
  (104 - 131.1, n=5)
119.7 fps -41%
Durchschnittliche NVIDIA GeForce RTX 2080 Super (Desktop)
  (110 - 118, n=2)
114 fps -44%
Durchschnittliche AMD Radeon RX 5700 XT (Desktop)
  (89 - 119, n=6)
110.8 fps -45%
Nvidia GeForce RTX 2080 Super
NVIDIA GeForce RTX 2080 Super (Desktop), R7 2700X
110 fps -46%
AMD Radeon RX 5700 XT
AMD Radeon RX 5700 XT (Desktop), R7 2700X
110 fps -46%
Nvidia GeForce RTX 2070 Super
NVIDIA GeForce RTX 2070 Super (Desktop), R7 2700X
104 fps -49%
AMD Radeon RX 5700
AMD Radeon RX 5700 (Desktop), R7 2700X
90 fps -55%
Forza Horizon 4
3840x2160 Ultra Preset AA:2xMS
AMD Radeon RX 6900 XT
AMD Radeon RX 6900 XT, R9 5950X (SAM ENABLED)
172 fps
AMD Radeon RX 6900 XT
AMD Radeon RX 6900 XT, R9 5950X
152 fps -12%
Durchschnittliche NVIDIA GeForce RTX 3090
 
147 fps -15%
Durchschnittliche NVIDIA Titan RTX
  (90 - 121, n=17)
112.9 fps -34%
KFA2 GeForce RTX 2080 Ti EX
NVIDIA GeForce RTX 2080 Ti (Desktop), R9 3900X
107 fps -38%
Durchschnittliche NVIDIA GeForce RTX 2080 Ti (Desktop)
  (98 - 111, n=3)
105.3 fps -39%
Durchschnittliche NVIDIA GeForce RTX 2070 Super (Desktop)
  (76 - 85, n=3)
81.7 fps -52%
Nvidia GeForce RTX 2080 Super
NVIDIA GeForce RTX 2080 Super (Desktop), R7 2700X
81 fps -53%
Durchschnittliche NVIDIA GeForce RTX 2080 Super (Desktop)
 
81 fps -53%
AMD Radeon RX 5700 XT
AMD Radeon RX 5700 XT (Desktop), R7 2700X
79 fps -54%
Durchschnittliche AMD Radeon RX 5700 XT (Desktop)
 
79 fps -54%
Nvidia GeForce RTX 2070 Super
NVIDIA GeForce RTX 2070 Super (Desktop), R7 2700X
76 fps -56%
AMD Radeon RX 5700
AMD Radeon RX 5700 (Desktop), R7 2700X
70 fps -59%
2560x1440 Ultra Preset AA:2xMS
AMD Radeon RX 6900 XT
AMD Radeon RX 6900 XT, R9 5950X (SAM ENABLED)
243 fps
AMD Radeon RX 6900 XT
AMD Radeon RX 6900 XT, R9 5950X
218 fps -10%
Durchschnittliche NVIDIA GeForce RTX 3090
 
164 fps -33%
Durchschnittliche NVIDIA Titan RTX
  (127 - 171, n=16)
154.8 fps -36%
KFA2 GeForce RTX 2080 Ti EX
NVIDIA GeForce RTX 2080 Ti (Desktop), R9 3900X
147 fps -40%
Durchschnittliche NVIDIA GeForce RTX 2080 Ti (Desktop)
  (131 - 150, n=3)
142.7 fps -41%
Durchschnittliche NVIDIA GeForce RTX 2070 Super (Desktop)
  (108 - 125, n=3)
119.3 fps -51%
AMD Radeon RX 5700 XT
AMD Radeon RX 5700 XT (Desktop), R7 2700X
119 fps -51%
Durchschnittliche AMD Radeon RX 5700 XT (Desktop)
 
119 fps -51%
Nvidia GeForce RTX 2080 Super
NVIDIA GeForce RTX 2080 Super (Desktop), R7 2700X
117 fps -52%
Durchschnittliche NVIDIA GeForce RTX 2080 Super (Desktop)
 
117 fps -52%
Nvidia GeForce RTX 2070 Super
NVIDIA GeForce RTX 2070 Super (Desktop), R7 2700X
108 fps -56%
AMD Radeon RX 5700
AMD Radeon RX 5700 (Desktop), R7 2700X
103 fps -58%
1920x1080 Ultra Preset AA:2xMS
AMD Radeon RX 6900 XT
AMD Radeon RX 6900 XT, R9 5950X
248 fps
AMD Radeon RX 6900 XT
AMD Radeon RX 6900 XT, R9 5950X (SAM ENABLED)
247 fps 0%
Durchschnittliche NVIDIA Titan RTX
  (129 - 196, n=17)
169.8 fps -32%
KFA2 GeForce RTX 2080 Ti EX
NVIDIA GeForce RTX 2080 Ti (Desktop), R9 3900X
168 fps -32%
Durchschnittliche NVIDIA GeForce RTX 3090
 
166 fps -33%
Durchschnittliche NVIDIA GeForce RTX 2080 Ti (Desktop)
  (153 - 169, n=3)
163.3 fps -34%
Durchschnittliche AMD Radeon RX 5700 XT (Desktop)
  (138 - 149, n=3)
145 fps -42%
Durchschnittliche NVIDIA GeForce RTX 2070 Super (Desktop)
  (129 - 153, n=3)
145 fps -42%
AMD Radeon RX 5700 XT
AMD Radeon RX 5700 XT (Desktop), R7 2700X
138 fps -44%
Nvidia GeForce RTX 2080 Super
NVIDIA GeForce RTX 2080 Super (Desktop), R7 2700X
133 fps -46%
Durchschnittliche NVIDIA GeForce RTX 2080 Super (Desktop)
 
133 fps -46%
Nvidia GeForce RTX 2070 Super
NVIDIA GeForce RTX 2070 Super (Desktop), R7 2700X
129 fps -48%
AMD Radeon RX 5700
AMD Radeon RX 5700 (Desktop), R7 2700X
118 fps -52%
Hitman 3
3840x2160 Maximum Settings AF:16x
AMD Radeon RX 6900 XT
AMD Radeon RX 6900 XT, R9 5950X
128.4 fps
AMD Radeon RX 6900 XT
AMD Radeon RX 6900 XT, R9 5950X (SAM ENABLED)
127.8 fps 0%
Durchschnittliche NVIDIA GeForce RTX 3090
  (115 - 122, n=2)
118.5 fps -8%
Nvidia GeForce RTX 3090 Founders Edition
NVIDIA GeForce RTX 3090, R9 5900X
115 fps -10%
Durchschnittliche NVIDIA GeForce RTX 3080
 
109 fps -15%
Durchschnittliche NVIDIA GeForce RTX 2080 Ti (Desktop)
 
85.2 fps -34%
AMD Ryzen 9 5900X
NVIDIA Titan RTX, R9 5900X
82 fps -36%
Durchschnittliche NVIDIA Titan RTX
 
82 fps -36%
Durchschnittliche NVIDIA GeForce RTX 3070
 
77.5 fps -40%
Durchschnittliche NVIDIA GeForce RTX 2080 Super (Desktop)
 
64 fps -50%
Durchschnittliche NVIDIA GeForce RTX 2070 Super (Desktop)
 
55 fps -57%
Durchschnittliche AMD Radeon RX 5700 XT (Desktop)
 
53 fps -59%
2560x1440 Maximum Settings AF:16x
AMD Radeon RX 6900 XT
AMD Radeon RX 6900 XT, R9 5950X
213.1 fps
AMD Radeon RX 6900 XT
AMD Radeon RX 6900 XT, R9 5950X (SAM ENABLED)
213.1 fps 0%
Nvidia GeForce RTX 3090 Founders Edition
NVIDIA GeForce RTX 3090, R9 5900X
190 fps -11%
Durchschnittliche NVIDIA GeForce RTX 3090
  (166 - 190, n=2)
178 fps -16%
Durchschnittliche NVIDIA GeForce RTX 3080
 
164 fps -23%
Durchschnittliche NVIDIA GeForce RTX 2080 Ti (Desktop)
 
147 fps -31%
AMD Ryzen 9 5900X
NVIDIA Titan RTX, R9 5900X
145 fps -32%
Durchschnittliche NVIDIA Titan RTX
 
145 fps -32%
Durchschnittliche NVIDIA GeForce RTX 3070
 
140 fps -34%
Durchschnittliche NVIDIA GeForce RTX 2080 Super (Desktop)
 
115 fps -46%
Durchschnittliche NVIDIA GeForce RTX 2070 Super (Desktop)
 
101 fps -53%
Durchschnittliche AMD Radeon RX 5700 XT (Desktop)
 
95 fps -55%
1920x1080 Maximum Settings AF:16x
AMD Radeon RX 6900 XT
AMD Radeon RX 6900 XT, R9 5950X
276.2 fps
AMD Radeon RX 6900 XT
AMD Radeon RX 6900 XT, R9 5950X (SAM ENABLED)
269.4 fps -2%
Nvidia GeForce RTX 3090 Founders Edition
NVIDIA GeForce RTX 3090, R9 5900X
223 fps -19%
AMD Ryzen 9 5900X
NVIDIA Titan RTX, R9 5900X
202 fps -27%
Durchschnittliche NVIDIA Titan RTX
 
202 fps -27%
Durchschnittliche NVIDIA GeForce RTX 3090
  (167 - 223, n=2)
195 fps -29%
Durchschnittliche NVIDIA GeForce RTX 3080
 
166 fps -40%
Durchschnittliche NVIDIA GeForce RTX 2080 Super (Desktop)
 
166 fps -40%
Durchschnittliche NVIDIA GeForce RTX 3070
 
165 fps -40%
Durchschnittliche NVIDIA GeForce RTX 2080 Ti (Desktop)
 
162 fps -41%
Durchschnittliche NVIDIA GeForce RTX 2070 Super (Desktop)
 
148 fps -46%
Durchschnittliche AMD Radeon RX 5700 XT (Desktop)
 
141 fps -49%
Watch Dogs Legion
1920x1080 Ultra Preset + Ultra Ray Tracing (DX12)
Durchschnittliche NVIDIA GeForce RTX 3090
  (75.7 - 78.2, n=2)
77 fps +38%
Nvidia GeForce RTX 3090 Founders Edition
NVIDIA GeForce RTX 3090, R9 5900X
75.7 (33.41min, 58.92P1 - 126.05max) fps +36%
AMD Radeon RX 6800 XT
AMD Radeon RX 6800 XT, R9 5950X
71.4 (47.71min, 55.63P1 - 113.42max) fps +28%
Durchschnittliche NVIDIA GeForce RTX 3080
  (70.9 - 71.3, n=2)
71.1 fps +28%
ASUS GeForce RTX 3080 ROG STRIX OC GAMING
NVIDIA GeForce RTX 3080, R9 5900X
70.9 (37.64min, 58.05P1 - 113.63max) fps +28%
Durchschnittliche NVIDIA GeForce RTX 2080 Ti (Desktop)
 
55.8 fps 0%
AMD Radeon RX 6900 XT
AMD Radeon RX 6900 XT, R9 5950X
55.6 (35.81min, 41.86P1 - 76.28max) fps
AMD Radeon RX 6900 XT
AMD Radeon RX 6900 XT, R9 5950X (SAM ENABLED)
55.5 (36.48min, 43.27P1 - 76.42max) fps 0%
Durchschnittliche NVIDIA Titan RTX
 
55.4 fps 0%
Durchschnittliche NVIDIA GeForce RTX 3070
  (51.7 - 61, n=4)
55.1 fps -1%
MSI GeForce RTX 3070 Gaming X Trio
NVIDIA GeForce RTX 3070, R9 5900X
54.3 (18.74min, 40.53P1 - 81.06max) fps -2%
Durchschnittliche NVIDIA GeForce RTX 2080 Super (Desktop)
 
45.4 fps -18%
Durchschnittliche NVIDIA GeForce RTX 2070 Super (Desktop)
 
39.2 fps -29%
3840x2160 Ultra Preset (DX12)
Durchschnittliche NVIDIA GeForce RTX 3090
  (57.6 - 60.3, n=2)
59 fps +10%
Nvidia GeForce RTX 3090 Founders Edition
NVIDIA GeForce RTX 3090, R9 5900X
57.6 (24.58min, 45.93P1 - 114.36max) fps +7%
ASUS GeForce RTX 3080 ROG STRIX OC GAMING
NVIDIA GeForce RTX 3080, R9 5900X
54.1 (24.72min, 44.97P1 - 114.7max) fps +1%
Durchschnittliche NVIDIA GeForce RTX 3080
  (53.5 - 54.1, n=2)
53.8 fps 0%
AMD Radeon RX 6900 XT
AMD Radeon RX 6900 XT, R9 5950X (SAM ENABLED)
53.6 (34.78min, 44.93P1 - 72.47max) fps
AMD Radeon RX 6900 XT
AMD Radeon RX 6900 XT, R9 5950X
53.5 (33.75min, 44.2P1 - 82.3max) fps 0%
AMD Radeon RX 6800 XT
AMD Radeon RX 6800 XT, R9 5950X
49.3 (32.85min, 41.54P1 - 76.12max) fps -8%
Durchschnittliche NVIDIA GeForce RTX 2080 Ti (Desktop)
 
44 fps -18%
Durchschnittliche NVIDIA Titan RTX
 
43.4 fps -19%
Durchschnittliche NVIDIA GeForce RTX 3070
  (37 - 39.2, n=4)
38 fps -29%
MSI GeForce RTX 3070 Gaming X Trio
NVIDIA GeForce RTX 3070, R9 5900X
37 (17.44min, 25.32P1 - 81.3max) fps -31%
Durchschnittliche NVIDIA GeForce RTX 2080 Super (Desktop)
 
34.4 fps -36%
Durchschnittliche NVIDIA GeForce RTX 2070 Super (Desktop)
 
29.2 fps -46%
Durchschnittliche AMD Radeon RX 5700 XT (Desktop)
 
12.7 fps -76%
2560x1440 Ultra Preset (DX12)
AMD Radeon RX 6900 XT
AMD Radeon RX 6900 XT, R9 5950X (SAM ENABLED)
91.4 (38.16min, 73.25P1 - 135.95max) fps
AMD Radeon RX 6900 XT
AMD Radeon RX 6900 XT, R9 5950X
91.1 (31.59min, 72.21P1 - 151.03max) fps 0%
Durchschnittliche NVIDIA GeForce RTX 3090
  (88.3 - 89.7, n=2)
89 fps -3%
Nvidia GeForce RTX 3090 Founders Edition
NVIDIA GeForce RTX 3090, R9 5900X
88.3 (48.36min, 68.18P1 - 160.5max) fps -3%
AMD Radeon RX 6800 XT
AMD Radeon RX 6800 XT, R9 5950X
84.5 (58.88min, 69.45P1 - 137.16max) fps -8%
ASUS GeForce RTX 3080 ROG STRIX OC GAMING
NVIDIA GeForce RTX 3080, R9 5900X
81.6 (44.31min, 65.35P1 - 139.28max) fps -11%
Durchschnittliche NVIDIA GeForce RTX 3080
  (81.1 - 81.6, n=2)
81.4 fps -11%
Durchschnittliche NVIDIA GeForce RTX 2080 Ti (Desktop)
 
72.9 fps -20%
Durchschnittliche NVIDIA Titan RTX
 
69.9 fps -24%
Durchschnittliche NVIDIA GeForce RTX 3070
  (65.3 - 67, n=4)
66.1 fps -28%
MSI GeForce RTX 3070 Gaming X Trio
NVIDIA GeForce RTX 3070, R9 5900X
65.7 (25.01min, 51.86P1 - 96.9max) fps -28%
Durchschnittliche NVIDIA GeForce RTX 2080 Super (Desktop)
 
57.3 fps -37%
Durchschnittliche NVIDIA GeForce RTX 2070 Super (Desktop)
 
51.4 fps -44%
Durchschnittliche AMD Radeon RX 5700 XT (Desktop)
 
46.4 fps -49%
1920x1080 Ultra Preset (DX12)
AMD Radeon RX 6900 XT
AMD Radeon RX 6900 XT, R9 5950X (SAM ENABLED)
121 (67.26min, 95.56P1 - 184.97max) fps
AMD Radeon RX 6900 XT
AMD Radeon RX 6900 XT, R9 5950X
120 (81.32min, 93.02P1 - 209.32max) fps -1%
AMD Radeon RX 6800 XT
AMD Radeon RX 6800 XT, R9 5950X
112 (75.12min, 87.97P1 - 181.69max) fps -7%
Nvidia GeForce RTX 3090 Founders Edition
NVIDIA GeForce RTX 3090, R9 5900X
107 (24.35min, 77.46P1 - 174.03max) fps -12%
Durchschnittliche NVIDIA GeForce RTX 3090
  (103 - 107, n=2)
105 fps -13%
ASUS GeForce RTX 3080 ROG STRIX OC GAMING
NVIDIA GeForce RTX 3080, R9 5900X
103 (55.63min, 83.65P1 - 156.57max) fps -15%
Durchschnittliche NVIDIA GeForce RTX 3080
  (99.3 - 103, n=2)
101.2 fps -16%
Durchschnittliche NVIDIA GeForce RTX 2080 Ti (Desktop)
 
89.6 fps -26%
Durchschnittliche NVIDIA Titan RTX
 
85.5 fps -29%
Durchschnittliche NVIDIA GeForce RTX 3070
  (79 - 89, n=4)
84.7 fps -30%
MSI GeForce RTX 3070 Gaming X Trio
NVIDIA GeForce RTX 3070, R9 5900X
79 (42.91min, 56.59P1 - 121.27max) fps -35%
Durchschnittliche NVIDIA GeForce RTX 2080 Super (Desktop)
 
75.4 fps -38%
Durchschnittliche NVIDIA GeForce RTX 2070 Super (Desktop)
 
68.3 fps -44%
Durchschnittliche AMD Radeon RX 5700 XT (Desktop)
 
66.8 fps -45%
F1 2020
3840x2160 Ultra High Preset AA:T AF:16x
Durchschnittliche NVIDIA GeForce RTX 3090
  (133 - 149.6, n=10)
141.8 fps +4%
AMD Radeon RX 6900 XT
AMD Radeon RX 6900 XT, R9 5950X (SAM ENABLED)
137 (109min - 165max) fps
AMD Radeon RX 6900 XT
AMD Radeon RX 6900 XT, R9 5950X
136 (110min - 161max) fps -1%
Nvidia GeForce RTX 3090 Founders Edition
NVIDIA GeForce RTX 3090, R9 5900X
135 (116min - 157max) fps -1%
AMD Radeon RX 6800 XT
AMD Radeon RX 6800 XT, R9 5950X (704326)
128 (106min - 152max) fps -7%
ASUS GeForce RTX 3080 ROG STRIX OC GAMING
NVIDIA GeForce RTX 3080, R9 5900X (692646)
118 (102min - 137max) fps -14%
Durchschnittliche NVIDIA GeForce RTX 3080
  (114 - 118, n=2)
116 fps -15%
Durchschnittliche NVIDIA Titan RTX
  (97.4 - 103.4, n=6)
101.5 fps -26%
Durchschnittliche NVIDIA GeForce RTX 2080 Ti (Desktop)
 
100 fps -27%
Durchschnittliche NVIDIA GeForce RTX 3070
  (88.7 - 92.7, n=3)
90.2 fps -34%
MSI GeForce RTX 3070 Gaming X Trio
NVIDIA GeForce RTX 3070, R9 5900X (692646)
89.2 (73min - 104max) fps -35%
Durchschnittliche NVIDIA GeForce RTX 2080 Super (Desktop)
 
77.2 fps -44%
Durchschnittliche NVIDIA GeForce RTX 2070 Super (Desktop)
  (67.6 - 71.4, n=3)
69.2 fps -49%
Durchschnittliche AMD Radeon RX 5700 XT (Desktop)
  (47 - 65, n=4)
59.3 fps -57%
2560x1440 Ultra High Preset AA:T AF:16x
AMD Radeon RX 6900 XT
AMD Radeon RX 6900 XT, R9 5950X (SAM ENABLED)
228 (178min - 275max) fps
AMD Radeon RX 6900 XT
AMD Radeon RX 6900 XT, R9 5950X
220 (173min - 264max) fps -4%
Durchschnittliche NVIDIA GeForce RTX 3090
  (204 - 240, n=10)
226 fps -1%
AMD Radeon RX 6800 XT
AMD Radeon RX 6800 XT, R9 5950X (704326)
215 (166min - 264max) fps -6%
Nvidia GeForce RTX 3090 Founders Edition
NVIDIA GeForce RTX 3090, R9 5900X
207 (171min - 241max) fps -9%
Durchschnittliche NVIDIA Titan RTX
  (153 - 175.8, n=6)
167.4 fps -27%
Durchschnittliche NVIDIA GeForce RTX 2080 Ti (Desktop)
 
162 fps -29%
ASUS GeForce RTX 3080 ROG STRIX OC GAMING
NVIDIA GeForce RTX 3080, R9 5900X (692646)
155 (128min - 184max) fps -32%
Durchschnittliche NVIDIA GeForce RTX 3080
  (146 - 155, n=2)
150.5 fps -34%
Durchschnittliche NVIDIA GeForce RTX 3070
  (143 - 162.2, n=3)
150.4 fps -34%
MSI GeForce RTX 3070 Gaming X Trio
NVIDIA GeForce RTX 3070, R9 5900X (692646)
146 (121min - 168max) fps -36%
Durchschnittliche NVIDIA GeForce RTX 2080 Super (Desktop)
 
127 fps -44%
Durchschnittliche NVIDIA GeForce RTX 2070 Super (Desktop)
  (117.6 - 121.1, n=3)
118.9 fps -48%
Durchschnittliche AMD Radeon RX 5700 XT (Desktop)
  (80 - 109, n=4)
99.3 fps -56%
1920x1080 Ultra High Preset AA:T AF:16x
AMD Radeon RX 6900 XT
AMD Radeon RX 6900 XT, R9 5950X (SAM ENABLED)
291 (222min - 355max) fps
AMD Radeon RX 6900 XT
AMD Radeon RX 6900 XT, R9 5950X
275 (213min - 338max) fps -5%
AMD Radeon RX 6800 XT
AMD Radeon RX 6800 XT, R9 5950X (704326)
279 (211min - 345max) fps -4%
Durchschnittliche NVIDIA GeForce RTX 3090
  (227 - 311, n=10)
279 fps -4%
Nvidia GeForce RTX 3090 Founders Edition
NVIDIA GeForce RTX 3090, R9 5900X
250 (214min - 304max) fps -14%
Durchschnittliche NVIDIA Titan RTX
  (194 - 231, n=7)
216 fps -26%
Durchschnittliche NVIDIA GeForce RTX 2080 Ti (Desktop)
 
202 fps -31%
Durchschnittliche NVIDIA GeForce RTX 3070
  (179 - 215, n=3)
191.7 fps -34%
ASUS GeForce RTX 3080 ROG STRIX OC GAMING
NVIDIA GeForce RTX 3080, R9 5900X (692646)
185 (158min - 218max) fps -36%
Durchschnittliche NVIDIA GeForce RTX 3080
  (179 - 185, n=2)
182 fps -37%
MSI GeForce RTX 3070 Gaming X Trio
NVIDIA GeForce RTX 3070, R9 5900X (692646)
179 (153min - 213max) fps -38%
Durchschnittliche NVIDIA GeForce RTX 2080 Super (Desktop)
 
162 fps -44%
Durchschnittliche NVIDIA GeForce RTX 2070 Super (Desktop)
  (153 - 163, n=3)
157.4 fps -46%
Durchschnittliche AMD Radeon RX 5700 XT (Desktop)
  (108 - 149, n=4)
131.9 fps -55%
min. mittel hoch max.QHD4K
The Witcher 3 (2015) 589 375 323 163.6 122
Shadow of the Tomb Raider (2018) 248 222 213 199 163 86
Forza Horizon 4 (2018) 350 283 279 247 243 172
Assassin´s Creed Odyssey (2018) 124 117 106 98 99 68
Battlefield V (2018) 196 195 196 197 196 134
Far Cry New Dawn (2019) 141 126 123 118 117 101
Metro Exodus (2019) 274 214 154 123 102 66.7
The Division 2 (2019) 217 190 157 138 118 66.6
Anno 1800 (2019) 223 162 139 87.1 70.7 52
Total War: Three Kingdoms (2019) 429.7 263 180.3 141.3 92.9 44.9
Control (2019) 240 234 174 113 53.9
Borderlands 3 (2019) 197 169 152 131 107 59.8
Red Dead Redemption 2 (2019) 208 196 150 98 82.1 54.6
Doom Eternal (2020) 624 480 416 411 328 185
Gears Tactics (2020) 495.8 338.1 249 175.1 136.4 74.1
F1 2020 (2020) 520 442 395 291 228 137
Horizon Zero Dawn (2020) 245 205 184 164 136 76
Mafia Definitive Edition (2020) 160 142 138 120 67
Watch Dogs Legion (2020) 191 190 170 121 91.4 53.6
Assassin´s Creed Valhalla (2020) 227 169 142 148 115 68
Call of Duty Black Ops Cold War (2020) 298 198 169 153 115 68.1
Immortals Fenyx Rising (2020) 139 126 127 122 121 83
Cyberpunk 2077 1.0 (2020) 160 152 127 106 72.3 34.8
Hitman 3 (2021) 352.8 283.2 279.9 269.4 213.1 127.8

Emissionen

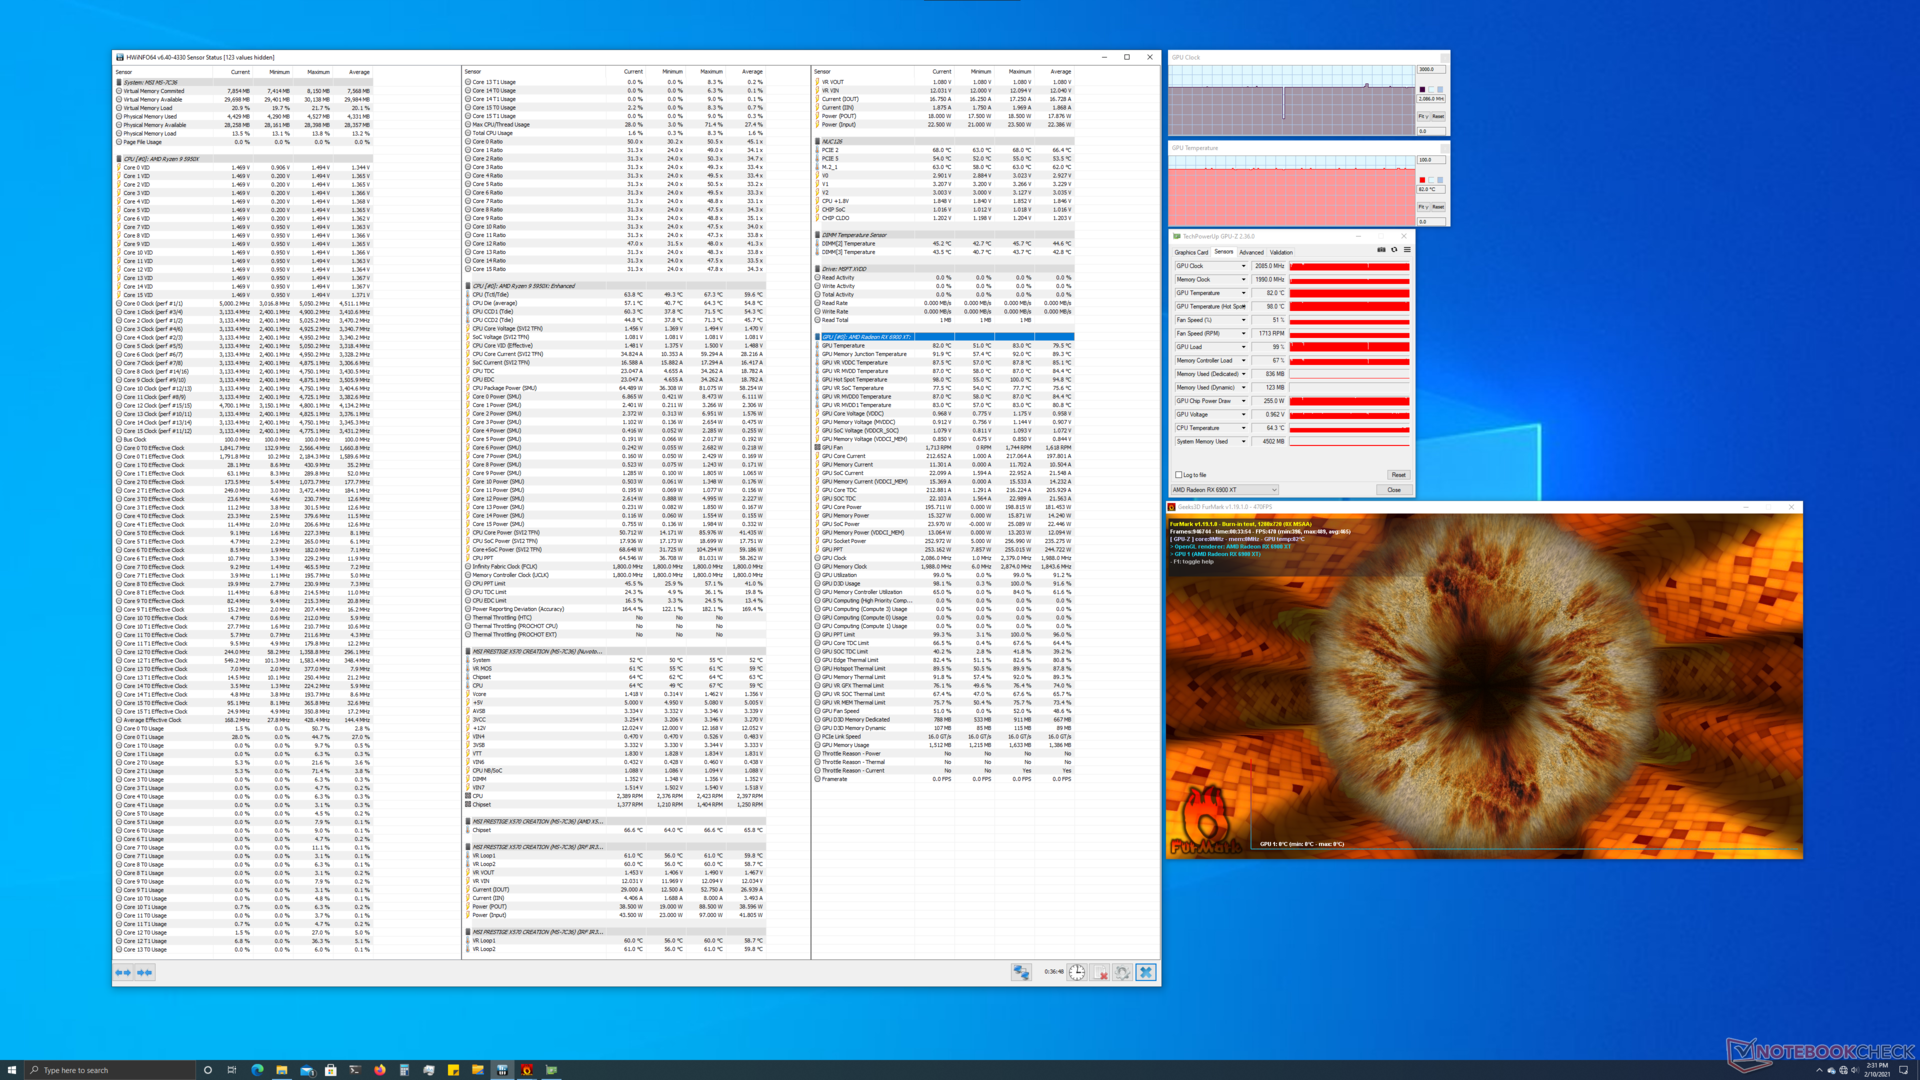
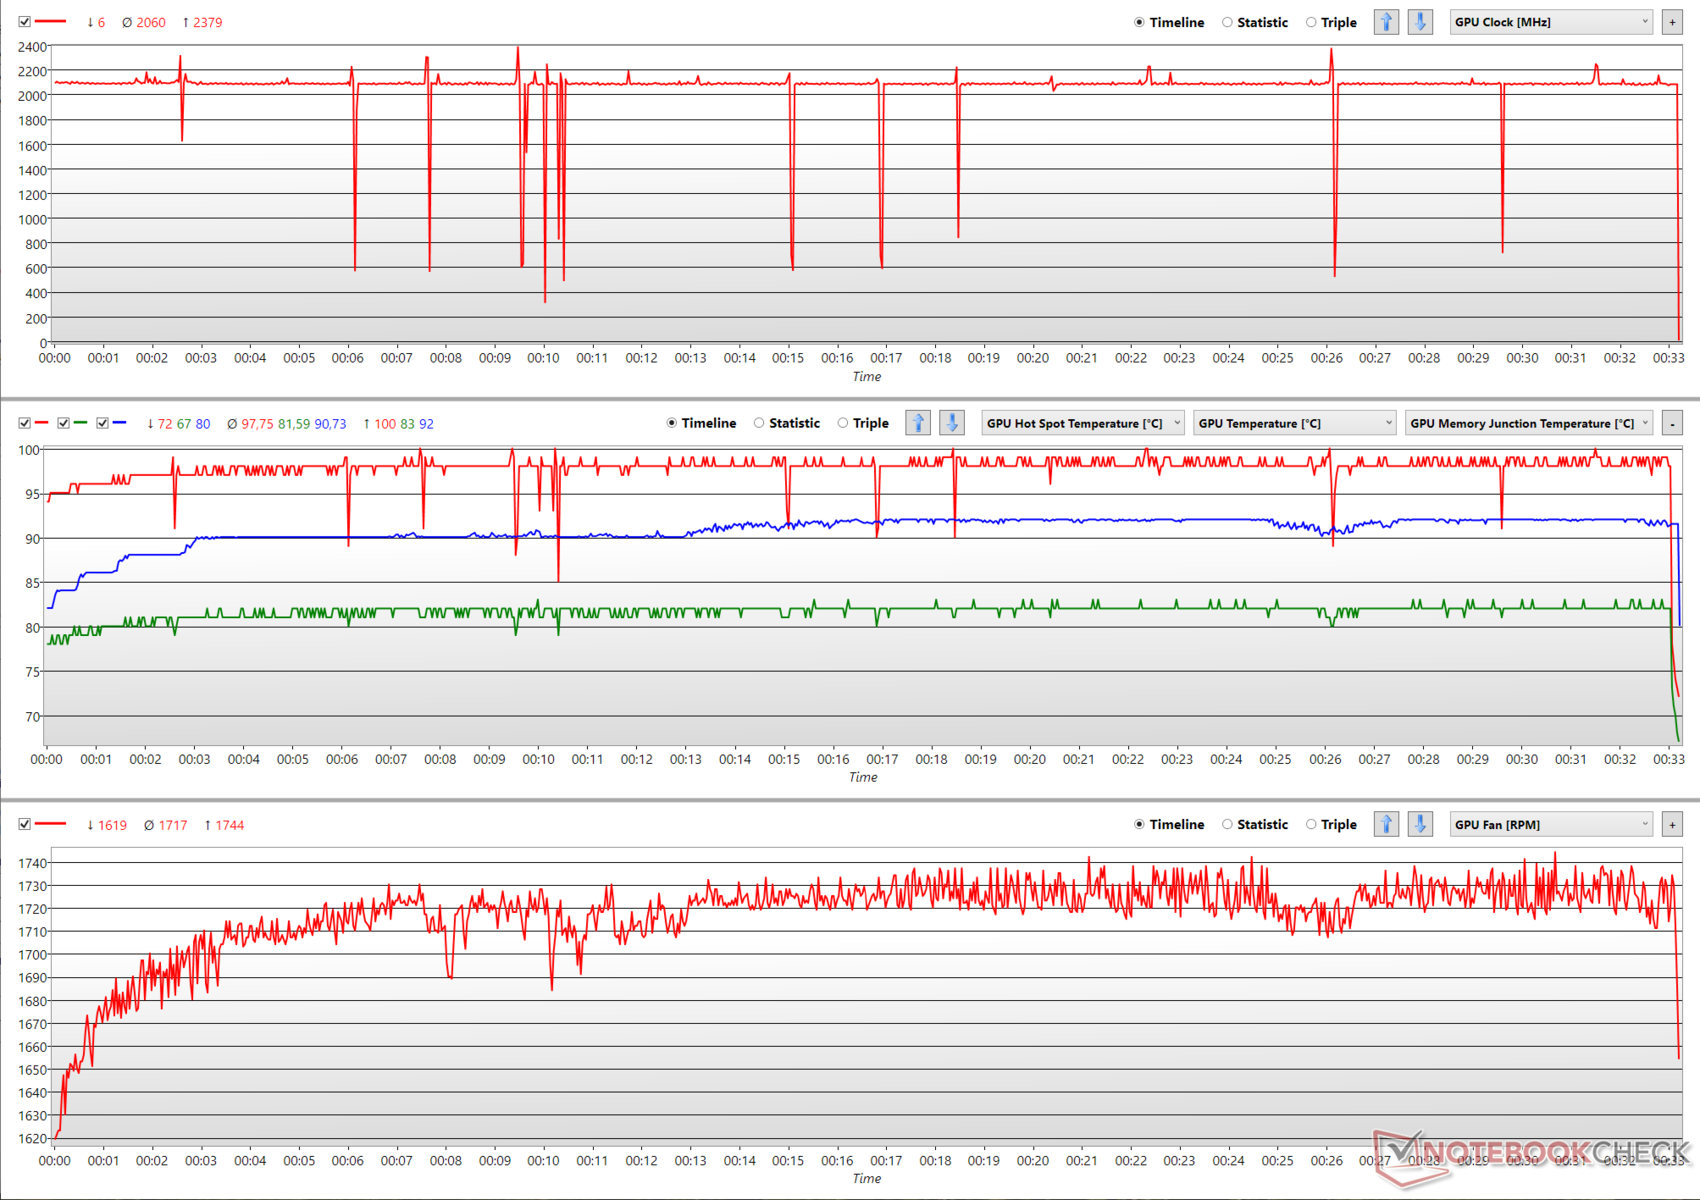
Mit der RX-6000-Series verabrschiedet sich AMD vom alten Lüfter und setzt nun auf ein fähigeres Triple-Fan-Kühlsystem. Aber während der neue Kühler zweifellos ausdauerndere Taktraten ermöglicht, beobachten wir dennoch, dass sich die Karte während des FurMark-Stresstests öfter der Hot-Spot-Temperatur von 100 °C annähert. Auch der Kern läuft mit 82 °C recht heiß.

Meistens schafft die RX 6900 XT einen kontinuierlichen Boost-Takt von 2.086 MHz, manchmal sogar 2.379 MHz. Andererseits gibt es auch gelegentliche Drosselung wenn die Temperatur die 100-°C-Marke erreicht, auch wenn sich die Taktraten recht schnell wieder erholen. 

Für die Messung der Lautstärke und Temperaturen nutzen wir den FurMark-Stress. FuMark und The Witcher 3 bei 1080p Ultra fungieren als Lastszenarien für die Verbrauchsmessungen.

FurMark-Stress
FurMark-Stress
Kerntaktraten, Temperaturen (GPU Hot-Spot-Temp. - rot, GPU-Temp. - grün, GDDR6-Junction-Temp. - blau), und Graph zur Lüftergeschwindigkeit während des FurMark-Stresses

Temperatur

Wärmekarte der AMD Radeon RX 6900 XT

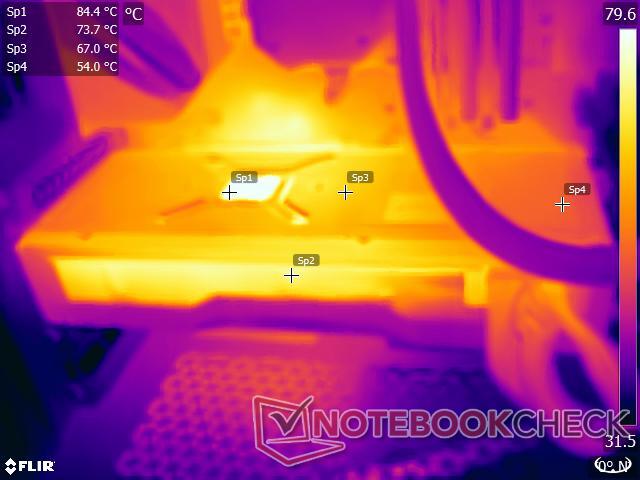
Die Oberflächentemperaturen sind ebenfalls recht hoch. Wir messen annähernd 85 °C in der Nähe der GPU und 67 °C nahe des Netzteils und der VRM-Sektion während des FurMark-Stresstests.

Die Luftausgänge an der Oberseite erhitzen sich auf bis zu 74 °C. Daher empfehlen wir einen guten Gehäuselüfter, um Hitzestau im Gehäuse zu vermeiden, vor allem wenn das Gehäuse über ein seitliches Sichtfenster aus Glas verfügt. Enthusiasten sollten darüber nachdenken die Karte zu undervolten und ein Power-Limit festzulegen. Eine solche Maßnahme kann potentiell die Hot-Spot-Temperatur reduzieren und somit womöglich das gelegentliche Absinken der Taktraten verhindern.

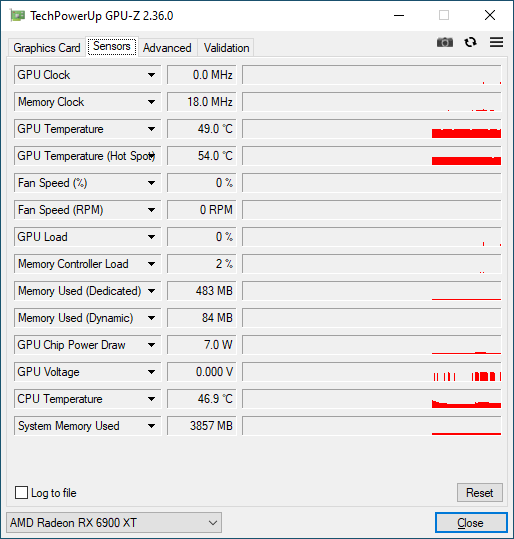
Im Leerlauf messen wir 49 °C und 54 °C als GPU- und Hot-Spot-Temperaturen. Anders als noch bei der Radeon RX 5700 XT bietet die RX 6900 XT jetzt die Funktion Idle-Fan-Stop, welche die Lüfter komplett abschaltet, wenn keine Last anliegt.

Energieverbrauch

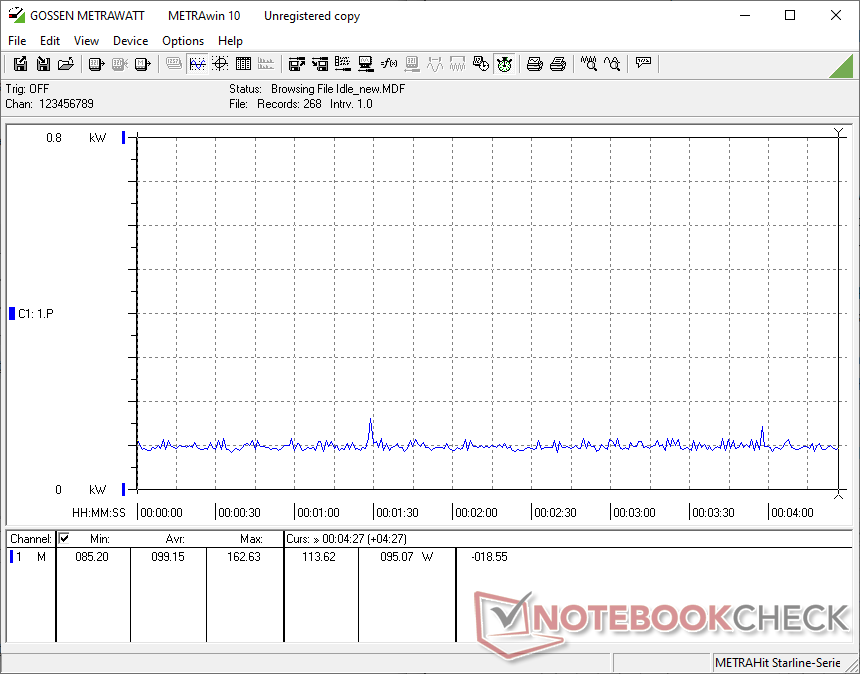
Im Leerlauf verbraucht unser Testsystem im Schnitt etwa 99 W, dabei sind alle RGB-Lichter deaktiviert und die insgesamt fünf Lüfter (3x Corsair SP 120 mm Gehäuselüfter und 2x Corsair ML 120 mm Radiator Fans) sowie der Elite Capellix AIO laufen im Ausbalancierten Modus.

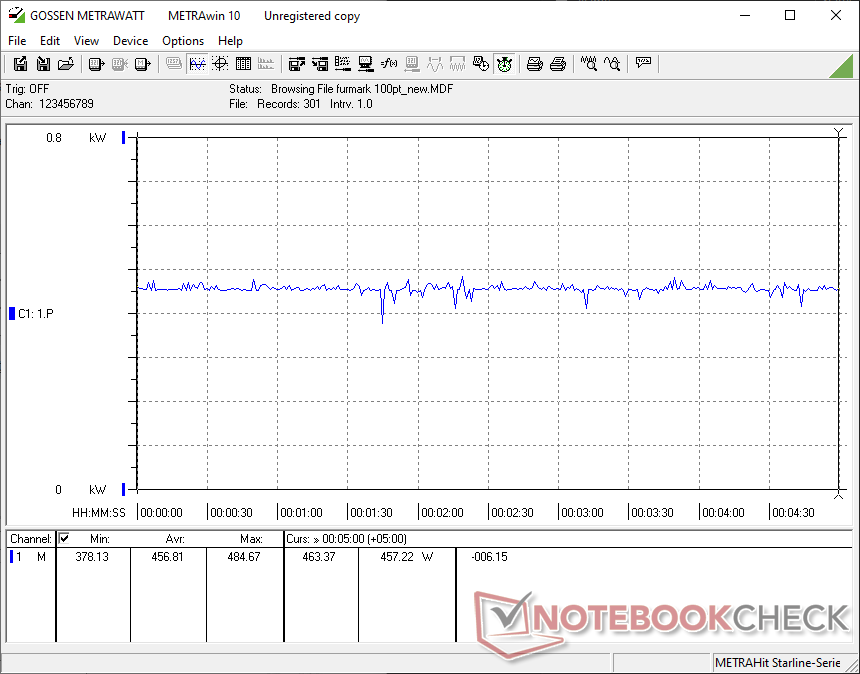
Im FurMark- und The-Witcher-3-Ultra-Stresstests verbraucht das System mit RX 6900 XT im Schnitt 456,8 W bzw. 488 W. Der Verbrauch im FurMark-Stress spiegelt dabei auch die zuvor beobachteten Taktrateneinbrüche wieder. 

Während die RDNA-2-Karte definitiv einen erhöhten Verbrauch im Vergleich zur RX 5700 XT zeigt, ist es interessant zu sehen, dass die Unterschiede zwischen einer RX 6800 XT und einer RX 6900 XT in dieser Hinsicht kaum spürbar sind. Die RTX 3090 Founders Edition, auf der anderen Seite, verbraucht im FurMark-Stress etwa 10 Prozent mehr als die 6900 XT, ist dafür aber rund 5 Prozent ökonomischer in The Witcher 3 Ultra.

Verbrauch im Leerlauf
Verbrauch im FurMark-Stress
Verbrauch in The Witcher 3 1080p Ultra
Power Consumption
1280x720 FurMark 1.19 GPU Stress Test (external Monitor)
ASUS GeForce RTX 3080 ROG STRIX OC GAMING
NVIDIA GeForce RTX 3080, R9 5900X (Idle: 88.3 W)
505 (493min - 541max) Watt * -11%
Nvidia GeForce RTX 3090 Founders Edition
NVIDIA GeForce RTX 3090, R9 5900X (Idle: 91.1 W)
502 (425min - 525max) Watt * -10%
Durchschnittliche NVIDIA GeForce RTX 3080
  (Idle: 492 - 505, n=2 W)
499 Watt * -9%
Durchschnittliche NVIDIA GeForce RTX 3090
  (Idle: 281 - 551, n=7 W)
466 Watt * -2%
AMD Radeon RX 6900 XT
AMD Radeon RX 6900 XT, R9 5950X (Idle: 99.15 W)
456.8 (378.13min - 484.67max) Watt *
AMD Radeon RX 6800 XT
AMD Radeon RX 6800 XT, R9 5950X (Idle: 99.5 W)
447.9 (413min - 484max) Watt * +2%
KFA2 GeForce RTX 2080 Ti EX
NVIDIA GeForce RTX 2080 Ti (Desktop), R9 3900X (Idle: 100.5 W)
400.8 (354min - 432max) Watt * +12%
Durchschnittliche NVIDIA GeForce RTX 2080 Ti (Desktop)
  (Idle: 330 - 439, n=3 W)
390 Watt * +15%
MSI GeForce RTX 3070 Gaming X Trio
NVIDIA GeForce RTX 3070, R9 5900X (Idle: 95.1 W)
376.9 (369min - 433max) Watt * +17%
Nvidia GeForce RTX 2080 Super
NVIDIA GeForce RTX 2080 Super (Desktop), R7 2700X (Idle: 78.87 W)
376.8 (331min - 409max) Watt * +18%
Durchschnittliche NVIDIA GeForce RTX 2080 Super (Desktop)
  (Idle: 328 - 414, n=4 W)
362 Watt * +21%
Durchschnittliche NVIDIA GeForce RTX 3070
  (Idle: 281 - 393, n=6 W)
348 Watt * +24%
Durchschnittliche AMD Radeon RX 5700 XT (Desktop)
  (Idle: 327 - 352, n=2 W)
339 Watt * +26%
Durchschnittliche NVIDIA GeForce RTX 2070 Super (Desktop)
  (Idle: 280 - 358, n=5 W)
327 Watt * +28%
AMD Radeon RX 5700 XT
AMD Radeon RX 5700 XT (Desktop), R7 2700X (239 fps, Idle: 69.8 W)
326.6 (313min - 351max) Watt * +29%
Nvidia GeForce RTX 2070 Super
NVIDIA GeForce RTX 2070 Super (Desktop), R7 2700X (283 fps, Idle: 80.5 W)
326 (315min - 348max) Watt * +29%
AMD Radeon RX 5700
AMD Radeon RX 5700 (Desktop), R7 2700X (207 fps, Idle: 64.5 W)
280.5 (271min - 312max) Watt * +39%
1920x1080 The Witcher 3 ultra (external Monitor)
Durchschnittliche NVIDIA GeForce RTX 3090
  (Idle: 464 - 597, n=16 W)
523 Watt * -7%
ASUS GeForce RTX 3080 ROG STRIX OC GAMING
NVIDIA GeForce RTX 3080, R9 5900X (Idle: 88.3 W)
505 (389min - 543max) Watt * -3%
AMD Radeon RX 6800 XT
AMD Radeon RX 6800 XT, R9 5950X (Idle: 99.5 W)
505 (389min - 543max) Watt * -3%
Durchschnittliche NVIDIA GeForce RTX 3080
  (Idle: 498 - 505, n=2 W)
502 Watt * -3%
AMD Radeon RX 6900 XT
AMD Radeon RX 6900 XT, R9 5950X (Idle: 99.15 W)
488.3 (459.99min - 512.79max) Watt *
Nvidia GeForce RTX 3090 Founders Edition
NVIDIA GeForce RTX 3090, R9 5900X (Idle: 91.1 W)
463.7 (450min - 487max) Watt * +5%
AMD Ryzen 9 5900X
NVIDIA Titan RTX, R9 5900X (Idle: 78.1 W)
439.6 (419min - 497max) Watt * +10%
KFA2 GeForce RTX 2080 Ti EX
NVIDIA GeForce RTX 2080 Ti (Desktop), R9 3900X (Idle: 100.5 W)
438.8 (431min - 463max) Watt * +10%
Durchschnittliche NVIDIA GeForce RTX 2080 Ti (Desktop)
  (Idle: 359 - 467, n=3 W)
422 Watt * +14%
Durchschnittliche NVIDIA Titan RTX
  (Idle: 371 - 463, n=26 W)
407 Watt * +17%
Durchschnittliche NVIDIA GeForce RTX 3070
  (Idle: 317 - 550, n=5 W)
401 Watt * +18%
MSI GeForce RTX 3070 Gaming X Trio
NVIDIA GeForce RTX 3070, R9 5900X (Idle: 95.1 W)
394.5 (381min - 430max) Watt * +19%
Nvidia GeForce RTX 2080 Super
NVIDIA GeForce RTX 2080 Super (Desktop), R7 2700X (Idle: 78.87 W)
382.8 (360min - 410max) Watt * +22%
Durchschnittliche AMD Radeon RX 5700 XT (Desktop)
  (Idle: 349 - 376, n=2 W)
363 Watt * +26%
Durchschnittliche NVIDIA GeForce RTX 2080 Super (Desktop)
  (Idle: 336 - 416, n=5 W)
363 Watt * +26%
AMD Radeon RX 5700 XT
AMD Radeon RX 5700 XT (Desktop), R7 2700X (Idle: 69.8 W)
348.7 (341min - 359max) Watt * +29%
Nvidia GeForce RTX 2070 Super
NVIDIA GeForce RTX 2070 Super (Desktop), R7 2700X (96.8 fps, Idle: 80.5 W)
344.7 (335min - 370max) Watt * +29%
Durchschnittliche NVIDIA GeForce RTX 2070 Super (Desktop)
  (Idle: 296 - 377, n=5 W)
340 Watt * +30%
AMD Radeon RX 5700
AMD Radeon RX 5700 (Desktop), R7 2700X (84.2 fps, Idle: 64.5 W)
295.9 (284min - 304max) Watt * +39%

* ... kleinere Werte sind besser

Geräuschpegel

AMDs neuer Triple-Lüfter scheint bei akzeptabler Geräuschkulisse zu arbeiten. Im Fan-Stop-Modus entspricht das Sound Pressure Level (SPL) weitestgehend der Umgebungslautstärke von 28,70 db(A) bei einer Messentfernung von 20 cm vom geschlossenen Gehäuse.

Während des FurMark-Stresses stieg das SPL auf 44,13 db(A), was noch immer tolerabel ist, zumindest bei geschlossenem Gehäuse. Über die Radeon-Software Adrenalin Edition oder Dritthersteller-Tools wie MSI Afterburner können Nutzer die Temperatur- und Geräuschentwicklung der Karte weiter beeinflussen.

Geräuschkulisse - Leerlauf mit deaktivierten Lüftern
Geräuschkulisse - FurMark-Stress mit deaktivierten Gehäuselüftern

Pro

+ gute Verarbeitungsqualität
+ Aluminium-Backplate
+ Dreifachlüfter
+ USB-Typ-C-Anschluss
+ Leistung zwischen einer RTX 3080 und RTX 3090 in den meisten synthetischen und 4K-Gaming-Benchmarks
+ gute Performance in professionellen 3D-Anwendungen
+ Stromverbrauch auf dem Niveau einer RX 6800 XT und weniger als RTX 3090
+ kompletter Lüfterstopp im Leerlauf
+ Tolerierbarer Geräuschpegel unter Stress
+ 500 Euro billigere UVP als RTX 3090

Contra

- Rechenleistung könnte noch besser sein
- Raytracing deutlich hinter RTX 3080 und RTX 3090
- noch kein KI-basiertes Super-Sampling
- Smart Access Memory von geringer Bedeutung in den meisten Spielen
- hohe Kern- und Oberflächentemperaturen unter Last
- sporadische Drosselung unter Last
- Gesamtleistung nur unwesentlich besser als RX 6800 XT
- sehr begrenzte Lagerbestände

Fazit

Die AMD Radeon RX 6900 XT, zur Verfügung gestellt von AMD India

Mit der Radeon RX 6900 XT sind AMDs Tage als GPU-Underdog offiziell vorbei. Die RX 6900 XT hat definitiv das Zeug dazu es mit NVIDIAs Flaggschiff-Angeboten aufzunehmen, was sich in den meisten Tests widerspiegelt. Mit den aktuellen Navi-2x-Karten hat AMD zudem ein ansehnlichere Design aufgesetzt, inklusive RGB-Radeon-Logo und einem Triple-Fan-Lüfter, der gegenüber dem alten Gebläselüfter eine verbesserte thermische Leistung entfaltet.

Die RX 6900 XT schlägt sich ziemlich gut und übertrifft die RTX 3090 sogar in einigen ausgewählten, synthetischen Benchmarks. Betrachtet man dann noch die UVP von 1.000 Euro gegenüber den 1.549 Euro für eine RTX 3090, nimmt man das nur leichte Leistungsdefizit für eine Preisersparnis von rund 550 Euro wohl gern in Kauf. Zusätzlich sehen wir ausgezeichnete Ergebnisse in professionellen Anwendungen, wodurch die RX 6900 XT auch hier eine gute Wahl darstellt, sofern der Workload nicht von CUDA abhängig ist.

Gamers, die nach einer AMD-Flaggschiff-Karte gesucht haben, die eine berechtigte Alternative zu NVIDIAs Angeboten darstellt, werden die RX 6900 XT in Betracht ziehen, vor allem wenn die Spiele für AMD-Hardware optimiert sind. Treiber für die Radeon-Software Adrenalin haben einen langen Weg hinter sich, was ihre Stabilität anbelangt und die Integration von sowohl Ryzen- als auch Radeon-Tuning-Optionen in der aktuellsten Version ist definitiv ein Schritt in die richtige Richtung. Smart Access Memory ist zwar schön zu haben, spielt bei der Mehrheit der heutigen Spiele aber kaum eine Rolle.

Leider hängt AMD noch immer in zwei Technologien, welche immer mehr Verwendung bei Games-Entwicklern finden, NVIDIA hinterher — Ray Tracing und KI-basiertem Super Sampling. Die Ray-Tracing-Leistung der RX 6900 XT liegt zwar schon auf RTX-2080-Ti-Niveau, wird von einer RTX 3080 oder gar RTX 3090 aber klar übertroffen. Außerdem muss AMD noch eine Lösung für das Super Sampling finden, welche es mit NVIDIAs Deep Learning Super Sampling (DLSS) aufnehmen kann.

Die acht zusätzlichen CUs in der RX 6900 XT scheinen keine signifikanten Mehrgewinn an Gaming-Leistung gegenüber einer 72-CU RX 6800 XT zu bieten. Wer also eine reine Gaming-Grafikkarte sucht, ist vermutlich mit der "nur" 650 Euro teuren RX 6800 XT besser beraten.

Die AMD Radeon RX 6900 XT ist genau das, was sich Team-Red-Fans seit Jahren erhofft haben, um die Konkurrenz aufrecht zu erhalten. Zwar kann eine RX 6900 XT eine NVIDIA GeForce RTX 3090 insgesamt nicht wirklich schlagen, aber sie kommt definitiv in deren Reichweite und kann NVIDIAs Topmodell in einigen Bereichen sogar übertreffen. Sie stellt eine gute Wahl dar sofern Next-Gen-Features wie Ray Tracing und KI-basiertes Super Sampling keine absolute Priorität haben.

Die RX 6900 XT hilft nicht unbedingt dabei bei der nächsten Energiekostenabrechnung zu sparen. Insgesamt ist sie aber dennoch etwas ökonomischer als eine RTX 3080 oder RTX 3090. Während die Geräuschkulisse unter hoher Last im akzeptablen Bereich bleibt, bewegen sich die Temperaturen im Grenzbereich, sodass es im Stresstest zu sporadischen Drosselungen kommen kann. 

Da RDNA 2 zur wichtigsten Grafikhardware für die Konsolen der nächsten Generation wie die Xbox Series X/S und die PlayStation 5 wird, gibt es ein großes Cross-Plattform-Potential, das die Entwickler ausloten können. Hoffentlich wird AMD so gut es geht noch an der Ray-Tracing-Front herumschustern und eine kompetitive DLSS-Alternative in den kommenden Monaten vorstellen.

Preise und Verfügbarkeit

AMD's Lagerbestände der Radeon RX 6900 XT sind angeblich aufgebraucht, der Hersteller hat aber versprochen, dass das Referenzmodell auch weiterhin angeboten wird. Während die Bestände bald wieder aufgefüllt werden sollen, können je nach Liefersituation auch Add-In-Board-Partnerkarten (AiB) von MSI, Sapphire, XFX und PowerColor online erhältlich sein.

Derweil werden aktuell Mondpreise für Grafikkarten aufgerufen, das sollte mittlerweile bekannt sein. Auf Amazon kostet die Radeon RX 6900 XT derzeit zwischen rund 2.000 Euro und 2.500 Euro

Daher können wir den Kauf derzeit explizit nicht empfehlen sondern plädieren dafür die Preise im Auge zu behalten und abzuwarten bis sich diese wieder einem erträglicheren Niveau annähern.

Preisvergleich

Alle 3 Beträge lesen / Antworten
static version load dynamic
Loading Comments
Diesen Artikel kommentieren / Antworten
Teilen Sie diesen Artikel, um uns zu unterstützen. Jeder Link hilft!
> Notebook Test, Laptop Test und News > Tests > Notebook Testberichte > AMD Radeon RX 6900 XT im Test: Performance fast auf RTX-3090-Niveau für 550 € weniger, aber nur marginal besser als eine RX 6800 XT
Autor: Vaidyanathan Subramaniam,  5.05.2021 (Update: 10.05.2021)