Notebookcheck Logo

Zotac Gaming GeForce RTX 3070 Twin Edge im Test: Die Leistung einer RTX 2080 Ti für jedermann

Fast and furious. Die NVIDIA RTX 3070 verspricht die Leistung einer RTX 2080 Ti für weniger als die Hälfte des Preises. Die Zotac Gaming GeForce RTX 3070 Twin Edge bringt alle Vorteile des Ampere-GA104 in einem kompakten 2-Slot-Gehäuse unter. Natürlich schauen wir in diesem Test auf die Leistung der Zotac RTX 3070 Twin Edge und klären, ob diese den Nvidia-Behauptungen entspricht.
Zotac Gaming GeForce RTX 3070 Twin Edge. (Bildquelle: Zotac)

Während NVIDIAs Ampere-Launch Ende letzten Jahres wurde viel darüber gesprochen, wie die GeForce RTX 3080 nun endlich 4K-Gaming im Mainstream salonfähig macht, während die RTX 3090 die Titan RTX ersetzt. Aber inmitten der ganzen Aufregung gab es eine herausragende Karte: die GeForce RTX 3070.

Denn Nvidia versprach für die RTX 3070 die Leistung einer RTX 2080 Ti für weniger als die Hälfte des Preises! Zwar bietet die RTX 3070 keinen GDDR6X-Speicher, bringt weniger VRAM mit und kommt dadurch auf eine geringere Speicherbandbreite als eine RTX 2080 TI. Dennoch, die Kombination aus nun noch mehr CUDA-Cores, Tensor-Cores der dritten Generation, RT-Cores der zweiten Generation und höhere Taktraten hieven die RTX 3070 auf die Geschwindigkeit des Turing-Flaggschiffs.

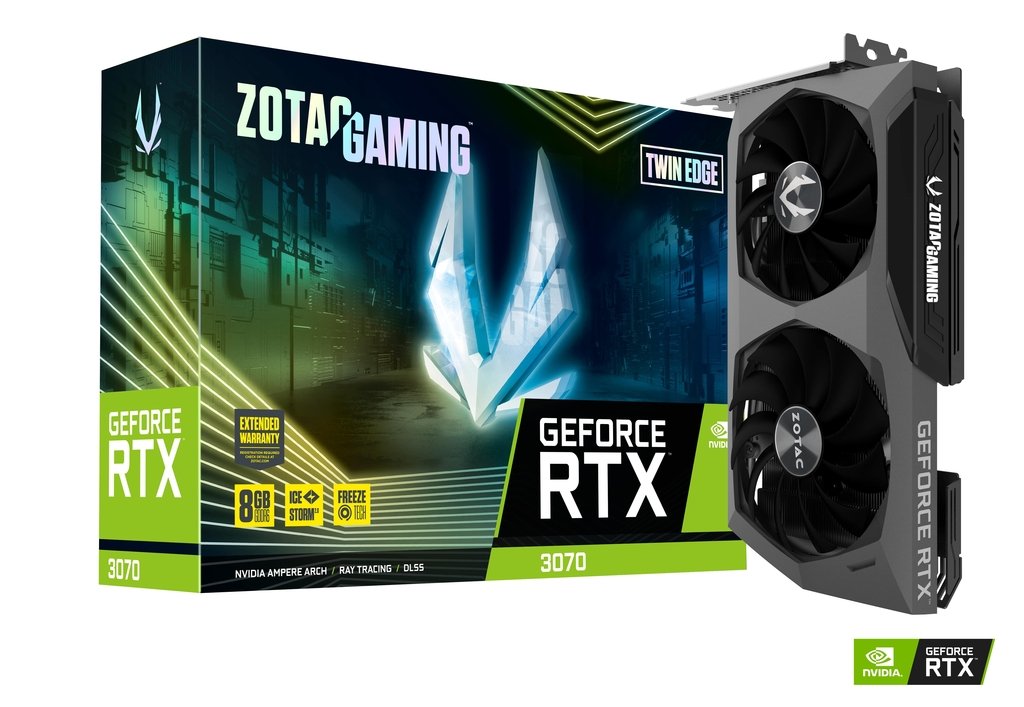
Bei der Zotac Gaming GeForce RTX 3070 Twin Edge handelt es sich, wie der Name bereits andeutet, um eine Grafikkarte mit Dual-Lüfter, die es sowohl in übertakteten (OC) als auch nicht übertakteten (Non-OC) Versionen gibt. Im Test haben wir die GPU ohne hochgeschraubte Taktraten, diese liegen beim Testmodell sogar knapp unterhalb derer in der Founders Edition, bei theoretisch gleicher Leistung von 220 W.  

Die OC-Version taktet allerdings auch nur unbedeutende 5 MHz höher. Wer von Haus aus mehr Boost benötigt, sollte sich gleich die Zotac RTX 3070 AMP Holo (240 W) und Super Mini (215 W) anschauen, alternativ auch die MSI GeForce RTX 3070 Gaming X Trio.

Vergleich der RTX 3070 mit anderen NVIDIA-GPUs

Specification RTX 3090 RTX 3080 FE Zotac RTX 3070 Twin Edge RTX 3070 FE Titan RTX RTX 2080 Ti RTX 2080 RTX 2070 S TITAN X Pascal
Chip GA102 GA102 GA104 GA104 TU102 TU102 TU104 TU104 GP102
FinFET process 8 nm 8 nm 8 nm 8 nm 12 nm 12 nm 12 nm 12 nm 16 nm
CUDA cores 10,496 8,704 5,888 5,888 4,608 4,352 2,944 2,560 3,584
Texture units 328 272 184 184 288 272 184 160 224
Tensor cores 328 3rd Gen. 272 3rd Gen. 184 3rd Gen. 184 3rd Gen. 576 2nd Gen. 544 2nd Gen. 368 2nd Gen. 320 2nd Gen.
RT cores 82 68 46 46 72 68 46 40
GPU base clock 1,395 MHz 1,440 MHz 1,500 MHz 1,500 MHz 1,350 MHz 1,350 MHz 1,515 MHz 1,605 MHz 1,417 MHz
GPU boost clock 1,695 MHz 1,710 MHz 1,725 MHz 1,750 MHz 1,770 MHz 1,545 MHz 1,710 MHz 1,770 MHz 1,531 MHz
Memory bus 384-bit 320-bit 256-bit 256-bit 384-bit 352-bit 256-bit 256-bit 384-bit
Memory bandwidth 936 GB/s 760 GB/s 448 GB/s 448 GB/s 672 GB/s 616 GB/s 448 GB/s 448 GB/s 480.4 GB/s
Video memory 24 GB GDDR6X 10 GB GDDR6X 8 GB GDDR6 8 GB GDDR6 24 GB GDDR6 11 GB GDDR6 8 GB GDDR6 8 GB GDDR6 12 GB GDDR5X
Power consumption 350 W 320 W 220 W 220 W 280 W 250 W 215 W 215 W 250 W

Die Zotac Gaming GeForce RTX 3070 Twin Edge näher betrachtet

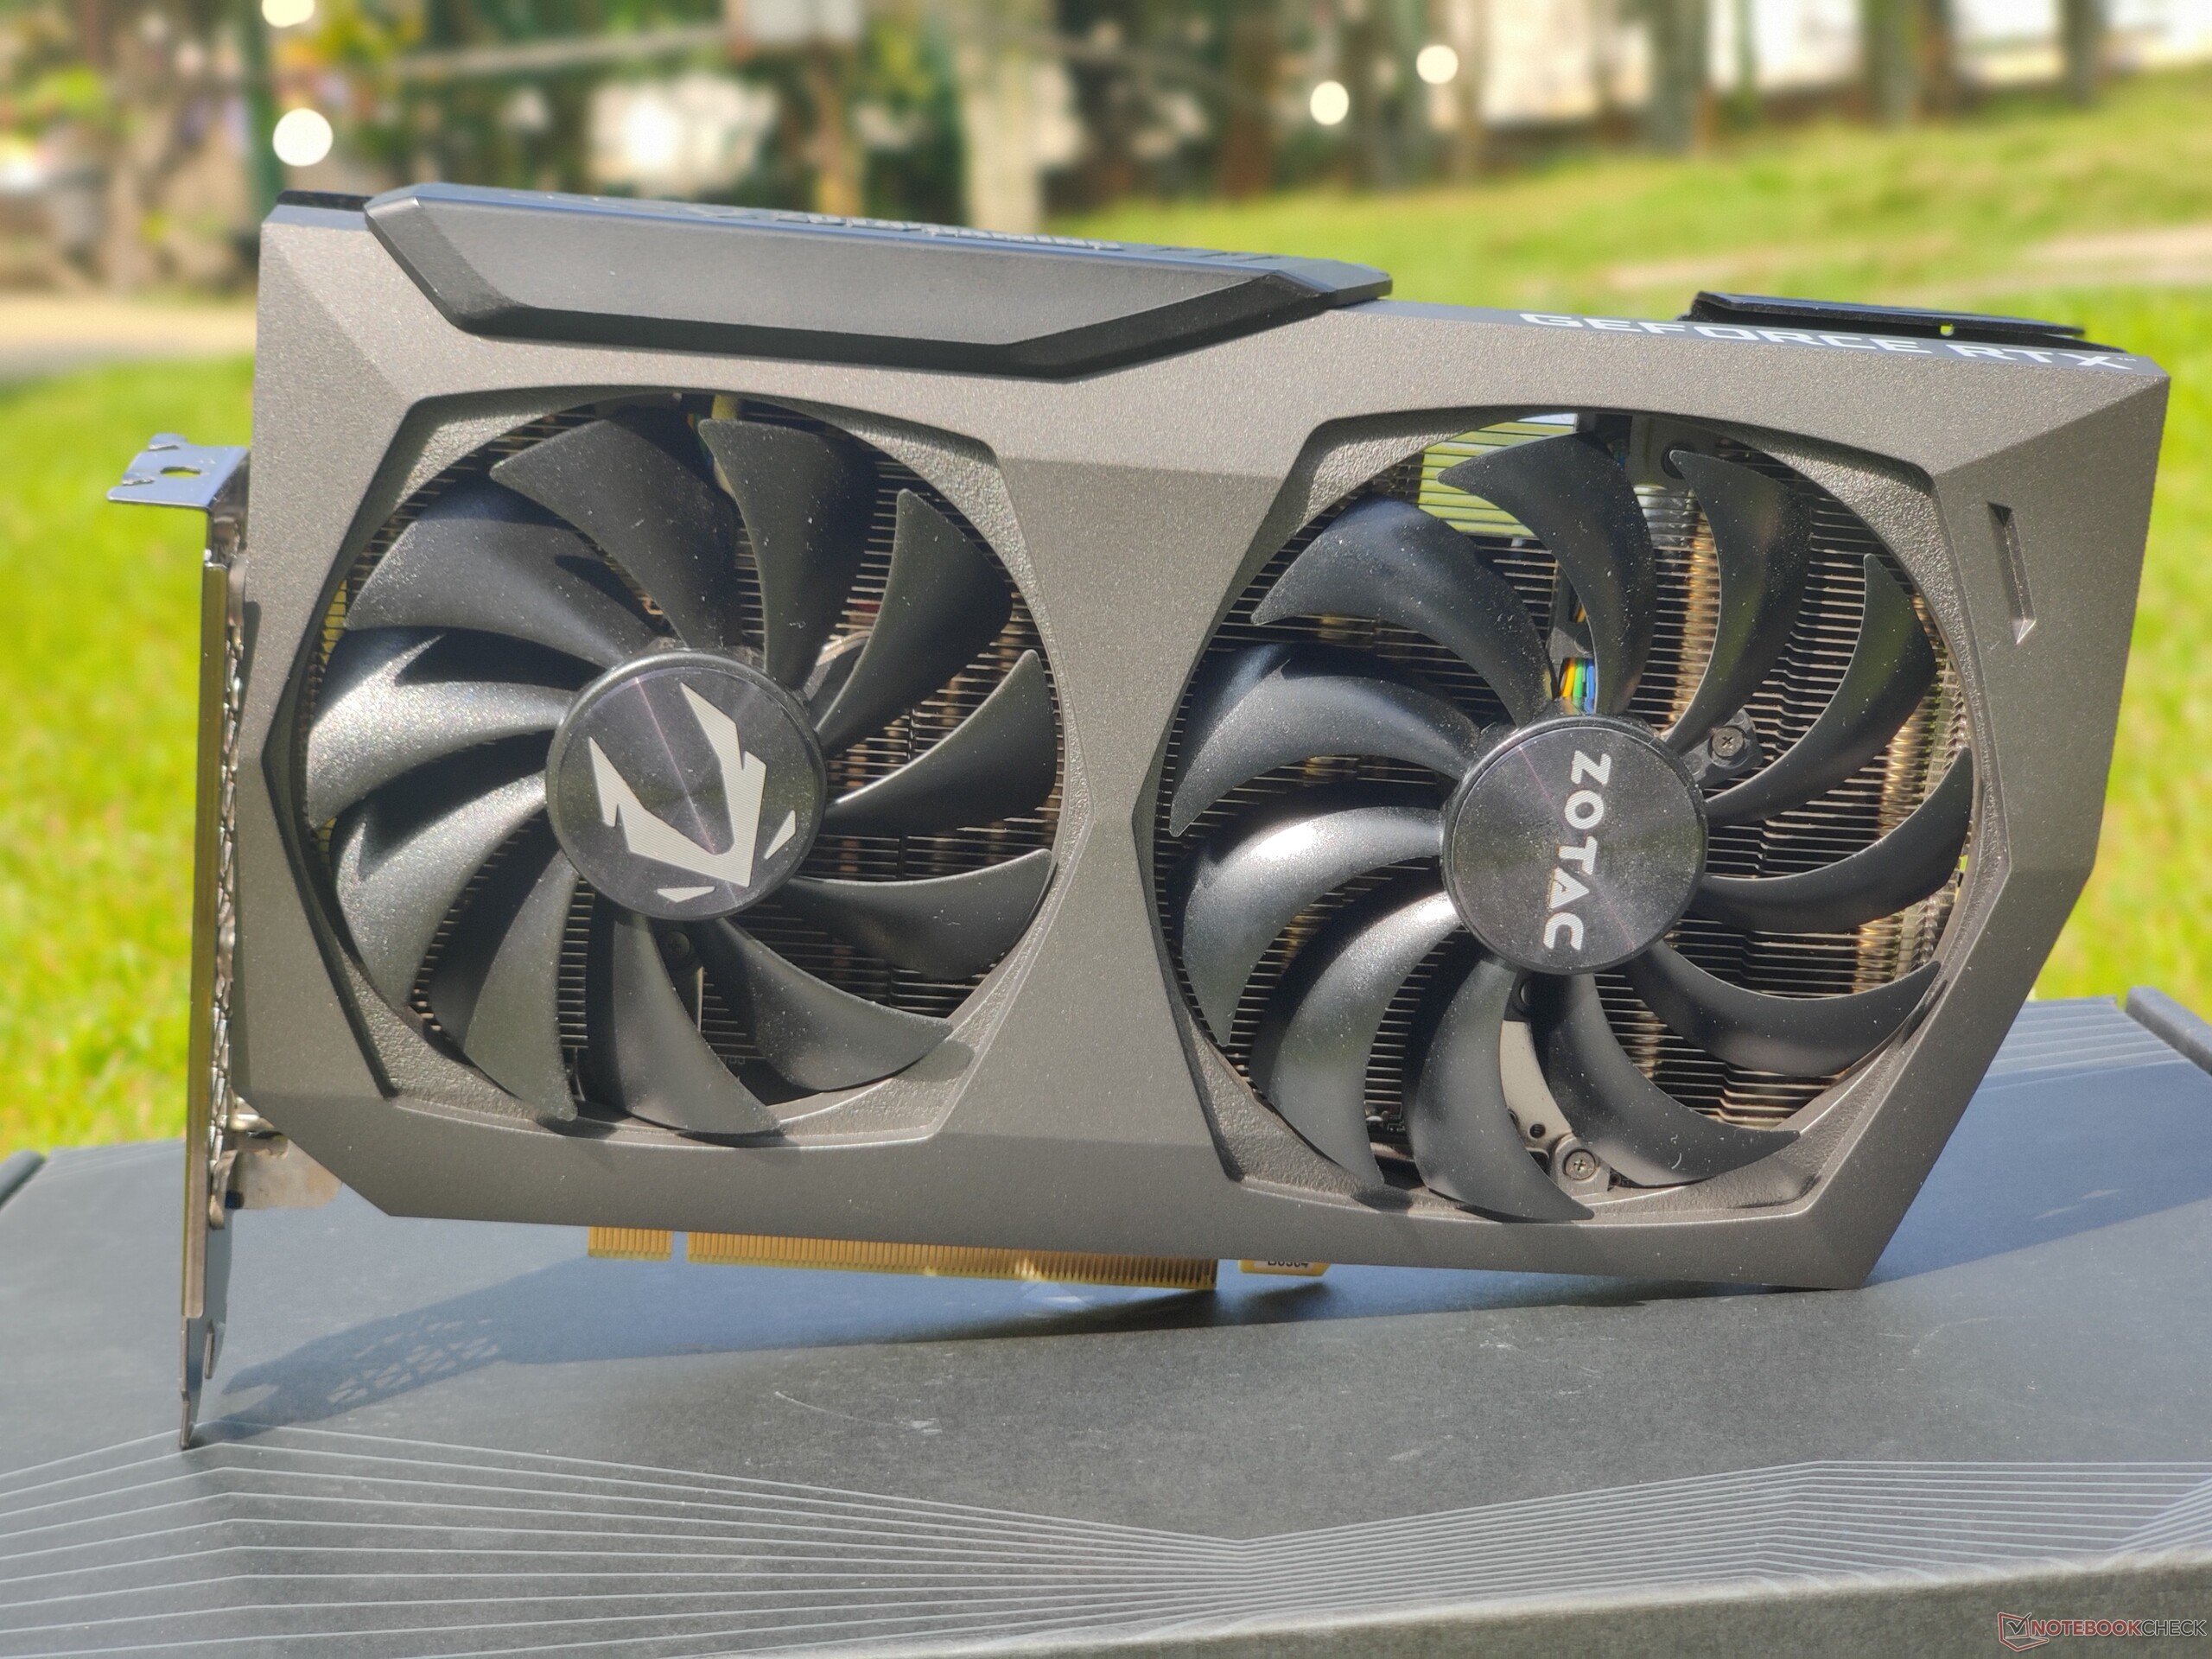
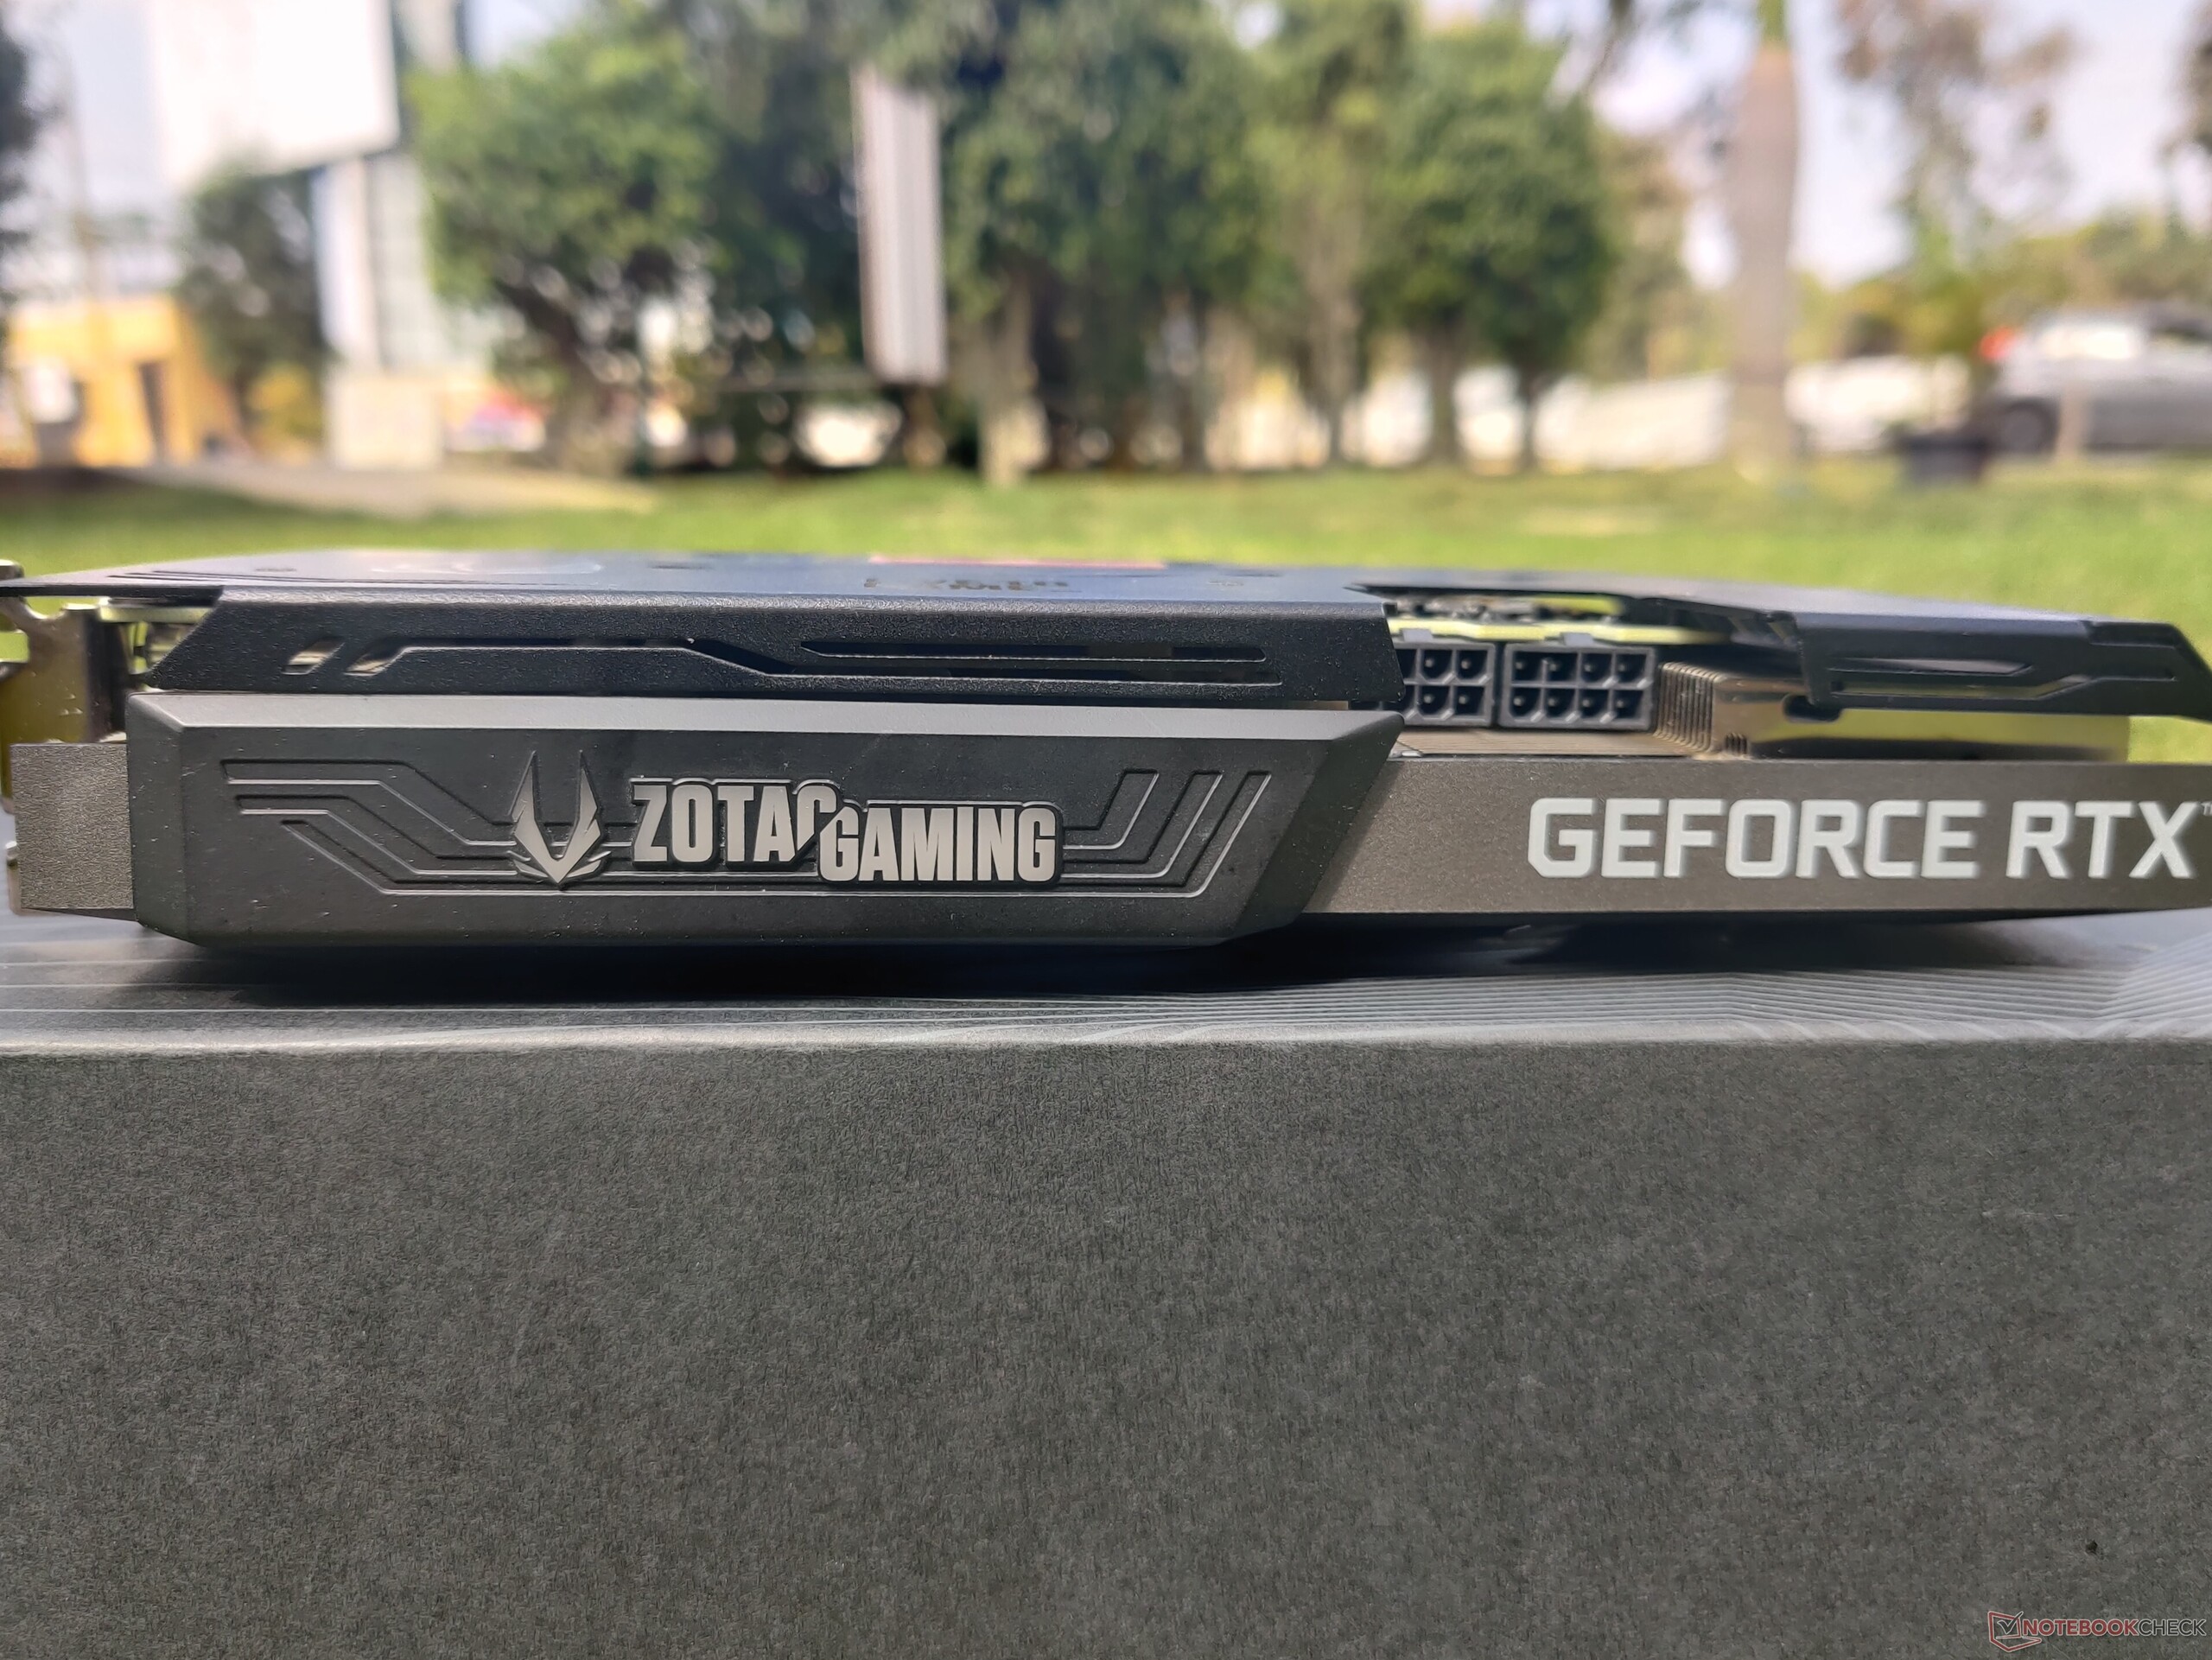
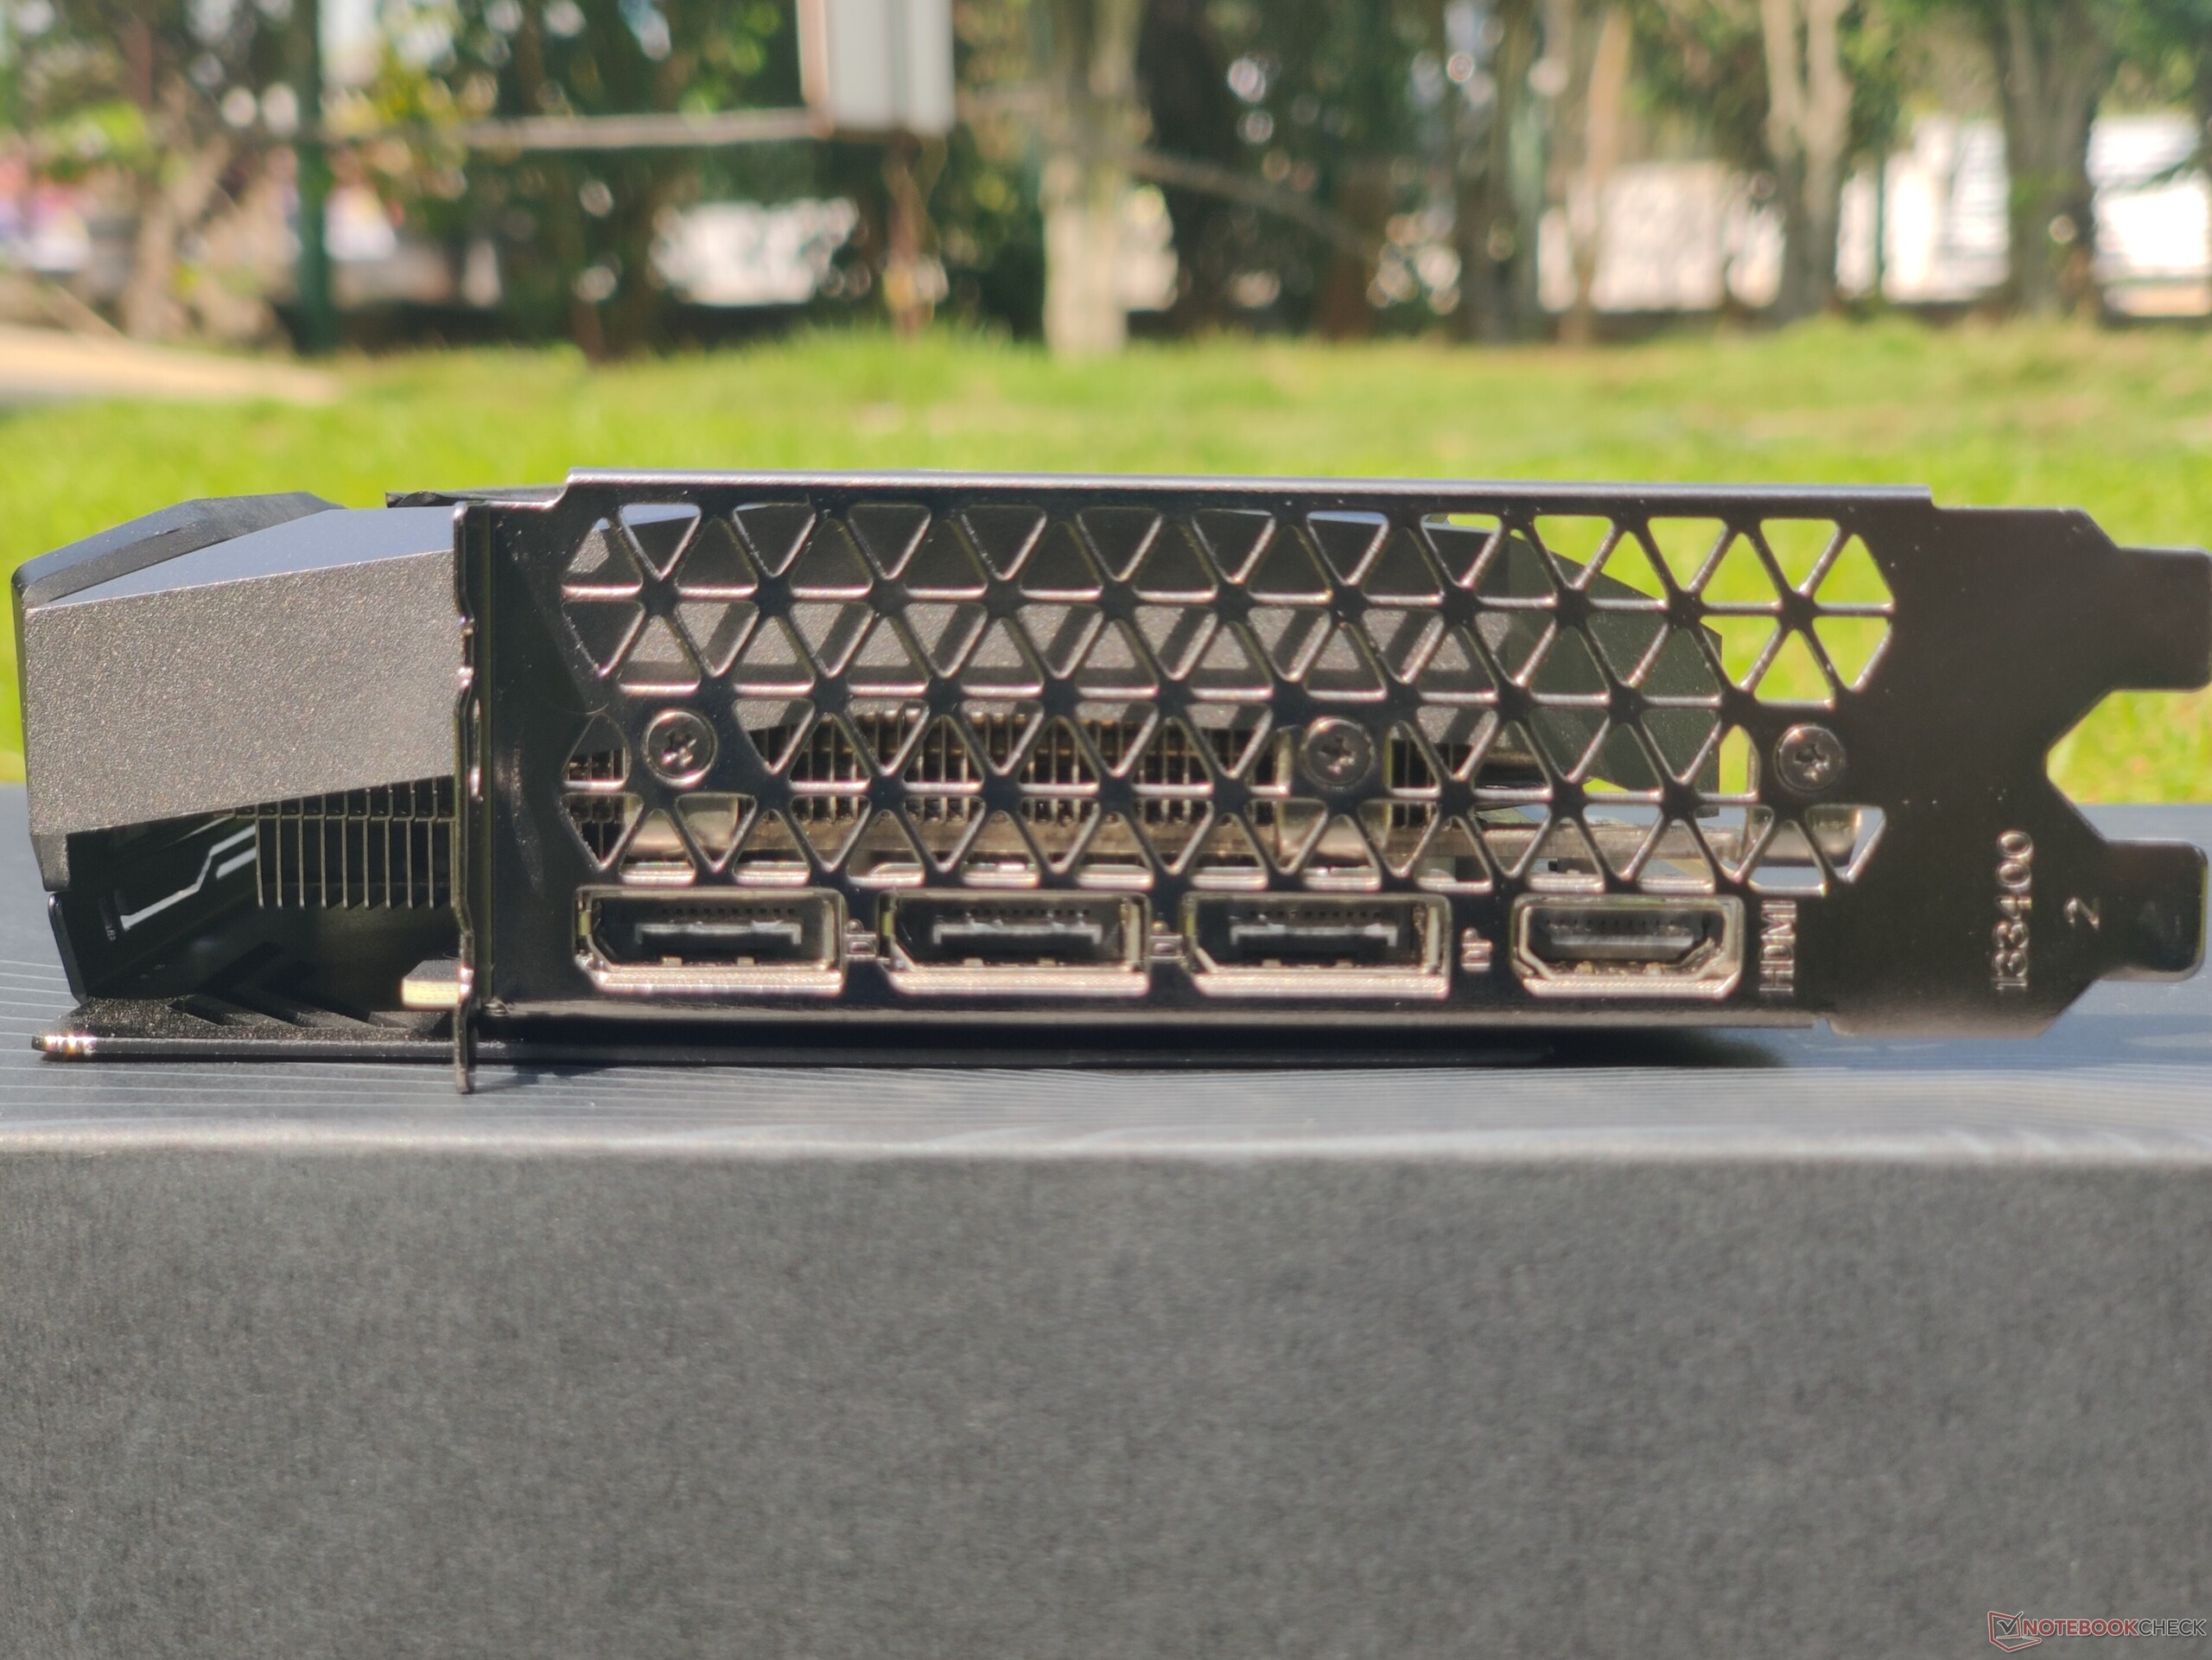
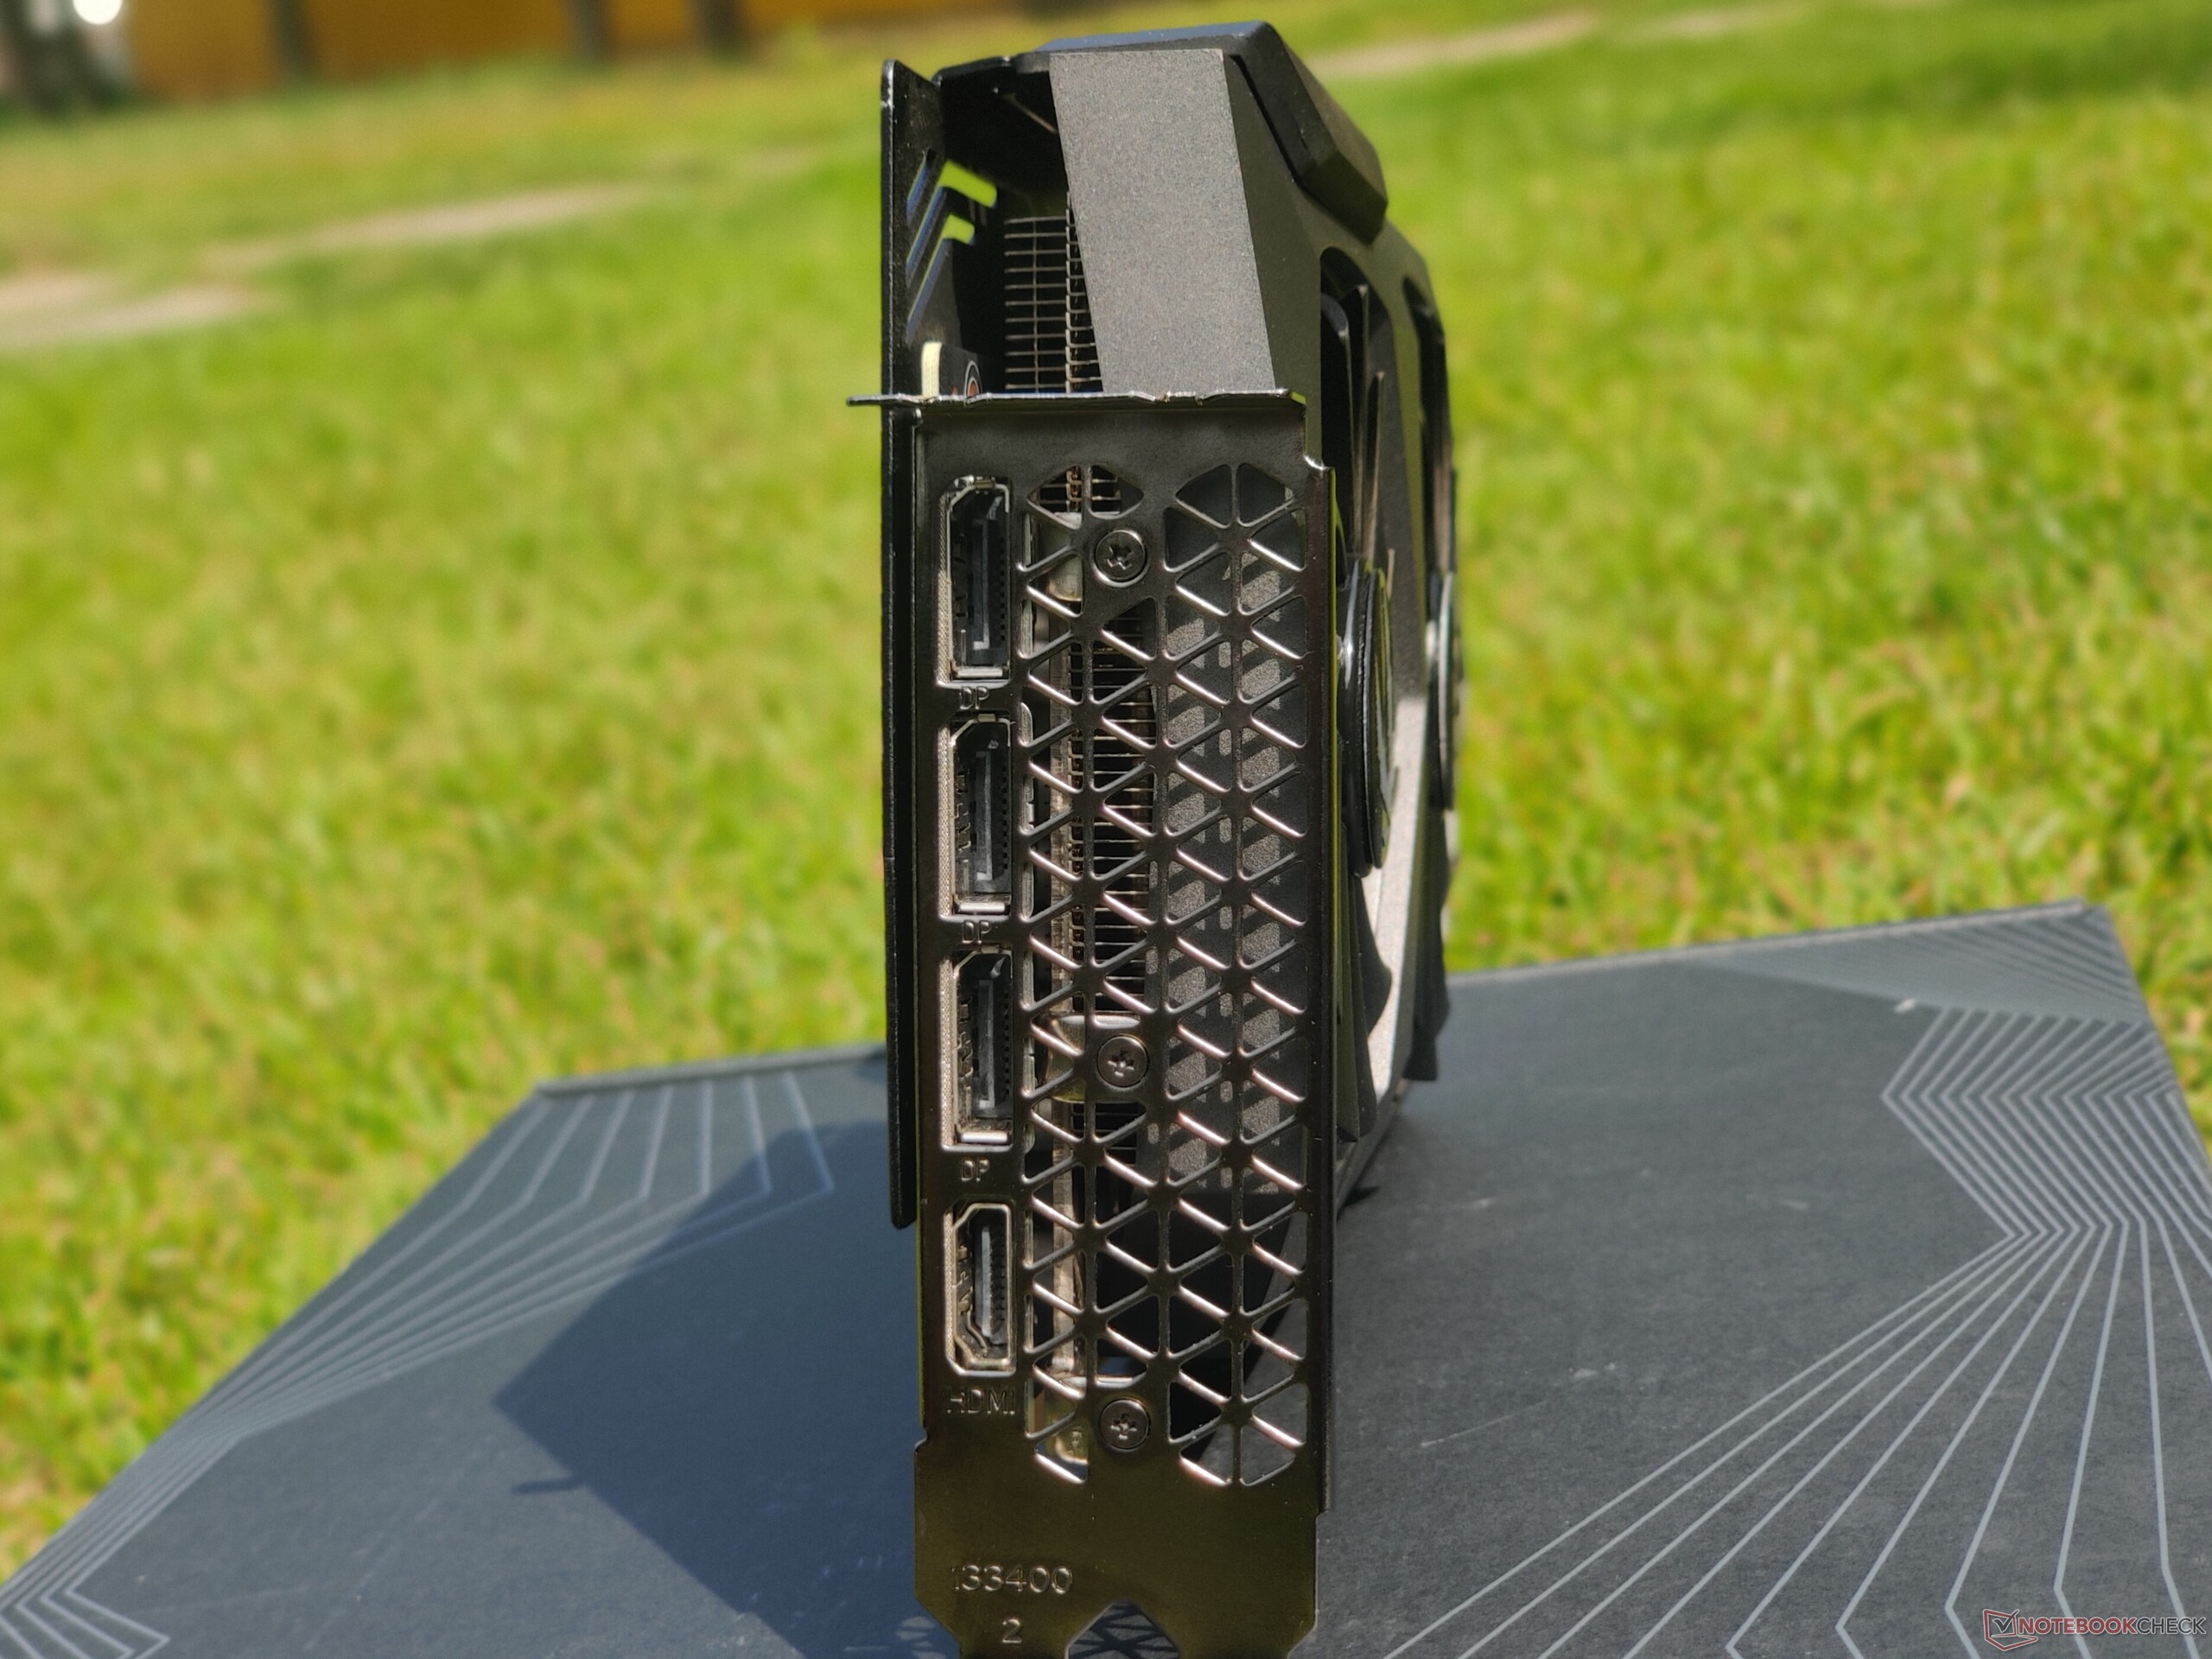
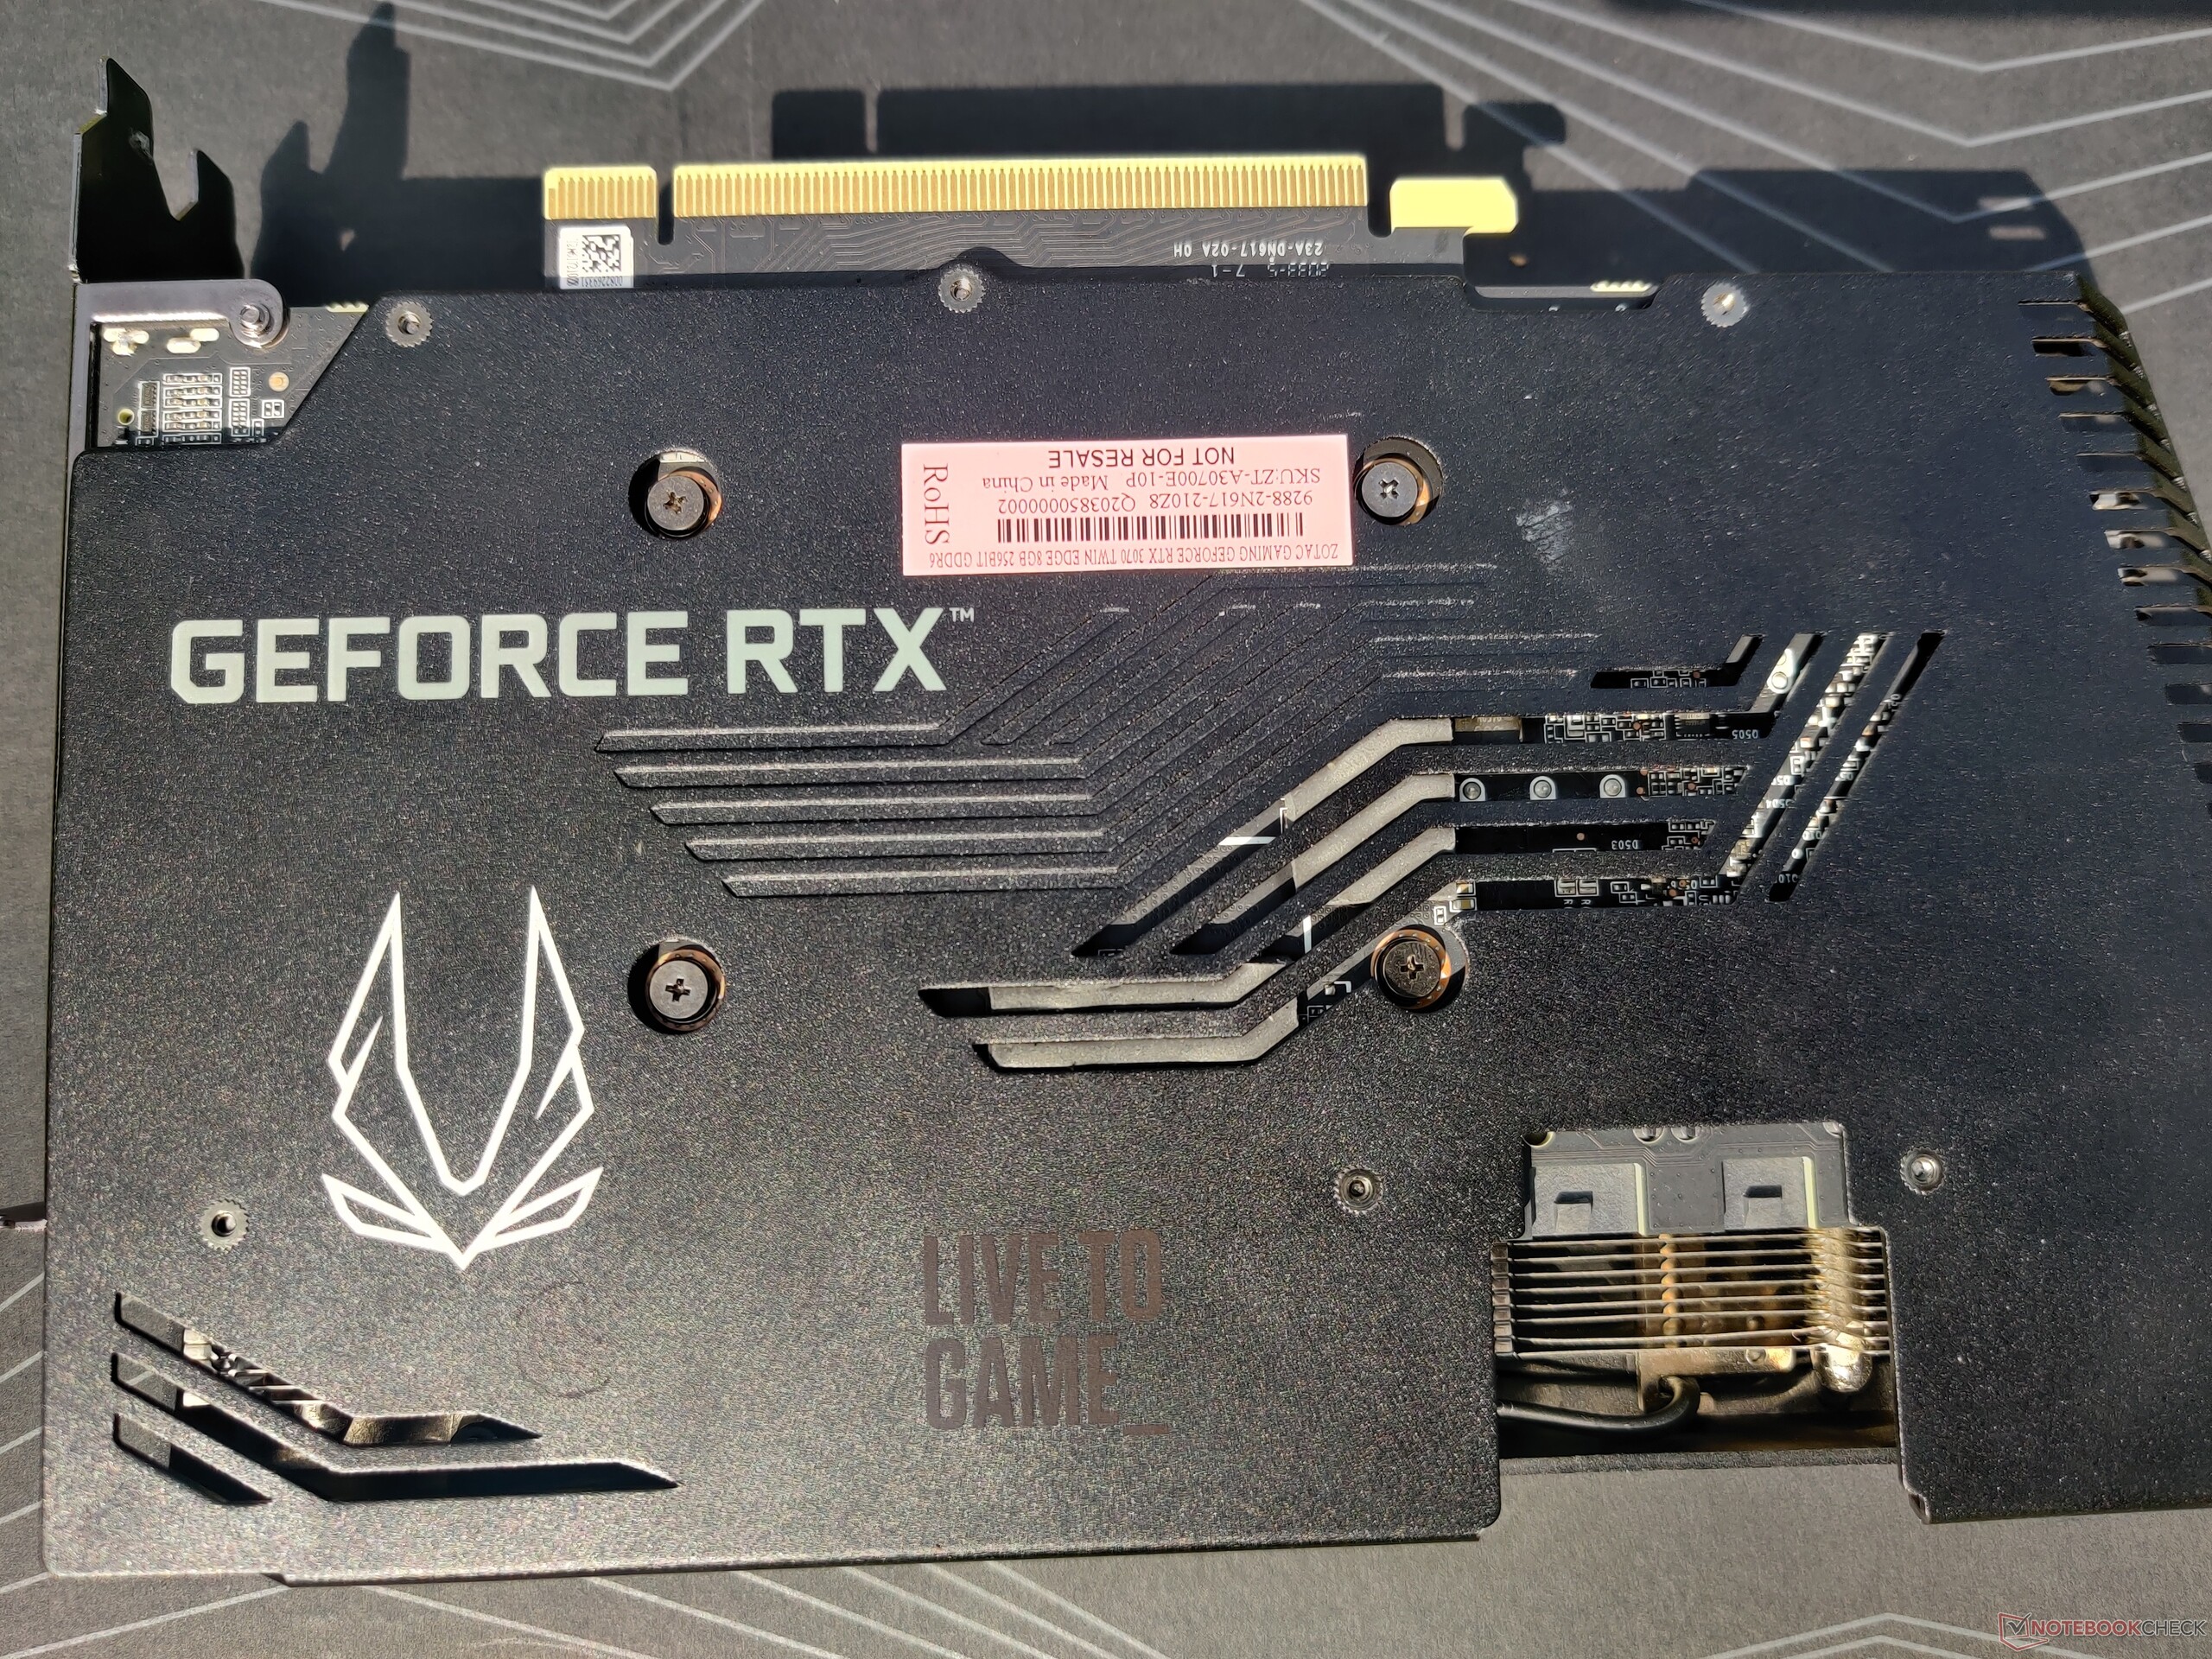
Optisch wird die Zotac Gaming RTX 3070 Twin Edge nicht unbedingt für verdrehte Hälse sorgen, aber sie glänzt mit einem schnörkellosen, minimalistischen Design. Es gibt kein RGB-Geblinke und Zotacs Gaminglogo leuchtet nur in Weiß. Die Karte bietet zwei 8-Pin-Power-Verbindungen und vier Videoausgänge, bestehend aus drei DisplayPort-1.4a-Slots und einem HDMI-2.1-Ausgang.

Die zwei 8-Pin-Verbindungen liegen wie bei vielen Zotac-Karten von rechts aus gesehen etwas weiter innen, bei einigen Nutzern sind dann womöglich die PSU-Kabel etwas zu kurz. Glücklicherweise legt Zotac zwei 6-Pin-auf-8-Pin-Adapter bei, wodurch sich das Problem notfalls lösen lässt. Im Test gab es keinerlei Stabilitätsprobleme beim Betrieb mit diesen Kabeln.

Zotac gewährt eine 3-jährige Standard-Garantie für alle RTX-3000-Karten. Diese kann durch eine Registrierung auf der Zotac-Website um zwei weitere Jahre verlängert werden. Allerdings greift diese Garantieregelung nur in EMEAI-Regionen.

Käufer in Nordamerika (USA und Kanada) bekommen nur 2 Jahre Garantie, welche sich über die Registrierung innerhalb von 30 Tagen nach dem Kauf um ein weiteres Jahr verlängern lässt.

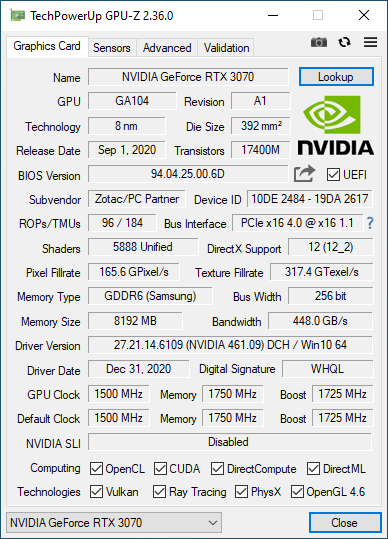
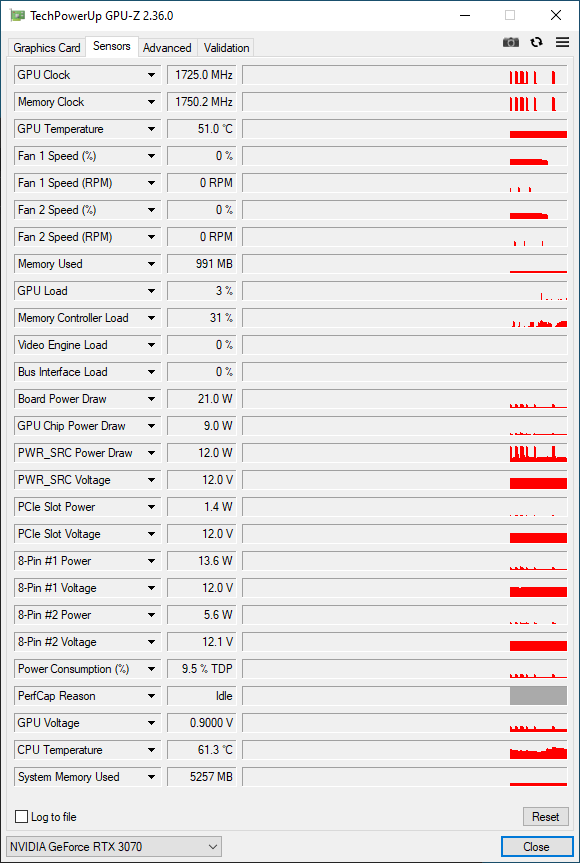
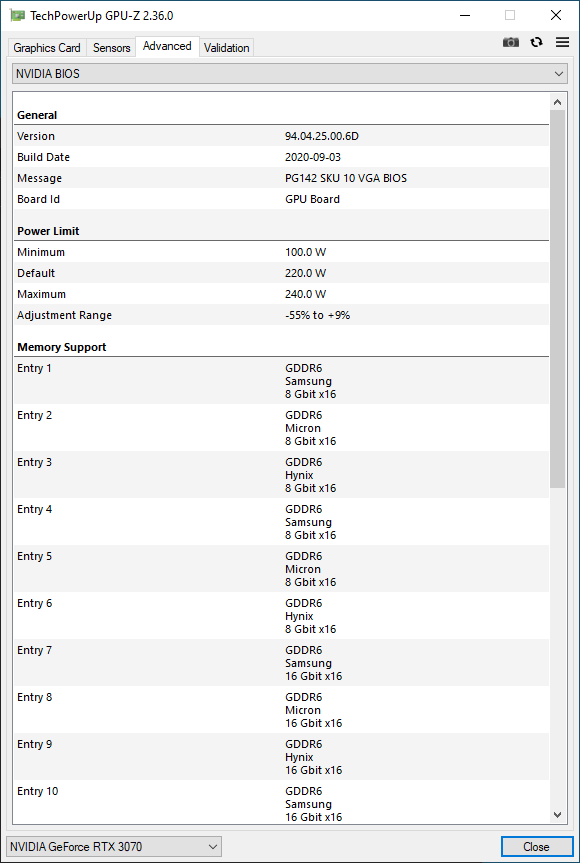
GPU-Z hält keine Überraschungen parat, weil Zotac die Werte der Founders Edition kaum optimiert hat. Die RTX 3070 Twin Edge läuft mit einem Basistakt von 1.500 MHz und kann auf bis zu 1.725 MHz hochboosten. Der TGP der RTX 3070 liegt zwar offiziell bei 220 W, lässt sich aber um 9 Prozent auf 240 W hochschrauben. Der Hauptteil der zusätzlichen Energie sollte auch bei der GPU selbst ankommen, immerhin gibt es kein RGB und die Karte hat nur einen Dual-Lüfter.

Unser Testsystem

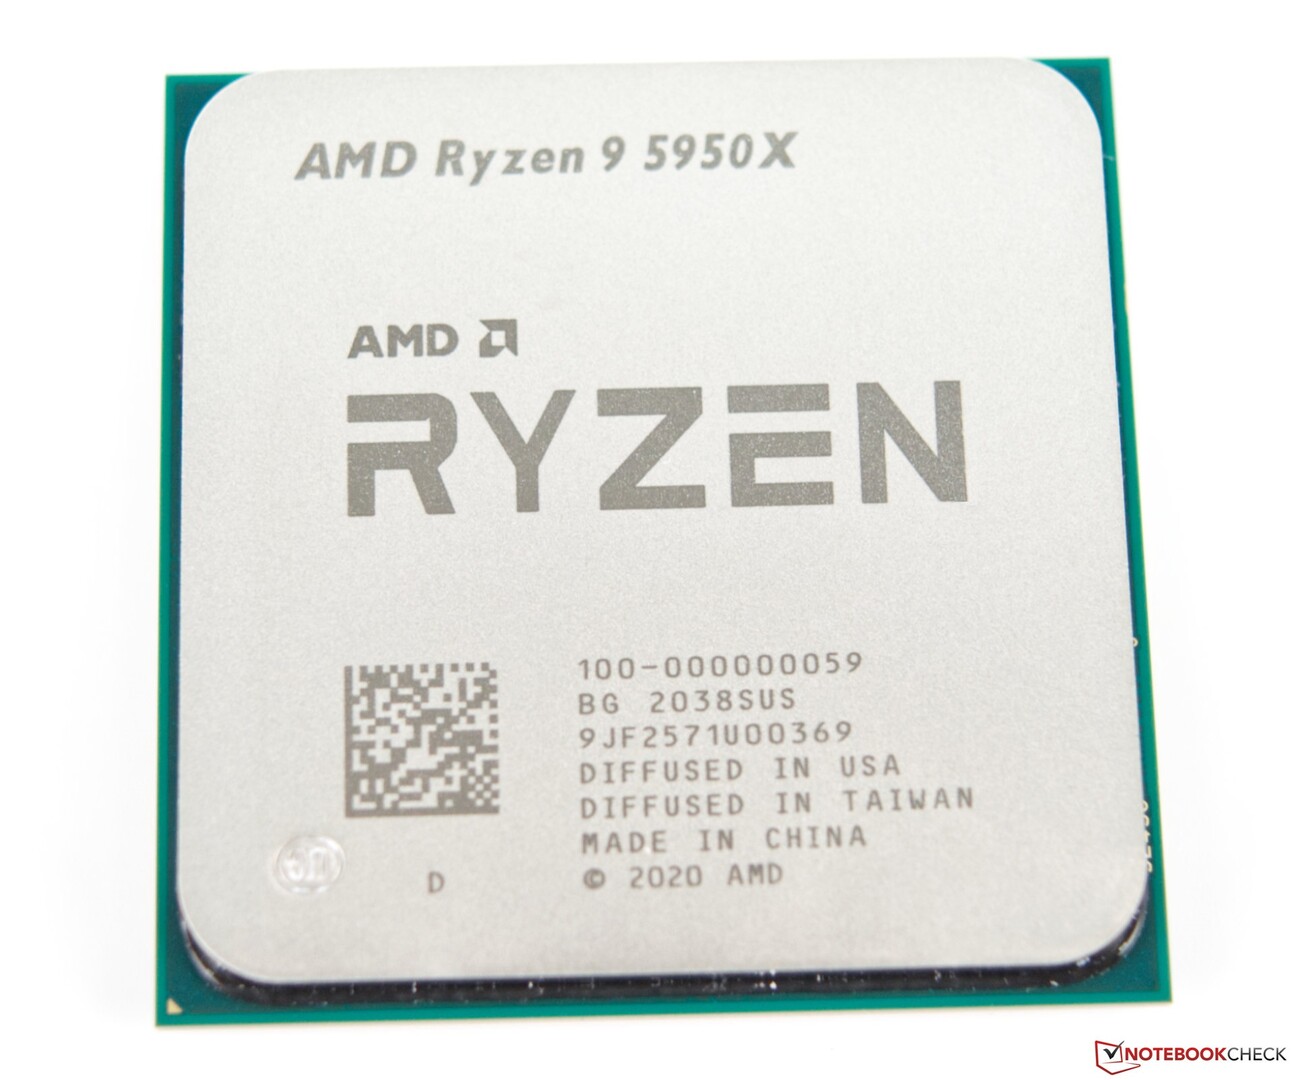
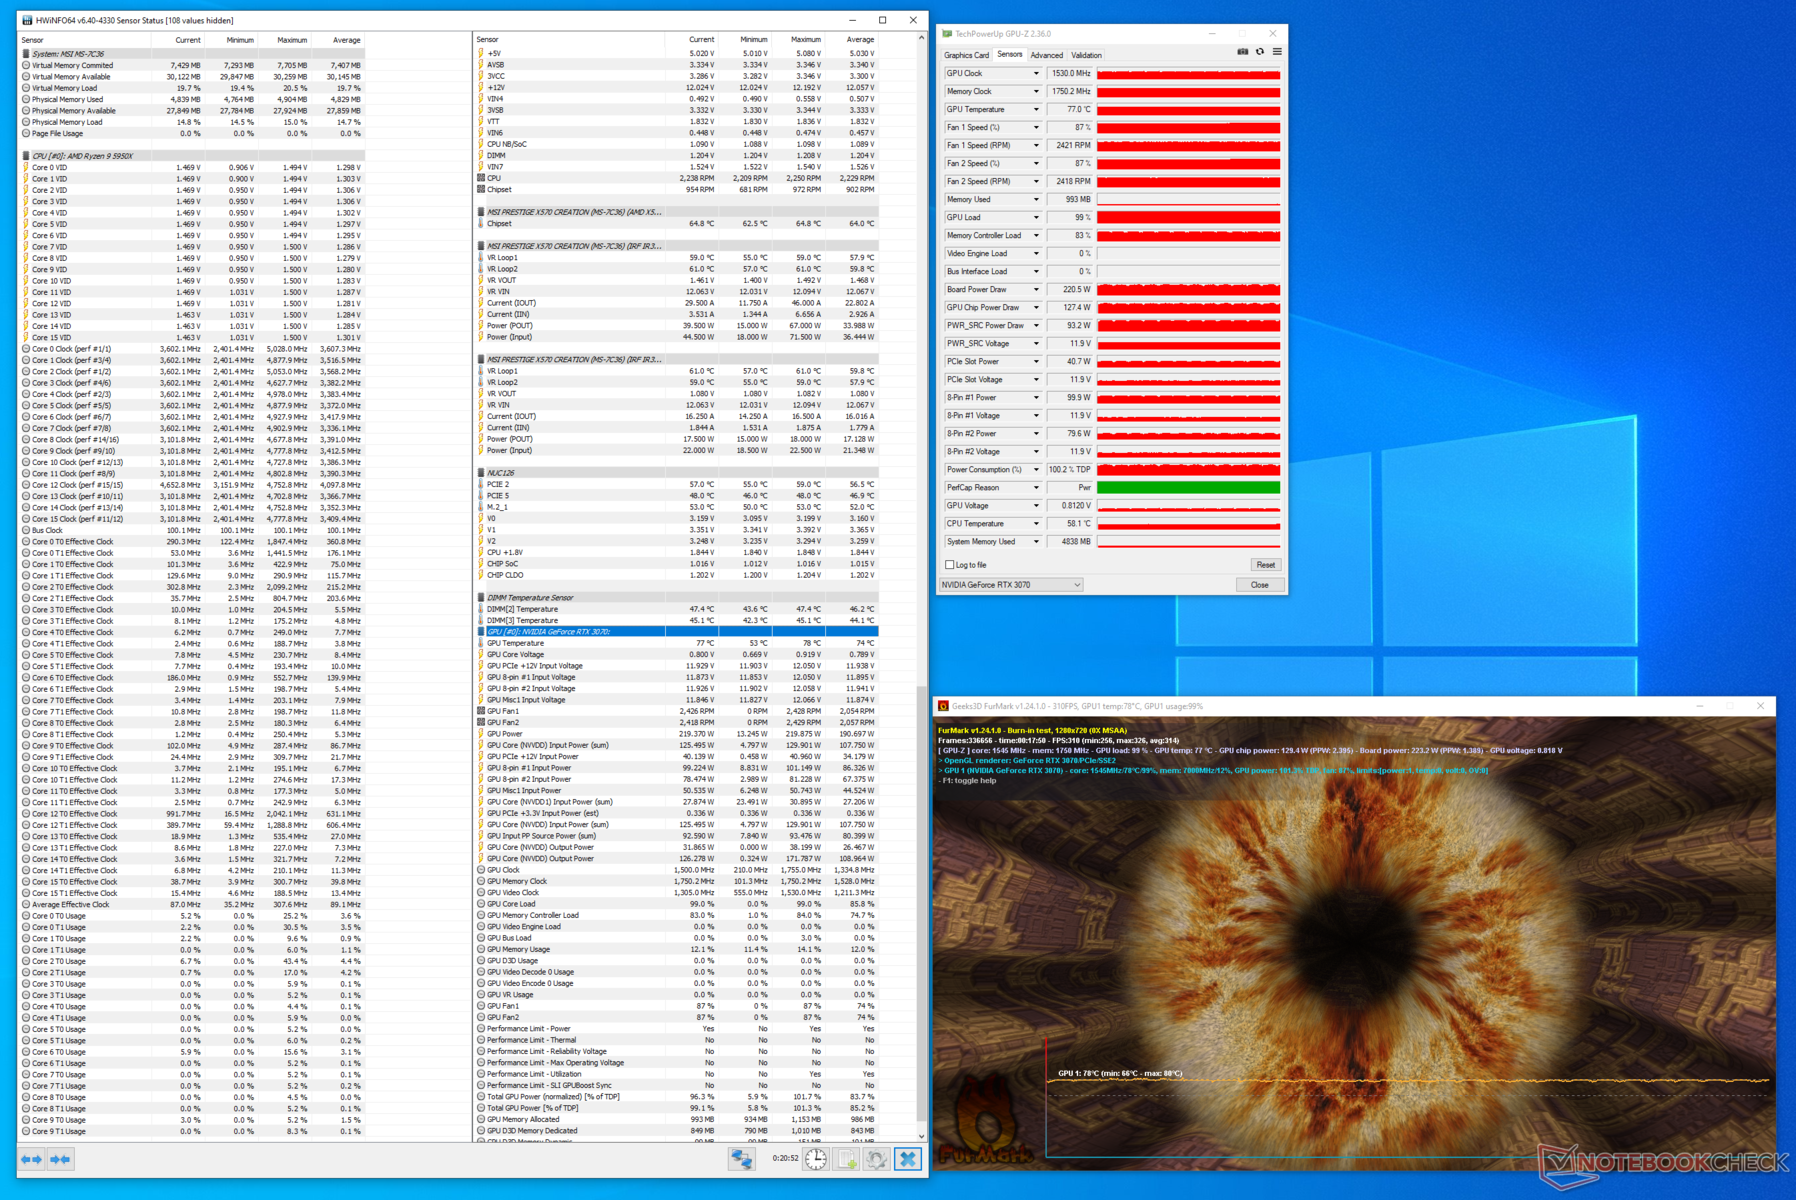
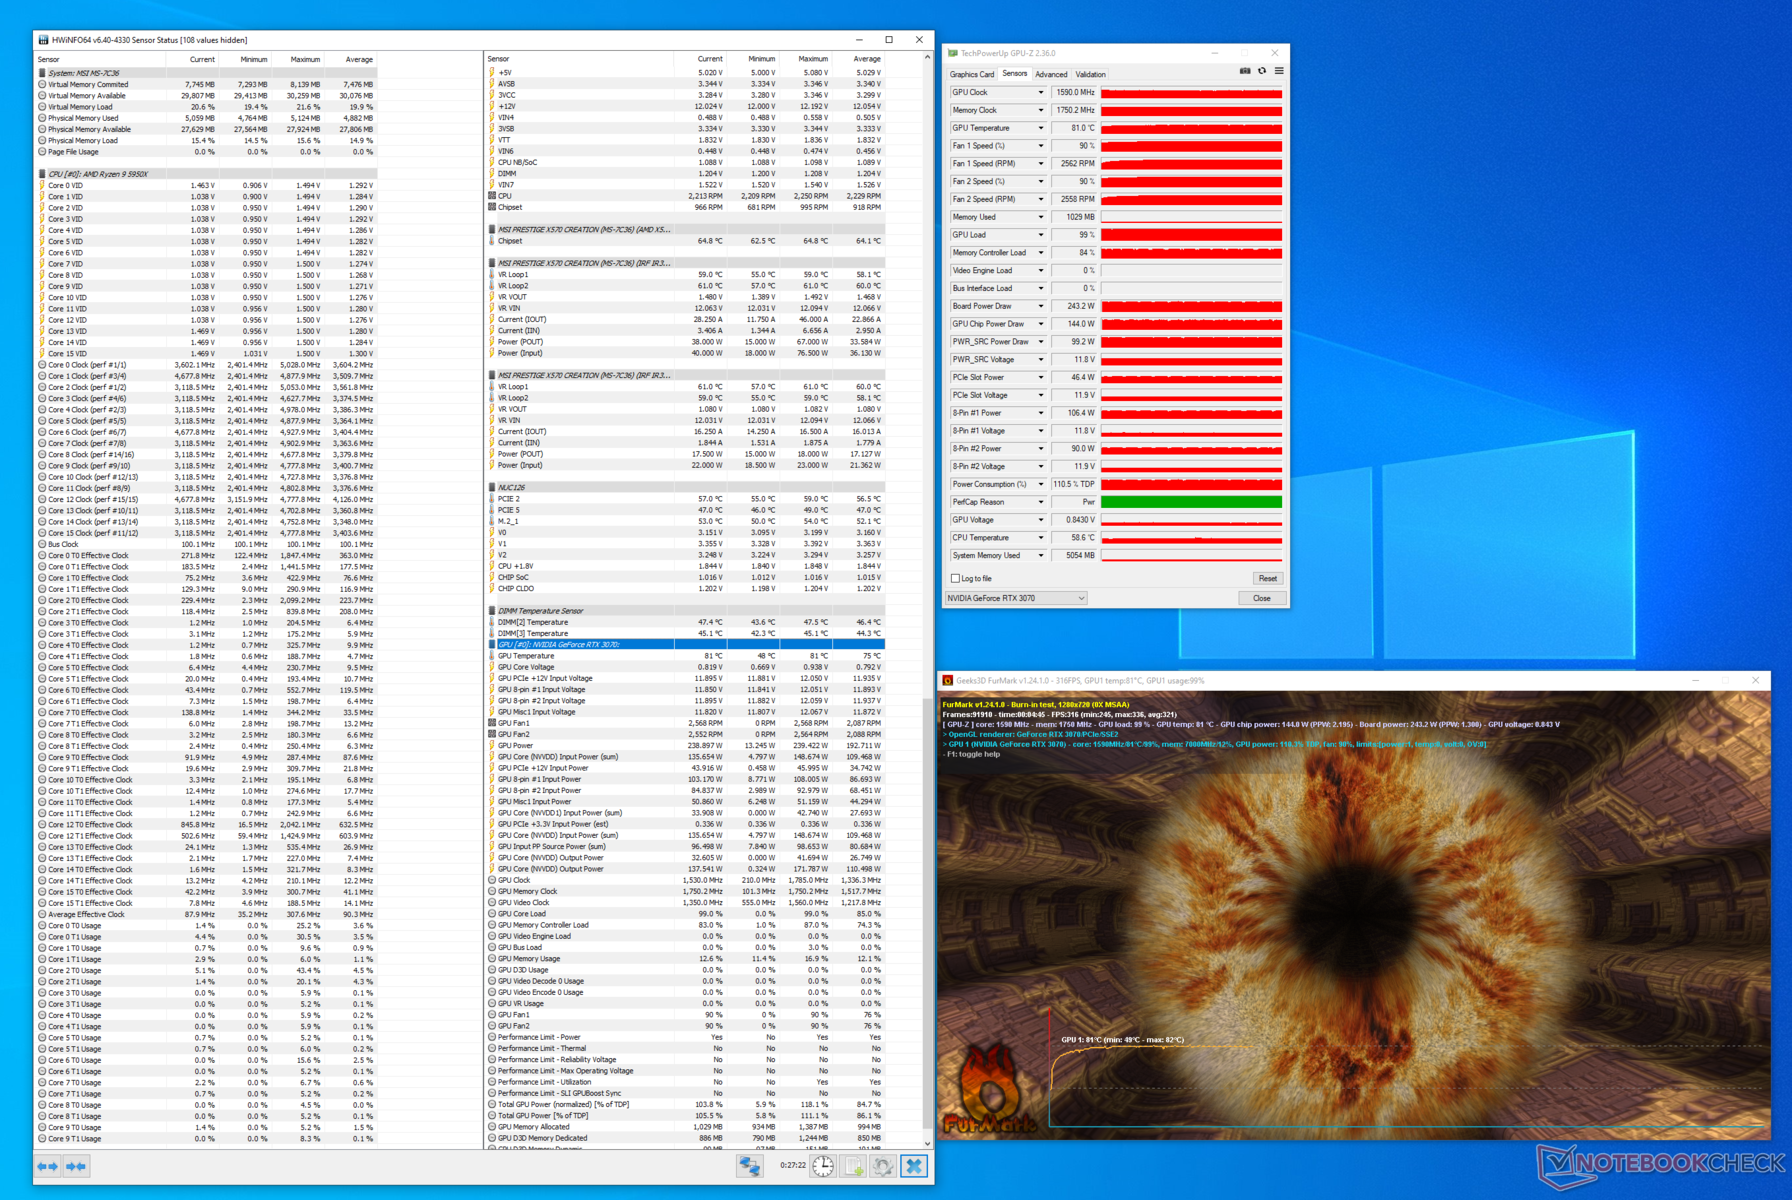
Unser Testsystem basiert auf dem AMD Ryzen 5000 Zen 3 X570. Der 16-Kerner AMD Ryzen 9 5950X kommt auf eine ausgezeichnete Gaming-Performance, die sogar den Intel Core i9-10900K übertrifft, weshalb wir den Ryzen für unseren Test wählen. Als Kühler setzen wir den Corsair iCUE H115i Elite Capellix AIO ein, welcher das CPU-Biest in Schach halten dürfte. 

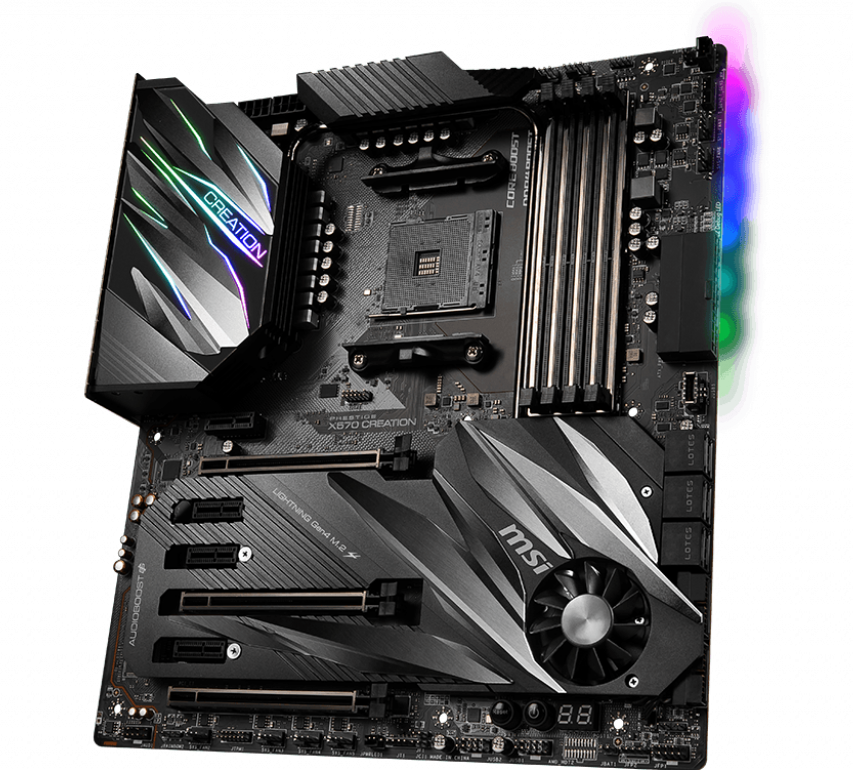
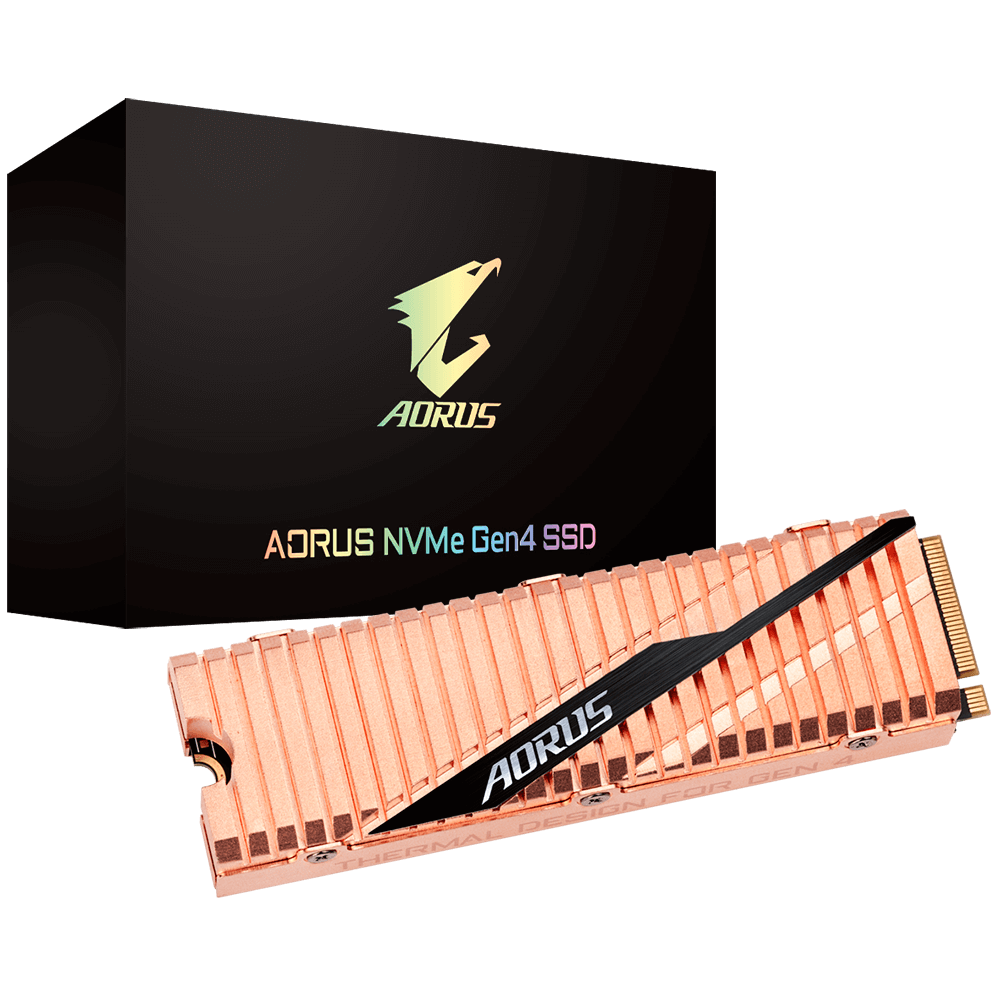
Die Hardware steckt im Mainboard MSI Prestige X570 Creation. Wir stellen dem Ryzen 9 5950X 32 GB (16 GB x2) G.SKILL Trident Z Neo DDR4-3600-RAM mit Timings von 16-19-19-39 zur Seite. Windows 10 20H2 mit den aktuellsten Updates (Build 19041.662) wurde auf der 1-TB-SSD Gigabyte Aorus NVMe Gen4 installiert, zwei Crucial-MX500-SATA-SSDs mit je 1 TB wurden für die Benchmarks und Spiele verwendet.

Das Gesamtpaket sitzt in einem Corsair-iCUE-4000X-RGB-Gehäuse und wird von dem Netzteil Thermaltake Toughpower Grand 850 W 80 Plus Gold versorgt. Während der Tests war das Gehäuse geschlossen, um den normalen Anwendungsfall zu simulieren.

An dieser Stelle wollen wir AMD für die Bereitstellung des Ryzen 9 5950X und Corsair für den iCUE Elite Capellix-Kühler und das iCUE 4000X-Gehäuse danken.

Wir haben die RTX 3070 Twin Edge mit einem OnePlus U Series 55U1-Smart-TV mit 4K und 60 Hz gekoppelt. Die Farbausgabe wurde in der NVIDIA-Systemsteuerung auf 32-Bit-RGB und die Windows-Desktopskalierung auf 100% eingestellt.

AMD Ryzen 9 5950X
AMD Ryzen 9 5950X
MSI Prestige X570 Creation Motherboard. (Bildquelle: MSI)
Gigabyte Aorus NVMe Gen4 SSD. (Bildquelle: Gigabyte)
G.SKILL Trident Z Neo DDR4-3600 RAM. (Bildquelle: G.SKILL)

Synthetische Benchmarks

Die Zotac RTX 3070 Twin Edge schlägt sich in den synthetischen Benchmarks ordentlich. Die Karte liegt in den meisten 3DMark-Tests auf dem gleichen Niveau wie die MSI GeForce RTX 3070 Ventus 3X OC, die Karten haben ja prinzipiell auch die gleichen Spezifikationen (die Ventus läuft etwa 25 MHz schneller).

Wir sehen auch, dass die Leistung in etwa der einer RTX 2080 Ti entspricht, außerdem ist sie zwischen 13 und 20 Prozent schneller als eine RTX 2080 Super.

Der Leistungsunterschied zwischen einer RTX 3070 und einer Titan RTX ist im Unigine Heaven 4.0 und im Valley 1.0 kaum signifikant. Allerdings scheint die Titan RTX leichte Vorteile in den Unterwerten des Superposition-Tests zu haben.

3DMark
1920x1080 Fire Strike Graphics
AMD Radeon RX 6800 XT
AMD Radeon RX 6800 XT, R9 5950X
49735 Points +59%
Zotac Gaming GeForce RTX 3090 Trinity
NVIDIA GeForce RTX 3090, R9 3900X
43404 Points +39%
MSI GeForce RTX 3090 Suprim X
NVIDIA GeForce RTX 3090, R9 5900X
42688 Points +37%
ASUS GeForce RTX 3080 ROG STRIX OC GAMING
NVIDIA GeForce RTX 3080, R9 5900X
40910 Points +31%
MSI GeForce RTX 3080 Gaming X Trio
NVIDIA GeForce RTX 3080, R9 5900X
37604 Points +20%
AMD Ryzen 9 5900X
NVIDIA Titan RTX, R9 5900X
34722 Points +11%
KFA2 GeForce RTX 2080 Ti EX
NVIDIA GeForce RTX 2080 Ti (Desktop), R9 3900X
32081 Points +3%
Zotac Gaming GeForce RTX 3070 Twin Edge
NVIDIA GeForce RTX 3070, R9 5950X
31252 Points
MSI GeForce RTX 3070 Gaming X Trio
NVIDIA GeForce RTX 3070, R9 5900X
31096 Points 0%
MSI GeForce RTX 3070 Ventus 3X
NVIDIA GeForce RTX 3070, R9 5900X
31020 Points -1%
Durchschnittliche NVIDIA GeForce RTX 3070
  (20357 - 33270, n=7)
28949 Points -7%
Nvidia GeForce RTX 2080 Super
NVIDIA GeForce RTX 2080 Super (Desktop), R7 2700X
27075 Points -13%
AMD Radeon RX 5700 XT
AMD Radeon RX 5700 XT (Desktop), R7 2700X
25383 Points -19%
Nvidia GeForce RTX 2070 Super
NVIDIA GeForce RTX 2070 Super (Desktop), R7 2700X
24151 Points -23%
Nvidia GeForce RTX 2060 Super
NVIDIA GeForce RTX 2060 Super (Desktop), R7 2700X
21970 Points -30%
3840x2160 Fire Strike Ultra Graphics
AMD Radeon RX 6800 XT
AMD Radeon RX 6800 XT, R9 5950X
12626 Points +57%
MSI GeForce RTX 3090 Suprim X
NVIDIA GeForce RTX 3090, R9 5900X
12371 Points +54%
Zotac Gaming GeForce RTX 3090 Trinity
NVIDIA GeForce RTX 3090, R9 3900X
11715 Points +46%
ASUS GeForce RTX 3080 ROG STRIX OC GAMING
NVIDIA GeForce RTX 3080, R9 5900X
10793 Points +34%
MSI GeForce RTX 3080 Gaming X Trio
NVIDIA GeForce RTX 3080, R9 5900X
10645 Points +32%
AMD Ryzen 9 5900X
NVIDIA Titan RTX, R9 5900X
8649 Points +8%
MSI GeForce RTX 3070 Gaming X Trio
NVIDIA GeForce RTX 3070, R9 5900X
8483 Points +5%
Durchschnittliche NVIDIA GeForce RTX 3070
  (8043 - 8483, n=5)
8250 Points +3%
MSI GeForce RTX 3070 Ventus 3X
NVIDIA GeForce RTX 3070, R9 5900X
8227 Points +2%
Zotac Gaming GeForce RTX 3070 Twin Edge
NVIDIA GeForce RTX 3070, R9 5950X
8043 Points
KFA2 GeForce RTX 2080 Ti EX
NVIDIA GeForce RTX 2080 Ti (Desktop), R9 3900X
7925 Points -1%
Nvidia GeForce RTX 2080 Super
NVIDIA GeForce RTX 2080 Super (Desktop), R7 2700X
6500 Points -19%
AMD Radeon RX 5700 XT
AMD Radeon RX 5700 XT (Desktop), R7 2700X
5955 Points -26%
Nvidia GeForce RTX 2070 Super
NVIDIA GeForce RTX 2070 Super (Desktop), R7 2700X
5786 Points -28%
Nvidia GeForce RTX 2060 Super
NVIDIA GeForce RTX 2060 Super (Desktop), R7 2700X
5175 Points -36%
Fire Strike Extreme Graphics
AMD Radeon RX 6800 XT
AMD Radeon RX 6800 XT, R9 5950X
25015 Points +61%
MSI GeForce RTX 3090 Suprim X
NVIDIA GeForce RTX 3090, R9 5900X
23114 Points +49%
Zotac Gaming GeForce RTX 3090 Trinity
NVIDIA GeForce RTX 3090, R9 3900X
22423 Points +45%
ASUS GeForce RTX 3080 ROG STRIX OC GAMING
NVIDIA GeForce RTX 3080, R9 5900X
20861 Points +35%
MSI GeForce RTX 3080 Gaming X Trio
NVIDIA GeForce RTX 3080, R9 5900X
20007 Points +29%
AMD Ryzen 9 5900X
NVIDIA Titan RTX, R9 5900X
17176 Points +11%
MSI GeForce RTX 3070 Gaming X Trio
NVIDIA GeForce RTX 3070, R9 5900X
16196 Points +4%
Durchschnittliche NVIDIA GeForce RTX 3070
  (15503 - 16276, n=5)
15859 Points +2%
MSI GeForce RTX 3070 Ventus 3X
NVIDIA GeForce RTX 3070, R9 5900X
15722 Points +1%
KFA2 GeForce RTX 2080 Ti EX
NVIDIA GeForce RTX 2080 Ti (Desktop), R9 3900X
15603 Points +1%
Zotac Gaming GeForce RTX 3070 Twin Edge
NVIDIA GeForce RTX 3070, R9 5950X
15503 Points
Nvidia GeForce RTX 2080 Super
NVIDIA GeForce RTX 2080 Super (Desktop), R7 2700X
12968 Points -16%
AMD Radeon RX 5700 XT
AMD Radeon RX 5700 XT (Desktop), R7 2700X
12209 Points -21%
Nvidia GeForce RTX 2070 Super
NVIDIA GeForce RTX 2070 Super (Desktop), R7 2700X
11634 Points -25%
Nvidia GeForce RTX 2060 Super
NVIDIA GeForce RTX 2060 Super (Desktop), R7 2700X
10481 Points -32%
2560x1440 Time Spy Graphics
MSI GeForce RTX 3090 Suprim X
NVIDIA GeForce RTX 3090, R9 5900X
19571 Points +50%
Zotac Gaming GeForce RTX 3090 Trinity
NVIDIA GeForce RTX 3090, R9 3900X
18863 Points +45%
MSI GeForce RTX 3080 Gaming X Trio
NVIDIA GeForce RTX 3080, R9 5900X
17604 Points +35%
AMD Radeon RX 6800 XT
AMD Radeon RX 6800 XT, R9 5950X
17603 Points +35%
ASUS GeForce RTX 3080 ROG STRIX OC GAMING
NVIDIA GeForce RTX 3080, R9 5900X
17467 Points +34%
AMD Ryzen 9 5900X
NVIDIA Titan RTX, R9 5900X
15283 Points +17%
KFA2 GeForce RTX 2080 Ti EX
NVIDIA GeForce RTX 2080 Ti (Desktop), R9 3900X
13744 Points +6%
MSI GeForce RTX 3070 Gaming X Trio
NVIDIA GeForce RTX 3070, R9 5900X
13579 Points +4%
MSI GeForce RTX 3070 Ventus 3X
NVIDIA GeForce RTX 3070, R9 5900X
13111 Points +1%
Zotac Gaming GeForce RTX 3070 Twin Edge
NVIDIA GeForce RTX 3070, R9 5950X
13024 Points
Durchschnittliche NVIDIA GeForce RTX 3070
  (11043 - 13579, n=7)
12616 Points -3%
Nvidia GeForce RTX 2080 Super
NVIDIA GeForce RTX 2080 Super (Desktop), R7 2700X
11477 Points -12%
Nvidia GeForce RTX 2070 Super
NVIDIA GeForce RTX 2070 Super (Desktop), R7 2700X
10094 Points -22%
Nvidia GeForce RTX 2060 Super
NVIDIA GeForce RTX 2060 Super (Desktop), R7 2700X
8795 Points -32%
AMD Radeon RX 5700 XT
AMD Radeon RX 5700 XT (Desktop), R7 2700X
8673 Points -33%
Unigine Heaven 4.0 - Extreme Preset DX11
MSI GeForce RTX 3090 Suprim X
NVIDIA GeForce RTX 3090, R9 5900X
283.5 fps +33%
Zotac Gaming GeForce RTX 3090 Trinity
NVIDIA GeForce RTX 3090, R9 3900X
272.4 (47.3min - 557.4max) fps +27%
MSI GeForce RTX 3080 Gaming X Trio
NVIDIA GeForce RTX 3080, R9 5900X
252.5 fps +18%
AMD Radeon RX 6800 XT
AMD Radeon RX 6800 XT, R9 5950X
247.9 fps +16%
AMD Ryzen 9 5900X
NVIDIA Titan RTX, R9 5900X
237.1 fps +11%
ASUS GeForce RTX 3080 ROG STRIX OC GAMING
NVIDIA GeForce RTX 3080, R9 5900X
232.6 fps +9%
KFA2 GeForce RTX 2080 Ti EX
NVIDIA GeForce RTX 2080 Ti (Desktop), R9 3900X
215.2 fps +1%
Zotac Gaming GeForce RTX 3070 Twin Edge
NVIDIA GeForce RTX 3070, R9 5950X
213.7 fps
Durchschnittliche NVIDIA GeForce RTX 3070
  (196.4 - 214, n=5)
206 fps -4%
MSI GeForce RTX 3070 Ventus 3X
NVIDIA GeForce RTX 3070, R9 5900X
203.2 fps -5%
MSI GeForce RTX 3070 Gaming X Trio
NVIDIA GeForce RTX 3070, R9 5900X
202.5 fps -5%
Nvidia GeForce RTX 2080 Super
NVIDIA GeForce RTX 2080 Super (Desktop), R7 2700X
175.2 fps -18%
Nvidia GeForce RTX 2070 Super
NVIDIA GeForce RTX 2070 Super (Desktop), R7 2700X
160.1 fps -25%
Nvidia GeForce RTX 2060 Super
NVIDIA GeForce RTX 2060 Super (Desktop), R7 2700X
141.7 fps -34%
AMD Radeon RX 5700 XT
AMD Radeon RX 5700 XT (Desktop), R7 2700X
132.5 fps -38%
Unigine Valley 1.0 - 1920x1080 Extreme HD DirectX AA:x8
MSI GeForce RTX 3090 Suprim X
NVIDIA GeForce RTX 3090, R9 5900X
196 fps +17%
AMD Radeon RX 6800 XT
AMD Radeon RX 6800 XT, R9 5950X
190.6 fps +13%
Zotac Gaming GeForce RTX 3090 Trinity
NVIDIA GeForce RTX 3090, R9 3900X
184.2 (47.3min - 301.5max) fps +10%
MSI GeForce RTX 3080 Gaming X Trio
NVIDIA GeForce RTX 3080, R9 5900X
181.8 fps +8%
AMD Ryzen 9 5900X
NVIDIA Titan RTX, R9 5900X
180.1 fps +7%
ASUS GeForce RTX 3080 ROG STRIX OC GAMING
NVIDIA GeForce RTX 3080, R9 5900X
176.2 fps +5%
Zotac Gaming GeForce RTX 3070 Twin Edge
NVIDIA GeForce RTX 3070, R9 5950X
168.1 fps
Durchschnittliche NVIDIA GeForce RTX 3070
  (155.1 - 168.5, n=5)
161.2 fps -4%
KFA2 GeForce RTX 2080 Ti EX
NVIDIA GeForce RTX 2080 Ti (Desktop), R9 3900X
159.4 fps -5%
MSI GeForce RTX 3070 Ventus 3X
NVIDIA GeForce RTX 3070, R9 5900X
157 fps -7%
MSI GeForce RTX 3070 Gaming X Trio
NVIDIA GeForce RTX 3070, R9 5900X
155.1 fps -8%
Nvidia GeForce RTX 2080 Super
NVIDIA GeForce RTX 2080 Super (Desktop), R7 2700X
120.2 fps -28%
Nvidia GeForce RTX 2070 Super
NVIDIA GeForce RTX 2070 Super (Desktop), R7 2700X
113.7 fps -32%
Nvidia GeForce RTX 2060 Super
NVIDIA GeForce RTX 2060 Super (Desktop), R7 2700X
106.9 fps -36%
AMD Radeon RX 5700 XT
AMD Radeon RX 5700 XT (Desktop), R7 2700X
106.3 fps -37%
Unigine Superposition
1280x720 720p Low
AMD Ryzen 9 5900X
NVIDIA Titan RTX, R9 5900X
40994 Points +4%
Zotac Gaming GeForce RTX 3070 Twin Edge
NVIDIA GeForce RTX 3070, R9 5950X
39277 Points
AMD Radeon RX 6800 XT
AMD Radeon RX 6800 XT, R9 5950X
36452 Points -7%
MSI GeForce RTX 3070 Ventus 3X
NVIDIA GeForce RTX 3070, R9 5900X
34602 Points -12%
Durchschnittliche NVIDIA GeForce RTX 3070
  (27330 - 40007, n=5)
34576 Points -12%
MSI GeForce RTX 3090 Suprim X
NVIDIA GeForce RTX 3090, R9 5900X
33329 Points -15%
MSI GeForce RTX 3080 Gaming X Trio
NVIDIA GeForce RTX 3080, R9 5900X
32183 Points -18%
MSI GeForce RTX 3070 Gaming X Trio
NVIDIA GeForce RTX 3070, R9 5900X
31666 Points -19%
ASUS GeForce RTX 3080 ROG STRIX OC GAMING
NVIDIA GeForce RTX 3080, R9 5900X
30851 Points -21%
1920x1080 1080p High
MSI GeForce RTX 3090 Suprim X
NVIDIA GeForce RTX 3090, R9 5900X
25953 Points +48%
Zotac Gaming GeForce RTX 3090 Trinity
NVIDIA GeForce RTX 3090, R9 3900X
23626 (113.62min - 236.69max) Points +35%
AMD Radeon RX 6800 XT
AMD Radeon RX 6800 XT, R9 5950X
22265 Points +27%
MSI GeForce RTX 3080 Gaming X Trio
NVIDIA GeForce RTX 3080, R9 5900X
21912 Points +25%
ASUS GeForce RTX 3080 ROG STRIX OC GAMING
NVIDIA GeForce RTX 3080, R9 5900X
21333 Points +22%
AMD Ryzen 9 5900X
NVIDIA Titan RTX, R9 5900X
20315 Points +16%
Zotac Gaming GeForce RTX 3070 Twin Edge
NVIDIA GeForce RTX 3070, R9 5950X
17491 Points
MSI GeForce RTX 3070 Gaming X Trio
NVIDIA GeForce RTX 3070, R9 5900X
17346 Points -1%
Durchschnittliche NVIDIA GeForce RTX 3070
  (17054 - 17491, n=5)
17312 Points -1%
MSI GeForce RTX 3070 Ventus 3X
NVIDIA GeForce RTX 3070, R9 5900X
17244 Points -1%
1920x1080 1080p Extreme
MSI GeForce RTX 3090 Suprim X
NVIDIA GeForce RTX 3090, R9 5900X
12694 Points +52%
Zotac Gaming GeForce RTX 3090 Trinity
NVIDIA GeForce RTX 3090, R9 3900X
11927 (69.49min - 121.03max) Points +43%
MSI GeForce RTX 3080 Gaming X Trio
NVIDIA GeForce RTX 3080, R9 5900X
10822 Points +30%
ASUS GeForce RTX 3080 ROG STRIX OC GAMING
NVIDIA GeForce RTX 3080, R9 5900X
10572 Points +27%
AMD Radeon RX 6800 XT
AMD Radeon RX 6800 XT, R9 5950X
10046 Points +21%
AMD Ryzen 9 5900X
NVIDIA Titan RTX, R9 5900X
9056 Points +9%
MSI GeForce RTX 3070 Gaming X Trio
NVIDIA GeForce RTX 3070, R9 5900X
8507 Points +2%
MSI GeForce RTX 3070 Ventus 3X
NVIDIA GeForce RTX 3070, R9 5900X
8365 Points 0%
Durchschnittliche NVIDIA GeForce RTX 3070
  (8276 - 8507, n=5)
8354 Points 0%
Zotac Gaming GeForce RTX 3070 Twin Edge
NVIDIA GeForce RTX 3070, R9 5950X
8336 Points
3840x2160 4k Optimized
MSI GeForce RTX 3090 Suprim X
NVIDIA GeForce RTX 3090, R9 5900X
16868 Points +58%
Zotac Gaming GeForce RTX 3090 Trinity
NVIDIA GeForce RTX 3090, R9 3900X
15888 (99.72min - 146.92max) Points +48%
MSI GeForce RTX 3080 Gaming X Trio
NVIDIA GeForce RTX 3080, R9 5900X
14243 Points +33%
ASUS GeForce RTX 3080 ROG STRIX OC GAMING
NVIDIA GeForce RTX 3080, R9 5900X
13984 Points +31%
AMD Radeon RX 6800 XT
AMD Radeon RX 6800 XT, R9 5950X
13471 Points +26%
AMD Ryzen 9 5900X
NVIDIA Titan RTX, R9 5900X
12186 Points +14%
MSI GeForce RTX 3070 Gaming X Trio
NVIDIA GeForce RTX 3070, R9 5900X
10755 Points 0%
Zotac Gaming GeForce RTX 3070 Twin Edge
NVIDIA GeForce RTX 3070, R9 5950X
10704 Points
MSI GeForce RTX 3070 Ventus 3X
NVIDIA GeForce RTX 3070, R9 5900X
10673 Points 0%
Durchschnittliche NVIDIA GeForce RTX 3070
  (10544 - 10755, n=5)
10667 Points 0%
7680x4320 8k Optimized
MSI GeForce RTX 3090 Suprim X
NVIDIA GeForce RTX 3090, R9 5900X
7521 Points +63%
Zotac Gaming GeForce RTX 3090 Trinity
NVIDIA GeForce RTX 3090, R9 3900X
6969 (43.54min - 60.14max) Points +51%
MSI GeForce RTX 3080 Gaming X Trio
NVIDIA GeForce RTX 3080, R9 5900X
6346 Points +38%
ASUS GeForce RTX 3080 ROG STRIX OC GAMING
NVIDIA GeForce RTX 3080, R9 5900X
6243 Points +36%
AMD Ryzen 9 5900X
NVIDIA Titan RTX, R9 5900X
5402 Points +17%
AMD Radeon RX 6800 XT
AMD Radeon RX 6800 XT, R9 5950X
5256 Points +14%
MSI GeForce RTX 3070 Gaming X Trio
NVIDIA GeForce RTX 3070, R9 5900X
4695 Points +2%
MSI GeForce RTX 3070 Ventus 3X
NVIDIA GeForce RTX 3070, R9 5900X
4639 Points +1%
Durchschnittliche NVIDIA GeForce RTX 3070
  (4587 - 4695, n=5)
4624 Points 0%
Zotac Gaming GeForce RTX 3070 Twin Edge
NVIDIA GeForce RTX 3070, R9 5950X
4602 Points
3DMark 11 Performance
36313 Punkte
3DMark Fire Strike Score
29648 Punkte
3DMark Fire Strike Extreme Score
15360 Punkte
3DMark Time Spy Score
12696 Punkte
Hilfe

Gaming-Benchmarks

Beim Gaming agiert die Zotac RTX 3070 Twin Edge auf Erwartungsniveau. Sie eignet sich ausgezeichnet für moderne AAA-Titel bei 1440p Ultra 60+ fps oder 1080p Ultra 100+ fps. 4K-Gaming ist ebenfalls möglich, die meisten Titel kommen auf hohe 40er oder niedrige 50er fps-Werte. Wenn man einige Ingame-Einstellungen noch optimiert, sollte es möglich sein auf 4K/60 fps zu spielen, ohne dabei mit großen visuellen Einschränkungen leben zu müssen.

Für die meisten aktuellen Spiele sollten die installierten 8 GB GDDR6-RAM ausreichend sein. Zwar dürften die 16 GB RAM einer AMD Radeon RX 6800 für viele verlockender klingen, aber beim Spielen mit der RTX 3070 sind wir niemals mit Problemen wegen einer VRAM-Begrenzung konfrontiert worden.

Unter The Witcher 3 1080p Ultra kommt die RTX 3070 Twin Edge auf durchschnittlich 123 fps. Gelegentlich fällt dieser Wert etwas, aber insgesamt ist die Leistung der Karte sehr konsistent und gerät nie unterhalb von 120 fps. Das ist auch ein Indikator dafür, dass das Kühlsystem der Karte zuverlässig arbeitet und thermische Drosselung gut verhindert.

0102030405060708090100110120Tooltip
Zotac Gaming GeForce RTX 3070 Twin Edge NVIDIA GeForce RTX 3070, R9 5950X: Ø123.2 (120-126)
The Witcher 3
1920x1080 Ultra Graphics & Postprocessing (HBAO+)
MSI GeForce RTX 3090 Suprim X
AMD Ryzen 9 5900X, NVIDIA GeForce RTX 3090
160 (140min - 184max) fps +30%
AMD Radeon RX 6800 XT
AMD Ryzen 9 5950X, AMD Radeon RX 6800 XT
160 (138min - 179max) fps +30%
ASUS GeForce RTX 3080 ROG STRIX OC GAMING
AMD Ryzen 9 5900X, NVIDIA GeForce RTX 3080
152 (138min - 171max) fps +24%
MSI GeForce RTX 3080 Gaming X Trio
AMD Ryzen 9 5900X, NVIDIA GeForce RTX 3080
145 (123min - 154max) fps +18%
KFA2 GeForce RTX 2080 Ti EX
AMD Ryzen 9 3900X, NVIDIA GeForce RTX 2080 Ti (Desktop)
135 (118min - 158max) fps +10%
Zotac Gaming GeForce RTX 3070 Twin Edge
AMD Ryzen 9 5950X, NVIDIA GeForce RTX 3070
123 (120min, 121P1 - 126max) fps
MSI GeForce RTX 3070 Gaming X Trio
AMD Ryzen 9 5900X, NVIDIA GeForce RTX 3070
122 (110min - 138max) fps -1%
MSI GeForce RTX 3070 Ventus 3X
AMD Ryzen 9 5900X, NVIDIA GeForce RTX 3070
121 (112min - 134max) fps -2%
Nvidia GeForce RTX 2080 Super
AMD Ryzen 7 2700X, NVIDIA GeForce RTX 2080 Super (Desktop)
109 (81min - 123max) fps -11%
Durchschnittliche NVIDIA GeForce RTX 3070
  (52.8 - 132.2, n=7)
106.1 fps -14%
Nvidia GeForce RTX 2070 Super
AMD Ryzen 7 2700X, NVIDIA GeForce RTX 2070 Super (Desktop)
97 (83min - 109max) fps -21%
AMD Radeon RX 5700 XT
AMD Ryzen 7 2700X, AMD Radeon RX 5700 XT (Desktop)
92 (79min - 99max) fps -25%
Nvidia GeForce RTX 2060 Super
AMD Ryzen 7 2700X, NVIDIA GeForce RTX 2060 Super (Desktop)
79 (67min - 89max) fps -36%
3840x2160 High Graphics & Postprocessing (Nvidia HairWorks Off)
MSI GeForce RTX 3090 Suprim X
AMD Ryzen 9 5900X, NVIDIA GeForce RTX 3090
128 (117min - 138max) fps +43%
ASUS GeForce RTX 3080 ROG STRIX OC GAMING
AMD Ryzen 9 5900X, NVIDIA GeForce RTX 3080
115 (107min - 124max) fps +28%
MSI GeForce RTX 3080 Gaming X Trio
AMD Ryzen 9 5900X, NVIDIA GeForce RTX 3080
114 (106min - 122max) fps +27%
AMD Radeon RX 6800 XT
AMD Ryzen 9 5950X, AMD Radeon RX 6800 XT
110 (97min - 117max) fps +23%
KFA2 GeForce RTX 2080 Ti EX
AMD Ryzen 9 3900X, NVIDIA GeForce RTX 2080 Ti (Desktop)
96 (87min - 109max) fps +7%
MSI GeForce RTX 3070 Ventus 3X
AMD Ryzen 9 5900X, NVIDIA GeForce RTX 3070
90.9 (84min - 101max) fps +1%
Zotac Gaming GeForce RTX 3070 Twin Edge
AMD Ryzen 9 5950X, NVIDIA GeForce RTX 3070
89.6 (81min, 81P1 - 96max) fps
Durchschnittliche NVIDIA GeForce RTX 3070
  (84 - 93.9, n=5)
89.3 fps 0%
MSI GeForce RTX 3070 Gaming X Trio
AMD Ryzen 9 5900X, NVIDIA GeForce RTX 3070
88.2 (82min - 97max) fps -2%
Nvidia GeForce RTX 2080 Super
AMD Ryzen 7 2700X, NVIDIA GeForce RTX 2080 Super (Desktop)
79 (71min - 87max) fps -12%
Nvidia GeForce RTX 2070 Super
AMD Ryzen 7 2700X, NVIDIA GeForce RTX 2070 Super (Desktop)
68 (61min - 74max) fps -24%
Nvidia GeForce RTX 2060 Super
AMD Ryzen 7 2700X, NVIDIA GeForce RTX 2060 Super (Desktop)
57 (51min - 62max) fps -36%
AMD Radeon RX 5700 XT
AMD Ryzen 7 2700X, AMD Radeon RX 5700 XT (Desktop)
52.1 (47min - 57max) fps -42%
3840x2160 Ultra Graphics & Postprocessing (HBAO+)
MSI GeForce RTX 3080 Gaming X Trio
AMD Ryzen 9 5900X, NVIDIA GeForce RTX 3080
85.7 (80min - 93max) fps +45%
MSI GeForce RTX 3090 Suprim X
AMD Ryzen 9 5900X, NVIDIA GeForce RTX 3090
85.4 (79min - 92max) fps +45%
ASUS GeForce RTX 3080 ROG STRIX OC GAMING
AMD Ryzen 9 5900X, NVIDIA GeForce RTX 3080
78 (72min - 83max) fps +32%
KFA2 GeForce RTX 2080 Ti EX
AMD Ryzen 9 3900X, NVIDIA GeForce RTX 2080 Ti (Desktop)
65 (59min - 71max) fps +10%
MSI GeForce RTX 3070 Ventus 3X
AMD Ryzen 9 5900X, NVIDIA GeForce RTX 3070
60.3 (55min - 67max) fps +2%
Durchschnittliche NVIDIA GeForce RTX 3070
  (59 - 60.3, n=2)
59.7 fps +1%
Zotac Gaming GeForce RTX 3070 Twin Edge
AMD Ryzen 9 5950X, NVIDIA GeForce RTX 3070
59 (53min, 53.59P1 - 64max) fps
Nvidia GeForce RTX 2080 Super
AMD Ryzen 7 2700X, NVIDIA GeForce RTX 2080 Super (Desktop)
55.2 (49min - 61max) fps -6%
Nvidia GeForce RTX 2070 Super
AMD Ryzen 7 2700X, NVIDIA GeForce RTX 2070 Super (Desktop)
46.3 (41min - 50max) fps -22%
AMD Radeon RX 5700 XT
AMD Ryzen 7 2700X, AMD Radeon RX 5700 XT (Desktop)
39.7 (35min - 43max) fps -33%
Nvidia GeForce RTX 2060 Super
AMD Ryzen 7 2700X, NVIDIA GeForce RTX 2060 Super (Desktop)
38.4 (32min - 42max) fps -35%
Shadow of the Tomb Raider
1920x1080 Highest Preset AA:T
AMD Radeon RX 6800 XT
AMD Ryzen 9 5950X, AMD Radeon RX 6800 XT
194 fps +29%
MSI GeForce RTX 3090 Suprim X
AMD Ryzen 9 5900X, NVIDIA GeForce RTX 3090
188 fps +25%
ASUS GeForce RTX 3080 ROG STRIX OC GAMING
AMD Ryzen 9 5900X, NVIDIA GeForce RTX 3080
185 fps +23%
MSI GeForce RTX 3080 Gaming X Trio
AMD Ryzen 9 5900X, NVIDIA GeForce RTX 3080
177 fps +18%
MSI GeForce RTX 3070 Ventus 3X
AMD Ryzen 9 5900X, NVIDIA GeForce RTX 3070
160 fps +7%
Durchschnittliche NVIDIA GeForce RTX 3070
  (138 - 160, n=4)
151.3 fps +1%
Zotac Gaming GeForce RTX 3070 Twin Edge
AMD Ryzen 9 5950X, NVIDIA GeForce RTX 3070
150 fps
Zotac Gaming GeForce RTX 3090 Trinity
AMD Ryzen 9 3900X, NVIDIA GeForce RTX 3090
145 fps -3%
Zotac Gaming GeForce RTX 3090 Trinity
AMD Ryzen 9 3900X, NVIDIA GeForce RTX 3090
145 fps -3%
Zotac Gaming GeForce RTX 3090 Trinity
AMD Ryzen 9 3900X, NVIDIA GeForce RTX 3090
145 fps -3%
MSI GeForce RTX 3070 Gaming X Trio
AMD Ryzen 9 5900X, NVIDIA GeForce RTX 3070
138 fps -8%
KFA2 GeForce RTX 2080 Ti EX
AMD Ryzen 9 3900X, NVIDIA GeForce RTX 2080 Ti (Desktop)
130 fps -13%
Nvidia GeForce RTX 2080 Super
AMD Ryzen 7 2700X, NVIDIA GeForce RTX 2080 Super (Desktop)
110 fps -27%
AMD Radeon RX 5700 XT
AMD Ryzen 7 2700X, AMD Radeon RX 5700 XT (Desktop)
110 fps -27%
Nvidia GeForce RTX 2070 Super
AMD Ryzen 7 2700X, NVIDIA GeForce RTX 2070 Super (Desktop)
104 fps -31%
Nvidia GeForce RTX 2060 Super
AMD Ryzen 7 2700X, NVIDIA GeForce RTX 2060 Super (Desktop)
96 fps -36%
2560x1440 Highest Preset AA:T
MSI GeForce RTX 3090 Suprim X
AMD Ryzen 9 5900X, NVIDIA GeForce RTX 3090
162 fps +42%
MSI GeForce RTX 3080 Gaming X Trio
AMD Ryzen 9 5900X, NVIDIA GeForce RTX 3080
152 fps +33%
AMD Radeon RX 6800 XT
AMD Ryzen 9 5950X, AMD Radeon RX 6800 XT
148 fps +30%
ASUS GeForce RTX 3080 ROG STRIX OC GAMING
AMD Ryzen 9 5900X, NVIDIA GeForce RTX 3080
147 fps +29%
Zotac Gaming GeForce RTX 3090 Trinity
AMD Ryzen 9 3900X, NVIDIA GeForce RTX 3090
137 fps +20%
MSI GeForce RTX 3070 Ventus 3X
AMD Ryzen 9 5900X, NVIDIA GeForce RTX 3070
116 fps +2%
Zotac Gaming GeForce RTX 3070 Twin Edge
AMD Ryzen 9 5950X, NVIDIA GeForce RTX 3070
114 fps
Durchschnittliche NVIDIA GeForce RTX 3070
  (108 - 116, n=4)
113.2 fps -1%
KFA2 GeForce RTX 2080 Ti EX
AMD Ryzen 9 3900X, NVIDIA GeForce RTX 2080 Ti (Desktop)
108 fps -5%
MSI GeForce RTX 3070 Gaming X Trio
AMD Ryzen 9 5900X, NVIDIA GeForce RTX 3070
108 fps -5%
Nvidia GeForce RTX 2080 Super
AMD Ryzen 7 2700X, NVIDIA GeForce RTX 2080 Super (Desktop)
91 fps -20%
Nvidia GeForce RTX 2070 Super
AMD Ryzen 7 2700X, NVIDIA GeForce RTX 2070 Super (Desktop)
81 fps -29%
AMD Radeon RX 5700 XT
AMD Ryzen 7 2700X, AMD Radeon RX 5700 XT (Desktop)
76 fps -33%
Nvidia GeForce RTX 2060 Super
AMD Ryzen 7 2700X, NVIDIA GeForce RTX 2060 Super (Desktop)
69 fps -39%
3840x2160 Highest Preset AA:T
MSI GeForce RTX 3090 Suprim X
AMD Ryzen 9 5900X, NVIDIA GeForce RTX 3090
95.6 fps +54%
Zotac Gaming GeForce RTX 3090 Trinity
AMD Ryzen 9 3900X, NVIDIA GeForce RTX 3090
89.3 fps +44%
MSI GeForce RTX 3080 Gaming X Trio
AMD Ryzen 9 5900X, NVIDIA GeForce RTX 3080
87.9 fps +42%
ASUS GeForce RTX 3080 ROG STRIX OC GAMING
AMD Ryzen 9 5900X, NVIDIA GeForce RTX 3080
83.9 fps +35%
AMD Radeon RX 6800 XT
AMD Ryzen 9 5950X, AMD Radeon RX 6800 XT
79.6 fps +28%
MSI GeForce RTX 3070 Ventus 3X
AMD Ryzen 9 5900X, NVIDIA GeForce RTX 3070
63.5 fps +2%
Durchschnittliche NVIDIA GeForce RTX 3070
  (61 - 63.5, n=4)
62.3 fps 0%
Zotac Gaming GeForce RTX 3070 Twin Edge
AMD Ryzen 9 5950X, NVIDIA GeForce RTX 3070
62 fps
MSI GeForce RTX 3070 Gaming X Trio
AMD Ryzen 9 5900X, NVIDIA GeForce RTX 3070
61 fps -2%
KFA2 GeForce RTX 2080 Ti EX
AMD Ryzen 9 3900X, NVIDIA GeForce RTX 2080 Ti (Desktop)
60 fps -3%
Nvidia GeForce RTX 2080 Super
AMD Ryzen 7 2700X, NVIDIA GeForce RTX 2080 Super (Desktop)
49 fps -21%
Nvidia GeForce RTX 2070 Super
AMD Ryzen 7 2700X, NVIDIA GeForce RTX 2070 Super (Desktop)
43 fps -31%
AMD Radeon RX 5700 XT
AMD Ryzen 7 2700X, AMD Radeon RX 5700 XT (Desktop)
38 fps -39%
Nvidia GeForce RTX 2060 Super
AMD Ryzen 7 2700X, NVIDIA GeForce RTX 2060 Super (Desktop)
36 fps -42%
Borderlands 3
2560x1440 Badass Overall Quality (DX11)
MSI GeForce RTX 3090 Suprim X
AMD Ryzen 9 5900X, NVIDIA GeForce RTX 3090
117 fps +48%
Zotac Gaming GeForce RTX 3090 Trinity
AMD Ryzen 9 3900X, NVIDIA GeForce RTX 3090
109 fps +38%
ASUS GeForce RTX 3080 ROG STRIX OC GAMING
AMD Ryzen 9 5900X, NVIDIA GeForce RTX 3080
103 fps +30%
MSI GeForce RTX 3080 Gaming X Trio
AMD Ryzen 9 5900X, NVIDIA GeForce RTX 3080
95.7 fps +21%
AMD Radeon RX 6800 XT
AMD Ryzen 9 5950X, AMD Radeon RX 6800 XT
93.6 fps +18%
Zotac Gaming GeForce RTX 3070 Twin Edge
AMD Ryzen 9 5950X, NVIDIA GeForce RTX 3070
79 fps
KFA2 GeForce RTX 2080 Ti EX
AMD Ryzen 9 3900X, NVIDIA GeForce RTX 2080 Ti (Desktop)
78 fps -1%
Durchschnittliche NVIDIA GeForce RTX 3070
  (75.1 - 82.9, n=5)
77.7 fps -2%
MSI GeForce RTX 3070 Gaming X Trio
AMD Ryzen 9 5900X, NVIDIA GeForce RTX 3070
75.9 fps -4%
MSI GeForce RTX 3070 Ventus 3X
AMD Ryzen 9 5900X, NVIDIA GeForce RTX 3070
75.1 fps -5%
3840x2160 Badass Overall Quality (DX11)
MSI GeForce RTX 3090 Suprim X
AMD Ryzen 9 5900X, NVIDIA GeForce RTX 3090
73.4 fps +65%
Zotac Gaming GeForce RTX 3090 Trinity
AMD Ryzen 9 3900X, NVIDIA GeForce RTX 3090
71.5 fps +61%
MSI GeForce RTX 3080 Gaming X Trio
AMD Ryzen 9 5900X, NVIDIA GeForce RTX 3080
61.9 fps +39%
ASUS GeForce RTX 3080 ROG STRIX OC GAMING
AMD Ryzen 9 5900X, NVIDIA GeForce RTX 3080
61.5 fps +38%
AMD Radeon RX 6800 XT
AMD Ryzen 9 5950X, AMD Radeon RX 6800 XT
53.6 fps +20%
Zotac Gaming GeForce RTX 3070 Twin Edge
AMD Ryzen 9 5950X, NVIDIA GeForce RTX 3070
44.5 fps
Durchschnittliche NVIDIA GeForce RTX 3070
  (42.7 - 46.3, n=5)
44.3 fps 0%
MSI GeForce RTX 3070 Gaming X Trio
AMD Ryzen 9 5900X, NVIDIA GeForce RTX 3070
44.2 fps -1%
MSI GeForce RTX 3070 Ventus 3X
AMD Ryzen 9 5900X, NVIDIA GeForce RTX 3070
43.8 fps -2%
KFA2 GeForce RTX 2080 Ti EX
AMD Ryzen 9 3900X, NVIDIA GeForce RTX 2080 Ti (Desktop)
43.6 fps -2%
1920x1080 Badass Overall Quality (DX11)
MSI GeForce RTX 3090 Suprim X
AMD Ryzen 9 5900X, NVIDIA GeForce RTX 3090
135 fps +30%
ASUS GeForce RTX 3080 ROG STRIX OC GAMING
AMD Ryzen 9 5900X, NVIDIA GeForce RTX 3080
128 fps +23%
AMD Radeon RX 6800 XT
AMD Ryzen 9 5950X, AMD Radeon RX 6800 XT
120 fps +15%
Zotac Gaming GeForce RTX 3090 Trinity
AMD Ryzen 9 3900X, NVIDIA GeForce RTX 3090
117 fps +13%
MSI GeForce RTX 3080 Gaming X Trio
AMD Ryzen 9 5900X, NVIDIA GeForce RTX 3080
117 fps +13%
Zotac Gaming GeForce RTX 3070 Twin Edge
AMD Ryzen 9 5950X, NVIDIA GeForce RTX 3070
104 fps
KFA2 GeForce RTX 2080 Ti EX
AMD Ryzen 9 3900X, NVIDIA GeForce RTX 2080 Ti (Desktop)
101.3 fps -3%
Durchschnittliche NVIDIA GeForce RTX 3070
  (95.3 - 108.9, n=5)
100.6 fps -3%
MSI GeForce RTX 3070 Gaming X Trio
AMD Ryzen 9 5900X, NVIDIA GeForce RTX 3070
95.8 fps -8%
MSI GeForce RTX 3070 Ventus 3X
AMD Ryzen 9 5900X, NVIDIA GeForce RTX 3070
95.3 fps -8%
Call of Duty Black Ops Cold War
1920x1080 Highest Settings
MSI GeForce RTX 3090 Suprim X
AMD Ryzen 9 5900X, NVIDIA GeForce RTX 3090
161 (59.8min, 96.1P0.1, 111P1 - 312max) fps +34%
AMD Radeon RX 6800 XT
AMD Ryzen 9 5950X, AMD Radeon RX 6800 XT
144 (58.7min, 90.7P0.1, 105P1 - 365max) fps +20%
MSI GeForce RTX 3080 Gaming X Trio
AMD Ryzen 9 5900X, NVIDIA GeForce RTX 3080
127 (21.9min, 24.4P0.1, 83.5P1 - 285max) fps +6%
MSI GeForce RTX 3070 Gaming X Trio
AMD Ryzen 9 5900X, NVIDIA GeForce RTX 3070
122 (45min, 57.3P0.1, 67.9P1 - 301max) fps +2%
Zotac Gaming GeForce RTX 3070 Twin Edge
AMD Ryzen 9 5950X, NVIDIA GeForce RTX 3070
120 (49.7min, 76.4P0.1, 85.7P1 - 245max) fps
Durchschnittliche NVIDIA GeForce RTX 3070
  (95.7 - 122, n=3)
112.6 fps -6%
MSI GeForce RTX 3070 Ventus 3X
AMD Ryzen 9 5900X, NVIDIA GeForce RTX 3070
95.7 (21.6min, 37.6P0.1, 58P1 - 166max) fps -20%
2560x1440 Highest Settings
MSI GeForce RTX 3090 Suprim X
AMD Ryzen 9 5900X, NVIDIA GeForce RTX 3090
122 (54.5min, 84.4P0.1, 93.9P1 - 258max) fps +36%
MSI GeForce RTX 3070 Gaming X Trio
AMD Ryzen 9 5900X, NVIDIA GeForce RTX 3070
107 (43.6min, 54P0.1, 62.7P1 - 272max) fps +20%
MSI GeForce RTX 3080 Gaming X Trio
AMD Ryzen 9 5900X, NVIDIA GeForce RTX 3080
104 (19.1min, 20.4P0.1, 77.7P1 - 258max) fps +16%
Durchschnittliche NVIDIA GeForce RTX 3070
  (83 - 107, n=3)
93.2 fps +4%
Zotac Gaming GeForce RTX 3070 Twin Edge
AMD Ryzen 9 5950X, NVIDIA GeForce RTX 3070
89.5 (40.5min, 65.1P0.1, 70.3P1 - 219max) fps
MSI GeForce RTX 3070 Ventus 3X
AMD Ryzen 9 5900X, NVIDIA GeForce RTX 3070
83 (22.7min, 30P0.1, 52.1P1 - 158max) fps -7%
AMD Radeon RX 6800 XT
AMD Ryzen 9 5950X, AMD Radeon RX 6800 XT
80.4 (16.5min, 31.8P0.1, 64.3P1 - 285max) fps -10%
3840x2160 Highest Settings
MSI GeForce RTX 3090 Suprim X
AMD Ryzen 9 5900X, NVIDIA GeForce RTX 3090
76.1 (42.1min, 58.7P0.1, 61.9P1 - 221max) fps +74%
MSI GeForce RTX 3070 Gaming X Trio
AMD Ryzen 9 5900X, NVIDIA GeForce RTX 3070
74 (32.6min, 43.5P0.1, 50.6P1 - 270max) fps +69%
MSI GeForce RTX 3080 Gaming X Trio
AMD Ryzen 9 5900X, NVIDIA GeForce RTX 3080
65.6 (13.8min, 17.5P0.1, 51.4P1 - 229max) fps +50%
AMD Radeon RX 6800 XT
AMD Ryzen 9 5950X, AMD Radeon RX 6800 XT
64 (10.8min, 11.6P0.1, 50.8P1 - 159max) fps +46%
Durchschnittliche NVIDIA GeForce RTX 3070
  (43.8 - 74, n=3)
56 fps +28%
MSI GeForce RTX 3070 Ventus 3X
AMD Ryzen 9 5900X, NVIDIA GeForce RTX 3070
50.2 (16.1min, 25.6P0.1, 36.1P1 - 146max) fps +15%
Zotac Gaming GeForce RTX 3070 Twin Edge
AMD Ryzen 9 5950X, NVIDIA GeForce RTX 3070
43.8 (16.7min, 17.4P0.1, 33.8P1 - 80.3max) fps
1920x1080 Highest Settings + Ultra Ray Tracing
MSI GeForce RTX 3090 Suprim X
AMD Ryzen 9 5900X, NVIDIA GeForce RTX 3090
88.3 (22.4min, 29.5P0.1, 44.8P1 - 267max) fps +26%
MSI GeForce RTX 3080 Gaming X Trio
AMD Ryzen 9 5900X, NVIDIA GeForce RTX 3080
81.9 (17.3min, 30.1P0.1, 42.6P1 - 248max) fps +17%
Zotac Gaming GeForce RTX 3070 Twin Edge
AMD Ryzen 9 5950X, NVIDIA GeForce RTX 3070
70.1 (23.8min, 27.5P0.1, 42.6P1 - 217max) fps
MSI GeForce RTX 3070 Gaming X Trio
AMD Ryzen 9 5900X, NVIDIA GeForce RTX 3070
68.5 (19.1min, 22.3P0.1, 30.4P1 - 229max) fps -2%
Durchschnittliche NVIDIA GeForce RTX 3070
  (49.8 - 70.1, n=3)
62.8 fps -10%
MSI GeForce RTX 3070 Ventus 3X
AMD Ryzen 9 5900X, NVIDIA GeForce RTX 3070
49.8 (8.39min, 9.64P0.1, 25.1P1 - 146max) fps -29%
AMD Radeon RX 6800 XT
AMD Ryzen 9 5950X, AMD Radeon RX 6800 XT
21.8 (8.8min, 9.61P0.1, 16.2P1 - 49.5max) fps -69%
Watch Dogs Legion
1920x1080 Ultra Preset + Ultra Ray Tracing (DX12)
MSI GeForce RTX 3090 Suprim X
AMD Ryzen 9 5900X, NVIDIA GeForce RTX 3090
78.2 (53.58min, 63.39P1 - 115.63max) fps +51%
AMD Radeon RX 6800 XT
AMD Ryzen 9 5950X, AMD Radeon RX 6800 XT
71.4 (47.71min, 55.63P1 - 113.42max) fps +38%
MSI GeForce RTX 3080 Gaming X Trio
AMD Ryzen 9 5900X, NVIDIA GeForce RTX 3080
71.3 (24.22min, 56.02P1 - 112.08max) fps +38%
ASUS GeForce RTX 3080 ROG STRIX OC GAMING
AMD Ryzen 9 5900X, NVIDIA GeForce RTX 3080
70.9 (37.64min, 58.05P1 - 113.63max) fps +37%
Durchschnittliche NVIDIA GeForce RTX 3070
  (51.7 - 61, n=4)
55.1 fps +7%
MSI GeForce RTX 3070 Gaming X Trio
AMD Ryzen 9 5900X, NVIDIA GeForce RTX 3070
54.3 (18.74min, 40.53P1 - 81.06max) fps +5%
MSI GeForce RTX 3070 Ventus 3X
AMD Ryzen 9 5900X, NVIDIA GeForce RTX 3070
53.2 (13.35min, 28.3P1 - 83.71max) fps +3%
Zotac Gaming GeForce RTX 3070 Twin Edge
AMD Ryzen 9 5950X, NVIDIA GeForce RTX 3070
51.7 (15.03min, 25.28P1 - 71.97max) fps
3840x2160 Ultra Preset (DX12)
MSI GeForce RTX 3090 Suprim X
AMD Ryzen 9 5900X, NVIDIA GeForce RTX 3090
60.3 (34.68min, 51.05P1 - 78.14max) fps +55%
ASUS GeForce RTX 3080 ROG STRIX OC GAMING
AMD Ryzen 9 5900X, NVIDIA GeForce RTX 3080
54.1 (24.72min, 44.97P1 - 114.7max) fps +39%
MSI GeForce RTX 3080 Gaming X Trio
AMD Ryzen 9 5900X, NVIDIA GeForce RTX 3080
53.5 (33.98min, 42.85P1 - 79.6max) fps +38%
AMD Radeon RX 6800 XT
AMD Ryzen 9 5950X, AMD Radeon RX 6800 XT
49.3 (32.85min, 41.54P1 - 76.12max) fps +27%
MSI GeForce RTX 3070 Ventus 3X
AMD Ryzen 9 5900X, NVIDIA GeForce RTX 3070
39.2 (17.54min, 27.54P1 - 81.17max) fps +1%
Zotac Gaming GeForce RTX 3070 Twin Edge
AMD Ryzen 9 5950X, NVIDIA GeForce RTX 3070
38.9 (22.74min, 31.31P1 - 54.01max) fps
Durchschnittliche NVIDIA GeForce RTX 3070
  (37 - 39.2, n=4)
38 fps -2%
MSI GeForce RTX 3070 Gaming X Trio
AMD Ryzen 9 5900X, NVIDIA GeForce RTX 3070
37 (17.44min, 25.32P1 - 81.3max) fps -5%
2560x1440 Ultra Preset (DX12)
MSI GeForce RTX 3090 Suprim X
AMD Ryzen 9 5900X, NVIDIA GeForce RTX 3090
89.7 (59.87min, 73.02P1 - 132.92max) fps +37%
AMD Radeon RX 6800 XT
AMD Ryzen 9 5950X, AMD Radeon RX 6800 XT
84.5 (58.88min, 69.45P1 - 137.16max) fps +29%
ASUS GeForce RTX 3080 ROG STRIX OC GAMING
AMD Ryzen 9 5900X, NVIDIA GeForce RTX 3080
81.6 (44.31min, 65.35P1 - 139.28max) fps +25%
MSI GeForce RTX 3080 Gaming X Trio
AMD Ryzen 9 5900X, NVIDIA GeForce RTX 3080
81.1 (46.24min, 61.45P1 - 140.66max) fps +24%
MSI GeForce RTX 3070 Ventus 3X
AMD Ryzen 9 5900X, NVIDIA GeForce RTX 3070
66.3 (41min, 50.81P1 - 116.42max) fps +2%
Durchschnittliche NVIDIA GeForce RTX 3070
  (65.3 - 67, n=4)
66.1 fps +1%
MSI GeForce RTX 3070 Gaming X Trio
AMD Ryzen 9 5900X, NVIDIA GeForce RTX 3070
65.7 (25.01min, 51.86P1 - 96.9max) fps +1%
Zotac Gaming GeForce RTX 3070 Twin Edge
AMD Ryzen 9 5950X, NVIDIA GeForce RTX 3070
65.3 (41.29min, 53.17P1 - 88.97max) fps
1920x1080 Ultra Preset (DX12)
AMD Radeon RX 6800 XT
AMD Ryzen 9 5950X, AMD Radeon RX 6800 XT
112 (75.12min, 87.97P1 - 181.69max) fps +32%
ASUS GeForce RTX 3080 ROG STRIX OC GAMING
AMD Ryzen 9 5900X, NVIDIA GeForce RTX 3080
103 (55.63min, 83.65P1 - 156.57max) fps +21%
MSI GeForce RTX 3090 Suprim X
AMD Ryzen 9 5900X, NVIDIA GeForce RTX 3090
103 (30.26min, 75.96P1 - 155.81max) fps +21%
MSI GeForce RTX 3080 Gaming X Trio
AMD Ryzen 9 5900X, NVIDIA GeForce RTX 3080
99.3 (13.98min, 73.29P1 - 167.32max) fps +17%
MSI GeForce RTX 3070 Ventus 3X
AMD Ryzen 9 5900X, NVIDIA GeForce RTX 3070
86 (37.65min, 66.32P1 - 130.48max) fps +1%
Zotac Gaming GeForce RTX 3070 Twin Edge
AMD Ryzen 9 5950X, NVIDIA GeForce RTX 3070
84.9 (55.86min, 67.74P1 - 127.49max) fps
Durchschnittliche NVIDIA GeForce RTX 3070
  (79 - 89, n=4)
84.7 fps 0%
MSI GeForce RTX 3070 Gaming X Trio
AMD Ryzen 9 5900X, NVIDIA GeForce RTX 3070
79 (42.91min, 56.59P1 - 121.27max) fps -7%
Metro Exodus
1920x1080 Ultra Quality DXR AF:16x
MSI GeForce RTX 3090 Suprim X
AMD Ryzen 9 5900X, NVIDIA GeForce RTX 3090
116 (59.68min - 166.06max) fps +41%
MSI GeForce RTX 3080 Gaming X Trio
AMD Ryzen 9 5900X, NVIDIA GeForce RTX 3080
102 (54.36min - 150.53max) fps +24%
ASUS GeForce RTX 3080 ROG STRIX OC GAMING
AMD Ryzen 9 5900X, NVIDIA GeForce RTX 3080
91.5 (51.03min - 134.52max) fps +11%
Zotac Gaming GeForce RTX 3090 Trinity
AMD Ryzen 9 3900X, NVIDIA GeForce RTX 3090
87.8 (55.41min - 116.04max) fps +7%
AMD Radeon RX 6800 XT
AMD Ryzen 9 5950X, AMD Radeon RX 6800 XT
85.5 (52.71min - 120.38max) fps +4%
Zotac Gaming GeForce RTX 3070 Twin Edge
AMD Ryzen 9 5950X, NVIDIA GeForce RTX 3070
82.1 (47.4min - 134.03max) fps
Durchschnittliche NVIDIA GeForce RTX 3070
  (80.4 - 83, n=5)
81.6 fps -1%
MSI GeForce RTX 3070 Gaming X Trio
AMD Ryzen 9 5900X, NVIDIA GeForce RTX 3070
80.4 (43.5min - 124.3max) fps -2%
MSI GeForce RTX 3070 Ventus 3X
AMD Ryzen 9 5900X, NVIDIA GeForce RTX 3070
80.4 (44.72min - 124.72max) fps -2%
KFA2 GeForce RTX 2080 Ti EX
AMD Ryzen 9 3900X, NVIDIA GeForce RTX 2080 Ti (Desktop)
78.6 (43min - 115max) fps -4%
Nvidia GeForce RTX 2080 Super
AMD Ryzen 7 2700X, NVIDIA GeForce RTX 2080 Super (Desktop)
65 (37.62min - 97.62max) fps -21%
Nvidia GeForce RTX 2070 Super
AMD Ryzen 7 2700X, NVIDIA GeForce RTX 2070 Super (Desktop)
57.5 (34min - 85max) fps -30%
Nvidia GeForce RTX 2060 Super
AMD Ryzen 7 2700X, NVIDIA GeForce RTX 2060 Super (Desktop)
50.1 (30min - 72max) fps -39%
3840x2160 Ultra Quality AF:16x
MSI GeForce RTX 3090 Suprim X
AMD Ryzen 9 5900X, NVIDIA GeForce RTX 3090
76.3 (45.25min - 131.44max) fps +58%
Zotac Gaming GeForce RTX 3090 Trinity
AMD Ryzen 9 3900X, NVIDIA GeForce RTX 3090
71.7 (40.9min - 110.8max) fps +48%
MSI GeForce RTX 3080 Gaming X Trio
AMD Ryzen 9 5900X, NVIDIA GeForce RTX 3080
65.9 (38.48min - 122.03max) fps +36%
ASUS GeForce RTX 3080 ROG STRIX OC GAMING
AMD Ryzen 9 5900X, NVIDIA GeForce RTX 3080
64.1 (36.54min - 108.57max) fps +33%
AMD Radeon RX 6800 XT
AMD Ryzen 9 5950X, AMD Radeon RX 6800 XT
56.3 (40.14min - 64.28max) fps +17%
MSI GeForce RTX 3070 Gaming X Trio
AMD Ryzen 9 5900X, NVIDIA GeForce RTX 3070
49.1 (30.24min - 89.89max) fps +2%
Durchschnittliche NVIDIA GeForce RTX 3070
  (48.3 - 49.7, n=5)
48.9 fps +1%
MSI GeForce RTX 3070 Ventus 3X
AMD Ryzen 9 5900X, NVIDIA GeForce RTX 3070
48.6 (29.82min - 99.64max) fps +1%
Zotac Gaming GeForce RTX 3070 Twin Edge
AMD Ryzen 9 5950X, NVIDIA GeForce RTX 3070
48.3 (29.65min - 105.2max) fps
KFA2 GeForce RTX 2080 Ti EX
AMD Ryzen 9 3900X, NVIDIA GeForce RTX 2080 Ti (Desktop)
47.5 (31min - 69max) fps -2%
Nvidia GeForce RTX 2080 Super
AMD Ryzen 7 2700X, NVIDIA GeForce RTX 2080 Super (Desktop)
40 (25.84min - 59.35max) fps -17%
Nvidia GeForce RTX 2070 Super
AMD Ryzen 7 2700X, NVIDIA GeForce RTX 2070 Super (Desktop)
35 (23min - 51max) fps -28%
Nvidia GeForce RTX 2060 Super
AMD Ryzen 7 2700X, NVIDIA GeForce RTX 2060 Super (Desktop)
29.7 (20min - 42max) fps -39%
AMD Radeon RX 5700 XT
AMD Ryzen 7 2700X, AMD Radeon RX 5700 XT (Desktop)
29.6 (20.7min - 36.64max) fps -39%
2560x1440 Ultra Quality AF:16x
MSI GeForce RTX 3090 Suprim X
AMD Ryzen 9 5900X, NVIDIA GeForce RTX 3090
112 (58.69min - 182.42max) fps +49%
Zotac Gaming GeForce RTX 3090 Trinity
AMD Ryzen 9 3900X, NVIDIA GeForce RTX 3090
102 (61.16min - 146.03max) fps +35%
MSI GeForce RTX 3080 Gaming X Trio
AMD Ryzen 9 5900X, NVIDIA GeForce RTX 3080
97.4 (51.56min - 162.47max) fps +29%
AMD Radeon RX 6800 XT
AMD Ryzen 9 5950X, AMD Radeon RX 6800 XT
94.6 (55.44min - 143.68max) fps +25%
ASUS GeForce RTX 3080 ROG STRIX OC GAMING
AMD Ryzen 9 5900X, NVIDIA GeForce RTX 3080
92.2 (46.62min - 155.93max) fps +22%
Durchschnittliche NVIDIA GeForce RTX 3070
  (74.4 - 78.3, n=5)
75.8 fps +1%
Zotac Gaming GeForce RTX 3070 Twin Edge
AMD Ryzen 9 5950X, NVIDIA GeForce RTX 3070
75.4 (39.91min - 127.26max) fps
MSI GeForce RTX 3070 Ventus 3X
AMD Ryzen 9 5900X, NVIDIA GeForce RTX 3070
74.8 (41.41min - 120.5max) fps -1%
MSI GeForce RTX 3070 Gaming X Trio
AMD Ryzen 9 5900X, NVIDIA GeForce RTX 3070
74.4 (38.95min - 129.85max) fps -1%
KFA2 GeForce RTX 2080 Ti EX
AMD Ryzen 9 3900X, NVIDIA GeForce RTX 2080 Ti (Desktop)
71.9 (40min - 108max) fps -5%
Nvidia GeForce RTX 2080 Super
AMD Ryzen 7 2700X, NVIDIA GeForce RTX 2080 Super (Desktop)
61 (35.51min - 95.82max) fps -19%
AMD Radeon RX 5700 XT
AMD Ryzen 7 2700X, AMD Radeon RX 5700 XT (Desktop)
54.5 (31.85min - 78.06max) fps -28%
Nvidia GeForce RTX 2070 Super
AMD Ryzen 7 2700X, NVIDIA GeForce RTX 2070 Super (Desktop)
54.3 (32min - 83max) fps -28%
Nvidia GeForce RTX 2060 Super
AMD Ryzen 7 2700X, NVIDIA GeForce RTX 2060 Super (Desktop)
46.5 (28min - 69max) fps -38%
1920x1080 Ultra Quality AF:16x
MSI GeForce RTX 3090 Suprim X
AMD Ryzen 9 5900X, NVIDIA GeForce RTX 3090
132 (72.24min - 199.88max) fps +41%
MSI GeForce RTX 3080 Gaming X Trio
AMD Ryzen 9 5900X, NVIDIA GeForce RTX 3080
116 (56.76min - 185.19max) fps +24%
AMD Radeon RX 6800 XT
AMD Ryzen 9 5950X, AMD Radeon RX 6800 XT
115 (64.52min - 181.92max) fps +23%
ASUS GeForce RTX 3080 ROG STRIX OC GAMING
AMD Ryzen 9 5900X, NVIDIA GeForce RTX 3080
111 (57.16min - 183.25max) fps +19%
Zotac Gaming GeForce RTX 3090 Trinity
AMD Ryzen 9 3900X, NVIDIA GeForce RTX 3090
108 (64.8min - 150.67max) fps +15%
Durchschnittliche NVIDIA GeForce RTX 3070
  (91.3 - 97.7, n=5)
93.9 fps 0%
MSI GeForce RTX 3070 Ventus 3X
AMD Ryzen 9 5900X, NVIDIA GeForce RTX 3070
93.7 (46.52min - 161.6max) fps 0%
Zotac Gaming GeForce RTX 3070 Twin Edge
AMD Ryzen 9 5950X, NVIDIA GeForce RTX 3070
93.6 (45.01min - 161.08max) fps
MSI GeForce RTX 3070 Gaming X Trio
AMD Ryzen 9 5900X, NVIDIA GeForce RTX 3070
91.3 (46.36min - 152.74max) fps -2%
KFA2 GeForce RTX 2080 Ti EX
AMD Ryzen 9 3900X, NVIDIA GeForce RTX 2080 Ti (Desktop)
89.7 (46min - 140max) fps -4%
Nvidia GeForce RTX 2080 Super
AMD Ryzen 7 2700X, NVIDIA GeForce RTX 2080 Super (Desktop)
76 (38.54min - 122.4max) fps -19%
Nvidia GeForce RTX 2070 Super
AMD Ryzen 7 2700X, NVIDIA GeForce RTX 2070 Super (Desktop)
67.8 (36min - 110max) fps -28%
AMD Radeon RX 5700 XT
AMD Ryzen 7 2700X, AMD Radeon RX 5700 XT (Desktop)
61 (36.09min - 86.1max) fps -35%
Nvidia GeForce RTX 2060 Super
AMD Ryzen 7 2700X, NVIDIA GeForce RTX 2060 Super (Desktop)
58.9 (32min - 92max) fps -37%
min. mittel hoch max.QHD4K
The Witcher 3 (2015) 548 449 244 123 89.6
Shadow of the Tomb Raider (2018) 165 161 157 150 114 62
Assassin´s Creed Odyssey (2018) 149 125 107 81 68 48
Metro Exodus (2019) 197 154 118 93.6 75.4 48.3
Total War: Three Kingdoms (2019) 371.5 206.4 136 103.5 67.5 33.1
Borderlands 3 (2019) 169 150 126 104 79 44.5
Red Dead Redemption 2 (2019) 175 160 118 77.9 63.2 42.6
Doom Eternal (2020) 547 358 322 311 244 136
Gears Tactics (2020) 342.6 204.9 150.8 136.2 98.2 53.5
Watch Dogs Legion (2020) 129 127 113 84.9 65.3 38.9
Assassin´s Creed Valhalla (2020) 130 100 85 77 65 43
Call of Duty Black Ops Cold War (2020) 239 146 124 120 89.5 43.8
Immortals Fenyx Rising (2020) 148 109 96 88 76 54
Cyberpunk 2077 1.0 (2020) 125 108 93.1 80.6 53.7 26.6

Emissionen

In Sachen Hitzeentwicklung und Energieverbrauch verhält sich die RTX 3070 nicht unbedingt konservativ. Allerdings bedient sich Zotac einiger Tricks, beispielsweise taktet der Hersteller die GPU minimal niedriger, verbaut ein verbessertes IceStorm-2.0-Kühlsystem und verwendet eine eine Backplate aus Metall, um die Hitze besser ableiten zu können.

Die voreingestellte TDP von 220 W kann um 9 Prozent auf W gesteigert werden, was einen Boosttakt von bis zu 1.785 MHz ermöglicht. Das sind etwa 45 MHz weniger als zum Beispiel die ab Werk übertaktete MSI RTX 3070 Gaming X Trio.

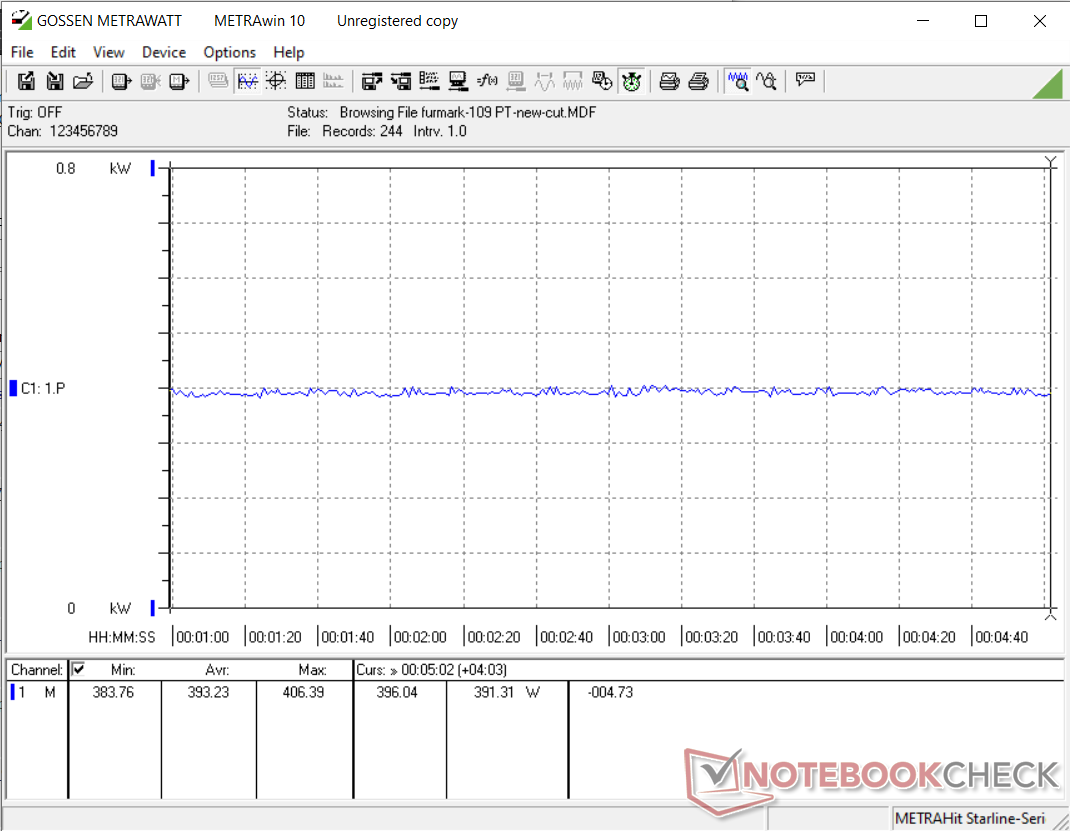
Wir haben den FurMark-Stress sowohl mit 100 als auch 109 Prozent Power-Target getestet, um die Auswirkungen auf Temperatur und Lautstärke beobachten zu können. Der Verbrauch des Gesamtsystems wurde während des Stesstests mittels FurMark und The Witcher 3 bei 1080p Ultra getestet.

FurMark-Stress bei 100% Power Target
FurMark-Stress bei 109% Power Target

Temperatur

Zotac RTX 3070 Twin Edge Heat Map.

Die RTX 3070 Twin Edge bleibt dank ihrer Dual-Lüfter mit je 11 Propellerflügeln relativ kühl. Laut Zotac verbessern sie den Luftfluss um 10 Prozent gegenüber der Vorgängergeneration. Allerdings bedeutet dies auch, dass die Lüfter recht laut werden, wie man weiter unten erkennen kann. 

Unter Volllast erwärmt sich der GPU-Kern auf 77 °C bei 220 W TGP. Unter einem TGP von 240 W erreicht der Kern heißere 81 °C.

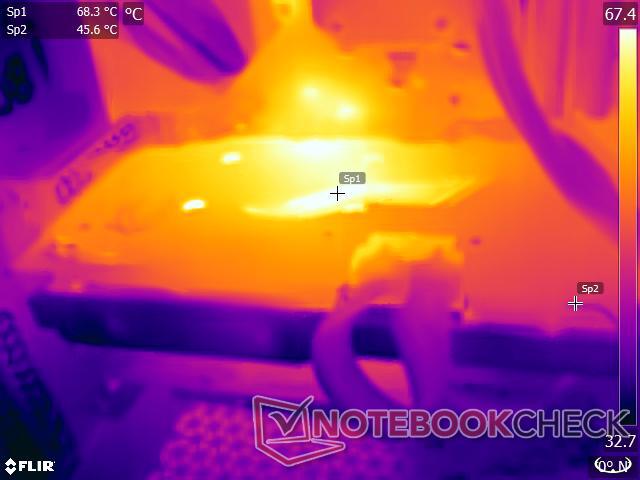
Die Oberflächentemperaturen erreichen unter Stress hingegen maximal 68.3 °C in der nähe der GPU-Zone, Bereiche, die etwas weiter von diesem Hot Spot entfernt sind, messen wir nur etwa 45 °C, wie man an unserer Heat Map erkennen kann.

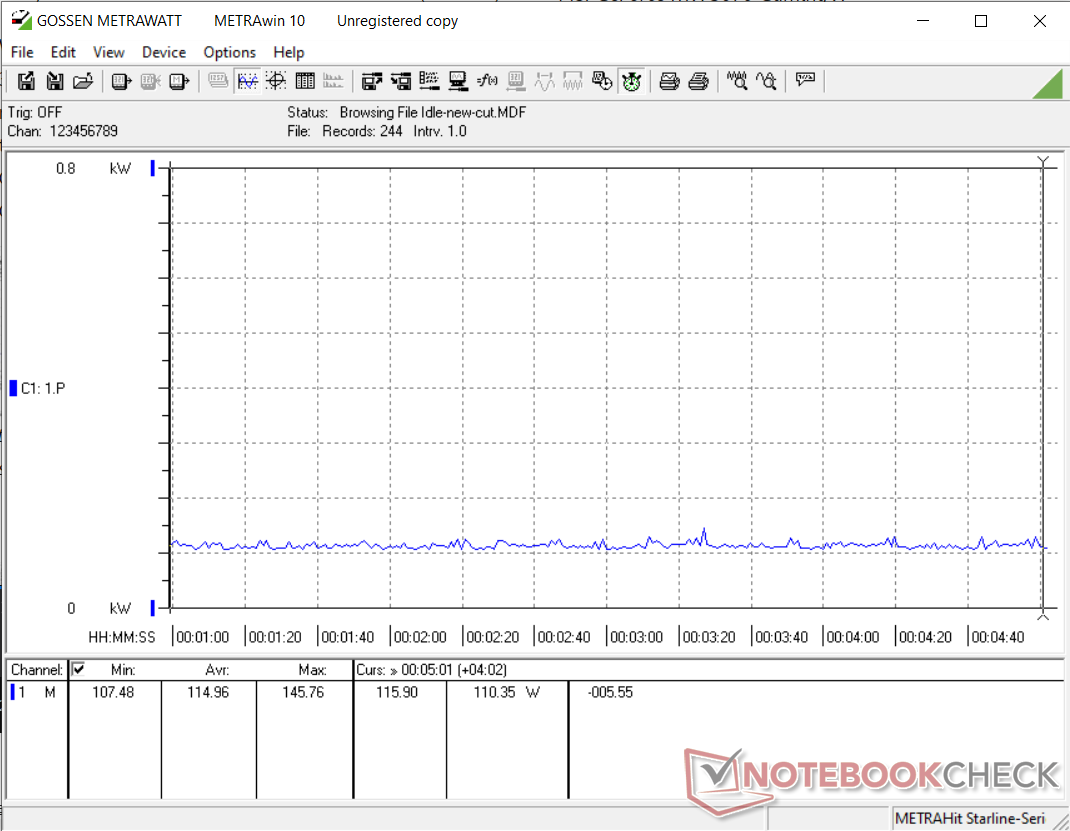
Die Temperaturen im Leerlauf bewegen sich zwischen 48 °C und 53 °C, dabei sind die Lüfter ausgeschaltet.

Energieverbrauch

Unser Testsystem mit fünf aktiven Lüftern (drei Corsair SP 120 mm Gehäuselüfter und zwei Corsair ML 120 Kühlerlüfter) verbraucht etwa 115 W im Leerlauf. Alle RGB-Lichter waren dabei deaktiviert und die Elite Capellix Pumpe läuft im Balanced-Profil.

Wir beobachten einen Durchschnittsverbrauch von 375 W unter FurMark und dem normalen 100-Prozent-Power-Target (PT). Das ist etwa 6 Prozent geringer als der Verbrauch einer RTX 2080 Ti und etwa auf dem Niveau einer RTX 2080 Super. Wird das PT auf 109 Prozent erhöht, so resultiert dies in einem rund 5 Prozent höherem Verbrauch von 393 W.

Unter The Witcher 3 bei 1080p Ultra zieht die RTX 3070 Twin Edge minimal mehr Strom aus der Dose als die MSI RTX 3070 Gaming X Trio, aber verglichen mit einer RTX 2080 Ti oder Titan RTX ist sie deutlich effizienter.

Systemverbrauch - Idle
Systemverbrauch - FurMark bei 100% PT
Systemverbrauch - FurMark bei 109% PT
Systemverbrauch - The Witcher 3 1080p Ultra
Power Consumption
1920x1080 The Witcher 3 ultra (external Monitor)
MSI GeForce RTX 3090 Suprim X
NVIDIA GeForce RTX 3090, R9 5900X (Idle: 105.9 W)
597 (577min - 618max) Watt * -47%
ASUS GeForce RTX 3080 ROG STRIX OC GAMING
NVIDIA GeForce RTX 3080, R9 5900X (Idle: 88.3 W)
505 (389min - 543max) Watt * -24%
AMD Radeon RX 6800 XT
AMD Radeon RX 6800 XT, R9 5950X (Idle: 99.5 W)
505 (389min - 543max) Watt * -24%
MSI GeForce RTX 3080 Gaming X Trio
NVIDIA GeForce RTX 3080, R9 5900X (Idle: 103 W)
498.3 (487min - 523max) Watt * -23%
AMD Ryzen 9 5900X
NVIDIA Titan RTX, R9 5900X (Idle: 78.1 W)
439.6 (419min - 497max) Watt * -8%
KFA2 GeForce RTX 2080 Ti EX
NVIDIA GeForce RTX 2080 Ti (Desktop), R9 3900X (Idle: 100.5 W)
438.8 (431min - 463max) Watt * -8%
Zotac Gaming GeForce RTX 3070 Twin Edge
NVIDIA GeForce RTX 3070, R9 5950X (Idle: 114.96 W)
406 (397min, 399P1 - 421max) Watt *
Durchschnittliche NVIDIA GeForce RTX 3070
  (Idle: 317 - 550, n=5 W)
401 Watt * +1%
MSI GeForce RTX 3070 Gaming X Trio
NVIDIA GeForce RTX 3070, R9 5900X (Idle: 95.1 W)
394.5 (381min - 430max) Watt * +3%
Nvidia GeForce RTX 2080 Super
NVIDIA GeForce RTX 2080 Super (Desktop), R7 2700X (Idle: 78.87 W)
382.8 (360min - 410max) Watt * +6%
AMD Radeon RX 5700 XT
AMD Radeon RX 5700 XT (Desktop), R7 2700X (Idle: 69.8 W)
348.7 (341min - 359max) Watt * +14%
Nvidia GeForce RTX 2070 Super
NVIDIA GeForce RTX 2070 Super (Desktop), R7 2700X (96.8 fps, Idle: 80.5 W)
344.7 (335min - 370max) Watt * +15%
MSI GeForce RTX 3070 Ventus 3X
NVIDIA GeForce RTX 3070, R9 5900X (Idle: 91.46 W)
316.5 (309min - 329max) Watt * +22%
Nvidia GeForce RTX 2060 Super
NVIDIA GeForce RTX 2060 Super (Desktop), R7 2700X (82.7 fps, Idle: 77.12 W)
298.2 (293min - 322max) Watt * +27%
1280x720 FurMark 1.19 GPU Stress Test (external Monitor)
MSI GeForce RTX 3090 Suprim X
NVIDIA GeForce RTX 3090, R9 5900X (Idle: 105.9 W)
551 (521min - 582max) Watt * -40%
ASUS GeForce RTX 3080 ROG STRIX OC GAMING
NVIDIA GeForce RTX 3080, R9 5900X (Idle: 88.3 W)
505 (493min - 541max) Watt * -28%
MSI GeForce RTX 3080 Gaming X Trio
NVIDIA GeForce RTX 3080, R9 5900X (Idle: 103 W)
492 (485min - 514max) Watt * -25%
AMD Radeon RX 6800 XT
AMD Radeon RX 6800 XT, R9 5950X (Idle: 99.5 W)
447.9 (413min - 484max) Watt * -14%
KFA2 GeForce RTX 2080 Ti EX
NVIDIA GeForce RTX 2080 Ti (Desktop), R9 3900X (Idle: 100.5 W)
400.8 (354min - 432max) Watt * -2%
Zotac Gaming GeForce RTX 3070 Twin Edge
NVIDIA GeForce RTX 3070, R9 5950X (109% PT, Idle: 114.96 W)
393 (384min, 385P1 - 406max) Watt *
Zotac Gaming GeForce RTX 3070 Twin Edge
NVIDIA GeForce RTX 3070, R9 5950X (100% PT, Idle: 114.96 W)
375 (365min, 366P1 - 421max) Watt * +5%
MSI GeForce RTX 3070 Gaming X Trio
NVIDIA GeForce RTX 3070, R9 5900X (Idle: 95.1 W)
376.9 (369min - 433max) Watt * +4%
Nvidia GeForce RTX 2080 Super
NVIDIA GeForce RTX 2080 Super (Desktop), R7 2700X (Idle: 78.87 W)
376.8 (331min - 409max) Watt * +4%
Durchschnittliche NVIDIA GeForce RTX 3070
  (Idle: 281 - 393, n=6 W)
348 Watt * +11%
MSI GeForce RTX 3070 Ventus 3X
NVIDIA GeForce RTX 3070, R9 5900X (Idle: 91.46 W)
336.6 (330min - 365max) Watt * +14%
AMD Radeon RX 5700 XT
AMD Radeon RX 5700 XT (Desktop), R7 2700X (239 fps, Idle: 69.8 W)
326.6 (313min - 351max) Watt * +17%
Nvidia GeForce RTX 2070 Super
NVIDIA GeForce RTX 2070 Super (Desktop), R7 2700X (283 fps, Idle: 80.5 W)
326 (315min - 348max) Watt * +17%
Nvidia GeForce RTX 2060 Super
NVIDIA GeForce RTX 2060 Super (Desktop), R7 2700X (237 fps, Idle: 77.12 W)
281.4 (275min - 321max) Watt * +28%

* ... kleinere Werte sind besser

Geräuschemissionen

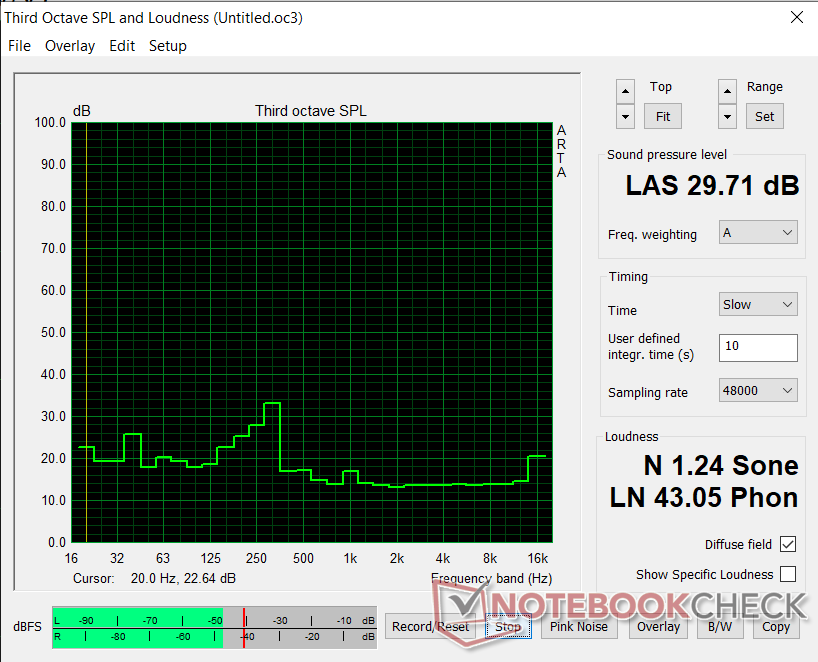
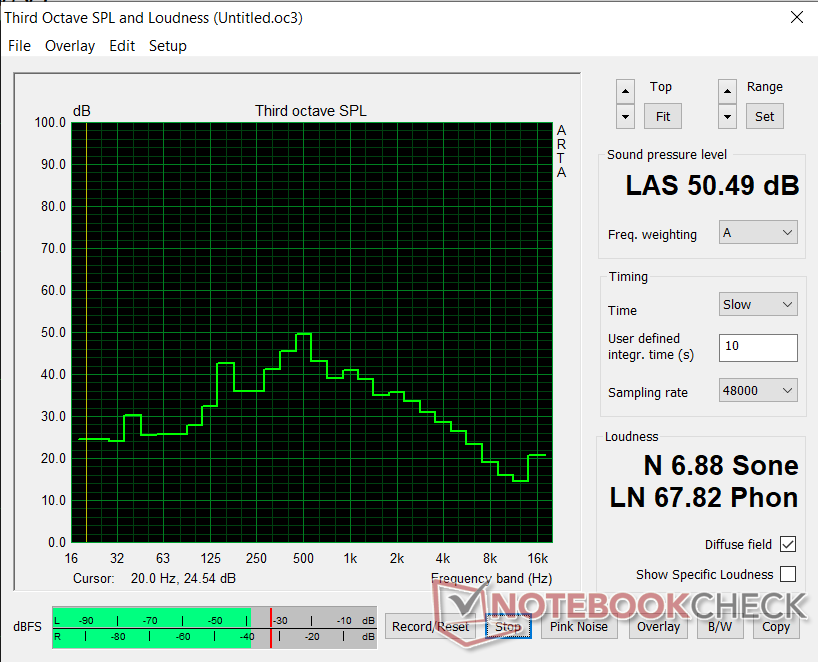
Im Systemleerlauf ist die Zotac RTX 3070 Twin Edge geräuschlos, ihre Lüfter bleiben deaktiviert. Unter Stress wird es allerdings laut. Nachdem man die Karte etwa 30 Minuten via FurMark stresst, messen wir in einer Distanz von 20 cm vom Gehäuse eine Lautstärke von über 50 db(A). Die hohe Lautstärke kommt sicher auch durch die nur zwei Lüfter zustande, welche hart arbeiten müssen, um die Temperaturen der kompakten Karten in Zaum zu halten.

Nutzer können die Lautstärke durch die manuelle Anpassung der Lüfterkurven noch optimieren, aber wir empfehlen beim Gamen die Verwendung eines Headsets, um vom hohen Pegel nicht gestört zu werden. 

Geräuschpegel - Idle mit deaktivierten Gehäuselüftern
Geräuschpegel - FurMark-Stress mit deaktivierten Gehäuselüftern

Pro

+ Kompakter 2-Slot-Formfaktor
+ Gute Bauweise
+ 2x 6-Pol-zu-8-Pol-Adapter enthalten
+ Backplate aus Metall
+ Zwei 11-Blatt-Lüfter
+ Lüfter sind im Idle aus
+ Leistung auf dem Niveau einer RTX 2080 Ti
+ Ray Tracing und DLSS 2.0-Funktionalität in kompatiblen Spielen
+ Option zur Erhöhung des TGP auf 240 W.
+ Oberflächentemperaturen unter 70 ° C unter Last
+ 3 + 2 Jahre Garantie in ausgewählten Regionen

Contra

- Kunststoffabdeckung könnte fester sein
- Das Zotac-Logo leuchtet nur in Weiß
- Etwas niedriger getaktet als die Founders Edition
- Hoher Geräuschpegel unter Last
- 8 GB GDDR6 VRAM sind möglicherweise nicht zukunftssicher
- Sehr begrenzte Lagerbestände
- Überhöhte Preise

Fazit

Die Zotac Gaming GeForce RTX 3070 Twin Edge. Testmodell zur Verfügung gestellt von Zotac India.

Die Zotac Gaming GeForce RTX 3070 Twin Edge ist gut verarbeitet, es fallen keine scharfen Ecken auf, nur das Plastikgehäuse könnte etwas fester sitzen. Die Karte nimmt nur wenig Platz ein und dürfte so in die meisten Gehäuse passen. Die Metall-Backplate ist eine willkommene Zugabe für die Hitzeableitung.

RGB-Liebhaber werden etwas enttäuscht sein, das die Twin Edge nur statischen Weiß für das Zotac-Logo auffährt. In Kombination mit den fünf Kupfer-Heatpipes schaffen es die 11-blättrigen Dual-Lüfter die Temperatur in Zaum zu halten. Dabei werden sie unter Last allerdings recht laut.

Die Zotac Gaming GeForce RTX 3070 Twin Edge ist eine gute Variante der RTX 3070. Die Leistung ist sehr nahe an einer RTX 2080 Ti oder übertrifft diese zuweilen auch leicht. Hinsichtlich des Energieverbrauchs und der Lautstärke gibt es aber noch Raum für Optimierungen.

Die Zotac RTX 3070 Twin Edge leistet sowohl in den synthetischen Benchmarks als auch in Spielen etwa das Gleiche wie eine RTX 2080 Ti, verbraucht dabei aber weniger Strom. Zotac erlaubt zudem die Steigerung des TGP um 20 W, was die Taktraten um 60 MHz erhöht und den Energieverbrauch um etwa 5 Prozent steigen lässt.

Unser Hauptproblem mit der Zotac RTX 3070 Twin Edge sind die aktuellen Verkaufspreise. NVIDIAs UVP für die RTX 3070 liegt bei 499 Euro, die RTX 3070 Twin Edge wird aber für ganze 620 Euro angeboten. Es kommt noch schlimmer: Durch die aktuellen Lieferbeschränkungen und folglicher Knappheit soll man für die RTX 3070 Twin Edge aktuell unfassbare 950 Euro aufwenden! Jedem, der nicht gerade ein unglaubliches Verlangen nach einer neuen GPU hat, empfehlen wir daher dringend zu warten bis die Preise wieder auf erträglichere Werte fallen. 

Preise und Verfügbarkeit

Die Zotac Gaming GeForce RTX 3070 Twin Edge kann über verschiedene Onlinehändler bezogen werden, darunter der Zotac Store, Amazon (909,95 Euro, nur noch 1 auf Lager) und Alternate. Bei Letzteren gibt es mit 799 Euro derzeit das preiswerteste Angebot (laut Idealo, Stand 29.01.2021), was immer noch deutlich oberhalb der UVP liegt. In vielen Shops wird sie aber auch als "gerade nicht verfügbar" gelistet.

Preisvergleich

static version load dynamic
Loading Comments
Diesen Artikel kommentieren / Antworten
Teilen Sie diesen Artikel, um uns zu unterstützen. Jeder Link hilft!
> Notebook Test, Laptop Test und News > Tests > Notebook Testberichte > Zotac Gaming GeForce RTX 3070 Twin Edge im Test: Die Leistung einer RTX 2080 Ti für jedermann
Autor: Vaidyanathan Subramaniam, 29.01.2021 (Update: 29.01.2021)