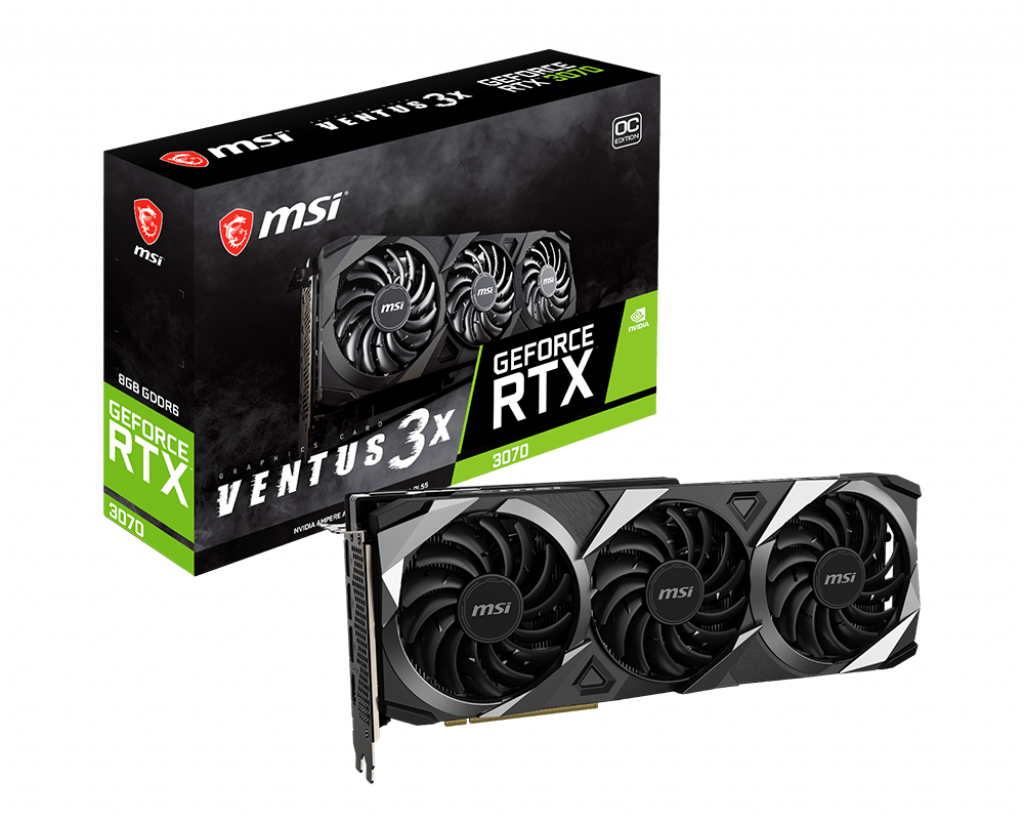
MSI GeForce RTX 3070 Ventus 3X OC Desktop Grafikkarte im Test

Die neuen RTX-3000-Grafikkarten haben wir inzwischen schon ausgiebig testen können. Mit der MSI GeForce RTX 3070 Ventus 3X OC hatten wir aber nun einen vergleichsweisen preiswerten Vertreter der neuen Ampere-Serie im Test. Denn mit einer UVP von nur 529 Euro ist das Custom-Modell nicht viel teurer als das Referenzmodell von Nvidia (499 Euro). Die angespannte Lage auf dem Markt sorgt aber weiterhin für eine sehr geringe Verfügbarkeit und treibt somit auch den Kaufpreis extrem in die Höhe, sodass zum Testzeitpunkt Preise ab 800 Euro für lagernde Modelle aufgerufen werden. Das ist ein Zustand, der sehr frustrierend ist, wenn man sich momentan ein neues Gaming-System zusammenstellen will um neue Blockbuster wie Cyberpunk 2077 zu zocken.
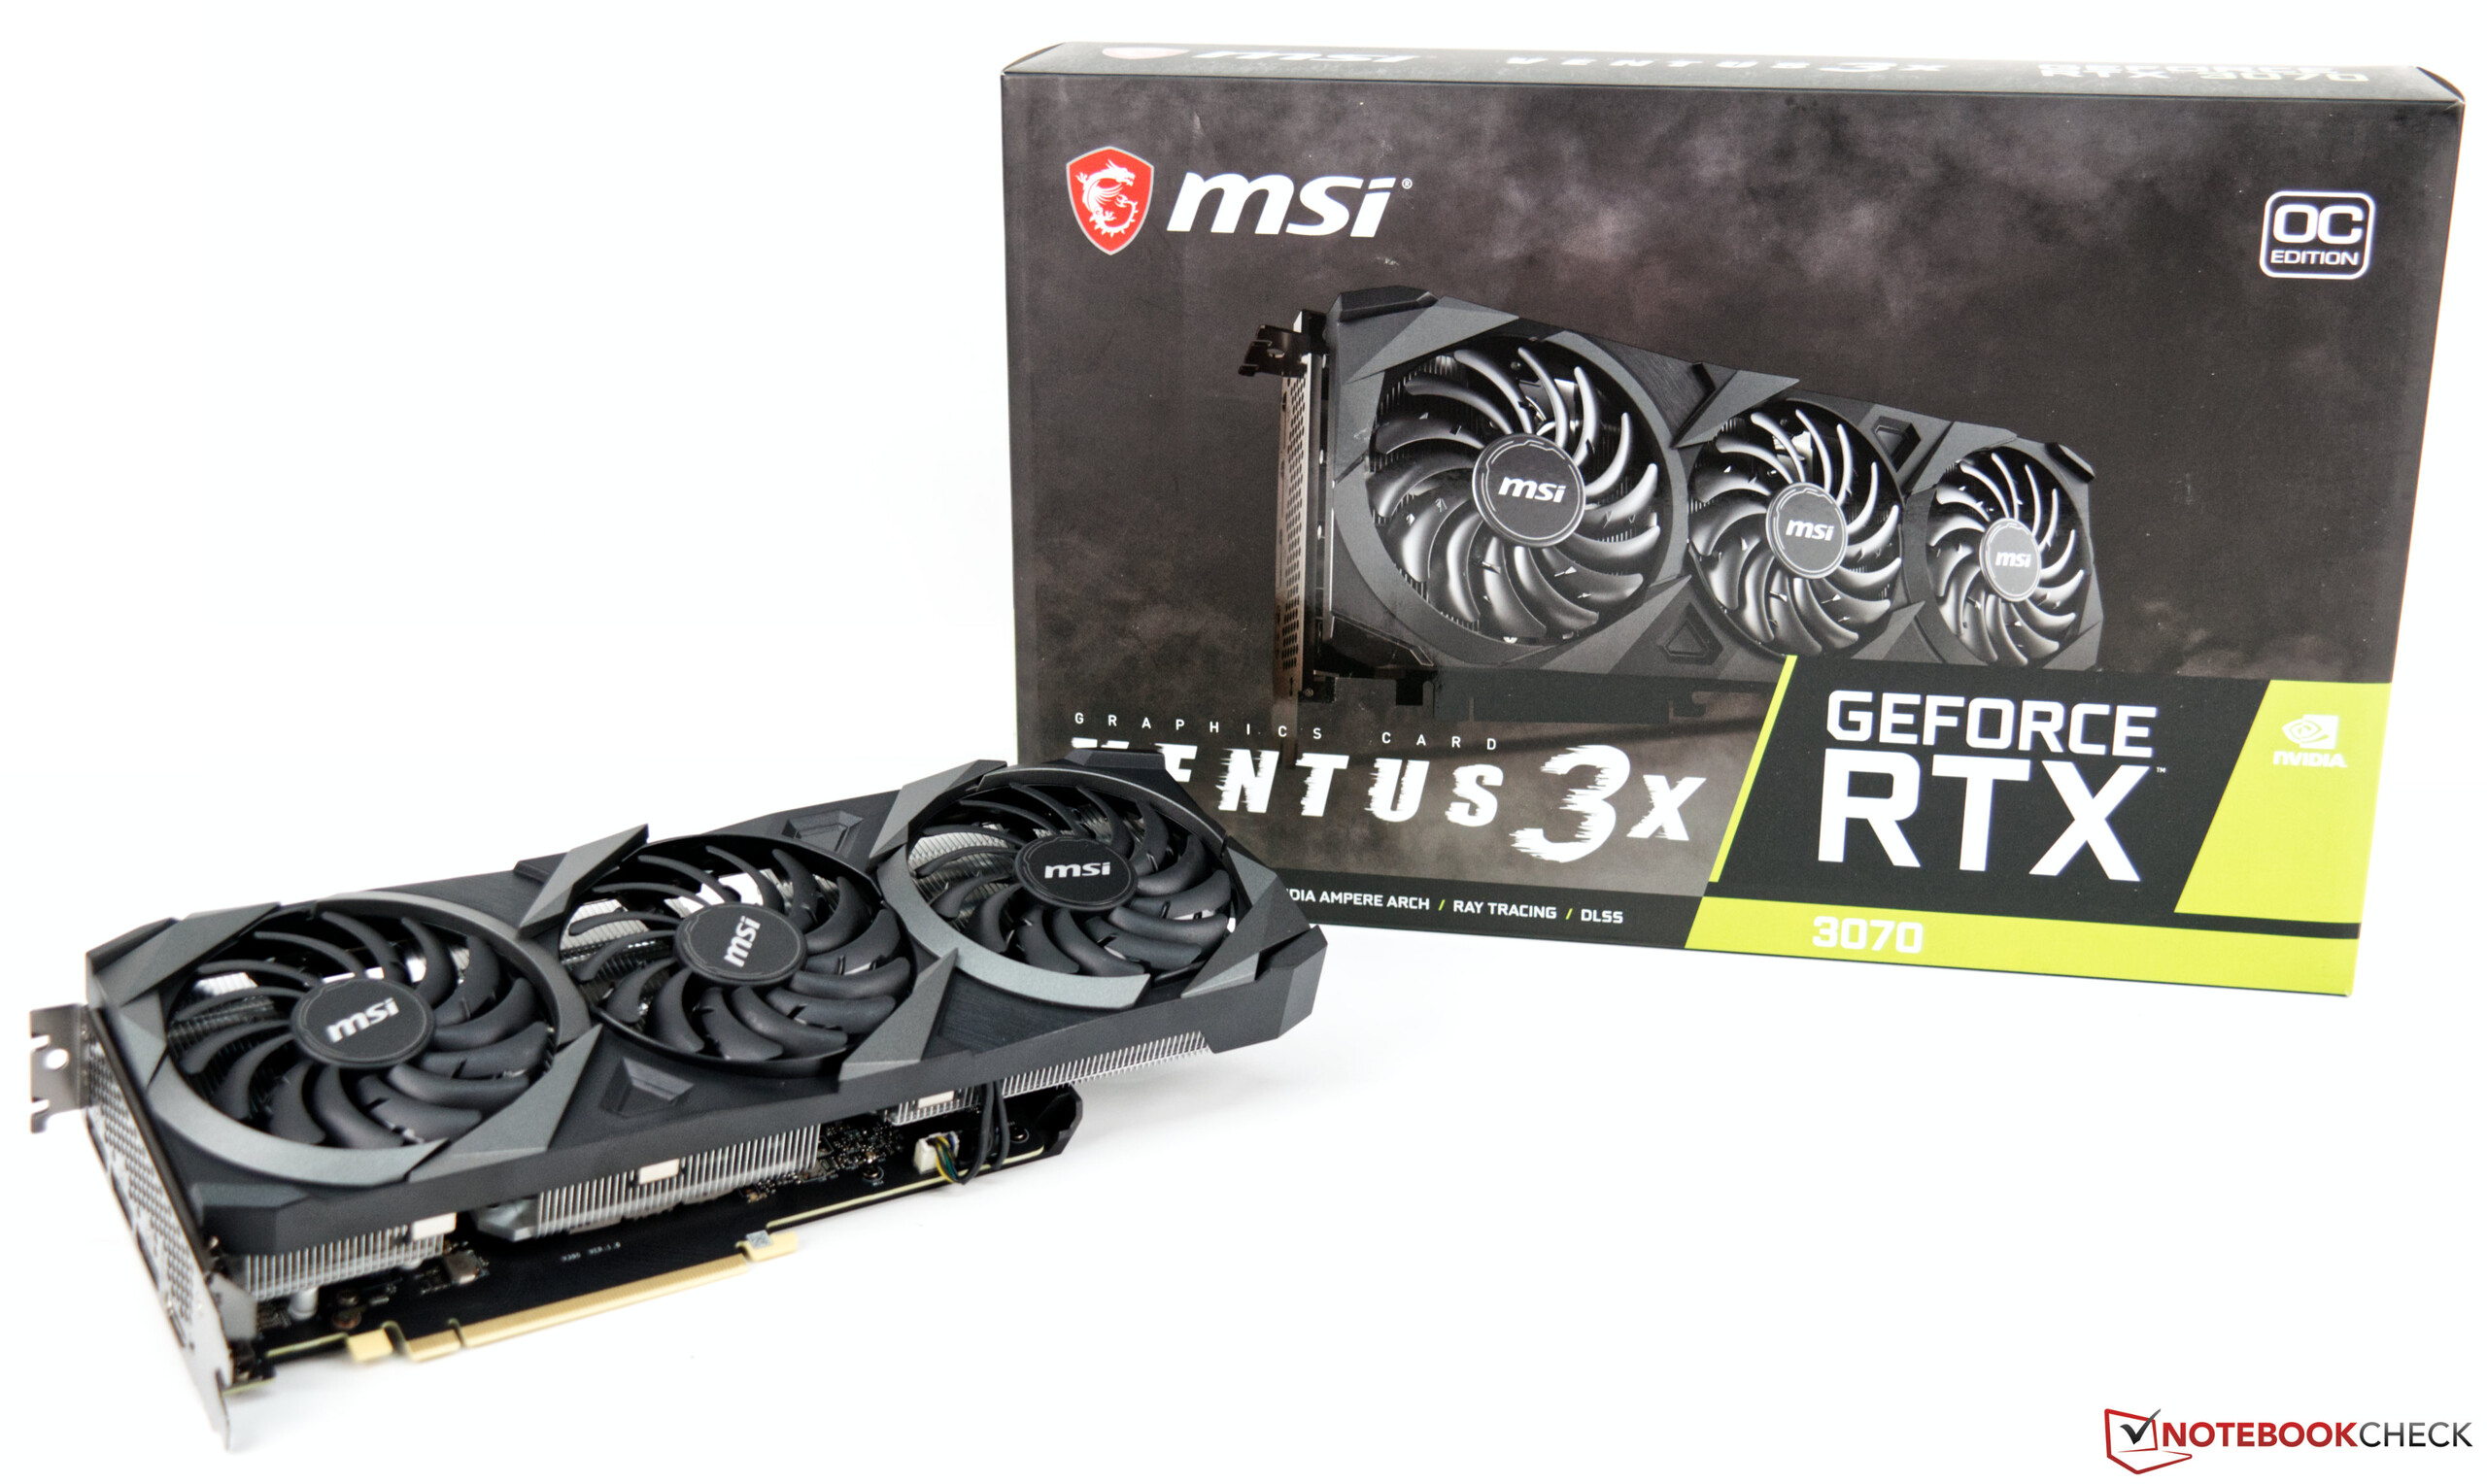
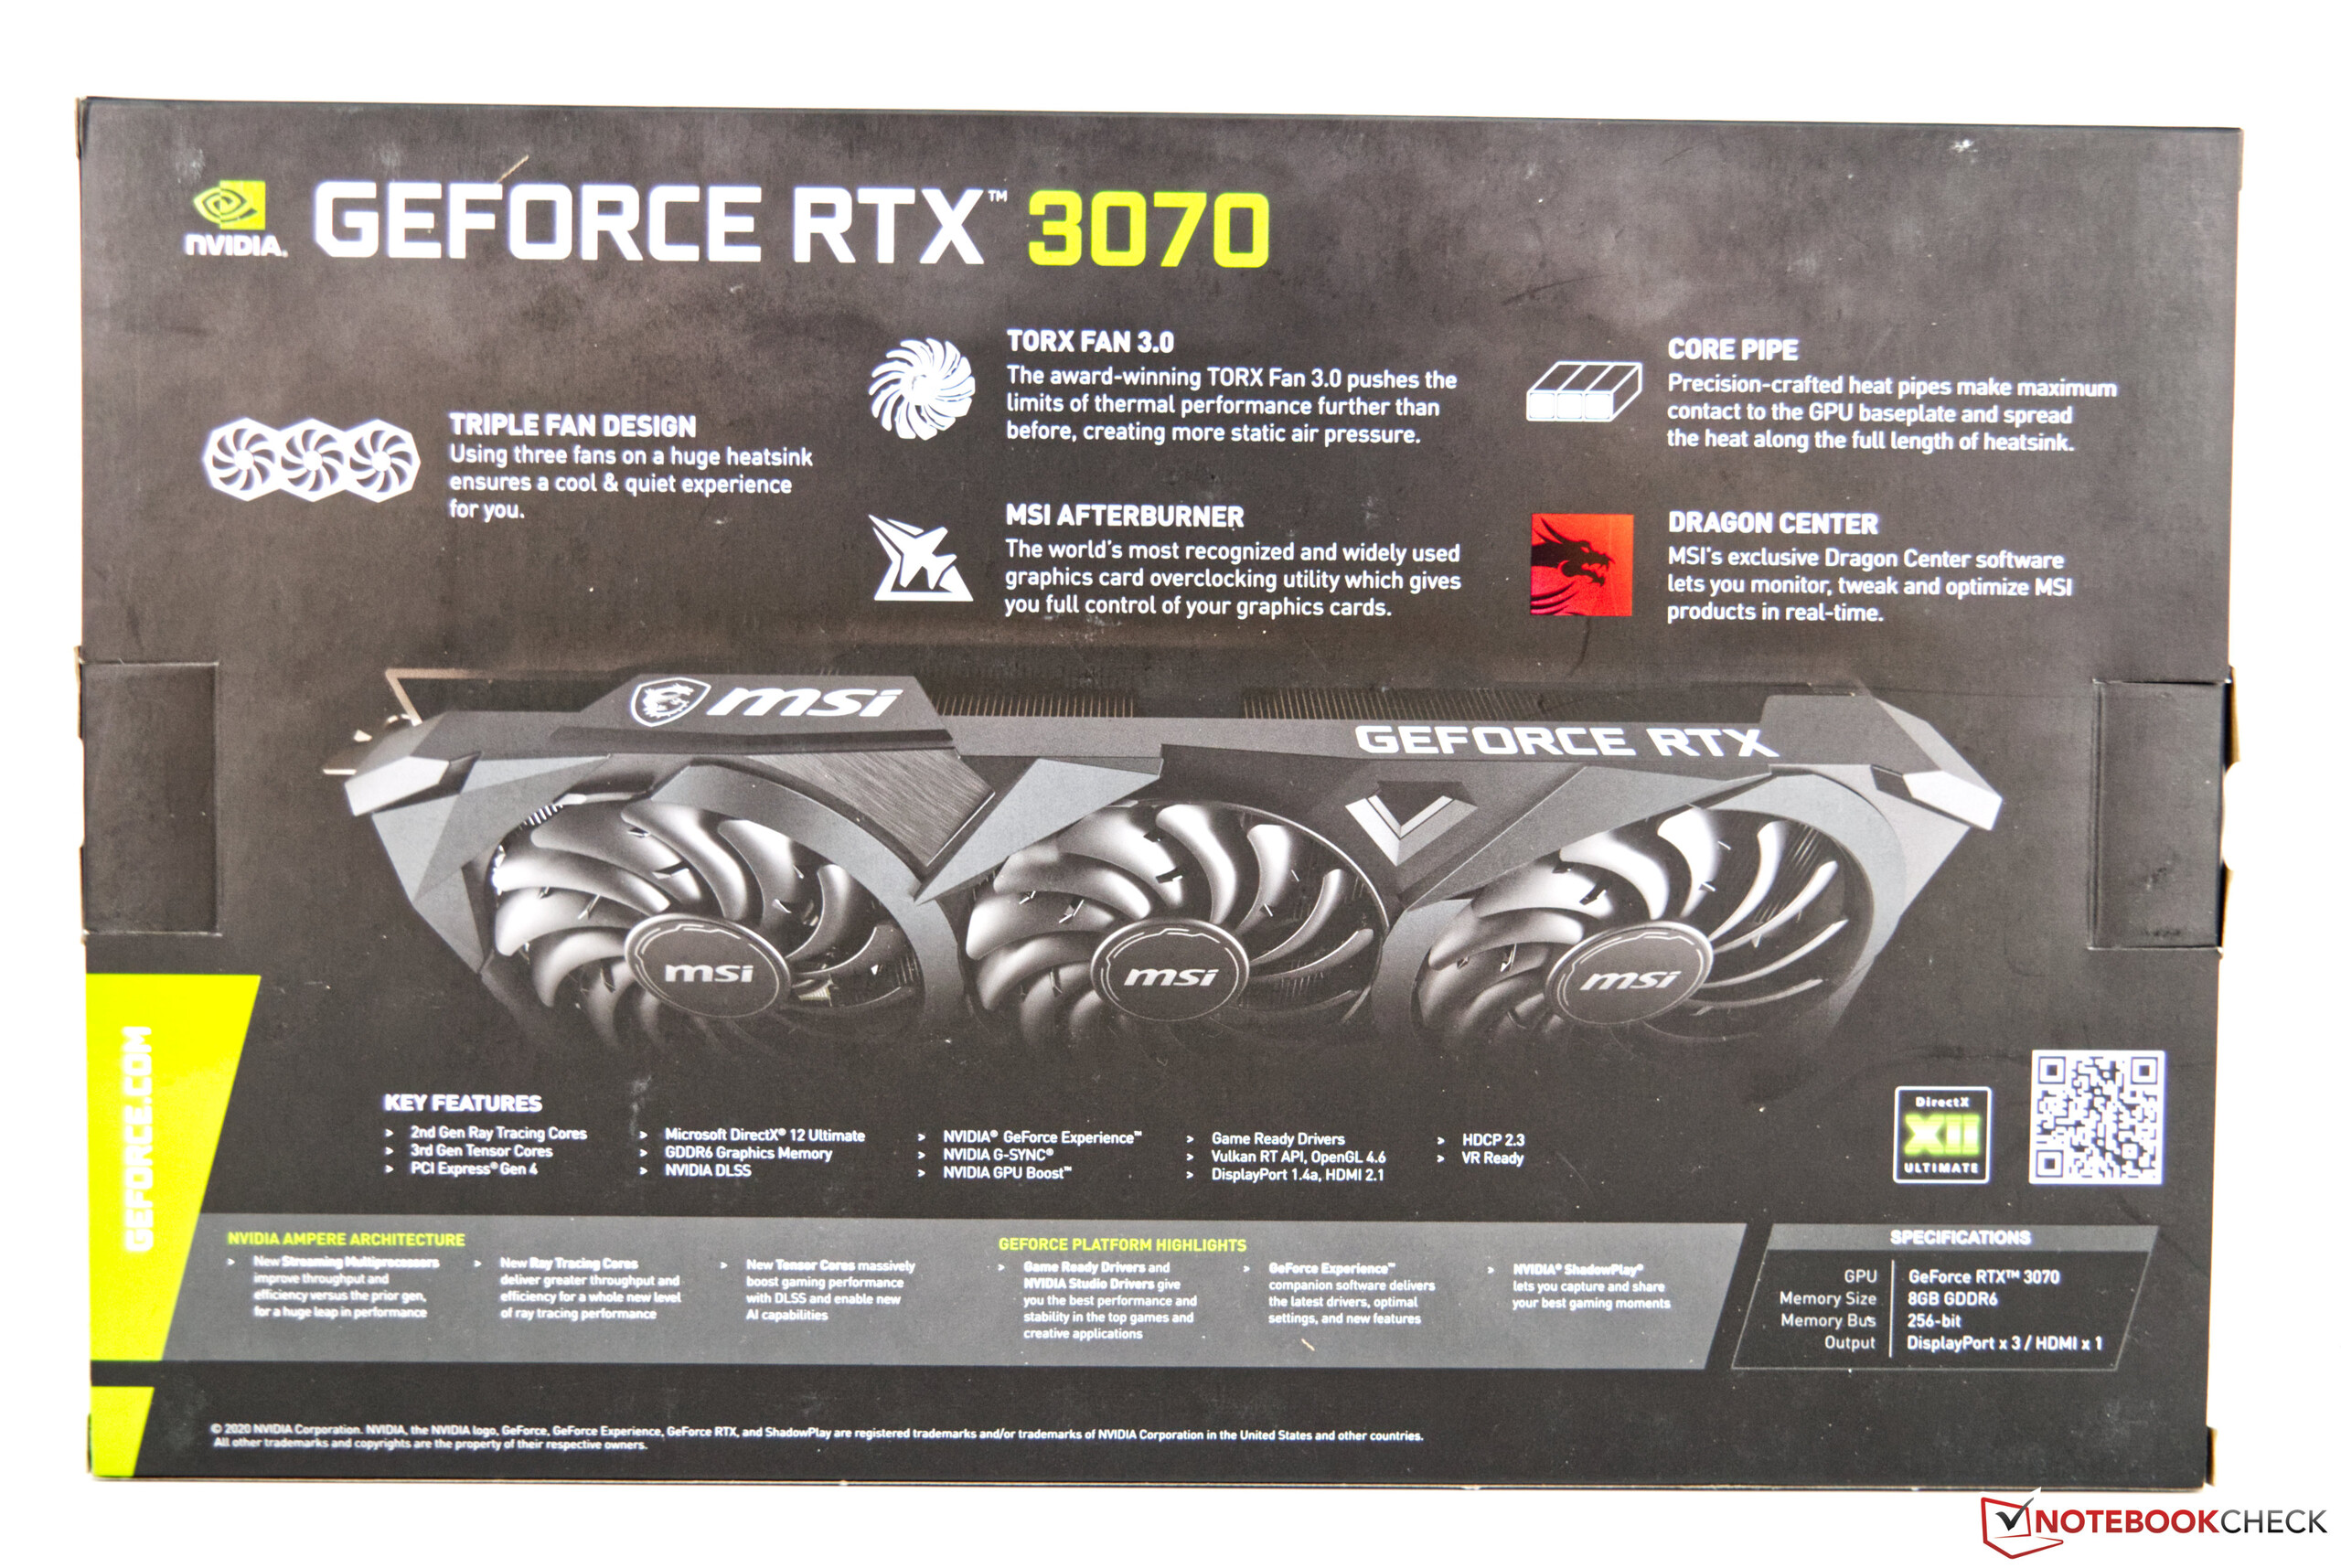
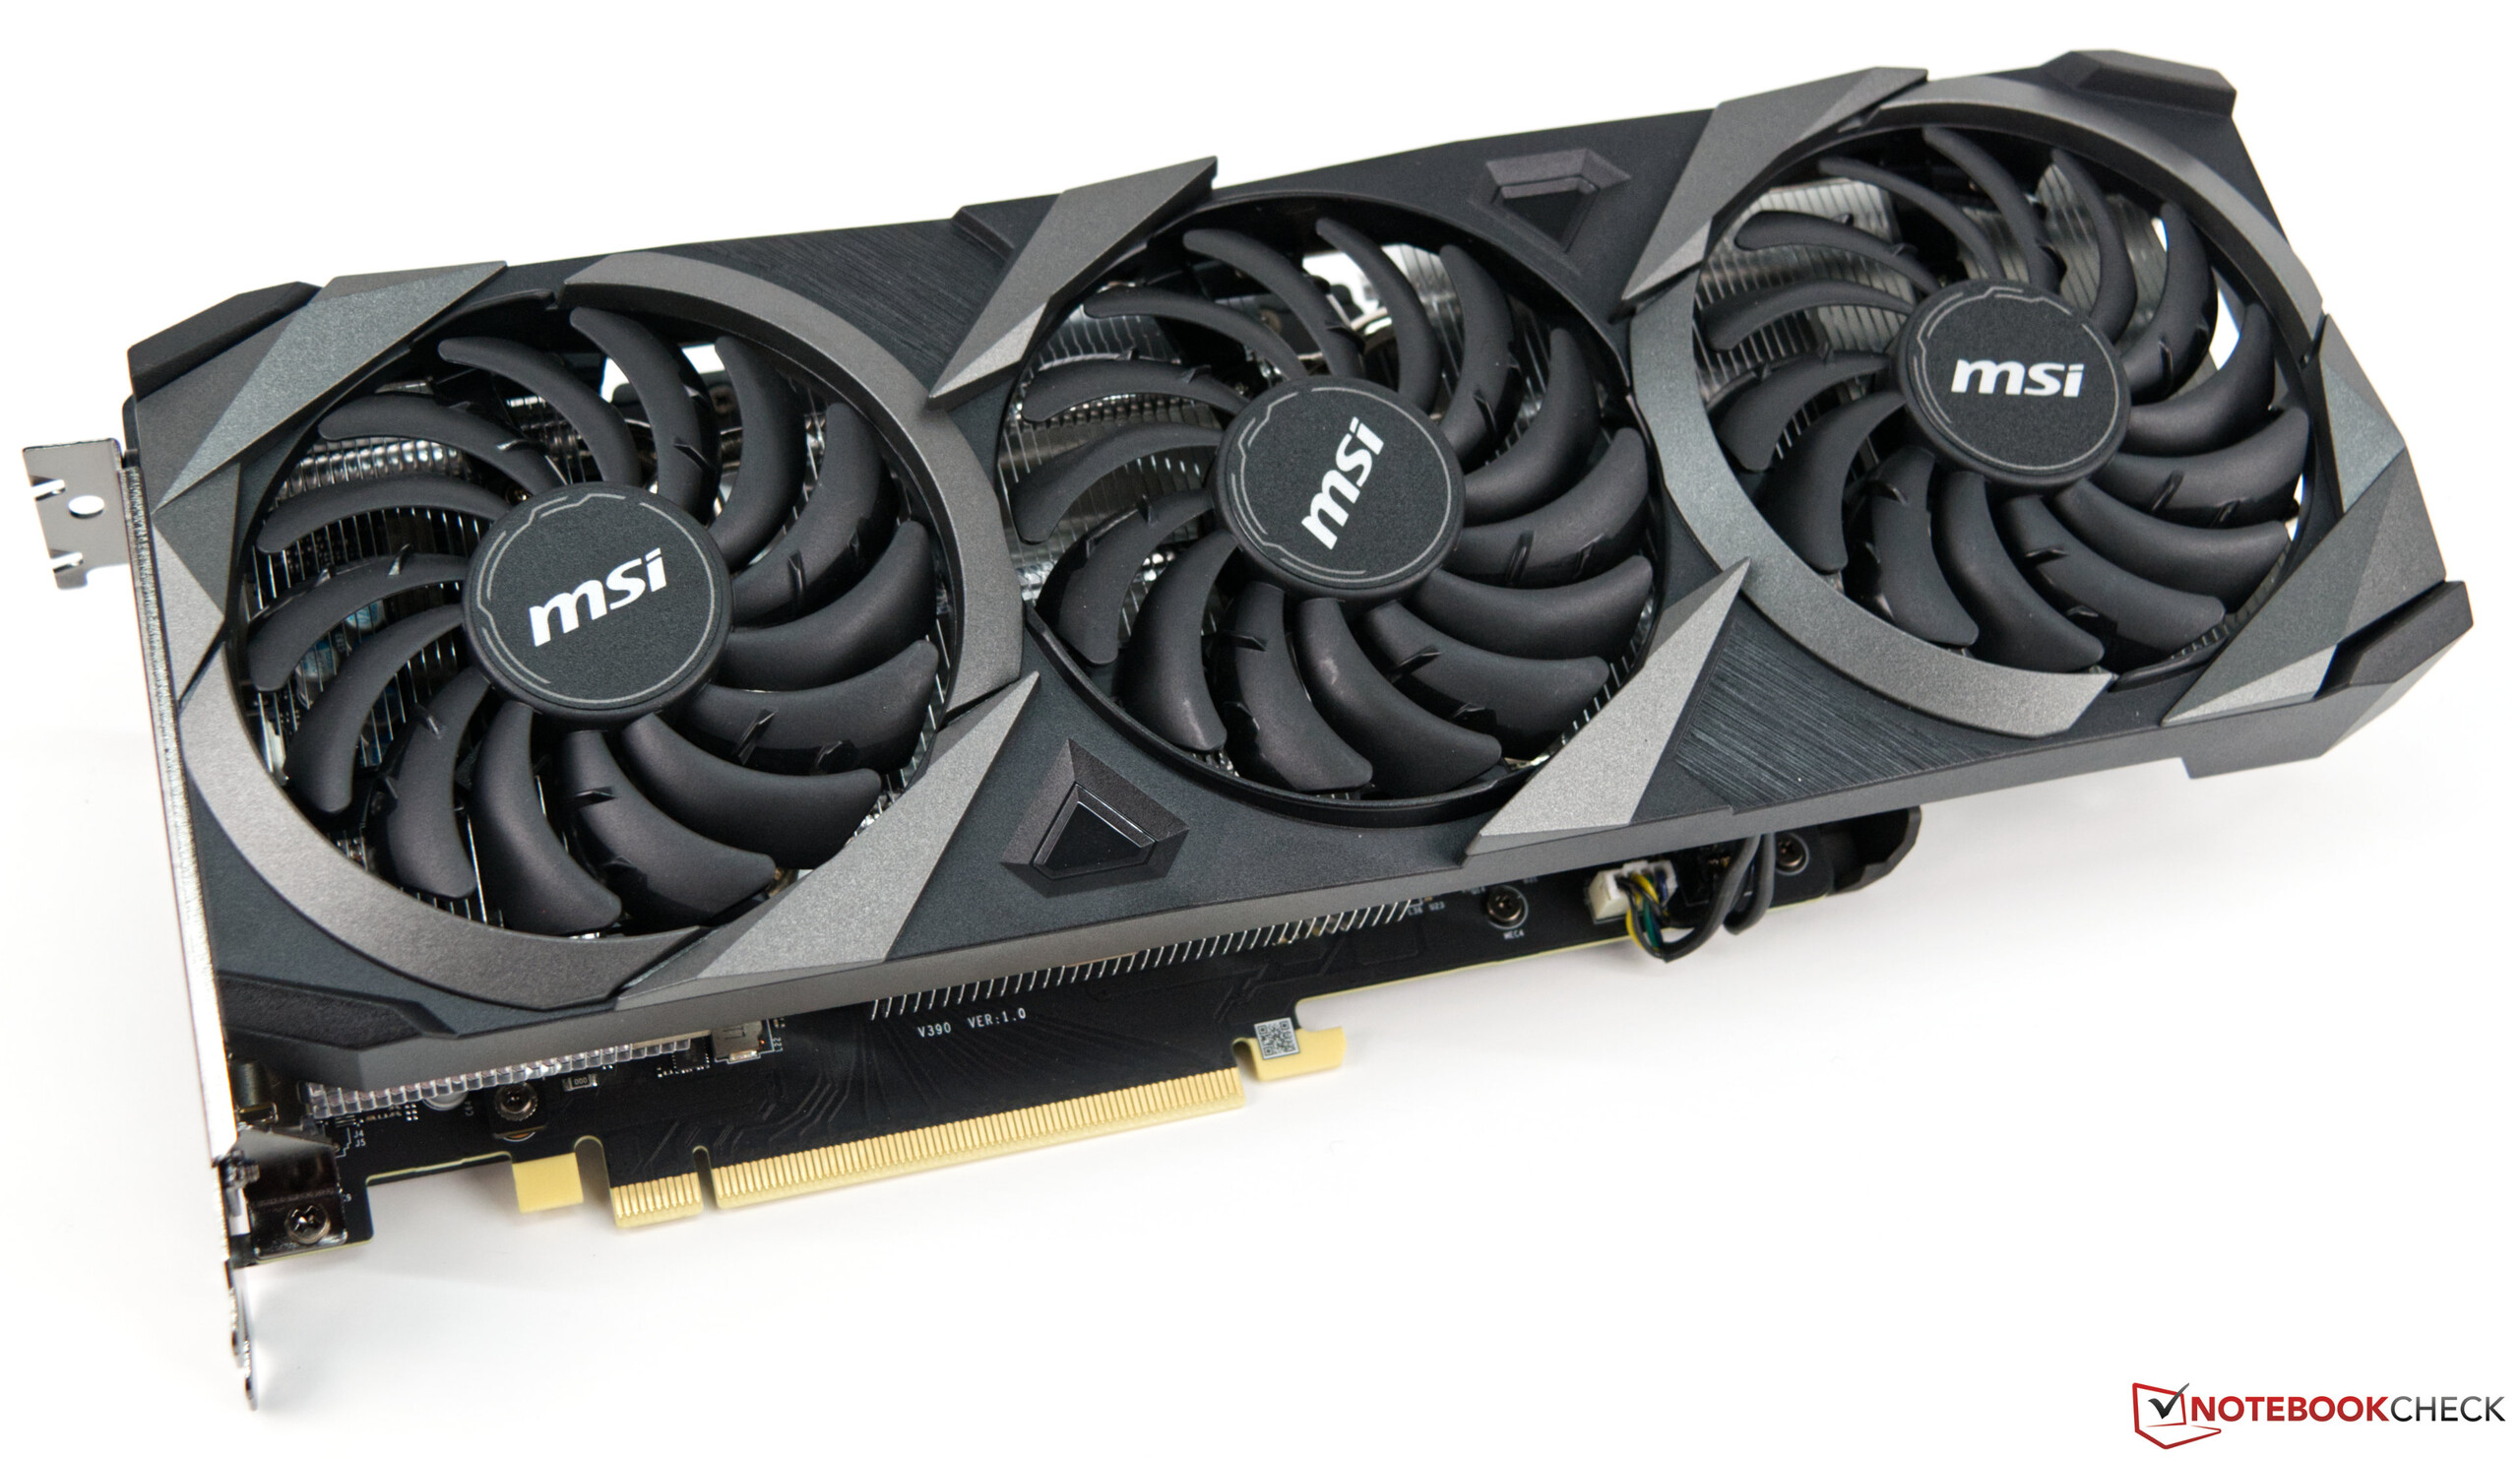
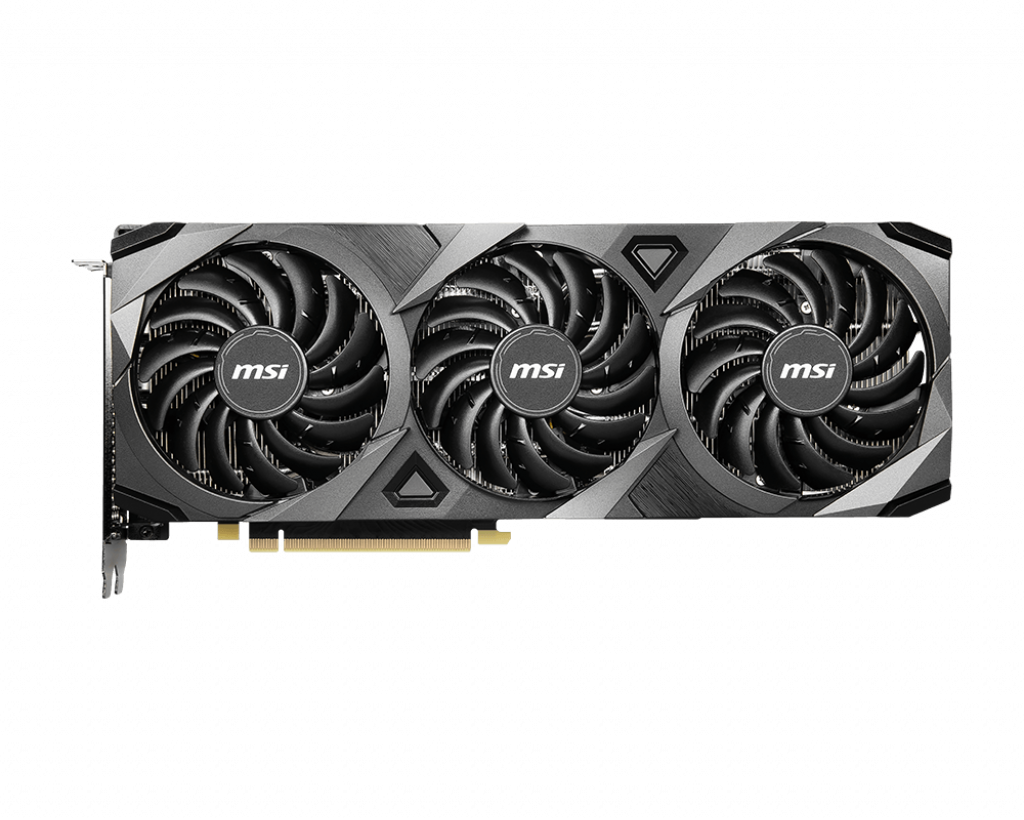
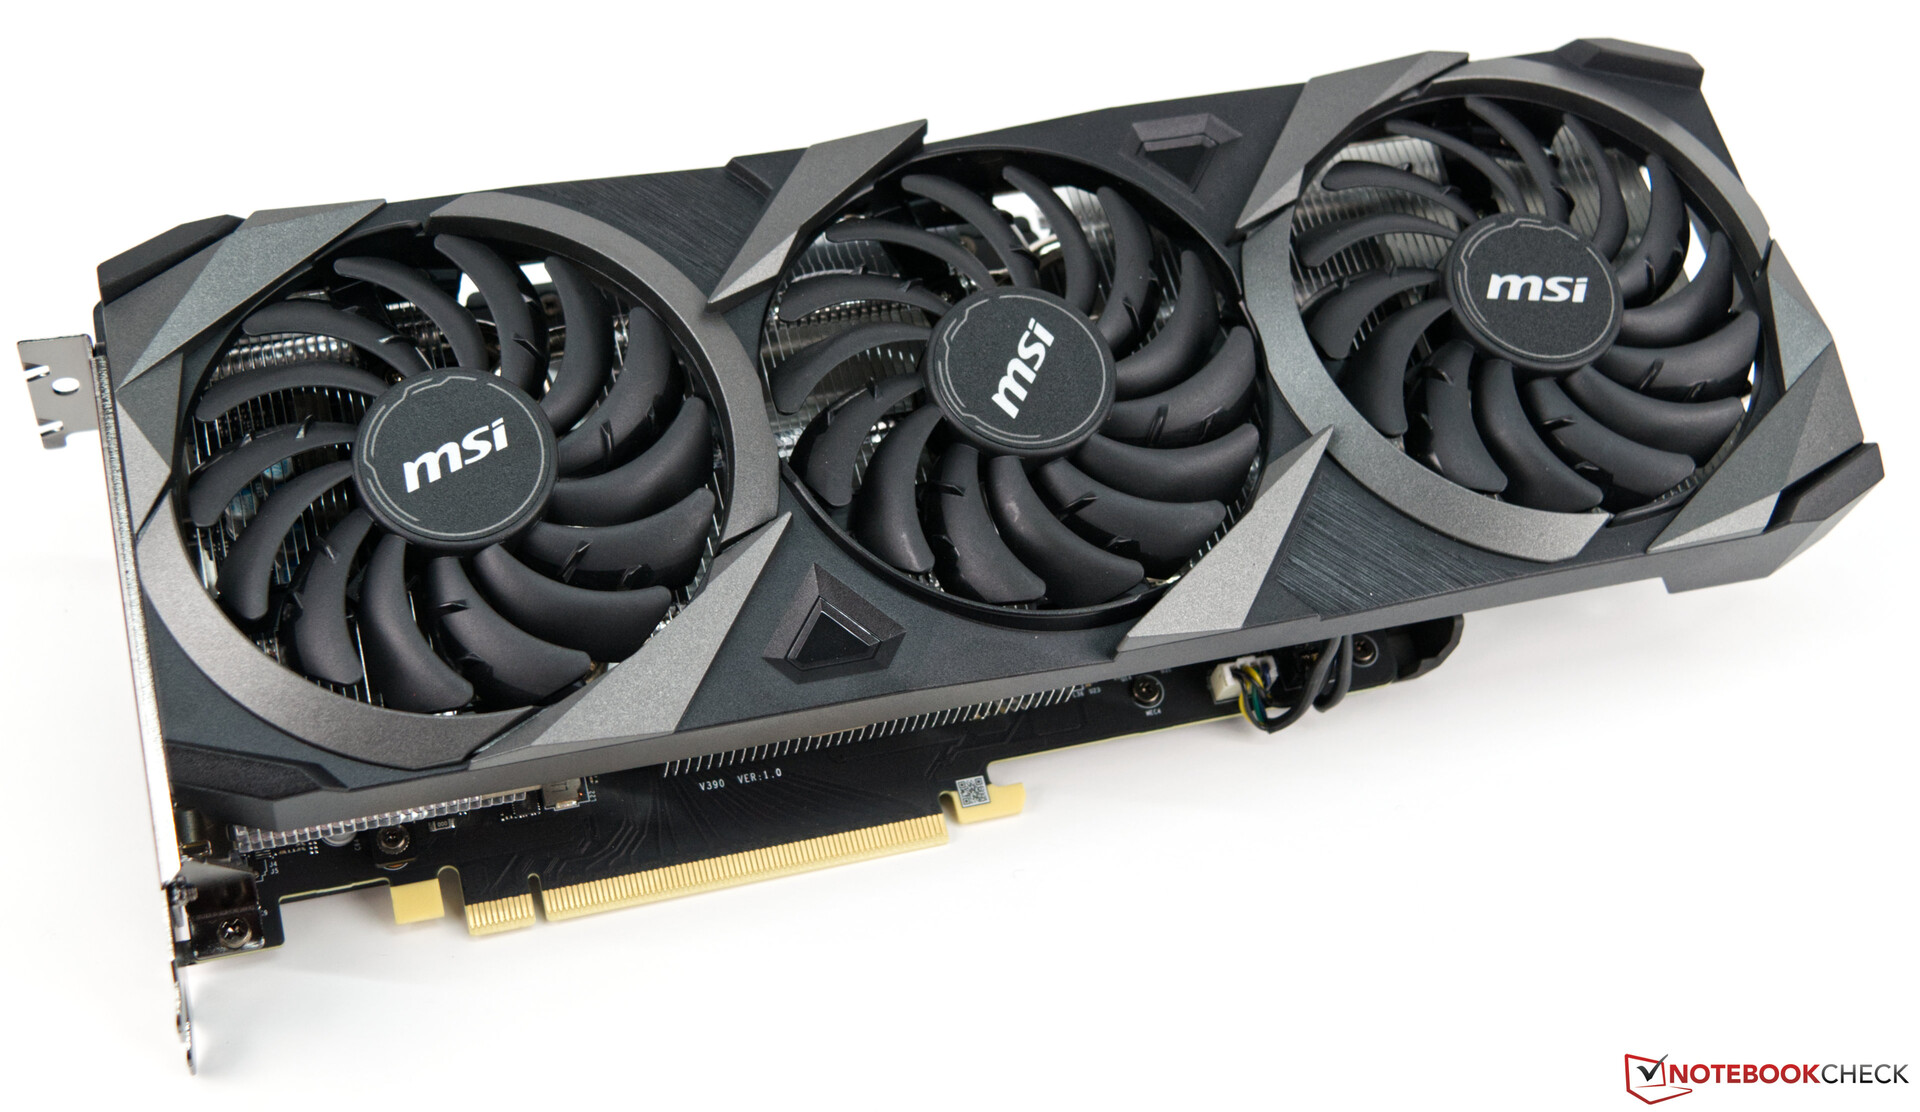
Auf die Leistungsfähigkeit hat die Knappheit glücklicherweise keinen Einfluss und im Test konnte das Modell von MSI durchaus überzeugen. Und wer auf die ganzen Beleuchtungsorgien per RGB verzichten kann, sollte sich die Ventus 3X Serie genauer anschauen. Die MSI GeForce RTX 3070 Ventus 3X OC besitzt einen großen Kühlkörper mit drei Axial-Lüftern, welche aber im 2D-Betrieb und bei geringer Last komplett stillstehen und somit keine Geräuschemission verursachen. Aber auch unter Last wird diese Grafikkarte nie laut. Maximal 220 Watt darf sich das Modell genehmigen, was genau den Daten der Founders-Edition entspricht. Das kürzlich von uns ebenfalls getestet Modell der Gaming X Trio Reihe war mit einem 240-Watt-BIOS versehen. Was das schlussendlich bei der Performance ausmacht, dazu kommen wir später im Test.
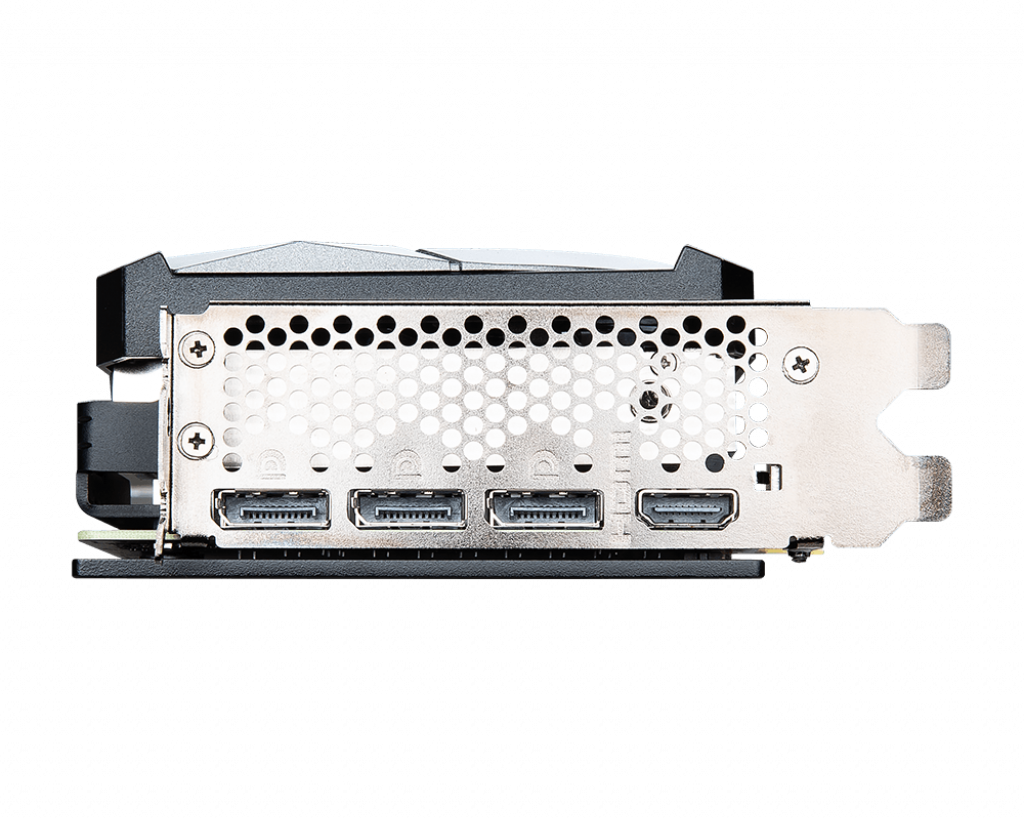
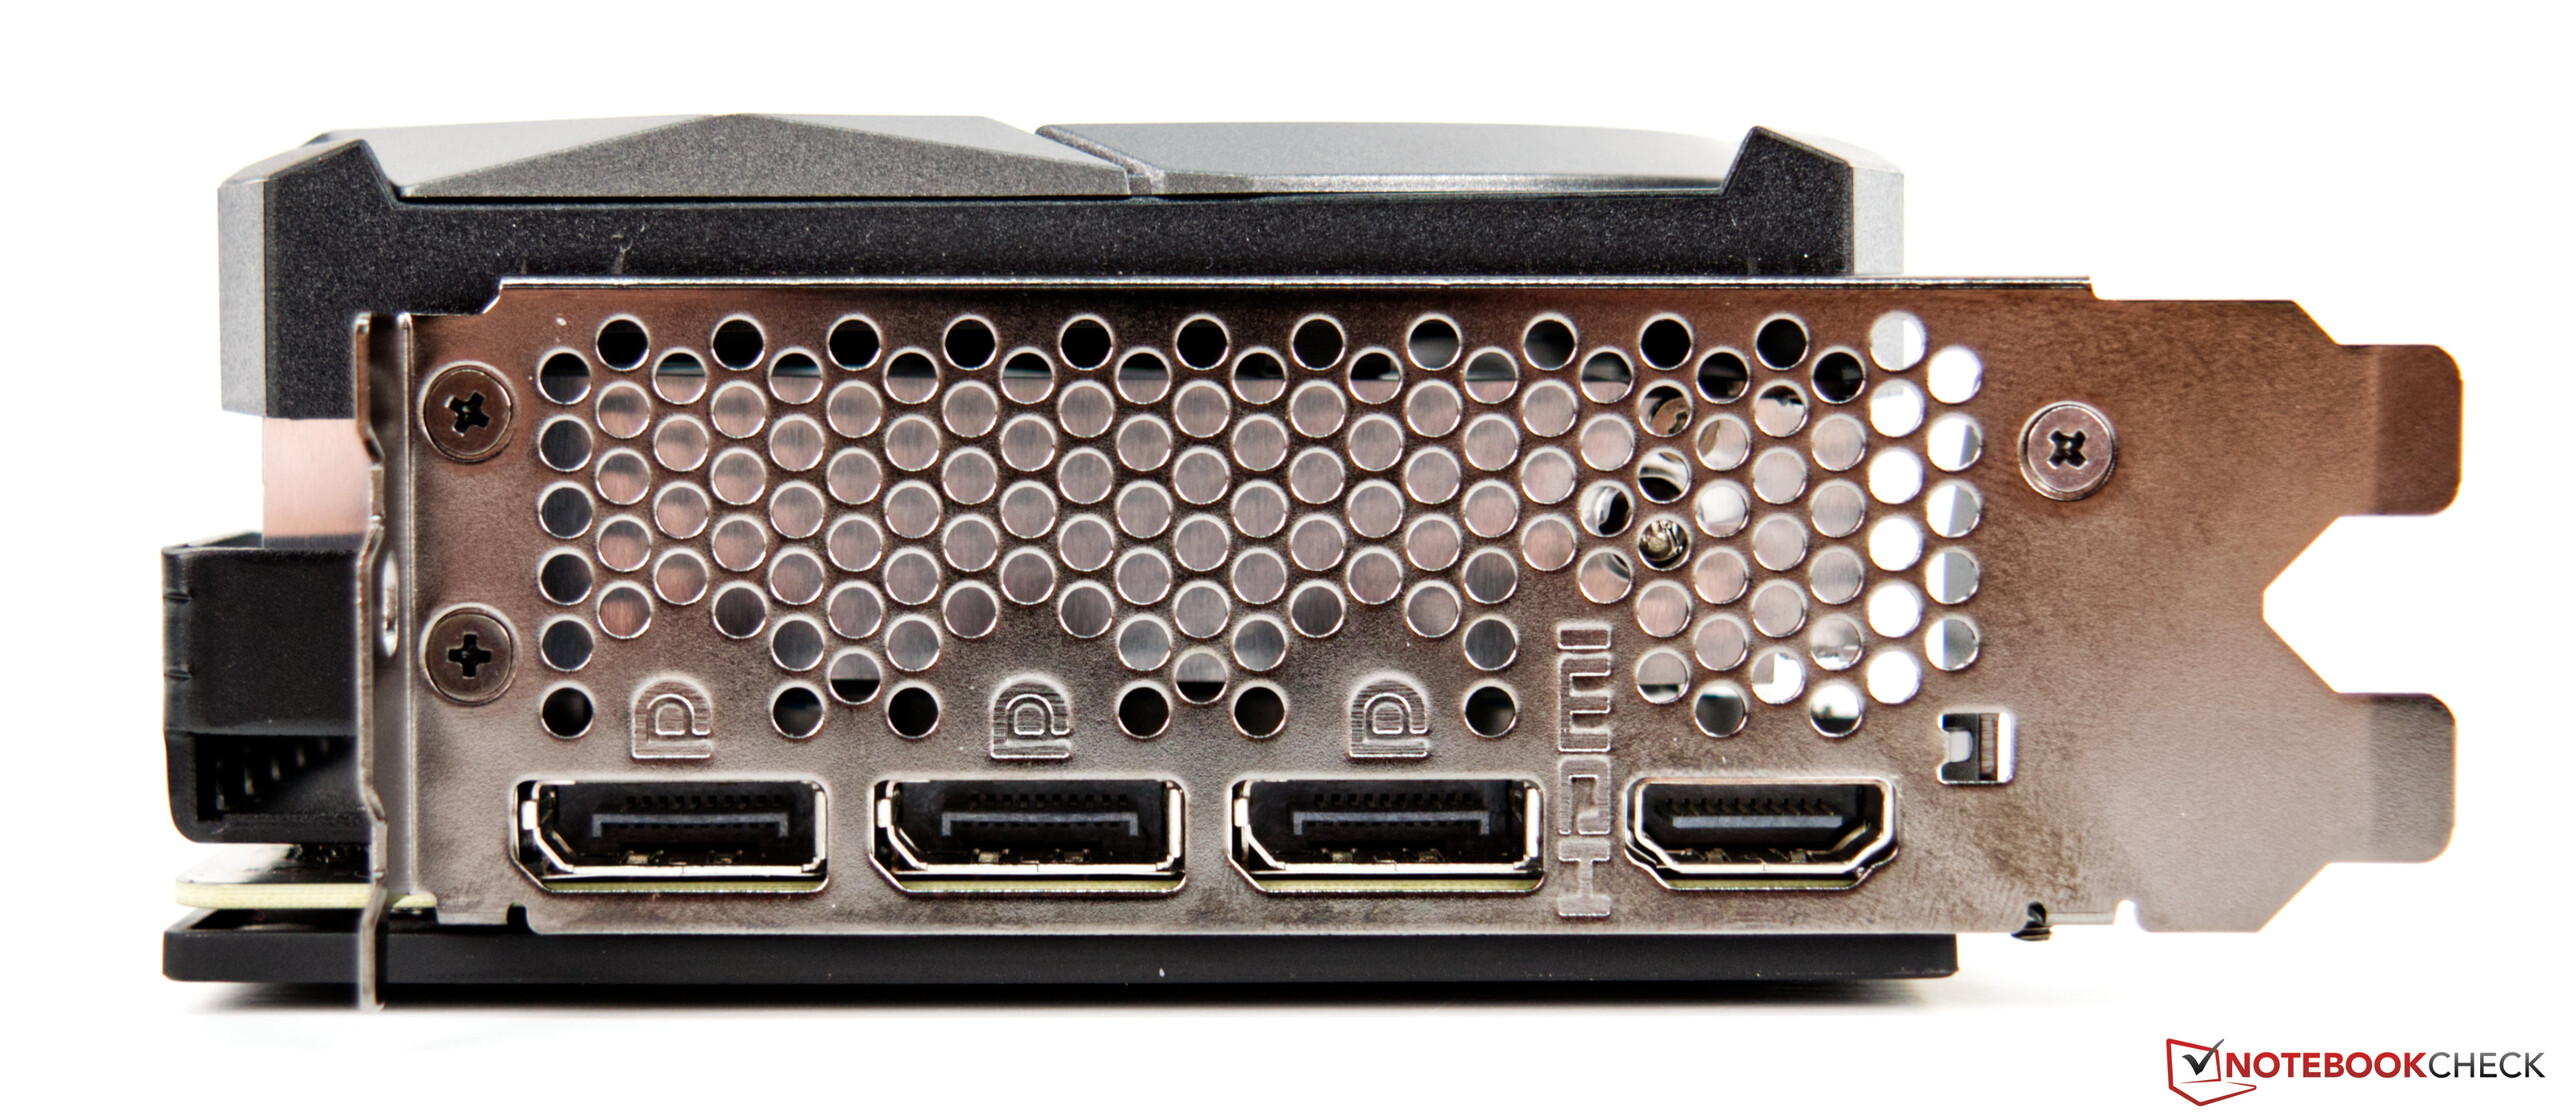
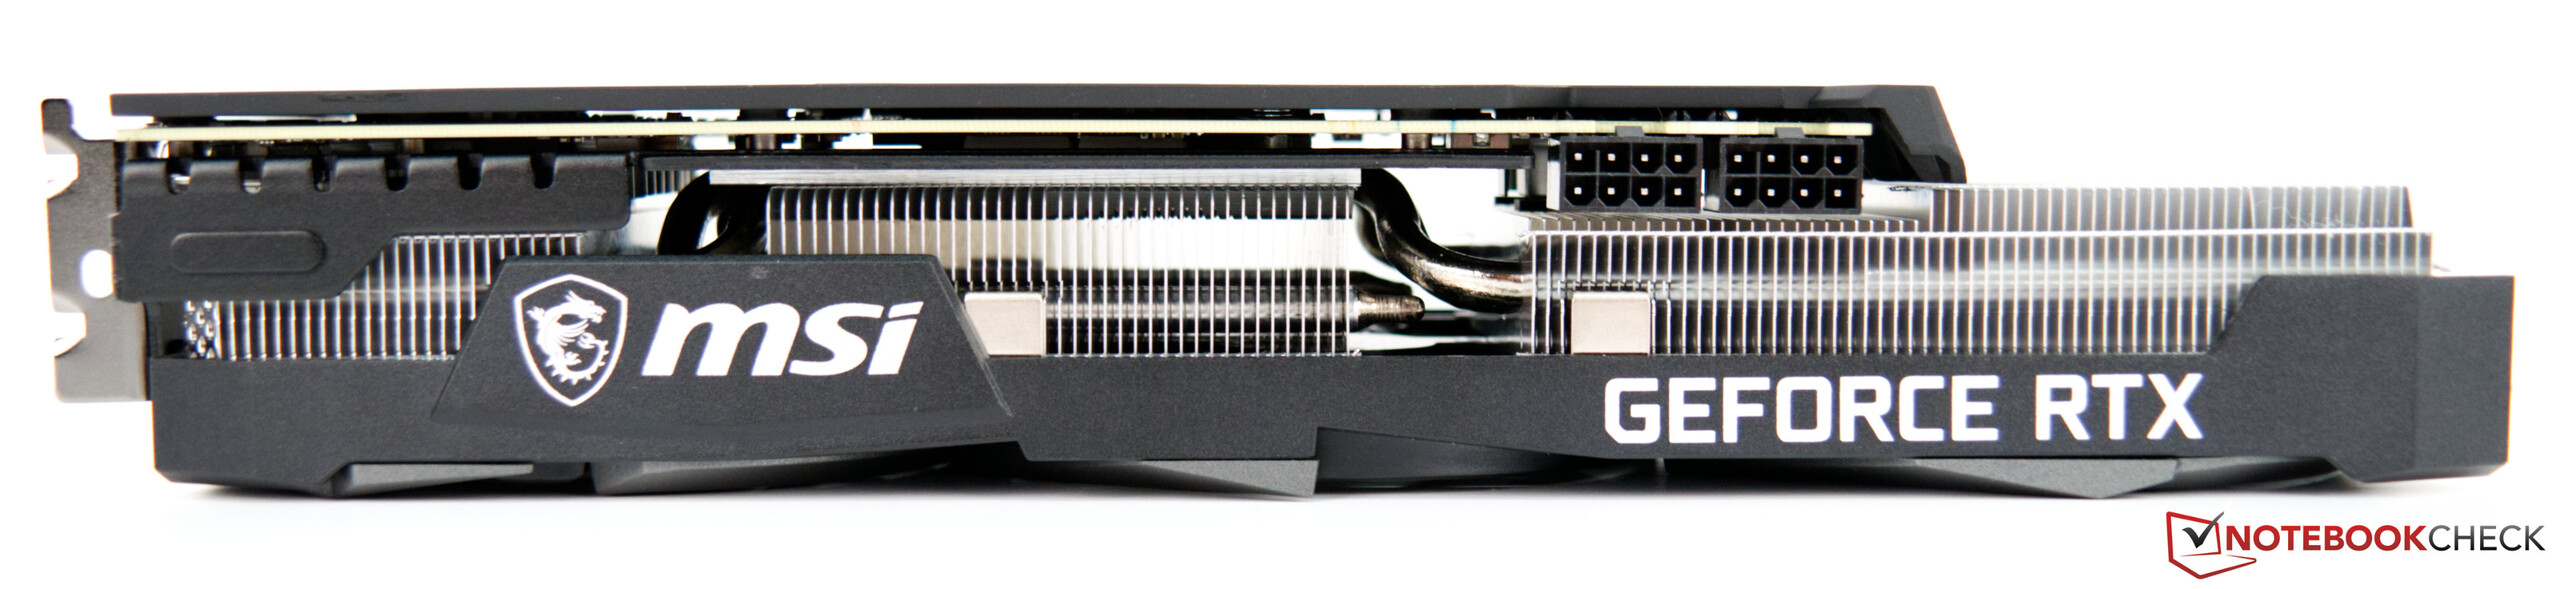
Mit knapp 31 Zentimetern ist unser Testsample aber nur minimal kürzer als die MSI GeForce RTX 3070 Gaming X Trio, was bedeutet, dass auch hier vor dem Kauf darauf geachtet werden sollte, ob dieses Modell in das Gehäuse passt. Weiterhin ist die MSI GeForce RTX 3070 Ventus 3X OC mit zwei 8 Pin-Stromanschlüssen bestückt und extern können bis zu vier Monitore gleichzeitig betrieben werden. Dafür gibt es einmal HDMI mit dem neuesten Standard (2.1) und drei DisplayPort-Anschlüsse (1.4a).


Vergleich der RTX 3080 mit anderen NVIDIA-GPUs
| Ausstattung | RTX 3090 FE | RTX 3080 FE | MSI RTX 3070 | RTX 3070 FE | Titan RTX | RTX 2080 Ti | RTX 2080 | RTX 2070 S |
| Chip | GA102 | GA102 | GA104 | GA104 | TU102 | TU102 | TU104 | TU104 |
| FinFET Prozess | 8 nm | 8 nm | 8 nm | 8 nm | 12 nm | 12 nm | 12 nm | 12 nm |
| CUDA Cores | 10,496 | 8.704 | 5.888 | 5.888 | 4.608 | 4.352 | 2.944 | 2.560 |
| Texture Units | 328 | 272 | 184 | 184 | 288 | 272 | 184 | 160 |
| Tensor Cores | 328 3. Gen. | 272 3. Gen. | 184 3. Gen. | 184 3. Gen. | 576 2. Gen. | 544 2. Gen. | 368 2. Gen. | 320 2. Gen. |
| RT Cores | 82 | 68 | 46 | 46 | 72 | 68 | 46 | 40 |
| GPU Base Clock | 1.395 MHz | 1.440 MHz | 1.500 MHz | 1.500 MHz | 1.350 MHz | 1.350 MHz | 1.515 MHz | 1.605 MHz |
| GPU Boost Clock | 1.695 MHz | 1.710 MHz | 1.750 MHz | 1.750 MHz | 1.770 MHz | 1.545 MHz | 1.710 MHz | 1.770 MHz |
| Memory Bus | 384-bit | 320-bit | 256 Bit | 256 Bit | 384-bit | 352-bit | 256-bit | 256-bit |
| Memory Bandwidth | 936 GB/s | 760 GB/s | 448 GB/s | 448 GB/s | 672 GB/s | 616 GB/s | 448 GB/s | 448 GB/s |
| Video Memory | 24 GB GDDR6X | 10 GB GDDR6X | 8 GB GDDR6 | 8 GB GDDR6 | 24 GB GDDR6 | 11 GB GDDR6 | 8 GB GDDR6 | 8 GB GDDR6 |
| Energieverbrauch | 350 W | 320 W | 220 W | 220 W | 280 W | 250 W | 215 W | 215 W |
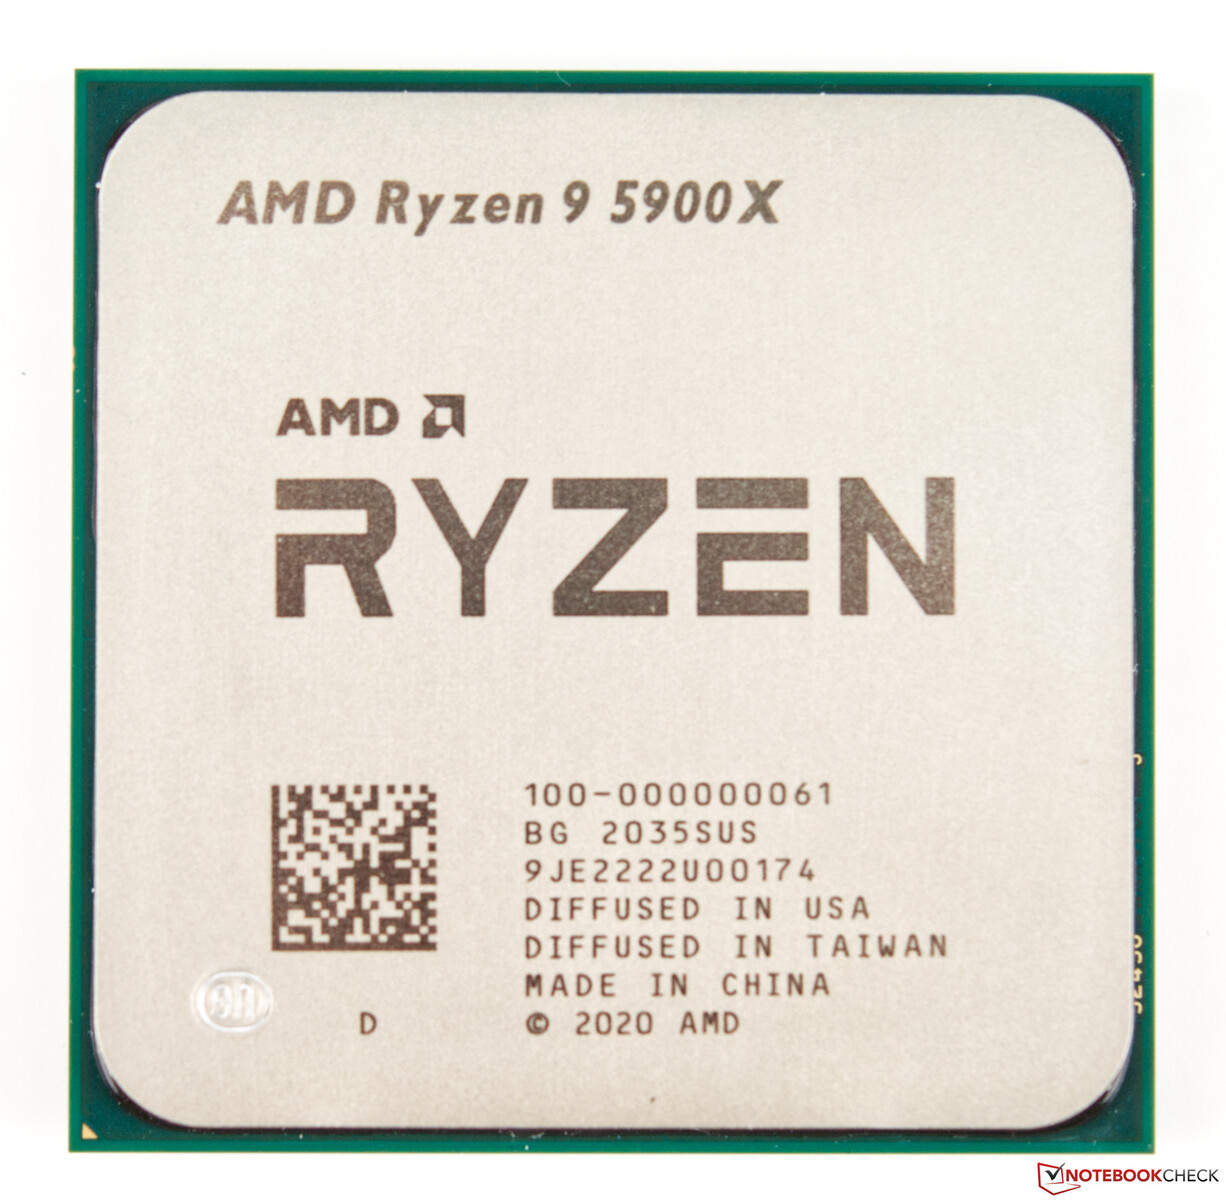
Unser Testsystem mit AMD Ryzen 9 5900X als Basis
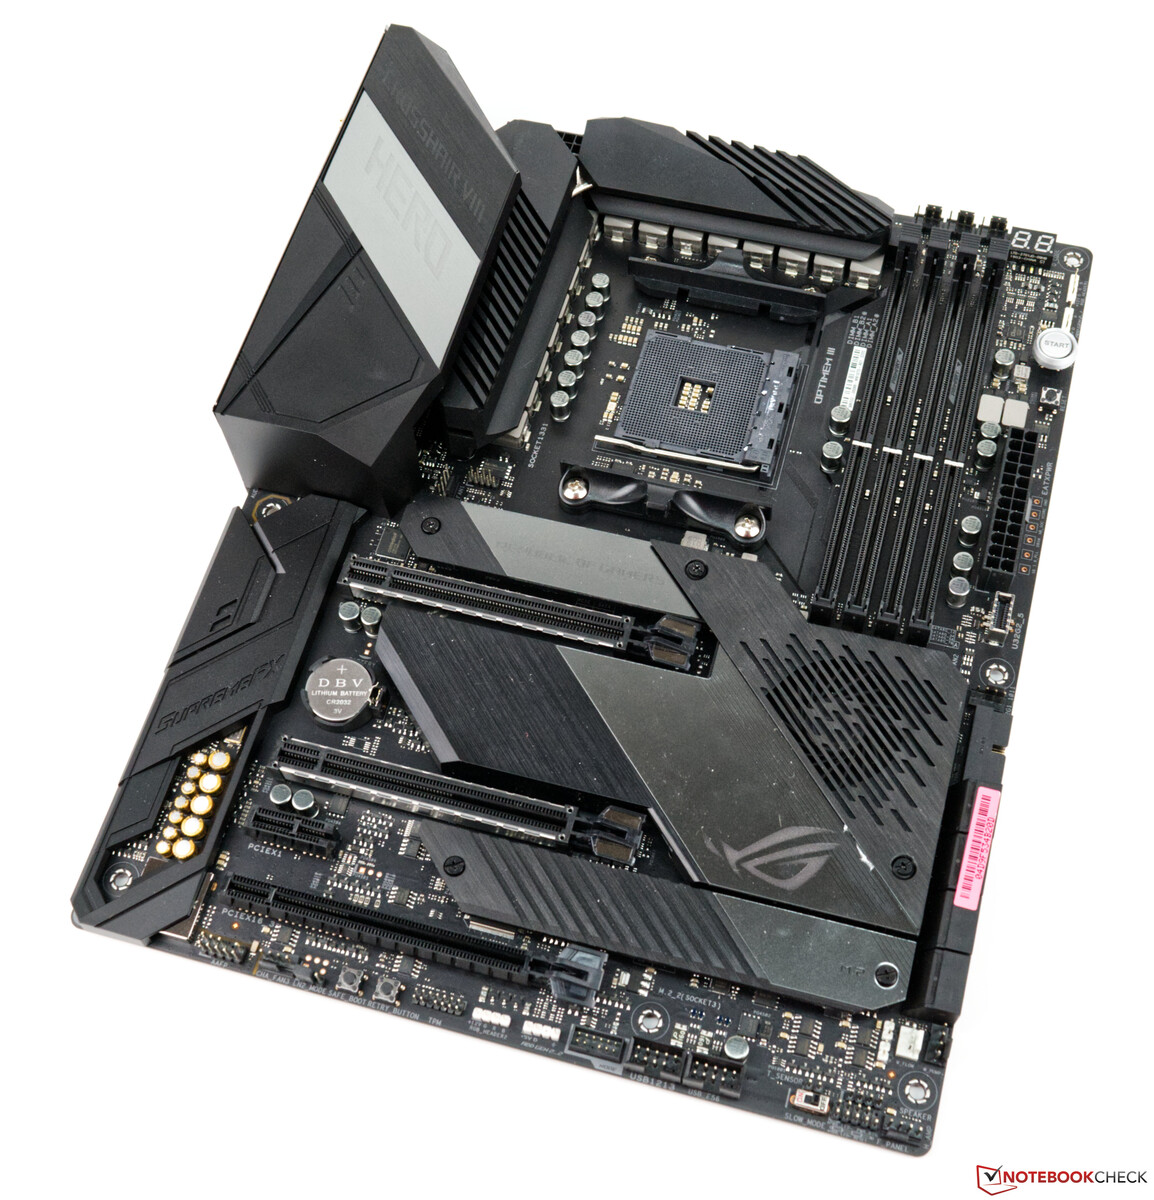
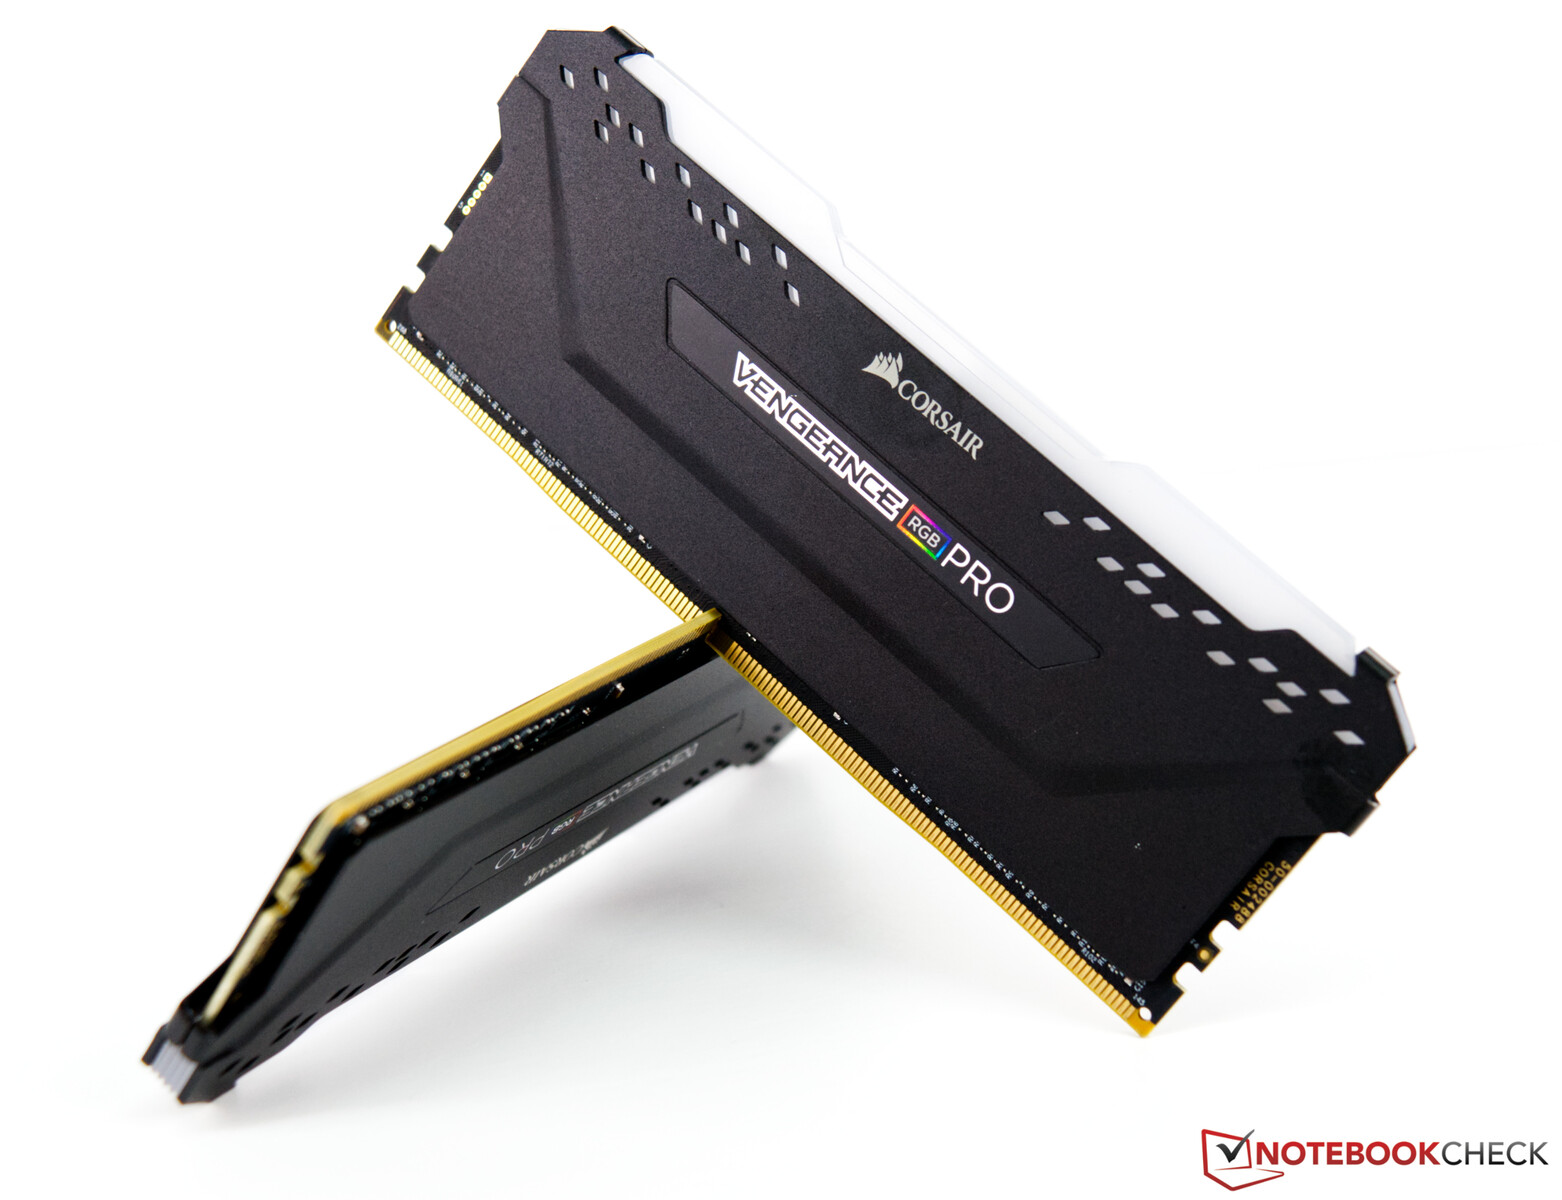
Als Testsystem dient eine aktuelle AMD-Plattform auf Basis des Asus X570 ROG Crosshair VIII. Die CPU (AMD Ryzen 9 5900X) bietet eine gute CPU-Leistung und als Kühlung nutzen wir eine AIO (Alphacool Eisbear Aurora 360mm). Der 32-GB-Arbeitsspeicher stammt von Corsair und taktet mit 4.000 MHz. Als Monitor nutzen wir den Acer Predator XB321HK. Dieser schränkt uns aufgrund der UHD-Tauglichkeit nicht ein. Ein großer Dank geht an dieser Stelle an AMD für die Bereitstellung der Testplattform, sowie an Corsair für das RAM-Kit.
Für die folgenden Benchmarks und Tests nutzen wir folgendes System:
- Lian Li O11 Dynamic
- AMD Ryzen 9 5900X
- MSI GeForce RTX 3070 Ventus 3X OC (Treiber Nvidia 460.89)
- Asus X570 ROG Crosshair VIII Hero WiFi (BIOS 2402, Default Settings, XMP 1 für DDR4-4000)
- Corsair RM1000X 1000-Watt-Netzteil
- Corsair Vengeance RGB Pro DDR4-4000 Speicherkit 2 x 16 GB
- Corsair MP600 2TB M.2 PCIe-4.0-SSD
- Crucial MX500 2TB (für Spiele)
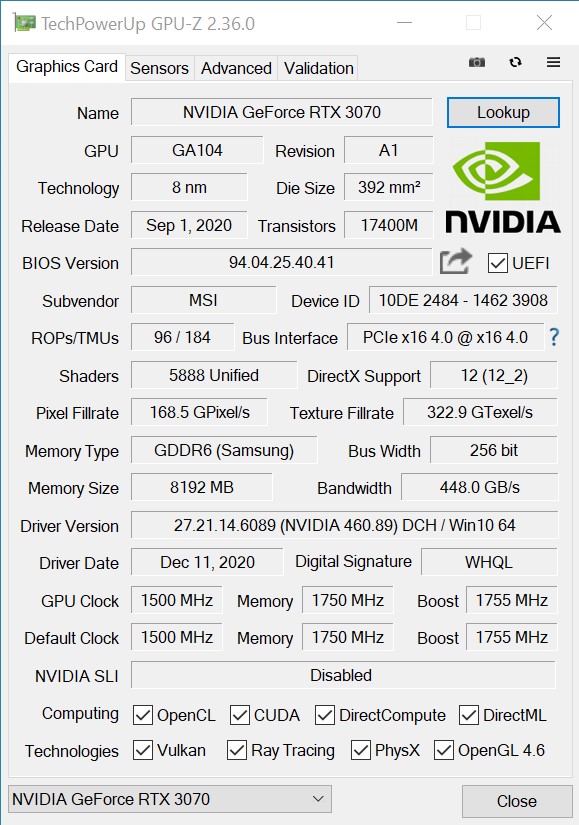
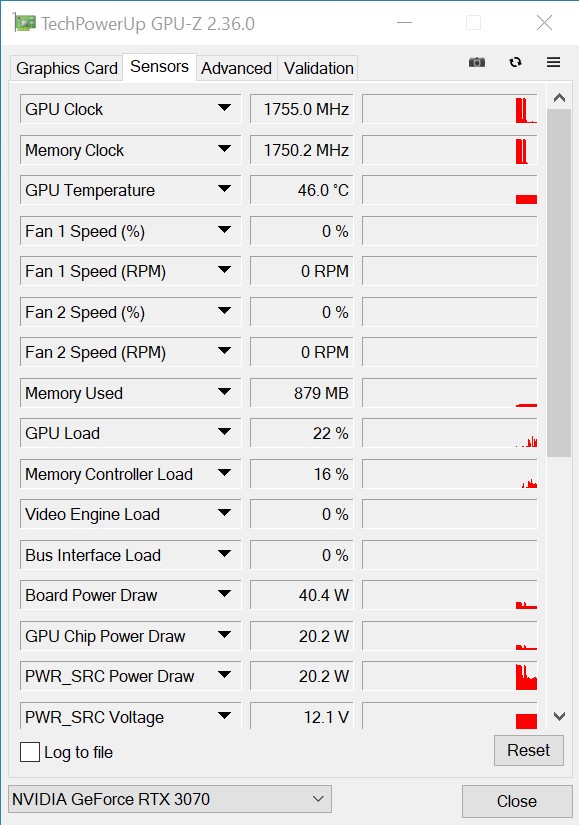
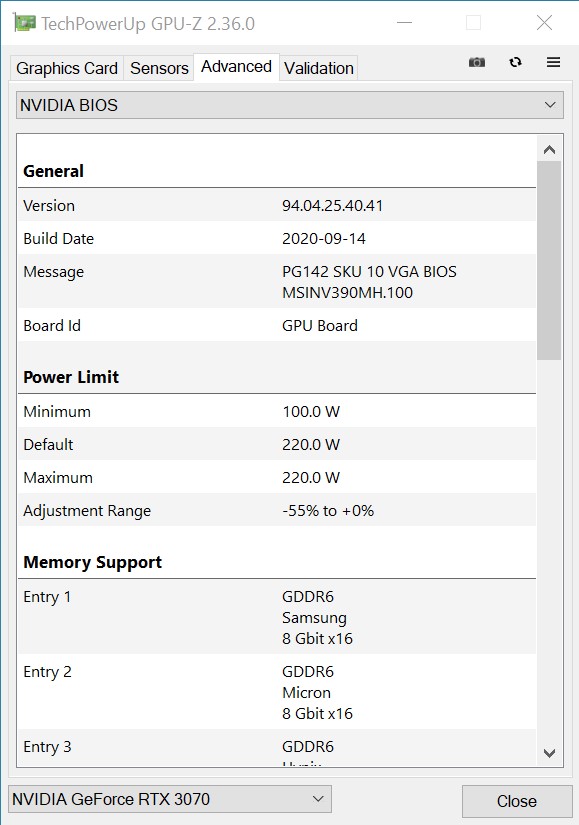
Die Taktraten der MSI GeForce RTX 3070 Ventus 3X OC
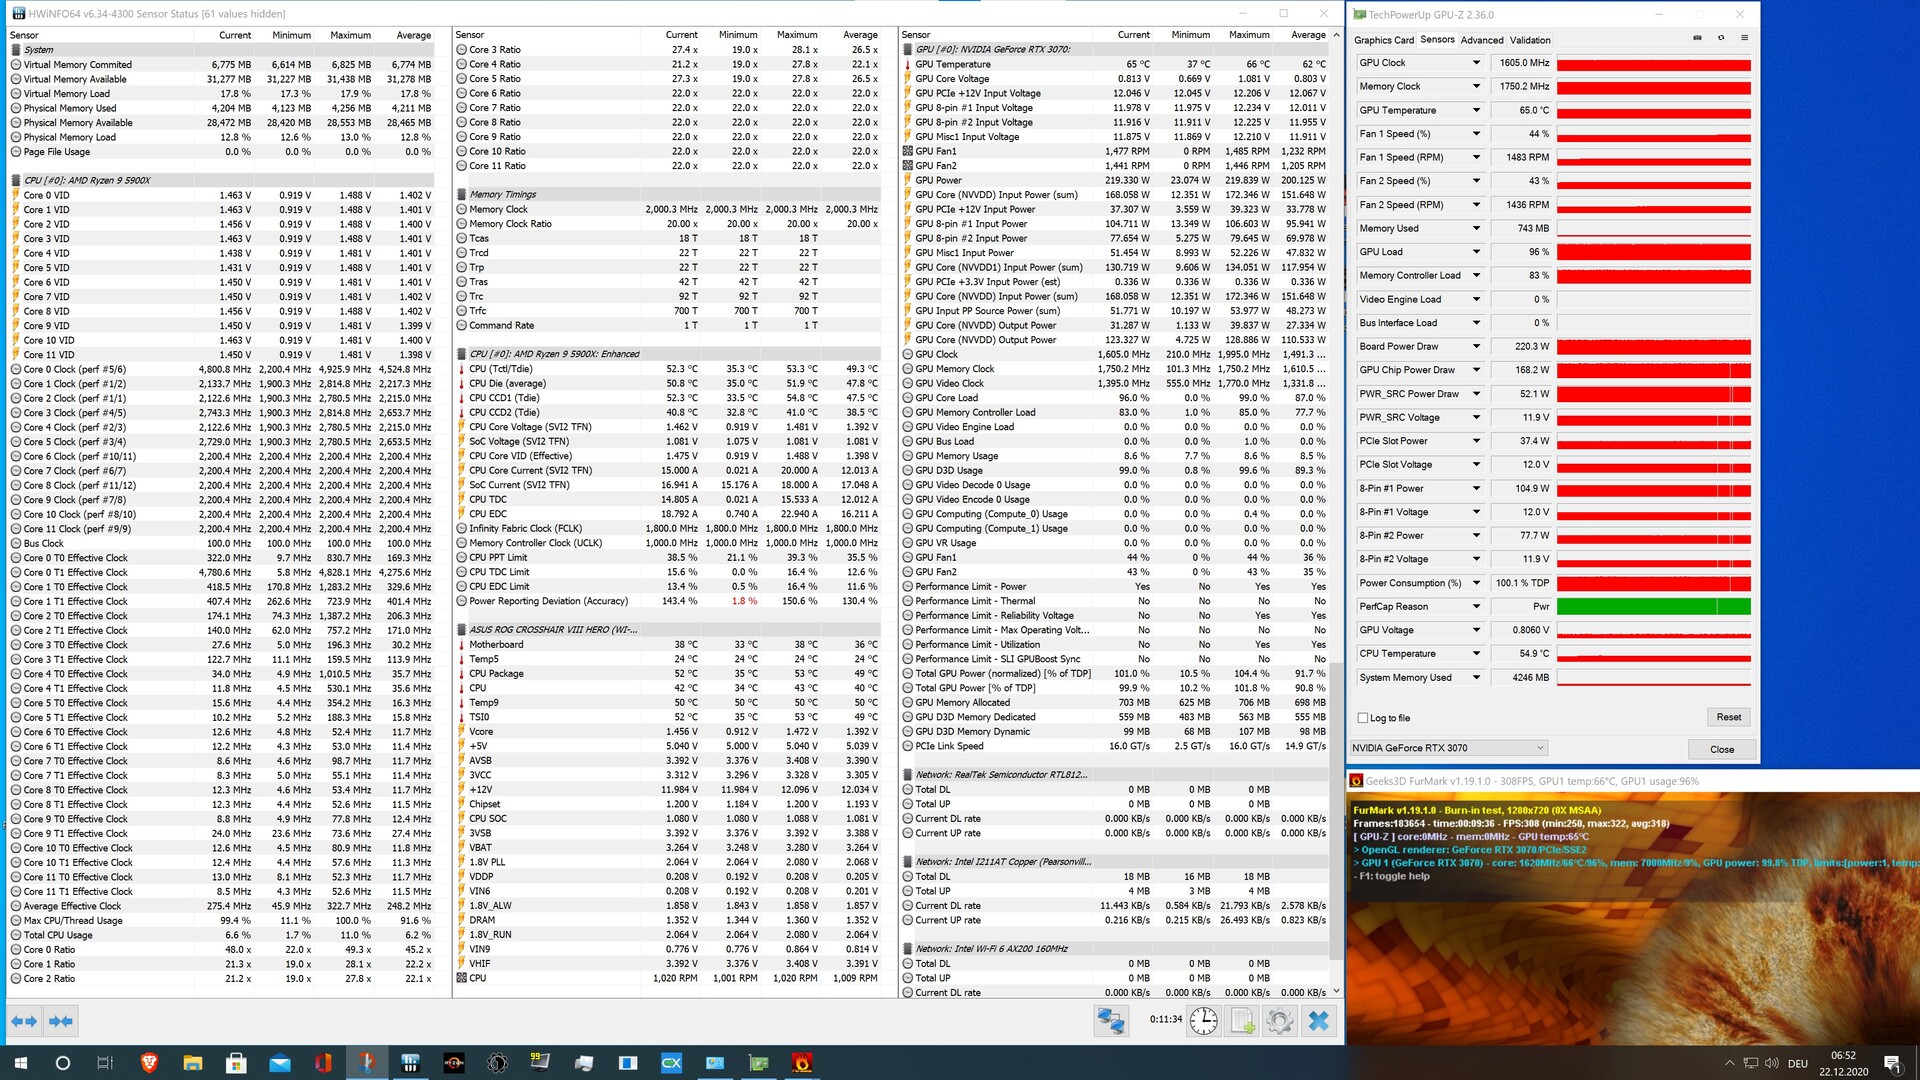
Wie eingangs schon erwähnt liegen die Taktraten der MSI GeForce RTX 3070 Ventus 3X OC gleichauf mit denen der Founders Edition von Nvidia. Gleiches gilt auch für das Power-Limit, welches 220 Watt für die gesamte Grafikkarte beträgt. Außerdem lässt sich das Powert-Target bei unserem Testsample nicht weiter erhöhen.
Synthetische Benchmarks
Einen ersten Eindruck über die Leistung der MSI GeForce RTX 3070 Ventus 3X OC bekommen wir bei den synthetischen Benchmarks. Wir man aus den technischen Daten schon erkennen kann, reiht sich unser Testsample hinter der GeForce RTX 3070 Gaming X Trio ein, wenngleich der Rückstand nur minimal ausfällt und nur messbar ist. Gegen die GeForce RTX 2080 Ti, welche wir al Custom-Version von KFA2 getestet haben, schlägt sich die RTX 3070 sehr gut und kann sich hier im Vergleich gegen das Top-Modell der Vorgängergeneration fast immer Durchsetzen.
| 3DMark 03 Standard | 136483 Punkte | |
| 3DMark 05 Standard | 34535 Punkte | |
| 3DMark 06 Standard Score | 35659 Punkte | |
| 3DMark Vantage P Result | 62128 Punkte | |
| 3DMark 11 Performance | 26565 Punkte | |
| 3DMark Ice Storm Standard Score | 197964 Punkte | |
| 3DMark Cloud Gate Standard Score | 48366 Punkte | |
| 3DMark Fire Strike Score | 20451 Punkte | |
| 3DMark Fire Strike Extreme Score | 12092 Punkte | |
| 3DMark Time Spy Score | 8797 Punkte | |
Hilfe | ||
Spiele-Benchmarks
Bei unseren Spieletests macht die MSI GeForce RTX 3070 Ventus 3X OC eine etwas bessere Figur, als bei den synthetischen Benchmarks, was bedeutet, dass das Gaming X Trio Modell in einigen Tests geschlagen wird. Beide MSI-Modelle rücken hier also näher zusammen und sind quasi gleich schnell. Auch gegenüber der RTX 2080 Ti kann sich unser Testsample meistens Durchsetzen. Gleichwohl geht der GeForce RTX 3070 Ventus 3X OC in sehr hohen Auflösungen die Puste aus, sodass hier das ältere Top-Modell die Nase vorn hat. Für 4K-Gaming ist die GeForce RTX 3070 nur bedingt geeignet, denn die Frameraten variieren sehr stark von Spiel zu Spiel. Mit neuesten Spielen hat dir MSI GeForce RTX 3070 Ventus 3X OC in 2160p mitunter Probleme für ein flüssiges Gameplay zu sorgen. Somit sehen wir diese Grafikkarte eher geeignet, wenn es um 1440p Gaming geht. Hier performt die MSI GeForce RTX 3070 Ventus 3X OC durchweg gut und kann in den von uns getesteten Spielen immer gute Frameraten auf den Bildschirm bringen.
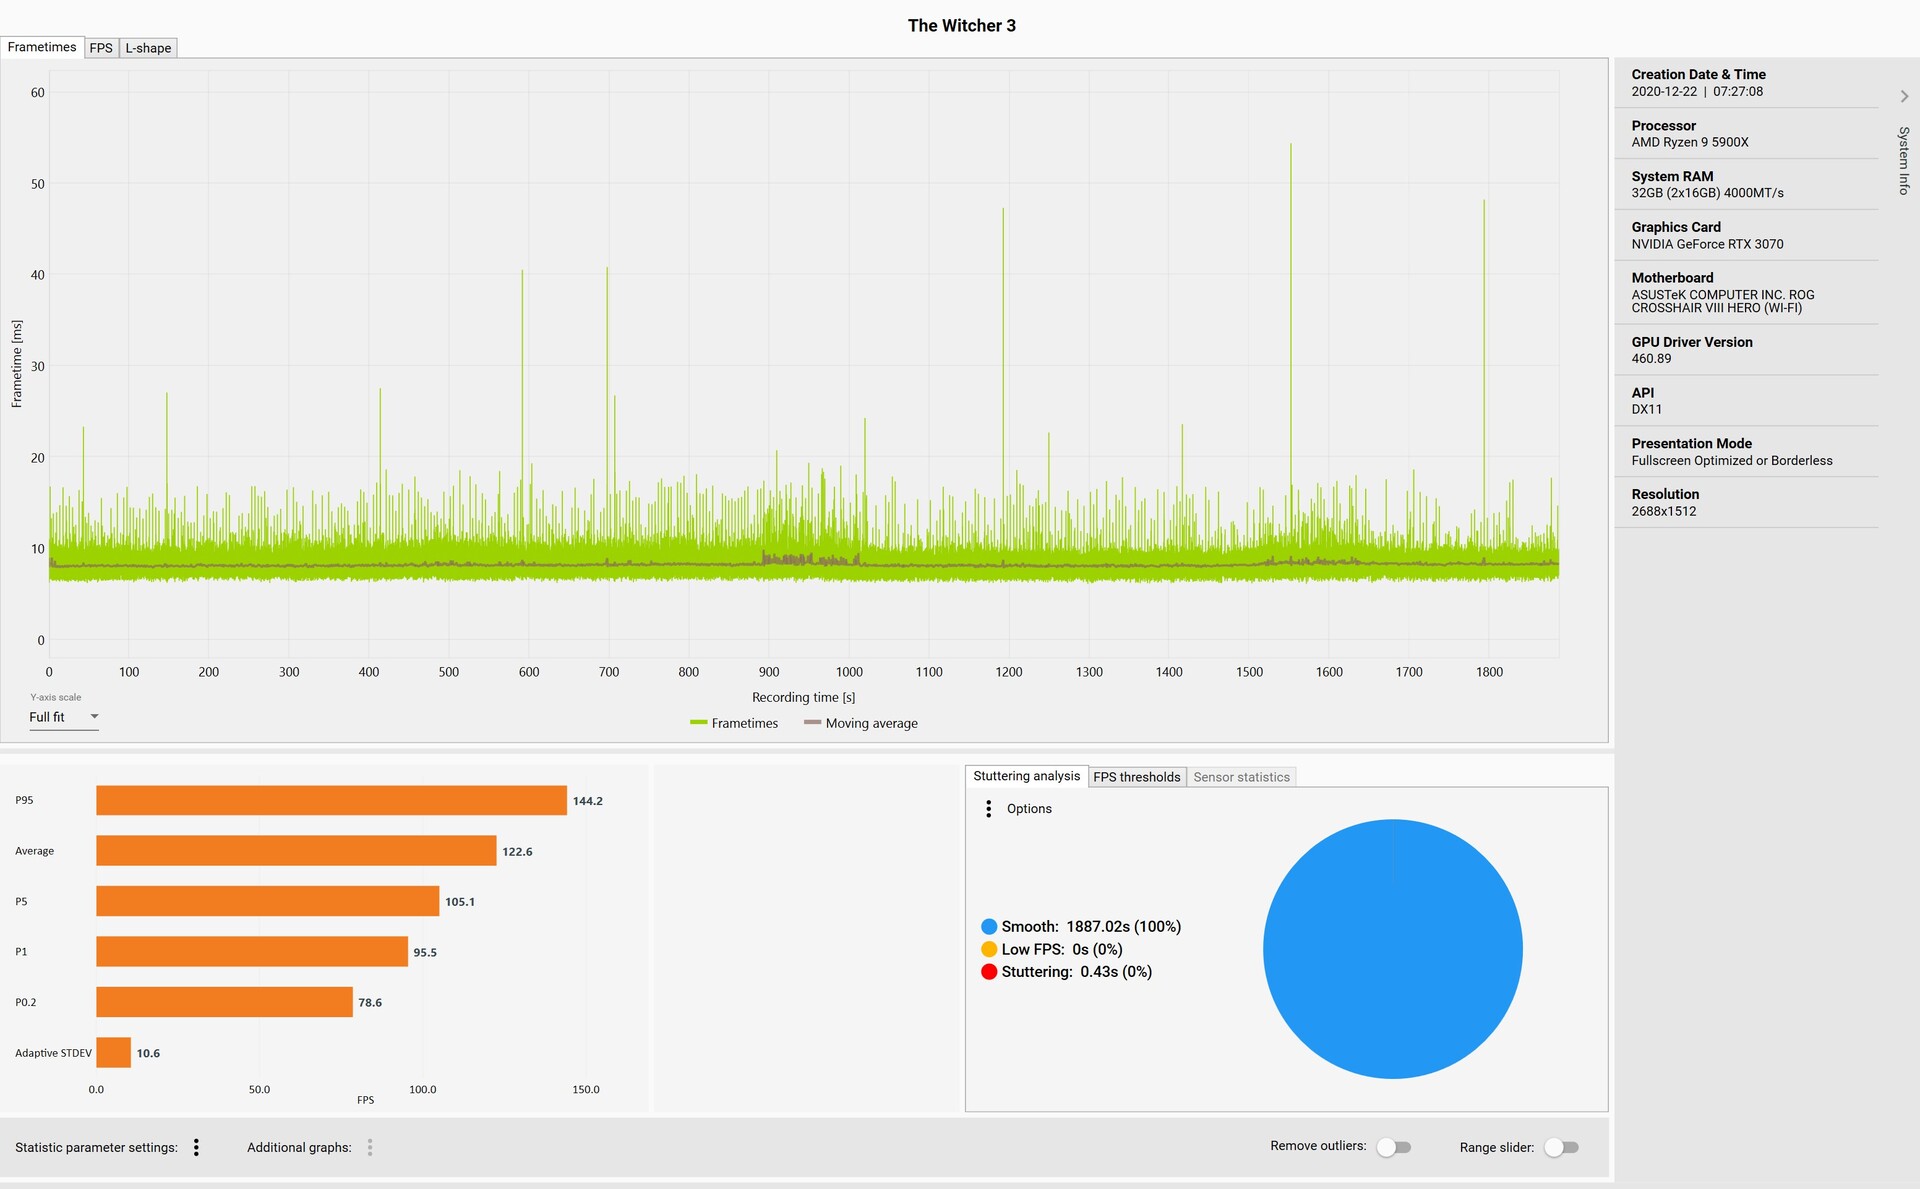
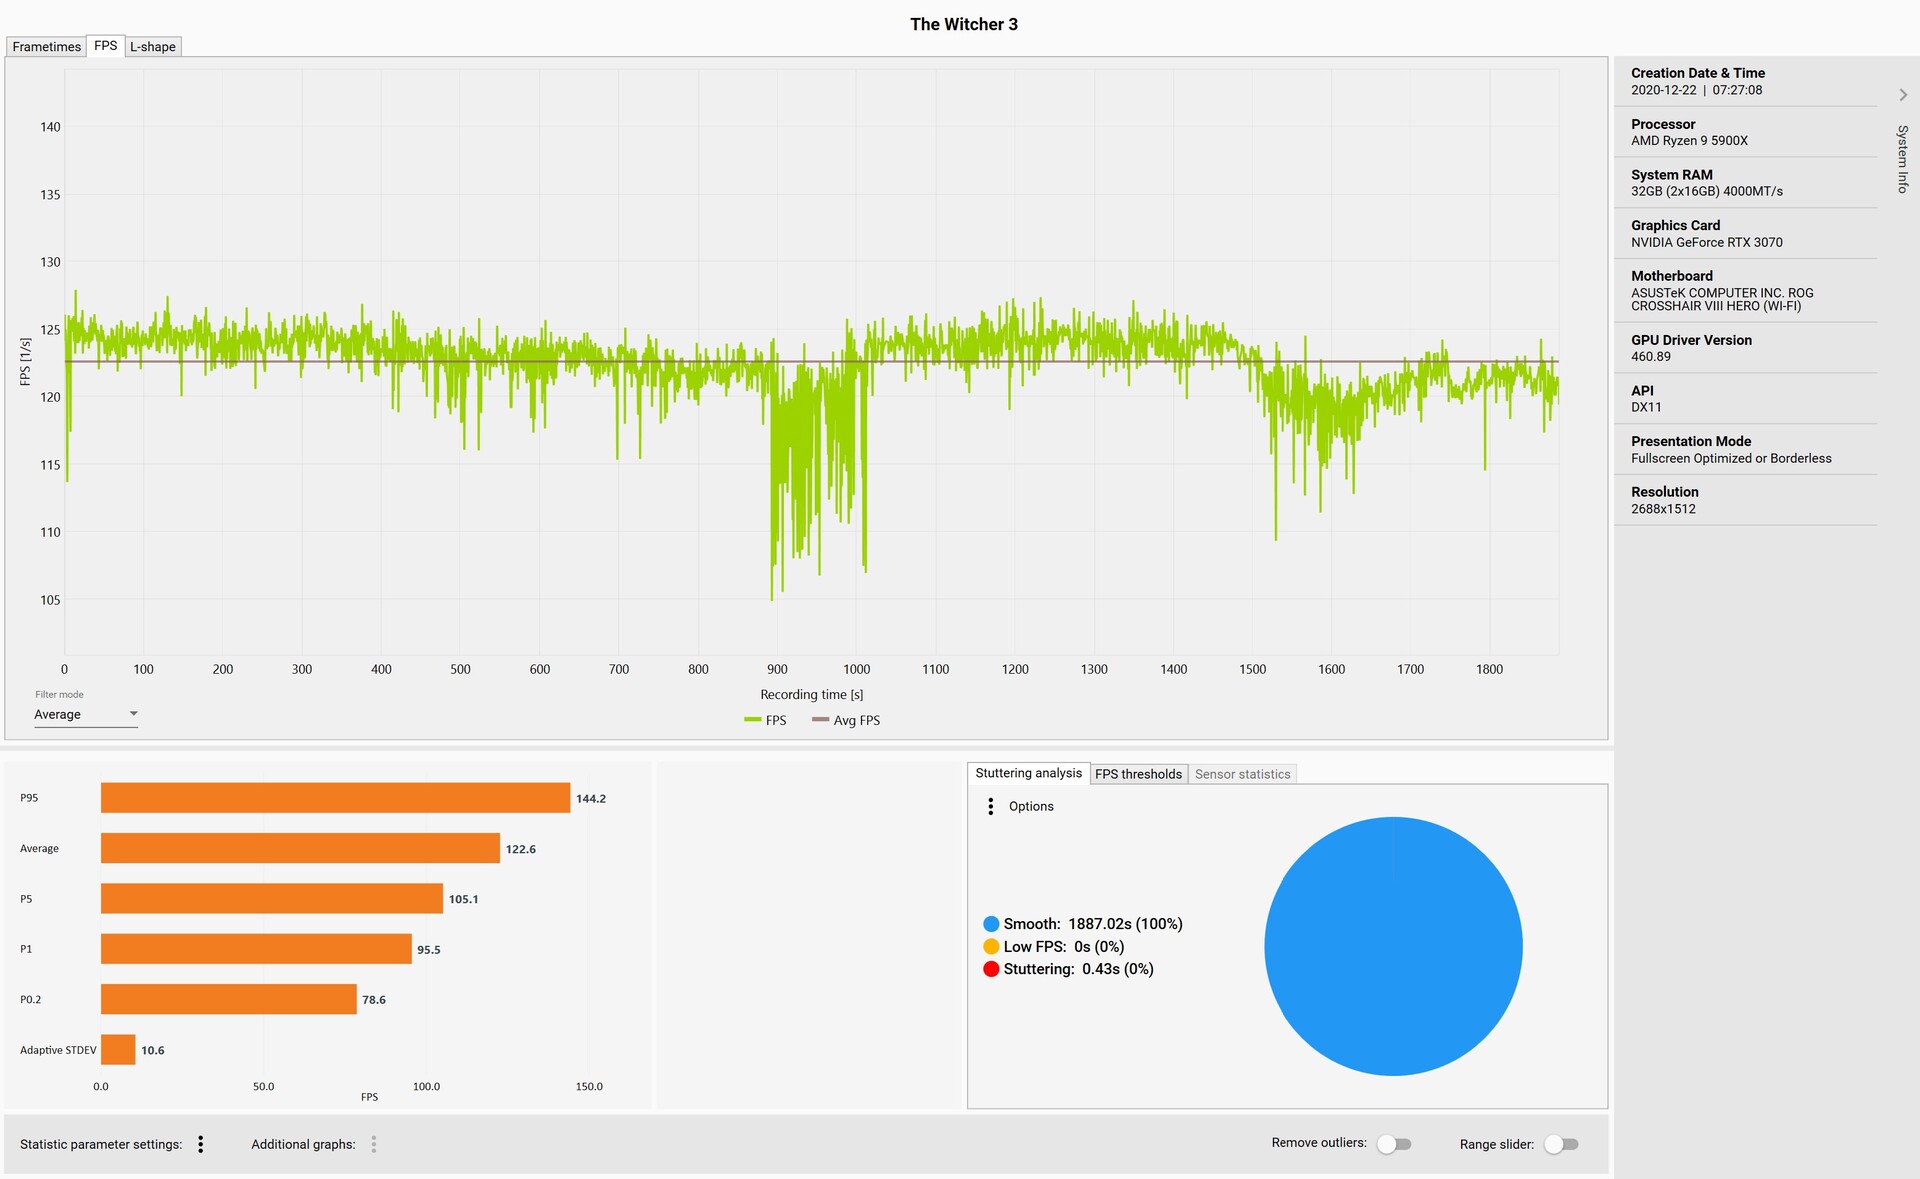
Wer meistens in 1080p oder 1440p spielt, wird mit der Leistung der MSI GeForce RTX 3070 Ventus 3X OC durchaus glücklich werden. Dennoch hinterlassen die 8-GB-VRAM einen faden Beigeschmack, wenn man auch für die Zukunft gewappnet sein will. Gleichwohl sind die 8-GB-VRAM momentan noch ausreichend. Bei den Frametimes und dem Frameverlauf nutzen wir wie immer das Spiel The Witcher 3 (1080p-Ultra-Preset). Bei der Aufzeichnung der Daten zeigen sich nur hin und wieder einige höhere Latenzen, die das Spielgeschehen aber nicht spürbar beeinflussen. Der Frameverlauf ist auch auf Dauer relativ konstant. In der Mitte und am Ende zeigen sich hin und wieder ein paar Framedrops, was sich aber auf das flüssige Spielverlauf nicht auswirkt, da immer mindestens 105 FPS anliegen.
| F1 2020 | |
| 3840x2160 Ultra High Preset AA:T AF:16x | |
| MSI GeForce RTX 3090 Suprim X | |
| AMD Radeon RX 6800 XT | |
| ASUS GeForce RTX 3080 ROG STRIX OC GAMING | |
| MSI GeForce RTX 3070 Gaming X Trio | |
| MSI GeForce RTX 3070 Ventus 3X OC | |
| 2560x1440 Ultra High Preset AA:T AF:16x | |
| MSI GeForce RTX 3090 Suprim X | |
| AMD Radeon RX 6800 XT | |
| ASUS GeForce RTX 3080 ROG STRIX OC GAMING | |
| MSI GeForce RTX 3070 Gaming X Trio | |
| MSI GeForce RTX 3070 Ventus 3X OC | |
| min. | mittel | hoch | max. | QHD | 4K | |
|---|---|---|---|---|---|---|
| GTA V (2015) | 184 | 175 | 170 | 108 | 98.3 | 117 |
| The Witcher 3 (2015) | 407 | 363 | 176 | 121 | 90.9 | |
| Dota 2 Reborn (2015) | 171 | 157 | 153.6 | 136.3 | 128.5 | |
| Rise of the Tomb Raider (2016) | 226 | 159 | 156 | 151 | 80.9 | |
| Final Fantasy XV Benchmark (2018) | 209 | 159 | 122 | 94.1 | 57.6 | |
| X-Plane 11.11 (2018) | 141 | 123 | 95.4 | 84.3 | ||
| Far Cry 5 (2018) | 184 | 161 | 154 | 143 | 125 | 70 |
| Strange Brigade (2018) | 413 | 302 | 251 | 222 | 166 | 96.8 |
| Shadow of the Tomb Raider (2018) | 200 | 176 | 168 | 160 | 116 | 63.5 |
| Battlefield V (2018) | 188.9 | 154.3 | 137.4 | 125.2 | 106.8 | 70.9 |
| Apex Legends (2019) | 144 | 144 | 144 | 144 | 144 | 106 |
| Far Cry New Dawn (2019) | 152 | 135 | 130 | 116 | 107 | 72 |
| Metro Exodus (2019) | 193 | 148 | 117 | 93.7 | 74.8 | 48.6 |
| Anno 1800 (2019) | 170 | 147 | 100 | 52 | 50.5 | 35 |
| Control (2019) | 238 | 149 | 117 | 79.8 | 41 | |
| Borderlands 3 (2019) | 134 | 123 | 94.5 | 95.3 | 75.1 | 43.8 |
| Star Wars Jedi Fallen Order (2019) | 130 | 128 | 128 | 125 | 70.1 | |
| Red Dead Redemption 2 (2019) | 156.5 | 149 | 112.8 | 76.2 | 63.4 | 42.1 |
| Hunt Showdown (2020) | 174 | 152 | 137 | 128 | 74.2 | |
| Doom Eternal (2020) | 246 | 246 | 244 | 237 | 208 | 116 |
| F1 2020 (2020) | 327 | 268 | 252 | 181 | 143 | 88.7 |
| Death Stranding (2020) | 224 | 190 | 173 | 170 | 126 | 74.1 |
| Horizon Zero Dawn (2020) | 189 | 153 | 138 | 124 | 104 | 61 |
| Crysis Remastered (2020) | 221 | 182 | 97.7 | 75.8 | 64.3 | 38.9 |
| Serious Sam 4 (2020) | 148.8 | 122 | 120.9 | 99 | 92 | 66.6 |
| Mafia Definitive Edition (2020) | 184 | 140 | 132 | 98.1 | 55.2 | |
| Star Wars Squadrons (2020) | 437 | 344 | 333 | 312 | 228 | 136 |
| FIFA 21 (2020) | 203 | 195 | 200 | 191 | 193 | 194 |
| Watch Dogs Legion (2020) | 122 | 118 | 112 | 86 | 66.3 | 39.2 |
| Dirt 5 (2020) | 179 | 122 | 106 | 89.3 | 75.9 | 54.7 |
| Assassin´s Creed Valhalla (2020) | 133 | 103 | 87 | 80 | 65 | 42 |
| Call of Duty Black Ops Cold War (2020) | 141 | 133 | 117 | 95.7 | 83 | 50.2 |
| Yakuza Like a Dragon (2020) | 109 | 109 | 116 | 111 | 96 | 51.7 |
| Immortals Fenyx Rising (2020) | 115 | 92 | 83 | 81 | 68 | 50 |
| Cyberpunk 2077 1.0 (2020) | 132 | 108 | 92.4 | 81 | 54.8 | 27.9 |
Compute Performance
In LuxMark und ComputeMark verliert unsere GeForce RTX 3070 Ventus 3X OC das interne MSI-Duell. Die geringere TDP und der geringere Boost sorgen für eine hauchdünne Niederlage. Dennoch bracht sich das preiswerte Modell aber nicht zu verstecken, denn insgesamt sind die Benchmarkergebnisse auf einem guten Niveau. Professionelle Grafiklösungen, wie zum Beispiel die Quadro- oder Fire-Pro-Modelle bieten aufgrund der angepassten Treiben eine deutlich höhere Leistung im Compute-Bereich.
Emissionen der MSI GeForce RTX 3070 Ventus 3X OC
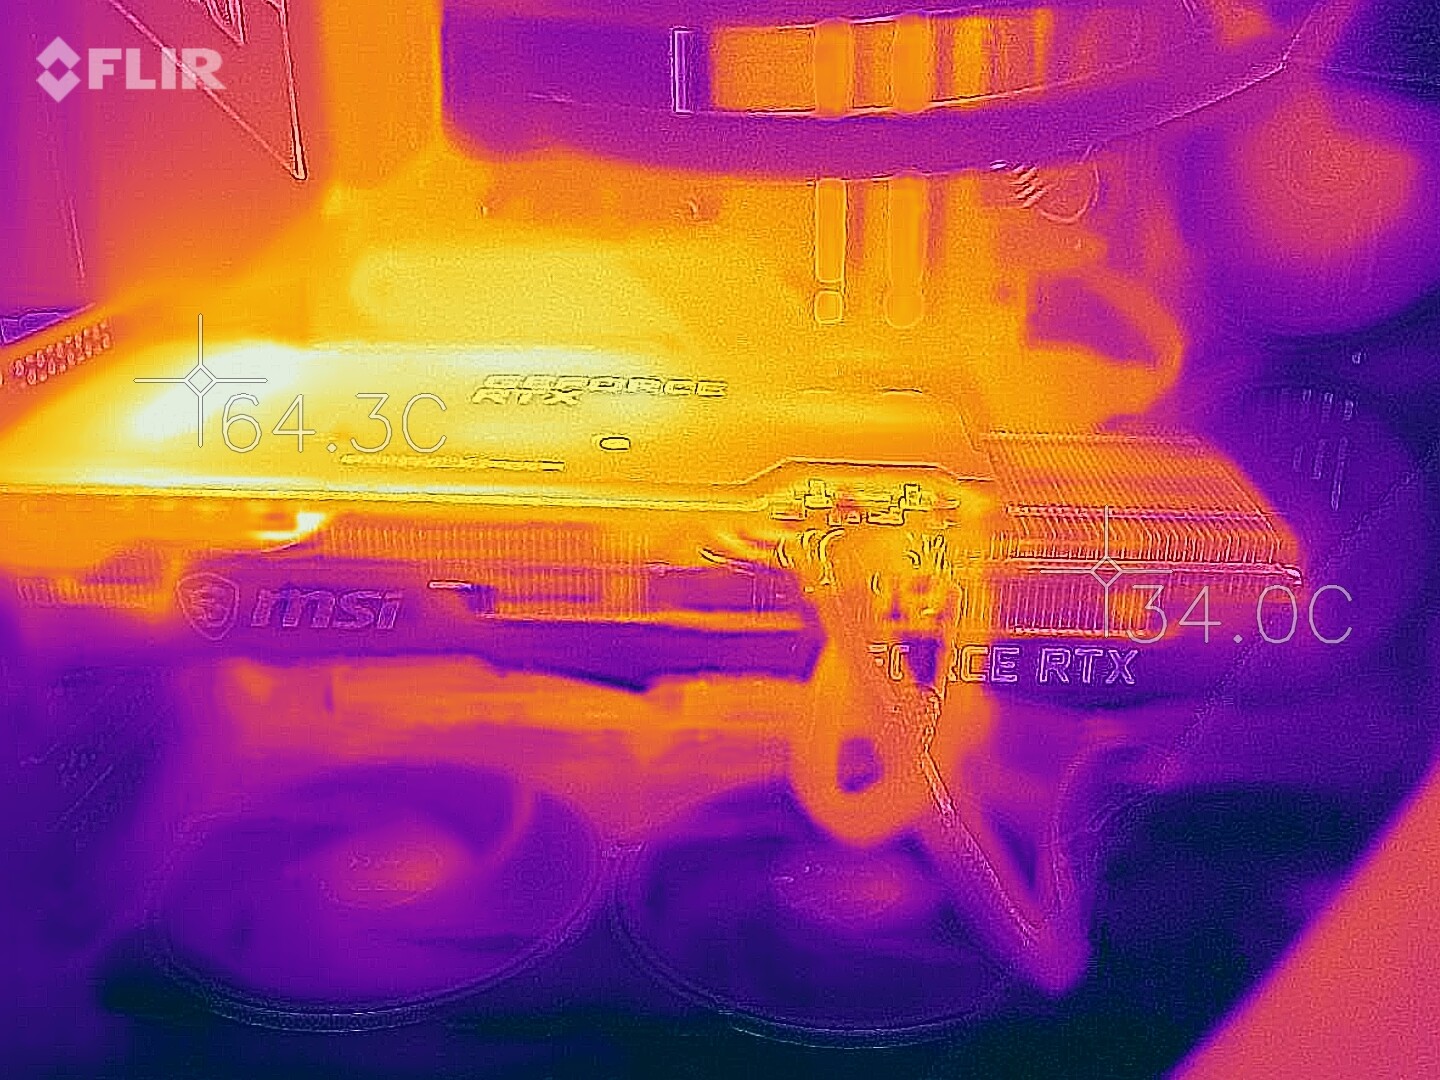
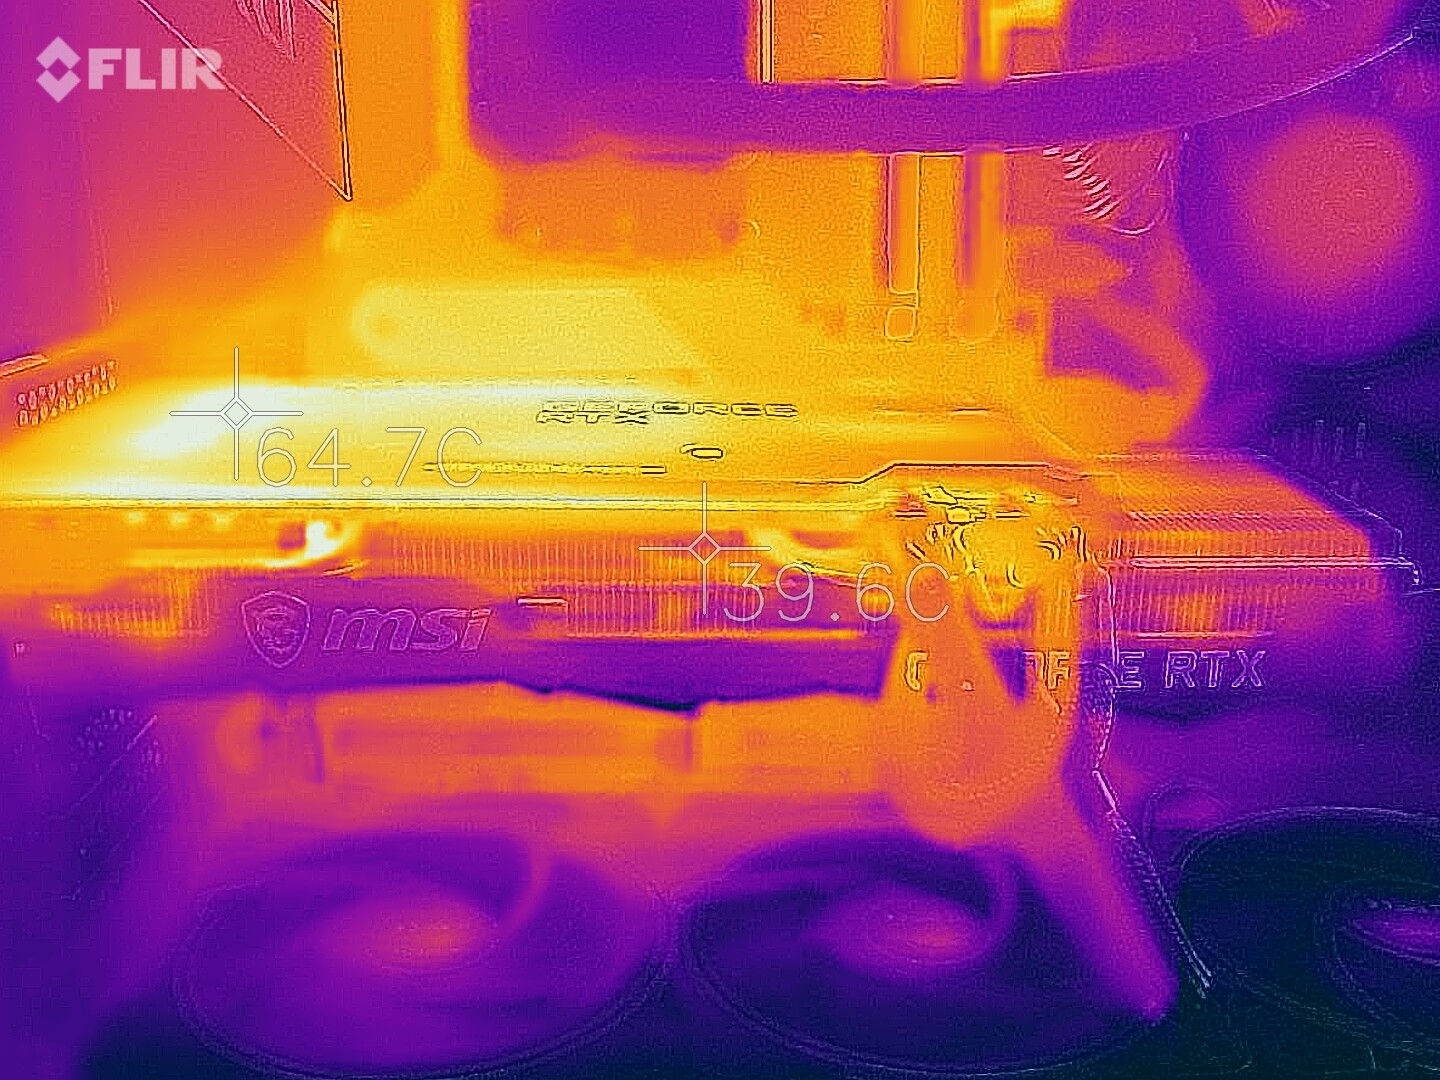
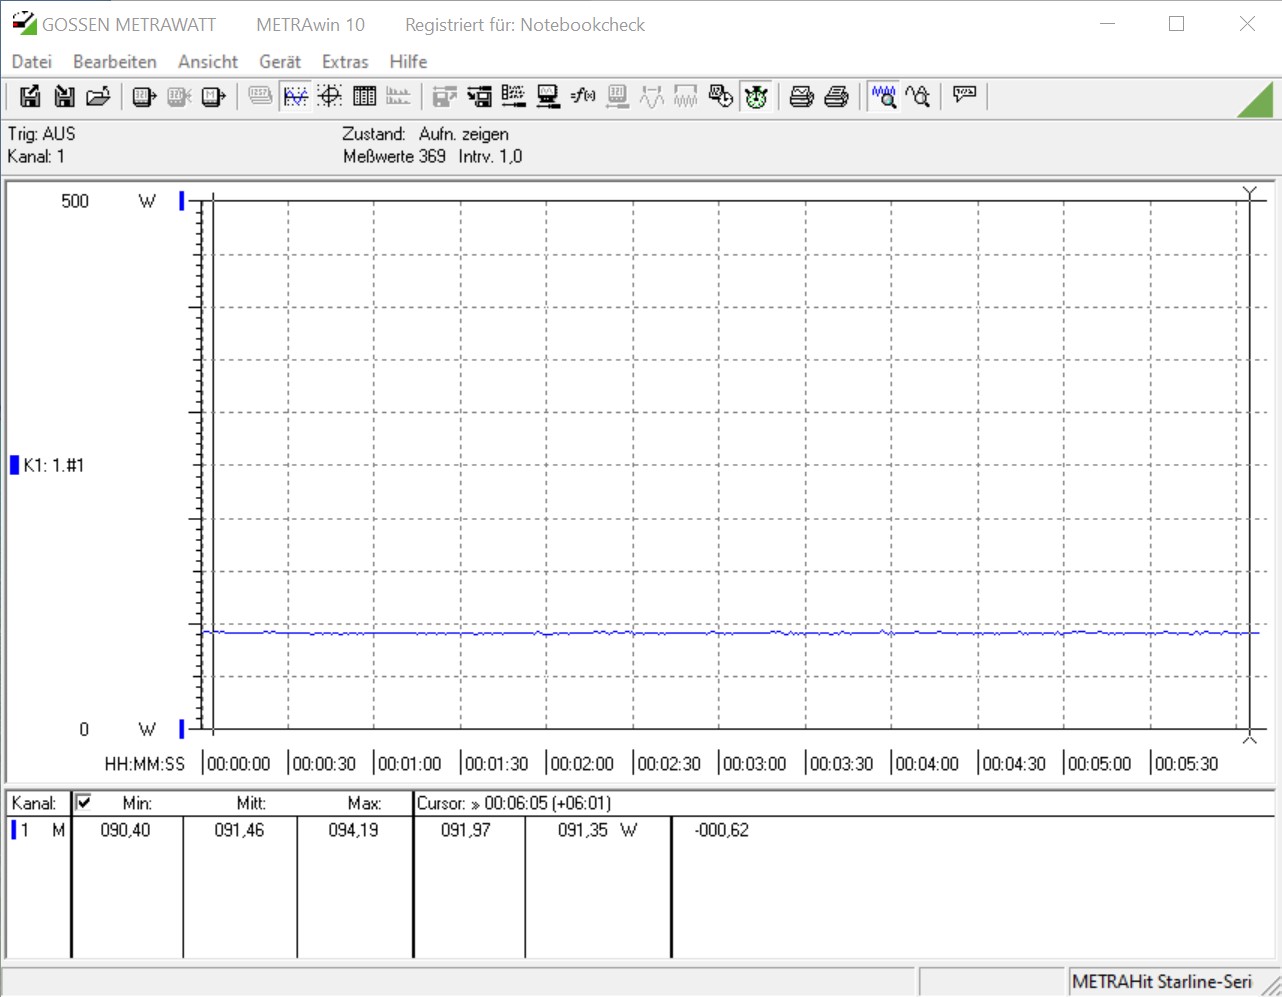
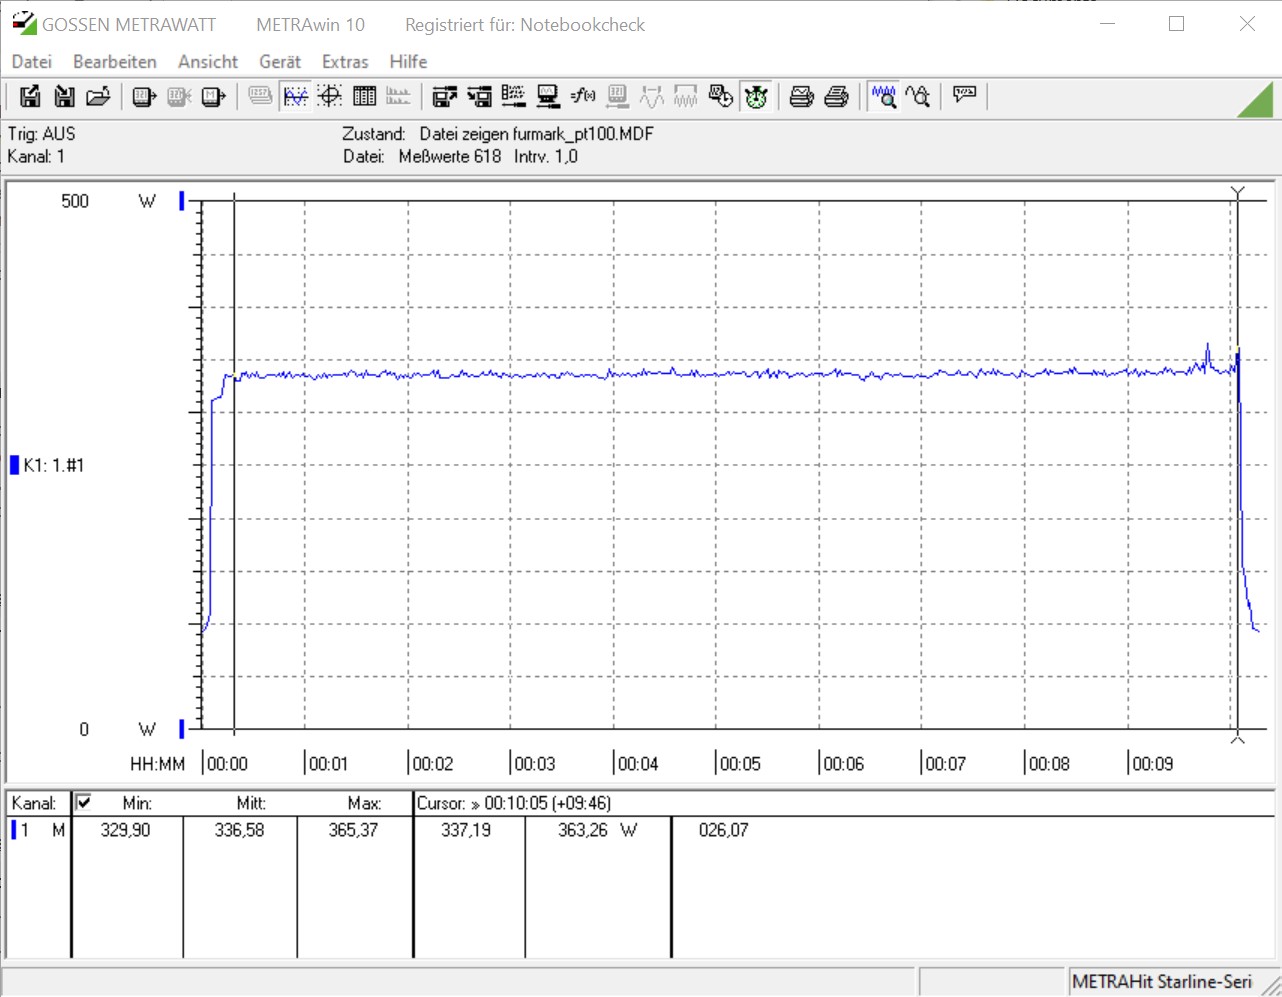
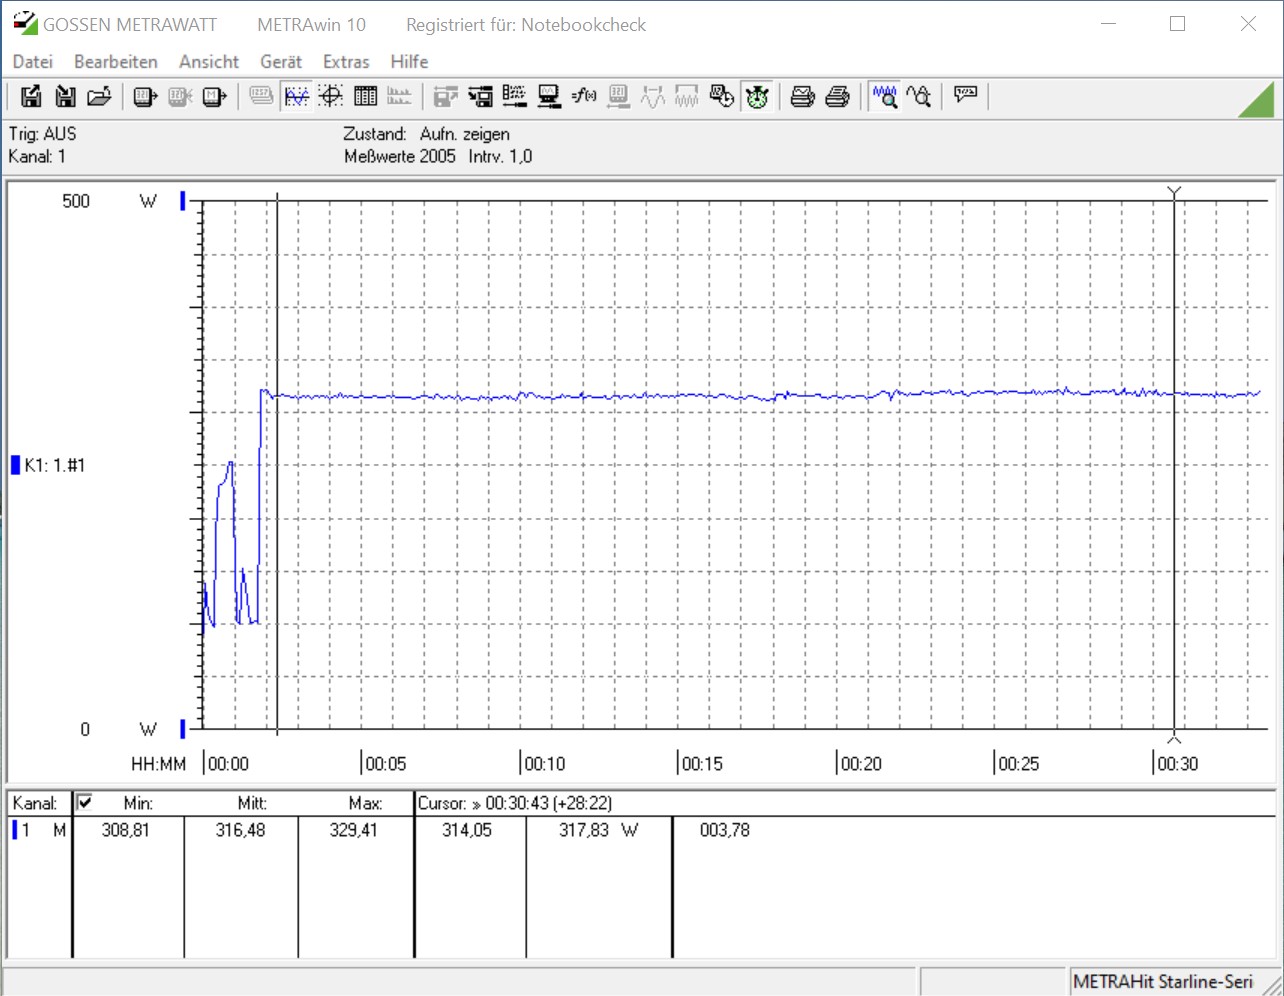
Bei den Emissionen kann die MSI GeForce RTX 3070 Ventus 3X OC auf ganzer Linie überzeugen. Mit 220 Watt ist die Grafikkarte lauf Herstellerangaben etwas sparsamer als eine GeForce RTX 2080 Ti und leistungstechnisch auf Augenhöhe mit dem High-End-Modell der Turing-Generation. Bei unserem Testsystem bedeutet dies ein Energieverbrauch von 91 Watt im Leerlauf und durchschnittlich 336 Watt beim Stresstest. Beim Spielen haben wir im Schnitt sogar nur 316 Watt gemessen, im Vergleich ist dies ein wirklich gutes Ergebnis.
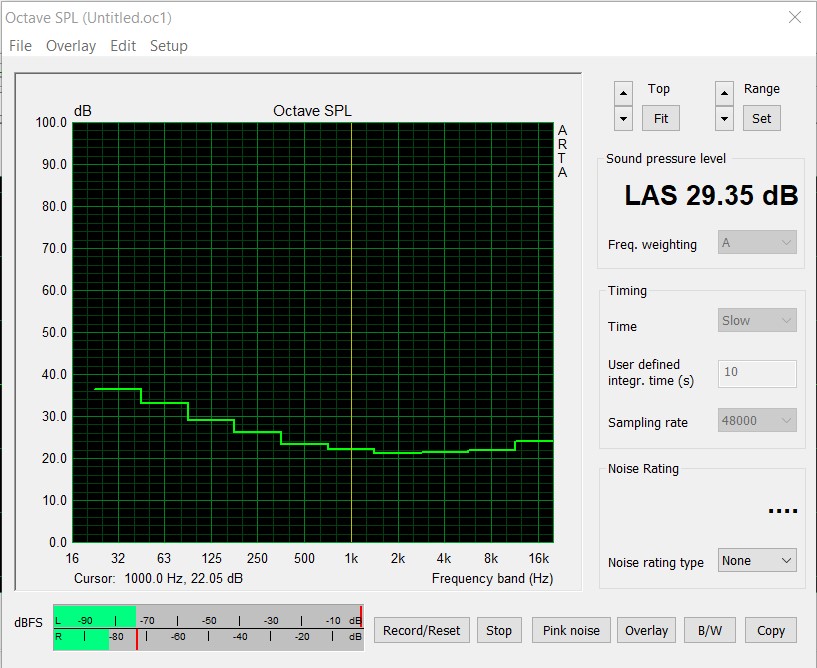
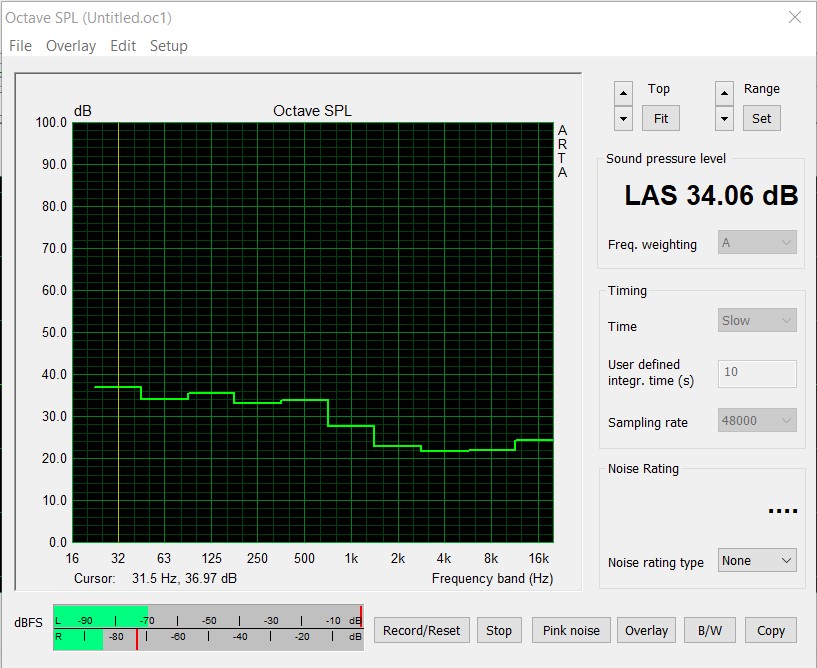
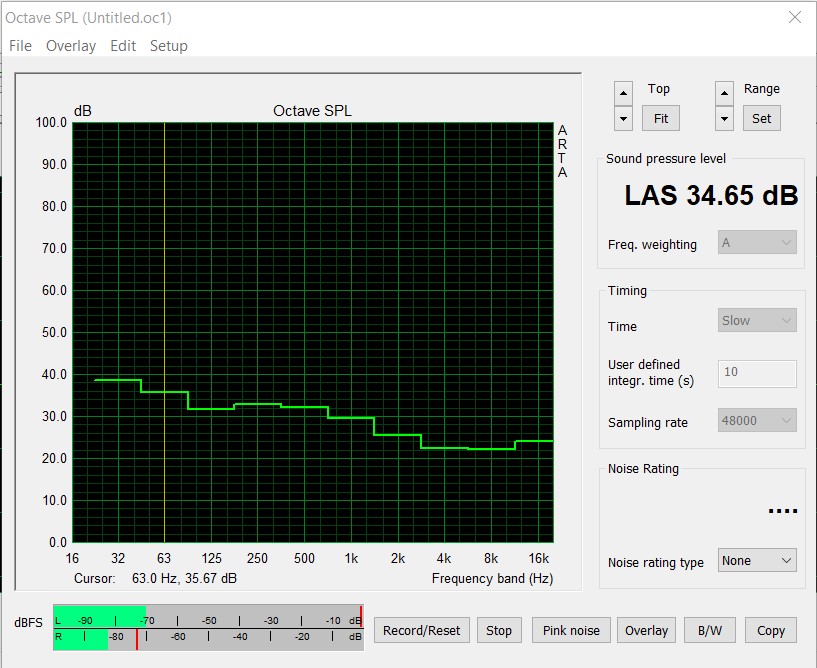
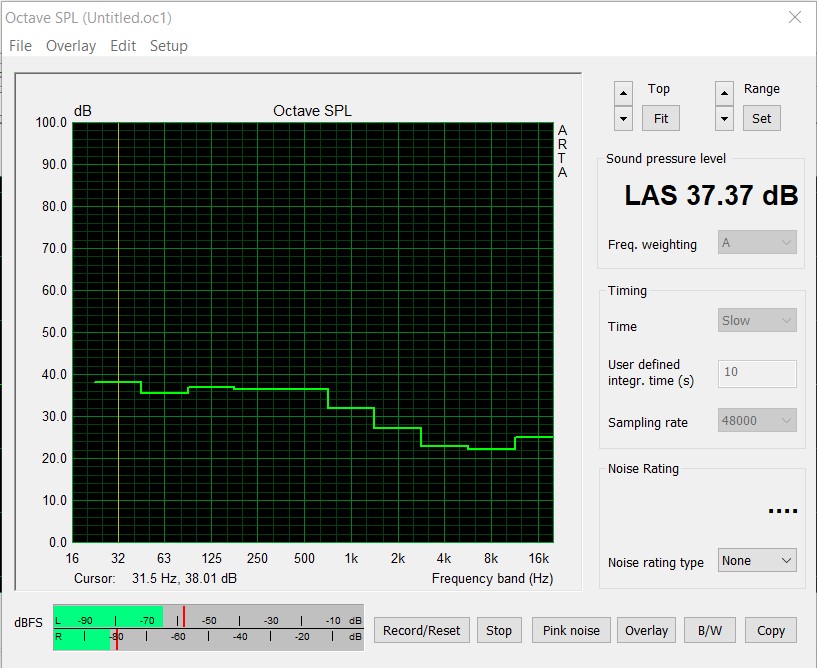
Bei den Geräuschemissionen ist die MSI GeForce RTX 3070 Ventus 3X OC ebenfalls sehr empfehlenswert. Beim Stresstest messen wir im Abstand von 20 Zentimetern zum Gehäuse 34,6 dB(A). Hierbei haben wir alle Gehäuselüfter ausgeschaltet, um nur die Grafikkarte aufzuzeichnen. Schalten wir die Gehäuselüfter wieder ein, so steigt der Geräuschpegel beim Stresstest auf 37,3 dB(A), was noch immer ein sehr gutes Ergebnis ist. Die Lüfterdrehzahl der Grafikkarte betrug knapp 1.500 Umdrehungen pro Minute was 44 Prozent entspricht. Mit maximal 65 °C blieb unser Testsample auch unter Last relativ kühl. Obwohl der verbaute Kühler im Vergleich zur Gaming X Trio Variante etwas billig wirkt, so konnte dieser bei der RTX 3070 Ventus 3X OC sehr gute Ergebnisse erzielen.
* ... kleinere Werte sind besser
Pro
Contra
Fazit - Schnell, Leise und Emissionsarm
Die MSI GeForce RTX 3070 Ventus 3X OC ist eine moderne, schnelle Grafikkarte ohne viel Bling Bling und dazu noch schnell genug um alle aktuellen Titel in 1440p wiederzugeben. Teilweise meistert dieses Modell auch Spiele in 4K, wenngleich hier aber von Spiel zu Spiel geschaut werden muss.
Wenn man die Leistung mit der Turing-Generation vergleicht, so liegt die GeForce RTX 3070 auf Augenhöhe mit einer GeForce RTX 2080 Ti, die zum Release mit einer UVP von 1.249 Euro angeboten wurde. Für unser Modell von MSI liegt die UVP nunmehr bei 529 Euro. Leider sind diese Preise momentan eine reine Wunschvorstellung denn die Marktsituation ist, seit der Veröffentlichung der neuen Ampere-Grafikkarten sehr angespannt was die Lieferzahlen betrifft. Das hat natürlich Auswirkungen auf den Preis, der für unser Testsample zum Testzeitpunkt bei knapp 800 Euro liegt. Wer also nicht unbedingt auf eine neue Grafikkarte angewiesen ist, sollte sich weiter gedulden bis Nvidia und auch die Boardpartner Grafikkarten in ausreichender Stückzahl ausliefern können. Erst dann ist mit einer Entspannung der jetzigen Situation zu rechnen. Bei AMD sieht es hingegen nicht besser aus.
Mit der MSI GeForce RTX 3070 Ventus 3X OC, bekommt man eine schnelle und modere Ampere-Grafikkarte die in puncto Emission überzeugt.
Aber zurück zur Grafikkarte. Insgesamt liefert die MSI GeForce RTX 3070 Ventus 3X OC eine gute Performance und kann auch bei den Emissionen komplett überzeugen. Der Fan-Stop-Mode sorgt bei geringer Belastung für einen lautlosen Betrieb was Silent-Freaks freuen wird.
Als richtigen Kritikpunkt können wir hier nur den Preis nennen. Beachten sollte man aber auch die Länge der Grafikkarte, denn kompakte Gehäuse scheiden hier unter Umständen aus. Wer den Kauf einer RTX 3070 plant, sollte beim Griff zum Netzteil mindestens ein 750-Watt-Modell auswählen.
Alle Benchmarks und Testwerte der RTX 3070 finden Sie auf der Grafikkartenseite der GeForce RTX 3070 (laufend aktualisiert).
