Zotac Magnus One Desktop-PC mit Core i7 und GeForce RTX 3070 im Test
Mit der neuen Magnus One Serie führt Zotac einen weiteren kompakten Gaming-Computer in ihrem Portfolio. An dieser Stelle sei jedoch gleich zu erwähnen, dass es sich beim Zotac Magnus One um ein Barebone System handelt. Das bedeutet, dass Arbeitsspeicher, Massenspeicher und auch das Betriebssystem extra erworben werden müssen. Einen ähnlichen Ansatz verfolgt Zotac auch mit seiner ZBOX Magnus, die jedoch noch kompakter ist.
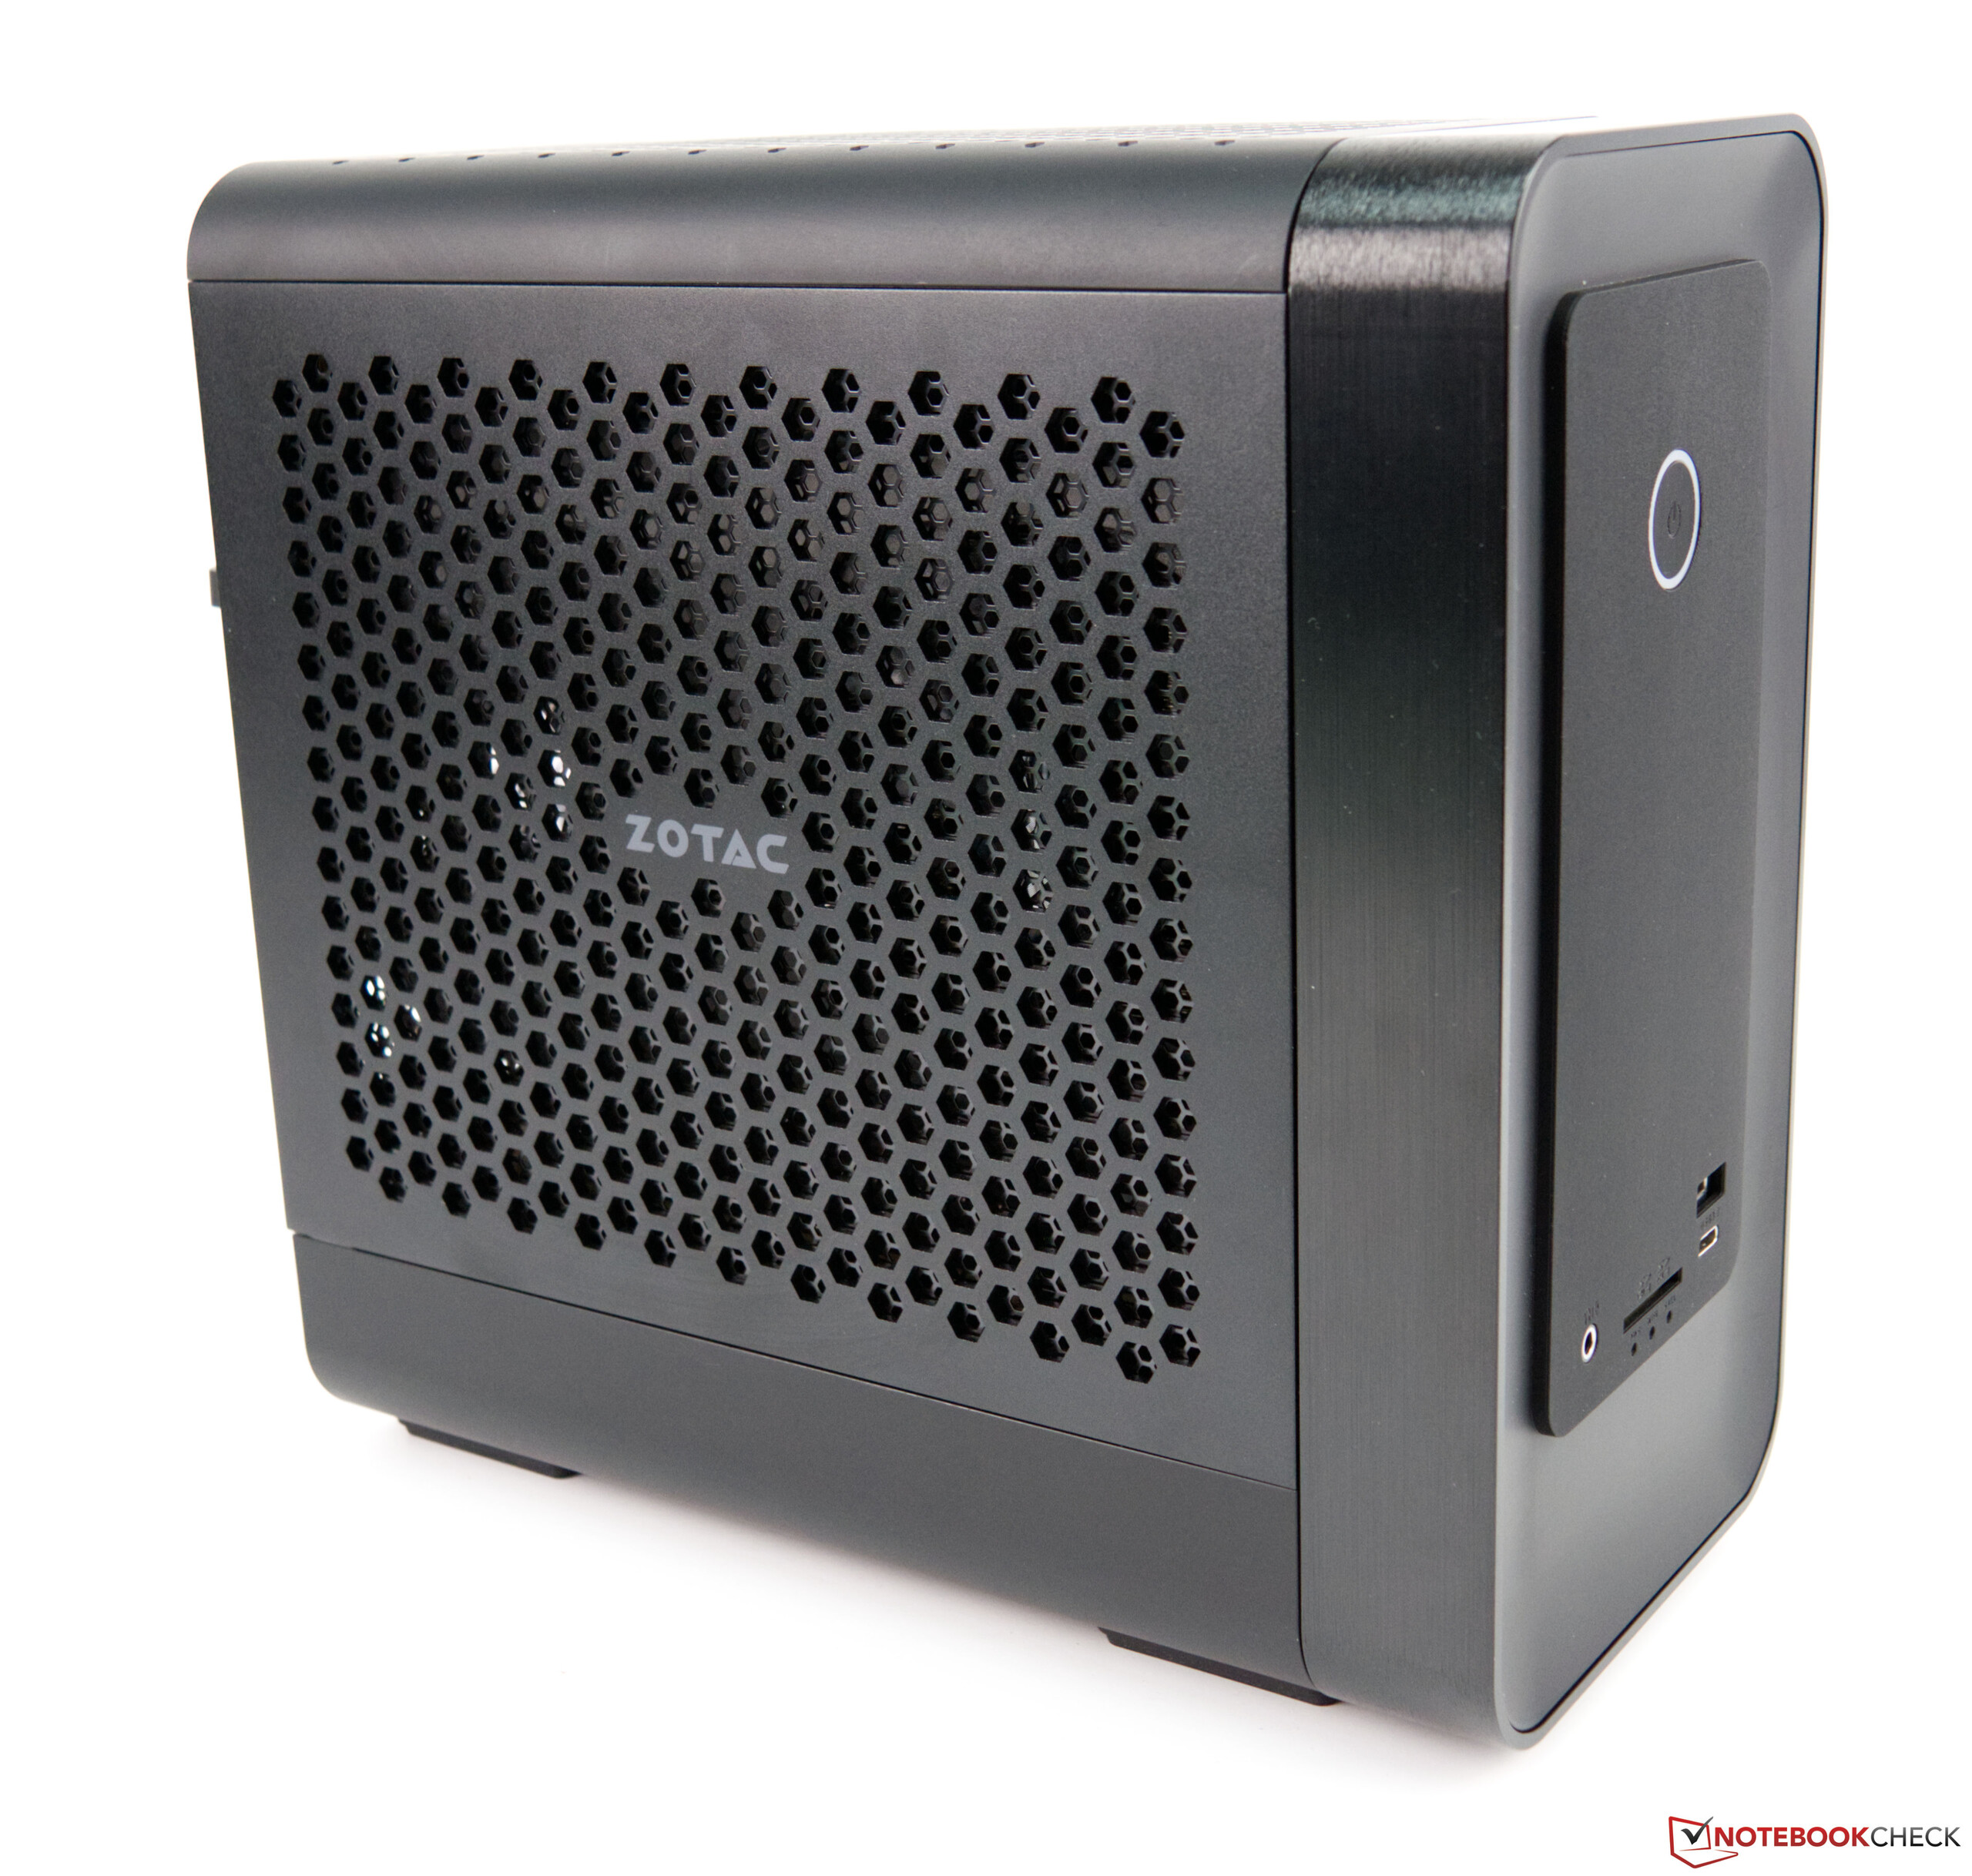
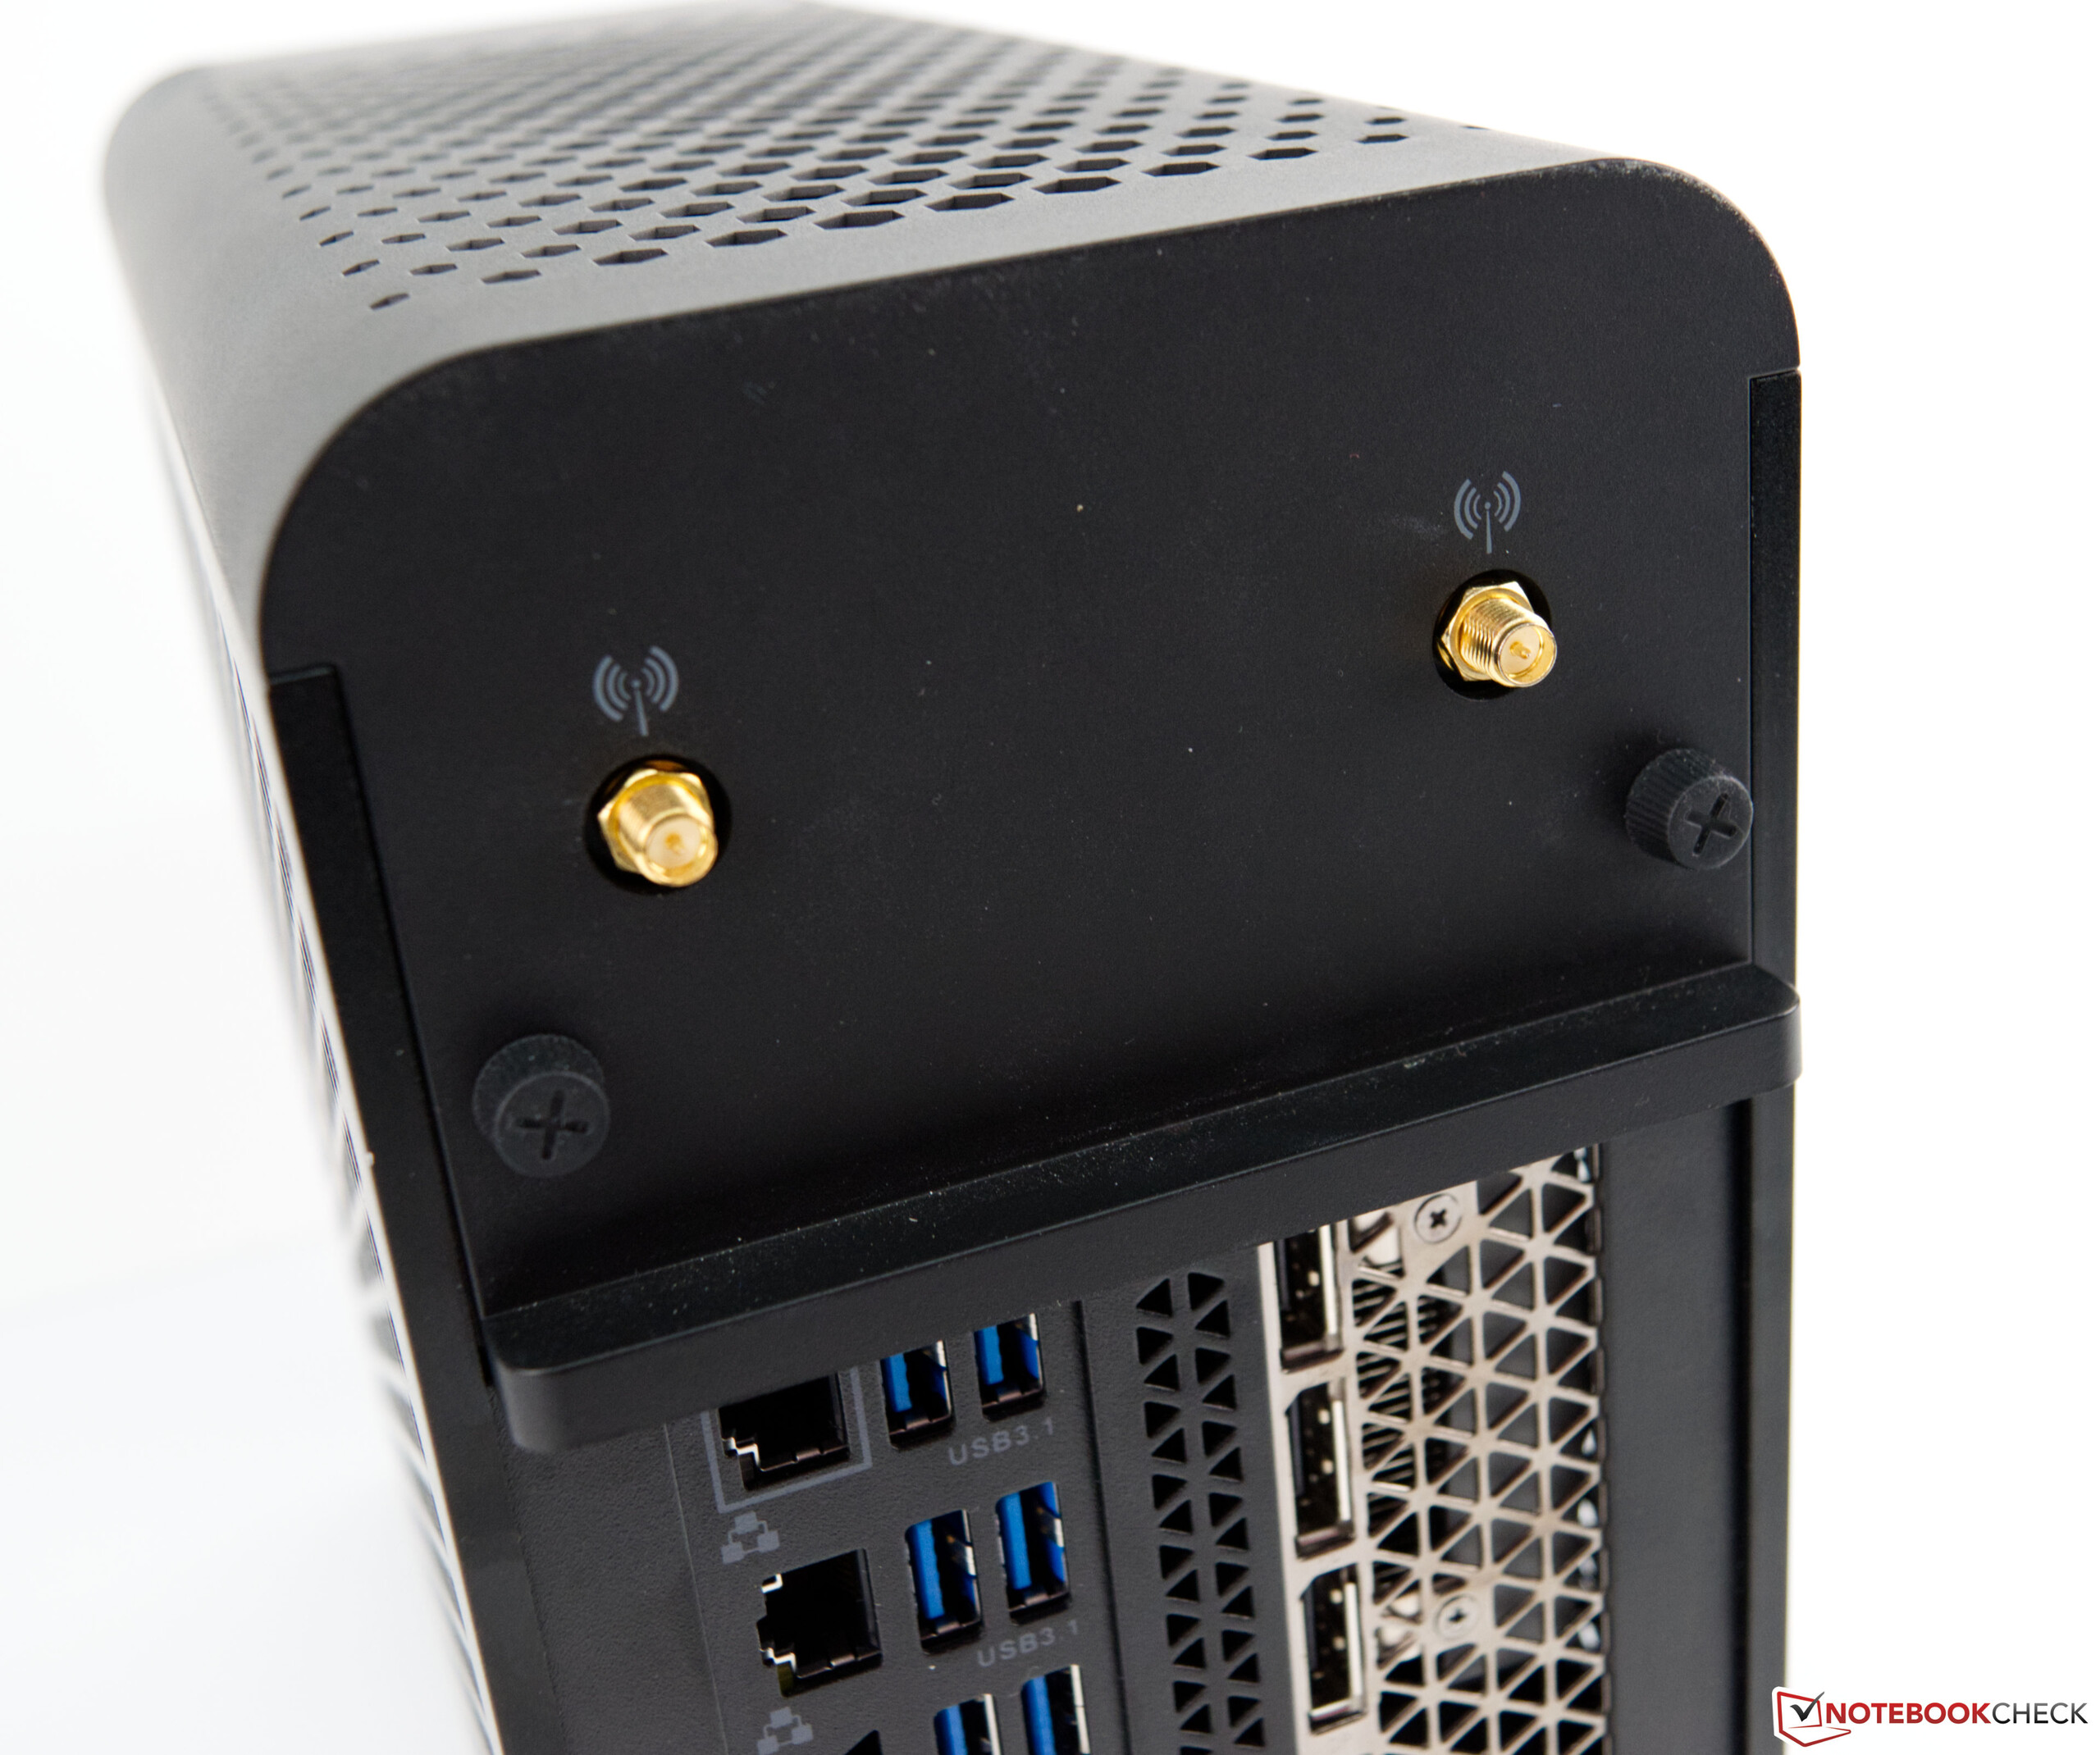
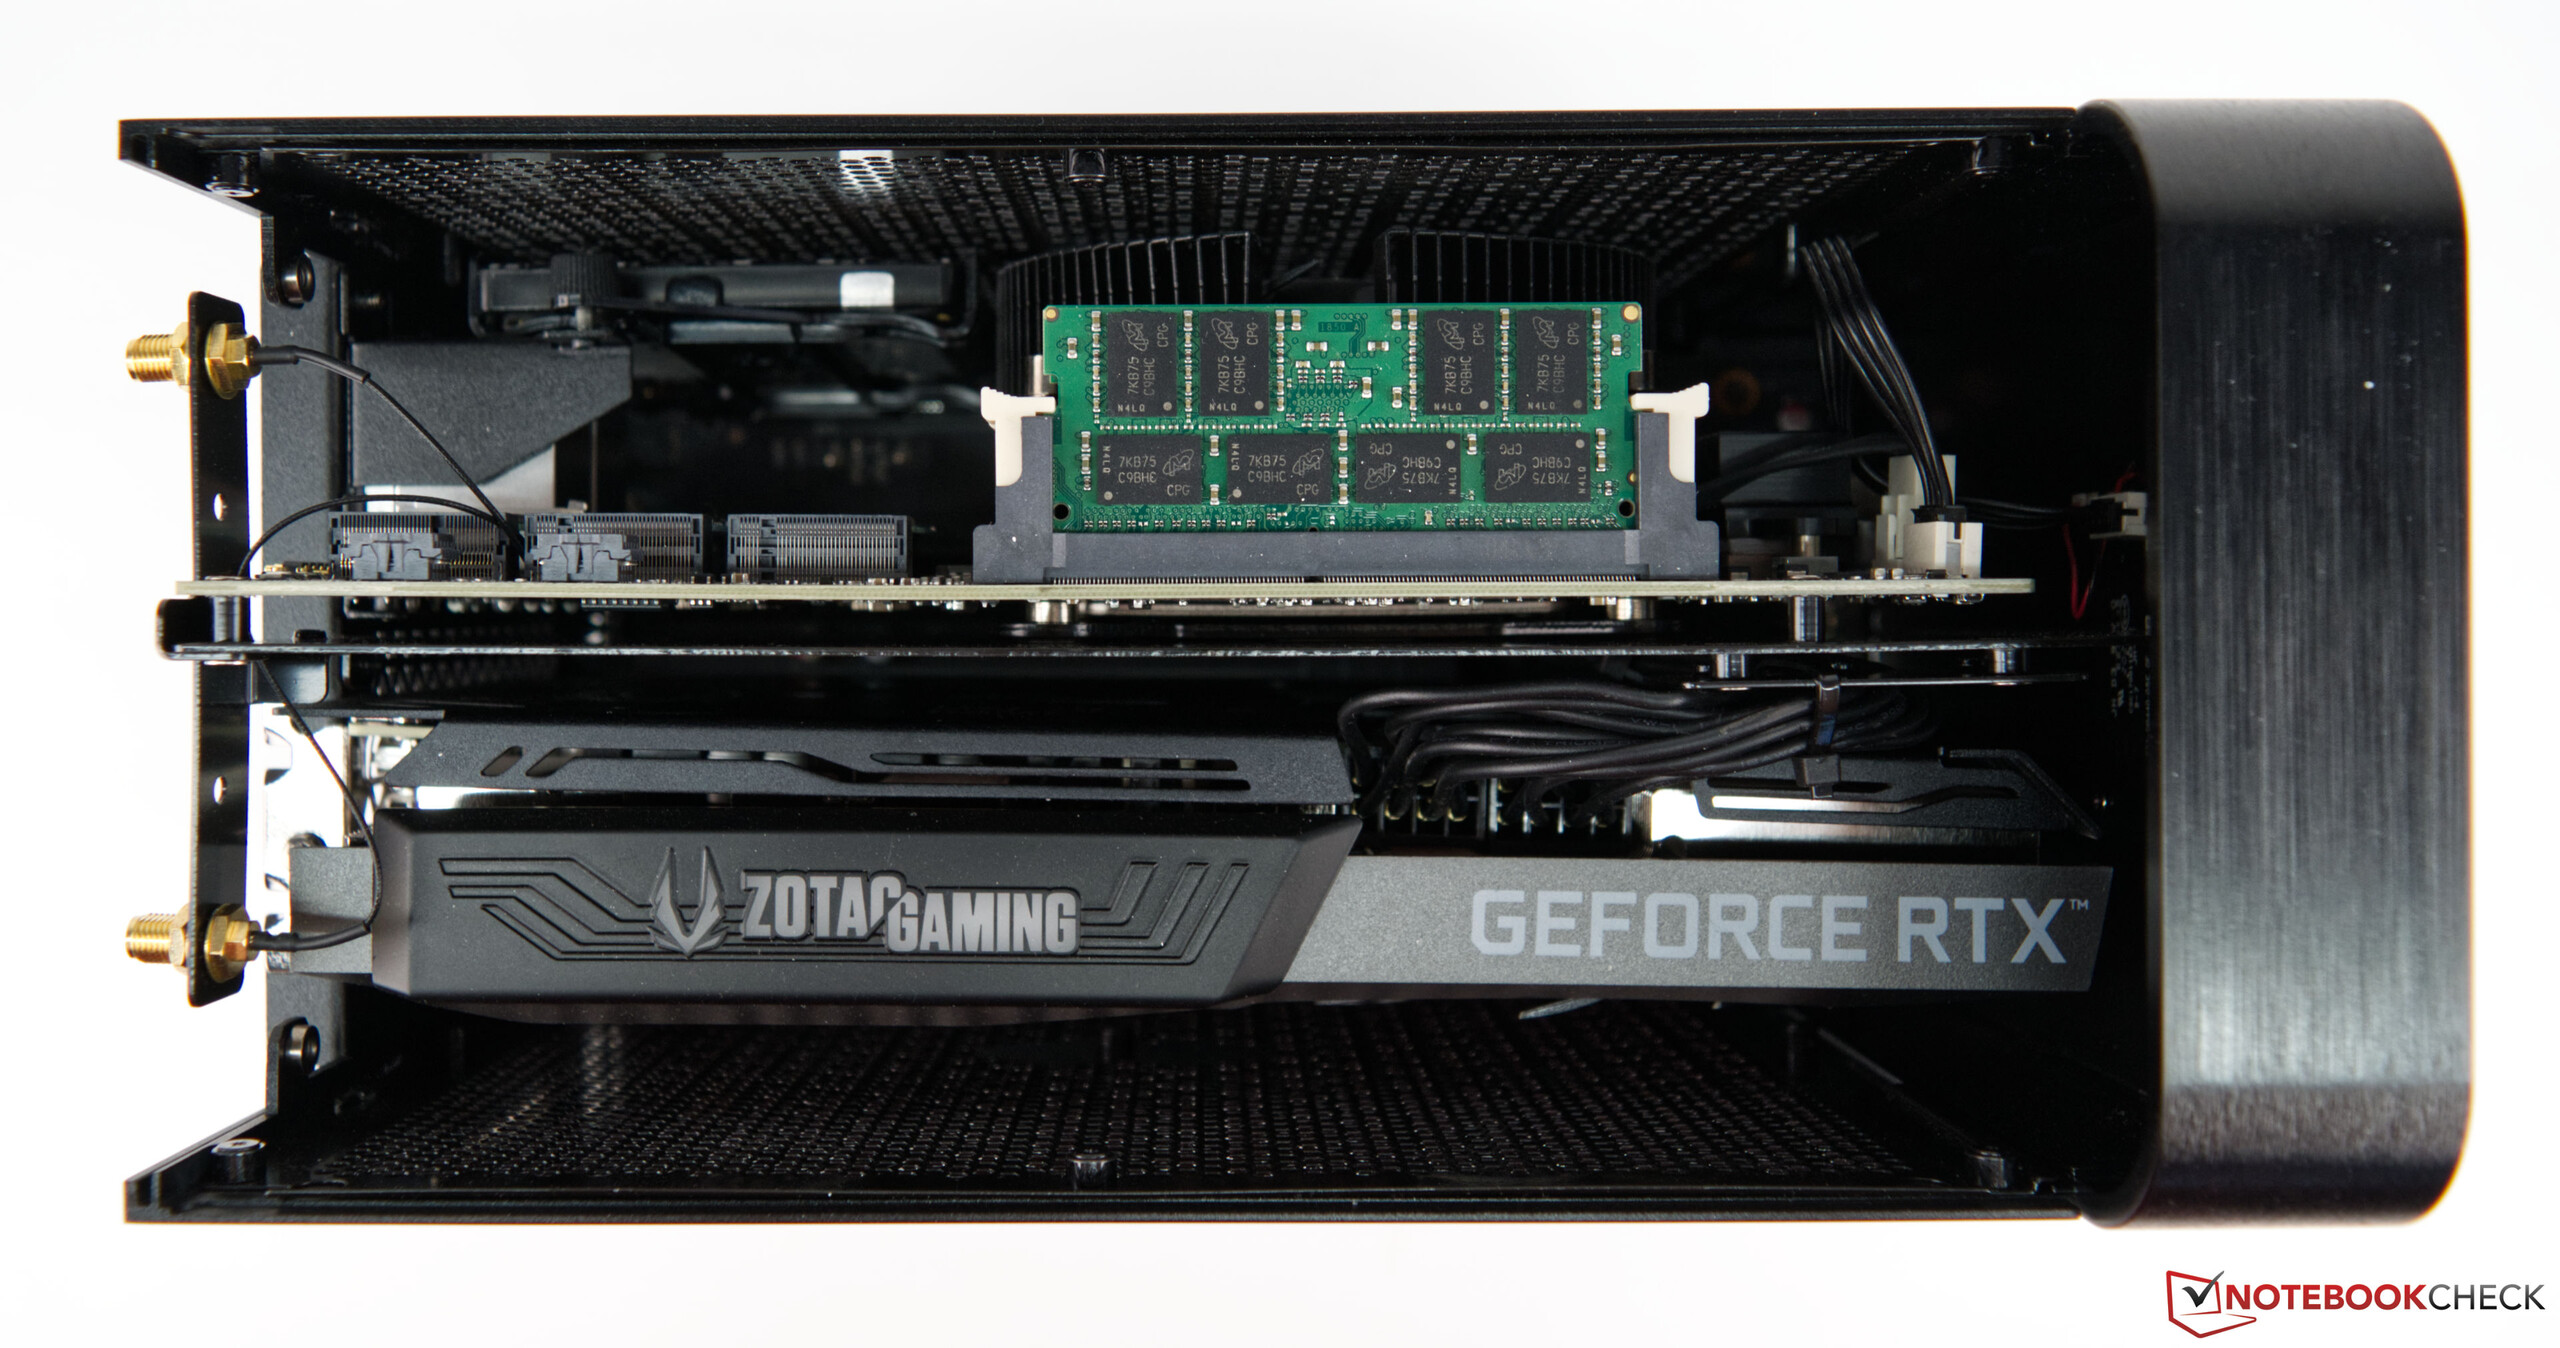
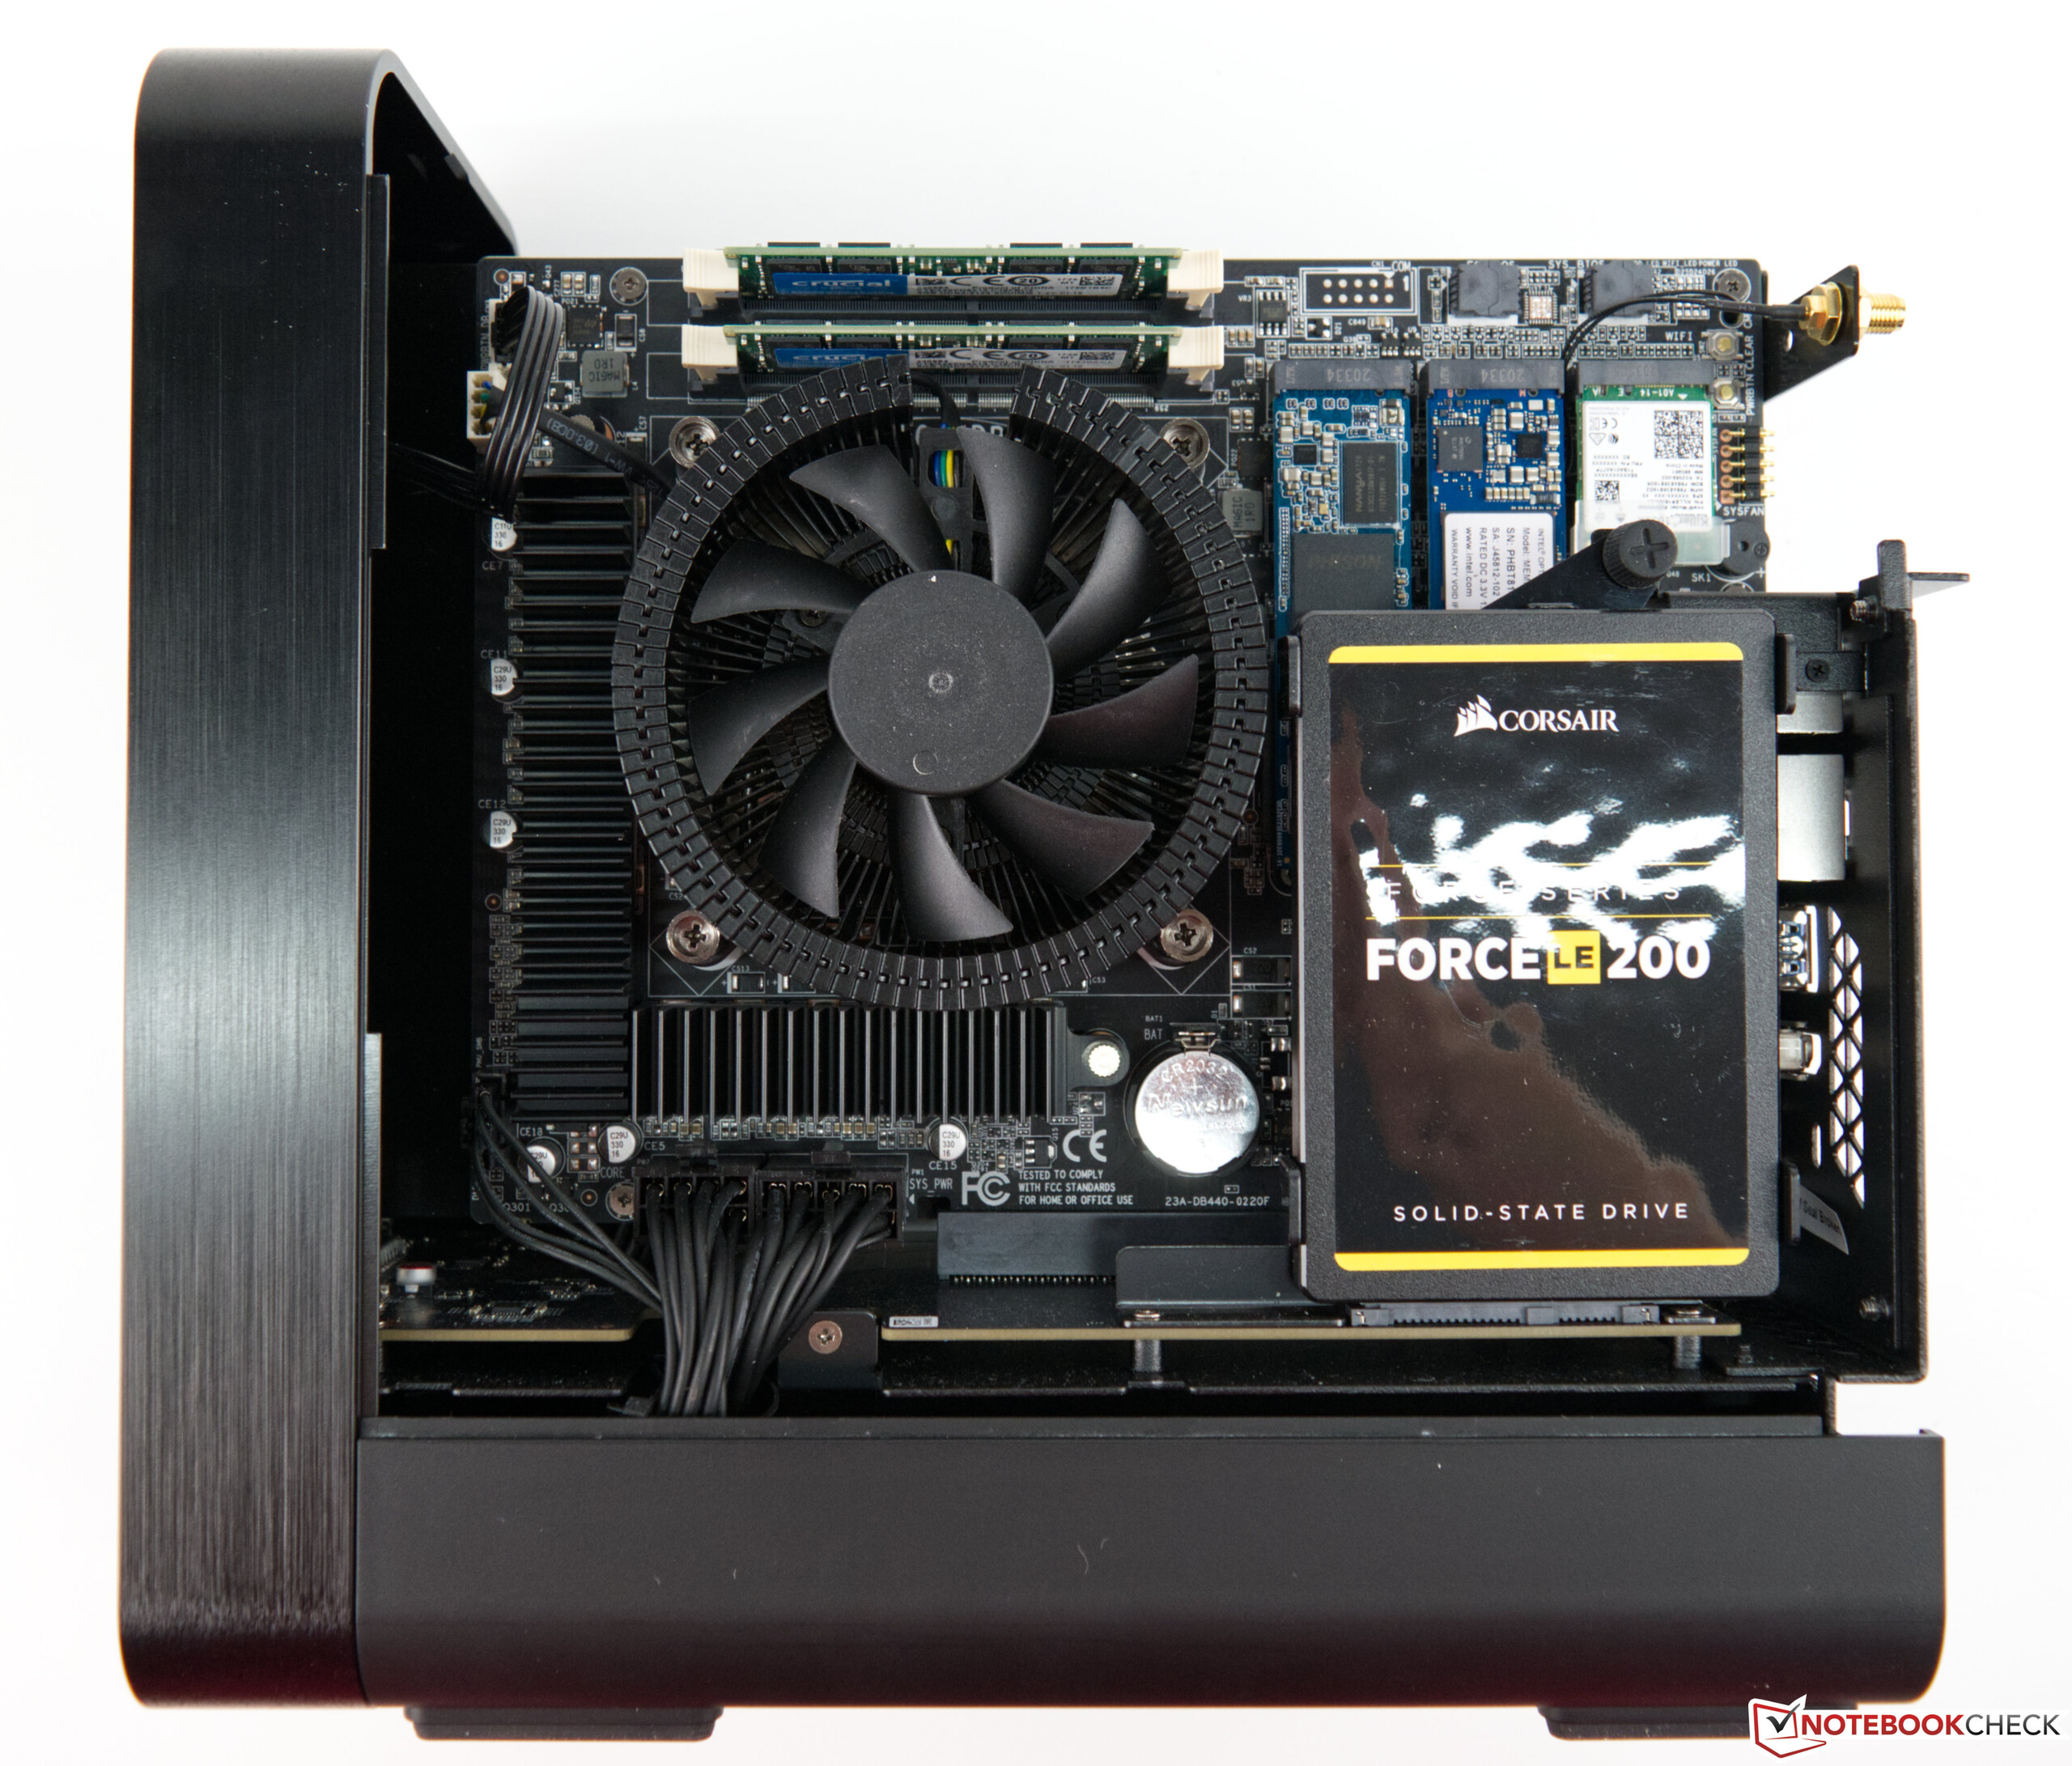
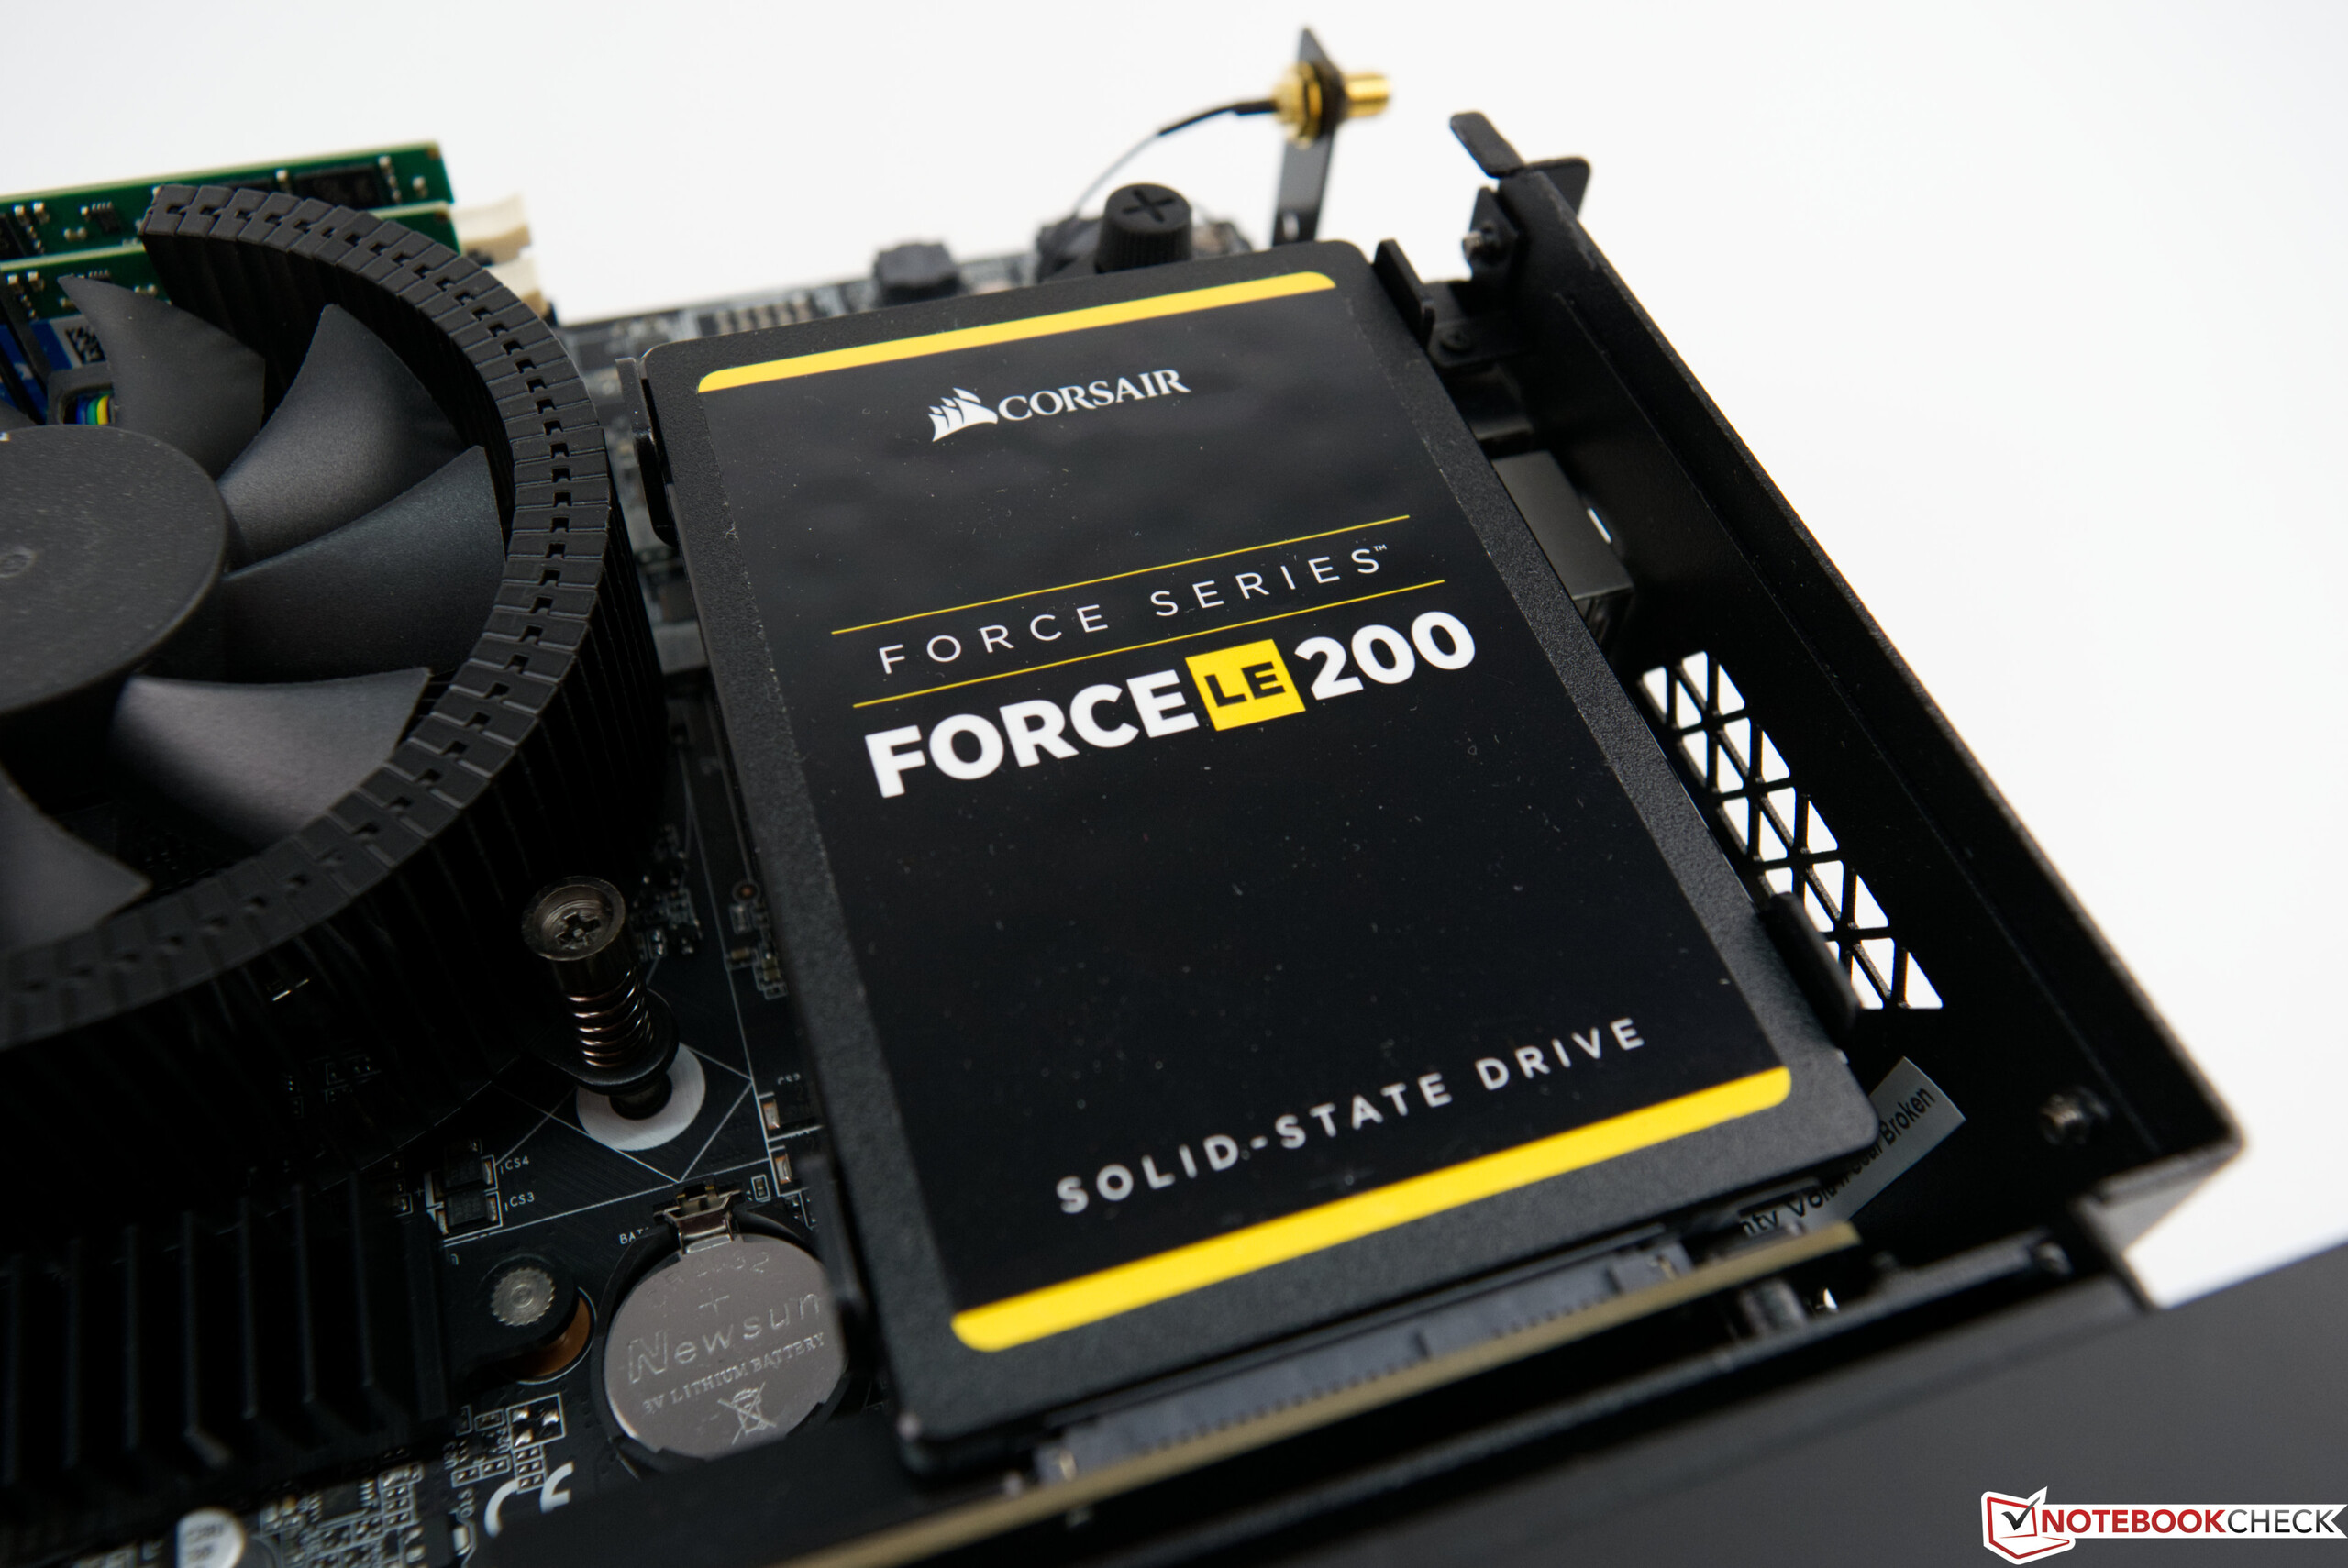
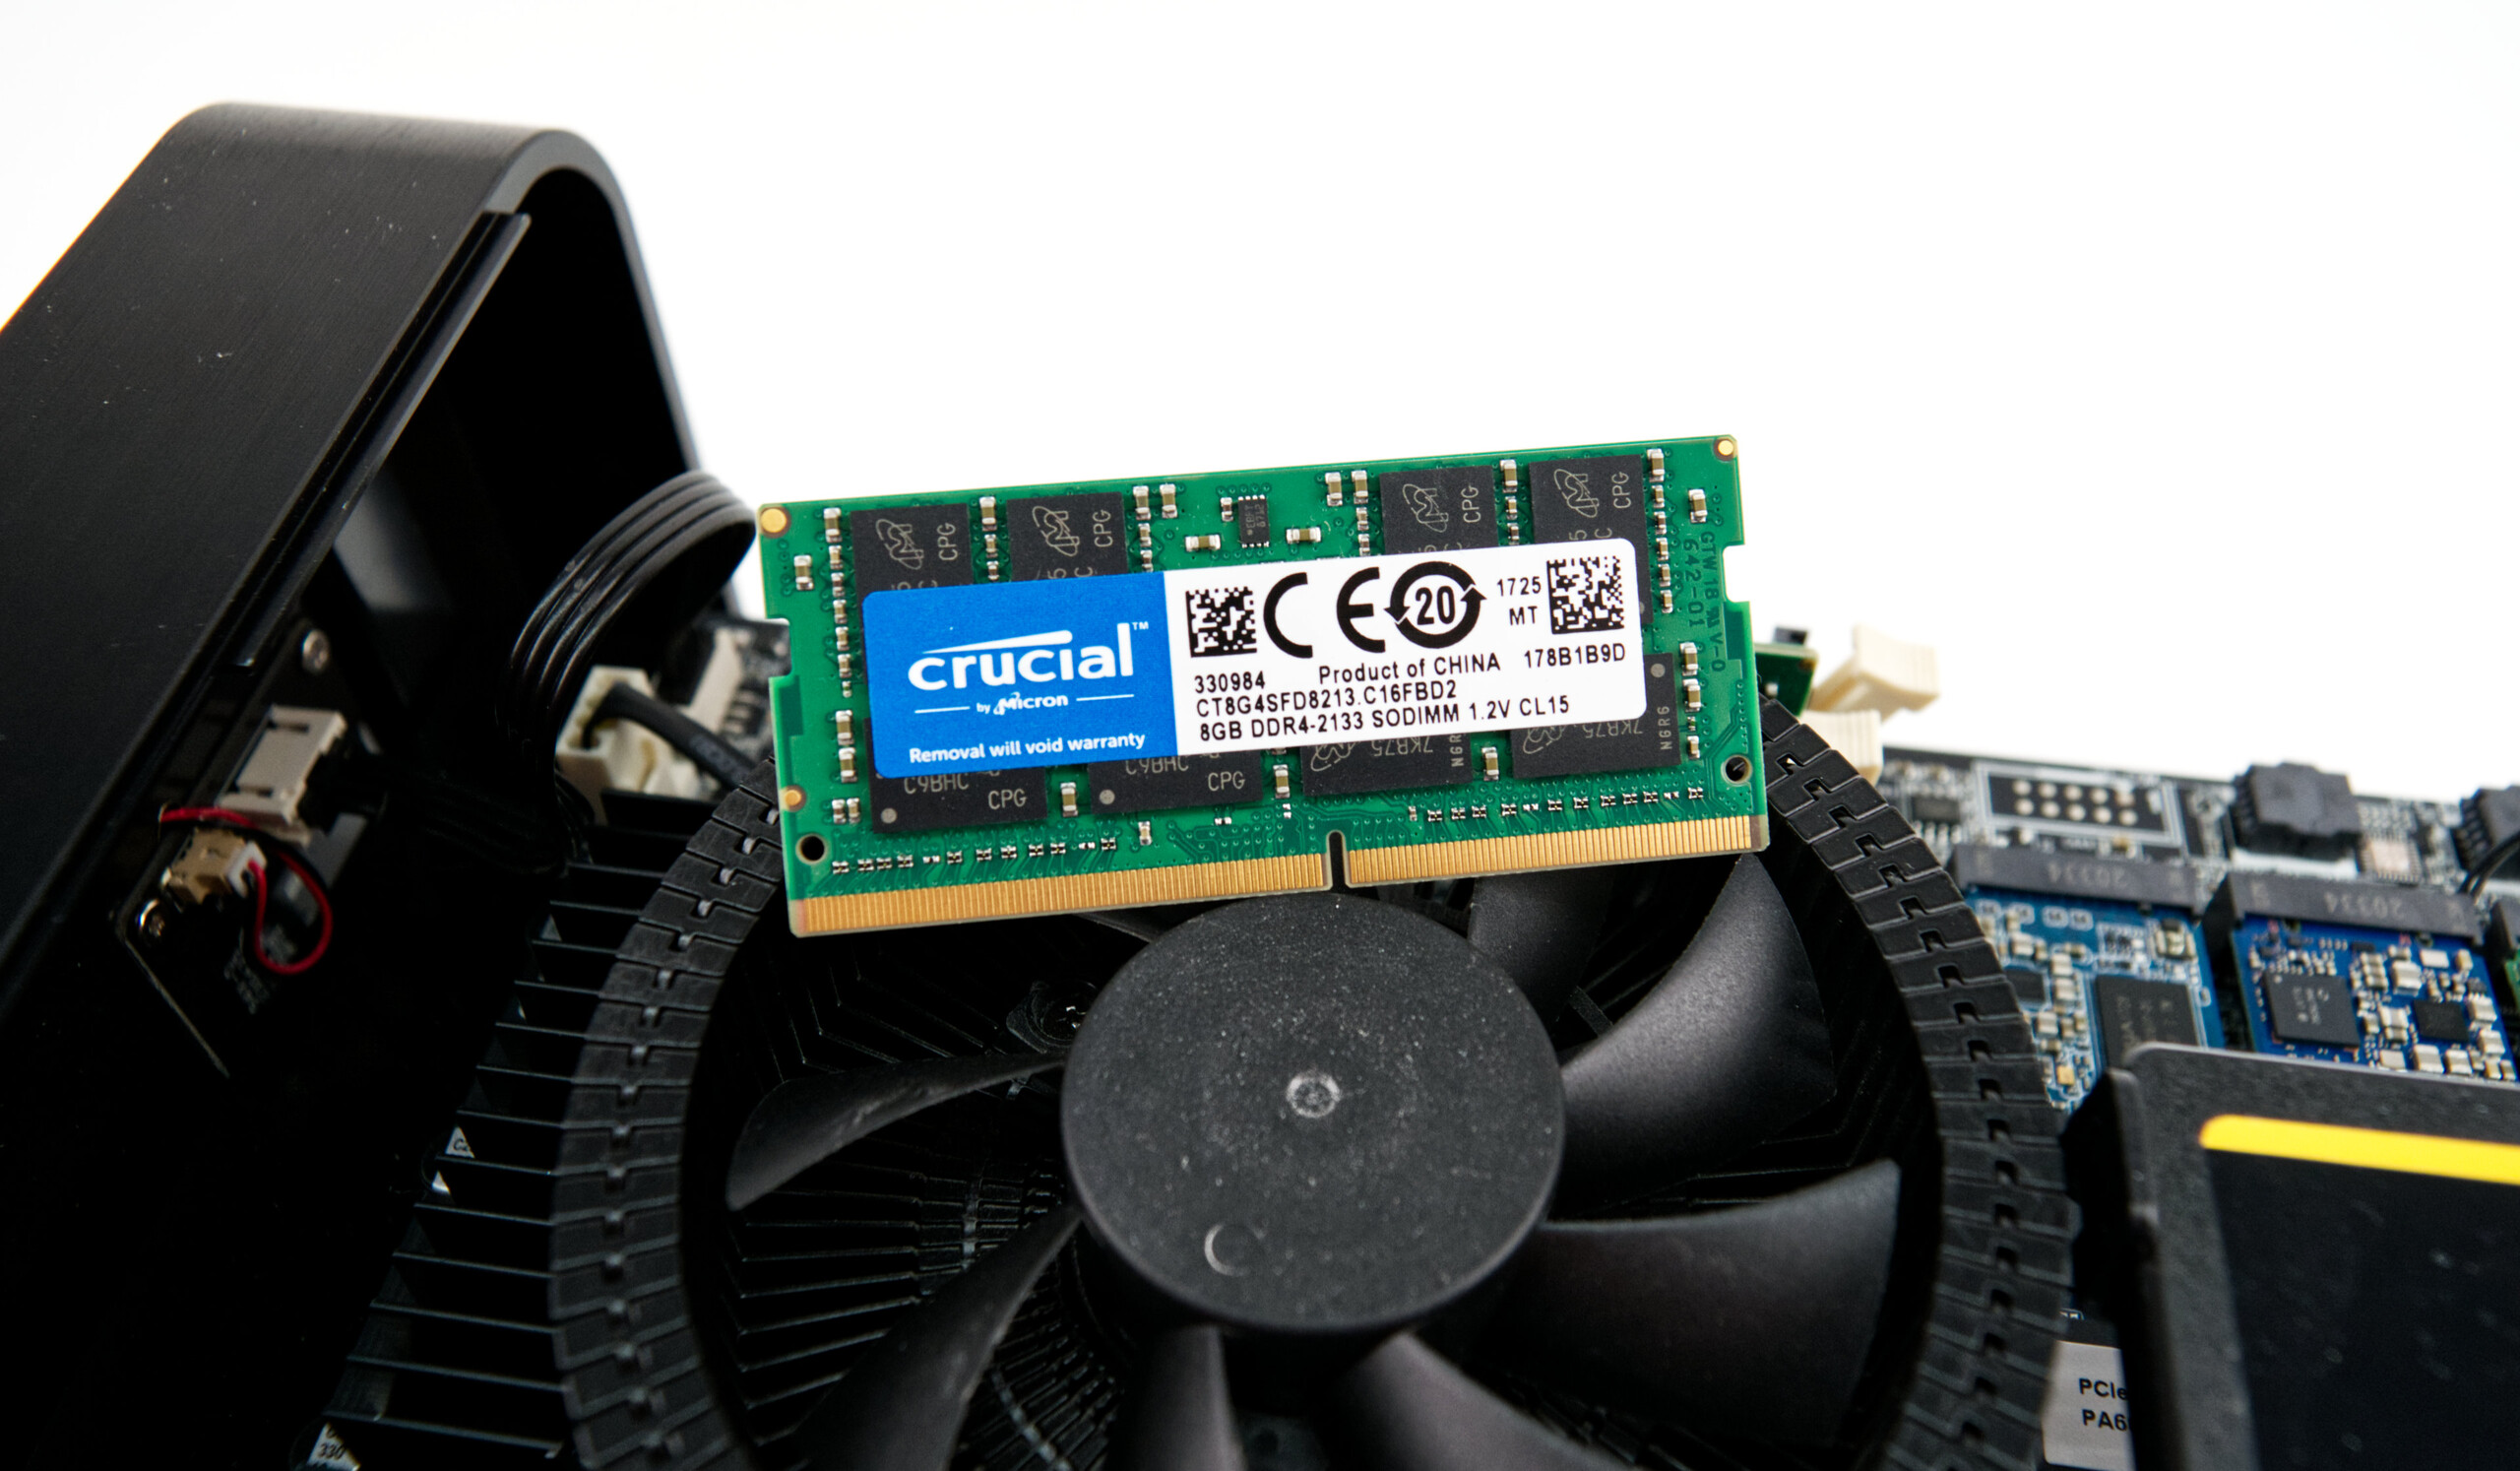
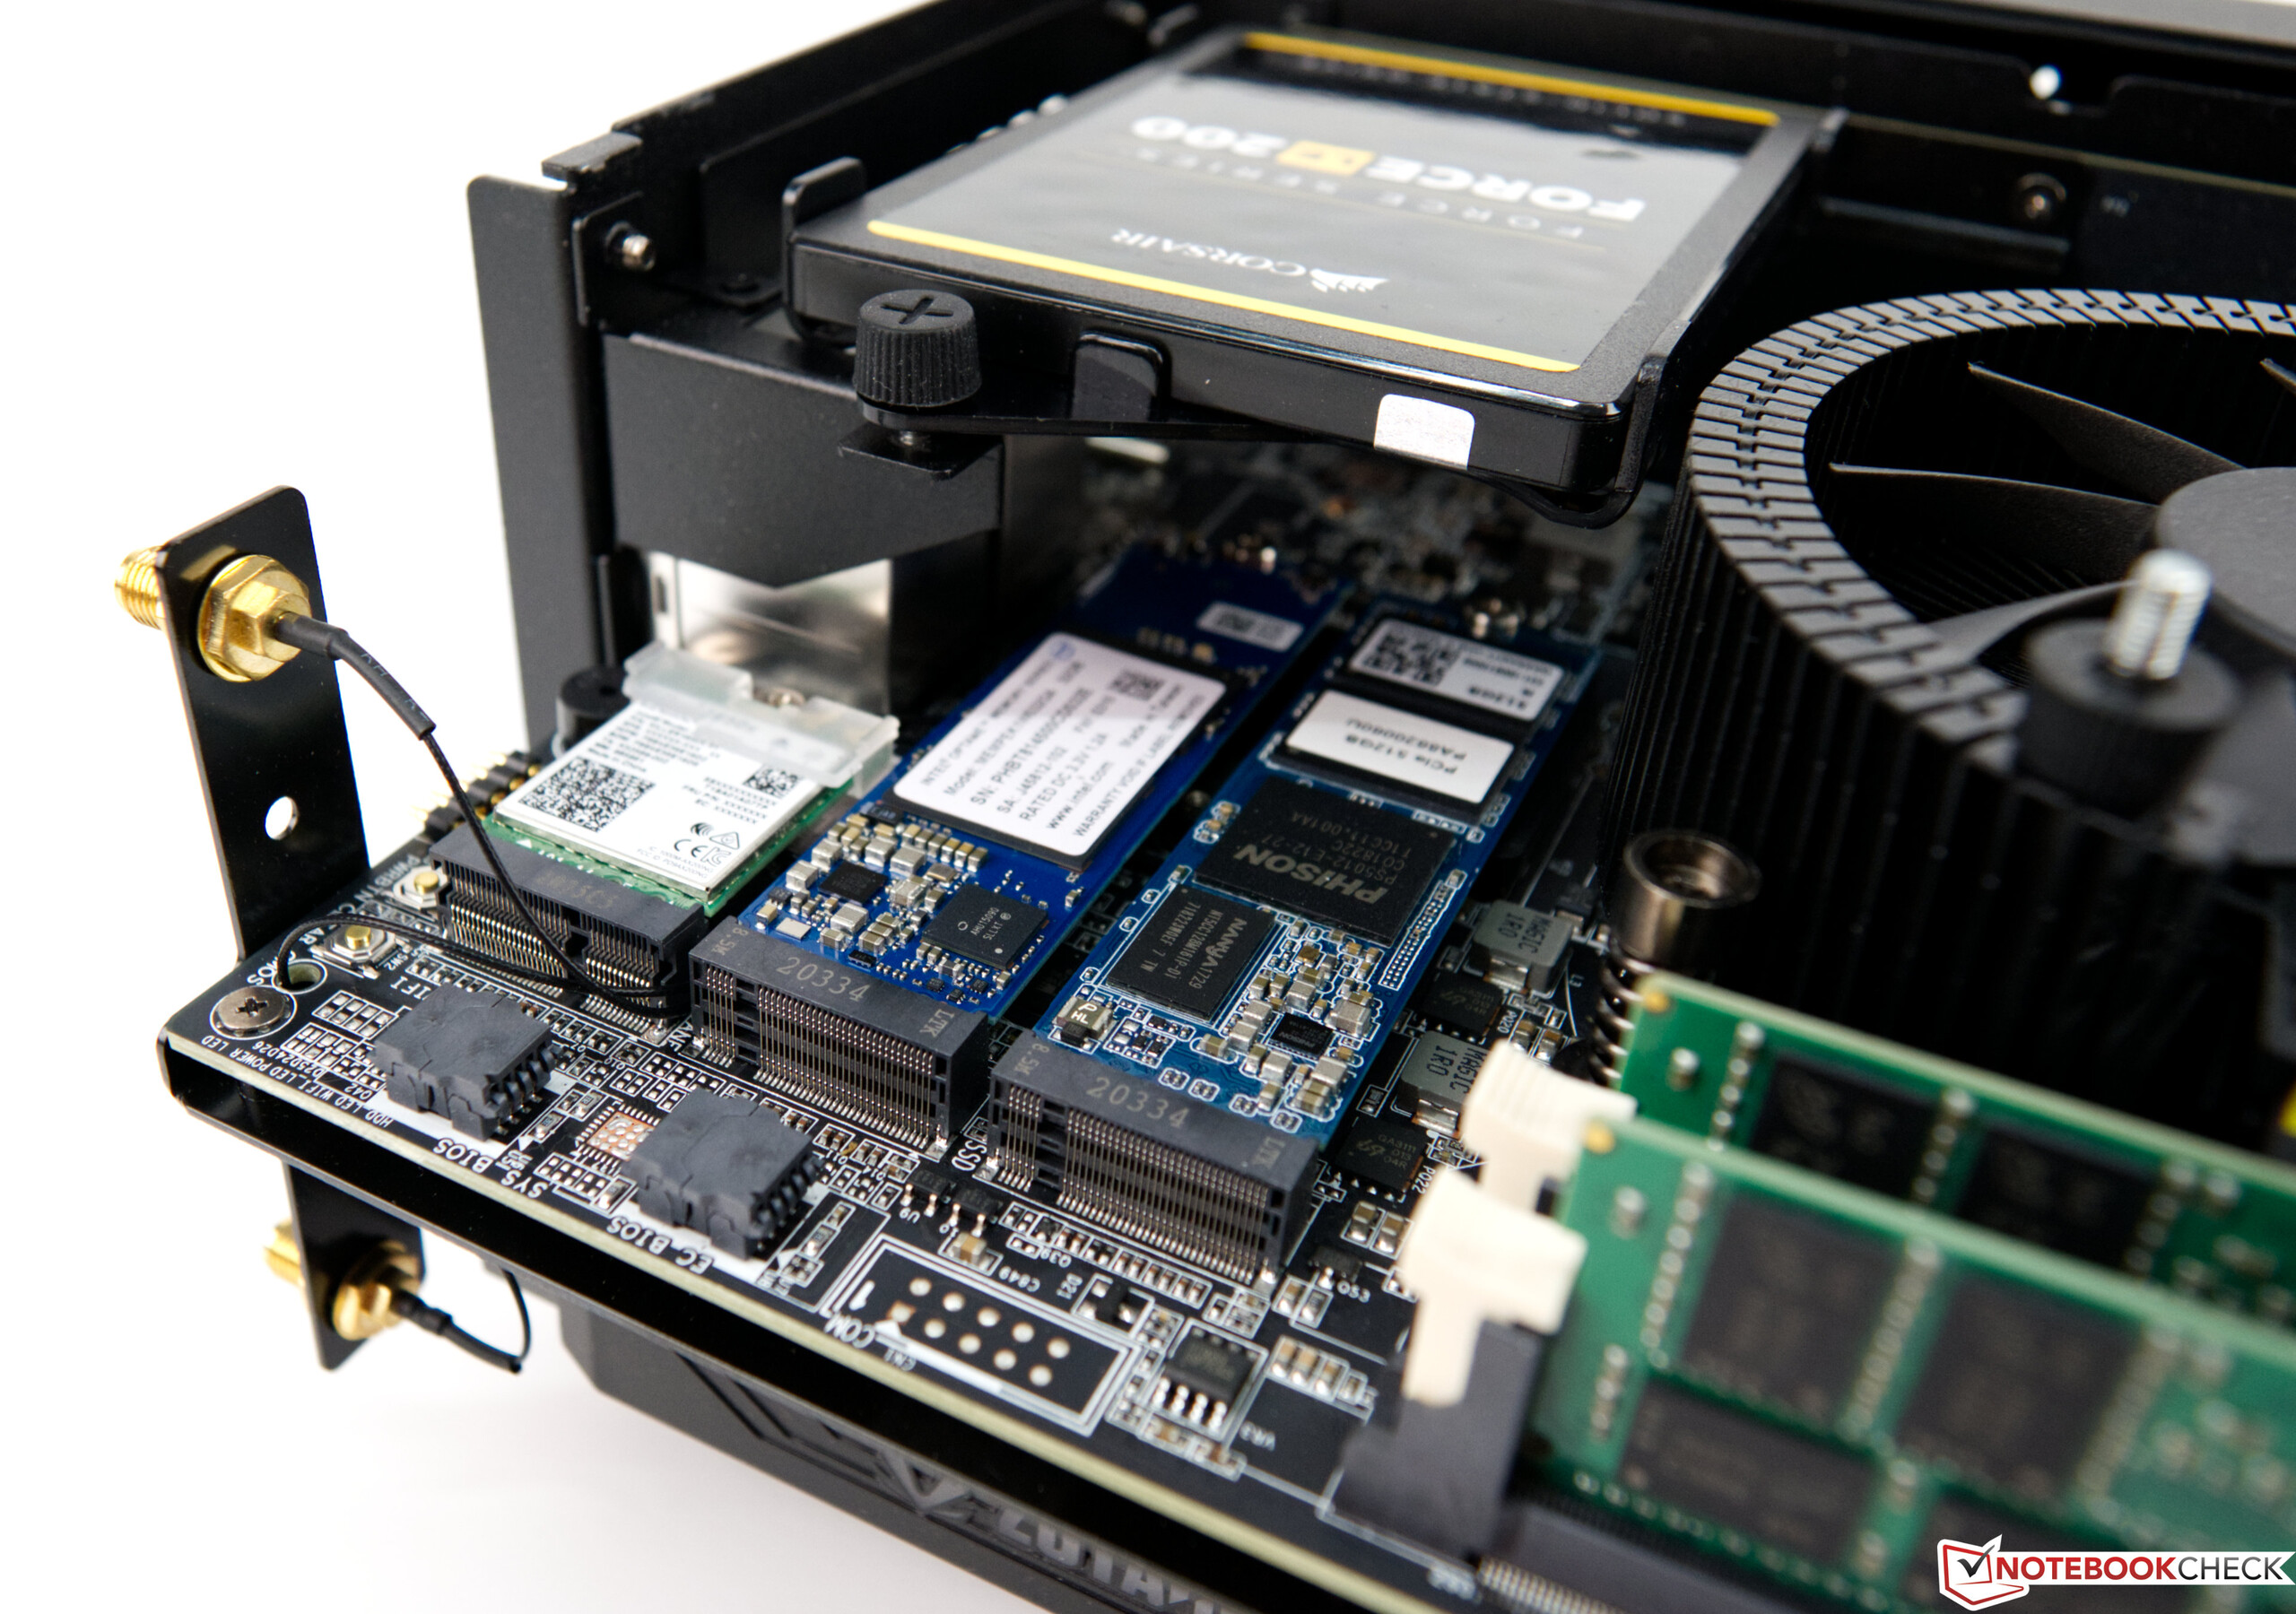
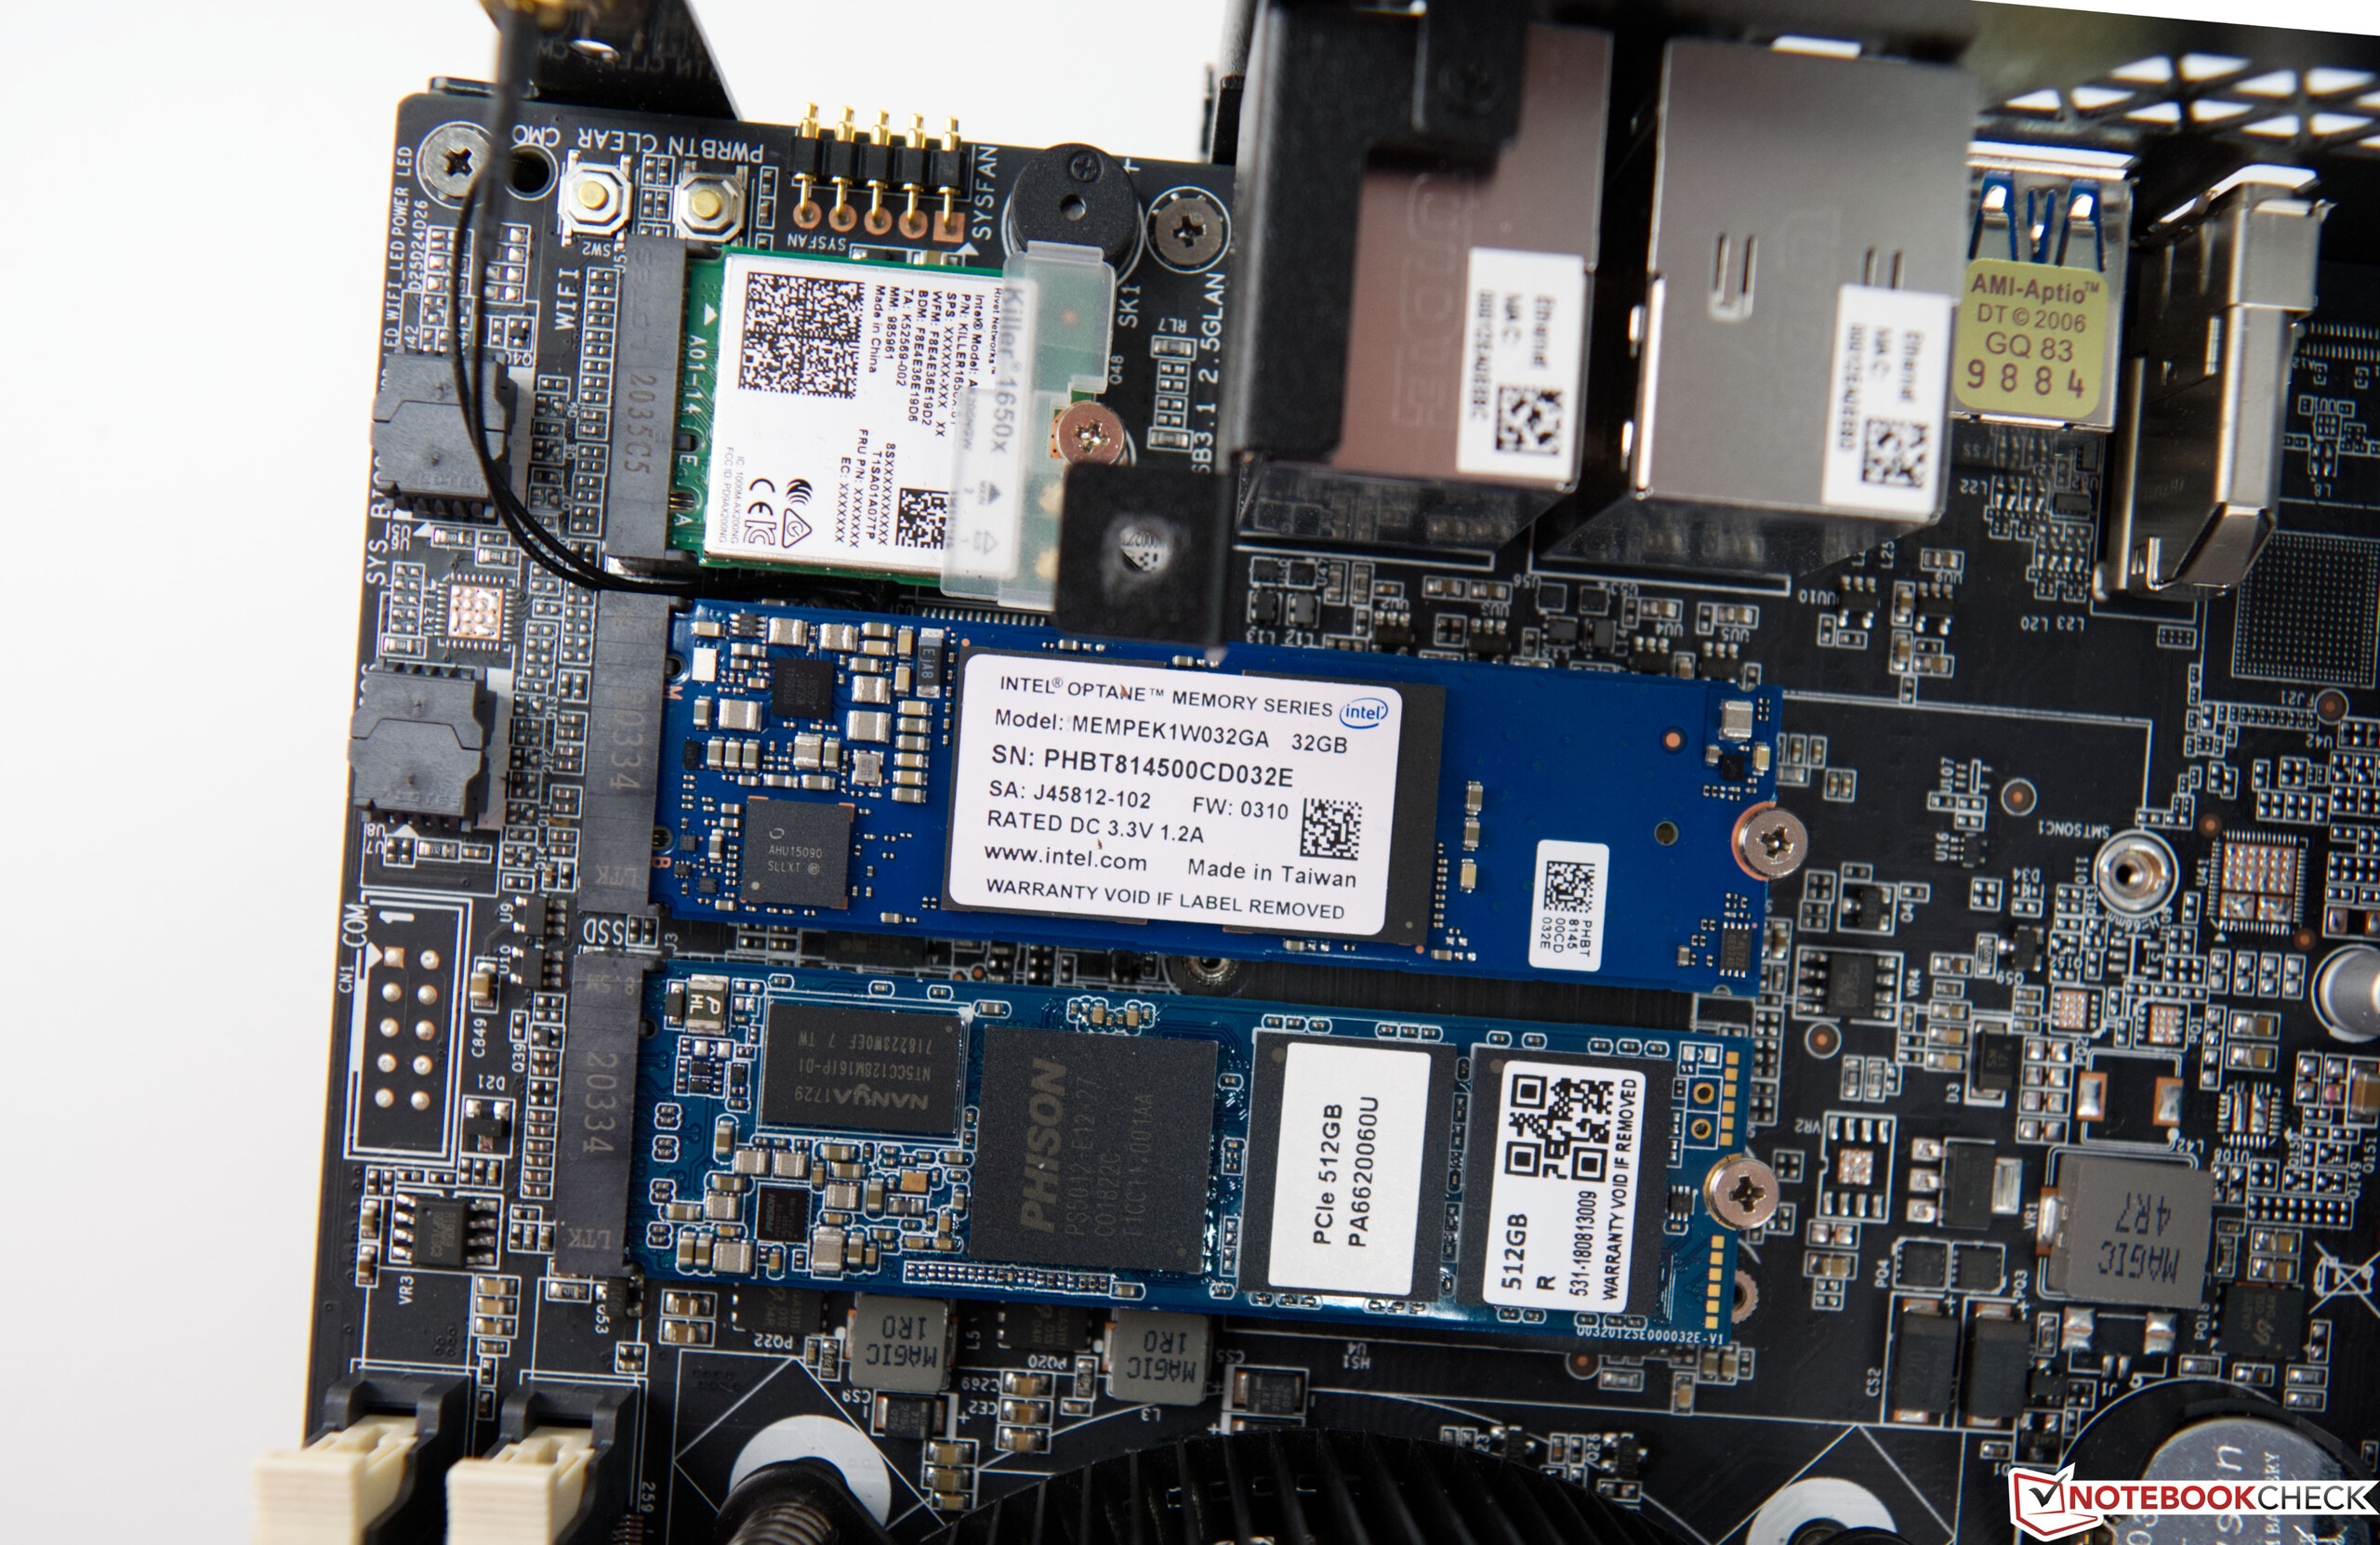
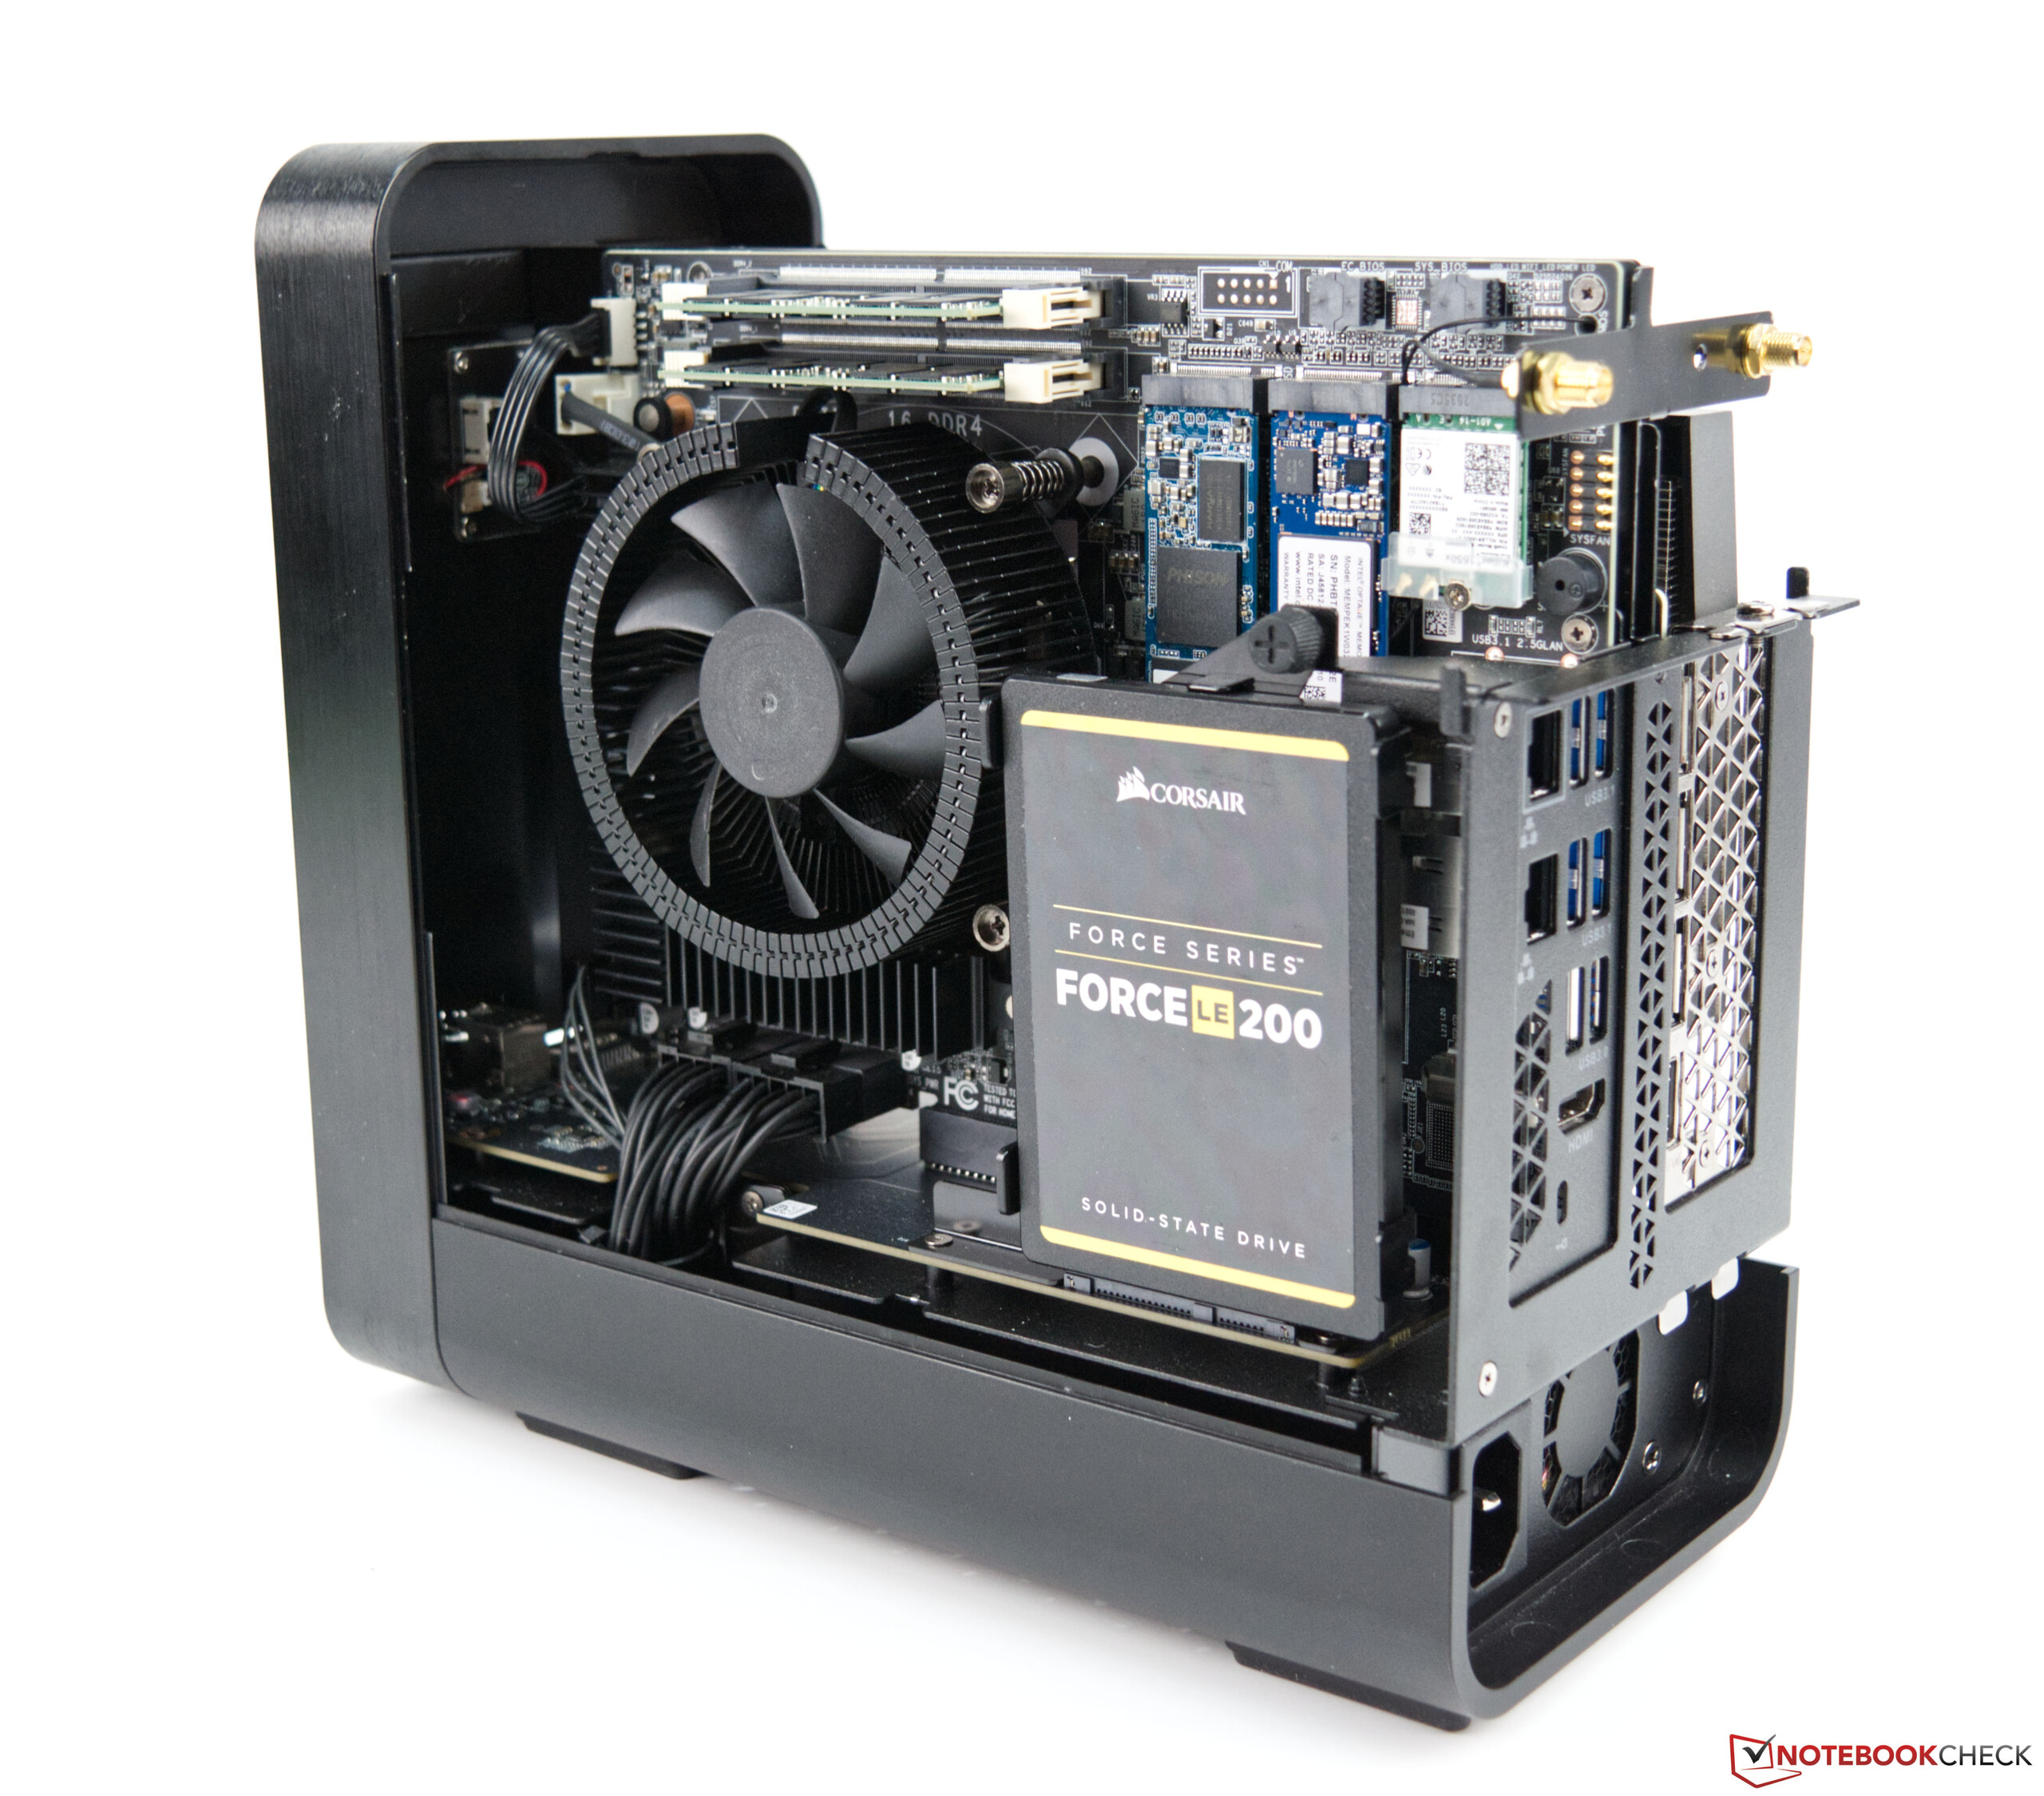
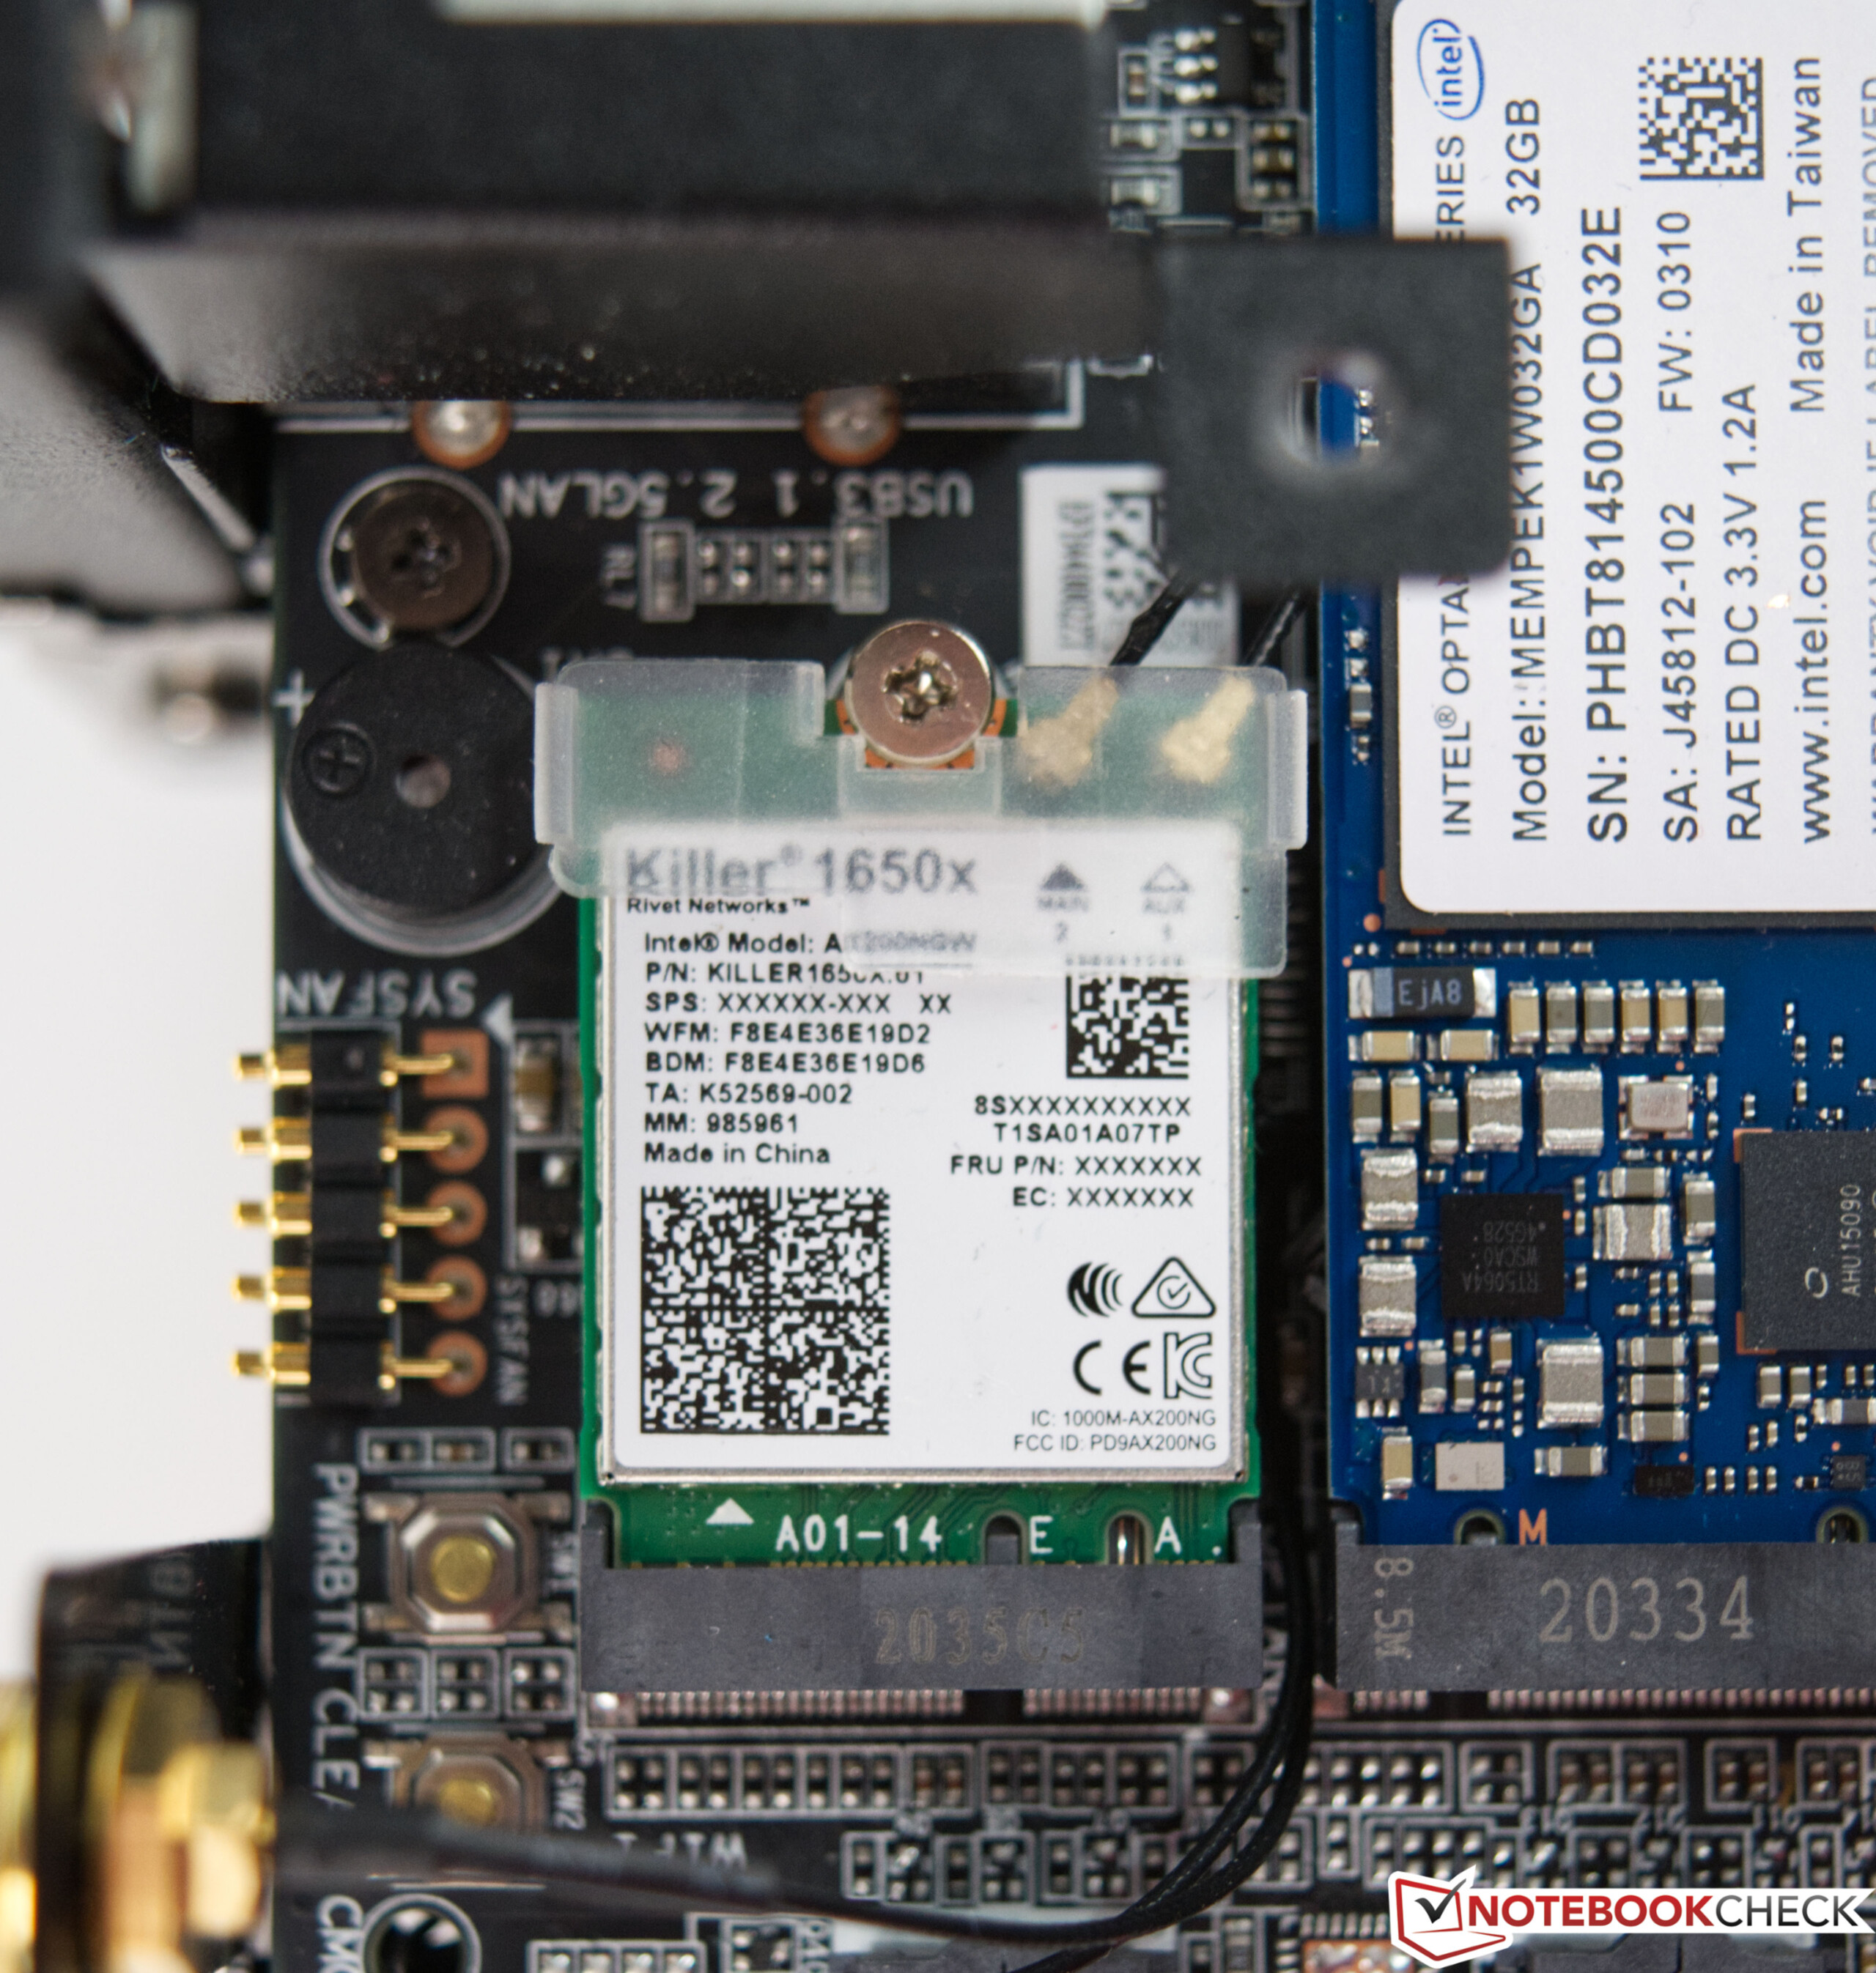
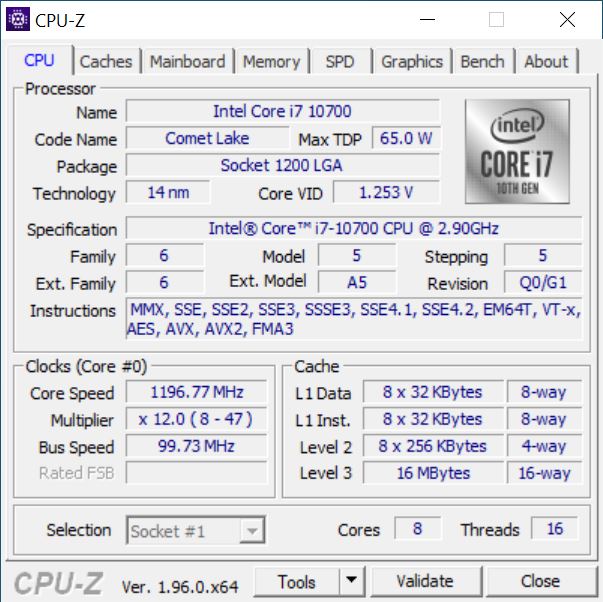
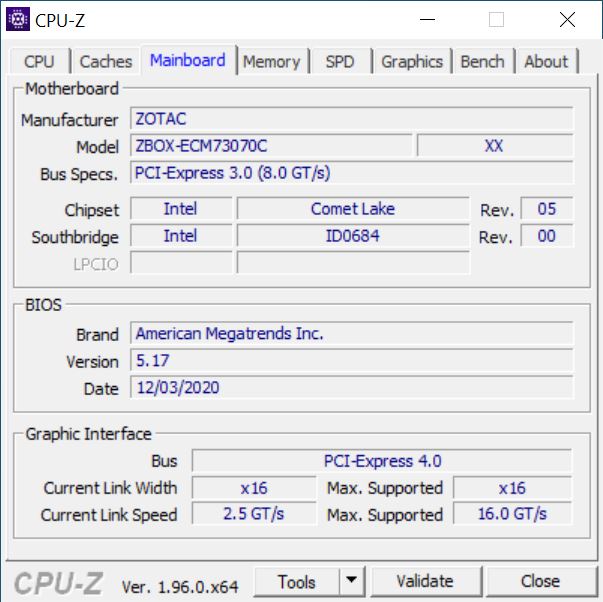
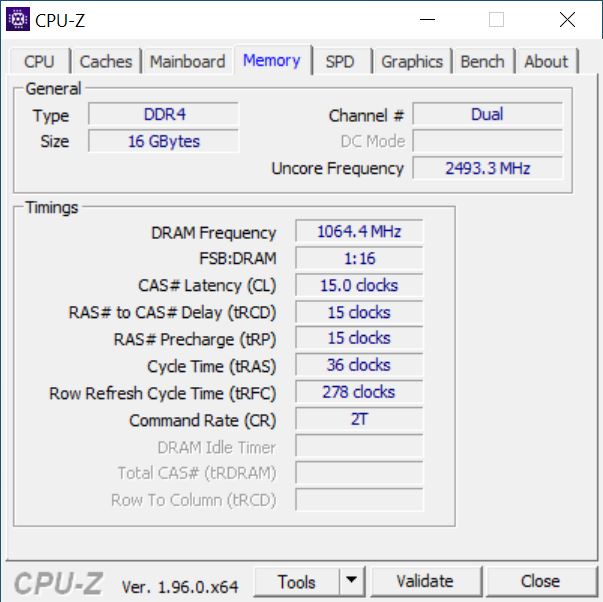
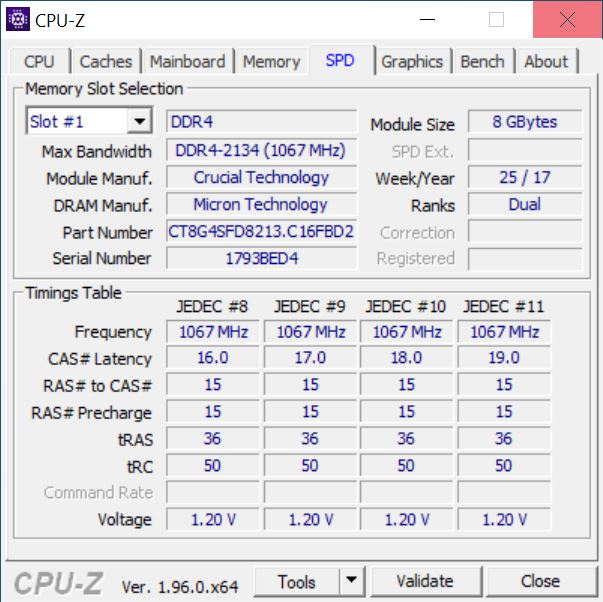
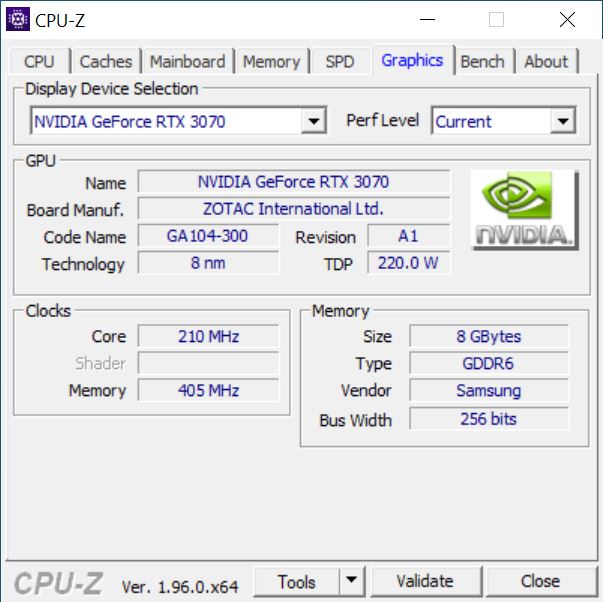
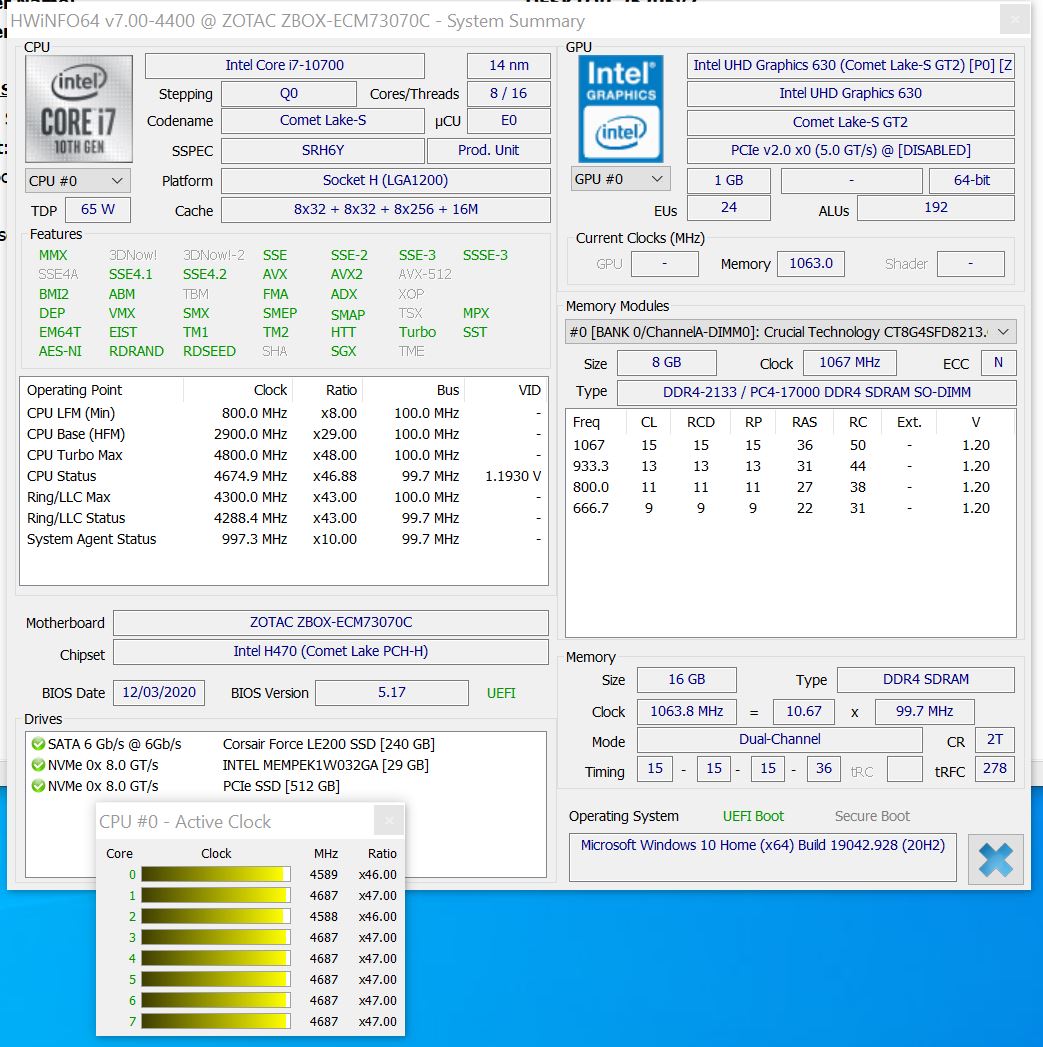
Das sehr kompakte Gehäuse beinhaltet alles, was man für einen vollwertigen Gaming-PC benötigt. Auch das Netzteil befindet sich im Gehäuse und muss nicht, wie beim MEK Mini separat angeschlossen werden. Als Basis dient eine eigens entwickelte Plattform auf Basis des Sockel 1200 von Intel. Mit dem Intel Core i7-10700 bekommt man einen noch halbwegs modernen Prozessor, der seine Arbeit gut verrichtet, denn mit seinen 8 Kernen und 16 Threads lassen sich auch anspruchsvolle Aufgaben bestens meistern. Das 65-Watt-Modell ist eine gute Wahl, denn die Abwärme sollte nicht unterschätzt werden. Zudem ist das System mit einer Zotac GeForce RTX 3070 bestückt. Aufgrund der engen Platzverhältnisse hat sich Zotac dazu entschieden, beim Arbeitsspeicher auf ein SO-DIMM-Module zu setzen, die meistens in Notebooks zu finden sind. Beim Massenspeicher kann man zwischen einer herkömmlichen 2,5-Zoll-Variante oder einer M.2-Variante wählen. Eine Kombination aus beiden ist allerdings auch möglich. Die Steckplätze behindern sich nicht gegenseitig.
Zotac hat uns den Magnus One mit 16-GB-DDR4 und SSDs mit insgesamt 750 GB Speicherplatz zur Verfügung gestellt. Das Barebone System mit der GeForce RTX 3070 wird von Zotac offiziell mit einer UVP von 1.499 Euro angeboten. Gleichwohl sind verfügbare Modelle zum Testzeitpunkt aber deutlich über der UVP (ab 1.650 Euro) gelistet, welches mit der geringen Verfügbarkeit der Grafikkarten zusammenhängt.
Prozessor Benchmarks
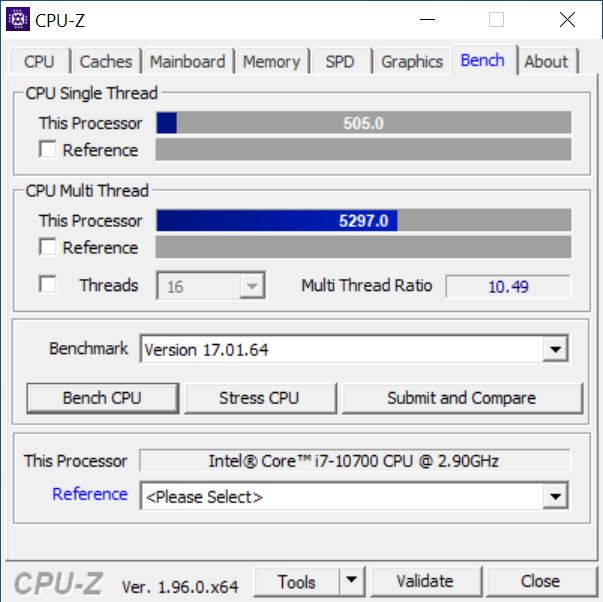
Beim Intel Core i7-10700 handelt es sich um einen 8-Kern-Prozessor mit einer TDP von 65 Watt. Der Basistakt beträgt 2,9 GHz und der maximale Boost ist mit 4,8 GHz angegeben. In dem Zotac Magnus One erreicht der Core i7-10700 ein solides Ergebnis, was aufgrund der Kompaktheit nicht mehr zulässt. Dennoch schlägt sich das System gut und kann bei den Multi-Thread-Tests den Intel Core i7-9700K weitestgehend hinter sich lassen. Bei den Single-Core-Tests liegt der Intel Core i7-10700 in unserem Testsystem etwas auf dem gleichen Level wie der Intel Core i5-10600K.
Für weitere Vergleiche und Benchmarks verweisen wir hier auf unsere CPU-Vergleichstabelle.
| Cinebench R20 | |
| CPU (Single Core) | |
| AMD Ryzen 7 5800X, AMD Ryzen 7 5800X | |
| AMD Ryzen 5 5600X, AMD Ryzen 5 5600X | |
| Intel Core i9-10900K, Intel Core i9-10900K | |
| Corsair One i160, Intel Core i9-9900K | |
| Intel Core i7-9700K, AMD Radeon RX Vega 64, Intel Core i7-9700K | |
| Intel Core i5-10600K, Intel Core i5-10600K | |
| Intel Core i5-10400F, Intel Core i5-10400F | |
| CPU (Multi Core) | |
| Intel Core i9-10900K, Intel Core i9-10900K | |
| AMD Ryzen 7 5800X, AMD Ryzen 7 5800X | |
| Corsair One i160, Intel Core i9-9900K | |
| AMD Ryzen 5 5600X, AMD Ryzen 5 5600X | |
| Intel Core i5-10600K, Intel Core i5-10600K | |
| Intel Core i7-9700K, AMD Radeon RX Vega 64, Intel Core i7-9700K | |
| Intel Core i5-10400F, Intel Core i5-10400F | |
| Cinebench R10 | |
| Rendering Single CPUs 64Bit | |
| AMD Ryzen 7 5800X, AMD Ryzen 7 5800X | |
| AMD Ryzen 5 5600X, AMD Ryzen 5 5600X | |
| Intel Core i9-10900K, Intel Core i9-10900K | |
| Corsair One i160, Intel Core i9-9900K | |
| Zotac Magnus One (ECM73070C), Intel Core i7-10700 | |
| Intel Core i7-9700K, AMD Radeon RX Vega 64, Intel Core i7-9700K | |
| Intel Core i5-10600K, Intel Core i5-10600K | |
| Intel Core i5-10400F, Intel Core i5-10400F | |
| Rendering Multiple CPUs 64Bit | |
| AMD Ryzen 7 5800X, AMD Ryzen 7 5800X | |
| Intel Core i9-10900K, Intel Core i9-10900K | |
| AMD Ryzen 5 5600X, AMD Ryzen 5 5600X | |
| Corsair One i160, Intel Core i9-9900K | |
| Intel Core i7-9700K, AMD Radeon RX Vega 64, Intel Core i7-9700K | |
| Zotac Magnus One (ECM73070C), Intel Core i7-10700 | |
| Intel Core i5-10600K, Intel Core i5-10600K | |
| Intel Core i5-10400F, Intel Core i5-10400F | |
| Geekbench 5.5 | |
| Multi-Core | |
| Intel Core i9-10900K, Intel Core i9-10900K | |
| AMD Ryzen 7 5800X, AMD Ryzen 7 5800X | |
| AMD Ryzen 5 5600X, AMD Ryzen 5 5600X | |
| Zotac Magnus One (ECM73070C), Intel Core i7-10700 | |
| Intel Core i7-9700K, AMD Radeon RX Vega 64, Intel Core i7-9700K | |
| Intel Core i5-10600K, Intel Core i5-10600K | |
| Intel Core i5-10400F, Intel Core i5-10400F | |
| Intel Core i5-10400F, Intel Core i5-10400F | |
| Intel Core i3-10100, Intel Core i3-10100 | |
| Single-Core | |
| AMD Ryzen 7 5800X, AMD Ryzen 7 5800X | |
| AMD Ryzen 5 5600X, AMD Ryzen 5 5600X | |
| Intel Core i9-10900K, Intel Core i9-10900K | |
| Intel Core i7-9700K, AMD Radeon RX Vega 64, Intel Core i7-9700K | |
| Zotac Magnus One (ECM73070C), Intel Core i7-10700 | |
| Intel Core i5-10600K, Intel Core i5-10600K | |
| Intel Core i5-10400F, Intel Core i5-10400F | |
| Intel Core i5-10400F, Intel Core i5-10400F | |
| Intel Core i3-10100, Intel Core i3-10100 | |
| Geekbench 5.0 | |
| 5.0 Multi-Core | |
| Intel Core i9-10900K, Intel Core i9-10900K | |
| AMD Ryzen 7 5800X, AMD Ryzen 7 5800X | |
| AMD Ryzen 5 5600X, AMD Ryzen 5 5600X | |
| Zotac Magnus One (ECM73070C), Intel Core i7-10700 | |
| Intel Core i5-10600K, Intel Core i5-10600K | |
| Intel Core i5-10400F, Intel Core i5-10400F | |
| Intel Core i3-10100, Intel Core i3-10100 | |
| 5.0 Single-Core | |
| AMD Ryzen 7 5800X, AMD Ryzen 7 5800X | |
| AMD Ryzen 5 5600X, AMD Ryzen 5 5600X | |
| Intel Core i9-10900K, Intel Core i9-10900K | |
| Zotac Magnus One (ECM73070C), Intel Core i7-10700 | |
| Intel Core i5-10600K, Intel Core i5-10600K | |
| Intel Core i5-10400F, Intel Core i5-10400F | |
| Intel Core i3-10100, Intel Core i3-10100 | |
| 3DMark 11 - 1280x720 Performance Physics | |
| AMD Ryzen 7 5800X, AMD Ryzen 7 5800X | |
| Intel Core i9-10900K, Intel Core i9-10900K | |
| AMD Ryzen 5 5600X, AMD Ryzen 5 5600X | |
| Corsair One i160, Intel Core i9-9900K | |
| Intel Core i7-9700K, AMD Radeon RX Vega 64, Intel Core i7-9700K | |
| Intel Core i5-10600K, Intel Core i5-10600K | |
| Zotac Magnus One (ECM73070C), Intel Core i7-10700 | |
| Intel Core i5-10400F, Intel Core i5-10400F | |
| R Benchmark 2.5 - Overall mean | |
| Intel Core i3-10100, Intel Core i3-10100 | |
| Intel Core i5-10400F, Intel Core i5-10400F | |
| Intel Core i5-10600K, Intel Core i5-10600K | |
| Zotac Magnus One (ECM73070C), Intel Core i7-10700 | |
| Intel Core i9-10900K, Intel Core i9-10900K | |
| AMD Ryzen 5 5600X, AMD Ryzen 5 5600X | |
| AMD Ryzen 7 5800X, AMD Ryzen 7 5800X | |
| LibreOffice - 20 Documents To PDF | |
| Intel Core i9-10900K, Intel Core i9-10900K | |
| Zotac Magnus One (ECM73070C), Intel Core i7-10700 | |
| Intel Core i3-10100, Intel Core i3-10100 | |
| Intel Core i5-10400F, Intel Core i5-10400F | |
| Intel Core i5-10600K, Intel Core i5-10600K | |
| AMD Ryzen 5 5600X, AMD Ryzen 5 5600X | |
| AMD Ryzen 7 5800X, AMD Ryzen 7 5800X | |
| WebXPRT 3 - Overall | |
| AMD Ryzen 7 5800X, AMD Ryzen 7 5800X | |
| AMD Ryzen 5 5600X, AMD Ryzen 5 5600X | |
| Intel Core i9-10900K, Intel Core i9-10900K | |
| Zotac Magnus One (ECM73070C), Intel Core i7-10700 | |
| Intel Core i5-10600K, Intel Core i5-10600K | |
| Intel Core i5-10400F, Intel Core i5-10400F | |
| Intel Core i3-10100, Intel Core i3-10100 | |
| Mozilla Kraken 1.1 - Total | |
| Intel Core i5-10400F, Intel Core i5-10400F | |
| Intel Core i3-10100, Intel Core i3-10100 | |
| Intel Core i5-10600K, Intel Core i5-10600K | |
| Zotac Magnus One (ECM73070C), Intel Core i7-10700 | |
| Intel Core i9-10900K, Intel Core i9-10900K | |
| AMD Ryzen 5 5600X, AMD Ryzen 5 5600X | |
| AMD Ryzen 7 5800X, AMD Ryzen 7 5800X | |
* ... kleinere Werte sind besser
Zotac Magnus One in der Cinebench-R15-Multi-Schleife
Der Intel Core i7-10700 verzeichnet nach dem ersten Durchlauf einen leichten Leistungseinbruch, der sich aber im weiteren Verlauf zunehmend stabilisiert. Dennoch ist die Leistung mit durchschnittlich mit 1.338 Punkten auf einem hohen Level.
Anwendungsleistung
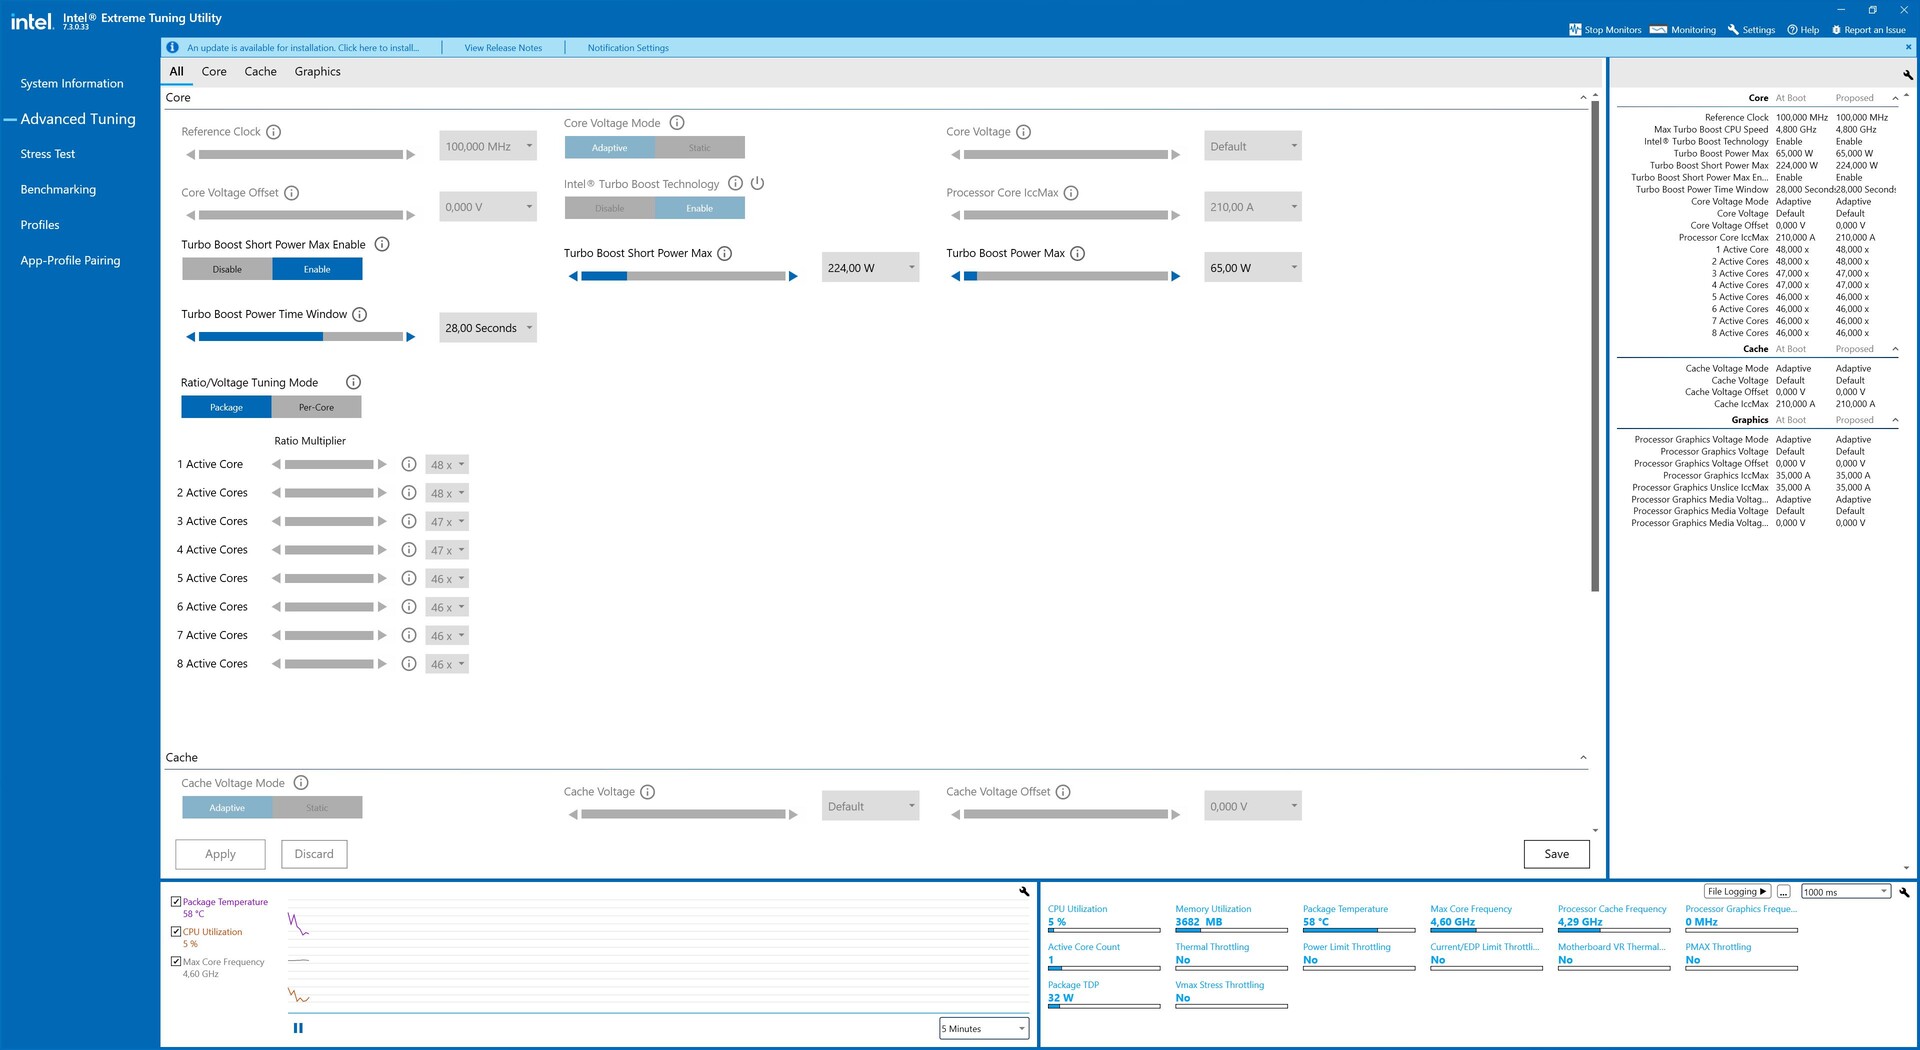
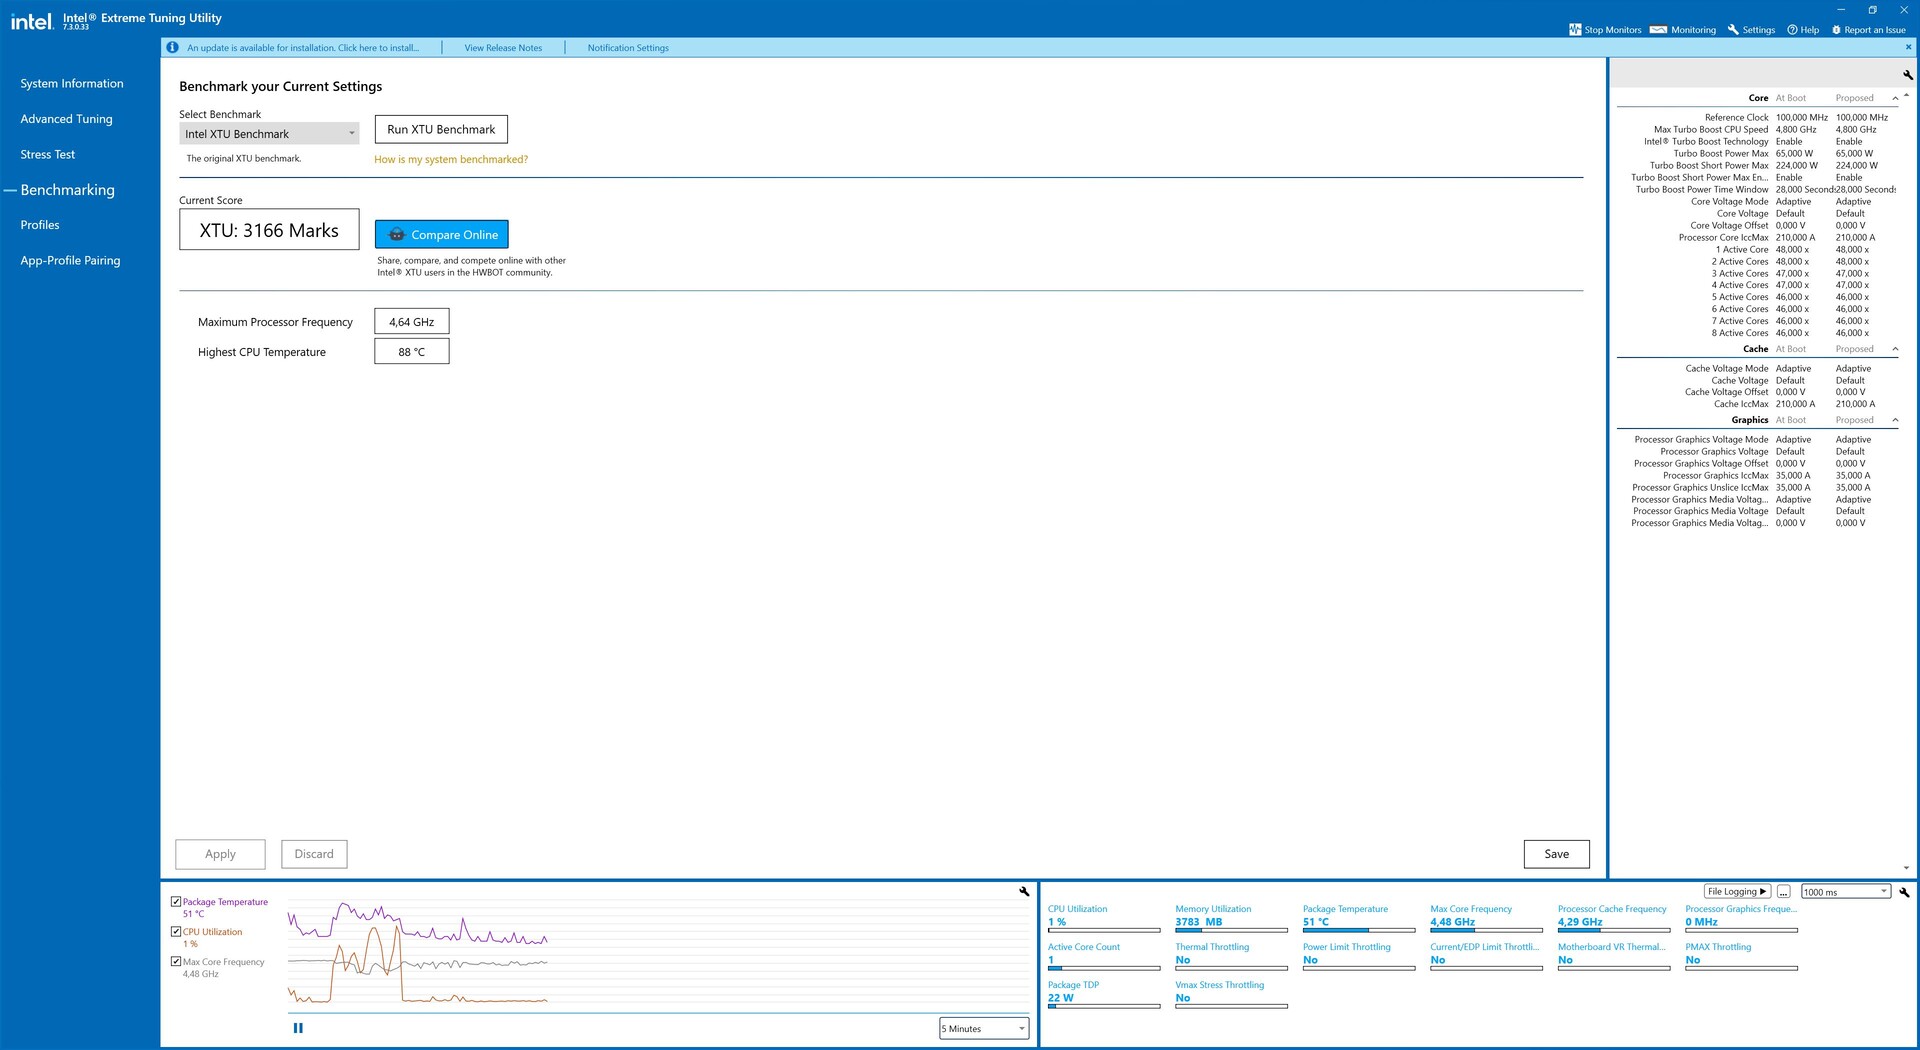
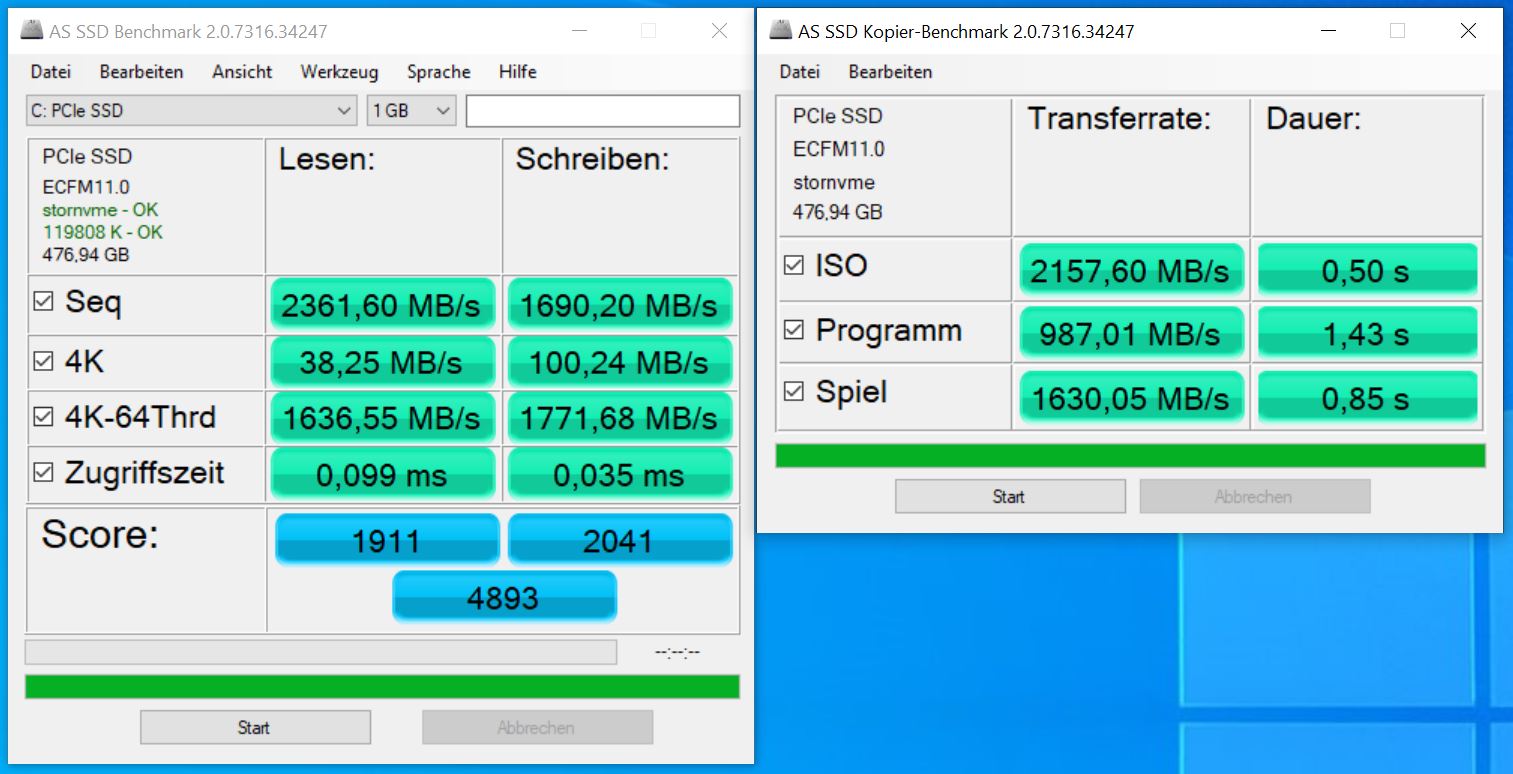
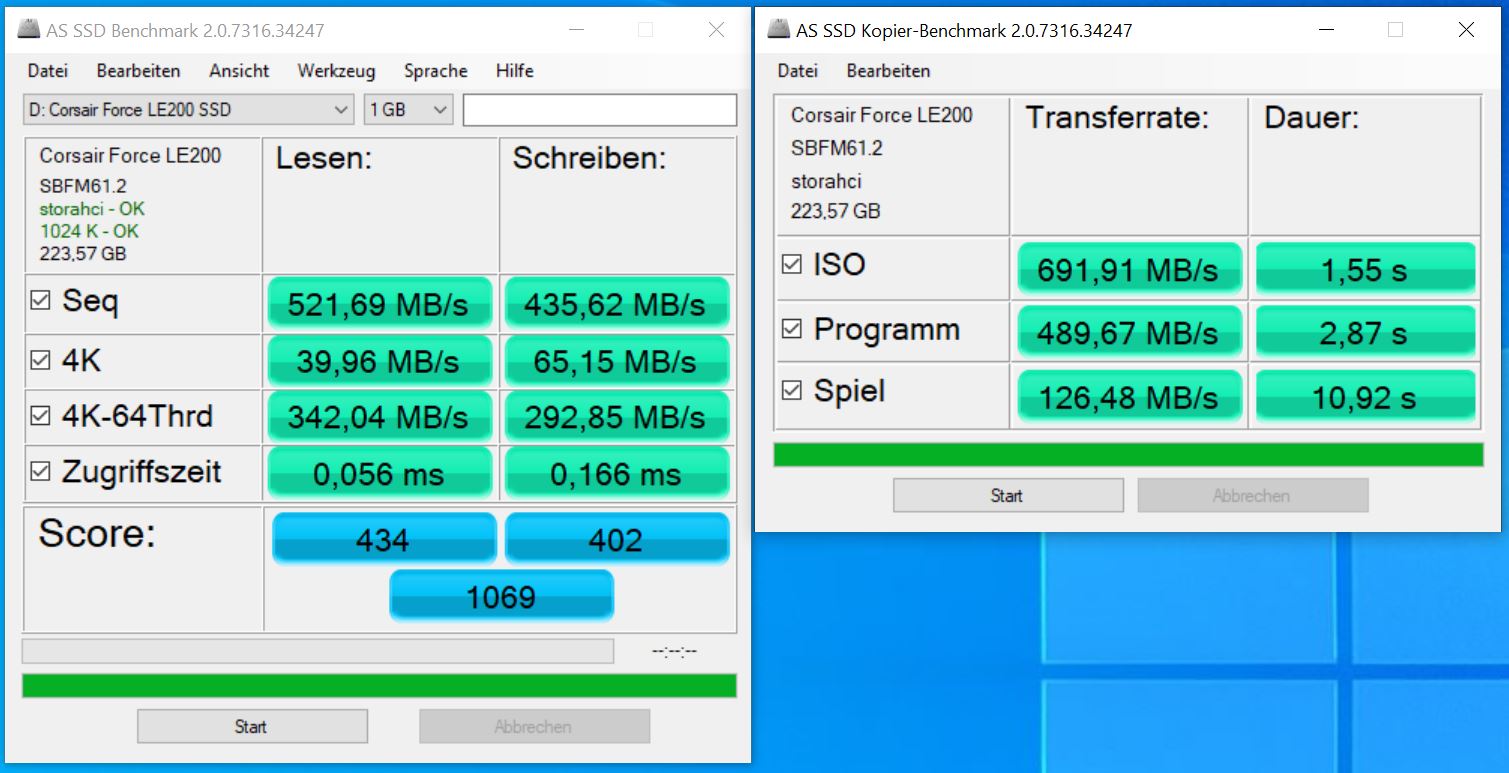
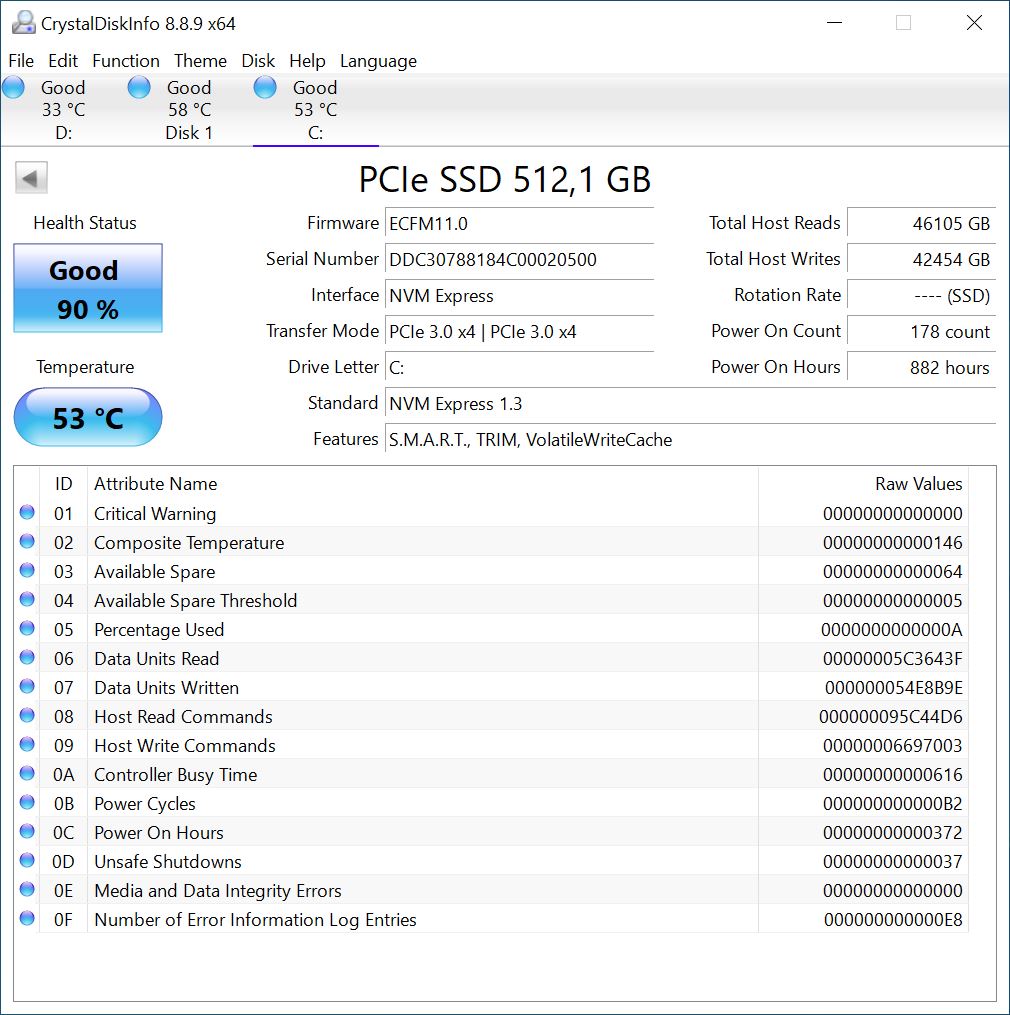
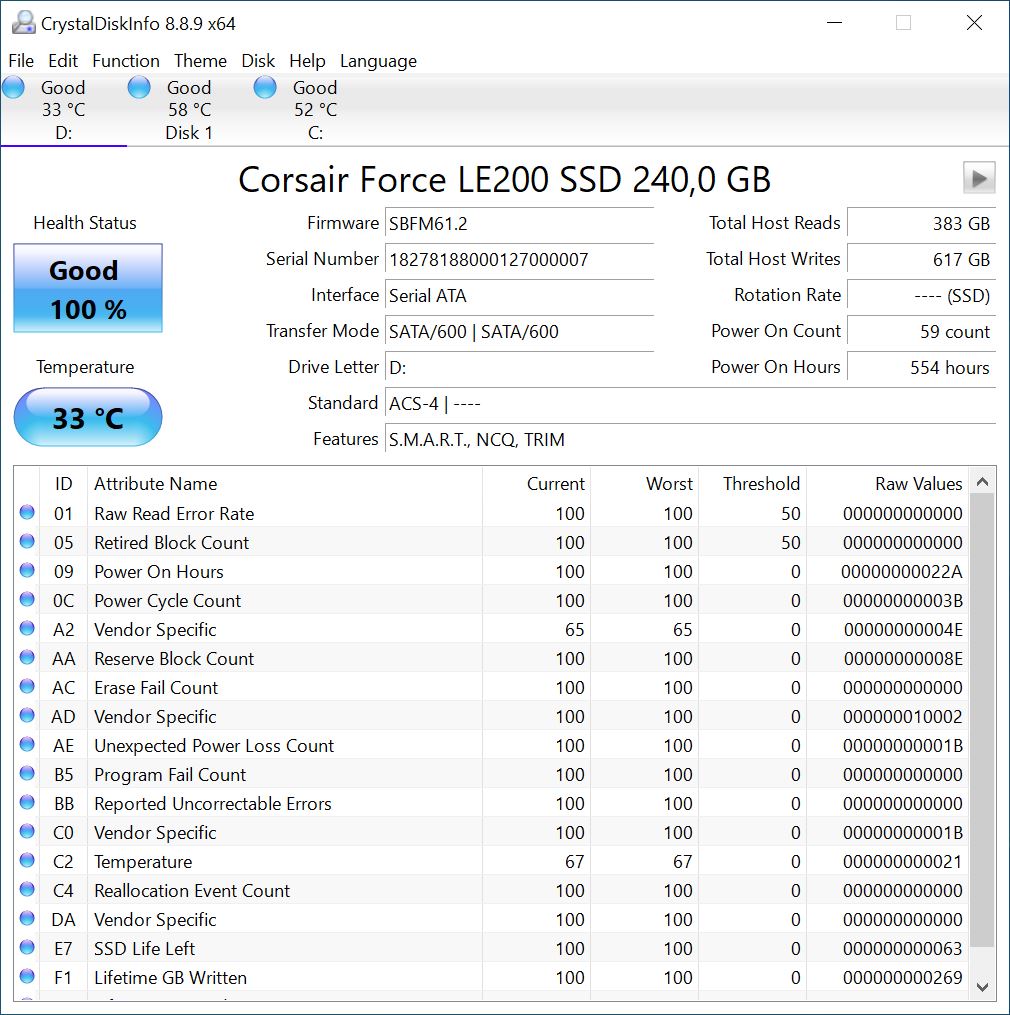
Bei unseren Anwendungsbenchmarks erreicht der Magnus One in unserer Testausstattung relativ gute Werte. Gleichwohl haben wir aber aufgrund der verbauten Komponenten mit einer besseren Leistung gerechnet. Im Vergleich zu unseren anderen Testsystemen hat der Magnus One oft nur das Nachsehen. Gut gefällt uns der Verzicht einer herkömmlichen Festplatte. Jedoch kann hier jeder selbst wählen welcher Massenspeicher verbaut werden soll. Die angefügten Screenshots verdeutlichen ansatzweise, welche Leistung erwartet werden kann. Insgesamt lassen sich sogar drei Massenspeicher in dem Gehäuse unterbringen.
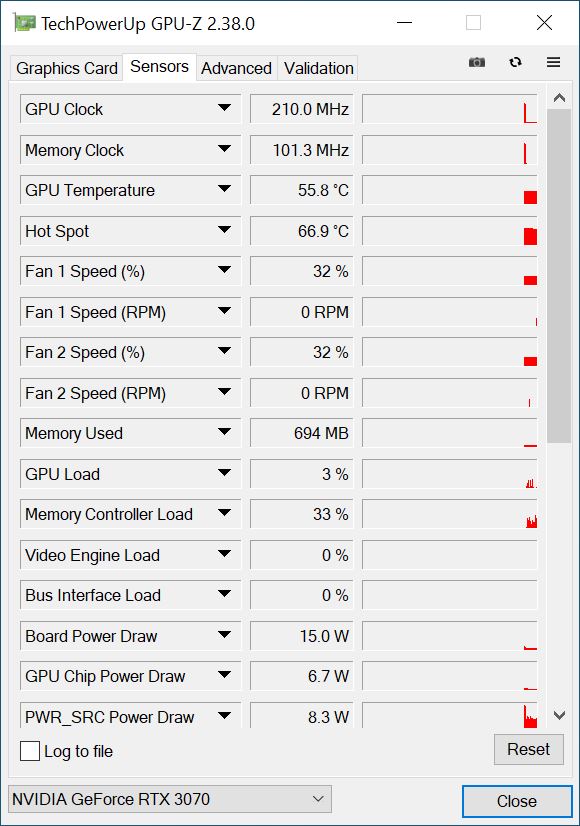
3D-Leistung und Gaming Performance
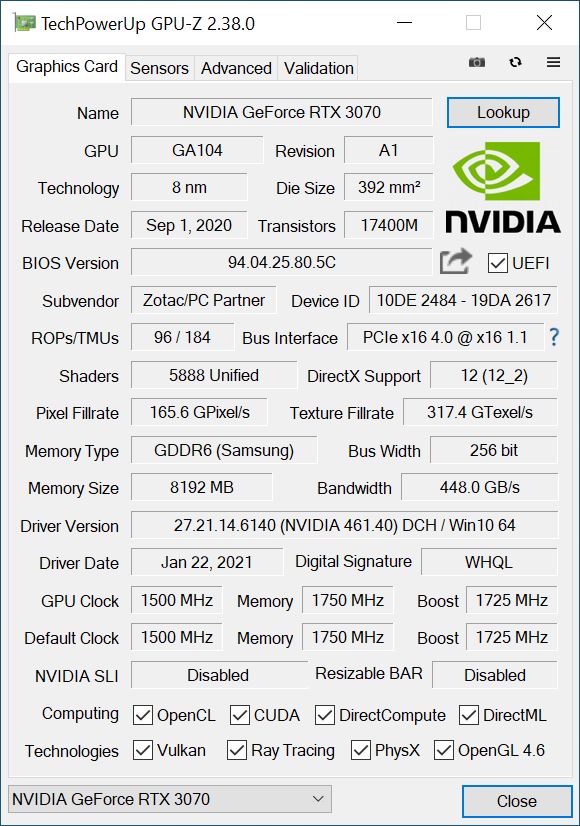
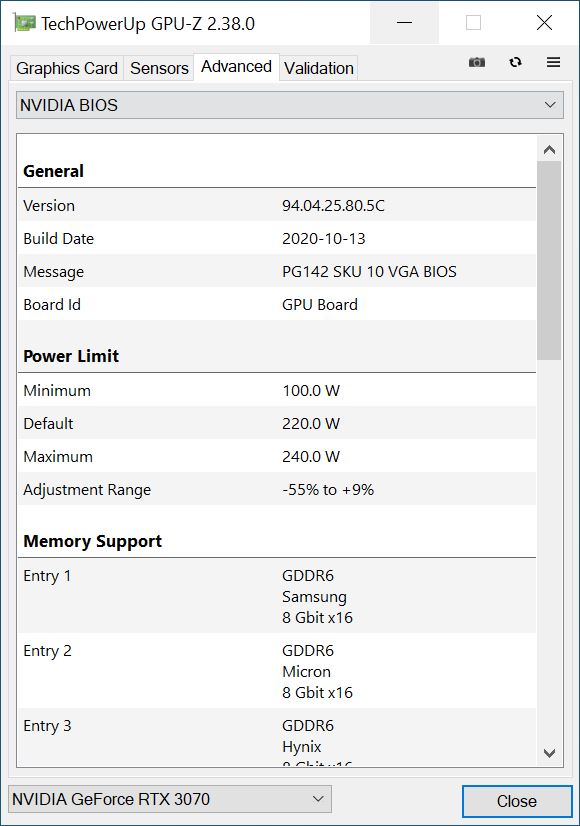
Für die gute 3D-Performance sorgt eine Nvidia GeForce RTX 3070, welche direkt aus dem hauseigenen Portfolio von Zotac stammt. Im Test konnte das System eine solide Leistung abliefern und insgesamt etwas besser abschneiden, als zuvor bei den reinen CPU-Tests. Rein leistungstechnisch sortiert sich der Magnus One mit der GeForce RTX 3070 direkt hinter unserem Testsytem auf Basis des etwas schnelleren AMD Ryzen 9 5900X und der MSI GeForce RTX 3070 Ventus 3X ein. Als spürbar ist die etwas geringere Leistung allerdings nicht einzustufen. Mit der Vorgängergeneration ala RTX 2070 Super hat die RTX 3070 allerdings leichtes Spiel. Bis zu 30 Prozent mehr Leistung sind möglich und auch beim Spielen durchaus spürbar. Mit der Ausstattung des Magnus One lassen sich durchaus viele Spiele in 2160p genießen, wenngleich aber vorrangig 1440p Gaming anvisiert werden sollte.
Für weitere Vergleiche und Benchmarks zur Leistung der Nvidia GeForce RTX 3070 verweisen wir hier auf unsere GPU-Vergleichstabelle.
| min. | mittel | hoch | max. | QHD | 4K | |
|---|---|---|---|---|---|---|
| GTA V (2015) | 180 | 173 | 161 | 95.6 | 91.6 | 110 |
| The Witcher 3 (2015) | 367 | 316 | 235 | 121 | 84 | |
| Dota 2 Reborn (2015) | 164.2 | 143.8 | 138.2 | 129.7 | 127.4 | |
| Final Fantasy XV Benchmark (2018) | 167 | 146 | 112 | 89.2 | 54.8 | |
| X-Plane 11.11 (2018) | 124 | 110 | 91 | 78.8 | ||
| Far Cry 5 (2018) | 150 | 133 | 126 | 117 | 112 | 70 |
| Strange Brigade (2018) | 430 | 311 | 253 | 222 | 165 | 97.1 |
| Far Cry New Dawn (2019) | 126 | 110 | 106 | 95 | 92 | 70 |
| Metro Exodus (2019) | 166 | 136 | 116 | 93.1 | 76.1 | 49 |
| Borderlands 3 (2019) | 149 | 132 | 118 | 98.8 | 75.5 | 42.7 |
Emissionen
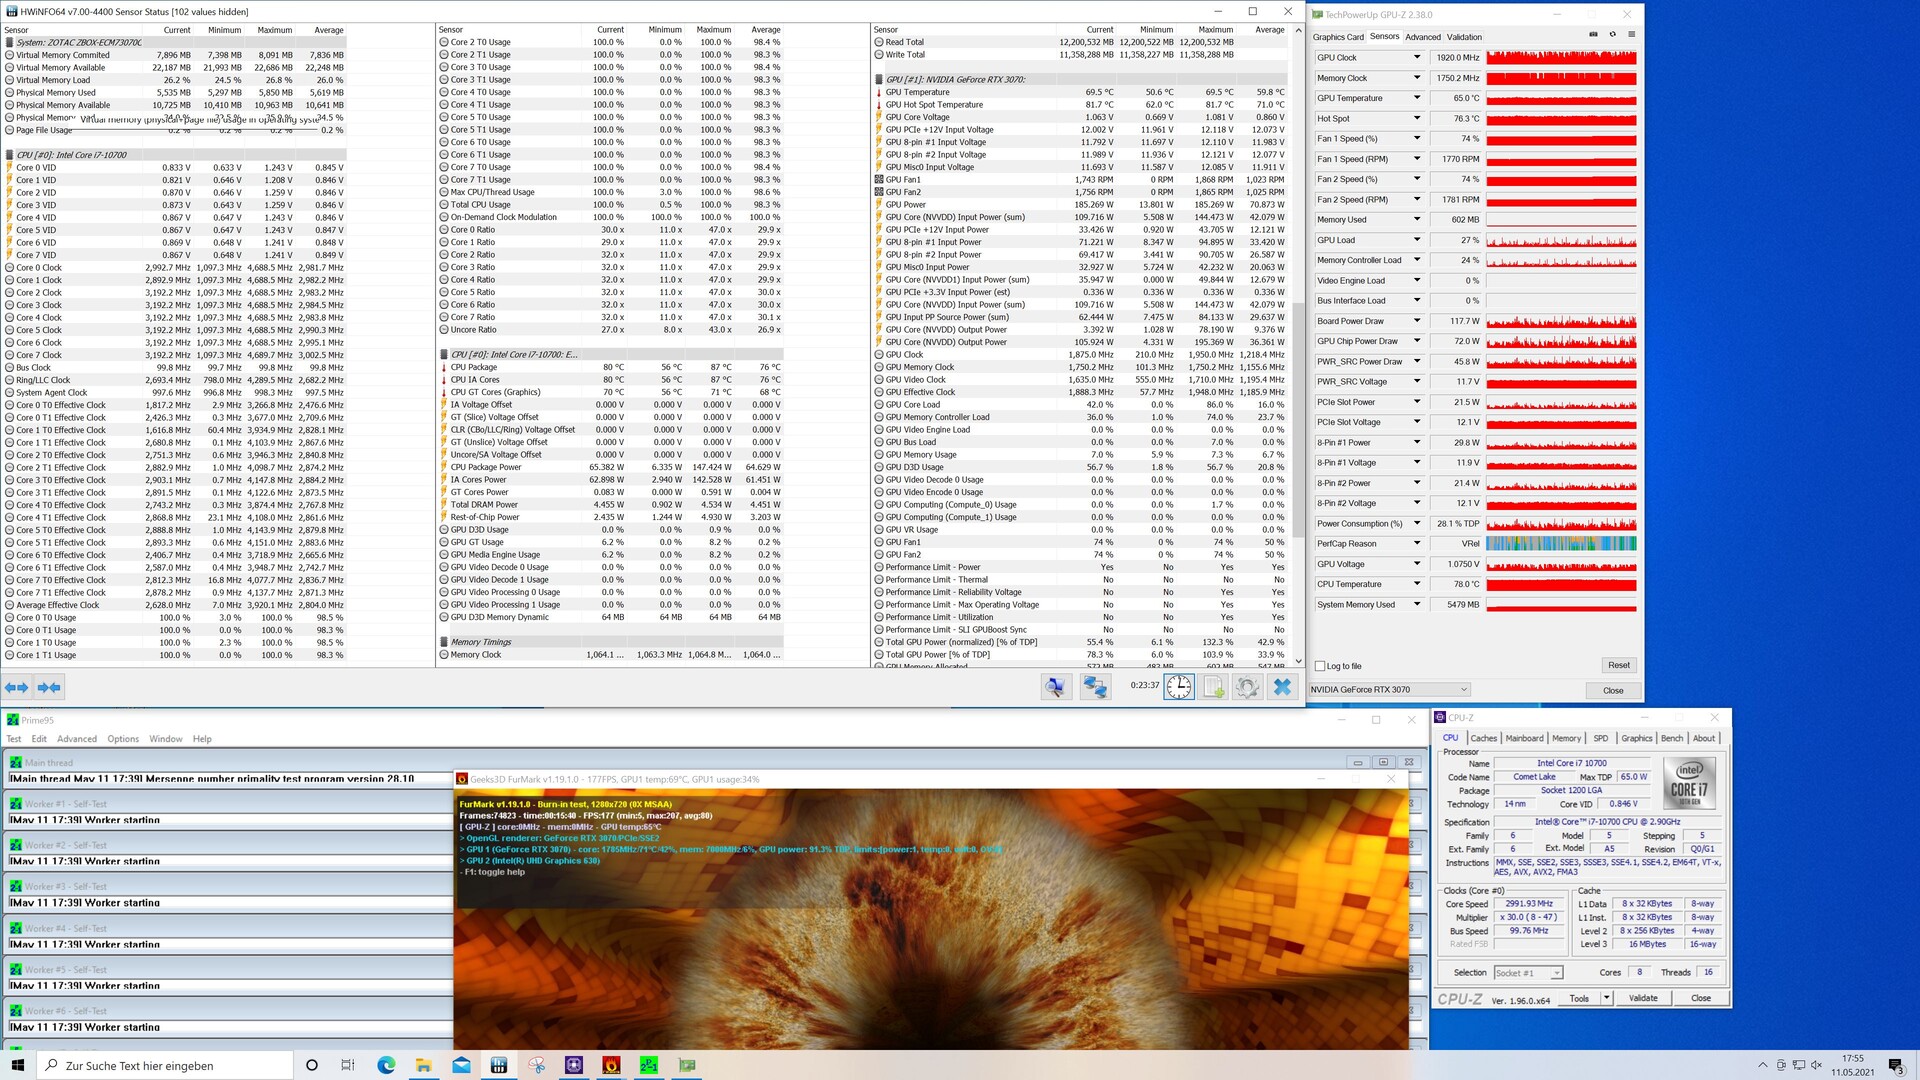
Der Zotac Magnus One beim Stresstest
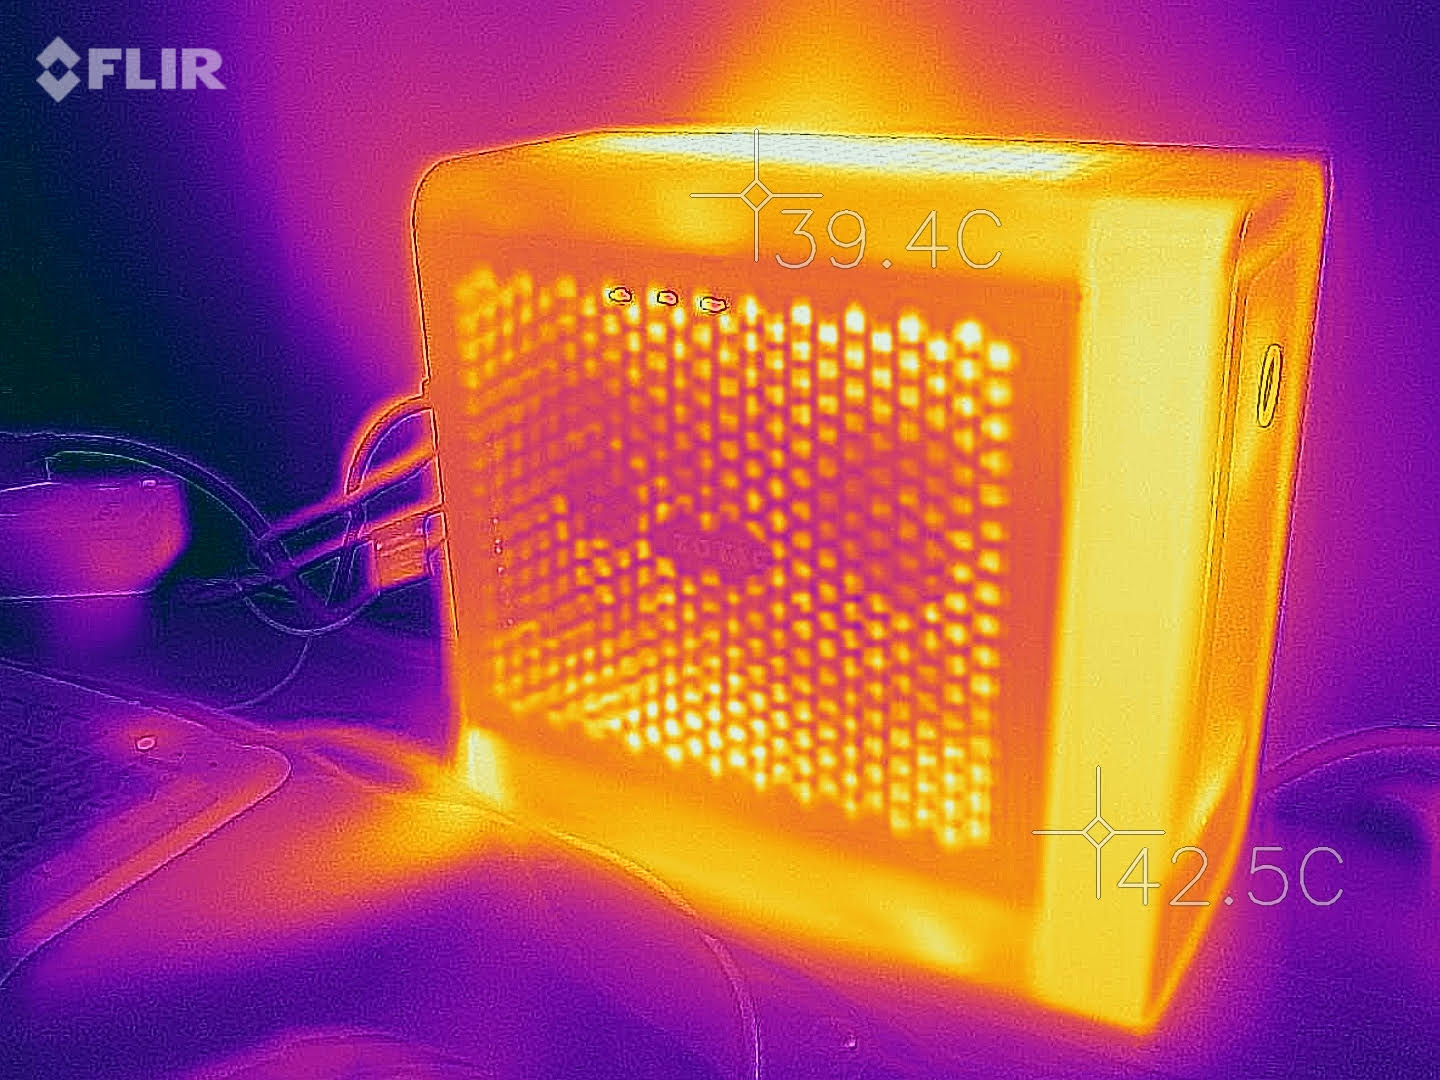
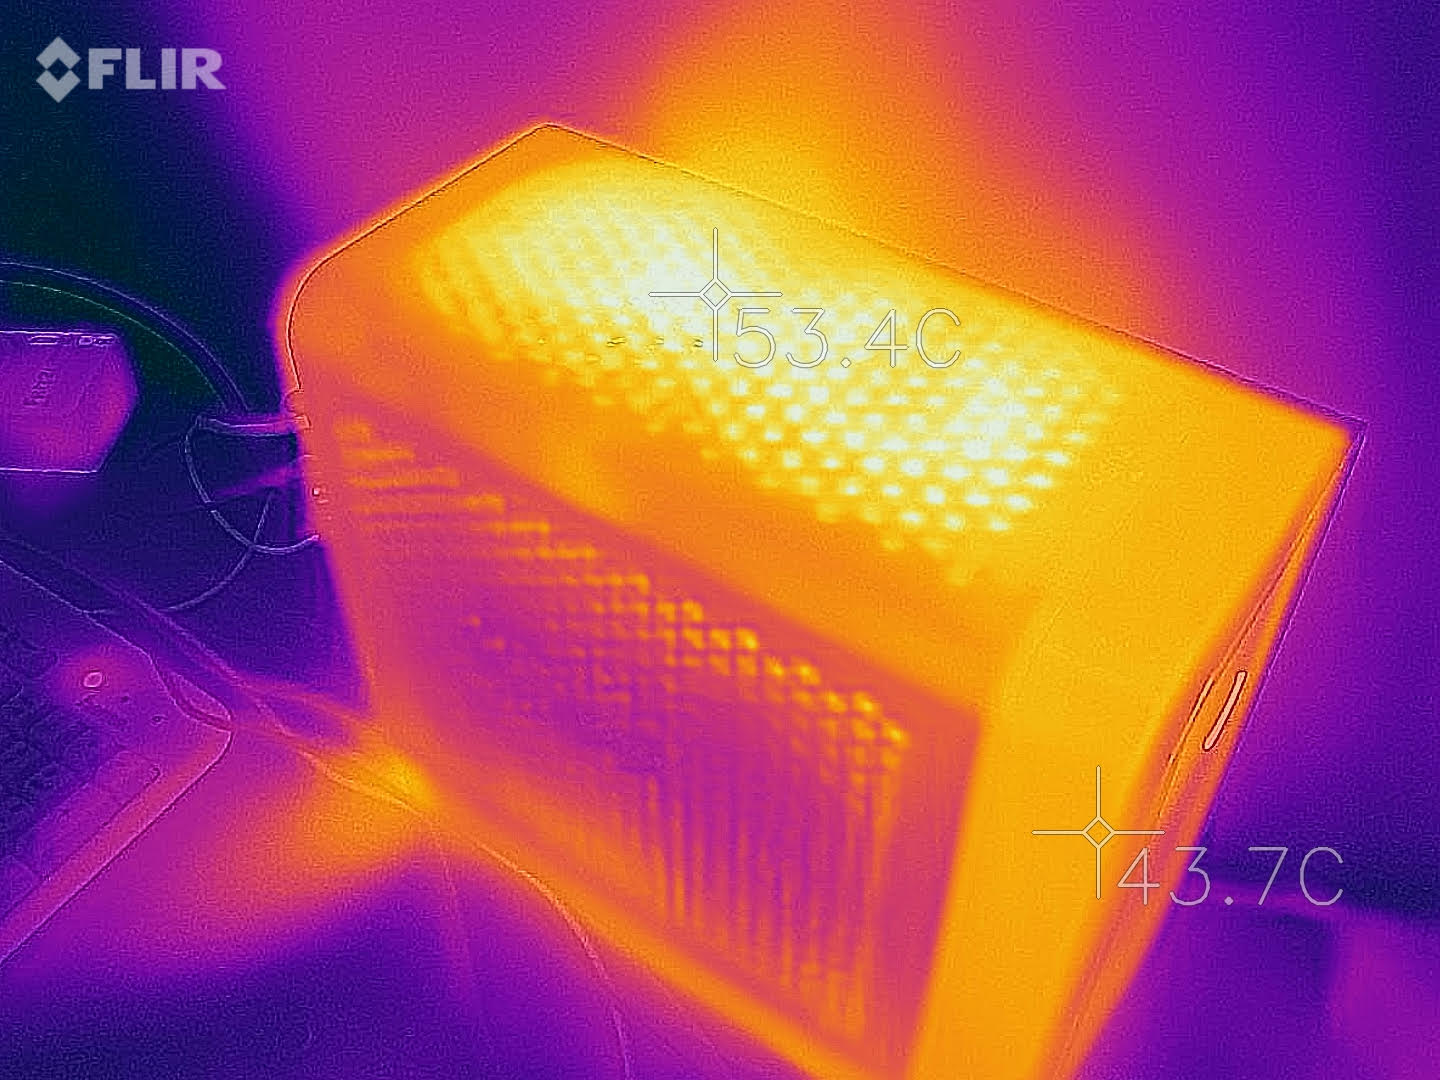
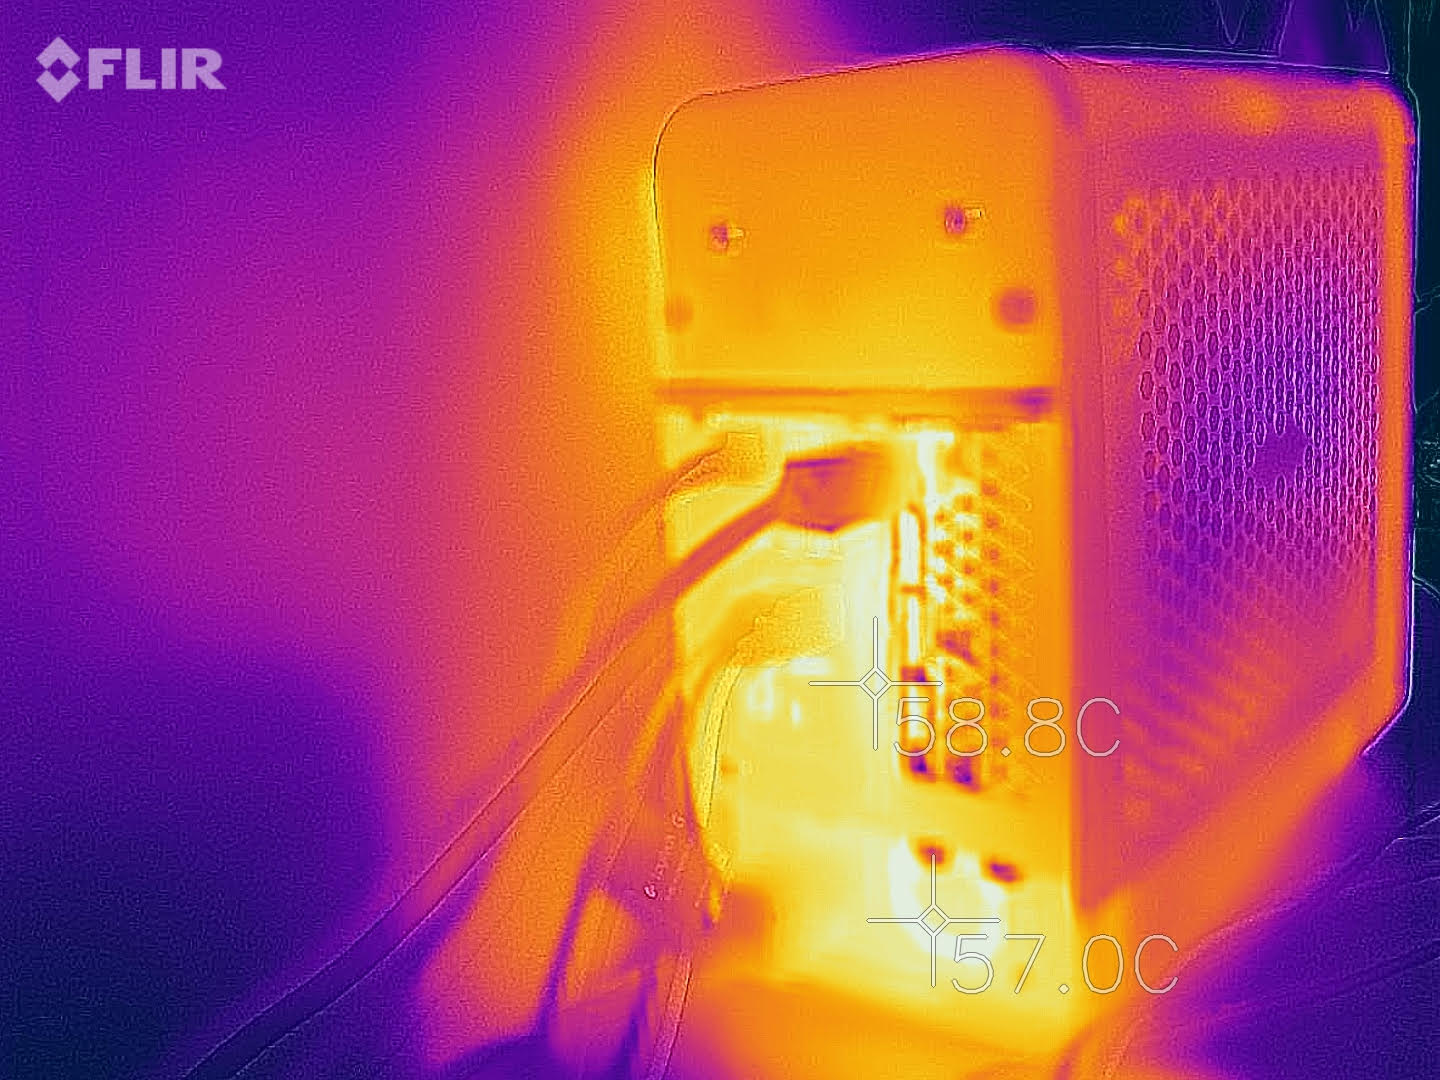
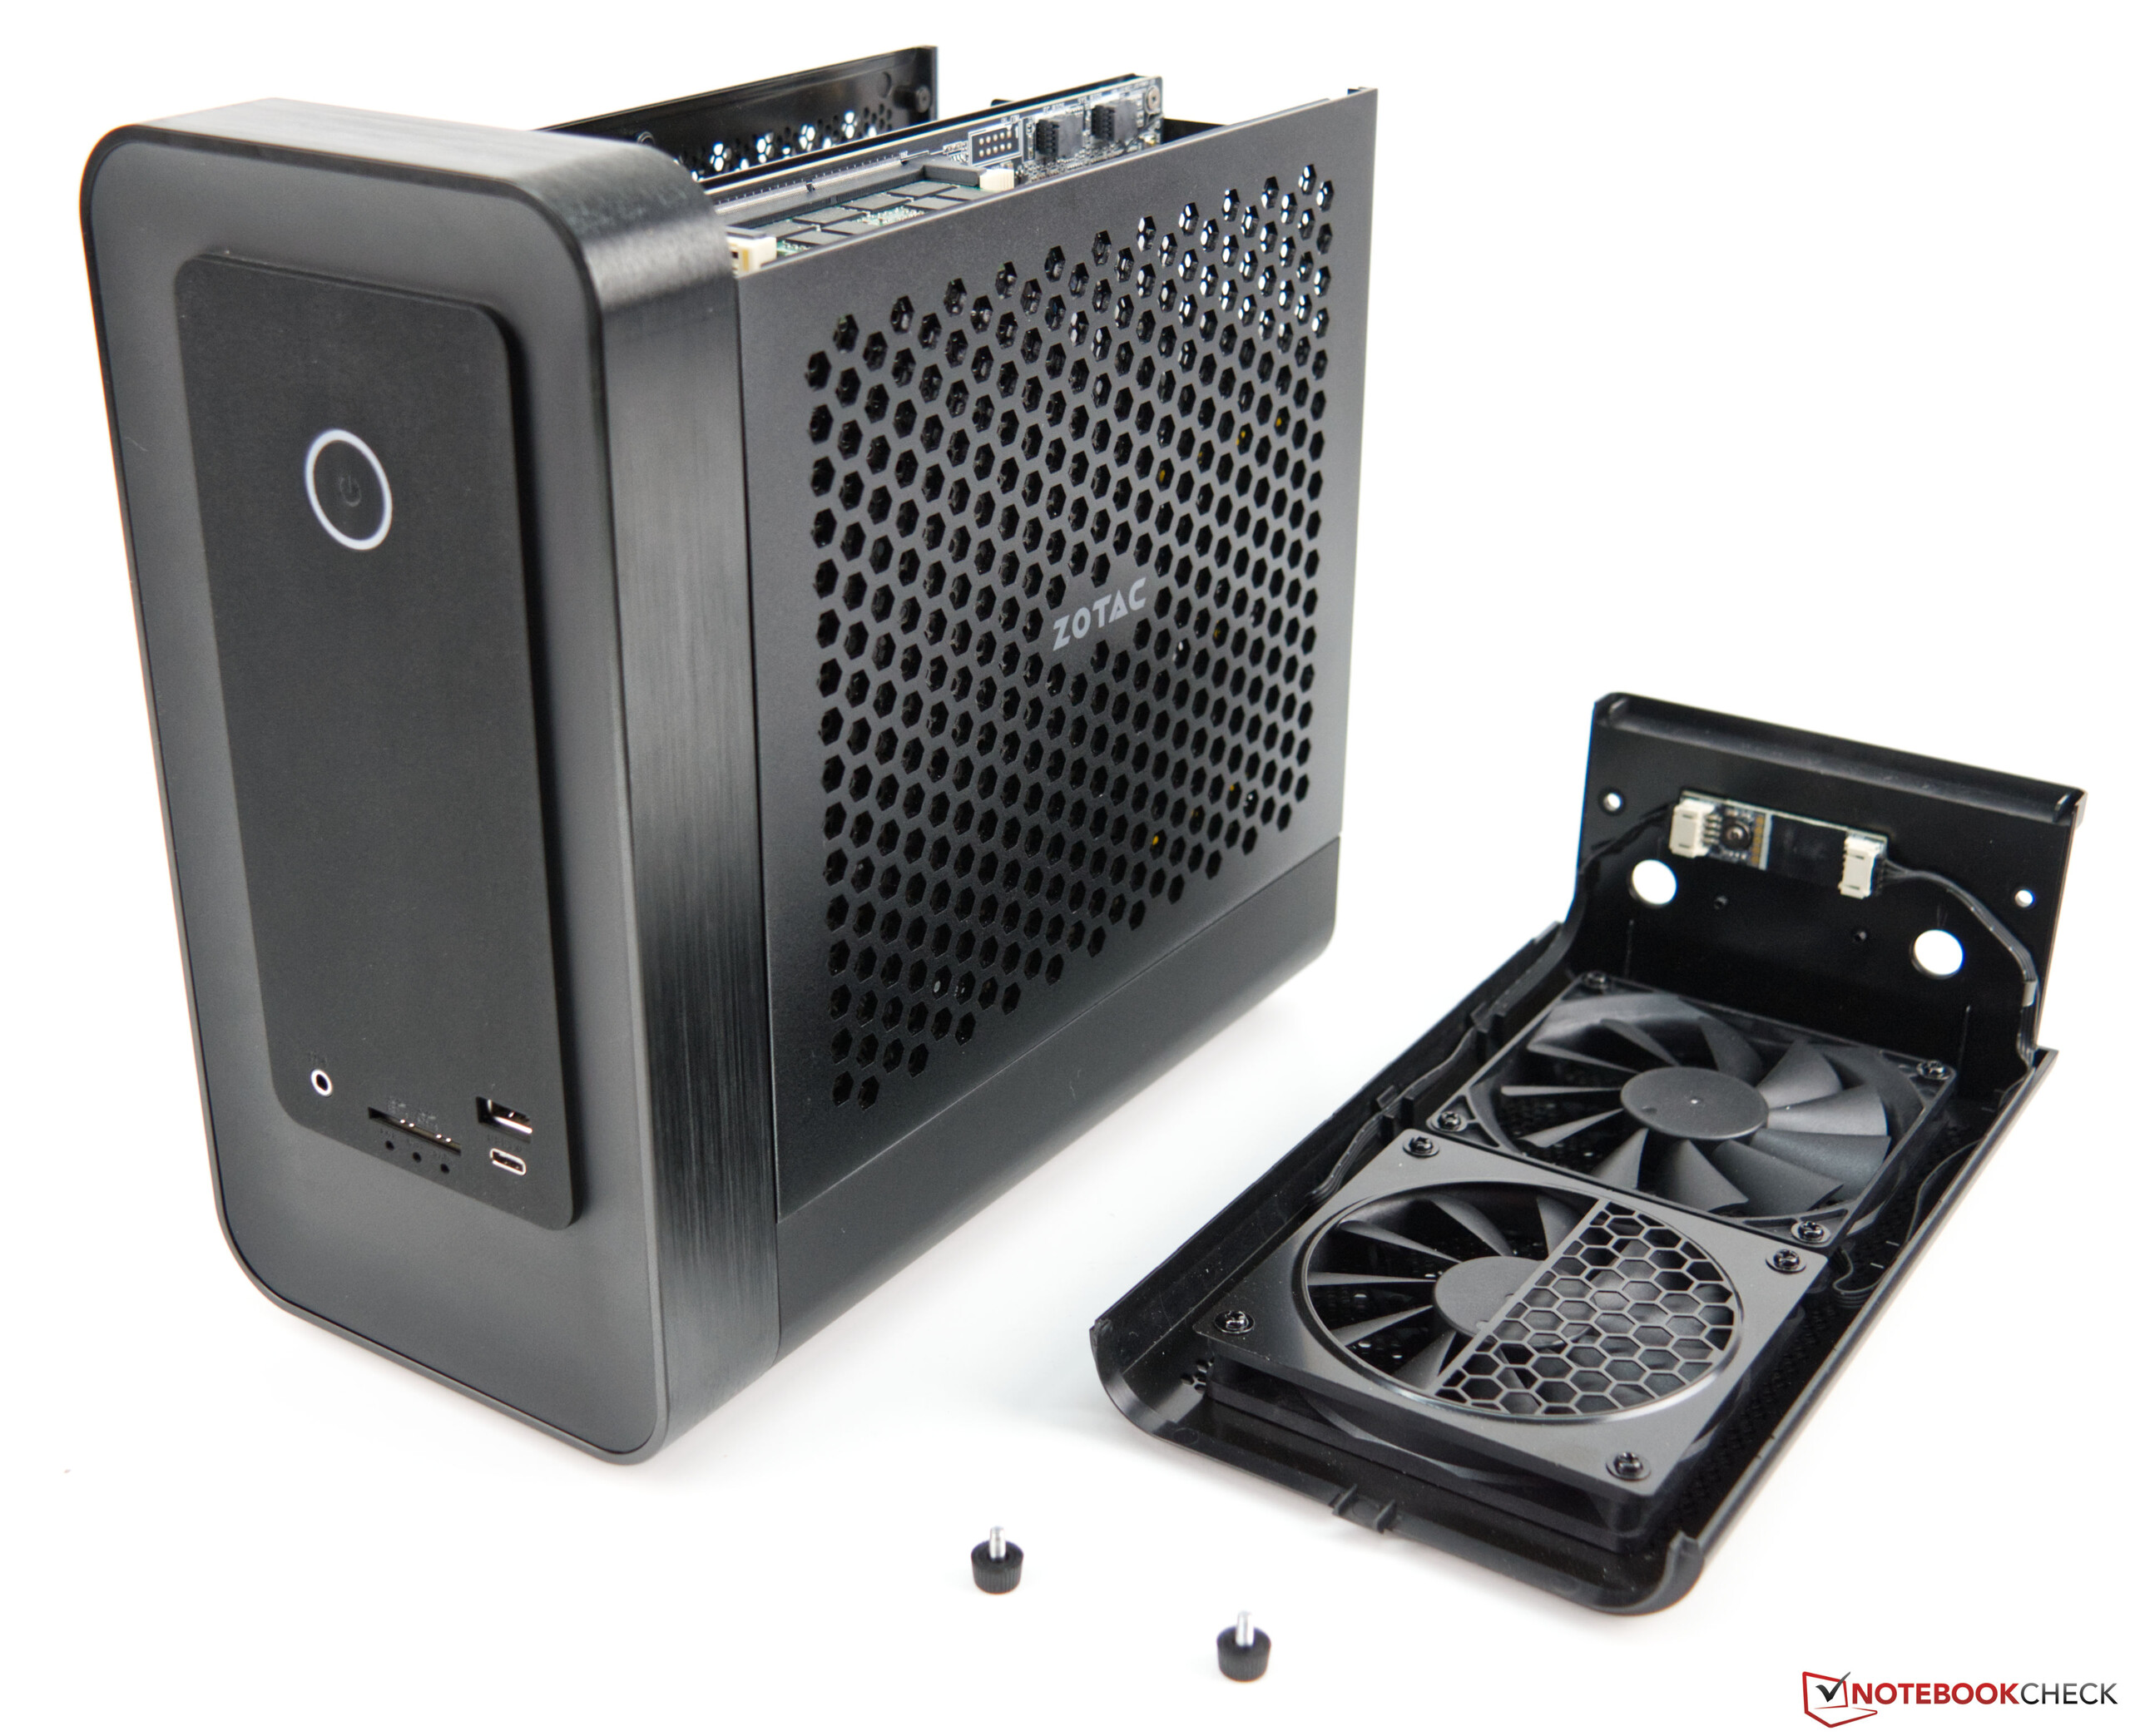
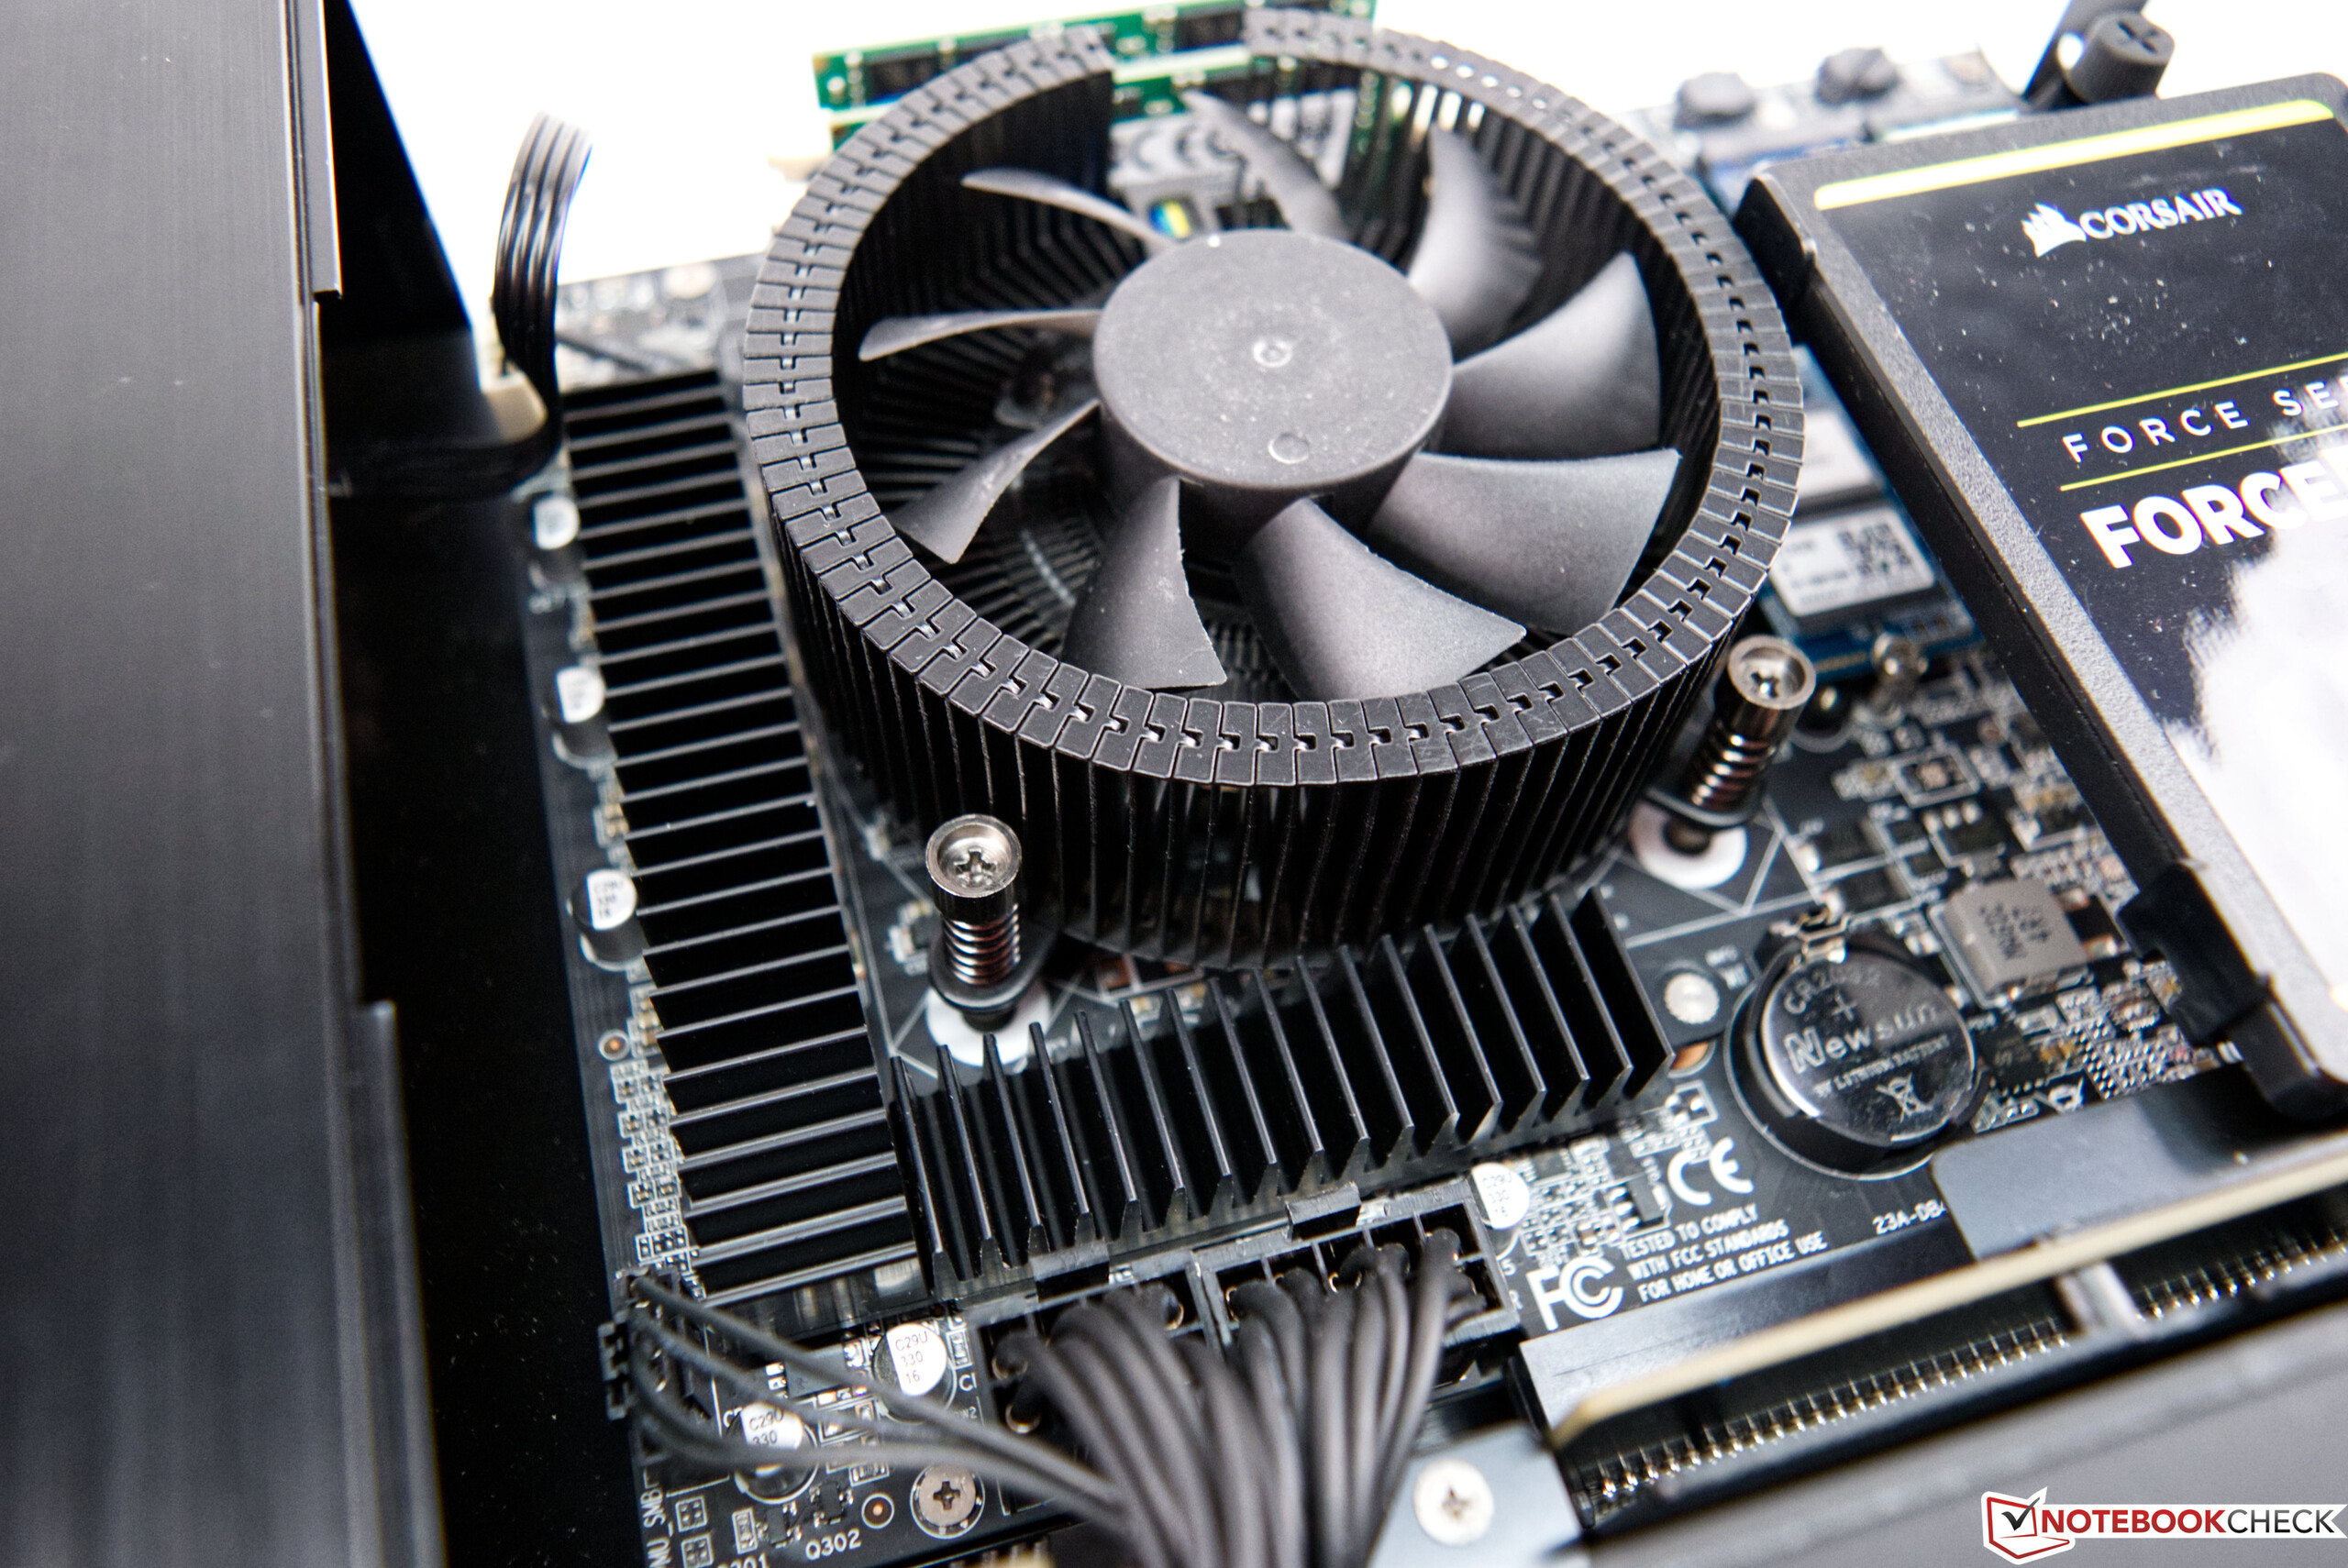
Die kompakte Bauweise erfordert eine ausgeklügelte Kühlung. Zotac nutzt dabei den sogenannten Kamineffekt und installiert in der Oberseite zwei Lüfter, die die entstehende Abwärme gut aus dem Gehäuse befördern. Beim Stresstest erwärmt sich der Intel Core i7-10700 jedoch trotzdem bis auf maximal 87 °C. Beim Lasttest der GeForce RTX 3070 kletterte die Temperatur bis auf knapp 81 °C. Das ist alles noch im vertretbaren Rahmen und es gibt keinen Grund zur Besorgnis. Auch bei langanhaltenden Spielesessions kam es zu keinen spürbaren Leistungseinbrüchen, die auf eine zu hohe Temperatur hindeuten.
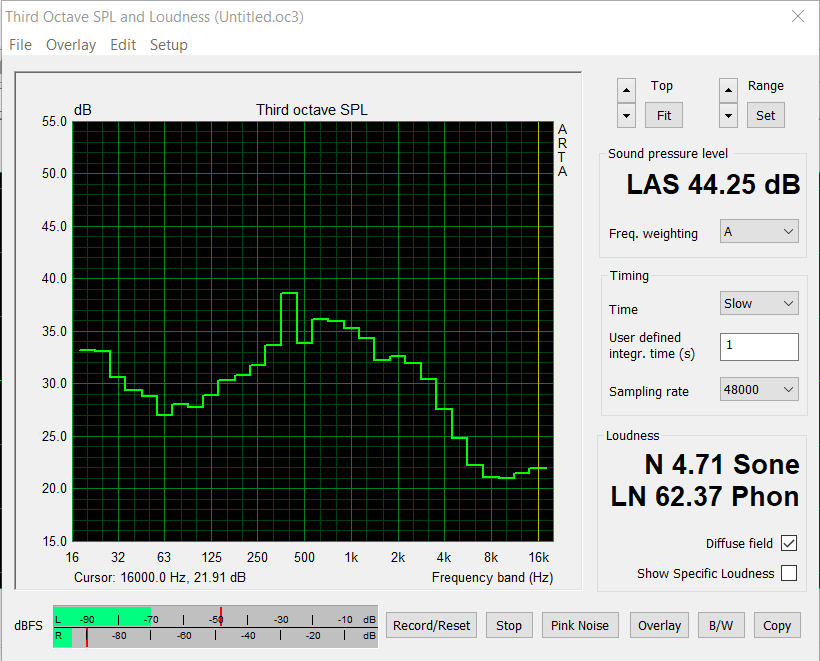
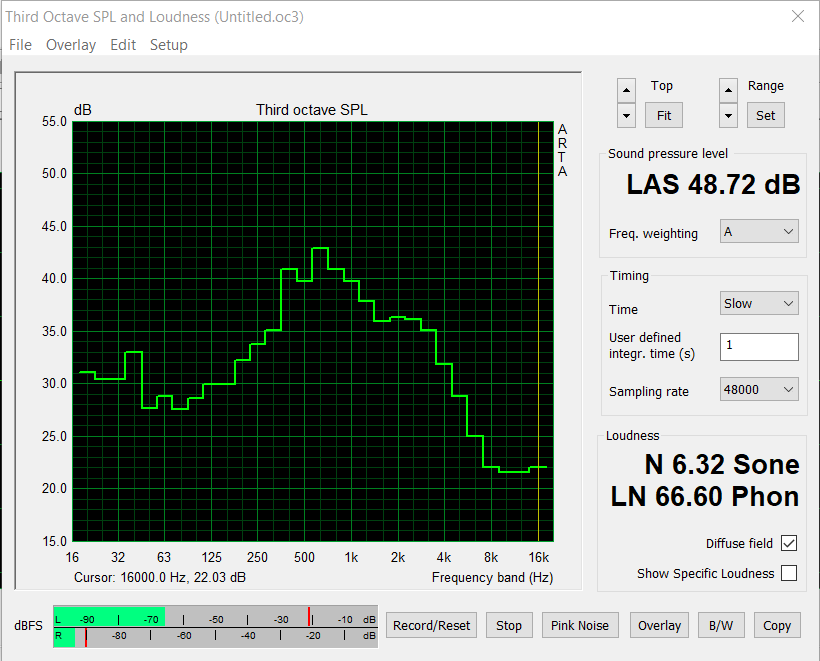
Für ein Desktop-System ist der Magnus One aber aufgrund der Kühlungssituation deutlich hörbar unter Last. Im Leerlauf haben wir lediglich 33,5 dB(A) gemessen, wenngleich es aber beim Spielen mit 48,7 dB(A) schon deutlich lauter wurde. Beim Stresstest war der Lautstärkepegel mit 44,2 dB(A) etwas geringer. Als positiv notieren wir an dieser Stelle, dass wir kein hochfrequentes Lüftergeräusch oder auch Spulenfiepen wahrgenommen haben.
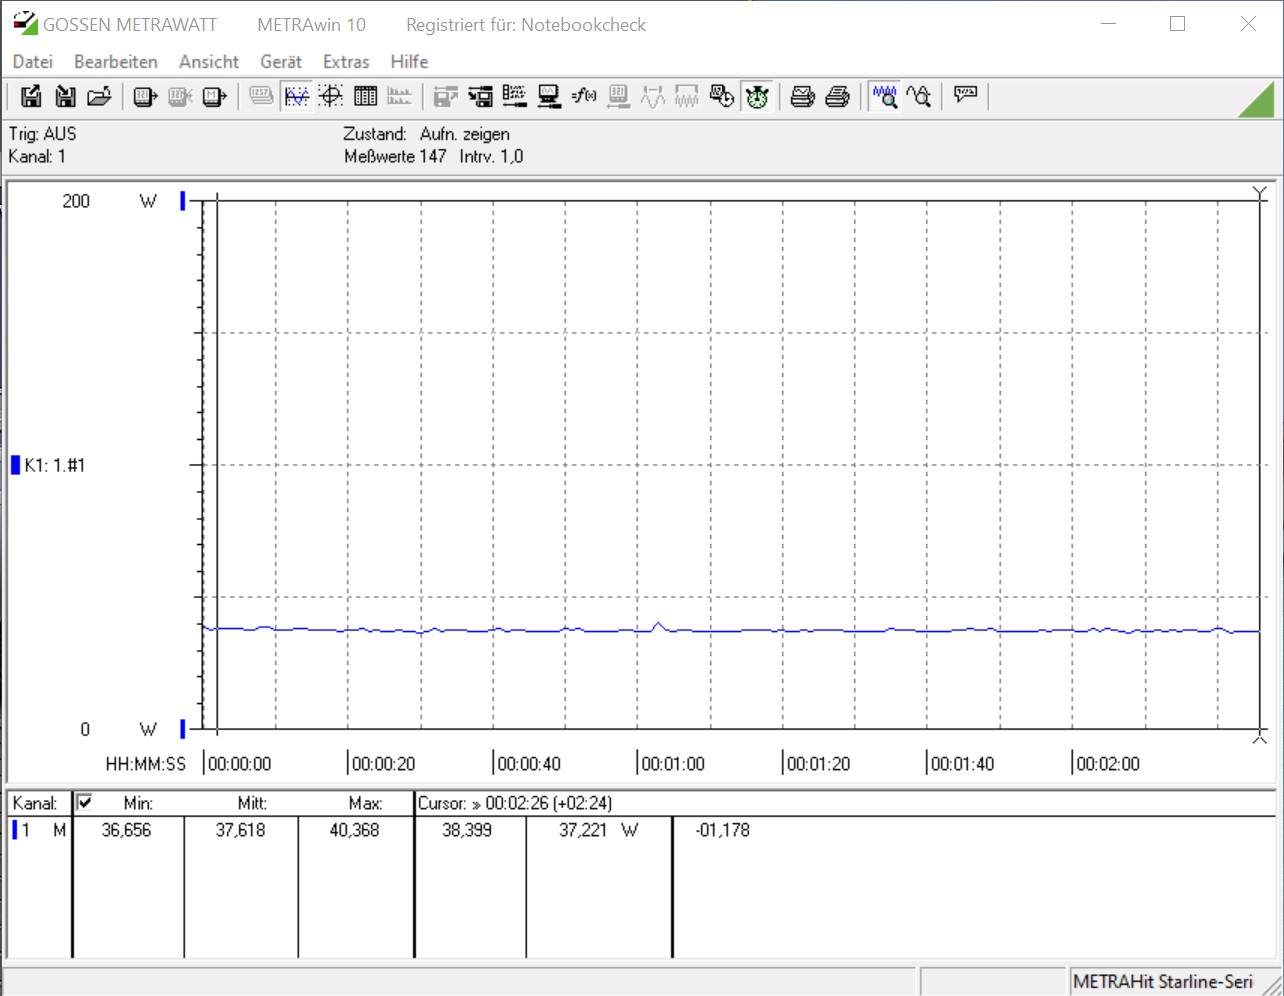
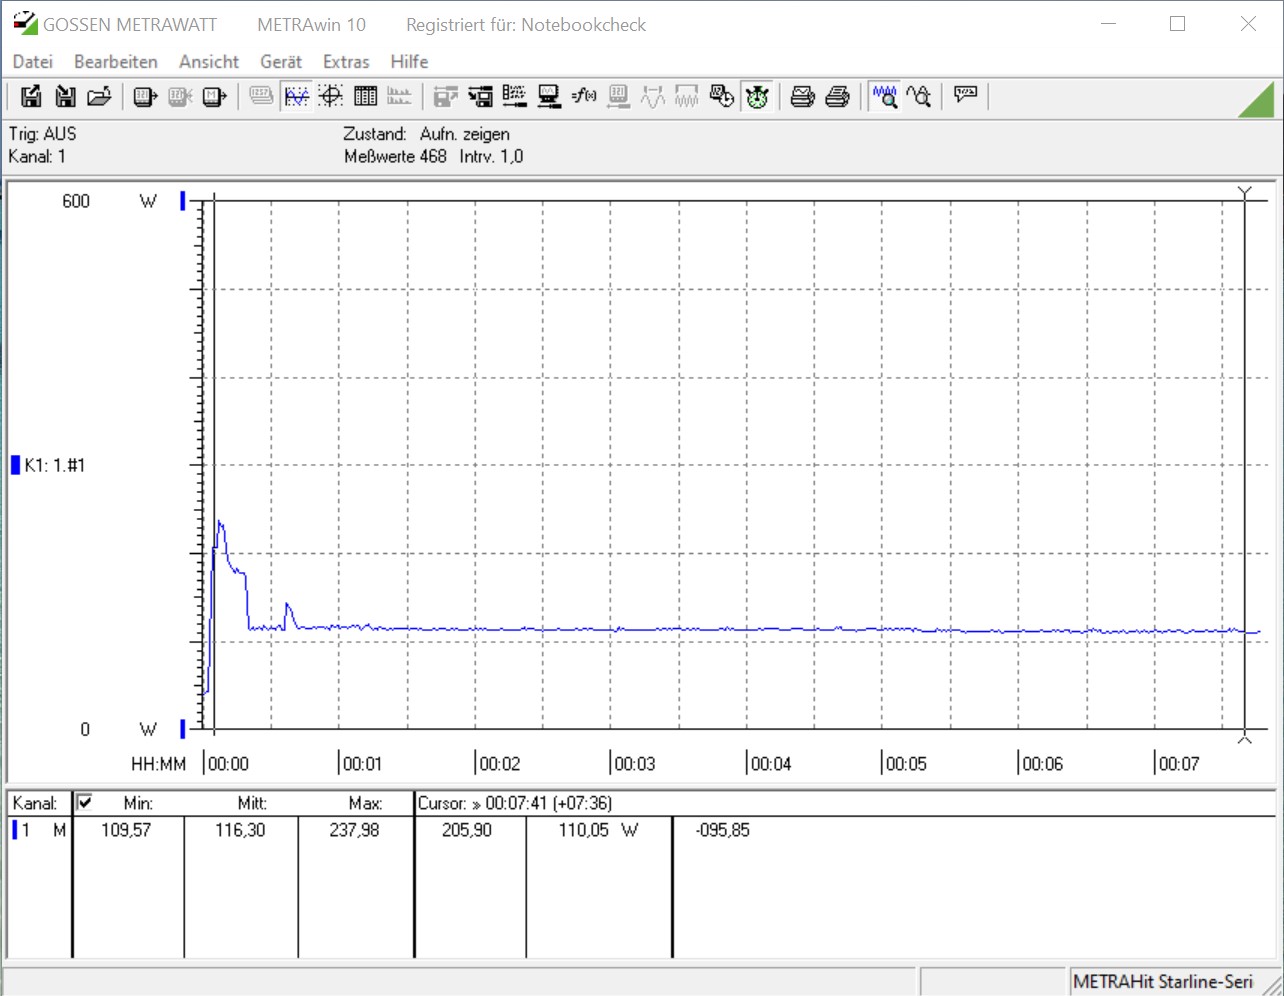
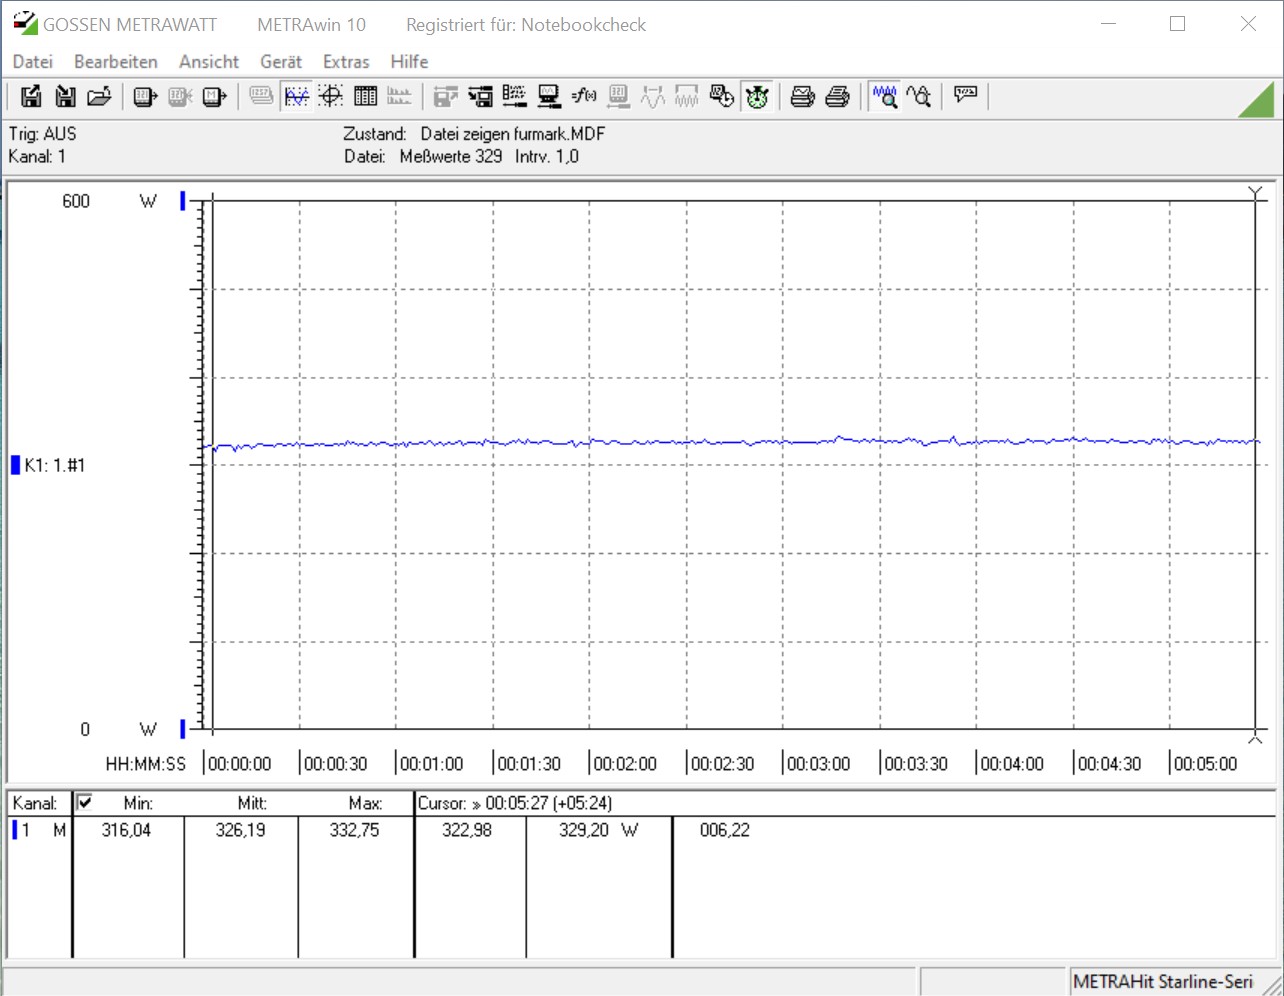
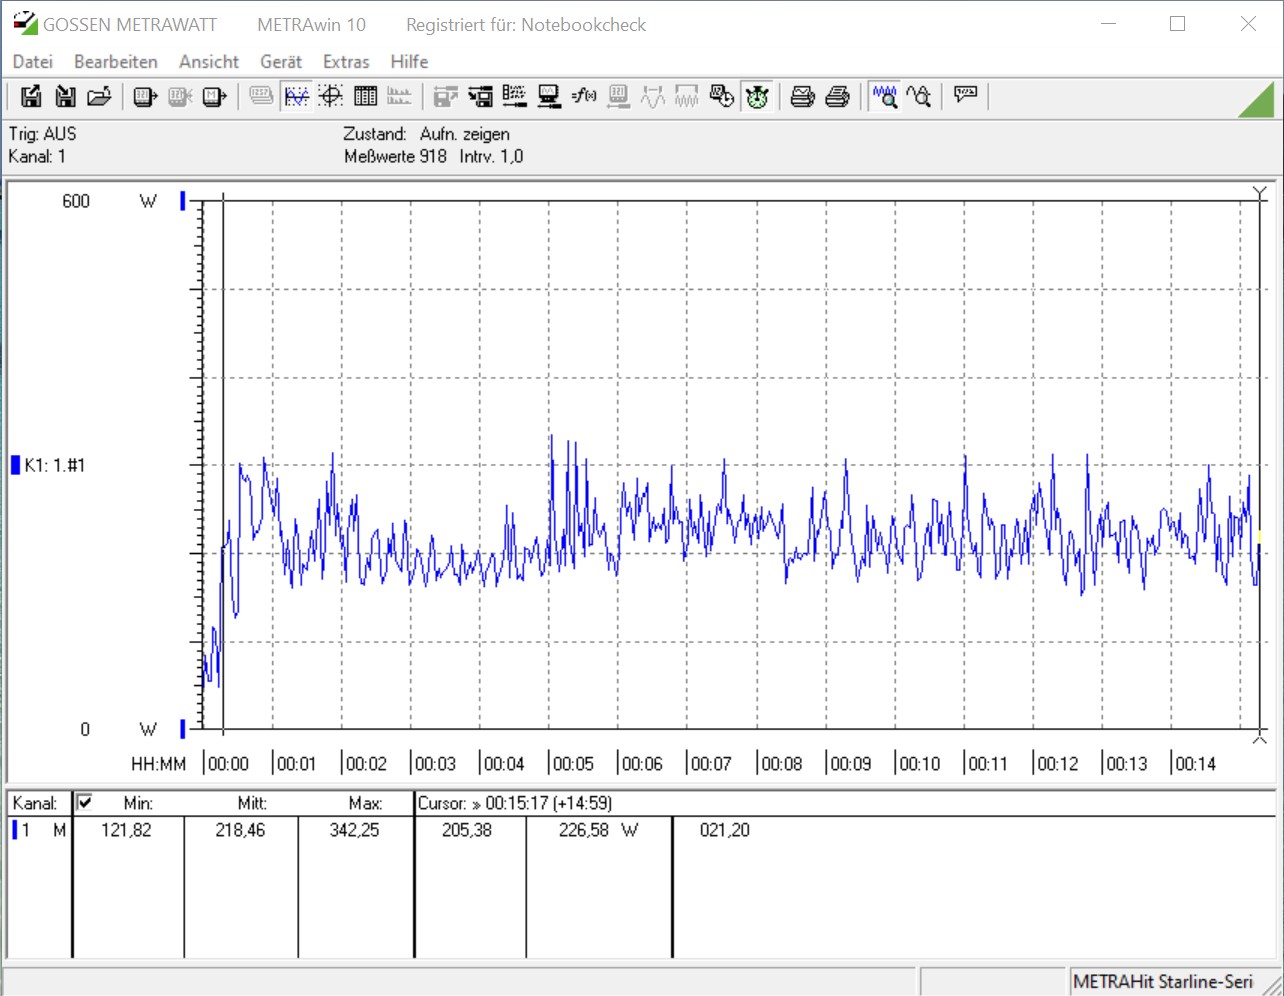
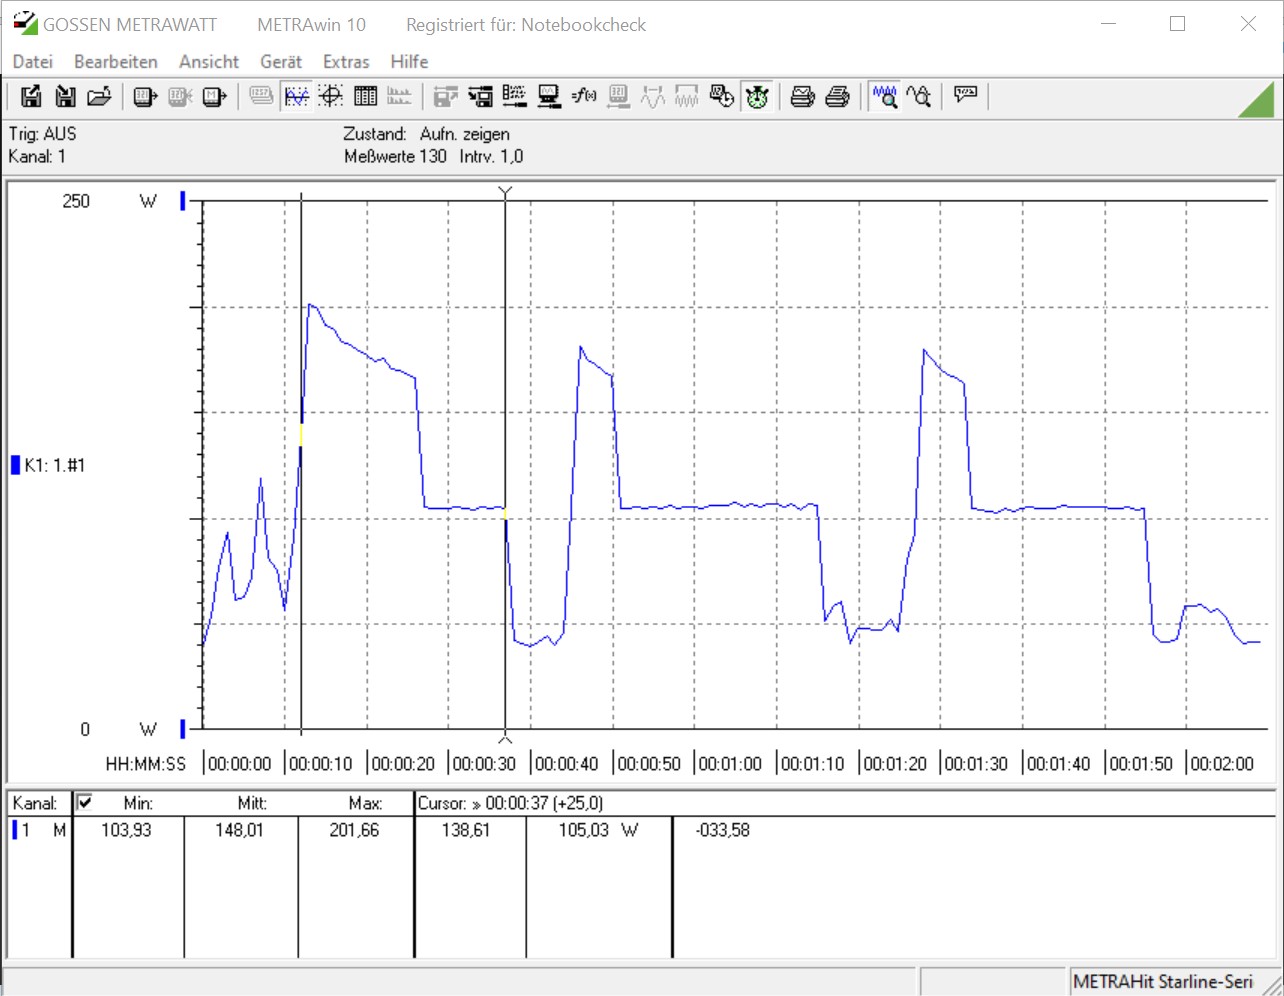
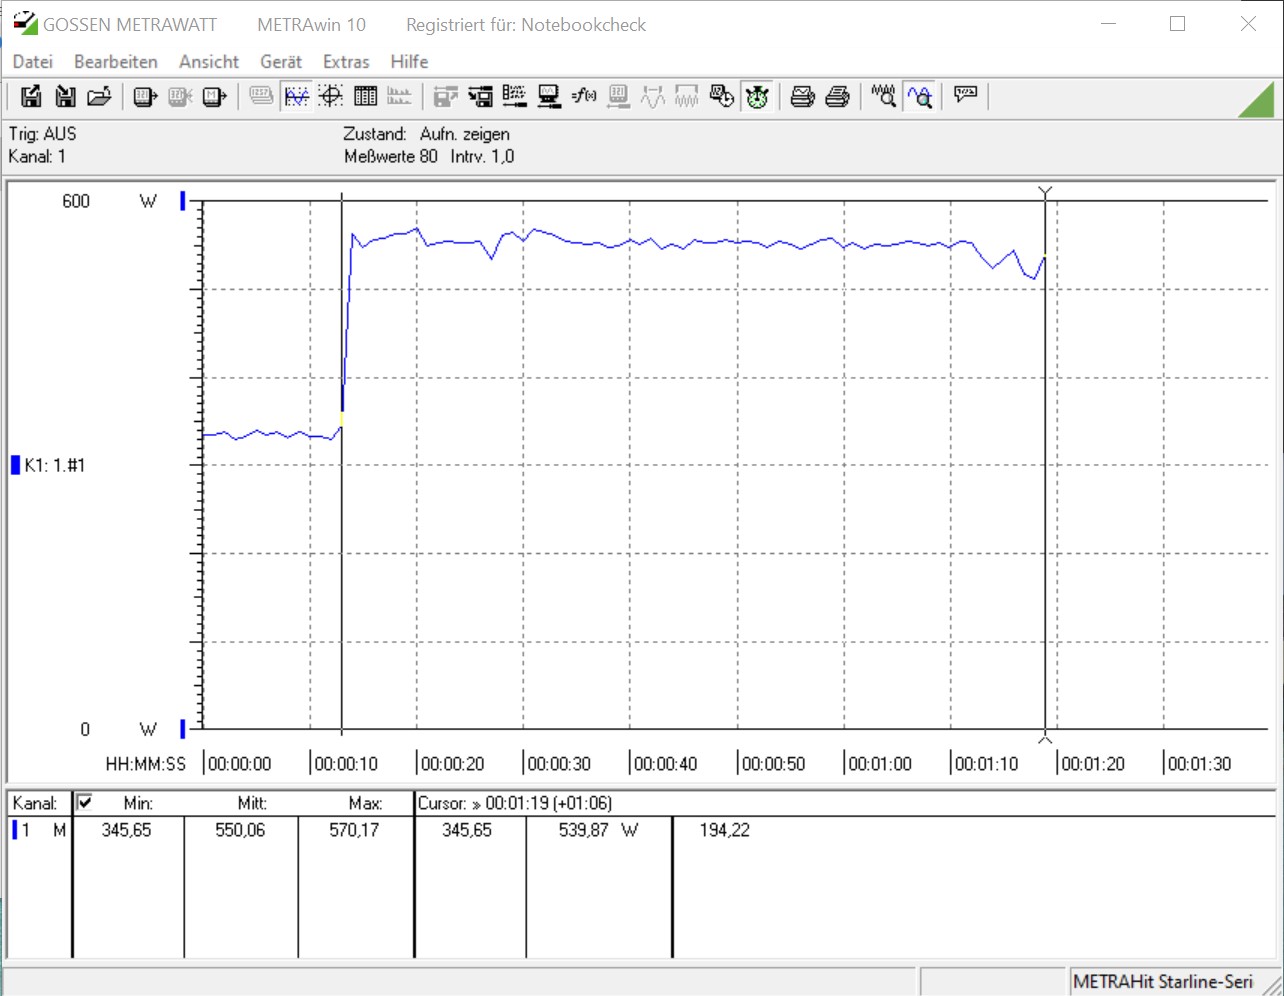
Beim Stromverbrauch zeigt sich der Magnus One einerseits relativ sparsam, aber andererseits auch sehr hungrig, wenn es ans Spielen geht. Durchschnittlich 550 Watt zeigte unser Messgerät beim Spieletest. Das verbaute Netzteil ist mit 500 Watt spezifiziert. Dennoch gab es beim Test keine Abstürze, die auf eine Überlastung hindeuten würden.
| Power Consumption | |
| 1920x1080 The Witcher 3 ultra (external Monitor) | |
| Zotac Magnus One (ECM73070C) (Idle: 37.6 W) | |
| AMD Ryzen 7 5800X (Idle: 77.5 W) | |
| AMD Ryzen 5 5600X (Idle: 79.23 W) | |
| Intel Core i5-10600K (Idle: 52.2 W) | |
| Intel Core i7-9700K, AMD Radeon RX Vega 64 | |
| MSI GeForce RTX 3070 Ventus 3X (Idle: 91.46 W) | |
| Prime95 V2810 Stress (external Monitor) | |
| AMD Ryzen 7 5800X (Idle: 77.5 W) | |
| Intel Core i7-9700K, AMD Radeon RX Vega 64 | |
| Intel Core i5-10600K (Idle: 52.2 W) | |
| AMD Ryzen 5 5600X (Idle: 79.23 W) | |
| Zotac Magnus One (ECM73070C) (Idle: 37.6 W) | |
| Cinebench R15 Multi (external Monitor) | |
| AMD Ryzen 7 5800X (Idle: 77.5 W) | |
| Intel Core i7-9700K, AMD Radeon RX Vega 64 | |
| Intel Core i5-10600K (Idle: 52.2 W) | |
| AMD Ryzen 5 5600X (Idle: 79.23 W) | |
| Zotac Magnus One (ECM73070C) (Idle: 37.6 W) | |
| Temperatures - CPU Temperature Prime95 | |
| AMD Ryzen 7 5800X | |
| Intel Core i5-10600K | |
* ... kleinere Werte sind besser
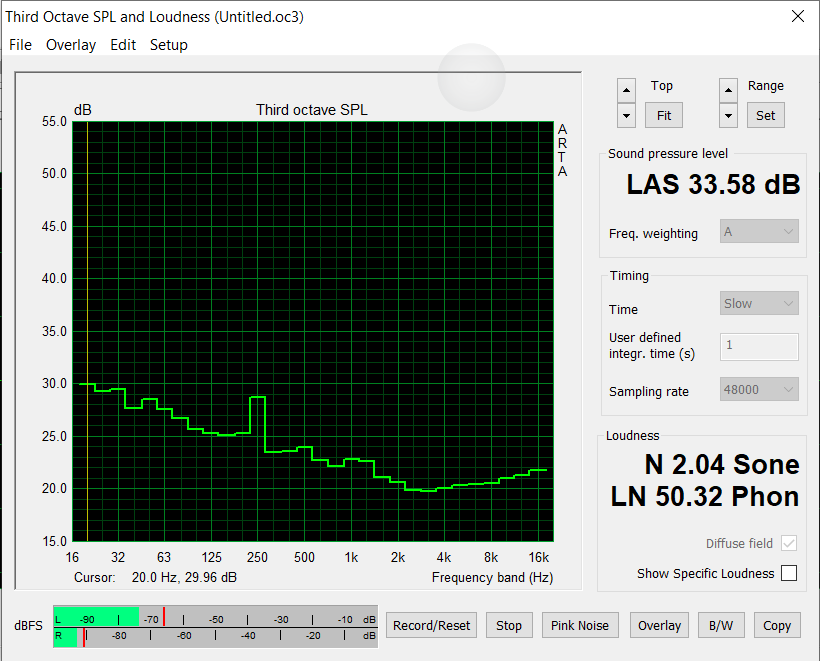
Lautstärkediagramm
| Idle |
| 33.58 / / dB(A) |
| Last |
| 44.25 / 48.72 dB(A) |
 | ||
30 dB leise 40 dB(A) deutlich hörbar 50 dB(A) störend |
||
min: | ||
Pro
Contra
Fazit - Gute Leistung und gute Ausstattung
Der Magnus One von Zotac ist ein kompaktes Gerät und bietet auf geringsten Raum eine sehr gute Leistung. Man beachte, dass es sich hierbei um ein Barebone System handelt, bei dem RAM, Massenspeicher und auch das Betriebssystem nicht Bestandteil der UVP von 1.499 Euro sind. Realistische Straßenpreise sind zum Testzeitpunkt allerdings ab 1.650 Euro und aufwärts. Wer den Magnus One aber preiswert ergattern kann, macht unterm Strich vielleicht sogar ein Schnäppchen, denn die GeForce RTX 3070 geht einzeln schon deutlich über 1.000 Euro über den Ladentisch. Mit dem Intel Core i7-10700 gibt es nicht die neueste Version der Core-Prozessoren, was aber im Alltag nicht stört. Insgesamt passt der kleine Core i7-10700, welcher in seiner TDP nicht beschnitten wurde, gut zum gesamten System. Bei unseren 3D- und Spiele-Benchmarks kann der Magnus One allerdings besser Punkten, als bei den reinen CPU-Tests. Hier ist AMD mit den Ryzen der 5000er-Serie etwas besser aufgestellt. Vielleicht nimmt Zotac sich ja mal vor, auch ein System auf AMD-Basis auf die Beine zu stellen.
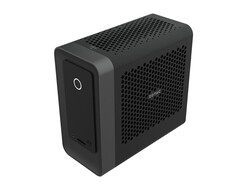
Der Magnus One ist ein leistungsstarkes und kompaktes System, welches auch ohne RGB ein Blickfang ist.
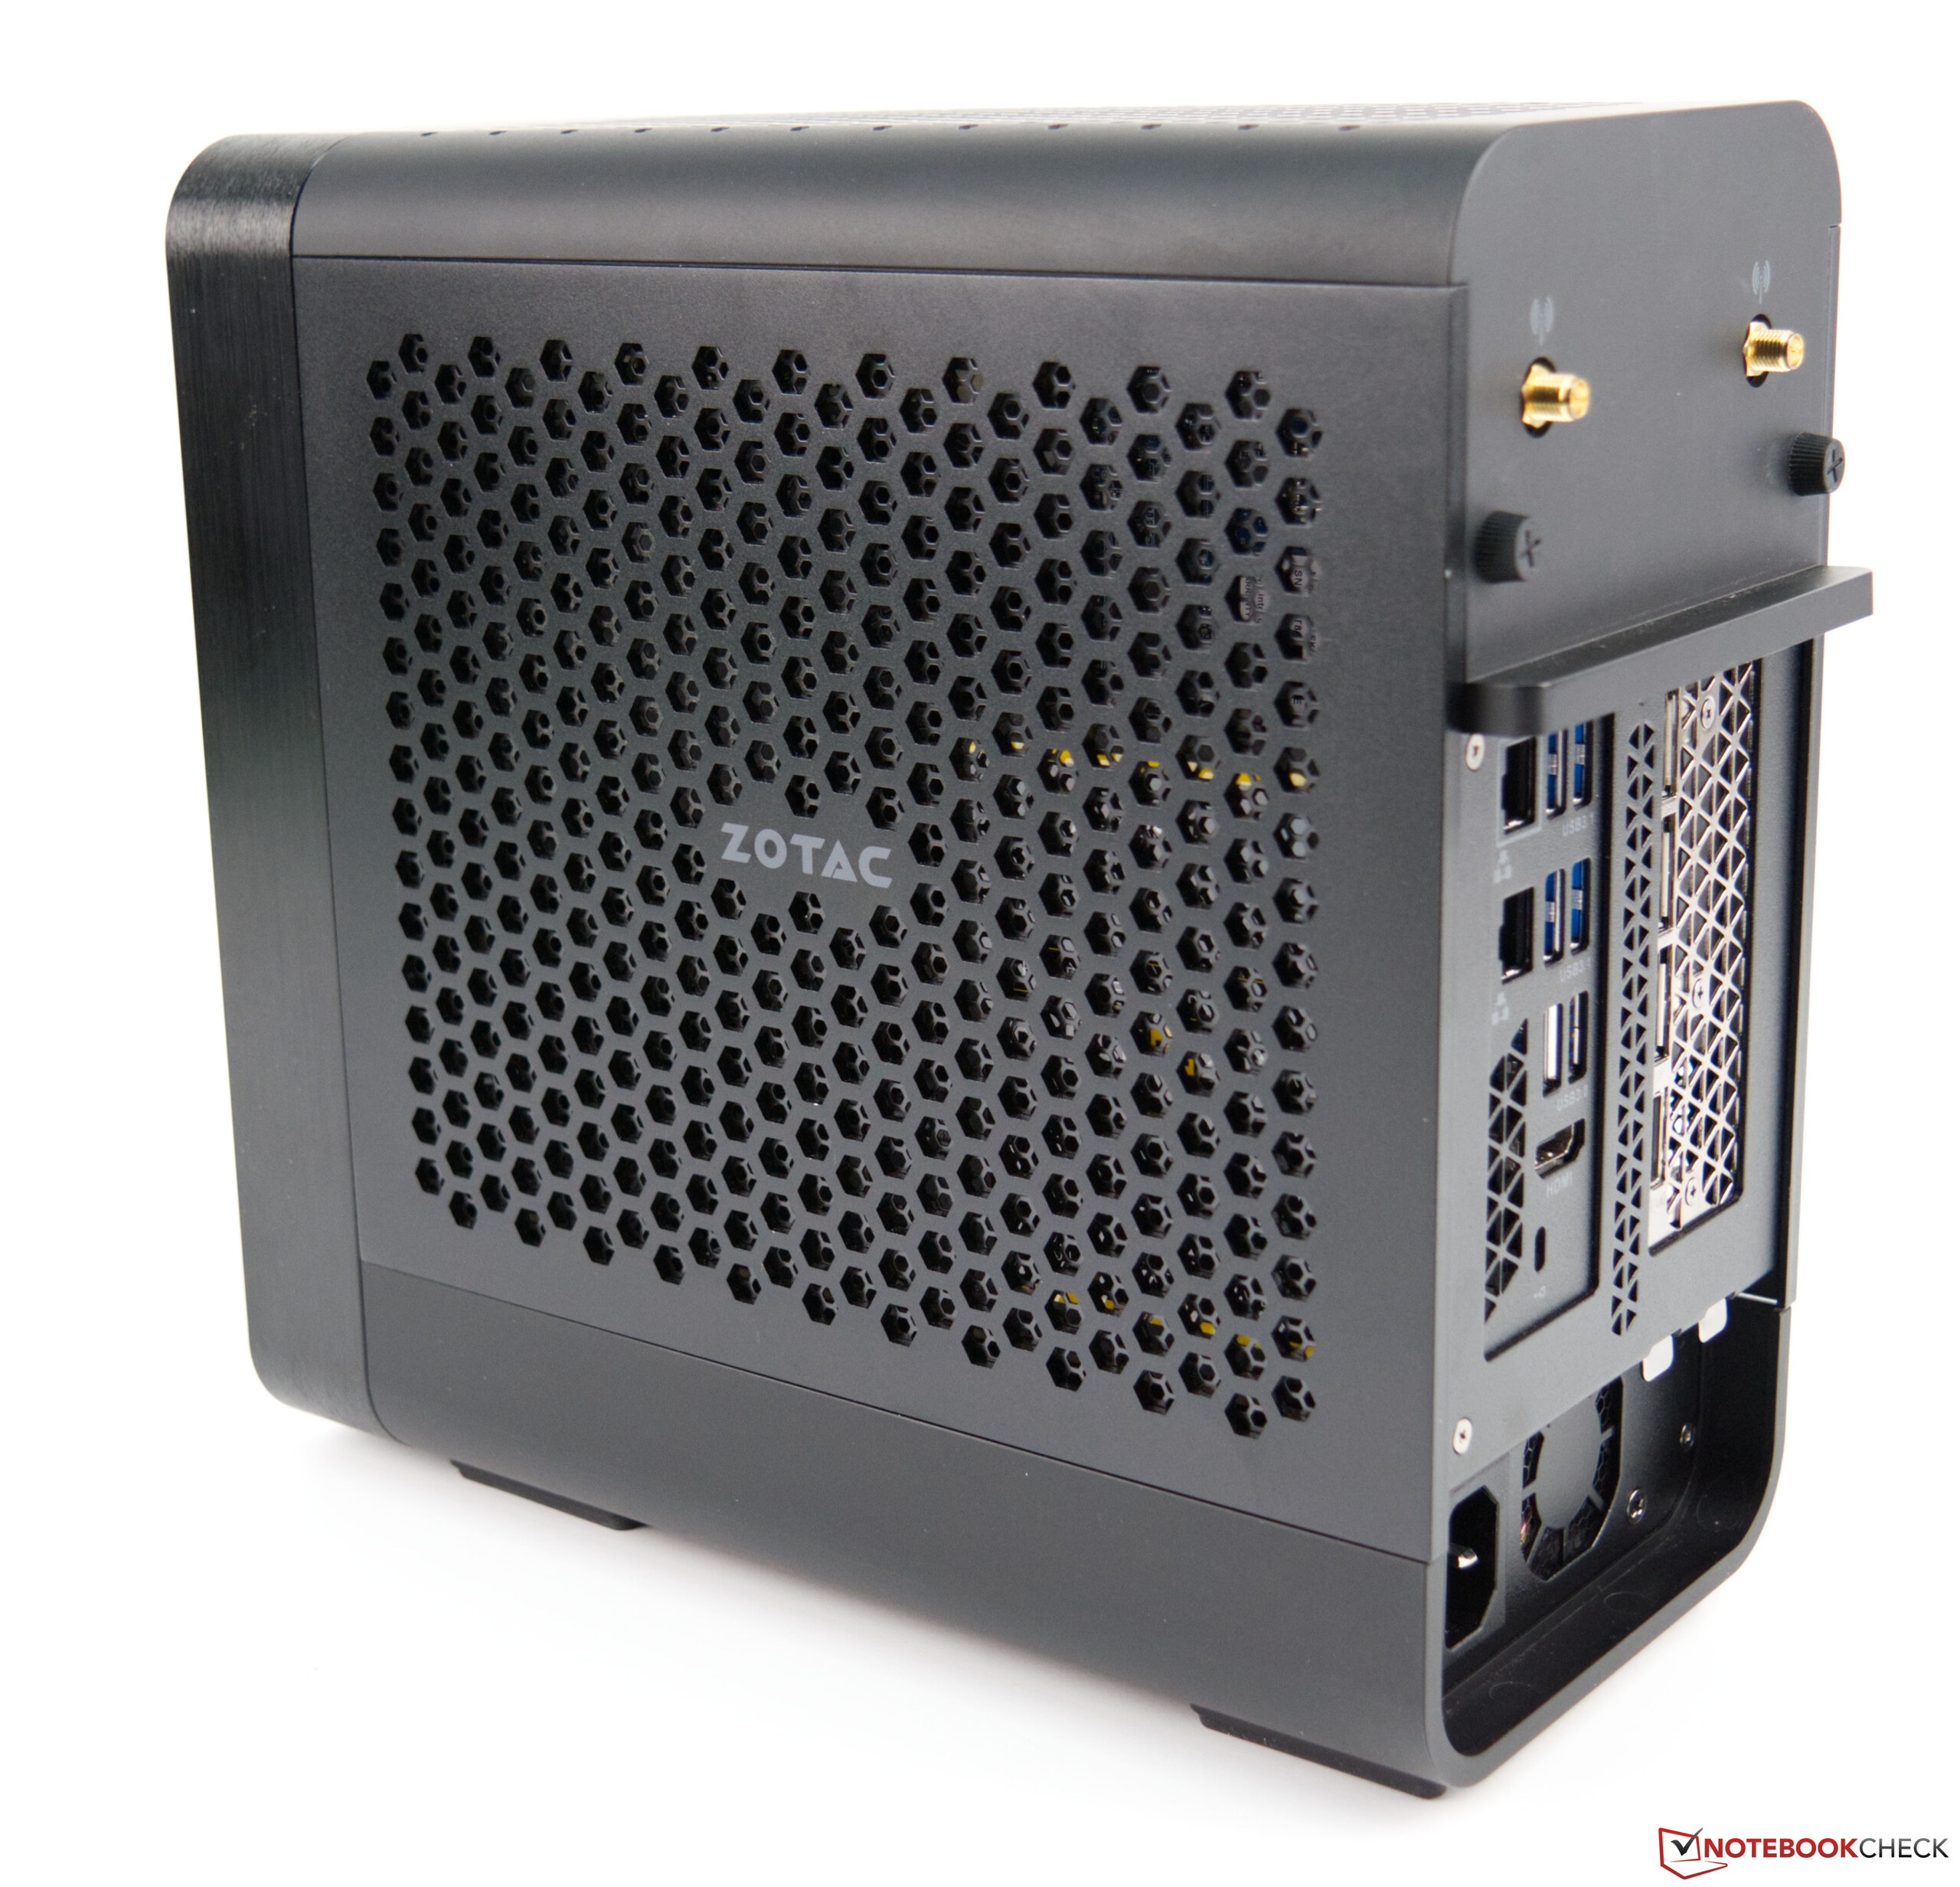
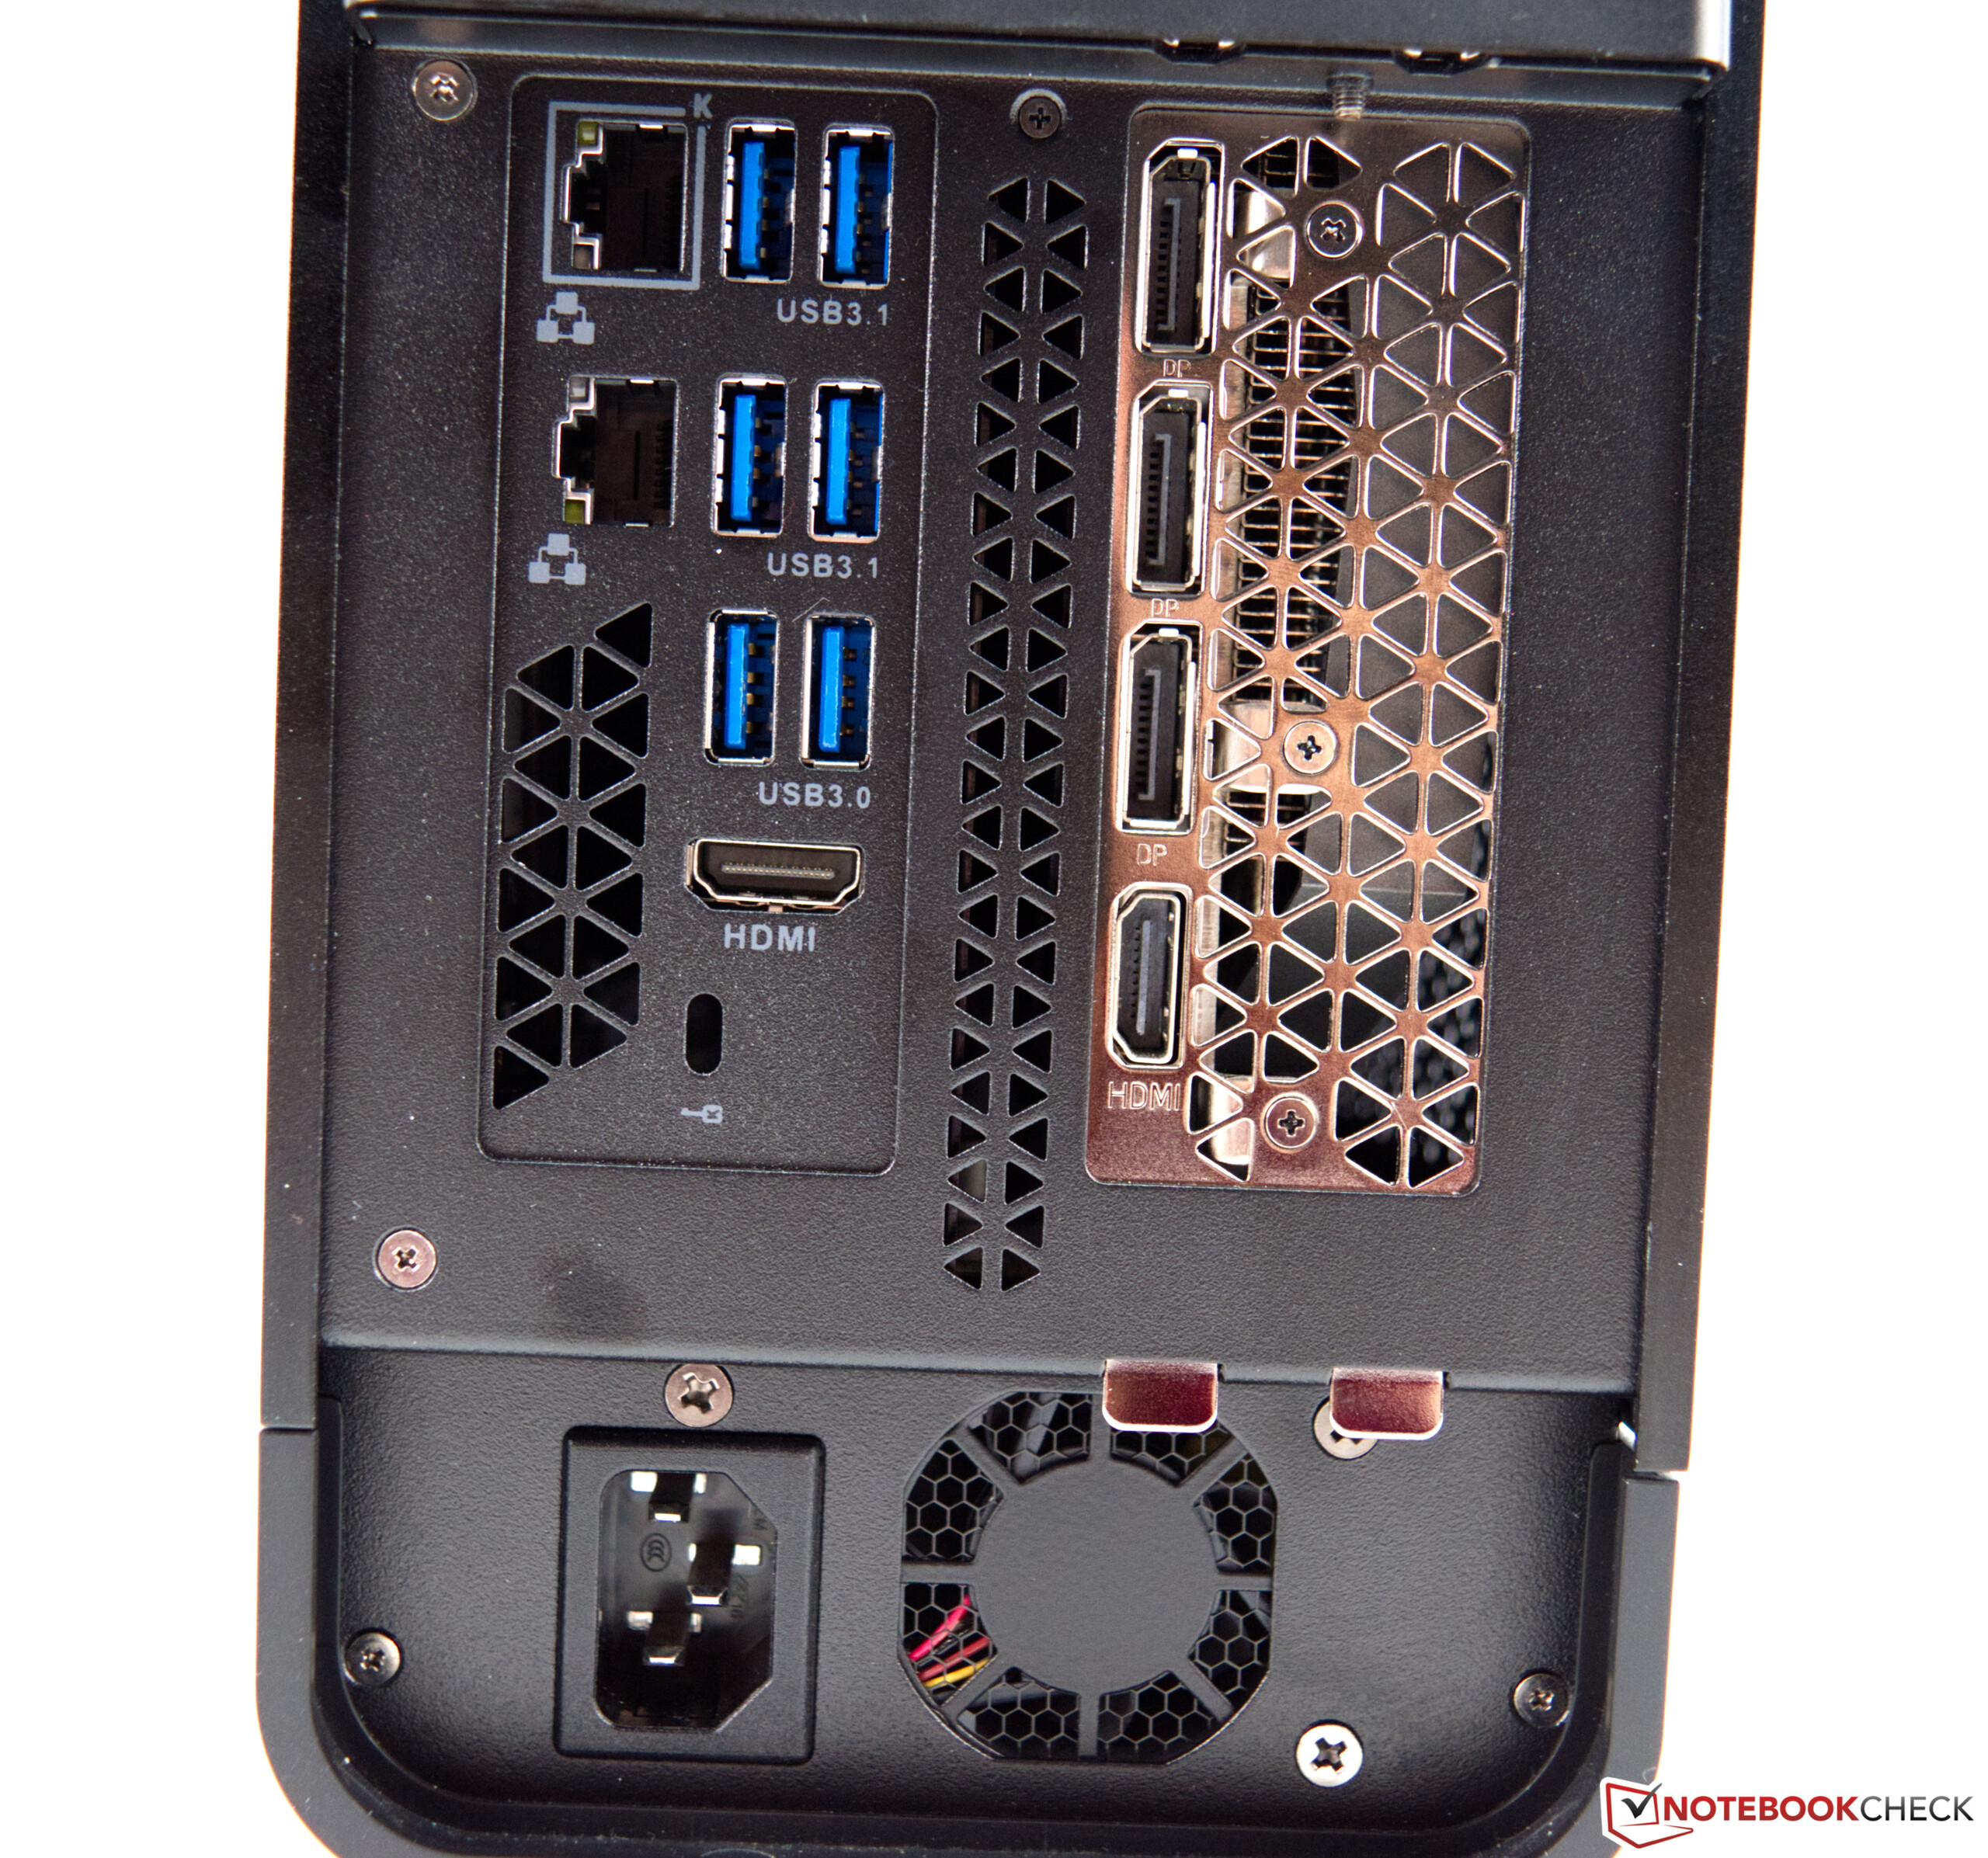
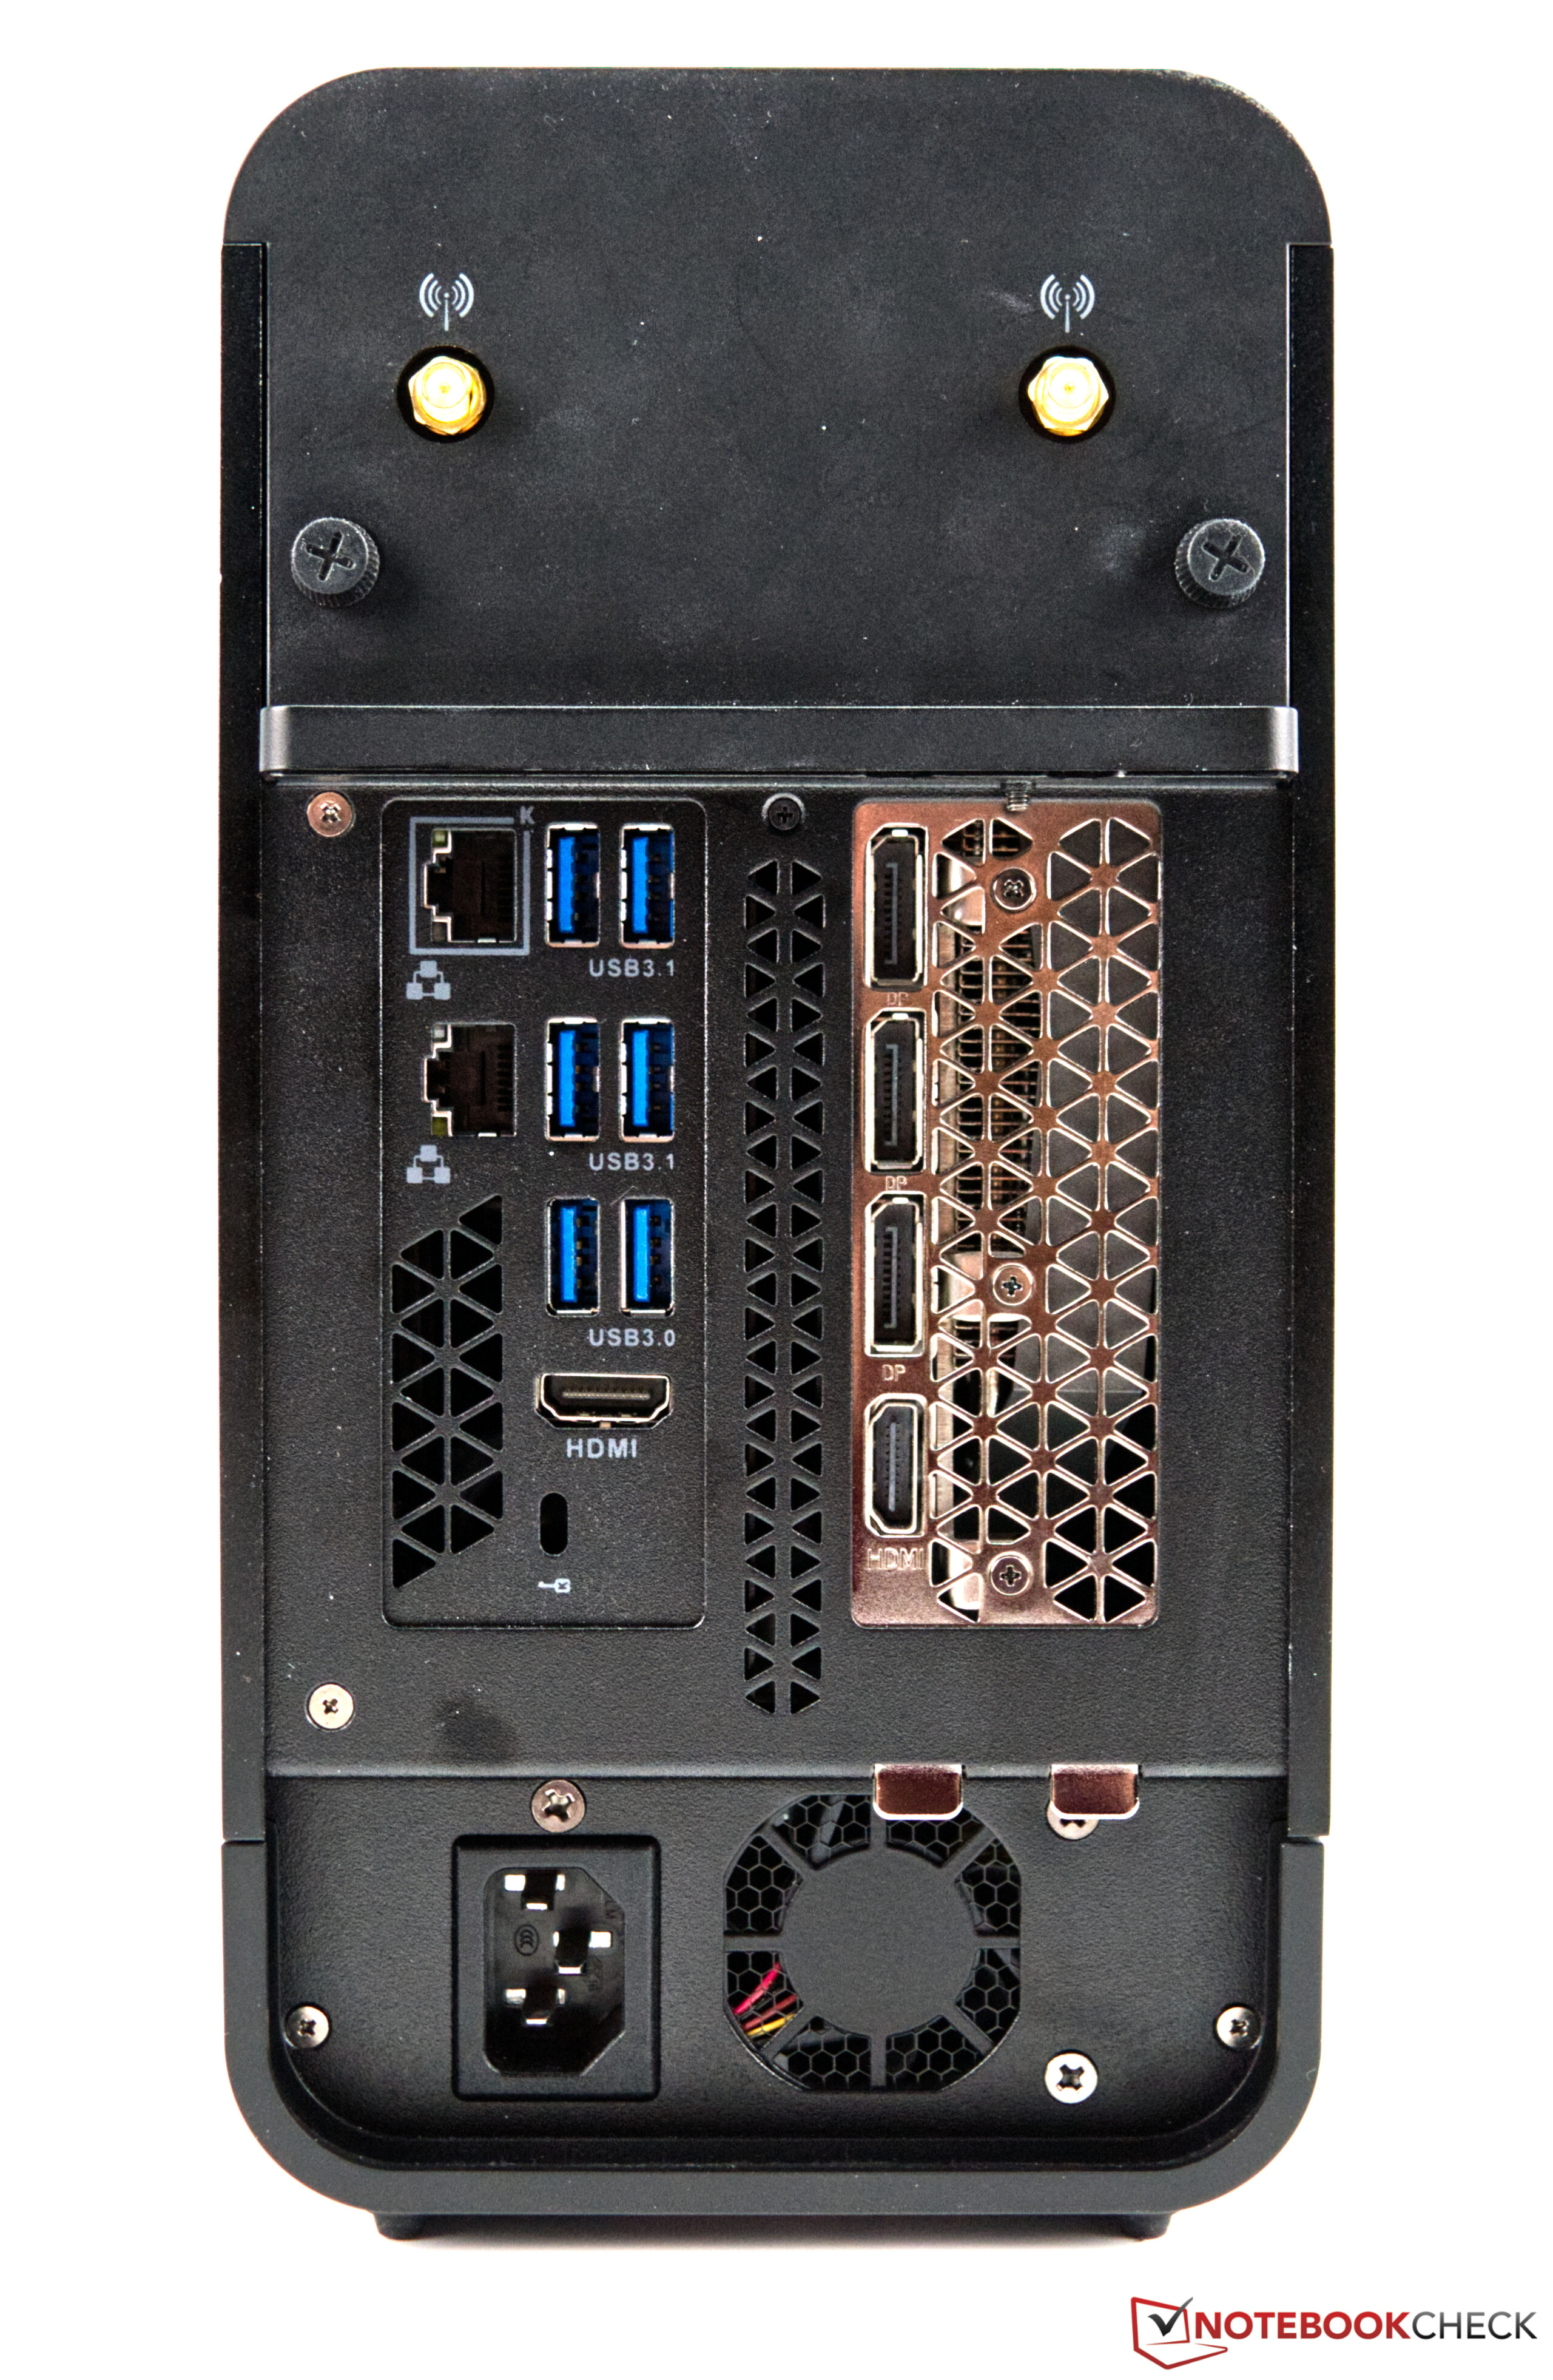
Gut gelungen ist die Optik ohne viel Schnick Schnack und auf RGB-Spektakel wurde gänzlich verzichtet. Das muss nicht unbedingt schlecht sein, denn viele wünschen sich ein schlichtes Gehäuse, was Zotac mit dem Magnus One gelungen ist. Zudem kommt die sehr gute Materialauswahl, denn das Gehäuse besteht zum größten Teil aus Metall. Vielseitig sind auch die Anschlussmöglichkeiten, die kaum Wünsche offenlässt. Kritikwürdig ist jedoch die etwas präsente Kühlung unter Last.
Alternativen zu dem Zotac Magnus One gibt es jedoch nicht viele, da sich die bekannten Hersteller meistens auf Komplettsysteme konzentrieren. Für einen Vergleich kann man sich aber gern einmal die MSI MEG Trident X Serie anschauen. Hier gibt es eine ähnliche Ausstattung in einem formschönen kompakten Gehäuse.
