


Intel NUC 12 Dragon Canyon mit Intel Core i9-12900 im Test
Das aktuelle Intel NUC 12 Extreme Kit kommt mit dem bereits bekannten Compute-Element daher. Dennoch gibt es wesentliche Änderungen, denn mit einer gesockelten CPU auf Basis des LGA1700 lässt sich das Compute-Element sogar mit verschiedenen Prozessoren betreiben. Mit dem bereits installierten Intel Core i9-12900 bekommt man derzeit ein richtig schnelles und kompaktes System geliefert.
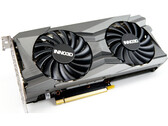
Intel Core i9-12900, NVIDIA GeForce RTX 3060