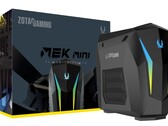
Notebookcheck Logo

NVIDIA GeForce RTX 2070 Super (Desktop)

Die Nvidia GeForce RTX 2070 Super (2070S) ist eine High-End Desktop Grafikkarte von Mitte 2019. Die RTX 2070 Super ist das Facelift-Modell der älteren Nvidia GeForce RTX 2070 und bietet eine etwas gesteigerte Performance. Damit schließt diese die Lücke zur etwas schnelleren Nvidia GeForce RTX 2080 und ist zum Release am 02.07.2019 die drittschnellste Grafikkarte auf Basis der Turing-Architektur für Consumer nach den beiden schnelleren RTX 2080 und RTX 2080 Ti die viertschnellste Turing-Grafikkarte für Desktop-PCs im Consumer-Bereich, wenn wir die Nvidia Titan RTX mit einbeziehen. Die GPU verfügt über 2.560 Shadereinheiten / Kerne und basiert nun auf dem TU104-Chip (Nvidia GeForce RTX 2070 = TU106, 2.304 Kerne). Der VRAM bleibt mit 8-GB-GDDR6-Speicher und dem 256-Bit-Interface (14 GHz, 448 GB/s) unangetastet.

Features

Der TU104-Chip wird in 12nm gefertigt und bietet eine Reihe neuer Features, wie DLSS (Deep Learning Super Sampling) und Real Time Ray Tracing. Dadurch lassen sich vor allem Bleuchtungseffekte sehr viel realistischer darstellen. Weiterhin gibt es Support für DisplayPort 1.4 (ready), HDMI 2.0b, HDR, Simultaneous Multi-Projection (SMP) sowie H.265 Video De- und Encoding (PlayReady 3.0). Außerdem erweitert Nvidia die Möglichkeit NVLink einzusetzen. Dies war bislang nur ab der Nvidia GeForce RTX 2080 möglich.

Performance

Die Performance der GeForce RTX 2070 Super liegt etwas über dem Niveau einer GeForce GTX 1080 Ti. Werden auch die neuen Features unterstützt, so ist die GeForce RTX 2070S der GeForce GTX 1080 Ti deutlich überlegen. Damit ordnet sich die RTX 2070 Super im absoluten High-End-Segment ein und kann die meisten Spiele der Jahre 2018 und 2019 in hohen Einstellungen und in 2.160p flüssig darstellen. Gegenüber AMD sollte es die Nvidia GeForce RTX 2070 Super mit AMD's kommender Navi-Generation aufnehmen können (z.B. die AMD Radeon 5700 XT).

Leistungsaufnahme

Die Leistungsaufnahme der GeForce RTX 2070 Super wird vom Hersteller mit 215 Watt beziffert und liegt damit etwas über dem Vorgängermodell (GeForce RTX 2070 175 Watt). Im Vergleich zur ähnlich schnellen GeForce GTX 1080 Ti, ist der Stromverbrauch jedoch deutlich geringer (z.B. 339 versus 296 Watt in unserem Test des Systems mit The Witcher 3).

GeForce RTX 2000 Serie

Titan RTX compare 4608 @ 1.35 - 1.77 GHz384 Bit @ 14000 MHz
GeForce RTX 2080 Ti (Desktop) compare 4352 @ 1.35 - 1.55 GHz352 Bit @ 14000 MHz
GeForce RTX 2080 Super (Desktop) compare 3072 @ 1.65 - 1.82 GHz256 Bit @ 15500 MHz
GeForce RTX 2080 (Desktop) compare 2944 @ 1.52 - 1.71 GHz256 Bit @ 14000 MHz
GeForce RTX 2080 Super Mobile compare 3072 @ 1.37 - 1.56 GHz256 Bit @ 14000 MHz
GeForce RTX 2080 Mobile compare 2944 @ 1.38 - 1.59 GHz256 Bit @ 14000 MHz
GeForce RTX 2070 Super (Desktop) 2560 @ 1.61 - 1.77 GHz256 Bit @ 14000 MHz
GeForce RTX 2070 (Desktop) compare 2304 @ 1.41 - 1.62 GHz256 Bit @ 14000 MHz
GeForce RTX 2070 Super Mobile compare 2560 @ 1.14 - 1.38 GHz256 Bit @ 14002 MHz
GeForce RTX 2080 Super Max-Q compare 3072 @ 0.98 - 1.23 GHz256 Bit @ 11000 MHz
GeForce RTX 2060 Super (Desktop) compare 2176 @ 1.47 - 1.65 GHz256 Bit @ 14000 MHz
GeForce RTX 2070 Mobile compare 2304 @ 1.22 - 1.44 GHz256 Bit @ 14000 MHz
GeForce RTX 2080 Max-Q compare 2944 @ 0.74 - 1.1 GHz256 Bit @ 12000 MHz
GeForce RTX 2060 (Desktop) compare 1920 @ 1.32 - 1.62 GHz192 Bit @ 14000 MHz
GeForce RTX 2070 Super Max-Q compare 2560 @ 0.93 - 1.16 GHz256 Bit @ 11000 MHz
GeForce RTX 2070 Max-Q compare 2304 @ 0.89 - 1.19 GHz256 Bit @ 12000 MHz
GeForce RTX 2060 Mobile compare 1920 @ 0.96 - 1.2 GHz192 Bit @ 14000 MHz
GeForce RTX 2060 Max-Q compare 1920 @ 0.98 - 1.19 GHz192 Bit @ 11000 MHz
GeForce RTX 2050 Mobile compare 2048 @ 1.48 GHz64 Bit @ 14000 MHz
CodenameTuring TU104
ArchitekturTuring
Pipelines2560 - unified
Kerntakt1605 - 1770 (Boost) MHz
Speichertakt14000 MHz
Speicherbandbreite256 Bit
SpeichertypGDDR6
Max. Speichergröße8 GB
Shared Memorynein
APIDirectX 12_1, Shader 6.4, OpenGL 4.6
Transistoren13.6 Billion
Herstellungsprozess12 nm
FeaturesDLSS, Raytraycing, NVLink, VR Ready, G-SYNC, Vulkan, Multi Monitor, 650 Watt system power recommended
Erscheinungsdatum02.07.2019

Benchmarks

Performance Rating - 3DMark 11 + Fire Strike + Time Spy
10.9 pt (33%)
Suchen: Modell: Max. Alter: Jahre
3DMark - 3DMark Speed Way Score
min: 2052     avg: 2056     median: 2055.5 (14%)     max: 2059 Points
3DMark - 3DMark Steel Nomad
2329 Points (16%)
3DMark - 3DMark Steel Nomad Light
9643 Points (22%)
3DMark - 3DMark Solar Bay
44176 Points (18%)
3DMark - 3DMark Fire Strike Standard Score
min: 19159     avg: 22433     median: 22317 (34%)     max: 25161 Points
3DMark - 3DMark Fire Strike Standard Graphics
min: 22819     avg: 24689     median: 24640 (23%)     max: 25799 Points
3DMark - 3DMark Ice Storm Graphics
min: 282279     avg: 435219     median: 412756 (46%)     max: 559706 Points
3DMark - 3DMark Time Spy Score
min: 8968     avg: 9980     median: 10161 (26%)     max: 10684 Points
3DMark - 3DMark Time Spy Graphics
min: 9564     avg: 9833     median: 9871 (20%)     max: 10094 Points
Suchen: Modell: Max. Alter: Jahre
3DMark - 3DMark Ice Storm Unlimited Graphics
min: 430289     avg: 560164     median: 521878 (53%)     max: 706398 Points
3DMark - 3DMark Ice Storm Extreme Graphics
min: 257035     avg: 375783     median: 367516 (43%)     max: 458018 Points
3DMark - 3DMark Cloud Gate Score
min: 39552     avg: 59119     median: 58583 (55%)     max: 74872 Points
3DMark - 3DMark Cloud Gate Graphics
min: 124048     avg: 131988     median: 131200 (32%)     max: 140218 Points
3DMark - 3DMark Night Raid
min: 40932     avg: 54766     median: 53465.5 (50%)     max: 74742 Points
3DMark - 3DMark Night Raid Graphics Score
min: 85908     avg: 105186     median: 108948 (42%)     max: 122031 Points
3DMark 11 - 3DM11 Performance Score
min: 24879     avg: 29228     median: 28445 (34%)     max: 35274 Points
3DMark 11 - 3DM11 Performance GPU
min: 33257     avg: 34838     median: 34963.5 (27%)     max: 37235 Points
Suchen: Modell: Max. Alter: Jahre
3DMark Vantage
3DM Vant. Perf. total +
3DMark Vantage - 3DM Vant. Perf. total
min: 63944     avg: 86659     median: 89208.5 (26%)     max: 104274 Points
3DM Vant. Perf. GPU no PhysX +
3DMark Vantage - 3DM Vant. Perf. GPU no PhysX
min: 66235     avg: 87880     median: 90123 (49%)     max: 105040 Points
Suchen: Modell: Max. Alter: Jahre
3DMark 05 - 3DMark 05 - Standard
min: 43643     avg: 73660     median: 86593 (95%)     max: 90745 Points
Suchen: Modell: Max. Alter: Jahre
3DMark 06 3DMark 06 - Standard 1280x1024 +
3DMark 06
min: 34959     avg: 53857     median: 55752.5 (73%)     max: 68964 Points
Unigine Valley 1.0 - Unigine Valley 1.0 DX
min: 113.7     avg: 122.5     median: 124.5 (38%)     max: 127.4 fps
SPECviewperf 12
specvp12 sw-03 +
SPECviewperf 12 - specvp12 sw-03
min: 65.4     avg: 76.9     median: 72.5 (18%)     max: 95.1 fps
specvp12 snx-02 +
SPECviewperf 12 - specvp12 snx-02
min: 11.44     avg: 12.8     median: 12.2 (2%)     max: 15.1 fps
specvp12 showcase-01 +
SPECviewperf 12 - specvp12 showcase-01
min: 124.6     avg: 131     median: 129.7 (23%)     max: 141 fps
specvp12 mediacal-01 +
SPECviewperf 12 - specvp12 mediacal-01
min: 38.15     avg: 51.5     median: 42.5 (11%)     max: 88 fps
specvp12 maya-04 +
SPECviewperf 12 - specvp12 maya-04
min: 125.1     avg: 177.9     median: 169 (46%)     max: 229 fps
specvp12 energy-01 +
SPECviewperf 12 - specvp12 energy-01
min: 11.35     avg: 12.1     median: 12 (11%)     max: 13.4 fps
specvp12 creo-01 +
SPECviewperf 12 - specvp12 creo-01
min: 47.4     avg: 57     median: 54.8 (22%)     max: 69.6 fps
specvp12 catia-04 +
SPECviewperf 12 - specvp12 catia-04
min: 96.3     avg: 105.2     median: 101.7 (16%)     max: 120 fps
specvp12 3dsmax-05 +
SPECviewperf 12 - specvp12 3dsmax-05
min: 206.8     avg: 222.1     median: 216.4 (33%)     max: 247 fps
SPECviewperf 13 specvp13 sw-04 +
SPECviewperf 13 - specvp13 sw-04
min: 93.3     avg: 111.4     median: 101.1 (27%)     max: 142 fps
specvp13 snx-03 +
SPECviewperf 13 - specvp13 snx-03
min: 20.71     avg: 23     median: 22 (2%)     max: 27.1 fps
specvp13 showcase-02 +
SPECviewperf 13 - specvp13 showcase-02
min: 126     avg: 129.3     median: 128.8 (22%)     max: 135 fps
specvp13 medical-02 +
SPECviewperf 13 - specvp13 medical-02
min: 57.7     avg: 62     median: 62.4 (11%)     max: 63.8 fps
specvp13 maya-05 +
SPECviewperf 13 - specvp13 maya-05
min: 198.1     avg: 293.2     median: 299.6 (34%)     max: 347 fps
specvp13 energy-02 +
SPECviewperf 13 - specvp13 energy-02
min: 23.1     avg: 23.7     median: 23.8 (8%)     max: 24.11 fps
specvp13 creo-02 +
SPECviewperf 13 - specvp13 creo-02
min: 171     avg: 209.6     median: 212.8 (31%)     max: 246 fps
specvp13 catia-05 +
SPECviewperf 13 - specvp13 catia-05
min: 141.7     avg: 153.5     median: 151.9 (17%)     max: 166 fps
specvp13 3dsmax-06 +
SPECviewperf 13 - specvp13 3dsmax-06
min: 205.2     avg: 222.3     median: 217.2 (34%)     max: 247 fps
SPECviewperf 2020 specvp2020 solidworks-05 4k +
SPECviewperf 2020 - specvp2020 solidworks-05 4k
106 fps (25%)
specvp2020 snx-04 4k +
SPECviewperf 2020 - specvp2020 snx-04 4k
min: 18.09     avg: 19.7     median: 19.8 (2%)     max: 21.1 fps
specvp2020 medical-03 4k +
SPECviewperf 2020 - specvp2020 medical-03 4k
min: 10.16     avg: 11.1     median: 11.1 (7%)     max: 12 fps
specvp2020 maya-06 4k +
SPECviewperf 2020 - specvp2020 maya-06 4k
min: 178     avg: 183     median: 185 (27%)     max: 186 fps
specvp2020 energy-03 4k +
SPECviewperf 2020 - specvp2020 energy-03 4k
min: 17.8     avg: 23.6     median: 25.9 (6%)     max: 27.08 fps
specvp2020 creo-03 4k +
SPECviewperf 2020 - specvp2020 creo-03 4k
min: 72.5     avg: 82.4     median: 85.8 (38%)     max: 88.8 fps
specvp2020 catia-06 4k +
SPECviewperf 2020 - specvp2020 catia-06 4k
min: 34.45     avg: 36.2     median: 36.7 (24%)     max: 37.4 fps
specvp2020 3dsmax-07 4k +
SPECviewperf 2020 - specvp2020 3dsmax-07 4k
min: 65.5     avg: 67.9     median: 68.5 (23%)     max: 69.7 fps
Cinebench R10 Cinebench R10 Shading (32bit) +
Cinebench R10 - Cinebench R10 Shading (32bit)
6820 Punkte (5%)
Cinebench R11.5 Cinebench R11.5 OpenGL 64 Bit +
Cinebench R11.5 - Cinebench R11.5 OpenGL 64 Bit
90.9 fps (9%)
Cinebench R15
Cinebench R15 OpenGL 64 Bit +
Cinebench R15 - Cinebench R15 OpenGL 64 Bit
min: 114.5     avg: 127.5     median: 119.9 (7%)     max: 148 fps
Cinebench R15 OpenGL Ref. Match 64 Bit +
Cinebench R15 - Cinebench R15 OpenGL Ref. Match 64 Bit
99.6 % (100%)
Geekbench 6.6 - Geekbench 6.6 GPU OpenCL
103086 Punkte (26%)
Geekbench 6.6 - Geekbench 6.6 GPU Vulkan
98212 Punkte (24%)
LuxMark v2.0 64Bit - LuxMark v2.0 Room GPU
3404 Samples/s (12%)
LuxMark v2.0 64Bit - LuxMark v2.0 Sala GPU
7594 Samples/s (13%)
ComputeMark v2.1 - ComputeMark v2.1 Result
min: 18083     avg: 18184     median: 18095 (15%)     max: 18374 Punkte
Power Consumption - Furmark Stress Test Power Consumption - external Monitor *
min: 280     avg: 329.5     median: 334.5 (45%)     max: 357.6 Watt
0102030405060708090100110120130140150160170180190200210220230240250260270280290300310320330340350360370Tooltip
Power Consumption - The Witcher 3 Power Consumption - external Monitor *
min: 296     avg: 341.9     median: 348.9 (49%)     max: 376.7 Watt
0153045607590105120135150165180195210225240255270285300315330345360375390405420435450465480495510Tooltip
Power Consumption - Power Efficiency - Witcher 3 ultra external Monitor
min: 0.2672     avg: 0.3     median: 0.3 (24%)     max: 0.348 fps per Watt
Power Consumption - Cyberpunk 2077 Power Consumption - external Monitor *
434 Watt (55%)
0102030405060708090100110120130140150160170180190200210220230240250260270280290300310320330340350360370380390400410420430440450460470480490Tooltip
Clock Speed - GPU Clock Witcher 3 ultra
1890 MHz (74%)
Clock Speed - GPU Clock Speed Furmark
min: 1620     avg: 1638     median: 1635 (65%)     max: 1670 MHz
- Bereich der Benchmarkergebnisse
red legend - Durchschnittliche Benchmarkergebnisse
* Kleinere Werte sind besser

Spiele-Benchmarks

Die folgenden Benchmarks basieren auf unseren Spieletests mit Testnotebooks. Die Performance dieser Grafikkarte bei den gelisteten Spielen ist abhängig von der verwendeten CPU, Speicherausstattung, Treiber und auch Betriebssystem. Dadurch müssen die untenstehenden Werte nicht repräsentativ sein. Detaillierte Informationen über das verwendete System sehen Sie nach einem Klick auf den fps-Wert.

min. 1920x1080
73  fps    + Vergleich
mittel 1920x1080
55  fps    + Vergleich
hoch 1920x1080
41  fps    + Vergleich
max. 1920x1080
22  fps    + Vergleich
QHD 2560x1440
16  fps    + Vergleich
4K 3840x2160
8  fps    + Vergleich
4K DLSS 3840x2160
17  fps    + Vergleich
QHD DLSS 2560x1440
24  fps    + Vergleich
» In Detailstufe hoch mit allen getesteten Notebooks spielbar
Additional Benchmarks
low TSR 100 1280x720
117
min. 1920x1080
199.6  fps    + Vergleich + 📈 Graph
mittel 1920x1080
134.4  fps    + Vergleich + 📈 Graph
hoch 1920x1080
107.3  fps    + Vergleich + 📈 Graph
max. 1920x1080
98.6  fps    + Vergleich + 📈 Graph
QHD 2560x1440
63.8  fps    + Vergleich + 📈 Graph
4K 3840x2160
32.1  fps    + Vergleich + 📈 Graph
» In Detailstufe max. mit allen getesteten Notebooks spielbar
Additional Benchmarks
Very Low Preset 1280x720
347
min. 1920x1080
156.4  fps    + Vergleich + 📈 Graph
mittel 1920x1080
96.4  fps    + Vergleich + 📈 Graph
hoch 1920x1080
77.3  fps    + Vergleich + 📈 Graph
max. 1920x1080
63.5  fps    + Vergleich + 📈 Graph
QHD 2560x1440
40.5  fps    + Vergleich + 📈 Graph
4K 3840x2160
22.2  fps    + Vergleich + 📈 Graph
4K DLSS 3840x2160
22.1  fps    + Vergleich + 📈 Graph
» In Detailstufe max. mit allen getesteten Notebooks spielbar
Additional Benchmarks
Low Preset 1280x720
211
Ultra Preset + Ultra Ray Tracing + DLSS Quality 2560x1440
38.3
F1 24

F1 24

2024
min. 1920x1080
277  fps    + Vergleich
mittel 1920x1080
231  fps    + Vergleich
hoch 1920x1080
172.9  fps    + Vergleich
max. 1920x1080
54.1  fps    + Vergleich
QHD 2560x1440
34.8  fps    + Vergleich
4K 3840x2160
17  fps    + Vergleich
4K DLSS 3840x2160
29.9  fps    + Vergleich
QHD DLSS 2560x1440
56  fps    + Vergleich
» In Detailstufe max. mit allen getesteten Notebooks spielbar
min. 1920x1080
57.2  fps    + Vergleich + 📈 Graph
mittel 1920x1080
47.9  fps    + Vergleich + 📈 Graph
hoch 1920x1080
35.7  fps    + Vergleich + 📈 Graph
QHD 2560x1440
24.3  fps    + Vergleich + 📈 Graph
4K 3840x2160
11.1  fps    + Vergleich + 📈 Graph
4K DLSS 3840x2160
23.6  fps    + Vergleich + 📈 Graph
QHD DLSS 2560x1440
37.6  fps    + Vergleich + 📈 Graph
» In Detailstufe hoch mit allen getesteten Notebooks spielbar
min. 1920x1080
95.9  fps    + Vergleich + 📈 Graph
mittel 1920x1080
80.5  fps    + Vergleich + 📈 Graph
hoch 1920x1080
73.4  fps    + Vergleich + 📈 Graph
max. 1920x1080
60.1  fps    + Vergleich + 📈 Graph
QHD 2560x1440
29.7  fps    + Vergleich + 📈 Graph
4K 3840x2160
12.9  fps    + Vergleich + 📈 Graph
4K DLSS 3840x2160
33.5  fps    + Vergleich + 📈 Graph
QHD DLSS 2560x1440
59.8  fps    + Vergleich + 📈 Graph
» In Detailstufe max. mit allen getesteten Notebooks spielbar
min. 1920x1080
107.6  fps    + Vergleich + 📈 Graph
mittel 1920x1080
95.9  fps    + Vergleich + 📈 Graph
hoch 1920x1080
67.5  fps    + Vergleich + 📈 Graph
max. 1920x1080
65.5  fps    + Vergleich + 📈 Graph
QHD 2560x1440
49.3  fps    + Vergleich + 📈 Graph
4K 3840x2160
28.8  fps    + Vergleich + 📈 Graph
4K DLSS 3840x2160
40.1  fps    + Vergleich + 📈 Graph
4K FSR 3840x2160
34.6  fps    + Vergleich + 📈 Graph
» In Detailstufe max. mit allen getesteten Notebooks spielbar
Additional Benchmarks
Very Low Preset 1280x720
157.2
min. 1920x1080
258  fps    + Vergleich + 📈 Graph
mittel 1920x1080
208  fps    + Vergleich + 📈 Graph
hoch 1920x1080
174.1  fps    + Vergleich + 📈 Graph
max. 1920x1080
95.1  fps    + Vergleich + 📈 Graph
QHD 2560x1440
46.2  fps    + Vergleich + 📈 Graph
4K 3840x2160
13.1  fps    + Vergleich + 📈 Graph
4K DLSS 3840x2160
31.8  fps    + Vergleich + 📈 Graph
4K FSR 3840x2160
46.1  fps    + Vergleich + 📈 Graph
» In Detailstufe max. mit allen getesteten Notebooks spielbar
Additional Benchmarks
Low Preset 1280x720
338
min. 1920x1080
65.8  fps    + Vergleich + 📈 Graph
hoch 1920x1080
59.2  fps    + Vergleich + 📈 Graph
QHD 2560x1440
44.9  fps    + Vergleich + 📈 Graph
4K 3840x2160
28.4  fps    + Vergleich + 📈 Graph
4K DLSS 3840x2160
33.6  fps    + Vergleich + 📈 Graph
4K FSR 3840x2160
31.3  fps    + Vergleich + 📈 Graph
» In Detailstufe hoch mit allen getesteten Notebooks spielbar
Additional Benchmarks
Low Preset 1280x720
84.4
min. 1920x1080
269  fps    + Vergleich + 📈 Graph
mittel 1920x1080
209  fps    + Vergleich + 📈 Graph
hoch 1920x1080
181.2  fps    + Vergleich + 📈 Graph
max. 1920x1080
131.2  fps    + Vergleich + 📈 Graph
QHD 2560x1440
84.6  fps    + Vergleich + 📈 Graph
4K 3840x2160
40.7  fps    + Vergleich + 📈 Graph
» In Detailstufe max. mit allen getesteten Notebooks spielbar
Additional Benchmarks
Very Low Preset 1280x720
297
min. 1920x1080
111  fps    + Vergleich
mittel 1920x1080
102  fps    + Vergleich
hoch 1920x1080
82  fps    + Vergleich
max. 1920x1080
62  fps    + Vergleich
QHD 2560x1440
50  fps    + Vergleich
4K 3840x2160
29  fps    + Vergleich
4K DLSS 3840x2160
46  fps    + Vergleich
4K FSR 3840x2160
43  fps    + Vergleich
» In Detailstufe max. mit allen getesteten Notebooks spielbar
Additional Benchmarks
Low Preset TAA 1280x720
142
min. 1920x1080
139.5  fps    + Vergleich + 📈 Graph
mittel 1920x1080
105.8  fps    + Vergleich + 📈 Graph
hoch 1920x1080
91.7  fps    + Vergleich + 📈 Graph
max. 1920x1080
90.3  fps    + Vergleich + 📈 Graph
QHD 2560x1440
63.7  fps    + Vergleich + 📈 Graph
4K 3840x2160
33.2  fps    + Vergleich + 📈 Graph
» In Detailstufe max. mit allen getesteten Notebooks spielbar
Additional Benchmarks
Low Preset 1280x720
194.7
min. 1920x1080
76  fps    + Vergleich + 📈 Graph
mittel 1920x1080
65.9  fps    + Vergleich + 📈 Graph
hoch 1920x1080
56.6  fps    + Vergleich + 📈 Graph
max. 1920x1080
47.4  fps    + Vergleich + 📈 Graph
QHD 2560x1440
36.8  fps    + Vergleich + 📈 Graph
4K 3840x2160
22.5  fps    + Vergleich + 📈 Graph
4K DLSS 3840x2160
32.6  fps    + Vergleich + 📈 Graph
4K FSR 3840x2160
31.5  fps    + Vergleich + 📈 Graph
» In Detailstufe max. mit allen getesteten Notebooks spielbar
Additional Benchmarks
Max. Performance 1280x720
123.6
Palworld

Palworld

2024
min. 1920x1080
143.7  fps    + Vergleich + 📈 Graph
mittel 1920x1080
120.1  fps    + Vergleich + 📈 Graph
hoch 1920x1080
94.4  fps    + Vergleich + 📈 Graph
max. 1920x1080
86.3  fps    + Vergleich + 📈 Graph
QHD 2560x1440
58.4  fps    + Vergleich + 📈 Graph
4K 3840x2160
31.2  fps    + Vergleich + 📈 Graph
4K DLSS 3840x2160
45  fps    + Vergleich + 📈 Graph
» In Detailstufe max. mit allen getesteten Notebooks spielbar
Additional Benchmarks
Very Low Preset 1280x720
239
mittel 1920x1080
359  fps    + Vergleich + 📈 Graph
hoch 1920x1080
359  fps    + Vergleich + 📈 Graph
max. 1920x1080
359  fps    + Vergleich + 📈 Graph
QHD 2560x1440
346  fps    + Vergleich + 📈 Graph
4K 3840x2160
176.2  fps    + Vergleich + 📈 Graph
» In Detailstufe max. mit allen getesteten Notebooks spielbar
min. 1920x1080
227  fps    + Vergleich + 📈 Graph
mittel 1920x1080
206  fps    + Vergleich + 📈 Graph
hoch 1920x1080
187.4  fps    + Vergleich + 📈 Graph
max. 1920x1080
122.1  fps    + Vergleich + 📈 Graph
QHD 2560x1440
68.9  fps    + Vergleich + 📈 Graph
4K 3840x2160
29.4  fps    + Vergleich + 📈 Graph
4K DLSS 3840x2160
65.4  fps    + Vergleich + 📈 Graph
» In Detailstufe max. mit allen getesteten Notebooks spielbar
min. 1920x1080
252  fps    + Vergleich + 📈 Graph
mittel 1920x1080
183.9  fps    + Vergleich + 📈 Graph
hoch 1920x1080
160.6  fps    + Vergleich + 📈 Graph
max. 1920x1080
122.6  fps    + Vergleich + 📈 Graph
QHD 2560x1440
75.7  fps    + Vergleich + 📈 Graph
4K 3840x2160
35.1  fps    + Vergleich + 📈 Graph
» In Detailstufe max. mit allen getesteten Notebooks spielbar
Additional Benchmarks
Low Preset 1280x720
346
Epic Preset + Epic RTX Global Illumination 1920x1080
115.7
min. 1920x1080
68  fps    + Vergleich
mittel 1920x1080
62  fps    + Vergleich
hoch 1920x1080
54  fps    + Vergleich
max. 1920x1080
41  fps    + Vergleich
QHD 2560x1440
26  fps    + Vergleich
4K 3840x2160
14  fps    + Vergleich
4K DLSS 3840x2160
23  fps    + Vergleich
» In Detailstufe max. mit allen getesteten Notebooks spielbar
Additional Benchmarks
Low Preset TAA 1280x720
98
min. 1920x1080
133  fps    + Vergleich
mittel 1920x1080
118  fps    + Vergleich
hoch 1920x1080
91  fps    + Vergleich
max. 1920x1080
90  fps    + Vergleich
QHD 2560x1440
85  fps    + Vergleich
4K 3840x2160
40  fps    + Vergleich
» In Detailstufe max. mit allen getesteten Notebooks spielbar
Additional Benchmarks
Minimum Preset 1280x720
195
min. 1920x1080
134.4  fps    + Vergleich + 📈 Graph
mittel 1920x1080
100.8  fps    + Vergleich + 📈 Graph
hoch 1920x1080
93.3  fps    + Vergleich + 📈 Graph
max. 1920x1080
85.5  fps    + Vergleich + 📈 Graph
QHD 2560x1440
62.2  fps    + Vergleich + 📈 Graph
4K 3840x2160
34.9  fps    + Vergleich + 📈 Graph
4K DLSS 3840x2160
50.8  fps    + Vergleich + 📈 Graph
» In Detailstufe max. mit allen getesteten Notebooks spielbar
Additional Benchmarks
Ultra Low Preset LowAA 1280x720
256
min. 1920x1080
56.1  fps    + Vergleich + 📈 Graph
mittel 1920x1080
50.4  fps    + Vergleich + 📈 Graph
hoch 1920x1080
47.3  fps    + Vergleich + 📈 Graph
QHD 2560x1440
31.4  fps    + Vergleich + 📈 Graph
4K 3840x2160
16.5  fps    + Vergleich + 📈 Graph
» In Detailstufe hoch mit allen getesteten Notebooks spielbar
Additional Benchmarks
Low Preset 1280x720
79.1
High Preset + High Ray Tracing 1920x1080
5.3
min. 1920x1080
83.2  fps    + Vergleich + 📈 Graph
mittel 1920x1080
69.6  fps    + Vergleich + 📈 Graph
hoch 1920x1080
51.5  fps    + Vergleich + 📈 Graph
max. 1920x1080
35.7  fps    + Vergleich + 📈 Graph
QHD 2560x1440
24.1  fps    + Vergleich + 📈 Graph
4K 3840x2160
11  fps    + Vergleich + 📈 Graph
4K DLSS 3840x2160
24.2  fps    + Vergleich + 📈 Graph
» In Detailstufe max. mit allen getesteten Notebooks spielbar
Additional Benchmarks
Low Preset 1280x720
124.1
min. 1920x1080
386.7  fps    + Vergleich
mittel 1920x1080
253.9  fps    + Vergleich
hoch 1920x1080
147.1  fps    + Vergleich
max. 1920x1080
114.7  fps    + Vergleich
QHD 2560x1440
79  fps    + Vergleich
4K 3840x2160
41.1  fps    + Vergleich
» In Detailstufe max. mit allen getesteten Notebooks spielbar
Additional Benchmarks
Low Preset 1280x720
546.5
min. 1920x1080
114  fps    + Vergleich
mittel 1920x1080
106  fps    + Vergleich
hoch 1920x1080
99  fps    + Vergleich
max. 1920x1080
79  fps    + Vergleich
QHD 2560x1440
62  fps    + Vergleich
4K 3840x2160
37  fps    + Vergleich
4K DLSS 3840x2160
51  fps    + Vergleich
» In Detailstufe max. mit allen getesteten Notebooks spielbar
Additional Benchmarks
Low Preset (Adaptive Quality Off) 1280x720
160
min. 1920x1080
254  fps    + Vergleich + 📈 Graph
mittel 1920x1080
230  fps    + Vergleich + 📈 Graph
hoch 1920x1080
185.1  fps    + Vergleich + 📈 Graph
max. 1920x1080
170.8  fps    + Vergleich + 📈 Graph
QHD 2560x1440
131.3  fps    + Vergleich + 📈 Graph
4K 3840x2160
76.5  fps    + Vergleich + 📈 Graph
» In Detailstufe max. mit allen getesteten Notebooks spielbar
Additional Benchmarks
Low Preset 1280x720
357
min. 1920x1080
341  fps    + Vergleich + 📈 Graph
mittel 1920x1080
316  fps    + Vergleich + 📈 Graph
hoch 1920x1080
218  fps    + Vergleich + 📈 Graph
max. 1920x1080
169.3  fps    + Vergleich + 📈 Graph
QHD 2560x1440
124.4  fps    + Vergleich + 📈 Graph
4K 3840x2160
55.2  fps    + Vergleich + 📈 Graph
» In Detailstufe max. mit allen getesteten Notebooks spielbar
Additional Benchmarks
Low Preset 1280x720
350
min. 1920x1080
117.2  fps    + Vergleich
mittel 1920x1080
95.9  fps    + Vergleich
hoch 1920x1080
84  fps    + Vergleich
max. 1920x1080
78.2  fps    + Vergleich
QHD 2560x1440
50.5  fps    + Vergleich
4K 3840x2160
24.6  fps    + Vergleich
» In Detailstufe max. mit allen getesteten Notebooks spielbar
Additional Benchmarks
Low Preset (FSR off) 1280x720
173
30min Start Ultra Preset (FSR off) 1920x1080
72.1
min. 1920x1080
126.1  fps    + Vergleich + 📈 Graph
mittel 1920x1080
102.4  fps    + Vergleich + 📈 Graph
hoch 1920x1080
87  fps    + Vergleich + 📈 Graph
max. 1920x1080
85.3  fps    + Vergleich + 📈 Graph
QHD 2560x1440
58.1  fps    + Vergleich + 📈 Graph
4K 3840x2160
30.6  fps    + Vergleich + 📈 Graph
» In Detailstufe max. mit allen getesteten Notebooks spielbar
Additional Benchmarks
Low Preset SMAA 1280x720
186.1
Lies of P

Lies of P

2023
min. 1920x1080
178.5  fps    + Vergleich + 📈 Graph
mittel 1920x1080
156.7  fps    + Vergleich + 📈 Graph
hoch 1920x1080
136.3  fps    + Vergleich + 📈 Graph
max. 1920x1080
120.8  fps    + Vergleich + 📈 Graph
QHD 2560x1440
80.3  fps    + Vergleich + 📈 Graph
4K 3840x2160
41.3  fps    + Vergleich + 📈 Graph
4K DLSS 3840x2160
65  fps    + Vergleich + 📈 Graph
» In Detailstufe max. mit allen getesteten Notebooks spielbar
Additional Benchmarks
Low Preset 1280x720
270
Starfield

Starfield

2023
min. 1920x1080
55.1  fps    + Vergleich + 📈 Graph
mittel 1920x1080
49  fps    + Vergleich + 📈 Graph
hoch 1920x1080
40.5  fps    + Vergleich + 📈 Graph
max. 1920x1080
36.6  fps    + Vergleich + 📈 Graph
QHD 2560x1440
30  fps    + Vergleich + 📈 Graph
4K 3840x2160
20.1  fps    + Vergleich + 📈 Graph
» In Detailstufe max. mit allen getesteten Notebooks spielbar
Additional Benchmarks
Low Preset 1280x720
68.6
min. 1920x1080
119.6  fps    + Vergleich + 📈 Graph
mittel 1920x1080
119.5  fps    + Vergleich + 📈 Graph
hoch 1920x1080
115.8  fps    + Vergleich + 📈 Graph
max. 1920x1080
99.5  fps    + Vergleich + 📈 Graph
QHD 2560x1440
73.1  fps    + Vergleich + 📈 Graph
4K 3840x2160
43.1  fps    + Vergleich + 📈 Graph
» In Detailstufe max. mit allen getesteten Notebooks spielbar
Additional Benchmarks
Low Preset 1280x720
119.5
min. 1920x1080
56.4  fps    + Vergleich + 📈 Graph
hoch 1920x1080
47.2  fps    + Vergleich + 📈 Graph
max. 1920x1080
36.6  fps    + Vergleich + 📈 Graph
QHD 2560x1440
24.8  fps    + Vergleich + 📈 Graph
4K 3840x2160
13.9  fps    + Vergleich + 📈 Graph
» In Detailstufe max. mit allen getesteten Notebooks spielbar
Additional Benchmarks
Low 1280x720
89.9
min. 1920x1080
141.2  fps    + Vergleich + 📈 Graph
mittel 1920x1080
133.7  fps    + Vergleich + 📈 Graph
hoch 1920x1080
123.1  fps    + Vergleich + 📈 Graph
max. 1920x1080
106.4  fps    + Vergleich + 📈 Graph
QHD 2560x1440
71.7  fps    + Vergleich + 📈 Graph
4K 3840x2160
40.6  fps    + Vergleich + 📈 Graph
» In Detailstufe max. mit allen getesteten Notebooks spielbar
Additional Benchmarks
Low Preset 1280x720
195.3
min. 1920x1080
86  fps    + Vergleich + 📈 Graph
mittel 1920x1080
74.8  fps    + Vergleich + 📈 Graph
hoch 1920x1080
60.2  fps    + Vergleich + 📈 Graph
max. 1920x1080
54  fps    + Vergleich + 📈 Graph
QHD 2560x1440
43.7  fps    + Vergleich + 📈 Graph
4K 3840x2160
29.7  fps    + Vergleich + 📈 Graph
» In Detailstufe max. mit allen getesteten Notebooks spielbar
Additional Benchmarks
Very Low Preset 1280x720
112.3
Very High Preset + Very High Raytracing TAA 1920x1080
35.4
F1 23

F1 23

2023
min. 1920x1080
308  fps    + Vergleich
mittel 1920x1080
273  fps    + Vergleich
hoch 1920x1080
187.3  fps    + Vergleich
max. 1920x1080
54.4  fps    + Vergleich
QHD 2560x1440
34.4  fps    + Vergleich
4K 3840x2160
16.5  fps    + Vergleich
4K DLSS 3840x2160
29.5  fps    + Vergleich
» In Detailstufe max. mit allen getesteten Notebooks spielbar
Additional Benchmarks
Ultra Low Preset TAA 1280x720
429
Diablo 4

Diablo 4

2023
min. 1920x1080
267  fps    + Vergleich + 📈 Graph
mittel 1920x1080
230  fps    + Vergleich + 📈 Graph
hoch 1920x1080
201  fps    + Vergleich + 📈 Graph
max. 1920x1080
164.3  fps    + Vergleich + 📈 Graph
QHD 2560x1440
107.9  fps    + Vergleich + 📈 Graph
4K 3840x2160
56  fps    + Vergleich + 📈 Graph
» In Detailstufe max. mit allen getesteten Notebooks spielbar
Additional Benchmarks
Low Preset 1280x720
394
min. 1920x1080
87.1  fps    + Vergleich + 📈 Graph
mittel 1920x1080
74.4  fps    + Vergleich + 📈 Graph
hoch 1920x1080
69.7  fps    + Vergleich + 📈 Graph
max. 1920x1080
65.6  fps    + Vergleich + 📈 Graph
QHD 2560x1440
41.6  fps    + Vergleich + 📈 Graph
4K 3840x2160
20.2  fps    + Vergleich + 📈 Graph
» In Detailstufe max. mit allen getesteten Notebooks spielbar
Additional Benchmarks
Low Preset 1280x720
149.1
Epic Preset + Ray Tracing 1920x1080
51.2
min. 1920x1080
260  fps    + Vergleich + 📈 Graph
mittel 1920x1080
221  fps    + Vergleich + 📈 Graph
hoch 1920x1080
162.1  fps    + Vergleich + 📈 Graph
max. 1920x1080
125  fps    + Vergleich + 📈 Graph
QHD 2560x1440
81.6  fps    + Vergleich + 📈 Graph
4K 3840x2160
39.2  fps    + Vergleich + 📈 Graph
» In Detailstufe max. mit allen getesteten Notebooks spielbar
Additional Benchmarks
Low Preset Low TAA 1280x720
318
min. 1920x1080
100.2  fps    + Vergleich + 📈 Graph
mittel 1920x1080
81  fps    + Vergleich + 📈 Graph
hoch 1920x1080
72.7  fps    + Vergleich + 📈 Graph
max. 1920x1080
50  fps    + Vergleich + 📈 Graph
QHD 2560x1440
34  fps    + Vergleich + 📈 Graph
4K 3840x2160
15.8  fps    + Vergleich + 📈 Graph
4K DLSS 3840x2160
6.1  fps    + Vergleich + 📈 Graph
» In Detailstufe max. mit allen getesteten Notebooks spielbar
Additional Benchmarks
Low Preset 1280x720
142.1
min. 1920x1080
136  fps    + Vergleich + 📈 Graph
mittel 1920x1080
94.8  fps    + Vergleich + 📈 Graph
hoch 1920x1080
87.5  fps    + Vergleich + 📈 Graph
» In Detailstufe hoch mit allen getesteten Notebooks spielbar
Additional Benchmarks
Prioritize Performance Preset 1280x720
204
min. 1920x1080
181.3  fps    + Vergleich
mittel 1920x1080
157.9  fps    + Vergleich
hoch 1920x1080
122.3  fps    + Vergleich
max. 1920x1080
120.2  fps    + Vergleich
QHD 2560x1440
88.4  fps    + Vergleich
4K 3840x2160
52.8  fps    + Vergleich
» In Detailstufe max. mit allen getesteten Notebooks spielbar
Additional Benchmarks
Minimum Settings 1280x720
304.1
min. 1920x1080
112.7  fps    + Vergleich + 📈 Graph
mittel 1920x1080
89.7  fps    + Vergleich + 📈 Graph
hoch 1920x1080
85.5  fps    + Vergleich + 📈 Graph
max. 1920x1080
83.4  fps    + Vergleich + 📈 Graph
QHD 2560x1440
64.5  fps    + Vergleich + 📈 Graph
4K 3840x2160
38.4  fps    + Vergleich + 📈 Graph
» In Detailstufe max. mit allen getesteten Notebooks spielbar
Additional Benchmarks
Ultra Low Preset 1280x720
136.3
min. 1920x1080
195.4  fps    + Vergleich + 📈 Graph
mittel 1920x1080
147.3  fps    + Vergleich + 📈 Graph
hoch 1920x1080
85.8  fps    + Vergleich + 📈 Graph
max. 1920x1080
68.3  fps    + Vergleich + 📈 Graph
QHD 2560x1440
52  fps    + Vergleich + 📈 Graph
4K 3840x2160
30.4  fps    + Vergleich + 📈 Graph
» In Detailstufe max. mit allen getesteten Notebooks spielbar
Additional Benchmarks
Low Preset 1280x720
291
Returnal

Returnal

2023
min. 1920x1080
104  fps    + Vergleich
mittel 1920x1080
100  fps    + Vergleich
hoch 1920x1080
89  fps    + Vergleich
max. 1920x1080
77  fps    + Vergleich
QHD 2560x1440
57  fps    + Vergleich
4K 3840x2160
33  fps    + Vergleich
» In Detailstufe max. mit allen getesteten Notebooks spielbar
Additional Benchmarks
Low Preset 1280x720
136
Epic Preset + Epic Ray-Tracing 1920x1080
61
Epic Preset + Epic Ray-Tracing 3840x2160
23
min. 1920x1080
140.8  fps    + Vergleich + 📈 Graph
mittel 1920x1080
107.8  fps    + Vergleich + 📈 Graph
hoch 1920x1080
84.3  fps    + Vergleich + 📈 Graph
max. 1920x1080
68.4  fps    + Vergleich + 📈 Graph
QHD 2560x1440
47.4  fps    + Vergleich + 📈 Graph
4K 3840x2160
25.1  fps    + Vergleich + 📈 Graph
» In Detailstufe max. mit allen getesteten Notebooks spielbar
Additional Benchmarks
Low Preset Low TAA 1280x720
168.6
Ultra Preset + Full Ray Tracing High TAA 1920x1080
42.3
Ultra Preset + Full Ray Tracing High TAA 3840x2160
15.5
min. 1920x1080
94  fps    + Vergleich + 📈 Graph
mittel 1920x1080
88.9  fps    + Vergleich + 📈 Graph
hoch 1920x1080
76.8  fps    + Vergleich + 📈 Graph
max. 1920x1080
74.8  fps    + Vergleich + 📈 Graph
QHD 2560x1440
50.8  fps    + Vergleich + 📈 Graph
4K 3840x2160
26  fps    + Vergleich + 📈 Graph
» In Detailstufe max. mit allen getesteten Notebooks spielbar
Additional Benchmarks
Low Preset TAA 1280x720
140.6
min. 1920x1080
223  fps    + Vergleich + 📈 Graph
mittel 1920x1080
177.1  fps    + Vergleich + 📈 Graph
hoch 1920x1080
149.6  fps    + Vergleich + 📈 Graph
max. 1920x1080
119.6  fps    + Vergleich + 📈 Graph
QHD 2560x1440
85  fps    + Vergleich + 📈 Graph
4K 3840x2160
47.9  fps    + Vergleich + 📈 Graph
» In Detailstufe max. mit allen getesteten Notebooks spielbar
Additional Benchmarks
Low Preset / Off 1280x720
304
RT Ultra Preset / On FXAA 1920x1080
26.9
min. 1920x1080
260  fps    + Vergleich + 📈 Graph
mittel 1920x1080
164  fps    + Vergleich + 📈 Graph
hoch 1920x1080
125  fps    + Vergleich + 📈 Graph
max. 1920x1080
98.9  fps    + Vergleich + 📈 Graph
QHD 2560x1440
59.7  fps    + Vergleich + 📈 Graph
4K 3840x2160
26  fps    + Vergleich + 📈 Graph
» In Detailstufe max. mit allen getesteten Notebooks spielbar
Additional Benchmarks
Low Preset 1280x720
355
min. 1920x1080
158.3  fps    + Vergleich
mittel 1920x1080
109.8  fps    + Vergleich
hoch 1920x1080
69.8  fps    + Vergleich
max. 1920x1080
69.6  fps    + Vergleich
QHD 2560x1440
51.3  fps    + Vergleich
4K 3840x2160
30.4  fps    + Vergleich
» In Detailstufe max. mit allen getesteten Notebooks spielbar
Additional Benchmarks
Low Preset (without FSR Upscaling) 1280x720
210.3
Ultra Preset (without FSR Upscaling) + Full Ray-Tracing 1920x1080
45.6
min. 1920x1080
156.3  fps    + Vergleich + 📈 Graph
mittel 1920x1080
139.2  fps    + Vergleich + 📈 Graph
hoch 1920x1080
112.2  fps    + Vergleich + 📈 Graph
max. 1920x1080
97  fps    + Vergleich + 📈 Graph
QHD 2560x1440
68.2  fps    + Vergleich + 📈 Graph
4K 3840x2160
36.1  fps    + Vergleich + 📈 Graph
» In Detailstufe max. mit allen getesteten Notebooks spielbar
Additional Benchmarks
Low Preset 1280x720
180.9
min. 1920x1080
136.1  fps    + Vergleich + 📈 Graph
mittel 1920x1080
118.4  fps    + Vergleich + 📈 Graph
hoch 1920x1080
114.2  fps    + Vergleich + 📈 Graph
max. 1920x1080
106.4  fps    + Vergleich + 📈 Graph
QHD 2560x1440
80  fps    + Vergleich + 📈 Graph
4K 3840x2160
40.7  fps    + Vergleich + 📈 Graph
» In Detailstufe max. mit allen getesteten Notebooks spielbar
Additional Benchmarks
Very Low Preset 1280x720
173
Very High Preset + Ray-Tracing TAA 1920x0180
50.9
min. 1920x1080
133  fps    + Vergleich
mittel 1920x1080
118  fps    + Vergleich
hoch 1920x1080
90  fps    + Vergleich
max. 1920x1080
83  fps    + Vergleich
QHD 2560x1440
60  fps    + Vergleich
4K 3840x2160
36  fps    + Vergleich
4K DLSS 3840x2160
58  fps    + Vergleich
» In Detailstufe max. mit allen getesteten Notebooks spielbar
Additional Benchmarks
Basic Quality Preset T2X SMAA 1280x720
190
min. 1920x1080
81.7  fps    + Vergleich + 📈 Graph
mittel 1920x1080
84.3  fps    + Vergleich + 📈 Graph
hoch 1920x1080
78.1  fps    + Vergleich + 📈 Graph
max. 1920x1080
74  fps    + Vergleich + 📈 Graph
QHD 2560x1440
56.9  fps    + Vergleich + 📈 Graph
4K 3840x2160
25.1  fps    + Vergleich + 📈 Graph
» In Detailstufe max. mit allen getesteten Notebooks spielbar
Additional Benchmarks
Low Preset 1280x720
109.3
min. 1920x1080
118  fps    + Vergleich + 📈 Graph
mittel 1920x1080
89  fps    + Vergleich + 📈 Graph
hoch 1920x1080
66.2  fps    + Vergleich + 📈 Graph
max. 1920x1080
50.2  fps    + Vergleich + 📈 Graph
QHD 2560x1440
36.1  fps    + Vergleich + 📈 Graph
4K 3840x2160
19.7  fps    + Vergleich + 📈 Graph
» In Detailstufe max. mit allen getesteten Notebooks spielbar
Additional Benchmarks
Low Preset 1280x720
158.8
FIFA 23

FIFA 23

2022
min. 1920x1080
294  fps    + Vergleich + 📈 Graph
mittel 1920x1080
265  fps    + Vergleich + 📈 Graph
hoch 1920x1080
193.8  fps    + Vergleich + 📈 Graph
max. 1920x1080
188  fps    + Vergleich + 📈 Graph
QHD 2560x1440
142.9  fps    + Vergleich + 📈 Graph
4K 3840x2160
85.8  fps    + Vergleich + 📈 Graph
» In Detailstufe max. mit allen getesteten Notebooks spielbar
Additional Benchmarks
Low Rendering Quality 1280x720
351
min. 1920x1080
159.9 162.6 ~ 161 fps    + Vergleich + 📈 Graph
mittel 1920x1080
124.1 124.3 ~ 124 fps    + Vergleich + 📈 Graph
hoch 1920x1080
99 101.5 ~ 100 fps    + Vergleich + 📈 Graph
max. 1920x1080
76.4 76.7 ~ 77 fps    + Vergleich + 📈 Graph
QHD 2560x1440
51 51.8 ~ 51 fps    + Vergleich + 📈 Graph
4K 3840x2160
23.2 23.6 ~ 23 fps    + Vergleich + 📈 Graph
» In Detailstufe max. mit allen getesteten Notebooks spielbar
Additional Benchmarks
Low Preset 1280x720
225
F1 22

F1 22

2022
min. 1920x1080
285 313 ~ 299 fps    + Vergleich
mittel 1920x1080
252 277 ~ 265 fps    + Vergleich
hoch 1920x1080
184.9 203 ~ 194 fps    + Vergleich
max. 1920x1080
56.5 60.2 ~ 58 fps    + Vergleich
QHD 2560x1440
36.4 38.4 ~ 37 fps    + Vergleich
4K 3840x2160
17.8 18.4 ~ 18 fps    + Vergleich
» In Detailstufe max. mit allen getesteten Notebooks spielbar
Additional Benchmarks
Ultra Low Preset 16xAF TAA 1280x720
430
499
min. 1920x1080
371  fps    + Vergleich + 📈 Graph
mittel 1920x1080
194.3  fps    + Vergleich + 📈 Graph
hoch 1920x1080
183.1  fps    + Vergleich + 📈 Graph
max. 1920x1080
175.7  fps    + Vergleich + 📈 Graph
QHD 2560x1440
118  fps    + Vergleich + 📈 Graph
4K 3840x2160
61.2  fps    + Vergleich + 📈 Graph
» In Detailstufe max. mit allen getesteten Notebooks spielbar
Additional Benchmarks
Low Preset 1280x720
414
min. 1920x1080
145.2 160.2 ~ 153 fps    + Vergleich + 📈 Graph
mittel 1920x1080
147.9  fps    + Vergleich + 📈 Graph
hoch 1920x1080
144.3 149.2 ~ 147 fps    + Vergleich + 📈 Graph
max. 1920x1080
138 148.2 ~ 143 fps    + Vergleich + 📈 Graph
QHD 2560x1440
87.8 93 ~ 90 fps    + Vergleich + 📈 Graph
4K 3840x2160
44.2 45.5 ~ 45 fps    + Vergleich + 📈 Graph
» In Detailstufe max. mit allen getesteten Notebooks spielbar
Additional Benchmarks
Lowest Settings 1280x720
221
287
Highest Settings + Maximum Ray Tracing 1920x1080
52.1
53.8
min. 1920x1080
180.8 194.6 199 ~ 191 fps    + Vergleich
mittel 1920x1080
147 157.3 158.4 ~ 154 fps    + Vergleich
hoch 1920x1080
105.5 107.5 108.9 ~ 107 fps    + Vergleich
max. 1920x1080
83.8 84.4 86 ~ 85 fps    + Vergleich
QHD 2560x1440
58.4 58.8 60.2 ~ 59 fps    + Vergleich
4K 3840x2160
31.2 31.4 31.9 ~ 32 fps    + Vergleich
» In Detailstufe max. mit allen getesteten Notebooks spielbar
Additional Benchmarks
Lowest Preset (DX12) 1280x720
300
357
min. 1920x1080
80 108.6 ~ 94 fps    + Vergleich
mittel 1920x1080
79.5 89.4 ~ 84 fps    + Vergleich
hoch 1920x1080
77.5 79 ~ 78 fps    + Vergleich
max. 1920x1080
71.9 73.2 ~ 73 fps    + Vergleich
QHD 2560x1440
46.6 47.8 ~ 47 fps    + Vergleich
4K 3840x2160
22.3 22.8 ~ 23 fps    + Vergleich
» In Detailstufe max. mit allen getesteten Notebooks spielbar
Additional Benchmarks
Low Preset 1280x720
80.2
159.1
Ray Tracing Ultra Preset (DLSS off) 1920x1080
29.6
33.4
Ray Tracing Ultra Preset (DLSS off) 3840x2160
12.5
2.6
Elex 2

Elex 2

2022
min. 1920x1080
99.4  fps    + Vergleich + 📈 Graph
mittel 1920x1080
94.4  fps    + Vergleich + 📈 Graph
hoch 1920x1080
86.7  fps    + Vergleich + 📈 Graph
max. 1920x1080
77.9  fps    + Vergleich + 📈 Graph
QHD 2560x1440
58.3  fps    + Vergleich + 📈 Graph
4K 3840x2160
33.5  fps    + Vergleich + 📈 Graph
» In Detailstufe max. mit allen getesteten Notebooks spielbar
Additional Benchmarks
Low / Off 1280x720
102
min. 1920x1080
218.8 223.7 312 ~ 252 fps    + Vergleich
mittel 1920x1080
174 179 231 ~ 195 fps    + Vergleich
hoch 1920x1080
145.5 149.5 186.9 ~ 161 fps    + Vergleich
max. 1920x1080
106.5 113.6 137.7 ~ 119 fps    + Vergleich
QHD 2560x1440
86.2 93.2 107.4 ~ 96 fps    + Vergleich
4K 3840x2160
56.3 62 66.7 ~ 62 fps    + Vergleich
» In Detailstufe max. mit allen getesteten Notebooks spielbar
Additional Benchmarks
Low Preset 1280x720
225.9
349
min. 1920x1080
59.9  fps    + Vergleich + 📈 Graph
mittel 1920x1080
59.9  fps    + Vergleich + 📈 Graph
hoch 1920x1080
59.9  fps    + Vergleich + 📈 Graph
max. 1920x1080
59.9  fps    + Vergleich + 📈 Graph