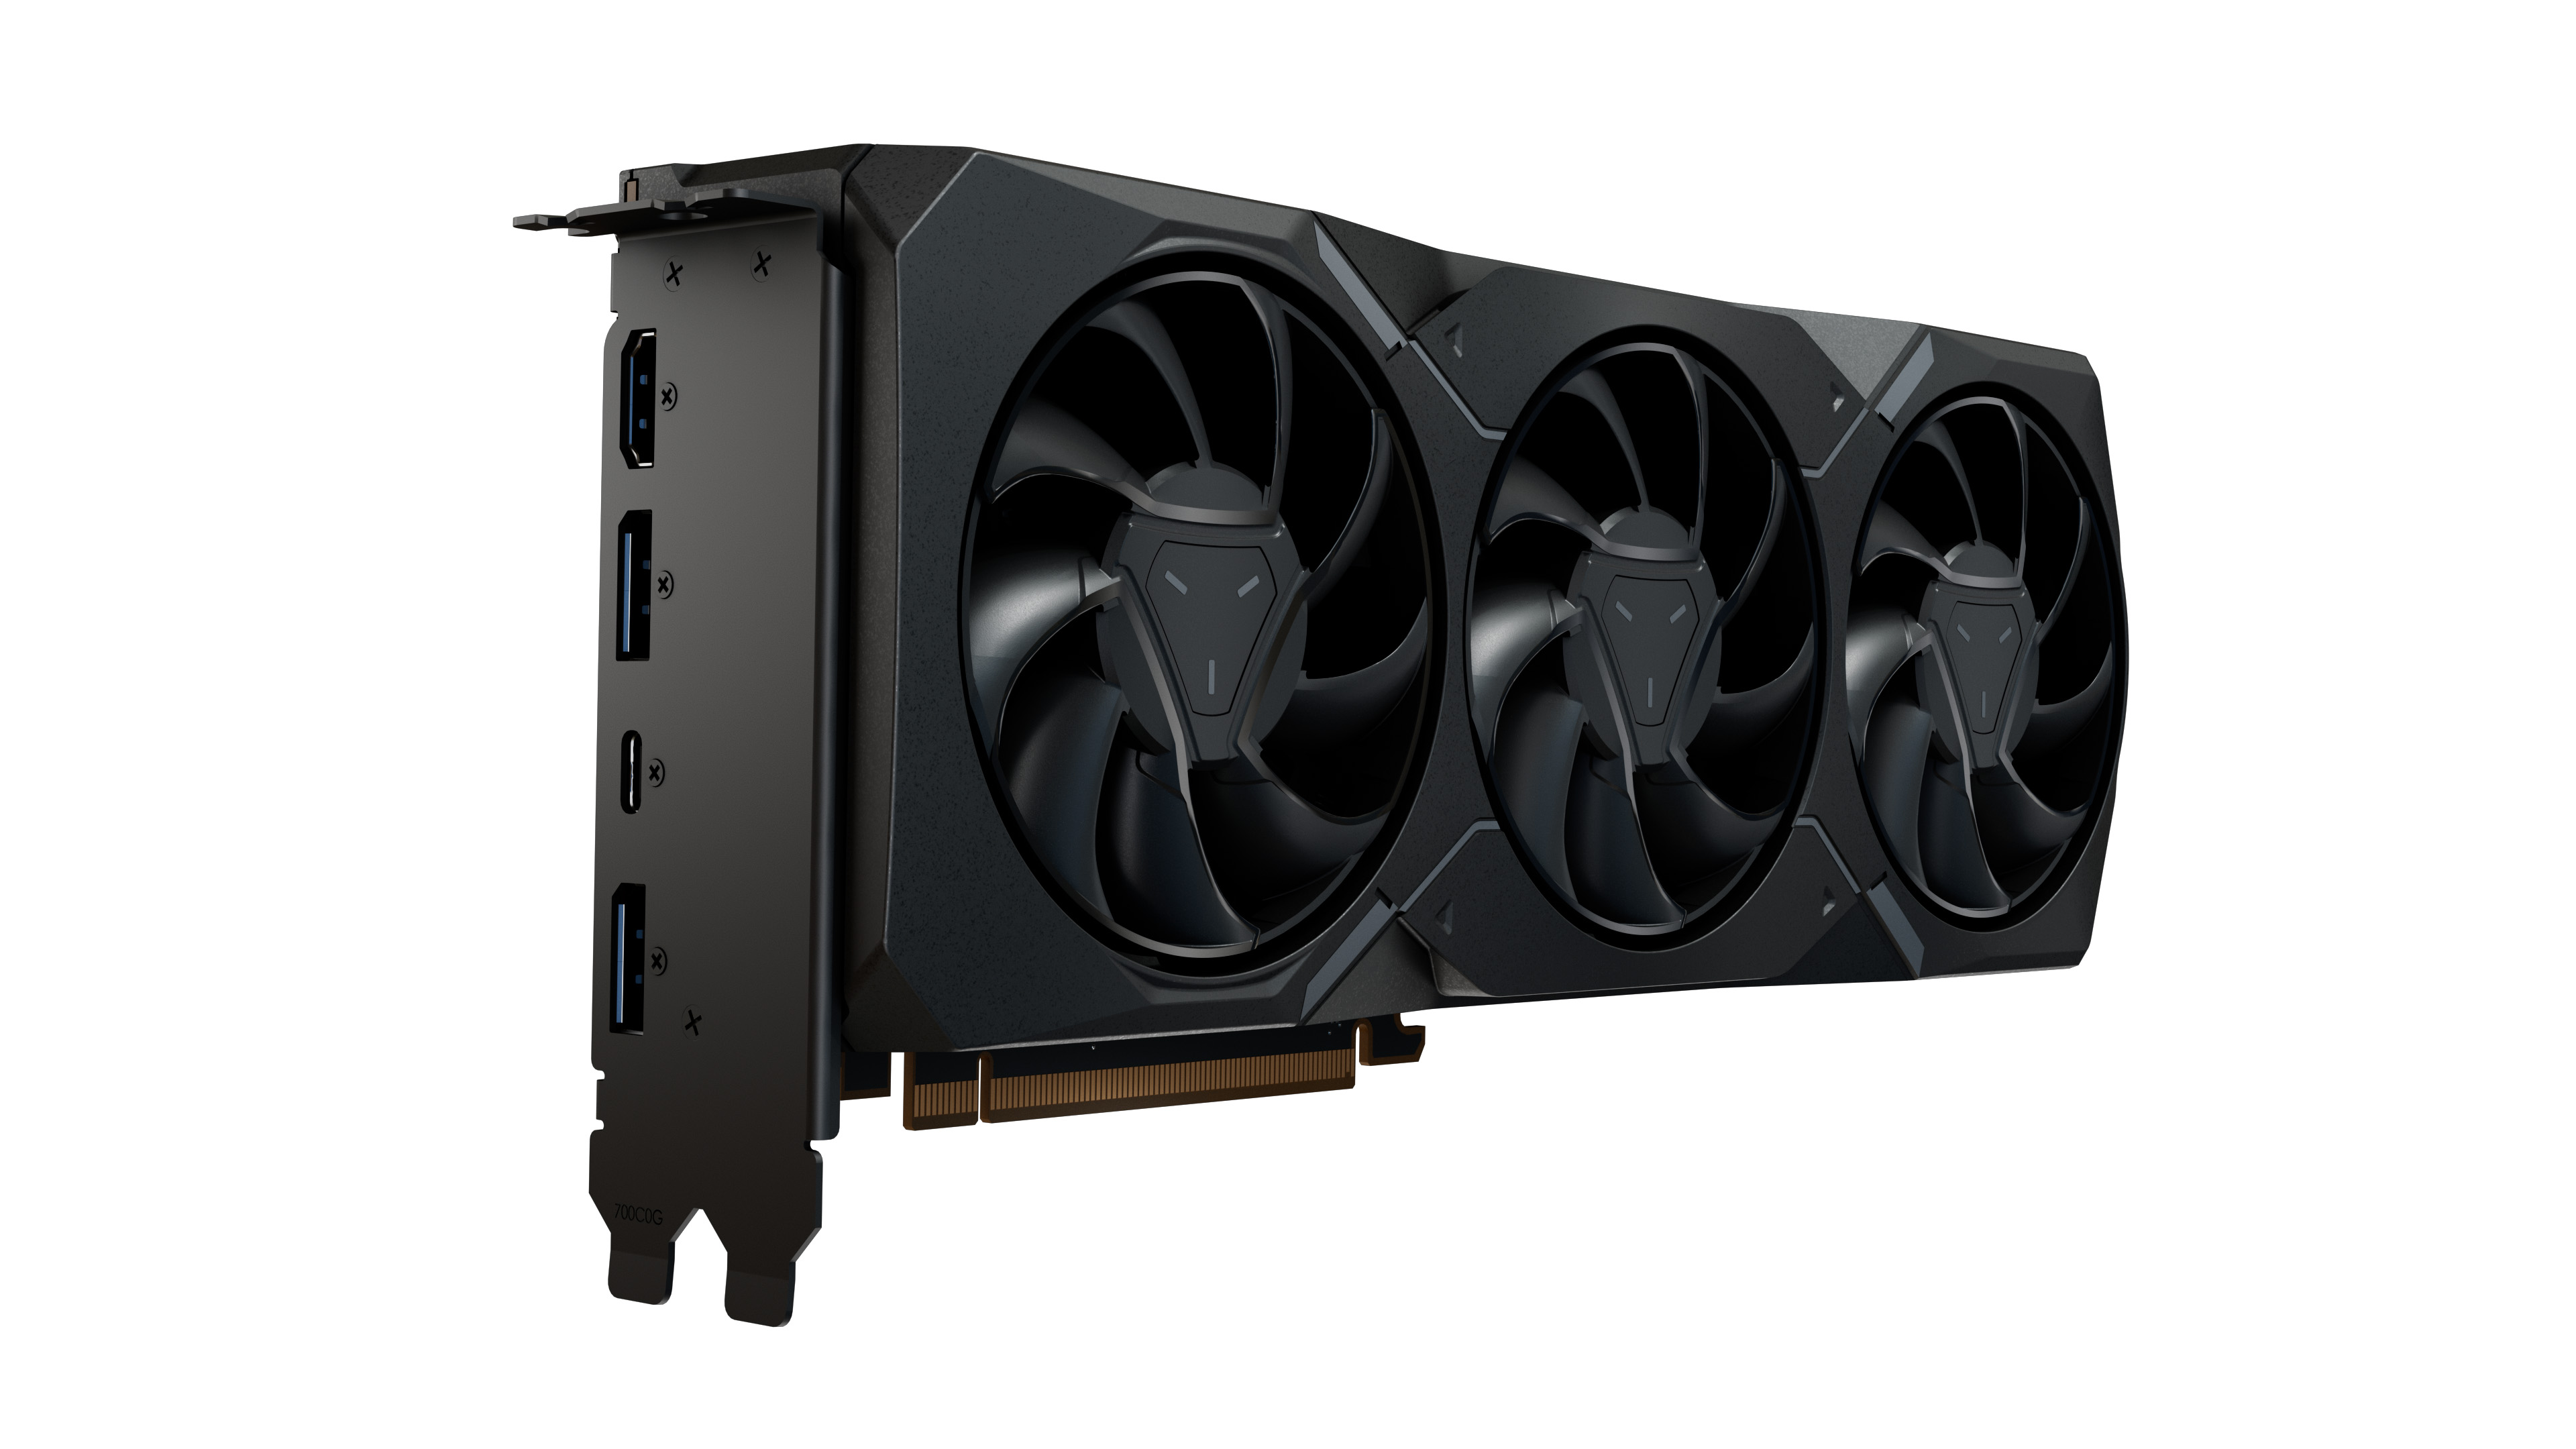
Notebookcheck Logo

AMD Radeon RX 7900 XT

AMD Radeon RX 7900 XT

Die AMD Radeon RX 7900 XT ist eine High-End-Desktop-Grafikkarte basierend auf der RDNA 3 Architektur. Sie nutzt den Navi 31 Chip basierend aus einem in 5nm gefertigten Graphics Compute Die (GCD Chiplet) und fünf der sechs Memory Cache Dies (MCD Chiplets) in 6nm. Die 7900 XT bietet 80 MB Infinity Cache und 20 GB GDDR6 dedizierten Grafikspeicher (per 320 Bit und 20 Gbps angebunden).

Die Spieleleistung ist je nach Spiel in etwa auf dem Niveau einer GeForce RTX 4080 und damit gut geeignet für QHD - 4K Auflösung und maximale Detailstufe bei aktuellen Games.

Der integrierte Video En- und Decoder unterstützt AV1, H.264 und HEVC Videos mit bis zu 8K Auflösung. Bei den Displayanschlüssen punktet die Radeon RX 7900 Serie mit Unterstützung von Display Port 2.1 mit UHBR13.5 und maximal 54 Gbps Bandbreite (für bis zu 8k 165 Hz mit DSC).

Radeon RX 7000 Serie

Radeon RX 7900 XTX compare 6144 @ 2.27 GHz384 Bit @ 20000 MHz
Radeon RX 7900 XT 5376 @ 2 GHz320 Bit @ 20000 MHz
Radeon RX 7900 GRE compare 5120 @ 2.25 GHz256 Bit @ 18000 MHz
Radeon RX 7800 XT compare 3840 @ 2.43 GHz256 Bit @ 19500 MHz
Radeon RX 7700 XT compare 3456 @ 1.7 - 2.54 GHz192 Bit @ 18000 MHz
CodenameNavi 31 XT
ArchitekturRDNA 3
Pipelines5376 - unified
TMUs336
ROPs192
Raytracing Cores84
Tensor / AI Cores168
Kerntakt2000 (Boost) MHz
Theoretical Performance103 TFLOPS FP16, 52 TFLOPS FP32, 1.6 TFLOPS FP64
CacheL2: 6 MB, L3: 80 MB
Speichertakt20000 effective = 2500 MHz
Speicherbandbreite320 Bit
SpeichertypGDDR6
Max. Speichergröße20 GB
Shared Memorynein
Memory Bandwidth800 GB/s
APIDirectX 12 Ultimate (12_2), Shader 6.7, OpenGL 4.6, OpenCL 2.1, Vulkan 1.3
Stromverbrauch315 Watt
Transistoren57.7 Billion
Chipgröße 520 mm²
Herstellungsprozess5 nm
PCIe4.0 x16
Displays4 Displays (max.), HDMI 2.1a, DisplayPort 2.1 UHBR13.5
Erscheinungsdatum03.11.2022
Herstellerseitewww.amd.com
PredecessorRadeon RX 6900 XT

Benchmarks

Performance Rating - 3DMark 11 + Fire Strike + Time Spy
29 pt (87%)
3DMark - 3DMark Fire Strike Standard Score
50669 Points (89%)
3DMark - 3DMark Fire Strike Standard Graphics
63712 Points (72%)
3DMark - 3DMark Night Raid Graphics Score
225446 Points (87%)
3DMark 11 - 3DM11 Performance Score
min: 48415     avg: 51606     median: 51605.5 (72%)     max: 54796 Points
3DMark 11 - 3DM11 Performance GPU
min: 74008     avg: 75896     median: 75896 (65%)     max: 77784 Points
3DMark Vantage
3DM Vant. Perf. total +
3DMark Vantage - 3DM Vant. Perf. total
142489 Points (41%)
3DM Vant. Perf. GPU no PhysX +
3DMark Vantage - 3DM Vant. Perf. GPU no PhysX
161658 Points (92%)
3DMark 06 3DMark 06 - Standard 1280x1024 +
SPECviewperf 12
specvp12 sw-03 +
specvp12 snx-02 +
specvp12 showcase-01 +
specvp12 mediacal-01 +
specvp12 maya-04 +
specvp12 energy-01 +
specvp12 creo-01 +
specvp12 catia-04 +
specvp12 3dsmax-05 +
SPECviewperf 13 specvp13 sw-04 +
specvp13 snx-03 +
specvp13 showcase-02 +
specvp13 medical-02 +
specvp13 maya-05 +
specvp13 energy-02 +
specvp13 creo-02 +
specvp13 catia-05 +
specvp13 3dsmax-06 +
SPECviewperf 2020 specvp2020 snx-04 4k +
specvp2020 medical-03 4k +
specvp2020 maya-06 4k +
specvp2020 energy-03 4k +
specvp2020 creo-03 4k +
specvp2020 catia-06 4k +
specvp2020 3dsmax-07 4k +
Power Consumption - Furmark Stress Test Power Consumption - external Monitor *
513 Watt (73%)
0306090120150180210240270300330360390420450480510Tooltip
Power Consumption - The Witcher 3 Power Consumption - external Monitor *
459 Watt (64%)
0255075100125150175200225250275300325350375400425450475Tooltip
- Bereich der Benchmarkergebnisse für diese Grafikkarte
- Durchschnittliche Benchmarkergebnisse für diese Grafikkarte
* Smaller numbers mean a higher performance

Spiele-Benchmarks

Die folgenden Benchmarks basieren auf unseren Spieletests mit Testnotebooks. Die Performance dieser Grafikkarte bei den gelisteten Spielen ist abhängig von der verwendeten CPU, Speicherausstattung, Treiber und auch Betriebssystem. Dadurch müssen die untenstehenden Werte nicht repräsentativ sein. Detaillierte Informationen über das verwendete System sehen Sie nach einem Klick auf den fps-Wert.

min. 1920x1080
85.5  fps    + Vergleich + 📈 Graph
hoch 1920x1080
82.9  fps    + Vergleich + 📈 Graph
QHD 2560x1440
82.4  fps    + Vergleich + 📈 Graph
4K 3840x2160
67.4  fps    + Vergleich + 📈 Graph
3840x2160
68.6  fps    + Vergleich + 📈 Graph
» In Detailstufe hoch mit allen getesteten Notebooks spielbar
mittel 1920x1080
154.3  fps    + Vergleich + 📈 Graph
hoch 1920x1080
132.4  fps    + Vergleich + 📈 Graph
max. 1920x1080
129.8  fps    + Vergleich + 📈 Graph
QHD 2560x1440
106.2  fps    + Vergleich + 📈 Graph
4K 3840x2160
69.5  fps    + Vergleich + 📈 Graph
3840x2160
88.6  fps    + Vergleich + 📈 Graph
» In Detailstufe max. mit allen getesteten Notebooks spielbar
min. 1920x1080
249  fps    + Vergleich
mittel 1920x1080
227  fps    + Vergleich
hoch 1920x1080
221  fps    + Vergleich
max. 1920x1080
169  fps    + Vergleich
QHD 2560x1440
114  fps    + Vergleich
4K 3840x2160
54  fps    + Vergleich
3840x2160
111  fps    + Vergleich
» In Detailstufe max. mit allen getesteten Notebooks spielbar
mittel 1920x1080
237  fps    + Vergleich + 📈 Graph
hoch 1920x1080
233  fps    + Vergleich + 📈 Graph
max. 1920x1080
232  fps    + Vergleich + 📈 Graph
QHD 2560x1440
183.5  fps    + Vergleich + 📈 Graph
4K 3840x2160
81.2  fps    + Vergleich + 📈 Graph
» In Detailstufe max. mit allen getesteten Notebooks spielbar
mittel 1920x1080
158  fps    + Vergleich
hoch 1920x1080
140  fps    + Vergleich
max. 1920x1080
113  fps    + Vergleich
QHD 2560x1440
94  fps    + Vergleich
4K 3840x2160
63  fps    + Vergleich
3840x2160
83  fps    + Vergleich
» In Detailstufe max. mit allen getesteten Notebooks spielbar
min. 1920x1080
153.8  fps    + Vergleich + 📈 Graph
mittel 1920x1080
149.3  fps    + Vergleich + 📈 Graph
hoch 1920x1080
148.1  fps    + Vergleich + 📈 Graph
max. 1920x1080
147.4  fps    + Vergleich + 📈 Graph
QHD 2560x1440
122.5  fps    + Vergleich + 📈 Graph
4K 3840x2160
65.1  fps    + Vergleich + 📈 Graph
» In Detailstufe max. mit allen getesteten Notebooks spielbar
mittel 1920x1080
135  fps    + Vergleich + 📈 Graph
hoch 1920x1080
119.9  fps    + Vergleich + 📈 Graph
max. 1920x1080
102.8  fps    + Vergleich + 📈 Graph
QHD 2560x1440
79.8  fps    + Vergleich + 📈 Graph
4K 3840x2160
46.7  fps    + Vergleich + 📈 Graph
3840x2160
71.1  fps    + Vergleich + 📈 Graph
» In Detailstufe max. mit allen getesteten Notebooks spielbar
Palworld

Palworld

2024
mittel 1920x1080
173.9  fps    + Vergleich + 📈 Graph
hoch 1920x1080
153.9  fps    + Vergleich + 📈 Graph
max. 1920x1080
149.9  fps    + Vergleich + 📈 Graph
QHD 2560x1440
135.2  fps    + Vergleich + 📈 Graph
4K 3840x2160
71.3  fps    + Vergleich + 📈 Graph
» In Detailstufe max. mit allen getesteten Notebooks spielbar
mittel 1920x1080
358  fps    + Vergleich + 📈 Graph
hoch 1920x1080
358  fps    + Vergleich + 📈 Graph
max. 1920x1080
358  fps    + Vergleich + 📈 Graph
QHD 2560x1440
358  fps    + Vergleich + 📈 Graph
4K 3840x2160
356  fps    + Vergleich + 📈 Graph
» In Detailstufe max. mit allen getesteten Notebooks spielbar
mittel 1920x1080
268  fps    + Vergleich + 📈 Graph
hoch 1920x1080
263  fps    + Vergleich + 📈 Graph
max. 1920x1080
253  fps    + Vergleich + 📈 Graph
QHD 2560x1440
173.1  fps    + Vergleich + 📈 Graph
4K 3840x2160
80.3  fps    + Vergleich + 📈 Graph
» In Detailstufe max. mit allen getesteten Notebooks spielbar
mittel 1920x1080
295  fps    + Vergleich + 📈 Graph
hoch 1920x1080
286  fps    + Vergleich + 📈 Graph
max. 1920x1080
258  fps    + Vergleich + 📈 Graph
QHD 2560x1440
172.4  fps    + Vergleich + 📈 Graph
4K 3840x2160
83  fps    + Vergleich + 📈 Graph
» In Detailstufe max. mit allen getesteten Notebooks spielbar
Additional Benchmarks
Epic Preset + Epic RTX Global Illumination 1920x1080
236
mittel 1920x1080
148  fps    + Vergleich
hoch 1920x1080
127  fps    + Vergleich
max. 1920x1080
102  fps    + Vergleich
QHD 2560x1440
71  fps    + Vergleich
4K 3840x2160
39  fps    + Vergleich
» In Detailstufe max. mit allen getesteten Notebooks spielbar
mittel 1920x1080
273  fps    + Vergleich
hoch 1920x1080
242  fps    + Vergleich
max. 1920x1080
234  fps    + Vergleich
QHD 2560x1440
184  fps    + Vergleich
4K 3840x2160
118  fps    + Vergleich
» In Detailstufe max. mit allen getesteten Notebooks spielbar
mittel 1920x1080
104.4  fps    + Vergleich + 📈 Graph
hoch 1920x1080
97.9  fps    + Vergleich + 📈 Graph
max. 1920x1080
90  fps    + Vergleich + 📈 Graph
QHD 2560x1440
87.9  fps    + Vergleich + 📈 Graph
4K 3840x2160
81.6  fps    + Vergleich + 📈 Graph
» In Detailstufe max. mit allen getesteten Notebooks spielbar
min. 1920x1080
136.5  fps    + Vergleich + 📈 Graph
mittel 1920x1080
125  fps    + Vergleich + 📈 Graph
hoch 1920x1080
122.9  fps    + Vergleich + 📈 Graph
QHD 2560x1440
95.3  fps    + Vergleich + 📈 Graph
4K 3840x2160
49.8  fps    + Vergleich + 📈 Graph
» In Detailstufe hoch mit allen getesteten Notebooks spielbar
Additional Benchmarks
High Preset + High Ray Tracing 1920x1080
41.3
mittel 1920x1080
154.4  fps    + Vergleich + 📈 Graph
hoch 1920x1080
112.6  fps    + Vergleich + 📈 Graph
max. 1920x1080
79.9  fps    + Vergleich + 📈 Graph
QHD 2560x1440
56.1  fps    + Vergleich + 📈 Graph
4K 3840x2160
29.7  fps    + Vergleich + 📈 Graph
» In Detailstufe max. mit allen getesteten Notebooks spielbar
mittel 1920x1080
278  fps    + Vergleich
hoch 1920x1080
187  fps    + Vergleich
max. 1920x1080
154  fps    + Vergleich
QHD 2560x1440
151  fps    + Vergleich
4K 3840x2160
98.4  fps    + Vergleich
» In Detailstufe max. mit allen getesteten Notebooks spielbar
mittel 1920x1080
179  fps    + Vergleich
hoch 1920x1080
170  fps    + Vergleich
max. 1920x1080
136  fps    + Vergleich
QHD 2560x1440
113  fps    + Vergleich
4K 3840x2160
71  fps    + Vergleich
» In Detailstufe max. mit allen getesteten Notebooks spielbar
mittel 1920x1080
254  fps    + Vergleich + 📈 Graph
hoch 1920x1080
220  fps    + Vergleich + 📈 Graph
max. 1920x1080
211  fps    + Vergleich + 📈 Graph
QHD 2560x1440
203  fps    + Vergleich + 📈 Graph
4K 3840x2160
166.9  fps    + Vergleich + 📈 Graph
» In Detailstufe max. mit allen getesteten Notebooks spielbar
mittel 1920x1080
288  fps    + Vergleich + 📈 Graph
hoch 1920x1080
270  fps    + Vergleich + 📈 Graph
max. 1920x1080
266  fps    + Vergleich + 📈 Graph
QHD 2560x1440
206  fps    + Vergleich + 📈 Graph
4K 3840x2160
100.7  fps    + Vergleich + 📈 Graph
» In Detailstufe max. mit allen getesteten Notebooks spielbar
mittel 1920x1080
190  fps    + Vergleich
hoch 1920x1080
186  fps    + Vergleich
max. 1920x1080
168  fps    + Vergleich
QHD 2560x1440
124  fps    + Vergleich
4K 3840x2160
59.8  fps    + Vergleich
» In Detailstufe max. mit allen getesteten Notebooks spielbar
Additional Benchmarks
Ray Tracing Ultra Preset (DLSS off) 1920x1080
56.5
Lies of P

Lies of P

2023
mittel 1920x1080
296  fps    + Vergleich + 📈 Graph
hoch 1920x1080
259  fps    + Vergleich + 📈 Graph
max. 1920x1080
240  fps    + Vergleich + 📈 Graph
QHD 2560x1440
183.8  fps    + Vergleich + 📈 Graph
4K 3840x2160
100.5  fps    + Vergleich + 📈 Graph
» In Detailstufe max. mit allen getesteten Notebooks spielbar
mittel 1920x1080
60  fps    + Vergleich
hoch 1920x1080
60  fps    + Vergleich
max. 1920x1080
60  fps    + Vergleich
QHD 2560x1440
60  fps    + Vergleich
4K 3840x2160
60  fps    + Vergleich
» In Detailstufe max. mit allen getesteten Notebooks spielbar
Starfield

Starfield

2023
mittel 1920x1080
105.7  fps    + Vergleich + 📈 Graph
hoch 1920x1080
101.5  fps    + Vergleich + 📈 Graph
max. 1920x1080
95.1  fps    + Vergleich + 📈 Graph
QHD 2560x1440
88.3  fps    + Vergleich + 📈 Graph
4K 3840x2160
59.6  fps    + Vergleich + 📈 Graph
» In Detailstufe max. mit allen getesteten Notebooks spielbar
mittel 1920x1080
118.8  fps    + Vergleich + 📈 Graph
hoch 1920x1080
118.9  fps    + Vergleich + 📈 Graph
max. 1920x1080
118.7  fps    + Vergleich + 📈 Graph
QHD 2560x1440
118.3  fps    + Vergleich + 📈 Graph
4K 3840x2160
84.7  fps    + Vergleich + 📈 Graph
» In Detailstufe max. mit allen getesteten Notebooks spielbar
hoch 1920x1080
124.7  fps    + Vergleich + 📈 Graph
max. 1920x1080
109.9  fps    + Vergleich + 📈 Graph
QHD 2560x1440
81.3  fps    + Vergleich + 📈 Graph
4K 3840x2160
45.7  fps    + Vergleich + 📈 Graph
» In Detailstufe max. mit allen getesteten Notebooks spielbar
mittel 1920x1080
180.1  fps    + Vergleich + 📈 Graph
hoch 1920x1080
170.8  fps    + Vergleich + 📈 Graph
max. 1920x1080
167.4  fps    + Vergleich + 📈 Graph
QHD 2560x1440
163.9  fps    + Vergleich + 📈 Graph
4K 3840x2160
96.3  fps    + Vergleich + 📈 Graph
» In Detailstufe max. mit allen getesteten Notebooks spielbar
min. 1920x1080
152.9  fps    + Vergleich + 📈 Graph
mittel 1920x1080
141  fps    + Vergleich + 📈 Graph
hoch 1920x1080
135.8  fps    + Vergleich + 📈 Graph
max. 1920x1080
118.8  fps    + Vergleich + 📈 Graph
QHD 2560x1440
83.9  fps    + Vergleich + 📈 Graph
4K 3840x2160
43.9  fps    + Vergleich + 📈 Graph
» In Detailstufe max. mit allen getesteten Notebooks spielbar
min. 1920x1080
307  fps    + Vergleich + 📈 Graph
mittel 1920x1080
249  fps    + Vergleich + 📈 Graph
hoch 1920x1080
221  fps    + Vergleich + 📈 Graph
max. 1920x1080
155.9  fps    + Vergleich + 📈 Graph
QHD 2560x1440
126.9  fps    + Vergleich + 📈 Graph
4K 3840x2160
79.7  fps    + Vergleich + 📈 Graph
» In Detailstufe max. mit allen getesteten Notebooks spielbar
mittel 1920x1080
330  fps    + Vergleich
hoch 1920x1080
267  fps    + Vergleich
max. 1920x1080
264  fps    + Vergleich
QHD 2560x1440
214  fps    + Vergleich
4K 3840x2160
120  fps    + Vergleich
» In Detailstufe max. mit allen getesteten Notebooks spielbar
min. 1920x1080
122.1  fps    + Vergleich + 📈 Graph
mittel 1920x1080
116.8  fps    + Vergleich + 📈 Graph
hoch 1920x1080
113.3  fps    + Vergleich + 📈 Graph
max. 1920x1080
111.6  fps    + Vergleich + 📈 Graph
QHD 2560x1440
108.3  fps    + Vergleich + 📈 Graph
4K 3840x2160
86  fps    + Vergleich + 📈 Graph
» In Detailstufe max. mit allen getesteten Notebooks spielbar
min. 1920x1080
328  fps    + Vergleich + 📈 Graph
mittel 1920x1080
262  fps    + Vergleich + 📈 Graph
hoch 1920x1080
169.8  fps    + Vergleich + 📈 Graph
max. 1920x1080
137.9  fps    + Vergleich + 📈 Graph
QHD 2560x1440
112.9  fps    + Vergleich + 📈 Graph
4K 3840x2160
71.4  fps    + Vergleich + 📈 Graph
» In Detailstufe max. mit allen getesteten Notebooks spielbar
Returnal

Returnal

2023
mittel 1920x1080
220  fps    + Vergleich
hoch 1920x1080
199  fps    + Vergleich
max. 1920x1080
170  fps    + Vergleich
QHD 2560x1440
131  fps    + Vergleich
4K 3840x2160
77  fps    + Vergleich
» In Detailstufe max. mit allen getesteten Notebooks spielbar
Additional Benchmarks
Epic Preset + Epic Ray-Tracing 1920x1080
109
Epic Preset + Epic Ray-Tracing 3840x2160
47
mittel 1920x1080
171.1  fps    + Vergleich + 📈 Graph
hoch 1920x1080
150.3  fps    + Vergleich + 📈 Graph
max. 1920x1080
133.4  fps    + Vergleich + 📈 Graph
QHD 2560x1440
104.8  fps    + Vergleich + 📈 Graph
4K 3840x2160
58  fps    + Vergleich + 📈 Graph
» In Detailstufe max. mit allen getesteten Notebooks spielbar
Additional Benchmarks
Ultra Preset + Full Ray Tracing High TAA 1920x1080
67.9
Ultra Preset + Full Ray Tracing High TAA 3840x2160
27.3
min. 1920x1080
143.9  fps    + Vergleich + 📈 Graph
mittel 1920x1080
139.1  fps    + Vergleich + 📈 Graph
hoch 1920x1080
126.5  fps    + Vergleich + 📈 Graph
max. 1920x1080
119.5  fps    + Vergleich + 📈 Graph
QHD 2560x1440
91.5  fps    + Vergleich + 📈 Graph
4K 3840x2160
52.8  fps    + Vergleich + 📈 Graph
» In Detailstufe max. mit allen getesteten Notebooks spielbar
min. 1920x1080
255  fps    + Vergleich
mittel 1920x1080
224  fps    + Vergleich
hoch 1920x1080
146  fps    + Vergleich
max. 1920x1080
145  fps    + Vergleich
QHD 2560x1440
110  fps    + Vergleich
4K 3840x2160
67  fps    + Vergleich
» In Detailstufe max. mit allen getesteten Notebooks spielbar
Additional Benchmarks
Low Preset (without FSR Upscaling) 1280x720
274
Ultra Preset (without FSR Upscaling) + Full Ray-Tracing 1920x1080
89
min. 1920x1080
207  fps    + Vergleich + 📈 Graph
mittel 1920x1080
193.4  fps    + Vergleich + 📈 Graph
hoch 1920x1080
161.5  fps    + Vergleich + 📈 Graph
max. 1920x1080
134.2  fps    + Vergleich + 📈 Graph
QHD 2560x1440
115.1  fps    + Vergleich + 📈 Graph
4K 3840x2160
76  fps    + Vergleich + 📈 Graph
» In Detailstufe max. mit allen getesteten Notebooks spielbar
Additional Benchmarks
Low Preset 1280x720
213
min. 1920x1080
178.5  fps    + Vergleich + 📈 Graph
mittel 1920x1080
171.4  fps    + Vergleich + 📈 Graph
hoch 1920x1080
158.7  fps    + Vergleich + 📈 Graph
max. 1920x1080
156.2  fps    + Vergleich + 📈 Graph
QHD 2560x1440
135  fps    + Vergleich + 📈 Graph
4K 3840x2160
83.9  fps    + Vergleich + 📈 Graph
» In Detailstufe max. mit allen getesteten Notebooks spielbar
Additional Benchmarks
Very Low Preset 1280x720
197.6
Very High Preset + Ray-Tracing TAA 1920x0180
88.5
min. 1920x1080
349  fps    + Vergleich
mittel 1920x1080
331  fps    + Vergleich
hoch 1920x1080
261  fps    + Vergleich
max. 1920x1080
256  fps    + Vergleich
QHD 2560x1440
189  fps    + Vergleich
4K 3840x2160
117  fps    + Vergleich
» In Detailstufe max. mit allen getesteten Notebooks spielbar
Additional Benchmarks
Basic Quality Preset T2X SMAA 1280x720
368
min. 1920x1080
155.8  fps    + Vergleich + 📈 Graph
mittel 1920x1080
153.9  fps    + Vergleich + 📈 Graph
hoch 1920x1080
141.6  fps    + Vergleich + 📈 Graph
max. 1920x1080
136.5  fps    + Vergleich + 📈 Graph
QHD 2560x1440
111.1  fps    + Vergleich + 📈 Graph
4K 3840x2160
71  fps    + Vergleich + 📈 Graph
» In Detailstufe max. mit allen getesteten Notebooks spielbar
Additional Benchmarks
Low Preset 1280x720
169.1
min. 1920x1080
215  fps    + Vergleich + 📈 Graph
mittel 1920x1080
183.9  fps    + Vergleich + 📈 Graph
hoch 1920x1080
142.3  fps    + Vergleich + 📈 Graph
max. 1920x1080
106  fps    + Vergleich + 📈 Graph
QHD 2560x1440
84.1  fps    + Vergleich + 📈 Graph
4K 3840x2160
47.9  fps    + Vergleich + 📈 Graph
» In Detailstufe max. mit allen getesteten Notebooks spielbar
Additional Benchmarks
Low Preset 1280x720
229
min. 1920x1080
342  fps    + Vergleich + 📈 Graph
mittel 1920x1080
258  fps    + Vergleich + 📈 Graph
hoch 1920x1080
216  fps    + Vergleich + 📈 Graph
max. 1920x1080
169.3  fps    + Vergleich + 📈 Graph
QHD 2560x1440
118.7  fps    + Vergleich + 📈 Graph
4K 3840x2160
62.4  fps    + Vergleich + 📈 Graph
» In Detailstufe max. mit allen getesteten Notebooks spielbar
Additional Benchmarks
Low Preset 1280x720
390
F1 22

F1 22

2022
min. 1920x1080
478  fps    + Vergleich
mittel 1920x1080
434  fps    + Vergleich
hoch 1920x1080
410  fps    + Vergleich
max. 1920x1080
129.8  fps    + Vergleich
QHD 2560x1440
88.1  fps    + Vergleich
4K 3840x2160
44.9  fps    + Vergleich
» In Detailstufe max. mit allen getesteten Notebooks spielbar
Additional Benchmarks
Ultra Low Preset 16xAF TAA 1280x720
603
min. 1920x1080
295  fps    + Vergleich + 📈 Graph
mittel 1920x1080
294  fps    + Vergleich + 📈 Graph
hoch 1920x1080
293  fps    + Vergleich + 📈 Graph
max. 1920x1080
292  fps    + Vergleich + 📈 Graph
QHD 2560x1440
228  fps    + Vergleich + 📈 Graph
4K 3840x2160
104  fps    + Vergleich + 📈 Graph
» In Detailstufe max. mit allen getesteten Notebooks spielbar
Additional Benchmarks
Lowest Settings 1280x720
325
Highest Settings + Maximum Ray Tracing 1920x1080
116.5
min. 1920x1080
435  fps    + Vergleich
mittel 1920x1080
348  fps    + Vergleich
hoch 1920x1080
250  fps    + Vergleich
max. 1920x1080
194.2  fps    + Vergleich
QHD 2560x1440
136  fps    + Vergleich
4K 3840x2160
71.3  fps    + Vergleich
» In Detailstufe max. mit allen getesteten Notebooks spielbar
Additional Benchmarks
Lowest Preset (DX12) 1280x720
455
min. 1920x1080
237  fps    + Vergleich
mittel 1920x1080
212  fps    + Vergleich
hoch 1920x1080
189.7  fps    + Vergleich
max. 1920x1080
178.6  fps    + Vergleich
QHD 2560x1440
122.4  fps    + Vergleich
4K 3840x2160
60  fps    + Vergleich
» In Detailstufe max. mit allen getesteten Notebooks spielbar
Additional Benchmarks
Low Preset 1280x720
247
Ray Tracing Ultra Preset (DLSS off) 1920x1080
57.1
Ray Tracing Ultra Preset (DLSS off) 3840x2160
17.6
min. 1920x1080
444  fps    + Vergleich
mittel 1920x1080
390  fps    + Vergleich
hoch 1920x1080
324  fps    + Vergleich
max. 1920x1080
273  fps    + Vergleich
QHD 2560x1440
241  fps    + Vergleich
4K 3840x2160
164.9  fps    + Vergleich
» In Detailstufe max. mit allen getesteten Notebooks spielbar
Additional Benchmarks
Low Preset 1280x720
455
min. 1920x1080
230  fps    + Vergleich + 📈 Graph
mittel 1920x1080
229  fps    + Vergleich + 📈 Graph
hoch 1920x1080
219  fps    + Vergleich + 📈 Graph
max. 1920x1080
165  fps    + Vergleich + 📈 Graph
QHD 2560x1440
136.7  fps    + Vergleich + 📈 Graph
4K 3840x2160
88.1  fps    + Vergleich + 📈 Graph
» In Detailstufe max. mit allen getesteten Notebooks spielbar
Additional Benchmarks
Low Preset 1280x720
230
230
min. 1280x720
315  fps    + Vergleich
mittel 1920x1080
244  fps    + Vergleich
hoch 1920x1080
223  fps    + Vergleich
max. 1920x1080
154  fps    + Vergleich
QHD 2560x1440
138  fps    + Vergleich
4K 3840x2160
104  fps    + Vergleich
» In Detailstufe max. mit allen getesteten Notebooks spielbar
Additional Benchmarks
Low Preset 1920x1080
262
min. 1280x720
202  fps    + Vergleich
mittel 1920x1080
201  fps    + Vergleich
hoch 1920x1080
200  fps    + Vergleich
max. 1920x1080
197  fps    + Vergleich
QHD 2560x1440
191  fps    + Vergleich
4K 3840x2160
118  fps    + Vergleich
» In Detailstufe max. mit allen getesteten Notebooks spielbar
Additional Benchmarks
Low Preset 1920x1080
203
Ultra Preset + Ultra Ray-Tracing 1920x1080
122
Far Cry 6

Far Cry 6

2021
min. 1280x720
233  fps    + Vergleich + 📈 Graph
mittel 1920x1080
208  fps    + Vergleich + 📈 Graph
hoch 1920x1080
190  fps    + Vergleich + 📈 Graph
max. 1920x1080
181.9  fps    + Vergleich + 📈 Graph
QHD 2560x1440
167.9  fps    + Vergleich + 📈 Graph
4K 3840x2160
104.1  fps    + Vergleich + 📈 Graph
» In Detailstufe max. mit allen getesteten Notebooks spielbar
Additional Benchmarks
Low Graphics Quality 1920x1080
227
Ultra Graphics Quality + HD Textures + DXR TAA 1920x1080
143.6
New World

New World

2021
min. 1280x720
213  fps    + Vergleich + 📈 Graph
mittel 1920x1080
177.8  fps    + Vergleich + 📈 Graph
hoch 1920x1080
164.1  fps    + Vergleich + 📈 Graph
max. 1920x1080
156.9  fps    + Vergleich + 📈 Graph
QHD 2560x1440
147  fps    + Vergleich + 📈 Graph
4K 3840x2160
84.4  fps    + Vergleich + 📈 Graph
» In Detailstufe max. mit allen getesteten Notebooks spielbar
Additional Benchmarks
Low Video Quality 1920x1080
210
F1 2021

F1 2021

2021
min. 1280x720
644  fps    + Vergleich
mittel 1920x1080
615  fps    + Vergleich
hoch 1920x1080
493  fps    + Vergleich
max. 1920x1080
248  fps    + Vergleich
QHD 2560x1440
192.8  fps    + Vergleich
4K 3840x2160
112.3  fps    + Vergleich
» In Detailstufe max. mit allen getesteten Notebooks spielbar
F1 2020

F1 2020

2020
min. 1280x720
581  fps    + Vergleich
mittel 1920x1080
484  fps    + Vergleich
hoch 1920x1080
466  fps    + Vergleich
max. 1920x1080
350  fps    + Vergleich
QHD 2560x1440
277  fps    + Vergleich
4K 3840x2160
165.5  fps    + Vergleich
» In Detailstufe max. mit allen getesteten Notebooks spielbar
min. 1280x720
248  fps    + Vergleich
mittel 1920x1080
220  fps    + Vergleich
hoch 1920x1080
199.2  fps    + Vergleich
max. 1920x1080
169.4  fps    + Vergleich
QHD 2560x1440
135.2  fps    + Vergleich
4K 3840x2160
74.6  fps    + Vergleich
» In Detailstufe max. mit allen getesteten Notebooks spielbar
Additional Benchmarks
Very Low Overall Quality (DX11) 1920x1080
245
Control

Control

2019
min. 1280x720
240  fps    + Vergleich + 📈 Graph
mittel 1920x1080
240  fps    + Vergleich + 📈 Graph
hoch 1920x1080
233  fps    + Vergleich + 📈 Graph
QHD 2560x1440
156.4  fps    + Vergleich + 📈 Graph
4K 3840x2160
75.8  fps    + Vergleich + 📈 Graph
» In Detailstufe hoch mit allen getesteten Notebooks spielbar
Additional Benchmarks
High Quality Preset & High Ray Tracing Preset (DX12) 1920x1080
116.1
min. 1280x720
182  fps    + Vergleich + 📈 Graph
mittel 1920x1080
163  fps    + Vergleich + 📈 Graph
hoch 1920x1080
157  fps    + Vergleich + 📈 Graph
max. 1920x1080
142  fps    + Vergleich + 📈 Graph
QHD 2560x1440
141  fps    + Vergleich + 📈 Graph
4K 3840x2160
129  fps    + Vergleich + 📈 Graph
» In Detailstufe max. mit allen getesteten Notebooks spielbar
min. 1280x720
331  fps    + Vergleich
mittel 1920x1080
274  fps    + Vergleich
max. 1920x1080
164.6  fps    + Vergleich
QHD 2560x1440
135  fps    + Vergleich
4K 3840x2160
86.9  fps    + Vergleich
» In Detailstufe max. mit allen getesteten Notebooks spielbar
Additional Benchmarks
Ultra Quality DXR 16xAF 1920x1080
124.3
min. 1280x720
370  fps    + Vergleich
mittel 1920x1080
311  fps    + Vergleich
hoch 1920x1080
307  fps    + Vergleich
max. 1920x1080
282  fps    + Vergleich
QHD 2560x1440
203  fps    + Vergleich
4K 3840x2160
109.6  fps    + Vergleich
» In Detailstufe max. mit allen getesteten Notebooks spielbar
Additional Benchmarks
Lowest Preset 1920x1080
370
Strange Brigade

Strange Brigade

2018
min. 1280x720
770  fps    + Vergleich
mittel 1920x1080
580  fps    + Vergleich
hoch 1920x1080
492  fps    + Vergleich
max. 1920x1080
424  fps    + Vergleich
QHD 2560x1440
325  fps    + Vergleich
4K 3840x2160
172.6  fps    + Vergleich
» In Detailstufe max. mit allen getesteten Notebooks spielbar
Far Cry 5

Far Cry 5

2018
min. 1280x720
221  fps    + Vergleich + 📈 Graph
mittel 1920x1080
196  fps    + Vergleich + 📈 Graph
hoch 1920x1080
187  fps    + Vergleich + 📈 Graph
max. 1920x1080
173  fps    + Vergleich + 📈 Graph
QHD 2560x1440
173  fps    + Vergleich + 📈 Graph
4K 3840x2160
132  fps    + Vergleich + 📈 Graph
» In Detailstufe max. mit allen getesteten Notebooks spielbar
Additional Benchmarks
Low Preset TAA 1920x1080
215
min. 1280x720
179.2  fps    + Vergleich
mittel 1920x1080
140.4  fps    + Vergleich
hoch 1920x1080
109.8  fps    + Vergleich
4K 3840x2160
81.4  fps    + Vergleich
» In Detailstufe hoch mit allen getesteten Notebooks spielbar
min. 1280x720
234  fps    + Vergleich
mittel 1920x1080
233  fps    + Vergleich
hoch 1920x1080
197.2  fps    + Vergleich
QHD 2560x1440
149.9  fps    + Vergleich
4K 3840x2160
84.9  fps    + Vergleich
» In Detailstufe hoch mit allen getesteten Notebooks spielbar
min. 1280x720
265.7  fps    + Vergleich
mittel 1366x768
217.1  fps    + Vergleich
hoch 1920x1080
198.9  fps    + Vergleich
max. 1920x1080
183.6  fps    + Vergleich
4K 3840x2160
153.2  fps    + Vergleich
» In Detailstufe max. mit allen getesteten Notebooks spielbar
min. 1024x768
816  fps    + Vergleich + 📈 Graph
mittel 1366x768
614  fps    + Vergleich + 📈 Graph
hoch 1920x1080
483  fps    + Vergleich + 📈 Graph
max. 1920x1080
265  fps    + Vergleich + 📈 Graph
4K 3840x2160
158.5  fps    + Vergleich + 📈 Graph
» In Detailstufe max. mit allen getesteten Notebooks spielbar
Additional Benchmarks
Ultra Graphics & Postprocessing (HBAO+) 3840x2160
109.4
Medium Graphics & Postprocessing 1920x1080
552
GTA V

GTA V

2015
min. 1024x768
188.4  fps    + Vergleich
mittel 1366x768
187.5  fps    + Vergleich
hoch 1920x1080
185.4  fps    + Vergleich
max. 1920x1080
159.9  fps    + Vergleich
QHD 2560x1440
159.2  fps    + Vergleich
4K 3840x2160
175.1  fps    + Vergleich
» In Detailstufe max. mit allen getesteten Notebooks spielbar
Additional Benchmarks
Highest Settings possible 16xAF 4xMSAA + FXAA 3840x2160
83.1
Normal/Off 4xAF 1920x1080
187.5
Lowest Settings possible 1920x1080
187.7
min.mittelhochmax.QHD4K
Dragon's Dogma 285.582.982.467.4
Horizon Forbidden West154.3132.4129.8106.269.5
Alone in the Dark24922722116911454
Last Epoch237233232183.581.2
Skull & Bones1581401139463
Helldivers 2153.8149.3148.1147.4122.565.1
Enshrouded135119.9102.879.846.7
Palworld173.9153.9149.9135.271.3
Prince of Persia The Lost Crown358358358358356
Ready or Not268263253173.180.3
The Finals295286258172.483
Avatar Frontiers of Pandora1481271027139
Call of Duty Modern Warfare 3 2023273242234184118
EA Sports WRC104.497.99087.981.6
Alan Wake 2136.5125122.995.349.8
Lords of the Fallen154.4112.679.956.129.7
Total War Pharaoh27818715415198.4
Assassin's Creed Mirage17917013611371
EA Sports FC 24254220211203166.9
Counter-Strike 2288270266206100.7
Cyberpunk 2077 2.0 Phantom Liberty19018616812459.8
Lies of P296259240183.8100.5
The Crew Motorfest6060606060
Starfield105.7101.595.188.359.6
Armored Core 6118.8118.9118.7118.384.7
Immortals of Aveum124.7109.981.345.7
Atlas Fallen180.1170.8167.4163.996.3
The Last of Us152.9141135.8118.883.943.9
Resident Evil 4 Remake307249221155.9126.979.7
Company of Heroes 3330267264214120
Sons of the Forest122.1116.8113.3111.6108.386
Atomic Heart328262169.8137.9112.971.4
Returnal22019917013177
Hogwarts Legacy171.1150.3133.4104.858
Dead Space Remake143.9139.1126.5119.591.552.8
The Callisto Protocol25522414614511067
Need for Speed Unbound207193.4161.5134.2115.176
Spider-Man Miles Morales178.5171.4158.7156.213583.9
Call of Duty Modern Warfare 2 2022349331261256189117
Uncharted Legacy of Thieves Collection155.8153.9141.6136.5111.171
A Plague Tale Requiem215183.9142.310684.147.9
The Quarry342258216169.3118.762.4
F1 22478434410129.888.144.9
Ghostwire Tokyo295294293292228104
Tiny Tina's Wonderlands435348250194.213671.3
Cyberpunk 2077 1.6237212189.7178.6122.460
GRID Legends444390324273241164.9
God of War230229219165136.788.1
Forza Horizon 5315244223154138104
Guardians of the Galaxy202201200197191118
Far Cry 6233208190181.9167.9104.1
New World213177.8164.1156.914784.4
F1 2021644615493248192.8112.3
F1 2020581484466350277165.5
Borderlands 3248220199.2169.4135.274.6
Control240240233156.475.8
Far Cry New Dawn182163157142141129
Metro Exodus331274164.613586.9
Shadow of the Tomb Raider370311307282203109.6
Strange Brigade770580492424325172.6
Far Cry 5221196187173173132
X-Plane 11.11179.2140.4109.881.4
Final Fantasy XV Benchmark234233197.2149.984.9
Dota 2 Reborn265.7217.1198.9183.6153.2
The Witcher 3816614483265158.5
GTA V188.4187.5185.4159.9159.2175.1
< 30 fps
< 60 fps
< 120 fps
≥ 120 fps


1
39


5
59


9
56


13
48

1
24
38
1
12
42
11

Eine Liste mit weiteren Spielen und allen Grafikkarten finden Sie auf unserer Seite: Welches Spiel ist mit welcher Grafikkarte spielbar?

Ein oder mehrere Geräte zum Vergleich auswählen

In der folgenden Liste können sie Geräte suchen und für einen Vergleich auswählen.

Liste einschränken:

show all (including archived), 2024, 2023
v1.26
log 25. 19:51:06

#0 no ids found in url (should be separated by "_") +0s ... 0s

#1 not redirecting to Ajax server +0s ... 0s

#2 did not recreate cache, as it is less than 5 days old! Created at Thu, 25 Apr 2024 05:40:10 +0200 +0.001s ... 0.001s

#3 composed specs +0.051s ... 0.052s

#4 did output specs +0s ... 0.052s

#5 start showIntegratedCPUs +0s ... 0.052s

#6 getting avg benchmarks for device 11442 +0.028s ... 0.08s

#7 got single benchmarks 11442 +0.012s ... 0.091s

#8 got avg benchmarks for devices +0s ... 0.092s

#9 min, max, avg, median took s +0.779s ... 0.871s

#10 before gaming benchmark output +0s ... 0.871s

#11 Got 364 rows for game benchmarks. +0.062s ... 0.932s

#12 composed SQL query for gamebenchmarks +0s ... 0.932s

#13 got data and put it in $dataArray +0.048s ... 0.98s

#14 benchmarks composed for output. +3.274s ... 4.254s

#15 return log +0.052s ... 4.306s

Teilen Sie diesen Artikel, um uns zu unterstützen. Jeder Link hilft!

» Vergleich mobiler Grafikkarten
Liste aller mobiler Grafikkarten mit Kurzinformationen sortiert nach Leistung

» Mobile Grafikkarten - Benchmarkliste
Sortier- und filterbare Benchmark-Liste

» Spieleliste
Welche Spiele laufen mit welcher Grafikkarte

Leistungsklasse 1

Leistungsklasse 2

Leistungsklasse 3

UHD Graphics 750

Leistungsklasse 4

* Geschätzte Position

> Notebook Test, Laptop Test und News > Benchmarks / Technik > Benchmarks / Technik > Vergleich mobiler Grafikkarten > AMD Radeon RX 7900 XT Grafikkarte - Benchmarks und Spezifikationen
Autor: Klaus Hinum (Update: 23.01.2023)