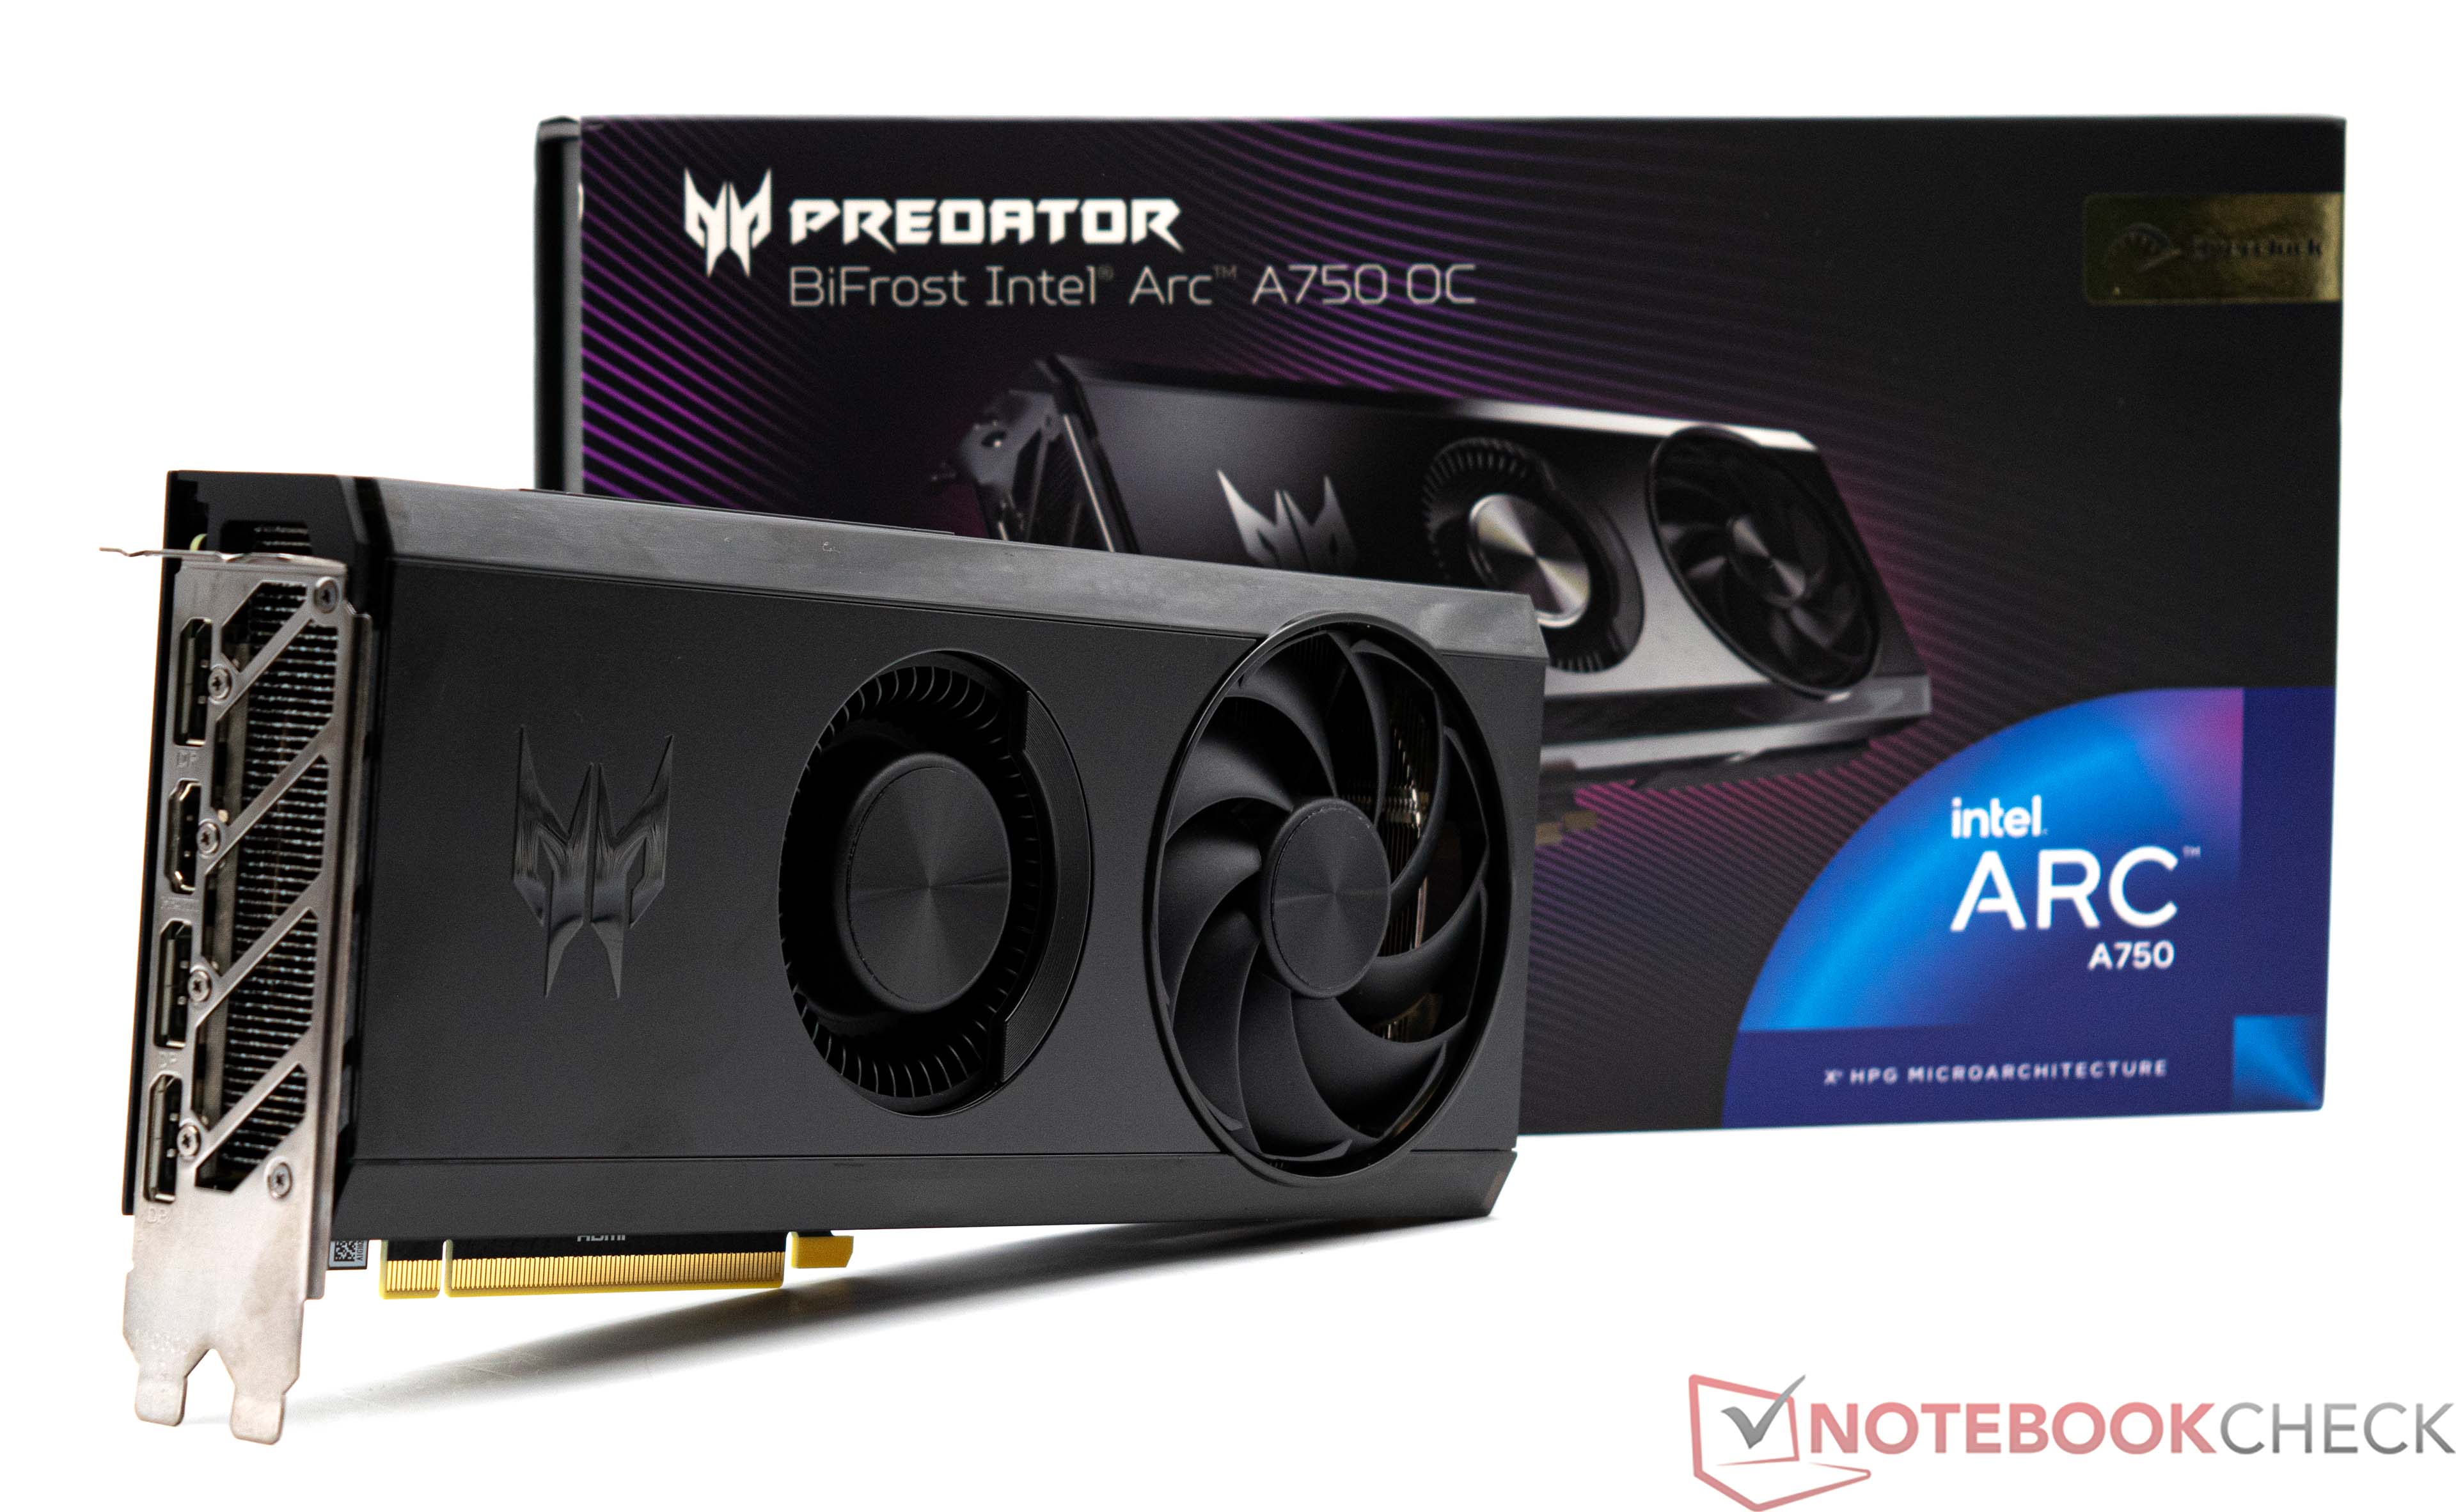
Notebookcheck Logo

Intel Arc A750

Intel Arc A750

Die Intel Arc A750 ist eine Mid-Range-Desktop-GPU und wird im 6 nm Verfahren bei TSMC gefertigt. Der Grafikprozessor verfügt über 3.854 Shadereinheiten, sowie über 8 GB GDDR6-VRAM mit einem 256-Bit-Interface (16 Gbps, 512 GB/s). Damit ist die Intel Arc A750 das zweitschnellste Grafikkartenmodell aus dem Hause Intel.

Features

Auf Basis der Alchemist-Architektur bietet Intel mit der Arc A750 das zweitschnellste Modell der Serie an. Im Preisbereich bis 250 Euro will Intel mit seinen Grafikkarten AMD und auch Nvidia unter Druck setzen. Features wie Ray Tracing werden ebenfalls unterstützt und auch Upscaling Features wie XeSS können mit DLSS und FSR konkurrieren. Dafür bietet die Intel Arc A750 448 Tensor Cores, welche wir auch schon bei den aktuellen Grafikkarten von Nvidia vorfinden. Mit der Unterstützung von AV1 ist die Grafikkarte vor allem für Content-Creator interessant. Das hardwareseitige Encodieren und Decodieren mit dem neuen Codec beherrschen aktuell nur die Ada Lovelace Modelle von Nvidia und die RDNA3-GPUs von AMD.

Performance

Die Leistung der Intel Arc A750 ist mit einer AMD Radeon RX 7600 vergleichbar. Mit neueren Spielen kommt das Modell aus dem Haus Intel deutlich besser zurecht. Mit aktivierten Raytracing kann sich die Intel Arc A750 sogar vor der AMD Radeon RX 7600 platzieren. Aufgrund der gezeigten Leistung ist die Intel Arc A750 für das 1080p-Gaming im Jahre 2023 gut geeignet.

Leistungsaufnahme

Die Leistungsaufnahme der Intel Arc A750 wird vom Hersteller mit 225 Watt (TGP) beziffert. Das ist etwas mehr als bei einer Nvidia GeForce RTX 4060 oder der AMD Radeon RX 7600. In puncto Effizienz kann die Intel Arc A750 jedoch nicht überzeugen. Hier muss Intel etwas Nachbessern um mit dem Nachfolger aka "Battlemage" nicht den Anschluss zu verlieren.

Arc Serie

Arc A770 compare 4096 @ 2.1 - 2.4 GHz256 Bit @ 16000 MHz
Arc A750 3584 @ 2.05 - 2.4 GHz256 Bit @ 16000 MHz
Arc A580 compare 3072 @ 1.7 - 2 GHz256 Bit @ 16000 MHz
A770M compare 4096 @ 1.65 GHz256 Bit @ 16000 MHz
A730M compare 3072 @ 1.1 GHz192 Bit @ 14000 MHz
A570M compare 16 @ 0.9 - 1.3 GHz128 Bit @ 14000 MHz
A550M compare 16 @ 0.9 - 2.01 GHz128 Bit @ 14000 MHz
A530M compare 12 @ 0.9 - 1.3 GHz128 Bit @ 14000 MHz
A370M compare 8 @ 1.55 GHz64 Bit @ 14000 MHz
Arc A380 compare 1024 @ 2 GHz96 Bit @ 15500 MHz
A310 compare 6 @ 2 GHz64 Bit @ 15500 MHz
A350M compare 6 @ 1.15 GHz64 Bit @ 14000 MHz
CodenameDG2-512
Pipelines3584 - unified
TMUs224
ROPs112
Raytracing Cores28
Tensor / AI Cores448
Kerntakt2050 - 2400 (Boost) MHz
Theoretical Performance34.41 TFLOPS FP16, 17.2 TFLOPS FP32
CacheL2: 16 MB
Speichertakt16000 effective = 2000 MHz
Speicherbandbreite256 Bit
SpeichertypGDDR6
Max. Speichergröße8 GB
Shared Memorynein
Memory Bandwidth512 GB/s
APIDirectX 12 Ultimate (12_2), Shader 6.6, OpenGL 4.6, OpenCL 3.0, Vulkan 1.3
Stromverbrauch225 Watt
Transistoren21.7 Billion
Chipgröße 406 mm²
Herstellungsprozess6 nm
PCIe4.0 x16
Displays4 Displays (max.), HDMI 2.1, DisplayPort 2.0
Erscheinungsdatum12.10.2022

Benchmarks

Performance Rating - 3DMark 11 + Fire Strike + Time Spy
13.5 pt (41%)
3DMark Vantage
3DM Vant. Perf. total +
3DM Vant. Perf. GPU no PhysX +
3DMark 06 3DMark 06 - Standard 1280x1024 +
SPECviewperf 12
specvp12 sw-03 +
specvp12 snx-02 +
specvp12 showcase-01 +
specvp12 mediacal-01 +
specvp12 maya-04 +
specvp12 energy-01 +
specvp12 creo-01 +
specvp12 catia-04 +
specvp12 3dsmax-05 +
SPECviewperf 13 specvp13 sw-04 +
specvp13 snx-03 +
specvp13 showcase-02 +
specvp13 medical-02 +
specvp13 maya-05 +
specvp13 energy-02 +
specvp13 creo-02 +
specvp13 catia-05 +
specvp13 3dsmax-06 +
SPECviewperf 2020 specvp2020 snx-04 4k +
specvp2020 medical-03 4k +
specvp2020 maya-06 4k +
specvp2020 energy-03 4k +
specvp2020 creo-03 4k +
specvp2020 catia-06 4k +
specvp2020 3dsmax-07 4k +
Power Consumption - Furmark Stress Test Power Consumption - external Monitor *
min: 388     avg: 426     median: 426 (61%)     max: 464 Watt
0306090120150180210240270300330360390420450480510Tooltip
Power Consumption - The Witcher 3 Power Consumption - external Monitor *
min: 323     avg: 326     median: 326 (46%)     max: 329 Watt
020406080100120140160180200220240260280300320340Tooltip
Power Consumption - Cyberpunk 2077 Power Consumption - external Monitor *
470 Watt (60%)
0306090120150180210240270300330360390420450480510Tooltip
Emissions Witcher 3 Fan Noise +
- Bereich der Benchmarkergebnisse für diese Grafikkarte
- Durchschnittliche Benchmarkergebnisse für diese Grafikkarte
* Smaller numbers mean a higher performance

Spiele-Benchmarks

Die folgenden Benchmarks basieren auf unseren Spieletests mit Testnotebooks. Die Performance dieser Grafikkarte bei den gelisteten Spielen ist abhängig von der verwendeten CPU, Speicherausstattung, Treiber und auch Betriebssystem. Dadurch müssen die untenstehenden Werte nicht repräsentativ sein. Detaillierte Informationen über das verwendete System sehen Sie nach einem Klick auf den fps-Wert.

F1 24

F1 24

2024
min. 1920x1080
265  fps    + Vergleich
mittel 1920x1080
224  fps    + Vergleich
hoch 1920x1080
168.5  fps    + Vergleich
max. 1920x1080
56.5  fps    + Vergleich
QHD 2560x1440
37.1  fps    + Vergleich
4K 3840x2160
16.8  fps    + Vergleich
3840x2160
29.7  fps    + Vergleich
» In Detailstufe max. mit allen getesteten Notebooks spielbar
Additional Benchmarks
Ultra High Preset + Quality FSR 16xAF 2560x1440
57.5
min. 1920x1080
44.3  fps    + Vergleich + 📈 Graph
mittel 1920x1080
37.8  fps    + Vergleich + 📈 Graph
hoch 1920x1080
31.3  fps    + Vergleich + 📈 Graph
QHD 2560x1440
22.8  fps    + Vergleich + 📈 Graph
4K 3840x2160
11  fps    + Vergleich + 📈 Graph
3840x2160
20  fps    + Vergleich + 📈 Graph
» In Detailstufe mittel mit allen getesteten Notebooks spielbar
Additional Benchmarks
High Preset + Quality FSR 2560x1440
32.8
High Preset + Quality XeSS 2560x1440
34.6
min. 1920x1080
91.8  fps    + Vergleich + 📈 Graph
mittel 1920x1080
77  fps    + Vergleich + 📈 Graph
hoch 1920x1080
70.6  fps    + Vergleich + 📈 Graph
max. 1920x1080
58  fps    + Vergleich + 📈 Graph
QHD 2560x1440
42.1  fps    + Vergleich + 📈 Graph
4K 3840x2160
19.4  fps    + Vergleich + 📈 Graph
3840x2160
34.3  fps    + Vergleich + 📈 Graph
» In Detailstufe max. mit allen getesteten Notebooks spielbar
Additional Benchmarks
Very High Preset + Quality FSR 2560x1440
52.9
Very High Preset + Quality XeSS 2560x1440
59.6
min. 1920x1080
48.2  fps    + Vergleich + 📈 Graph
hoch 1920x1080
41.3  fps    + Vergleich + 📈 Graph
QHD 2560x1440
33.6  fps    + Vergleich + 📈 Graph
4K 3840x2160
20.7  fps    + Vergleich + 📈 Graph
» In Detailstufe hoch mit allen getesteten Notebooks spielbar
Additional Benchmarks
Low Preset 1280x720
59.2
min. 1920x1080
76.3  fps    + Vergleich + 📈 Graph
mittel 1920x1080
70.3  fps    + Vergleich + 📈 Graph
hoch 1920x1080
50.5  fps    + Vergleich + 📈 Graph
max. 1920x1080
50.1  fps    + Vergleich + 📈 Graph
QHD 2560x1440
40.3  fps    + Vergleich + 📈 Graph
4K 3840x2160
25.3  fps    + Vergleich + 📈 Graph
3840x2160
28.3  fps    + Vergleich + 📈 Graph
» In Detailstufe max. mit allen getesteten Notebooks spielbar
Additional Benchmarks
Very Low Preset 1280x720
100.6
min. 1920x1080
185.6  fps    + Vergleich + 📈 Graph
mittel 1920x1080
154.7  fps    + Vergleich + 📈 Graph
hoch 1920x1080
136.6  fps    + Vergleich + 📈 Graph
max. 1920x1080
77  fps    + Vergleich + 📈 Graph
QHD 2560x1440
47  fps    + Vergleich + 📈 Graph
4K 3840x2160
10.5  fps    + Vergleich + 📈 Graph
3840x2160
28.3  fps    + Vergleich + 📈 Graph
» In Detailstufe max. mit allen getesteten Notebooks spielbar
Additional Benchmarks
Low Preset 1280x720
156.6
min. 1920x1080
220  fps    + Vergleich + 📈 Graph
mittel 1920x1080
178.3  fps    + Vergleich + 📈 Graph
hoch 1920x1080
153.7  fps    + Vergleich + 📈 Graph
max. 1920x1080
121.7  fps    + Vergleich + 📈 Graph
QHD 2560x1440
81.1  fps    + Vergleich + 📈 Graph
4K 3840x2160
39.4  fps    + Vergleich + 📈 Graph
» In Detailstufe max. mit allen getesteten Notebooks spielbar
Additional Benchmarks
Very Low Preset 1280x720
296
min. 1920x1080
76  fps    + Vergleich
mittel 1920x1080
66  fps    + Vergleich
hoch 1920x1080
59  fps    + Vergleich
max. 1920x1080
49  fps    + Vergleich
QHD 2560x1440
41  fps    + Vergleich
4K 3840x2160
27  fps    + Vergleich
3840x2160
37  fps    + Vergleich
» In Detailstufe max. mit allen getesteten Notebooks spielbar
Additional Benchmarks
Low Preset TAA 1280x720
86
min. 1920x1080
108.5  fps    + Vergleich + 📈 Graph
mittel 1920x1080
88.1  fps    + Vergleich + 📈 Graph
hoch 1920x1080
82.2  fps    + Vergleich + 📈 Graph
max. 1920x1080
81.2  fps    + Vergleich + 📈 Graph
QHD 2560x1440
60.7  fps    + Vergleich + 📈 Graph
4K 3840x2160
32.1  fps    + Vergleich + 📈 Graph
» In Detailstufe max. mit allen getesteten Notebooks spielbar
Additional Benchmarks
Low Preset 1280x720
126.3
min. 1920x1080
67.7  fps    + Vergleich + 📈 Graph
mittel 1920x1080
59  fps    + Vergleich + 📈 Graph
hoch 1920x1080
51  fps    + Vergleich + 📈 Graph
max. 1920x1080
44  fps    + Vergleich + 📈 Graph
QHD 2560x1440
35.5  fps    + Vergleich + 📈 Graph
4K 3840x2160
22.2  fps    + Vergleich + 📈 Graph
3840x2160
26.2  fps    + Vergleich + 📈 Graph
» In Detailstufe max. mit allen getesteten Notebooks spielbar
Additional Benchmarks
Max. Performance 1280x720
104.1
Palworld

Palworld

2024
min. 1920x1080
125.2  fps    + Vergleich + 📈 Graph
mittel 1920x1080
112.2  fps    + Vergleich + 📈 Graph
hoch 1920x1080
89.5  fps    + Vergleich + 📈 Graph
max. 1920x1080
81.7  fps    + Vergleich + 📈 Graph
QHD 2560x1440
59.3  fps    + Vergleich + 📈 Graph
4K 3840x2160
32.3  fps    + Vergleich + 📈 Graph
» In Detailstufe max. mit allen getesteten Notebooks spielbar
Additional Benchmarks
Very Low Preset 1280x720
211
mittel 1920x1080
358  fps    + Vergleich + 📈 Graph
hoch 1920x1080
358  fps    + Vergleich + 📈 Graph
max. 1920x1080
359  fps    + Vergleich + 📈 Graph
QHD 2560x1440
332  fps    + Vergleich + 📈 Graph
4K 3840x2160
173.5  fps    + Vergleich + 📈 Graph
» In Detailstufe max. mit allen getesteten Notebooks spielbar
min. 1920x1080
185  fps    + Vergleich + 📈 Graph
mittel 1920x1080
173.1  fps    + Vergleich + 📈 Graph
hoch 1920x1080
166.8  fps    + Vergleich + 📈 Graph
max. 1920x1080
118.5  fps    + Vergleich + 📈 Graph
QHD 2560x1440
73.9  fps    + Vergleich + 📈 Graph
4K 3840x2160
31.9  fps    + Vergleich + 📈 Graph
» In Detailstufe max. mit allen getesteten Notebooks spielbar
min. 1920x1080
189.5  fps    + Vergleich + 📈 Graph
mittel 1920x1080
148.8  fps    + Vergleich + 📈 Graph
hoch 1920x1080
134.6  fps    + Vergleich + 📈 Graph
max. 1920x1080
109.3  fps    + Vergleich + 📈 Graph
QHD 2560x1440
72.1  fps    + Vergleich + 📈 Graph
4K 3840x2160
35.1  fps    + Vergleich + 📈 Graph
» In Detailstufe max. mit allen getesteten Notebooks spielbar
Additional Benchmarks
Low Preset 1280x720
265
min. 1920x1080
59  fps    + Vergleich
mittel 1920x1080
55  fps    + Vergleich
hoch 1920x1080
47  fps    + Vergleich
max. 1920x1080
38  fps    + Vergleich
QHD 2560x1440
27  fps    + Vergleich
4K 3840x2160
12  fps    + Vergleich
» In Detailstufe max. mit allen getesteten Notebooks spielbar
Additional Benchmarks
Low Preset TAA 1280x720
84
min. 1920x1080
109  fps    + Vergleich
mittel 1920x1080
99  fps    + Vergleich
hoch 1920x1080
80  fps    + Vergleich
max. 1920x1080
75  fps    + Vergleich
QHD 2560x1440
57  fps    + Vergleich
4K 3840x2160
20  fps    + Vergleich
» In Detailstufe max. mit allen getesteten Notebooks spielbar
Additional Benchmarks
Minimum Preset 1280x720
166
min. 1920x1080
98.4  fps    + Vergleich + 📈 Graph
mittel 1920x1080
72.3  fps    + Vergleich + 📈 Graph
hoch 1920x1080
66  fps    + Vergleich + 📈 Graph
max. 1920x1080
61  fps    + Vergleich + 📈 Graph
QHD 2560x1440
49  fps    + Vergleich + 📈 Graph
4K 3840x2160
30.3  fps    + Vergleich + 📈 Graph
» In Detailstufe max. mit allen getesteten Notebooks spielbar
Additional Benchmarks
Ultra Low Preset LowAA 1280x720
177.1
min. 1920x1080
44.6  fps    + Vergleich + 📈 Graph
mittel 1920x1080
41.3  fps    + Vergleich + 📈 Graph
hoch 1920x1080
38  fps    + Vergleich + 📈 Graph
QHD 2560x1440
26.7  fps    + Vergleich + 📈 Graph
4K 3840x2160
15.7  fps    + Vergleich + 📈 Graph
» In Detailstufe hoch mit allen getesteten Notebooks spielbar
Additional Benchmarks
Low Preset 1280x720
58.8
High Preset + High Ray Tracing 1920x1080
15.9
min. 1920x1080
63.2  fps    + Vergleich + 📈 Graph
mittel 1920x1080
55.4  fps    + Vergleich + 📈 Graph
hoch 1920x1080
46.4  fps    + Vergleich + 📈 Graph
max. 1920x1080
35.2  fps    + Vergleich + 📈 Graph
QHD 2560x1440
25.7  fps    + Vergleich + 📈 Graph
4K 3840x2160
10.1  fps    + Vergleich + 📈 Graph
» In Detailstufe max. mit allen getesteten Notebooks spielbar
Additional Benchmarks
Low Preset 1280x720
87.5
min. 1920x1080
367.2  fps    + Vergleich
mittel 1920x1080
231.4  fps    + Vergleich
hoch 1920x1080
137  fps    + Vergleich
max. 1920x1080
108.7  fps    + Vergleich
QHD 2560x1440
77.4  fps    + Vergleich
4K 3840x2160
40.6  fps    + Vergleich
» In Detailstufe max. mit allen getesteten Notebooks spielbar
Additional Benchmarks
Low Preset 1280x720
490.9
min. 1920x1080
80  fps    + Vergleich
mittel 1920x1080
70  fps    + Vergleich
hoch 1920x1080
70  fps    + Vergleich
max. 1920x1080
53  fps    + Vergleich
QHD 2560x1440
43  fps    + Vergleich
4K 3840x2160
29  fps    + Vergleich
» In Detailstufe max. mit allen getesteten Notebooks spielbar
Additional Benchmarks
Low Preset (Adaptive Quality Off) 1280x720
100
min. 1920x1080
191.8  fps    + Vergleich + 📈 Graph
mittel 1920x1080
176.2  fps    + Vergleich + 📈 Graph
hoch 1920x1080
136.5  fps    + Vergleich + 📈 Graph
max. 1920x1080
127.2  fps    + Vergleich + 📈 Graph
QHD 2560x1440
105.7  fps    + Vergleich + 📈 Graph
4K 3840x2160
67.7  fps    + Vergleich + 📈 Graph
» In Detailstufe max. mit allen getesteten Notebooks spielbar
Additional Benchmarks
Low Preset 1280x720
239
min. 1920x1080
336  fps    + Vergleich + 📈 Graph
mittel 1920x1080
270  fps    + Vergleich + 📈 Graph
hoch 1920x1080
169.5  fps    + Vergleich + 📈 Graph
max. 1920x1080
117.9  fps    + Vergleich + 📈 Graph
QHD 2560x1440
89  fps    + Vergleich + 📈 Graph
4K 3840x2160
40.3  fps    + Vergleich + 📈 Graph
» In Detailstufe max. mit allen getesteten Notebooks spielbar
Additional Benchmarks
Low Preset 1280x720
308
min. 1920x1080
90.7  fps    + Vergleich
mittel 1920x1080
87.9  fps    + Vergleich
hoch 1920x1080
76.3  fps    + Vergleich
max. 1920x1080
74.9  fps    + Vergleich
QHD 2560x1440
54.2  fps    + Vergleich
4K 3840x2160
27.6  fps    + Vergleich
» In Detailstufe max. mit allen getesteten Notebooks spielbar
Additional Benchmarks
Low Preset (FSR off) 1280x720
89.4
Ray Tracing Ultra Preset (DLSS off) 1920x1080
28.2
30min Start Ultra Preset (FSR off) 1920x1080
68.9
Lies of P

Lies of P

2023
min. 1920x1080
156.9  fps    + Vergleich + 📈 Graph
mittel 1920x1080
138.4  fps    + Vergleich + 📈 Graph
hoch 1920x1080
121.4  fps    + Vergleich + 📈 Graph
max. 1920x1080
112  fps    + Vergleich + 📈 Graph
QHD 2560x1440
77.9  fps    + Vergleich + 📈 Graph
4K 3840x2160
40.4  fps    + Vergleich + 📈 Graph
» In Detailstufe max. mit allen getesteten Notebooks spielbar
Additional Benchmarks
Low Preset 1280x720
219
Starfield

Starfield

2023
min. 1920x1080
44.1  fps    + Vergleich + 📈 Graph
mittel 1920x1080
38.5  fps    + Vergleich + 📈 Graph
hoch 1920x1080
32.9  fps    + Vergleich + 📈 Graph
max. 1920x1080
27.2  fps    + Vergleich + 📈 Graph
QHD 2560x1440
16.5  fps    + Vergleich + 📈 Graph
4K 3840x2160
11.2  fps    + Vergleich + 📈 Graph
» In Detailstufe mittel mit allen getesteten Notebooks spielbar
Additional Benchmarks
Low Preset 1280x720
50.7
min. 1920x1080
75  fps    + Vergleich + 📈 Graph
mittel 1920x1080
73.9  fps    + Vergleich + 📈 Graph
hoch 1920x1080
71.5  fps    + Vergleich + 📈 Graph
max. 1920x1080
70.4  fps    + Vergleich + 📈 Graph
QHD 2560x1440
65.7  fps    + Vergleich + 📈 Graph
4K 3840x2160
41.6  fps    + Vergleich + 📈 Graph
» In Detailstufe max. mit allen getesteten Notebooks spielbar
Additional Benchmarks
Low Preset 1280x720
70.2
min. 1920x1080
53.8  fps    + Vergleich + 📈 Graph
hoch 1920x1080
46.8  fps    + Vergleich + 📈 Graph
max. 1920x1080
41.8  fps    + Vergleich + 📈 Graph
QHD 2560x1440
29.7  fps    + Vergleich + 📈 Graph
4K 3840x2160
9.9  fps    + Vergleich + 📈 Graph
» In Detailstufe max. mit allen getesteten Notebooks spielbar
Additional Benchmarks
Low 1280x720
71.3
min. 1920x1080
126.6  fps    + Vergleich + 📈 Graph
mittel 1920x1080
122.3  fps    + Vergleich + 📈 Graph
hoch 1920x1080
115.2  fps    + Vergleich + 📈 Graph
max. 1920x1080
83.3  fps    + Vergleich + 📈 Graph
QHD 2560x1440
63.9  fps    + Vergleich + 📈 Graph
4K 3840x2160
33.1  fps    + Vergleich + 📈 Graph
» In Detailstufe max. mit allen getesteten Notebooks spielbar
Additional Benchmarks
Low Preset 1280x720
179.5
min. 1920x1080
119  fps    + Vergleich + 📈 Graph
mittel 1920x1080
100.9  fps    + Vergleich + 📈 Graph
hoch 1920x1080
90.3  fps    + Vergleich + 📈 Graph
max. 1920x1080
87.9  fps    + Vergleich + 📈 Graph
QHD 2560x1440
58.9  fps    + Vergleich + 📈 Graph
4K 3840x2160
29.8  fps    + Vergleich + 📈 Graph
» In Detailstufe max. mit allen getesteten Notebooks spielbar
Additional Benchmarks
Low Preset 1280x720
176.3
min. 1920x1080
85.4  fps    + Vergleich + 📈 Graph
mittel 1920x1080
74.3  fps    + Vergleich + 📈 Graph
hoch 1920x1080
59.9  fps    + Vergleich + 📈 Graph
max. 1920x1080
53.7  fps    + Vergleich + 📈 Graph
QHD 2560x1440
43.5  fps    + Vergleich + 📈 Graph
4K 3840x2160
30.5  fps    + Vergleich + 📈 Graph
» In Detailstufe max. mit allen getesteten Notebooks spielbar
Additional Benchmarks
Very Low Preset 1280x720
107.9
Very High Preset + Very High Raytracing TAA 1920x1080
31.1
F1 23

F1 23

2023
min. 1920x1080
274  fps    + Vergleich
mittel 1920x1080
239  fps    + Vergleich
hoch 1920x1080
170.5  fps    + Vergleich
max. 1920x1080
55.2  fps    + Vergleich
QHD 2560x1440
34.9  fps    + Vergleich
4K 3840x2160
16.2  fps    + Vergleich
» In Detailstufe max. mit allen getesteten Notebooks spielbar
Additional Benchmarks
Ultra Low Preset TAA 1280x720
403
Diablo 4

Diablo 4

2023
min. 1920x1080
197  fps    + Vergleich + 📈 Graph
mittel 1920x1080
178.3  fps    + Vergleich + 📈 Graph
hoch 1920x1080
162  fps    + Vergleich + 📈 Graph
max. 1920x1080
136.1  fps    + Vergleich + 📈 Graph
QHD 2560x1440
87.1  fps    + Vergleich + 📈 Graph
4K 3840x2160
47.2  fps    + Vergleich + 📈 Graph
» In Detailstufe max. mit allen getesteten Notebooks spielbar
Additional Benchmarks
Low Preset 1280x720
288
min. 1920x1080
75.9  fps    + Vergleich + 📈 Graph
mittel 1920x1080
67.2  fps    + Vergleich + 📈 Graph
hoch 1920x1080
63.3  fps    + Vergleich + 📈 Graph
max. 1920x1080
58.9  fps    + Vergleich + 📈 Graph
QHD 2560x1440
39  fps    + Vergleich + 📈 Graph
4K 3840x2160
19.5  fps    + Vergleich + 📈 Graph
» In Detailstufe max. mit allen getesteten Notebooks spielbar
Additional Benchmarks
Low Preset 1280x720
118.6
Epic Preset + Ray Tracing 1920x1080
42.1
min. 1920x1080
204  fps    + Vergleich + 📈 Graph
mittel 1920x1080
174  fps    + Vergleich + 📈 Graph
hoch 1920x1080
138.1  fps    + Vergleich + 📈 Graph
max. 1920x1080
107.5  fps    + Vergleich + 📈 Graph
QHD 2560x1440
79  fps    + Vergleich + 📈 Graph
4K 3840x2160
40.4  fps    + Vergleich + 📈 Graph
» In Detailstufe max. mit allen getesteten Notebooks spielbar
Additional Benchmarks
Low Preset Low TAA 1280x720
207
min. 1920x1080
49.5  fps    + Vergleich + 📈 Graph
mittel 1920x1080
36.4  fps    + Vergleich + 📈 Graph
hoch 1920x1080
46  fps    + Vergleich + 📈 Graph
max. 1920x1080
38.7  fps    + Vergleich + 📈 Graph
QHD 2560x1440
28.4  fps    + Vergleich + 📈 Graph
4K 3840x2160
12.7  fps    + Vergleich + 📈 Graph
» In Detailstufe max. mit allen getesteten Notebooks spielbar
Additional Benchmarks
Low Preset 1280x720
80.6
min. 1920x1080
150.5  fps    + Vergleich + 📈 Graph
mittel 1920x1080
108.1  fps    + Vergleich + 📈 Graph
hoch 1920x1080
101.9  fps    + Vergleich + 📈 Graph
max. 1920x1080
67.9  fps    + Vergleich + 📈 Graph
QHD 2560x1440
47.6  fps    + Vergleich + 📈 Graph
4K 3840x2160
28.9  fps    + Vergleich + 📈 Graph
» In Detailstufe max. mit allen getesteten Notebooks spielbar
Additional Benchmarks
Prioritize Performance Preset 1280x720
193
min. 1920x1080
169.9  fps    + Vergleich
mittel 1920x1080
142.7  fps    + Vergleich
hoch 1920x1080
114.2  fps    + Vergleich
max. 1920x1080
114.1  fps    + Vergleich
QHD 2560x1440
86.4  fps    + Vergleich
4K 3840x2160
53.7  fps    + Vergleich
» In Detailstufe max. mit allen getesteten Notebooks spielbar
Additional Benchmarks
Minimum Settings 1280x720
258.2
min. 1920x1080
65.5  fps    + Vergleich + 📈 Graph
mittel 1920x1080
51  fps    + Vergleich + 📈 Graph
hoch 1920x1080
50.5  fps    + Vergleich + 📈 Graph
max. 1920x1080
49.7  fps    + Vergleich + 📈 Graph
QHD 2560x1440
36.7  fps    + Vergleich + 📈 Graph
4K 3840x2160
21.7  fps    + Vergleich + 📈 Graph
» In Detailstufe max. mit allen getesteten Notebooks spielbar
Additional Benchmarks
Ultra Low Preset 1280x720
92.2
min. 1920x1080
163.6  fps    + Vergleich + 📈 Graph
mittel 1920x1080
122.6  fps    + Vergleich + 📈 Graph
hoch 1920x1080
89.3  fps    + Vergleich + 📈 Graph
max. 1920x1080
64.6  fps    + Vergleich + 📈 Graph
QHD 2560x1440
51.8  fps    + Vergleich + 📈 Graph
4K 3840x2160
30.5  fps    + Vergleich + 📈 Graph
» In Detailstufe max. mit allen getesteten Notebooks spielbar
Additional Benchmarks
Low Preset 1280x720
219
Returnal

Returnal

2023
min. 1920x1080
85  fps    + Vergleich
mittel 1920x1080
84  fps    + Vergleich
hoch 1920x1080
77  fps    + Vergleich
max. 1920x1080
67  fps    + Vergleich
QHD 2560x1440
53  fps    + Vergleich
4K 3840x2160
32  fps    + Vergleich
» In Detailstufe max. mit allen getesteten Notebooks spielbar
Additional Benchmarks
Low Preset 1280x720
104
Epic Preset + Epic Ray-Tracing 1920x1080
47
Epic Preset + Epic Ray-Tracing 3840x2160
18
min. 1920x1080
110.7  fps    + Vergleich + 📈 Graph
mittel 1920x1080
85.1  fps    + Vergleich + 📈 Graph
hoch 1920x1080
67.6  fps    + Vergleich + 📈 Graph
max. 1920x1080
55.3  fps    + Vergleich + 📈 Graph
QHD 2560x1440
41.6  fps    + Vergleich + 📈 Graph
4K 3840x2160
22.8  fps    + Vergleich + 📈 Graph
» In Detailstufe max. mit allen getesteten Notebooks spielbar
Additional Benchmarks
Low Preset Low TAA 1280x720
144.7
Ultra Preset + Full Ray Tracing High TAA 1920x1080
30.8
Ultra Preset + Full Ray Tracing High TAA 3840x2160
11.5
min. 1920x1080
70.8  fps    + Vergleich + 📈 Graph
mittel 1920x1080
71.2  fps    + Vergleich + 📈 Graph
hoch 1920x1080
63.9  fps    + Vergleich + 📈 Graph
max. 1920x1080
63.8  fps    + Vergleich + 📈 Graph
QHD 2560x1440
44.7  fps    + Vergleich + 📈 Graph
4K 3840x2160
16.7  fps    + Vergleich + 📈 Graph
» In Detailstufe max. mit allen getesteten Notebooks spielbar
Additional Benchmarks
Low Preset TAA 1280x720
100.3
min. 1920x1080
241  fps    + Vergleich + 📈 Graph
mittel 1920x1080
158.2  fps    + Vergleich + 📈 Graph
hoch 1920x1080
130.8  fps    + Vergleich + 📈 Graph
max. 1920x1080
104.3  fps    + Vergleich + 📈 Graph
QHD 2560x1440
66.5  fps    + Vergleich + 📈 Graph
4K 3840x2160
30.9  fps    + Vergleich + 📈 Graph
» In Detailstufe max. mit allen getesteten Notebooks spielbar
Additional Benchmarks
Low Preset 1280x720
310
min. 1920x1080
152.2  fps    + Vergleich
mittel 1920x1080
114.7  fps    + Vergleich
hoch 1920x1080
107.1  fps    + Vergleich
max. 1920x1080
75.8  fps    + Vergleich
QHD 2560x1440
60.5  fps    + Vergleich
4K 3840x2160
38.1  fps    + Vergleich
» In Detailstufe max. mit allen getesteten Notebooks spielbar
Additional Benchmarks
Low Preset (without FSR Upscaling) 1280x720
180.4
Ultra Preset (without FSR Upscaling) + Full Ray-Tracing 1920x1080
54.1
min. 1920x1080
108.6  fps    + Vergleich + 📈 Graph
mittel 1920x1080
96  fps    + Vergleich + 📈 Graph
hoch 1920x1080
75.3  fps    + Vergleich + 📈 Graph
max. 1920x1080
74.8  fps    + Vergleich + 📈 Graph
QHD 2560x1440
56.6  fps    + Vergleich + 📈 Graph
4K 3840x2160
32.5  fps    + Vergleich + 📈 Graph
» In Detailstufe max. mit allen getesteten Notebooks spielbar
Additional Benchmarks
Low Preset 1280x720
137.3
min. 1920x1080
129.1  fps    + Vergleich + 📈 Graph
mittel 1920x1080
116  fps    + Vergleich + 📈 Graph
hoch 1920x1080
112.5  fps    + Vergleich + 📈 Graph
max. 1920x1080
104.7  fps    + Vergleich + 📈 Graph
QHD 2560x1440
77.9  fps    + Vergleich + 📈 Graph
4K 3840x2160
44.7  fps    + Vergleich + 📈 Graph
» In Detailstufe max. mit allen getesteten Notebooks spielbar
Additional Benchmarks
Very Low Preset 1280x720
159.7
Very High Preset + Ray-Tracing TAA 1920x0180
43
min. 1920x1080
57.4  fps    + Vergleich + 📈 Graph
mittel 1920x1080
55.6  fps    + Vergleich + 📈 Graph
hoch 1920x1080
52.8  fps    + Vergleich + 📈 Graph
max. 1920x1080
49.1  fps    + Vergleich + 📈 Graph
QHD 2560x1440
37.2  fps    + Vergleich + 📈 Graph
4K 3840x2160
19  fps    + Vergleich + 📈 Graph
» In Detailstufe max. mit allen getesteten Notebooks spielbar
Additional Benchmarks
Low Preset 1280x720
65.2
min. 1920x1080
94.9  fps    + Vergleich + 📈 Graph
mittel 1920x1080
77.2  fps    + Vergleich + 📈 Graph
hoch 1920x1080
60.9  fps    + Vergleich + 📈 Graph
max. 1920x1080
47  fps    + Vergleich + 📈 Graph
QHD 2560x1440
36.7  fps    + Vergleich + 📈 Graph
4K 3840x2160
21.9  fps    + Vergleich + 📈 Graph
» In Detailstufe max. mit allen getesteten Notebooks spielbar
Additional Benchmarks
Low Preset 1280x720
96.9
min. 1920x1080
116.7  fps    + Vergleich + 📈 Graph
mittel 1920x1080
90.9  fps    + Vergleich + 📈 Graph
hoch 1920x1080
74  fps    + Vergleich + 📈 Graph
max. 1920x1080
56.9  fps    + Vergleich + 📈 Graph
QHD 2560x1440
39.5  fps    + Vergleich + 📈 Graph
4K 3840x2160
20.3  fps    + Vergleich + 📈 Graph
» In Detailstufe max. mit allen getesteten Notebooks spielbar
Additional Benchmarks
Low Preset 1280x720
148.2
F1 22

F1 22

2022
min. 1920x1080
280  fps    + Vergleich
mittel 1920x1080
249  fps    + Vergleich
hoch 1920x1080
201  fps    + Vergleich
max. 1920x1080
65.4  fps    + Vergleich
QHD 2560x1440
40.9  fps    + Vergleich
4K 3840x2160
18.4  fps    + Vergleich
» In Detailstufe max. mit allen getesteten Notebooks spielbar
Additional Benchmarks
Ultra Low Preset 16xAF TAA 1280x720
394
min. 1920x1080
136  fps    + Vergleich + 📈 Graph
mittel 1920x1080
133.7  fps    + Vergleich + 📈 Graph
hoch 1920x1080
132.9  fps    + Vergleich + 📈 Graph
max. 1920x1080
125.4  fps    + Vergleich + 📈 Graph
QHD 2560x1440
88.2  fps    + Vergleich + 📈 Graph
4K 3840x2160
43.2  fps    + Vergleich + 📈 Graph
» In Detailstufe max. mit allen getesteten Notebooks spielbar
Additional Benchmarks
Lowest Settings 1280x720
221
Highest Settings + Maximum Ray Tracing 1920x1080
58
min. 1920x1080
188.1  fps    + Vergleich
mittel 1920x1080
149.8  fps    + Vergleich
hoch 1920x1080
104.9  fps    + Vergleich
max. 1920x1080
85.8  fps    + Vergleich
QHD 2560x1440
59.2  fps    + Vergleich
4K 3840x2160
30.9  fps    + Vergleich
» In Detailstufe max. mit allen getesteten Notebooks spielbar
Additional Benchmarks
Lowest Preset (DX12) 1280x720
296
min. 1920x1080
75.1  fps    + Vergleich
mittel 1920x1080
66.4  fps    + Vergleich
hoch 1920x1080
58.3  fps    + Vergleich
max. 1920x1080
55  fps    + Vergleich
QHD 2560x1440
41.5  fps    + Vergleich
4K 3840x2160
23.2  fps    + Vergleich
» In Detailstufe max. mit allen getesteten Notebooks spielbar
Additional Benchmarks
Low Preset 1280x720
90.1
Ray Tracing Ultra Preset (DLSS off) 1920x1080
26.6
Ray Tracing Ultra Preset (DLSS off) 3840x2160
6.8
min. 1920x1080
156.3  fps    + Vergleich
mittel 1920x1080
129.7  fps    + Vergleich
hoch 1920x1080
106.9  fps    + Vergleich
max. 1920x1080
88.7  fps    + Vergleich
QHD 2560x1440
77.1  fps    + Vergleich
4K 3840x2160
67.7  fps    + Vergleich
» In Detailstufe max. mit allen getesteten Notebooks spielbar
Additional Benchmarks
Low Preset 1280x720
166.4
min. 1920x1080
84.2  fps    + Vergleich + 📈 Graph
mittel 1920x1080
76.7  fps    + Vergleich + 📈 Graph
hoch 1920x1080
65.6  fps    + Vergleich + 📈 Graph
max. 1920x1080
51.4  fps    + Vergleich + 📈 Graph
QHD 2560x1440
44.4  fps    + Vergleich + 📈 Graph
4K 3840x2160
31.2  fps    + Vergleich + 📈 Graph
» In Detailstufe max. mit allen getesteten Notebooks spielbar
Additional Benchmarks
Low Preset 1280x720
97.3
min. 1280x720
356  fps    + Vergleich + 📈 Graph
mittel 1920x1080
219  fps    + Vergleich + 📈 Graph
hoch 1920x1080
192.4  fps    + Vergleich + 📈 Graph
max. 1920x1080
165.8  fps    + Vergleich + 📈 Graph
QHD 2560x1440
128.2  fps    + Vergleich + 📈 Graph
4K 3840x2160
80.7  fps    + Vergleich + 📈 Graph
» In Detailstufe max. mit allen getesteten Notebooks spielbar
Additional Benchmarks
Low Preset 1920x1080
388
min. 1280x720
227  fps    + Vergleich
mittel 1920x1080
132  fps    + Vergleich
hoch 1920x1080
121  fps    + Vergleich
max. 1920x1080
70  fps    + Vergleich
QHD 2560x1440
60  fps    + Vergleich
4K 3840x2160
44  fps    + Vergleich
» In Detailstufe max. mit allen getesteten Notebooks spielbar
Additional Benchmarks
Low Preset 1920x1080
153
min. 1280x720
167  fps    + Vergleich
mittel 1920x1080
118  fps    + Vergleich
hoch 1920x1080
116  fps    + Vergleich
max. 1920x1080
109  fps    + Vergleich
QHD 2560x1440
83  fps    + Vergleich
4K 3840x2160
48  fps    + Vergleich
» In Detailstufe max. mit allen getesteten Notebooks spielbar
Additional Benchmarks
Low Preset 1920x1080
125
Ultra Preset + Ultra Ray-Tracing 1920x1080
54
Far Cry 6

Far Cry 6

2021
min. 1280x720
193.9  fps    + Vergleich + 📈 Graph
mittel 1920x1080
126.7  fps    + Vergleich + 📈 Graph
hoch 1920x1080
110.1  fps    + Vergleich + 📈 Graph
max. 1920x1080
83.7  fps    + Vergleich + 📈 Graph
QHD 2560x1440
70.9  fps    + Vergleich + 📈 Graph
4K 3840x2160
41.9  fps    + Vergleich + 📈 Graph
» In Detailstufe max. mit allen getesteten Notebooks spielbar
Additional Benchmarks
Low Graphics Quality 1920x1080
149
Ultra Graphics Quality + HD Textures + DXR TAA 1920x1080
69.4
F1 2021

F1 2021

2021
min. 1280x720
530  fps    + Vergleich
mittel 1920x1080
305  fps    + Vergleich
hoch 1920x1080
235  fps    + Vergleich
max. 1920x1080
115.2  fps    + Vergleich
QHD 2560x1440
86.7  fps    + Vergleich
4K 3840x2160
47.9  fps    + Vergleich
» In Detailstufe max. mit allen getesteten Notebooks spielbar
min. 1280x720
116  fps    + Vergleich
mittel 1920x1080
90  fps    + Vergleich
hoch 1920x1080
76  fps    + Vergleich
max. 1920x1080
69  fps    + Vergleich
QHD 2560x1440
54  fps    + Vergleich
4K 3840x2160
30  fps    + Vergleich
» In Detailstufe max. mit allen getesteten Notebooks spielbar
Dirt 5

Dirt 5

2020
min. 1280x720
84.8  fps    + Vergleich
mittel 1920x1080
76.9  fps    + Vergleich
hoch 1920x1080
61.5  fps    + Vergleich
max. 1920x1080
52.6  fps    + Vergleich
QHD 2560x1440
52.2  fps    + Vergleich
4K 3840x2160
50.1  fps    + Vergleich
» In Detailstufe max. mit allen getesteten Notebooks spielbar
min. 1280x720
101  fps    + Vergleich
mittel 1920x1080
96  fps    + Vergleich
hoch 1920x1080
89  fps    + Vergleich
max. 1920x1080
63  fps    + Vergleich
QHD 2560x1440
50  fps    + Vergleich
4K 3840x2160
30  fps    + Vergleich
» In Detailstufe max. mit allen getesteten Notebooks spielbar
Additional Benchmarks
Ultra Preset + Ultra Ray Tracing (DX12) 1920x1080
30
min. 1280x720
136  fps    + Vergleich
mittel 1920x1080
115  fps    + Vergleich
hoch 1920x1080
104  fps    + Vergleich
max. 1920x1080
93  fps    + Vergleich
QHD 2560x1440
74  fps    + Vergleich
4K 3840x2160
42  fps    + Vergleich
» In Detailstufe max. mit allen getesteten Notebooks spielbar
Additional Benchmarks
Ultimate Quality FidelityFX Quality 3840x2160
66
min. 1280x720
179.9  fps    + Vergleich + 📈 Graph
mittel 1920x1080
132.8  fps    + Vergleich + 📈 Graph
hoch 1920x1080
126.2  fps    + Vergleich + 📈 Graph
max. 1920x1080
121.6  fps    + Vergleich + 📈 Graph
QHD 2560x1440
92.4  fps    + Vergleich + 📈 Graph
4K 3840x2160
55  fps    + Vergleich + 📈 Graph
» In Detailstufe max. mit allen getesteten Notebooks spielbar
F1 2020

F1 2020

2020
min. 1280x720
267  fps    + Vergleich
mittel 1920x1080
194.6  fps    + Vergleich
hoch 1920x1080
162.3  fps    + Vergleich
max. 1920x1080
113.4  fps    + Vergleich
QHD 2560x1440
92.3  fps    + Vergleich
4K 3840x2160
58.3  fps    + Vergleich
» In Detailstufe max. mit allen getesteten Notebooks spielbar
min. 1280x720
126.5  fps    + Vergleich
mittel 1920x1080
110.5  fps    + Vergleich
hoch 1920x1080
93.2  fps    + Vergleich
max. 1920x1080
78.4  fps    + Vergleich
QHD 2560x1440
60  fps    + Vergleich
4K 3840x2160
33.1  fps    + Vergleich
» In Detailstufe max. mit allen getesteten Notebooks spielbar
Additional Benchmarks
Very Low Overall Quality (DX11) 1920x1080
124.7
Control

Control

2019
min. 1280x720
195.3  fps    + Vergleich + 📈 Graph
mittel 1920x1080
99.2  fps    + Vergleich + 📈 Graph
hoch 1920x1080
81.6  fps    + Vergleich + 📈 Graph
QHD 2560x1440
59.4  fps    + Vergleich + 📈 Graph
4K 3840x2160
31.6  fps    + Vergleich + 📈 Graph
» In Detailstufe hoch mit allen getesteten Notebooks spielbar
Additional Benchmarks
High Quality Preset & High Ray Tracing Preset (DX12) 1920x1080
58.7
High Quality Preset & High Ray Tracing Preset (DX12) 3840x2160
12.9
Anno 1800

Anno 1800

2019
min. 1280x720
150.5  fps    + Vergleich + 📈 Graph
mittel 1920x1080
105  fps    + Vergleich + 📈 Graph
hoch 1920x1080
67.9  fps    + Vergleich + 📈 Graph
max. 1920x1080
37  fps    + Vergleich + 📈 Graph
QHD 2560x1440
27  fps    + Vergleich + 📈 Graph
4K 3840x2160
15.8  fps    + Vergleich + 📈 Graph
» In Detailstufe max. mit allen getesteten Notebooks spielbar
min. 1280x720
197  fps    + Vergleich
mittel 1920x1080
147  fps    + Vergleich
hoch 1920x1080
118  fps    + Vergleich
max. 1920x1080
93  fps    + Vergleich
QHD 2560x1440
63  fps    + Vergleich
4K 3840x2160
31  fps    + Vergleich
» In Detailstufe max. mit allen getesteten Notebooks spielbar
min. 1280x720
143  fps    + Vergleich + 📈 Graph
mittel 1920x1080
116  fps    + Vergleich + 📈 Graph
hoch 1920x1080
110  fps    + Vergleich + 📈 Graph
max. 1920x1080
99  fps    + Vergleich + 📈 Graph
QHD 2560x1440
86  fps    + Vergleich + 📈 Graph
4K 3840x2160
52  fps    + Vergleich + 📈 Graph
» In Detailstufe max. mit allen getesteten Notebooks spielbar
min. 1280x720
198.9  fps    + Vergleich
mittel 1920x1080
139.6  fps    + Vergleich
hoch 1920x1080
96.5  fps    + Vergleich
max. 1920x1080
78.7  fps    + Vergleich
QHD 2560x1440
65  fps    + Vergleich
4K 3840x2160
43.1  fps    + Vergleich
» In Detailstufe max. mit allen getesteten Notebooks spielbar
Additional Benchmarks
Ultra Quality DXR 16xAF 1920x1080
66
min. 1280x720
144  fps    + Vergleich + 📈 Graph
mittel 1920x1080
143.9  fps    + Vergleich + 📈 Graph
hoch 1920x1080
143.1  fps    + Vergleich + 📈 Graph
max. 1920x1080
143.7  fps    + Vergleich + 📈 Graph
QHD 2560x1440
128.3  fps    + Vergleich + 📈 Graph
4K 3840x2160
79.6  fps    + Vergleich + 📈 Graph
» In Detailstufe max. mit allen getesteten Notebooks spielbar
min. 1280x720
76  fps    + Vergleich
mittel 1920x1080
62  fps    + Vergleich
hoch 1920x1080
55  fps    + Vergleich
max. 1920x1080
45  fps    + Vergleich
QHD 2560x1440
38  fps    + Vergleich
4K 3840x2160
28  fps    + Vergleich
» In Detailstufe max. mit allen getesteten Notebooks spielbar
min. 1280x720
176  fps    + Vergleich
mittel 1920x1080
112  fps    + Vergleich
hoch 1920x1080
106  fps    + Vergleich
max. 1920x1080
90  fps    + Vergleich
QHD 2560x1440
79  fps    + Vergleich
4K 3840x2160
61  fps    + Vergleich
» In Detailstufe max. mit allen getesteten Notebooks spielbar
min. 1280x720
265  fps    + Vergleich
mittel 1920x1080
130.9  fps    + Vergleich
hoch 1920x1080
122.2  fps    + Vergleich
max. 1920x1080
108.4  fps    + Vergleich
QHD 2560x1440
78.9  fps    + Vergleich
4K 3840x2160
44.2  fps    + Vergleich
» In Detailstufe max. mit allen getesteten Notebooks spielbar
Additional Benchmarks
Lowest Preset 1920x1080
215
Strange Brigade

Strange Brigade

2018
min. 1280x720
623  fps    + Vergleich
mittel 1920x1080
285  fps    + Vergleich
hoch 1920x1080
239  fps    + Vergleich
max. 1920x1080
198.6  fps    + Vergleich
QHD 2560x1440
144.9  fps    + Vergleich
4K 3840x2160
83.5  fps    + Vergleich
» In Detailstufe max. mit allen getesteten Notebooks spielbar
Far Cry 5

Far Cry 5

2018
min. 1280x720
152  fps    + Vergleich + 📈 Graph
mittel 1920x1080
111  fps    + Vergleich + 📈 Graph
hoch 1920x1080
102  fps    + Vergleich + 📈 Graph
max. 1920x1080
98  fps    + Vergleich + 📈 Graph
QHD 2560x1440
76  fps    + Vergleich + 📈 Graph
4K 3840x2160
45  fps    + Vergleich + 📈 Graph
» In Detailstufe max. mit allen getesteten Notebooks spielbar
Additional Benchmarks
Low Preset TAA 1920x1080
122
min. 1280x720
98.8  fps    + Vergleich
mittel 1920x1080
87.1  fps    + Vergleich
hoch 1920x1080
68.4  fps    + Vergleich
4K 3840x2160
56.6  fps    + Vergleich
» In Detailstufe hoch mit allen getesteten Notebooks spielbar
min. 1280x720
124.5  fps    + Vergleich
mittel 1920x1080
86.6  fps    + Vergleich
hoch 1920x1080
48.2  fps    + Vergleich
QHD 2560x1440
41.4  fps    + Vergleich
4K 3840x2160
28.8  fps    + Vergleich
» In Detailstufe hoch mit allen getesteten Notebooks spielbar
min. 1280x720
78  fps    + Vergleich
mittel 1920x1080
65  fps    + Vergleich
hoch 1920x1080
63  fps    + Vergleich
max. 1920x1080
56  fps    + Vergleich
QHD 2560x1440
50  fps    + Vergleich
4K 3840x2160
37  fps    + Vergleich
» In Detailstufe max. mit allen getesteten Notebooks spielbar
min. 1280x720
140.2  fps    + Vergleich
mittel 1366x768
124.1  fps    + Vergleich
hoch 1920x1080
113.8  fps    + Vergleich
max. 1920x1080
121.3  fps    + Vergleich
4K 3840x2160
89.9  fps    + Vergleich
» In Detailstufe max. mit allen getesteten Notebooks spielbar
min. 1024x768
443  fps    + Vergleich + 📈 Graph
mittel 1366x768
308  fps    + Vergleich + 📈 Graph
hoch 1920x1080
184.7  fps    + Vergleich + 📈 Graph
max. 1920x1080
69.2  fps    + Vergleich + 📈 Graph
QHD 2560x1440
57  fps    + Vergleich + 📈 Graph
4K 3840x2160
69.2  fps    + Vergleich + 📈 Graph
» In Detailstufe max. mit allen getesteten Notebooks spielbar
Additional Benchmarks
Ultra Graphics & Postprocessing (HBAO+) 3840x2160
38
Medium Graphics & Postprocessing 1920x1080
218
GTA V

GTA V

2015
min. 1024x768
188.1  fps    + Vergleich
mittel 1366x768
187.1  fps    + Vergleich
hoch 1920x1080
137.3  fps    + Vergleich
max. 1920x1080
60.2  fps    + Vergleich
QHD 2560x1440
41.1  fps    + Vergleich
4K 3840x2160
44.8  fps    + Vergleich
» In Detailstufe max. mit allen getesteten Notebooks spielbar
Additional Benchmarks
Highest Settings possible 16xAF 4xMSAA + FXAA 3840x2160
20.5
Normal/Off 4xAF 1920x1080
186.5
Lowest Settings possible 1920x1080
188.6
min.mittelhochmax.QHD4K
F1 24265224168.556.537.116.8
Senua's Saga Hellblade 244.337.831.322.811
Ghost of Tsushima91.87770.65842.119.4
Dragon's Dogma 248.241.333.620.7
Horizon Forbidden West76.370.350.550.140.325.3
Alone in the Dark185.6154.7136.6774710.5
Last Epoch220178.3153.7121.781.139.4
Skull & Bones766659494127
Helldivers 2108.588.182.281.260.732.1
Enshrouded67.759514435.522.2
Palworld125.2112.289.581.759.332.3
Prince of Persia The Lost Crown358358359332173.5
Ready or Not185173.1166.8118.573.931.9
The Finals189.5148.8134.6109.372.135.1
Avatar Frontiers of Pandora595547382712
Call of Duty Modern Warfare 3 20231099980755720
EA Sports WRC98.472.366614930.3
Alan Wake 244.641.33826.715.7
Lords of the Fallen63.255.446.435.225.710.1
Total War Pharaoh367.2231.4137108.777.440.6
Assassin's Creed Mirage807070534329
EA Sports FC 24191.8176.2136.5127.2105.767.7
Counter-Strike 2336270169.5117.98940.3
Cyberpunk 2077 2.1 Phantom Liberty90.787.976.374.954.227.6
Lies of P156.9138.4121.411277.940.4
Starfield44.138.532.927.216.511.2
Armored Core 67573.971.570.465.741.6
Immortals of Aveum53.846.841.829.79.87
Atlas Fallen126.6122.3115.283.363.933.1
Baldur's Gate 3119100.990.387.958.929.8
Ratchet & Clank Rift Apart85.474.359.953.743.530.5
F1 23274239170.555.234.916.2
Diablo 4197178.3162136.187.147.2
Star Wars Jedi Survivor75.967.263.358.93919.5
Dead Island 2204174138.1107.57940.4
The Last of Us49.536.44638.728.412.7
Resident Evil 4 Remake150.5108.1101.967.947.628.9
Company of Heroes 3169.9142.7114.2114.186.453.7
Sons of the Forest65.55150.549.736.721.7
Atomic Heart163.6122.689.364.651.830.5
Returnal858477675332
Hogwarts Legacy110.785.167.655.341.622.8
Dead Space Remake70.871.263.963.844.716.7
High On Life241158.2130.8104.366.530.9
The Callisto Protocol152.2114.7107.175.860.538.1
Need for Speed Unbound108.69675.374.856.632.5
Spider-Man Miles Morales129.1116112.5104.777.944.7
Uncharted Legacy of Thieves Collection57.455.652.849.137.219
A Plague Tale Requiem94.977.260.94736.721.9
The Quarry116.790.97456.939.520.3
F1 2228024920165.440.918.4
Ghostwire Tokyo136133.7132.9125.488.243.2
Tiny Tina's Wonderlands188.1149.8104.985.859.230.9
Cyberpunk 2077 1.675.166.458.35541.523.2
GRID Legends156.3129.7106.988.777.167.7
God of War84.276.765.651.444.431.2
Farming Simulator 22356219192.4165.8128.280.7
Forza Horizon 5227132121706044
Guardians of the Galaxy1671181161098348
Far Cry 6193.9126.7110.183.770.941.9
F1 2021530305235115.286.747.9
Assassin´s Creed Valhalla1169076695430
Dirt 584.876.961.552.652.250.1
Watch Dogs Legion1019689635030
Horizon Zero Dawn136115104937442
Death Stranding179.9132.8126.2121.692.455
F1 2020267194.6162.3113.492.358.3
Borderlands 3126.5110.593.278.46033.1
Control195.399.281.659.431.6
Anno 1800150.510567.9372715.8
The Division 2197147118936331
Far Cry New Dawn143116110998652
Metro Exodus198.9139.696.578.76543.1
Apex Legends144143.9143.1143.7128.379.6
Assassin´s Creed Odyssey766255453828
Forza Horizon 4176112106907961
Shadow of the Tomb Raider265130.9122.2108.478.944.2
Strange Brigade623285239198.6144.983.5
Far Cry 5152111102987645
X-Plane 11.1198.887.168.456.6
Final Fantasy XV Benchmark124.586.648.241.428.8
Assassin´s Creed Origins786563565037
Dota 2 Reborn140.2124.1113.8121.389.9
The Witcher 3443308184.769.25769.2
GTA V188.1187.1137.360.241.144.8
< 30 fps
< 60 fps
< 120 fps
≥ 120 fps

8
29
47

9
39
35

17
42
26
1
24
44
10
8
39
32
4
32
44
8
1

Eine Liste mit weiteren Spielen und allen Grafikkarten finden Sie auf unserer Seite: Welches Spiel ist mit welcher Grafikkarte spielbar?

Ein oder mehrere Geräte zum Vergleich auswählen

In der folgenden Liste können sie Geräte suchen und für einen Vergleich auswählen.

Liste einschränken:

show all (including archived), 2024, 2023
v1.28
log 25. 05:47:34

#0 no ids found in url (should be separated by "_") +0s ... 0s

#1 not redirecting to Ajax server +0s ... 0s

#2 did not recreate cache, as it is less than 5 days old! Created at Thu, 25 Jul 2024 05:29:35 +0200 +0.001s ... 0.001s

#3 composed specs +0.044s ... 0.045s

#4 did output specs +0s ... 0.045s

#5 start showIntegratedCPUs +0s ... 0.045s

#6 getting avg benchmarks for device 11632 +0.03s ... 0.075s

#7 got single benchmarks 11632 +0.012s ... 0.087s

#8 got avg benchmarks for devices +0s ... 0.087s

#9 min, max, avg, median took s +0.879s ... 0.966s

#10 before gaming benchmark output +0s ... 0.966s

#11 Got 506 rows for game benchmarks. +0.05s ... 1.016s

#12 composed SQL query for gamebenchmarks +0s ... 1.016s

#13 got data and put it in $dataArray +0.056s ... 1.072s

#14 benchmarks composed for output. +4.726s ... 5.798s

#15 return log +0.047s ... 5.845s

Teilen Sie diesen Artikel, um uns zu unterstützen. Jeder Link hilft!

» Vergleich mobiler Grafikkarten
Liste aller mobiler Grafikkarten mit Kurzinformationen sortiert nach Leistung

» Mobile Grafikkarten - Benchmarkliste
Sortier- und filterbare Benchmark-Liste

» Spieleliste
Welche Spiele laufen mit welcher Grafikkarte

Leistungsklasse 1

Leistungsklasse 2

Leistungsklasse 3

UHD Graphics 750

* Geschätzte Position

> Notebook Test, Laptop Test und News > Benchmarks / Technik > Benchmarks / Technik > Vergleich mobiler Grafikkarten > Intel Arc A750 Grafikkarte - Benchmarks und Spezifikationen
Autor: Sebastian Bade (Update: 20.11.2023)