


AMD Radeon RX 6500 XT im Test - AMD's neue Einsteiger-Grafikkarte auf Navi-Basis
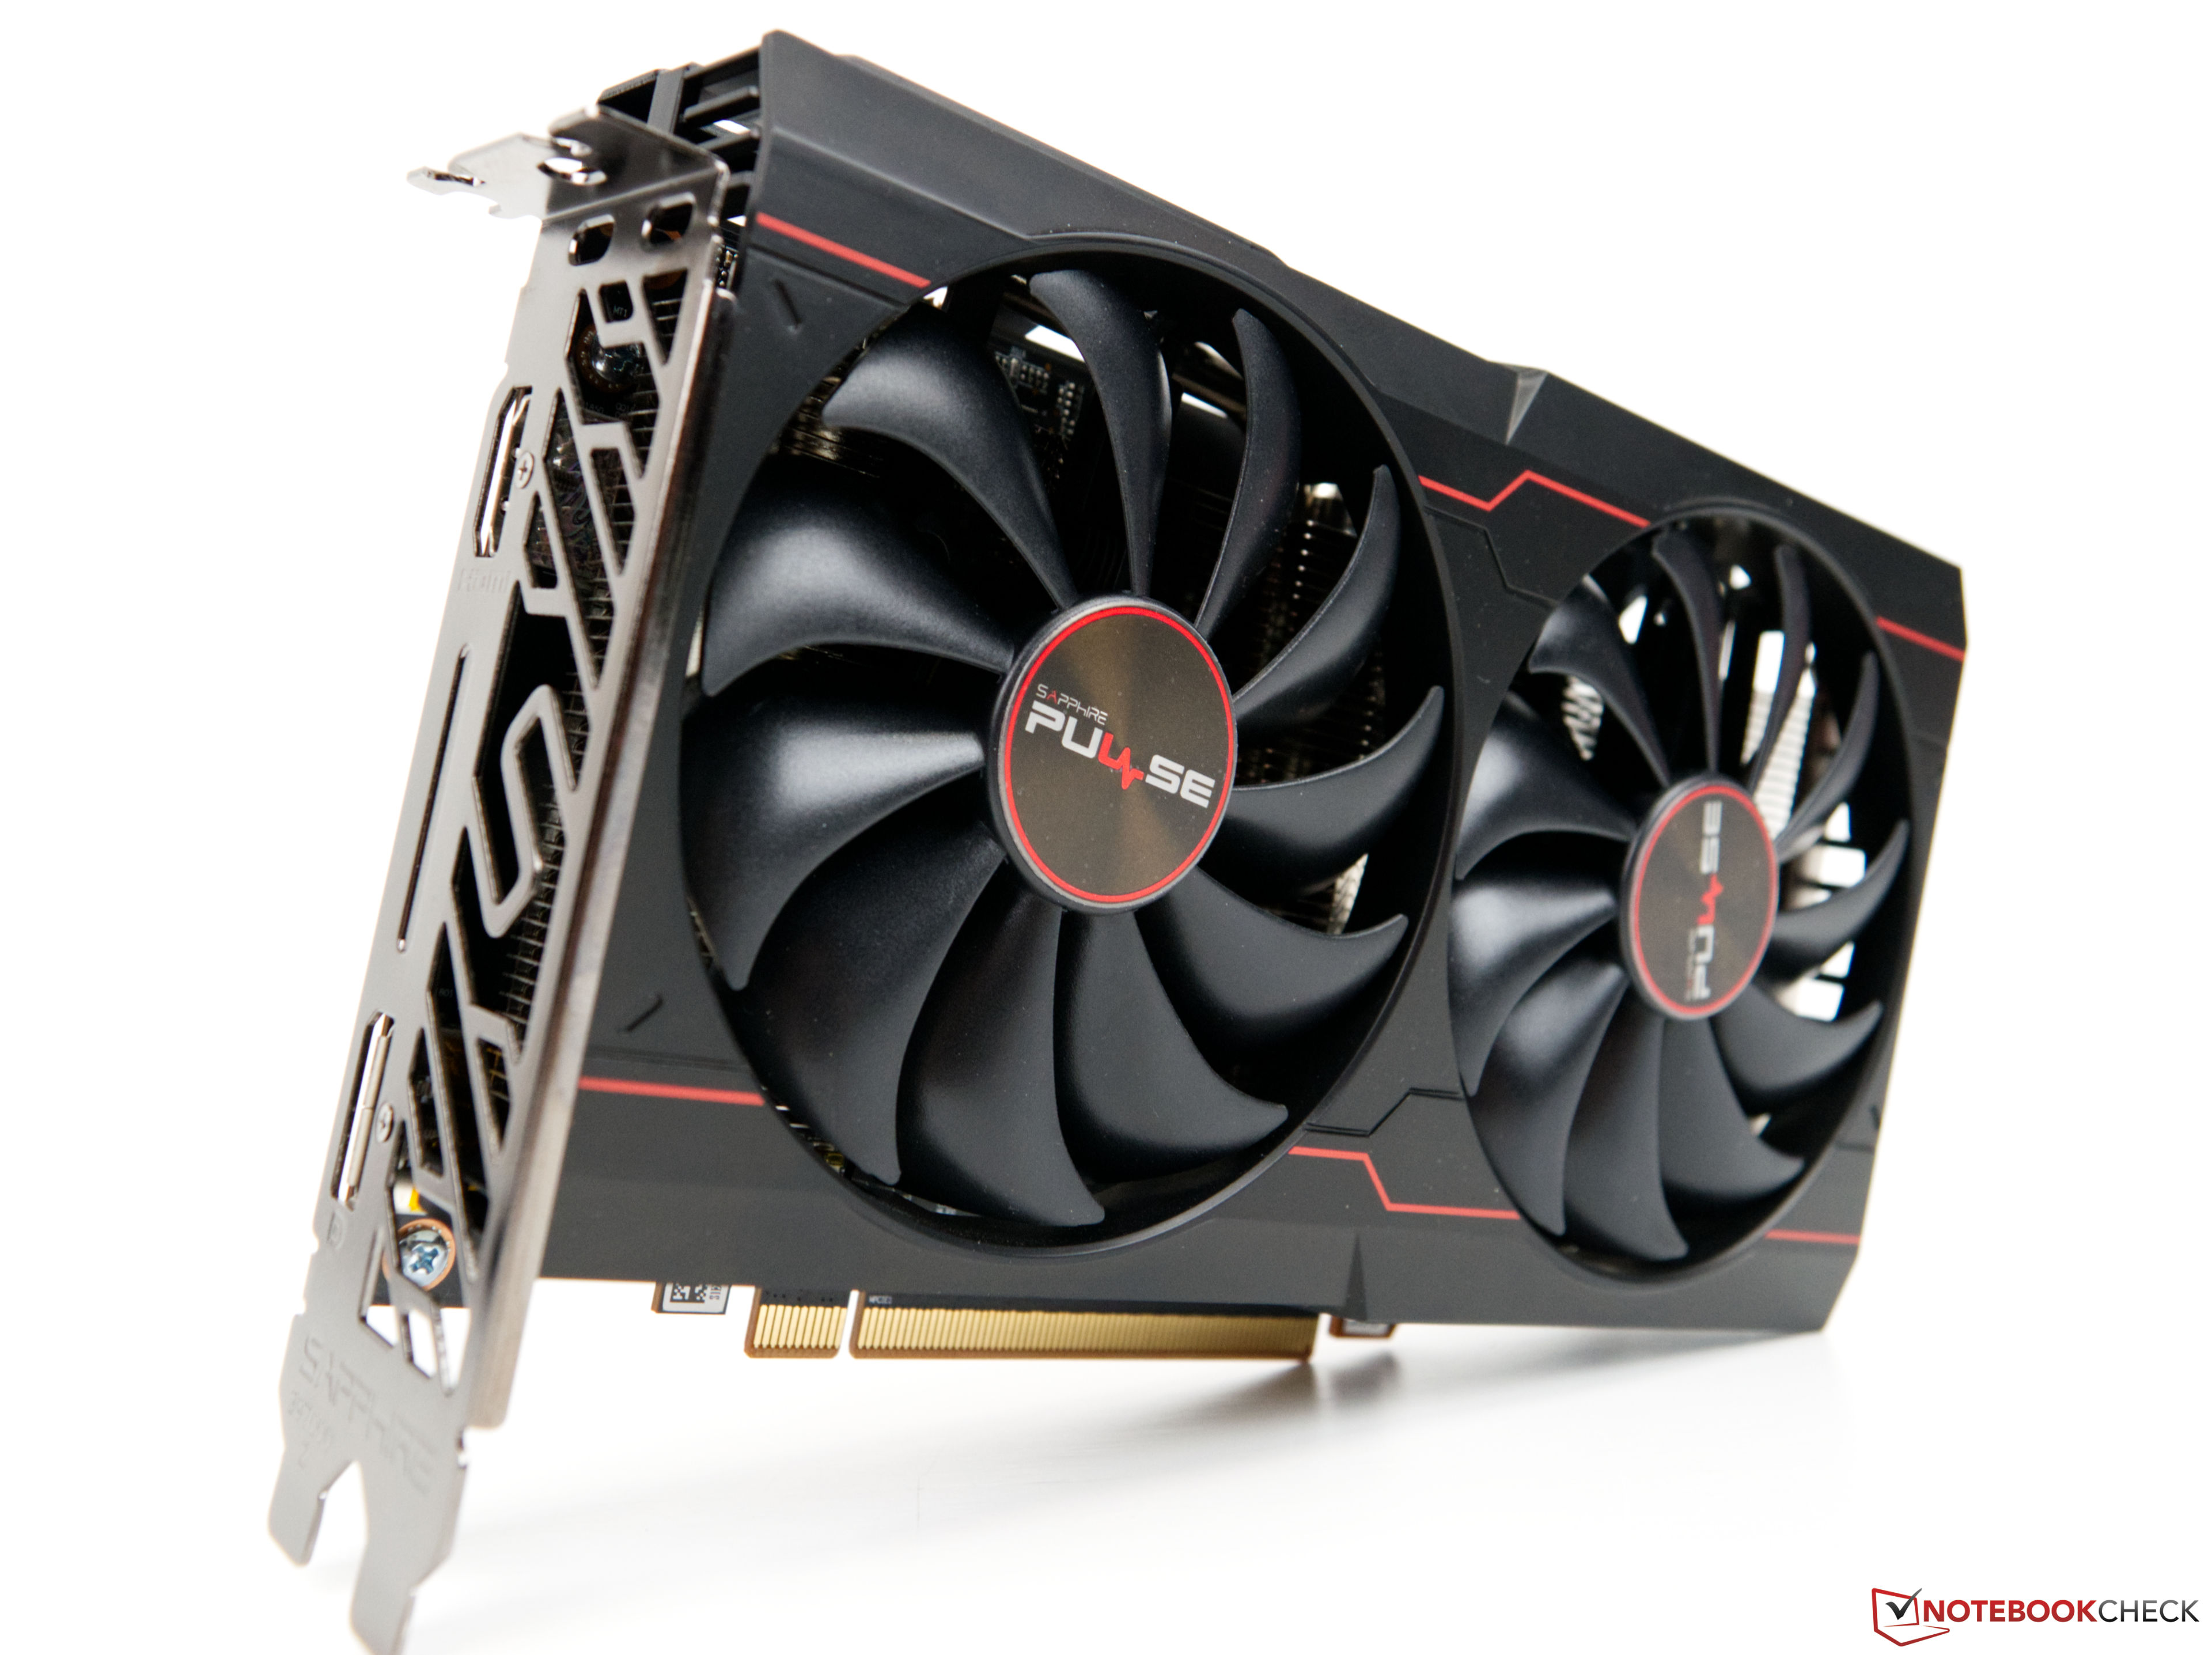
Nach und nach erweitert AMD sein Navi-Line-up und bedient auch die Kunden mit dem kleineren Geldbeutel, wenn es um aktuelle RDNA2-Grafikkarten geht. Mit der AMD Radeon RX 6500 XT gibt es eine sparsame 1080p-Gaming-Grafikkarte. Mit deutlichen Einschränkungen bei den technischen Daten hat AMD aber den Rotstift deutlich angesetzt. Wir schauen uns genauer an, was dennoch an Leistung erwartet werden kann.
AMD Ryzen 9 5900X, Radeon RX 6500 XT, 32"