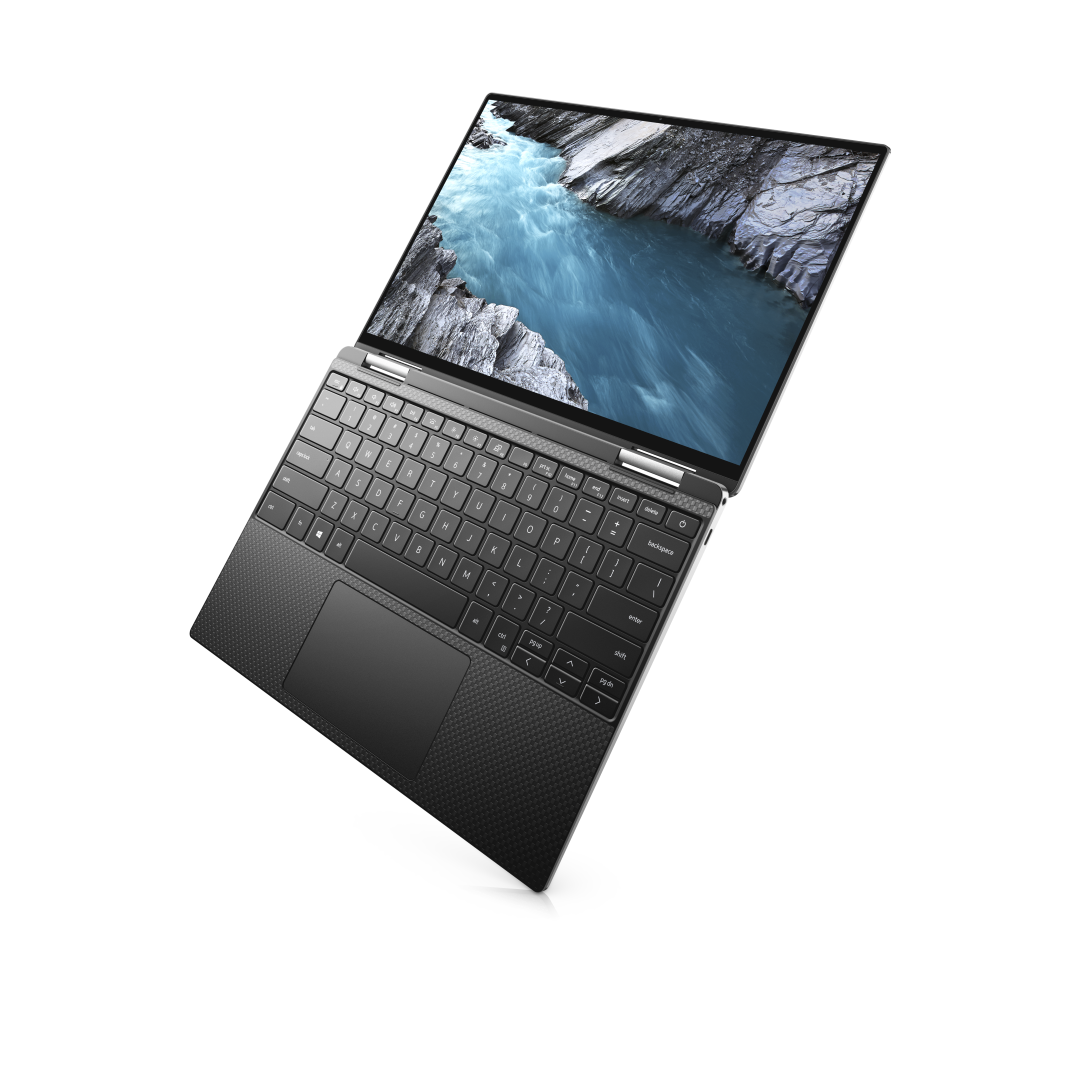
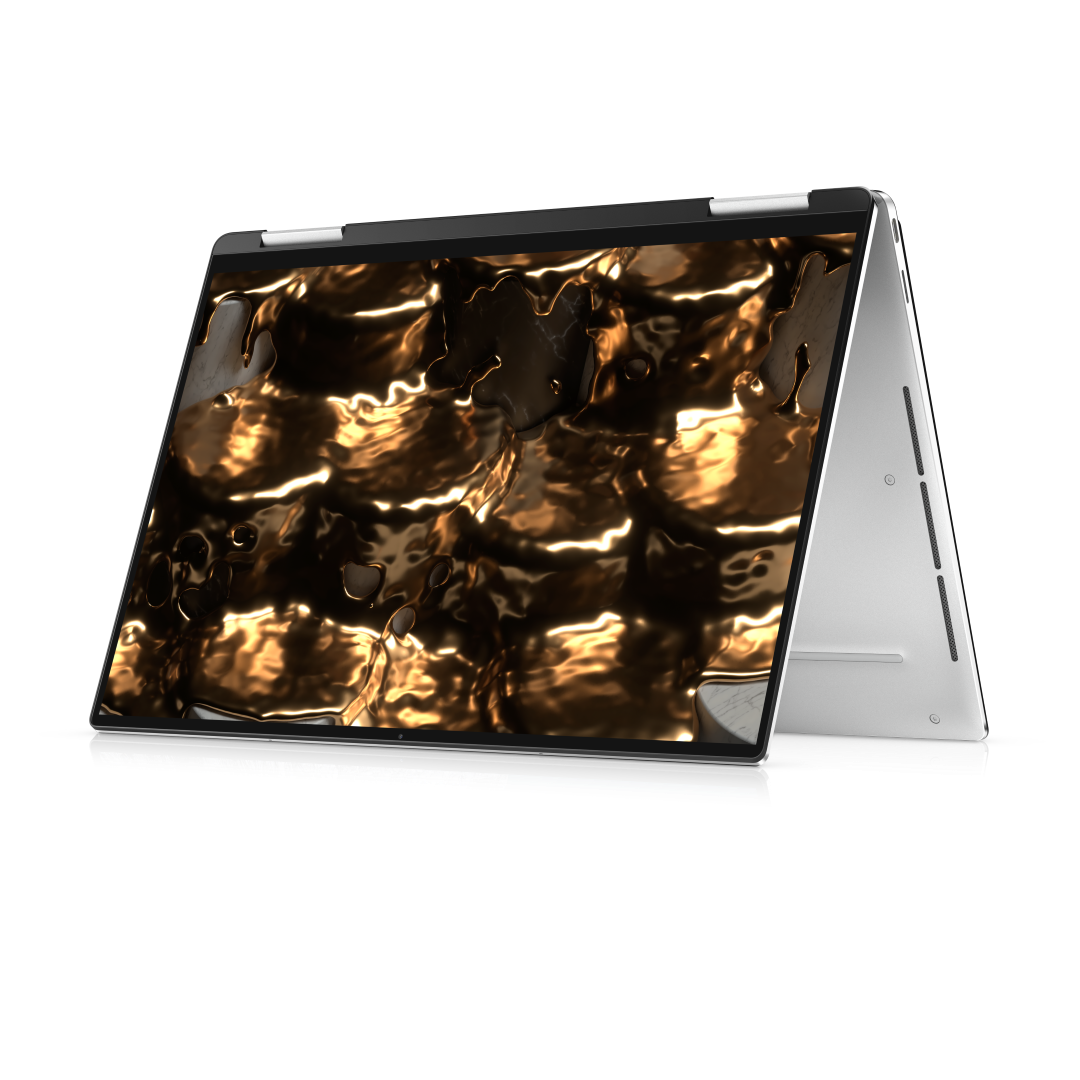
Dell XPS 13 9310 2-in-1 im Test: Ein entscheidender Unterschied zum XPS 13 7390 2-in-1
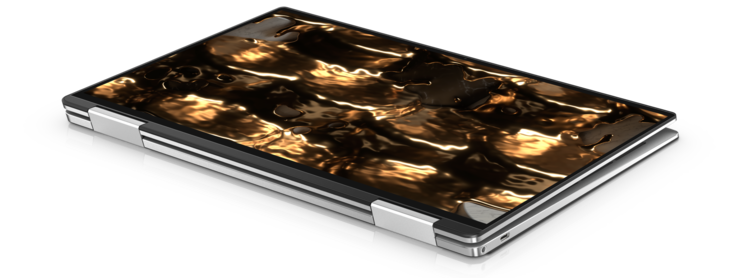
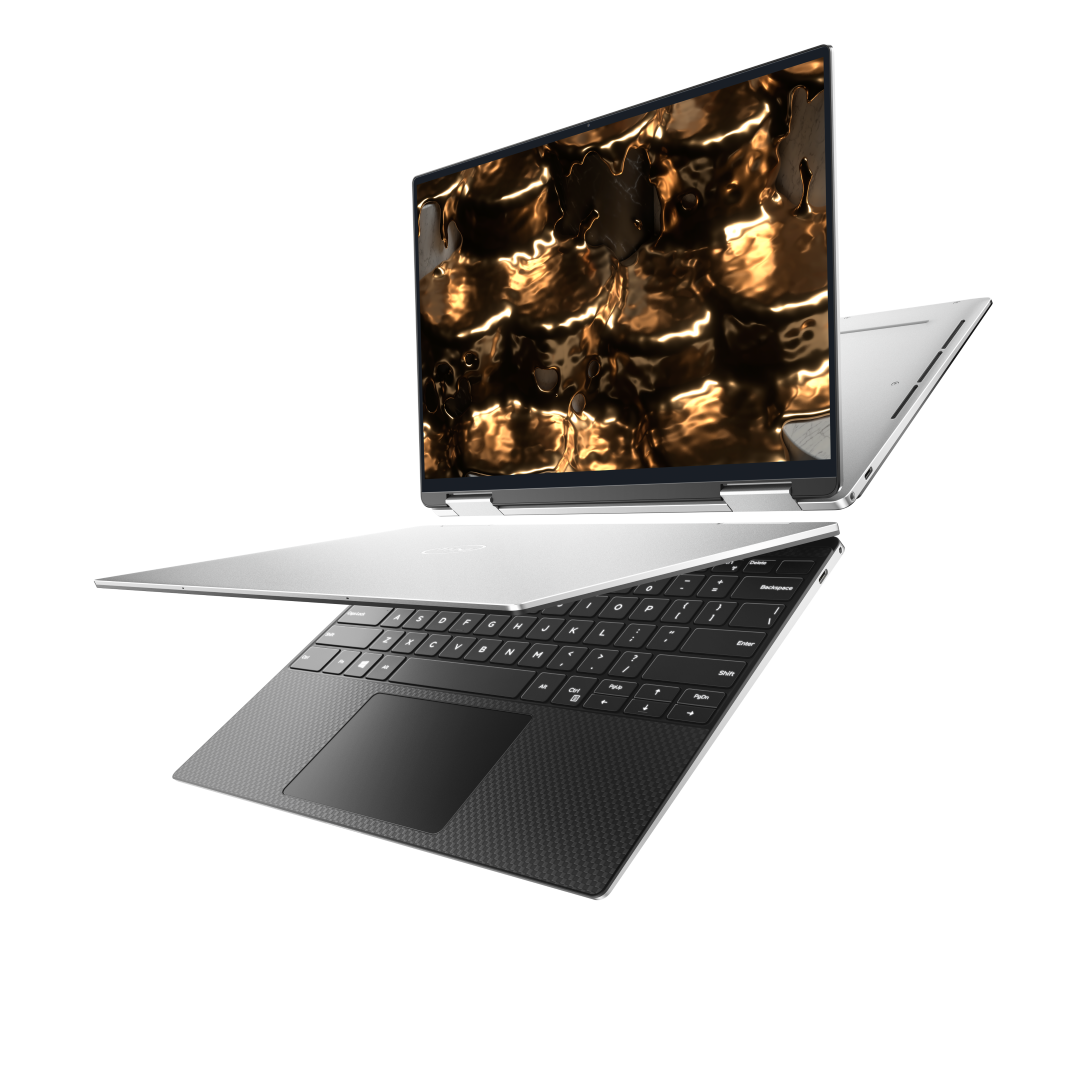
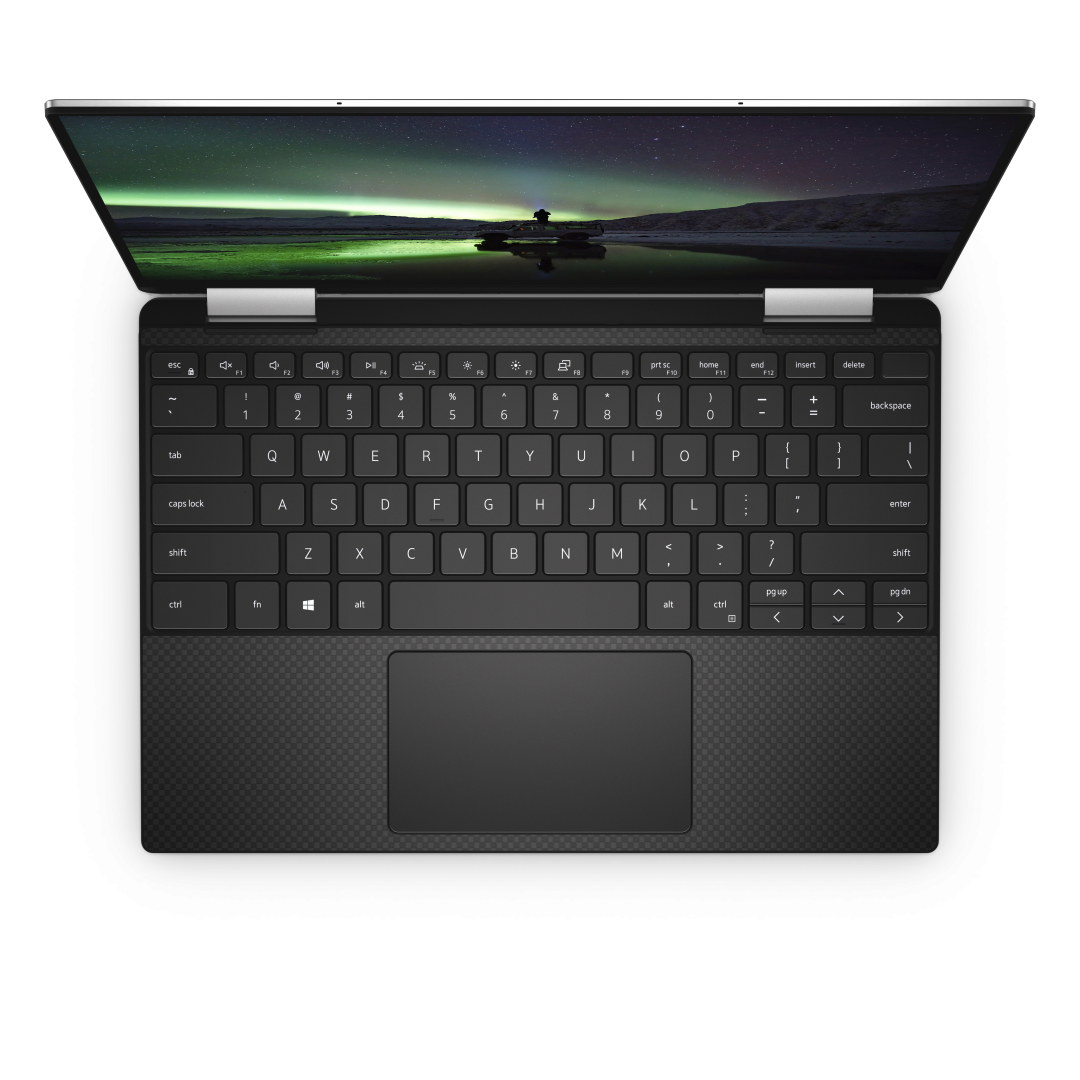
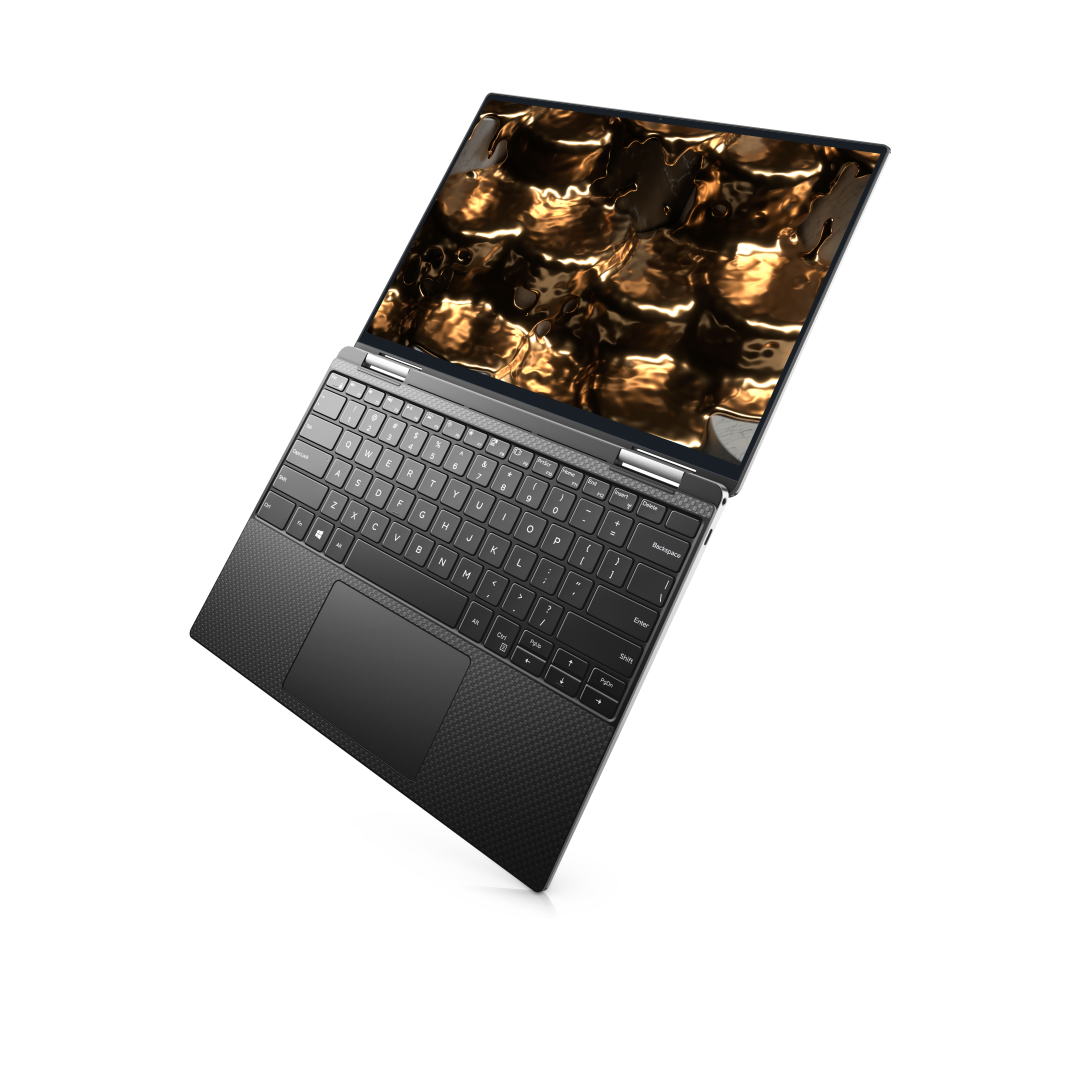
Das Dell XPS 13 9310 2-in-1 hat das gleiche Gehäuse wie das XPS 13 7390 2-in-1 aus 2019, ist im Inneren aber mit der neueren Tiger-Lake-U-CPU der 11. Intel-Generation ausgestattet, der die älteren Ice-Lake-Optionen der 10. Generation ersetzt. Die wichtigsten Features des 7290 2-in-1 finden sich im 9310 2-in-1 daher wieder. Dazu gehört die MagLev-Tastatur, das Vapor-Chamber-Kühlsystem, der 16:10 13,4-Zoll-Touchscreen und die gut positionierte Webcam.
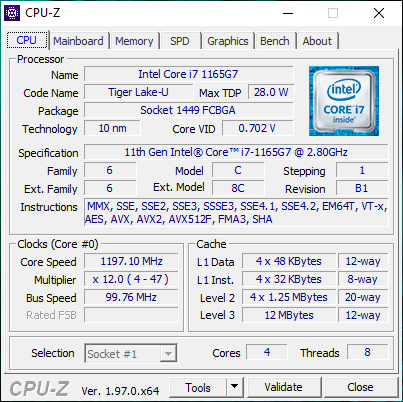
Die Konfiguration unseres Testgeräts ist mit dem Core i7-1165G7, einem 16 GB LPDDR4x-4267-MHz-RAM-Modul und einem 1.920x1.200-Touchscreen ausgestattet und für rund 1.800 EUR erhältlich. Alternativ gäbe es eine Konfiguration mit i5-1135G7-CPU mit einer halb so großen RAM oder einem höherauflösenden Display (3.840 x 2.400). Im Gegensatz zur Clamshell-Version des XPS 14 9310 gibt es keine OLED-Option.
Wir empfehlen Ihnen, einen Blick auf unseren Testbericht des XPS 13 7390 2-in-1 zu werfen, um mehr über die physischen Aspekte des unveränderten Gehäuses zu erfahren. In diesem Testbericht werden wir uns hauptsächlich mit der Leistung des XPS 13 9310 2-in-1 sowie den Vorteilen gegenüber der Vorgängerversion beschäftigen.
Zu den Mitstreitern gehören unter anderem weitere 13-Zoll-Subnotebook-Convertibles wie das Lenovo Yoga 6 13, das Asus ZenBook Flip 13, das Samsung Galaxy Book Pro 360 13 oder das MSI Summit E13 Flip. Das XPS 13 9310 2-in-1 ist auch als Clamshell-Version (XPS 13 9310) erhältlich.
Weitere Dell-Testberichte:
Potenzielle Mitstreiter im Vergleich
Bew. | Datum | Modell | Gewicht | Dicke | Größe | Auflösung | Preis ab |
|---|---|---|---|---|---|---|---|
| 86.7 % v7 (old) | 10 / 2021 | Dell XPS 13 9310 2-in-1 i7-1165G7, Iris Xe G7 96EUs | 1.3 kg | 14.35 mm | 13.40" | 1920x1200 | |
| 88.1 % v7 (old) | 10 / 2020 | Dell XPS 13 9310 Core i7 FHD i7-1165G7, Iris Xe G7 96EUs | 1.3 kg | 14.8 mm | 13.40" | 1920x1200 | |
| 86.3 % v7 (old) | 10 / 2019 | Dell XPS 13 7390 2-in-1 Core i7 i7-1065G7, Iris Plus Graphics G7 (Ice Lake 64 EU) | 1.3 kg | 13 mm | 13.40" | 1920x1200 | |
| 84.7 % v7 (old) | 07 / 2021 | Lenovo Yoga 6 13 82ND0009US R5 5500U, Vega 7 | 1.3 kg | 18.2 mm | 13.30" | 1920x1080 | |
| 86.3 % v7 (old) | 07 / 2021 | Asus ZenBook Flip 13 UX363EA-HP069T i7-1165G7, Iris Xe G7 96EUs | 1.2 kg | 13 mm | 13.30" | 1920x1080 | |
| 85.4 % v7 (old) | 06 / 2021 | Samsung Galaxy Book Pro 360 13 i5-1135G7, Iris Xe G7 80EUs | 1.1 kg | 13 mm | 13.20" | 1920x1080 |
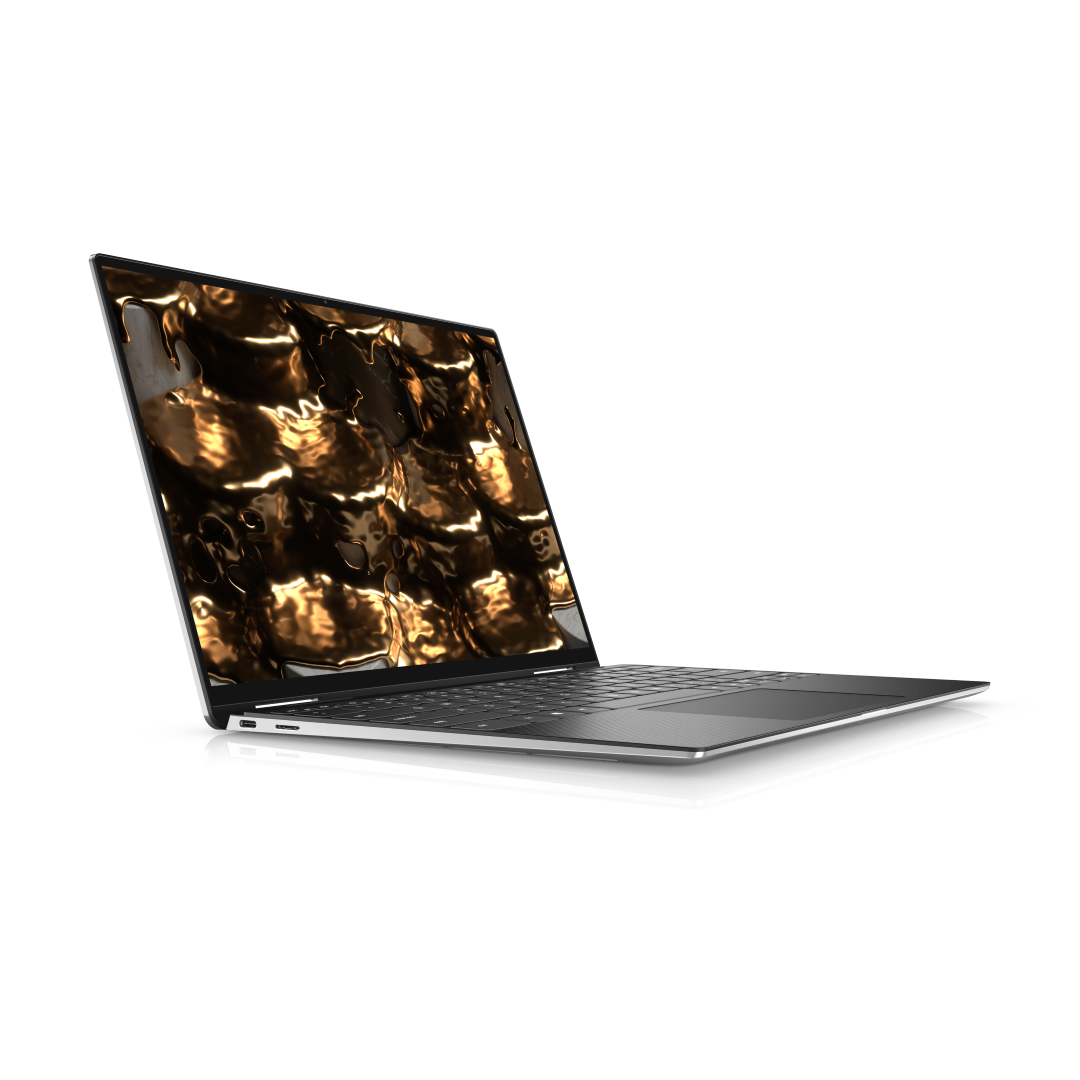
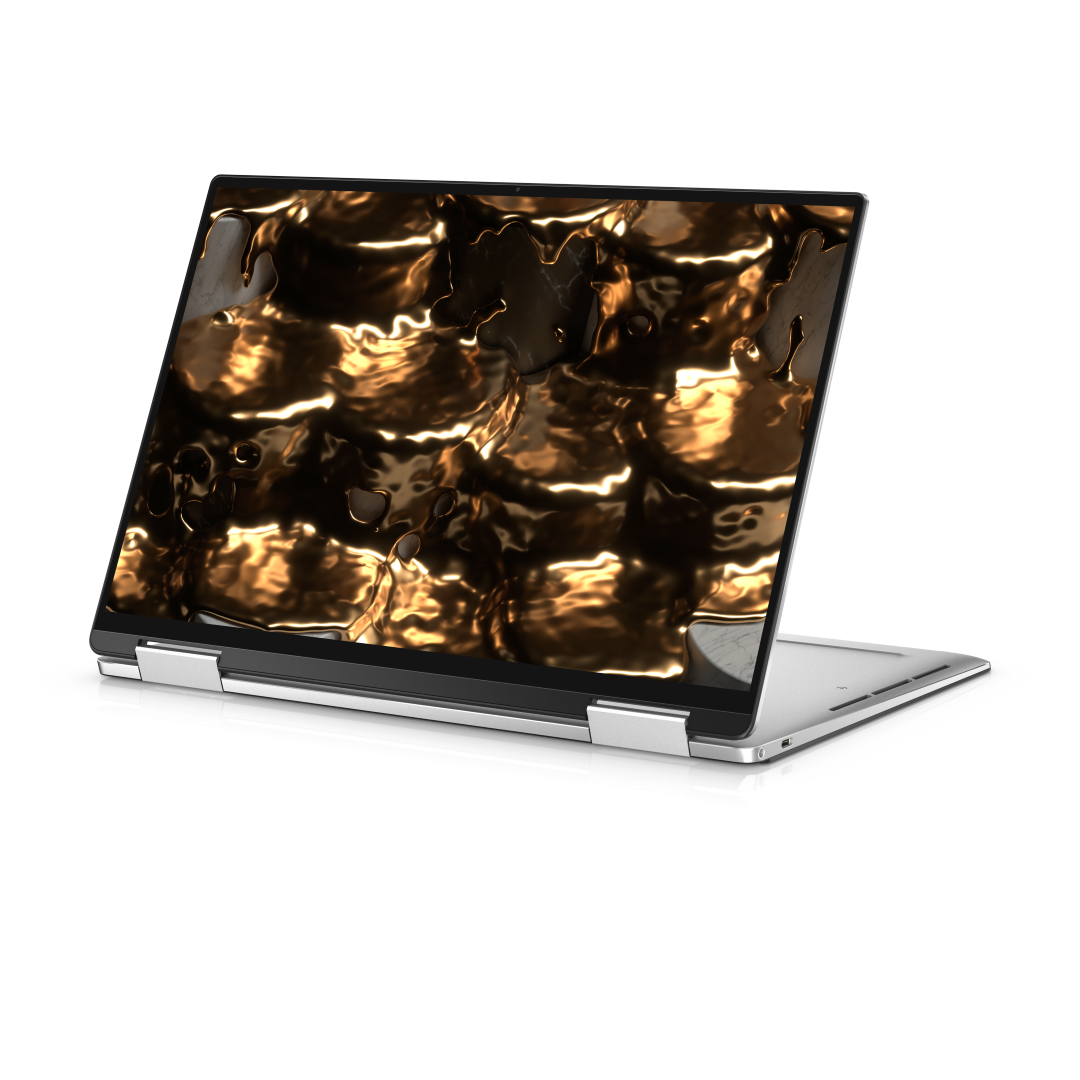
Gehäuse — Immer noch das eleganteste Convertible am Markt
Das Gehäuse hat sich im Vergleich zur Vorgängerversion XPS 13 7310 2-in-1 nicht verändert. Allerdings scheint Dell Größen nun anders zu messen, weshalb unser Testgerät jetzt offiziell 14,35 x 297 x 207 mm groß ist, während das ältere 7390 2-in-1 die Maßangaben 13 x 296 x 207 mm hatte.

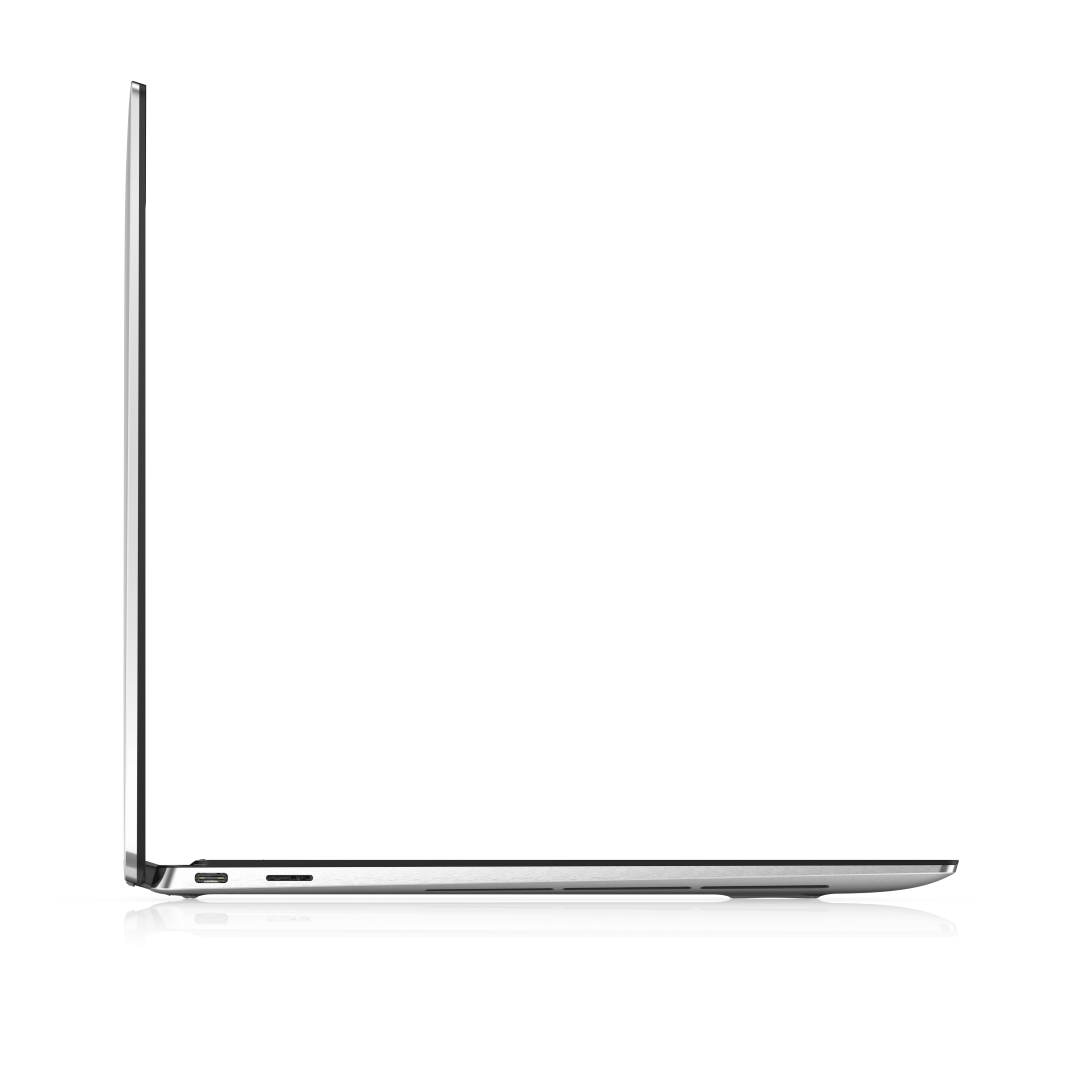
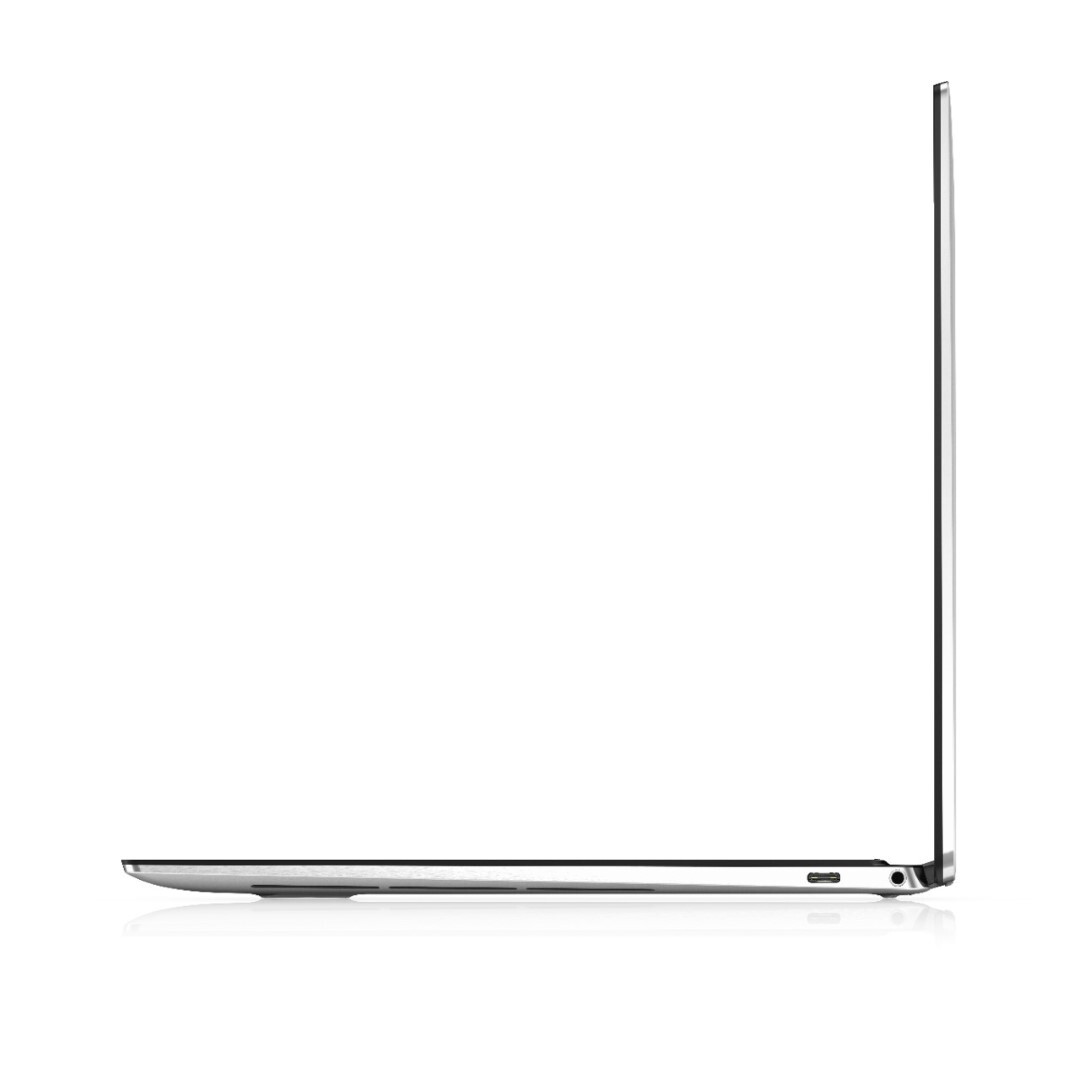
Ausstattung — Jetzt mit Thunderbolt 4
Die beiden Thunderbolt-3-Ports aus dem Vorgängermodell wurden auf Thunderbolt 4 modernisiert. Die meisten Nutzer werden hier keinen Unterschied feststellen – nur wer sich mit einer externen GPU verbinden möchte, hat nun einen Vorteil.
SDCardreader
| SD Card Reader | |
| average JPG Copy Test (av. of 3 runs) | |
| Dell XPS 13 9310 Core i7 FHD (Toshiba Exceria Pro M501 64 GB UHS-II) | |
| Dell XPS 13 9310 2-in-1 (AV Pro V60) | |
| Dell XPS 13 7390 2-in-1 Core i7 (Toshiba Exceria Pro M501 64 GB UHS-II) | |
| Samsung Galaxy Book Pro 360 13 | |
| maximum AS SSD Seq Read Test (1GB) | |
| Dell XPS 13 9310 Core i7 FHD (Toshiba Exceria Pro M501 64 GB UHS-II) | |
| Dell XPS 13 9310 2-in-1 (AV Pro V60) | |
| Dell XPS 13 7390 2-in-1 Core i7 (Toshiba Exceria Pro M501 64 GB UHS-II) | |
| Samsung Galaxy Book Pro 360 13 | |
Kommunikation
Webcam
Die Webcam mit der geringen Auflösung von 720p hat sich nicht verändert, was sehr schade ist. Die Webcam im neuesten Razer-Blade-Laptop hat hingegen ein Update von 720p auf 1.080p erhalten, obwohl sich auch hier nichts am Gehäuse getan hat. Es hätte uns gefreut, etwas ähnliches auch beim XPS 13 zu sehen.


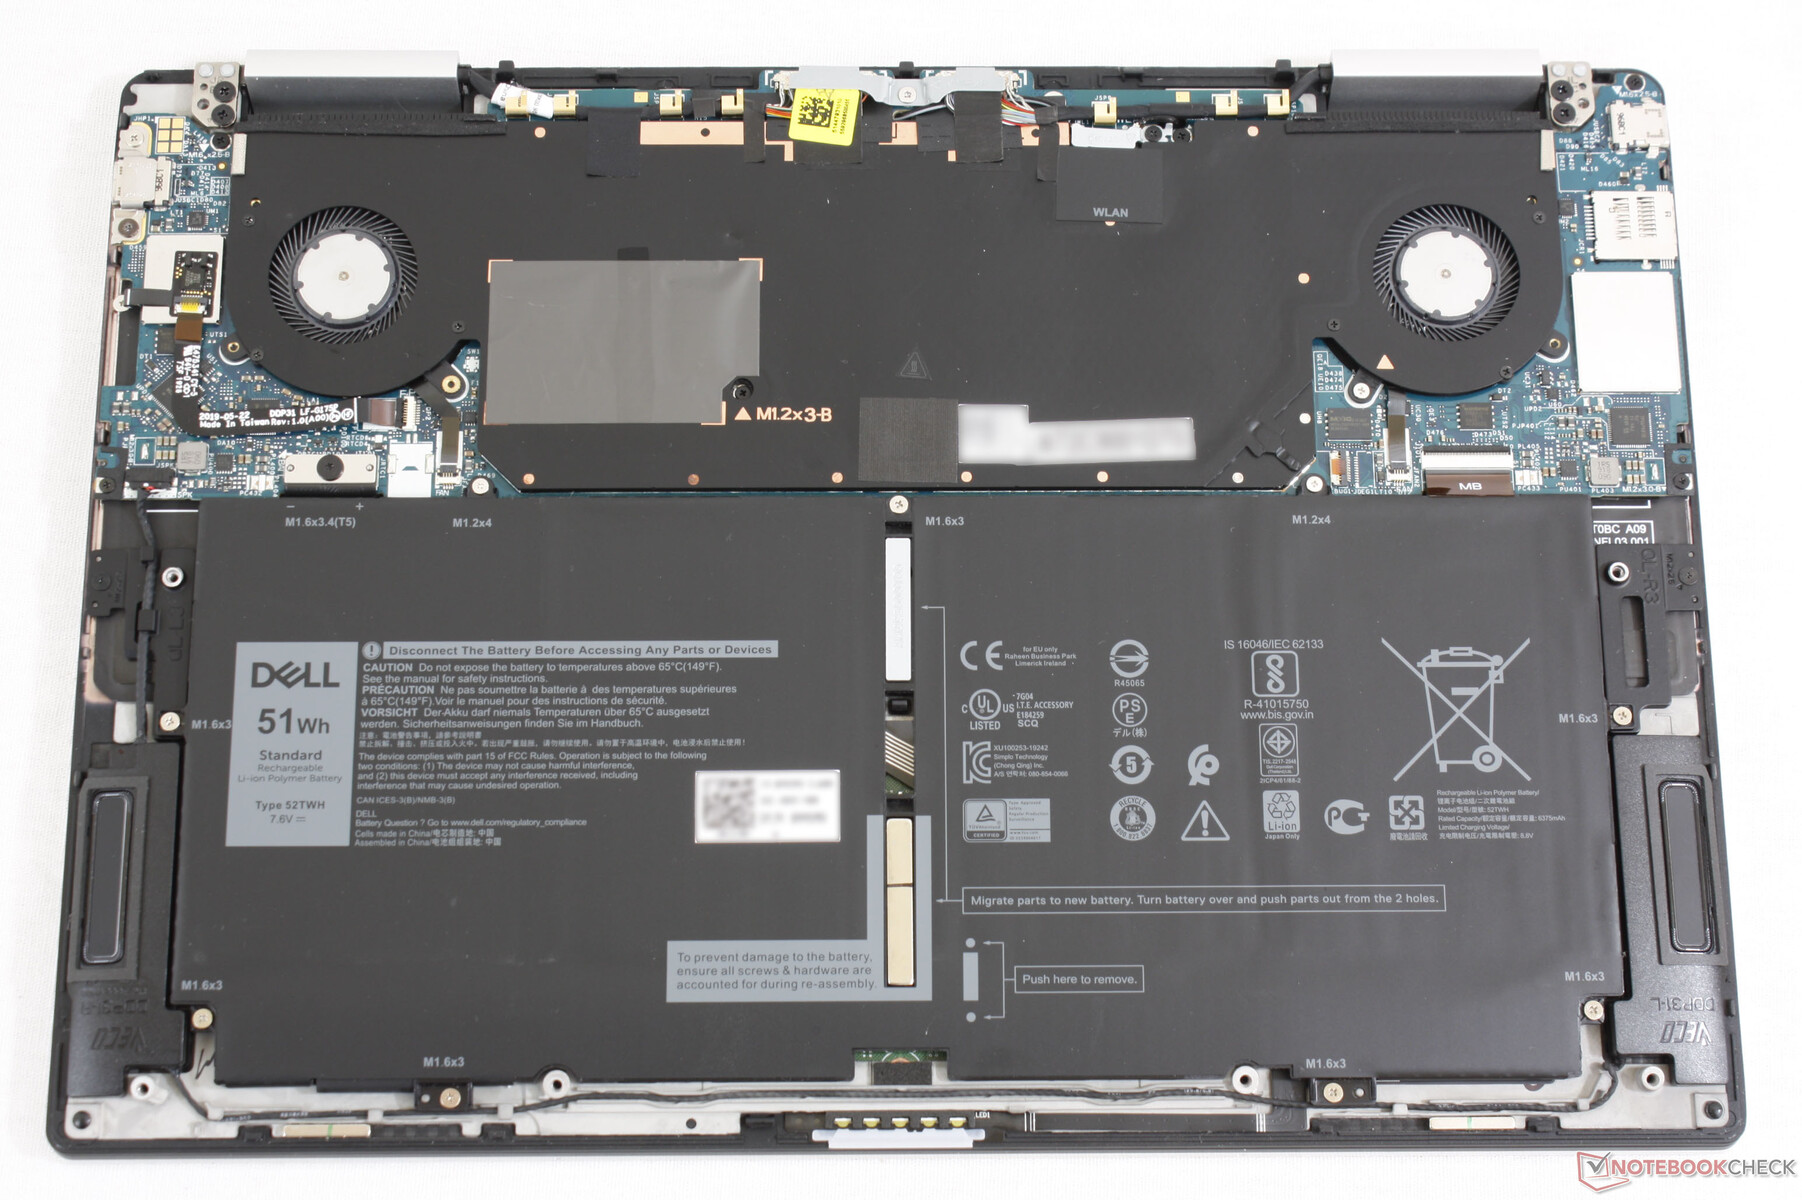
Wartung

Zubehör und Garantie
Zu den Extras gehören ein Adapter für USB-C auf USB-A, da das Gerät keinen USB-A-Anschluss in voller Größe besitzt. Auch an die Umwelt wurde gedacht: Die Verpackung besteht vollständig aus recycelten Materialien und zu 25 % aus aus dem Ozean gesammeltem Kunststoff.
Es gilt die standardmäßige einjährige Garantie, die beim Kauf direkt beim Hersteller gegen einen Aufpreis erweitert werden kann.
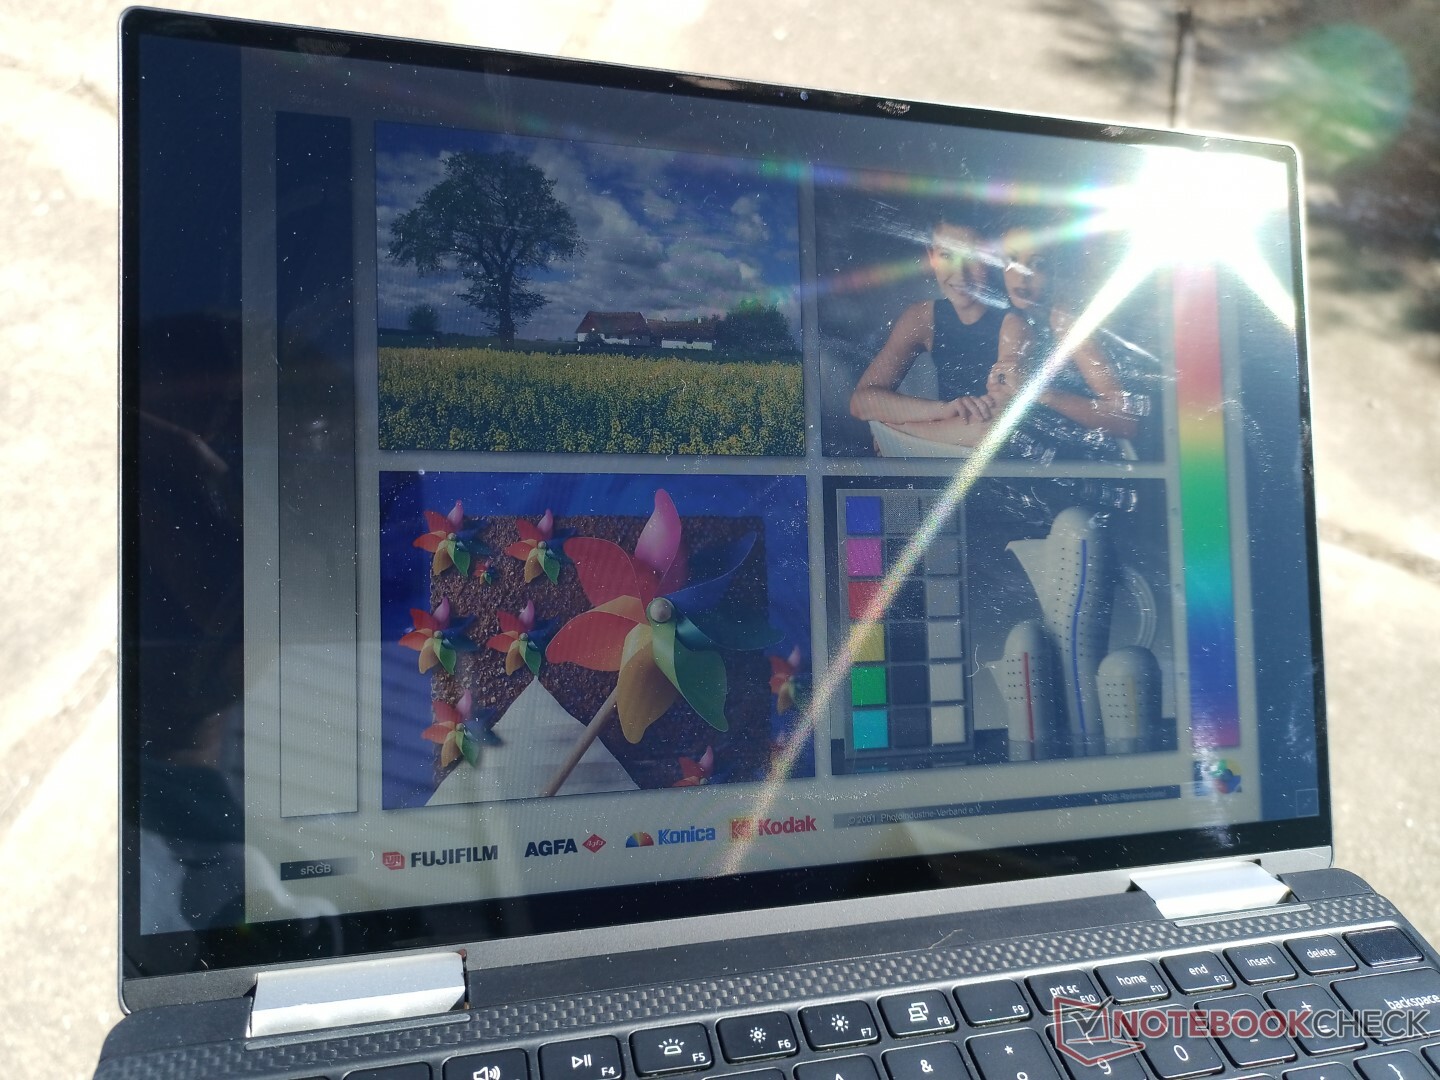
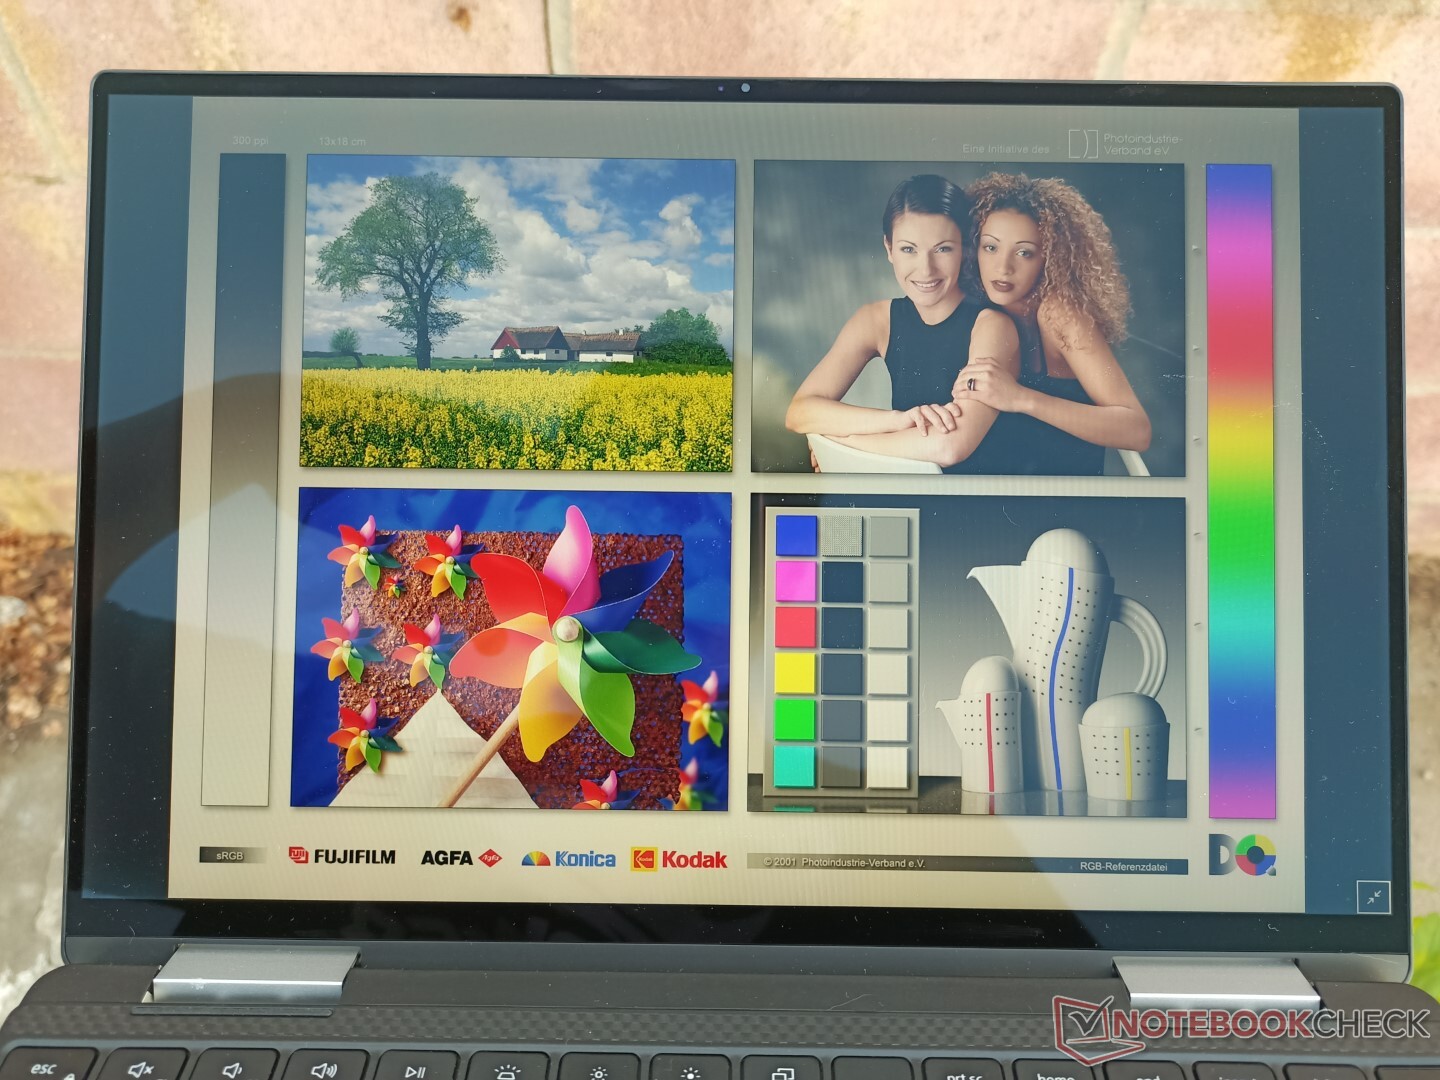
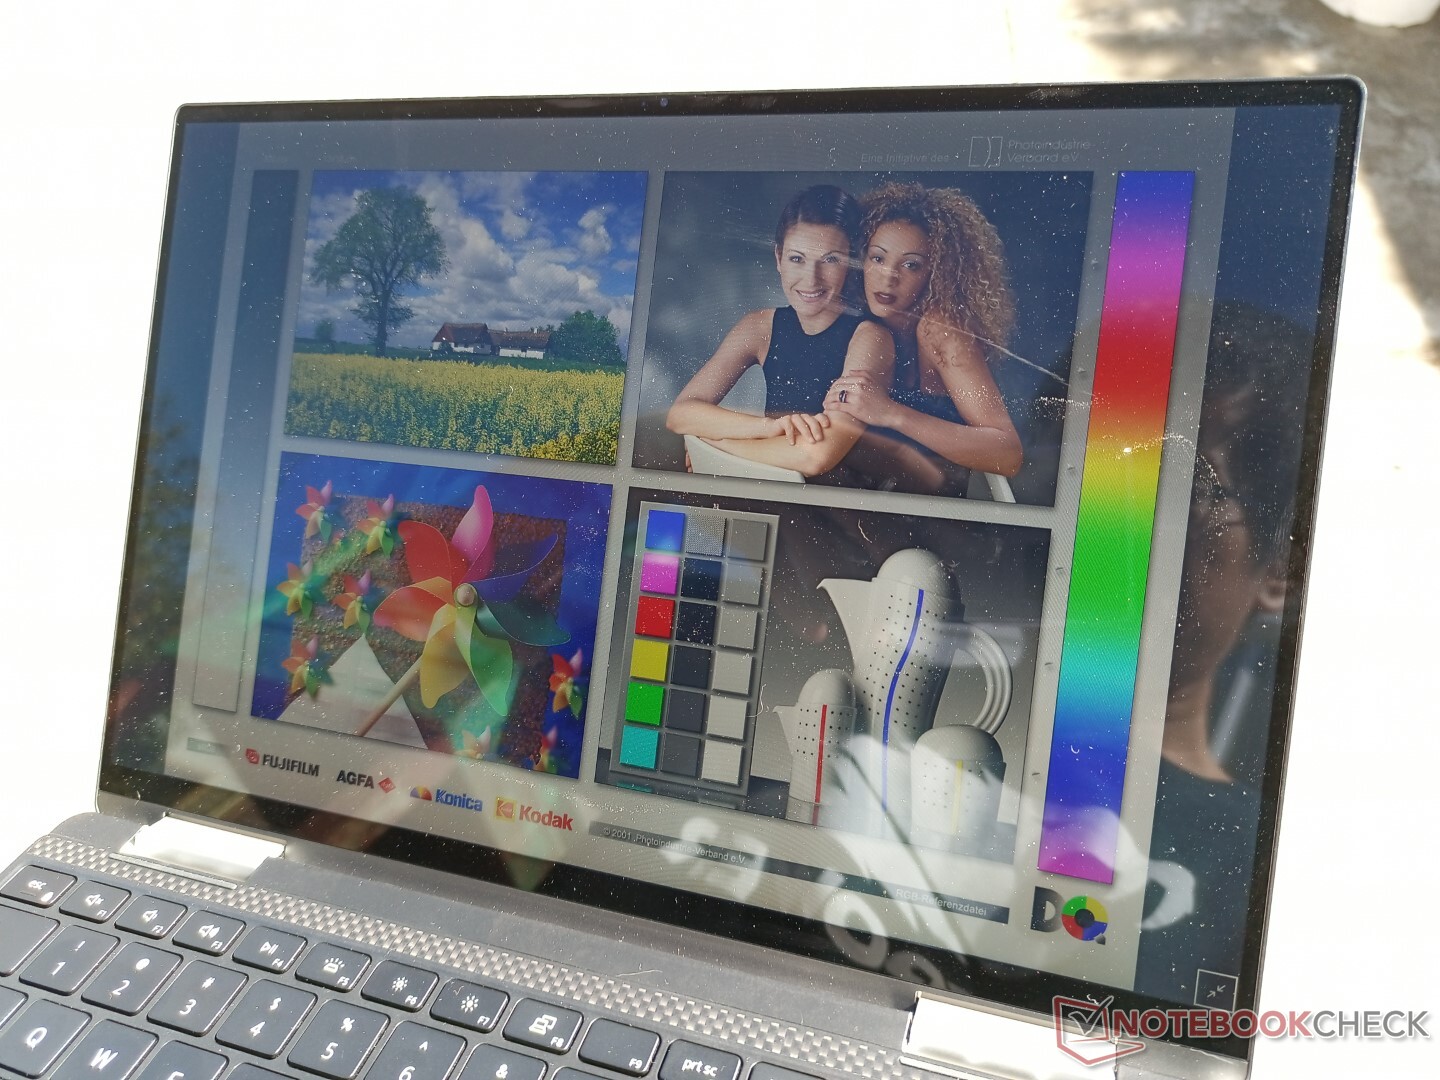
Display — Kennen wir schon
Dell setzt für all seine 16:10-XPS-13-Laptops (XPS 13 7390 2-in-1, XPS 13 9300 Clamshell, XPS 13 9310 Clamshell und unser XPS 13 9310 2-in-1) das gleiche 1.200p-Sharp-LQ134N1-IPS-Panel ein. Das ist grundsätzlich nicht schlecht, da dieses 13,4-Zoll-Panel sehr hell und qualitativ hochwertig ist und eine gute Farbraumabdeckung bietet (>99 Prozent sRGB) und ein hohes Kontrastverhältnis und scharfe Pixel ohne Bildkörnung hat. Die langsame Schwarz-Weiß-Reaktionszeit ist weiterhin ein Schwachpunkt, was, vor allem beim Gamen, zu deutlichem Ghosting führt.
Unser Testmodell ist auch mit einem höher auflösenden UHD+-Panel (3.840 x 2.400p) erhältlich. Es handelt sich dabei vermutlich um das gleiche Sharp-LQ134R1-IPS-Panel wie im XPS 13 9300.


| |||||||||||||||||||||||||
Ausleuchtung: 90 %
Helligkeit Akku: 555.7 cd/m²
Kontrast: 1588:1 (Schwarzwert: 0.35 cd/m²)
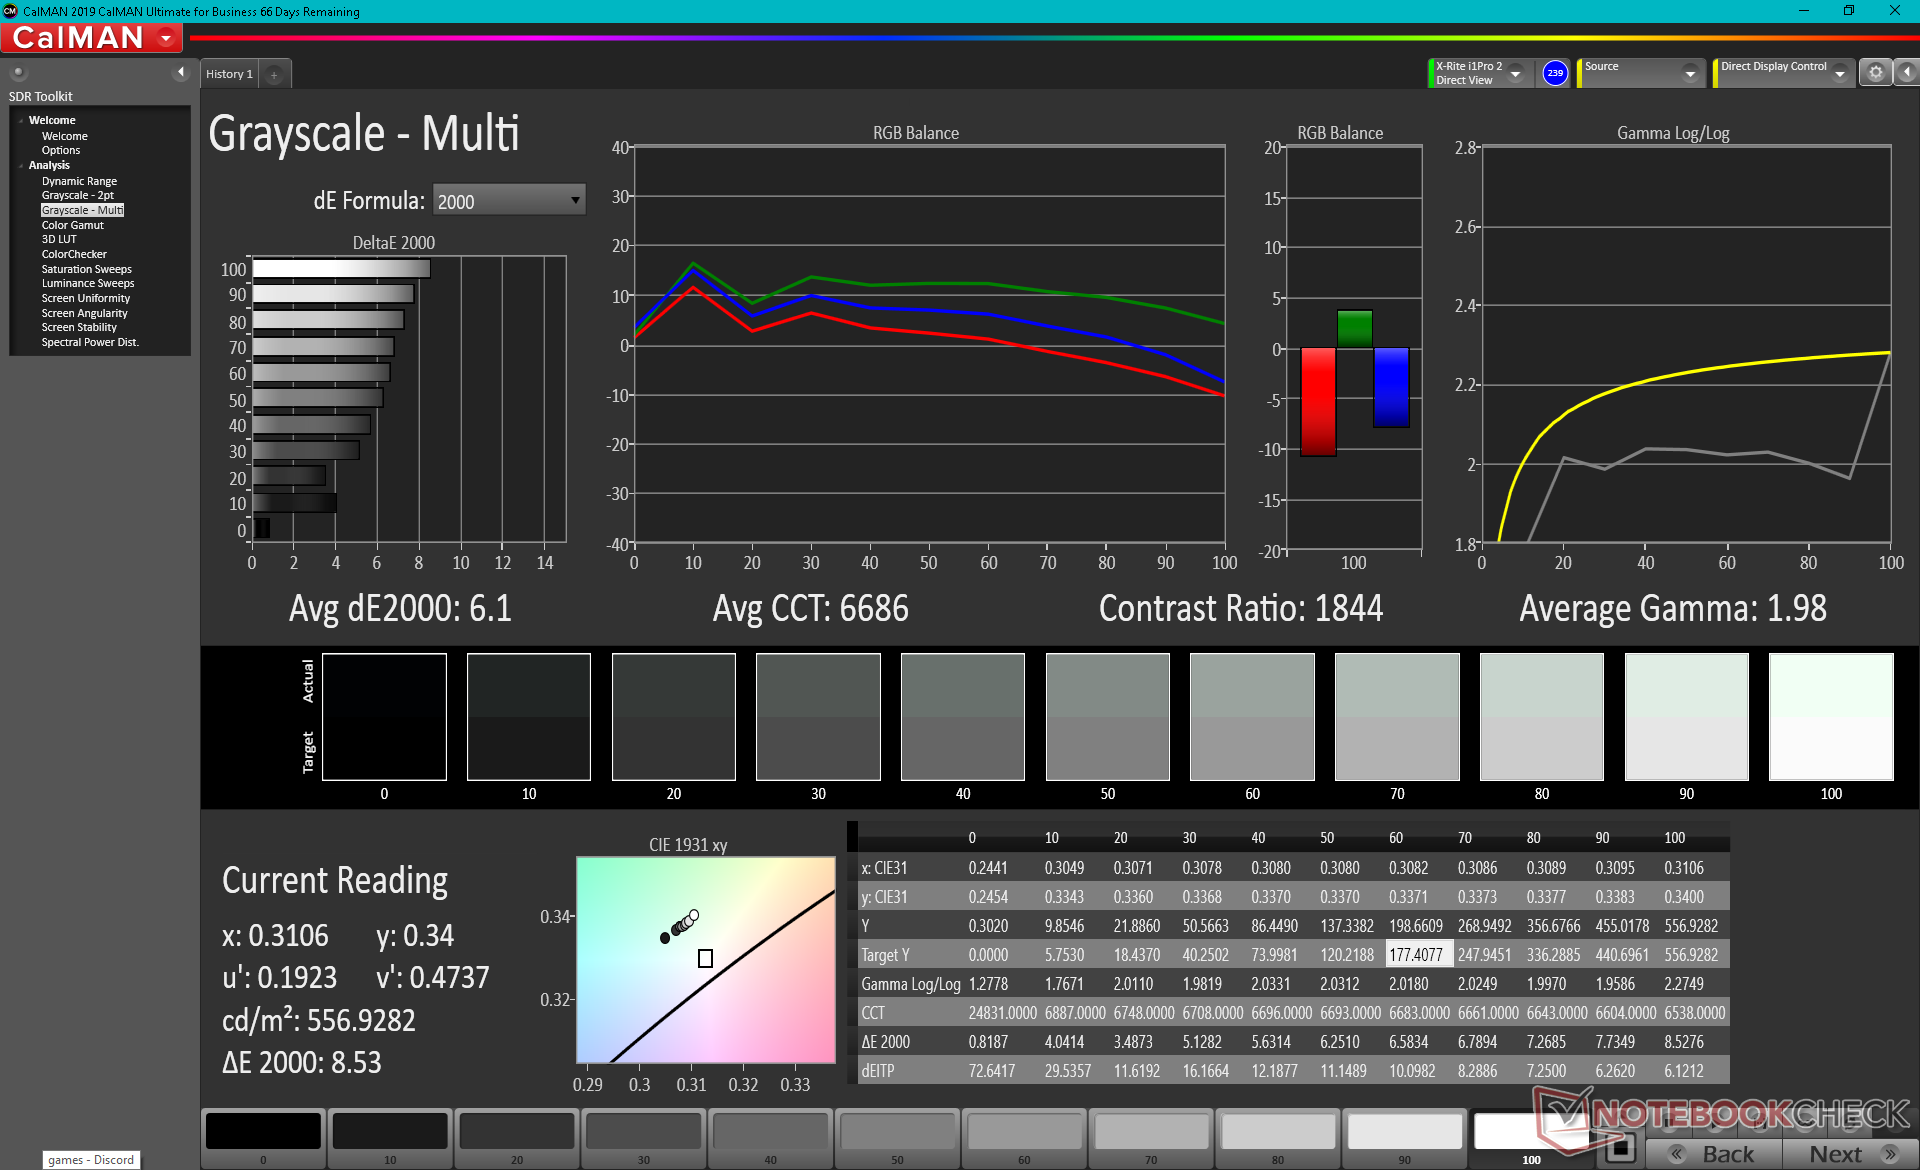
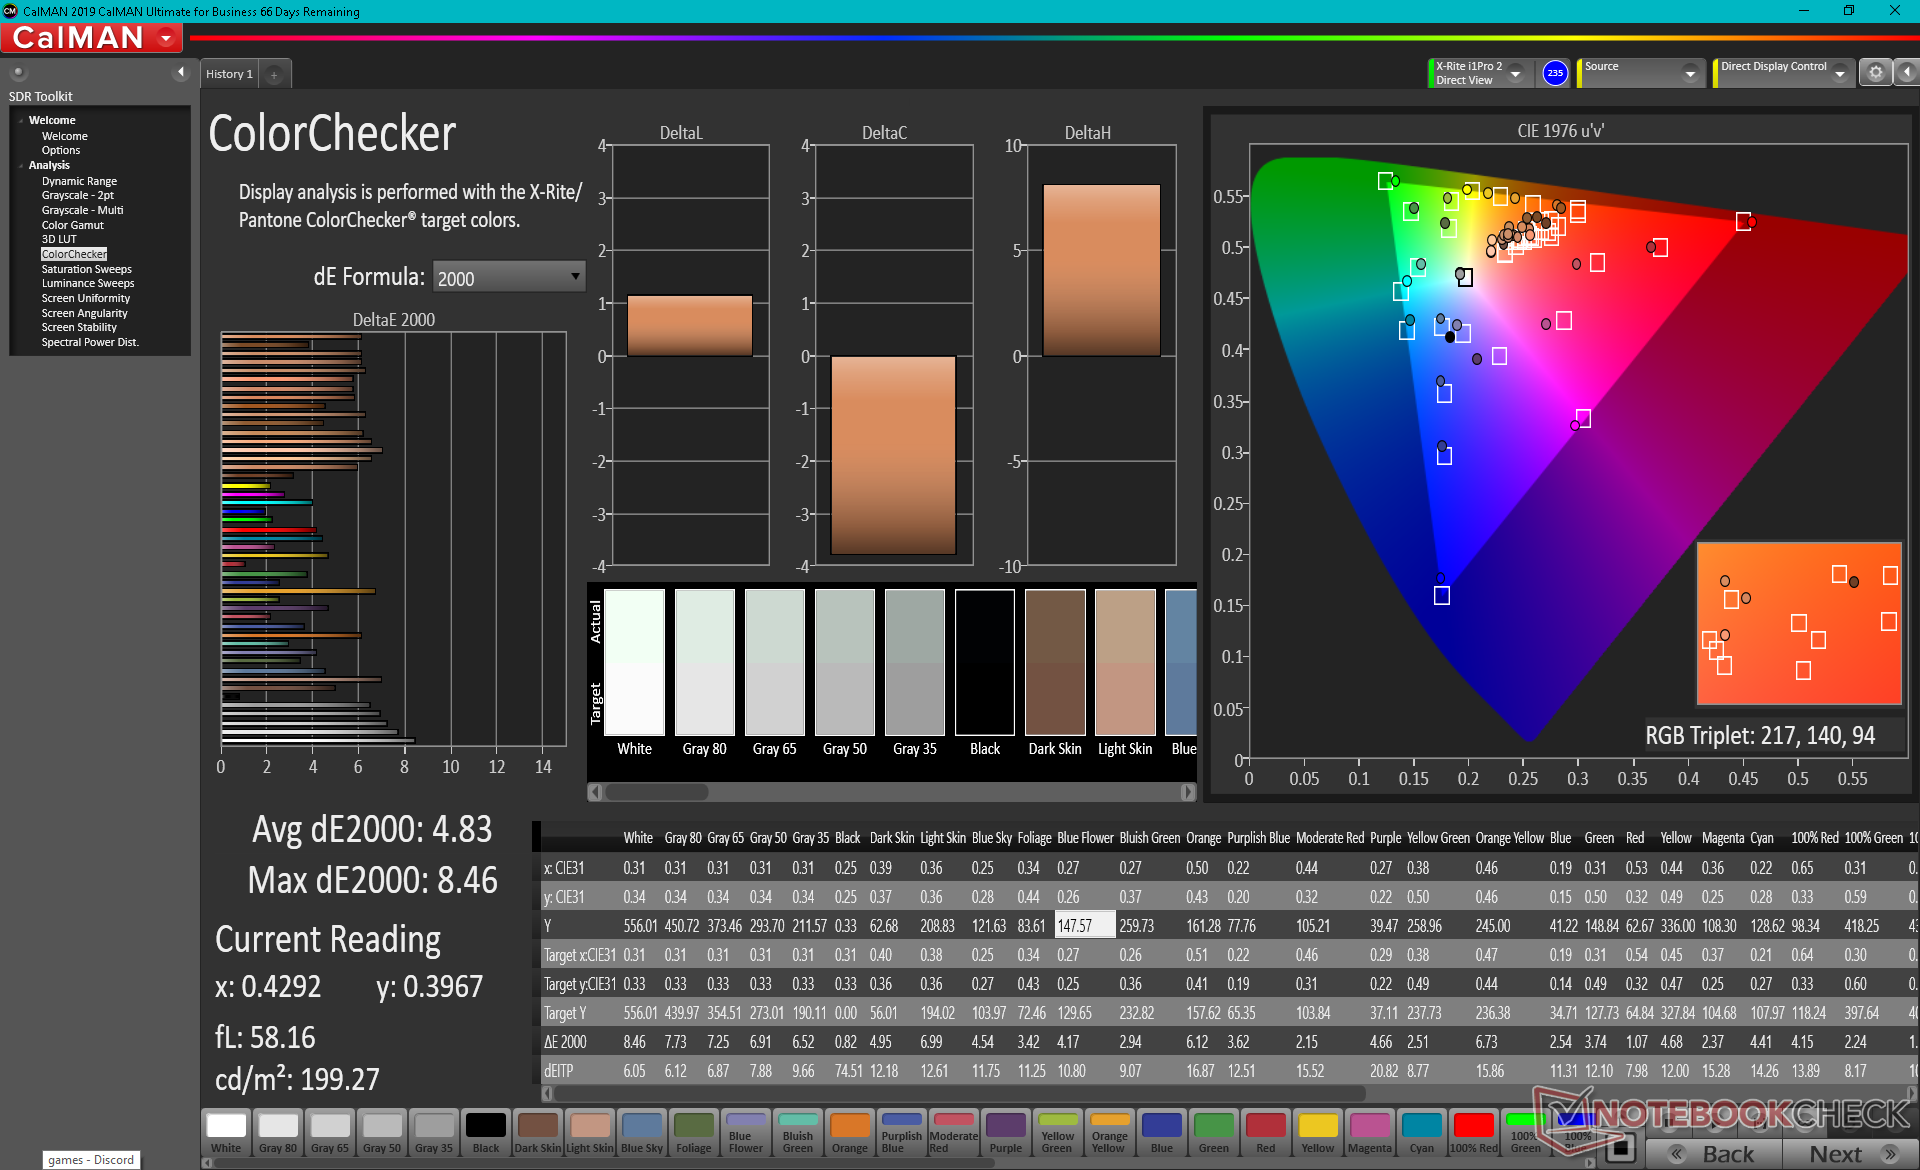
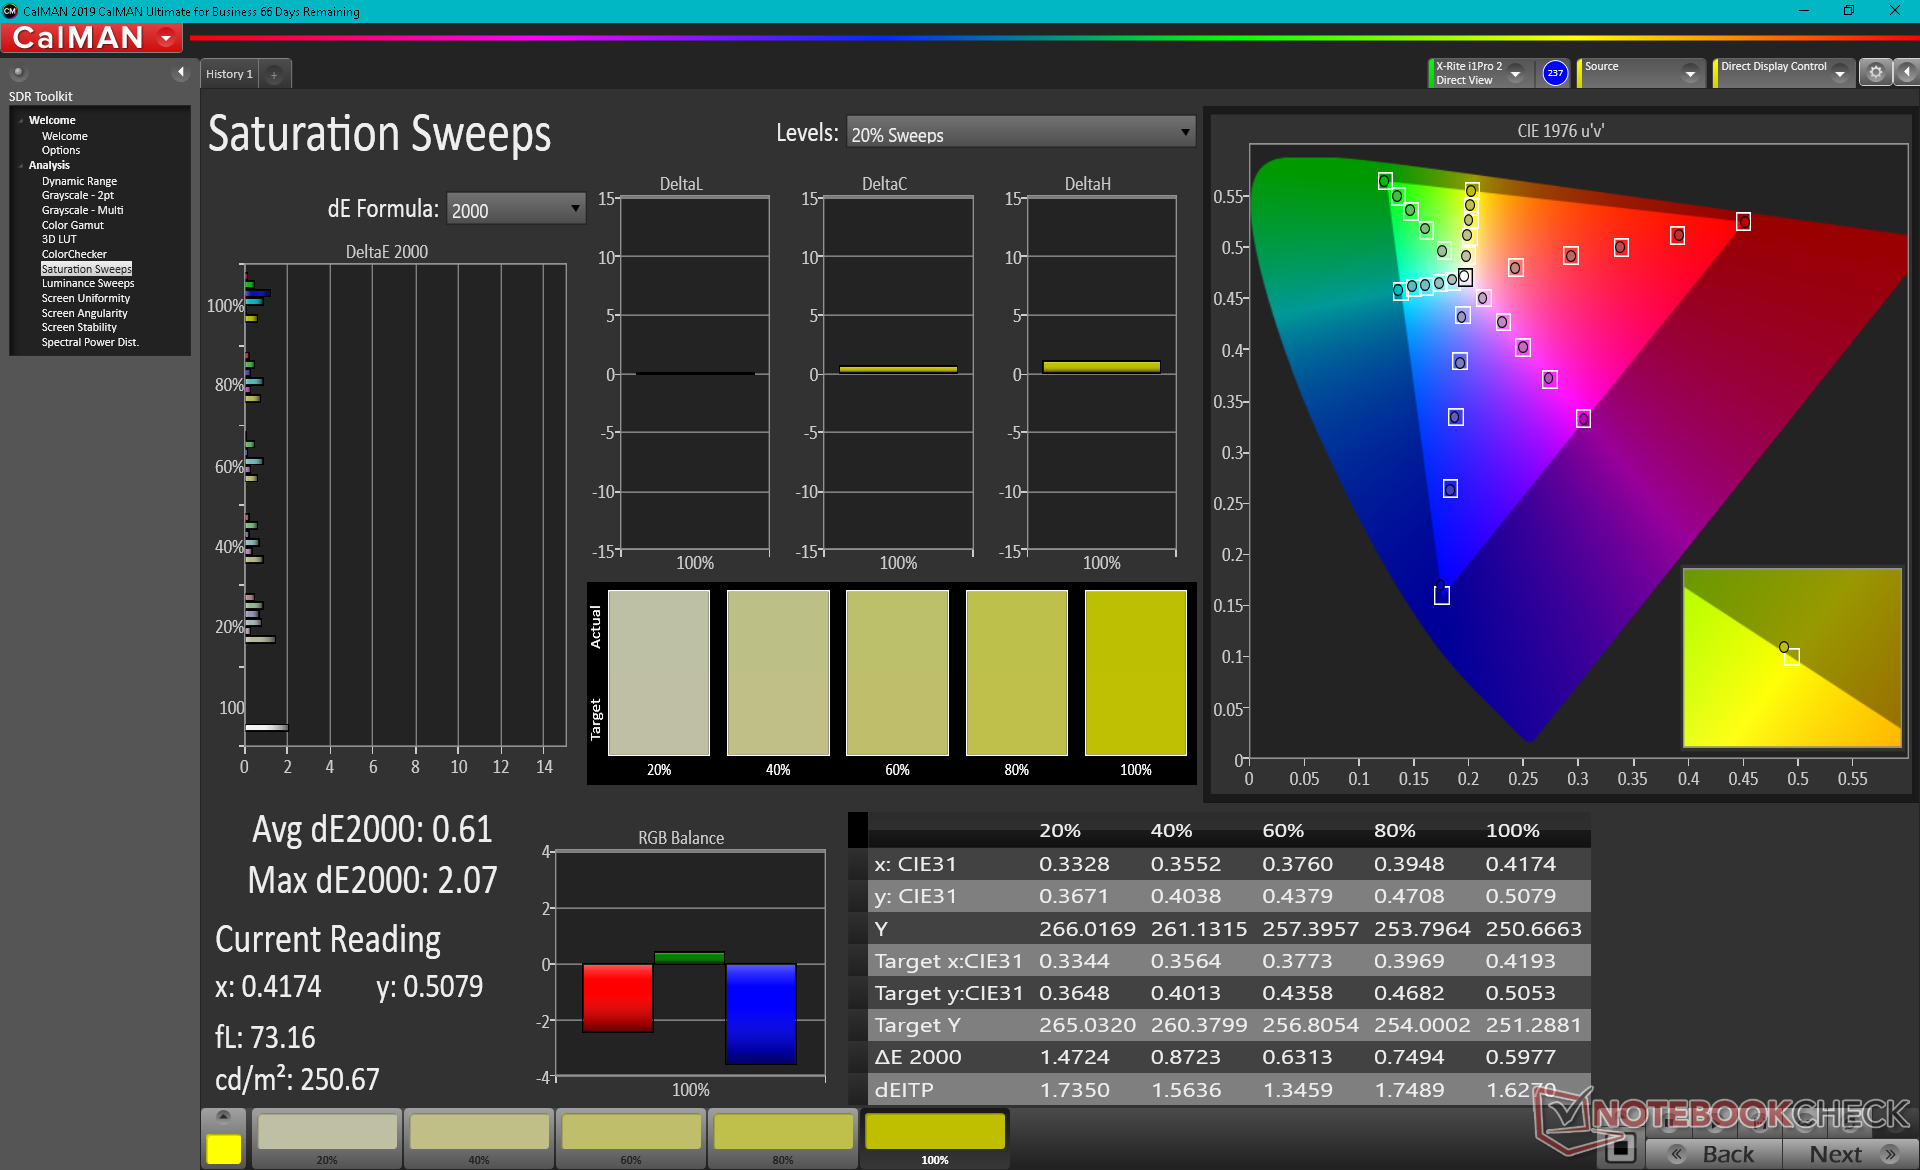
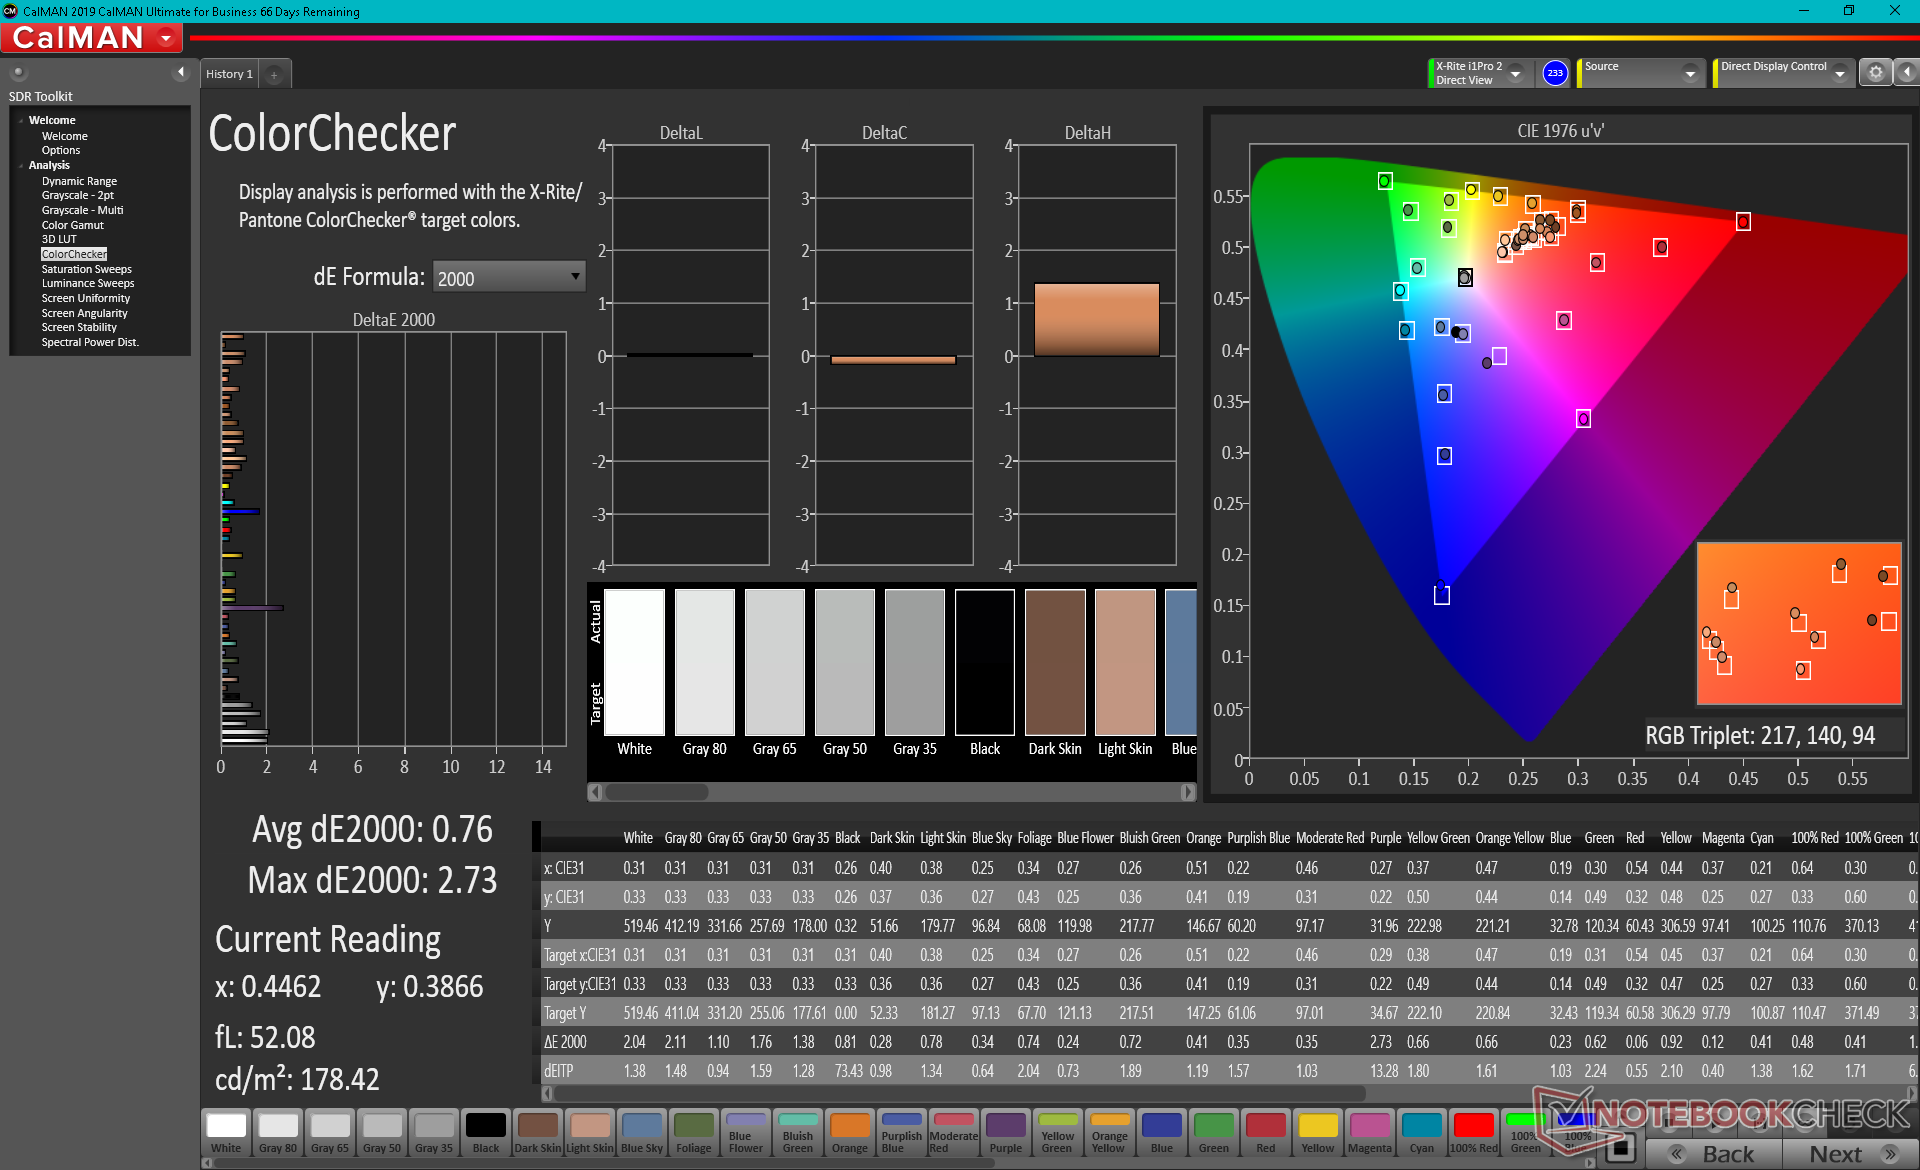
ΔE ColorChecker Calman: 4.83 | ∀{0.5-29.43 Ø4.72}
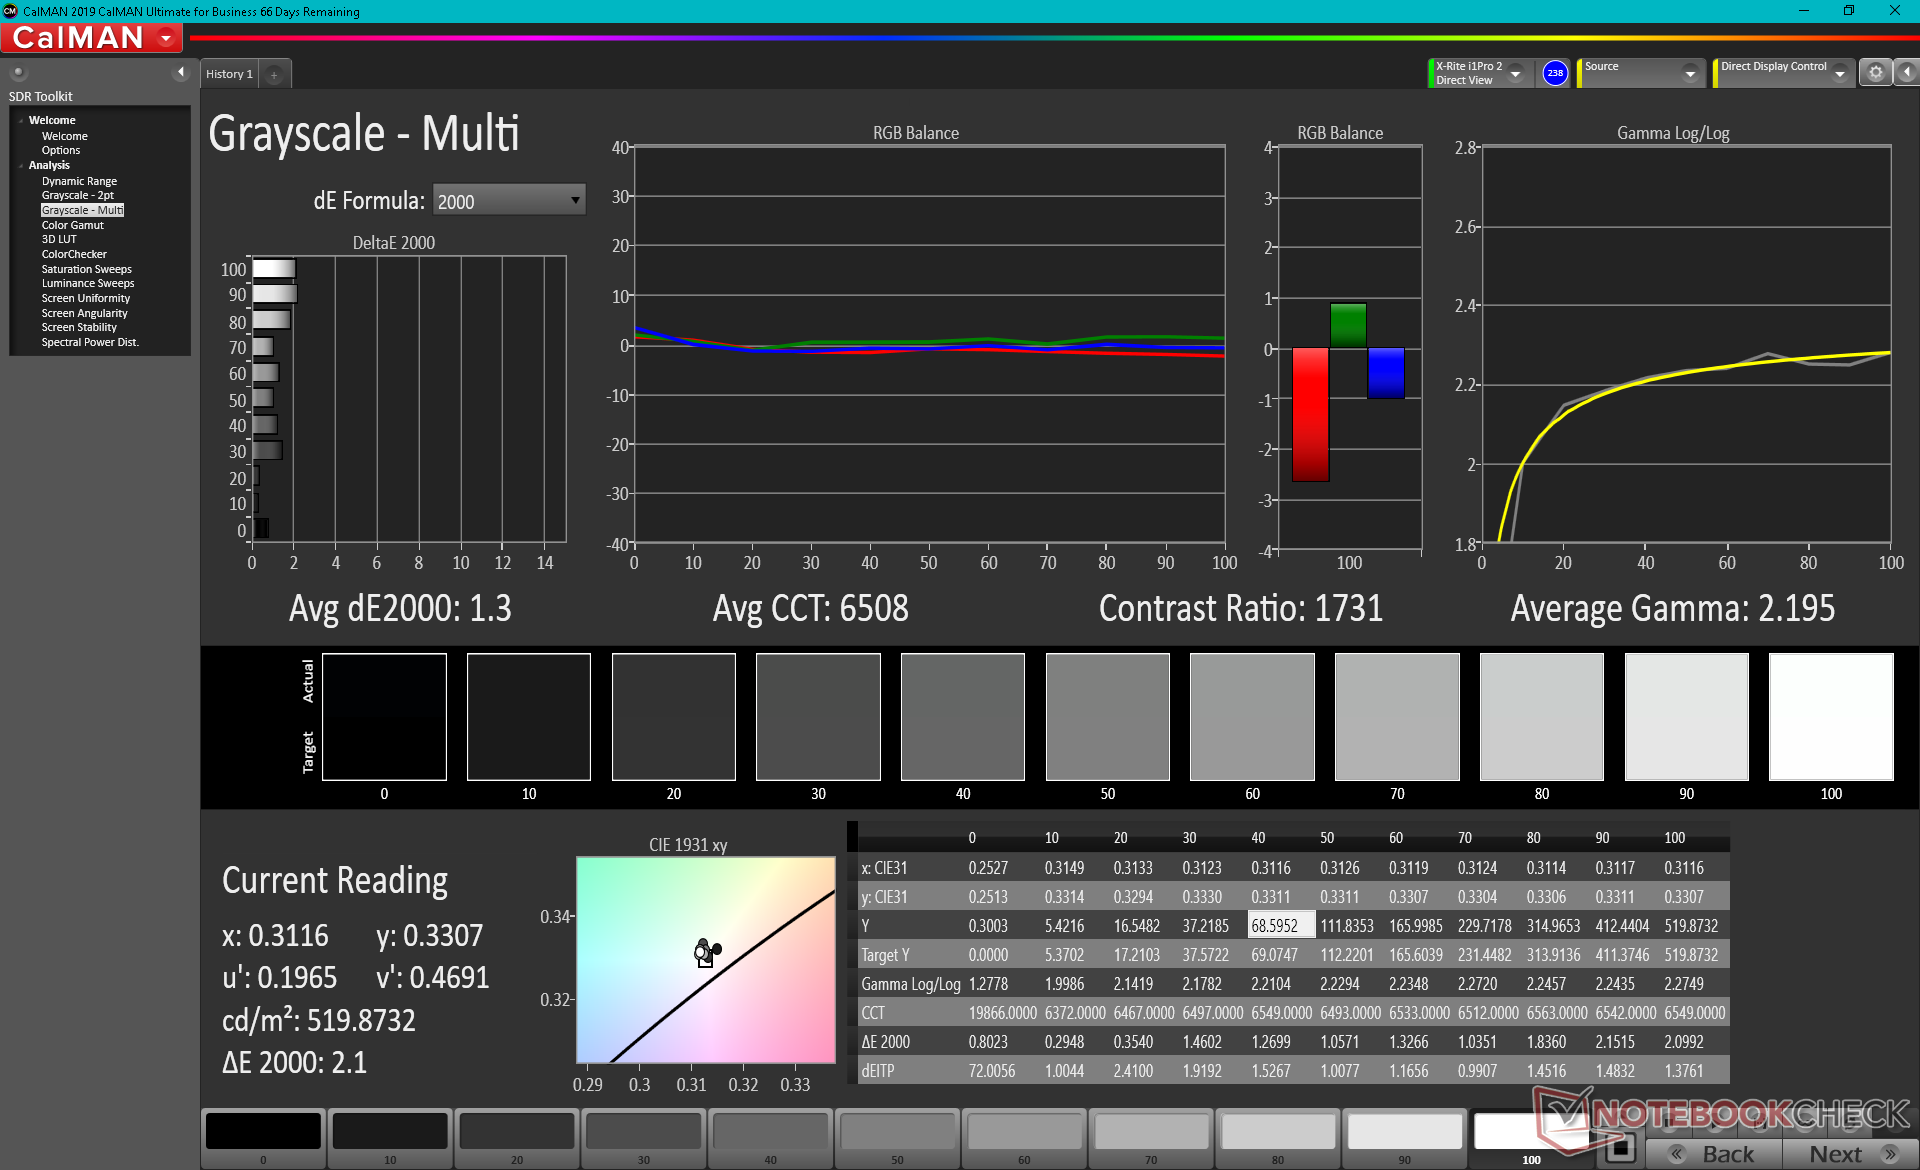
calibrated: 0.76
ΔE Greyscale Calman: 6.1 | ∀{0.09-98 Ø4.97}
71.7% AdobeRGB 1998 (Argyll 3D)
99% sRGB (Argyll 3D)
69.7% Display P3 (Argyll 3D)
Gamma: 1.98
CCT: 6686 K
| Dell XPS 13 9310 2-in-1 Sharp LQ134N1, IPS, 13.4", 1920x1200 | Dell XPS 13 9310 Core i7 FHD Sharp LQ134N1, IPS, 13.4", 1920x1200 | Dell XPS 13 7390 2-in-1 Core i7 Sharp LQ134N1, IPS, 13.4", 1920x1200 | Lenovo Yoga 6 13 82ND0009US AU Optronics B133HAN05.F, IPS, 13.3", 1920x1080 | Asus ZenBook Flip 13 UX363EA-HP069T Samsung, SDC414A, OLED, 13.3", 1920x1080 | Samsung Galaxy Book Pro 360 13 AMOLED, 13.2", 1920x1080 | |
|---|---|---|---|---|---|---|
| Display | 1% | 0% | 0% | 26% | ||
| Display P3 Coverage (%) | 69.7 | 70.9 2% | 69.9 0% | 69.7 0% | 99.4 43% | |
| sRGB Coverage (%) | 99 | 99.1 0% | 99.2 0% | 99.2 0% | 100 1% | |
| AdobeRGB 1998 Coverage (%) | 71.7 | 72.9 2% | 71.5 0% | 71.4 0% | 96 34% | |
| Response Times | 12% | 21% | 23% | 96% | 96% | |
| Response Time Grey 50% / Grey 80% * (ms) | 55.6 ? | 52 ? 6% | 47.6 ? 14% | 46.8 ? 16% | 2 ? 96% | 2 ? 96% |
| Response Time Black / White * (ms) | 40.4 ? | 33.2 ? 18% | 29.2 ? 28% | 28.8 ? 29% | 2 ? 95% | 2 ? 95% |
| PWM Frequency (Hz) | 2500 ? | 2475 ? | 2500 ? | 60 | 60 ? | |
| Bildschirm | -2% | 7% | -8% | -38% | 235% | |
| Helligkeit Bildmitte (cd/m²) | 555.7 | 543.3 -2% | 549.8 -1% | 291.5 -48% | 353 -36% | 287 -48% |
| Brightness (cd/m²) | 528 | 524 -1% | 520 -2% | 294 -44% | 359 -32% | 289 -45% |
| Brightness Distribution (%) | 90 | 92 2% | 86 -4% | 93 3% | 95 6% | 96 7% |
| Schwarzwert * (cd/m²) | 0.35 | 0.38 -9% | 0.39 -11% | 0.19 46% | 0.1 71% | 0.01 97% |
| Kontrast (:1) | 1588 | 1430 -10% | 1410 -11% | 1534 -3% | 3530 122% | 28700 1707% |
| Delta E Colorchecker * | 4.83 | 3.02 37% | 2.12 56% | 3.83 21% | 3.98 18% | 2.24 54% |
| Colorchecker dE 2000 max. * | 8.46 | 7.61 10% | 3.66 57% | 8.43 -0% | 53.07 -527% | 3.69 56% |
| Colorchecker dE 2000 calibrated * | 0.76 | 1.23 -62% | 1.37 -80% | 1.07 -41% | ||
| Delta E Graustufen * | 6.1 | 5 18% | 2.6 57% | 6.2 -2% | 1.41 77% | 2.73 55% |
| Gamma | 1.98 111% | 2.02 109% | 2.3 96% | 2.2 100% | 2.39 92% | 2.46 89% |
| CCT | 6686 97% | 6550 99% | 6884 94% | 6469 100% | 6346 102% | 6523 100% |
| Farbraum (Prozent von AdobeRGB 1998) (%) | 66.8 | 65.4 | ||||
| Color Space (Percent of sRGB) (%) | 99.6 | 99.7 | ||||
| Durchschnitt gesamt (Programm / Settings) | 4% /
1% | 9% /
7% | 5% /
-2% | 29% /
-11% | 119% /
166% |
* ... kleinere Werte sind besser
Reaktionszeiten (Response Times) des Displays
| ↔ Reaktionszeiten Schwarz zu Weiß | ||
|---|---|---|
| 40.4 ms ... steigend ↗ und fallend ↘ kombiniert | ↗ 22 ms steigend | 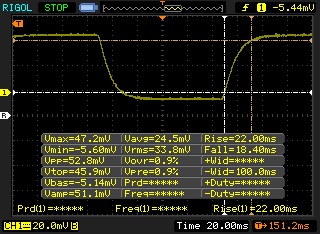 |
| ↘ 18.4 ms fallend | ||
| Die gemessenen Reaktionszeiten sind langsam und dadurch für viele Spieler wahrscheinlich zu langsam. Im Vergleich rangierten die bei uns getesteten Geräte von 0.1 (Minimum) zu 240 (Maximum) ms. » 97 % aller Screens waren schneller als der getestete. Daher sind die gemessenen Reaktionszeiten schlechter als der Durchschnitt aller vermessenen Geräte (19.8 ms). | ||
| ↔ Reaktionszeiten 50% Grau zu 80% Grau | ||
| 55.6 ms ... steigend ↗ und fallend ↘ kombiniert | ↗ 27.6 ms steigend | 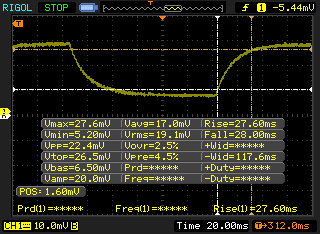 |
| ↘ 28 ms fallend | ||
| Die gemessenen Reaktionszeiten sind langsam und dadurch für viele Spieler wahrscheinlich zu langsam. Im Vergleich rangierten die bei uns getesteten Geräte von 0.165 (Minimum) zu 636 (Maximum) ms. » 92 % aller Screens waren schneller als der getestete. Daher sind die gemessenen Reaktionszeiten schlechter als der Durchschnitt aller vermessenen Geräte (31 ms). | ||
Bildschirm-Flackern / PWM (Pulse-Width Modulation)
| Flackern / PWM festgestellt | 2500 Hz | ≤ 25 % Helligkeit | 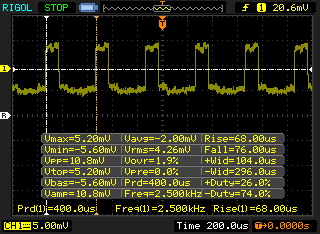 |
Das Display flackert mit 2500 Hz (im schlimmsten Fall, eventuell durch Pulsweitenmodulation PWM) bei einer eingestellten Helligkeit von 25 % und darunter. Darüber sollte es zu keinem Flackern kommen. Die Frequenz von 2500 Hz ist sehr hoch und sollte daher auch bei empfindlichen Personen zu keinen Problemen führen. Im Vergleich: 52 % aller getesteten Geräte nutzten kein PWM um die Helligkeit zu reduzieren. Wenn PWM eingesetzt wurde, dann bei einer Frequenz von durchschnittlich 7763 (Minimum 5, Maximum 343500) Hz. | |||

Leistung — Intel Tiger Lake-U packt an
Prozessor — Hinter den Erwartungen zurückgeblieben
Die CPU-Leistung schwankt – wie auch bei der Clamshell-Version des XPS 9210 mit dem gleichen Core i7-1165G7 – sehr stark. Die CineBench-R15-xT-Ergebnisse liegen bei 480 bis 750 Punkten, während das XPS 13 7390 2-in-1 oder das ZenBook Flip 13 deutlich konsistentere Taktraten bietet. Die Prozessorleistung kann daher zeitweise geringer sein, als die des Vorgängers Core i7-1065G7.
Unser Testgerät wurde vor der Durchführung der Benchmarks im Dell-Power-Management-Programm in den Ultra-Performance-Modus geschaltet, um die bestmöglichen Ergebnisse zu erreichen.
Cinebench R15 Multi Loop
Cinebench R23: Multi Core | Single Core
Cinebench R15: CPU Multi 64Bit | CPU Single 64Bit
Blender: v2.79 BMW27 CPU
7-Zip 18.03: 7z b 4 -mmt1 | 7z b 4
Geekbench 5.5: Single-Core | Multi-Core
HWBOT x265 Benchmark v2.2: 4k Preset
LibreOffice : 20 Documents To PDF
R Benchmark 2.5: Overall mean
| Cinebench R20 / CPU (Multi Core) | |
| Lenovo Yoga Slim 7-14ARE | |
| Asus ZenBook 13 OLED UM325UA | |
| Lenovo Yoga 6 13 82ND0009US | |
| Dell XPS 13 7390 Core i7-10710U | |
| Durchschnittliche Intel Core i7-1165G7 (1060 - 2657, n=81) | |
| Dell XPS 13 9310 OLED | |
| HP Spectre x360 13-aw2003dx | |
| Dell XPS 13 9310 2-in-1 | |
| Asus VivoBook S13 S333JA-DS51 | |
| Asus Zenbook S UX393JA | |
| HP Envy 13-ba0001ng | |
| HP Envy 13-aq0003ng | |
| Cinebench R20 / CPU (Single Core) | |
| Dell XPS 13 9310 OLED | |
| Durchschnittliche Intel Core i7-1165G7 (442 - 589, n=81) | |
| HP Spectre x360 13-aw2003dx | |
| Asus ZenBook 13 OLED UM325UA | |
| Dell XPS 13 9310 2-in-1 | |
| Lenovo Yoga Slim 7-14ARE | |
| Dell XPS 13 7390 Core i7-10710U | |
| Lenovo Yoga 6 13 82ND0009US | |
| Asus Zenbook S UX393JA | |
| HP Envy 13-ba0001ng | |
| Asus VivoBook S13 S333JA-DS51 | |
| HP Envy 13-aq0003ng | |
| Cinebench R23 / Multi Core | |
| Lenovo Yoga Slim 7-14ARE | |
| Asus ZenBook 13 OLED UM325UA | |
| Lenovo Yoga 6 13 82ND0009US | |
| Durchschnittliche Intel Core i7-1165G7 (2525 - 6862, n=64) | |
| Dell XPS 13 9310 OLED | |
| Dell XPS 13 9310 2-in-1 | |
| HP Spectre x360 13-aw2003dx | |
| Asus VivoBook S13 S333JA-DS51 | |
| Cinebench R23 / Single Core | |
| Dell XPS 13 9310 OLED | |
| Durchschnittliche Intel Core i7-1165G7 (1110 - 1539, n=59) | |
| Dell XPS 13 9310 2-in-1 | |
| HP Spectre x360 13-aw2003dx | |
| Asus ZenBook 13 OLED UM325UA | |
| Lenovo Yoga Slim 7-14ARE | |
| Lenovo Yoga 6 13 82ND0009US | |
| Asus VivoBook S13 S333JA-DS51 | |
| Cinebench R15 / CPU Multi 64Bit | |
| Lenovo Yoga Slim 7-14ARE | |
| Asus ZenBook 13 OLED UM325UA | |
| Dell XPS 13 7390 Core i7-10710U | |
| Lenovo Yoga 6 13 82ND0009US | |
| Durchschnittliche Intel Core i7-1165G7 (553 - 1027, n=86) | |
| HP Spectre x360 13-aw2003dx | |
| Dell XPS 13 9310 OLED | |
| Dell XPS 13 9310 2-in-1 | |
| Asus VivoBook S13 S333JA-DS51 | |
| Asus Zenbook S UX393JA | |
| HP Envy 13-ba0001ng | |
| HP Envy 13-aq0003ng | |
| Cinebench R15 / CPU Single 64Bit | |
| Dell XPS 13 9310 OLED | |
| Durchschnittliche Intel Core i7-1165G7 (115 - 230, n=78) | |
| HP Spectre x360 13-aw2003dx | |
| Asus ZenBook 13 OLED UM325UA | |
| Lenovo Yoga Slim 7-14ARE | |
| Dell XPS 13 7390 Core i7-10710U | |
| Asus Zenbook S UX393JA | |
| HP Envy 13-ba0001ng | |
| Lenovo Yoga 6 13 82ND0009US | |
| HP Envy 13-aq0003ng | |
| Dell XPS 13 9310 2-in-1 | |
| Asus VivoBook S13 S333JA-DS51 | |
| Blender / v2.79 BMW27 CPU | |
| HP Envy 13-ba0001ng | |
| Asus Zenbook S UX393JA | |
| Asus VivoBook S13 S333JA-DS51 | |
| Dell XPS 13 9310 2-in-1 | |
| Dell XPS 13 9310 OLED | |
| HP Spectre x360 13-aw2003dx | |
| Durchschnittliche Intel Core i7-1165G7 (468 - 1138, n=80) | |
| Dell XPS 13 7390 Core i7-10710U | |
| Lenovo Yoga 6 13 82ND0009US | |
| Asus ZenBook 13 OLED UM325UA | |
| Lenovo Yoga Slim 7-14ARE | |
| 7-Zip 18.03 / 7z b 4 -mmt1 | |
| Durchschnittliche Intel Core i7-1165G7 (4478 - 5507, n=80) | |
| Dell XPS 13 9310 2-in-1 | |
| HP Envy 13-ba0001ng | |
| HP Spectre x360 13-aw2003dx | |
| Asus ZenBook 13 OLED UM325UA | |
| Lenovo Yoga Slim 7-14ARE | |
| Asus Zenbook S UX393JA | |
| Dell XPS 13 7390 Core i7-10710U | |
| Lenovo Yoga 6 13 82ND0009US | |
| Asus VivoBook S13 S333JA-DS51 | |
| Dell XPS 13 9310 OLED | |
| 7-Zip 18.03 / 7z b 4 | |
| Lenovo Yoga Slim 7-14ARE | |
| Asus ZenBook 13 OLED UM325UA | |
| Lenovo Yoga 6 13 82ND0009US | |
| Dell XPS 13 7390 Core i7-10710U | |
| Dell XPS 13 9310 2-in-1 | |
| Durchschnittliche Intel Core i7-1165G7 (15347 - 27405, n=80) | |
| HP Spectre x360 13-aw2003dx | |
| Dell XPS 13 9310 OLED | |
| Asus Zenbook S UX393JA | |
| Asus VivoBook S13 S333JA-DS51 | |
| HP Envy 13-ba0001ng | |
| Geekbench 5.5 / Single-Core | |
| Dell XPS 13 9310 OLED | |
| Durchschnittliche Intel Core i7-1165G7 (1302 - 1595, n=77) | |
| HP Spectre x360 13-aw2003dx | |
| Asus Zenbook S UX393JA | |
| HP Envy 13-ba0001ng | |
| Asus ZenBook 13 OLED UM325UA | |
| Lenovo Yoga Slim 7-14ARE | |
| Lenovo Yoga Slim 7-14ARE | |
| Asus VivoBook S13 S333JA-DS51 | |
| Geekbench 5.5 / Multi-Core | |
| Lenovo Yoga Slim 7-14ARE | |
| Lenovo Yoga Slim 7-14ARE | |
| Asus ZenBook 13 OLED UM325UA | |
| Dell XPS 13 9310 OLED | |
| HP Spectre x360 13-aw2003dx | |
| Durchschnittliche Intel Core i7-1165G7 (3078 - 5926, n=77) | |
| Asus Zenbook S UX393JA | |
| Asus VivoBook S13 S333JA-DS51 | |
| HP Envy 13-ba0001ng | |
| HWBOT x265 Benchmark v2.2 / 4k Preset | |
| Lenovo Yoga Slim 7-14ARE | |
| Asus ZenBook 13 OLED UM325UA | |
| Lenovo Yoga 6 13 82ND0009US | |
| Dell XPS 13 9310 OLED | |
| Dell XPS 13 9310 2-in-1 | |
| Durchschnittliche Intel Core i7-1165G7 (1.39 - 8.47, n=80) | |
| HP Spectre x360 13-aw2003dx | |
| Dell XPS 13 7390 Core i7-10710U | |
| Asus VivoBook S13 S333JA-DS51 | |
| Asus Zenbook S UX393JA | |
| HP Envy 13-ba0001ng | |
| LibreOffice / 20 Documents To PDF | |
| Lenovo Yoga 6 13 82ND0009US | |
| Asus VivoBook S13 S333JA-DS51 | |
| Asus ZenBook 13 OLED UM325UA | |
| Lenovo Yoga Slim 7-14ARE | |
| HP Envy 13-ba0001ng | |
| HP Spectre x360 13-aw2003dx | |
| Durchschnittliche Intel Core i7-1165G7 (21.5 - 88.1, n=78) | |
| Asus Zenbook S UX393JA | |
| Dell XPS 13 9310 OLED | |
| R Benchmark 2.5 / Overall mean | |
| Asus VivoBook S13 S333JA-DS51 | |
| Asus Zenbook S UX393JA | |
| HP Envy 13-ba0001ng | |
| HP Spectre x360 13-aw2003dx | |
| Lenovo Yoga 6 13 82ND0009US | |
| Lenovo Yoga Slim 7-14ARE | |
| Dell XPS 13 9310 2-in-1 | |
| Asus ZenBook 13 OLED UM325UA | |
| Dell XPS 13 9310 OLED | |
| Durchschnittliche Intel Core i7-1165G7 (0.552 - 1.002, n=80) | |
* ... kleinere Werte sind besser
Systemleistung
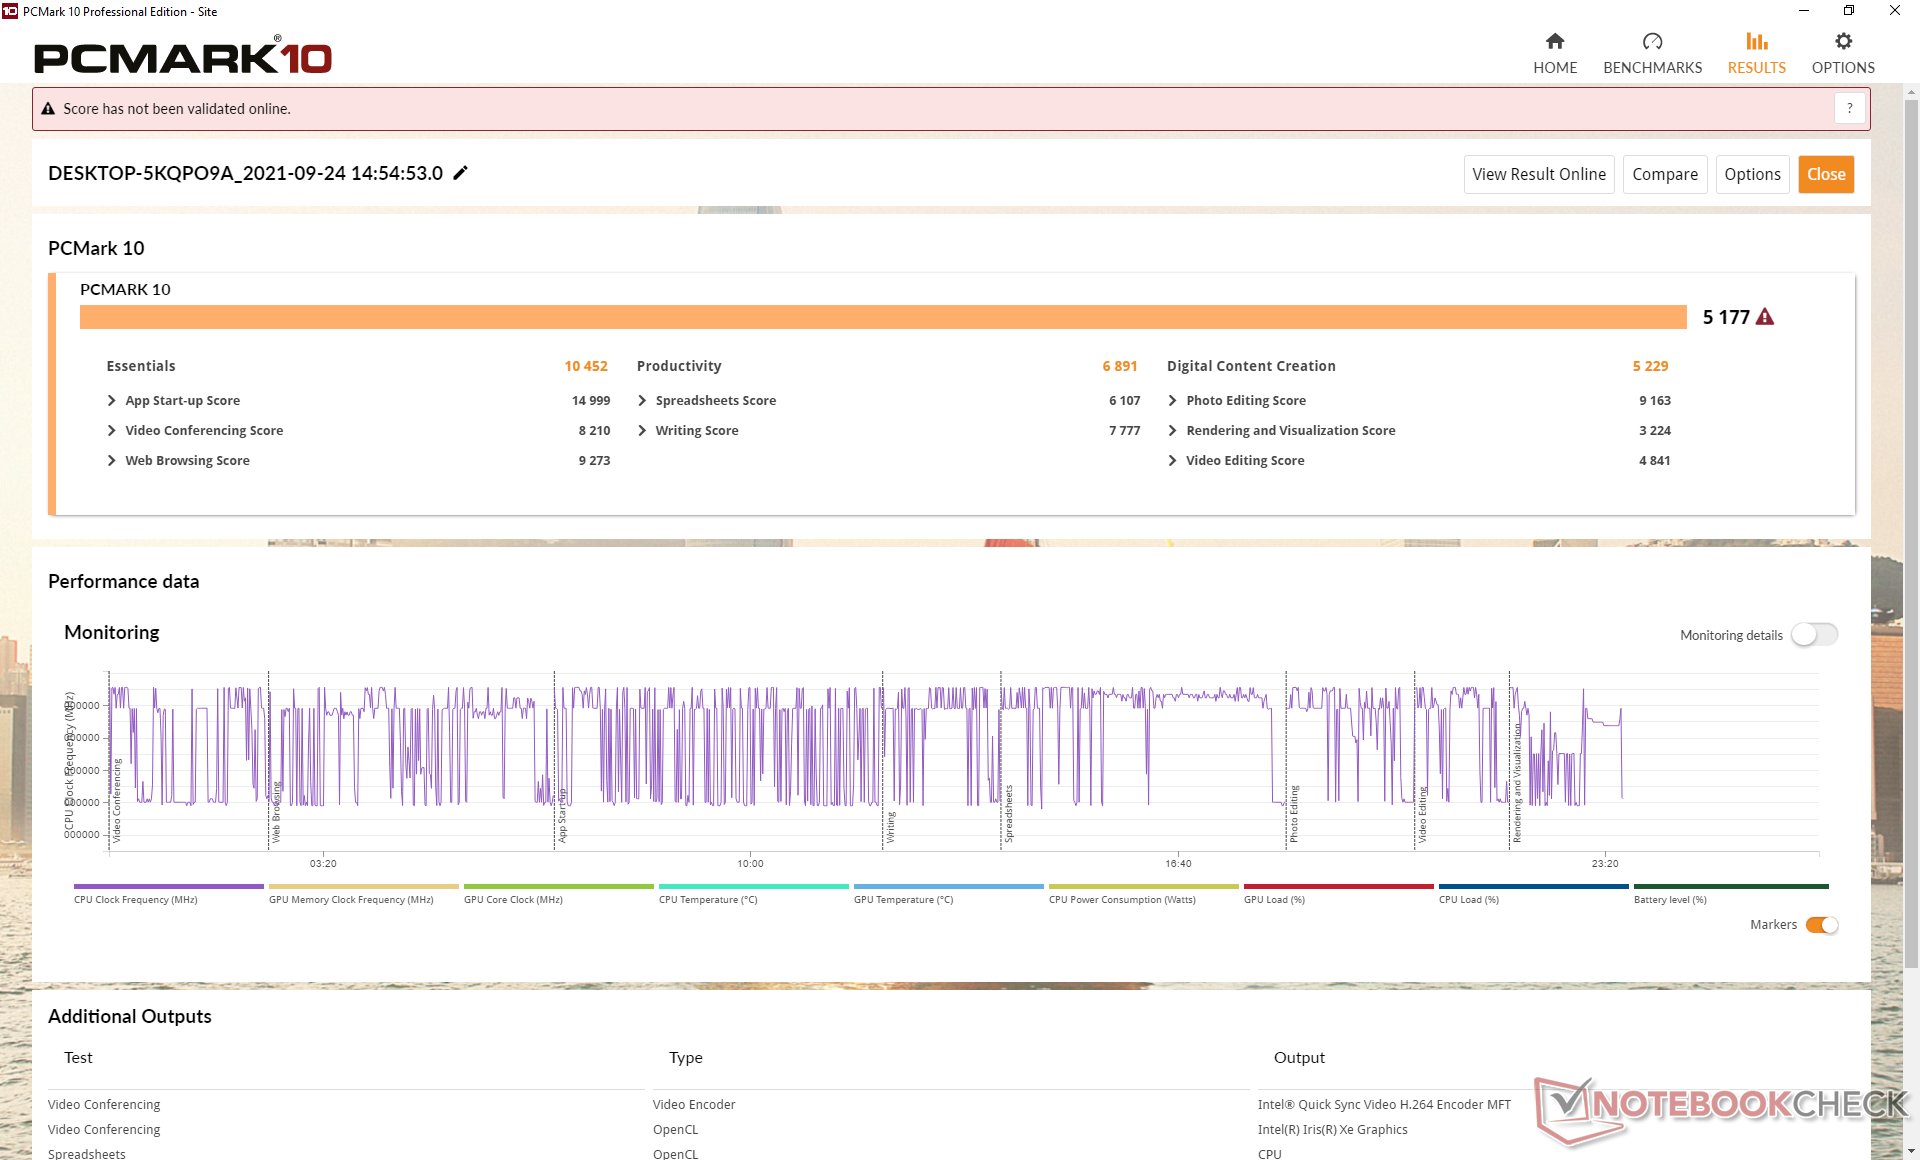
Die PCMark-10-Ergebnisse sind im Vergleich zu anderen mit der gleichen Core-i7-CPU ausgestatteten Laptops durchschnittlich. Den größten Vorteil gegenüber dem älteren XPS 13 7390 2-in-1 sieht man im GPU-lastigen Digital-Content-Creation-Benchmark. Hier kann unsere Iris Xe die Iris Plus G7 mit Leichtigkeit übertreffen.
| PCMark 10 / Score | |
| Lenovo Yoga 6 13 82ND0009US | |
| Dell XPS 13 9310 2-in-1 | |
| Durchschnittliche Intel Core i7-1165G7, Intel Iris Xe Graphics G7 96EUs (4531 - 5454, n=50) | |
| Dell XPS 13 9310 Core i7 FHD | |
| Asus ZenBook Flip 13 UX363EA-HP069T | |
| Dell XPS 13 7390 2-in-1 Core i7 | |
| Samsung Galaxy Book Pro 360 13 | |
| PCMark 10 / Essentials | |
| Dell XPS 13 9310 2-in-1 | |
| Asus ZenBook Flip 13 UX363EA-HP069T | |
| Durchschnittliche Intel Core i7-1165G7, Intel Iris Xe Graphics G7 96EUs (8997 - 11505, n=50) | |
| Lenovo Yoga 6 13 82ND0009US | |
| Dell XPS 13 9310 Core i7 FHD | |
| Dell XPS 13 7390 2-in-1 Core i7 | |
| Samsung Galaxy Book Pro 360 13 | |
| PCMark 10 / Productivity | |
| Lenovo Yoga 6 13 82ND0009US | |
| Dell XPS 13 7390 2-in-1 Core i7 | |
| Asus ZenBook Flip 13 UX363EA-HP069T | |
| Dell XPS 13 9310 2-in-1 | |
| Dell XPS 13 9310 Core i7 FHD | |
| Durchschnittliche Intel Core i7-1165G7, Intel Iris Xe Graphics G7 96EUs (5570 - 7136, n=50) | |
| Samsung Galaxy Book Pro 360 13 | |
| PCMark 10 / Digital Content Creation | |
| Lenovo Yoga 6 13 82ND0009US | |
| Dell XPS 13 9310 2-in-1 | |
| Durchschnittliche Intel Core i7-1165G7, Intel Iris Xe Graphics G7 96EUs (4083 - 5550, n=50) | |
| Dell XPS 13 9310 Core i7 FHD | |
| Samsung Galaxy Book Pro 360 13 | |
| Asus ZenBook Flip 13 UX363EA-HP069T | |
| Dell XPS 13 7390 2-in-1 Core i7 | |
| PCMark 10 Score | 5177 Punkte | |
Hilfe | ||
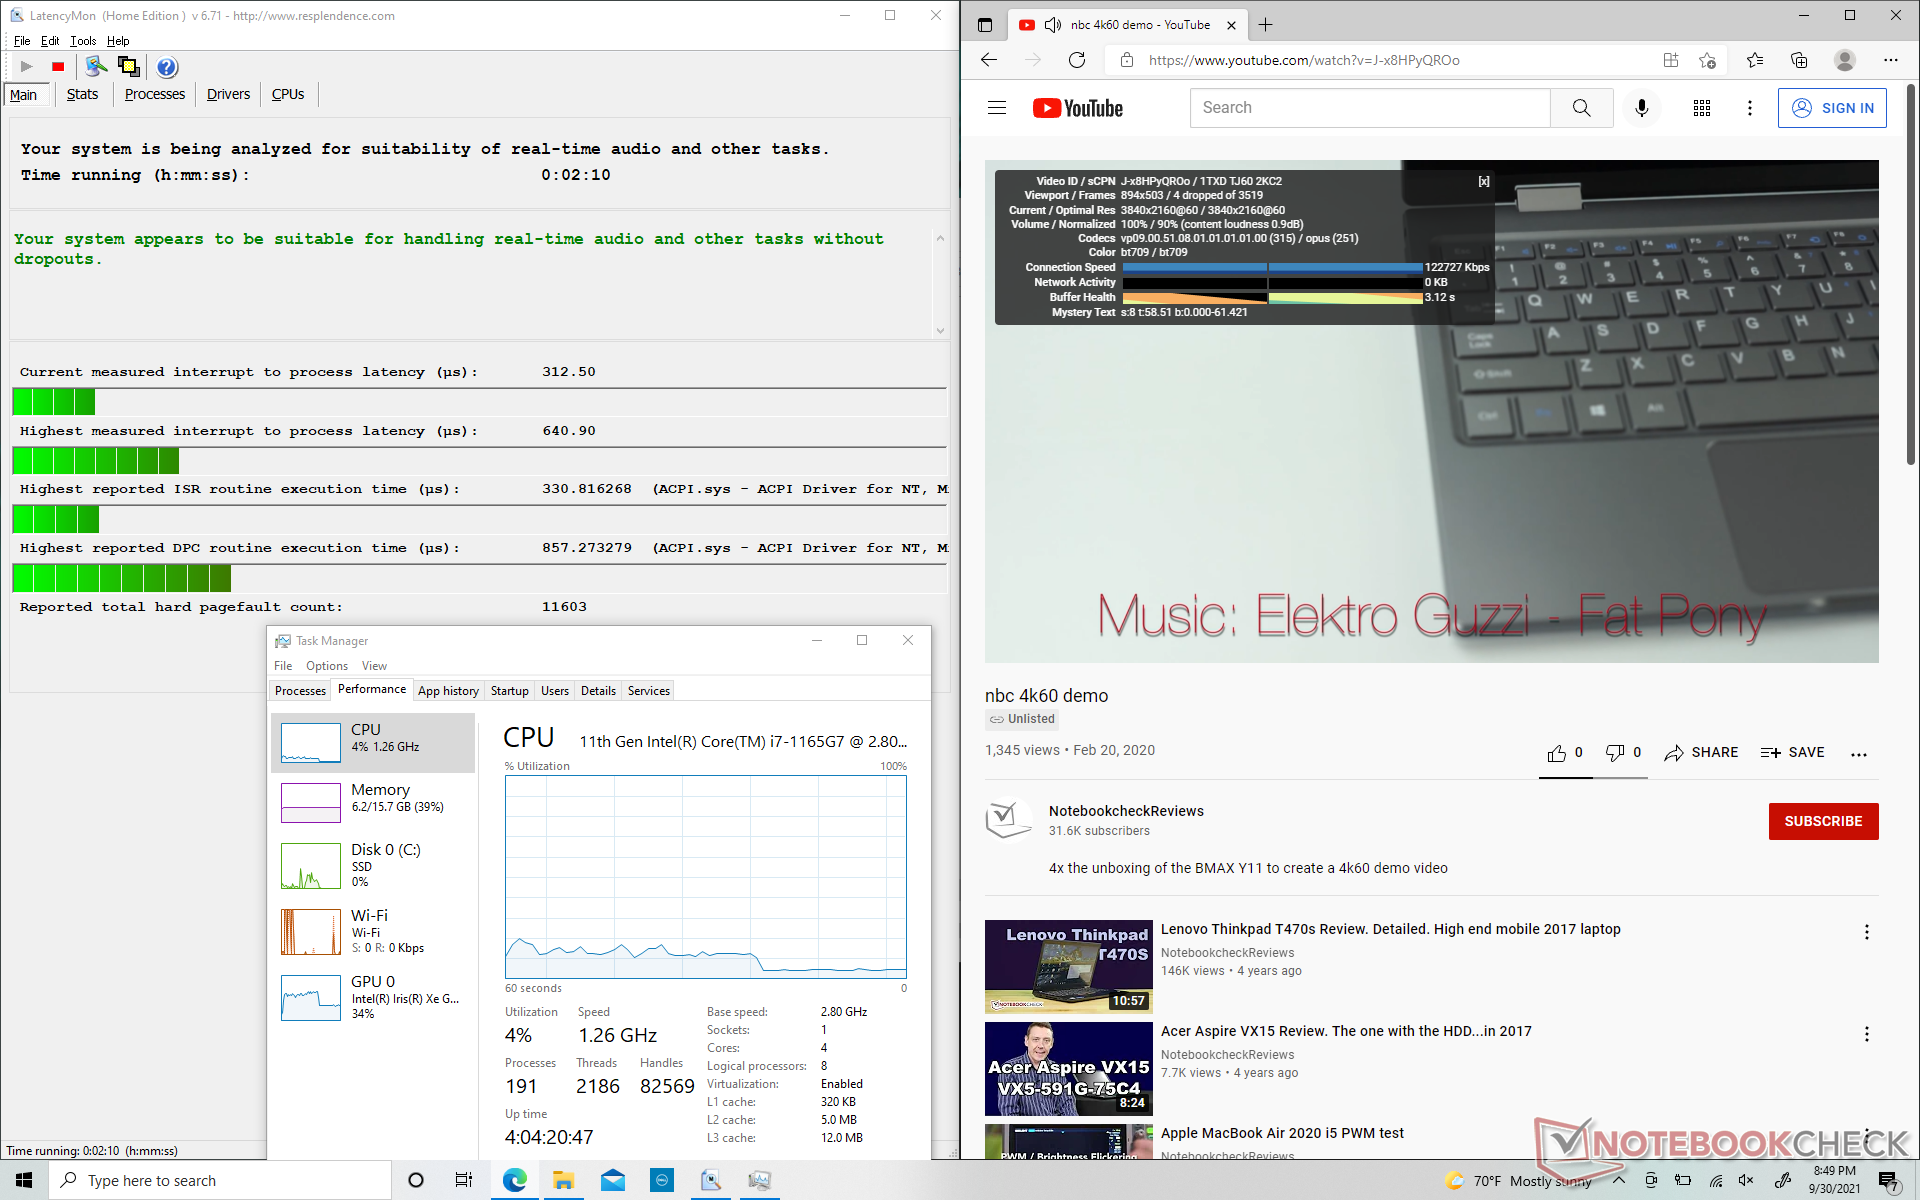
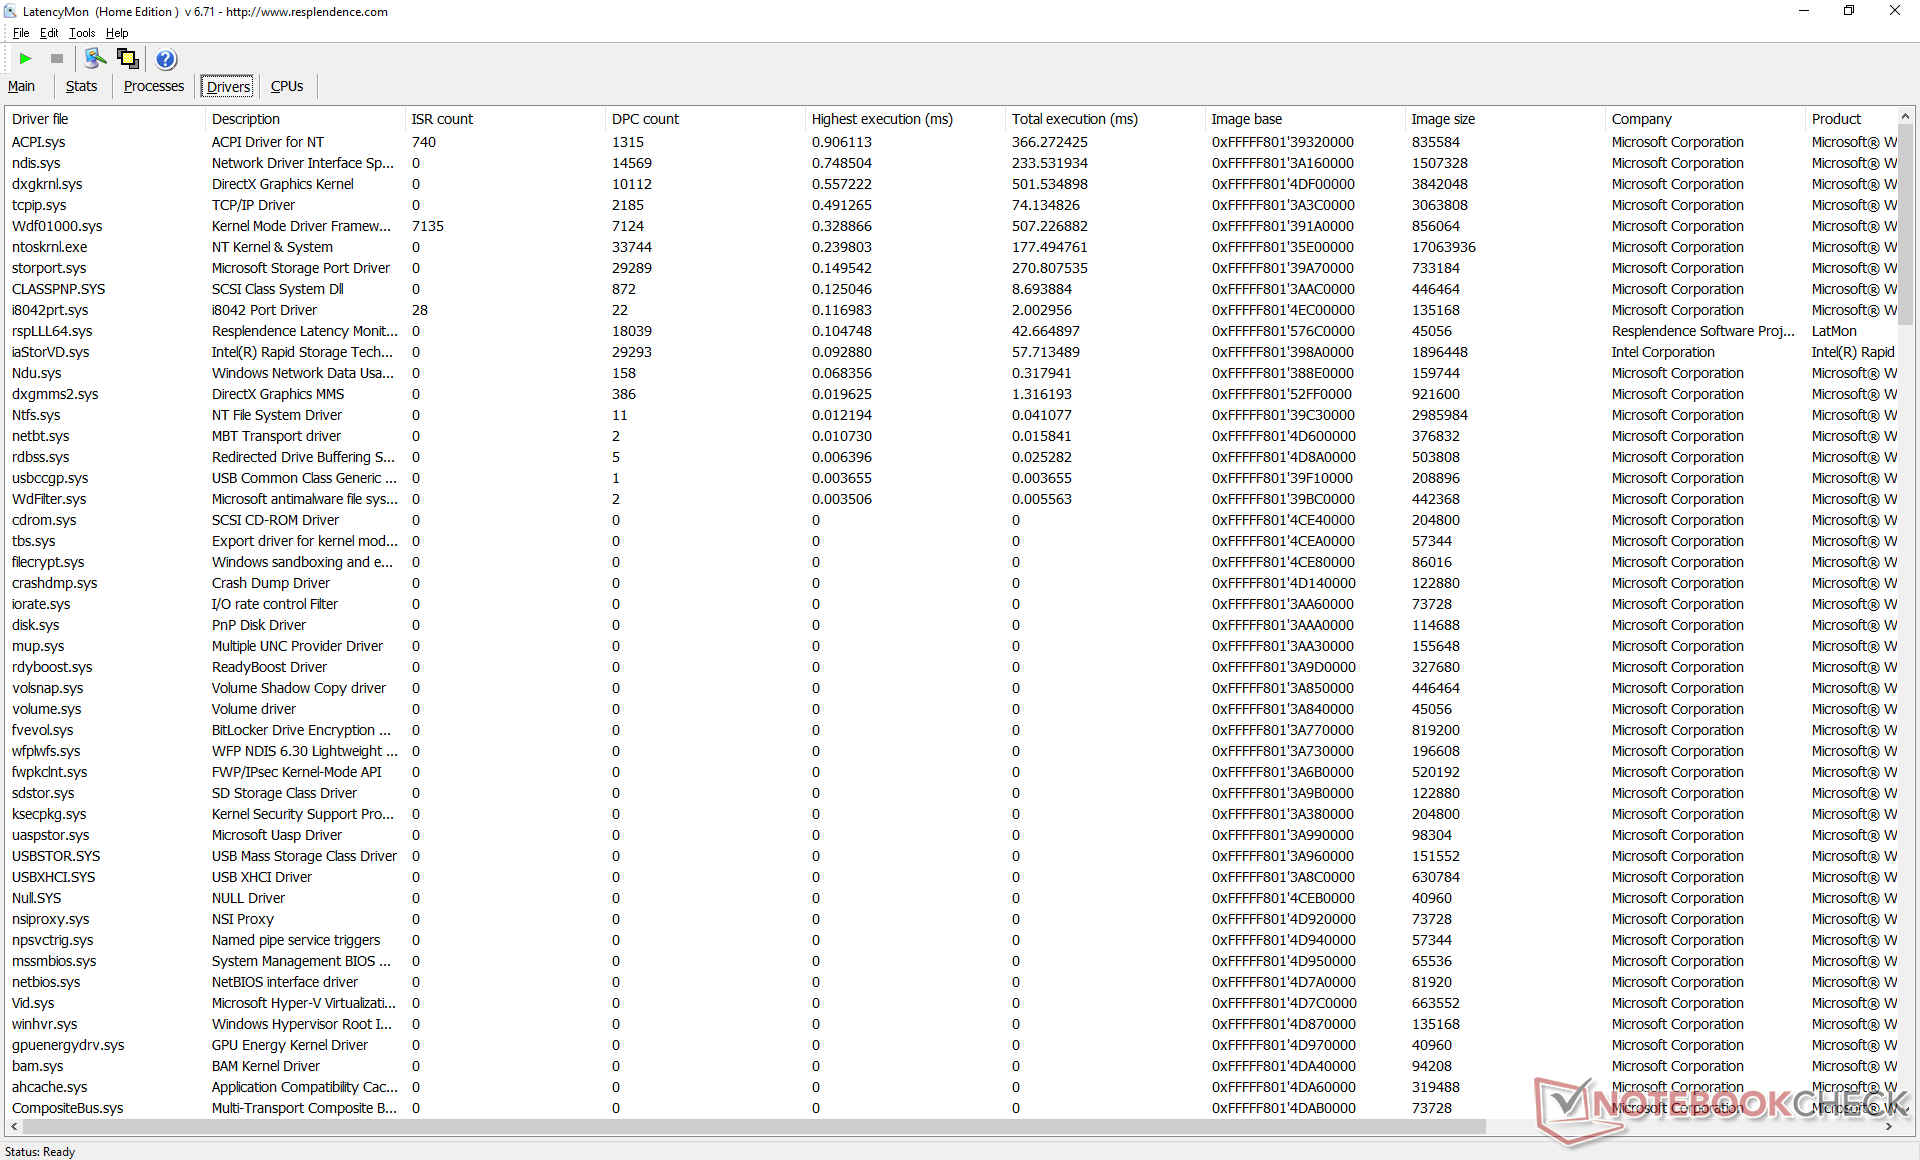
DPC-Latenzen
Der LatencyMon zeigt keine Probleme mit DPC-Latenzen, wenn mehrere Tabs auf unsere Homepage geöffnet sind oder Prime95 läuft. Auch die Darstellung von 4K-UHD-Video mit 60 FPS ist flüssig.
| DPC Latencies / LatencyMon - interrupt to process latency (max), Web, Youtube, Prime95 | |
| Samsung Galaxy Book Pro 360 13 | |
| Asus ZenBook Flip 13 UX363EA-HP069T | |
| Lenovo Yoga 6 13 82ND0009US | |
| Dell XPS 13 9310 Core i7 FHD | |
| Dell XPS 13 9310 2-in-1 | |
* ... kleinere Werte sind besser
Massenspeicher
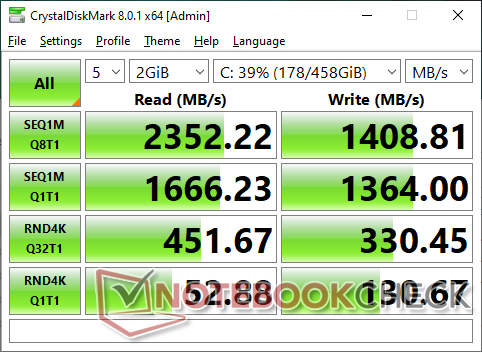
Unser Testgerät ist mit der gleichen Toshiba BG4 PCIe3 NVMe SSD ausgestattet wie das ältere XPS 13 7390 2-in-1. Allerdings würde es uns nicht wundern, wenn manche Geräte stattdessen mit einer Micron SSD ausgestattet sind. PCIe4-Geschwindigkeiten werden – im Gegensatz zum neuesten Vaio Z – nicht unterstützt.
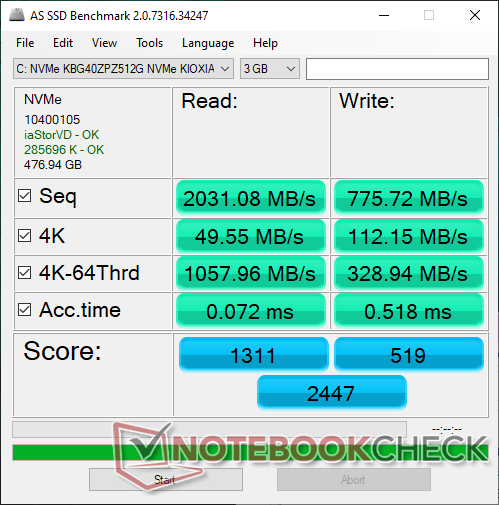
| Dell XPS 13 9310 2-in-1 Toshiba BG4 KBG40ZPZ512G | Dell XPS 13 9310 Core i7 FHD Micron 2300 512GB MTFDHBA512TDV | Dell XPS 13 7390 2-in-1 Core i7 Toshiba BG4 KBG40ZPZ512G | Lenovo Yoga 6 13 82ND0009US WDC PC SN530 SDBPMPZ-265G | Samsung Galaxy Book Pro 360 13 Samsung PM991 MZVLQ256HAJD | |
|---|---|---|---|---|---|
| AS SSD | 70% | 2% | -28% | 15% | |
| Seq Read (MB/s) | 2031 | 2091 3% | 1801 -11% | 1860 -8% | 1771 -13% |
| Seq Write (MB/s) | 776 | 1396 80% | 1125 45% | 500 -36% | 894 15% |
| 4K Read (MB/s) | 49.55 | 49.29 -1% | 39.7 -20% | 36.26 -27% | 53.5 8% |
| 4K Write (MB/s) | 112.2 | 104.2 -7% | 67 -40% | 118.6 6% | 157.8 41% |
| 4K-64 Read (MB/s) | 1058 | 827 -22% | 1253 18% | 419 -60% | 478.1 -55% |
| 4K-64 Write (MB/s) | 328.9 | 1636 397% | 209 -36% | 219 -33% | 741 125% |
| Access Time Read * (ms) | 0.072 | 0.066 8% | 0.069 4% | 0.102 -42% | 0.156 -117% |
| Access Time Write * (ms) | 0.518 | 0.365 30% | 0.625 -21% | 0.17 67% | 0.023 96% |
| Score Read (Points) | 1311 | 1086 -17% | 1472 12% | 641 -51% | 709 -46% |
| Score Write (Points) | 519 | 1880 262% | 388 -25% | 388 -25% | 988 90% |
| Score Total (Points) | 2447 | 3499 43% | 2583 6% | 1300 -47% | 2034 -17% |
| Copy ISO MB/s (MB/s) | 1103 | 1544 40% | 1293 17% | 880 -20% | 960 -13% |
| Copy Program MB/s (MB/s) | 331.7 | 613 85% | 560 69% | 185.3 -44% | 648 95% |
| Copy Game MB/s (MB/s) | 828 | 1451 75% | 927 12% | 212.7 -74% | 882 7% |
| CrystalDiskMark 5.2 / 6 | 24% | -3% | -20% | -12% | |
| Write 4K (MB/s) | 129.6 | 97.5 -25% | 106.7 -18% | 89.2 -31% | 170.6 32% |
| Read 4K (MB/s) | 52.2 | 50.9 -2% | 49.94 -4% | 33.09 -37% | 44.51 -15% |
| Write Seq (MB/s) | 1310 | 1811 38% | 1223 -7% | 988 -25% | 872 -33% |
| Read Seq (MB/s) | 1726 | 1836 6% | 1801 4% | 1322 -23% | 1188 -31% |
| Write 4K Q32T1 (MB/s) | 334.7 | 521 56% | 325.3 -3% | 332.6 -1% | 483.1 44% |
| Read 4K Q32T1 (MB/s) | 447.6 | 357.5 -20% | 551 23% | 389.3 -13% | 284.3 -36% |
| Write Seq Q32T1 (MB/s) | 1410 | 2879 104% | 1224 -13% | 984 -30% | 950 -33% |
| Read Seq Q32T1 (MB/s) | 2390 | 3204 34% | 2350 -2% | 2461 3% | 1872 -22% |
| Durchschnitt gesamt (Programm / Settings) | 47% /
53% | -1% /
0% | -24% /
-25% | 2% /
6% |
* ... kleinere Werte sind besser

Dauerleistung Lesen: DiskSpd Read Loop, Queue Depth 8
Grafikkarte — Große Leistungssteigerung im Vergleich zur Iris Plus G7
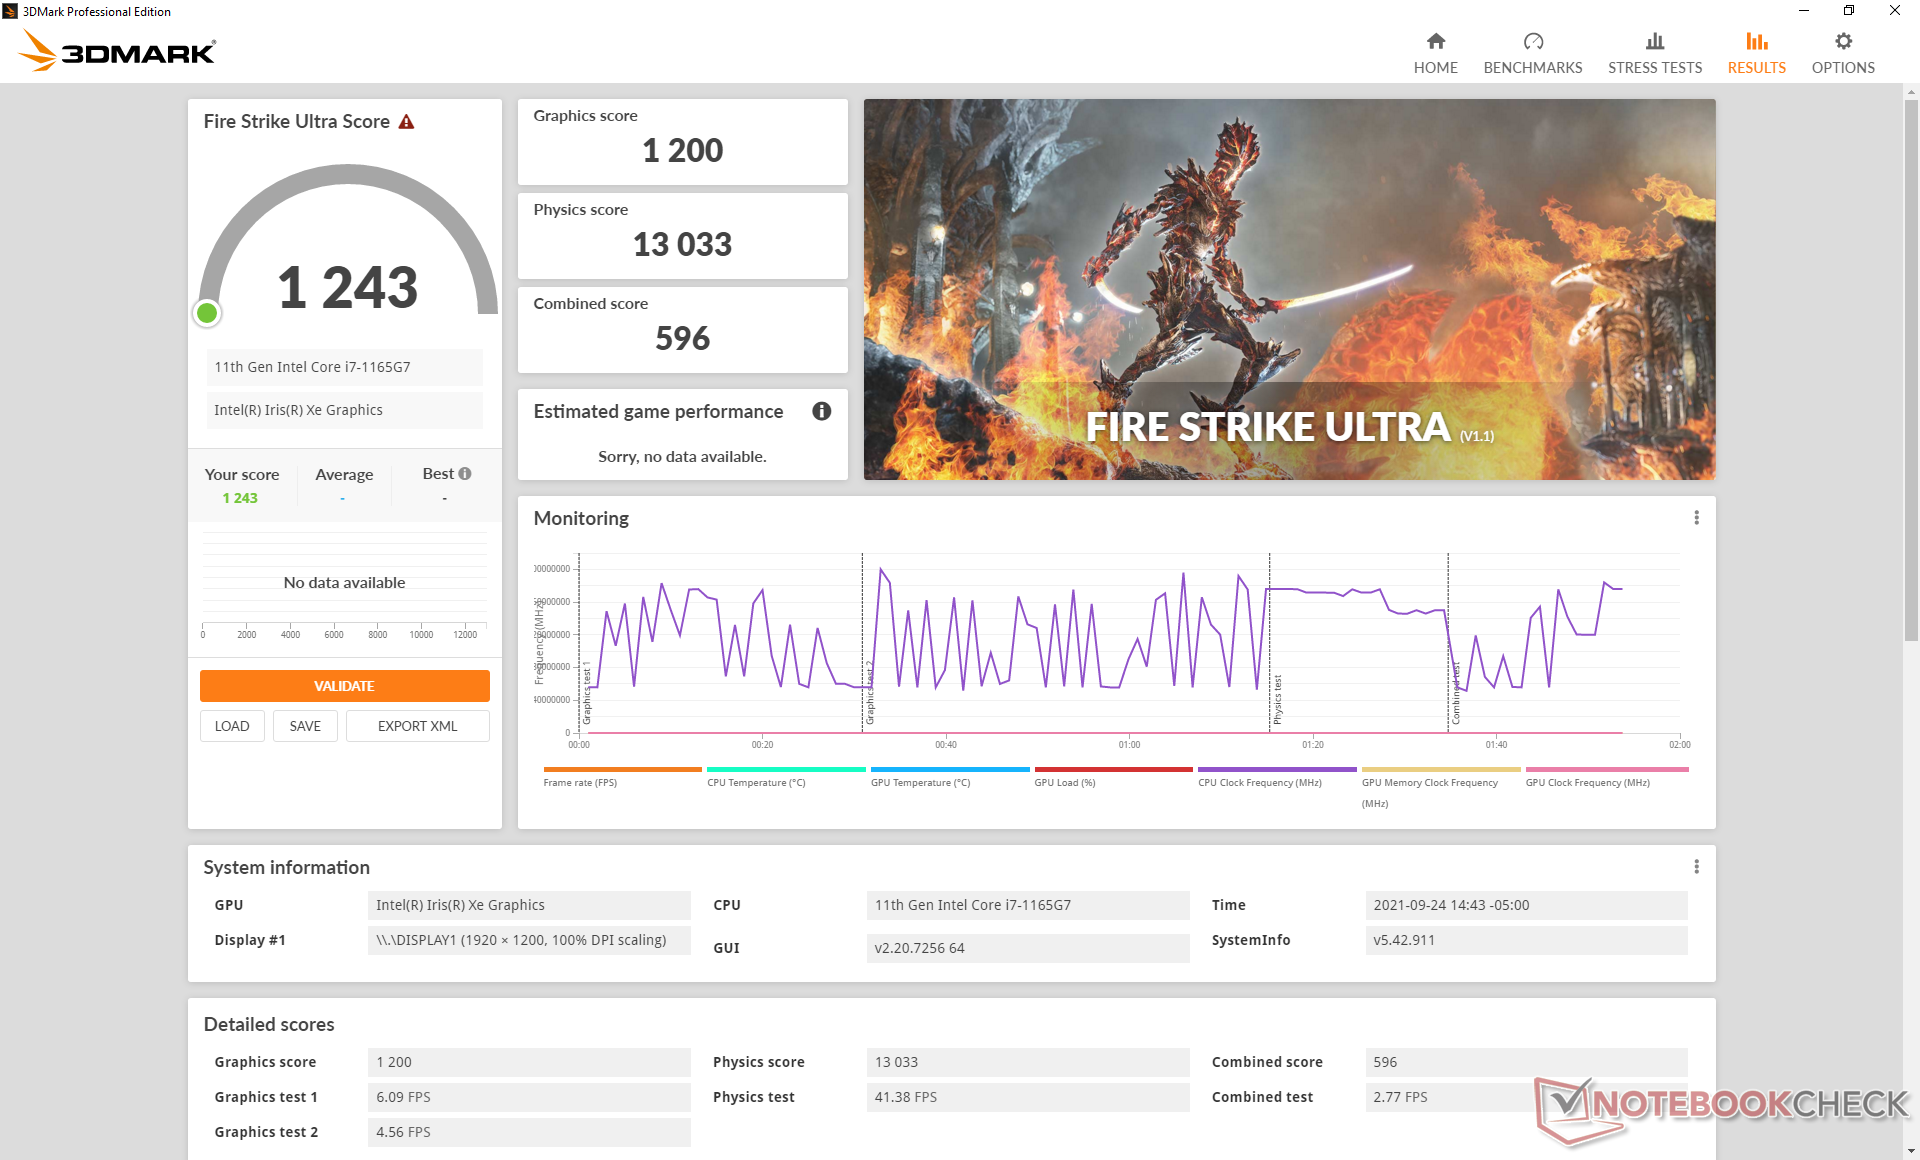
Intel Tiger Lake-U Xe Graphics G7 96EUs Grafikkarte - Benchmarks und SpezifikationenDie Grafikleistung der Iris Xe ist deutlich besser als die der Iris Plus G7 im Vorgängermodell XPS 13 7390 2-in-1. Der Unterschied beträgt laut unseren 3DMark-Ergebnissen zwischen 60 und 90 Prozent. Die größten Leistungsunterschiede können sich Nutzer für Titel, die DX12 anstatt DX11 unterstützten, erwarten.
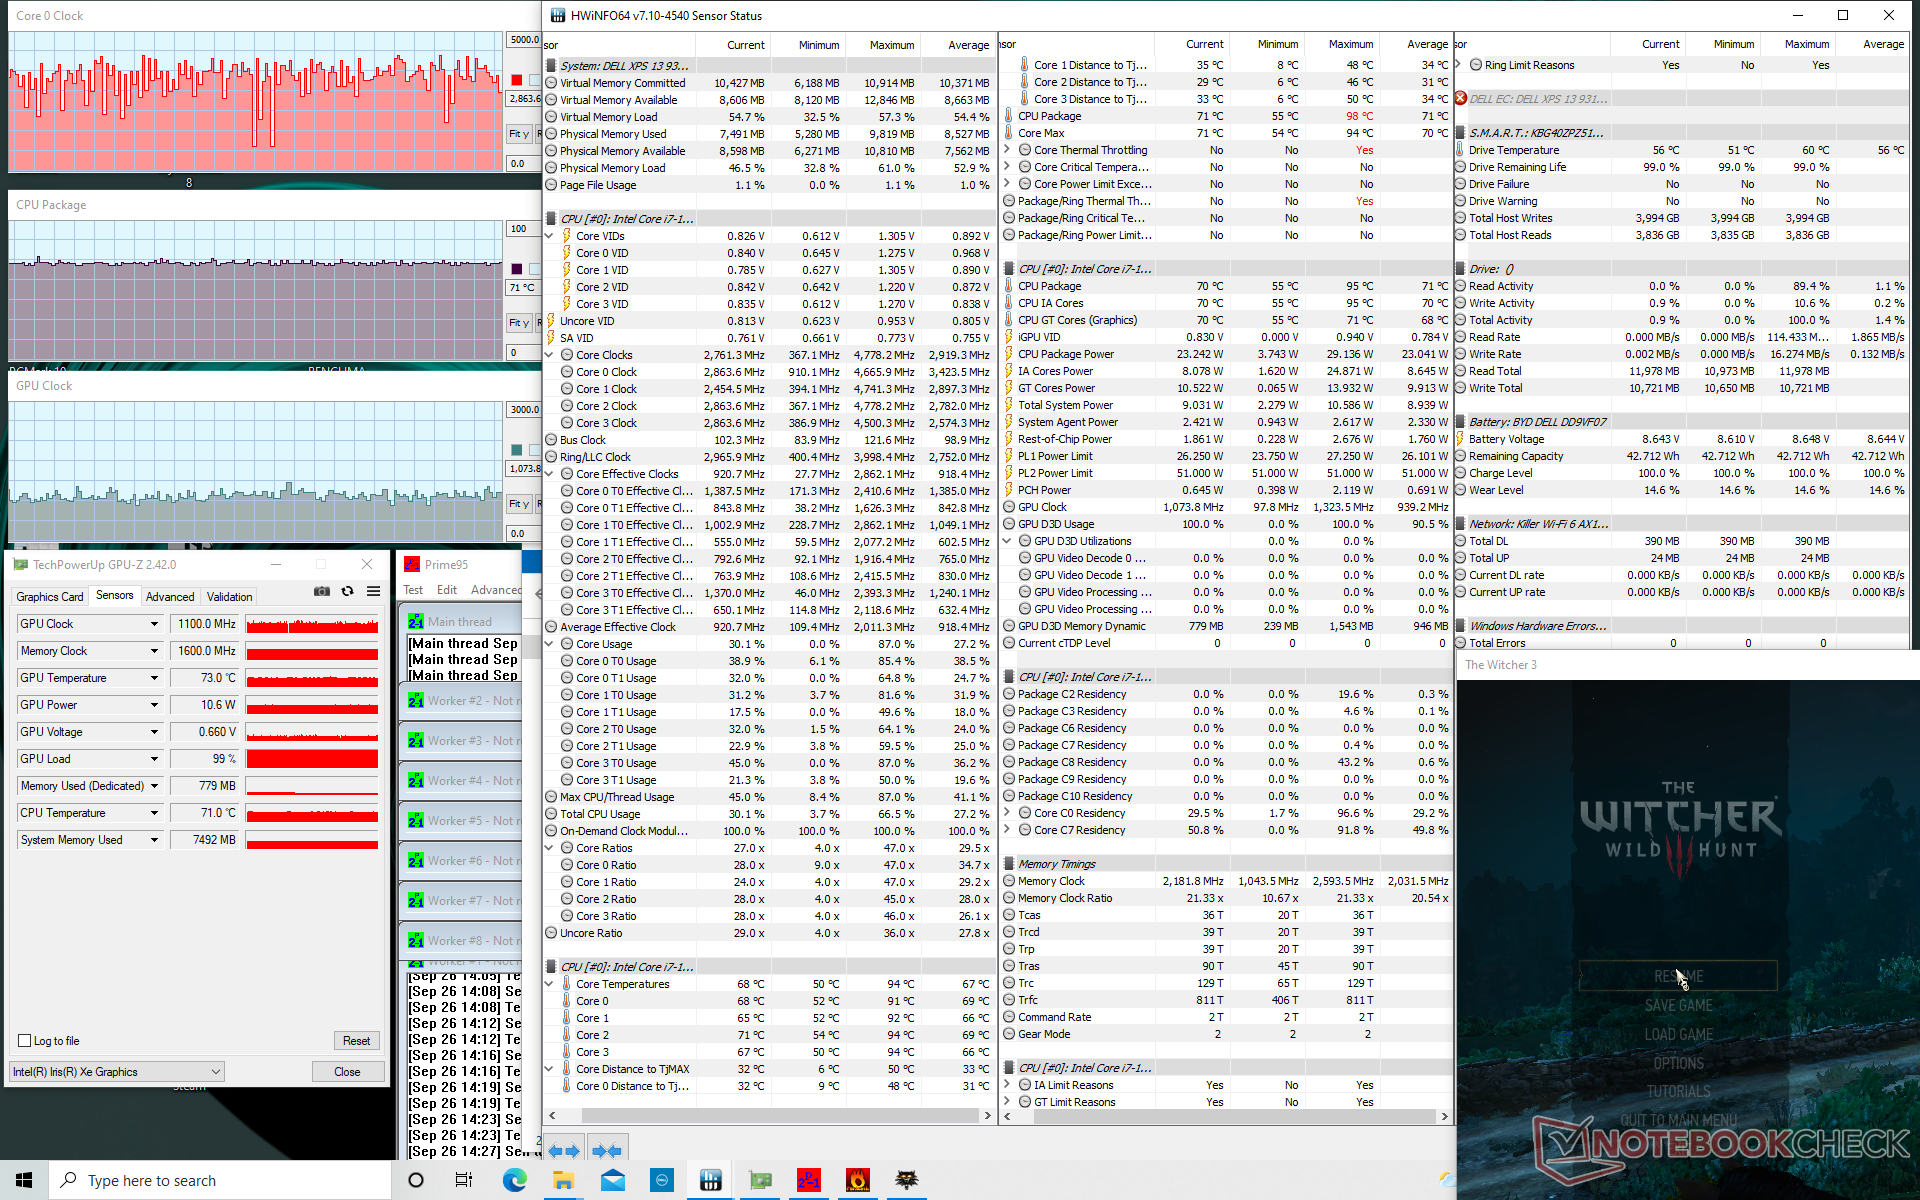
Allerdings ist die Leistung nicht immer gleichmäßig. Im einstündigen Leerlauf auf Witcher 3 bei niedrigen Einstellungen schwankt die Framerate etwa zwischen 70 und 98 FPS. Während die Leistung im Durchschnitt also ausgezeichnet ist, kann sie zeitweise auch deutlich langsamer sein. Dieses Verhalten haben wir bereits bei früheren Generationen des XPS 13 festgestellt.
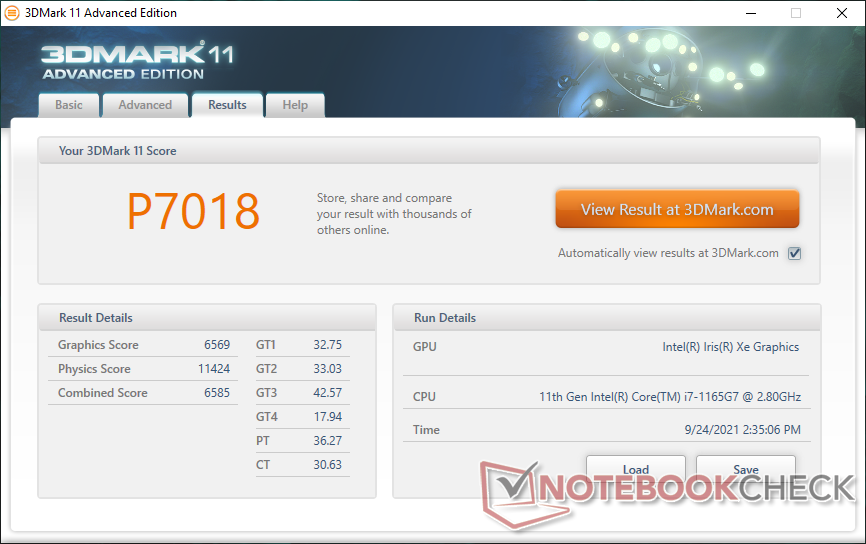
| 3DMark 11 Performance | 7018 Punkte | |
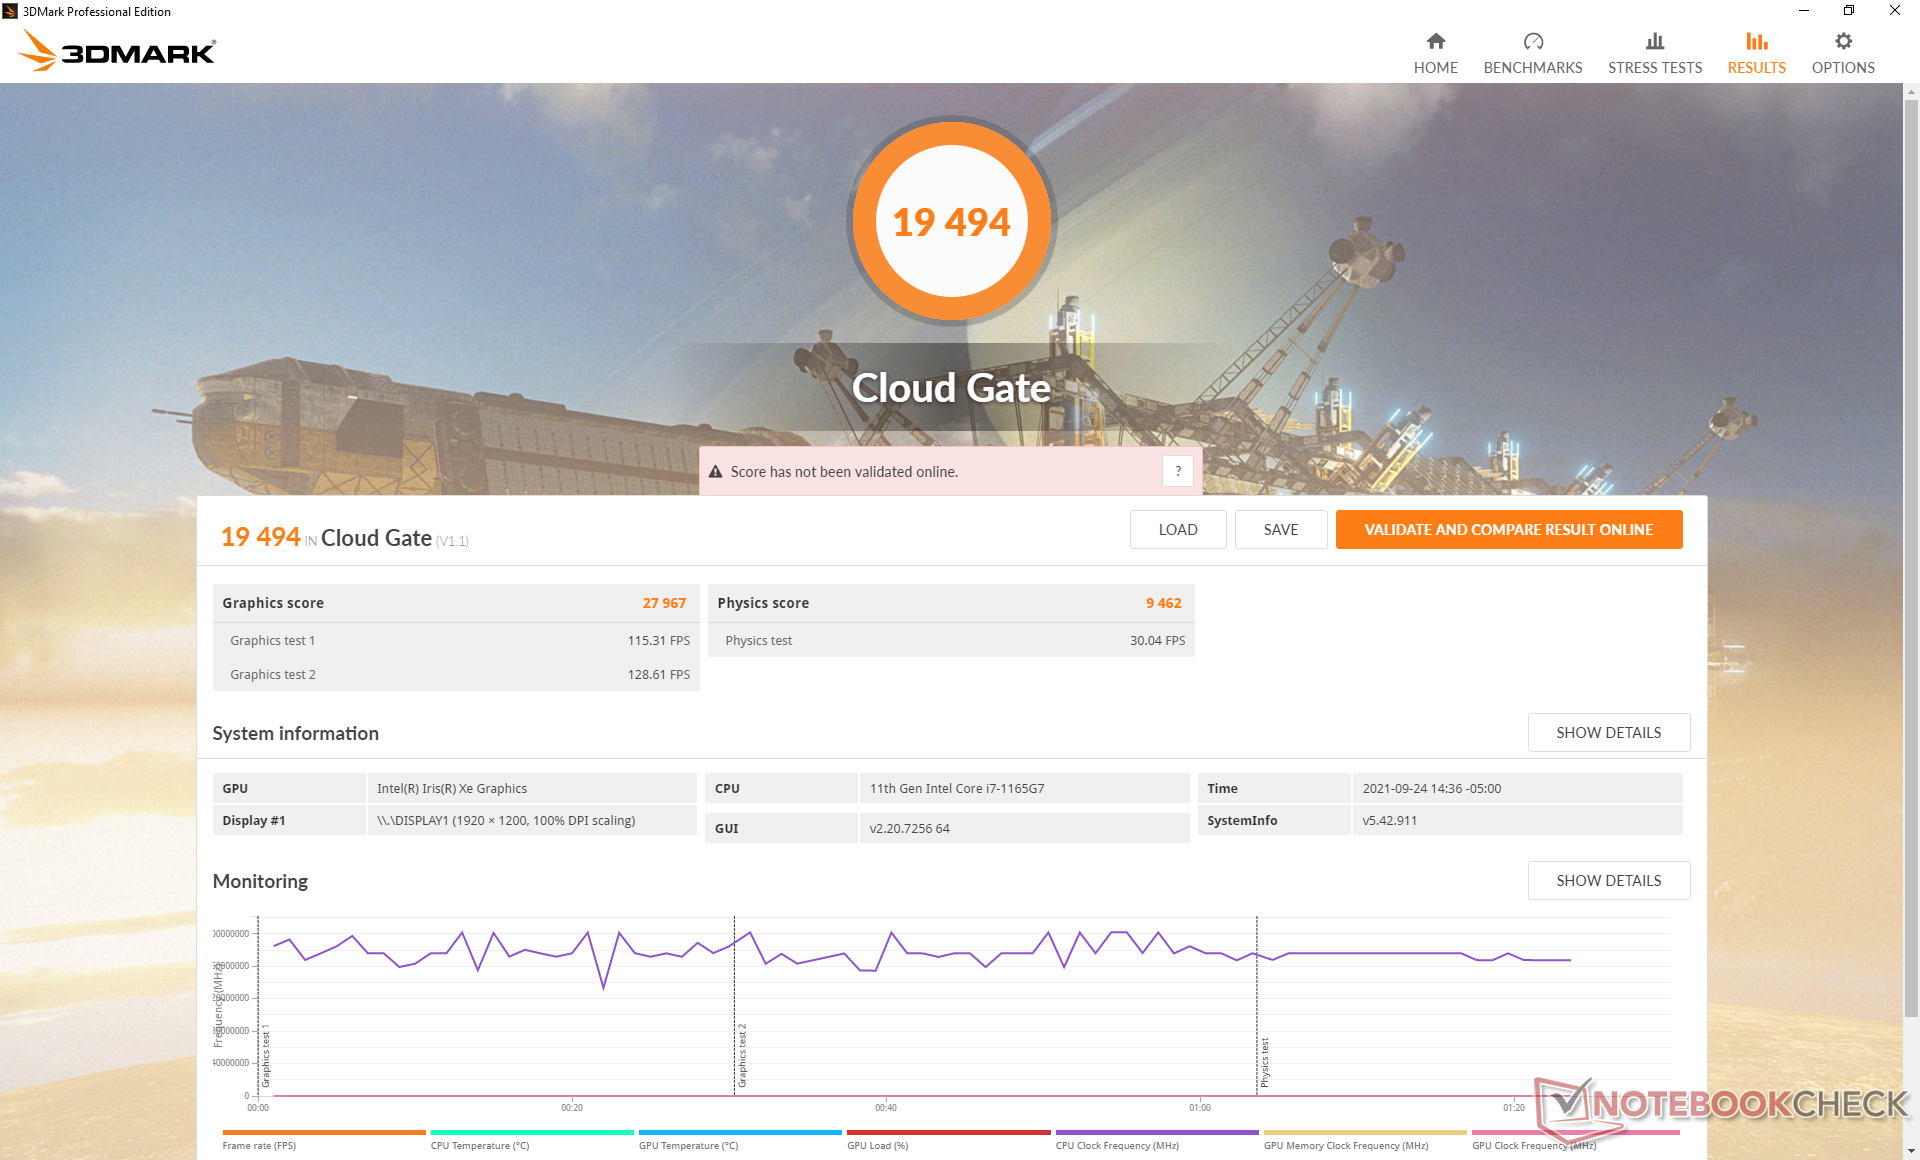
| 3DMark Cloud Gate Standard Score | 19494 Punkte | |
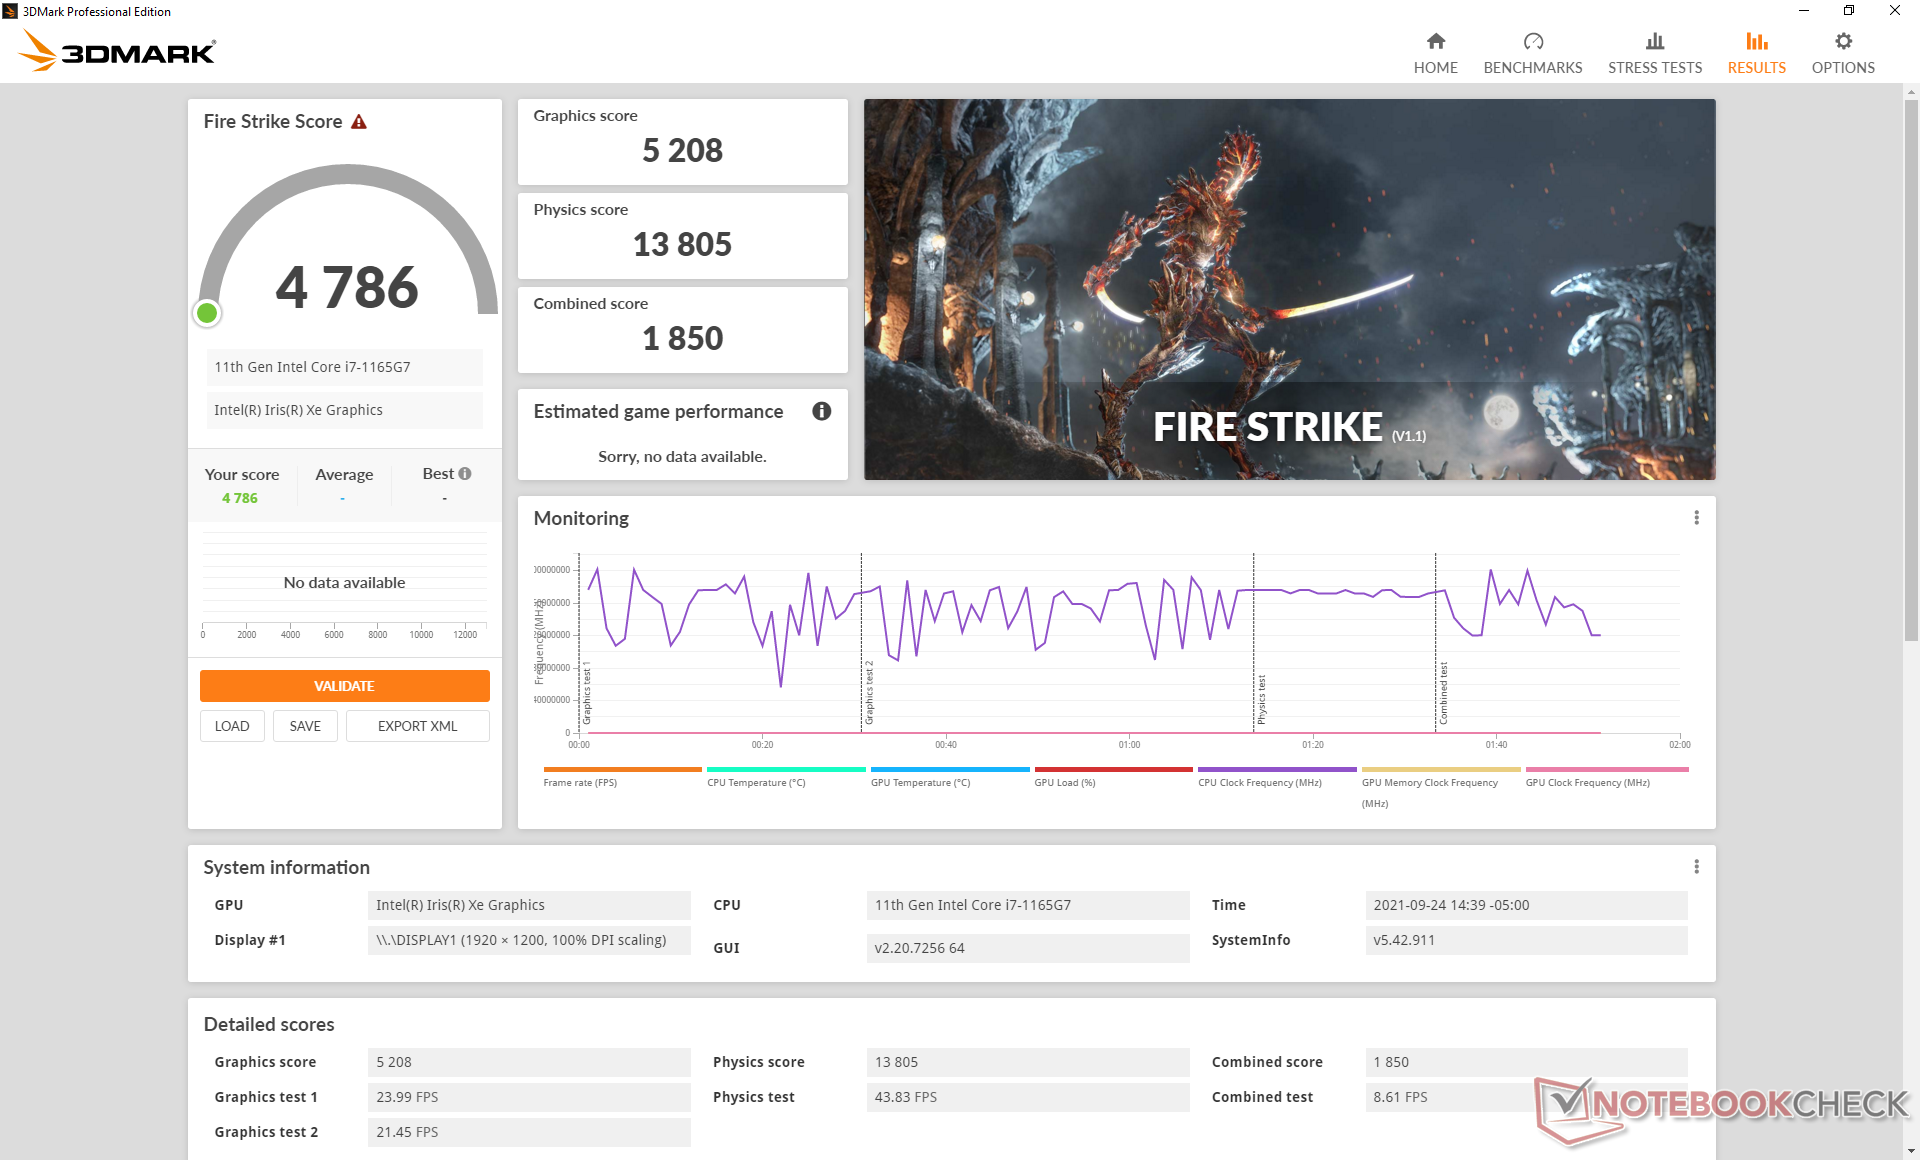
| 3DMark Fire Strike Score | 4786 Punkte | |
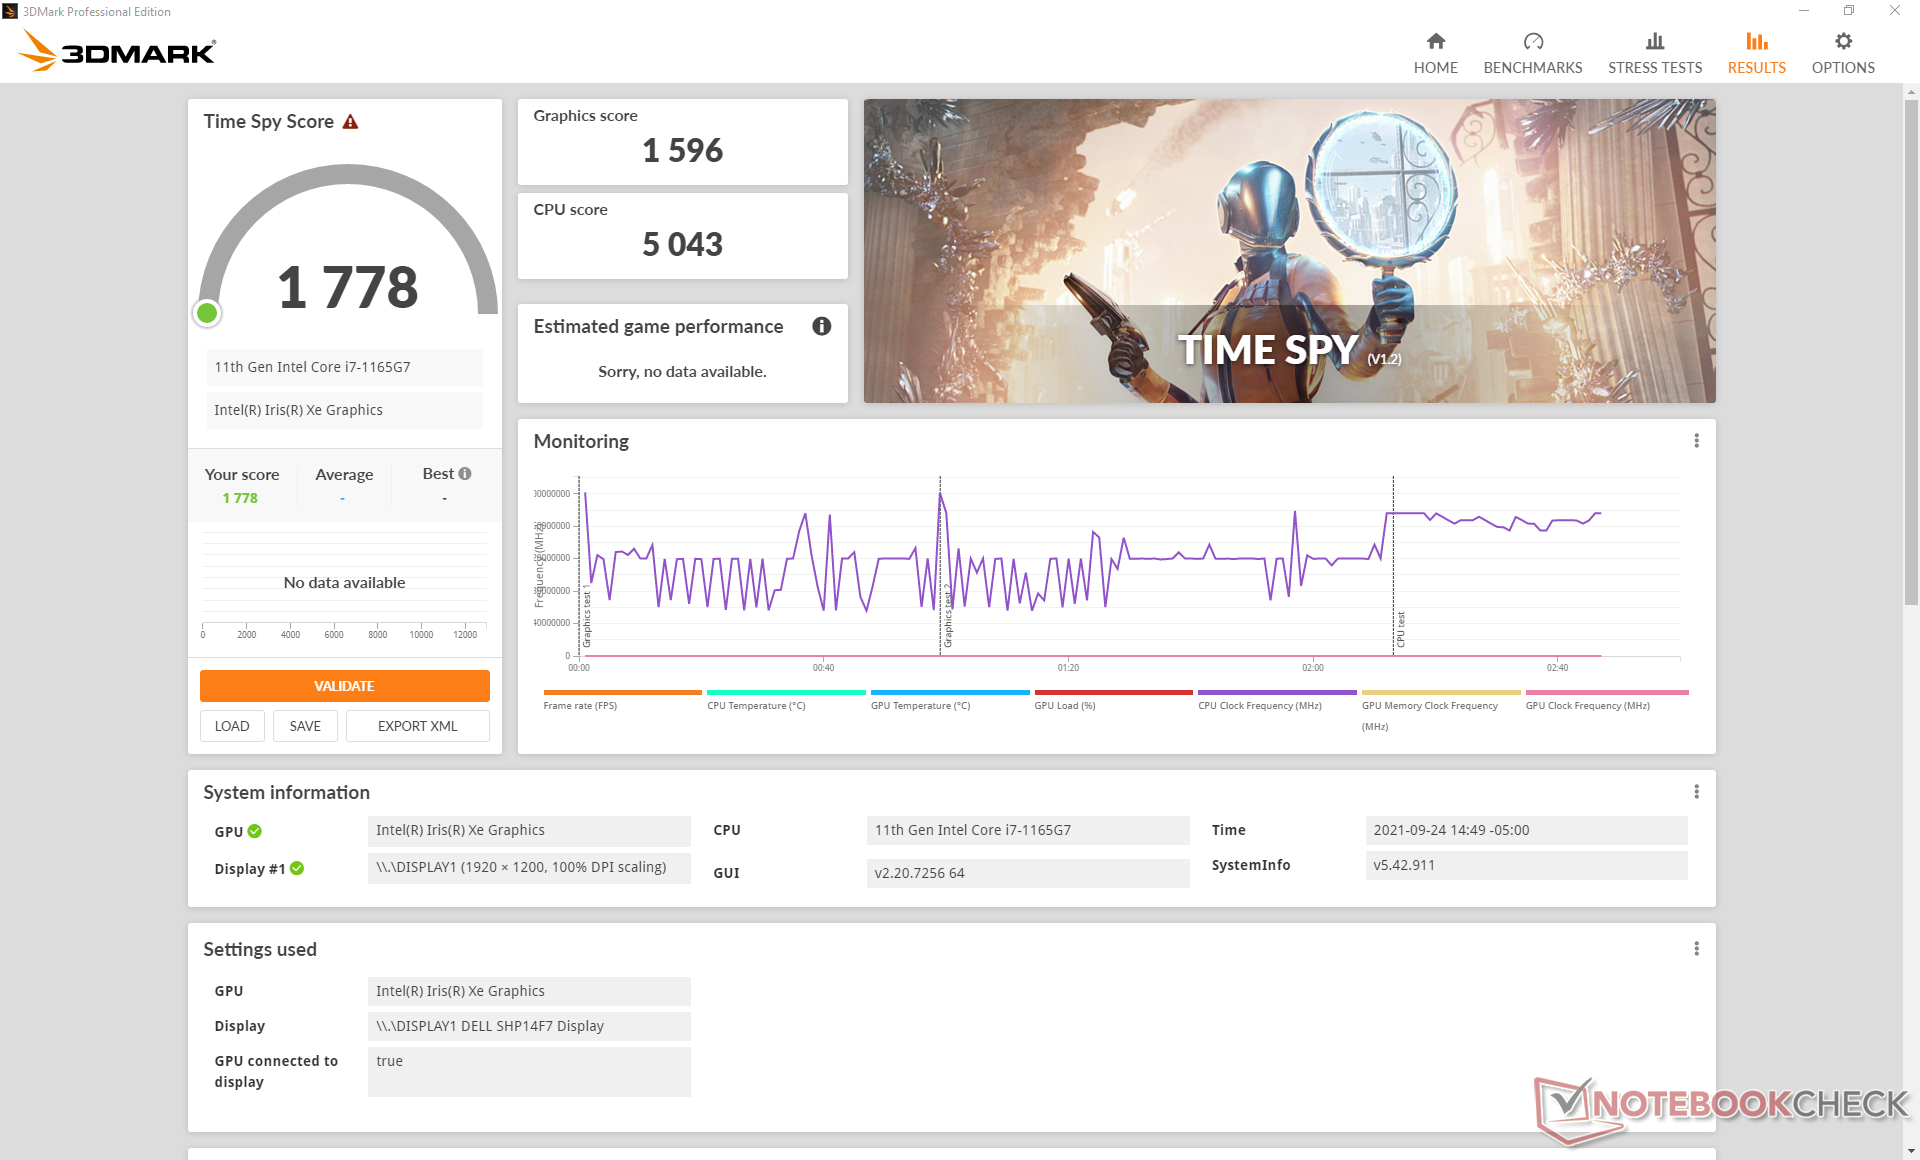
| 3DMark Time Spy Score | 1778 Punkte | |
Hilfe | ||
| Final Fantasy XV Benchmark | |
| 1280x720 Lite Quality | |
| Durchschnittliche Intel Iris Xe Graphics G7 96EUs (14.9 - 56.5, n=189) | |
| HP Spectre x360 13-aw2003dx | |
| Lenovo Yoga Slim 7-14ARE | |
| Dell XPS 13 9310 2-in-1 | |
| Dell XPS 13 9310 OLED | |
| Asus ZenBook 13 OLED UM325UA | |
| Lenovo Yoga 6 13 82ND0009US | |
| Asus Zenbook S UX393JA | |
| Asus VivoBook S13 S333JA-DS51 | |
| 1920x1080 Standard Quality | |
| Durchschnittliche Intel Iris Xe Graphics G7 96EUs (10.5 - 31.2, n=185) | |
| Dell XPS 13 9310 2-in-1 | |
| HP Spectre x360 13-aw2003dx | |
| Dell XPS 13 9310 OLED | |
| Lenovo Yoga Slim 7-14ARE | |
| Asus ZenBook 13 OLED UM325UA | |
| Lenovo Yoga 6 13 82ND0009US | |
| Asus Zenbook S UX393JA | |
| Asus VivoBook S13 S333JA-DS51 | |
| 1920x1080 High Quality | |
| HP Spectre x360 13-aw2003dx | |
| Durchschnittliche Intel Iris Xe Graphics G7 96EUs (8.15 - 27.8, n=178) | |
| Dell XPS 13 9310 2-in-1 | |
| Dell XPS 13 9310 OLED | |
| Lenovo Yoga Slim 7-14ARE | |
| Asus ZenBook 13 OLED UM325UA | |
| Lenovo Yoga 6 13 82ND0009US | |
| Asus Zenbook S UX393JA | |
| Asus VivoBook S13 S333JA-DS51 | |
| X-Plane 11.11 | |
| 1280x720 low (fps_test=1) | |
| HP Envy 13-ba0001ng | |
| Lenovo Yoga Slim 7-14ARE | |
| Durchschnittliche Intel Iris Xe Graphics G7 96EUs (13.4 - 88.4, n=213) | |
| Asus Zenbook S UX393JA | |
| Asus ZenBook 13 OLED UM325UA | |
| Lenovo Yoga 6 13 82ND0009US | |
| Asus VivoBook S13 S333JA-DS51 | |
| Dell XPS 13 9310 OLED | |
| HP Spectre x360 13-aw2003dx | |
| Dell XPS 13 9310 2-in-1 | |
| 1920x1080 med (fps_test=2) | |
| HP Envy 13-ba0001ng | |
| Dell XPS 13 9310 OLED | |
| Durchschnittliche Intel Iris Xe Graphics G7 96EUs (11.6 - 69.5, n=214) | |
| Lenovo Yoga Slim 7-14ARE | |
| HP Spectre x360 13-aw2003dx | |
| Dell XPS 13 9310 2-in-1 | |
| Asus ZenBook 13 OLED UM325UA | |
| Lenovo Yoga 6 13 82ND0009US | |
| Asus Zenbook S UX393JA | |
| Asus VivoBook S13 S333JA-DS51 | |
| 1920x1080 high (fps_test=3) | |
| HP Envy 13-ba0001ng | |
| Durchschnittliche Intel Iris Xe Graphics G7 96EUs (11.1 - 59.8, n=213) | |
| Dell XPS 13 9310 2-in-1 | |
| Lenovo Yoga Slim 7-14ARE | |
| Dell XPS 13 9310 OLED | |
| Asus ZenBook 13 OLED UM325UA | |
| Lenovo Yoga 6 13 82ND0009US | |
| HP Spectre x360 13-aw2003dx | |
| Asus Zenbook S UX393JA | |
| Asus VivoBook S13 S333JA-DS51 | |
| Strange Brigade | |
| 1280x720 lowest AF:1 | |
| Dell XPS 13 9310 OLED | |
| Durchschnittliche Intel Iris Xe Graphics G7 96EUs (48.5 - 115.1, n=172) | |
| Lenovo Yoga Slim 7-14ARE | |
| Dell XPS 13 9310 2-in-1 | |
| Lenovo Yoga 6 13 82ND0009US | |
| Asus Zenbook S UX393JA | |
| 1920x1080 medium AA:medium AF:4 | |
| Dell XPS 13 9310 2-in-1 | |
| Durchschnittliche Intel Iris Xe Graphics G7 96EUs (18.2 - 51.4, n=170) | |
| Dell XPS 13 9310 OLED | |
| Lenovo Yoga Slim 7-14ARE | |
| Lenovo Yoga 6 13 82ND0009US | |
| Asus Zenbook S UX393JA | |
| 1920x1080 high AA:high AF:8 | |
| Dell XPS 13 9310 OLED | |
| Dell XPS 13 9310 2-in-1 | |
| Durchschnittliche Intel Iris Xe Graphics G7 96EUs (15.4 - 39.8, n=169) | |
| Lenovo Yoga Slim 7-14ARE | |
| Lenovo Yoga 6 13 82ND0009US | |
| Asus Zenbook S UX393JA | |
| 1920x1080 ultra AA:ultra AF:16 | |
| Dell XPS 13 9310 2-in-1 | |
| Durchschnittliche Intel Iris Xe Graphics G7 96EUs (13.2 - 31.7, n=167) | |
| Lenovo Yoga Slim 7-14ARE | |
| Dell XPS 13 9310 OLED | |
| Lenovo Yoga 6 13 82ND0009US | |
| Asus Zenbook S UX393JA | |
| Far Cry 5 | |
| 1280x720 Low Preset AA:T | |
| Dell XPS 13 9310 2-in-1 | |
| Durchschnittliche Intel Iris Xe Graphics G7 96EUs (23 - 75, n=93) | |
| 1920x1080 Low Preset AA:T | |
| Durchschnittliche Intel Iris Xe Graphics G7 96EUs (15 - 48, n=41) | |
| Dell XPS 13 9310 2-in-1 | |
| 1920x1080 Medium Preset AA:T | |
| Durchschnittliche Intel Iris Xe Graphics G7 96EUs (14 - 39, n=91) | |
| Dell XPS 13 9310 2-in-1 | |
| 1920x1080 High Preset AA:T | |
| Durchschnittliche Intel Iris Xe Graphics G7 96EUs (10 - 35, n=89) | |
| Dell XPS 13 9310 2-in-1 | |
| 1920x1080 Ultra Preset AA:T | |
| Durchschnittliche Intel Iris Xe Graphics G7 96EUs (11 - 33, n=75) | |
| Dell XPS 13 9310 2-in-1 | |
Witcher 3 FPS-Tabelle
| min. | mittel | hoch | max. | |
|---|---|---|---|---|
| GTA V (2015) | 96.7 | 80.5 | 25.4 | 10 |
| The Witcher 3 (2015) | 86.2 | 54.3 | 29.9 | 14.7 |
| Dota 2 Reborn (2015) | 109 | 61.4 | 52.8 | 52.8 |
| Final Fantasy XV Benchmark (2018) | 36.8 | 21.8 | 15.9 | |
| X-Plane 11.11 (2018) | 23.5 | 31.9 | 31.3 | |
| Far Cry 5 (2018) | 49 | 23 | 22 | 22 |
| Strange Brigade (2018) | 78.1 | 36.8 | 29.4 | 24 |
Emissionen
Geräuschemissionen — In den meisten Szenarien mit niedriger bis mittlerer Last leise
Das Lüfterverhalten hat sich im Vergleich zum XPS 13 7390 2-in-1 kaum verändert. Der größte Unterschied liegt darin, dass das Lüftergeräusch bei höheren Lasten wie 3DMark 06 früher hochschaltet, was möglicherweise auf den höheren Turbo Boost und das höhere PL2-Limit von Tiger-Lake-U zurückzuführen ist. Ansonsten können Nutzer bei starker Last ein Lüftergeräusch zwischen 38 und 43 dB(A) und beim Streamen von Videos und Surfen im Web ein Geräusch von bis zu 27,2 dB(A) erwarten. Das Hintergrundgeräusch lag bei 24,3 dB(A). Das neue Galaxy Book Pro 360 erreicht hier ähnliche Werte.
| Dell XPS 13 9310 2-in-1 Iris Xe G7 96EUs, i7-1165G7, Toshiba BG4 KBG40ZPZ512G | Dell XPS 13 9310 Core i7 FHD Iris Xe G7 96EUs, i7-1165G7, Micron 2300 512GB MTFDHBA512TDV | Dell XPS 13 7390 2-in-1 Core i7 Iris Plus Graphics G7 (Ice Lake 64 EU), i7-1065G7, Toshiba BG4 KBG40ZPZ512G | Lenovo Yoga 6 13 82ND0009US Vega 7, R5 5500U, WDC PC SN530 SDBPMPZ-265G | Asus ZenBook Flip 13 UX363EA-HP069T Iris Xe G7 96EUs, i7-1165G7, WDC PC SN730 SDBPNTY-1T00 | Samsung Galaxy Book Pro 360 13 Iris Xe G7 80EUs, i5-1135G7, Samsung PM991 MZVLQ256HAJD | |
|---|---|---|---|---|---|---|
| Geräuschentwicklung | 4% | -8% | -1% | -12% | -7% | |
| aus / Umgebung * (dB) | 24.3 | 25.7 -6% | 28.1 -16% | 25.1 -3% | 27 -11% | 27 -11% |
| Idle min * (dB) | 24.8 | 25.7 -4% | 28.1 -13% | 25.1 -1% | 27 -9% | 27 -9% |
| Idle avg * (dB) | 24.8 | 25.7 -4% | 28.1 -13% | 25.1 -1% | 27 -9% | 27 -9% |
| Idle max * (dB) | 24.8 | 25.9 -4% | 28.1 -13% | 25.1 -1% | 27 -9% | 27 -9% |
| Last avg * (dB) | 38 | 26.2 31% | 31.7 17% | 41 -8% | 46 -21% | 40.7 -7% |
| Witcher 3 ultra * (dB) | 38 | 36.5 4% | 43.4 -14% | 38.6 -2% | ||
| Last max * (dB) | 41.5 | 36.6 12% | 43.4 -5% | 38.7 7% | 46.6 -12% | 40.7 2% |
* ... kleinere Werte sind besser
Lautstärkediagramm
| Idle |
| 24.8 / 24.8 / 24.8 dB(A) |
| Last |
| 38 / 41.5 dB(A) |
 | ||
30 dB leise 40 dB(A) deutlich hörbar 50 dB(A) störend |
||
min: | ||
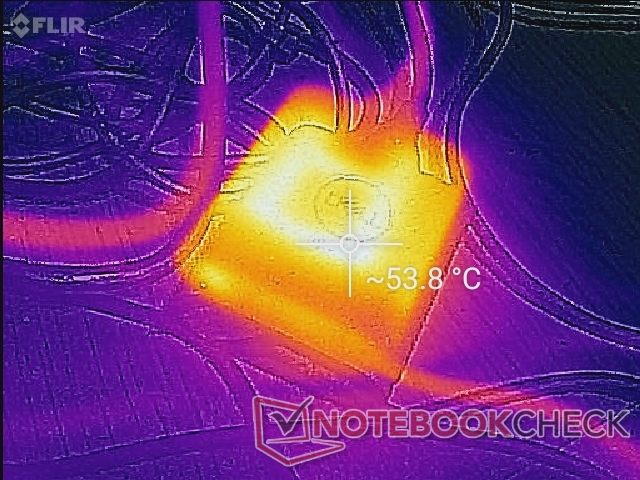
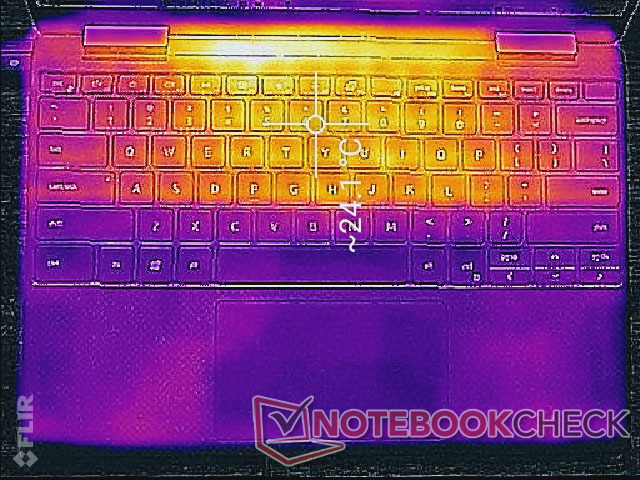
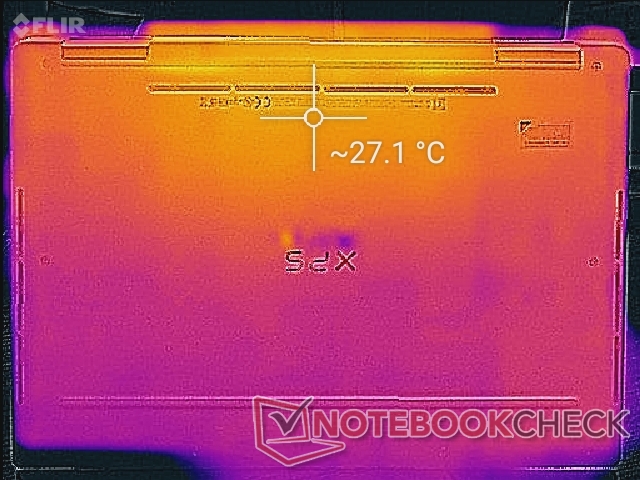
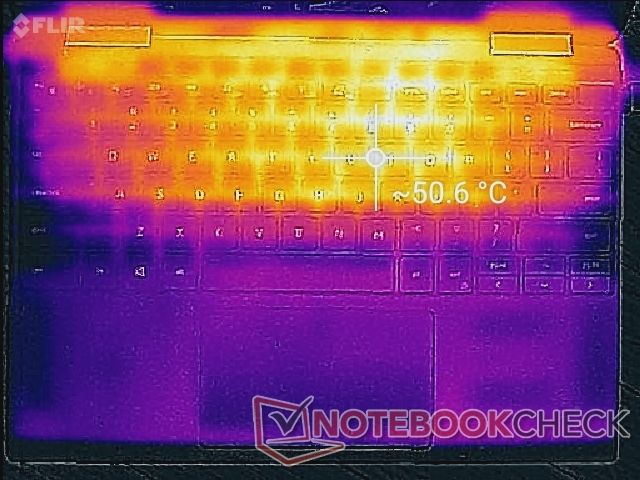
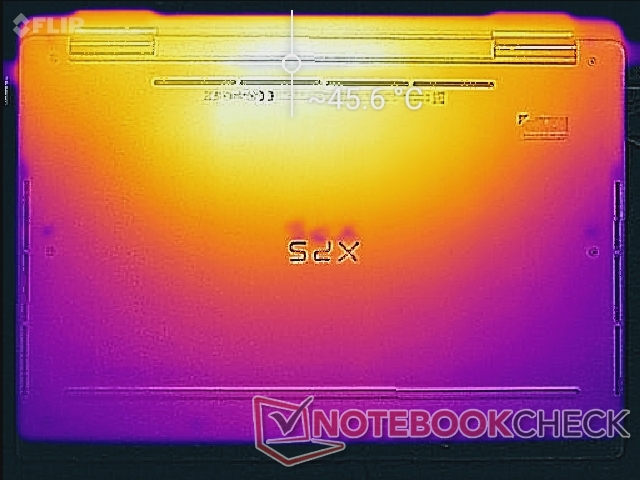
Temperatur — Relativ kühle Handballenablage
Auch die Oberflächentemperatur hat sich im Vergleich zum Ice-Lake-XPS-13-7390-2-in-1 nicht verändert. Die Hotspots liegen bei 50 °C oben und 57 °C unten. Die Tastatur ist weiterhin wärmer als bei vielen anderen Subnotebooks, wie etwa dem neuen Samsung Galaxy Book Pro 360.
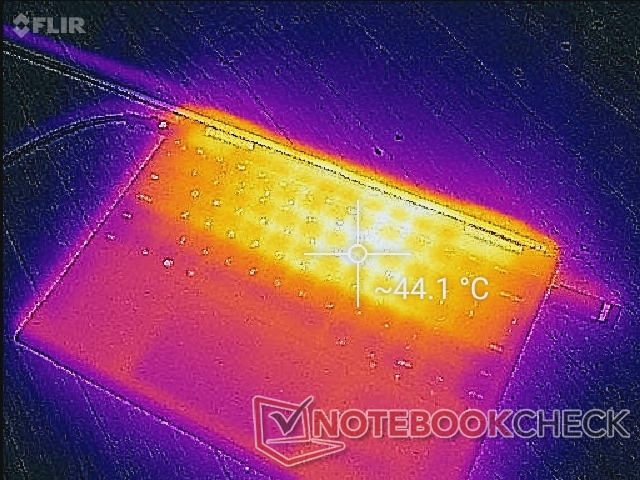
(-) Die maximale Temperatur auf der Oberseite ist 51 °C. Im Vergleich liegt der Klassendurchschnitt bei 35.4 °C (von 19.6 bis 60 °C für die Klasse Convertible).
(-) Auf der Unterseite messen wir eine maximalen Wert von 45.4 °C (im Vergleich zum Durchschnitt von 36.9 °C).
(+) Ohne Last messen wir eine durchschnittliche Temperatur von 22.9 °C auf der Oberseite. Der Klassendurchschnitt erreicht 30.3 °C.
(+) Die Handballen und der Touchpad-Bereich sind mit gemessenen 30.6 °C kühler als die typische Hauttemperatur und fühlen sich dadurch kühl an.
(-) Die durchschnittliche Handballen-Temperatur anderer getesteter Geräte war 28 °C (-2.6 °C).
Stresstest — Schwankende Takt- und Frameraten
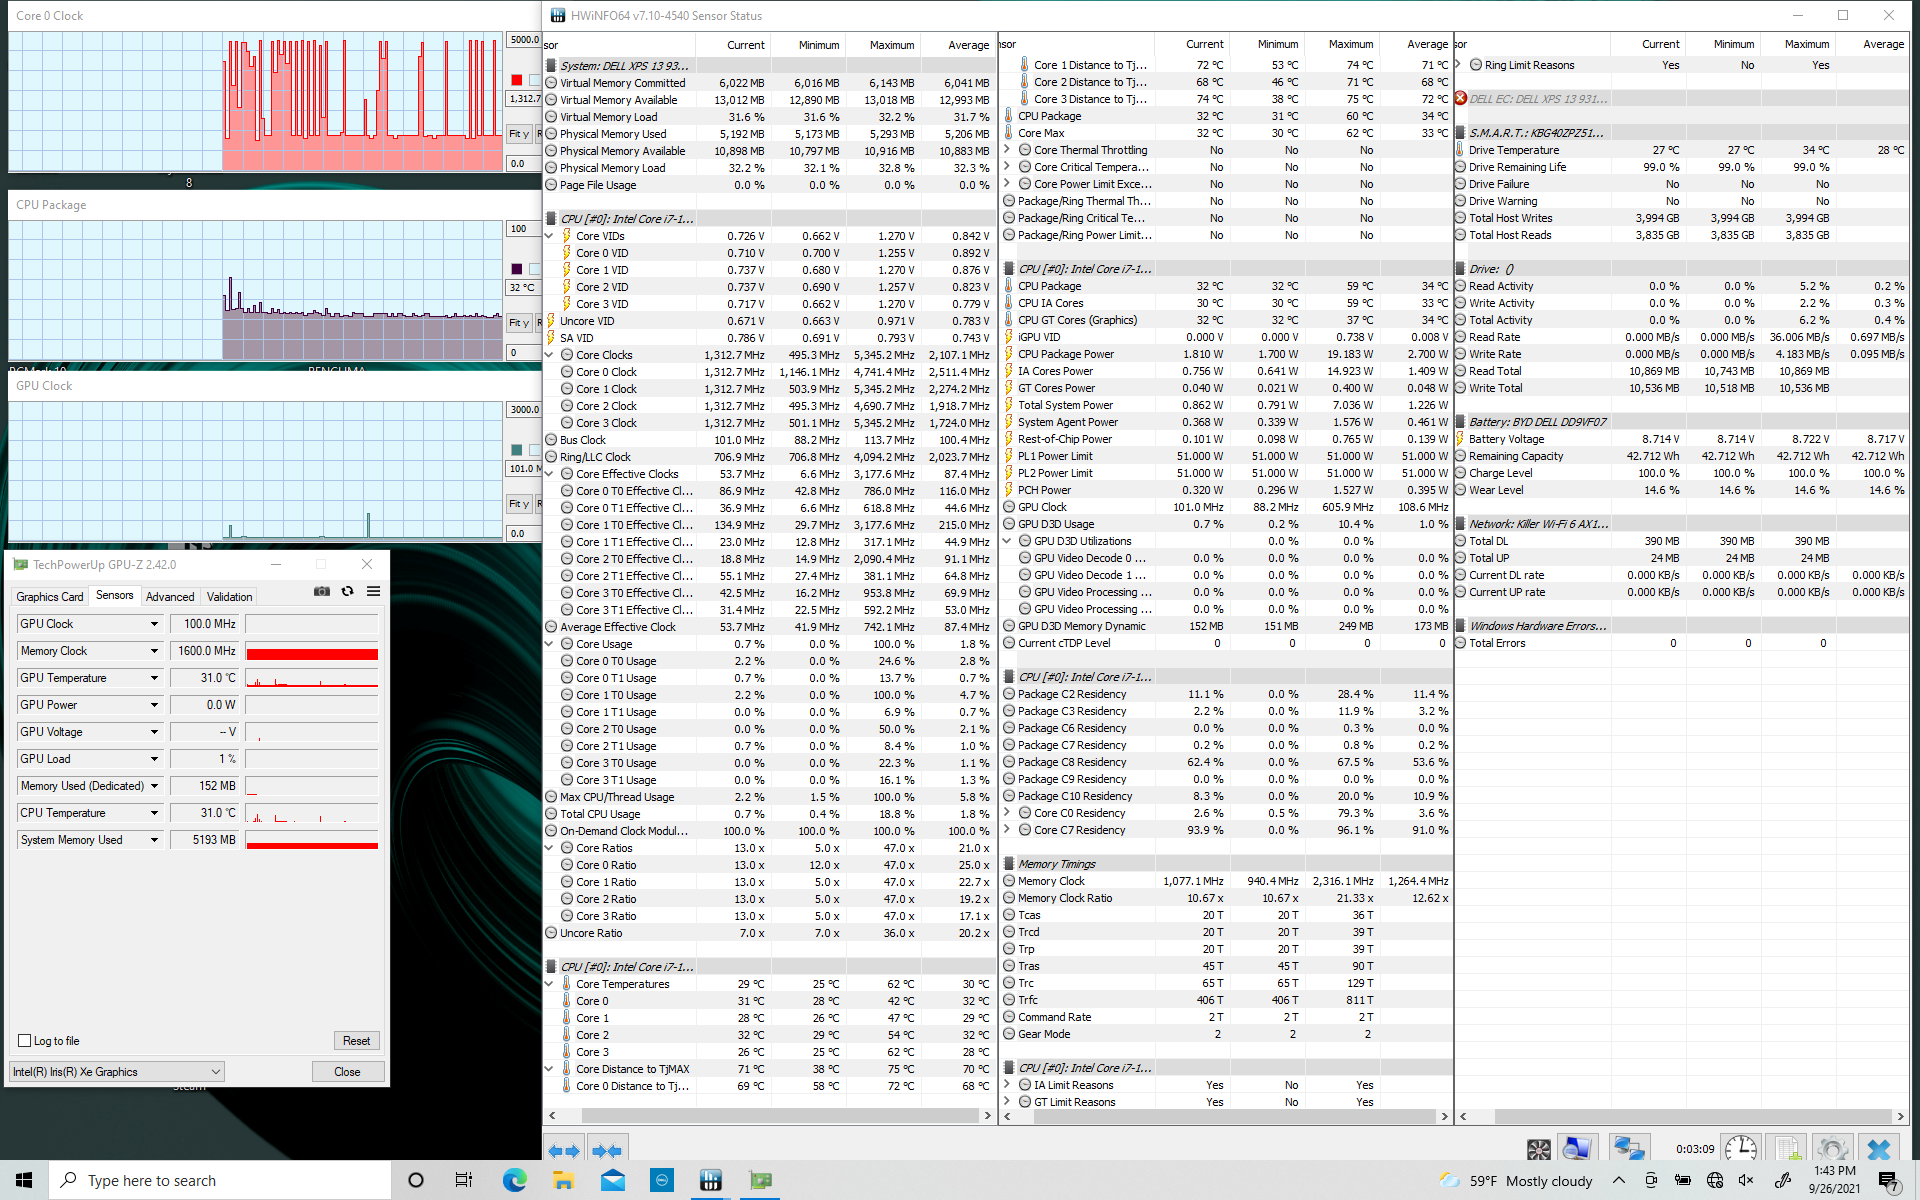
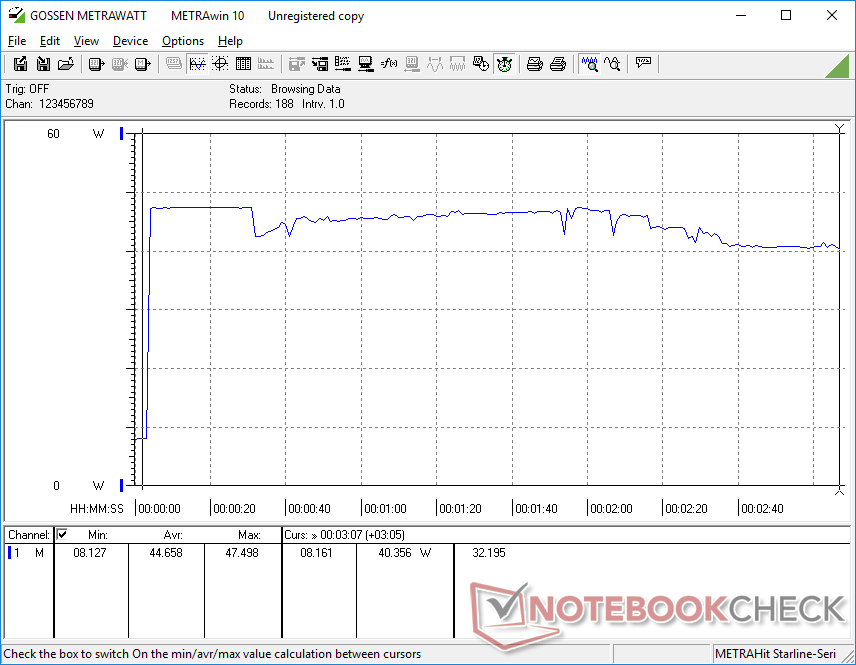
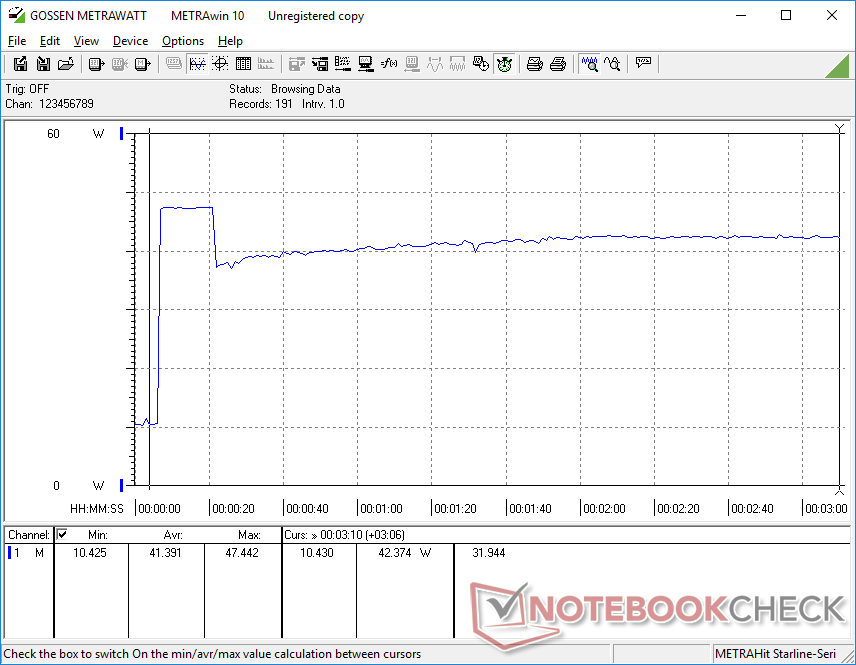
Im Stresstest mit Prime95 steigt die Taktrate und Temperatur der CPU auf 2,9 GHz bzw. 100°C und bleibt die ersten paar Minuten lang stabil. Danach fällt die Taktrate und Temperatur ab und stabilisiert sich bei 1,8-2,2 GHz bzw. 66-75 °C – selbst im Ultra-Performance-Modus. Im Vergleich dazu erreichte das Ice-Lake-XPS-13-7390-2-in-1 höhere stabile Taktraten und Temperaturen. Es scheint daher als würde das neuere XPS 13 9310 2-in-1 auf niedrigere Kerntemperaturen abzielen, auch wenn dafür eine mögliche höhere Turbo-Boost-Leistung eingebüßt werden muss. Die schwankende Taktrate im Stresstest entspricht den schwankenden Benchmarkergebnissen des CineBench R15 Multi-Thread.
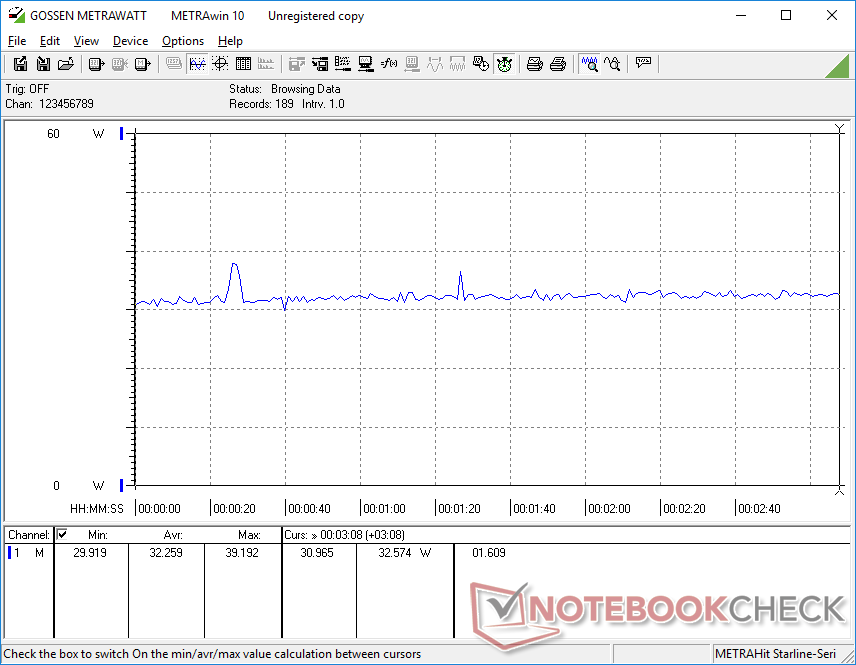
Die GPU-Taktrate schwankt unter Witcher 3 ebenfalls zwischen 800 und 1.280 MHz, was den oben beschriebenen schwankenden Frameraten entspricht. Leider gibt es beim XPS 13 keine Option für eine stabile Leistung, die manche Nutzer diesem Schwanken bevorzugen würden.
Im Akkumodus ist die Leistung des Geräts eingeschränkt. Hier ergibt der 3DMark 11 Physics- und Graphics-Ergebnisse von 9.805 bzw. 5.106 Punkten, während im Netzbetrieb 11.424 und 6.569 Punkte erreicht wurden.
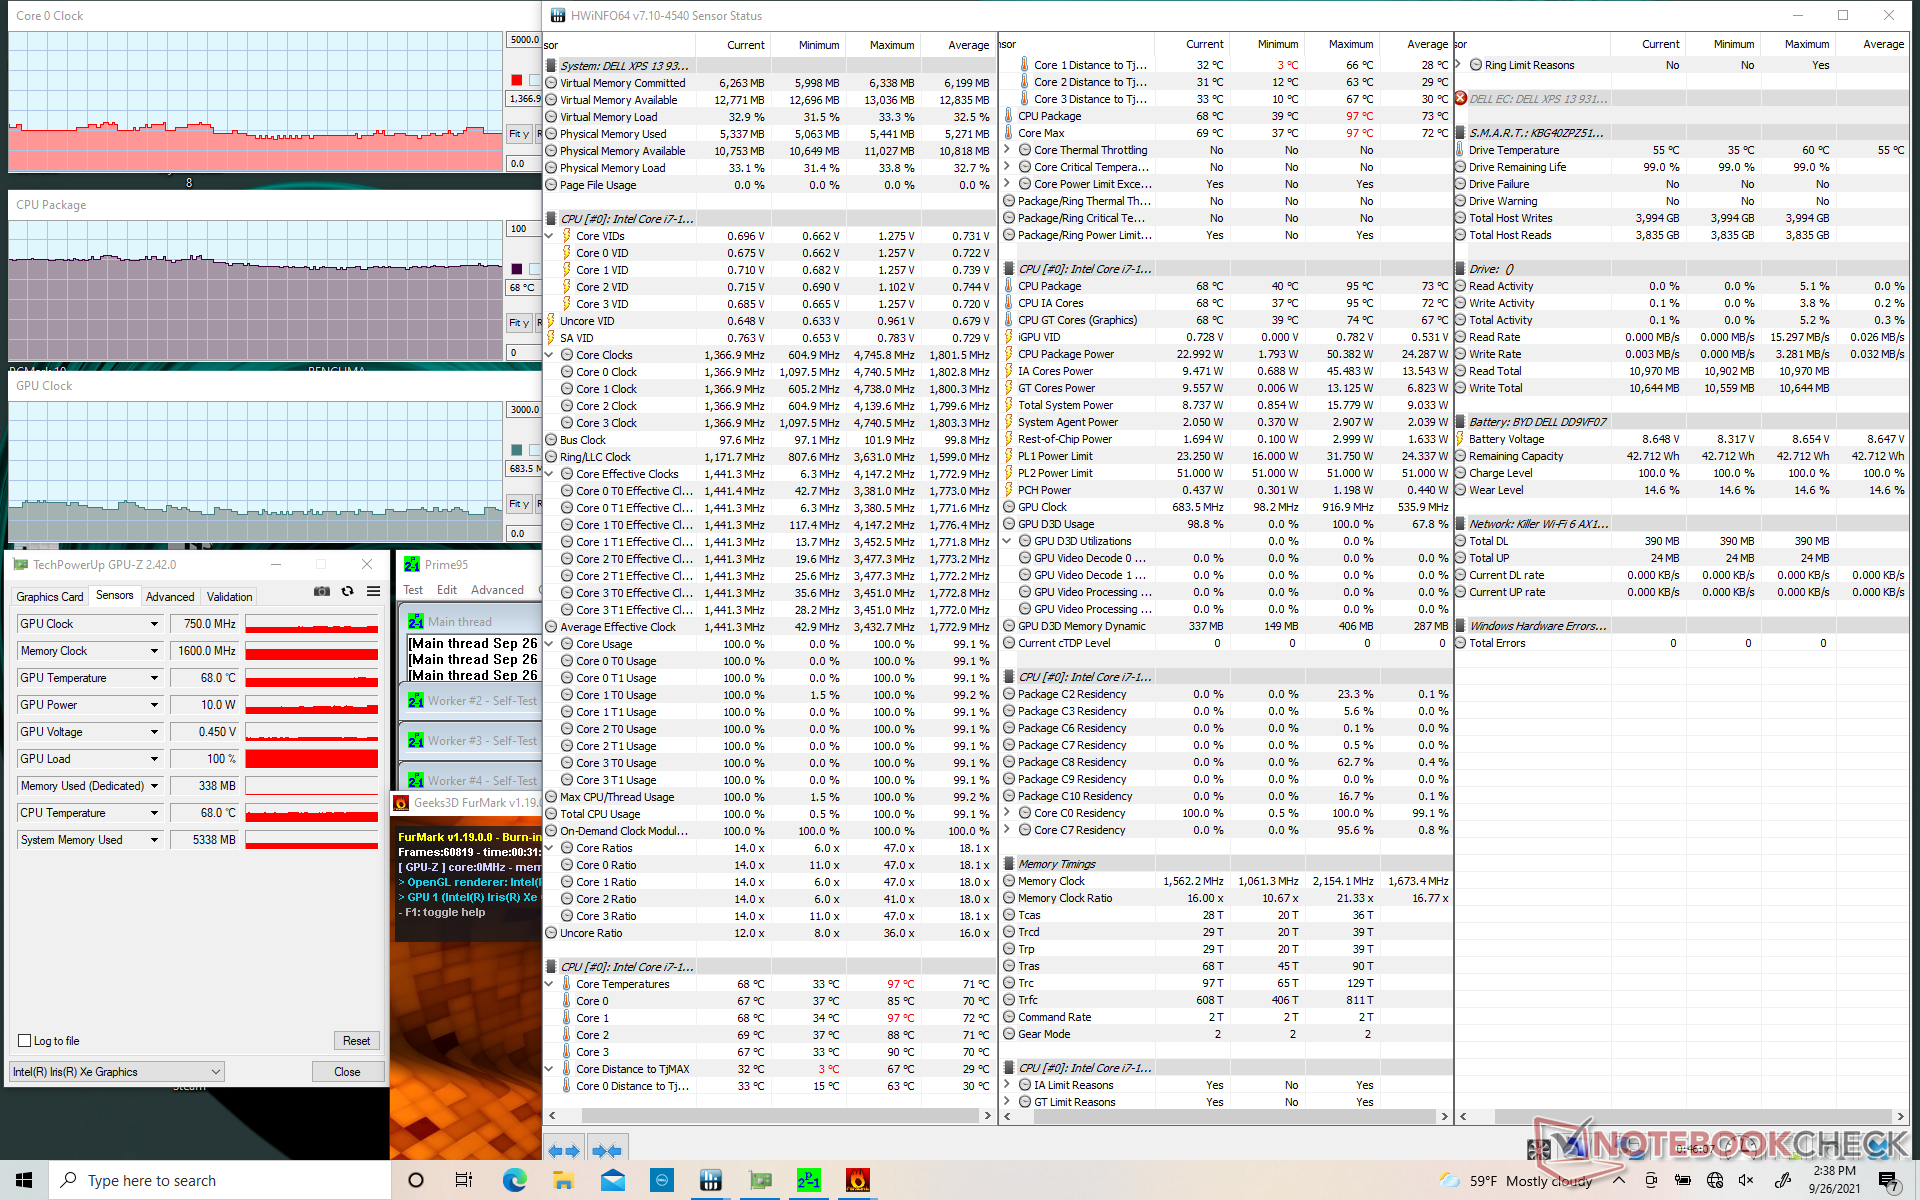

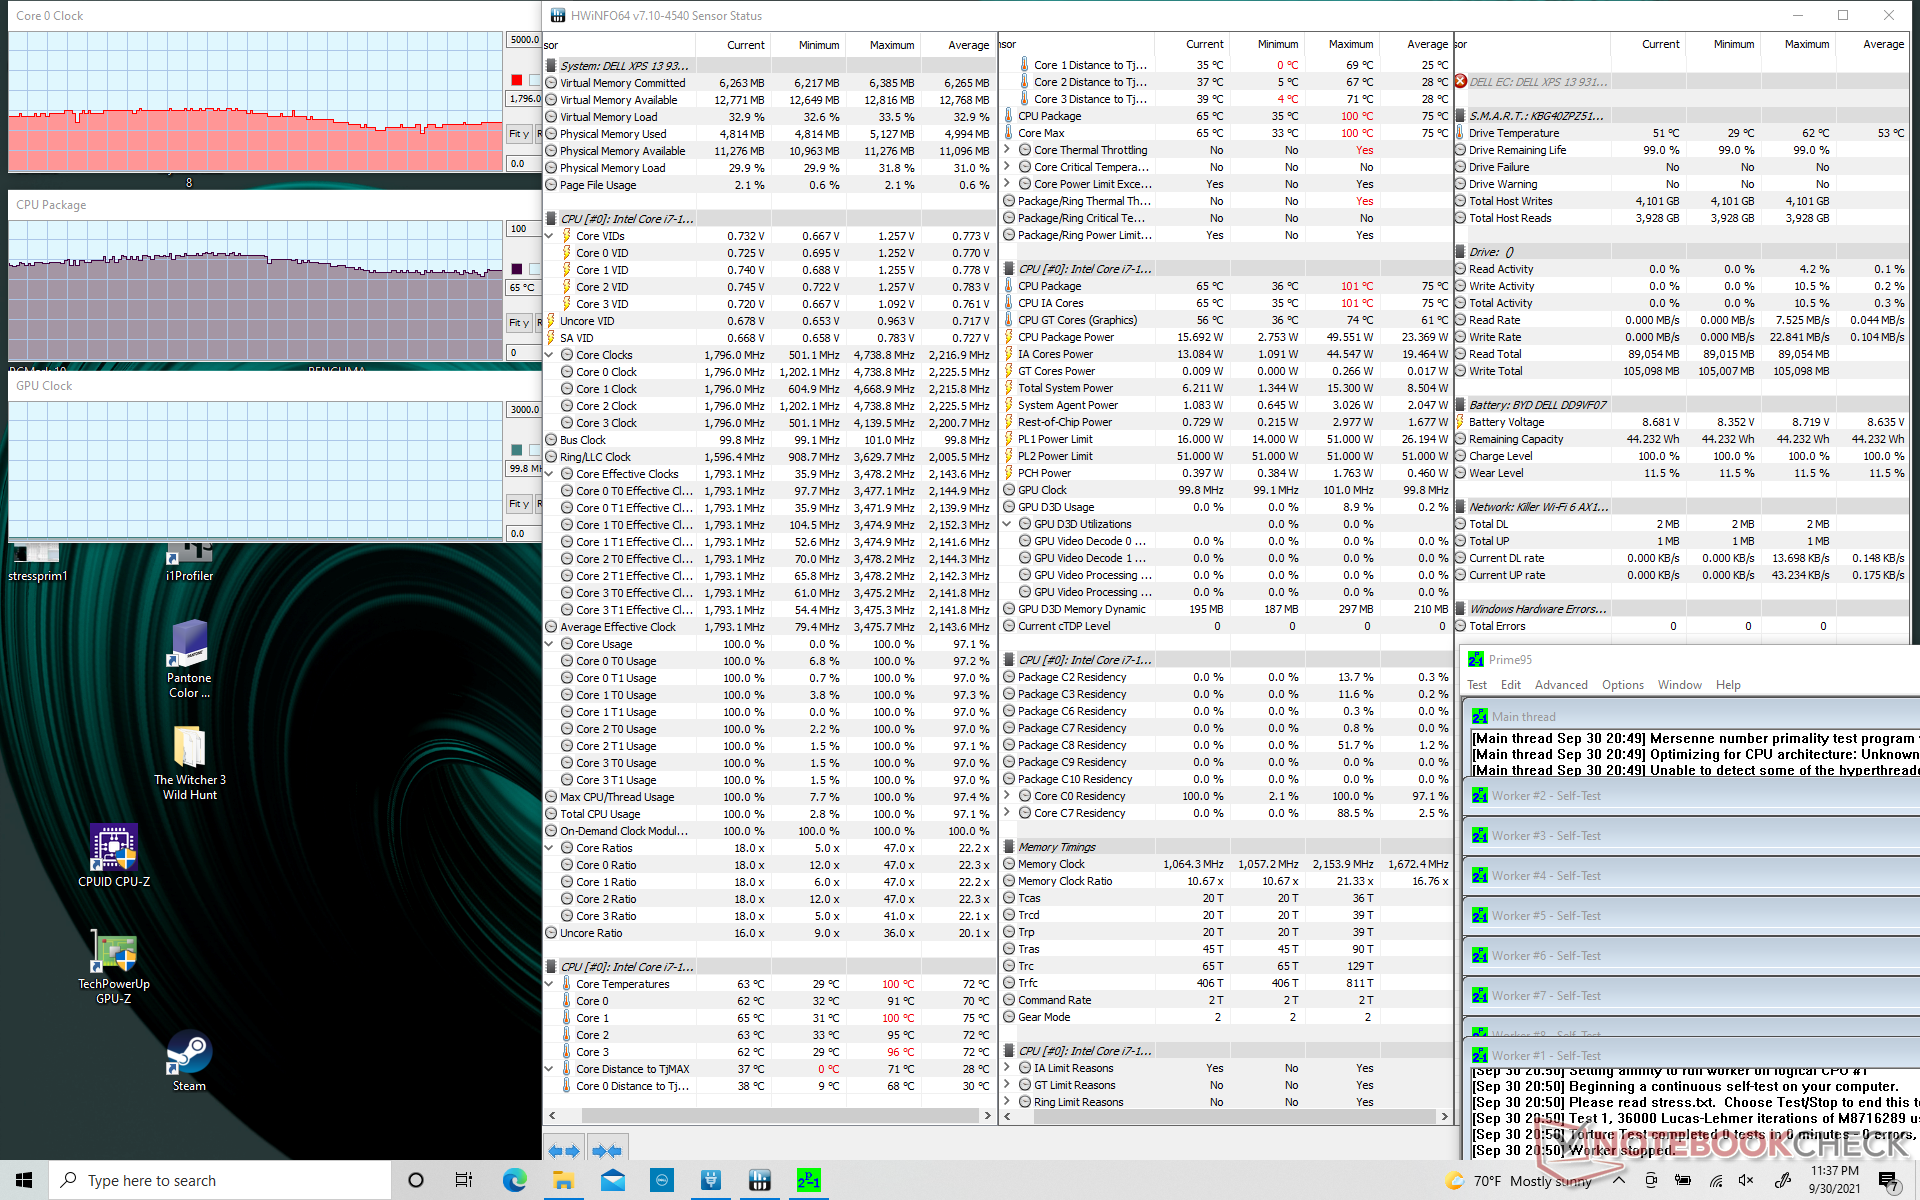
| CPU Clock (GHz) | GPU Clock (MHz) | Average CPU Temperature (°C) | |
| System Idle | -- | -- | 32 |
| Prime95 Stress | 1.8 - 2.2 | -- | 66 - 75 |
| Prime95 + FurMark Stress | 1.4 - 1.6 | ~650 - 750 | 68 |
| Witcher 3 Stress | ~0.6 - 1.4 | ~800 - 1280 | 71 |
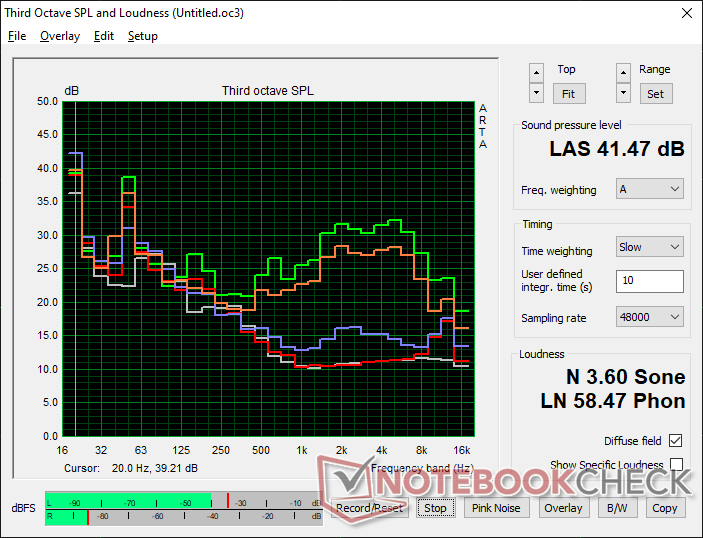
Lautsprecher

Dell XPS 13 9310 2-in-1 Audio Analyse
(±) | Mittelmäßig laut spielende Lautsprecher (80.7 dB)
Bass 100 - 315 Hz
(±) | abgesenkter Bass - 11.7% geringer als der Median
(±) | durchschnittlich lineare Bass-Wiedergabe (10.6% Delta zum Vorgänger)
Mitteltöne 400 - 2000 Hz
(±) | zu hohe Mitten, vom Median 6.1% abweichend
(+) | lineare Mitten (4.1% Delta zum Vorgänger)
Hochtöne 2 - 16 kHz
(+) | ausgeglichene Hochtöne, vom Median nur 1.4% abweichend
(+) | sehr lineare Hochtöne (3.6% Delta zum Vorgänger)
Gesamt im hörbaren Bereich 100 - 16.000 Hz
(+) | hörbarer Bereich ist sehr linear (12.7% Abstand zum Median
Im Vergleich zu allen Geräten derselben Klasse
» 16% aller getesteten Geräte dieser Klasse waren besser, 2% vergleichbar, 82% schlechter
» Das beste Gerät hat einen Delta-Wert von 6%, durchschnittlich ist 20%, das schlechteste Gerät hat 57%
Im Vergleich zu allen Geräten im Test
» 12% aller getesteten Geräte waren besser, 3% vergleichbar, 86% schlechter
» Das beste Gerät hat einen Delta-Wert von 4%, durchschnittlich ist 23%, das schlechteste Gerät hat 134%
Apple MacBook 12 (Early 2016) 1.1 GHz Audio Analyse
(+) | Die Lautsprecher können relativ laut spielen (83.6 dB)
Bass 100 - 315 Hz
(±) | abgesenkter Bass - 11.3% geringer als der Median
(±) | durchschnittlich lineare Bass-Wiedergabe (14.2% Delta zum Vorgänger)
Mitteltöne 400 - 2000 Hz
(+) | ausgeglichene Mitten, vom Median nur 2.4% abweichend
(+) | lineare Mitten (5.5% Delta zum Vorgänger)
Hochtöne 2 - 16 kHz
(+) | ausgeglichene Hochtöne, vom Median nur 2% abweichend
(+) | sehr lineare Hochtöne (4.5% Delta zum Vorgänger)
Gesamt im hörbaren Bereich 100 - 16.000 Hz
(+) | hörbarer Bereich ist sehr linear (10.2% Abstand zum Median
Im Vergleich zu allen Geräten derselben Klasse
» 7% aller getesteten Geräte dieser Klasse waren besser, 2% vergleichbar, 91% schlechter
» Das beste Gerät hat einen Delta-Wert von 5%, durchschnittlich ist 18%, das schlechteste Gerät hat 53%
Im Vergleich zu allen Geräten im Test
» 5% aller getesteten Geräte waren besser, 1% vergleichbar, 94% schlechter
» Das beste Gerät hat einen Delta-Wert von 4%, durchschnittlich ist 23%, das schlechteste Gerät hat 134%
Energieverwaltung
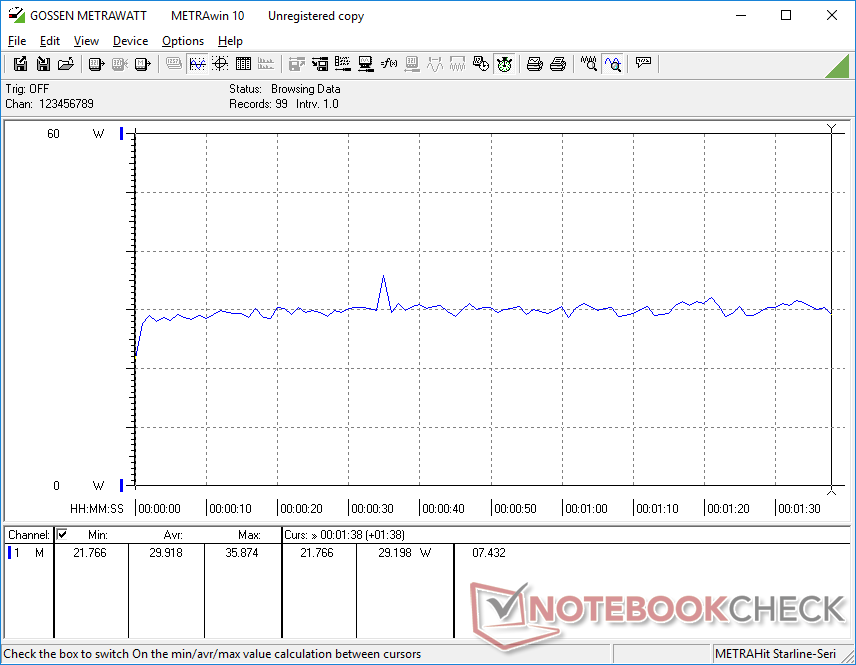
Energieaufnahme — Deutlich effizienter
Unser Testgerät nimmt trotz der deutlichen Leistungssteigerung beim Gamen weniger Energie auf als das ältere XPS 13 7390 2-in-1. Das illustriert den deutlichen Vorteil, den die Iris Xe im Bereich der Energieeffizienz und Leistung gegenüber der älteren Iris Plus G7 bieten kann.
| Aus / Standby | |
| Idle | |
| Last |
|
Legende:
min: | |
| Dell XPS 13 9310 2-in-1 i7-1165G7, Iris Xe G7 96EUs, Toshiba BG4 KBG40ZPZ512G, IPS, 1920x1200, 13.4" | Dell XPS 13 9310 Core i7 FHD i7-1165G7, Iris Xe G7 96EUs, Micron 2300 512GB MTFDHBA512TDV, IPS, 1920x1200, 13.4" | Dell XPS 13 7390 2-in-1 Core i7 i7-1065G7, Iris Plus Graphics G7 (Ice Lake 64 EU), Toshiba BG4 KBG40ZPZ512G, IPS, 1920x1200, 13.4" | Lenovo Yoga 6 13 82ND0009US R5 5500U, Vega 7, WDC PC SN530 SDBPMPZ-265G, IPS, 1920x1080, 13.3" | Asus ZenBook Flip 13 UX363EA-HP069T i7-1165G7, Iris Xe G7 96EUs, WDC PC SN730 SDBPNTY-1T00, OLED, 1920x1080, 13.3" | Samsung Galaxy Book Pro 360 13 i5-1135G7, Iris Xe G7 80EUs, Samsung PM991 MZVLQ256HAJD, AMOLED, 1920x1080, 13.2" | |
|---|---|---|---|---|---|---|
| Stromverbrauch | -11% | -9% | -20% | -11% | -22% | |
| Idle min * (Watt) | 2.6 | 3.9 -50% | 2.6 -0% | 5 -92% | 4.4 -69% | 5 -92% |
| Idle avg * (Watt) | 6.4 | 5.9 8% | 5.3 17% | 6.3 2% | 7.4 -16% | 6 6% |
| Idle max * (Watt) | 7.7 | 6.3 18% | 7 9% | 6.9 10% | 11.3 -47% | 11.7 -52% |
| Last avg * (Watt) | 29.9 | 39.7 -33% | 43.1 -44% | 41.5 -39% | 22 26% | 28 6% |
| Witcher 3 ultra * (Watt) | 32.2 | 34.8 -8% | 43.1 -34% | 33.2 -3% | 22.8 29% | 28.3 12% |
| Last max * (Watt) | 47.5 | 47.5 -0% | 49 -3% | 46.5 2% | 42.5 11% | 53 -12% |
* ... kleinere Werte sind besser
Energieaufnahme Witcher 3 / Stresstest
Akkulaufzeit — Laufzeit im zweistelligen Bereich
Die Laufzeit entspricht der des XPS 13 9310 Clamshell und ist etwa zwei Stunden länger als beim älteren XPS 13 7310 2-in-1. Mit einer realistischen WLAN-Laufzeit von 11 Stunden sollte der Akku groß genug sein, um den ganzen Tag im Einsatz zu sein.
Das vollständige Aufladen des leeren Akkus dauert 1,5 Stunden. Der 45-W-USB-C-Adapter kann auch zum Aufladen anderer Geräte verwendet werden.
| Dell XPS 13 9310 2-in-1 i7-1165G7, Iris Xe G7 96EUs, 51 Wh | Dell XPS 13 9310 Core i7 FHD i7-1165G7, Iris Xe G7 96EUs, 52 Wh | Dell XPS 13 7390 2-in-1 Core i7 i7-1065G7, Iris Plus Graphics G7 (Ice Lake 64 EU), 51 Wh | Lenovo Yoga 6 13 82ND0009US R5 5500U, Vega 7, 60 Wh | Asus ZenBook Flip 13 UX363EA-HP069T i7-1165G7, Iris Xe G7 96EUs, 67 Wh | Samsung Galaxy Book Pro 360 13 i5-1135G7, Iris Xe G7 80EUs, 63 Wh | |
|---|---|---|---|---|---|---|
| Akkulaufzeit | 5% | -16% | -16% | -6% | 12% | |
| Idle (h) | 25.4 | 30 18% | 17.5 -31% | 20.5 -19% | 31.3 23% | |
| WLAN (h) | 10.7 | 11 3% | 9 -16% | 13.2 23% | 10.7 0% | 12.1 13% |
| Last (h) | 3.4 | 3.2 -6% | 2 -41% | 3.4 0% | 3.4 0% |
Pro
Contra
Fazit — Schneller ohne zusätzliche Kosten
Das XPS 13 9310 2-in-1 bietet eine deutlich schnellere Grafikleistung als das XPS 13 7390 2-in-1. Außerdem benötigt das Modell dafür nicht mehr Energie als sein Vorgänger. Bessere Grafiken bei gleicher Akkulaufzeit, Oberflächentemperatur und Geräuschkulisse. Nutzern aus dem Bereich der Grafikbearbeitung bietet die neue Iris Xe im Vergleich zur älteren UHD Graphics oder der Iris Plus G7 aus dem Vorjahr einen deutlichen Vorteil.
Die Intel Iris Xe ist ein regelrechter Segen für die XPS-13-Serie. Doch die instabile CPU- und GPU-Taktrate könnte für einige Power-User ärgerlich sein.
Leider hat sich die Prozessorleistung im Vergleich zum Core i7 XPS 13 7390 2-in-1 kaum verbessert. Die Taktrate scheint bei unserem Core-i7-13-9310-2-in-1 noch stärker zu schwanken als im Vorgängermodell, und die fehlenden Displayoptionen können auch nicht gerade als Pluspunkt durchgehen. Insgesamt bietet das XPS 13 9310 2-in-1 für Privatnutzer im Vergleich zum XPS 13 7390 2-in-1 daher wenig bis keine Vorzüge – insbesondere, wenn man bedenkt, dass das Vorgängermodell jetzt deutlich billiger erhältlich ist.
Preis und Verfügbarkeit
Unsere Konfiguration des Dell XPS 13 9310 2-in-1 mit Core i7 ist direkt bei Dell.com sowie bei Cyberport erhältlich.
Dell XPS 13 9310 2-in-1
- 02.10.2021 v7 (old)
Allen Ngo
Preisvergleich

