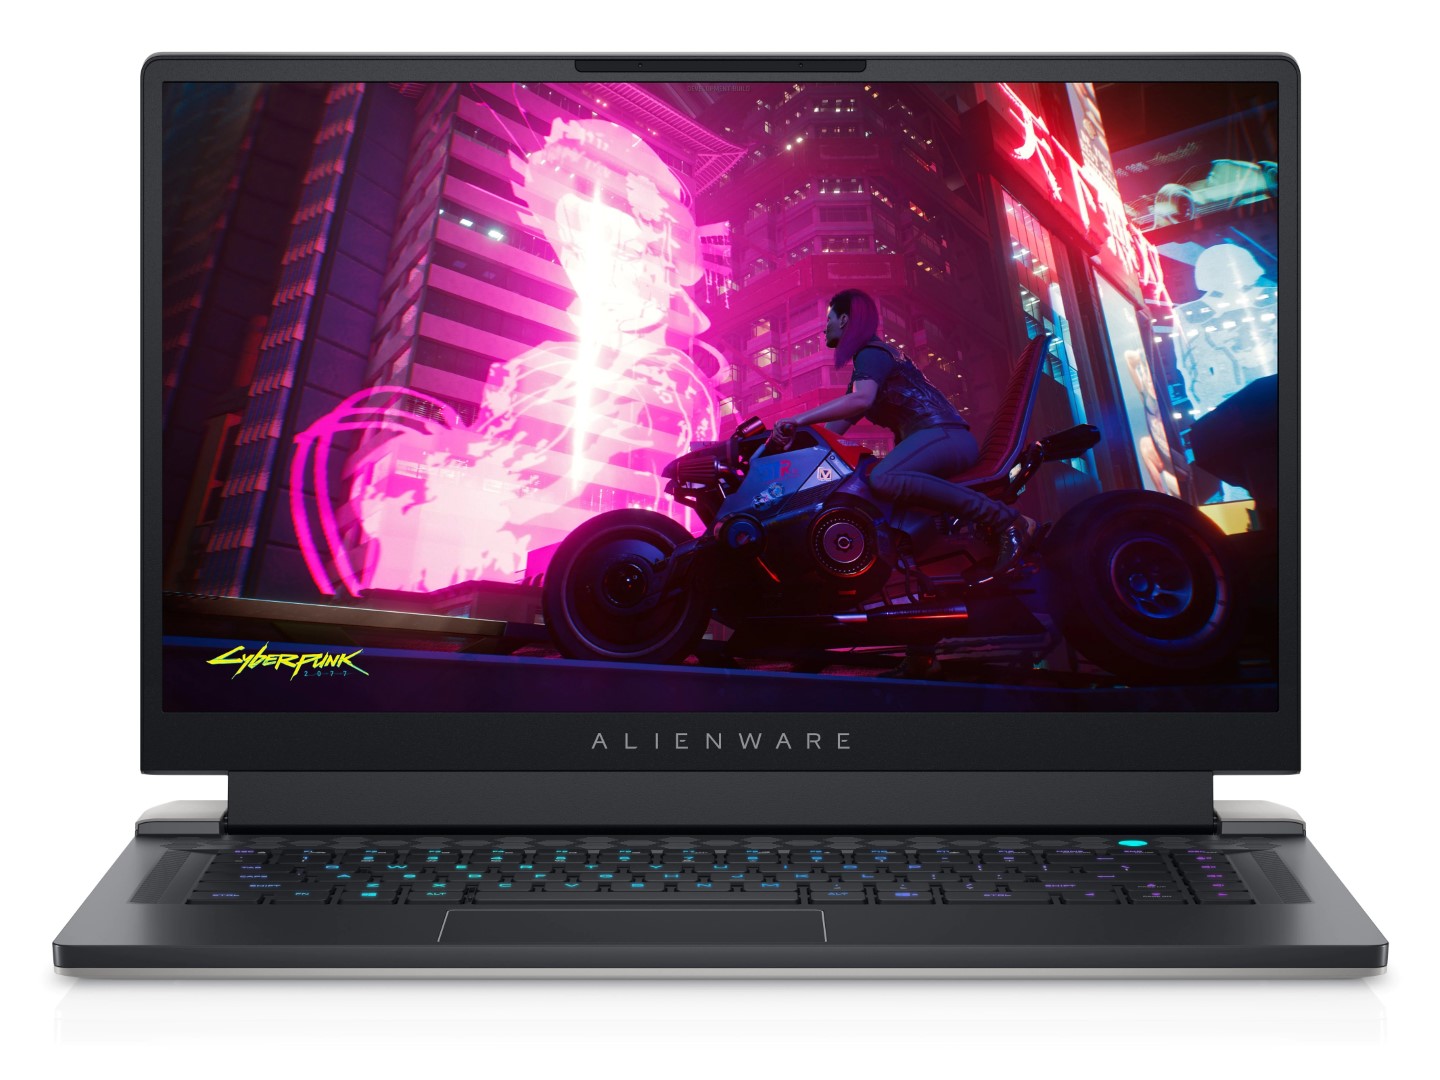
Alienware x15 R1 Laptop im Test: Dells dünnstes UFO ist gelandet
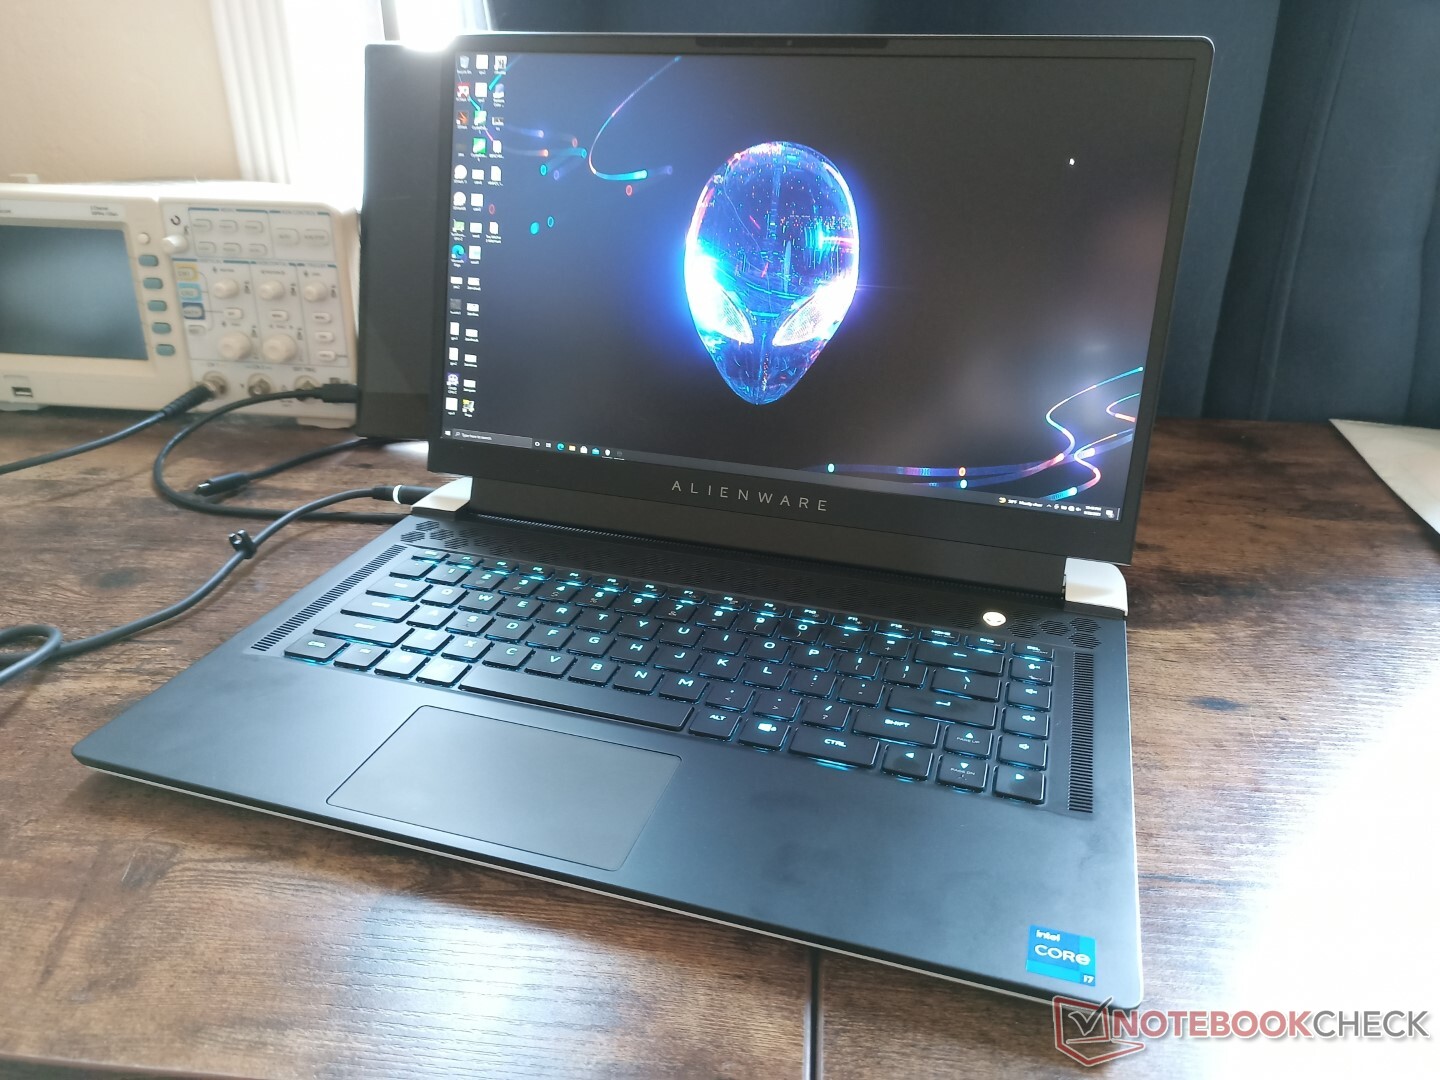
Mit dem Alienware x15 R1 bricht eine neue Ära von 15,6-Zoll-Alienware-Laptops an, welche die Zeit der älteren Alienware-m15-Reihe beendet. Beim aktuellen Modell wurde das "Legend"-Chassisdesign, das zuerst mit dem Alienware m15 R2 eingeführt wurde, von einer schlankeren, schickeren Optik abgelöst.
Derzeitige Modelle reichen von der Basiskonfiguration, die für ca. 2.200 Euro erhältlich und mit dem Intel Core i7-11800H, einer GeForce RTX 3060 und einem 165-Hz-FHD-Display ausgestattet ist, bis zur Topkonfiguration, die mit dem Core i9-11900H, einer GeForce RTX 3070 und einem 360-Hz-FHD-Display bzw. einem 240-Hz-QHD-Display daherkommt und ca. 3.000 Euro kostet. Dell hat für die kommenden Monate auch RTX-3080-Modelle geplant. Unsere Konfiguration liegt mit einem i7-11800H, einer RTX 3070 und einem 240-Hz-QHD-Display zum Preis von ca. 2.700 Euro zwischen der Basis- und der Spitzenkonfiguration.
Zur Konkurrenz des Alienware x15 R1 gehören andere, ultradünne 15,6-Zoll-Gaming-Laptops wie das Razer Blade 15, MSI GS66, Asus Zephyrus S15, Acer Predator Triton 700 und das Aorus 15G. Die größere 17,3-Zoll-Variante existiert in Form des Alienware x17 R1.
Weitere Dell-Tests:
Mögliche Konkurrenten im Vergleich
Bew. | Datum | Modell | Gewicht | Dicke | Größe | Auflösung | Preis ab |
|---|---|---|---|---|---|---|---|
| 87.2 % v7 (old) | 10 / 2021 | Alienware x15 RTX 3070 P111F i7-11800H, GeForce RTX 3070 Laptop GPU | 2.4 kg | 15.9 mm | 15.60" | 2560x1440 | |
| 86.1 % v7 (old) | 06 / 2021 | Alienware m15 R4 RTX 3080 i9-10980HK, GeForce RTX 3080 Laptop GPU | 2.4 kg | 20 mm | 15.60" | 1920x1080 | |
| 84 % v7 (old) | 02 / 2021 | MSI GS66 Stealth 10UG i7-10870H, GeForce RTX 3070 Laptop GPU | 2.1 kg | 19.8 mm | 15.60" | 1920x1080 | |
| 88.9 % v7 (old) | 07 / 2021 | Razer Blade 15 Advanced (Mid 2021) i7-11800H, GeForce RTX 3080 Laptop GPU | 2 kg | 16.99 mm | 15.60" | 1920x1080 | |
| 82.9 % v7 (old) | 09 / 2020 | Asus Zephyrus S15 GX502L i7-10875H, GeForce RTX 2070 Super Mobile | 2.1 kg | 19 mm | 15.60" | 1920x1080 | |
| 83.8 % v7 (old) | 07 / 2021 | Acer Predator Helios 300 PH315-53-786B i7-10750H, GeForce RTX 3070 Laptop GPU | 2.2 kg | 22.9 mm | 15.60" | 1920x1080 |
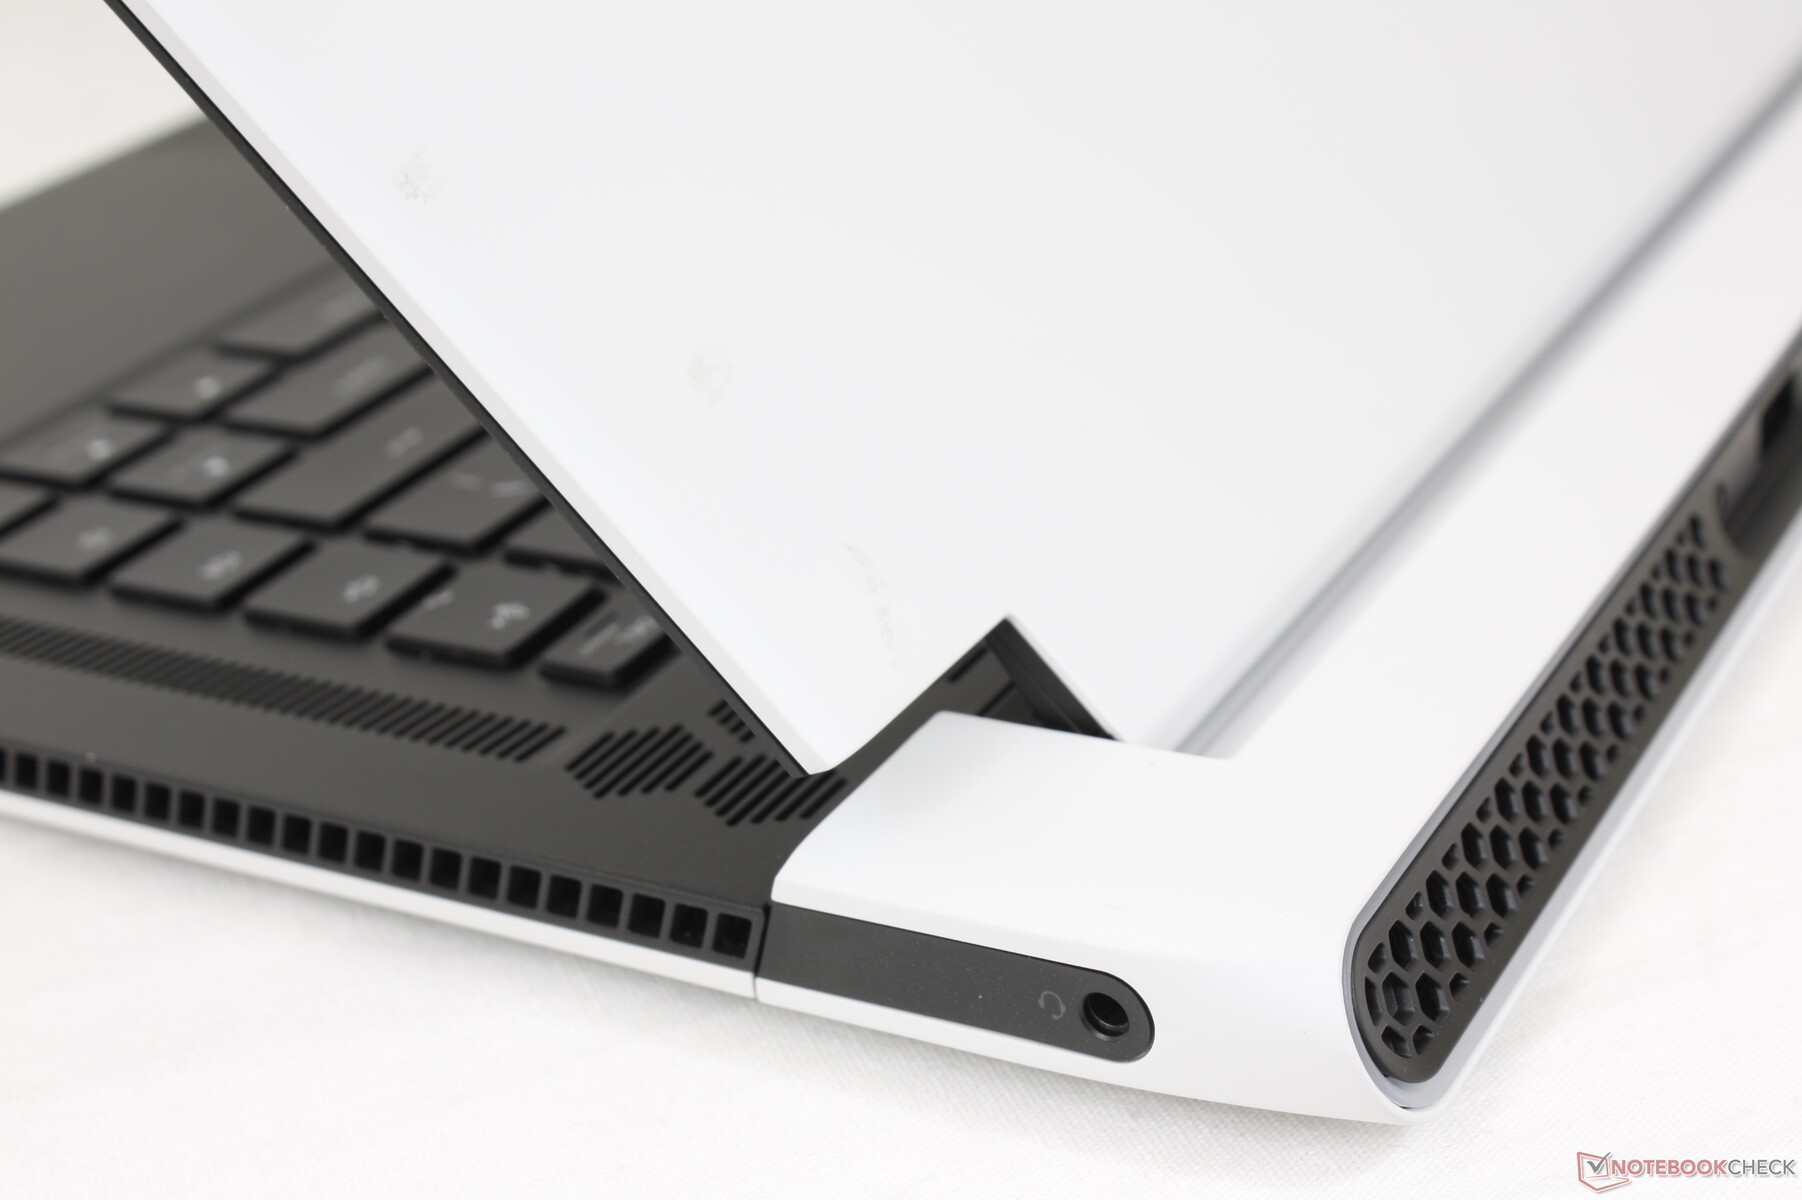
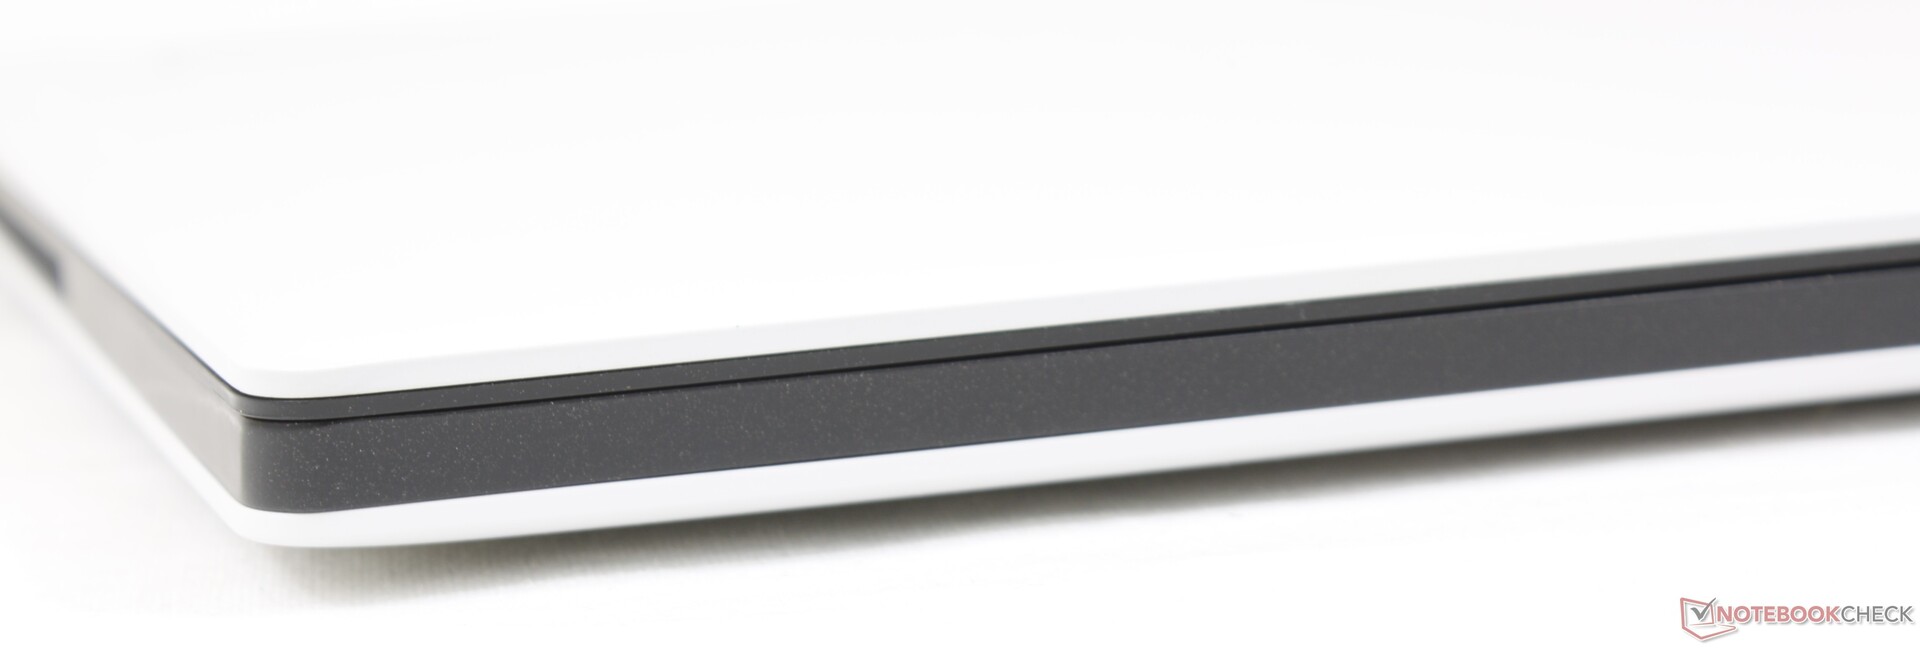
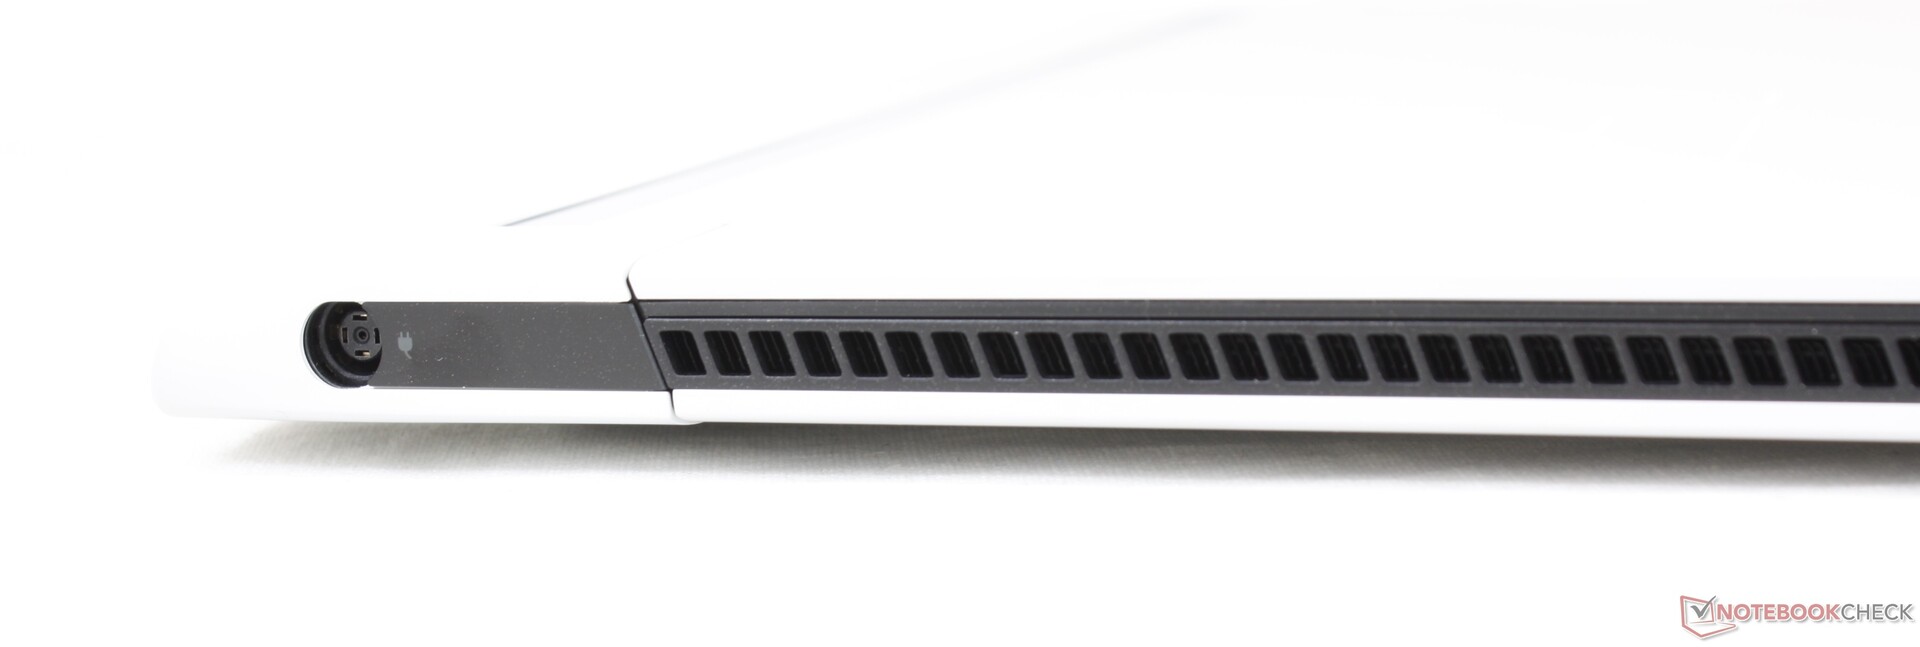
Gehäuse — Dünner, aber breiter
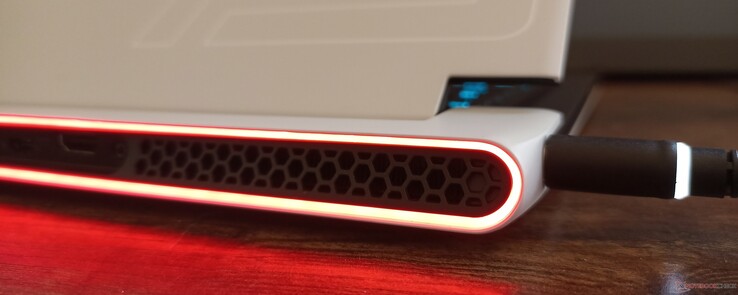
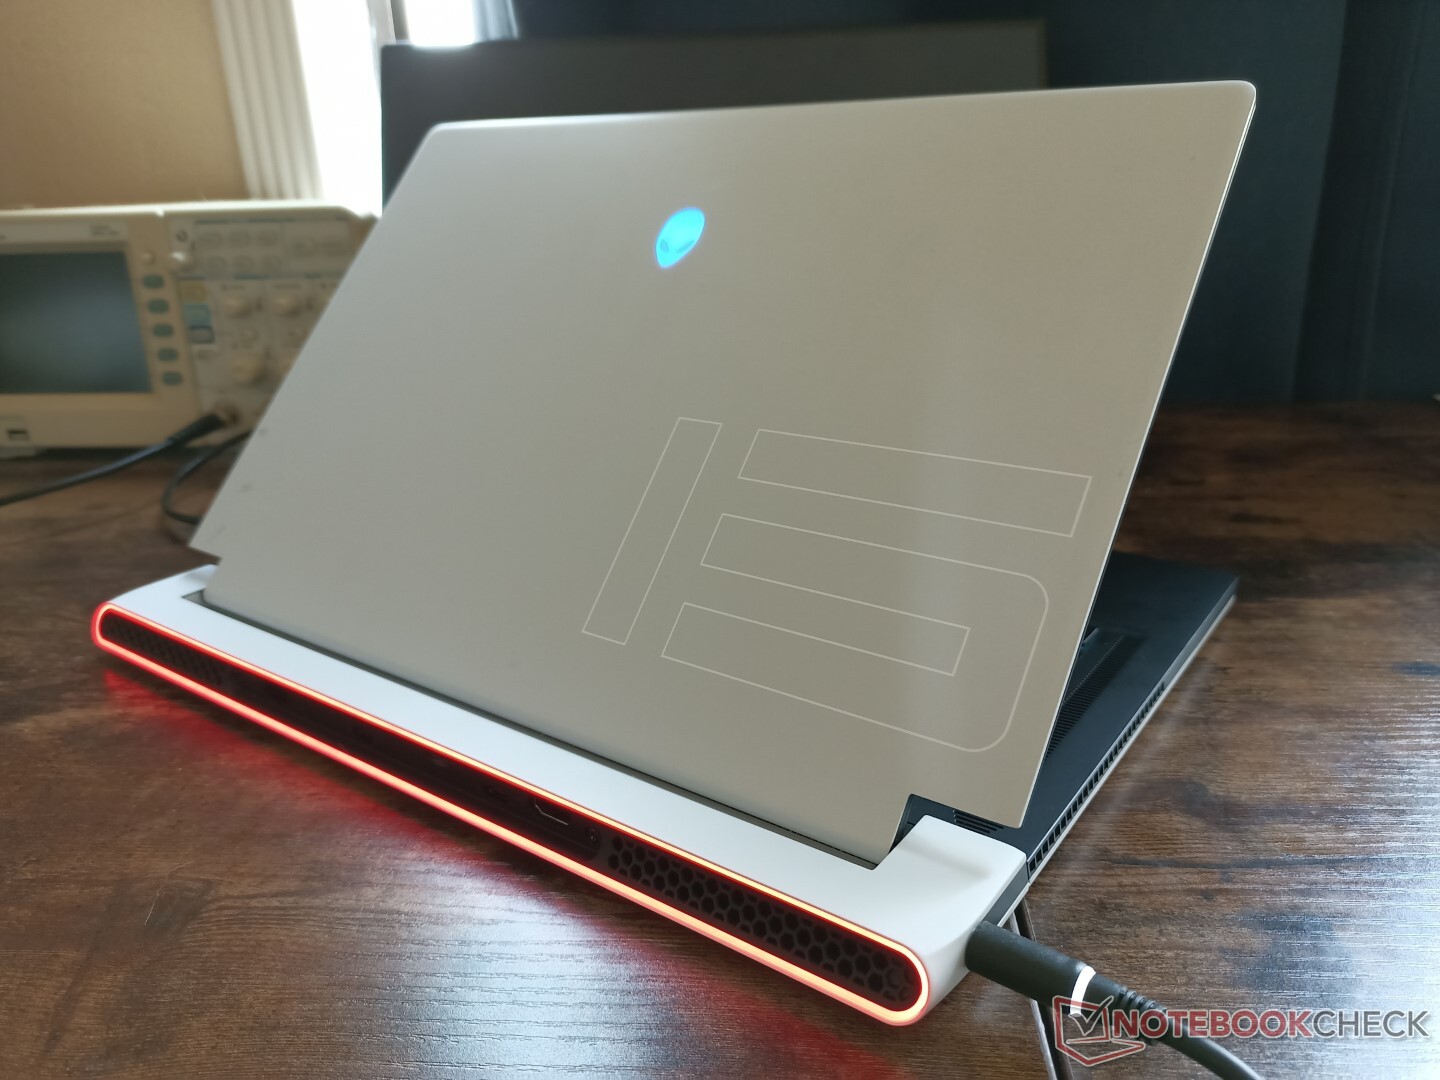
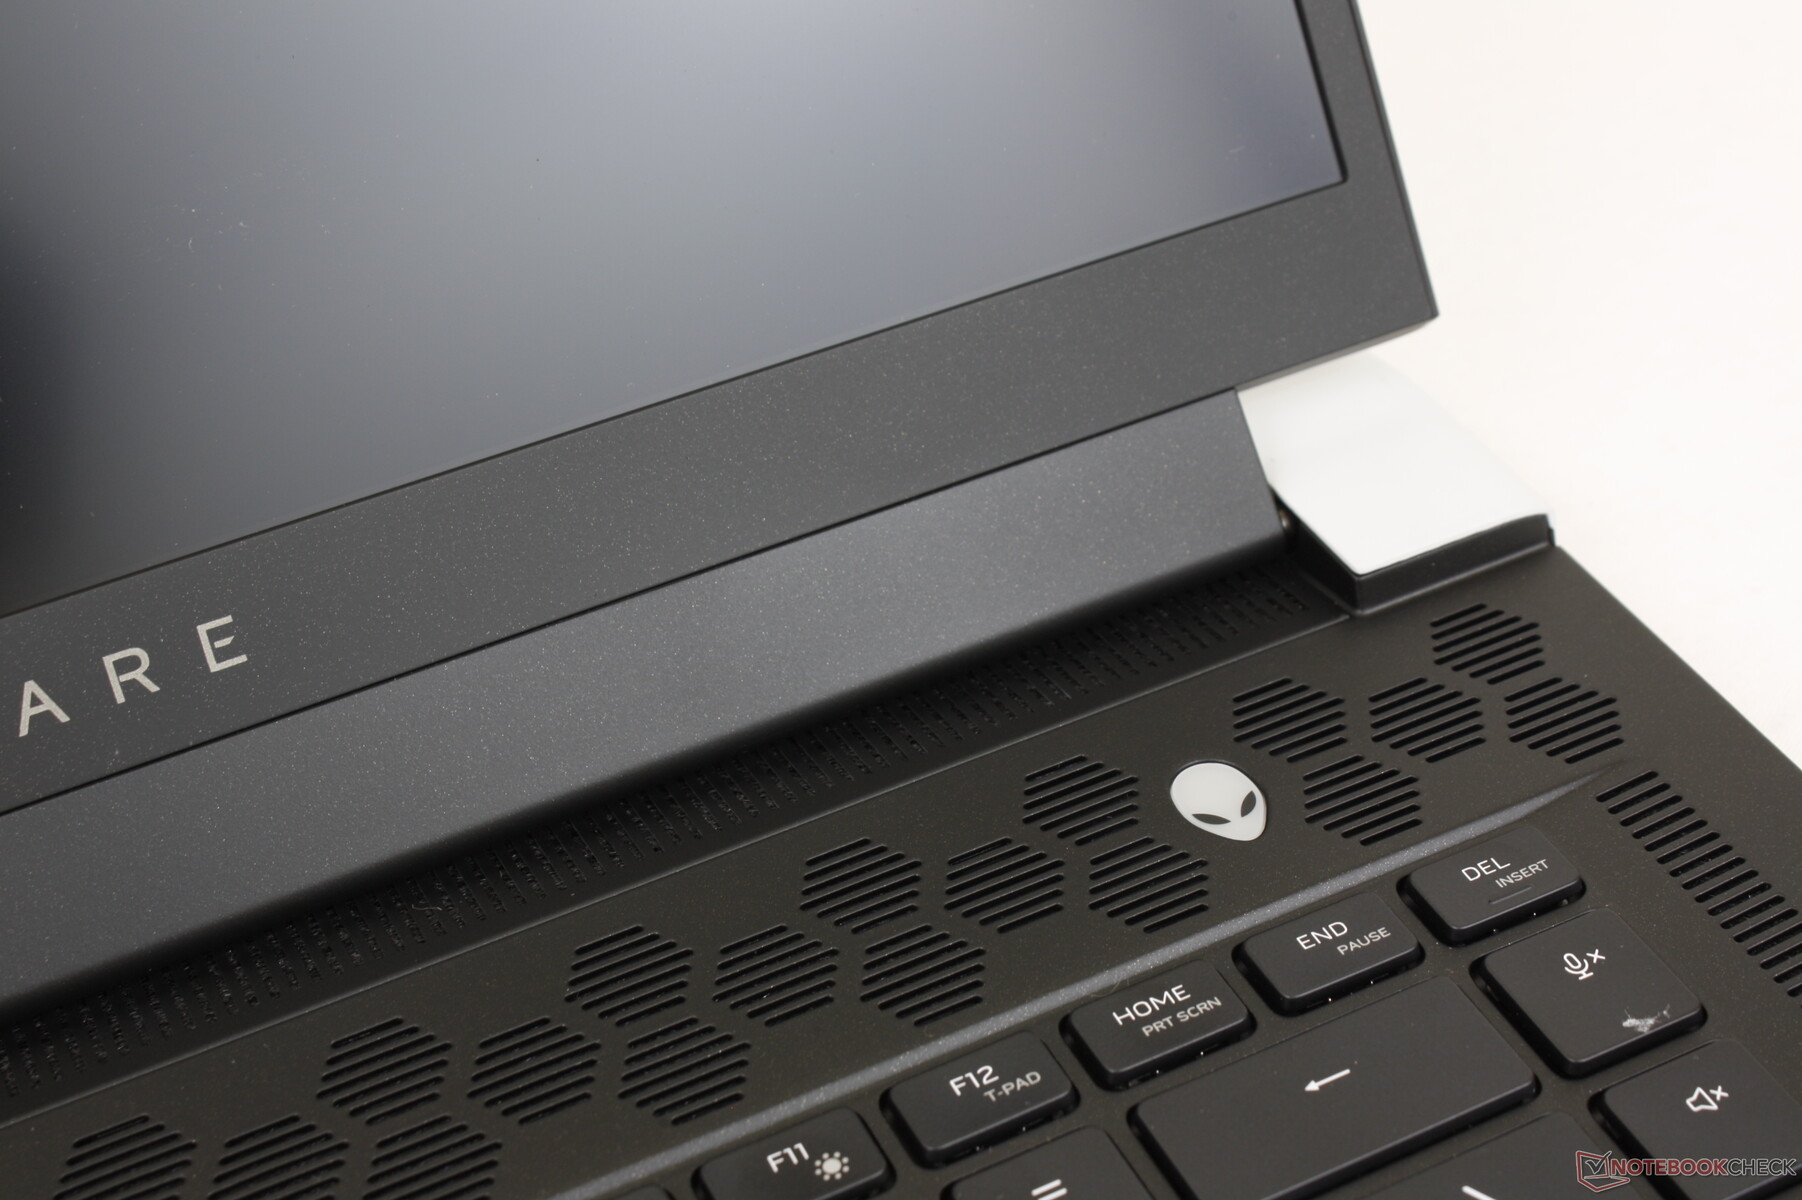
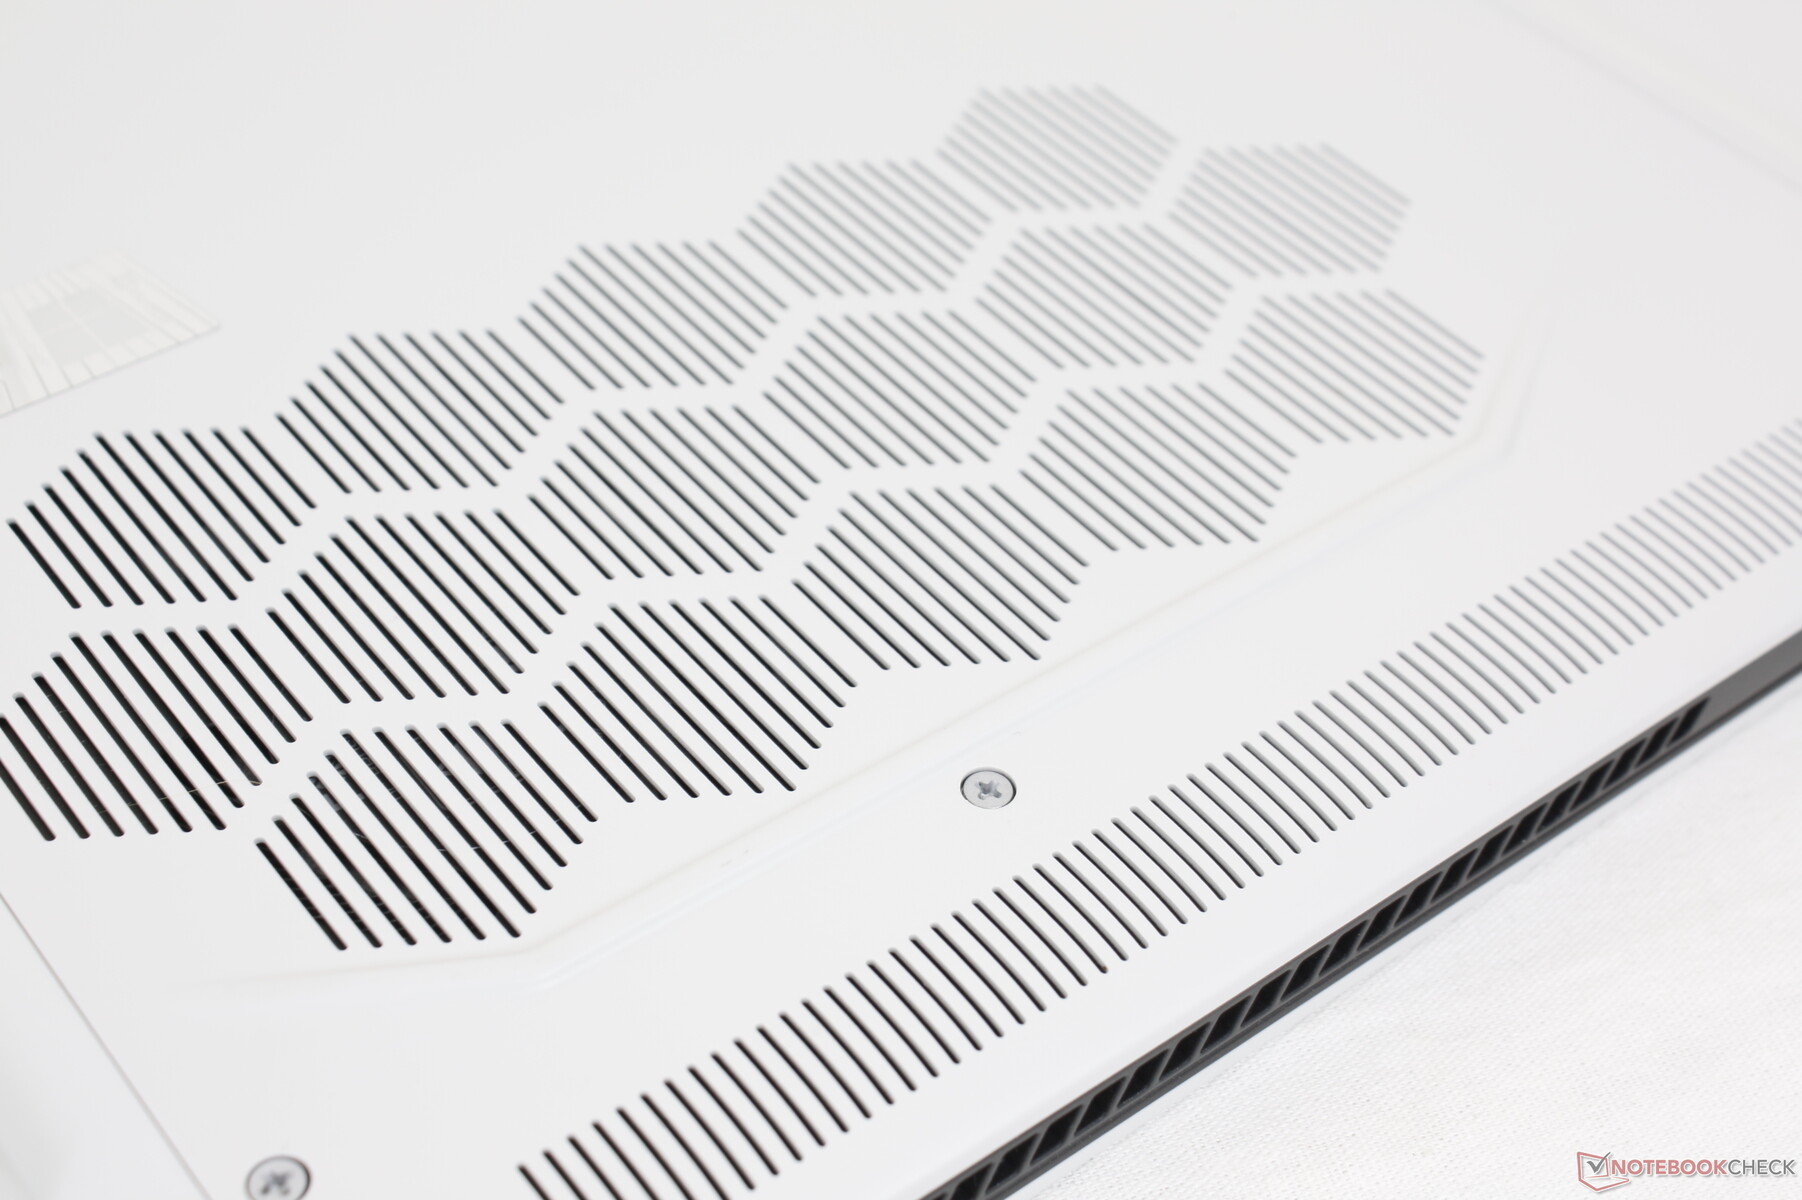
Das neue Chassis lässt sich am besten als flacheres Alienware m15 R2 beschreiben, da das x15 R1 eine fast identische Länge und Breite besitzt und auch die Gehäusematerialien sowie die daraus resultierende Haptik extrem ähnlich sind. Die auffälligen glänzenden Plastikstreifen an der Vorderkante und dem unteren Displayrand wurden gestrichen, wodurch die Konstruktion nun fast vollständig matt ist. Das Chassis erinnert an ein Ultrabook und erhält alle ursprünglichen Designmerkmale vom "Legend"-Design des m15 R2 wie zum Beispiel die Honigwaben-Belüftungsschlitze und den rückseitigen RGB-LED-Ring.
Die Gehäusestabilität ist etwas niedriger als beim m15 R2/R3/R4/R5. Sowohl die Basiseinheit als auch der Deckel geben beim Belasten der jeweiligen Ecken leichter nach und geben dabei mehr Geräusche von sich als beim älteren, dickeren Design. Unter Druck geben auch die Tastaturmitte und die Deckelrückseite leicht nach. Insgesamt ist die Konstruktion mit der des MSI GS66 vergleichbar und etwas schwächer als beim Razer Blade 15.
Im Gegensatz zum Alienware x17 R1, das etwas dicker und schwerer ist als sein Vorgäner, das Alienware m17 R4, ist das Alienware x15 R1 dünner als das Alienware m15 R5 und wiegt ungefähr gleich viel. Damit ist das x15 weiterhin einer der größten und schwersten Vertreter der ultradünnen Gaming-Laptop-Klasse, da konkurrierende Modelle wie das Zephyrus S15 und das Razer Blade 15 spürbar kleiner und leichter sind. Die große Grundfläche muss man für das extrem dünne Profil möglicherweise in Kauf nehmen.
Bestimmte Modelle mit dem FHD-165-Hz-Panel sind um Bruchteile eines Millimeters dicker als unser QHD-Modell (16,3 vs. 15,9 mm).
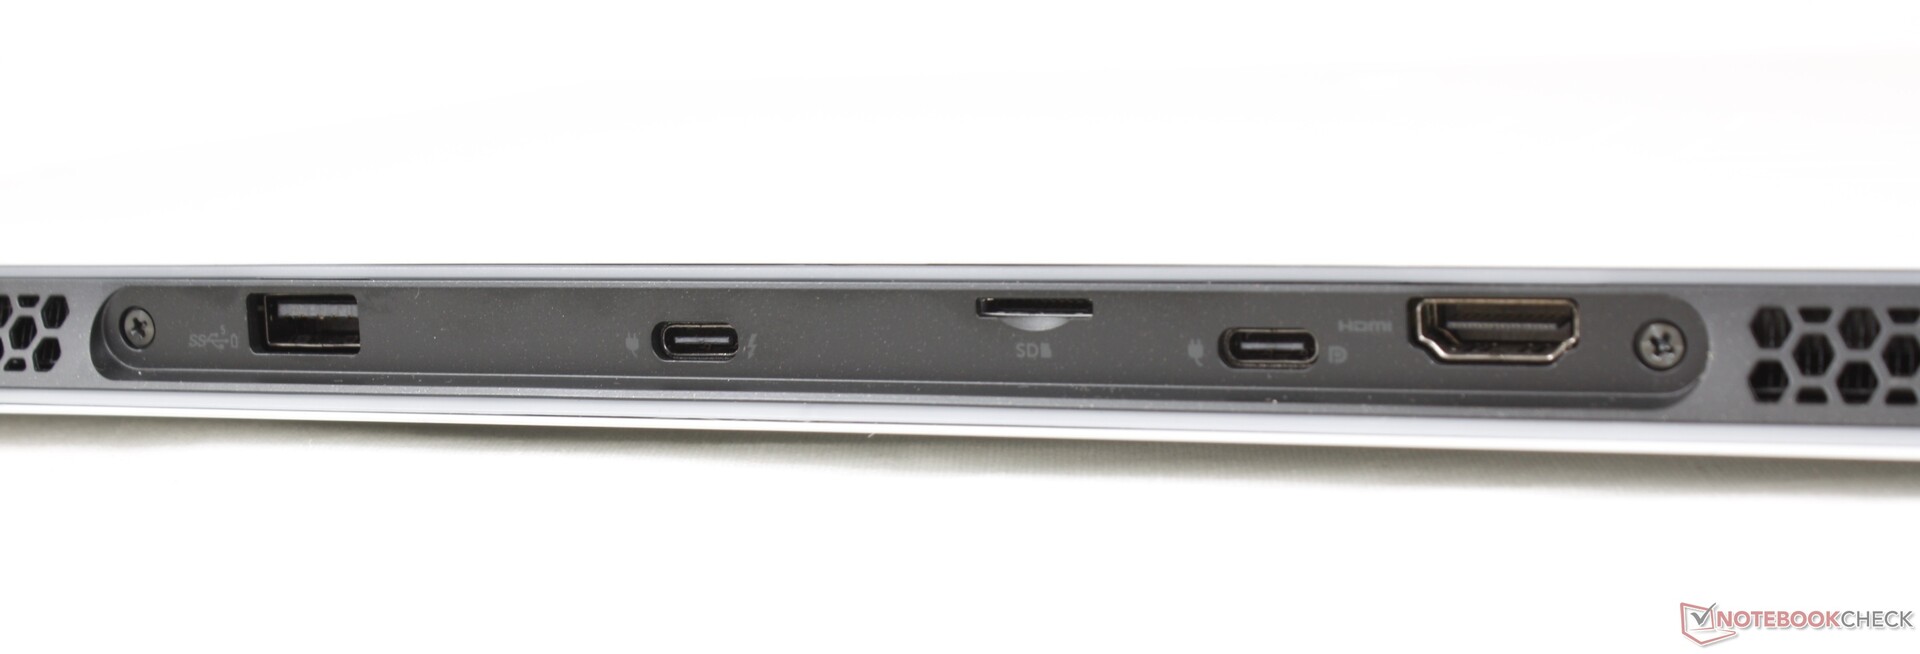
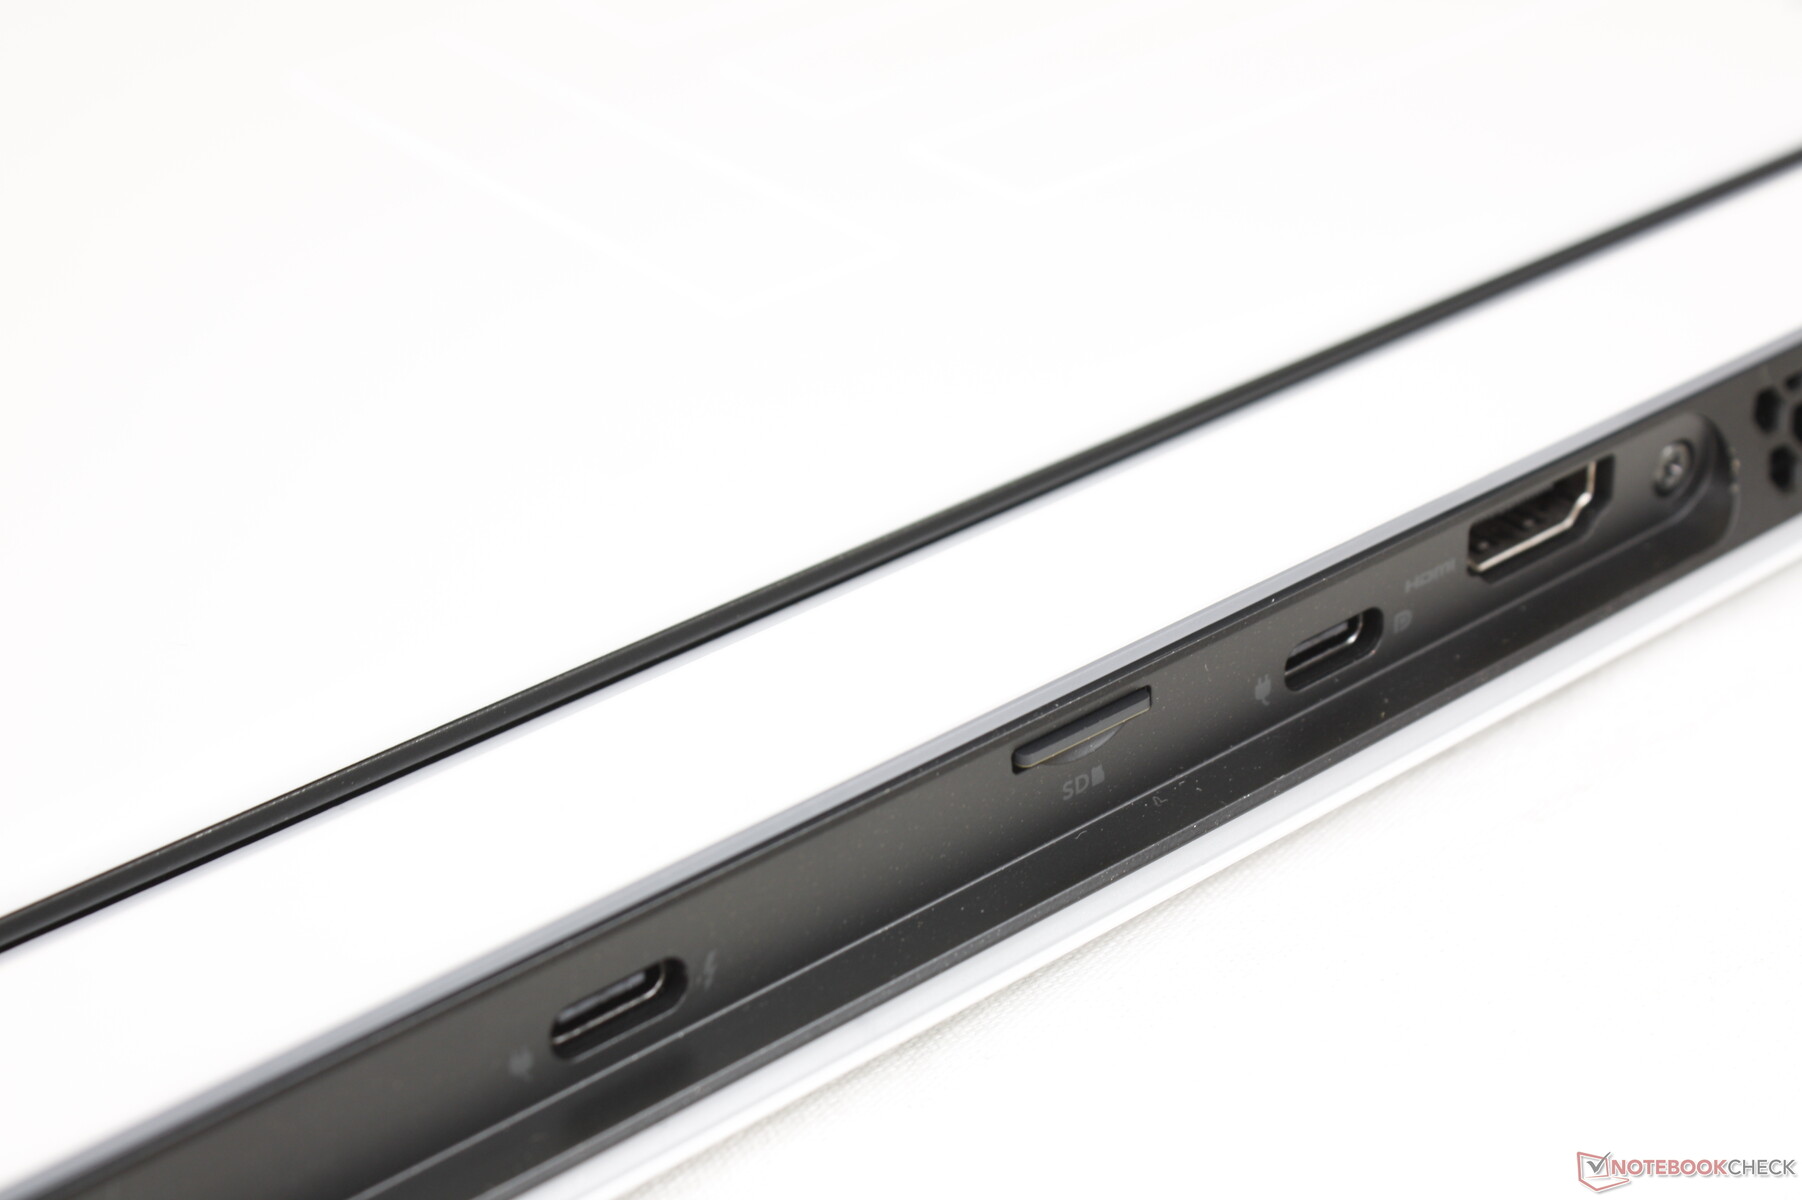
Ausstattung — Weniger ist mehr
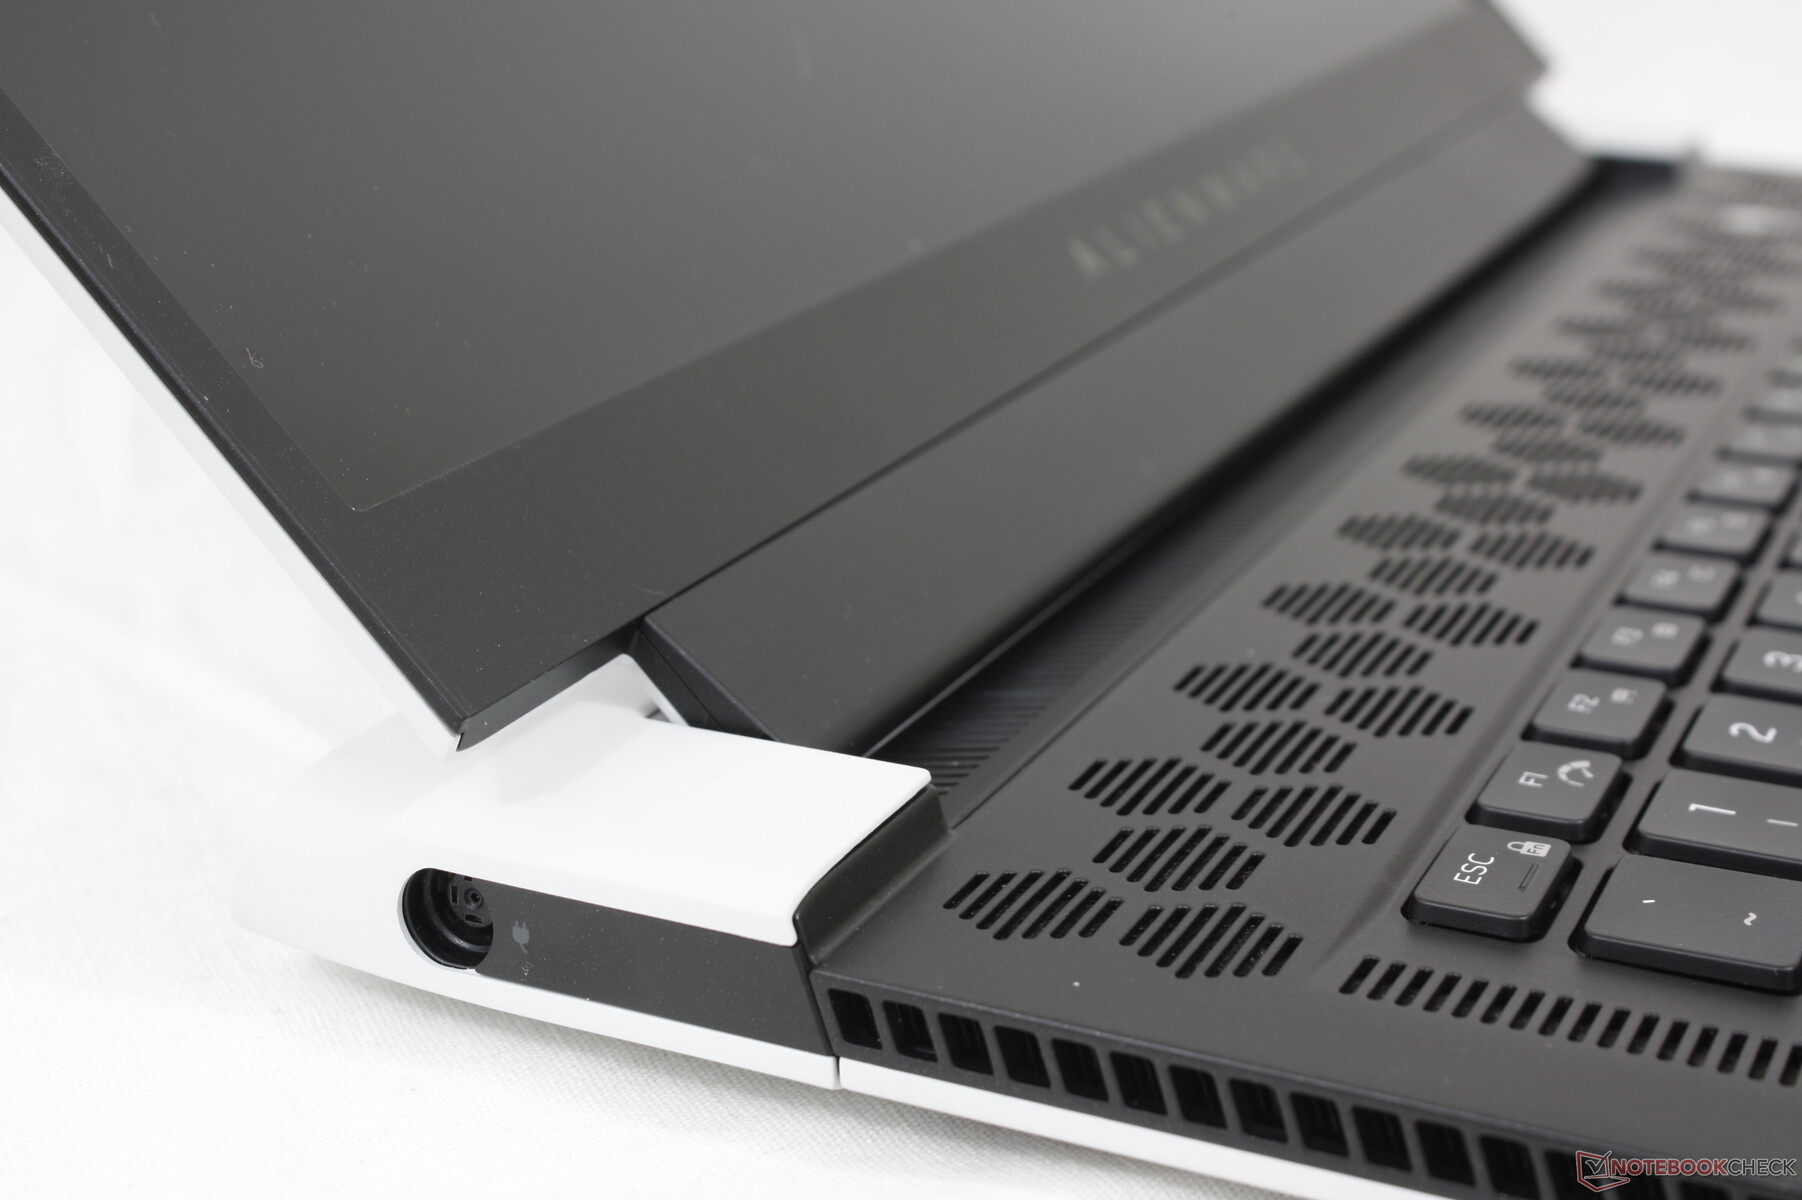
Manche Anschlussoptionen des älteren Alienware m15 R4 wurden hier gestrichen. So gibt es hier nur noch einen USB-A-Anschluss statt drei und RJ-45, Mini-Displayport und der Grafikbeschleuniger-Anschluss sind allesamt weggefallen. Dafür bekommt man einen zweiten USB-C-Anschluss, mit dem man (abhängig vom Anwendungsszenario) vermutlich flexibler ist.
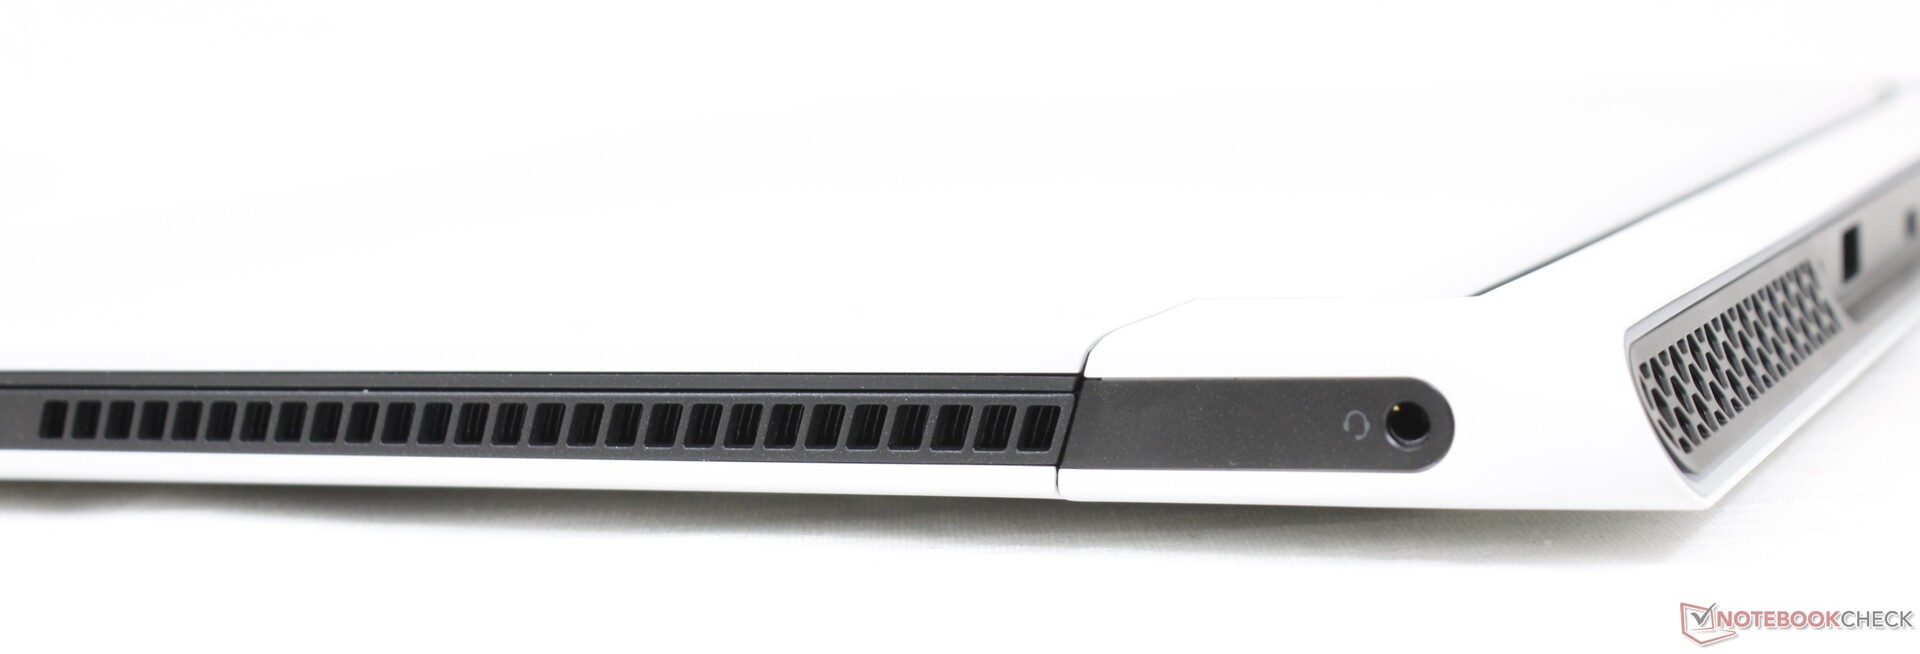
Fast alle Anschlüsse befinden sich auf der Rückseite des Chassis und sind dadurch möglicherweise schwerer zu erreichen. Da sie nicht beleuchtet oder mit einfach zu erkennenden Symbolen gekennzeichnet sind, kann man sie auch nicht ohne Weiteres sofort identifizieren.
SD-Kartenleser
Da das Asus Zephyrus S15, MSI GS66, Razer Blade 15 und die meisten anderen 15,6-Zoll-Gaming-Laptops nicht über einen Kartenleser verfügen, müssen wir Dell an dieser Stelle dafür loben, diesem Trend nicht zu folgen. Mit rund 200 MB/s sind die Übertragungsraten in Kombination mit unserer UHS-II-Testkarte sehr hoch.
| SD Card Reader | |
| average JPG Copy Test (av. of 3 runs) | |
| Alienware x15 RTX 3070 P111F (AV Pro V60) | |
| Alienware m15 R4 RTX 3080 (AV PRO microSD 128 GB V60) | |
| maximum AS SSD Seq Read Test (1GB) | |
| Alienware x15 RTX 3070 P111F (AV Pro V60) | |
| Alienware m15 R4 RTX 3080 (AV PRO microSD 128 GB V60) | |
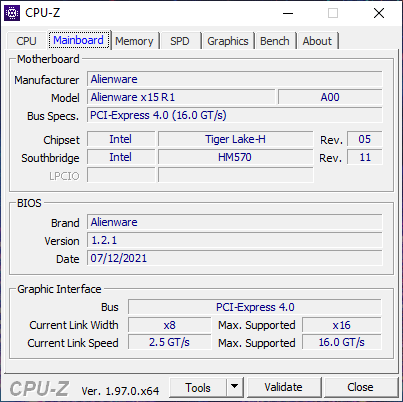
Kommunikation — Standardmäßig mit WLAN 6E
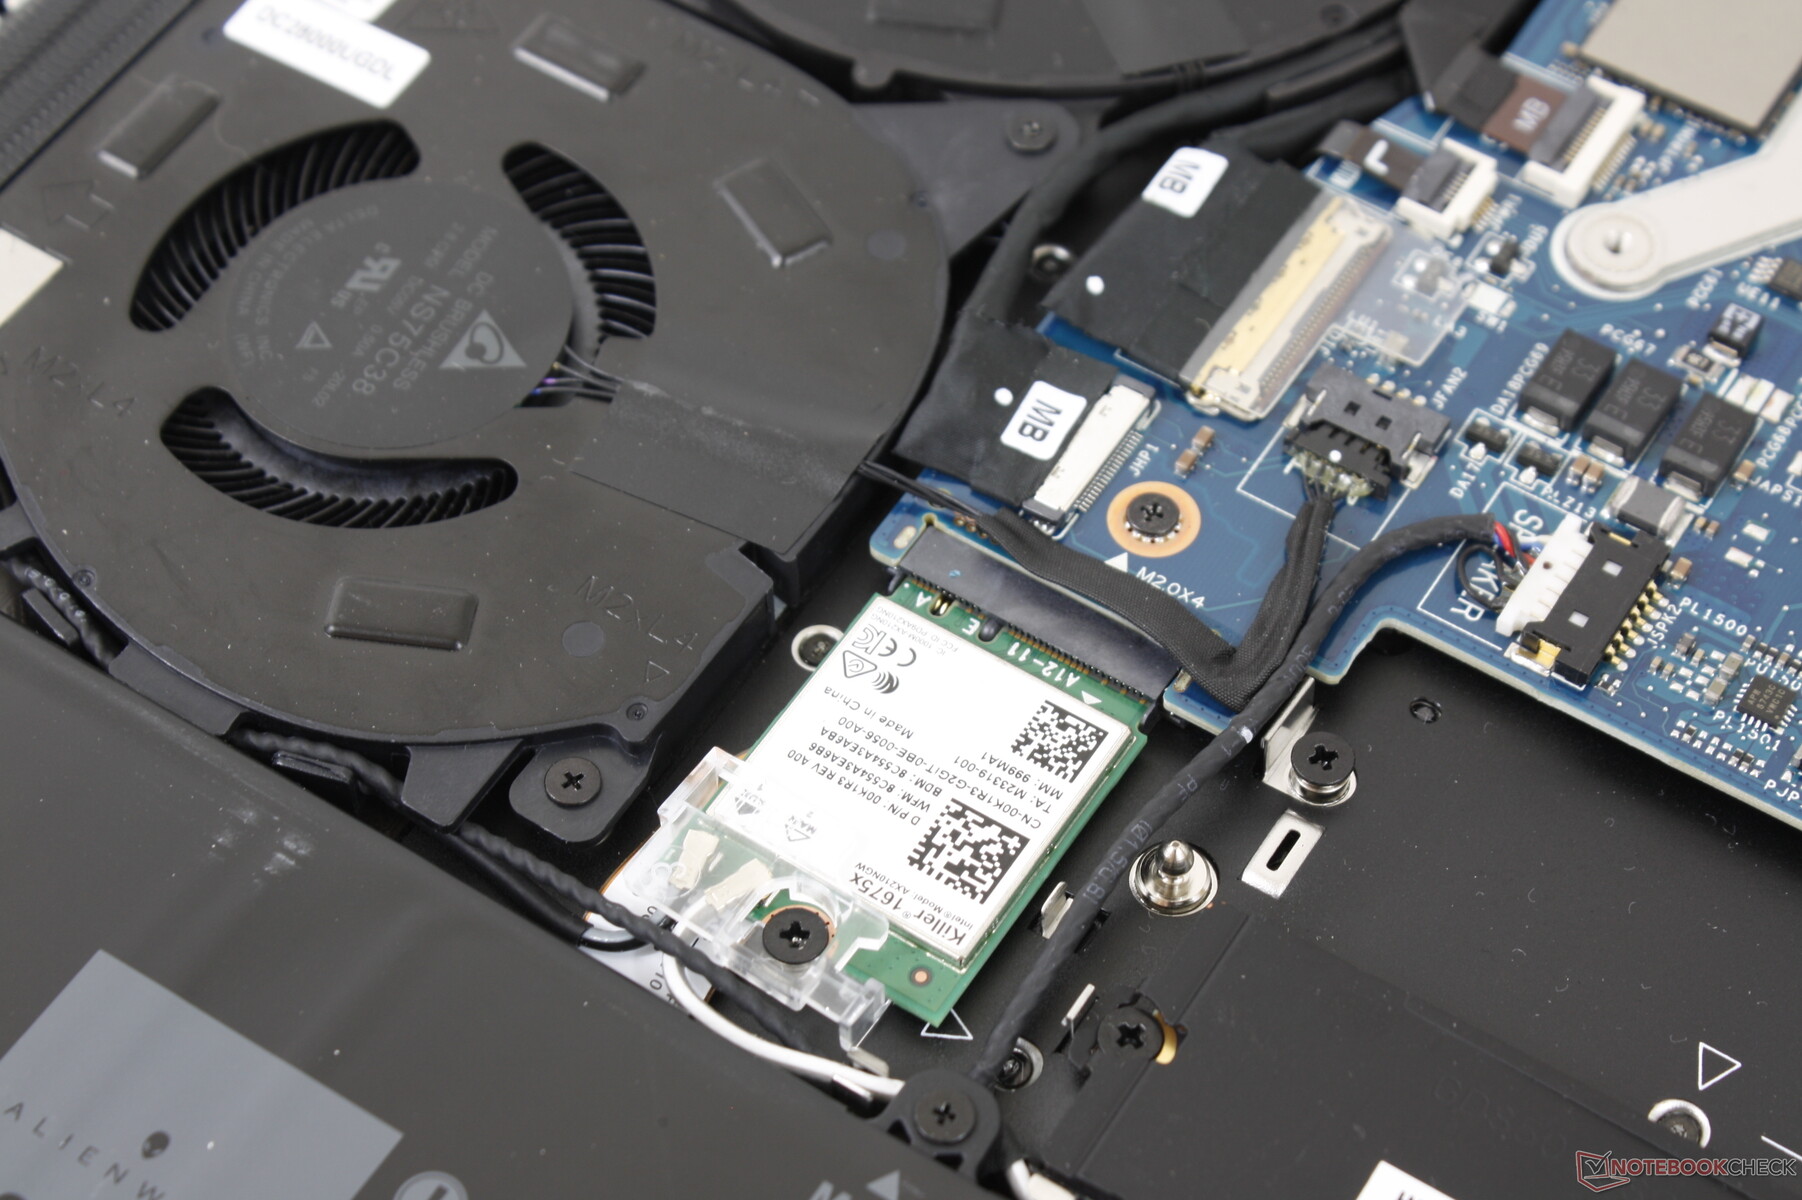
Alle Modelle sind standardmäßig mit dem Killer-WLAN-6E-Modul AX1675x ausgestattet, welches das WLAN-6-Modul Killer AX1650w aus dem Vorjahr ablöst. Im Gegensatz zum Intel AX210 sind die Killer-Chips mit der Killer Performance Suite und all ihren Softwarefunktionen kompatibel.
Webcam
Die Qualität der Kamera, die über keine eingebaute Abdeckung verfügt, ist dank 720p-Auflösung verbesserungswürdig. Eine IR-Kamera für Windows Hello ist vorhanden.


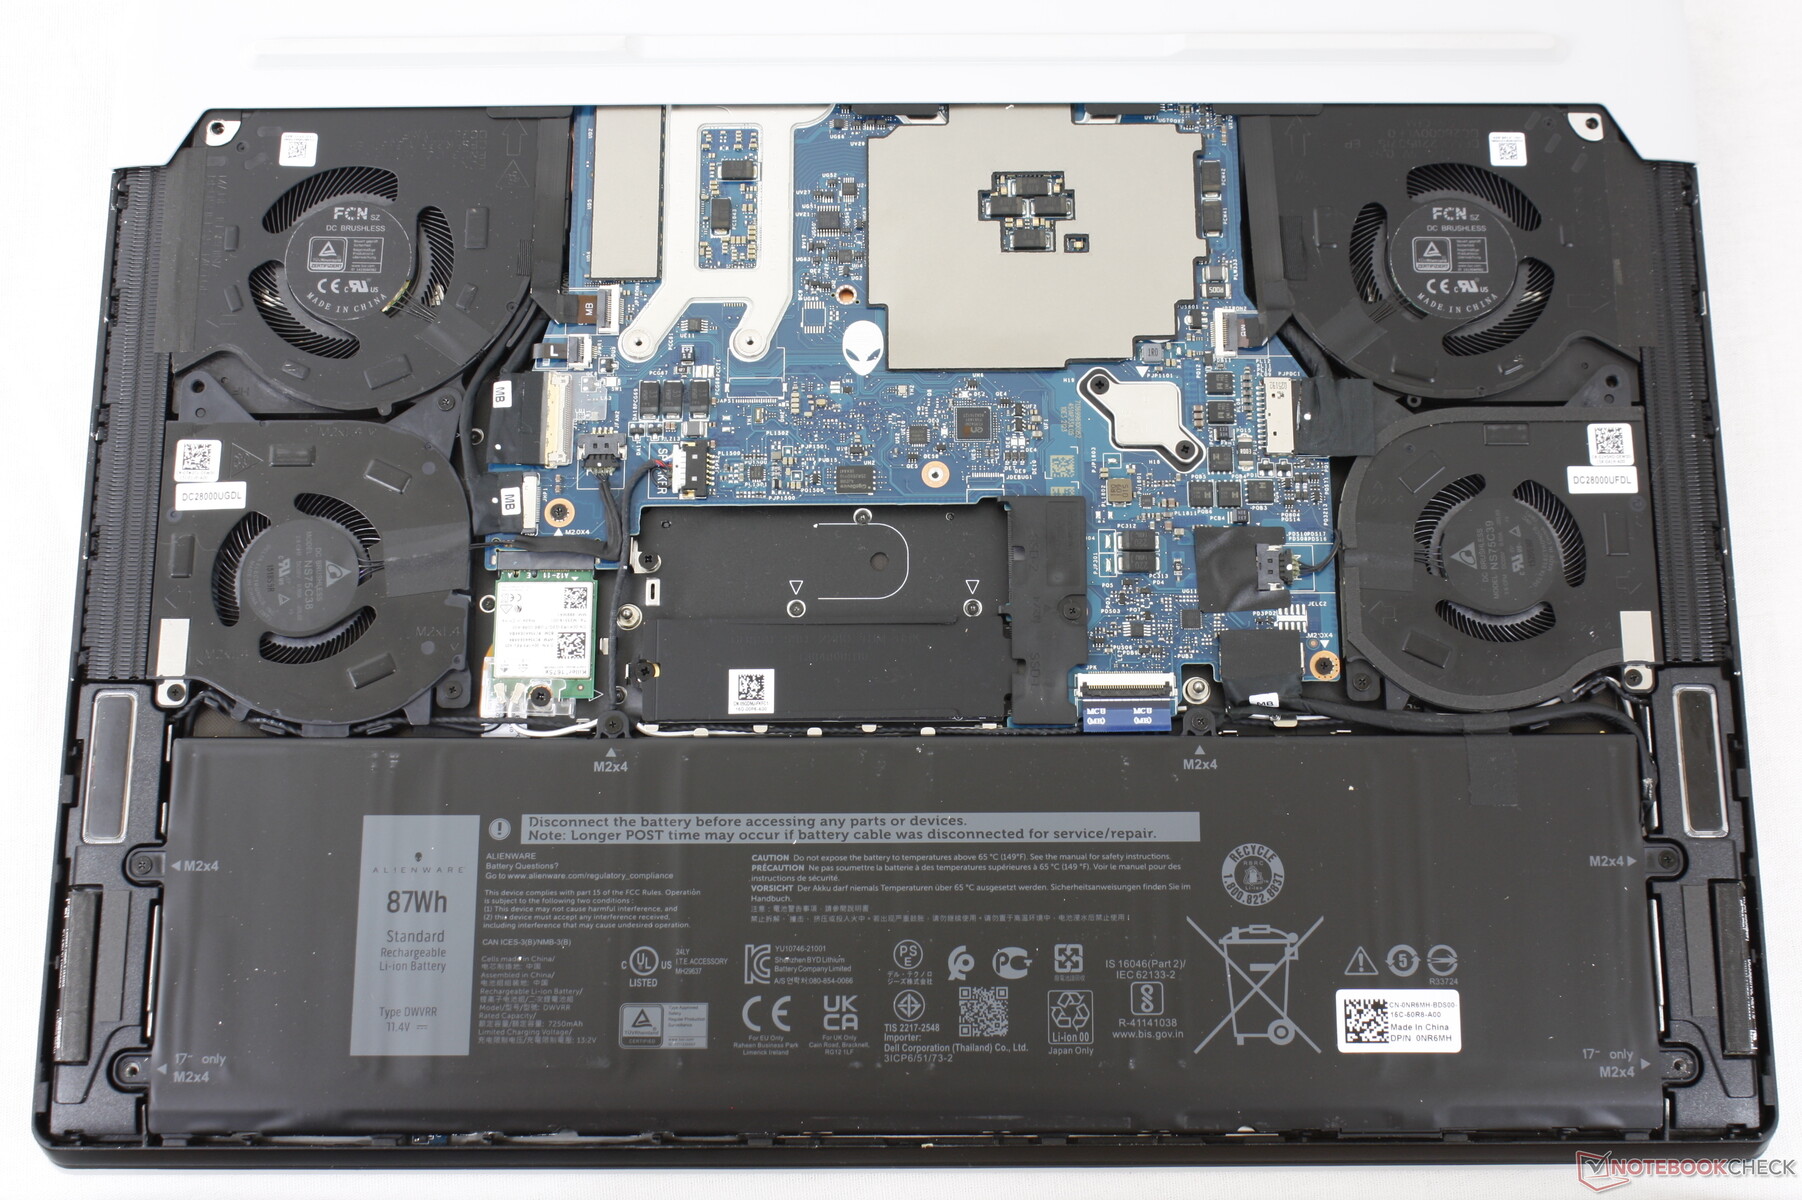
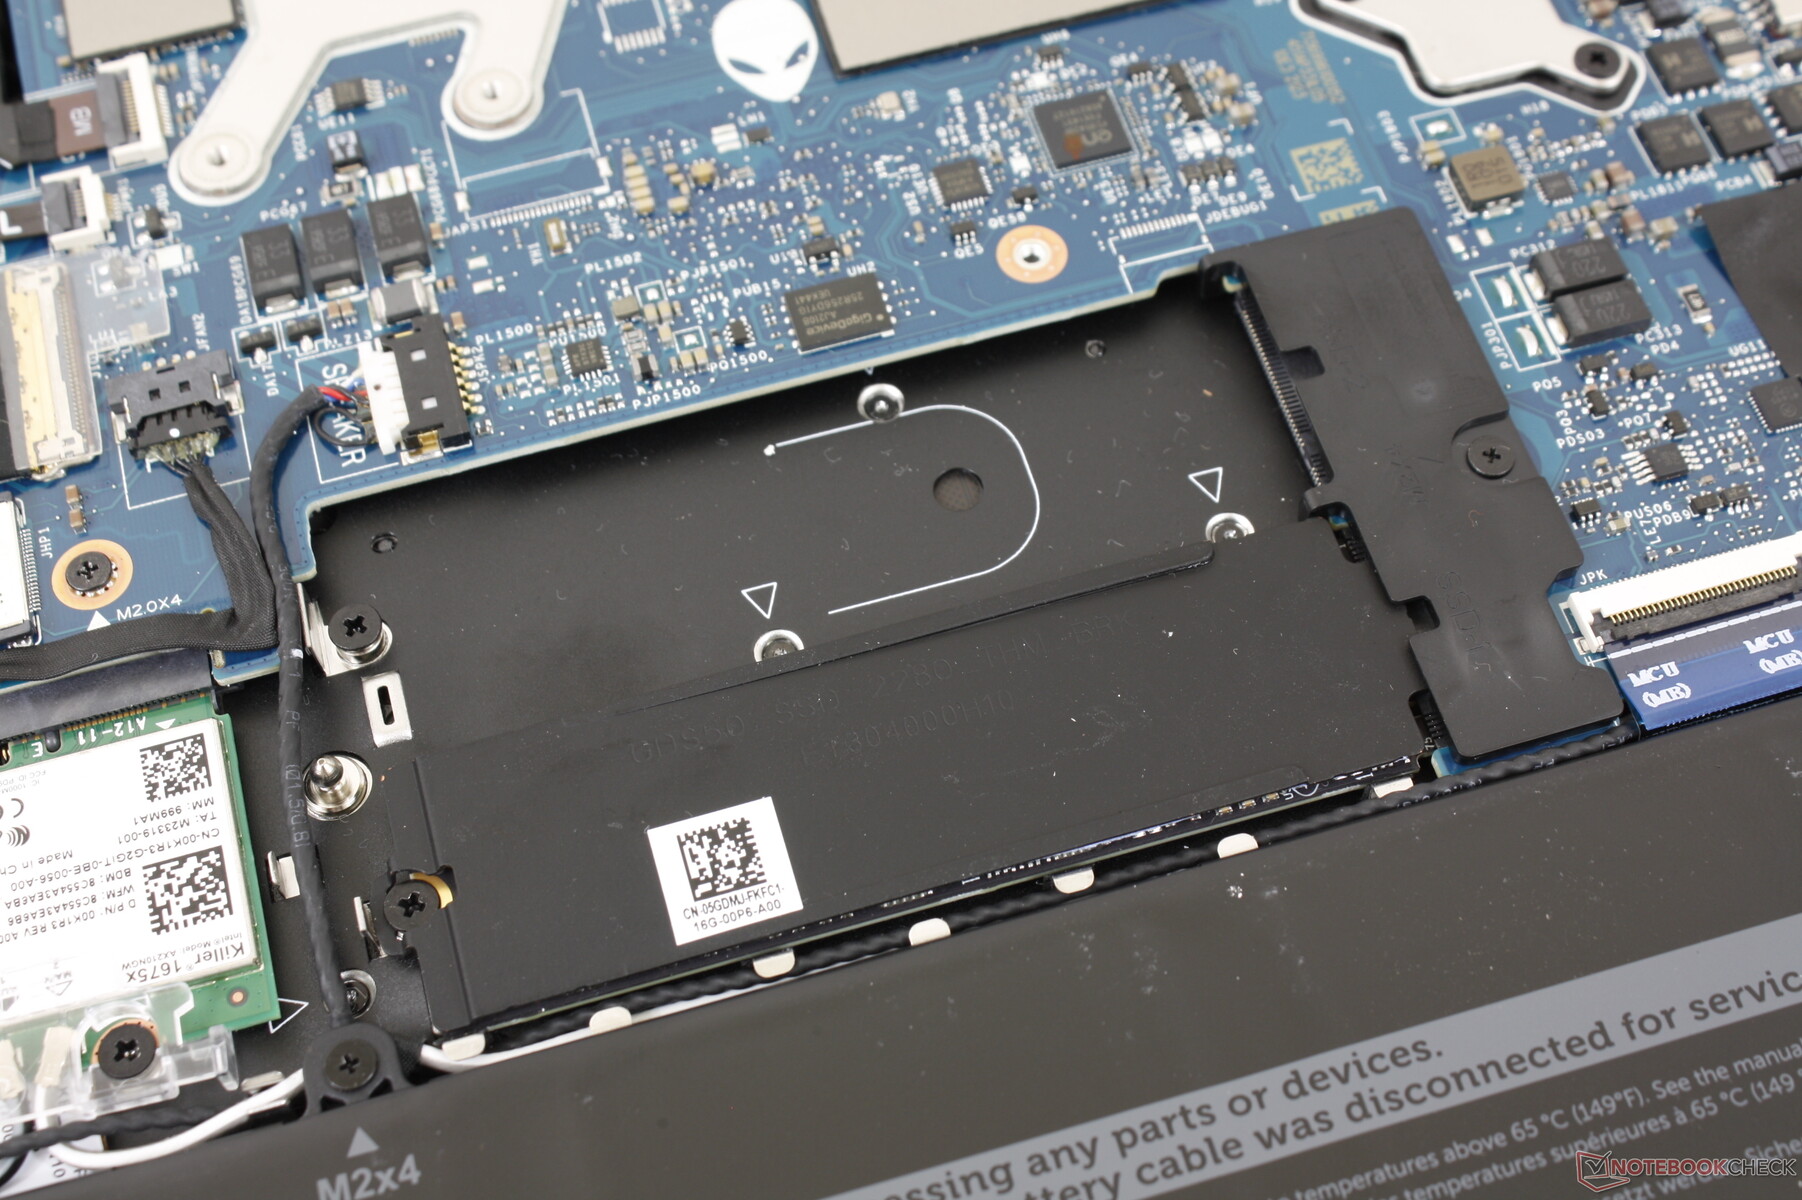
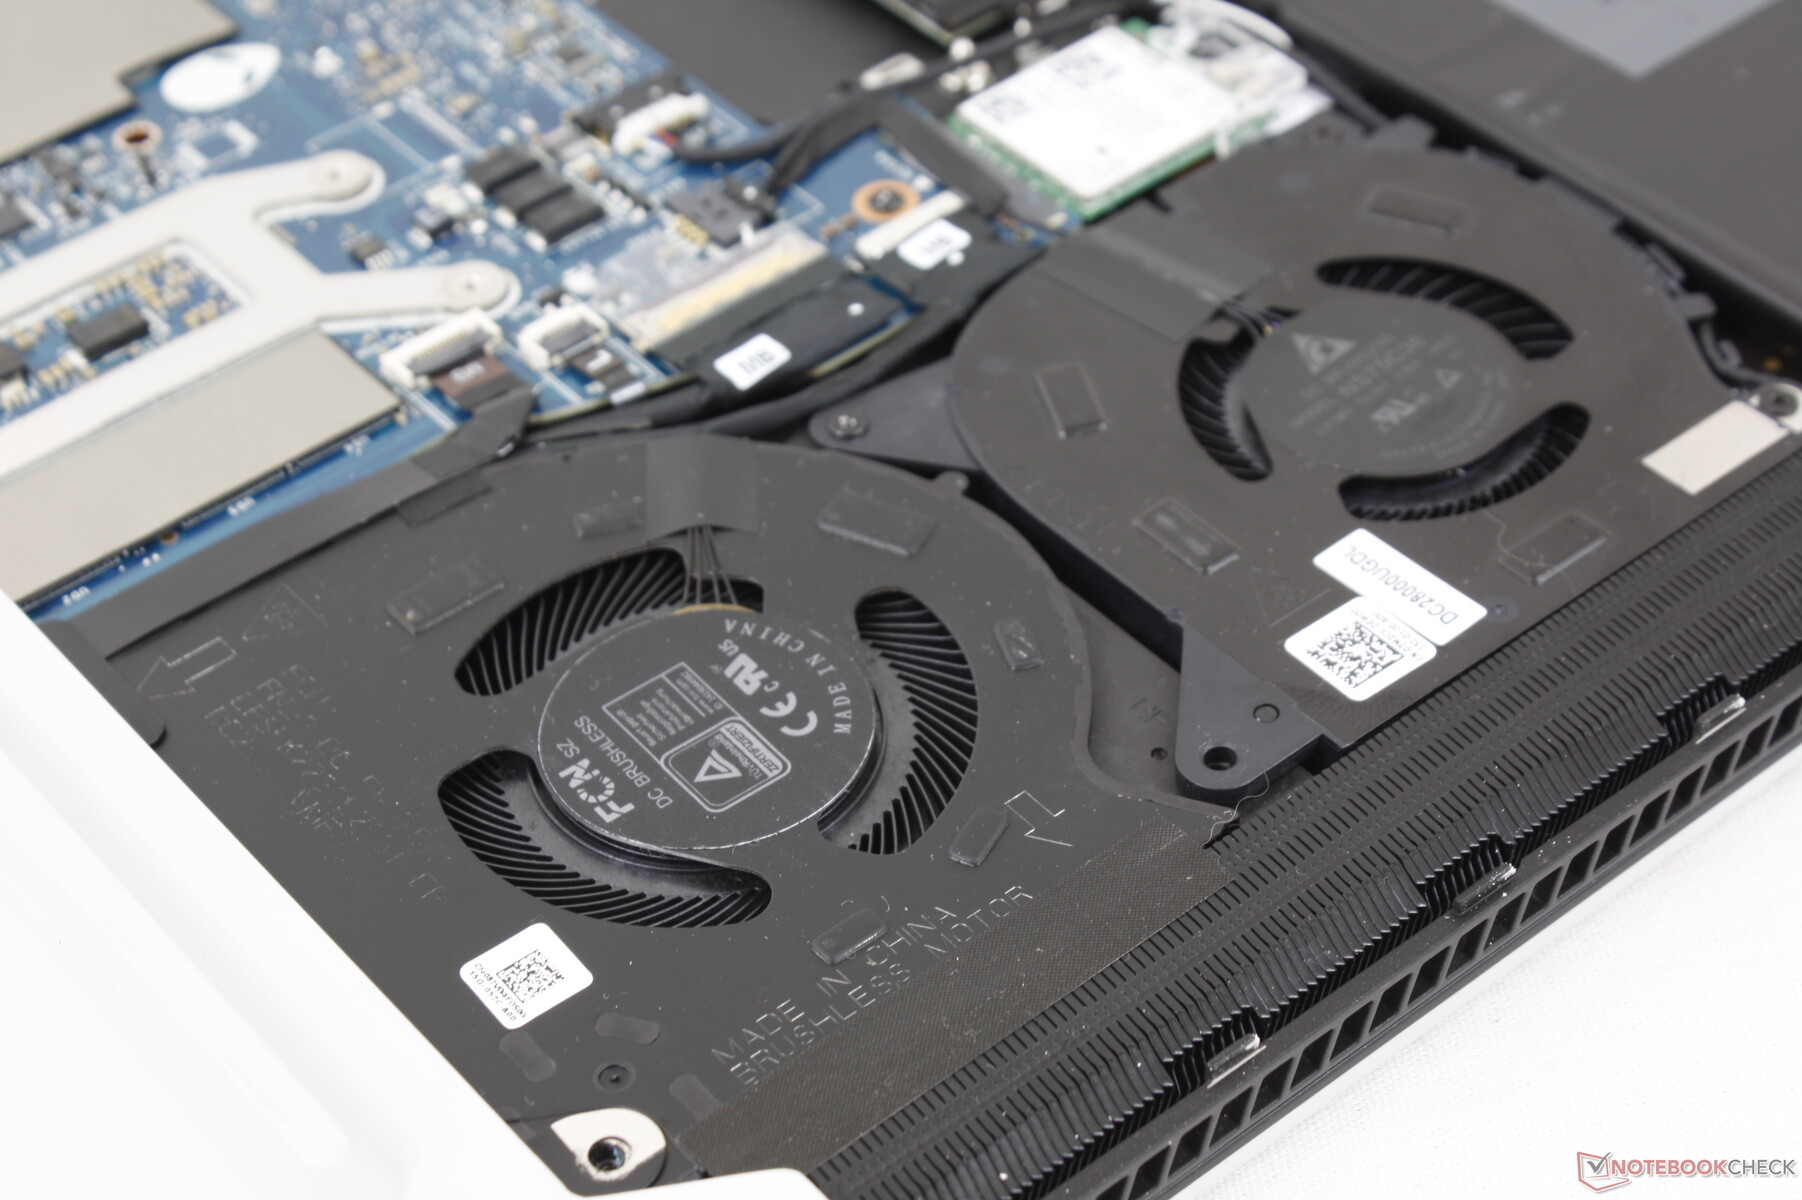
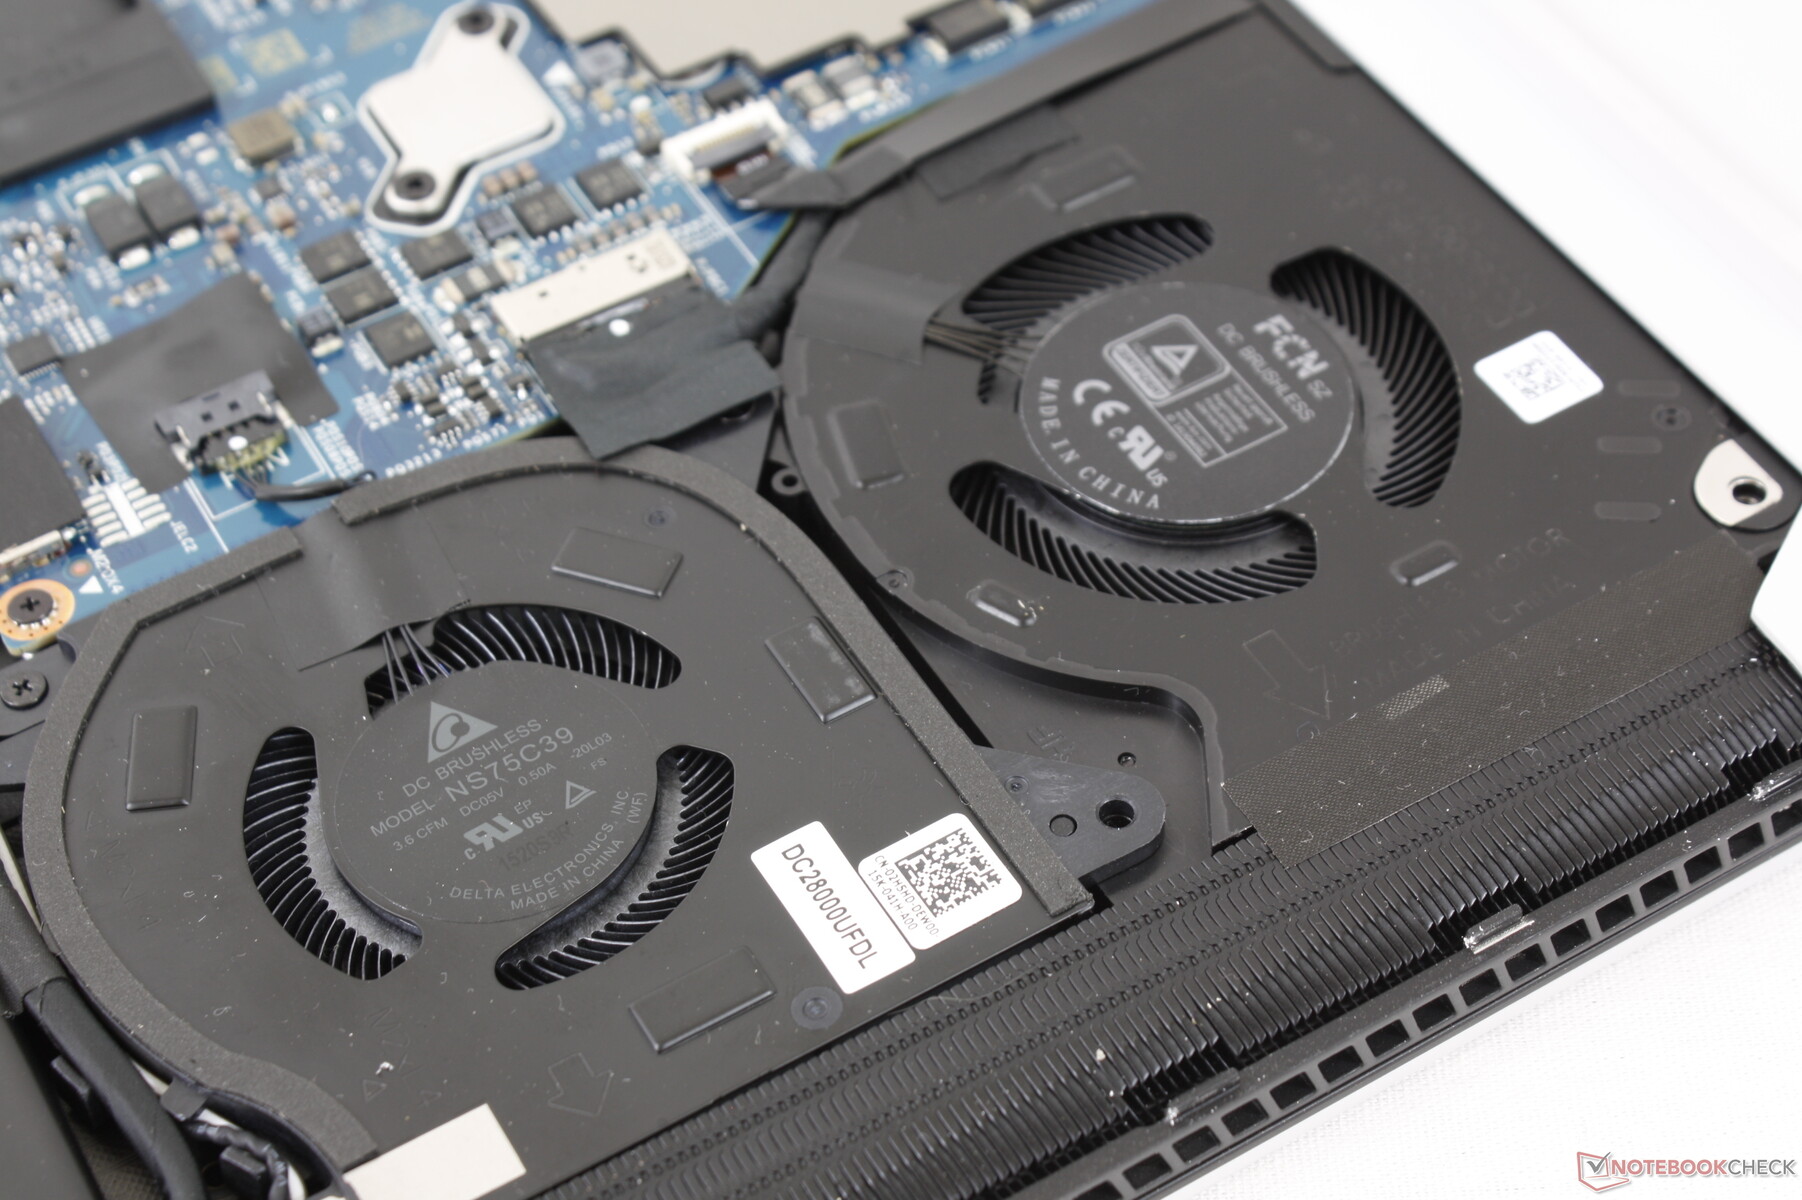
Wartung
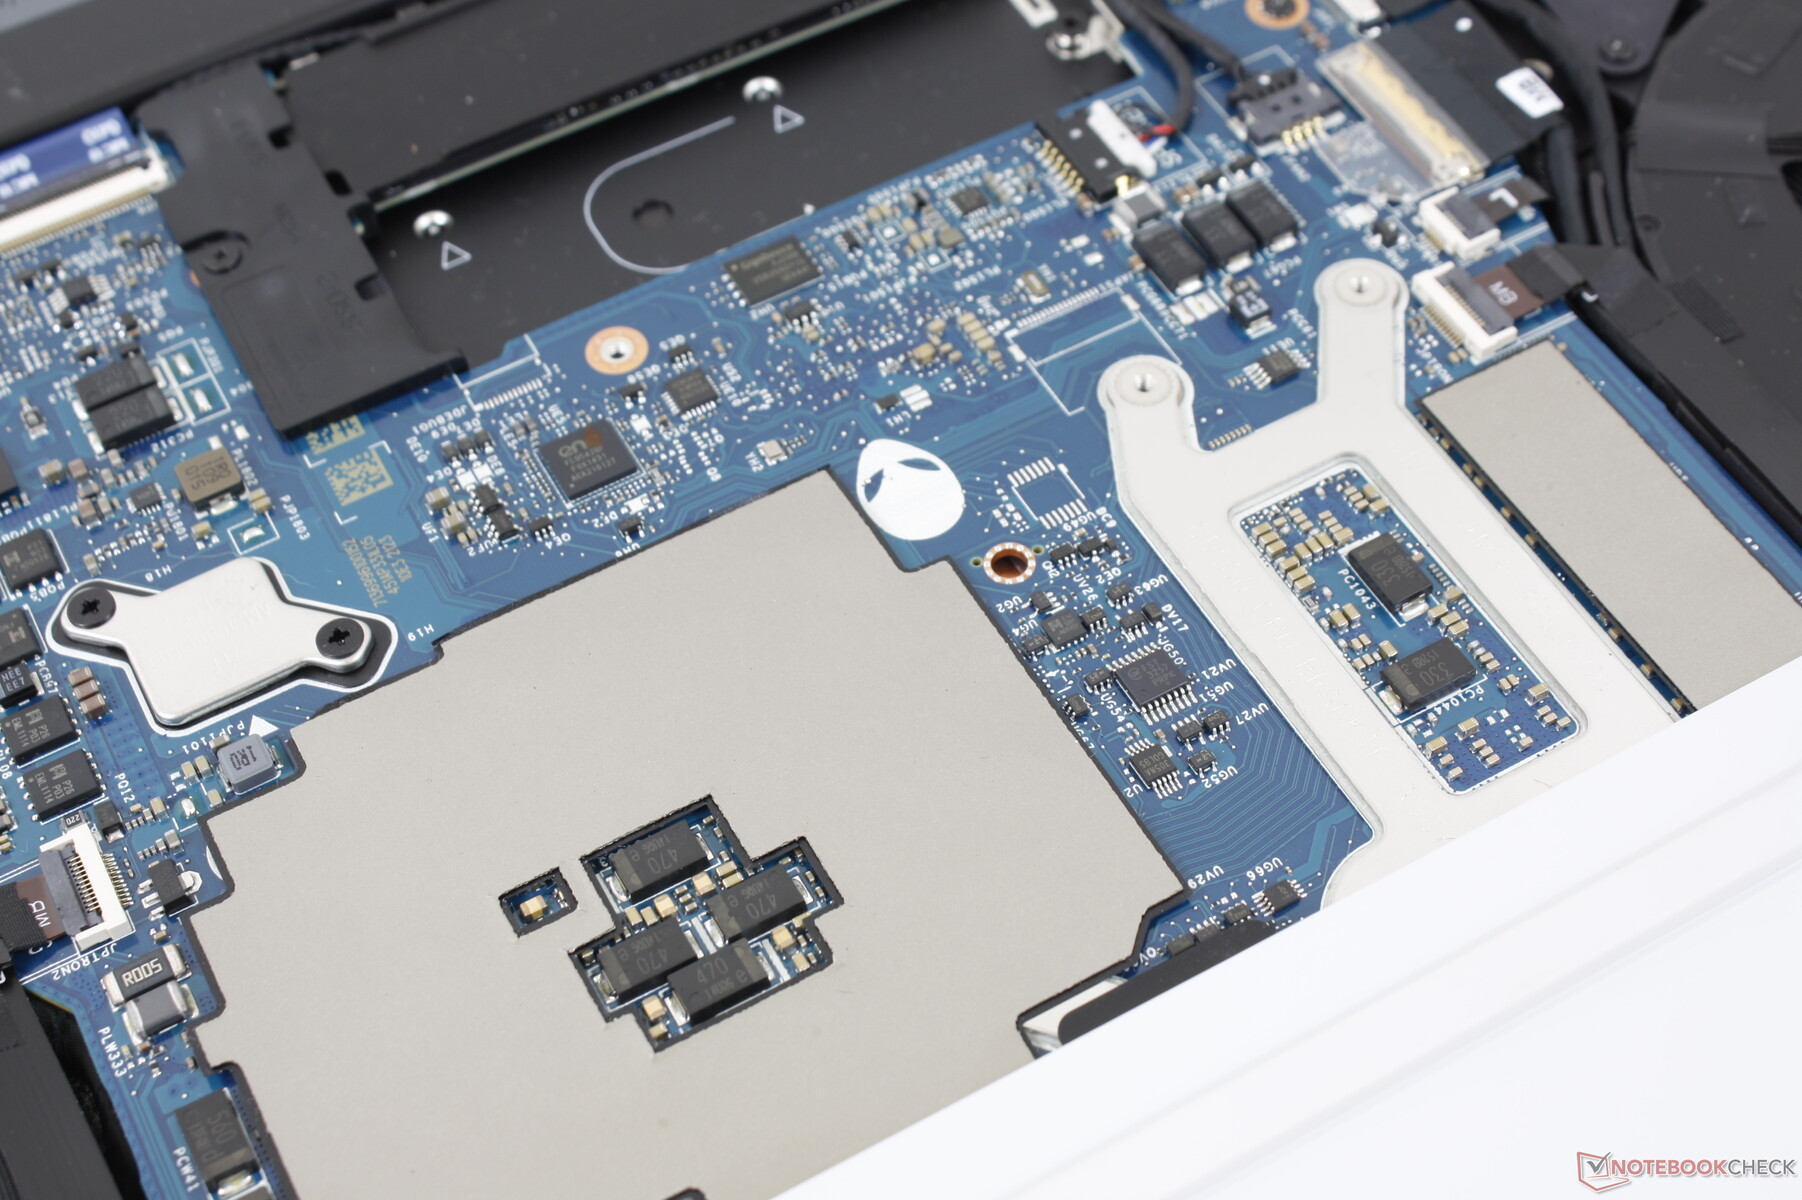
Die Bodenplatte ist mit nur 6 Kreuzschrauben gesichert, was das Aufrüsten und die Wartung erleichtert. Da der RAM jedoch verlötet ist, kann man nur die M.2-SSDs aufrüsten. Konkurrierende Modelle wie das Razer Blade 15 und das MSI GS66 verfügen über SODIMM-Steckplätze, über die der Arbeitsspeicher vergleichsweise einfach aufgerüstet werden kann.
Garantie und Zubehör
Im Lieferumfang befinden sich bis auf das Netzteil und dem üblichen Papierkram keine Extras. Es gilt die übliche, einjährige eingeschränkte Garantie, die mit vielen Optionen erweitert werden kann, wenn man direkt bei Dell bestellt.
Eingabegeräte — Besseres Tastenfeedback
Tastatur
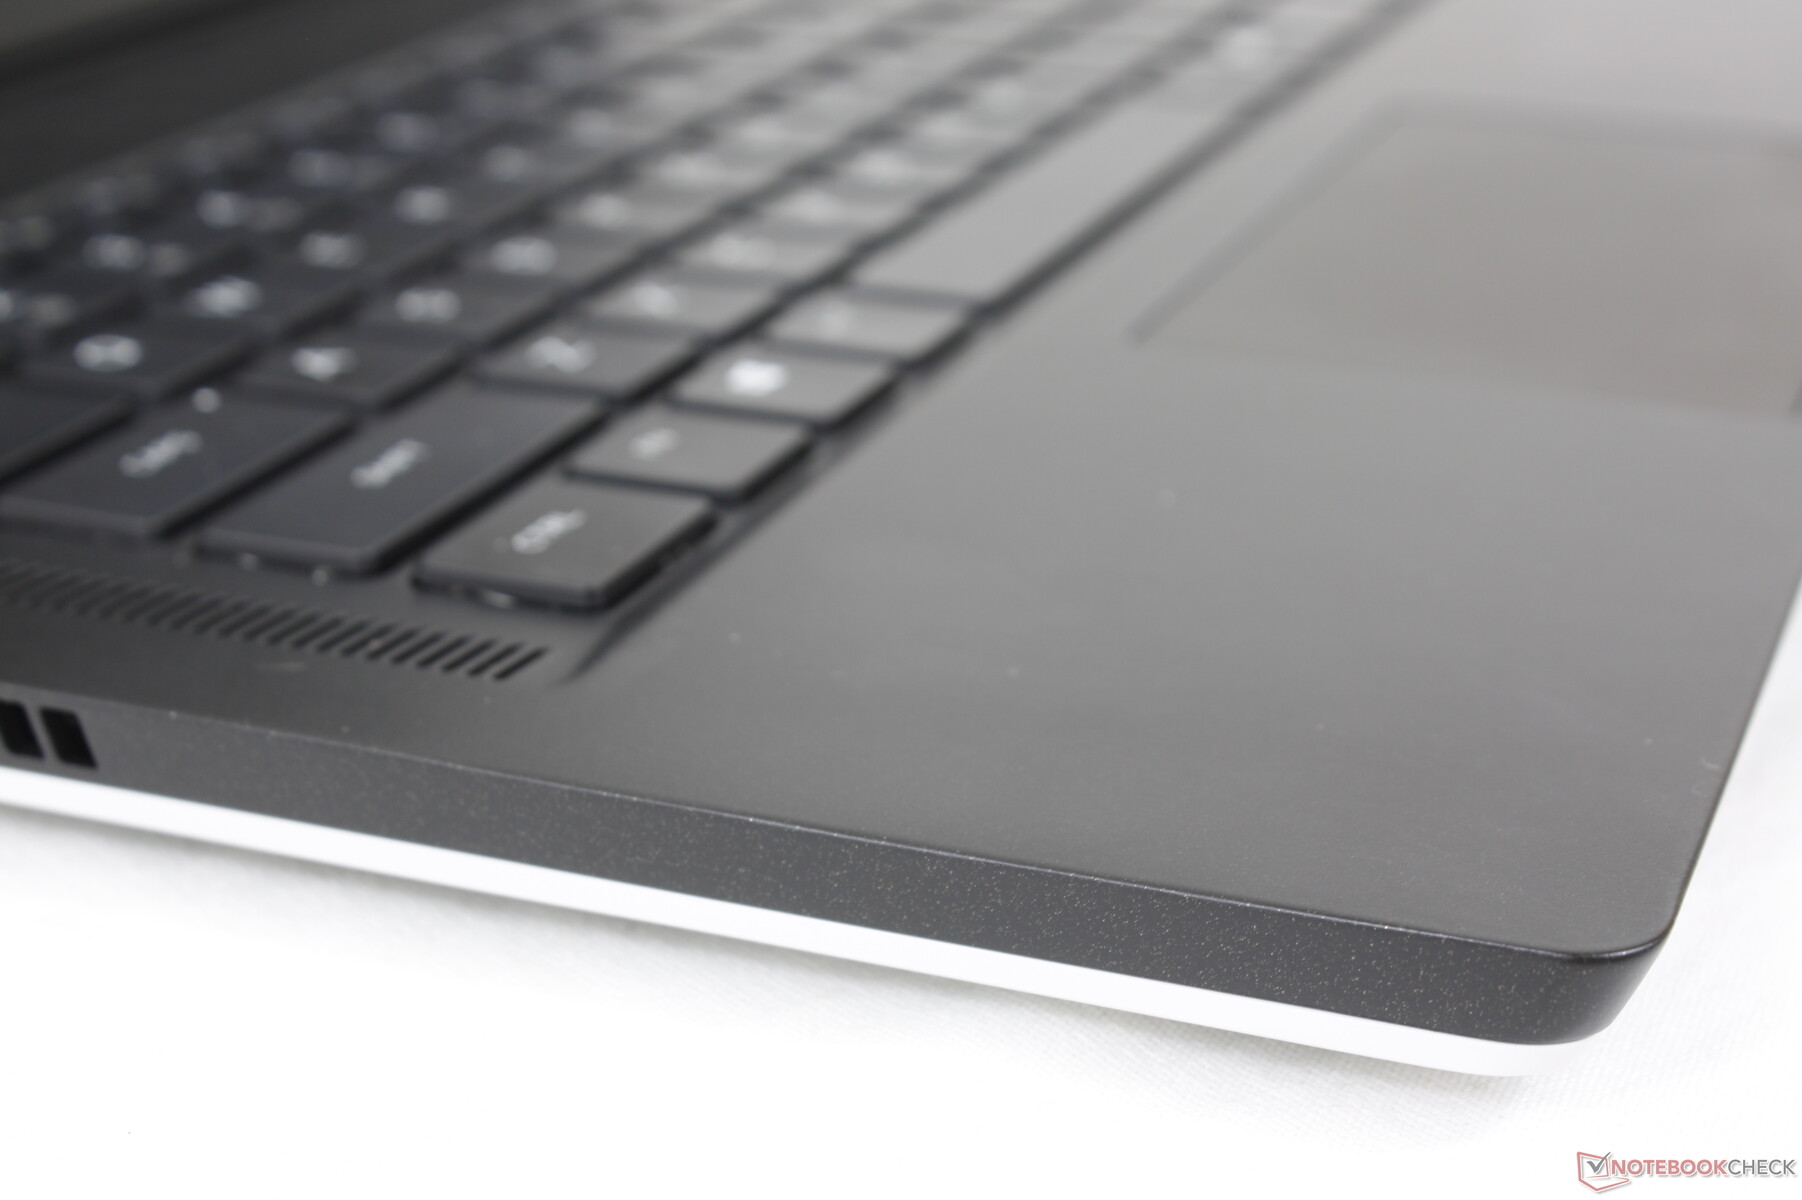
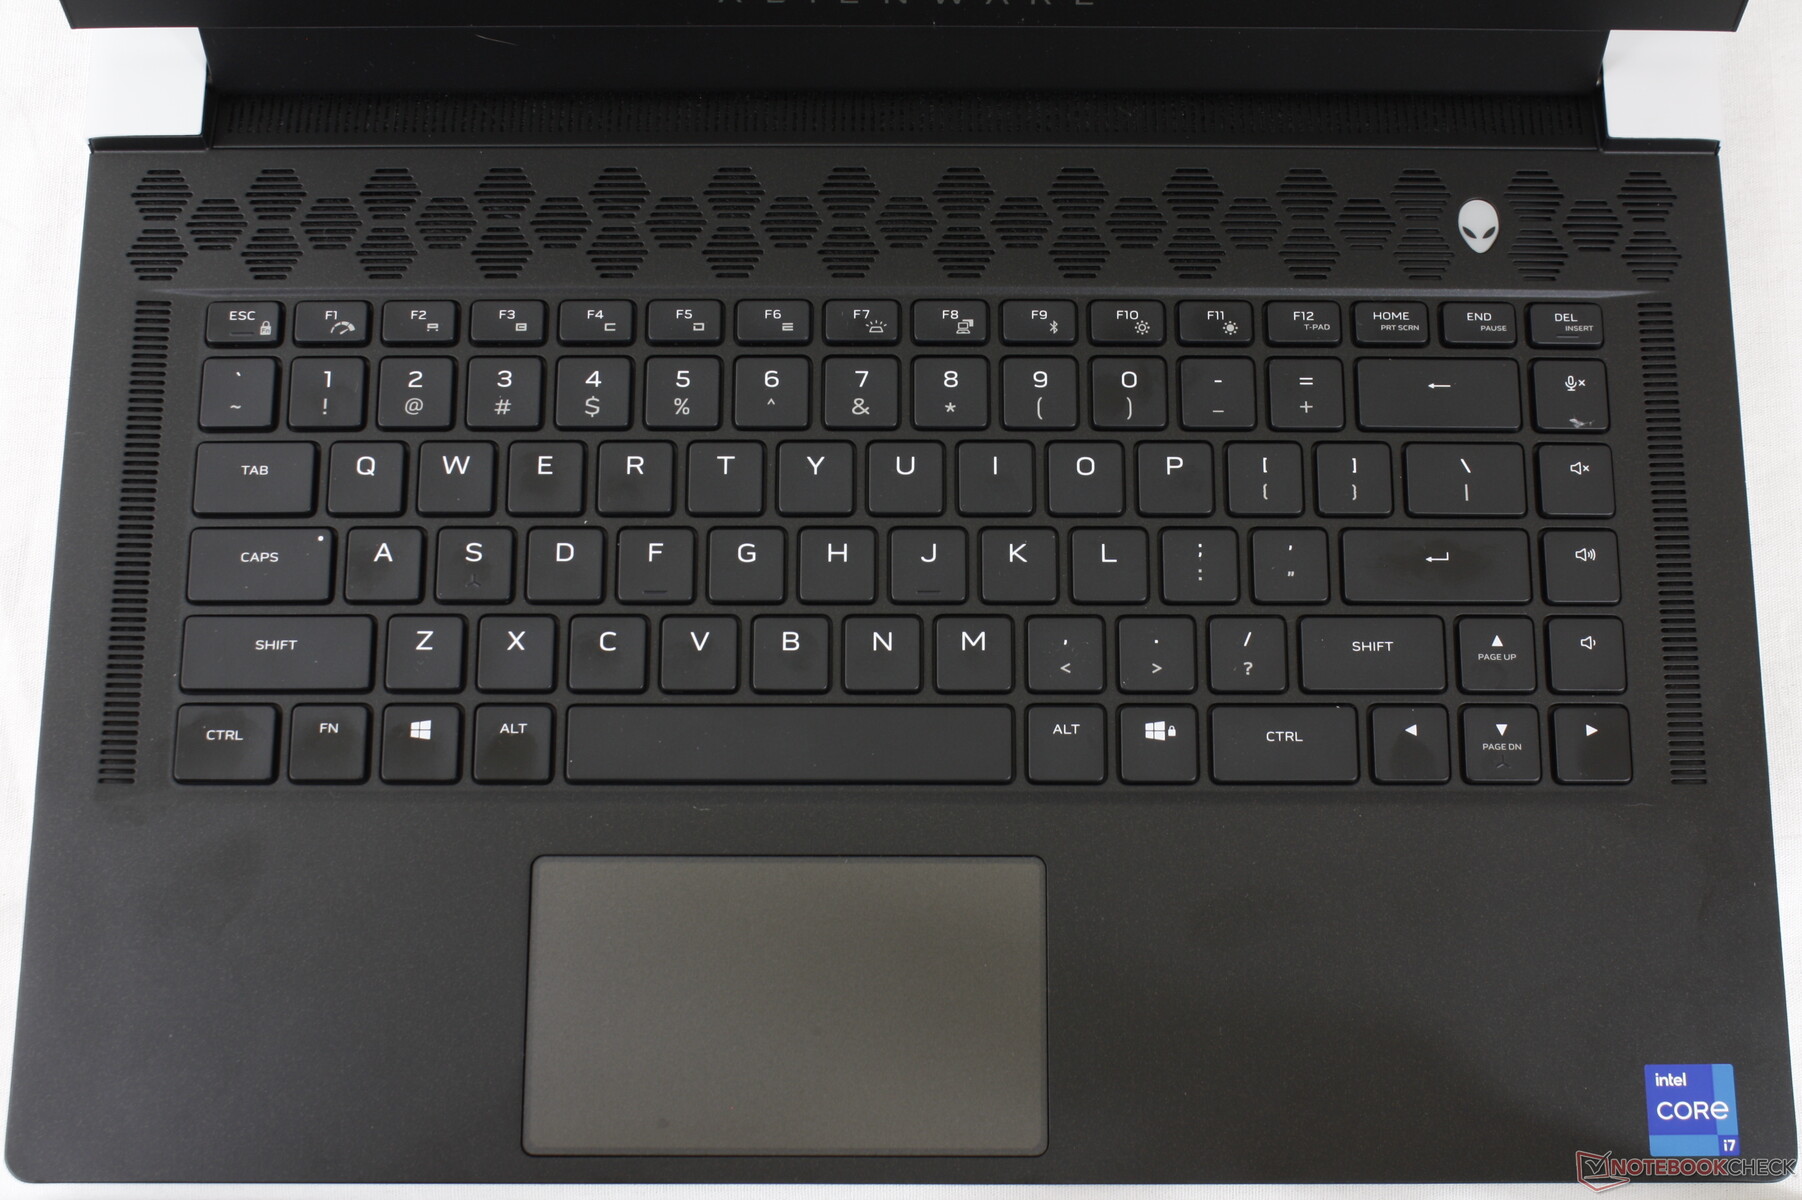
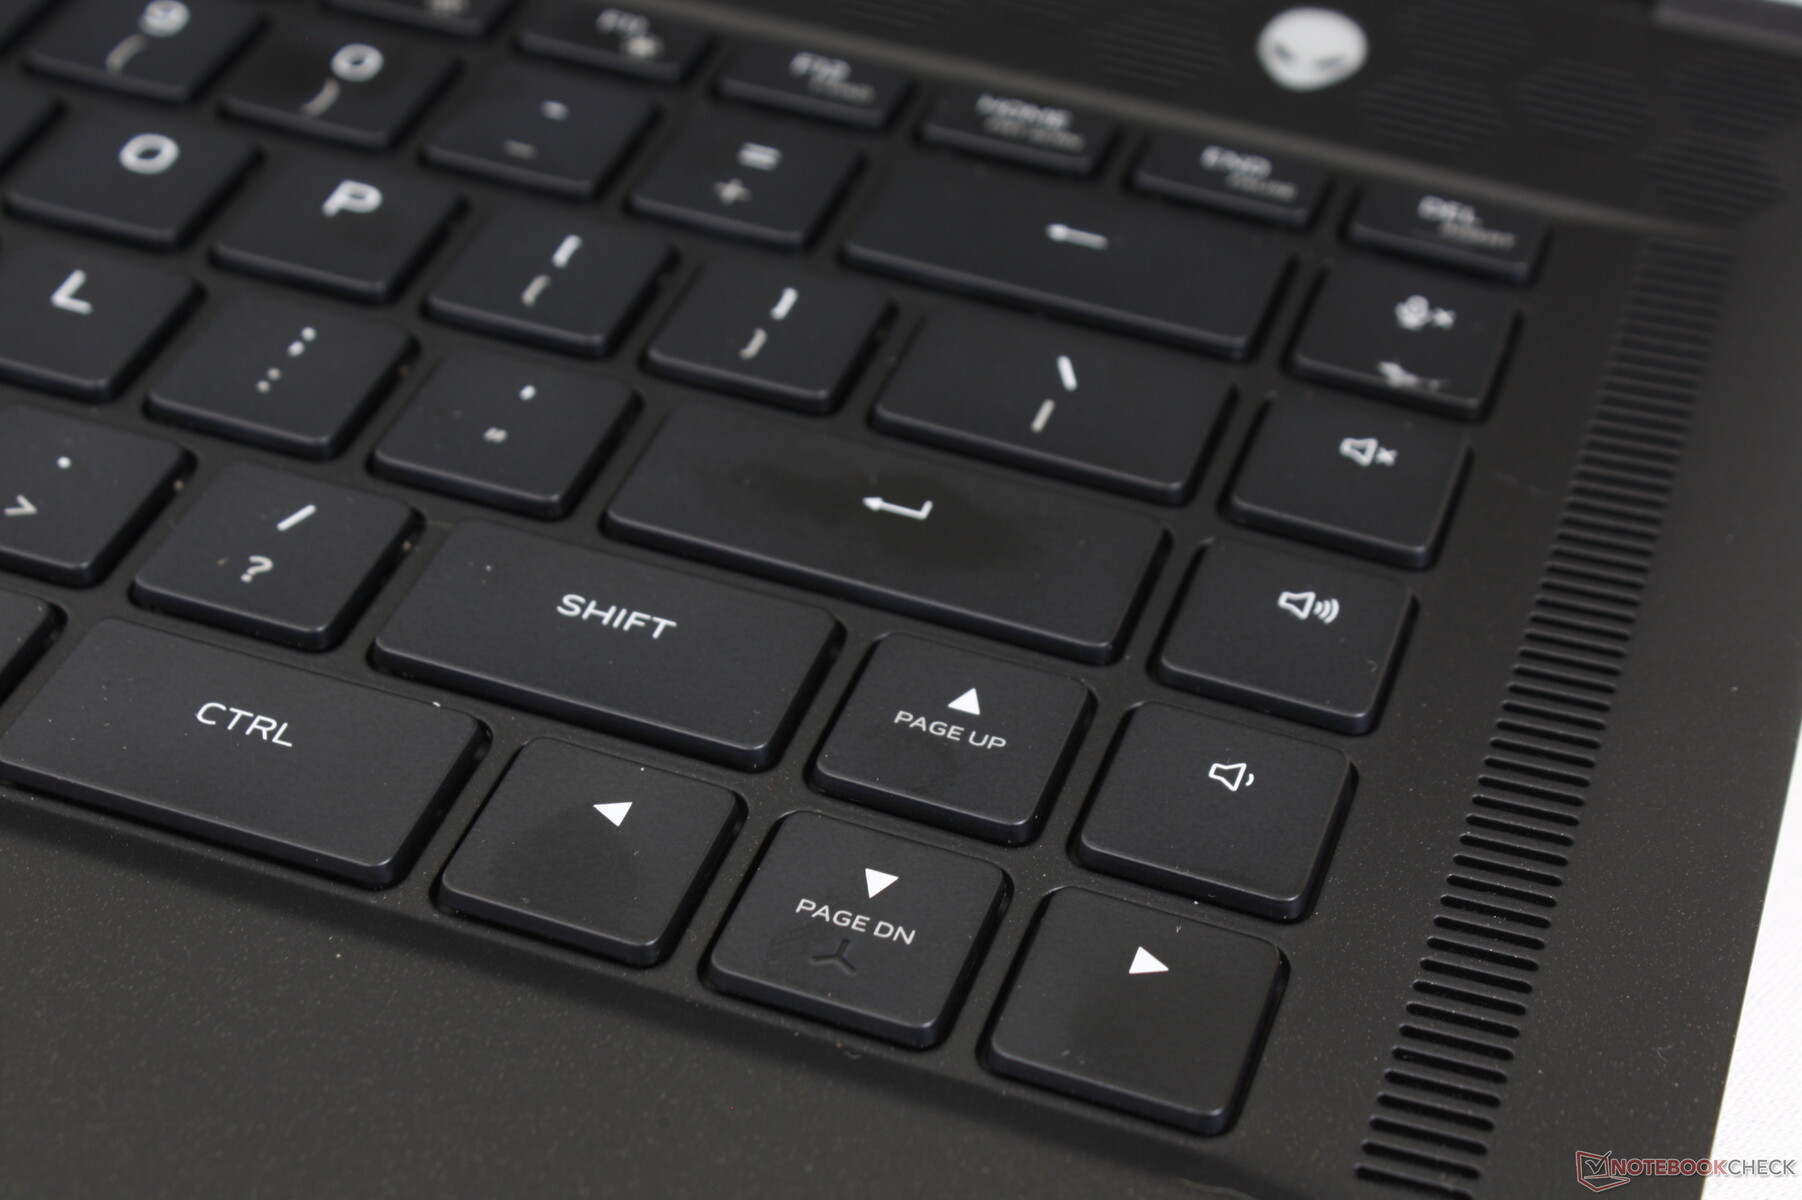
Beim x15 kommen membranbasierte Standardtasten mit individueller RGB-Tastenbeleuchtung zum Einsatz, wobei letztere gegenüber der 4-Zonenbeleuchtung des Alienware m15 R4 eine willkommene Neuerung darstellt. Das Tastenfeedback fällt deutlicher und härter aus, während der Tastenhub von 1,5 mm sichtlich größer ist als bei den Tasten vieler Ultrabooks. Insgesamt gefällt uns das Tippgefühl besser als bei der Asus-Zephyrus- und der Razer-Blade-15-Reihe. Das Betätigen der Eingabe- und der Leertaste wird akustisch viel lauter bestätigt als bei den QWERTZ-Standardtasten.
Ärgerlicherweise sind die sekundären Tastenbeschriftungen nicht beleuchtet - bei der älteren m15-Reihe war das anders. Auch die Tastatur des x17 R1 ist von diesem Problem betroffen.
Touchpad
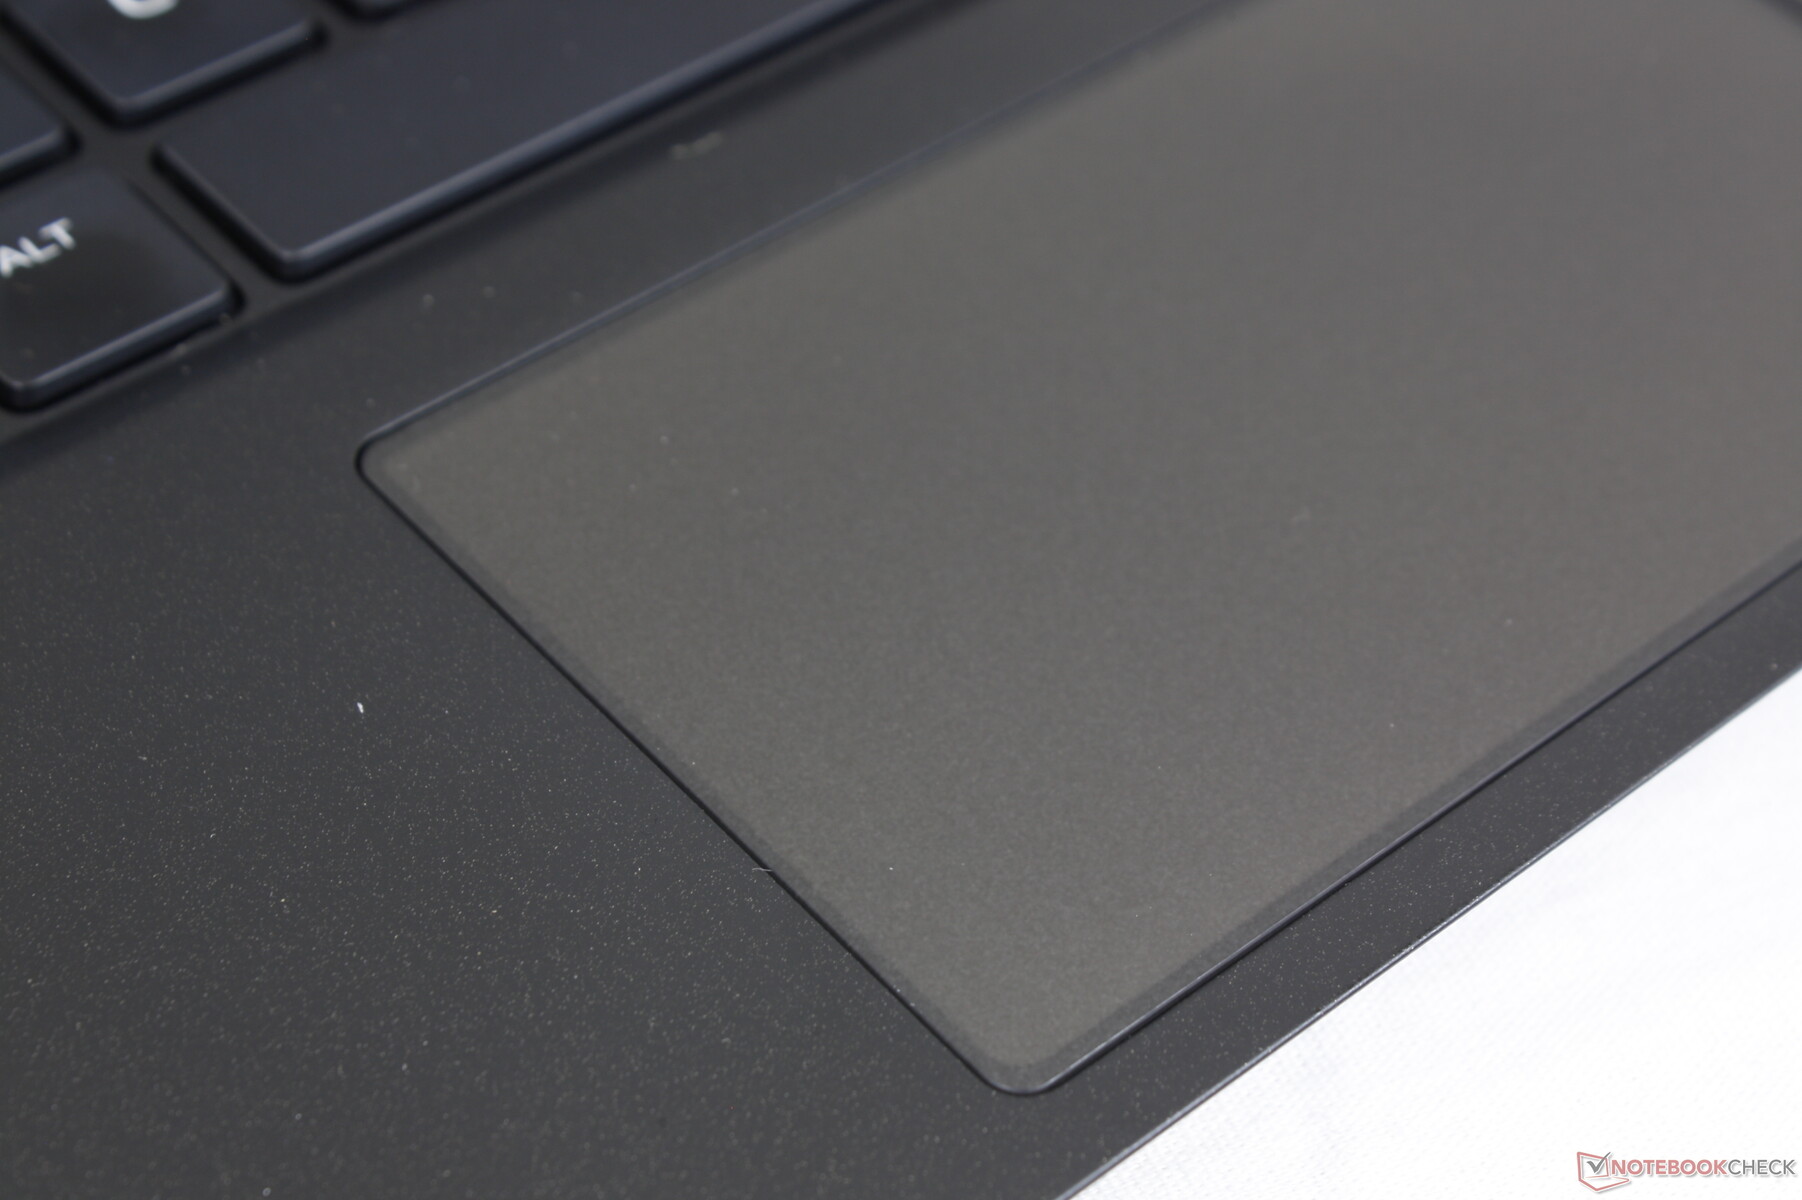
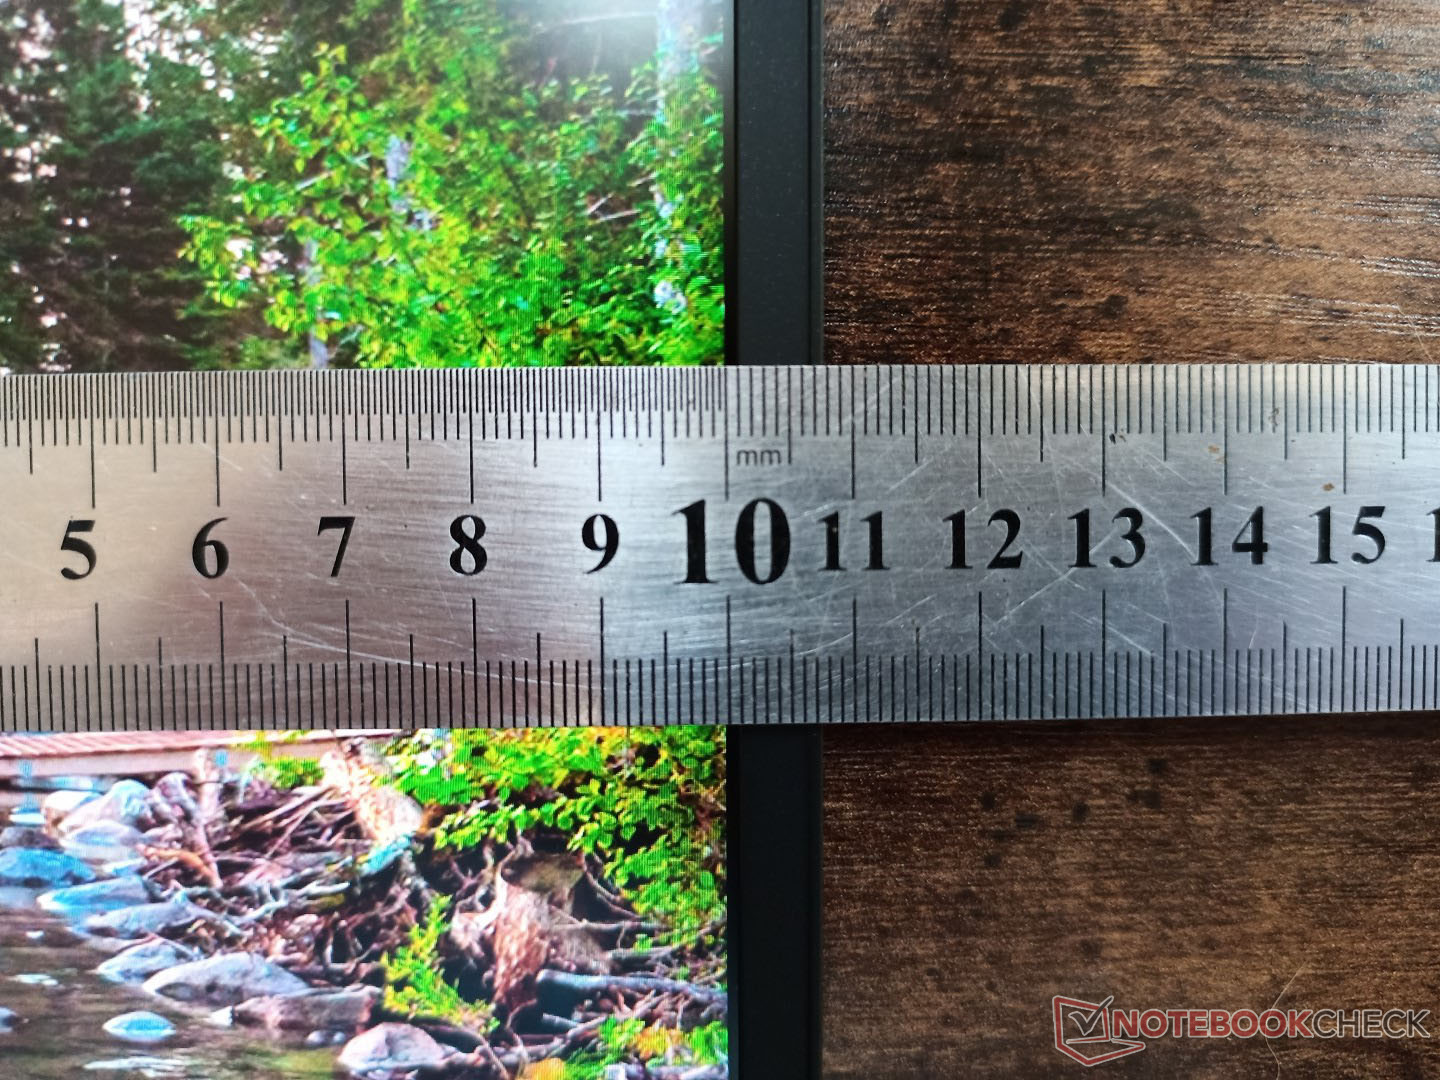
Mit nur 10,5 x 6 cm hat sich die Größe der ClickPad-Oberfläche gegenüber der des Vorgängers nicht verändert. Die Gleiteigenschaften sind bei mittleren bis schnellen Bewegungen gut, während Finger bei langsameren Geschwindigkeiten etwas stärker auf der Oberfläche haften, was der Präzision zugute kommt. Die Klicks wirken leider immer noch schwammig und bieten kein wirklich befriedigendes Tastenfeedback. Außerdem ist das dunkelgraue ClickPad deutlich anfälliger für Fingerabdrücke als das weiße Modell des Alienware m15.

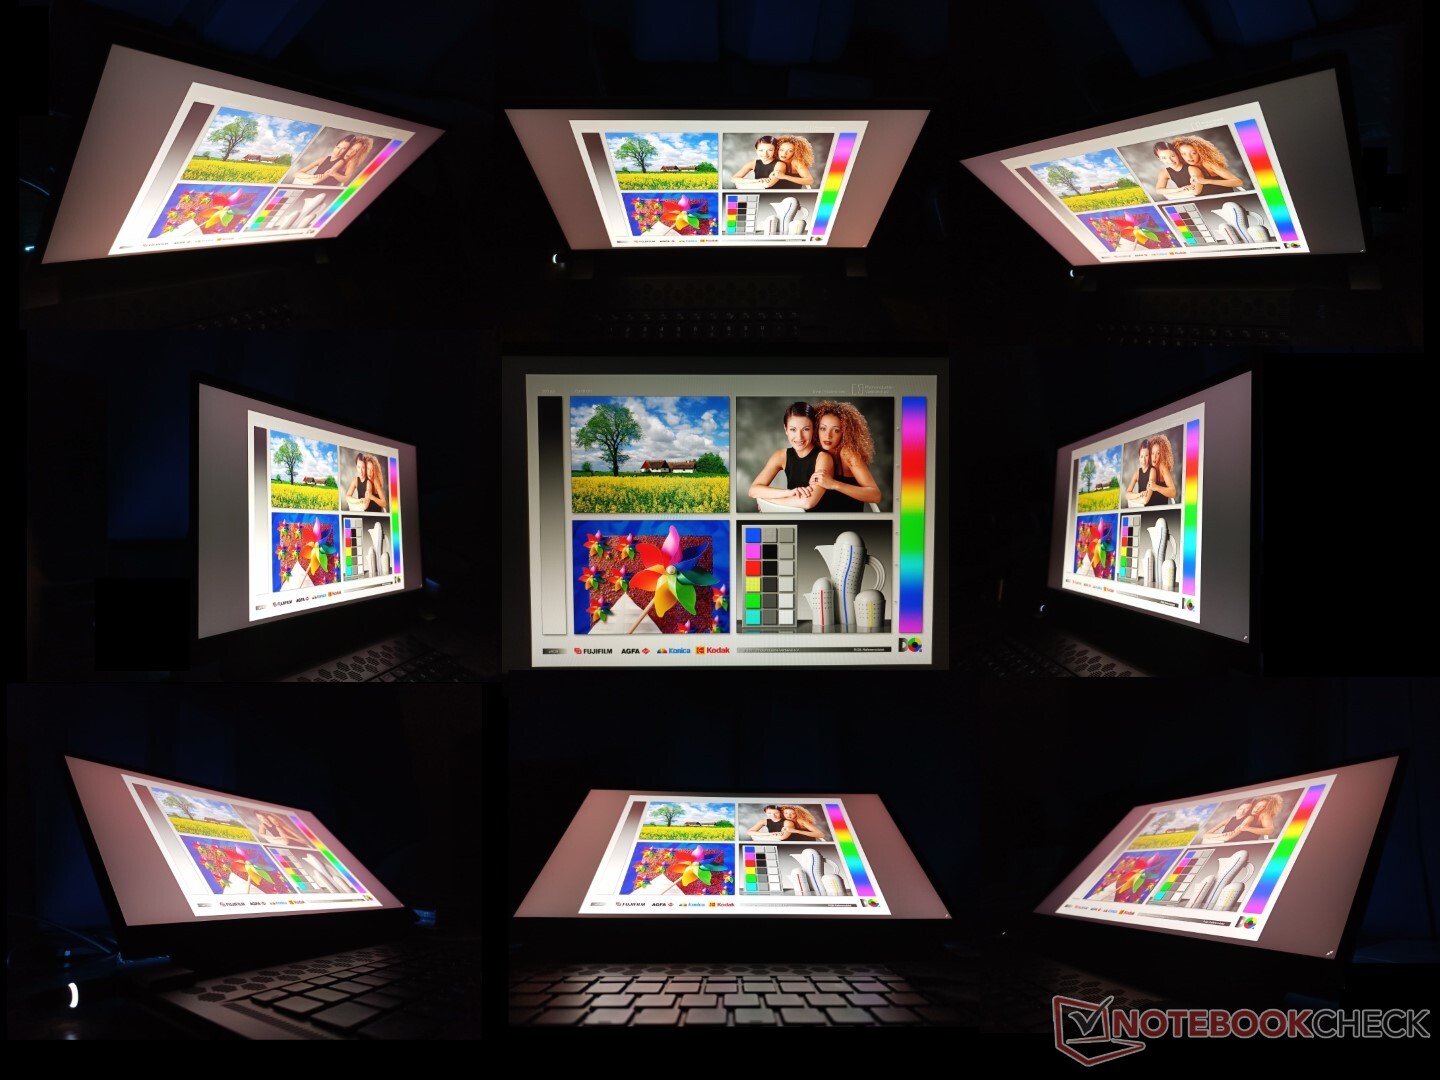
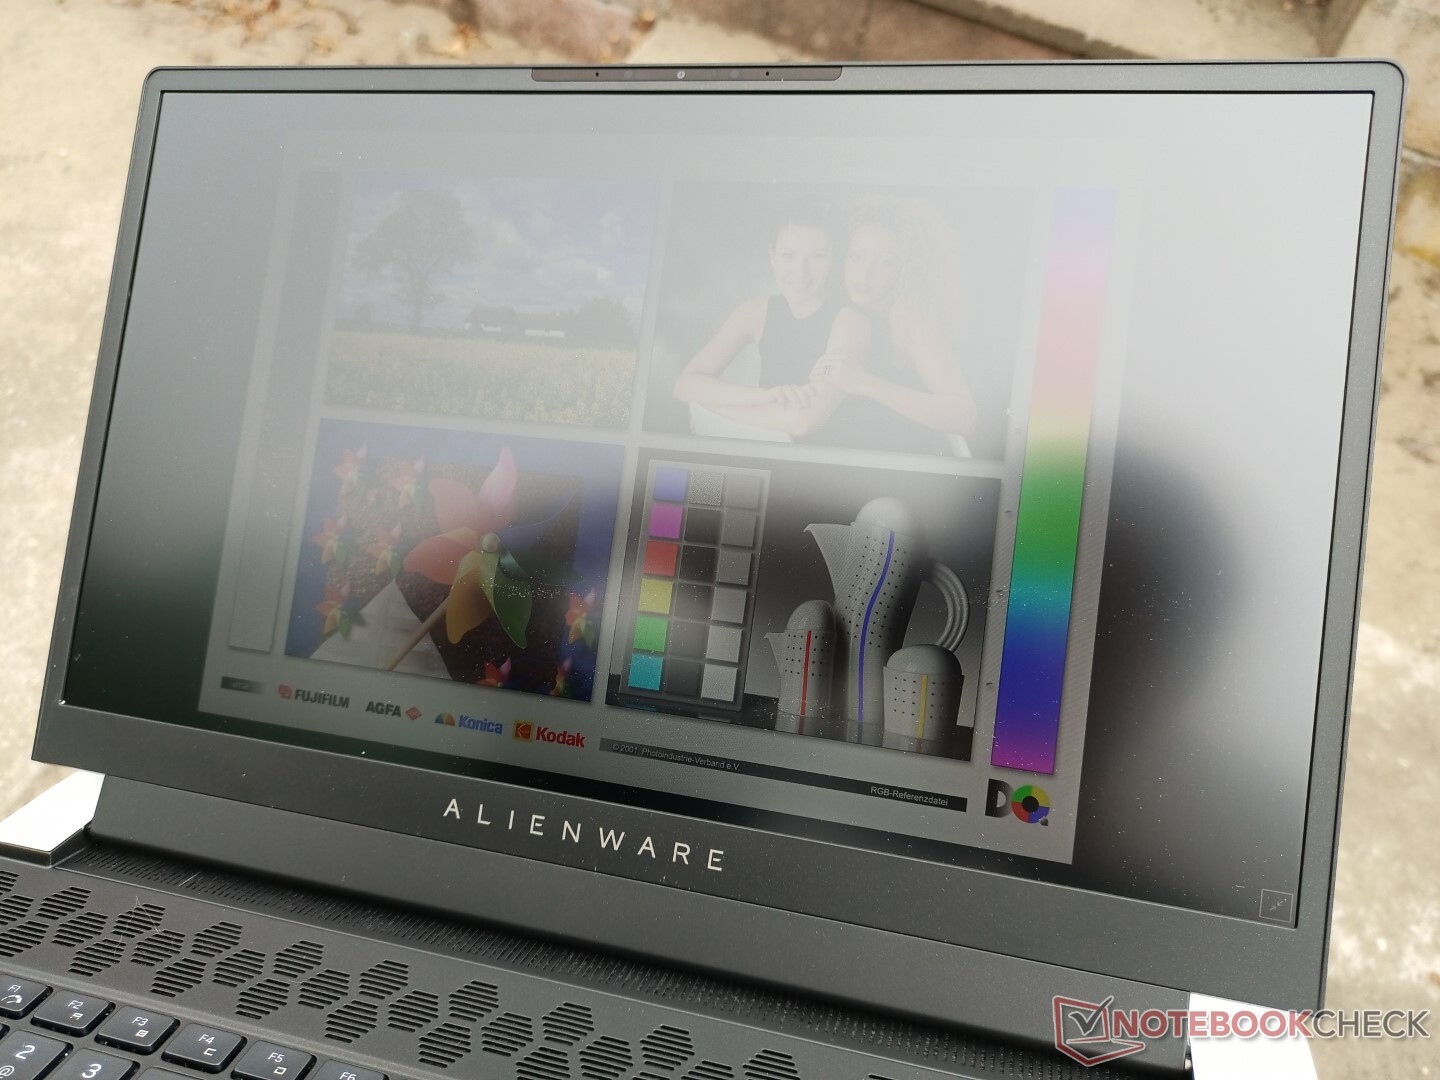
Display — Keine OLED-Optionen mehr
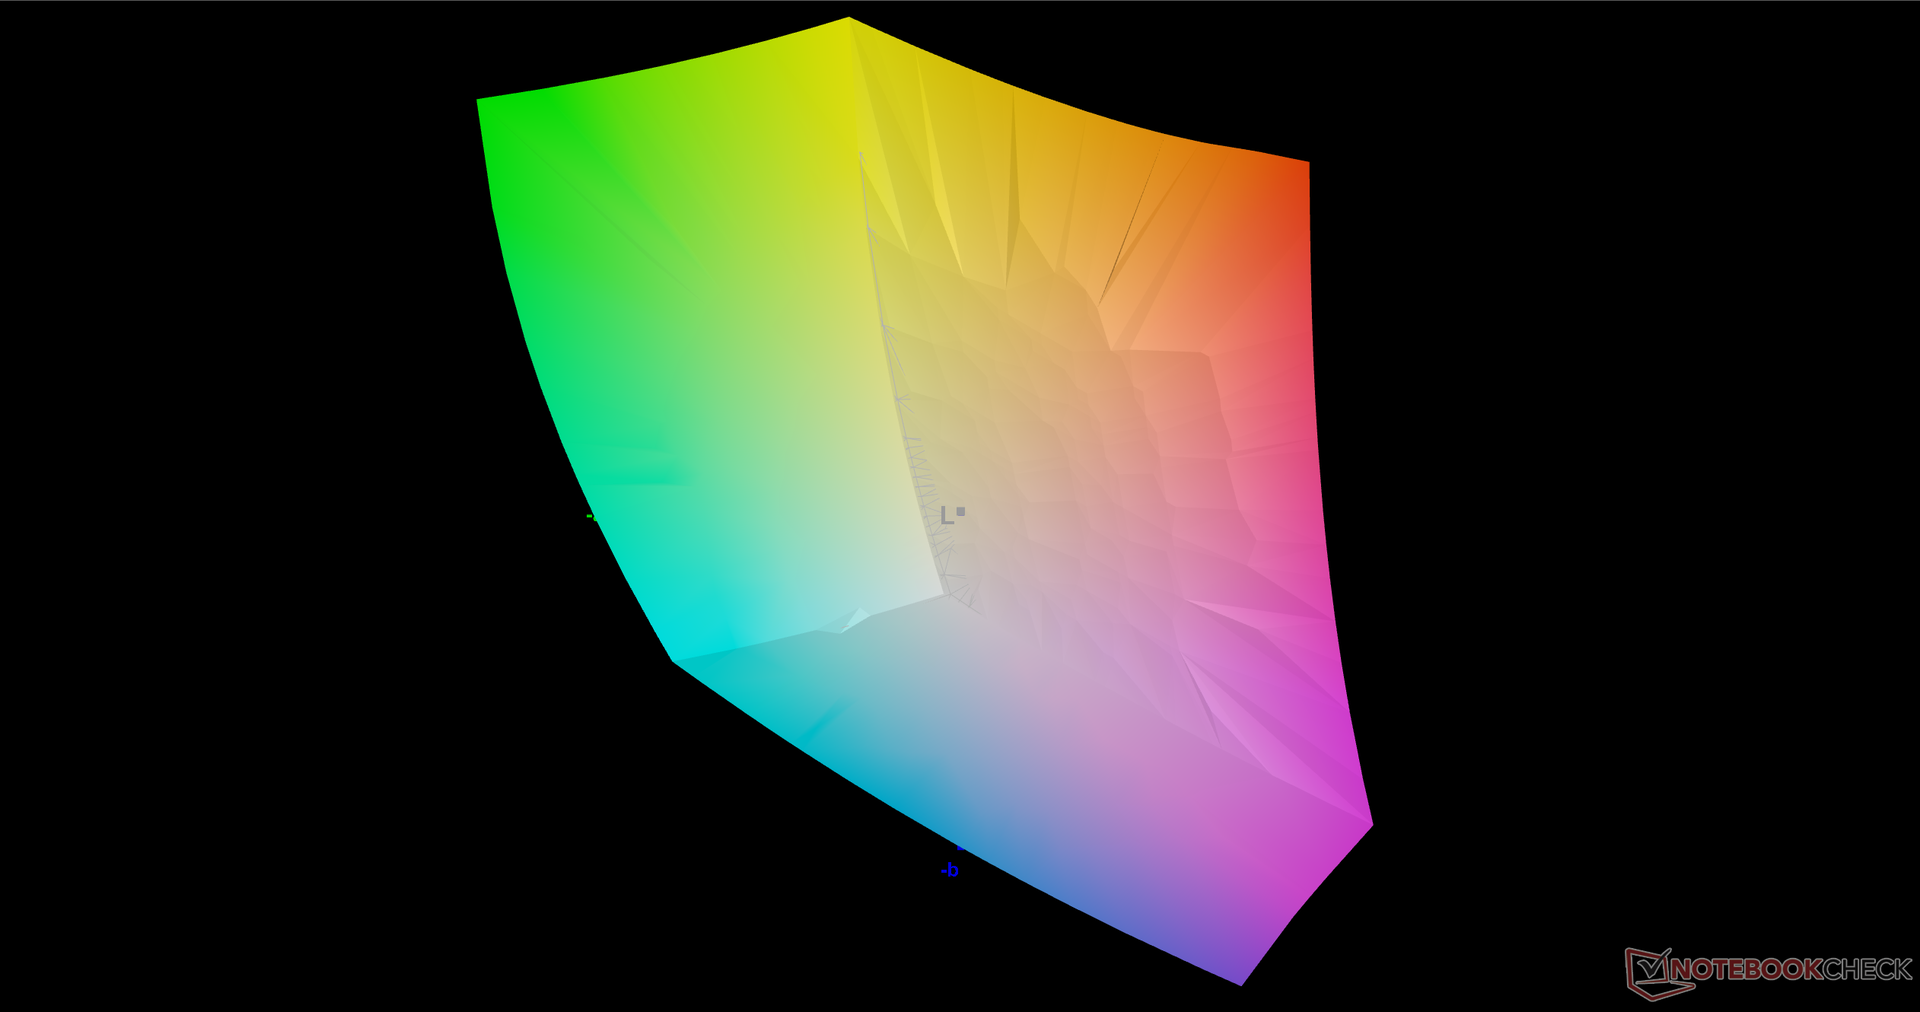
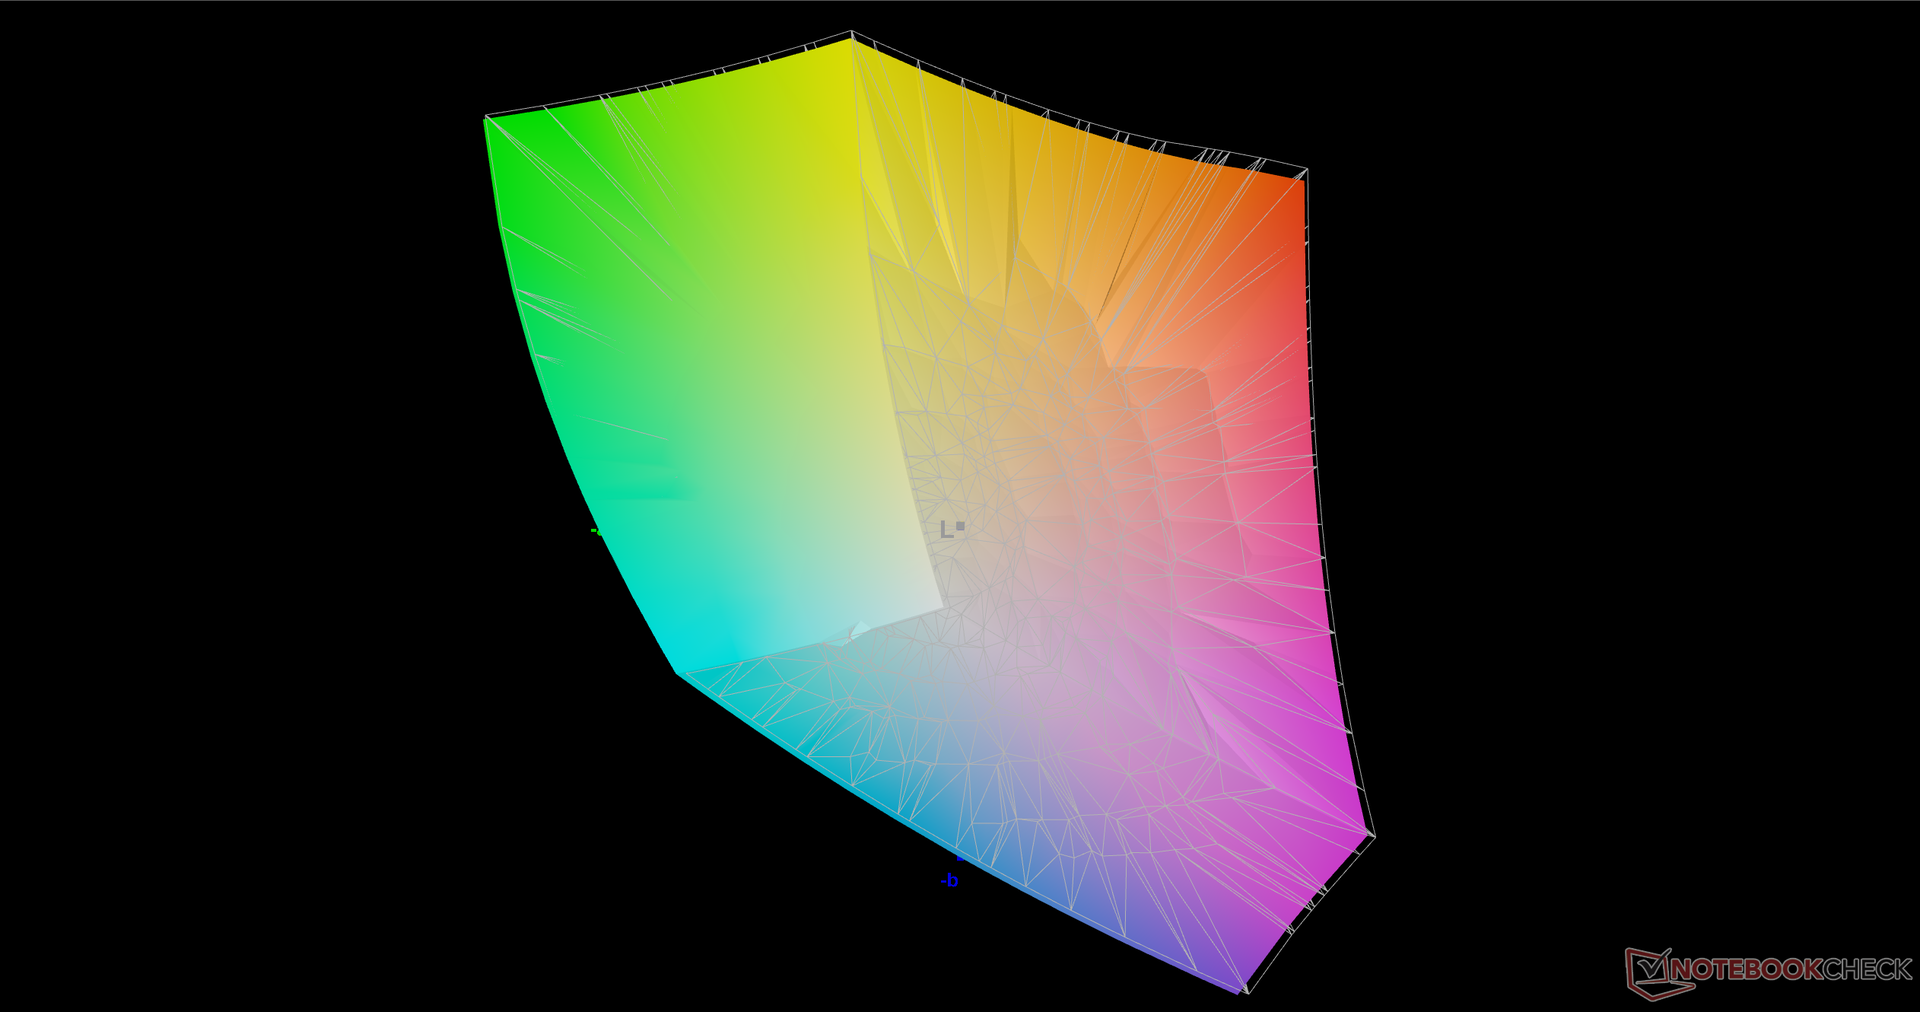
Das 1440p-IPS-Panel LG-Philips 156QHG ist in unserer Datenbank das erste seiner Art. Die Eckdaten sind hervorragend und beinhalten unter anderem schnelle Reaktionszeiten von nur 6 ms, eine schnelle Bildwiederholfrequenz von 240 Hz, eine fast hundertprozentige Abdeckung des DCI-P3-Farbraums und eine helle 400-cd/m²-Hintergrundbeleuchtung, die heller als beim neuen MSI GS66 und den meisten anderen 15,6-Zoll-Gaming-Laptops ist. Die vielleicht größte Schwäche ist das Kontrastverhältnis von ca. 900:1, welches für das vorliegende Preisniveau eher durchschnittlich ist.
| |||||||||||||||||||||||||
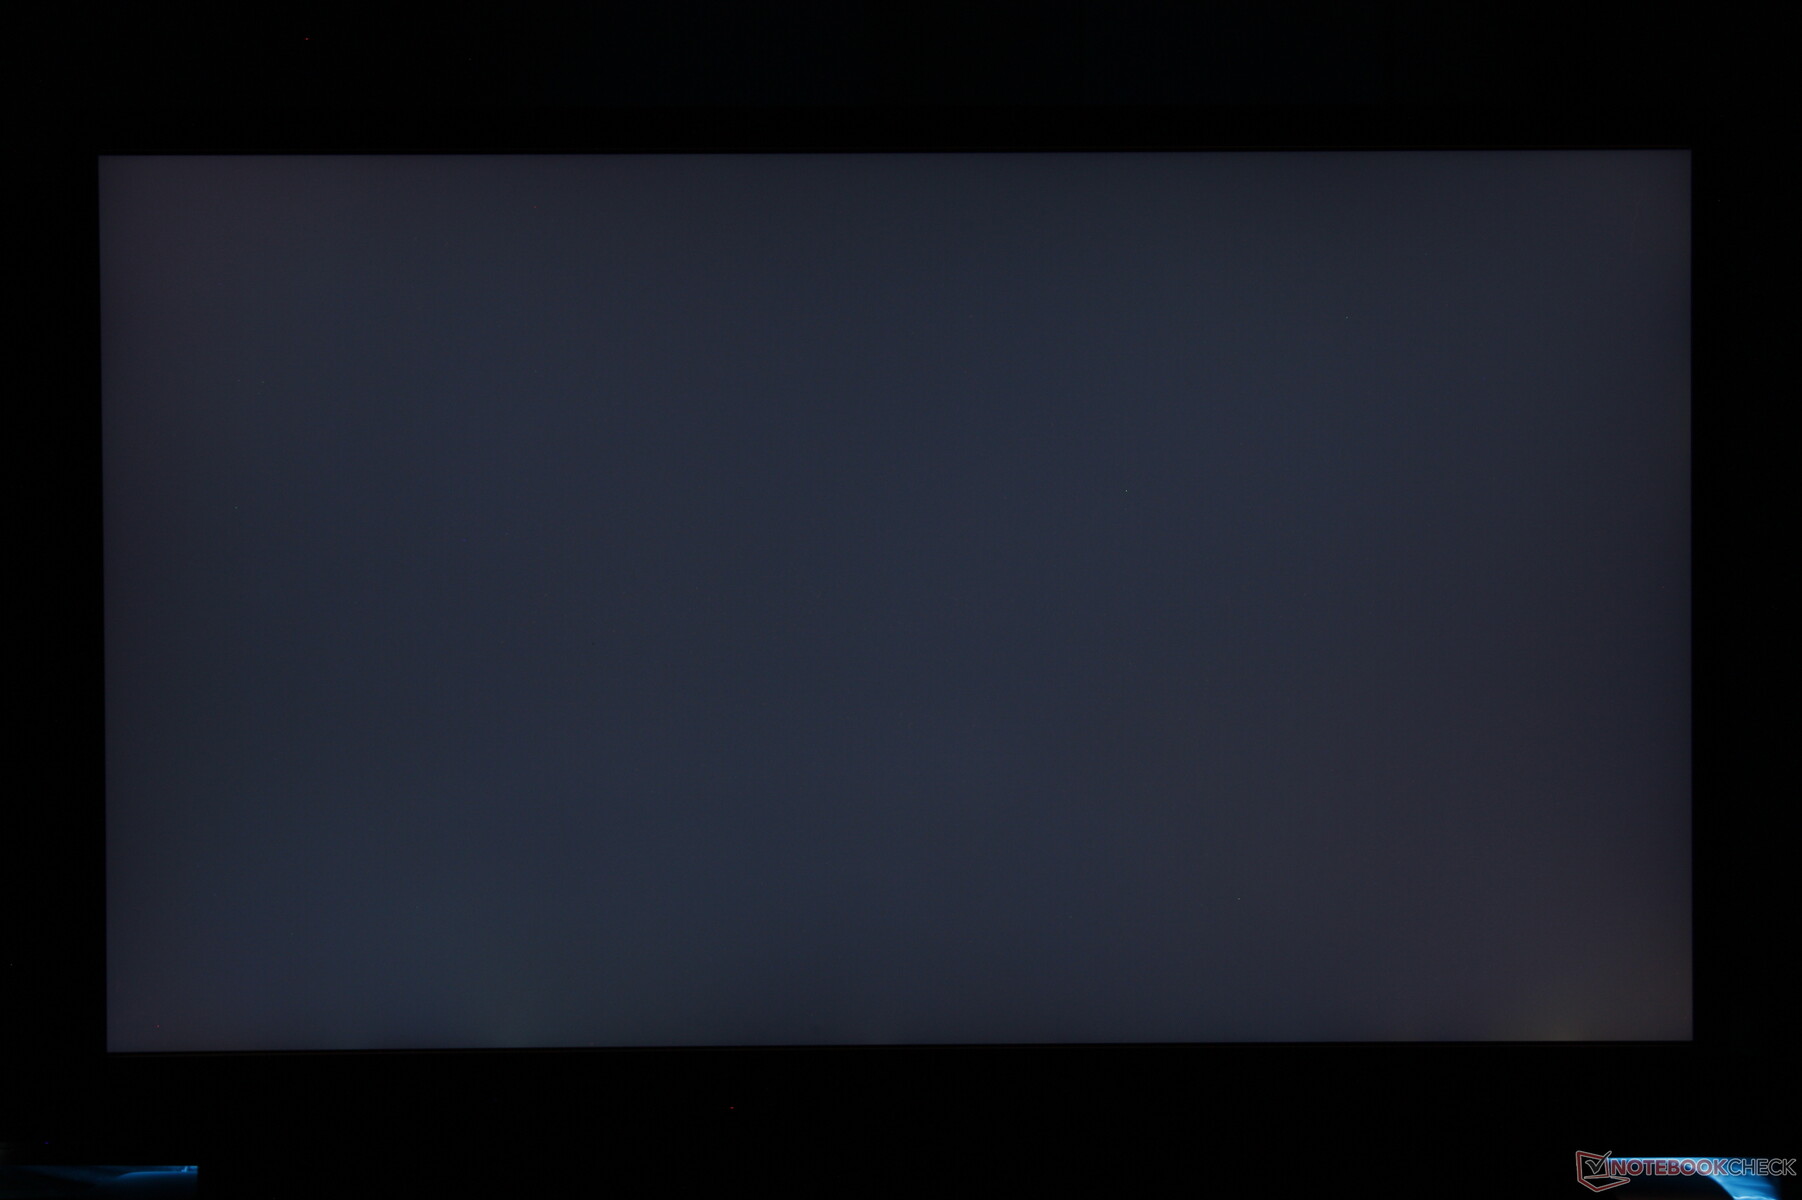
Ausleuchtung: 88 %
Helligkeit Akku: 409.5 cd/m²
Kontrast: 871:1 (Schwarzwert: 0.47 cd/m²)
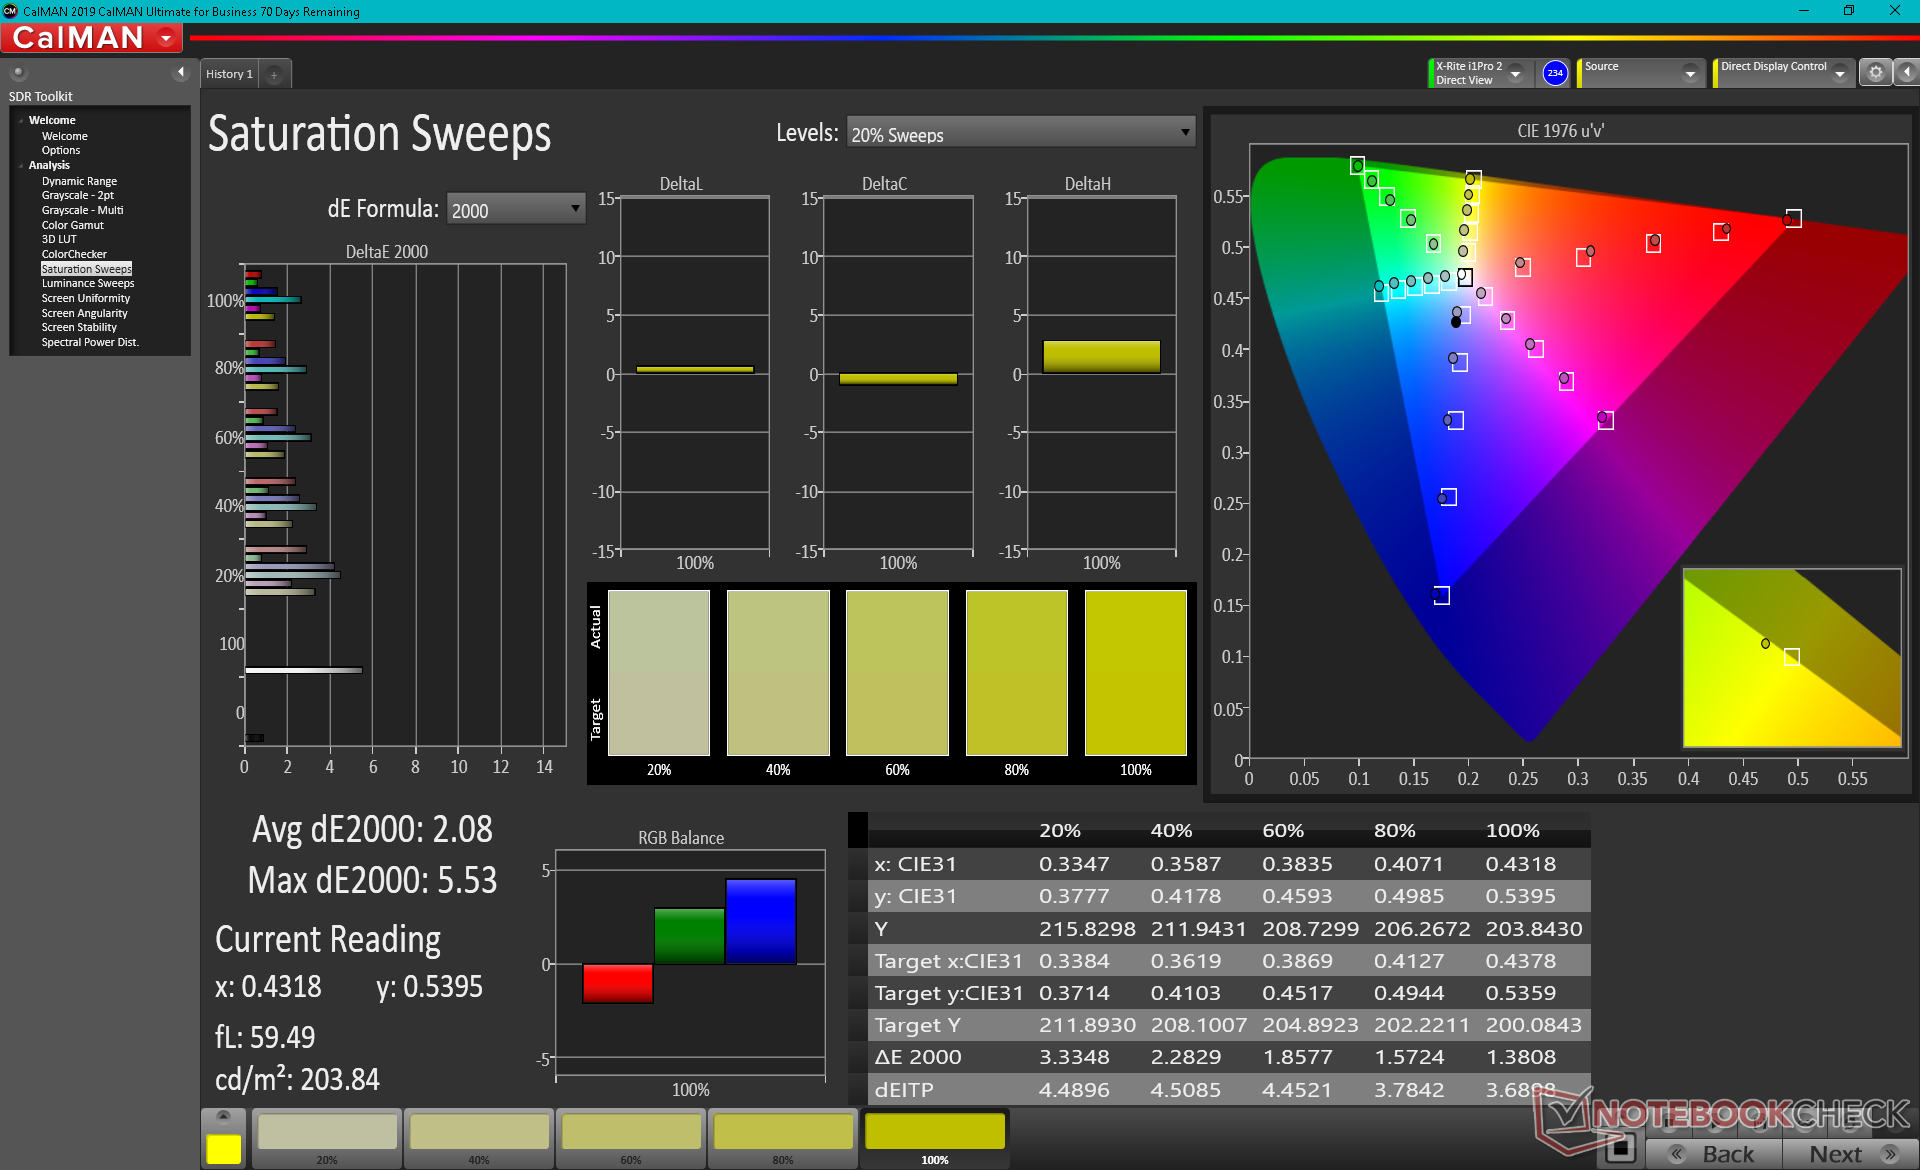
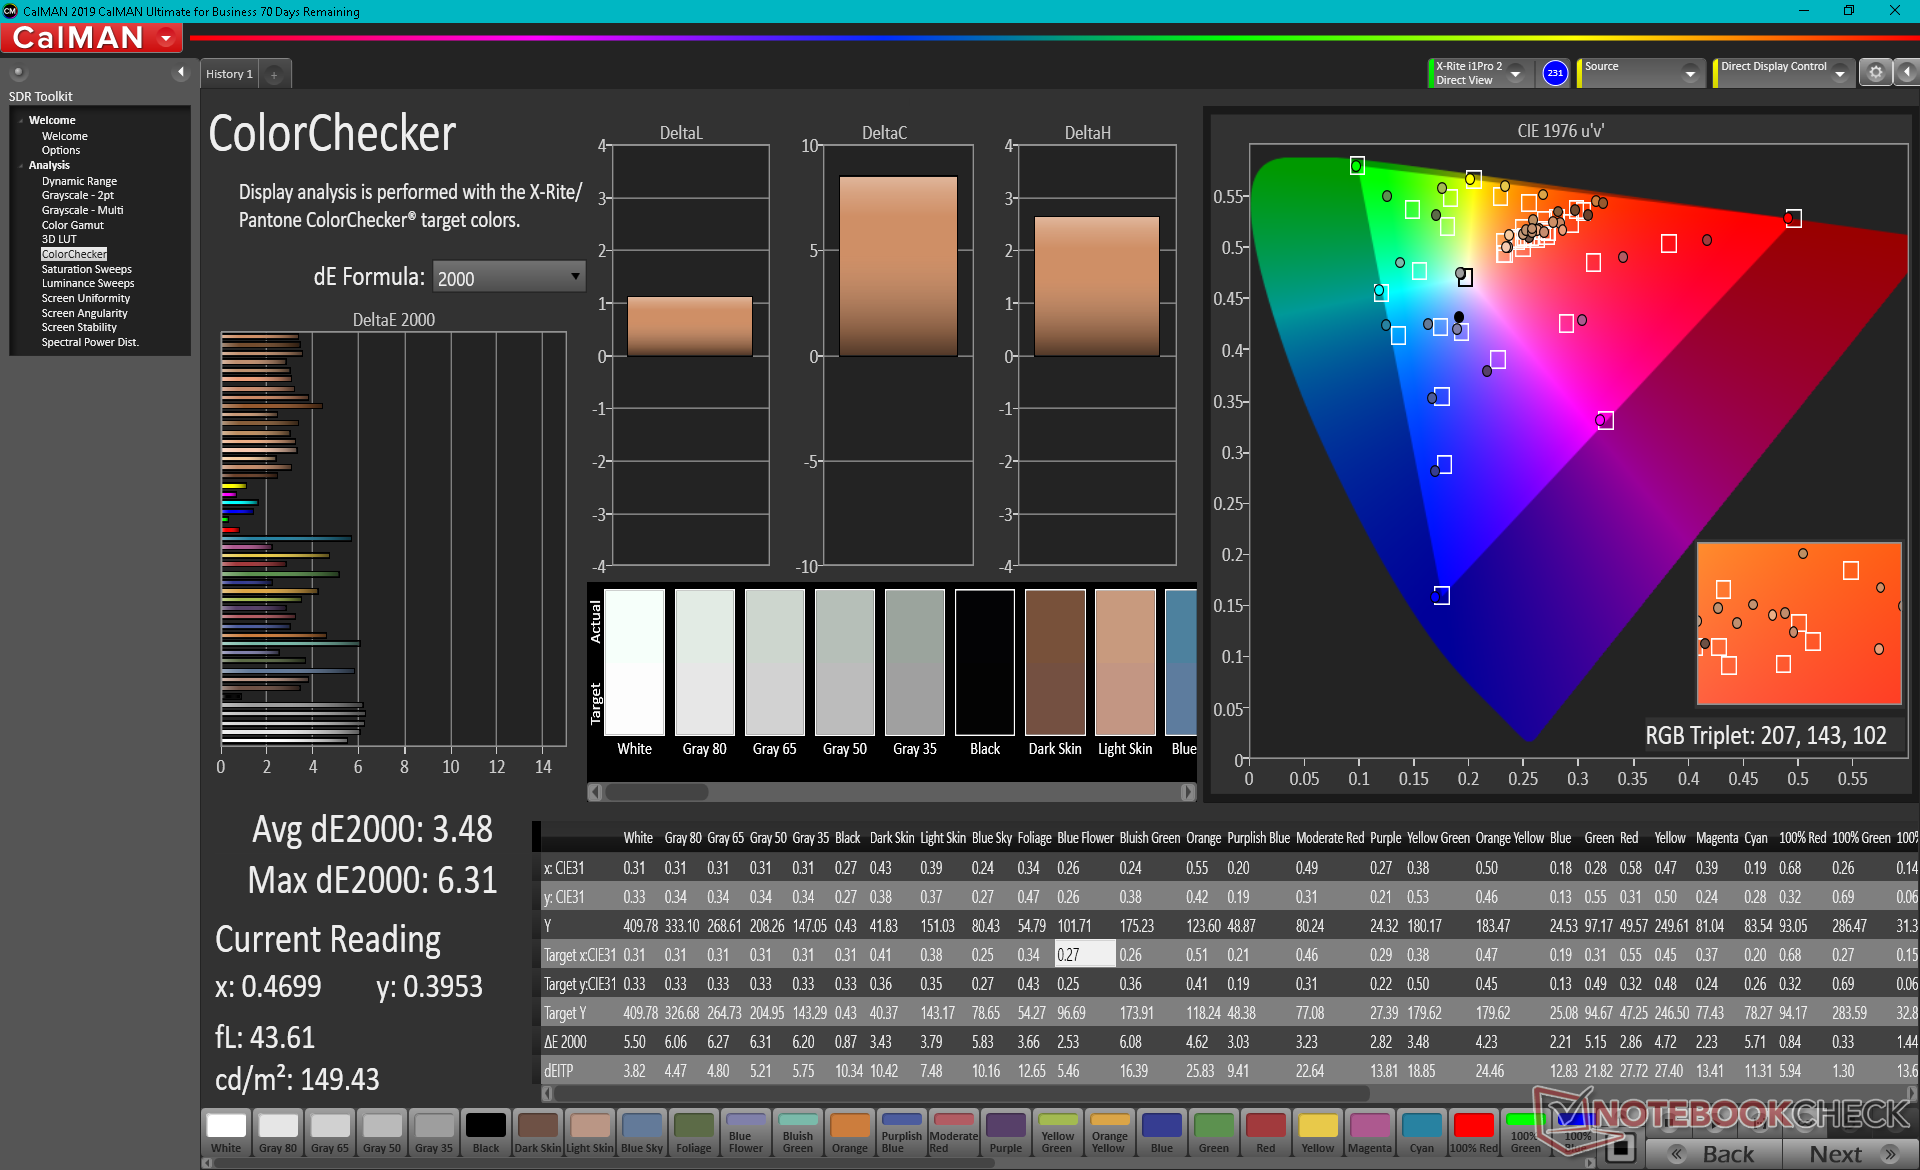
ΔE ColorChecker Calman: 3.48 | ∀{0.5-29.43 Ø4.73}
calibrated: 0.89
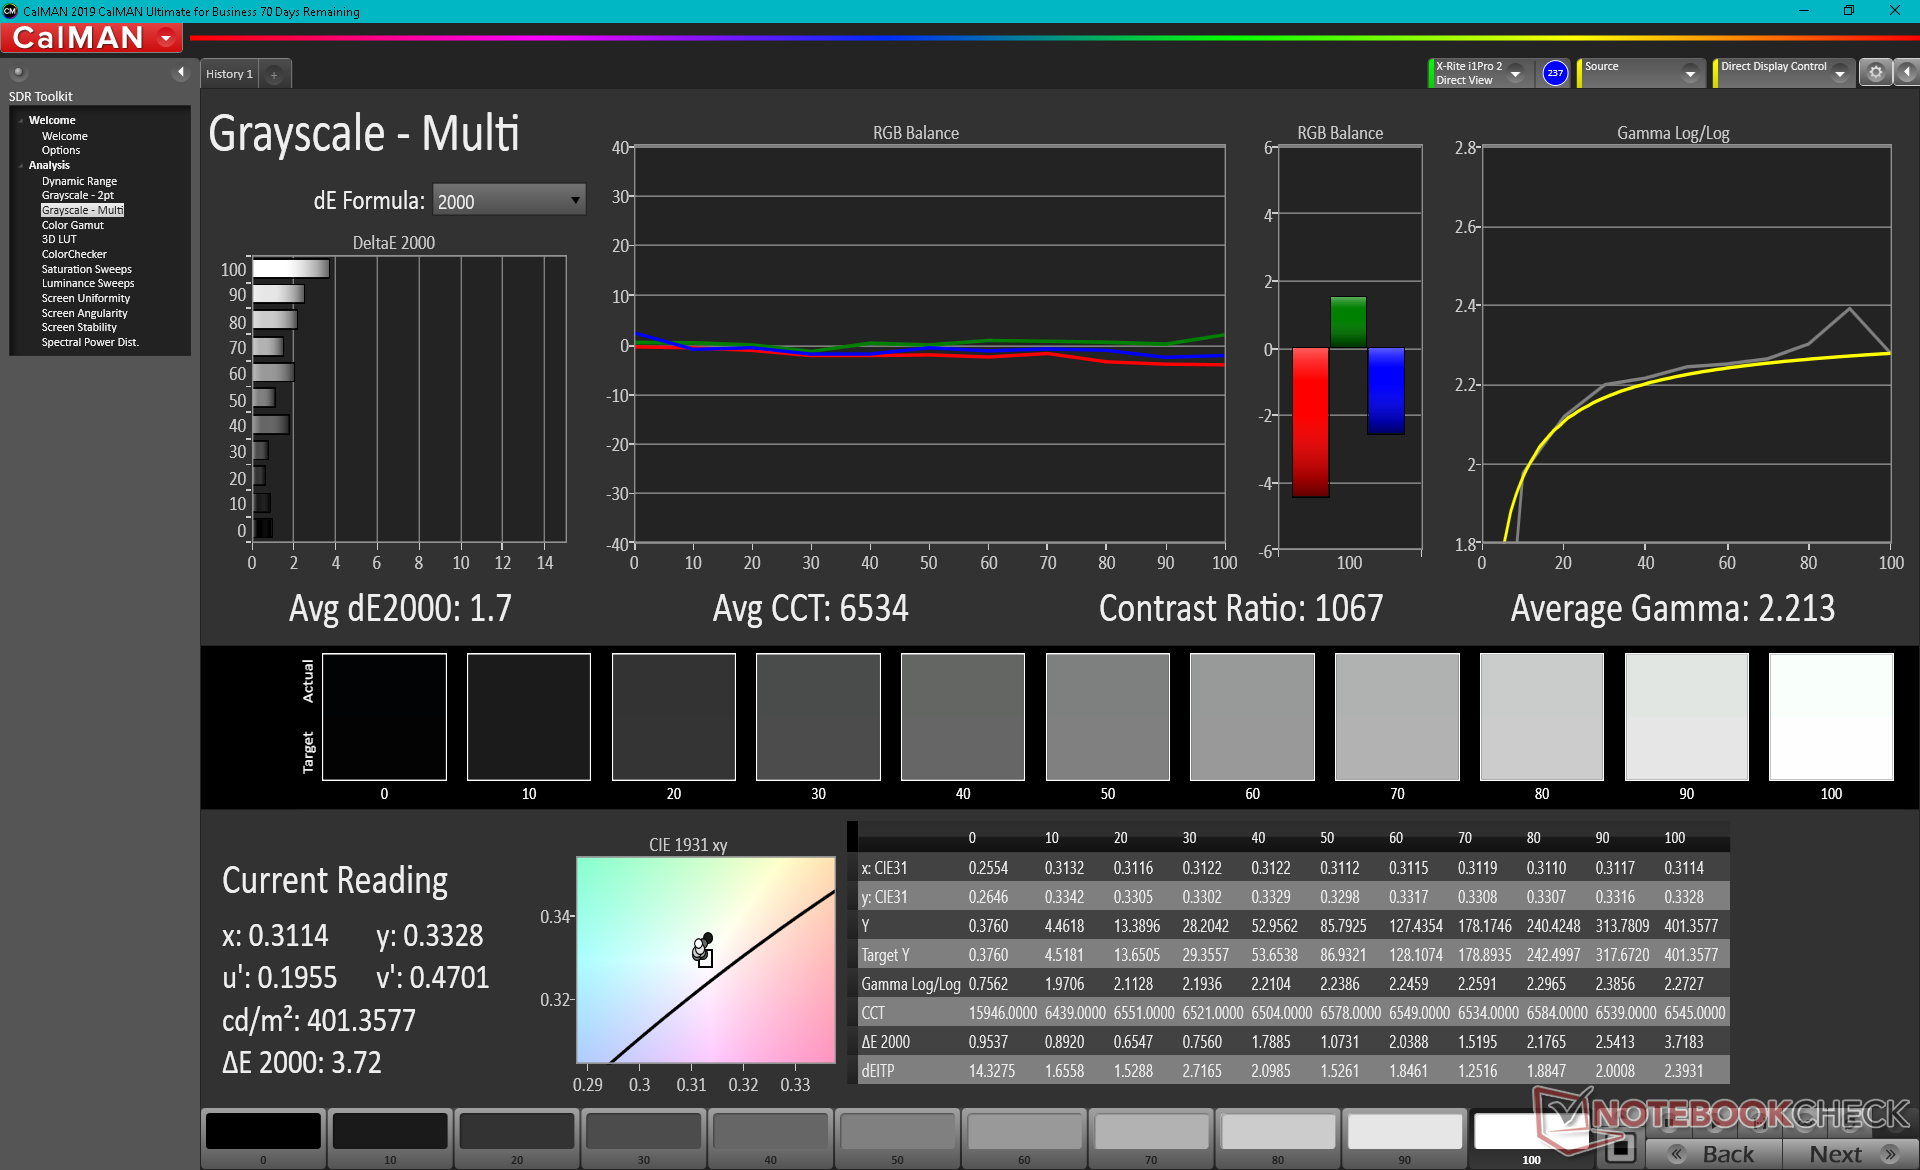
ΔE Greyscale Calman: 5 | ∀{0.09-98 Ø4.97}
99.9% sRGB (Argyll 3D)
97.8% Display P3 (Argyll 3D)
Gamma: 2.16
CCT: 6591 K
| Alienware x15 RTX 3070 P111F LG Philips 156QHG, IPS, 15.6", 2560x1440 | Alienware m15 R4 RTX 3080 LG Philips LGD066E (156WFG), IPS, 15.6", 1920x1080 | MSI GS66 Stealth 10UG AU Optronics B156HAN12.0, IPS, 15.6", 1920x1080 | Razer Blade 15 Advanced (Mid 2021) TL156VDXP02-0, IPS, 15.6", 1920x1080 | Asus Zephyrus S15 GX502L B156HAN12.0 (AUOBC8C), IPS, 15.6", 1920x1080 | Acer Predator Helios 300 PH315-53-786B Sharp LQ156M1JW09, IPS, 15.6", 1920x1080 | |
|---|---|---|---|---|---|---|
| Display | -14% | -17% | -18% | -15% | -16% | |
| Display P3 Coverage (%) | 97.8 | 70.1 -28% | 67.7 -31% | 66.9 -32% | 69.7 -29% | 68.4 -30% |
| sRGB Coverage (%) | 99.9 | 99.8 0% | 98.4 -2% | 97.1 -3% | 99.7 0% | 99.4 -1% |
| AdobeRGB 1998 Coverage (%) | 71.5 | 69.1 | 69 | 71.1 | 70.4 | |
| Response Times | 23% | -16% | 35% | -5% | -8% | |
| Response Time Grey 50% / Grey 80% * (ms) | 12 ? | 7.6 ? 37% | 14.4 ? -20% | 4.2 ? 65% | 14 ? -17% | 15.2 ? -27% |
| Response Time Black / White * (ms) | 10.4 ? | 9.6 ? 8% | 11.6 ? -12% | 10 ? 4% | 9.6 ? 8% | 9.2 ? 12% |
| PWM Frequency (Hz) | 23580 ? | |||||
| Bildschirm | 19% | -1% | 12% | 9% | 3% | |
| Helligkeit Bildmitte (cd/m²) | 409.5 | 347 -15% | 259.5 -37% | 353.4 -14% | 283 -31% | 312 -24% |
| Brightness (cd/m²) | 390 | 318 -18% | 264 -32% | 340 -13% | 289 -26% | 290 -26% |
| Brightness Distribution (%) | 88 | 86 -2% | 90 2% | 92 5% | 90 2% | 87 -1% |
| Schwarzwert * (cd/m²) | 0.47 | 0.31 34% | 0.25 47% | 0.31 34% | 0.24 49% | 0.32 32% |
| Kontrast (:1) | 871 | 1119 28% | 1038 19% | 1140 31% | 1179 35% | 975 12% |
| Delta E Colorchecker * | 3.48 | 1.68 52% | 2.52 28% | 2.17 38% | 2.26 35% | 3.03 13% |
| Colorchecker dE 2000 max. * | 6.31 | 3.03 52% | 5.55 12% | 5.69 10% | 5.64 11% | 6.81 -8% |
| Colorchecker dE 2000 calibrated * | 0.89 | 1.08 -21% | 1.93 -117% | 1.05 -18% | 1.11 -25% | 0.71 20% |
| Delta E Graustufen * | 5 | 1.8 64% | 1.7 66% | 3.4 32% | 3.4 32% | 4.7 6% |
| Gamma | 2.16 102% | 2.262 97% | 2.04 108% | 2.2 100% | 2.228 99% | 2.177 101% |
| CCT | 6591 99% | 6592 99% | 6414 101% | 6830 95% | 7249 90% | 6676 97% |
| Farbraum (Prozent von AdobeRGB 1998) (%) | 71 | 63.3 | 71 | |||
| Color Space (Percent of sRGB) (%) | 94 | 98.8 | 93 | |||
| Durchschnitt gesamt (Programm / Settings) | 9% /
15% | -11% /
-6% | 10% /
11% | -4% /
3% | -7% /
-2% |
* ... kleinere Werte sind besser
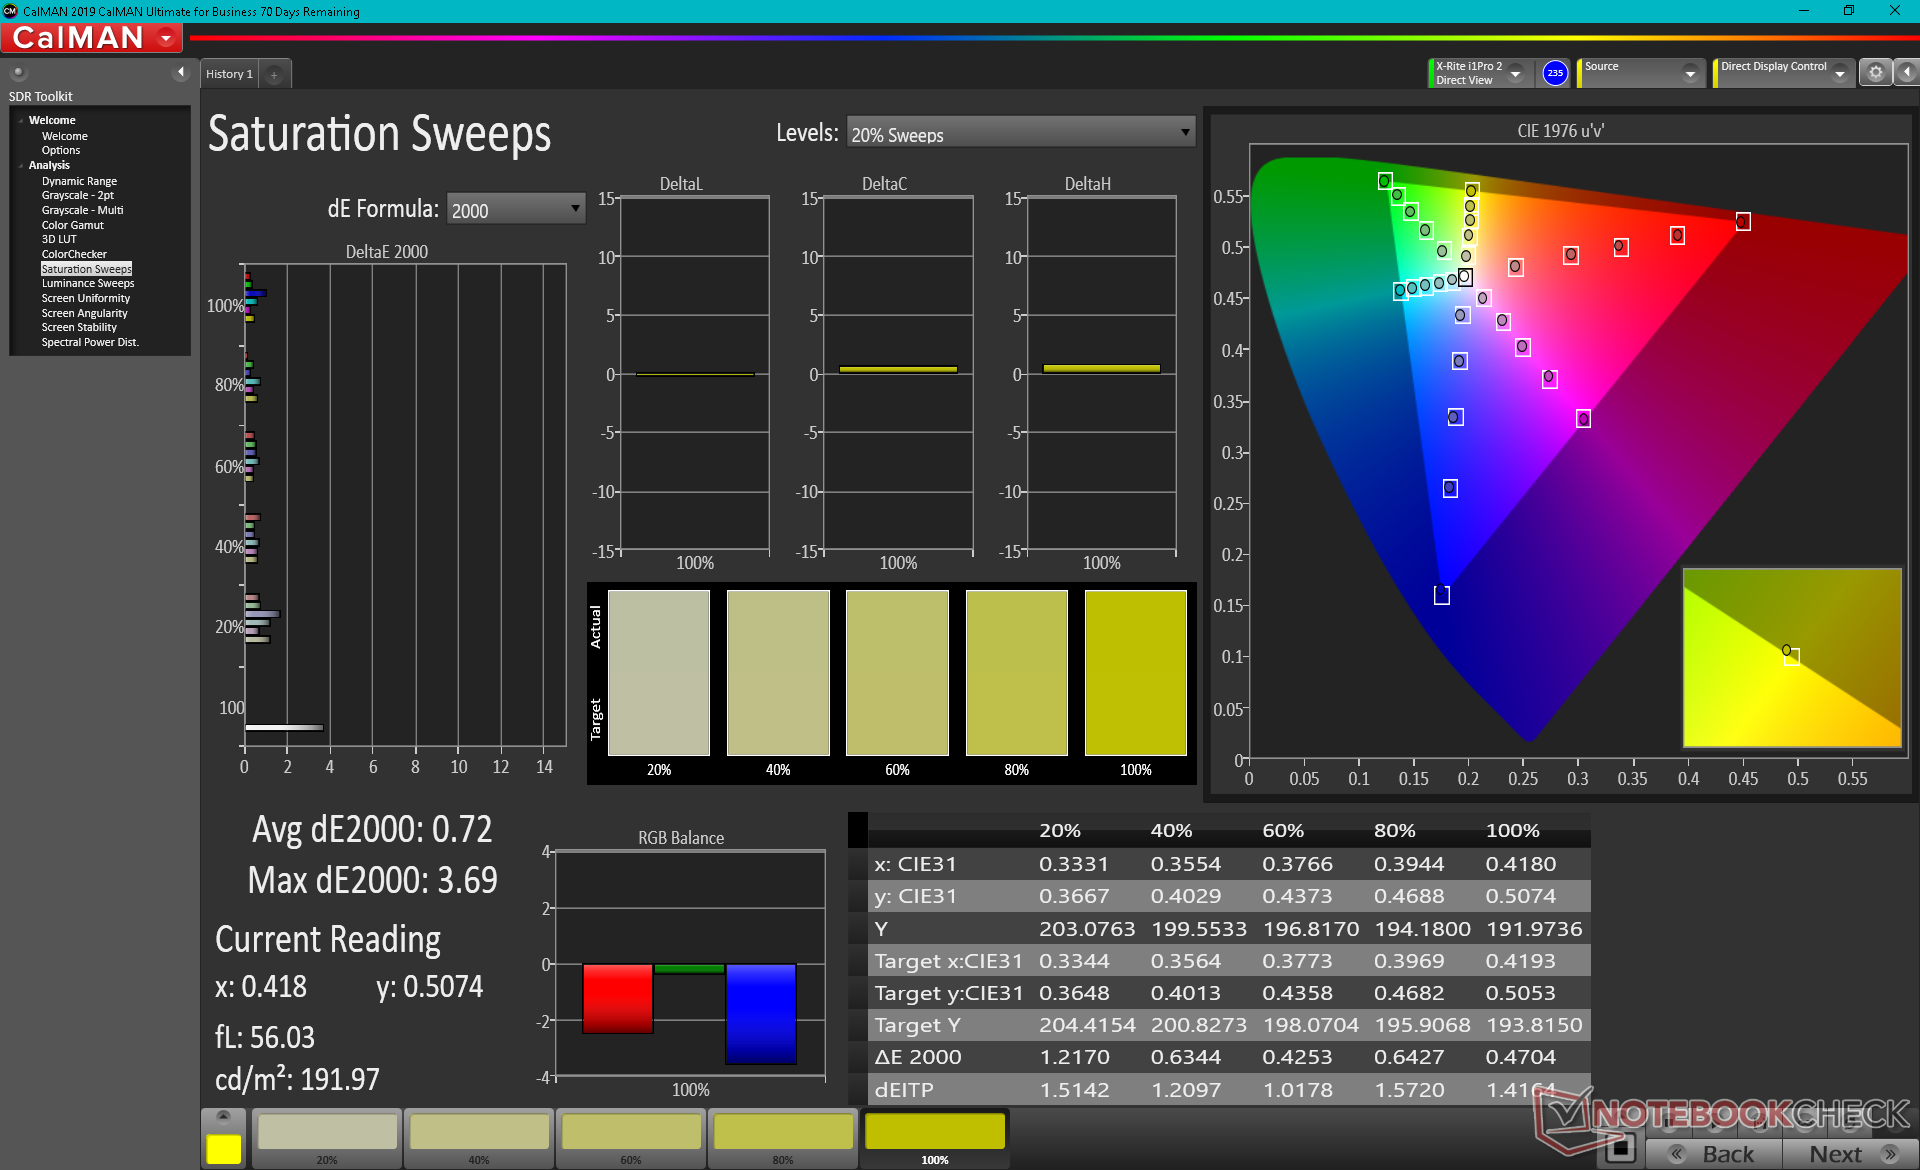
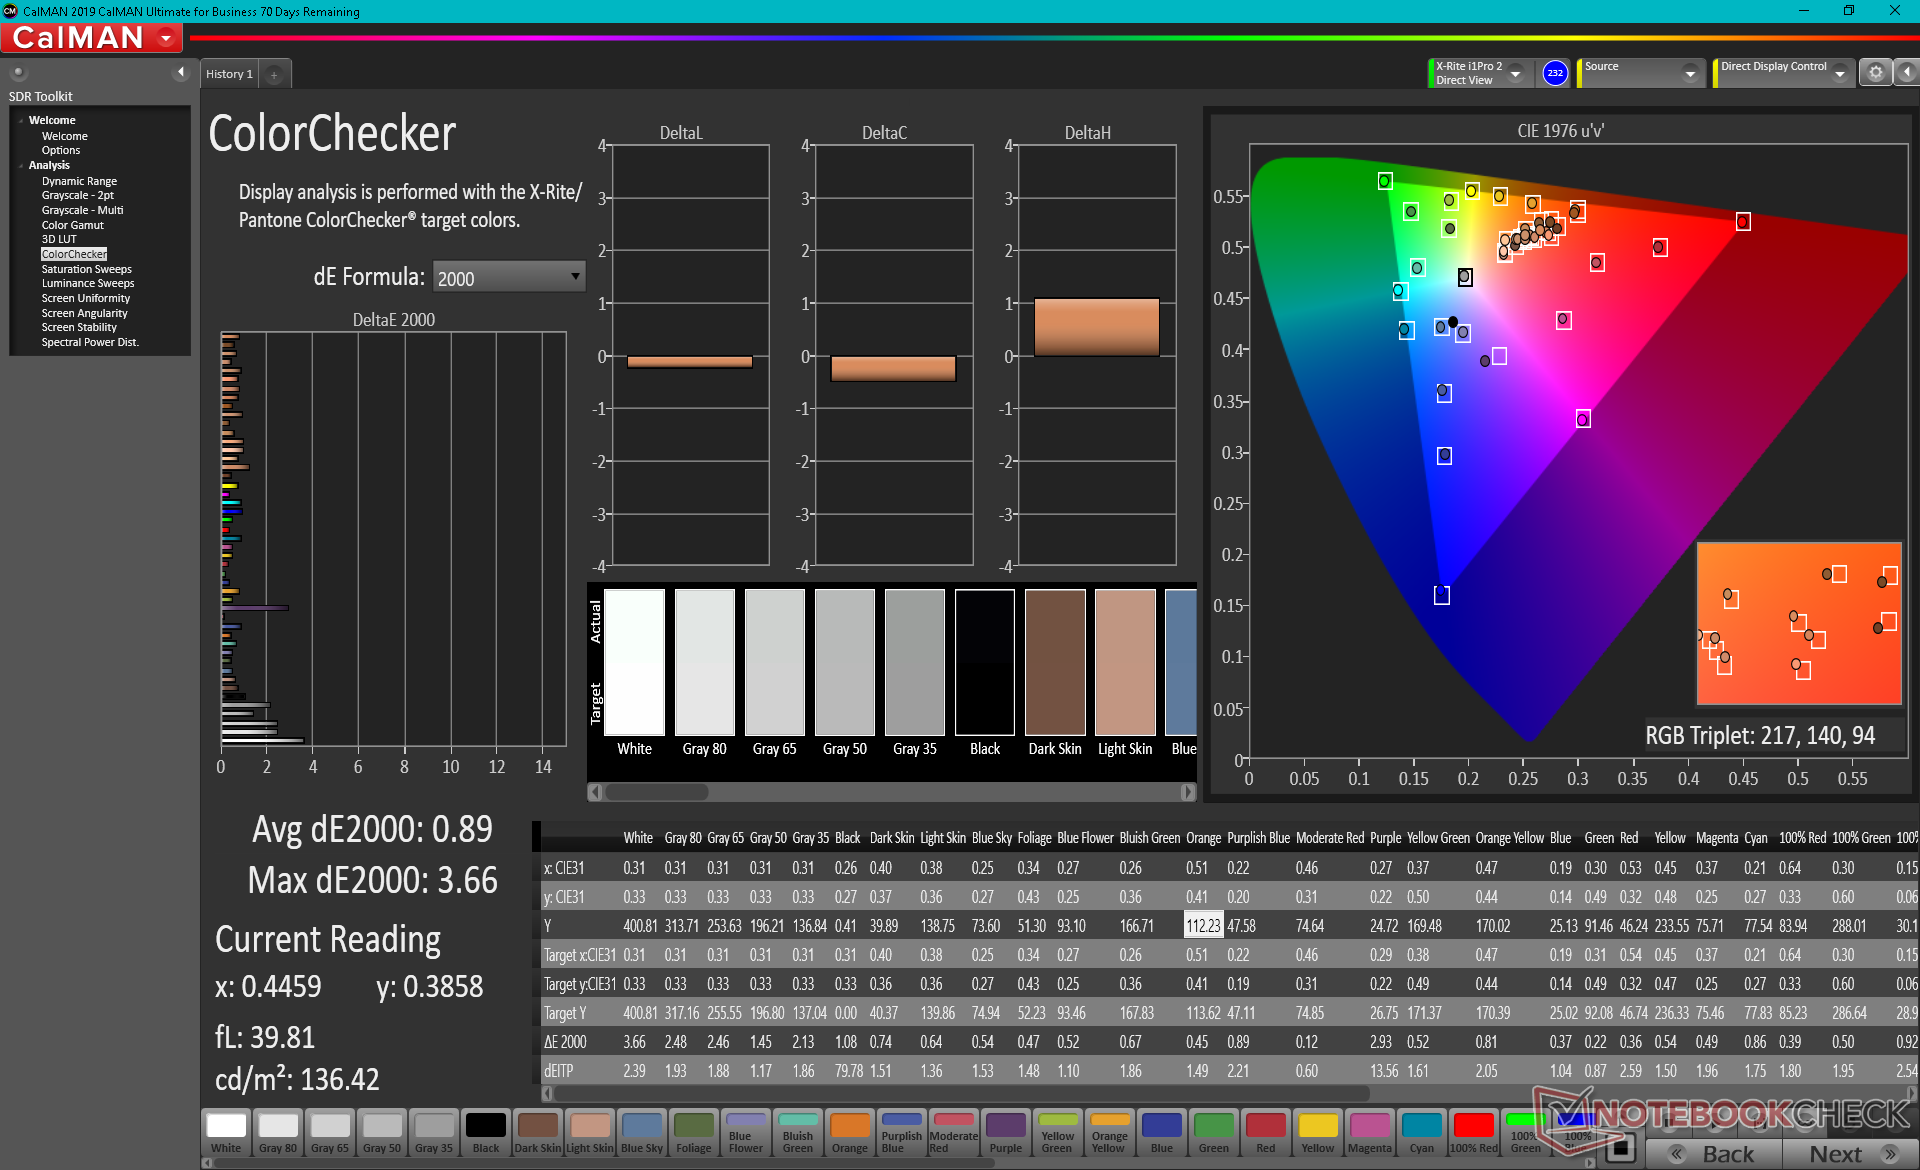
Die von Dell beworbene DCI-P3-Farbraumabdeckung von 99 % können wir durch unserer Messung bestätigen. Damit eignet sich das 8-Bit-Panel dank seiner satten Farben und schnellen Reaktionszeiten nicht nur für Spiele, sondern auch für die professionelle Bildbearbeitung.
Mit durchschnittlichen Graustufen- und Farb-DeltaE-Werten von 5 bzw. 3.48 fällt die Darstellung ab Werk schon ordentlich aus. Wie unsere CalMAN-Ergebnisse unten zeigen, können diese Werte dank der zuvor erwähnten, großen Farbraumabdeckung durch eine Kalibrierung verbessert werden.

Reaktionszeiten (Response Times) des Displays
| ↔ Reaktionszeiten Schwarz zu Weiß | ||
|---|---|---|
| 10.4 ms ... steigend ↗ und fallend ↘ kombiniert | ↗ 6 ms steigend | 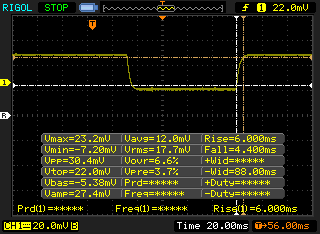 |
| ↘ 4.4 ms fallend | ||
| Die gemessenen Reaktionszeiten sind gut, für anspruchsvolle Spieler könnten der Bildschirm jedoch zu langsam sein. Im Vergleich rangierten die bei uns getesteten Geräte von 0.1 (Minimum) zu 240 (Maximum) ms. » 28 % aller Screens waren schneller als der getestete. Daher sind die gemessenen Reaktionszeiten besser als der Durchschnitt aller vermessenen Geräte (19.9 ms). | ||
| ↔ Reaktionszeiten 50% Grau zu 80% Grau | ||
| 12 ms ... steigend ↗ und fallend ↘ kombiniert | ↗ 6 ms steigend | 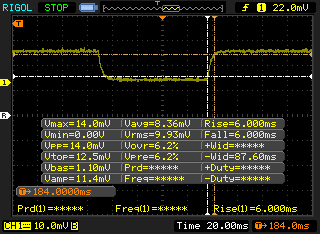 |
| ↘ 6 ms fallend | ||
| Die gemessenen Reaktionszeiten sind gut, für anspruchsvolle Spieler könnten der Bildschirm jedoch zu langsam sein. Im Vergleich rangierten die bei uns getesteten Geräte von 0.165 (Minimum) zu 636 (Maximum) ms. » 25 % aller Screens waren schneller als der getestete. Daher sind die gemessenen Reaktionszeiten besser als der Durchschnitt aller vermessenen Geräte (31.1 ms). | ||
Bildschirm-Flackern / PWM (Pulse-Width Modulation)
| Flackern / PWM nicht festgestellt | 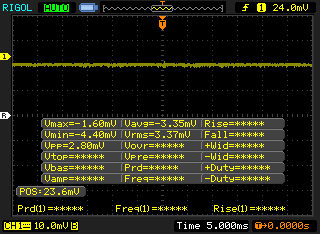 | ||
Im Vergleich: 52 % aller getesteten Geräte nutzten kein PWM um die Helligkeit zu reduzieren. Wenn PWM eingesetzt wurde, dann bei einer Frequenz von durchschnittlich 7798 (Minimum 5, Maximum 343500) Hz. | |||
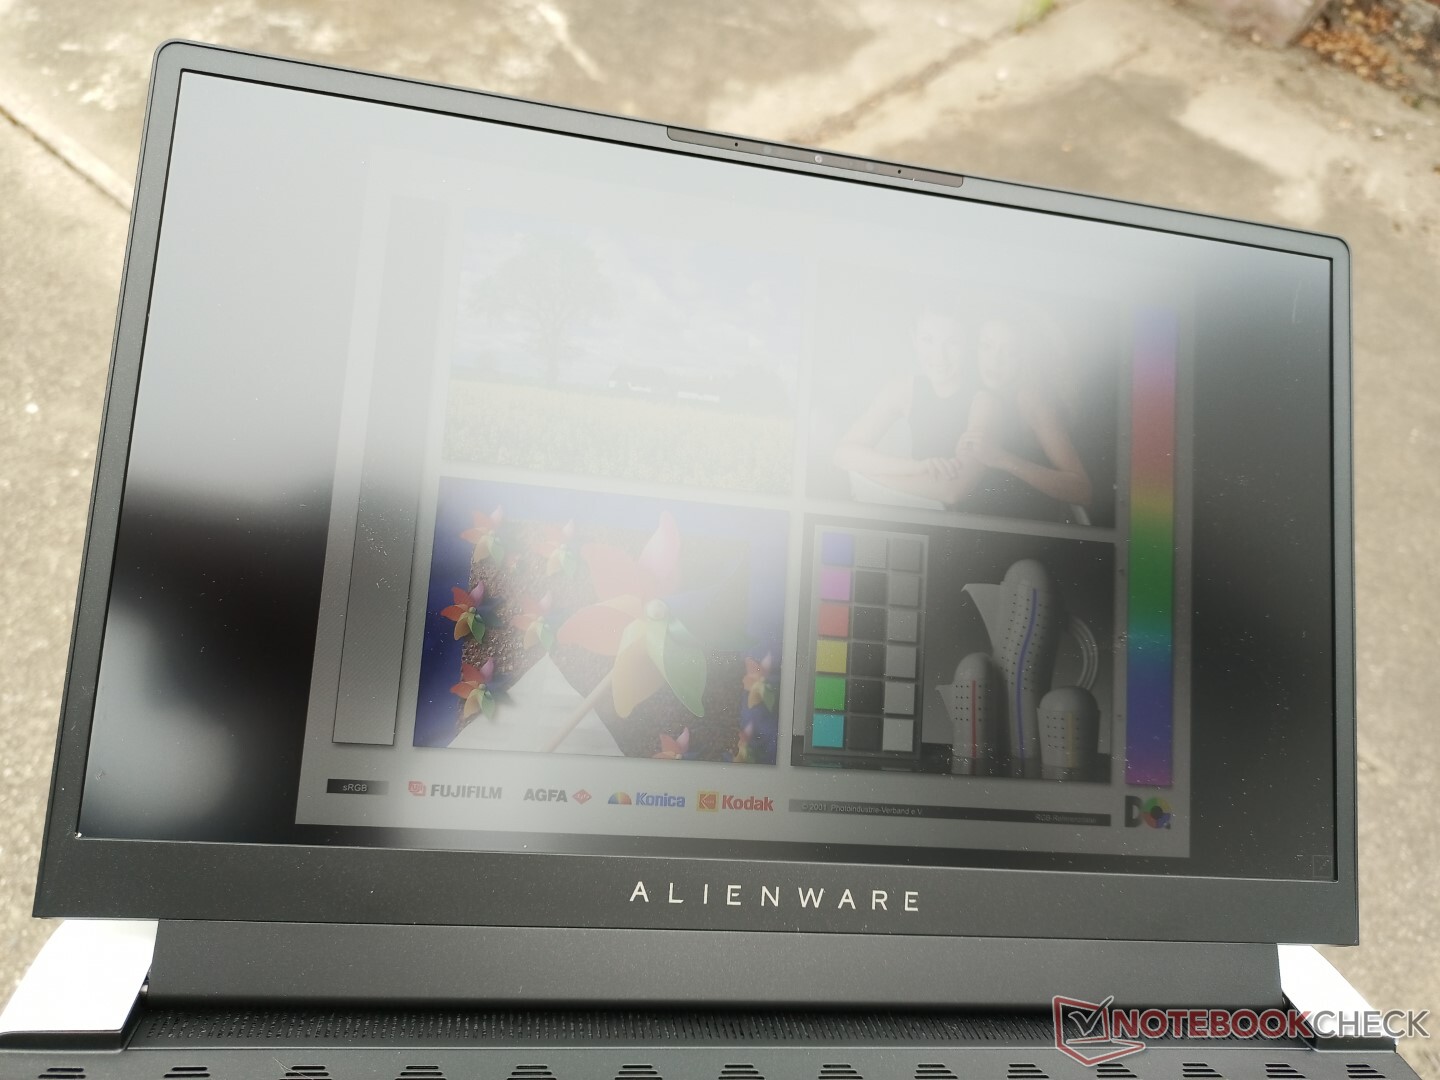
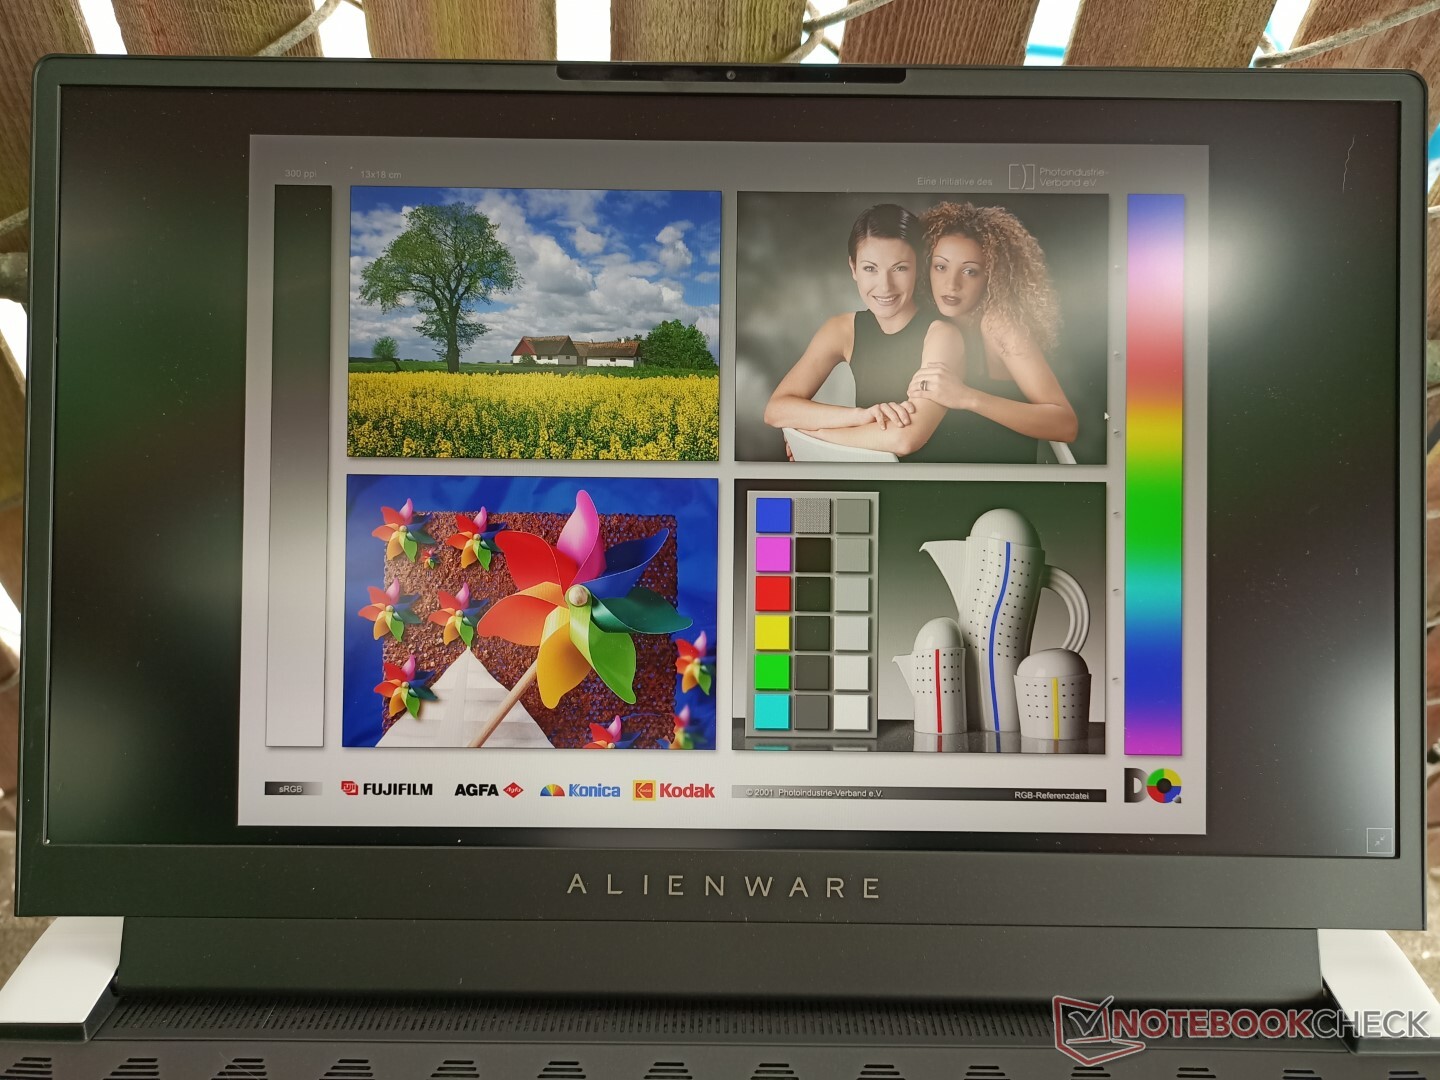
Die Lesbarkeit im Freien ist besser als bei den meisten anderen Gaming-Laptops, da die Hintergrundbeleuchtung mit 400 cd/m² heller ist als der Klassendurchschnitt von 300 cd/m². Für die Nutzung im Schatten ist der Laptop, ebenso wie das Dell XPS 15, somit zwar gut gerüstet, direktes Sonnenlicht sollte man aber nach Möglichkeit dennoch meiden.
Leistung — Etwas niedrigere GPU-TGP
Beim Kauf hat man die Wahl zwischen den Tiger-Lake-Prozessoren Core i7-11800H und Core i9-11900H und den GeForce-Ampere-Grafikkarten RTX 3060, RTX 3070 und RTX 3080 mit TGPs von 90, 110 bzw. 110 W. Das ist im Vergleich mit dem Alienware m15 R4 aus dem letzten Jahr, bei dem die GPU auf bis zu 140 W TGP zurückgreifen konnte, ein Rückschritt. Im Prinzip handelt es sich hierbei um eine Max-Q-GPU, obwohl "Max-Q" kein Bestandteil des Namens mehr ist.
Dynamic Boost 2.0, WhisperMode 2.0 und Advanced Optimus mit G-Sync werden unterstützt. Tatsächlich ist das Alienware x15 einer der wenigen Gaming-Laptops mit Advanced Optimus. Man sollte jedoch beachten, dass die Funktion nur bei Modellen mit dem 240-Hz-QHD- und dem 360-Hz-FHD-Display zur Verfügung steht. Außerdem sollte man den aktuellen BIOS-Patch 1.3.0 installieren, da dieser den exklusiven dGPU-Betrieb ermöglicht.
Im Alienware Command Center haben wir vor dem Ausführen der unten stehenden Benchmarks den Hochleistungsmodus gewählt, um die bestmöglichen Punktzahlen zu erreichen.
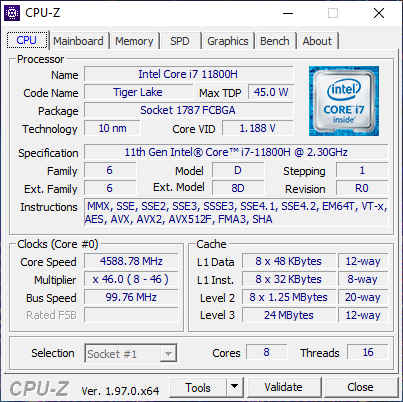
Prozessor — Erwartungen übertroffen
In unseren Multi-Thread-Tests ist die CPU um 15 % schneller als ein durchschnittlicher Laptop mit der gleichen Core i7-11800H-CPU und insbesondere auch schneller als das Razer Blade 15. Damit liefert sich unsere Konfiguration ein Kopf-an-Kopf-Rennen mit dem konkurrierenden Ryzen 9 5900HX, der normalerweise besser abschneidet als der i7-11800H. Wie die konstanten Cinebench-R15-xT-Punktzahlen unten zeigen, wird die Leistung hervorragend aufrechterhalten.
Basierend auf unserer Erfahrung mit dem Core i9-11900H in anderen Laptops wie dem Asus Zephyrus S17 fällt der Leistungssprung mit dieser CPU gegenüber unserer i7-11800H-Konfiguration vermutlich gering aus.
Cinebench R15 Multi Loop
Cinebench R23: Multi Core | Single Core
Cinebench R15: CPU Multi 64Bit | CPU Single 64Bit
Blender: v2.79 BMW27 CPU
7-Zip 18.03: 7z b 4 -mmt1 | 7z b 4
Geekbench 5.5: Single-Core | Multi-Core
HWBOT x265 Benchmark v2.2: 4k Preset
LibreOffice : 20 Documents To PDF
R Benchmark 2.5: Overall mean
| Cinebench R20 / CPU (Multi Core) | |
| Alienware x15 RTX 3070 P111F | |
| Asus ROG Strix Scar 15 G533QS | |
| Asus ROG Zephyrus S17 GX703HSD | |
| Acer Nitro 5 AN515-45-R1JH | |
| Durchschnittliche Intel Core i7-11800H (2498 - 5408, n=50) | |
| Dell G5 15 SE 5505 P89F | |
| Alienware m15 R4 RTX 3080 | |
| MSI GS66 Stealth 10UG | |
| Razer Blade 15 Advanced Model Early 2021 | |
| Schenker XMG Pro 15 | |
| Cinebench R20 / CPU (Single Core) | |
| Asus ROG Zephyrus S17 GX703HSD | |
| Alienware x15 RTX 3070 P111F | |
| Durchschnittliche Intel Core i7-11800H (520 - 586, n=47) | |
| Asus ROG Strix Scar 15 G533QS | |
| Acer Nitro 5 AN515-45-R1JH | |
| Dell G5 15 SE 5505 P89F | |
| Alienware m15 R4 RTX 3080 | |
| Razer Blade 15 Advanced Model Early 2021 | |
| MSI GS66 Stealth 10UG | |
| Schenker XMG Pro 15 | |
| Cinebench R23 / Multi Core | |
| Alienware x15 RTX 3070 P111F | |
| Asus ROG Strix Scar 15 G533QS | |
| Asus ROG Zephyrus S17 GX703HSD | |
| Acer Nitro 5 AN515-45-R1JH | |
| Durchschnittliche Intel Core i7-11800H (6508 - 14088, n=48) | |
| Alienware m15 R4 RTX 3080 | |
| MSI GS66 Stealth 10UG | |
| Razer Blade 15 Advanced Model Early 2021 | |
| Cinebench R23 / Single Core | |
| Asus ROG Zephyrus S17 GX703HSD | |
| Alienware x15 RTX 3070 P111F | |
| Durchschnittliche Intel Core i7-11800H (1386 - 1522, n=45) | |
| Asus ROG Strix Scar 15 G533QS | |
| Acer Nitro 5 AN515-45-R1JH | |
| MSI GS66 Stealth 10UG | |
| Alienware m15 R4 RTX 3080 | |
| Razer Blade 15 Advanced Model Early 2021 | |
| Cinebench R15 / CPU Multi 64Bit | |
| Asus ROG Strix Scar 15 G533QS | |
| Asus ROG Zephyrus S17 GX703HSD | |
| Alienware x15 RTX 3070 P111F | |
| Acer Nitro 5 AN515-45-R1JH | |
| Dell G5 15 SE 5505 P89F | |
| Durchschnittliche Intel Core i7-11800H (1342 - 2173, n=50) | |
| Alienware m15 R4 RTX 3080 | |
| MSI GS66 Stealth 10UG | |
| Razer Blade 15 Advanced Model Early 2021 | |
| Schenker XMG Pro 15 | |
| Cinebench R15 / CPU Single 64Bit | |
| Asus ROG Zephyrus S17 GX703HSD | |
| Asus ROG Strix Scar 15 G533QS | |
| Acer Nitro 5 AN515-45-R1JH | |
| Alienware x15 RTX 3070 P111F | |
| Durchschnittliche Intel Core i7-11800H (201 - 231, n=46) | |
| MSI GS66 Stealth 10UG | |
| Razer Blade 15 Advanced Model Early 2021 | |
| Alienware m15 R4 RTX 3080 | |
| Dell G5 15 SE 5505 P89F | |
| Schenker XMG Pro 15 | |
| Blender / v2.79 BMW27 CPU | |
| Schenker XMG Pro 15 | |
| Razer Blade 15 Advanced Model Early 2021 | |
| MSI GS66 Stealth 10UG | |
| Alienware m15 R4 RTX 3080 | |
| Durchschnittliche Intel Core i7-11800H (217 - 454, n=46) | |
| Dell G5 15 SE 5505 P89F | |
| Acer Nitro 5 AN515-45-R1JH | |
| Asus ROG Strix Scar 15 G533QS | |
| Asus ROG Zephyrus S17 GX703HSD | |
| Alienware x15 RTX 3070 P111F | |
| 7-Zip 18.03 / 7z b 4 -mmt1 | |
| Asus ROG Zephyrus S17 GX703HSD | |
| Asus ROG Strix Scar 15 G533QS | |
| Acer Nitro 5 AN515-45-R1JH | |
| Durchschnittliche Intel Core i7-11800H (5138 - 5732, n=46) | |
| Alienware x15 RTX 3070 P111F | |
| Alienware m15 R4 RTX 3080 | |
| MSI GS66 Stealth 10UG | |
| Razer Blade 15 Advanced Model Early 2021 | |
| Dell G5 15 SE 5505 P89F | |
| Schenker XMG Pro 15 | |
| Geekbench 5.5 / Single-Core | |
| Asus ROG Zephyrus S17 GX703HSD | |
| Durchschnittliche Intel Core i7-11800H (1429 - 1625, n=40) | |
| Acer Nitro 5 AN515-45-R1JH | |
| Alienware m15 R4 RTX 3080 | |
| Razer Blade 15 Advanced Model Early 2021 | |
| MSI GS66 Stealth 10UG | |
| Dell G5 15 SE 5505 P89F | |
| Schenker XMG Pro 15 | |
| Geekbench 5.5 / Multi-Core | |
| Asus ROG Zephyrus S17 GX703HSD | |
| Durchschnittliche Intel Core i7-11800H (4655 - 9851, n=40) | |
| Alienware m15 R4 RTX 3080 | |
| Dell G5 15 SE 5505 P89F | |
| MSI GS66 Stealth 10UG | |
| Acer Nitro 5 AN515-45-R1JH | |
| Razer Blade 15 Advanced Model Early 2021 | |
| Schenker XMG Pro 15 | |
| HWBOT x265 Benchmark v2.2 / 4k Preset | |
| Asus ROG Zephyrus S17 GX703HSD | |
| Alienware x15 RTX 3070 P111F | |
| Asus ROG Strix Scar 15 G533QS | |
| Acer Nitro 5 AN515-45-R1JH | |
| Durchschnittliche Intel Core i7-11800H (7.38 - 17.4, n=46) | |
| Alienware m15 R4 RTX 3080 | |
| Dell G5 15 SE 5505 P89F | |
| MSI GS66 Stealth 10UG | |
| Razer Blade 15 Advanced Model Early 2021 | |
| Schenker XMG Pro 15 | |
| LibreOffice / 20 Documents To PDF | |
| Alienware m15 R4 RTX 3080 | |
| Acer Nitro 5 AN515-45-R1JH | |
| Dell G5 15 SE 5505 P89F | |
| Razer Blade 15 Advanced Model Early 2021 | |
| Asus ROG Strix Scar 15 G533QS | |
| Alienware x15 RTX 3070 P111F | |
| MSI GS66 Stealth 10UG | |
| Durchschnittliche Intel Core i7-11800H (38.6 - 59.9, n=45) | |
| Asus ROG Zephyrus S17 GX703HSD | |
| R Benchmark 2.5 / Overall mean | |
| Schenker XMG Pro 15 | |
| MSI GS66 Stealth 10UG | |
| Alienware m15 R4 RTX 3080 | |
| Razer Blade 15 Advanced Model Early 2021 | |
| Dell G5 15 SE 5505 P89F | |
| Alienware x15 RTX 3070 P111F | |
| Durchschnittliche Intel Core i7-11800H (0.548 - 0.615, n=46) | |
| Asus ROG Zephyrus S17 GX703HSD | |
| Acer Nitro 5 AN515-45-R1JH | |
| Asus ROG Strix Scar 15 G533QS | |
* ... kleinere Werte sind besser
Systemleistung
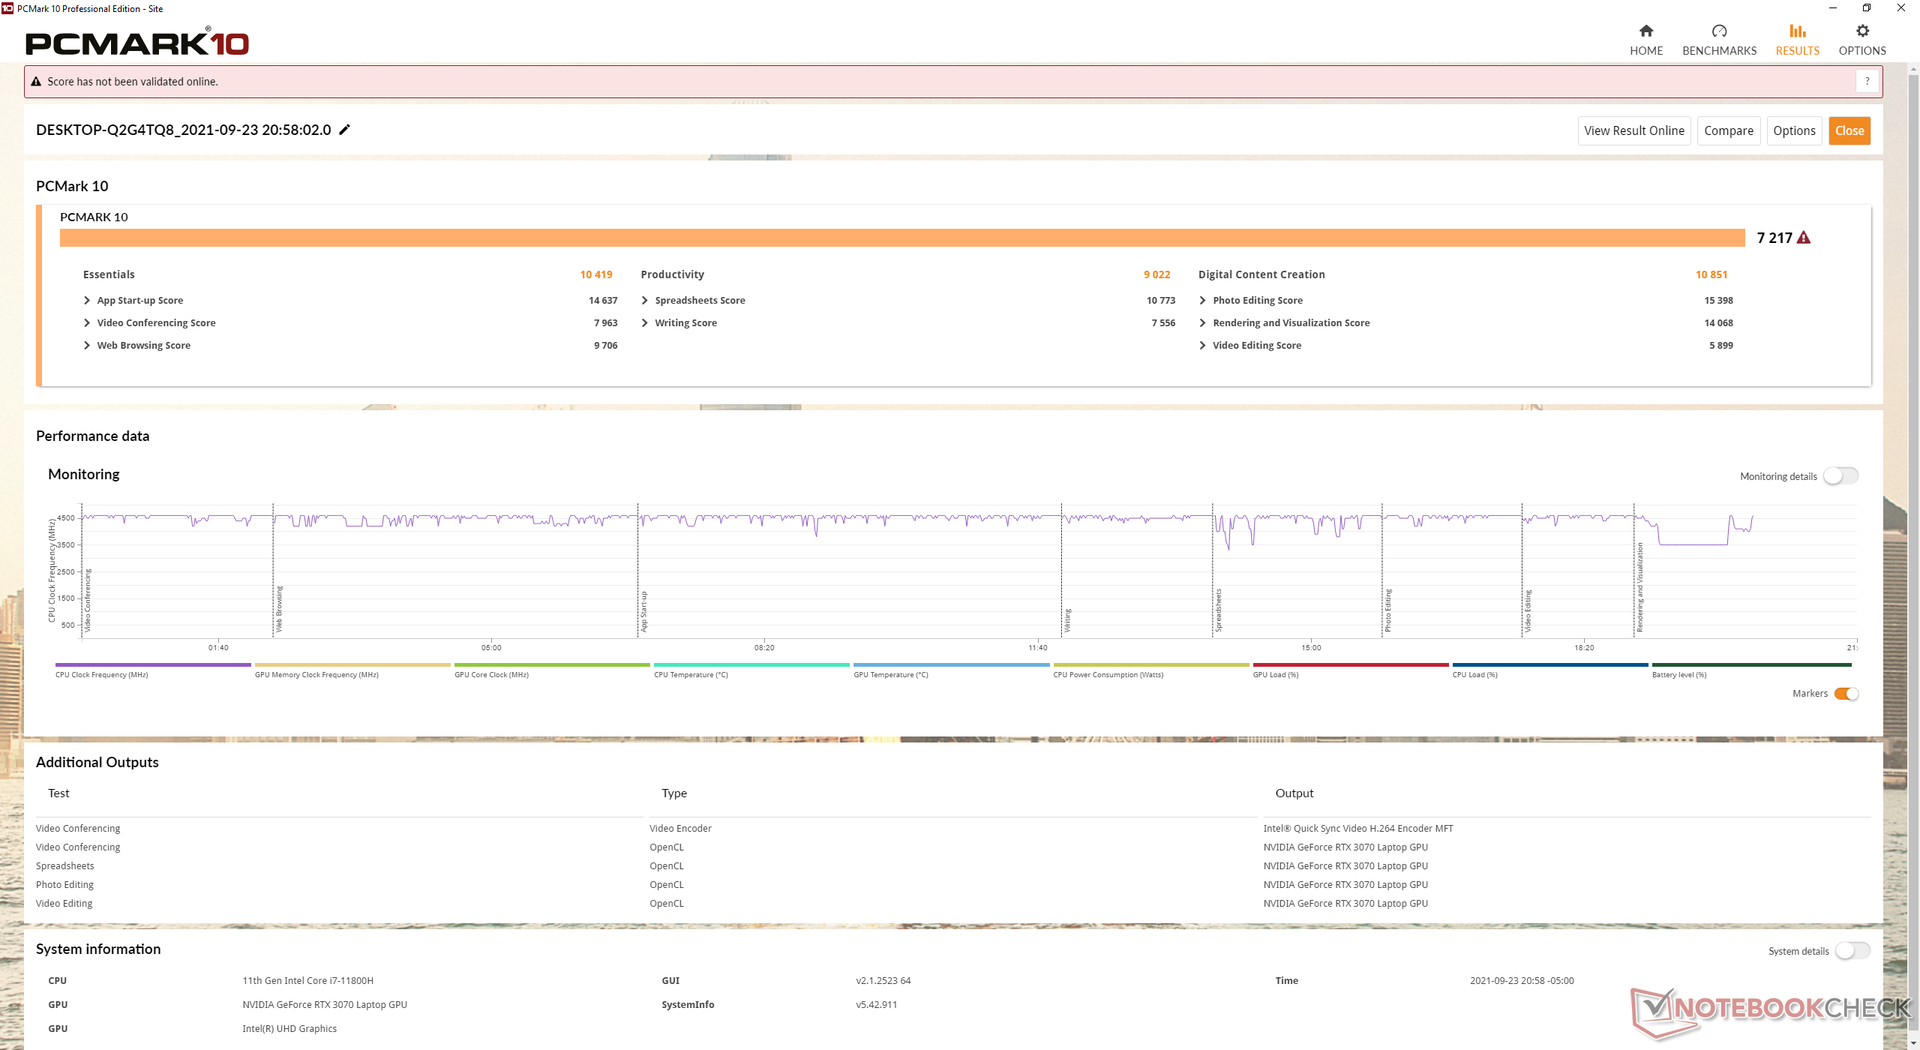
Die PCMark-10-Punktzahlen sind ausgezeichnet und konstant höher als die des Alienware m15 R4. Die einzige Ausnahme bildet der Produktivitäts-Benchmark, was höchstwahrscheinlich auf die schnelleren RAID-0-Laufwerke in unserer Konfiguration des m15 R4 zurückzuführen ist.
Bei unserem Testgerät sind wir auf einen Fehler gestoßen, der beim Ändern des Profils im Alienware Command Center dazu führte, dass der Bildschirm schwarz wurde und einen Neustart erforderte. Obwohl das Problem nicht konstant reproduzieren konnten, ist es dennoch erwähnenswert, vor allem, da unser x17-Testgerät von letzter Woche kein derartiges Verhalten aufwies.
| PCMark 10 / Score | |
| Razer Blade 15 Advanced (Mid 2021) | |
| Alienware x15 RTX 3070 P111F | |
| Alienware m15 R4 RTX 3080 | |
| Durchschnittliche Intel Core i7-11800H, NVIDIA GeForce RTX 3070 Laptop GPU (6126 - 7311, n=11) | |
| MSI GS66 Stealth 10UG | |
| Acer Predator Helios 300 PH315-53-786B | |
| Asus Zephyrus S15 GX502L | |
| PCMark 10 / Essentials | |
| Razer Blade 15 Advanced (Mid 2021) | |
| Alienware x15 RTX 3070 P111F | |
| Durchschnittliche Intel Core i7-11800H, NVIDIA GeForce RTX 3070 Laptop GPU (9248 - 10832, n=11) | |
| Alienware m15 R4 RTX 3080 | |
| Asus Zephyrus S15 GX502L | |
| MSI GS66 Stealth 10UG | |
| Acer Predator Helios 300 PH315-53-786B | |
| PCMark 10 / Productivity | |
| Alienware m15 R4 RTX 3080 | |
| Durchschnittliche Intel Core i7-11800H, NVIDIA GeForce RTX 3070 Laptop GPU (8571 - 9669, n=11) | |
| Alienware x15 RTX 3070 P111F | |
| Razer Blade 15 Advanced (Mid 2021) | |
| Asus Zephyrus S15 GX502L | |
| Acer Predator Helios 300 PH315-53-786B | |
| MSI GS66 Stealth 10UG | |
| PCMark 10 / Digital Content Creation | |
| Alienware x15 RTX 3070 P111F | |
| Razer Blade 15 Advanced (Mid 2021) | |
| Alienware m15 R4 RTX 3080 | |
| Durchschnittliche Intel Core i7-11800H, NVIDIA GeForce RTX 3070 Laptop GPU (7627 - 10851, n=11) | |
| MSI GS66 Stealth 10UG | |
| Acer Predator Helios 300 PH315-53-786B | |
| Asus Zephyrus S15 GX502L | |
| PCMark 10 Score | 7217 Punkte | |
Hilfe | ||
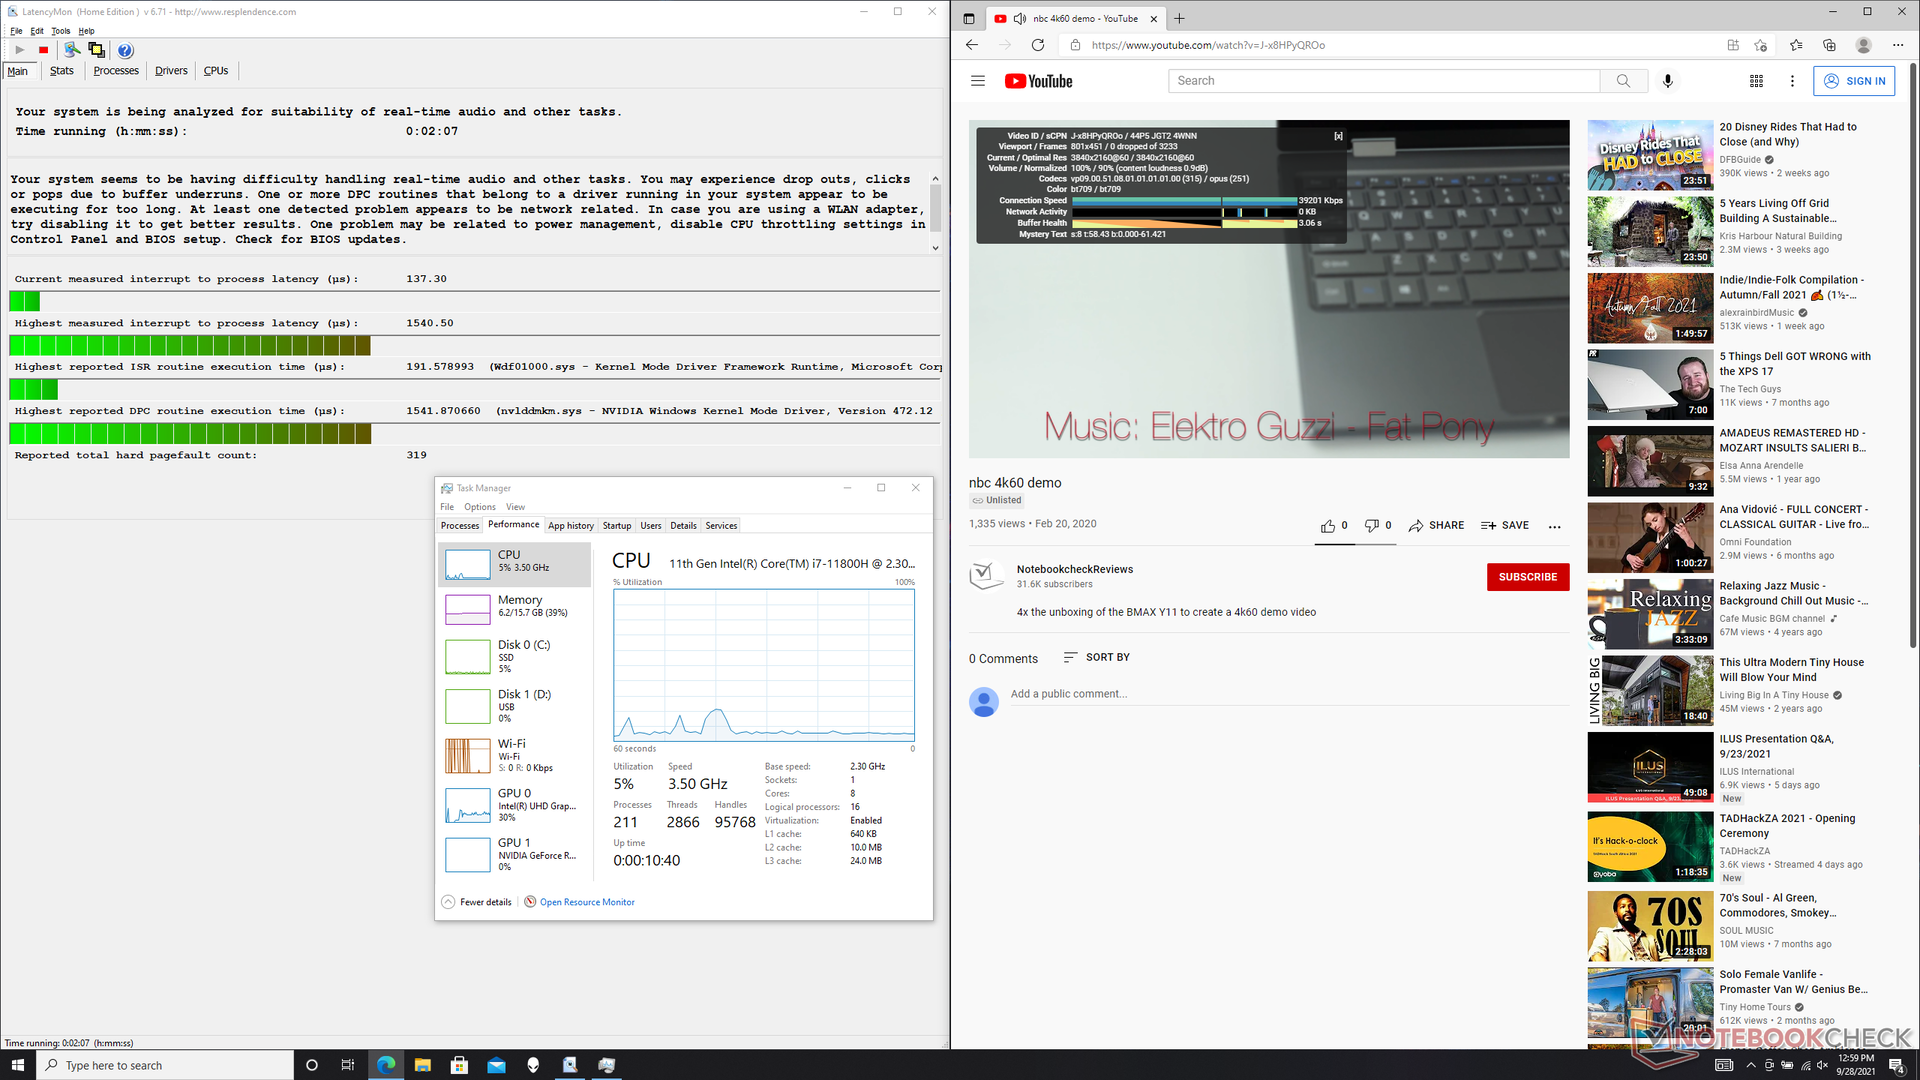
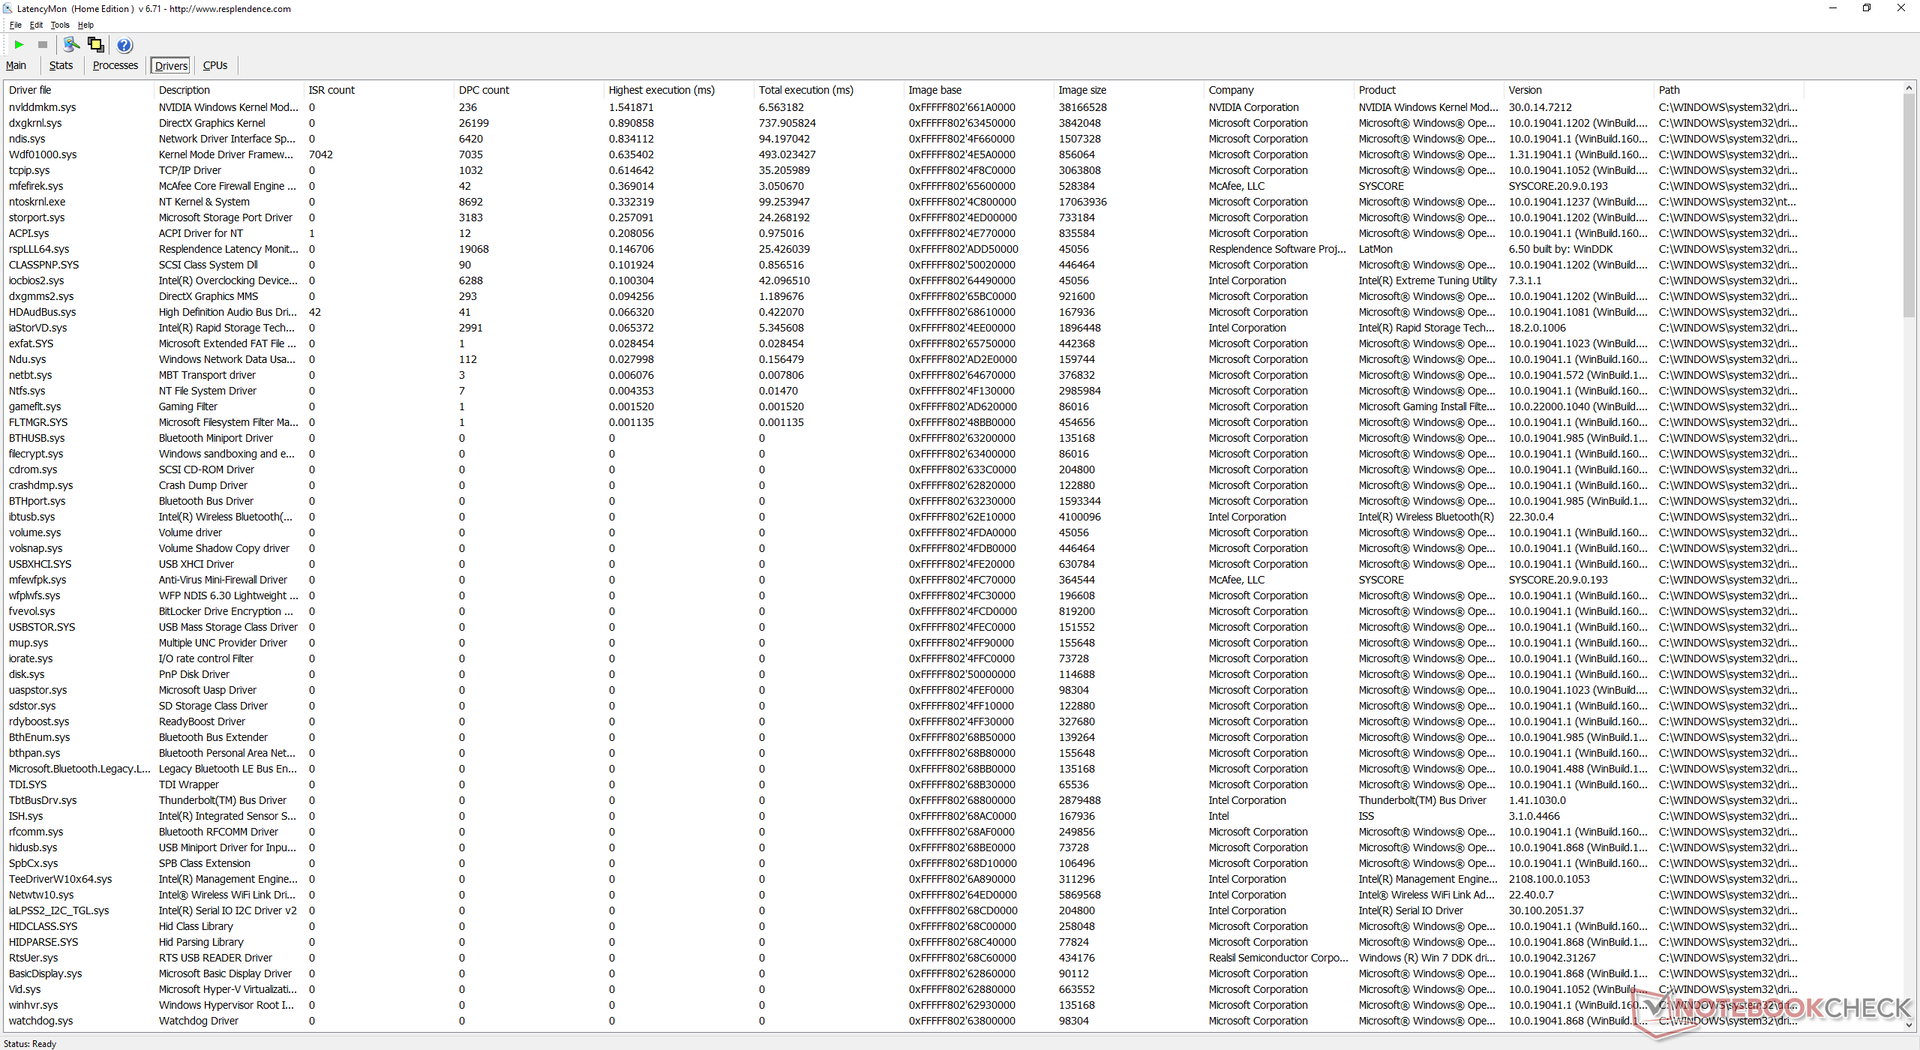
DPC-Latenzen
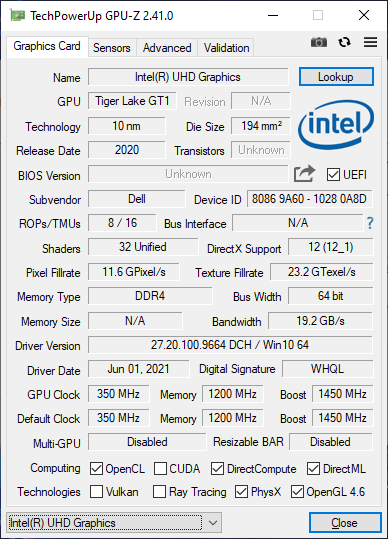
LatencyMon meldet minimal erhöhte DPC-Latenzen beim Öffnen unserer Homepage in mehreren Tabs und dem Auslasten der CPU mittels Prime95. Die Wiedergabe von 4K-Videos mit 60 Fps gelingt davon abgesehen problemlos und auch im iGPU-Modus gehen keine Frames verloren.
| DPC Latencies / LatencyMon - interrupt to process latency (max), Web, Youtube, Prime95 | |
| Asus Zephyrus S15 GX502L | |
| Razer Blade 15 Advanced (Mid 2021) | |
| Alienware x15 RTX 3070 P111F | |
| Alienware m15 R4 RTX 3080 | |
| MSI GS66 Stealth 10UG | |
| Acer Predator Helios 300 PH315-53-786B | |
* ... kleinere Werte sind besser
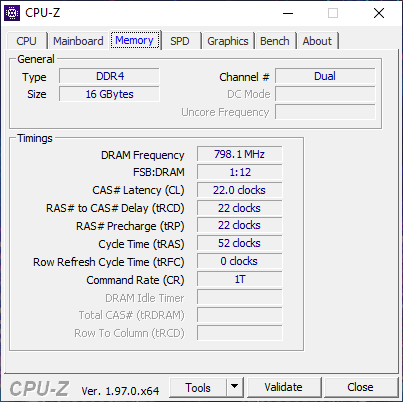
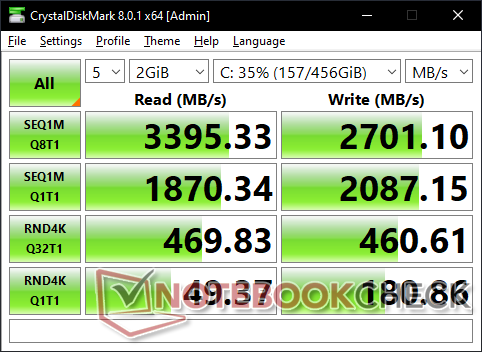
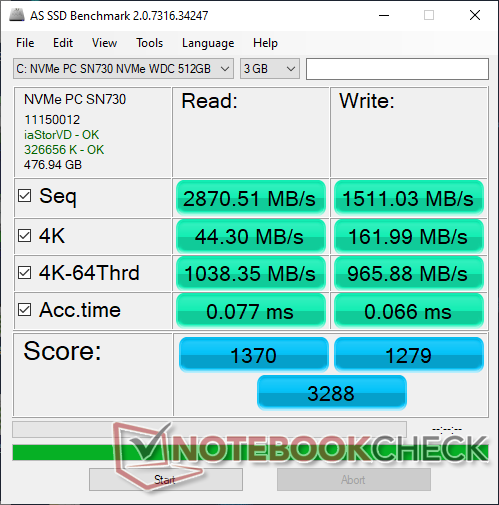
Massenspeicher — Alienware x15 mit PCIe4 x4
Es können bis zu zwei M.2-Laufwerke in RAID 0 verbaut werden. Dabei ist jedoch nur ein Steckplatz mit PCIe4 kompatibel, während der andere Steckplatz wie beim Alienware x17 R1 nur PCIe3 unterstützt. Derzeitige x15-R1-Modelle beinhalten ausschließlich PCIe3-NVMe-SSDs wie die 512 GB große WD SN730 in unserem Testgerät. Die Übertragungsraten sind mit denen der PM981a vergleichbar, die man häufig in anderen Oberklasse-Gaming-Laptops zum Beispiel aus der Razer-Blade-Reihe findet.
| Alienware x15 RTX 3070 P111F WDC PC SN730 SDBPNTY-512G | Alienware m15 R4 RTX 3080 2x WDC PC SN730 SDBPNTY-512G (RAID 0) | MSI GS66 Stealth 10UG WDC PC SN730 SDBPNTY-1T00 | Razer Blade 15 Advanced (Mid 2021) SSSTC CA6-8D1024 | Acer Predator Helios 300 PH315-53-786B Samsung PM981a MZVLB1T0HBLR | |
|---|---|---|---|---|---|
| AS SSD | 29% | 37% | 90% | 34% | |
| Seq Read (MB/s) | 2871 | 2888 1% | 2198 -23% | 5739 100% | 2792 -3% |
| Seq Write (MB/s) | 1511 | 2786 84% | 2596 72% | 4201 178% | 2311 53% |
| 4K Read (MB/s) | 44.3 | 41.98 -5% | 43.81 -1% | 53.8 21% | 48.34 9% |
| 4K Write (MB/s) | 162 | 108 -33% | 115.5 -29% | 179.2 11% | 93.9 -42% |
| 4K-64 Read (MB/s) | 1038 | 1396 34% | 1692 63% | 2959 185% | 1516 46% |
| 4K-64 Write (MB/s) | 966 | 1234 28% | 2162 124% | 1891 96% | 1940 101% |
| Access Time Read * (ms) | 0.077 | 0.056 27% | 0.056 27% | 0.027 65% | |
| Access Time Write * (ms) | 0.066 | 0.035 47% | 0.098 -48% | 0.154 -133% | 0.04 39% |
| Score Read (Points) | 1370 | 1727 26% | 1956 43% | 3587 162% | 1843 35% |
| Score Write (Points) | 1279 | 1621 27% | 2537 98% | 2490 95% | 2265 77% |
| Score Total (Points) | 3288 | 4227 29% | 5513 68% | 7821 138% | 5030 53% |
| Copy ISO MB/s (MB/s) | 1962 | 1868 -5% | 2236 14% | 3027 54% | 1921 -2% |
| Copy Program MB/s (MB/s) | 407.9 | 812 99% | 690 69% | 1177 189% | 581 42% |
| Copy Game MB/s (MB/s) | 1105 | 1596 44% | 1546 40% | 2170 96% | 1454 32% |
| CrystalDiskMark 5.2 / 6 | -1% | 4% | 81% | -29% | |
| Write 4K (MB/s) | 179.6 | 114.2 -36% | 163.1 -9% | 295.6 65% | 76.2 -58% |
| Read 4K (MB/s) | 49.21 | 43.77 -11% | 48.97 0% | 85.7 74% | 34.32 -30% |
| Write Seq (MB/s) | 2062 | 2607 26% | 4149 101% | 776 -62% | |
| Read Seq (MB/s) | 1849 | 2316 25% | 4203 127% | 2169 17% | |
| Write 4K Q32T1 (MB/s) | 462.9 | 464.5 0% | 338 -27% | 715 54% | 357.3 -23% |
| Read 4K Q32T1 (MB/s) | 470.2 | 546 16% | 475.6 1% | 709 51% | 429.6 -9% |
| Write Seq Q32T1 (MB/s) | 2702 | 3233 20% | 3090 14% | 4681 73% | 788 -71% |
| Read Seq Q32T1 (MB/s) | 3371 | 3473 3% | 3421 1% | 6905 105% | 3542 5% |
| Write 4K Q8T8 (MB/s) | 1375 | ||||
| Read 4K Q8T8 (MB/s) | 1447 | ||||
| Durchschnitt gesamt (Programm / Settings) | 14% /
20% | 21% /
25% | 86% /
87% | 3% /
10% |
* ... kleinere Werte sind besser

Laufwerksdrosseln: DiskSpd-Leseschleife, Warteschlangentiefe 8
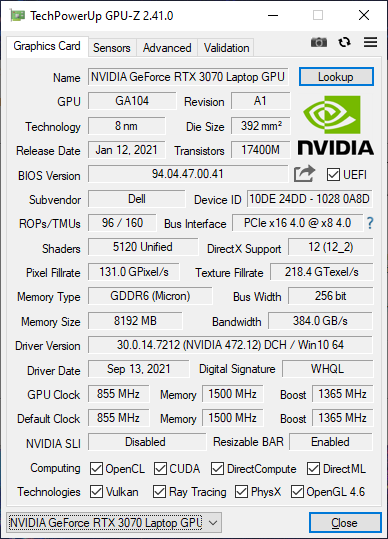
Grafikkarte
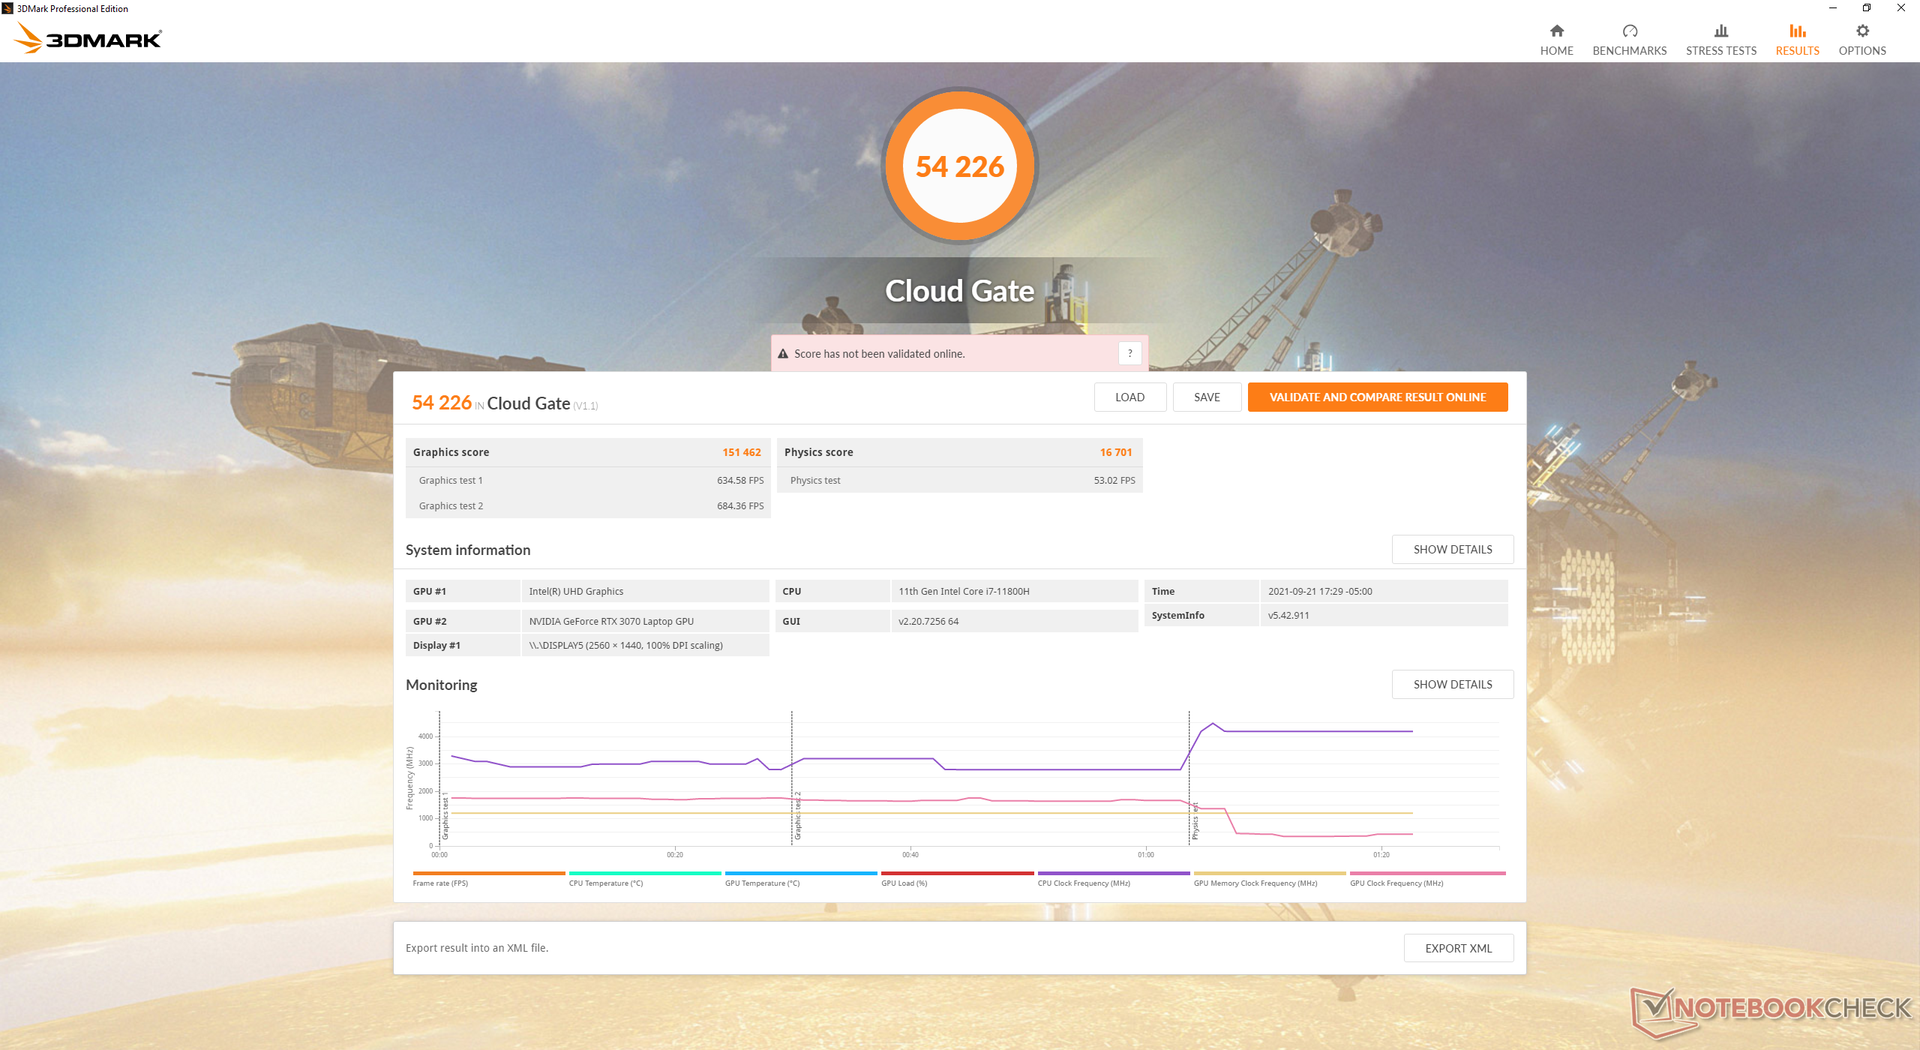
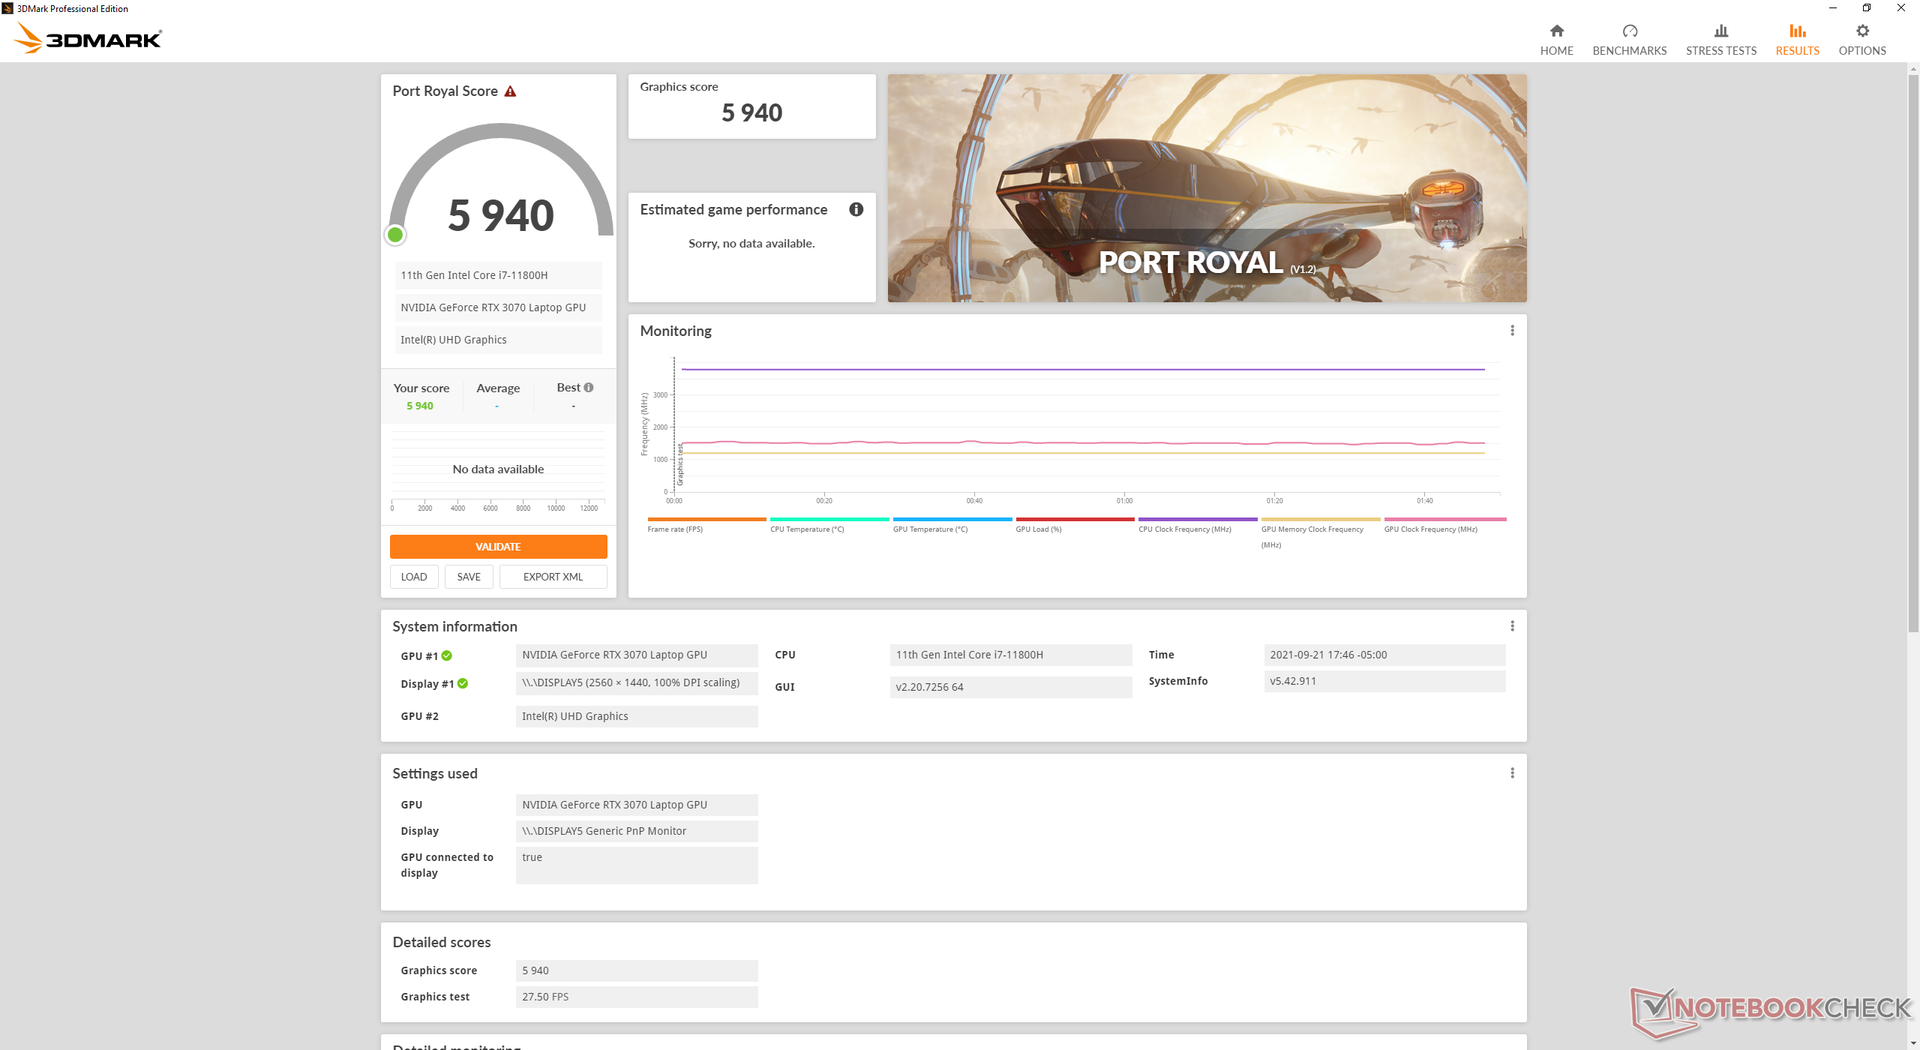
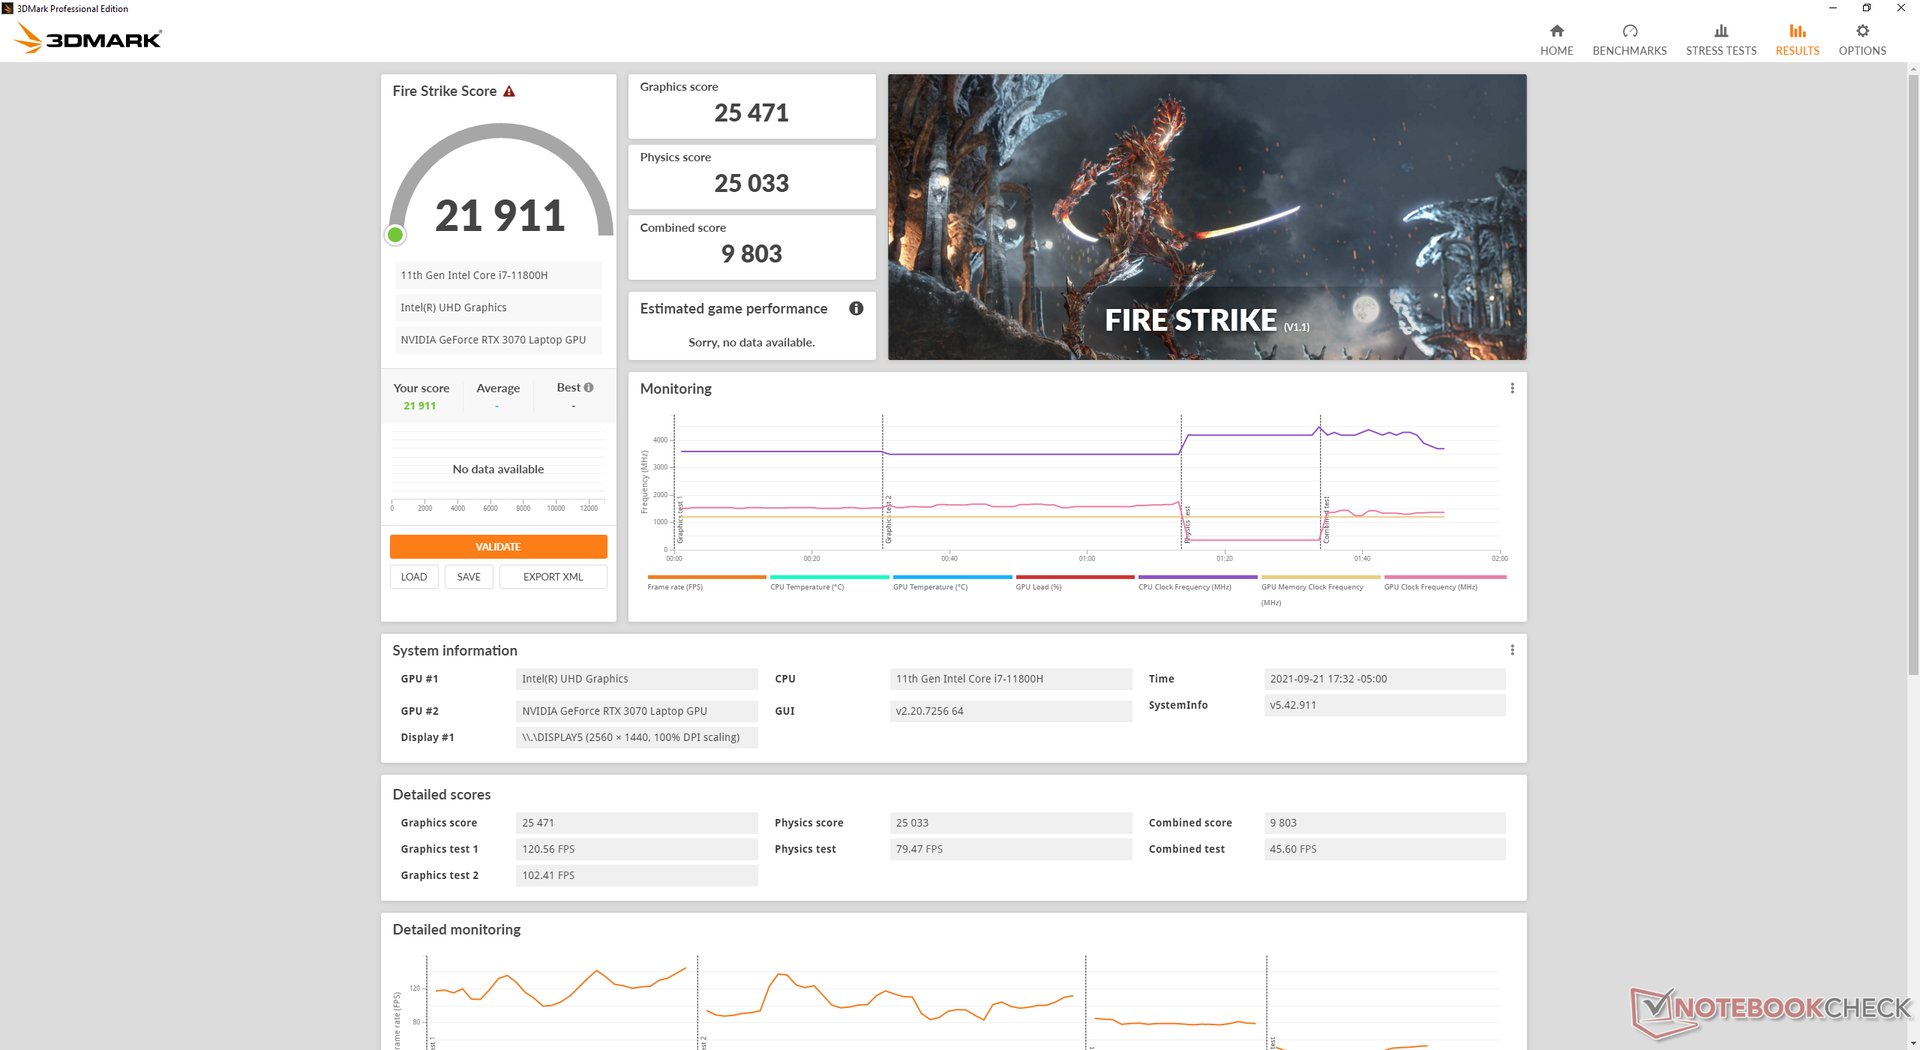
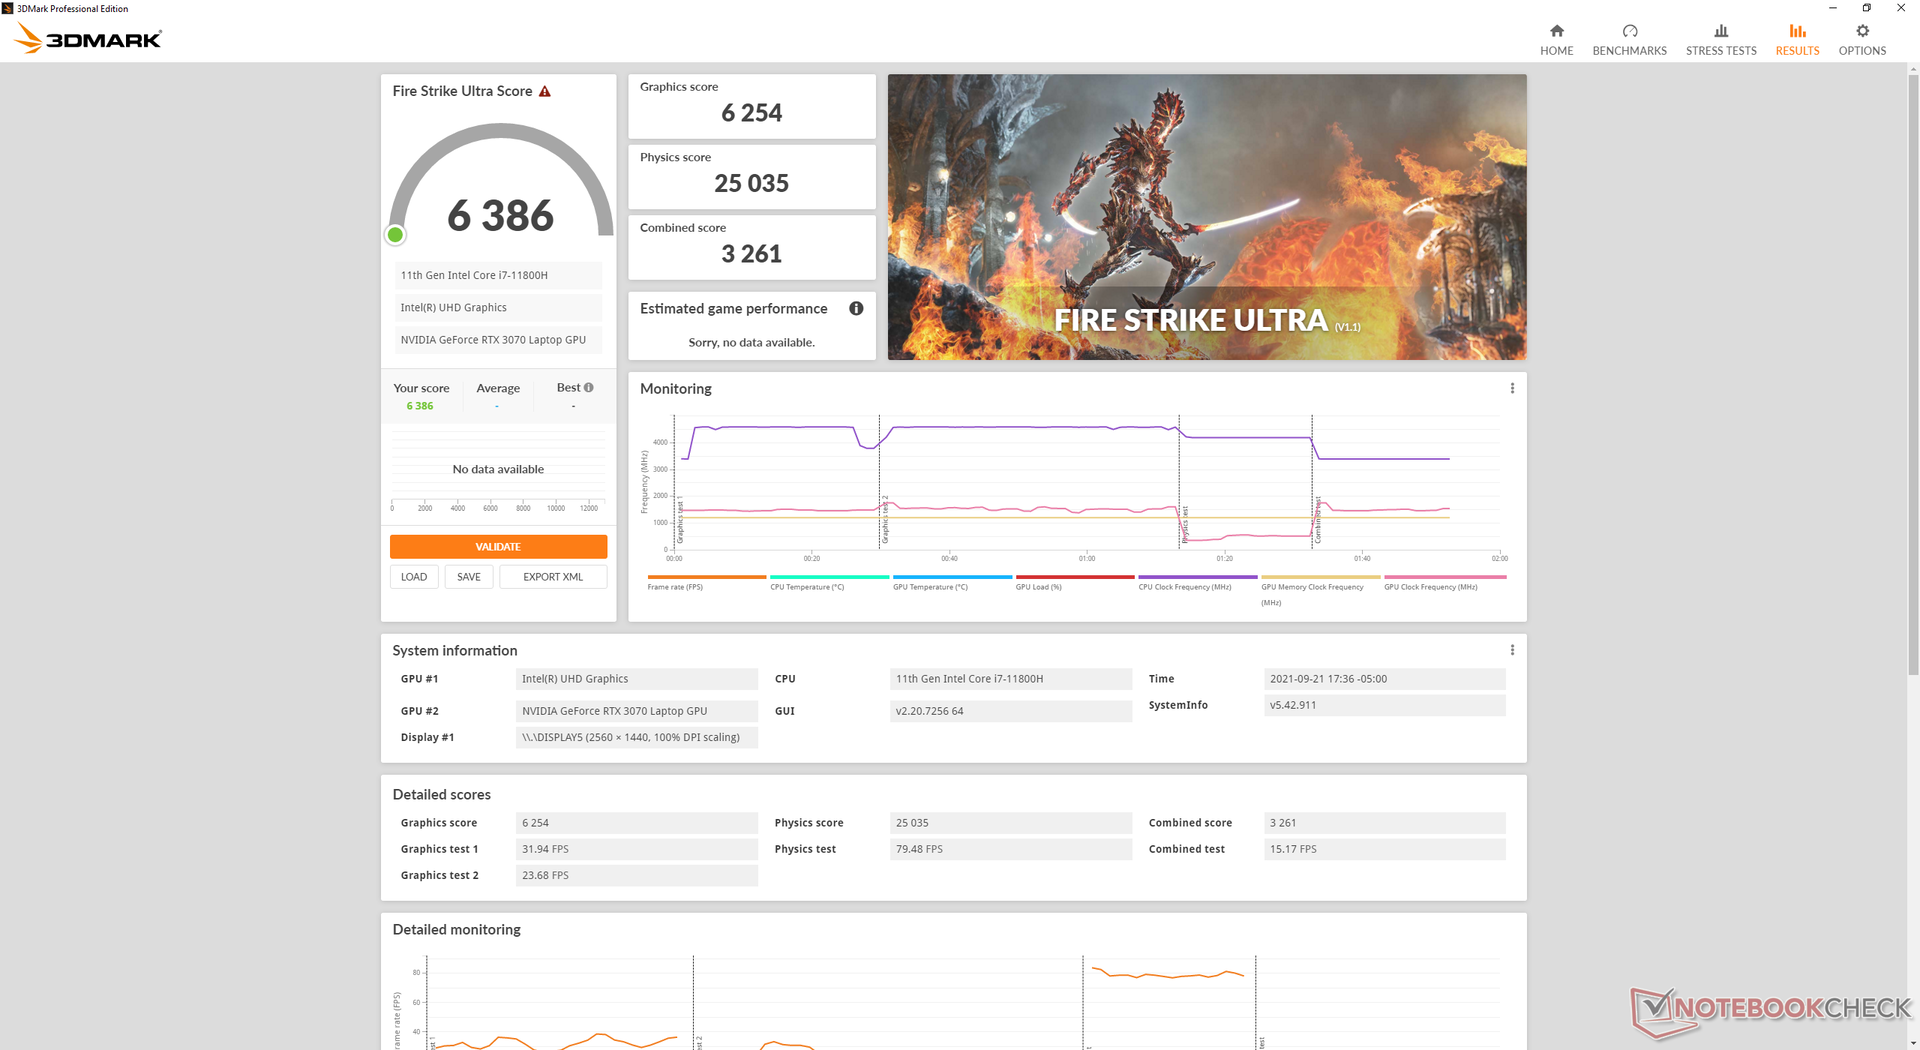
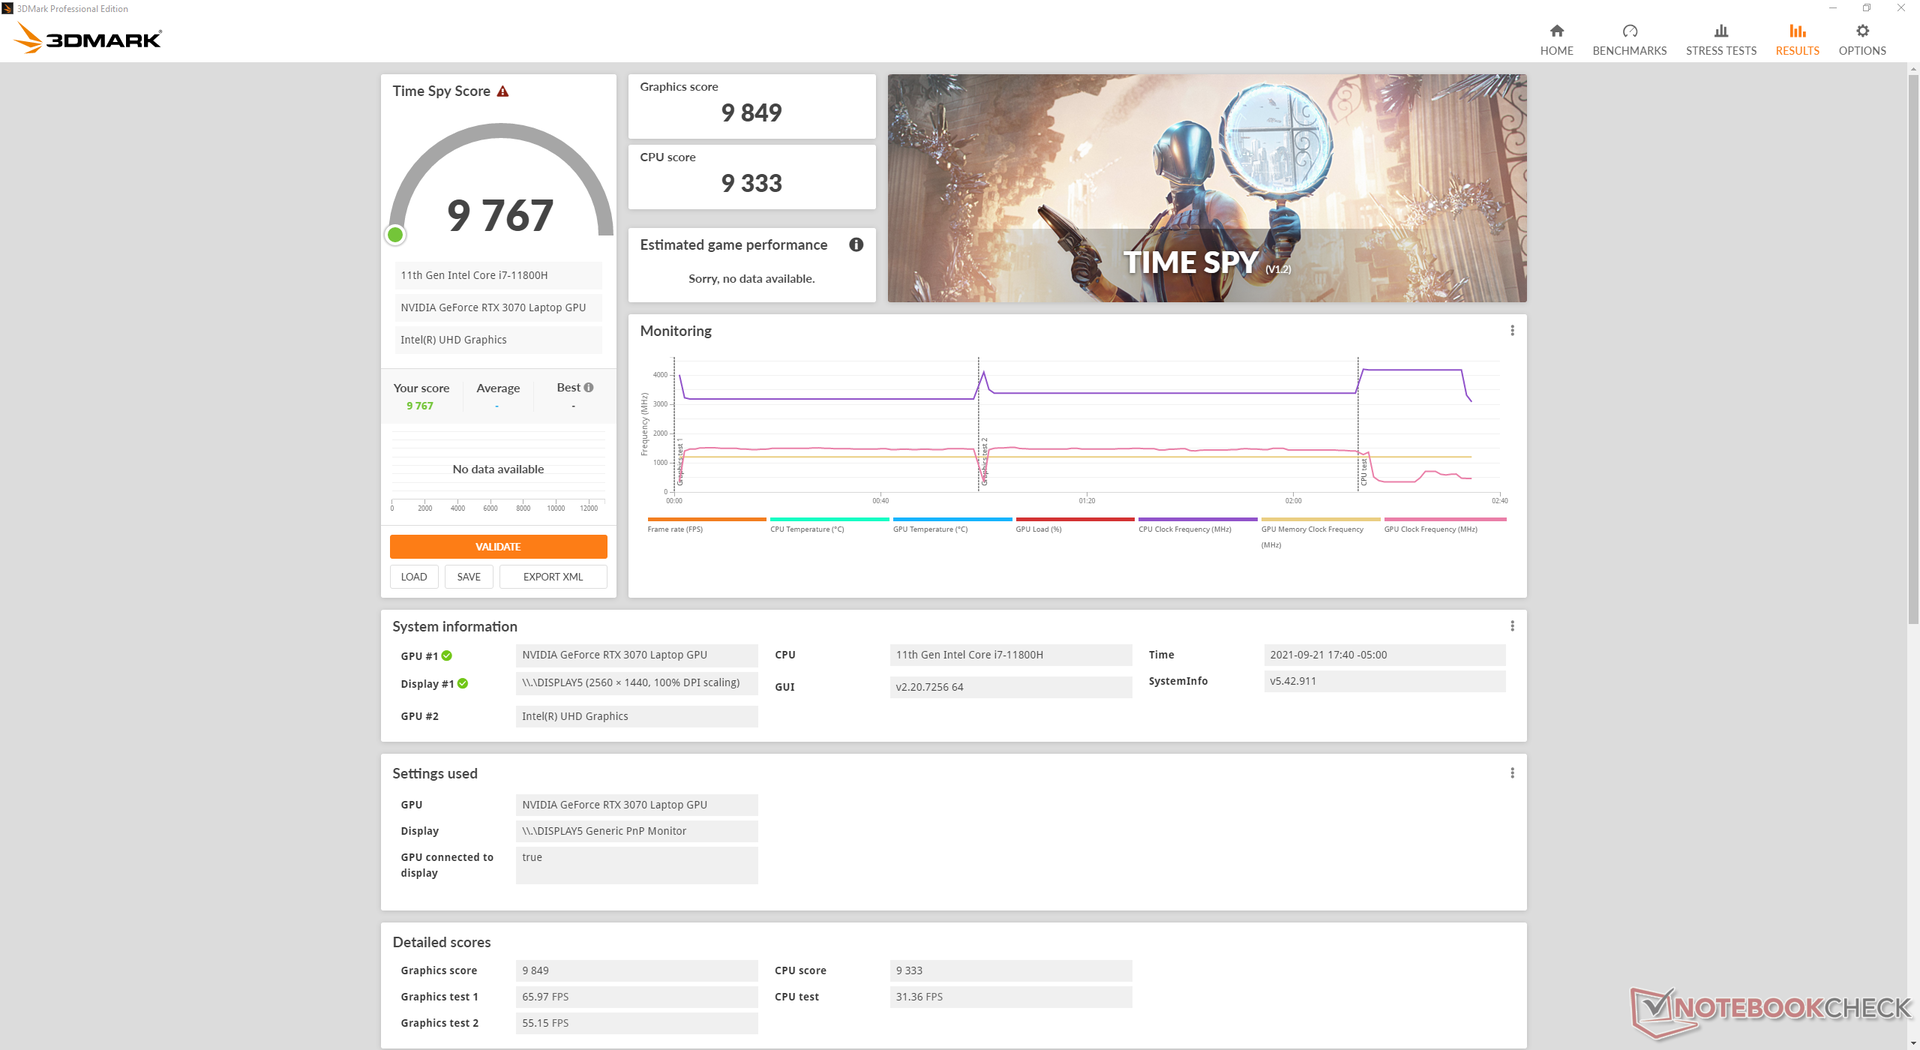
Die Leistung unserer mobilen GeForce RTX 3070 entspricht relativ zu der anderer Laptops mit dieser GPU unseren Erwartungen. Das ist etwas bedauerlich, da das ältere Alienware m15 R4 mit der RTX 3070 das neuere x15 R1 in allen 3DMark-Benchmarks konstant um 10 % schlägt. Wir vermuten, dass die niedrigere TGP des x15 R1 (110 W vs. 140 W) für die insgesamt niedrigere Grafikleistung verantwortlich ist.
Das RTX-3080-Modell wird höchstwahrscheinlich ebenfalls nicht viel schneller sein als unser RTX-3070-Modell, da ihm ebenfalls nur eine 110-W-TGP zur Verfügung steht. Größere Unterschiede dürfte es hingegen zwischen den RTX-3060- und 3070-Modellen geben.
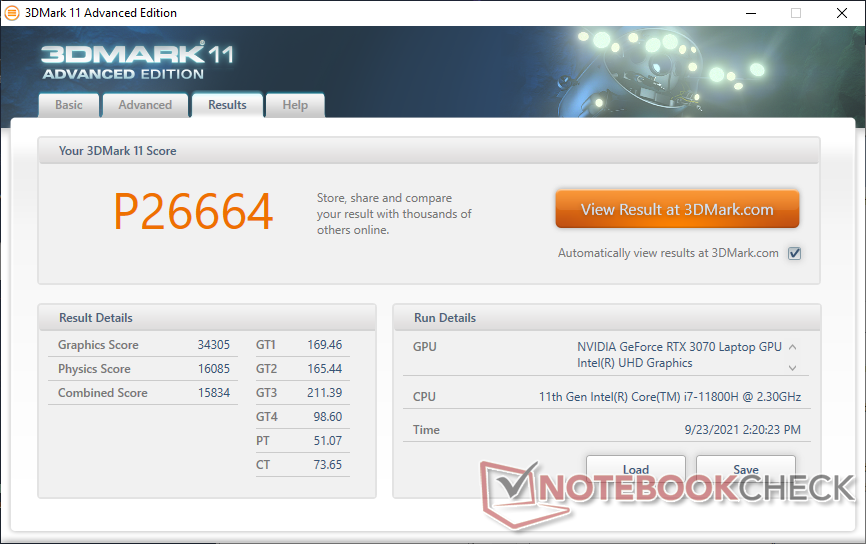
| 3DMark 11 Performance | 26664 Punkte | |
| 3DMark Cloud Gate Standard Score | 54226 Punkte | |
| 3DMark Fire Strike Score | 21911 Punkte | |
| 3DMark Time Spy Score | 9767 Punkte | |
Hilfe | ||
FPS-Verlauf Witcher 3
| min. | mittel | hoch | max. | QHD | |
|---|---|---|---|---|---|
| GTA V (2015) | 181 | 174 | 166 | 95.8 | 83.7 |
| The Witcher 3 (2015) | 415.4 | 279.4 | 197.7 | 100.2 | |
| Dota 2 Reborn (2015) | 167 | 148 | 143 | 130 | |
| Final Fantasy XV Benchmark (2018) | 150 | 123 | 93.7 | 73.8 | |
| X-Plane 11.11 (2018) | 129 | 114 | 89.9 | ||
| Far Cry 5 (2018) | 143 | 125 | 118 | 113 | 96 |
| Strange Brigade (2018) | 467 | 253 | 206 | 178 | 132 |
Emissionen
Geräuschemissionen — Nur im Gaming-Betrieb laut
Das Alienware x15 R1 nutzt die gleiche Gallium-Silikon-Wärmeleitpaste für die CPU und die gleichen Lüfterprofile im Alienware Command Center (Leise, Leistung, Maximalgeschwindigkeit) wie das x17 R1. In weniger anspruchsvollen Szenarien erzeugen die Lüfter bei einem stillen Hintergrundgeräuschniveau von 24,1 dB(A) nur 26 bis 31 dB(A), womit sie kaum auffallen und deutlich leiser sind als beim Alienware m15 R4, dessen Lüfter häufiger pulsierten.
Im Gaming-Betrieb ist die Lautstärke mit fast 50 dB(A) in den Modi "Ausbalanciert" und "Leistung" ähnlich hoch wie beim x17 R1. Im Modus "Maximalgeschwindigkeit" erzeugen die Lüfter in der Spitze sogar bis zu 55 dB(A). Obwohl es über mehr Lüfter verfügt als die meisten anderen 15,6-Zoll-Gaming-Laptops, ist das x15 R1 in dieser Hinsicht nicht unbedingt leiser.
| Alienware x15 RTX 3070 P111F GeForce RTX 3070 Laptop GPU, i7-11800H, WDC PC SN730 SDBPNTY-512G | Alienware m15 R4 RTX 3080 GeForce RTX 3080 Laptop GPU, i9-10980HK, 2x WDC PC SN730 SDBPNTY-512G (RAID 0) | MSI GS66 Stealth 10UG GeForce RTX 3070 Laptop GPU, i7-10870H, WDC PC SN730 SDBPNTY-1T00 | Razer Blade 15 Advanced (Mid 2021) GeForce RTX 3080 Laptop GPU, i7-11800H, SSSTC CA6-8D1024 | Asus Zephyrus S15 GX502L GeForce RTX 2070 Super Mobile, i7-10875H, WDC PC SN730 SDBPNTY-1T00 | Acer Predator Helios 300 PH315-53-786B GeForce RTX 3070 Laptop GPU, i7-10750H, Samsung PM981a MZVLB1T0HBLR | |
|---|---|---|---|---|---|---|
| Geräuschentwicklung | -10% | -21% | -2% | -23% | -11% | |
| aus / Umgebung * (dB) | 24.1 | 25 -4% | 26.2 -9% | 25.1 -4% | 25 -4% | 25 -4% |
| Idle min * (dB) | 26.6 | 25 6% | 34 -28% | 25.3 5% | 28 -5% | 25 6% |
| Idle avg * (dB) | 26.6 | 29 -9% | 34 -28% | 25.3 5% | 31 -17% | 27 -2% |
| Idle max * (dB) | 26.6 | 33 -24% | 34 -28% | 25.3 5% | 36 -35% | 35 -32% |
| Last avg * (dB) | 30.9 | 48 -55% | 47.2 -53% | 42 -36% | 56 -81% | 46 -49% |
| Witcher 3 ultra * (dB) | 49.9 | 46 8% | 46.3 7% | 45.6 9% | 55 -10% | 49 2% |
| Last max * (dB) | 53.5 | 49 8% | 58.2 -9% | 51.6 4% | 57 -7% | 51 5% |
* ... kleinere Werte sind besser
Lautstärkediagramm
| Idle |
| 26.6 / 26.6 / 26.6 dB(A) |
| Last |
| 30.9 / 53.5 dB(A) |
 | ||
30 dB leise 40 dB(A) deutlich hörbar 50 dB(A) störend |
||
min: | ||
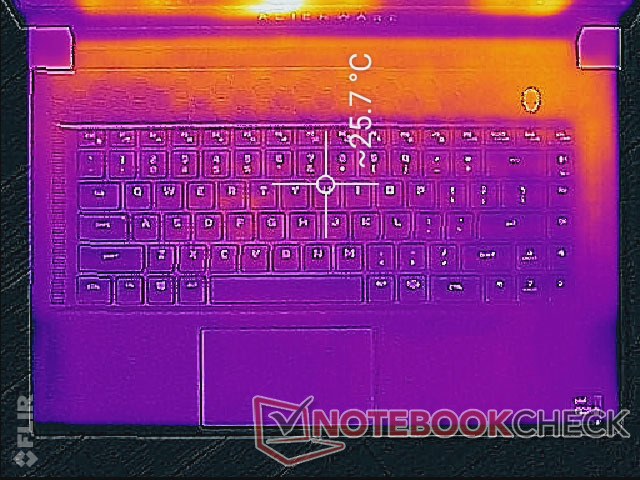
Temperatur — Heiße Rückseite
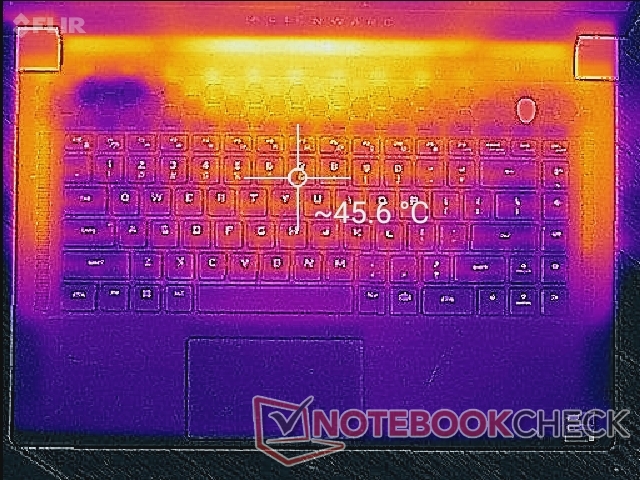
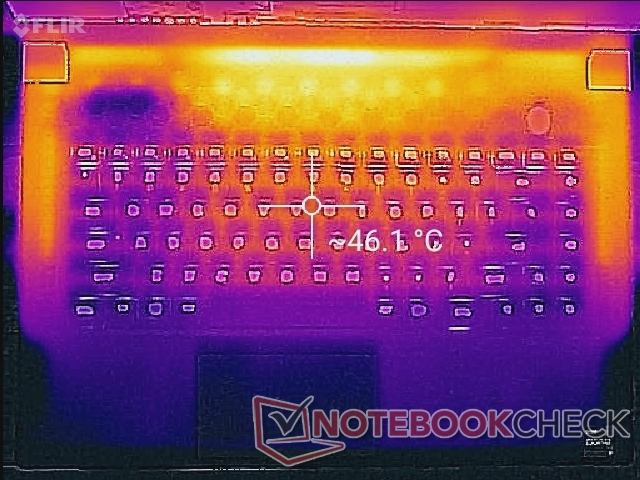
Frühere Alienware-m15-Laptops litten unter sehr warmen Handballenauflagen, die im Gaming-Betrieb fast 40 °C erreichen konnten. Zum Glück sind die Handballenauflagen des x15 R1 mit ungefähr 8 °C weniger deutlich kühler, was für die Hände und Finger spürbar angenehmer ist. Während die WASD-Tasten nicht mehr so warm werden wie zuvor, sollte man beachten, dass sich die Flächen zwischen der Tastatur und dem Gehäuserand aufgrund der darunterliegenden Kupferheatpipes stark erhitzen können.
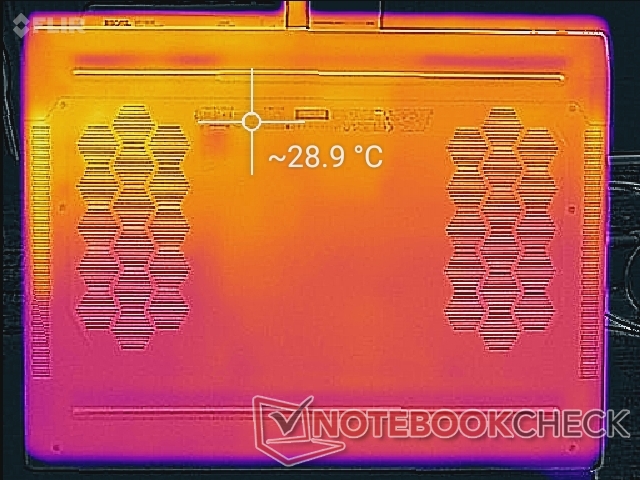
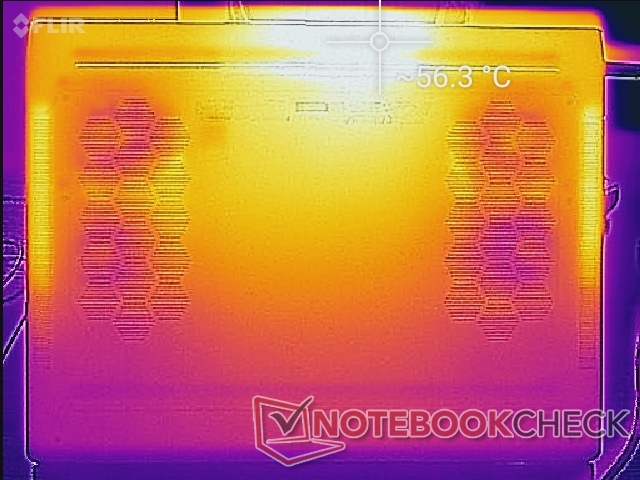
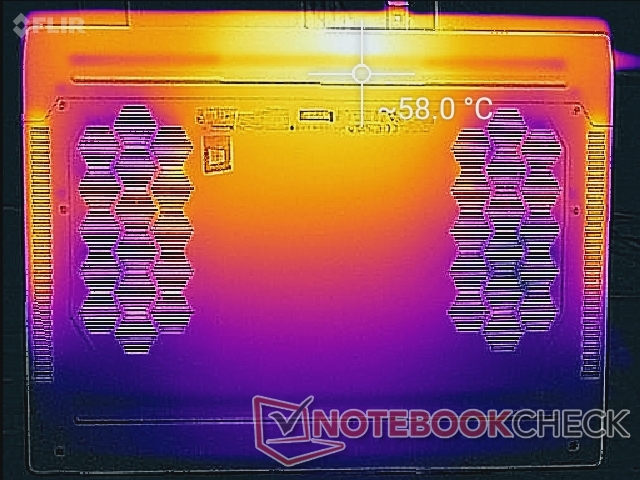
Die wärmsten Stellen auf der Ober- und Unterseite des Gehäuses erreichen jeweils fast 60 °C, womit die Maximaltemperaturen ähnlich hoch wie beim älteren m15-Design sind. Glücklicherweise befinden sich diese Stellen im hinteren Bereich, mit dem man höchstwahrscheinlich nicht in Berührung kommt.
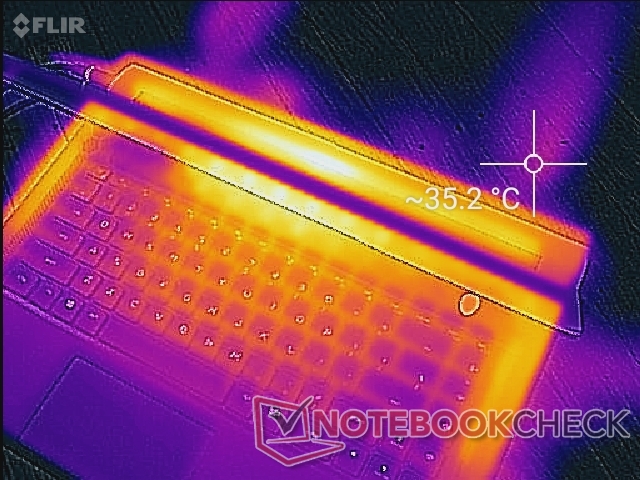
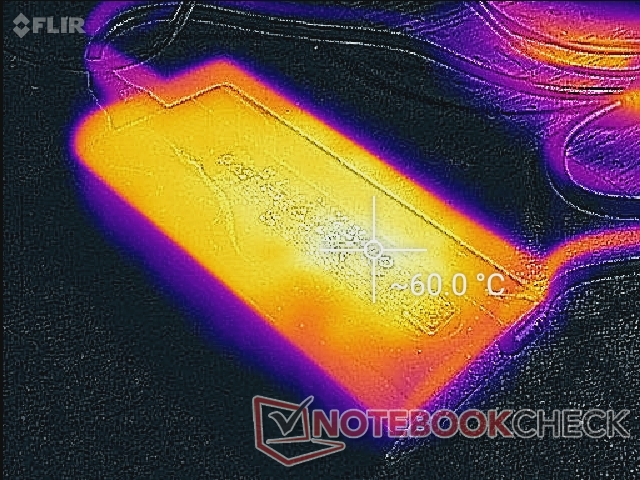
(-) Die maximale Temperatur auf der Oberseite ist 59.2 °C. Im Vergleich liegt der Klassendurchschnitt bei 40.4 °C (von 21.2 bis 68.8 °C für die Klasse Gaming).
(-) Auf der Unterseite messen wir eine maximalen Wert von 58 °C (im Vergleich zum Durchschnitt von 43.2 °C).
(+) Ohne Last messen wir eine durchschnittliche Temperatur von 26.2 °C auf der Oberseite. Der Klassendurchschnitt erreicht 33.9 °C.
(-) Beim längeren Spielen von The Witcher 3 erhitzt sich das Gerät durchschnittlich auf 43.2 °C. Der Durchschnitt der Klasse ist derzeit 33.9 °C.
(+) Die Handballen und der Touchpad-Bereich erreichen maximal 32.2 °C und damit die typische Hauttemperatur und fühlen sich daher nicht heiß an.
(-) Die durchschnittliche Handballen-Temperatur anderer getesteter Geräte war 28.8 °C (-3.4 °C).
Stresstest
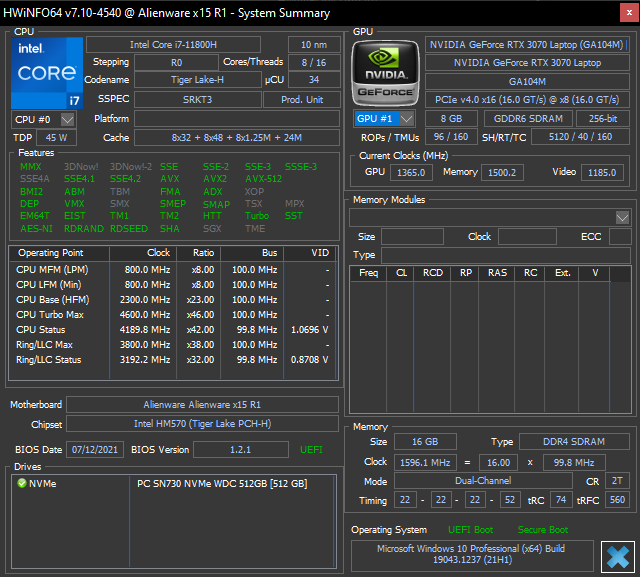
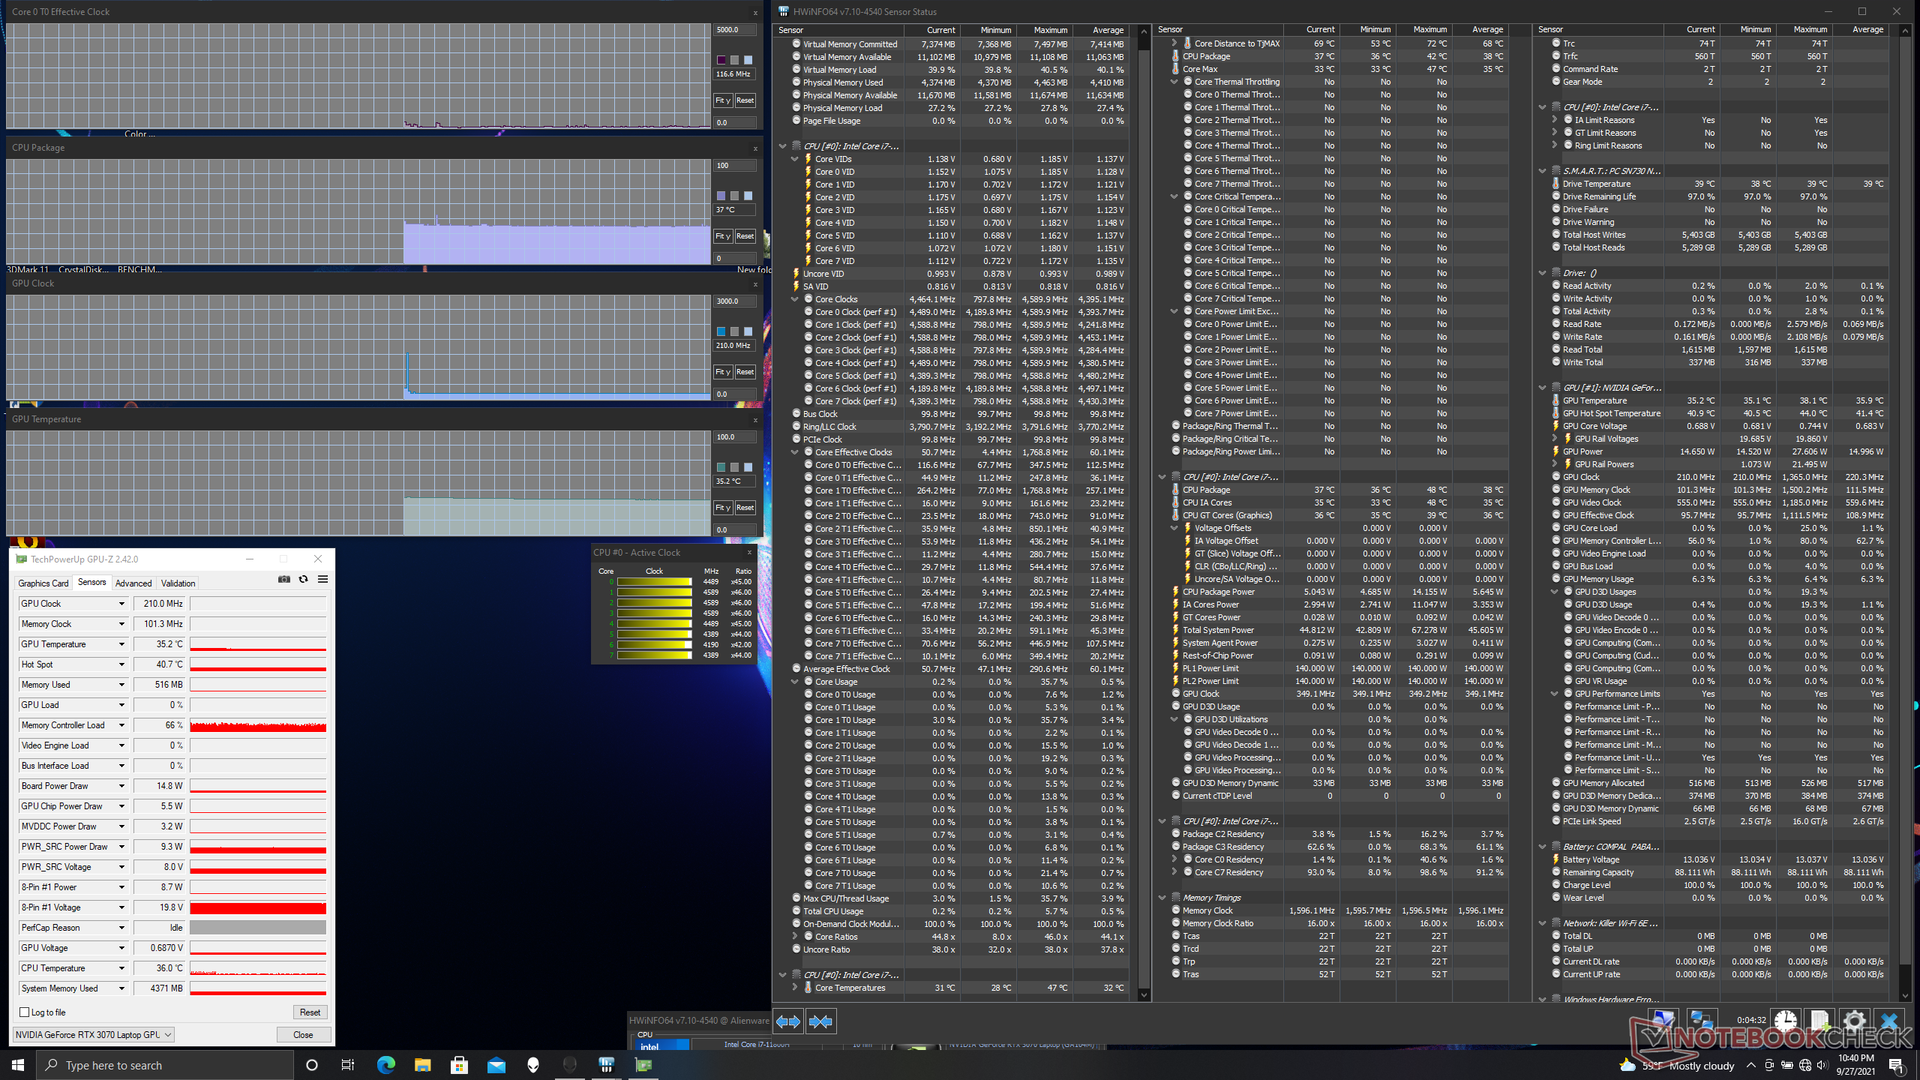
Beim Auslasten der CPU mit Prime95 schwanken die Taktfrequenz und die Temperatur zwischen 3,5 und 4 GHz bzw. 90 und 100 °C, während die CPU-Package-Power bei 79 bis 95 W liegt. Unter den gleichen Bedingungen weist das Alienware x17 R1 ein ähnliches Verhalten auf, und die Werte fluktuieren jeweils ebenfalls. Der Prozessor ist hier zugleich schneller und heißer als bei den meisten anderen Laptops, in denen er zum Einsatz kommt. Insbesondere stabilisiert sich der Core i7-11800H im Razer Blade 15 Advanced Model bei "nur" 2,9 GHz und 83 °C.
Beim Spielen von The Witcher 3 stabilisiert sich die GPU bei 1.605 MHz und 74 °C, beim Alienware m15 R4 RTX 3070 waren es 1.680 MHz bzw. 80 °C. Vor allem der Speichertakt war beim älteren m15 R4 im Vergleich zum neueren x15 R1 deutlich höher (1.750 MHz vs. 1.500 MHz laut GPU-Z). In Anbetracht der etwas besseren 3DMark-Ergebnisse sind die schnelleren Taktfrequenzen des älteren Alienware-Modells hier keine Überraschung.
Die TGP stabilisiert sich beim Spielen von The Witcher 3 bei 108 W und damit nahe am maximal möglichen 110-W-Ziel. Dell gibt die GPU mit 90 W und 20 W Turbo an und es scheint, als hätte sie in diesem Gehäuse keine Probleme damit, im Gaming-Betrieb ein hohes Leistungsniveau aufrechtzuerhalten, das den Grafikchip an seine Grenzen bringt.
Im Akkumodus ist die Grafikleistung erheblich eingeschränkt. Ein Fire-Strike-Test liefert im Akkumodus Physik- und Grafikpunktzahlen von 24.234 bzw. 16.281 Punkten, während im Netzebetrieb 25.033 bzw. 25.471 Punkte erreicht werden.
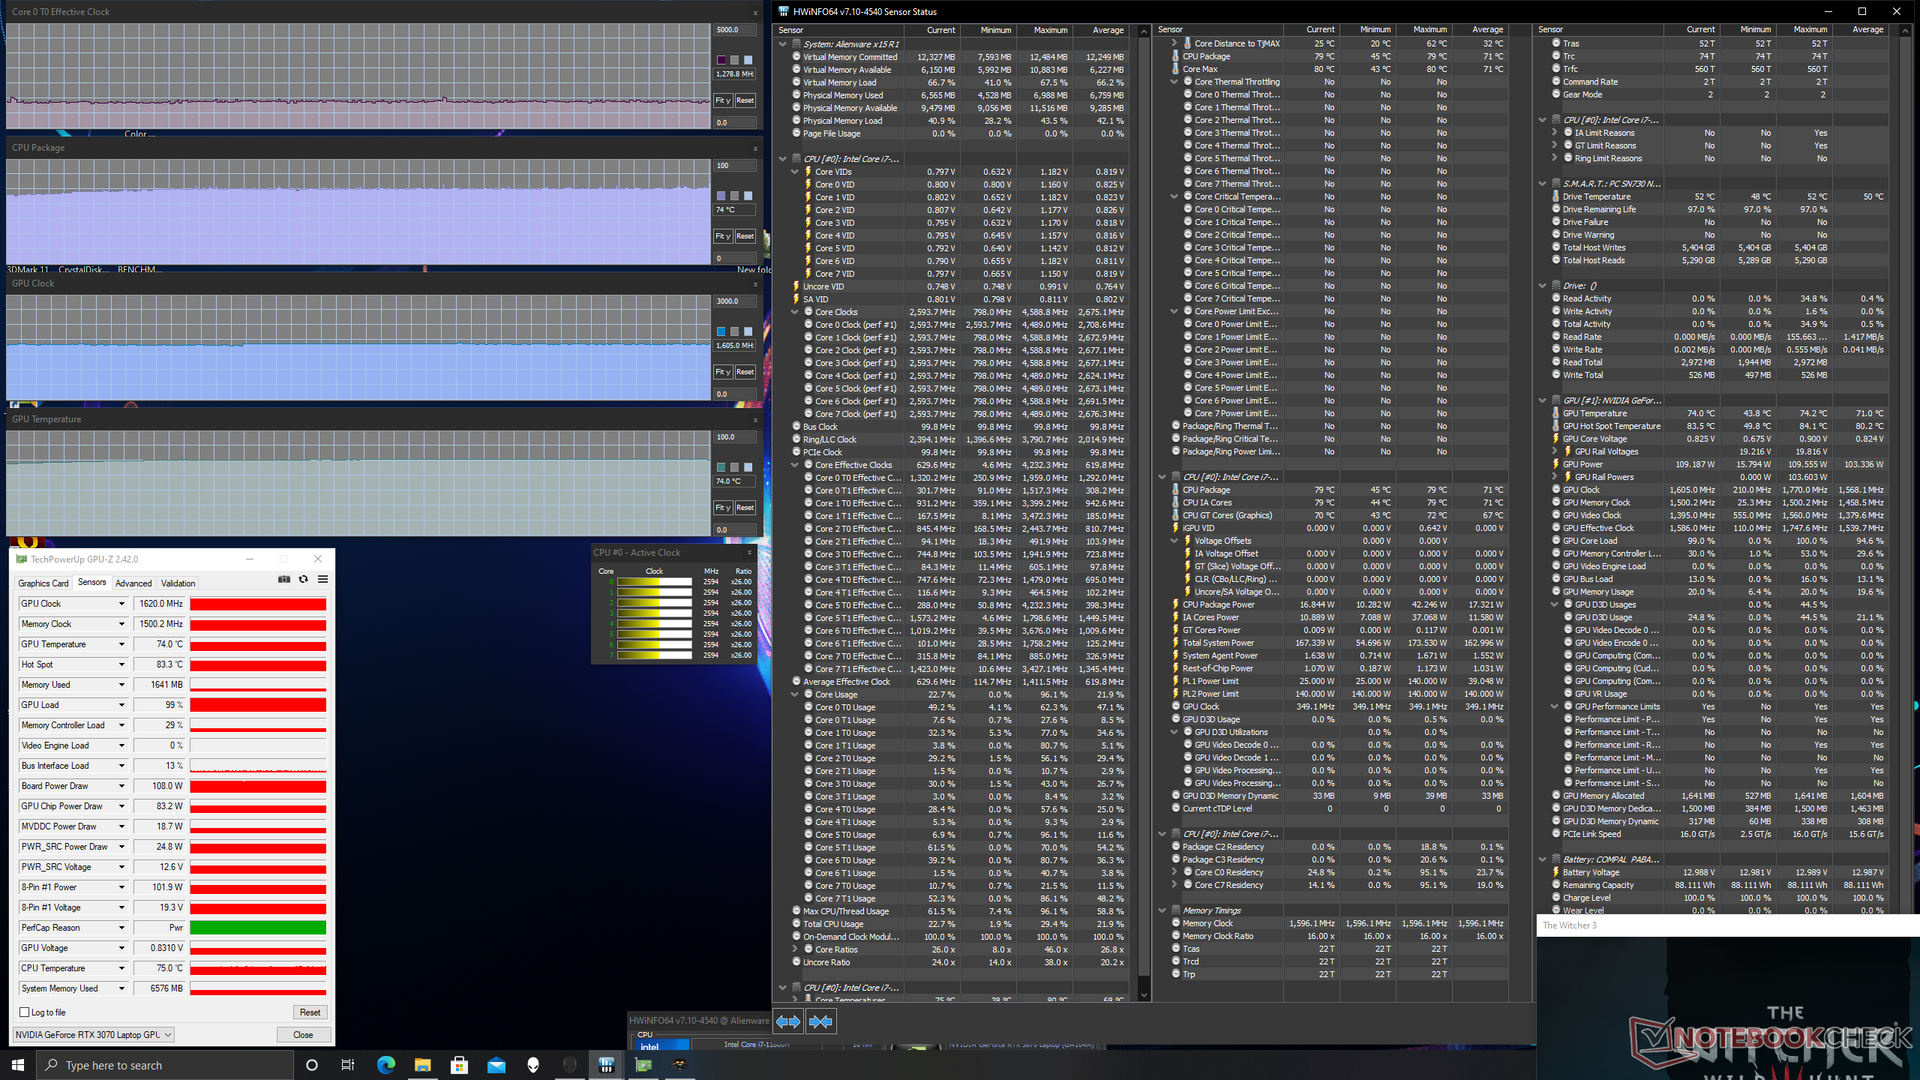
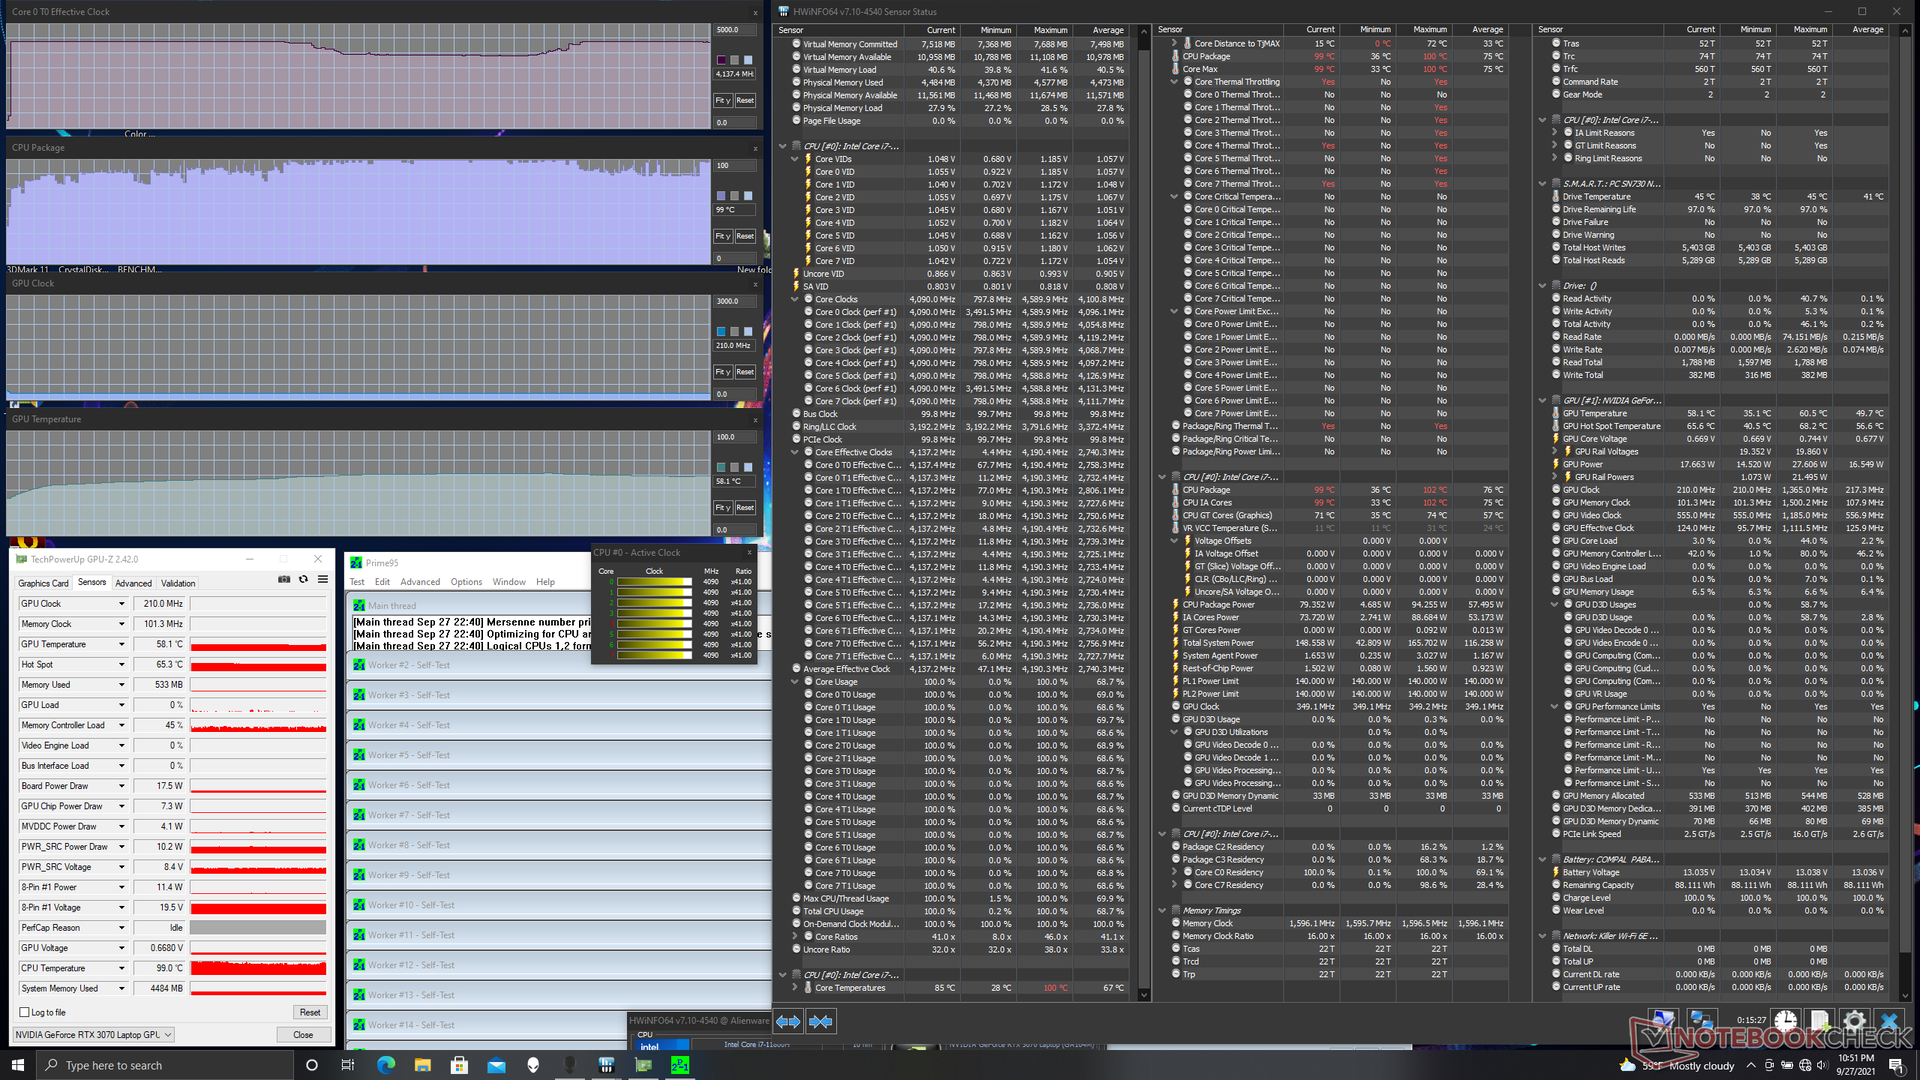
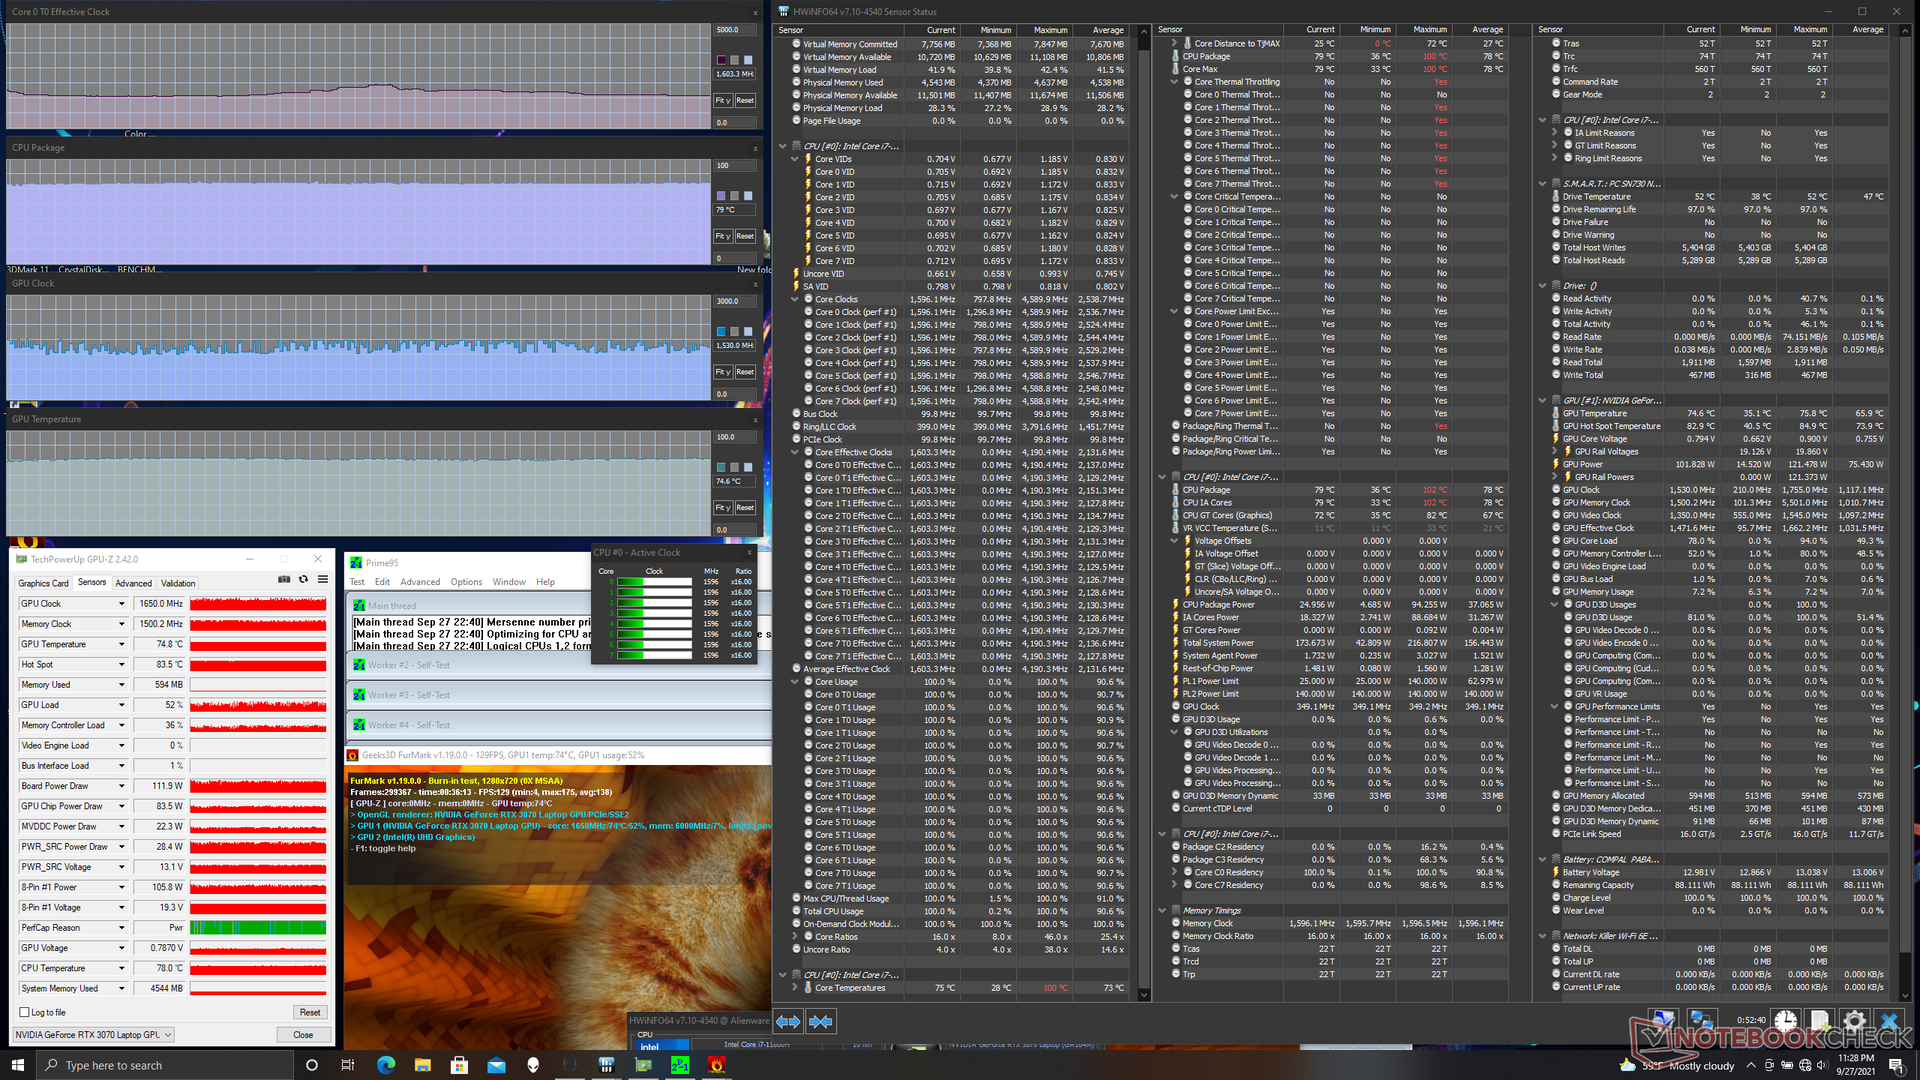
| CPU Clock (GHz) | GPU Clock (MHz) | Average CPU Temperature (°C) | Average GPU Temperature (°C) | |
| System Idle | -- | -- | 37 | 35 |
| Prime95 Stress | 3.5 - 4.2 | 90 - 100 | -- | 58 |
| Prime95 + FurMark Stress | 1.6 - 2.0 | 79 | ~1530 | 75 |
| Witcher 3 Stress | 2.6 | 1605 | 74 | 74 |
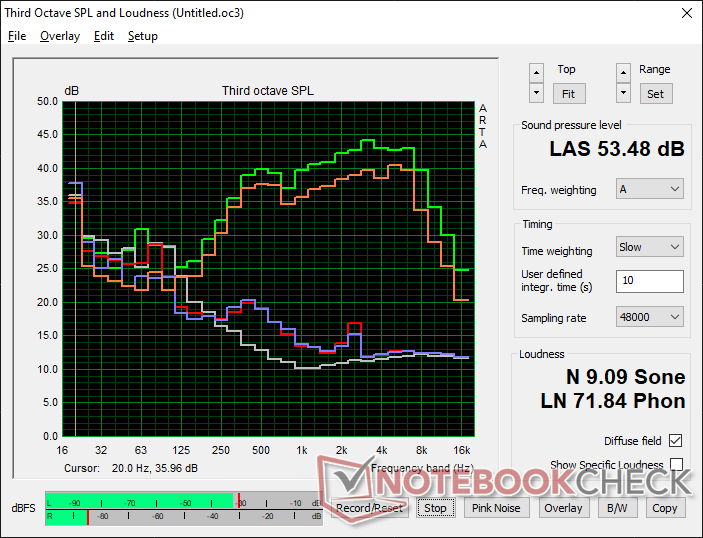
Lautsprecher — Klangqualität eines Ultrabooks
 in den vorderen Ecken. Die Klangqualität ist in Ordnung, allerdings lassen die Maximallautstärke und der Bass zu wünschen übrig.")

Alienware x15 RTX 3070 P111F Audio Analyse
(+) | Die Lautsprecher können relativ laut spielen (82.7 dB)
Bass 100 - 315 Hz
(-) | kaum Bass - 24.2% niedriger als der Median
(±) | durchschnittlich lineare Bass-Wiedergabe (11.8% Delta zum Vorgänger)
Mitteltöne 400 - 2000 Hz
(±) | zu hohe Mitten, vom Median 10.3% abweichend
(±) | Linearität der Mitten ist durchschnittlich (8.8% Delta zum Vorgänger)
Hochtöne 2 - 16 kHz
(±) | zu hohe Hochtöne, vom Median nur 6.1% abweichend
(±) | durchschnittlich lineare Hochtöne (8.6% Delta zum Vorgänger)
Gesamt im hörbaren Bereich 100 - 16.000 Hz
(±) | hörbarer Bereich ist durchschnittlich linear (29.3% Abstand zum Median)
Im Vergleich zu allen Geräten derselben Klasse
» 95% aller getesteten Geräte dieser Klasse waren besser, 2% vergleichbar, 3% schlechter
» Das beste Gerät hat einen Delta-Wert von 6%, durchschnittlich ist 18%, das schlechteste Gerät hat 132%
Im Vergleich zu allen Geräten im Test
» 87% aller getesteten Geräte waren besser, 3% vergleichbar, 10% schlechter
» Das beste Gerät hat einen Delta-Wert von 4%, durchschnittlich ist 24%, das schlechteste Gerät hat 134%
Apple MacBook 12 (Early 2016) 1.1 GHz Audio Analyse
(+) | Die Lautsprecher können relativ laut spielen (83.6 dB)
Bass 100 - 315 Hz
(±) | abgesenkter Bass - 11.3% geringer als der Median
(±) | durchschnittlich lineare Bass-Wiedergabe (14.2% Delta zum Vorgänger)
Mitteltöne 400 - 2000 Hz
(+) | ausgeglichene Mitten, vom Median nur 2.4% abweichend
(+) | lineare Mitten (5.5% Delta zum Vorgänger)
Hochtöne 2 - 16 kHz
(+) | ausgeglichene Hochtöne, vom Median nur 2% abweichend
(+) | sehr lineare Hochtöne (4.5% Delta zum Vorgänger)
Gesamt im hörbaren Bereich 100 - 16.000 Hz
(+) | hörbarer Bereich ist sehr linear (10.2% Abstand zum Median
Im Vergleich zu allen Geräten derselben Klasse
» 7% aller getesteten Geräte dieser Klasse waren besser, 2% vergleichbar, 91% schlechter
» Das beste Gerät hat einen Delta-Wert von 5%, durchschnittlich ist 18%, das schlechteste Gerät hat 53%
Im Vergleich zu allen Geräten im Test
» 5% aller getesteten Geräte waren besser, 1% vergleichbar, 94% schlechter
» Das beste Gerät hat einen Delta-Wert von 4%, durchschnittlich ist 24%, das schlechteste Gerät hat 134%
Energieverwaltung
Energieaufnahme
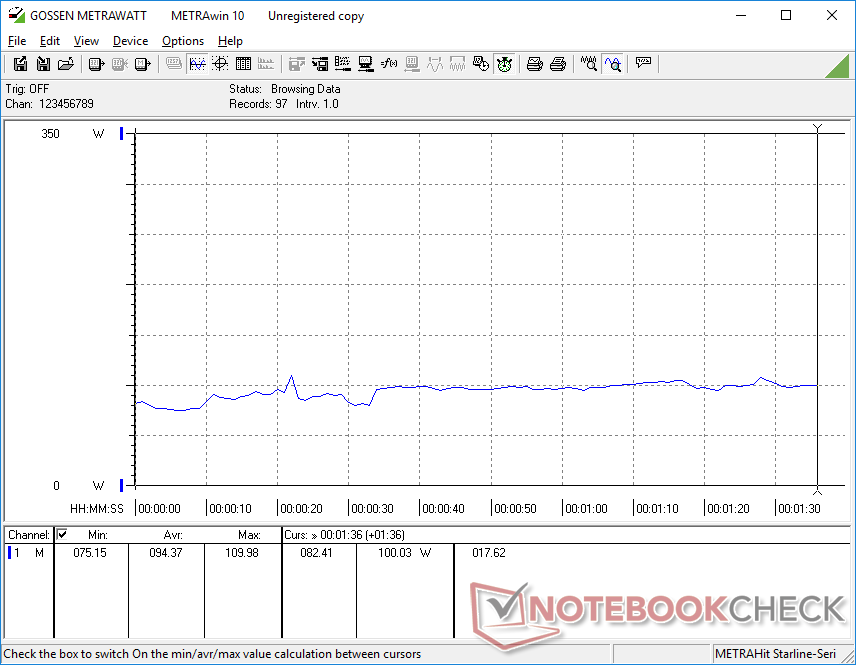
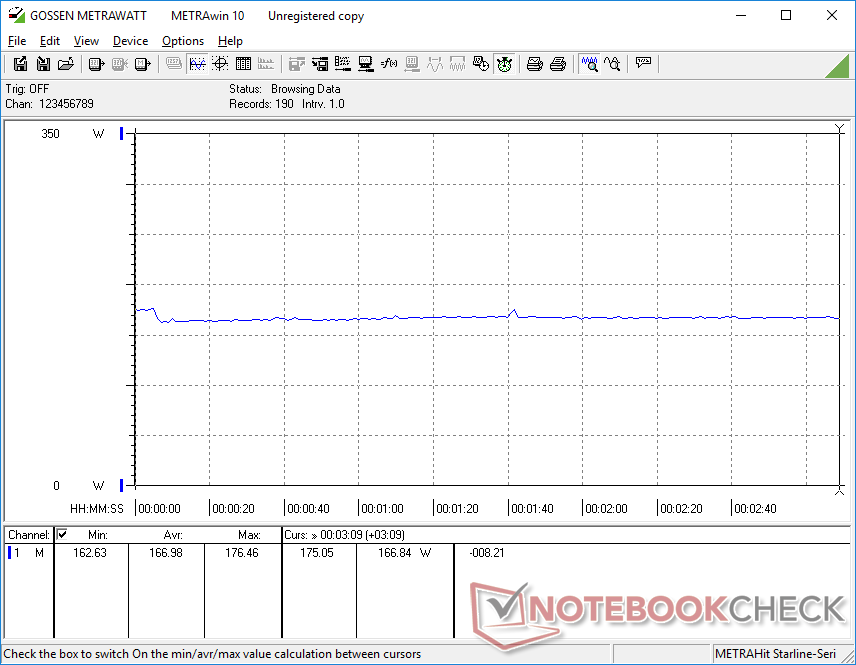
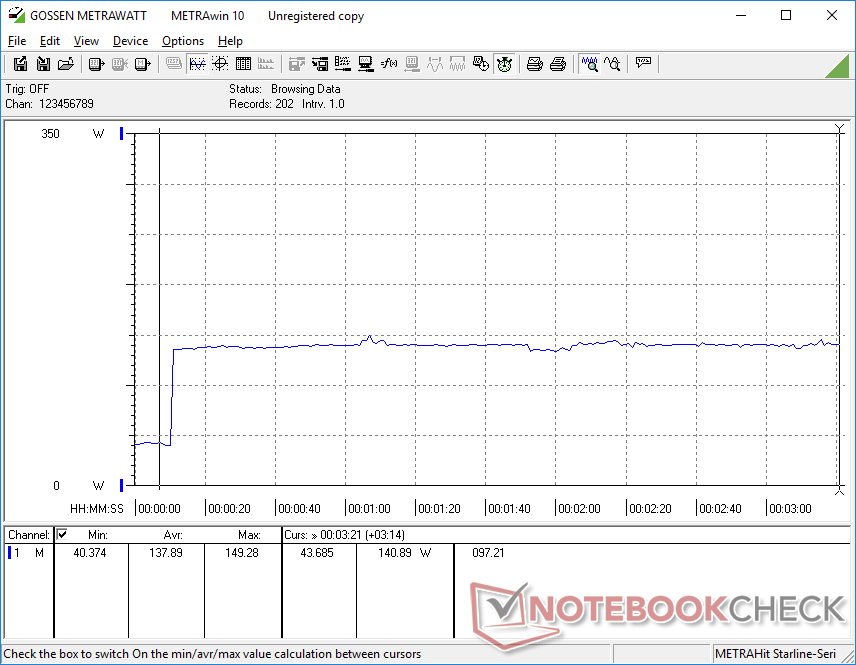
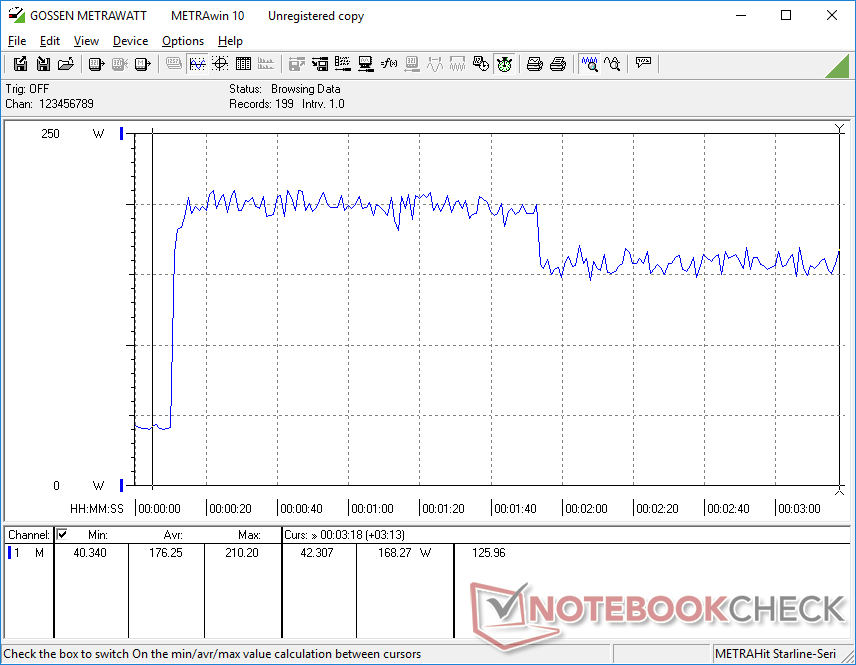
Die Energieaufnahme hat sich gegenüber der des Alienware m15 R4 aus dem letzten Jahr deutlich verbessert. Im Leerlauf auf dem Desktop werden nur 16 W verbraucht, während der Vorgänger hier mehr als das doppelte benötigte. Beim Spielen von The Witcher 3 werden hier rund 167 W verbraucht und beim m15 R4, das mit der gleichen RTX-3070-GPU ausgestattet ist, sind es 194 W, was einer Ersparnis von 14 % bei einer um 10 % niedrigeren Leistung entspricht. Dass der Unterschied zwischen 194 W und 167 W mit der TGP-Differenz der beiden Laptops nahezu identisch ausfällt, ist wohl kein Zufall.
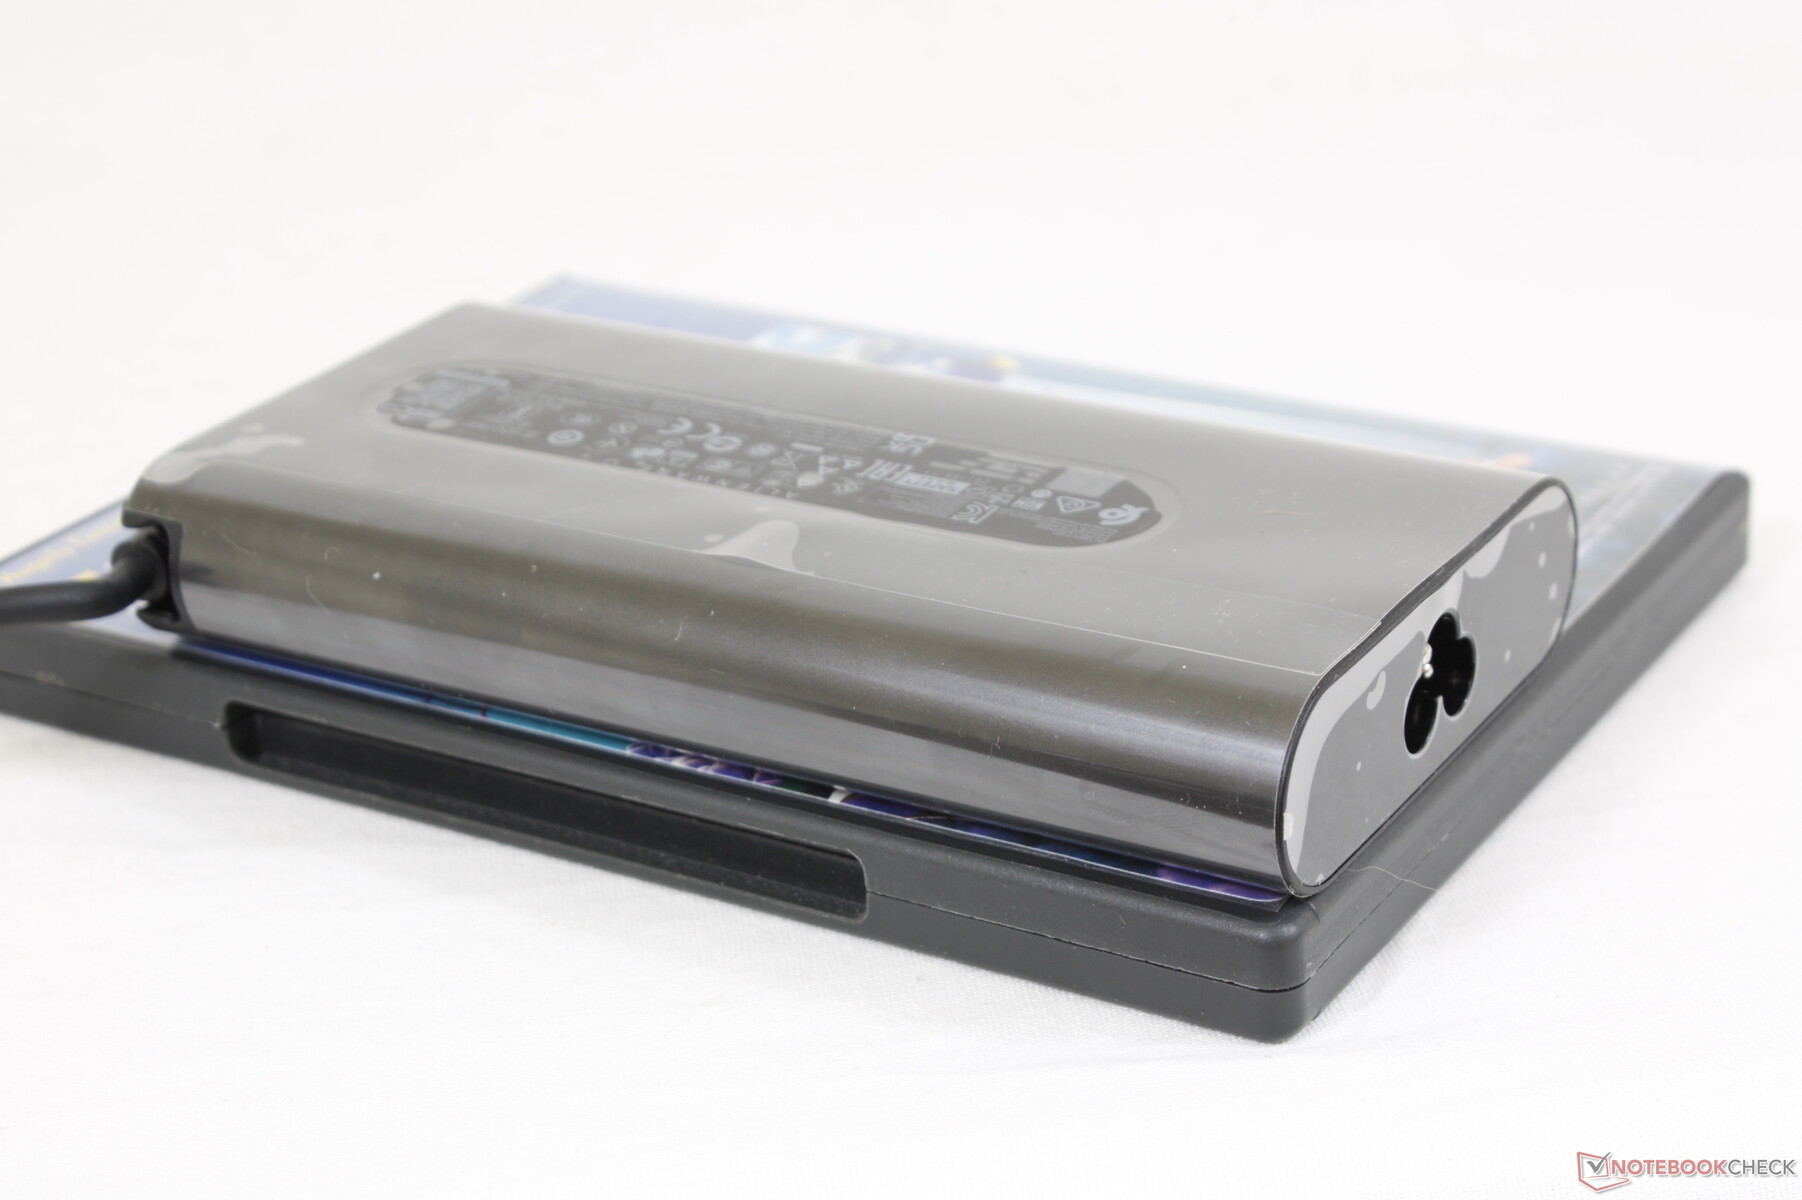
Wir konnten an dem mittelgroßen (~15,2 x 7,6 x 2,4 cm) 240-W-Netzteil einen temporären Spitzenverbrauch von 184 W messen. Das gleiche Netzteil befindet sich übrigens auch im Lieferumfang von bestimmten, günstigeren Alienware-x17-R1-Modellen.
| Aus / Standby | |
| Idle | |
| Last |
|
Legende:
min: | |
| Alienware x15 RTX 3070 P111F i7-11800H, GeForce RTX 3070 Laptop GPU, WDC PC SN730 SDBPNTY-512G, IPS, 2560x1440, 15.6" | Alienware m15 R4 i9-10980HK, GeForce RTX 3070 Laptop GPU, Micron 2300 1TB MTFDHBA1T0TDV, IPS, 1920x1080, 15.6" | MSI GS66 Stealth 10UG i7-10870H, GeForce RTX 3070 Laptop GPU, WDC PC SN730 SDBPNTY-1T00, IPS, 1920x1080, 15.6" | Razer Blade 15 Advanced (Mid 2021) i7-11800H, GeForce RTX 3080 Laptop GPU, SSSTC CA6-8D1024, IPS, 1920x1080, 15.6" | Asus Zephyrus S15 GX502L i7-10875H, GeForce RTX 2070 Super Mobile, WDC PC SN730 SDBPNTY-1T00, IPS, 1920x1080, 15.6" | Acer Predator Helios 300 PH315-53-786B i7-10750H, GeForce RTX 3070 Laptop GPU, Samsung PM981a MZVLB1T0HBLR, IPS, 1920x1080, 15.6" | |
|---|---|---|---|---|---|---|
| Stromverbrauch | -54% | 8% | -10% | 8% | 25% | |
| Idle min * (Watt) | 15.7 | 35 -123% | 12.9 18% | 19.5 -24% | 7 55% | 4 75% |
| Idle avg * (Watt) | 20.3 | 39 -92% | 15.4 24% | 23.3 -15% | 13 36% | 11 46% |
| Idle max * (Watt) | 43 | 48 -12% | 27.1 37% | 40.1 7% | 25 42% | 24 44% |
| Last avg * (Watt) | 94.4 | 135 -43% | 98.2 -4% | 98.9 -5% | 148 -57% | 91 4% |
| Witcher 3 ultra * (Watt) | 167 | 194 -16% | 164.9 1% | 174 -4% | 175 -5% | 164 2% |
| Last max * (Watt) | 183.4 | 252 -37% | 232.9 -27% | 214 -17% | 232 -26% | 220 -20% |
* ... kleinere Werte sind besser
Power Consumption Witcher 3 / Stresstest
Akkulaufzeit — Viel höher als zuvor
Wie beim Sprung vom Alienware m17 zum x17 resultiert auch der Sprung vom Alienware m15 zum x15 aufgrund der oben erwähnten, höheren Effizienz in einer insgesamt merklich höheren Akkulaufzeit. Wir konnten eine WLAN-Gesamtlaufzeit von gut 6 Stunden messen, während as m15 R4 trotz der Akkukapazität von ebenfalls rund 87 Wh nur 2 Stunden durchhält.
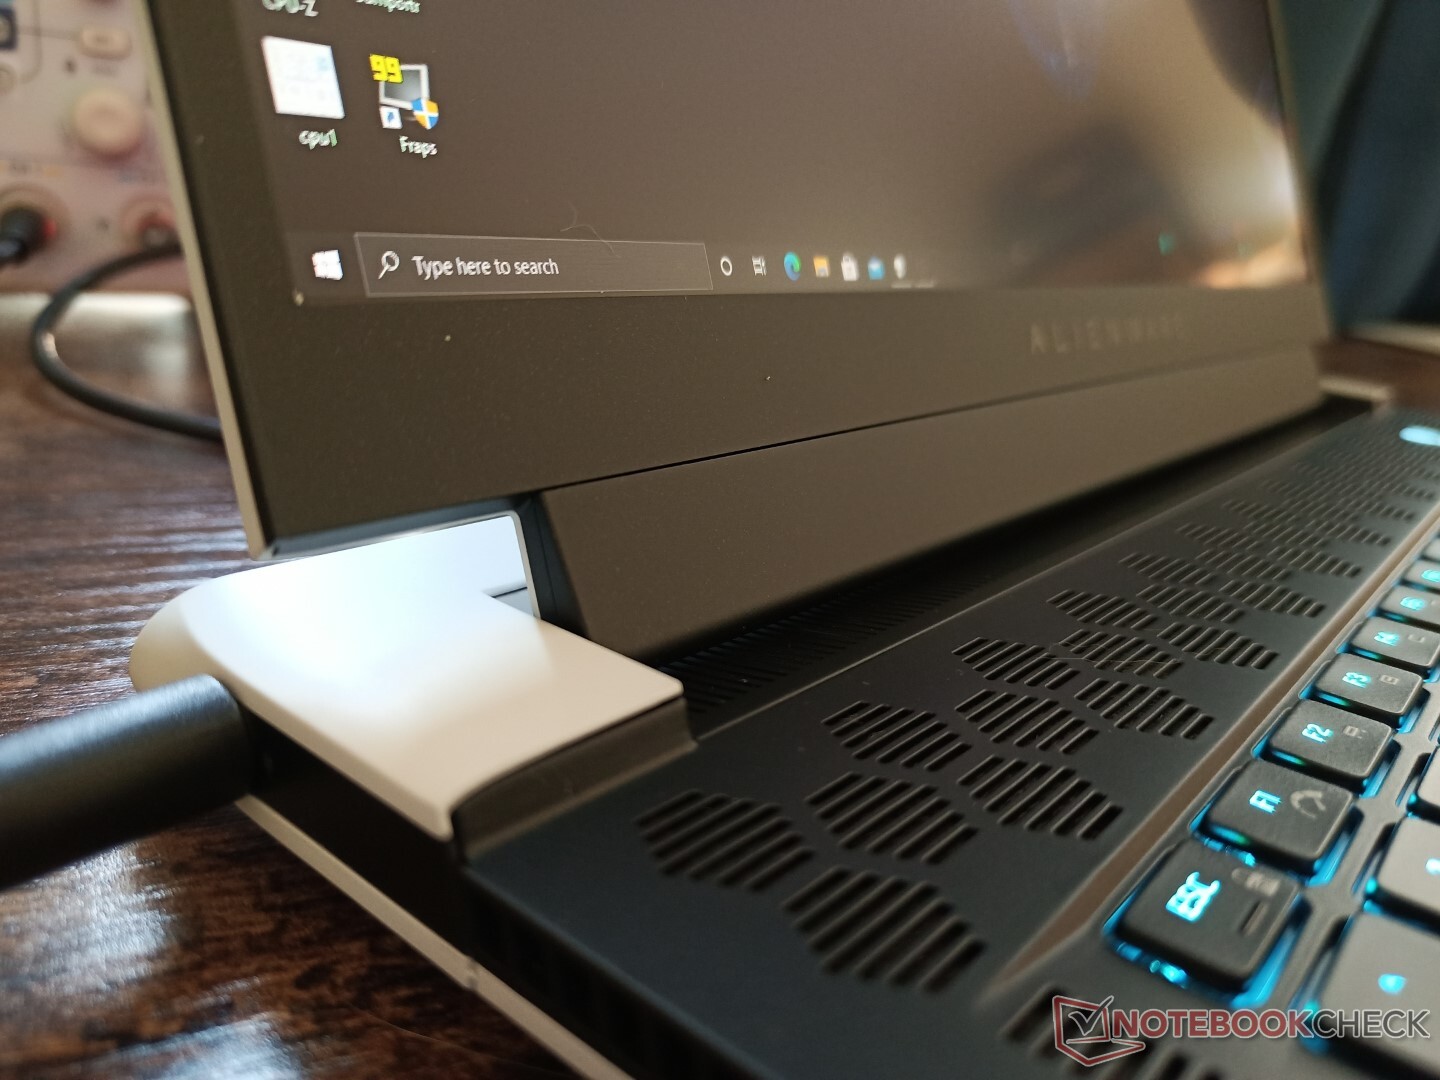
Den leeren Akku vollständig zu laden gelingt mit dem mitgelieferten Hohlsteckernetzteil in nur 75 Minuten. Der Laptop kann auch über USB-C geladen werden, der Ladevorgang dauert dann jedoch länger.
| Alienware x15 RTX 3070 P111F i7-11800H, GeForce RTX 3070 Laptop GPU, 87 Wh | Alienware m15 R4 RTX 3080 i9-10980HK, GeForce RTX 3080 Laptop GPU, 86 Wh | MSI GS66 Stealth 10UG i7-10870H, GeForce RTX 3070 Laptop GPU, 99.9 Wh | Razer Blade 15 Advanced (Mid 2021) i7-11800H, GeForce RTX 3080 Laptop GPU, 80 Wh | Asus Zephyrus S15 GX502L i7-10875H, GeForce RTX 2070 Super Mobile, 76 Wh | Acer Predator Helios 300 PH315-53-786B i7-10750H, GeForce RTX 3070 Laptop GPU, 58.75 Wh | |
|---|---|---|---|---|---|---|
| Akkulaufzeit | -41% | 57% | -3% | 2% | 27% | |
| Idle (h) | 9.7 | 10.8 11% | 8.7 -10% | 10.6 9% | ||
| WLAN (h) | 6.1 | 1.8 -70% | 7.1 16% | 5.9 -3% | 3 -51% | 6.4 5% |
| Last (h) | 0.9 | 0.8 -11% | 2.2 144% | 1.5 67% | 1.5 67% | |
| Witcher 3 ultra (h) | 0.8 |
Pro
Contra
Fazit — Große Fortschritte, kleine Rückschritte
Dell wollte nicht nur den bisher dünnsten 15,6-Zoll-Alienware-Laptop, sondern auch den aktuell schlankesten 15,6-Zoll-Gaming-Laptop mit GeForce-RTX-Grafik bauen. Das ist eine beachtliche Leistung, allerdings sollte man sich auch über die Nachteile im Klaren sein.
Mit nur 90-110 W besitzt das neuere Alienware x15 R1 nämlich eine niedrigere GPU-TGP als das m15 R4 aus dem Vorjahr mit 140 W, was in einer etwas niedrigeren Grafikleistung resultiert. Dazu ist der Laptop schwerer und seine Grundfläche trotz der aufwendigen Kühllösung größer als bei vielen 15,6-Zoll-Konkurrenten, wie zum Beispiel dem Razer Blade 15 und dem MSI GS66. Der Arbeitsspeicher kann nicht aufgerüstet werden, was fortgeschrittenen Nutzern ein Dorn im Auge sein könnte. Das ungewöhnliche Anschlusslayout ist für viele Nutzer vermutlich ebenfalls nicht optimal.
Das Alienware x15 R1 ist dünner, kühler und langlebiger als das Alienware m15 R5. Die reine Grafikleistung ist jedoch nicht unbedingt höher.
Dafür bietet das aktuelle x15 R1 gegenüber der m15-Reihe viele entscheidende Verbesserungen. Vor allem die Akkulaufzeit, die Energieaufnahme, das Lüfterverhalten und die Oberflächentemperaturen haben sich trotz der schlankeren Konstruktion und den größtenteils identischen Displayoptionen stark verbessert. Auch die Prozessorleistung und das Tippgefühl haben unsere Erwartungen übertroffen. Wer die bestmögliche CPU-Leistung benötigt, aber nicht zu den dickeren Modellen der Area-51m- bzw. MSI-GT-Reihe greifen möchte, bekommt mit dem Alienware x15 die nächstbeste Lösung. Für alle, die oft unterwegs sind, ist das kompaktere Razer Blade 15 eine Überlegung wert, da es eine vergleichbare Gaming-Leistung bietet.
Preis und Verfügbarkeit
Ein FHD-Modell des Alienware x15 R1, das unserem Testgerät abgesehen von der Displayauflösung sehr ähnlich ist, ist derzeit auf Amazon für 2.660 Euro erhältlich. Die meisten Konfigurationsmöglichkeiten findet man in Dells Online-Shop.
Alienware x15 RTX 3070 P111F
- 30.09.2021 v7 (old)
Allen Ngo
Preisvergleich

