Notebookcheck Logo

Asus ROG Strix G15 G512LW Laptop-Test: Viel besser als das G512LI
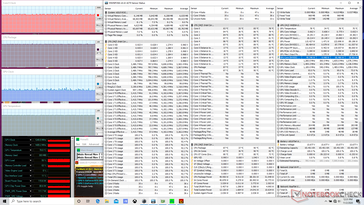
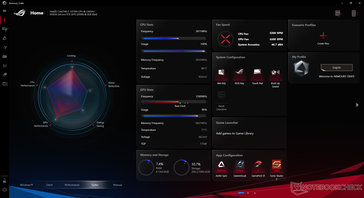
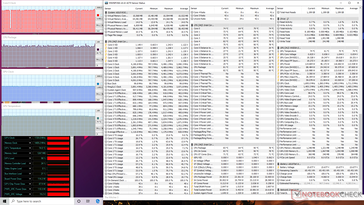
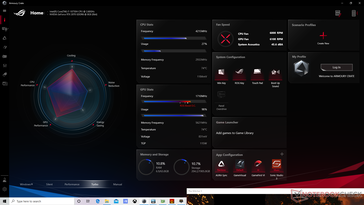
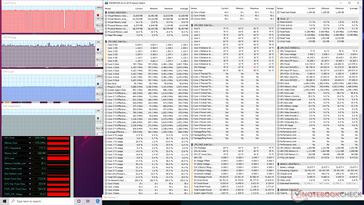
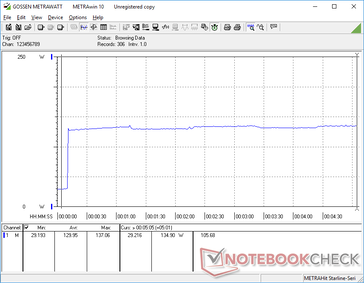
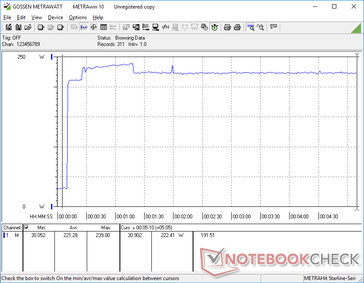
Keine Drosselung.

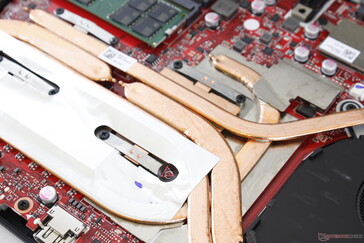
Das Asus-System verwendet für seine CPU flüssiges Metall im Vergleich zu herkömmlicher Wärmeleitpaste. Obwohl die Turbo-Boost-Nachhaltigkeit ausgezeichnet ist, bleiben die Kerntemperaturen beim Spielen mit ca. 80 C mild.

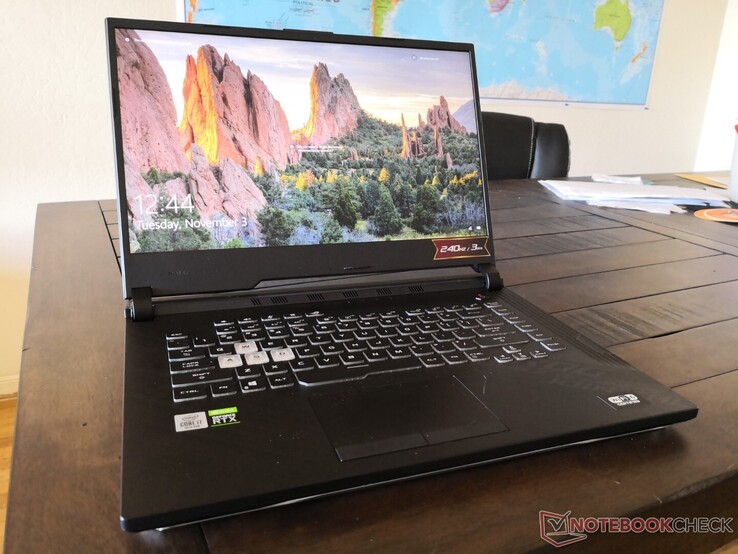
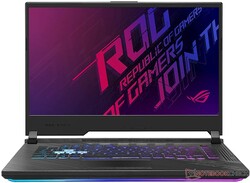
Während das Asus ROG Strix G15 G512LI mit der GeForce GTX 1650 Ti und 144 Hz Display ausgestattet ist, verfügt das Asus ROG Strix G15 G512LW über die wesentlich leistungsfähigere GeForce RTX 2070 und ein noch schnelleres 240 Hz Display. Ansonsten teilen sich beide Modelle das gleiche Gehäuse, allerdings mit einigen wichtigen Unterschieden, die wir in diesem Test beachten werden.

Wir empfehlen Ihnen, unseren Testbericht über das G512LI zu lesen, um mehr über die Eigenschaften des G512LW zu erfahren, da fast alle unsere bisherigen Kommentare nach wie vor zutreffen. Auf dieser Seite werden die Leistungsunterschiede zwischen dem G512LW und G512LI und anderen 15,6-Zoll-Gaming-Notebooks wie dem MSI GP65 oder dem Alienware m15 R3 untersucht. Unsere Konfiguration finden Sie auf Computer Upgrade King für ca. $1500 USD und mehr, abhängig von RAM und Speicher.

Mehr Asus-Bewertungen:

Asus ROG Strix G15 G512LW (ROG Strix G15 G512 Serie)
Prozessor
Grafikkarte
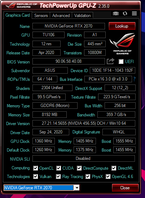
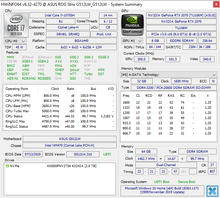
NVIDIA GeForce RTX 2070 Mobile - 8 GB VRAM, Kerntakt: 1260 MHz, Speichertakt: 1375 MHz, GDDR6, 456.55, Optimus
RAM
64 GB 
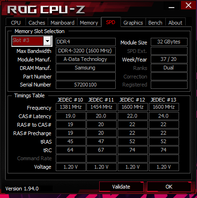
, ADATA DDR4-3200, 21-21-21-47, Dual-Channel
Bildschirm
15.60 Zoll 16:9, 1920 x 1080 Pixel 141 PPI, Sharp LQ156M1JW09, IPS, SHP14D3, spiegelnd: nein, 240 Hz
Mainboard
Intel HM470
Massenspeicher
Toshiba XG5-P KXG50PNV2T04, 2048 GB 
Soundkarte
Intel Comet Lake PCH-H - cAVS
Anschlüsse
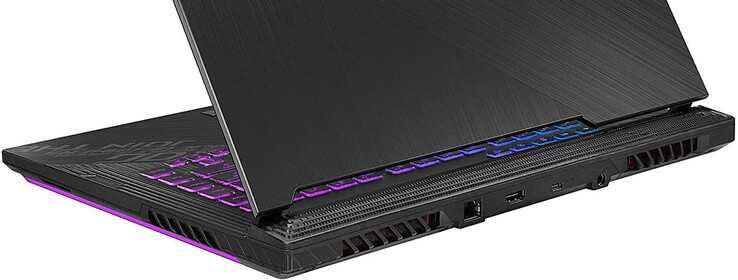
4 USB 3.0 / 3.1 Gen1, 1 USB 3.1 Gen2, 1 HDMI, 1 DisplayPort, 1 Kensington Lock, Audio Anschlüsse: 3.5 mm combo
Netzwerk
Realtek RTL8168/8111 Gigabit-LAN (10/100/1000MBit/s), Intel Wi-Fi 6 AX201 (a/b/g/h/n = Wi-Fi 4/ac = Wi-Fi 5/ax = Wi-Fi 6/), Bluetooth 5.1
Abmessungen
Höhe x Breite x Tiefe (in mm): 25.8 x 360 x 275
Akku
66 Wh Lithium-Polymer
Betriebssystem
Microsoft Windows 10 Home 64 Bit
Sonstiges
Tastatur: Chiclet, Tastatur-Beleuchtung: ja, Asus Armoury Crate, 12 Monate Garantie
Gewicht
2.344 kg, Netzteil: 752 g
Preis
1500 USD
Hinweis: Der Hersteller kann abweichende Bauteile wie Bildschirme, Laufwerke und Speicherriegel mit ähnlichen Spezifikationen unter dem gleichen Modellnamen einsetzen.


Bew.
Datum
Modell
Gewicht
Dicke
Größe
Auflösung
Preis ab
83.4 %
v7 (old)
11 / 2020
Asus ROG Strix G15 G512LW
i7-10750H, GeForce RTX 2070 Mobile
2.3 kg25.8 mm15.60"1920x1080
80.8 %
v7 (old)
08 / 2020
Asus ROG Strix G15 G512LI
i7-10750H, GeForce GTX 1650 Ti Mobile
2.3 kg25.8 mm15.60"1920x1080
86.9 %
v7 (old)
08 / 2020
Razer Blade 15 RTX 2070 Super Max-Q
i7-10875H, GeForce RTX 2070 Super Max-Q
2.1 kg17.8 mm15.60"1920x1080
83.2 %
v7 (old)
06 / 2020
MSI GP65 10SFK-047US
i7-10750H, GeForce RTX 2070 Mobile
2.3 kg27.5 mm15.60"1920x1080
84.4 %
v7 (old)
08 / 2020
Asus ROG Strix Scar 15 G532LWS
i9-10980HK, GeForce RTX 2070 Super Mobile
2.4 kg24.9 mm15.60"1920x1080
84.8 %
v7 (old)
08 / 2020
Alienware m15 R3 P87F
i7-10750H, GeForce RTX 2070 Mobile
2.3 kg19.9 mm15.60"1920x1080

Gehäuse

360 mm 275 mm 25.8 mm 2.3 kg360 mm 275 mm 25.8 mm 2.3 kg357.7 mm 248 mm 27.5 mm 2.3 kg360 mm 275 mm 24.9 mm 2.4 kg360.3 mm 276 mm 19.9 mm 2.3 kg355 mm 235 mm 17.8 mm 2.1 kg297 mm 210 mm 1 mm 5.7 g

Kommunikation

Der Intel AX201 ist standardmäßig mit Wi-Fi 6-Konnektivität und Bluetooth 5.1 ausgestattet. Die durchschnittlichen Übertragungsraten sind diesmal mit 790 Mbit/s seltsamerweise langsamer, wenn sie mit unserem Netgear RAX200-Router verbunden sind. Die Ergebnisse werden sich auch nach dem Zurücksetzen unseres Routers und Laptops nicht verbessern.

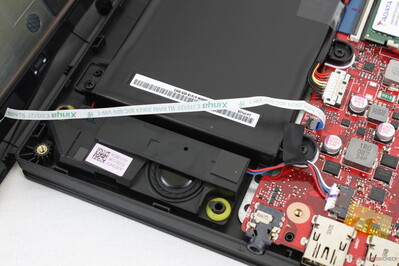
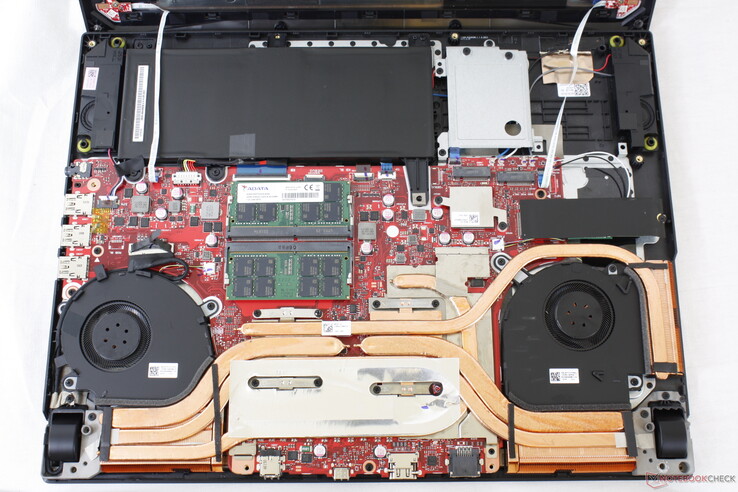
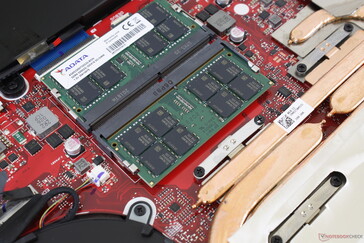
Das entfernbare M.2-WLAN-Modul befindet sich unter dem primären M.2-SSD
Networking
iperf3 transmit AX12
Asus ROG Strix G15 G512LI
Intel Wi-Fi 6 AX201
1447 (1167min - 1677max) MBit/s +83%
MSI GP65 10SFK-047US
Intel Wi-Fi 6 AX201
1427 (808min - 1646max) MBit/s +81%
Razer Blade 15 RTX 2070 Super Max-Q
Intel Wi-Fi 6 AX201
1240 (619min - 1284max) MBit/s +57%
Alienware m15 R3 P87F
Intel Killer Wi-Fi 6 AX1650w
1202 (1013min - 1346max) MBit/s +52%
Asus ROG Strix Scar 15 G532LWS
Intel Wi-Fi 6 AX201
1057 (522min - 1214max) MBit/s +34%
Asus ROG Strix G15 G512LW
Intel Wi-Fi 6 AX201
790 (647min - 869max) MBit/s
iperf3 receive AX12
Razer Blade 15 RTX 2070 Super Max-Q
Intel Wi-Fi 6 AX201
1394 (843min - 1528max) MBit/s +21%
Alienware m15 R3 P87F
Intel Killer Wi-Fi 6 AX1650w
1375 (1240min - 1425max) MBit/s +19%
MSI GP65 10SFK-047US
Intel Wi-Fi 6 AX201
1314 (949min - 1439max) MBit/s +14%
Asus ROG Strix Scar 15 G532LWS
Intel Wi-Fi 6 AX201
1238 (1020min - 1354max) MBit/s +7%
Asus ROG Strix G15 G512LI
Intel Wi-Fi 6 AX201
1237 (778min - 1367max) MBit/s +7%
Asus ROG Strix G15 G512LW
Intel Wi-Fi 6 AX201
1152 (586min - 1283max) MBit/s
050100150200250300350400450500550600650700750800850900950100010501100115012001250Tooltip
Asus ROG Strix G15 G512LW; iperf3 receive AX12; iperf 3.1.3: Ø1152 (586-1283)
Asus ROG Strix G15 G512LW; iperf3 transmit AX12; iperf 3.1.3: Ø790 (647-869)

Wartung

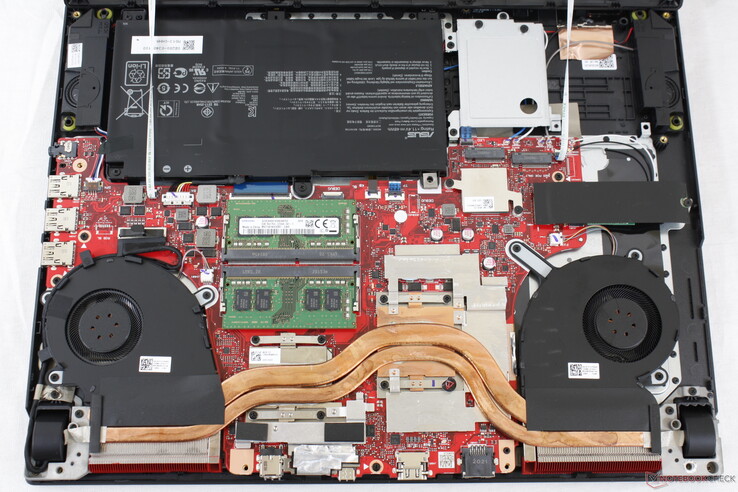
ROG Strix G15 G512LW
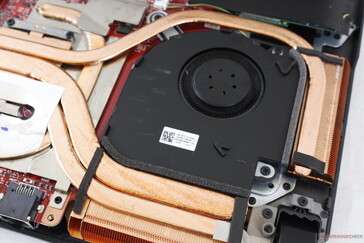
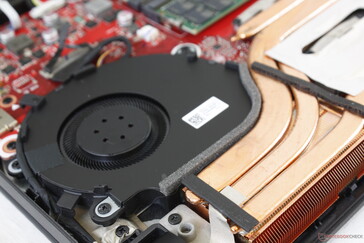
ROG Strix G15 G512LI zum Vergleich. Beachten Sie die wenigeren und kürzeren Heatpipes in dieser langsameren Konfiguration

Display

Das 240 Hz Sharp-Panel unseres G512LW ist dem 144 Hz Panda-Panel des billigeren G512LI in jeder Hinsicht überlegen. Am wichtigsten ist jedoch, dass Kontrast, Farbraum und Schwarz-Weiß-Reaktionszeiten für ein visuelles Erlebnis, das den vierstelligen Preis widerspiegelt, deutlich besser sind. Wir haben uns in der Vergangenheit schon über Panda-Panels beschwert, und so ist es eine Erleichterung, dass wir kein Panda-Panel auf dem enthusiastischen G512LW sehen.

Keine größeren Körnigkeitsprobleme auf der Mattscheibe
Leicht ungleichmäßiges backlight bleeding entlang der Unterkante
278
cd/m²
298.7
cd/m²
280.6
cd/m²
289.9
cd/m²
300.9
cd/m²
288.9
cd/m²
287.4
cd/m²
289.1
cd/m²
290.3
cd/m²
Ausleuchtung des Bildschirms
Sharp LQ156M1JW09 getestet mit X-Rite i1Pro 2
Maximal: 300.9 cd/m² (Nits) Durchschnitt: 289.3 cd/m² Minimum: 17.32 cd/m²
Ausleuchtung: 92 %
Helligkeit Akku: 300.9 cd/m²
Kontrast: 971:1 (Schwarzwert: 0.31 cd/m²)
ΔE Color 3.54 | 0.5-29.43 Ø4.91, calibrated: 1
ΔE Greyscale 5.9 | 0.5-98 Ø5.2
98.3% sRGB (Argyll 1.6.3 3D)
63.3% AdobeRGB 1998 (Argyll 1.6.3 3D)
68.5% AdobeRGB 1998 (Argyll 2.2.0 3D)
98.3% sRGB (Argyll 2.2.0 3D)
67.8% Display P3 (Argyll 2.2.0 3D)
Gamma: 2.37
Asus ROG Strix G15 G512LW
Sharp LQ156M1JW09, IPS, 15.6", 1920x1080
Asus ROG Strix G15 G512LI
Panda LM156LF-2F01, IPS, 15.6", 1920x1080
Razer Blade 15 RTX 2070 Super Max-Q
AU Optronics B156HAN12.0, IPS, 15.6", 1920x1080
MSI GP65 10SFK-047US
LG Philips LP156WFG-SPB3, IPS, 15.6", 1920x1080
Asus ROG Strix Scar 15 G532LWS
AU Optronics B156HAN12.0, IPS, 15.6", 1920x1080
Alienware m15 R3 P87F
AU Optronics B156HAN, IPS, 15.6", 1920x1080
Display
-40%
2%
-5%
3%
1%
Display P3 Coverage
67.8
39.73
-41%
69.4
2%
63.5
-6%
69.9
3%
68.6
1%
sRGB Coverage
98.3
59.8
-39%
98.8
1%
94.4
-4%
99.6
1%
98.9
1%
AdobeRGB 1998 Coverage
68.5
41.06
-40%
70.5
3%
65.1
-5%
71.4
4%
69.8
2%
Response Times
-138%
52%
10%
11%
36%
Response Time Grey 50% / Grey 80% *
16 ?(8.4, 7.6)
33.6 ?(18.4, 15.2)
-110%
3.2 ?(1.4, 1.8)
80%
10.4 ?(6.4, 4)
35%
14.4 ?(6.8, 7.6)
10%
4 ?(1.6, 2.4)
75%
Response Time Black / White *
10.4 ?(5.2, 5.2)
27.6 ?(15.6, 12)
-165%
8 ?(4, 4)
23%
12 ?(6.8, 5.2)
-15%
9.2 ?(4.8, 4.4)
12%
10.8 ?(5.2, 5.6)
-4%
PWM Frequency
23580 ?(29)
Bildschirm
-57%
3%
-8%
22%
7%
Helligkeit Bildmitte
300.9
271.2
-10%
345.4
15%
384.9
28%
307.2
2%
326.7
9%
Brightness
289
252
-13%
342
18%
358
24%
301
4%
316
9%
Brightness Distribution
92
79
-14%
90
-2%
87
-5%
91
-1%
87
-5%
Schwarzwert *
0.31
0.53
-71%
0.34
-10%
0.67
-116%
0.21
32%
0.33
-6%
Kontrast
971
512
-47%
1016
5%
574
-41%
1463
51%
990
2%
Delta E Colorchecker *
3.54
5.04
-42%
3.18
10%
2.43
31%
1.85
48%
2.4
32%
Colorchecker dE 2000 max. *
9.82
16.07
-64%
6.57
33%
4.58
53%
3.92
60%
6.06
38%
Colorchecker dE 2000 calibrated *
1
4.26
-326%
1.77
-77%
2.03
-103%
1.26
-26%
1.51
-51%
Delta E Graustufen *
5.9
3.4
42%
3.8
36%
2.6
56%
2
66%
3.2
46%
Gamma
2.37 93%
2.09 105%
2.15 102%
2.2 100%
2.15 102%
2.13 103%
CCT
7456 87%
7079 92%
7109 91%
6981 93%
6479 100%
7129 91%
Farbraum (Prozent von AdobeRGB 1998)
63.3
37.8
-40%
64.3
2%
59.7
-6%
65
3%
63.7
1%
Color Space (Percent of sRGB)
98.3
59.5
-39%
99
1%
93.9
-4%
99.7
1%
99.2
1%
Durchschnitt gesamt (Programm / Settings)
-78% / -64%
19% / 9%
-1% / -5%
12% / 17%
15% / 9%

* ... kleinere Werte sind besser

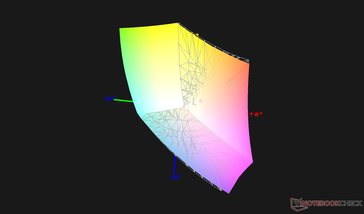
vs. sRGB
vs. sRGB
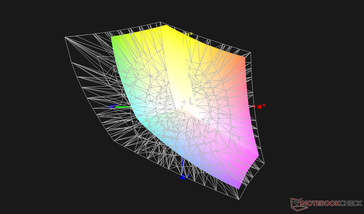
vs. AdobeRGB
vs. AdobeRGB

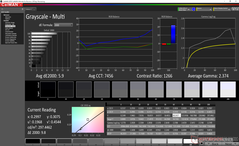
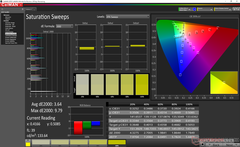
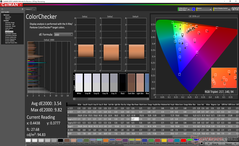
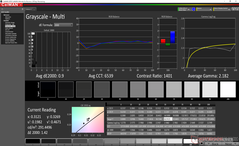
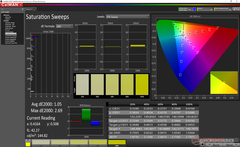
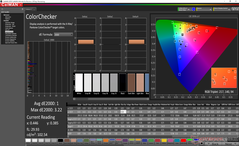
Die Anzeige hätte angesichts der Preisspanne besser kalibriert werden können. Die Farbtemperatur ist außerhalb der Verpackung zu warm, was sich auf die durchschnittliche Graustufen- und Farbgenauigkeit auswirkt. Nachdem wir das Panel selbst kalibriert haben, hat sich die Genauigkeit in allen Bereichen merklich verbessert. Wir empfehlen eine eigenhändige Kalibrierung oder zumindest eine manuelle Anpassung der Graustufen für ein besseres Bild.

Graustufen vor der Kalibrierung
Sättigungs-Sweeps vor der Kalibrierung
ColorChecker vor der Kalibrierung
Graustufen nach der Kalibrierung
Sättigungs-Sweeps nach der Kalibrierung
ColorChecker nach der Kalibrierung

Reaktionszeiten (Response Times) des Displays

Die Reaktionszeiten (Response Times) beschreiben wie schnell zwischen zwei Farben eines Pixels umgeschaltet werden kann. Langsame Response Times können zu einer verschwommenen Darstellung, Schlieren und Geisterbilder führen. Besonders bei schnellen 3D-Spielen sind kurze Umschaltzeiten wichtig.
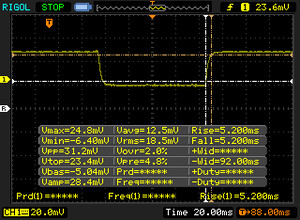
       Reaktionszeiten Schwarz zu Weiß
10.4 ms ... steigend ↗ und fallend ↘ kombiniert↗ 5.2 ms steigend
↘ 5.2 ms fallend
Die gemessenen Reaktionszeiten sind gut, für anspruchsvolle Spieler könnten der Bildschirm jedoch zu langsam sein.
Im Vergleich rangierten die bei uns getesteten Geräte von 0.1 (Minimum) zu 240 (Maximum) ms. » 25 % aller Screens waren schneller als der getestete.
Daher sind die gemessenen Reaktionszeiten besser als der Durchschnitt aller vermessenen Geräte (20.9 ms).
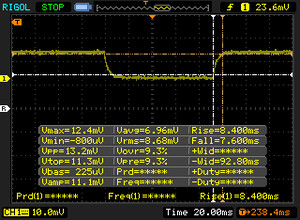
       Reaktionszeiten 50% Grau zu 80% Grau
16 ms ... steigend ↗ und fallend ↘ kombiniert↗ 8.4 ms steigend
↘ 7.6 ms fallend
Die gemessenen Reaktionszeiten sind gut, für anspruchsvolle Spieler könnten der Bildschirm jedoch zu langsam sein.
Im Vergleich rangierten die bei uns getesteten Geräte von 0.165 (Minimum) zu 636 (Maximum) ms. » 27 % aller Screens waren schneller als der getestete.
Daher sind die gemessenen Reaktionszeiten besser als der Durchschnitt aller vermessenen Geräte (32.8 ms).

Bildschirm-Flackern / PWM (Pulse-Width Modulation)

Eine günstige Methode um die Helligkeit eines Bildschirms zu steuern, ist die Beleuchtung periodisch ein- und auszuschalten. Dies nennt sich PWM (Pulsweitenmodulation) Diese Umschaltung sollte mit einer hohen Frequenz stattfinden damit das menschliche Auge kein Flimmern wahrnimmt. Wenn die Frequenz zu niedrig ist, kann dies zu Ermüdungserscheinungen, Augenbrennen, Kopfweh und auch sichtbaren Flackern führen.
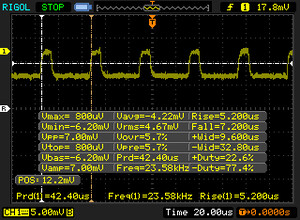
Flackern / PWM festgestellt 23580 Hz ≤ 29 % Helligkeit

Das Display flackert mit 23580 Hz (im schlimmsten Fall, eventuell durch Pulsweitenmodulation PWM) bei einer eingestellten Helligkeit von 29 % und darunter. Darüber sollte es zu keinem Flackern kommen.

Die Frequenz von 23580 Hz ist sehr hoch und sollte daher auch bei empfindlichen Personen zu keinen Problemen führen.

Im Vergleich: 53 % aller getesteten Geräte nutzten kein PWM um die Helligkeit zu reduzieren. Wenn PWM eingesetzt wurde, dann bei einer Frequenz von durchschnittlich 8705 (Minimum 5, Maximum 343500) Hz.

Im Freien unter Sonnenlicht
Draußen im Schatten
Draußen im Schatten
Im Freien unter Sonnenlicht
Breite IPS-Betrachtungswinkel. Leichte Veränderungen von Farben und Kontrast aus extremen Winkeln

Leistung

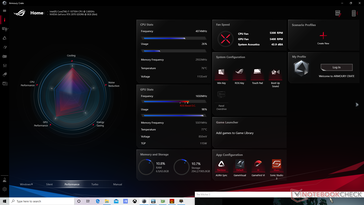
Alle nachstehenden Benchmarks wurden im Asus-Turbo-Modus durchgeführt. Wir empfehlen Eigentümern, sich mit Armoury Crate vertraut zu machen, da die Leistungsprofile direkt mit dieser Software verknüpft sind.

Performance

Die Multi-Thread-CPU-Leistung ist etwa 5 bis 10 Prozent schneller als der durchschnittliche Laptop in unserer Datenbank, der mit der gleichen Core i7-10750H-CPU ausgestattet ist. Die Nachhaltigkeit der Leistung ist ausgezeichnet und sogar etwas besser als beim G512LI, wie unser CineBench R15 xT Loop-Test unten zeigt.

07014021028035042049056063070077084091098010501120119012601330Tooltip
Asus ROG Strix G15 G512LW GeForce RTX 2070 Mobile, i7-10750H, Toshiba XG5-P KXG50PNV2T04; CPU Multi 64Bit: Ø1328 (1277.18-1346.3)
Asus ROG Strix G15 G512LI GeForce GTX 1650 Ti Mobile, i7-10750H, Intel SSD 660p SSDPEKNW512G8; CPU Multi 64Bit: Ø1253 (1225.64-1341.61)
Razer Blade 15 RTX 2070 Super Max-Q GeForce RTX 2070 Super Max-Q, i7-10875H, Samsung SSD PM981a MZVLB512HBJQ; CPU Multi 64Bit: Ø1366 (1323.8-1373.01)
Alienware m15 R3 P87F GeForce RTX 2070 Mobile, i7-10750H, 2x Micron 2200S 512 GB (RAID 0); CPU Multi 64Bit: Ø1338 (1320.39-1347.39)
Cinebench R20: CPU (Multi Core) | CPU (Single Core)
Cinebench R15: CPU Multi 64Bit | CPU Single 64Bit
Blender: v2.79 BMW27 CPU
7-Zip 18.03: 7z b 4 -mmt1 | 7z b 4
Geekbench 5.5: Single-Core | Multi-Core
HWBOT x265 Benchmark v2.2: 4k Preset
LibreOffice : 20 Documents To PDF
R Benchmark 2.5: Overall mean
Cinebench R20 / CPU (Multi Core)
MSI Bravo 15 A4DCR
AMD Ryzen 7 4800H
3956 Points +19%
Asus Zephyrus S15 GX502L
Intel Core i7-10875H
3907 Points +18%
Asus ROG Strix Scar 15 G532LWS
Intel Core i9-10980HK
3871 Points +16%
Asus ROG Zephyrus G15 GA502IU-ES76
AMD Ryzen 7 4800HS
3869 Points +16%
Eurocom Nightsky RX15
Intel Core i9-9980HK
3795 Points +14%
MSI GE65 Raider 9SF-049US
Intel Core i9-9880H
3505 Points +5%
Asus ROG Strix G15 G512LW
Intel Core i7-10750H
3325 Points
Acer Nitro 5 AN515-44-R5FT
AMD Ryzen 5 4600H
3224 Points -3%
Asus ROG Strix G15 G512LI
Intel Core i7-10750H
3049 Points -8%
Durchschnittliche Intel Core i7-10750H
  (1749 - 3325, n=43)
2848 Points -14%
Maingear Vector 15
Intel Core i7-9750H
2784 Points -16%
MSI GE63 Raider 8SG
Intel Core i7-8750H
2142 Points -36%
Gateway Creator Series 15.6 GWTN156-3BK
Intel Core i5-10300H
2130 Points -36%
Cinebench R20 / CPU (Single Core)
Asus ROG Strix Scar 15 G532LWS
Intel Core i9-10980HK
490 Points +2%
Asus ROG Zephyrus G15 GA502IU-ES76
AMD Ryzen 7 4800HS
482 Points 0%
Asus ROG Strix G15 G512LW
Intel Core i7-10750H
480 Points
Eurocom Nightsky RX15
Intel Core i9-9980HK
479 Points 0%
MSI Bravo 15 A4DCR
AMD Ryzen 7 4800H
477 Points -1%
MSI GE65 Raider 9SF-049US
Intel Core i9-9880H
474 Points -1%
Durchschnittliche Intel Core i7-10750H
  (431 - 504, n=43)
473 Points -1%
Asus Zephyrus S15 GX502L
Intel Core i7-10875H
467 Points -3%
Asus ROG Strix G15 G512LI
Intel Core i7-10750H
454 Points -5%
Gateway Creator Series 15.6 GWTN156-3BK
Intel Core i5-10300H
442 Points -8%
Maingear Vector 15
Intel Core i7-9750H
432 Points -10%
Acer Nitro 5 AN515-44-R5FT
AMD Ryzen 5 4600H
428 Points -11%
MSI GE63 Raider 8SG
Intel Core i7-8750H
409 Points -15%
Cinebench R15 / CPU Multi 64Bit
Eurocom Nightsky RX15
Intel Core i9-9980HK
1821 Points +35%
MSI Bravo 15 A4DCR
AMD Ryzen 7 4800H
1741 (1664.03min - 1741.33max) Points +29%
Asus ROG Strix Scar 15 G532LWS
Intel Core i9-10980HK
1733 (1604.75min - 1733.1max) Points +29%
Asus Zephyrus S15 GX502L
Intel Core i7-10875H
1664 (1603.72min - 1663.62max) Points +24%
Asus ROG Zephyrus G15 GA502IU-ES76
AMD Ryzen 7 4800HS
1634 (1595.85min - 1741.4max) Points +21%
MSI GE65 Raider 9SF-049US
Intel Core i9-9880H
1623 Points +21%
Acer Nitro 5 AN515-44-R5FT
AMD Ryzen 5 4600H
1398 (1313.46min - 1397.77max) Points +4%
Asus ROG Strix G15 G512LW
Intel Core i7-10750H
1346 (1277.18min - 1346.3max) Points
Asus ROG Strix G15 G512LI
Intel Core i7-10750H
1342 (1225.64min - 1341.61max) Points 0%
Maingear Vector 15
Intel Core i7-9750H
1280 Points -5%
Durchschnittliche Intel Core i7-10750H
  (804 - 1418, n=50)
1263 Points -6%
MSI GE63 Raider 8SG
Intel Core i7-8750H
1016 Points -25%
Gateway Creator Series 15.6 GWTN156-3BK
Intel Core i5-10300H
879 (870.4min - 879.37max) Points -35%
Cinebench R15 / CPU Single 64Bit
Asus ROG Strix Scar 15 G532LWS
Intel Core i9-10980HK
211 Points +2%
Asus ROG Strix G15 G512LW
Intel Core i7-10750H
206 Points
Eurocom Nightsky RX15
Intel Core i9-9980HK
202 Points -2%
MSI GE65 Raider 9SF-049US
Intel Core i9-9880H
198 Points -4%
Durchschnittliche Intel Core i7-10750H
  (184 - 213, n=45)
196.7 Points -5%
Asus ROG Strix G15 G512LI
Intel Core i7-10750H
192 Points -7%
Asus Zephyrus S15 GX502L
Intel Core i7-10875H
192 Points -7%
Maingear Vector 15
Intel Core i7-9750H
186 Points -10%
MSI Bravo 15 A4DCR
AMD Ryzen 7 4800H
186 Points -10%
Asus ROG Zephyrus G15 GA502IU-ES76
AMD Ryzen 7 4800HS
186 Points -10%
Acer Nitro 5 AN515-44-R5FT
AMD Ryzen 5 4600H
178 Points -14%
Gateway Creator Series 15.6 GWTN156-3BK
Intel Core i5-10300H
178 Points -14%
MSI GE63 Raider 8SG
Intel Core i7-8750H
167 Points -19%
Blender / v2.79 BMW27 CPU
Eurocom Nightsky RX15
Intel Core i9-9980HK
527 Seconds * -62%
Gateway Creator Series 15.6 GWTN156-3BK
Intel Core i5-10300H
511 Seconds * -57%
Durchschnittliche Intel Core i7-10750H
  (322 - 587, n=43)
389 Seconds * -19%
Asus ROG Strix G15 G512LI
Intel Core i7-10750H
364 Seconds * -12%
Acer Nitro 5 AN515-44-R5FT
AMD Ryzen 5 4600H
345 Seconds * -6%
Asus ROG Strix G15 G512LW
Intel Core i7-10750H
326 Seconds *
MSI Bravo 15 A4DCR
AMD Ryzen 7 4800H
284 Seconds * +13%
Asus ROG Zephyrus G15 GA502IU-ES76
AMD Ryzen 7 4800HS
284 Seconds * +13%
Asus ROG Strix Scar 15 G532LWS
Intel Core i9-10980HK
279 Seconds * +14%
Asus Zephyrus S15 GX502L
Intel Core i7-10875H
261 Seconds * +20%
7-Zip 18.03 / 7z b 4 -mmt1
Asus ROG Strix Scar 15 G532LWS
Intel Core i9-10980HK
5525 MIPS +5%
Eurocom Nightsky RX15
Intel Core i9-9980HK
5367 MIPS +2%
Asus ROG Strix G15 G512LW
Intel Core i7-10750H
5277 MIPS
Asus Zephyrus S15 GX502L
Intel Core i7-10875H
5114 MIPS -3%
Durchschnittliche Intel Core i7-10750H
  (4504 - 5470, n=43)
5114 MIPS -3%
Asus ROG Strix G15 G512LI
Intel Core i7-10750H
4951 MIPS -6%
Asus ROG Zephyrus G15 GA502IU-ES76
AMD Ryzen 7 4800HS
4655 MIPS -12%
MSI Bravo 15 A4DCR
AMD Ryzen 7 4800H
4584 MIPS -13%
Gateway Creator Series 15.6 GWTN156-3BK
Intel Core i5-10300H
4545 MIPS -14%
Acer Nitro 5 AN515-44-R5FT
AMD Ryzen 5 4600H
4471 MIPS -15%
7-Zip 18.03 / 7z b 4
Asus ROG Zephyrus G15 GA502IU-ES76
AMD Ryzen 7 4800HS
48392 MIPS +31%
Asus Zephyrus S15 GX502L
Intel Core i7-10875H
47941 MIPS +30%
Asus ROG Strix Scar 15 G532LWS
Intel Core i9-10980HK
47806 MIPS +30%
MSI Bravo 15 A4DCR
AMD Ryzen 7 4800H
47520 MIPS +29%
Eurocom Nightsky RX15
Intel Core i9-9980HK
43805 MIPS +19%
Asus ROG Strix G15 G512LW
Intel Core i7-10750H
36831 MIPS
Acer Nitro 5 AN515-44-R5FT
AMD Ryzen 5 4600H
36693 MIPS 0%
Asus ROG Strix G15 G512LI
Intel Core i7-10750H
36453 MIPS -1%
Durchschnittliche Intel Core i7-10750H
  (26040 - 37345, n=43)
33946 MIPS -8%
Gateway Creator Series 15.6 GWTN156-3BK
Intel Core i5-10300H
22728 MIPS -38%
Geekbench 5.5 / Single-Core
Asus ROG Strix Scar 15 G532LWS
Intel Core i9-10980HK
1368 Points +3%
Asus ROG Strix G15 G512LW
Intel Core i7-10750H
1329 Points
Durchschnittliche Intel Core i7-10750H
  (1114 - 1333, n=43)
1263 Points -5%
Asus Zephyrus S15 GX502L
Intel Core i7-10875H
1242 Points -7%
Asus ROG Zephyrus G15 GA502IU-ES76
AMD Ryzen 7 4800HS
1188 Points -11%
MSI Bravo 15 A4DCR
AMD Ryzen 7 4800H
1154 Points -13%
Asus ROG Strix G15 G512LI
Intel Core i7-10750H
1136 Points -15%
Acer Nitro 5 AN515-44-R5FT
AMD Ryzen 5 4600H
1108 Points -17%
Gateway Creator Series 15.6 GWTN156-3BK
Intel Core i5-10300H
1067 Points -20%
Geekbench 5.5 / Multi-Core
Asus ROG Strix Scar 15 G532LWS
Intel Core i9-10980HK
8586 Points +29%
Asus ROG Zephyrus G15 GA502IU-ES76
AMD Ryzen 7 4800HS
7682 Points +16%
Asus Zephyrus S15 GX502L
Intel Core i7-10875H
7583 Points +14%
MSI Bravo 15 A4DCR
AMD Ryzen 7 4800H
7453 Points +12%
Asus ROG Strix G15 G512LW
Intel Core i7-10750H
6650 Points
Asus ROG Strix G15 G512LI
Intel Core i7-10750H
6243 Points -6%
Durchschnittliche Intel Core i7-10750H
  (4443 - 6674, n=43)
6135 Points -8%
Acer Nitro 5 AN515-44-R5FT
AMD Ryzen 5 4600H
5260 Points -21%
Gateway Creator Series 15.6 GWTN156-3BK
Intel Core i5-10300H
3862 Points -42%
HWBOT x265 Benchmark v2.2 / 4k Preset
Asus Zephyrus S15 GX502L
Intel Core i7-10875H
13.5 fps +19%
Asus ROG Strix Scar 15 G532LWS
Intel Core i9-10980HK
13 fps +15%
Eurocom Nightsky RX15
Intel Core i9-9980HK
12.35 fps +9%
Asus ROG Zephyrus G15 GA502IU-ES76
AMD Ryzen 7 4800HS
12 fps +6%
MSI Bravo 15 A4DCR
AMD Ryzen 7 4800H
11.7 fps +4%
Asus ROG Strix G15 G512LW
Intel Core i7-10750H
11.3 fps
Asus ROG Strix G15 G512LI
Intel Core i7-10750H
10 fps -12%
Durchschnittliche Intel Core i7-10750H
  (5.54 - 11.6, n=43)
9.61 fps -15%
Acer Nitro 5 AN515-44-R5FT
AMD Ryzen 5 4600H
9.27 fps -18%
Gateway Creator Series 15.6 GWTN156-3BK
Intel Core i5-10300H
6.86 fps -39%
LibreOffice / 20 Documents To PDF
MSI Bravo 15 A4DCR
AMD Ryzen 7 4800H
93.9 s * -100%
Acer Nitro 5 AN515-44-R5FT
AMD Ryzen 5 4600H
64.1 s * -37%
Asus ROG Zephyrus G15 GA502IU-ES76
AMD Ryzen 7 4800HS
56.7 s * -21%
Gateway Creator Series 15.6 GWTN156-3BK
Intel Core i5-10300H
56 s * -19%
Durchschnittliche Intel Core i7-10750H
  (43.1 - 99.2, n=43)
53.3 s * -14%
Asus ROG Strix G15 G512LI
Intel Core i7-10750H
49.9 s * -6%
Asus ROG Strix Scar 15 G532LWS
Intel Core i9-10980HK
48.4 s * -3%
Asus Zephyrus S15 GX502L
Intel Core i7-10875H
47.1 s * -0%
Asus ROG Strix G15 G512LW
Intel Core i7-10750H
46.9 s *
R Benchmark 2.5 / Overall mean
Gateway Creator Series 15.6 GWTN156-3BK
Intel Core i5-10300H
0.683 sec * -14%
Acer Nitro 5 AN515-44-R5FT
AMD Ryzen 5 4600H
0.626 sec * -4%
Asus ROG Strix G15 G512LI
Intel Core i7-10750H
0.618 sec * -3%
Durchschnittliche Intel Core i7-10750H
  (0.578 - 0.708, n=42)
0.611 sec * -2%
Asus ROG Strix G15 G512LW
Intel Core i7-10750H
0.601 sec *
MSI Bravo 15 A4DCR
AMD Ryzen 7 4800H
0.597 sec * +1%
Asus Zephyrus S15 GX502L
Intel Core i7-10875H
0.597 sec * +1%
Asus ROG Zephyrus G15 GA502IU-ES76
AMD Ryzen 7 4800HS
0.58 sec * +3%
Asus ROG Strix Scar 15 G532LWS
Intel Core i9-10980HK
0.565 sec * +6%
Cinebench R20: CPU (Multi Core) | CPU (Single Core)
Cinebench R15: CPU Multi 64Bit | CPU Single 64Bit
Blender: v2.79 BMW27 CPU
7-Zip 18.03: 7z b 4 -mmt1 | 7z b 4
Geekbench 5.5: Single-Core | Multi-Core
HWBOT x265 Benchmark v2.2: 4k Preset
LibreOffice : 20 Documents To PDF
R Benchmark 2.5: Overall mean

* ... kleinere Werte sind besser

Cinebench R15 CPU Multi 64Bit
1346 Points
Cinebench R15 OpenGL 64Bit
140 fps
Cinebench R15 Ref. Match 64Bit
99.6 %
Cinebench R15 CPU Single 64Bit
206 Points
Cinebench R20 CPU (Multi Core)
3325 Points
Cinebench R20 CPU (Single Core)
480 Points
Hilfe

Systemleistung

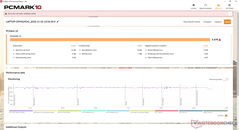
Die Ergebnisse des PCMark 10 liegen dort, wo wir sie erwarten, mit Ausnahme der Erstellung digitaler Inhalte, bei denen unser System schlechter abschneidet als der G512LI. Wir vermuten, dass die langsamen Schreibgeschwindigkeiten unserer Toshiba M.2 SSD der Übeltäter sein könnten, da die meisten anderen Laptops in dieser Kategorie in der Regel mit viel schnelleren Speicherlaufwerken ausgestattet sind. Das Samsung PM981a beispielsweise ist in dieser Hinsicht fast dreimal so schnell wie das G512LI.

PCMark 10 Standard
PCMark 10 Standard
PCMark 8 Home beschleunigt
PCMark 8 Work beschleunigt
PCMark 10
Score
Razer Blade 15 RTX 2070 Super Max-Q
GeForce RTX 2070 Super Max-Q, i7-10875H, Samsung SSD PM981a MZVLB512HBJQ
6739 Points +23%
Alienware m15 R3 P87F
GeForce RTX 2070 Mobile, i7-10750H, 2x Micron 2200S 512 GB (RAID 0)
6255 Points +14%
MSI GP65 10SFK-047US
GeForce RTX 2070 Mobile, i7-10750H, Samsung SSD PM981 MZVLB1T0HALR
6254 Points +14%
Asus ROG Strix Scar 15 G532LWS
GeForce RTX 2070 Super Mobile, i9-10980HK, 2x Intel SSD 660p 1TB SSDPEKNW010T8 (RAID 0)
6236 Points +14%
Durchschnittliche Intel Core i7-10750H, NVIDIA GeForce RTX 2070 Mobile
  (5179 - 6255, n=4)
5792 Points +6%
Asus ROG Strix G15 G512LW
GeForce RTX 2070 Mobile, i7-10750H, Toshiba XG5-P KXG50PNV2T04
5479 Points
Asus ROG Strix G15 G512LI
GeForce GTX 1650 Ti Mobile, i7-10750H, Intel SSD 660p SSDPEKNW512G8
5466 Points 0%
Essentials
Razer Blade 15 RTX 2070 Super Max-Q
GeForce RTX 2070 Super Max-Q, i7-10875H, Samsung SSD PM981a MZVLB512HBJQ
10341 Points +5%
MSI GP65 10SFK-047US
GeForce RTX 2070 Mobile, i7-10750H, Samsung SSD PM981 MZVLB1T0HALR
10017 Points +1%
Asus ROG Strix Scar 15 G532LWS
GeForce RTX 2070 Super Mobile, i9-10980HK, 2x Intel SSD 660p 1TB SSDPEKNW010T8 (RAID 0)
9897 Points 0%
Asus ROG Strix G15 G512LW
GeForce RTX 2070 Mobile, i7-10750H, Toshiba XG5-P KXG50PNV2T04
9874 Points
Durchschnittliche Intel Core i7-10750H, NVIDIA GeForce RTX 2070 Mobile
  (9509 - 10017, n=4)
9735 Points -1%
Alienware m15 R3 P87F
GeForce RTX 2070 Mobile, i7-10750H, 2x Micron 2200S 512 GB (RAID 0)
9540 Points -3%
Asus ROG Strix G15 G512LI
GeForce GTX 1650 Ti Mobile, i7-10750H, Intel SSD 660p SSDPEKNW512G8
9296 Points -6%
Productivity
Asus ROG Strix G15 G512LW
GeForce RTX 2070 Mobile, i7-10750H, Toshiba XG5-P KXG50PNV2T04
8826 Points
Asus ROG Strix Scar 15 G532LWS
GeForce RTX 2070 Super Mobile, i9-10980HK, 2x Intel SSD 660p 1TB SSDPEKNW010T8 (RAID 0)
8613 Points -2%
Razer Blade 15 RTX 2070 Super Max-Q
GeForce RTX 2070 Super Max-Q, i7-10875H, Samsung SSD PM981a MZVLB512HBJQ
8503 Points -4%
Durchschnittliche Intel Core i7-10750H, NVIDIA GeForce RTX 2070 Mobile
  (7860 - 8826, n=4)
8255 Points -6%
MSI GP65 10SFK-047US
GeForce RTX 2070 Mobile, i7-10750H, Samsung SSD PM981 MZVLB1T0HALR
8193 Points -7%
Asus ROG Strix G15 G512LI
GeForce GTX 1650 Ti Mobile, i7-10750H, Intel SSD 660p SSDPEKNW512G8
8130 Points -8%
Alienware m15 R3 P87F
GeForce RTX 2070 Mobile, i7-10750H, 2x Micron 2200S 512 GB (RAID 0)
7860 Points -11%
Digital Content Creation
Razer Blade 15 RTX 2070 Super Max-Q
GeForce RTX 2070 Super Max-Q, i7-10875H, Samsung SSD PM981a MZVLB512HBJQ
9448 Points +84%
Alienware m15 R3 P87F
GeForce RTX 2070 Mobile, i7-10750H, 2x Micron 2200S 512 GB (RAID 0)
8855 Points +73%
MSI GP65 10SFK-047US
GeForce RTX 2070 Mobile, i7-10750H, Samsung SSD PM981 MZVLB1T0HALR
8088 Points +58%
Asus ROG Strix Scar 15 G532LWS
GeForce RTX 2070 Super Mobile, i9-10980HK, 2x Intel SSD 660p 1TB SSDPEKNW010T8 (RAID 0)
7722 Points +51%
Durchschnittliche Intel Core i7-10750H, NVIDIA GeForce RTX 2070 Mobile
  (4872 - 8855, n=4)
6734 Points +31%
Asus ROG Strix G15 G512LI
GeForce GTX 1650 Ti Mobile, i7-10750H, Intel SSD 660p SSDPEKNW512G8
5864 Points +14%
Asus ROG Strix G15 G512LW
GeForce RTX 2070 Mobile, i7-10750H, Toshiba XG5-P KXG50PNV2T04
5122 Points
PCMark 8
Home Score Accelerated v2
Razer Blade 15 RTX 2070 Super Max-Q
GeForce RTX 2070 Super Max-Q, i7-10875H, Samsung SSD PM981a MZVLB512HBJQ
5840 Points +27%
Alienware m15 R3 P87F
GeForce RTX 2070 Mobile, i7-10750H, 2x Micron 2200S 512 GB (RAID 0)
5702 Points +24%
Asus ROG Strix Scar 15 G532LWS
GeForce RTX 2070 Super Mobile, i9-10980HK, 2x Intel SSD 660p 1TB SSDPEKNW010T8 (RAID 0)
5020 Points +9%
Asus ROG Strix G15 G512LW
GeForce RTX 2070 Mobile, i7-10750H, Toshiba XG5-P KXG50PNV2T04
4589 Points
Durchschnittliche Intel Core i7-10750H, NVIDIA GeForce RTX 2070 Mobile
  (3372 - 5702, n=4)
4545 Points -1%
MSI GP65 10SFK-047US
GeForce RTX 2070 Mobile, i7-10750H, Samsung SSD PM981 MZVLB1T0HALR
4516 Points -2%
Asus ROG Strix G15 G512LI
GeForce GTX 1650 Ti Mobile, i7-10750H, Intel SSD 660p SSDPEKNW512G8
4420 Points -4%
Work Score Accelerated v2
Razer Blade 15 RTX 2070 Super Max-Q
GeForce RTX 2070 Super Max-Q, i7-10875H, Samsung SSD PM981a MZVLB512HBJQ
6825 Points +14%
Asus ROG Strix Scar 15 G532LWS
GeForce RTX 2070 Super Mobile, i9-10980HK, 2x Intel SSD 660p 1TB SSDPEKNW010T8 (RAID 0)
6456 Points +8%
Alienware m15 R3 P87F
GeForce RTX 2070 Mobile, i7-10750H, 2x Micron 2200S 512 GB (RAID 0)
6224 Points +4%
Asus ROG Strix G15 G512LW
GeForce RTX 2070 Mobile, i7-10750H, Toshiba XG5-P KXG50PNV2T04
5964 Points
Durchschnittliche Intel Core i7-10750H, NVIDIA GeForce RTX 2070 Mobile
  (5678 - 6224, n=4)
5940 Points 0%
MSI GP65 10SFK-047US
GeForce RTX 2070 Mobile, i7-10750H, Samsung SSD PM981 MZVLB1T0HALR
5894 Points -1%
Asus ROG Strix G15 G512LI
GeForce GTX 1650 Ti Mobile, i7-10750H, Intel SSD 660p SSDPEKNW512G8
5587 Points -6%
PCMark 8 Home Score Accelerated v2
4589 Punkte
PCMark 8 Work Score Accelerated v2
5964 Punkte
PCMark 10 Score
5479 Punkte
Hilfe

DPC-Latenzzeit

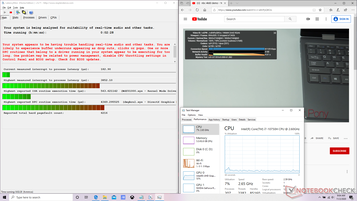
DPC Latencies / LatencyMon - interrupt to process latency (max), Web, Youtube, Prime95
Asus ROG Strix G15 G512LW
GeForce RTX 2070 Mobile, i7-10750H, Toshiba XG5-P KXG50PNV2T04
4349 μs *
Razer Blade 15 RTX 2070 Super Max-Q
GeForce RTX 2070 Super Max-Q, i7-10875H, Samsung SSD PM981a MZVLB512HBJQ
1768 μs * +59%
Asus ROG Strix Scar 15 G532LWS
GeForce RTX 2070 Super Mobile, i9-10980HK, 2x Intel SSD 660p 1TB SSDPEKNW010T8 (RAID 0)
1475 μs * +66%
Asus ROG Strix G15 G512LI
GeForce GTX 1650 Ti Mobile, i7-10750H, Intel SSD 660p SSDPEKNW512G8
1249 μs * +71%
Alienware m15 R3 P87F
GeForce RTX 2070 Mobile, i7-10750H, 2x Micron 2200S 512 GB (RAID 0)
1206 μs * +72%
MSI GP65 10SFK-047US
GeForce RTX 2070 Mobile, i7-10750H, Samsung SSD PM981 MZVLB1T0HALR
1172 μs * +73%

* ... kleinere Werte sind besser

Speichergeräte

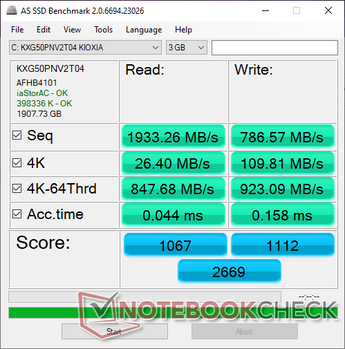
CUKUSA hat unser Gerät mit einer 2 TB Toshiba XG5-P M.2 NVMe SSD konfiguriert. Obwohl die sequentiellen Lesegeschwindigkeiten schnell sind, sind die Schreibgeschwindigkeiten bei einer PCIe-SSD laut AS-SSD mit nur etwa 790 MB/s langsam.

AS SSD
AS SSD
CDM 5.5
CDM 5.5
Drei interne M.2 2280-Steckplätze verfügbar
Asus ROG Strix G15 G512LW
Toshiba XG5-P KXG50PNV2T04
Asus ROG Strix G15 G512LI
Intel SSD 660p SSDPEKNW512G8
Razer Blade 15 RTX 2070 Super Max-Q
Samsung SSD PM981a MZVLB512HBJQ
Asus ROG Strix Scar 15 G532LWS
2x Intel SSD 660p 1TB SSDPEKNW010T8 (RAID 0)
Alienware m15 R3 P87F
2x Micron 2200S 512 GB (RAID 0)
AS SSD
-24%
46%
29%
14%
Seq Read
1933
1157
-40%
1957
1%
1982
3%
2058
6%
Seq Write
787
675
-14%
2092
166%
1444
83%
2316
194%
4K Read
26.4
49.99
89%
50.2
90%
50.3
91%
39.72
50%
4K Write
109.8
114
4%
96.5
-12%
120.1
9%
62.9
-43%
4K-64 Read
848
322.2
-62%
1594
88%
1016
20%
1334
57%
4K-64 Write
923
759
-18%
2005
117%
1351
46%
1271
38%
Access Time Read *
0.044
0.07
-59%
0.057
-30%
0.044
-0%
0.062
-41%
Access Time Write *
0.158
0.137
13%
0.112
29%
0.109
31%
0.388
-146%
Score Read
1067
488
-54%
1840
72%
1264
18%
1580
48%
Score Write
1112
940
-15%
2310
108%
1615
45%
1565
41%
Score Total
2669
1673
-37%
5103
91%
3510
32%
3968
49%
Copy ISO MB/s
3210
939
-71%
1793
-44%
3474
8%
1685
-48%
Copy Program MB/s
728
489.9
-33%
573
-21%
751
3%
669
-8%
Copy Game MB/s
1499
895
-40%
1418
-5%
1684
12%
1493
0%
CrystalDiskMark 5.2 / 6
1%
62%
51%
46%
Write 4K
116.5
125.4
8%
139.8
20%
128.4
10%
67.3
-42%
Read 4K
27.6
52.7
91%
48.62
76%
53.7
95%
41.47
50%
Write Seq
1020
943
-8%
2260
122%
1875
84%
2239
120%
Read Seq
1999
1383
-31%
2135
7%
2315
16%
2112
6%
Write 4K Q32T1
375.9
437.9
16%
499.3
33%
427.2
14%
488.9
30%
Read 4K Q32T1
398.5
334.9
-16%
552
39%
440.7
11%
557
40%
Write Seq Q32T1
1015
960
-5%
2960
192%
2793
175%
2654
161%
Read Seq Q32T1
3049
1530
-50%
3269
7%
3101
2%
3137
3%
Durchschnitt gesamt (Programm / Settings)
-12% / -15%
54% / 52%
40% / 37%
30% / 26%

* ... kleinere Werte sind besser

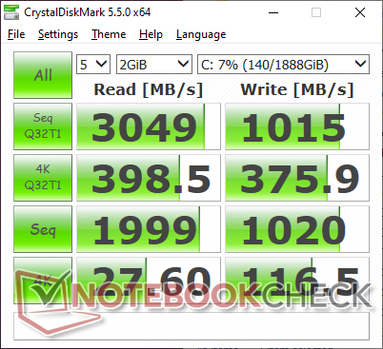
Toshiba XG5-P KXG50PNV2T04
CDM 5/6 Read Seq Q32T1: 3049 MB/s
CDM 5/6 Write Seq Q32T1: 1015 MB/s
CDM 5/6 Read 4K Q32T1: 398.5 MB/s
CDM 5/6 Write 4K Q32T1: 375.9 MB/s
CDM 5 Read Seq: 1999 MB/s
CDM 5 Write Seq: 1020 MB/s
CDM 5/6 Read 4K: 27.6 MB/s
CDM 5/6 Write 4K: 116.5 MB/s

Disk Throttling: DiskSpd Read Loop, Queue Depth 8

No graph data

GPU-Leistung

Die Grafikleistung liegt nur wenige Prozentpunkte über der durchschnittlichen mobilen GeForce RTX 2070 in unserer Datenbank. Eine vollwertige Desktop-GeForce RTX 2070 ist laut 3DMark-Benchmarks etwa 10 bis 20 Prozent schneller. Durch die Wahl des G512LW gegenüber dem GTX 1650 Ti-betriebenen G512LI erhalten Benutzer etwa die doppelte Grafikleistung.

Beachten Sie, dass die Grafikleistung im Turbo-Modus (7826 Punkte bei Time Spy-Grafiken) etwas schneller ist als im Performance-Modus (7543 Punkte).

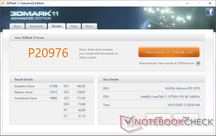
3DMark 11
3DMark 11
Cloud Gate
Cloud Gate
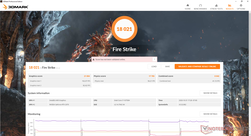
Fire Strike
Fire Strike
Fire Strike Ultra
Fire Strike Ultra
Time Spy (Turbo mode)
Time Spy (Performance mode)
3DMark
1920x1080 Fire Strike Graphics
Asus Strix Scar 17 G732LXS
NVIDIA GeForce RTX 2080 Super Mobile, i9-10980HK
24416 Points +16%
Asus ROG Strix RTX 2070 OC
NVIDIA GeForce RTX 2070 (Desktop), R7 2700X
23373 Points +11%
Asus Zephyrus S15 GX502L
NVIDIA GeForce RTX 2070 Super Mobile, i7-10875H
21896 Points +4%
Asus ROG Strix G15 G512LW
NVIDIA GeForce RTX 2070 Mobile, i7-10750H
21004 Points
Durchschnittliche NVIDIA GeForce RTX 2070 Mobile
  (18169 - 21138, n=19)
20123 Points -4%
Asus ROG Zephyrus Duo 15 GX550LXS
NVIDIA GeForce RTX 2080 Super Max-Q, i9-10980HK
19914 Points -5%
MSI RTX 2060 Gaming Z 6G
NVIDIA GeForce RTX 2060 (Desktop), R7 2700X
19338 Points -8%
Dell G5 15 SE 5505 P89F
AMD Radeon RX 5600M, R7 4800H
18807 Points -10%
Asus ROG Zephyrus M15 GU502L
NVIDIA GeForce RTX 2070 Max-Q, i7-10750H
17321 Points -18%
Asus ROG Zephyrus M15 GU502LU-BI7N4
NVIDIA GeForce GTX 1660 Ti Mobile, i7-10750H
16488 Points -22%
Aorus 5 KB
NVIDIA GeForce RTX 2060 Mobile, i7-10750H
16362 Points -22%
Asus ROG Strix G15 G512LI
NVIDIA GeForce GTX 1650 Ti Mobile, i7-10750H
10663 Points -49%
HP Pavilion Gaming 15-ec1206ng
NVIDIA GeForce GTX 1650 Mobile, R5 4600H
9778 Points -53%
2560x1440 Time Spy Graphics
Asus Strix Scar 17 G732LXS
NVIDIA GeForce RTX 2080 Super Mobile, i9-10980HK
9638 Points +23%
Asus ROG Strix RTX 2070 OC
NVIDIA GeForce RTX 2070 (Desktop), R7 2700X
9364 Points +20%
Asus Zephyrus S15 GX502L
NVIDIA GeForce RTX 2070 Super Mobile, i7-10875H
8134 Points +4%
Asus ROG Strix G15 G512LW
NVIDIA GeForce RTX 2070 Mobile, i7-10750H
7826 Points
MSI RTX 2060 Gaming Z 6G
NVIDIA GeForce RTX 2060 (Desktop), R7 2700X
7732 Points -1%
Asus ROG Zephyrus Duo 15 GX550LXS
NVIDIA GeForce RTX 2080 Super Max-Q, i9-10980HK
7665 Points -2%
Durchschnittliche NVIDIA GeForce RTX 2070 Mobile
  (7006 - 8028, n=18)
7651 Points -2%
Asus ROG Zephyrus M15 GU502L
NVIDIA GeForce RTX 2070 Max-Q, i7-10750H
6627 Points -15%
Dell G5 15 SE 5505 P89F
AMD Radeon RX 5600M, R7 4800H
6312 Points -19%
Aorus 5 KB
NVIDIA GeForce RTX 2060 Mobile, i7-10750H
6123 Points -22%
Asus ROG Zephyrus M15 GU502LU-BI7N4
NVIDIA GeForce GTX 1660 Ti Mobile, i7-10750H
6123 Points -22%
Asus ROG Strix G15 G512LI
NVIDIA GeForce GTX 1650 Ti Mobile, i7-10750H
3841 Points -51%
HP Pavilion Gaming 15-ec1206ng
NVIDIA GeForce GTX 1650 Mobile, R5 4600H
3515 Points -55%
2560x1440 Time Spy Score
Asus Strix Scar 17 G732LXS
NVIDIA GeForce RTX 2080 Super Mobile, i9-10980HK
9629 Points +25%
Asus ROG Strix RTX 2070 OC
NVIDIA GeForce RTX 2070 (Desktop), R7 2700X
9284 Points +20%
Asus Zephyrus S15 GX502L
NVIDIA GeForce RTX 2070 Super Mobile, i7-10875H
8293 Points +7%
MSI RTX 2060 Gaming Z 6G
NVIDIA GeForce RTX 2060 (Desktop), R7 2700X
7878 Points +2%
Asus ROG Zephyrus Duo 15 GX550LXS
NVIDIA GeForce RTX 2080 Super Max-Q, i9-10980HK
7780 Points +1%
Asus ROG Strix G15 G512LW
NVIDIA GeForce RTX 2070 Mobile, i7-10750H
7718 Points
Durchschnittliche NVIDIA GeForce RTX 2070 Mobile
  (6890 - 8253, n=18)
7537 Points -2%
Dell G5 15 SE 5505 P89F
AMD Radeon RX 5600M, R7 4800H
6610 Points -14%
Asus ROG Zephyrus M15 GU502L
NVIDIA GeForce RTX 2070 Max-Q, i7-10750H
6604 Points -14%
Asus ROG Zephyrus M15 GU502LU-BI7N4
NVIDIA GeForce GTX 1660 Ti Mobile, i7-10750H
6261 Points -19%
Aorus 5 KB
NVIDIA GeForce RTX 2060 Mobile, i7-10750H
6258 Points -19%
Asus ROG Strix G15 G512LI
NVIDIA GeForce GTX 1650 Ti Mobile, i7-10750H
4131 Points -46%
HP Pavilion Gaming 15-ec1206ng
NVIDIA GeForce GTX 1650 Mobile, R5 4600H
3765 Points -51%
3DMark 11
1280x720 Performance GPU
Asus Strix Scar 17 G732LXS
NVIDIA GeForce RTX 2080 Super Mobile, i9-10980HK
34021 Points +25%
Asus ROG Strix RTX 2070 OC
NVIDIA GeForce RTX 2070 (Desktop), R7 2700X
31595 Points +16%
Asus Zephyrus S15 GX502L
NVIDIA GeForce RTX 2070 Super Mobile, i7-10875H
29174 Points +7%
Asus ROG Strix G15 G512LW
NVIDIA GeForce RTX 2070 Mobile, i7-10750H
27298 Points
Asus ROG Zephyrus Duo 15 GX550LXS
NVIDIA GeForce RTX 2080 Super Max-Q, i9-10980HK
27202 Points 0%
MSI RTX 2060 Gaming Z 6G
NVIDIA GeForce RTX 2060 (Desktop), R7 2700X
26413 Points -3%
Durchschnittliche NVIDIA GeForce RTX 2070 Mobile
  (23335 - 27298, n=21)
25775 Points -6%
Dell G5 15 SE 5505 P89F
AMD Radeon RX 5600M, R7 4800H
25706 Points -6%
Asus ROG Zephyrus M15 GU502LU-BI7N4
NVIDIA GeForce GTX 1660 Ti Mobile, i7-10750H
22670 Points -17%
Asus ROG Zephyrus M15 GU502L
NVIDIA GeForce RTX 2070 Max-Q, i7-10750H
22516 Points -18%
Aorus 5 KB
NVIDIA GeForce RTX 2060 Mobile, i7-10750H
22138 Points -19%
Asus ROG Strix G15 G512LI
NVIDIA GeForce GTX 1650 Ti Mobile, i7-10750H
14231 Points -48%
HP Pavilion Gaming 15-ec1206ng
NVIDIA GeForce GTX 1650 Mobile, R5 4600H
12946 Points -53%
1280x720 Performance Combined
Asus Strix Scar 17 G732LXS
NVIDIA GeForce RTX 2080 Super Mobile, i9-10980HK
17605 Points +60%
Asus ROG Zephyrus Duo 15 GX550LXS
NVIDIA GeForce RTX 2080 Super Max-Q, i9-10980HK
15885 Points +45%
Asus ROG Strix RTX 2070 OC
NVIDIA GeForce RTX 2070 (Desktop), R7 2700X
13950 Points +27%
MSI RTX 2060 Gaming Z 6G
NVIDIA GeForce RTX 2060 (Desktop), R7 2700X
13742 Points +25%
Asus Zephyrus S15 GX502L
NVIDIA GeForce RTX 2070 Super Mobile, i7-10875H
13712 Points +25%
Dell G5 15 SE 5505 P89F
AMD Radeon RX 5600M, R7 4800H
13126 Points +19%
Asus ROG Zephyrus M15 GU502LU-BI7N4
NVIDIA GeForce GTX 1660 Ti Mobile, i7-10750H
13061 Points +19%
Asus ROG Strix G15 G512LI
NVIDIA GeForce GTX 1650 Ti Mobile, i7-10750H
12993 Points +18%
Asus ROG Zephyrus M15 GU502L
NVIDIA GeForce RTX 2070 Max-Q, i7-10750H
12942 Points +18%
Durchschnittliche NVIDIA GeForce RTX 2070 Mobile
  (8716 - 16364, n=21)
12534 Points +14%
Aorus 5 KB
NVIDIA GeForce RTX 2060 Mobile, i7-10750H
11840 Points +8%
Asus ROG Strix G15 G512LW
NVIDIA GeForce RTX 2070 Mobile, i7-10750H
10992 Points
HP Pavilion Gaming 15-ec1206ng
NVIDIA GeForce GTX 1650 Mobile, R5 4600H
10473 Points -5%
3DMark 11 Performance
20976 Punkte
3DMark Cloud Gate Standard Score
39474 Punkte
3DMark Fire Strike Score
18021 Punkte
3DMark Time Spy Score
7718 Punkte
Hilfe
Final Fantasy XV Benchmark
1280x720 Lite Quality
Razer Blade 15 RTX 2070 Super Max-Q
Intel Core i7-10875H, NVIDIA GeForce RTX 2070 Super Max-Q
162 fps +7%
Durchschnittliche NVIDIA GeForce RTX 2070 Mobile
  (151 - 158, n=2)
154.5 fps +2%
MSI RTX 2060 Gaming Z 6G
AMD Ryzen 7 2700X, NVIDIA GeForce RTX 2060 (Desktop)
151.9 (95min - 175max) fps +1%
Asus ROG Strix G15 G512LW
Intel Core i7-10750H, NVIDIA GeForce RTX 2070 Mobile
151 fps
Asus ROG Zephyrus M15 GU502LU-BI7N4
Intel Core i7-10750H, NVIDIA GeForce GTX 1660 Ti Mobile
137 fps -9%
Asus ROG Zephyrus G15 GA502IU-ES76
AMD Ryzen 7 4800HS, NVIDIA GeForce GTX 1660 Ti Max-Q
131 fps -13%
MSI Bravo 15 A4DCR
AMD Ryzen 7 4800H, AMD Radeon RX 5300M
98.4 (64min) fps -35%
Gateway Creator Series 15.6 GWTN156-3BK
Intel Core i5-10300H, NVIDIA GeForce RTX 2060 Mobile
98.4 fps -35%
1920x1080 Standard Quality
Asus Strix Scar 17 G732LXS
Intel Core i9-10980HK, NVIDIA GeForce RTX 2080 Super Mobile
124 (62min) fps +17%
Razer Blade 15 RTX 2070 Super Max-Q
Intel Core i7-10875H, NVIDIA GeForce RTX 2070 Super Max-Q
110 fps +4%
Asus ROG Strix G15 G512LW
Intel Core i7-10750H, NVIDIA GeForce RTX 2070 Mobile
106 fps
Durchschnittliche NVIDIA GeForce RTX 2070 Mobile
  (100 - 106, n=3)
103 fps -3%
MSI RTX 2060 Gaming Z 6G
AMD Ryzen 7 2700X, NVIDIA GeForce RTX 2060 (Desktop)
99.6 (73min - 132max) fps -6%
Asus ROG Zephyrus M15 GU502LU-BI7N4
Intel Core i7-10750H, NVIDIA GeForce GTX 1660 Ti Mobile
87.6 fps -17%
Asus ROG Zephyrus G15 GA502IU-ES76
AMD Ryzen 7 4800HS, NVIDIA GeForce GTX 1660 Ti Max-Q
74.1 fps -30%
Gateway Creator Series 15.6 GWTN156-3BK
Intel Core i5-10300H, NVIDIA GeForce RTX 2060 Mobile
74 fps -30%
Acer Nitro 5 AN515-44-R5FT
AMD Ryzen 5 4600H, NVIDIA GeForce GTX 1650 Ti Mobile
56.5 (23min) fps -47%
MSI Bravo 15 A4DCR
AMD Ryzen 7 4800H, AMD Radeon RX 5300M
51.6 (42min) fps -51%
1920x1080 High Quality
Asus Strix Scar 17 G732LXS
Intel Core i9-10980HK, NVIDIA GeForce RTX 2080 Super Mobile
95.7 (49min) fps +19%
Razer Blade 15 RTX 2070 Super Max-Q
Intel Core i7-10875H, NVIDIA GeForce RTX 2070 Super Max-Q
83.7 fps +4%
Asus ROG Strix G15 G512LW
Intel Core i7-10750H, NVIDIA GeForce RTX 2070 Mobile
80.6 fps
Asus Zephyrus S15 GX502L
Intel Core i7-10875H, NVIDIA GeForce RTX 2070 Super Mobile
79.7 fps -1%
Durchschnittliche NVIDIA GeForce RTX 2070 Mobile
  (77 - 80.6, n=3)
78.6 fps -2%
MSI RTX 2060 Gaming Z 6G
AMD Ryzen 7 2700X, NVIDIA GeForce RTX 2060 (Desktop)
72.6 (31min - 114max) fps -10%
Aorus 5 KB
Intel Core i7-10750H, NVIDIA GeForce RTX 2060 Mobile
66.1 fps -18%
Asus ROG Zephyrus M15 GU502LU-BI7N4
Intel Core i7-10750H, NVIDIA GeForce GTX 1660 Ti Mobile
63.9 fps -21%
Gateway Creator Series 15.6 GWTN156-3BK
Intel Core i5-10300H, NVIDIA GeForce RTX 2060 Mobile
60 fps -26%
Asus ROG Zephyrus G15 GA502IU-ES76
AMD Ryzen 7 4800HS, NVIDIA GeForce GTX 1660 Ti Max-Q
54.6 fps -32%
Acer Nitro 5 AN515-44-R5FT
AMD Ryzen 5 4600H, NVIDIA GeForce GTX 1650 Ti Mobile
42 (20min) fps -48%
MSI Bravo 15 A4DCR
AMD Ryzen 7 4800H, AMD Radeon RX 5300M
29.3 (8min) fps -64%
The Witcher 3
1920x1080 High Graphics & Postprocessing (Nvidia HairWorks Off)
Asus Strix Scar 17 G732LXS
Intel Core i9-10980HK, NVIDIA GeForce RTX 2080 Super Mobile
178 (150min) fps +23%
Asus ROG Strix Scar 15 G532LWS
Intel Core i9-10980HK, NVIDIA GeForce RTX 2070 Super Mobile
168 (155min - 175max) fps +16%
MSI GP65 10SFK-047US
Intel Core i7-10750H, NVIDIA GeForce RTX 2070 Mobile
160.8 (152min - 177max) fps +11%
Eurocom Nightsky RX15
Intel Core i9-9980HK, NVIDIA GeForce RTX 2070 Mobile
155.8 fps +8%
MSI GE65 Raider 9SF-049US
Intel Core i9-9880H, NVIDIA GeForce RTX 2070 Mobile
152.3 fps +5%
Alienware m15 R3 P87F
Intel Core i7-10750H, NVIDIA GeForce RTX 2070 Mobile
149.8 (139min - 156max) fps +4%
Asus ROG Strix G15 G512LW
Intel Core i7-10750H, NVIDIA GeForce RTX 2070 Mobile
144.5 (136min - 155max) fps
Asus ROG Zephyrus Duo 15 GX550LXS
Intel Core i9-10980HK, NVIDIA GeForce RTX 2080 Super Max-Q
143.4 fps -1%
Razer Blade 15 RTX 2070 Super Max-Q
Intel Core i7-10875H, NVIDIA GeForce RTX 2070 Super Max-Q
141.4 (134min - 152max) fps -2%
Durchschnittliche NVIDIA GeForce RTX 2070 Mobile
  (115.7 - 160.8, n=17)
140.1 fps -3%
MSI RTX 2060 Gaming Z 6G
AMD Ryzen 7 2700X, NVIDIA GeForce RTX 2060 (Desktop)
135.7 (113min - 150max) fps -6%
Asus ROG Zephyrus M15 GU502L
Intel Core i7-10750H, NVIDIA GeForce RTX 2070 Max-Q
127.4 fps -12%
MSI GE63 Raider 8SG
Intel Core i7-8750H, NVIDIA GeForce RTX 2080 Mobile
126.1 fps -13%
Asus ROG Zephyrus M15 GU502LU-BI7N4
Intel Core i7-10750H, NVIDIA GeForce GTX 1660 Ti Mobile
117.6 (107min - 128max) fps -19%
Gateway Creator Series 15.6 GWTN156-3BK
Intel Core i5-10300H, NVIDIA GeForce RTX 2060 Mobile
111 (96min - 121max) fps -23%
Maingear Vector 15
Intel Core i7-9750H, NVIDIA GeForce GTX 1660 Ti Mobile
110.7 fps -23%
Dell G5 15 SE 5505 P89F
AMD Ryzen 7 4800H, AMD Radeon RX 5600M
103.6 (92min - 110max) fps -28%
Asus ROG Zephyrus G15 GA502IU-ES76
AMD Ryzen 7 4800HS, NVIDIA GeForce GTX 1660 Ti Max-Q
94.5 (85min - 105max) fps -35%
Asus ROG Strix G15 G512LI
Intel Core i7-10750H, NVIDIA GeForce GTX 1650 Ti Mobile
76.1 (71min - 80max) fps -47%
HP Pavilion Gaming 15-ec1206ng
AMD Ryzen 5 4600H, NVIDIA GeForce GTX 1650 Mobile
68.9 fps -52%
Acer Nitro 5 AN515-44-R5FT
AMD Ryzen 5 4600H, NVIDIA GeForce GTX 1650 Ti Mobile
67.7 (56min) fps -53%
MSI Bravo 15 A4DCR
AMD Ryzen 7 4800H, AMD Radeon RX 5300M
60 (48min) fps -58%
1920x1080 Ultra Graphics & Postprocessing (HBAO+)
Asus Strix Scar 17 G732LXS
Intel Core i9-10980HK, NVIDIA GeForce RTX 2080 Super Mobile
93.4 (78min) fps +19%
Asus ROG Strix Scar 15 G532LWS
Intel Core i9-10980HK, NVIDIA GeForce RTX 2070 Super Mobile
85.7 (80min - 91max) fps +10%
MSI GE63 Raider 8SG
Intel Core i7-8750H, NVIDIA GeForce RTX 2080 Mobile
82.2 fps +5%
MSI GP65 10SFK-047US
Intel Core i7-10750H, NVIDIA GeForce RTX 2070 Mobile
82.1 (77min - 86max) fps +5%
Alienware m15 R3 P87F
Intel Core i7-10750H, NVIDIA GeForce RTX 2070 Mobile
81 (77min - 86max) fps +4%
Eurocom Nightsky RX15
Intel Core i9-9980HK, NVIDIA GeForce RTX 2070 Mobile
80.6 fps +3%
MSI GE65 Raider 9SF-049US
Intel Core i9-9880H, NVIDIA GeForce RTX 2070 Mobile
78.4 fps 0%
Asus ROG Strix G15 G512LW
Intel Core i7-10750H, NVIDIA GeForce RTX 2070 Mobile
78.2 (73min - 82max) fps
Asus Zephyrus S15 GX502L
Intel Core i7-10875H, NVIDIA GeForce RTX 2070 Super Mobile
76.3 (64min) fps -2%
Asus ROG Zephyrus Duo 15 GX550LXS
Intel Core i9-10980HK, NVIDIA GeForce RTX 2080 Super Max-Q
75.8 (63min) fps -3%
Durchschnittliche NVIDIA GeForce RTX 2070 Mobile
  (64 - 82.1, n=21)
74.3 fps -5%
Razer Blade 15 RTX 2070 Super Max-Q
Intel Core i7-10875H, NVIDIA GeForce RTX 2070 Super Max-Q
74 (70min - 78max) fps -5%
MSI RTX 2060 Gaming Z 6G
AMD Ryzen 7 2700X, NVIDIA GeForce RTX 2060 (Desktop)
72.7 (61min - 82max) fps -7%
Asus ROG Zephyrus M15 GU502L
Intel Core i7-10750H, NVIDIA GeForce RTX 2070 Max-Q
70.7 fps -10%
Dell G5 15 SE 5505 P89F
AMD Ryzen 7 4800H, AMD Radeon RX 5600M
66.1 (62min - 70max) fps -15%
Asus ROG Zephyrus M15 GU502LU-BI7N4
Intel Core i7-10750H, NVIDIA GeForce GTX 1660 Ti Mobile
65.1 (62min - 69max) fps -17%
Gateway Creator Series 15.6 GWTN156-3BK
Intel Core i5-10300H, NVIDIA GeForce RTX 2060 Mobile
63.2 (57min - 69max) fps -19%
Maingear Vector 15
Intel Core i7-9750H, NVIDIA GeForce GTX 1660 Ti Mobile
61.3 fps -22%
Aorus 5 KB
Intel Core i7-10750H, NVIDIA GeForce RTX 2060 Mobile
57 (47min) fps -27%
Asus ROG Zephyrus G15 GA502IU-ES76
AMD Ryzen 7 4800HS, NVIDIA GeForce GTX 1660 Ti Max-Q
51.3 (47min - 56max) fps -34%
Asus ROG Strix G15 G512LI
Intel Core i7-10750H, NVIDIA GeForce GTX 1650 Ti Mobile
40.1 (37min - 44max) fps -49%
HP Pavilion Gaming 15-ec1206ng
AMD Ryzen 5 4600H, NVIDIA GeForce GTX 1650 Mobile
39.8 (28min) fps -49%
Acer Nitro 5 AN515-44-R5FT
AMD Ryzen 5 4600H, NVIDIA GeForce GTX 1650 Ti Mobile
38.3 (29min) fps -51%
MSI Bravo 15 A4DCR
AMD Ryzen 7 4800H, AMD Radeon RX 5300M
38.3 (31min) fps -51%
GTA V
1024x768 Lowest Settings possible
Asus Strix Scar 17 G732LXS
Intel Core i9-10980HK, NVIDIA GeForce RTX 2080 Super Mobile
185 (4.98min, 143P1 - 276max) fps +4%
Asus ROG Zephyrus M15 GU502LU-BI7N4
Intel Core i7-10750H, NVIDIA GeForce GTX 1660 Ti Mobile
178 (3.93min, 111P1 - 272max) fps 0%
Asus ROG Strix G15 G512LW
Intel Core i7-10750H, NVIDIA GeForce RTX 2070 Mobile
178 (3.64min, 125P1 - 345max) fps
MSI RTX 2060 Gaming Z 6G
AMD Ryzen 7 2700X, NVIDIA GeForce RTX 2060 (Desktop)
174.4 fps -2%
Durchschnittliche NVIDIA GeForce RTX 2070 Mobile
  (163.4 - 179, n=3)
173.5 fps -3%
MSI Bravo 15 A4DCR
AMD Ryzen 7 4800H, AMD Radeon RX 5300M
163 (6.36min, 111P1 - 255max) fps -8%
Gateway Creator Series 15.6 GWTN156-3BK
Intel Core i5-10300H, NVIDIA GeForce RTX 2060 Mobile
153 (7.3min, 90.9P1 - 292max) fps -14%
Acer Nitro 5 AN515-44-R5FT
AMD Ryzen 5 4600H, NVIDIA GeForce GTX 1650 Ti Mobile
144 (4.75min, 83.3P1 - 257max) fps -19%
1920x1080 Lowest Settings possible
Asus Strix Scar 17 G732LXS
Intel Core i9-10980HK, NVIDIA GeForce RTX 2080 Super Mobile
182 (2.03min, 143P1 - 301max) fps +5%
Durchschnittliche NVIDIA GeForce RTX 2070 Mobile
  (174 - 179, n=2)
176.5 fps +1%
Asus ROG Zephyrus M15 GU502LU-BI7N4
Intel Core i7-10750H, NVIDIA GeForce GTX 1660 Ti Mobile
175 (3.43min, 125P1 - 385max) fps +1%
Asus ROG Strix G15 G512LW
Intel Core i7-10750H, NVIDIA GeForce RTX 2070 Mobile
174 (6.8min, 125P1 - 352max) fps
MSI Bravo 15 A4DCR
AMD Ryzen 7 4800H, AMD Radeon RX 5300M
153 (4.39min, 100P1 - 241max) fps -12%
Acer Nitro 5 AN515-44-R5FT
AMD Ryzen 5 4600H, NVIDIA GeForce GTX 1650 Ti Mobile
130 (60.6min, 83.3P1 - 213max) fps -25%
Gateway Creator Series 15.6 GWTN156-3BK
Intel Core i5-10300H, NVIDIA GeForce RTX 2060 Mobile
124 (18.1min, 83.3P1 - 195max) fps -29%
1366x768 Normal/Off AF:4x
Asus Strix Scar 17 G732LXS
Intel Core i9-10980HK, NVIDIA GeForce RTX 2080 Super Mobile
178 (3.16min, 143P1 - 360max) fps +5%
Asus ROG Zephyrus M15 GU502LU-BI7N4
Intel Core i7-10750H, NVIDIA GeForce GTX 1660 Ti Mobile
171 (5.11min, 125P1 - 320max) fps +1%
Asus ROG Strix G15 G512LW
Intel Core i7-10750H, NVIDIA GeForce RTX 2070 Mobile
170 (5.41min, 125P1 - 255max) fps
MSI RTX 2060 Gaming Z 6G
AMD Ryzen 7 2700X, NVIDIA GeForce RTX 2060 (Desktop)
166.4 fps -2%
Durchschnittliche NVIDIA GeForce RTX 2070 Mobile
  (155.7 - 172, n=3)
165.9 fps -2%
Gateway Creator Series 15.6 GWTN156-3BK
Intel Core i5-10300H, NVIDIA GeForce RTX 2060 Mobile
133 (10.5min, 76.9P1 - 279max) fps -22%
1920x1080 Normal/Off AF:4x
Asus Strix Scar 17 G732LXS
Intel Core i9-10980HK, NVIDIA GeForce RTX 2080 Super Mobile
177 (3.7min, 125P1 - 380max) fps +6%
Durchschnittliche NVIDIA GeForce RTX 2070 Mobile
  (167 - 173, n=2)
170 fps +2%
Asus ROG Zephyrus M15 GU502LU-BI7N4
Intel Core i7-10750H, NVIDIA GeForce GTX 1660 Ti Mobile
169 (4.81min, 111P1 - 331max) fps +1%
Asus ROG Strix G15 G512LW
Intel Core i7-10750H, NVIDIA GeForce RTX 2070 Mobile
167 (4.7min, 111P1 - 302max) fps
MSI Bravo 15 A4DCR
AMD Ryzen 7 4800H, AMD Radeon RX 5300M
145 (3.9min, 90.9P1 - 230max) fps -13%
Acer Nitro 5 AN515-44-R5FT
AMD Ryzen 5 4600H, NVIDIA GeForce GTX 1650 Ti Mobile
122 (49.6min, 76.9P1 - 208max) fps -27%
Gateway Creator Series 15.6 GWTN156-3BK
Intel Core i5-10300H, NVIDIA GeForce RTX 2060 Mobile
113 (20min, 71.4P1 - 232max) fps -32%
1920x1080 High/On (Advanced Graphics Off) AA:2xMSAA + FX AF:8x
Asus Strix Scar 17 G732LXS
Intel Core i9-10980HK, NVIDIA GeForce RTX 2080 Super Mobile
164 (8.73min, 111P1 - 318max) fps +11%
MSI RTX 2060 Gaming Z 6G
AMD Ryzen 7 2700X, NVIDIA GeForce RTX 2060 (Desktop)
148.4 fps 0%
Asus ROG Strix G15 G512LW
Intel Core i7-10750H, NVIDIA GeForce RTX 2070 Mobile
148 (4.56min, 100P1 - 248max) fps
Durchschnittliche NVIDIA GeForce RTX 2070 Mobile
  (126.6 - 160, n=3)
144.9 fps -2%
Asus ROG Zephyrus M15 GU502LU-BI7N4
Intel Core i7-10750H, NVIDIA GeForce GTX 1660 Ti Mobile
140 (3.44min, 90.9P1 - 281max) fps -5%
Gateway Creator Series 15.6 GWTN156-3BK
Intel Core i5-10300H, NVIDIA GeForce RTX 2060 Mobile
94.5 (10.2min, 66.7P1 - 161max) fps -36%
Acer Nitro 5 AN515-44-R5FT
AMD Ryzen 5 4600H, NVIDIA GeForce GTX 1650 Ti Mobile
93.1 (32.6min, 66.7P1 - 135max) fps -37%
MSI Bravo 15 A4DCR
AMD Ryzen 7 4800H, AMD Radeon RX 5300M
86.1 (8.46min, 66.7P1 - 126max) fps -42%
1920x1080 Highest Settings possible AA:4xMSAA + FX AF:16x
MSI RTX 2060 Gaming Z 6G
AMD Ryzen 7 2700X, NVIDIA GeForce RTX 2060 (Desktop)
100.5 fps +23%
Asus Strix Scar 17 G732LXS
Intel Core i9-10980HK, NVIDIA GeForce RTX 2080 Super Mobile
92.8 (26.9min, 55.6P1 - 191max) fps +13%
Asus ROG Strix G15 G512LW
Intel Core i7-10750H, NVIDIA GeForce RTX 2070 Mobile
82 (10.7min, 52.6P1 - 165max) fps
Durchschnittliche NVIDIA GeForce RTX 2070 Mobile
  (71.4 - 87, n=3)
80.1 fps -2%
Asus ROG Zephyrus M15 GU502LU-BI7N4
Intel Core i7-10750H, NVIDIA GeForce GTX 1660 Ti Mobile
76 (7.66min, 45.5P1 - 141max) fps -7%
Gateway Creator Series 15.6 GWTN156-3BK
Intel Core i5-10300H, NVIDIA GeForce RTX 2060 Mobile
60 (5.51min, 40P1 - 102max) fps -27%
Acer Nitro 5 AN515-44-R5FT
AMD Ryzen 5 4600H, NVIDIA GeForce GTX 1650 Ti Mobile
51.5 (19.1min, 34.5P1 - 86.4max) fps -37%
MSI Bravo 15 A4DCR
AMD Ryzen 7 4800H, AMD Radeon RX 5300M
42.6 (3.28min, 30.3P1 - 72.3max) fps -48%
Strange Brigade
1280x720 lowest AF:1
Asus ROG Strix G15 G512LW
Intel Core i7-10750H, NVIDIA GeForce RTX 2070 Mobile
313 (60.6min, 246P1 - 481max) fps
Durchschnittliche NVIDIA GeForce RTX 2070 Mobile
  ()
313 fps 0%
Asus ROG Zephyrus M15 GU502LU-BI7N4
Intel Core i7-10750H, NVIDIA GeForce GTX 1660 Ti Mobile
311 (91.4min, 250P1 - 486max) fps -1%
Gateway Creator Series 15.6 GWTN156-3BK
Intel Core i5-10300H, NVIDIA GeForce RTX 2060 Mobile
236 (59.3min, 185P1 - 404max) fps -25%
1920x1080 medium AA:medium AF:4
Asus ROG Strix G15 G512LW
Intel Core i7-10750H, NVIDIA GeForce RTX 2070 Mobile
183 (139min, 157P1 - 278max) fps
Durchschnittliche NVIDIA GeForce RTX 2070 Mobile
  ()
183 fps 0%
Asus ROG Zephyrus M15 GU502LU-BI7N4
Intel Core i7-10750H, NVIDIA GeForce GTX 1660 Ti Mobile
150 (47.9min, 126P1 - 222max) fps -18%
Gateway Creator Series 15.6 GWTN156-3BK
Intel Core i5-10300H, NVIDIA GeForce RTX 2060 Mobile
149 (79.8min, 117P1 - 238max) fps -19%
1920x1080 high AA:high AF:8
Asus ROG Strix G15 G512LW
Intel Core i7-10750H, NVIDIA GeForce RTX 2070 Mobile
149 (105min, 114P1 - 277max) fps
Durchschnittliche NVIDIA GeForce RTX 2070 Mobile
  ()
149 fps 0%
Gateway Creator Series 15.6 GWTN156-3BK
Intel Core i5-10300H, NVIDIA GeForce RTX 2060 Mobile
122 (46.6min, 92.4P1 - 215max) fps -18%
Asus ROG Zephyrus M15 GU502LU-BI7N4
Intel Core i7-10750H, NVIDIA GeForce GTX 1660 Ti Mobile
122 (68.9min, 95.9P1 - 191max) fps -18%
1920x1080 ultra AA:ultra AF:16
Asus ROG Strix G15 G512LW
Intel Core i7-10750H, NVIDIA GeForce RTX 2070 Mobile
125 (73min, 97.8P1 - 200max) fps
Durchschnittliche NVIDIA GeForce RTX 2070 Mobile
  ()
125 fps 0%
Gateway Creator Series 15.6 GWTN156-3BK
Intel Core i5-10300H, NVIDIA GeForce RTX 2060 Mobile
104 (56.1min, 81P1 - 209max) fps -17%
Asus ROG Zephyrus M15 GU502LU-BI7N4
Intel Core i7-10750H, NVIDIA GeForce GTX 1660 Ti Mobile
104 (63.4min, 82.8P1 - 176max) fps -17%
Dota 2 Reborn
1280x720 min (0/3) fastest
Asus Strix Scar 17 G732LXS
Intel Core i9-10980HK, NVIDIA GeForce RTX 2080 Super Mobile
168 (143.8min) fps +13%
Asus ROG Strix Scar 15 G532LWS
Intel Core i9-10980HK, NVIDIA GeForce RTX 2070 Super Mobile
156 (136.6min) fps +5%
Asus Zephyrus S15 GX502L
Intel Core i7-10875H, NVIDIA GeForce RTX 2070 Super Mobile
156 (135.8min) fps +5%
MSI GP65 10SFK-047US
Intel Core i7-10750H, NVIDIA GeForce RTX 2070 Mobile
152 (131.6min) fps +2%
Asus ROG Zephyrus M15 GU502LU-BI7N4
Intel Core i7-10750H, NVIDIA GeForce GTX 1660 Ti Mobile
150 (131.2min) fps +1%
Asus ROG Strix G15 G512LW
Intel Core i7-10750H, NVIDIA GeForce RTX 2070 Mobile
149 (127.8min) fps
Asus ROG Strix G15 G512LI
Intel Core i7-10750H, NVIDIA GeForce GTX 1650 Ti Mobile
148 (128.6min) fps -1%
Durchschnittliche NVIDIA GeForce RTX 2070 Mobile
  (129.7 - 153, n=9)
144.4 fps -3%
Razer Blade 15 RTX 2070 Super Max-Q
Intel Core i7-10875H, NVIDIA GeForce RTX 2070 Super Max-Q
144 (124.9min) fps -3%
Alienware m15 R3 P87F
Intel Core i7-10750H, NVIDIA GeForce RTX 2070 Mobile
142 (121.9min) fps -5%
Aorus 5 KB
Intel Core i7-10750H, NVIDIA GeForce RTX 2060 Mobile
140 (124.1min) fps -6%
Dell G5 15 SE 5505 P89F
AMD Ryzen 7 4800H, AMD Radeon RX 5600M
124 (103.6min) fps -17%
Asus ROG Zephyrus G15 GA502IU-ES76
AMD Ryzen 7 4800HS, NVIDIA GeForce GTX 1660 Ti Max-Q
119 (105.9min) fps -20%
Gateway Creator Series 15.6 GWTN156-3BK
Intel Core i5-10300H, NVIDIA GeForce RTX 2060 Mobile
117 (103.4min) fps -21%
MSI Bravo 15 A4DCR
AMD Ryzen 7 4800H, AMD Radeon RX 5300M
113 (93.9min) fps -24%
Acer Nitro 5 AN515-44-R5FT
AMD Ryzen 5 4600H, NVIDIA GeForce GTX 1650 Ti Mobile
107 (95.5min) fps -28%
1366x768 med (1/3)
Asus Strix Scar 17 G732LXS
Intel Core i9-10980HK, NVIDIA GeForce RTX 2080 Super Mobile
154 (133.3min) fps +18%
Asus ROG Strix Scar 15 G532LWS
Intel Core i9-10980HK, NVIDIA GeForce RTX 2070 Super Mobile
145 (125.4min) fps +12%
MSI GP65 10SFK-047US
Intel Core i7-10750H, NVIDIA GeForce RTX 2070 Mobile
139 (121.6min) fps +7%
Asus Zephyrus S15 GX502L
Intel Core i7-10875H, NVIDIA GeForce RTX 2070 Super Mobile
136 (118.3min) fps +5%
Asus ROG Zephyrus M15 GU502LU-BI7N4
Intel Core i7-10750H, NVIDIA GeForce GTX 1660 Ti Mobile
135 (117.8min) fps +4%
Alienware m15 R3 P87F
Intel Core i7-10750H, NVIDIA GeForce RTX 2070 Mobile
133 (116.8min) fps +2%
Asus ROG Strix G15 G512LI
Intel Core i7-10750H, NVIDIA GeForce GTX 1650 Ti Mobile
132 (115.3min) fps +2%
Razer Blade 15 RTX 2070 Super Max-Q
Intel Core i7-10875H, NVIDIA GeForce RTX 2070 Super Max-Q
132 (117min) fps +2%
Durchschnittliche NVIDIA GeForce RTX 2070 Mobile
  (120.7 - 140, n=9)
131.3 fps +1%
Asus ROG Strix G15 G512LW
Intel Core i7-10750H, NVIDIA GeForce RTX 2070 Mobile
130 (113.4min) fps
Aorus 5 KB
Intel Core i7-10750H, NVIDIA GeForce RTX 2060 Mobile
128 (114.2min) fps -2%
Dell G5 15 SE 5505 P89F
AMD Ryzen 7 4800H, AMD Radeon RX 5600M
119 (99.7min) fps -8%
Asus ROG Zephyrus G15 GA502IU-ES76
AMD Ryzen 7 4800HS, NVIDIA GeForce GTX 1660 Ti Max-Q
112 (99.6min) fps -14%
MSI Bravo 15 A4DCR
AMD Ryzen 7 4800H, AMD Radeon RX 5300M
108 (89.7min) fps -17%
Gateway Creator Series 15.6 GWTN156-3BK
Intel Core i5-10300H, NVIDIA GeForce RTX 2060 Mobile
107 (96.2min) fps -18%
Acer Nitro 5 AN515-44-R5FT
AMD Ryzen 5 4600H, NVIDIA GeForce GTX 1650 Ti Mobile
104 (73min) fps -20%
1920x1080 high (2/3)
Asus Strix Scar 17 G732LXS
Intel Core i9-10980HK, NVIDIA GeForce RTX 2080 Super Mobile
148 (121.5min) fps +19%
Asus ROG Strix Scar 15 G532LWS
Intel Core i9-10980HK, NVIDIA GeForce RTX 2070 Super Mobile
135 (100.8min) fps +9%
MSI GP65 10SFK-047US
Intel Core i7-10750H, NVIDIA GeForce RTX 2070 Mobile
128 (111.7min) fps +3%
Razer Blade 15 RTX 2070 Super Max-Q
Intel Core i7-10875H, NVIDIA GeForce RTX 2070 Super Max-Q
127 (110.6min) fps +2%
Alienware m15 R3 P87F
Intel Core i7-10750H, NVIDIA GeForce RTX 2070 Mobile
125 (105.1min) fps +1%
Asus ROG Zephyrus M15 GU502LU-BI7N4
Intel Core i7-10750H, NVIDIA GeForce GTX 1660 Ti Mobile
124 (107.1min) fps 0%
Asus ROG Strix G15 G512LW
Intel Core i7-10750H, NVIDIA GeForce RTX 2070 Mobile
124 (96.5min) fps
Durchschnittliche NVIDIA GeForce RTX 2070 Mobile
  (104.1 - 131, n=9)
122.3 fps -1%
Asus ROG Strix G15 G512LI
Intel Core i7-10750H, NVIDIA GeForce GTX 1650 Ti Mobile
122 (105.4min) fps -2%
Aorus 5 KB
Intel Core i7-10750H, NVIDIA GeForce RTX 2060 Mobile
121 (106.1min) fps -2%
Asus Zephyrus S15 GX502L
Intel Core i7-10875H, NVIDIA GeForce RTX 2070 Super Mobile
111 (95.8min) fps -10%
Dell G5 15 SE 5505 P89F
AMD Ryzen 7 4800H, AMD Radeon RX 5600M
106 (91.5min) fps -15%
Asus ROG Zephyrus G15 GA502IU-ES76
AMD Ryzen 7 4800HS, NVIDIA GeForce GTX 1660 Ti Max-Q
106 (92.9min) fps -15%
MSI Bravo 15 A4DCR
AMD Ryzen 7 4800H, AMD Radeon RX 5300M
97.9 (85.2min) fps -21%
Gateway Creator Series 15.6 GWTN156-3BK
Intel Core i5-10300H, NVIDIA GeForce RTX 2060 Mobile
93.3 (84.6min) fps -25%
Acer Nitro 5 AN515-44-R5FT
AMD Ryzen 5 4600H, NVIDIA GeForce GTX 1650 Ti Mobile
91 (81.4min) fps -27%
1920x1080 ultra (3/3) best looking
Asus Strix Scar 17 G732LXS
Intel Core i9-10980HK, NVIDIA GeForce RTX 2080 Super Mobile
134 (115min) fps +15%
Asus ROG Strix Scar 15 G532LWS
Intel Core i9-10980HK, NVIDIA GeForce RTX 2070 Super Mobile
129 (110.1min) fps +10%
MSI GP65 10SFK-047US
Intel Core i7-10750H, NVIDIA GeForce RTX 2070 Mobile
120 (104.9min) fps +3%
Alienware m15 R3 P87F
Intel Core i7-10750H, NVIDIA GeForce RTX 2070 Mobile
120 (102.4min) fps +3%
Razer Blade 15 RTX 2070 Super Max-Q
Intel Core i7-10875H, NVIDIA GeForce RTX 2070 Super Max-Q
120 (103.6min) fps +3%
Asus ROG Zephyrus M15 GU502LU-BI7N4
Intel Core i7-10750H, NVIDIA GeForce GTX 1660 Ti Mobile
118 (100.3min) fps +1%
Asus ROG Strix G15 G512LW
Intel Core i7-10750H, NVIDIA GeForce RTX 2070 Mobile
117 (101.7min) fps
Durchschnittliche NVIDIA GeForce RTX 2070 Mobile
  (98.4 - 124, n=9)
115.9 fps -1%
Asus ROG Strix G15 G512LI
Intel Core i7-10750H, NVIDIA GeForce GTX 1650 Ti Mobile
115 (98.5min) fps -2%
Aorus 5 KB
Intel Core i7-10750H, NVIDIA GeForce RTX 2060 Mobile
115 (100min) fps -2%
Asus Zephyrus S15 GX502L
Intel Core i7-10875H, NVIDIA GeForce RTX 2070 Super Mobile
104 (88.9min) fps -11%
Asus ROG Zephyrus G15 GA502IU-ES76
AMD Ryzen 7 4800HS, NVIDIA GeForce GTX 1660 Ti Max-Q
103 (91.7min) fps -12%
Dell G5 15 SE 5505 P89F
AMD Ryzen 7 4800H, AMD Radeon RX 5600M
102 (88.8min) fps -13%
MSI Bravo 15 A4DCR
AMD Ryzen 7 4800H, AMD Radeon RX 5300M
94.7 (83.3min) fps -19%
Gateway Creator Series 15.6 GWTN156-3BK
Intel Core i5-10300H, NVIDIA GeForce RTX 2060 Mobile
88.3 (79.8min) fps -25%
Acer Nitro 5 AN515-44-R5FT
AMD Ryzen 5 4600H, NVIDIA GeForce GTX 1650 Ti Mobile
87.1 (77.9min) fps -26%