Asus Zephyrus M15 GU502LU vs. GU502LW: Wo liegen die Unterschiede?
Das Asus Zephyrus G15 GU502 kommt in drei feststehenden Varianten: als GU502LW, GU502LV und GU502LU, alle unterscheiden sich durch verschiedene GPU-Optionen. Zuletzt testeten wir das GU502LW mit einer GeForce RTX 2070 Max-Q und einem 4K-Display und jetzt schauen wir uns an, wie es sich vom preiswerteren GU502LU mit GTX 1660 Ti und einem FHD-Display unterscheidet.
Weitere Asus-Tests:
Bew. | Datum | Modell | Gewicht | Dicke | Größe | Auflösung | Preis ab |
|---|---|---|---|---|---|---|---|
| 82.1 % v7 (old) | 10 / 2020 | Asus ROG Zephyrus M15 GU502LU-BI7N4 i7-10750H, GeForce GTX 1660 Ti Mobile | 2 kg | 18.9 mm | 15.60" | 1920x1080 | |
| 82.5 % v7 (old) | 09 / 2020 | Asus ROG Zephyrus M15 GU502L i7-10750H, GeForce RTX 2070 Max-Q | 2 kg | 18.9 mm | 15.60" | 3840x2160 | |
| 82.1 % v7 (old) | 09 / 2020 | HP Omen 15-ek0456ng i5-10300H, GeForce GTX 1660 Ti Mobile | 2.1 kg | 32 mm | 15.60" | 1920x1080 | |
| 82.1 % v7 (old) | 12 / 2020 | Gateway Creator Series 15.6 GWTN156-3BK i5-10300H, GeForce RTX 2060 Mobile | 2 kg | 19.9 mm | 15.60" | 1920x1080 | |
| 83.3 % v7 (old) | 07 / 2020 | Lenovo Legion 5 15IMH05H i5-10300H, GeForce RTX 2060 Mobile | 2.5 kg | 26.1 mm | 15.60" | 1920x1080 | |
| 83.2 % v7 (old) | 06 / 2020 | MSI GP65 10SFK-047US i7-10750H, GeForce RTX 2070 Mobile | 2.3 kg | 27.5 mm | 15.60" | 1920x1080 |
Gehäuse
Kommunikation
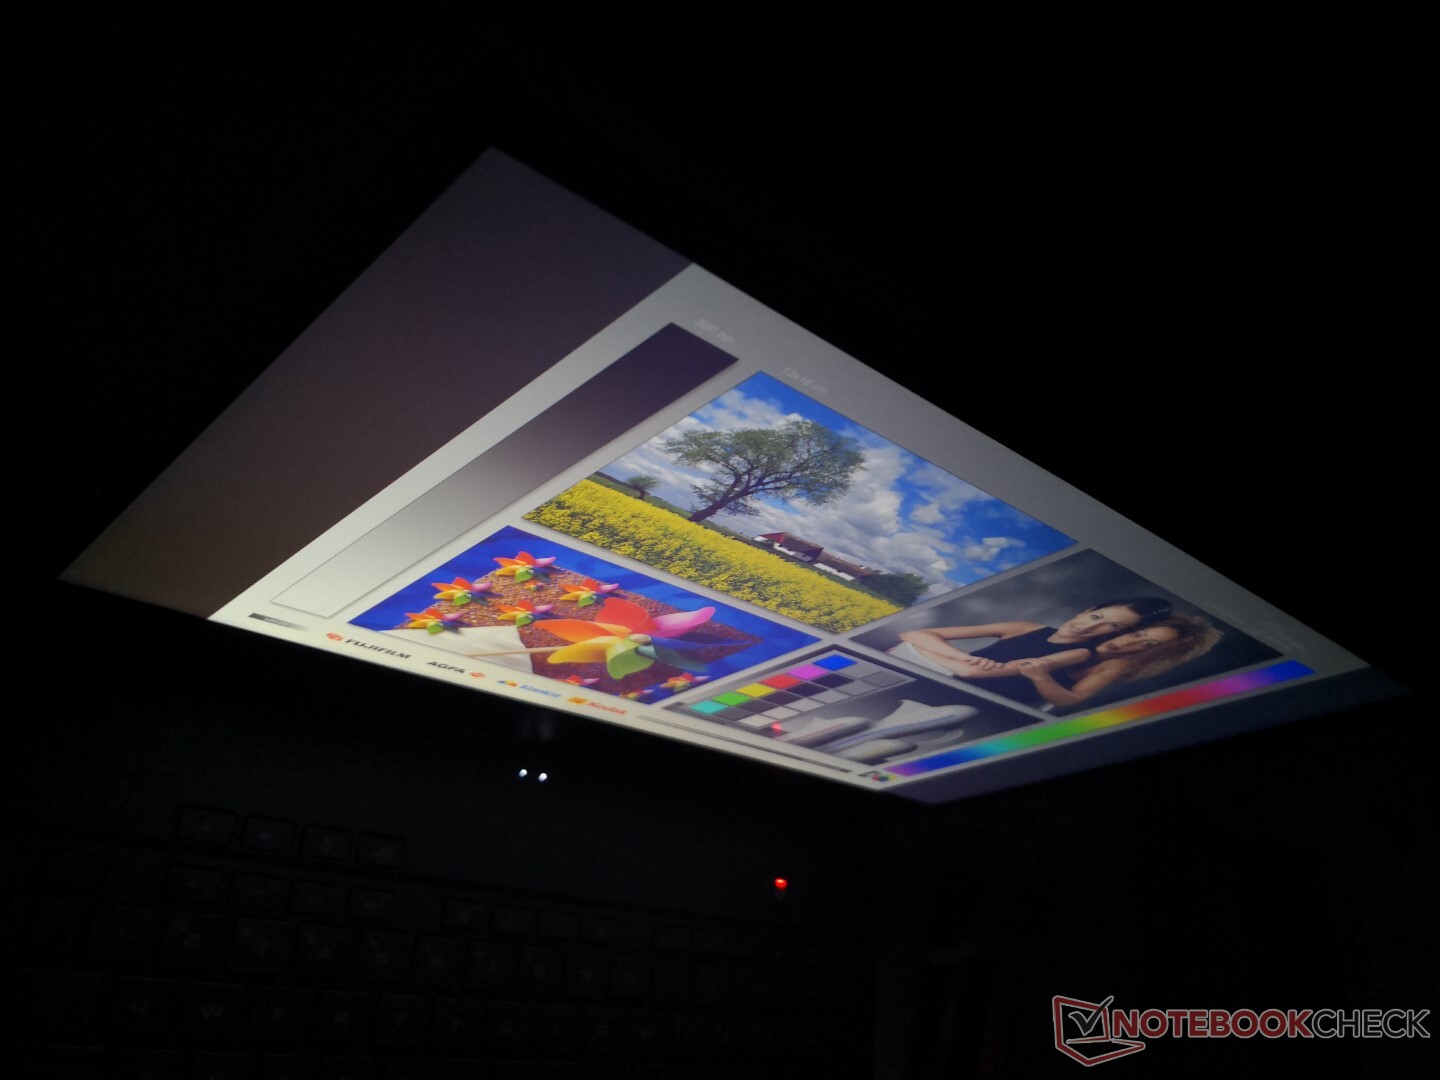
Display
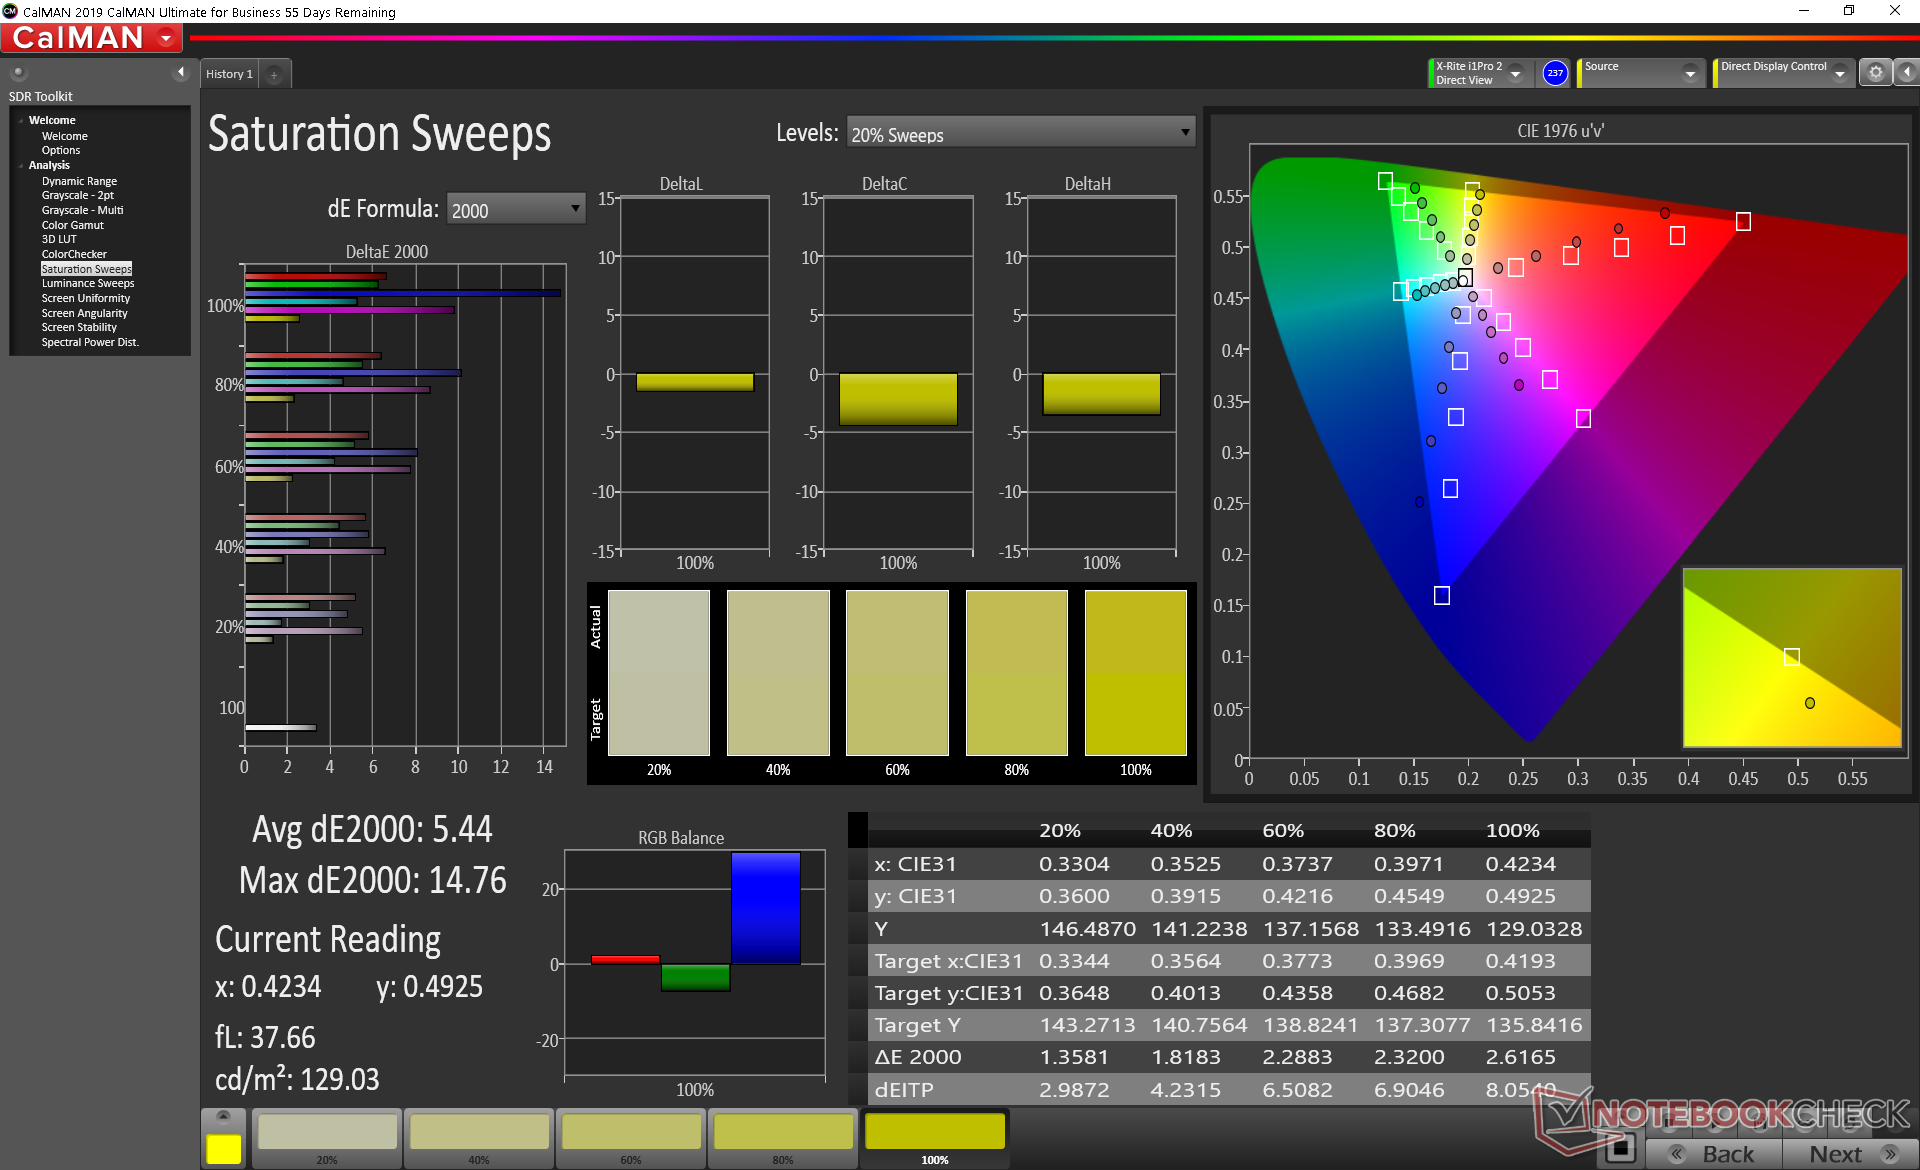
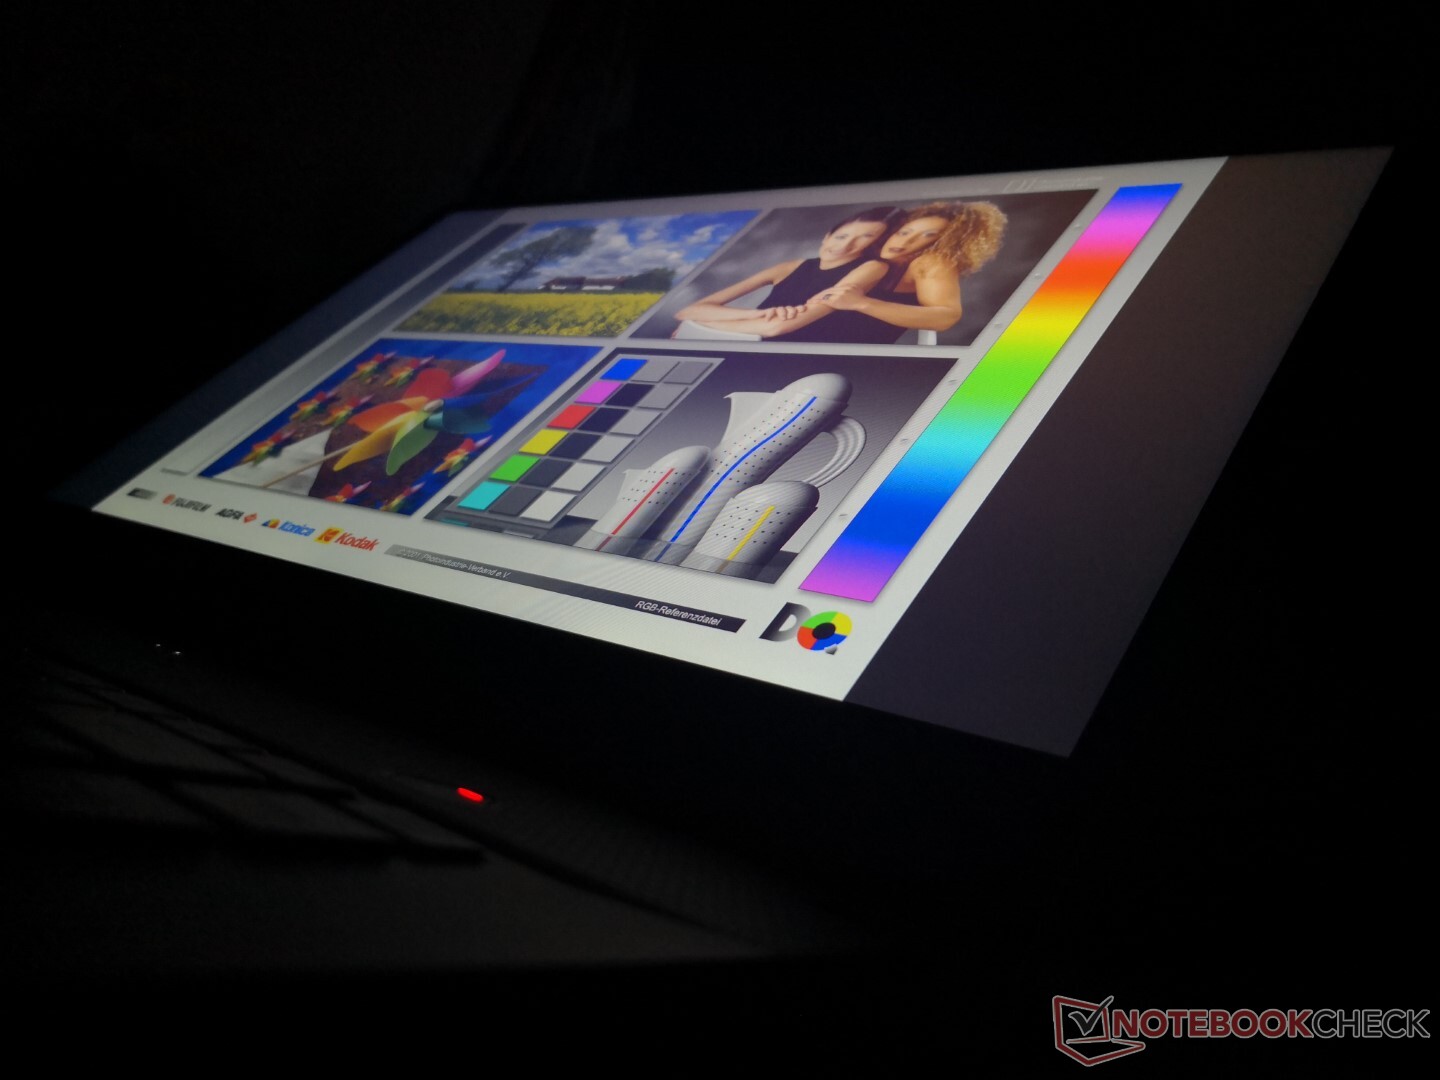
Während das GU502LW mit einem 60-Hz-4K-Panel ausgestattet ist, kommt das weniger teure GU502LU mit einem 144-Hz-1080p-Panel daher. Das Hauptproblem des Panda-Panels (LM156LF-2F01) ist, dass es im Gegensatz zu vielen LG- oder Philips-Panels nur sehr langsame Reaktionszeiten bietet und auch noch unter sichtbarem Ghosting leidet, was es für schnelle Actionspiele eher ungeeignet erscheinen lässt. Aber auch die anderen Werte wie Farben, Kontrast und Helligkeit sind eher schwach bis mittelmäßig, wie wir es mittlerweile leider von einem Panda-Panel erwarten.


| |||||||||||||||||||||||||
Ausleuchtung: 86 %
Helligkeit Akku: 282.5 cd/m²
Kontrast: 831:1 (Schwarzwert: 0.34 cd/m²)
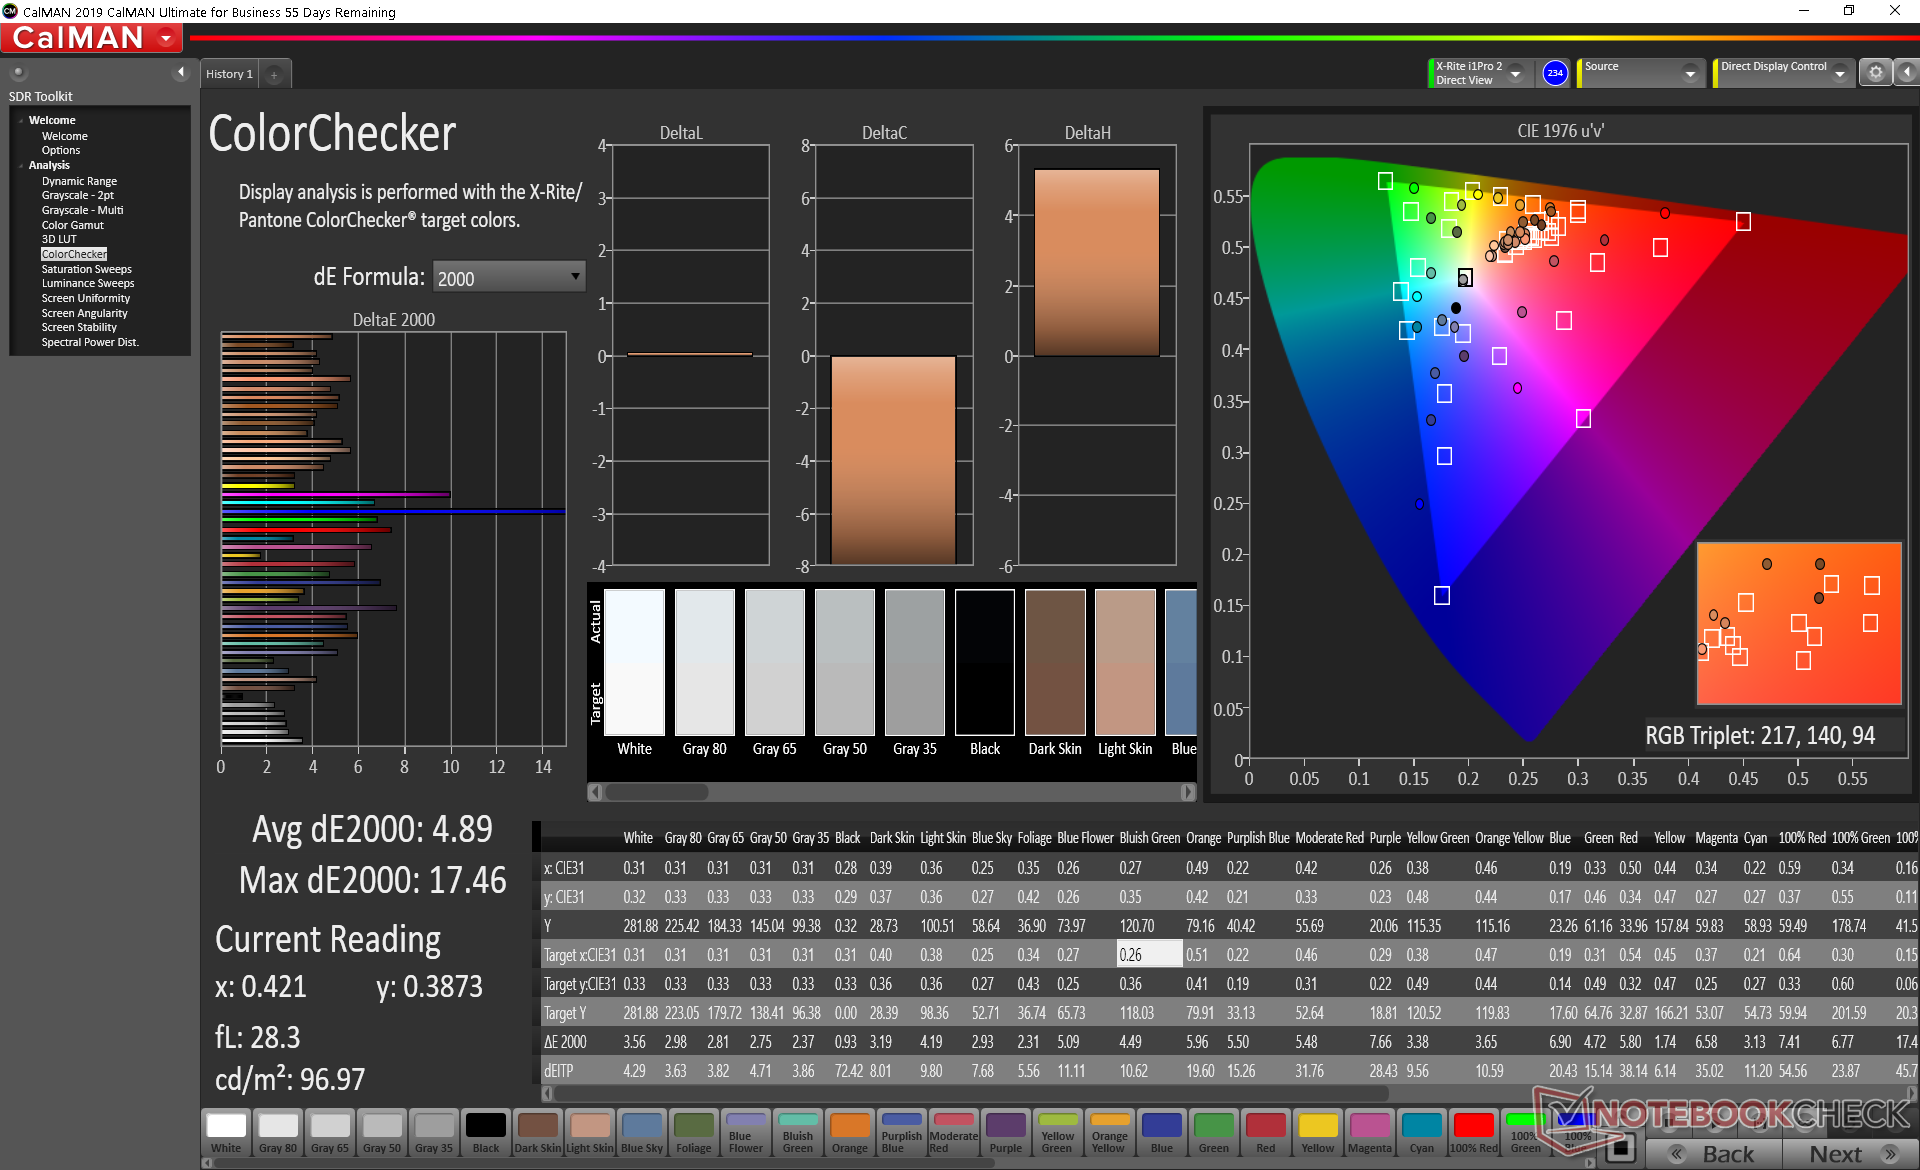
ΔE ColorChecker Calman: 4.89 | ∀{0.5-29.43 Ø4.73}
calibrated: 4.75
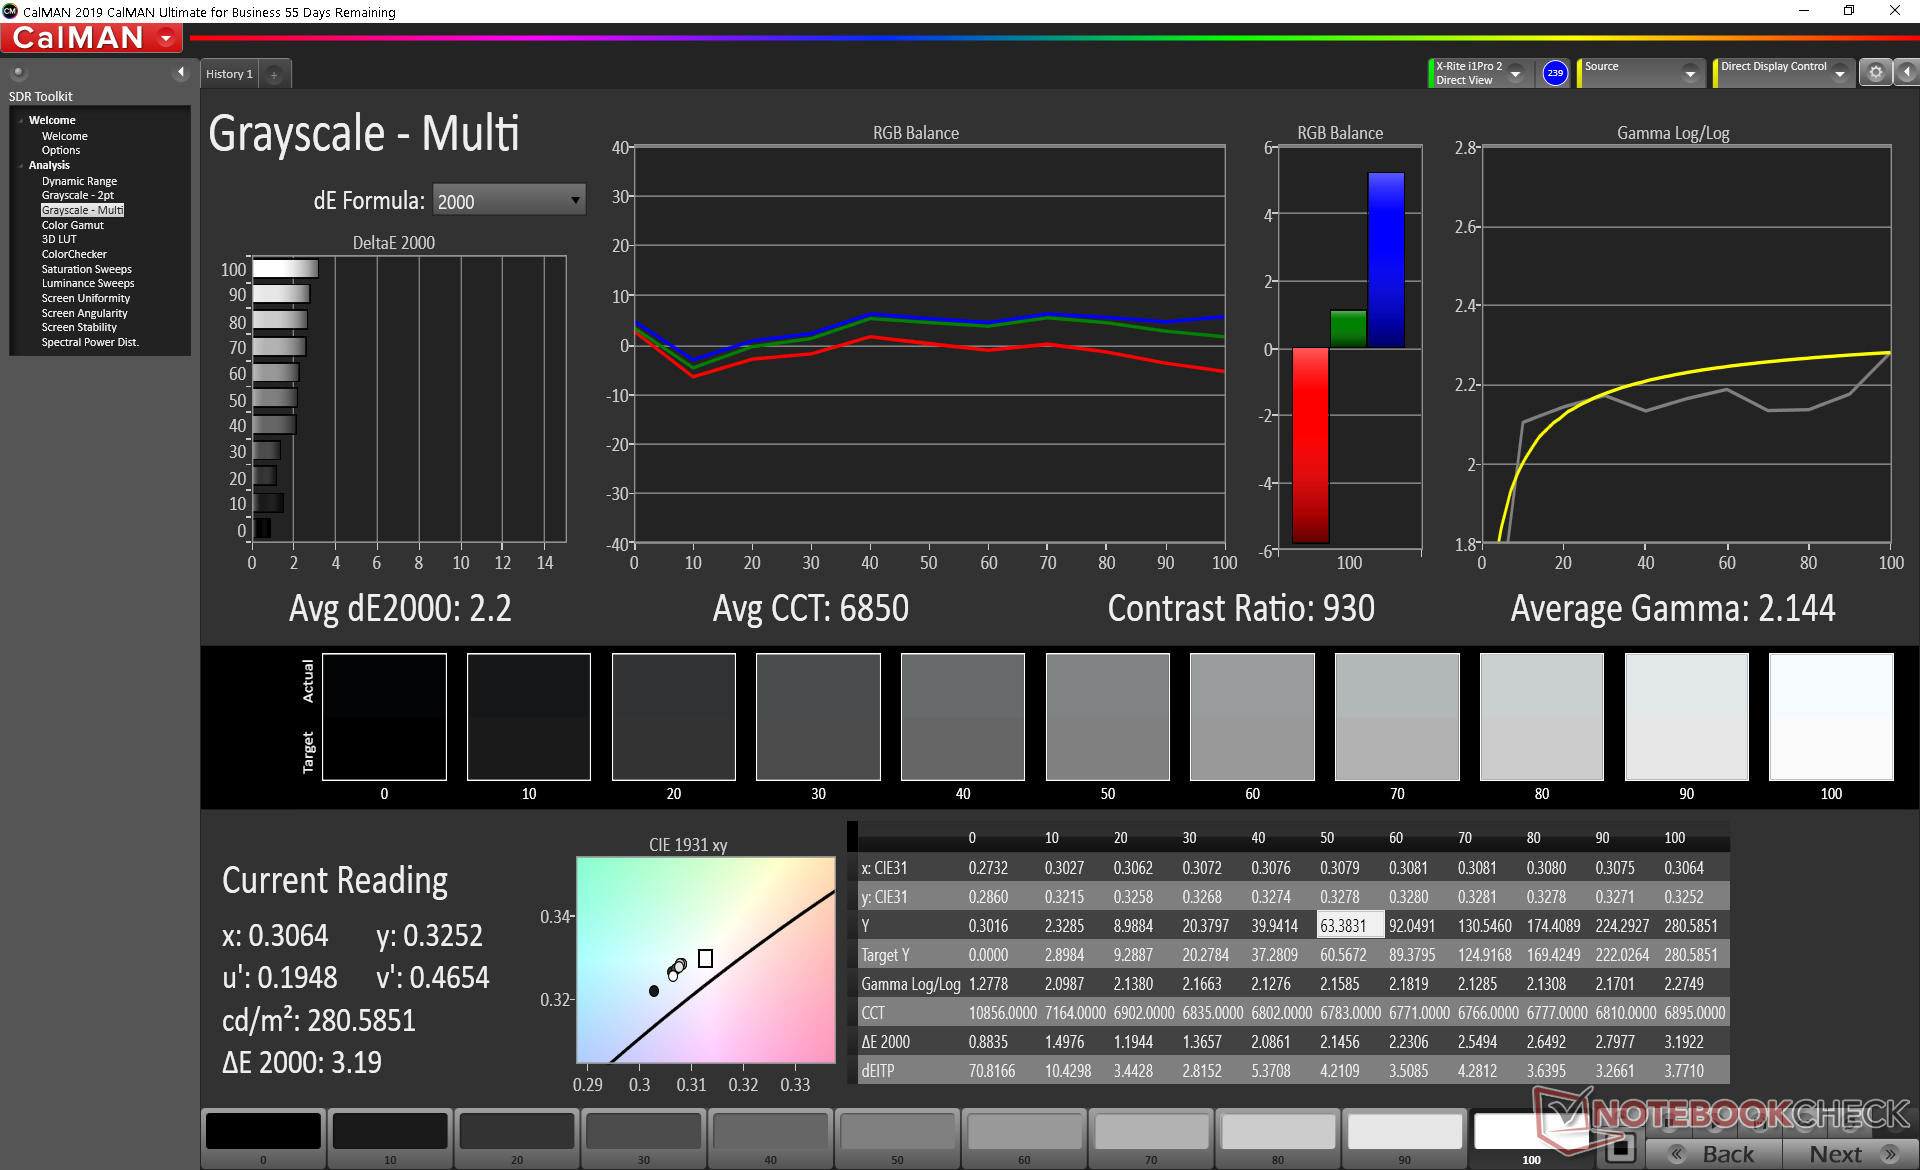
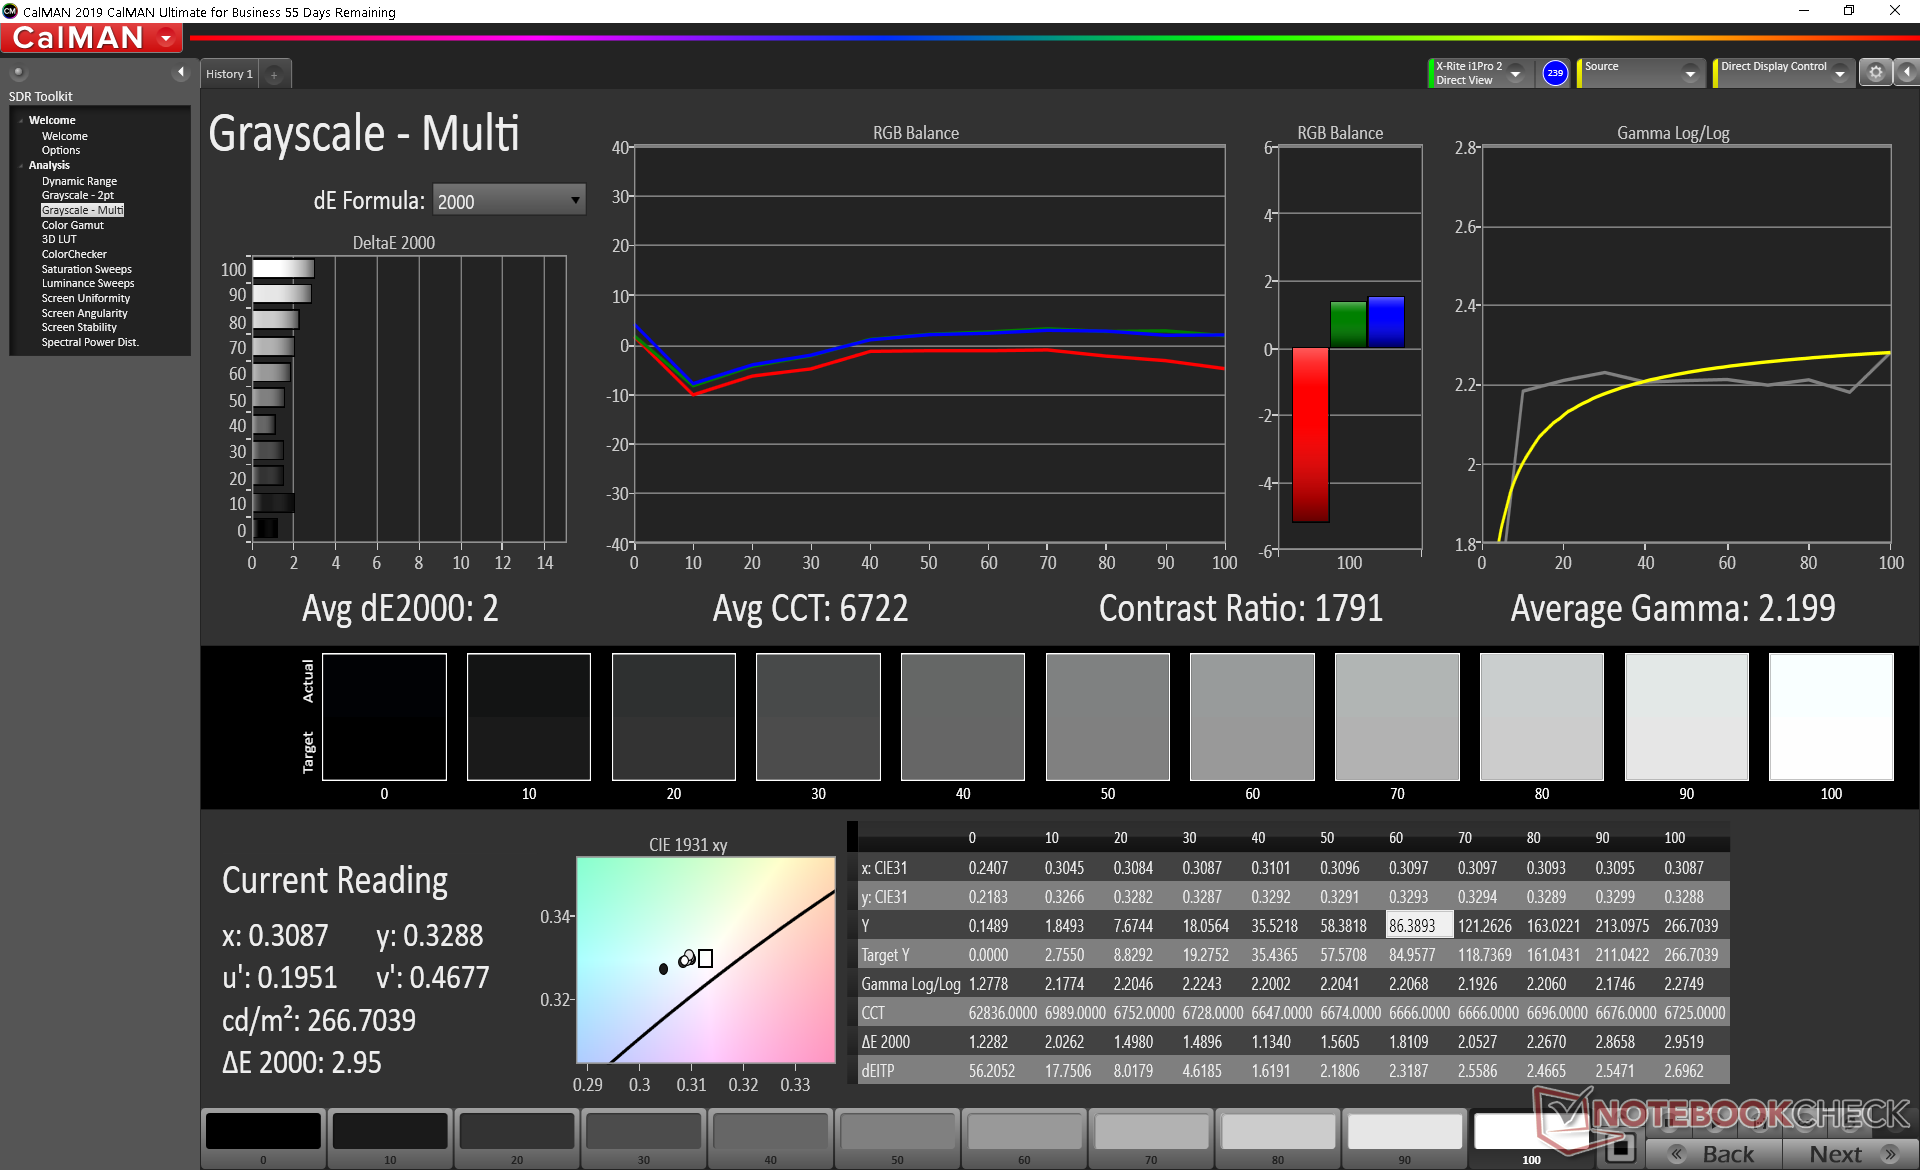
ΔE Greyscale Calman: 2.2 | ∀{0.09-98 Ø4.97}
58.5% sRGB (Argyll 1.6.3 3D)
37.2% AdobeRGB 1998 (Argyll 1.6.3 3D)
40.65% AdobeRGB 1998 (Argyll 3D)
59.1% sRGB (Argyll 3D)
39.32% Display P3 (Argyll 3D)
Gamma: 2.14
CCT: 6850 K
| Asus ROG Zephyrus M15 GU502LU-BI7N4 Panda LM156LF-2F01, IPS, 15.6", 1920x1080 | Asus ROG Zephyrus M15 GU502L AU Optronics B156ZAN03.1, IPS, 15.6", 3840x2160 | HP Omen 15-ek0456ng LGD05FE, IPS, 15.6", 1920x1080 | Gateway Creator Series 15.6 GWTN156-3BK BOE NV156FHM-NX1, IPS, 15.6", 1920x1080 | Lenovo Legion 5 15IMH05H BOE CQ NV156FHM-NX1, IPS, 15.6", 1920x1080 | MSI GP65 10SFK-047US LG Philips LP156WFG-SPB3, IPS, 15.6", 1920x1080 | |
|---|---|---|---|---|---|---|
| Display | 73% | 0% | -1% | 60% | ||
| Display P3 Coverage (%) | 39.32 | 69.4 77% | 39.86 1% | 38.8 -1% | 63.5 61% | |
| sRGB Coverage (%) | 59.1 | 99 68% | 58.4 -1% | 57.8 -2% | 94.4 60% | |
| AdobeRGB 1998 Coverage (%) | 40.65 | 70.5 73% | 41.18 1% | 40.09 -1% | 65.1 60% | |
| Response Times | -66% | 46% | -15% | 17% | 57% | |
| Response Time Grey 50% / Grey 80% * (ms) | 26 ? | 60 ? -131% | 17 ? 35% | 38.4 ? -48% | 26 ? -0% | 10.4 ? 60% |
| Response Time Black / White * (ms) | 25.6 ? | 25.6 ? -0% | 11 ? 57% | 20.8 ? 19% | 17 ? 34% | 12 ? 53% |
| PWM Frequency (Hz) | ||||||
| Bildschirm | 59% | 30% | -16% | 4% | 21% | |
| Helligkeit Bildmitte (cd/m²) | 282.5 | 387 37% | 314 11% | 296.3 5% | 301 7% | 384.9 36% |
| Brightness (cd/m²) | 260 | 377 45% | 293 13% | 284 9% | 277 7% | 358 38% |
| Brightness Distribution (%) | 86 | 90 5% | 87 1% | 84 -2% | 77 -10% | 87 1% |
| Schwarzwert * (cd/m²) | 0.34 | 0.23 32% | 0.22 35% | 0.38 -12% | 0.26 24% | 0.67 -97% |
| Kontrast (:1) | 831 | 1683 103% | 1427 72% | 780 -6% | 1158 39% | 574 -31% |
| Delta E Colorchecker * | 4.89 | 1.8 63% | 2.51 49% | 6.56 -34% | 5.12 -5% | 2.43 50% |
| Colorchecker dE 2000 max. * | 17.46 | 3.94 77% | 4.42 75% | 21.81 -25% | 8.86 49% | 4.58 74% |
| Colorchecker dE 2000 calibrated * | 4.75 | 0.7 85% | 1.71 64% | 5.34 -12% | 4.88 -3% | 2.03 57% |
| Delta E Graustufen * | 2.2 | 2.9 -32% | 3.26 -48% | 4.4 -100% | 3.47 -58% | 2.6 -18% |
| Gamma | 2.14 103% | 2.178 101% | 2.42 91% | 2.22 99% | 2.37 93% | 2.2 100% |
| CCT | 6850 95% | 6992 93% | 6150 106% | 6716 97% | 7062 92% | 6981 93% |
| Farbraum (Prozent von AdobeRGB 1998) (%) | 37.2 | 99 166% | 37.3 0% | 37 -1% | 59.7 60% | |
| Color Space (Percent of sRGB) (%) | 58.5 | 99 69% | 57.6 -2% | 57 -3% | 93.9 61% | |
| Durchschnitt gesamt (Programm / Settings) | 22% /
46% | 38% /
33% | -10% /
-13% | 7% /
5% | 46% /
33% |
* ... kleinere Werte sind besser
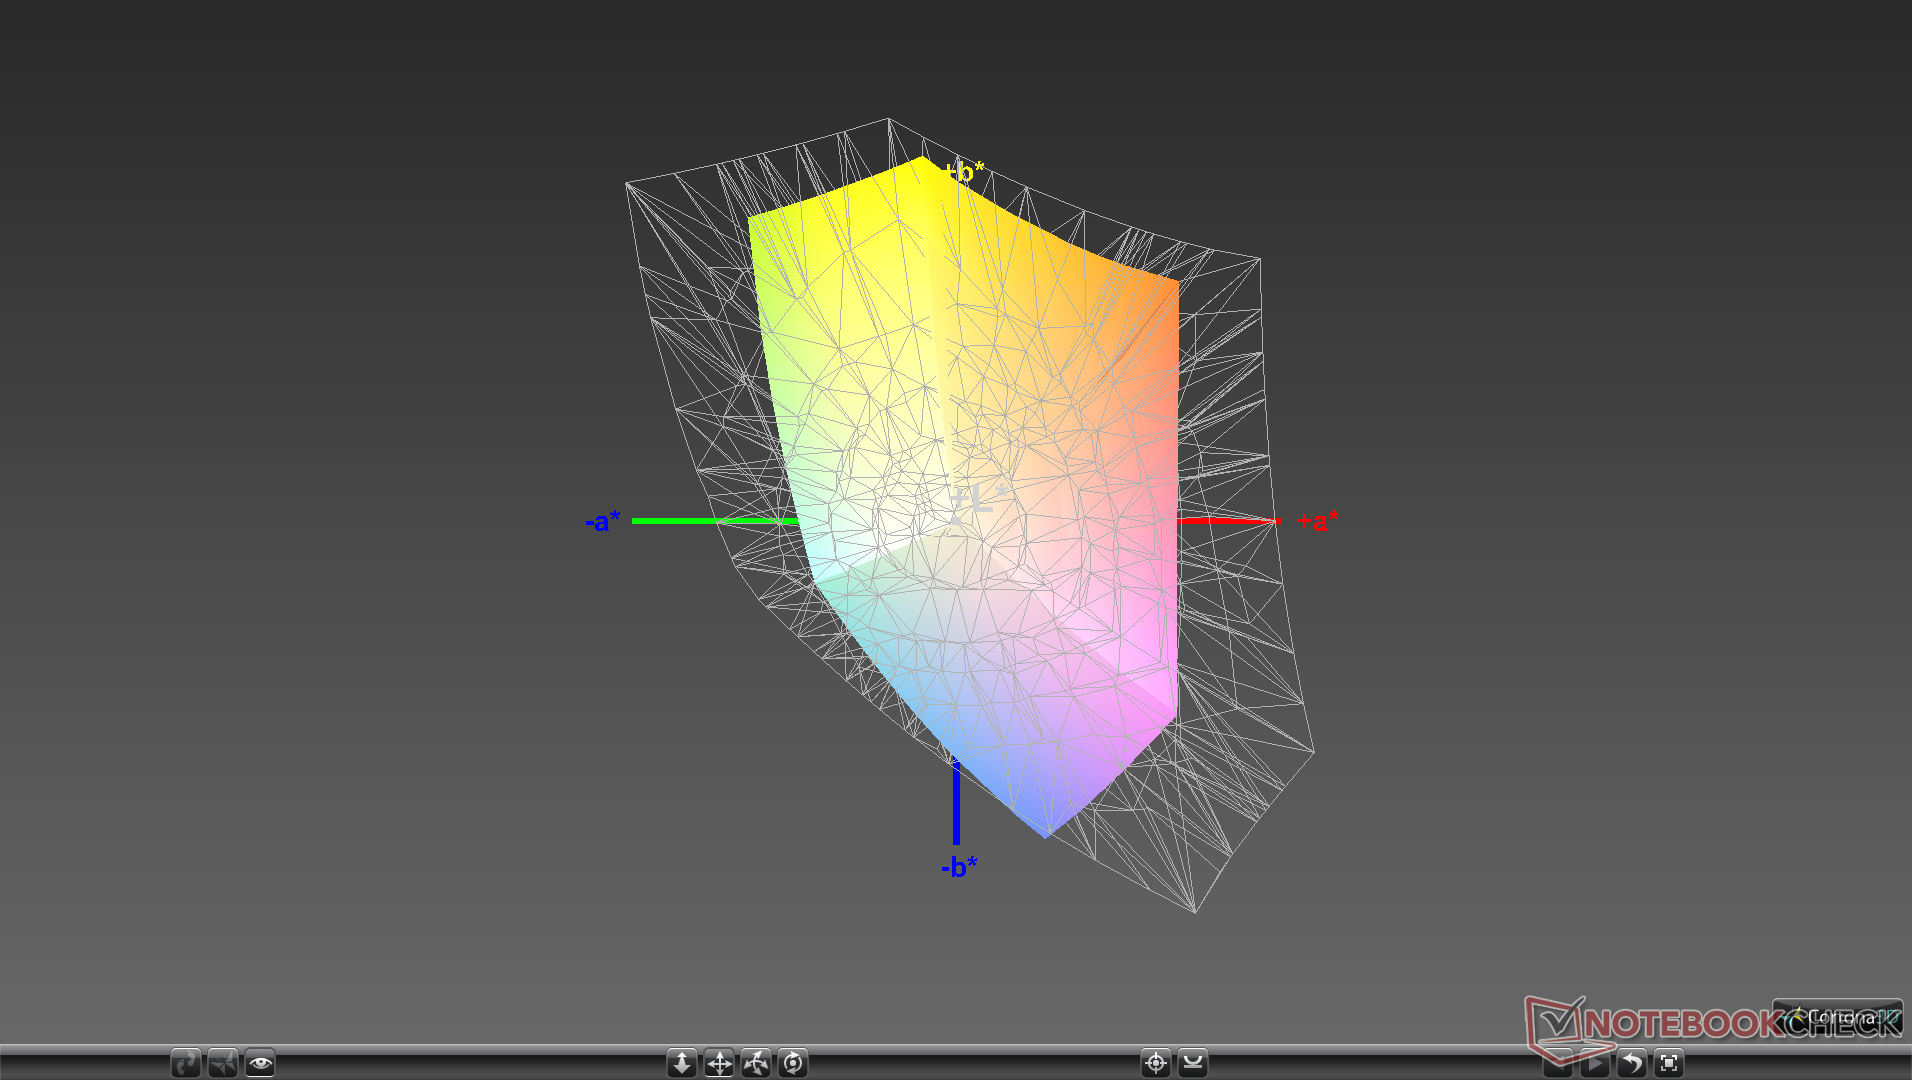
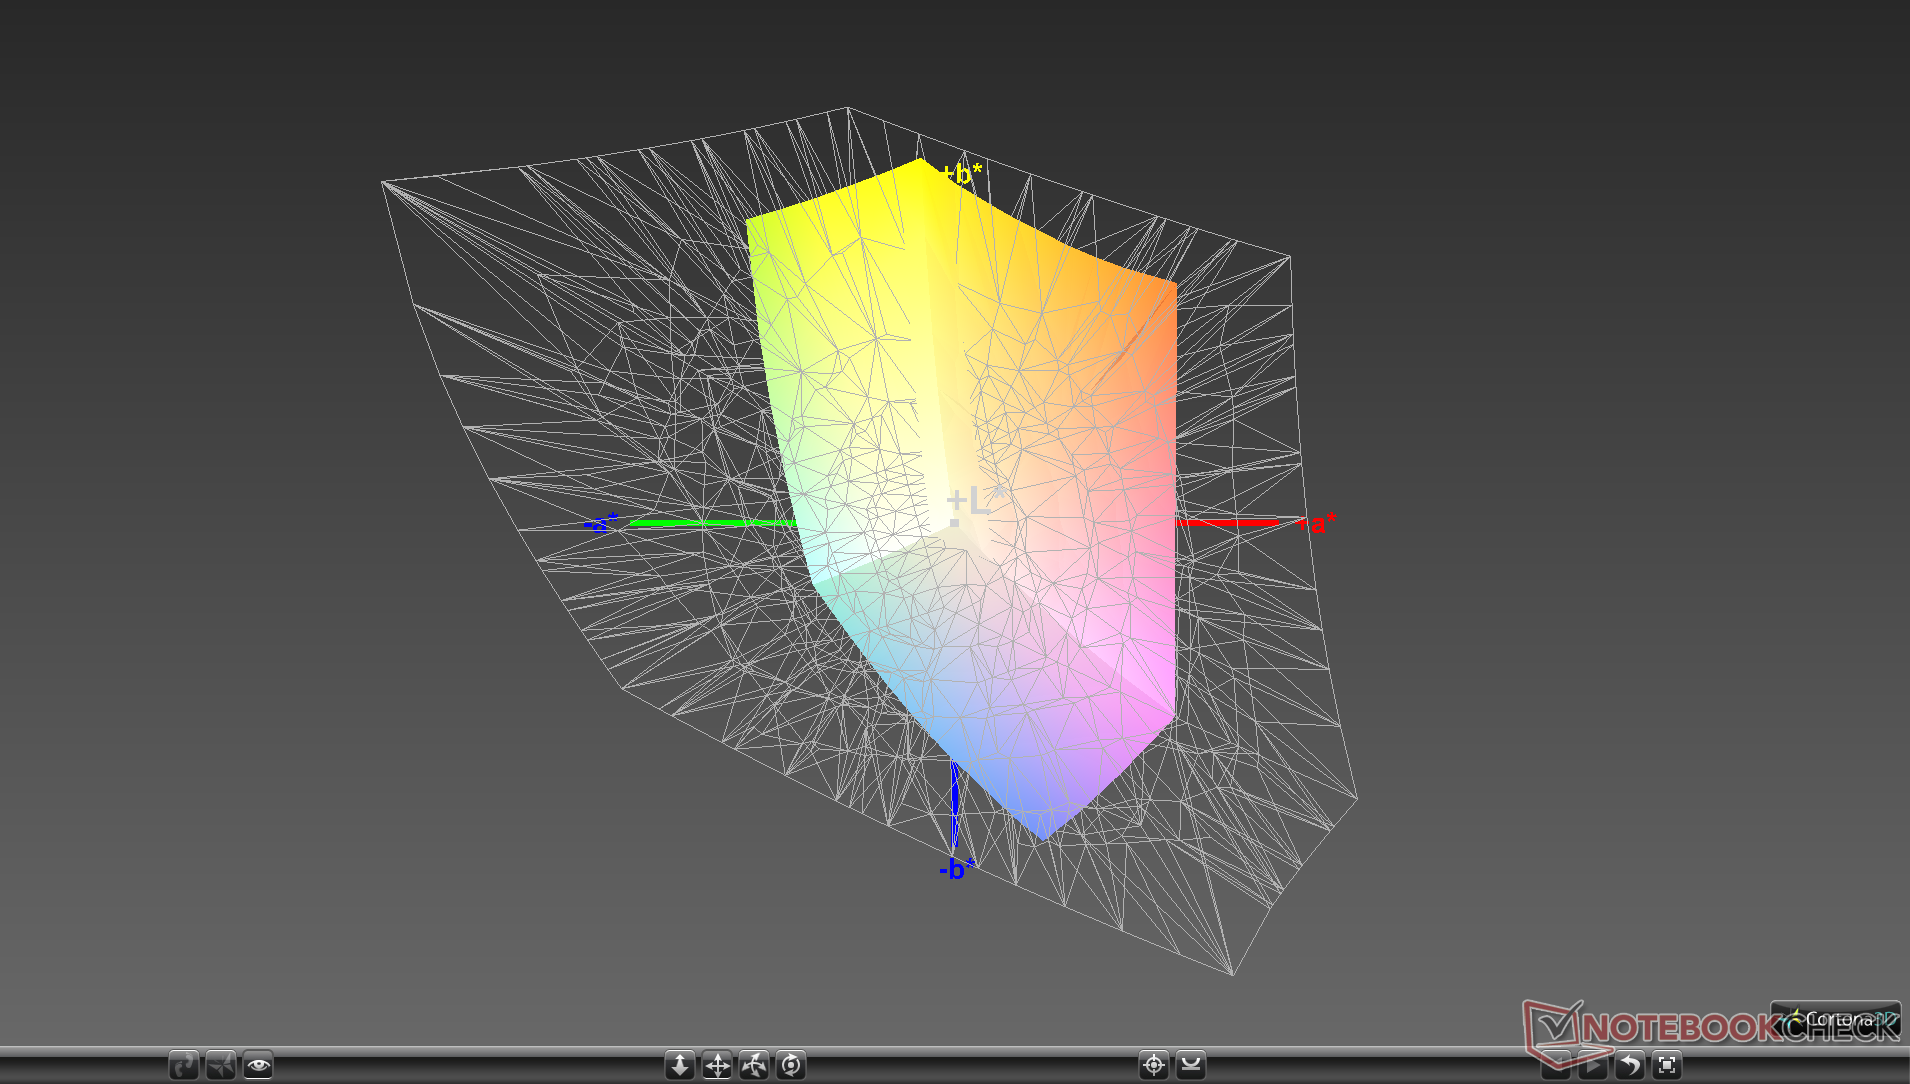
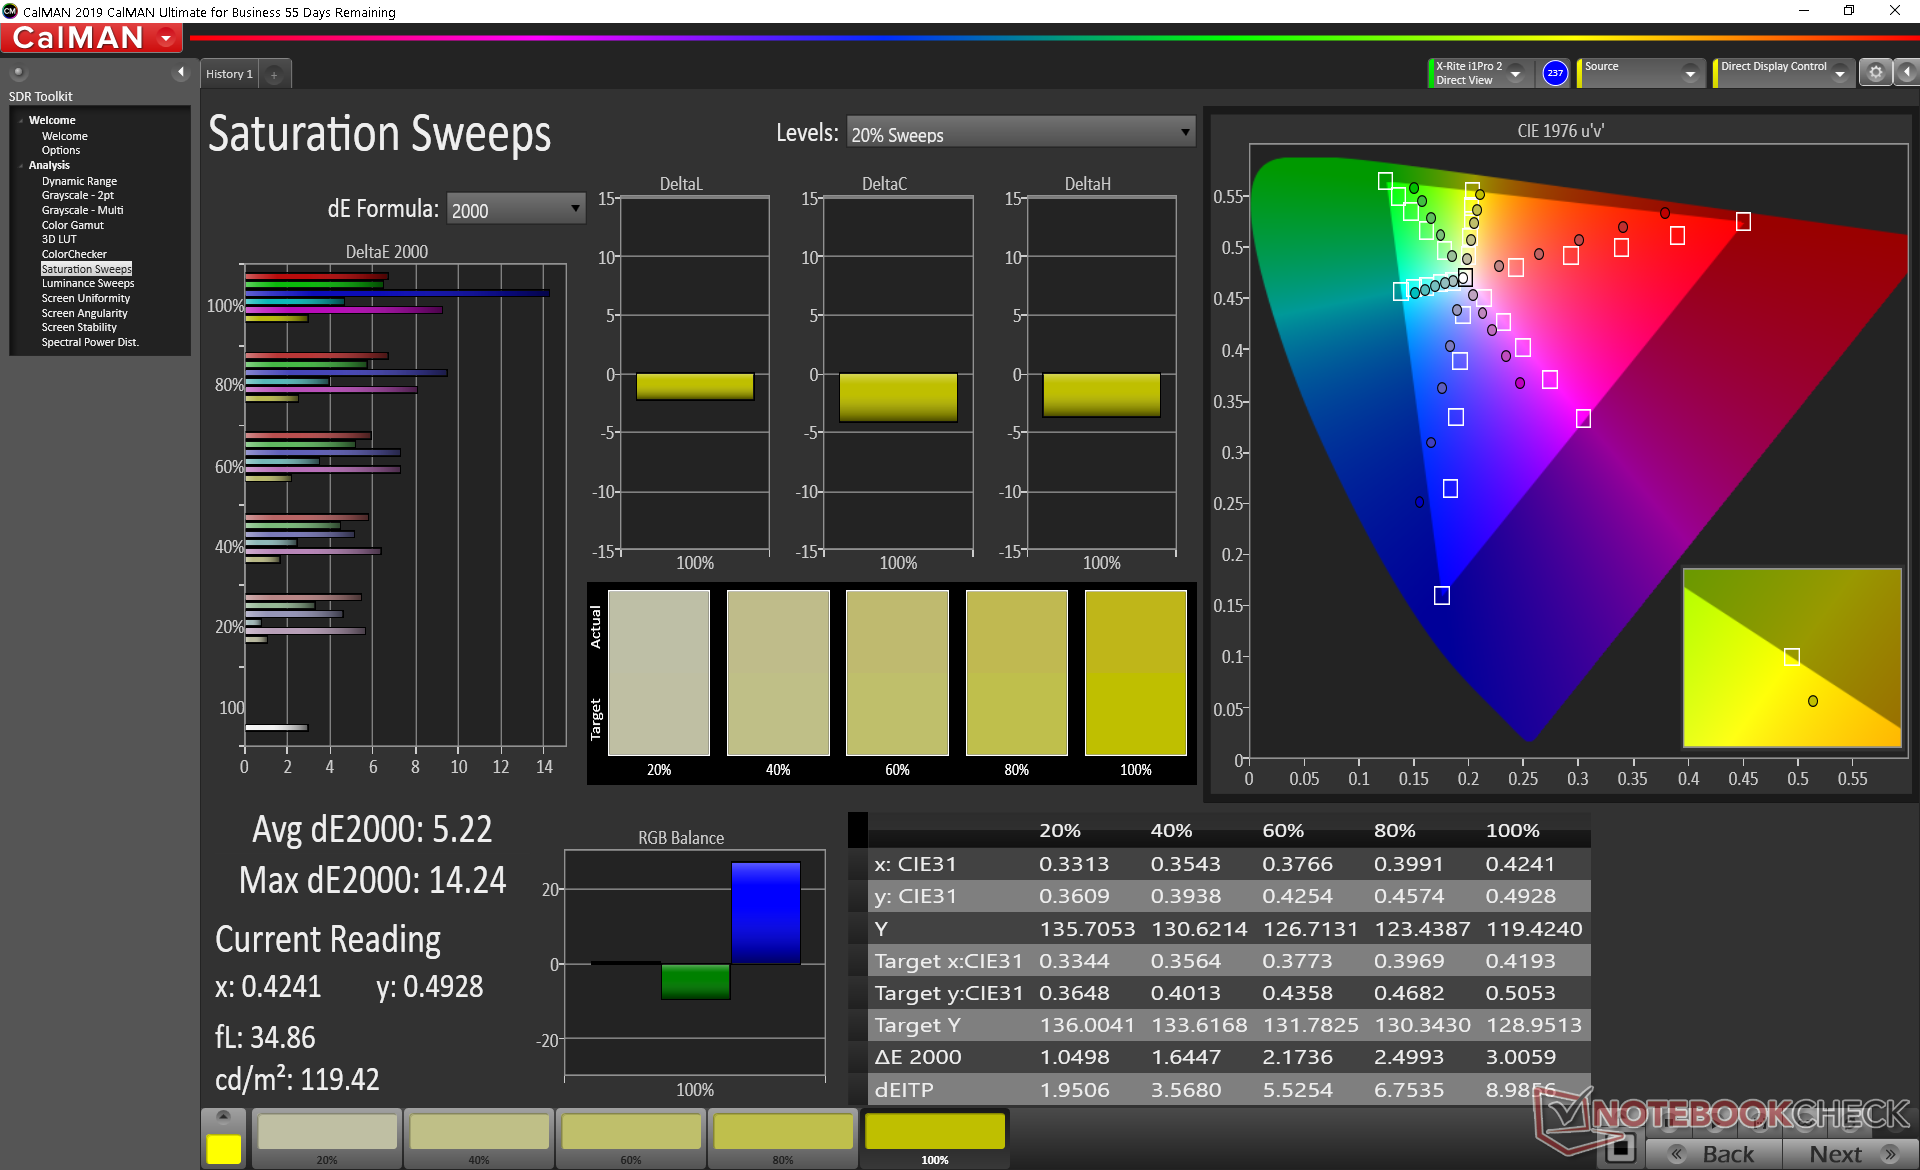
Mit Ausnahme der schwachen Farbraumabdeckung (nur 59 Prozent sRGB) ist das Display ab Werk recht gut kalibriert. Die Farbgenauigkeit bleibt unter höherer Sättigung suboptimal.

Reaktionszeiten (Response Times) des Displays
| ↔ Reaktionszeiten Schwarz zu Weiß | ||
|---|---|---|
| 25.6 ms ... steigend ↗ und fallend ↘ kombiniert | ↗ 14.8 ms steigend | 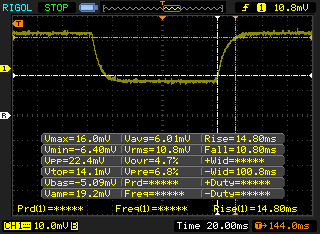 |
| ↘ 10.8 ms fallend | ||
| Die gemessenen Reaktionszeiten sind mittelmäßig und dadurch für Spieler eventuell zu langsam. Im Vergleich rangierten die bei uns getesteten Geräte von 0.1 (Minimum) zu 240 (Maximum) ms. » 61 % aller Screens waren schneller als der getestete. Daher sind die gemessenen Reaktionszeiten schlechter als der Durchschnitt aller vermessenen Geräte (19.9 ms). | ||
| ↔ Reaktionszeiten 50% Grau zu 80% Grau | ||
| 26 ms ... steigend ↗ und fallend ↘ kombiniert | ↗ 11.2 ms steigend | 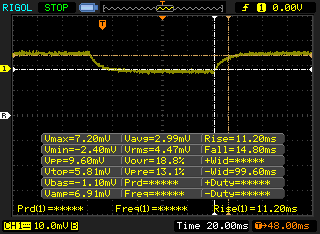 |
| ↘ 14.8 ms fallend | ||
| Die gemessenen Reaktionszeiten sind mittelmäßig und dadurch für Spieler eventuell zu langsam. Im Vergleich rangierten die bei uns getesteten Geräte von 0.165 (Minimum) zu 636 (Maximum) ms. » 36 % aller Screens waren schneller als der getestete. Daher sind die gemessenen Reaktionszeiten besser als der Durchschnitt aller vermessenen Geräte (31.1 ms). | ||
Bildschirm-Flackern / PWM (Pulse-Width Modulation)
| Flackern / PWM nicht festgestellt | 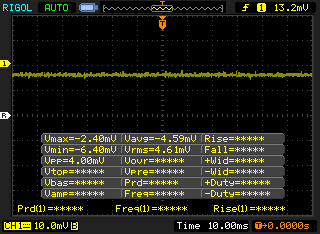 | ||
Im Vergleich: 52 % aller getesteten Geräte nutzten kein PWM um die Helligkeit zu reduzieren. Wenn PWM eingesetzt wurde, dann bei einer Frequenz von durchschnittlich 7788 (Minimum 5, Maximum 343500) Hz. | |||

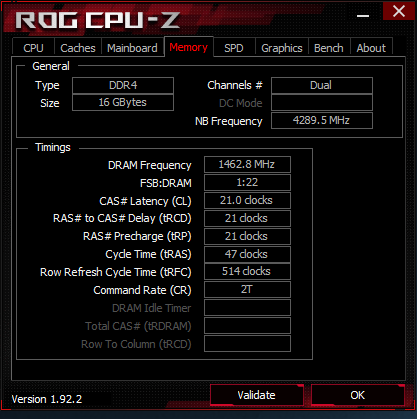
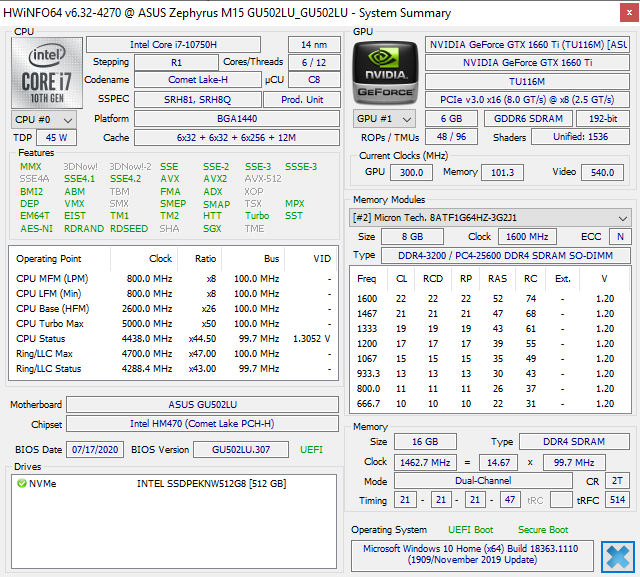
Leistung
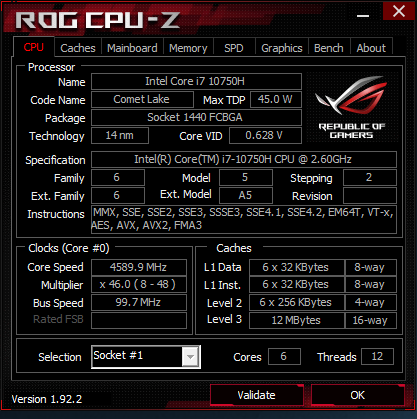
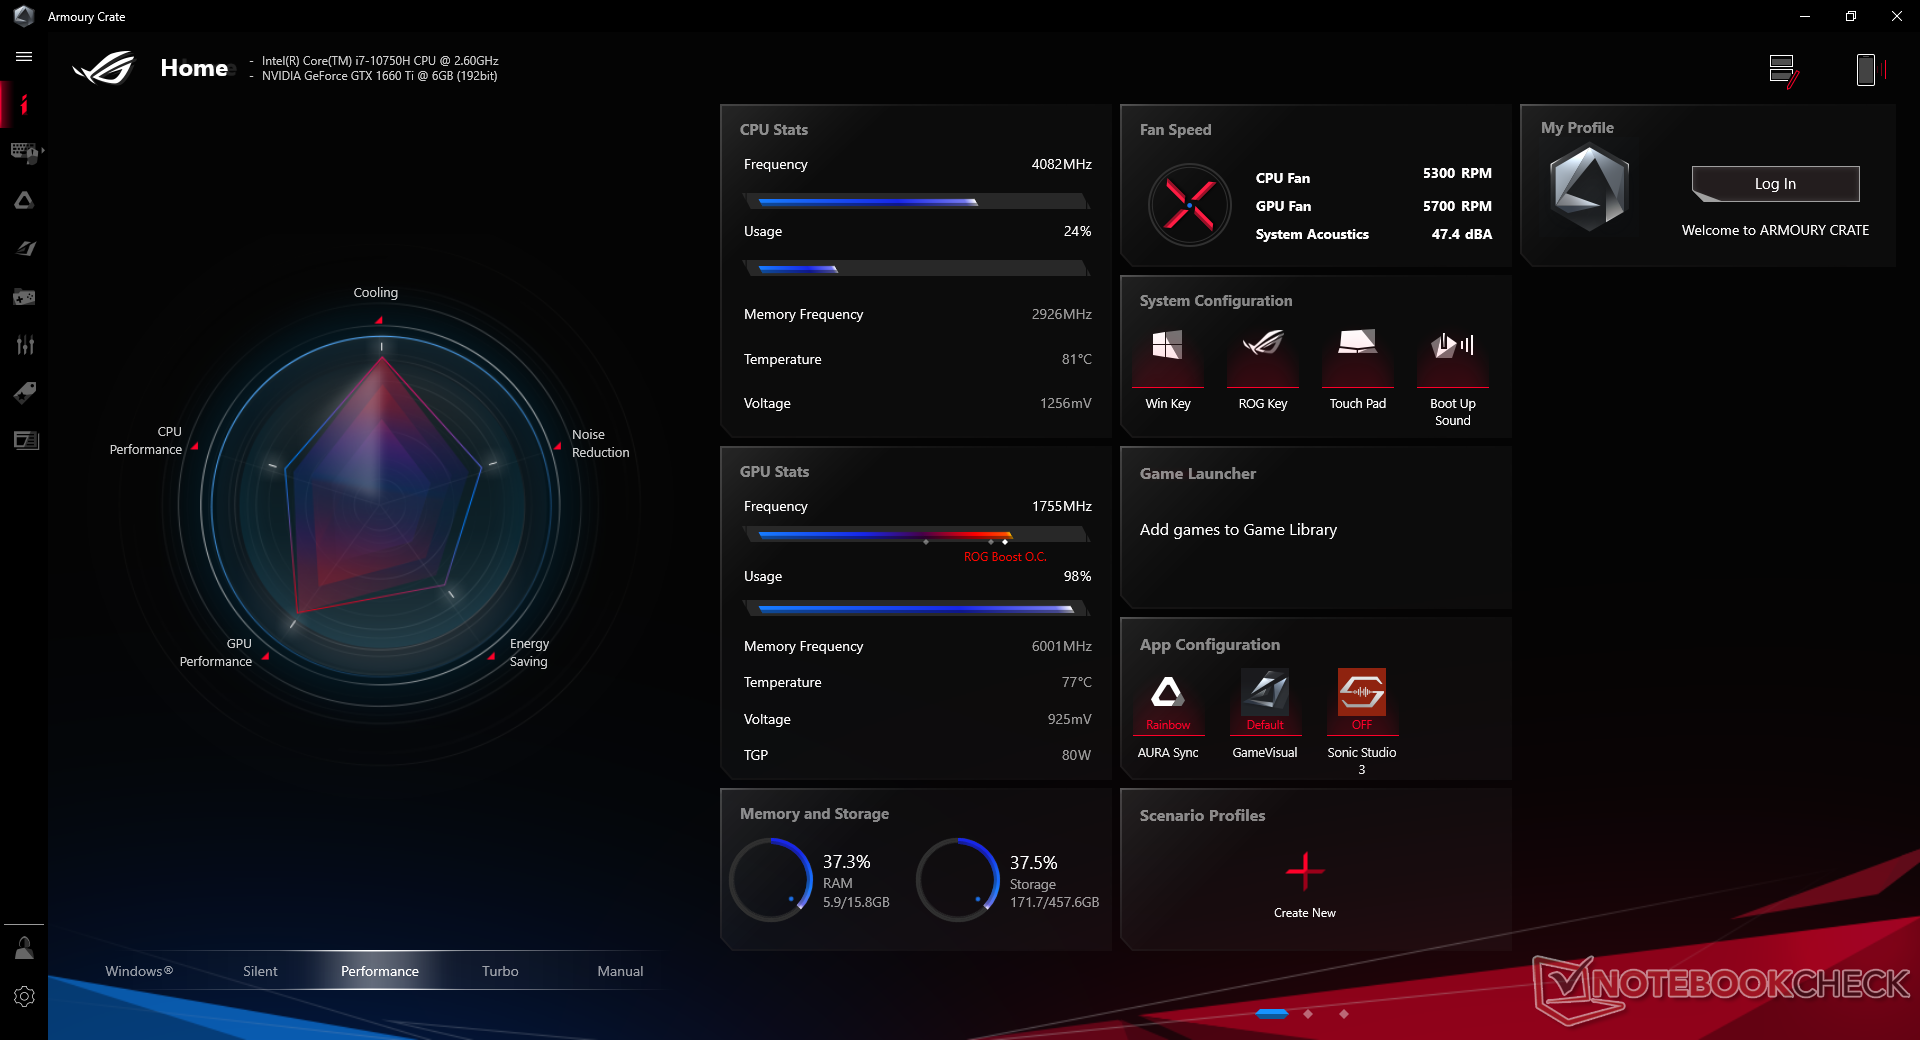
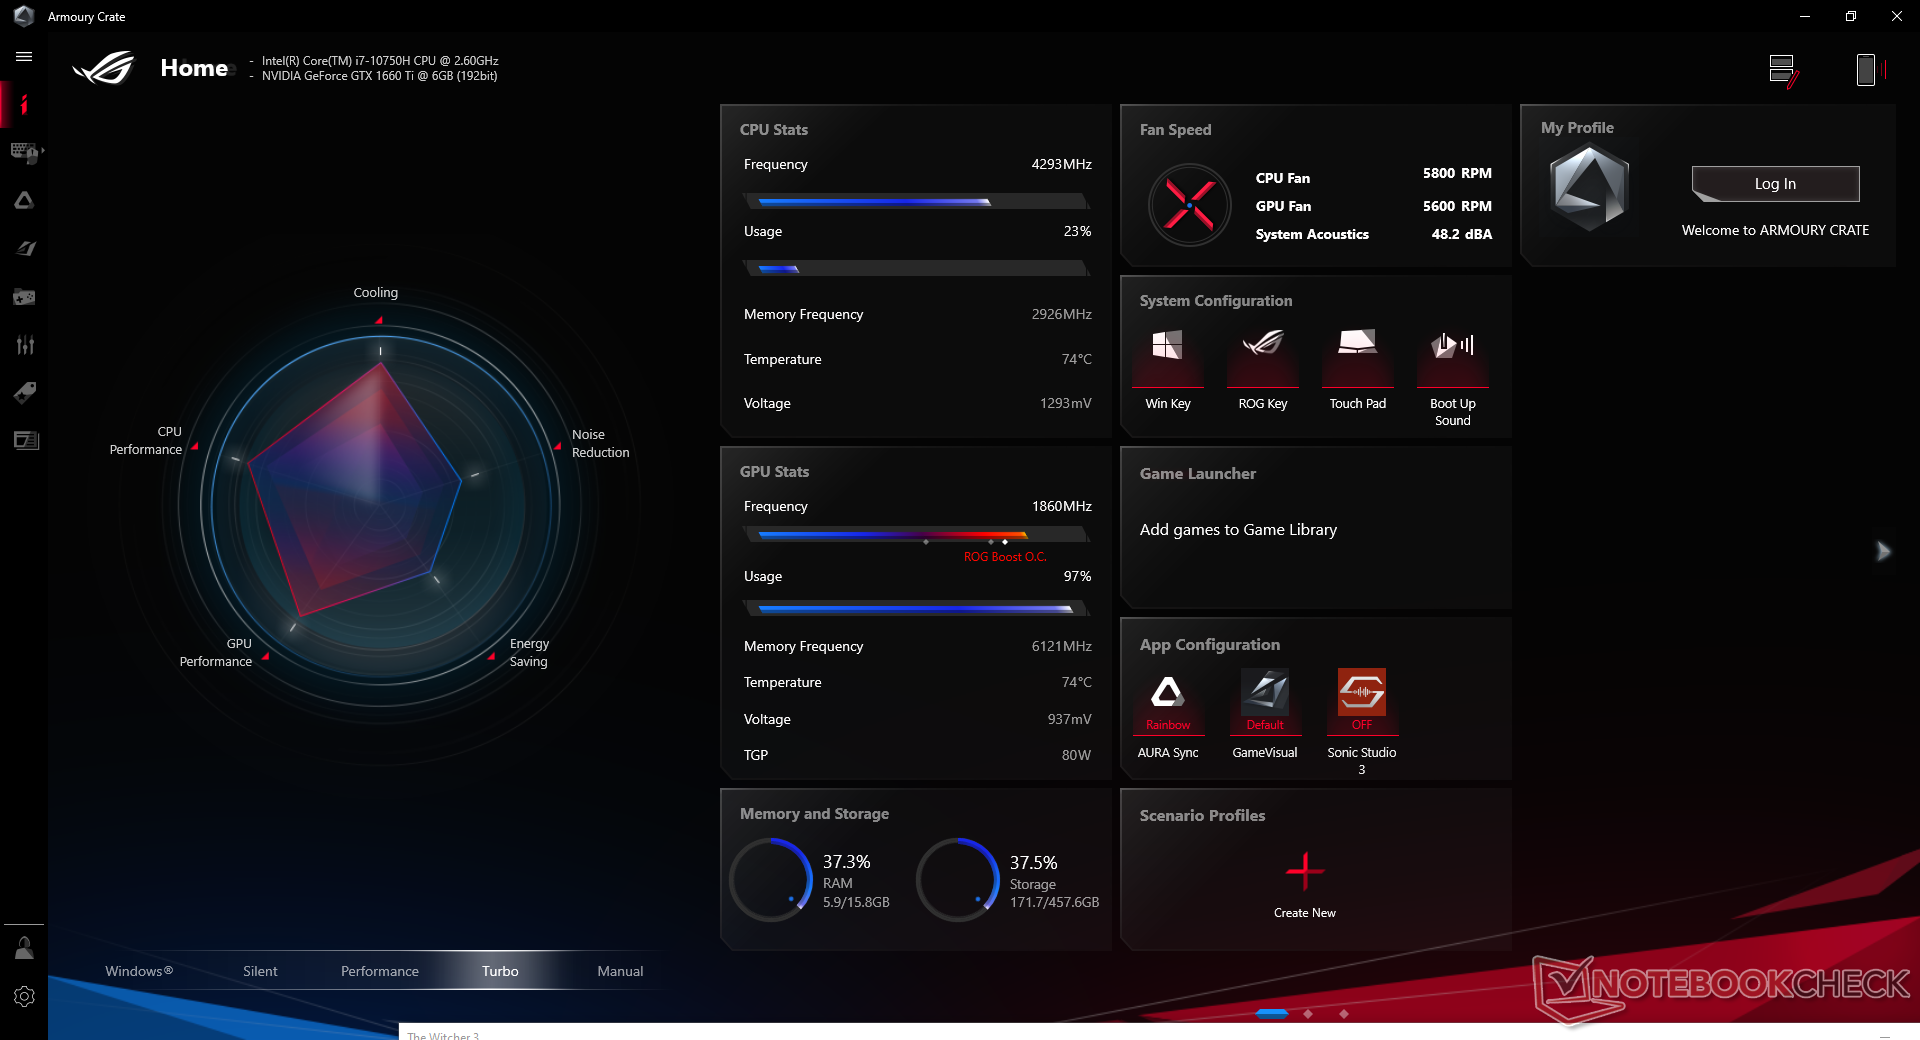
Auch wenn sich GPU und das Display unterscheiden, ist im GU502LU der gleiche Core i7-10750H verbaut wie im GU502LW. Dennoch kann sich die CPU-Leistung voneinander unterscheiden, das hängt auch vom eingestellten Leistungsprofil im Armoury Crate ab. Wir haben deshalb alle Leistungsbenchmarks im Turbo-Modus durchgeführt.

Prozessor
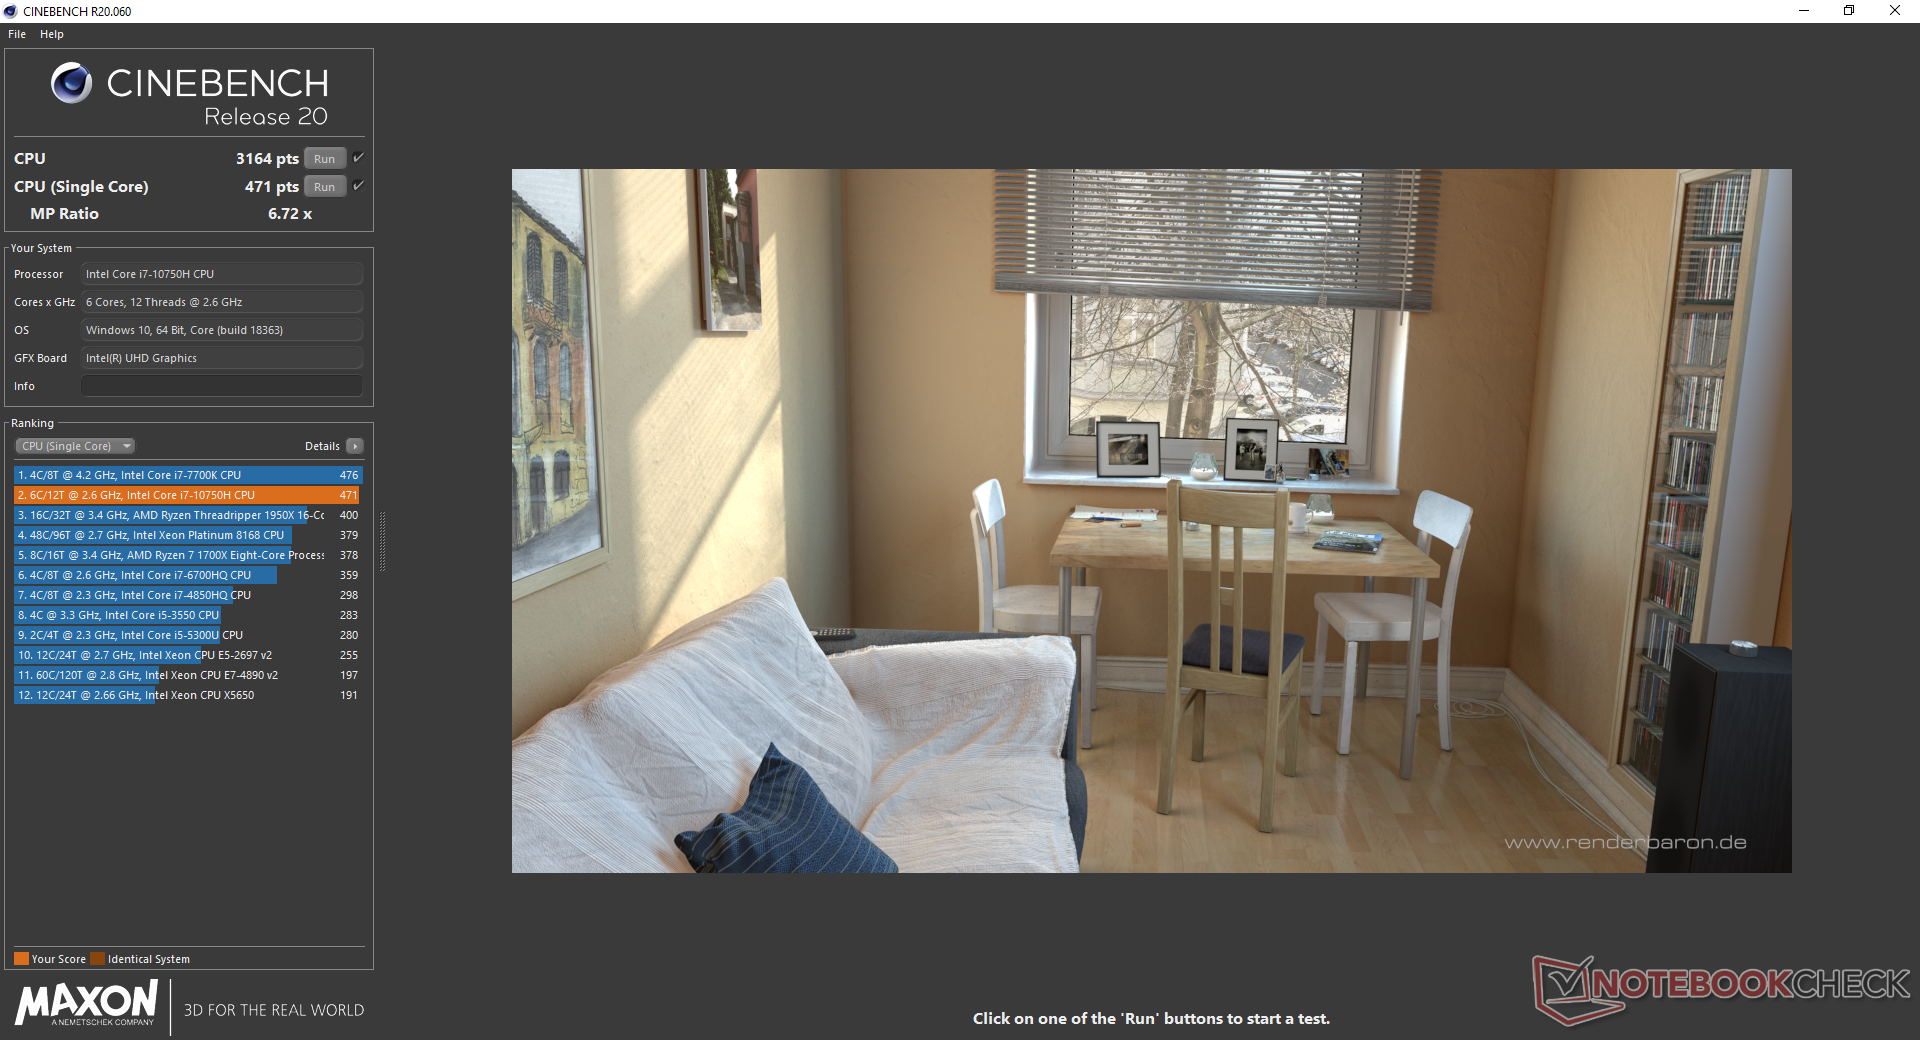
Die Stabilität des Turbo-Boosts hat sich verbessert, wie unsere CineBench-R15-Multi-Thread-Schleife zeigt, zumindest wenn man den Turbo-Modus aktiviert. Im Performance-Modus brach die Leistung über die Zeit noch um 9 Prozent ein. Die reine CPU-Leistung entspricht in etwa der des preiswerteren Ryzen 5 4600H.
Im Akkumodus fällt die Prozessorleistung von 3164 auf 2528 Punkte im CineBench R20. Zu beachten ist hier allerdings, dass der Turbo-Modus abseits der Steckdose automatisch deaktiviert wird.


Cinebench R15: CPU Multi 64Bit | CPU Single 64Bit
Blender: v2.79 BMW27 CPU
7-Zip 18.03: 7z b 4 -mmt1 | 7z b 4
Geekbench 5.5: Single-Core | Multi-Core
HWBOT x265 Benchmark v2.2: 4k Preset
LibreOffice : 20 Documents To PDF
R Benchmark 2.5: Overall mean
| Cinebench R20 / CPU (Multi Core) | |
| MSI GT76 Titan DT 10SGS | |
| MSI Bravo 15 A4DCR | |
| Asus Zephyrus S15 GX502L | |
| Asus ROG Strix Scar 15 G532LWS | |
| Asus ROG Zephyrus G15 GA502IU-ES76 | |
| Eurocom Nightsky RX15 | |
| MSI GE65 Raider 9SF-049US | |
| HP Pavilion Gaming 15-ec1206ng | |
| Asus ROG Zephyrus M15 GU502LU-BI7N4 | |
| Durchschnittliche Intel Core i7-10750H (1749 - 3325, n=43) | |
| Schenker XMG Pro 15 | |
| Cinebench R20 / CPU (Single Core) | |
| MSI GT76 Titan DT 10SGS | |
| Asus ROG Strix Scar 15 G532LWS | |
| Asus ROG Zephyrus G15 GA502IU-ES76 | |
| Eurocom Nightsky RX15 | |
| MSI Bravo 15 A4DCR | |
| MSI GE65 Raider 9SF-049US | |
| Durchschnittliche Intel Core i7-10750H (431 - 504, n=43) | |
| Asus Zephyrus S15 GX502L | |
| Asus ROG Zephyrus M15 GU502LU-BI7N4 | |
| HP Pavilion Gaming 15-ec1206ng | |
| Schenker XMG Pro 15 | |
| Cinebench R15 / CPU Multi 64Bit | |
| MSI GT76 Titan DT 10SGS | |
| Eurocom Nightsky RX15 | |
| MSI Bravo 15 A4DCR | |
| Asus ROG Strix Scar 15 G532LWS | |
| Asus Zephyrus S15 GX502L | |
| Asus ROG Zephyrus G15 GA502IU-ES76 | |
| MSI GE65 Raider 9SF-049US | |
| HP Pavilion Gaming 15-ec1206ng | |
| Asus ROG Zephyrus M15 GU502LU-BI7N4 | |
| Durchschnittliche Intel Core i7-10750H (804 - 1418, n=50) | |
| Schenker XMG Pro 15 | |
| Cinebench R15 / CPU Single 64Bit | |
| Asus ROG Strix Scar 15 G532LWS | |
| MSI GT76 Titan DT 10SGS | |
| Eurocom Nightsky RX15 | |
| MSI GE65 Raider 9SF-049US | |
| Durchschnittliche Intel Core i7-10750H (184 - 213, n=45) | |
| Asus Zephyrus S15 GX502L | |
| Asus ROG Zephyrus M15 GU502LU-BI7N4 | |
| MSI Bravo 15 A4DCR | |
| Asus ROG Zephyrus G15 GA502IU-ES76 | |
| HP Pavilion Gaming 15-ec1206ng | |
| Schenker XMG Pro 15 | |
| Blender / v2.79 BMW27 CPU | |
| Eurocom Nightsky RX15 | |
| Schenker XMG Pro 15 | |
| Durchschnittliche Intel Core i7-10750H (322 - 587, n=43) | |
| HP Pavilion Gaming 15-ec1206ng | |
| Asus ROG Zephyrus M15 GU502LU-BI7N4 | |
| MSI Bravo 15 A4DCR | |
| Asus ROG Zephyrus G15 GA502IU-ES76 | |
| Asus ROG Strix Scar 15 G532LWS | |
| Asus Zephyrus S15 GX502L | |
| MSI GT76 Titan DT 10SGS | |
| 7-Zip 18.03 / 7z b 4 -mmt1 | |
| Asus ROG Strix Scar 15 G532LWS | |
| Eurocom Nightsky RX15 | |
| MSI GT76 Titan DT 10SGS | |
| Asus Zephyrus S15 GX502L | |
| Durchschnittliche Intel Core i7-10750H (4504 - 5470, n=43) | |
| Asus ROG Zephyrus M15 GU502LU-BI7N4 | |
| Asus ROG Zephyrus G15 GA502IU-ES76 | |
| Schenker XMG Pro 15 | |
| MSI Bravo 15 A4DCR | |
| HP Pavilion Gaming 15-ec1206ng | |
| Geekbench 5.5 / Single-Core | |
| Asus ROG Strix Scar 15 G532LWS | |
| MSI GT76 Titan DT 10SGS | |
| Durchschnittliche Intel Core i7-10750H (1114 - 1333, n=43) | |
| Asus Zephyrus S15 GX502L | |
| Asus ROG Zephyrus M15 GU502LU-BI7N4 | |
| Asus ROG Zephyrus G15 GA502IU-ES76 | |
| MSI Bravo 15 A4DCR | |
| Schenker XMG Pro 15 | |
| HP Pavilion Gaming 15-ec1206ng | |
| Geekbench 5.5 / Multi-Core | |
| MSI GT76 Titan DT 10SGS | |
| Asus ROG Strix Scar 15 G532LWS | |
| Asus ROG Zephyrus G15 GA502IU-ES76 | |
| Asus Zephyrus S15 GX502L | |
| MSI Bravo 15 A4DCR | |
| Asus ROG Zephyrus M15 GU502LU-BI7N4 | |
| Durchschnittliche Intel Core i7-10750H (4443 - 6674, n=43) | |
| Schenker XMG Pro 15 | |
| HP Pavilion Gaming 15-ec1206ng | |
| HWBOT x265 Benchmark v2.2 / 4k Preset | |
| MSI GT76 Titan DT 10SGS | |
| Asus Zephyrus S15 GX502L | |
| Asus ROG Strix Scar 15 G532LWS | |
| Eurocom Nightsky RX15 | |
| Asus ROG Zephyrus G15 GA502IU-ES76 | |
| MSI Bravo 15 A4DCR | |
| Asus ROG Zephyrus M15 GU502LU-BI7N4 | |
| HP Pavilion Gaming 15-ec1206ng | |
| Durchschnittliche Intel Core i7-10750H (5.54 - 11.6, n=43) | |
| Schenker XMG Pro 15 | |
| LibreOffice / 20 Documents To PDF | |
| MSI Bravo 15 A4DCR | |
| HP Pavilion Gaming 15-ec1206ng | |
| Asus ROG Zephyrus G15 GA502IU-ES76 | |
| Durchschnittliche Intel Core i7-10750H (43.1 - 99.2, n=43) | |
| Asus ROG Strix Scar 15 G532LWS | |
| Asus ROG Zephyrus M15 GU502LU-BI7N4 | |
| Asus Zephyrus S15 GX502L | |
| MSI GT76 Titan DT 10SGS | |
| R Benchmark 2.5 / Overall mean | |
| Schenker XMG Pro 15 | |
| Asus ROG Zephyrus M15 GU502LU-BI7N4 | |
| Durchschnittliche Intel Core i7-10750H (0.578 - 0.708, n=42) | |
| HP Pavilion Gaming 15-ec1206ng | |
| MSI Bravo 15 A4DCR | |
| Asus Zephyrus S15 GX502L | |
| Asus ROG Zephyrus G15 GA502IU-ES76 | |
| MSI GT76 Titan DT 10SGS | |
| Asus ROG Strix Scar 15 G532LWS | |
* ... kleinere Werte sind besser
Systemleistung
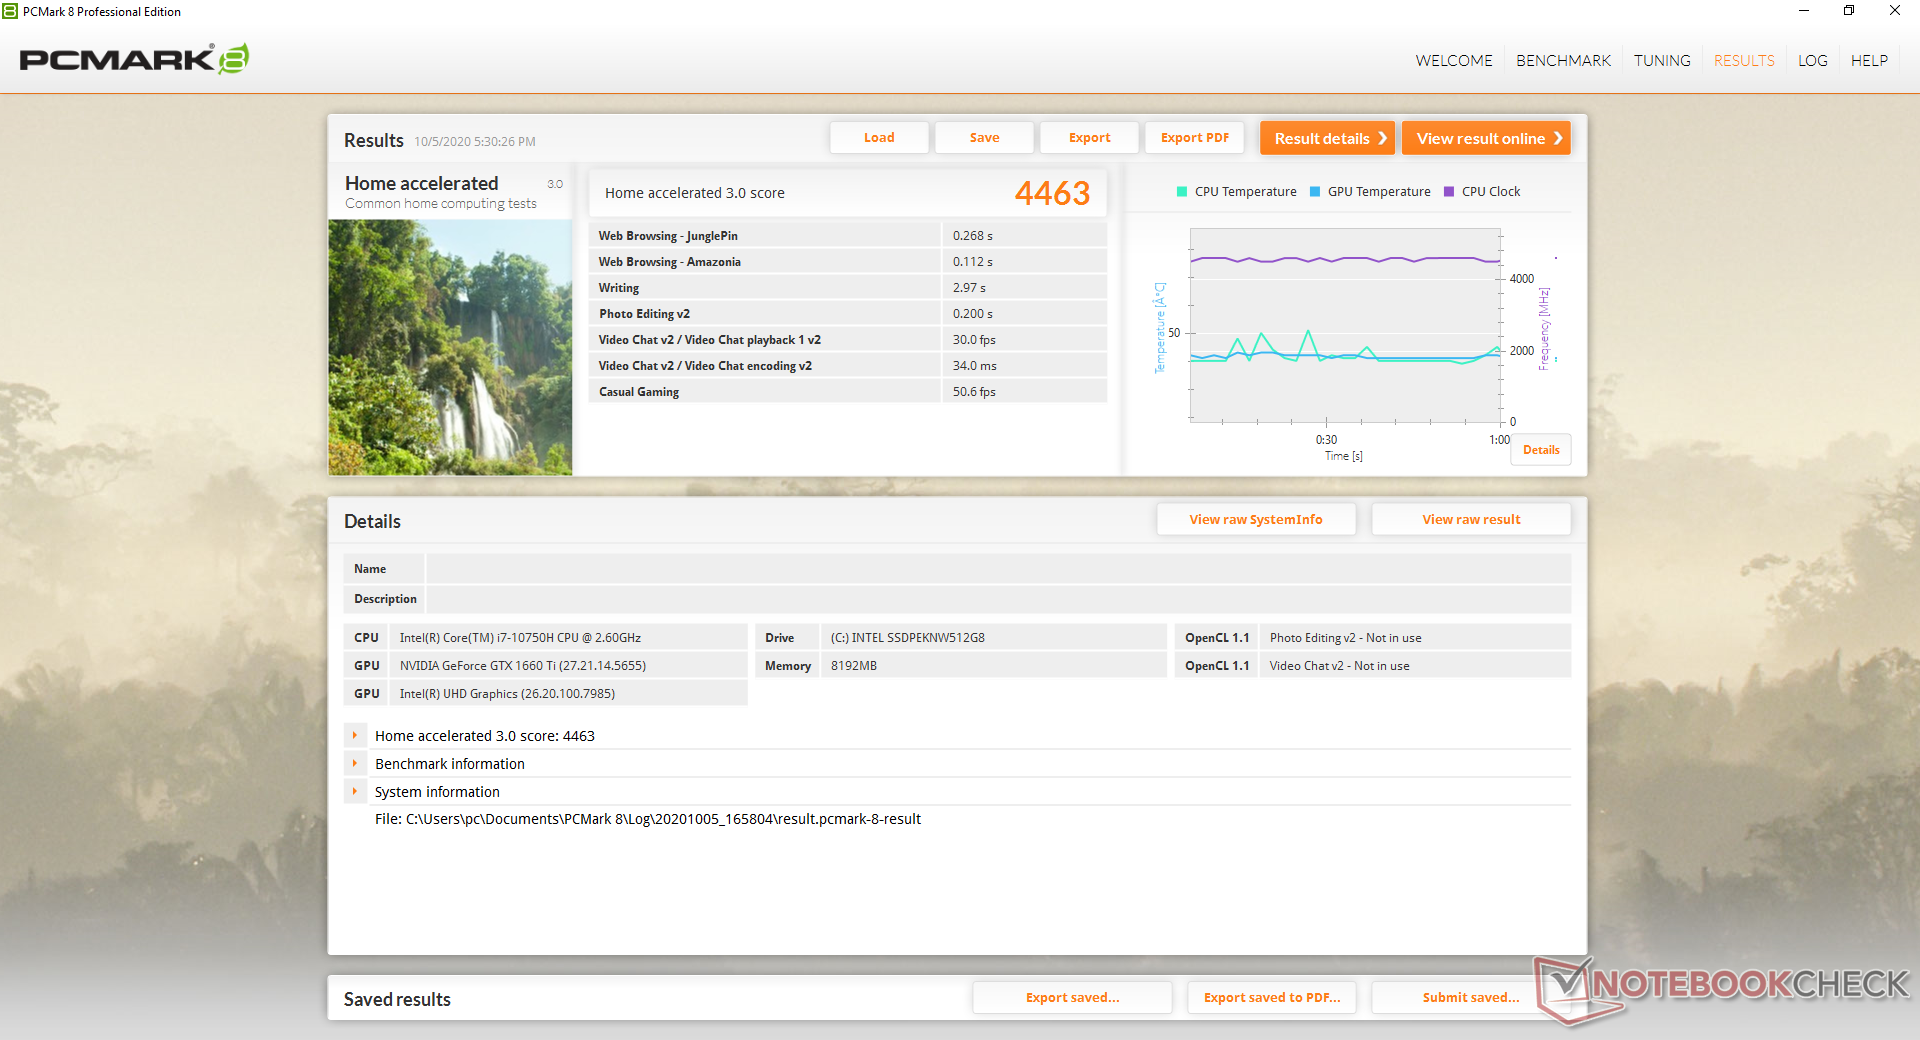
| PCMark 8 Home Score Accelerated v2 | 4463 Punkte | |
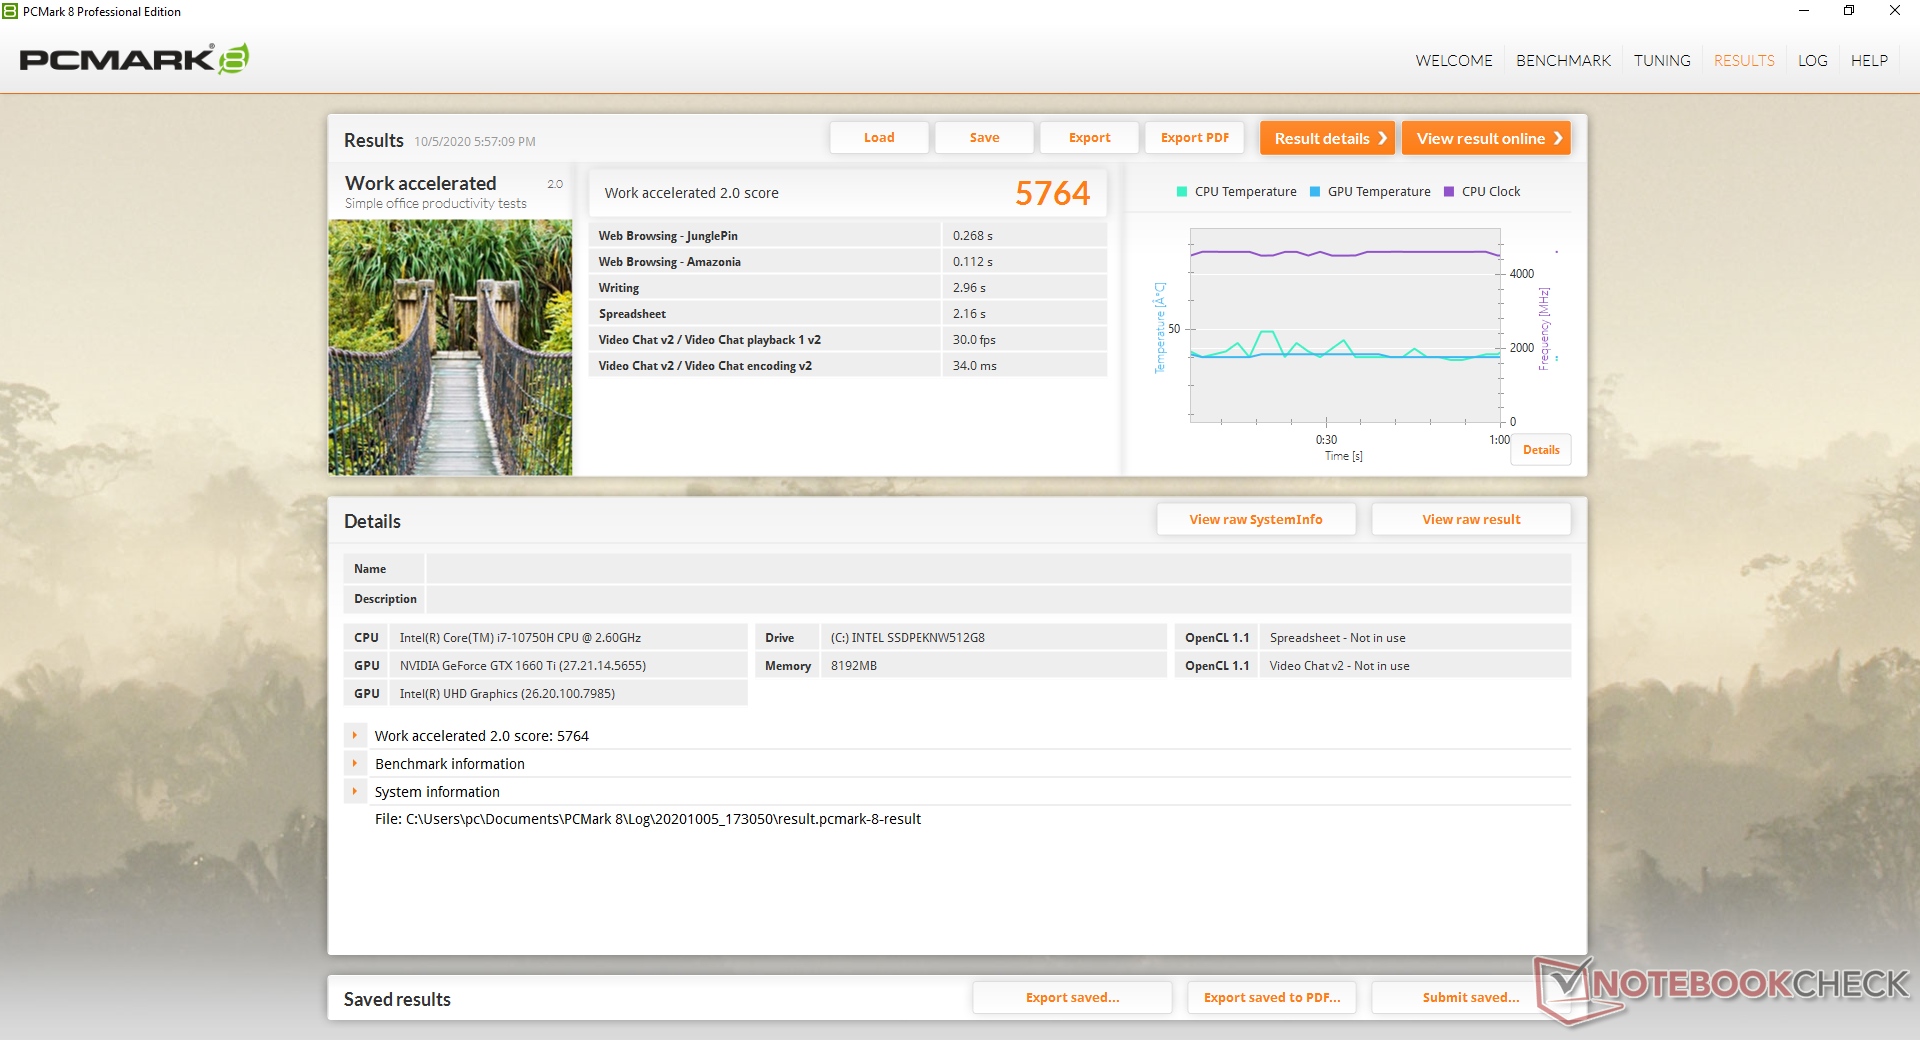
| PCMark 8 Work Score Accelerated v2 | 5764 Punkte | |
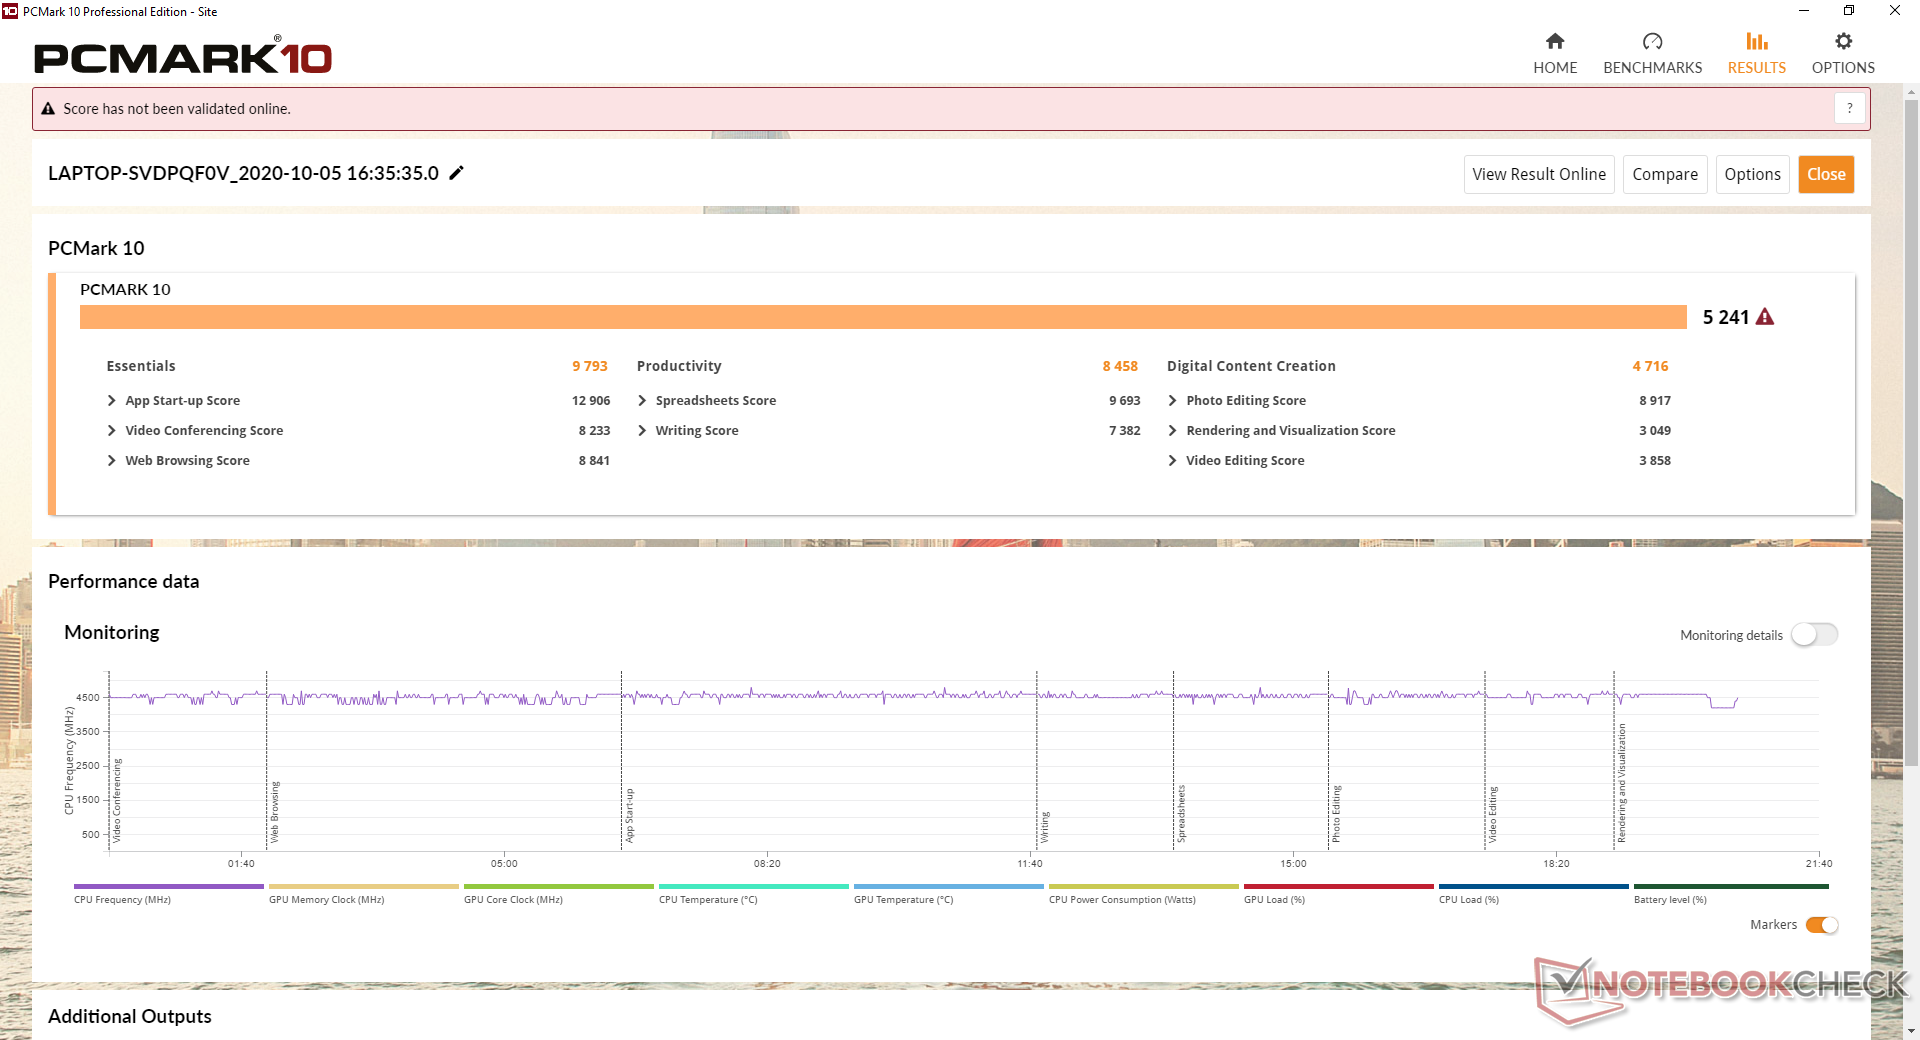
| PCMark 10 Score | 5241 Punkte | |
Hilfe | ||
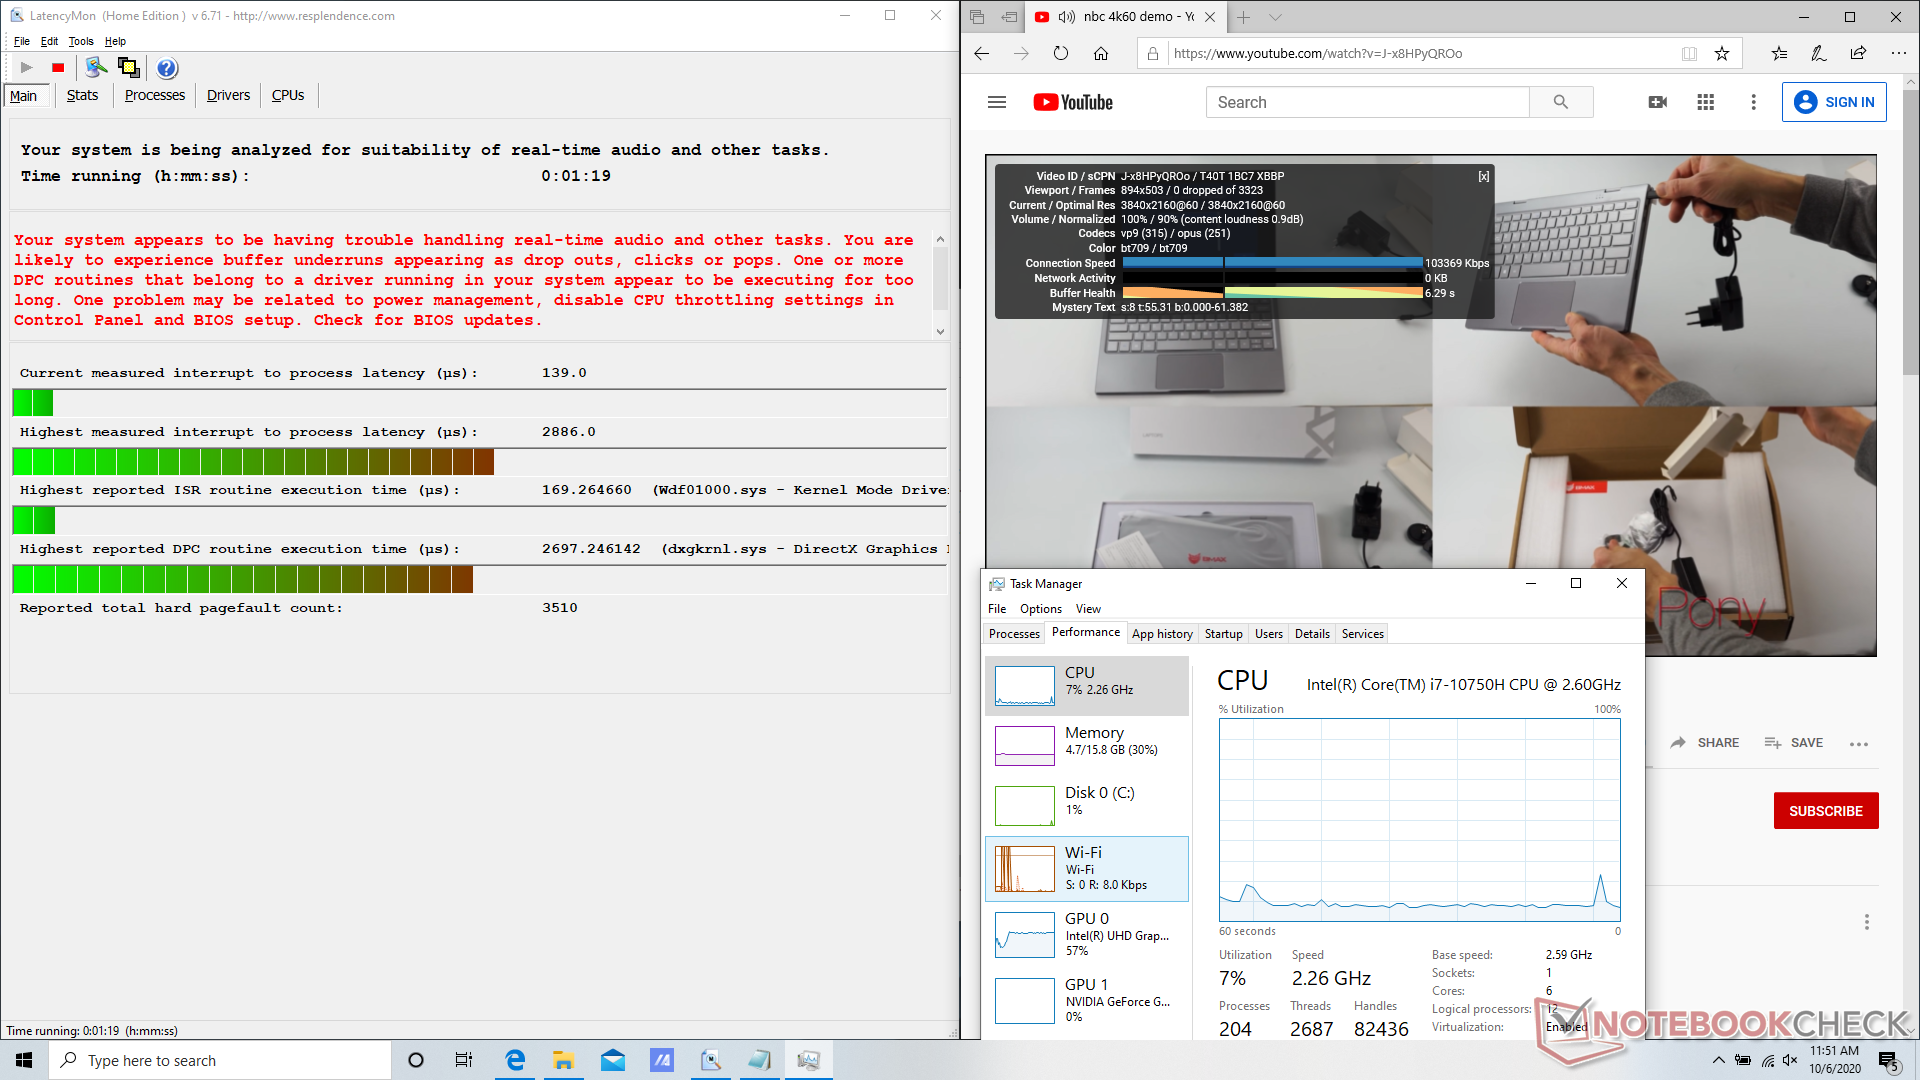
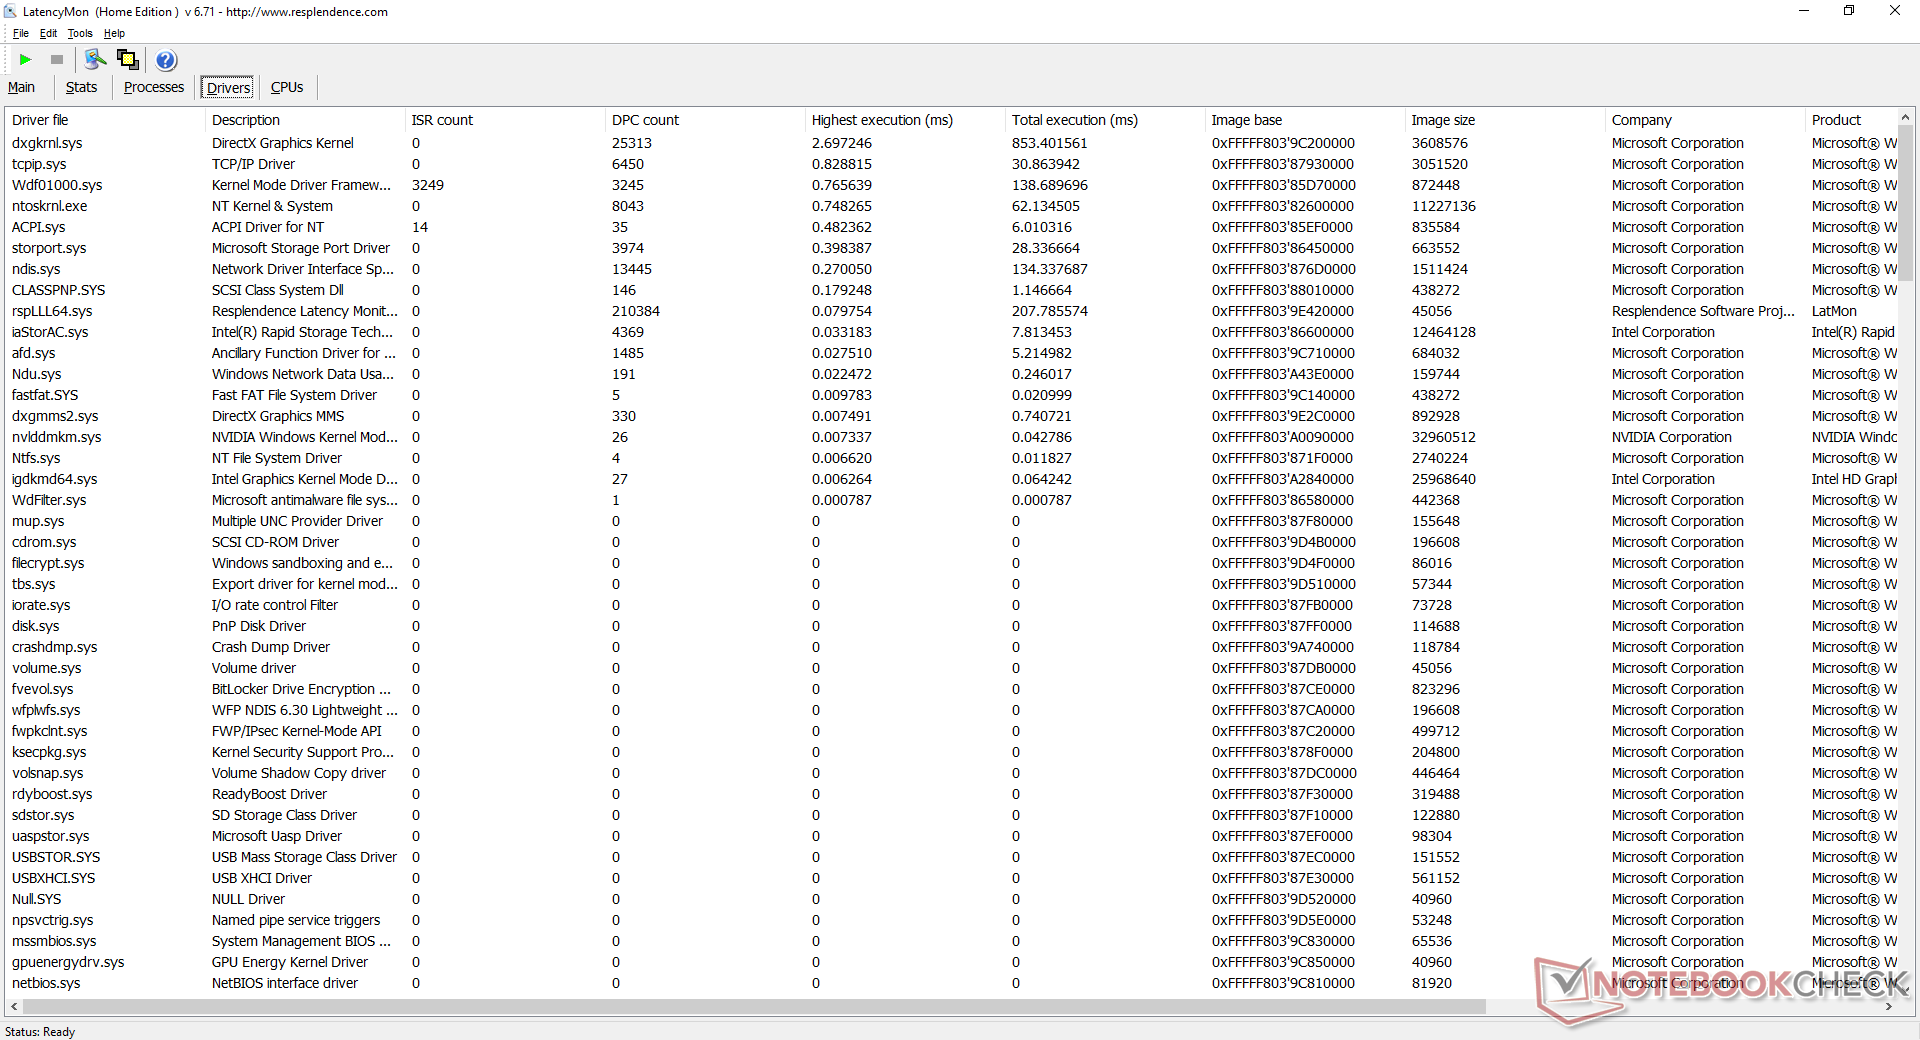
DPC-Latenzen
LatencyMon zeigt leider Probleme mit DPC-Latenzen beim Öffnen mehrerer Browsertabs auf. Die Wiedergabe unseres 4K/60fps-Testvideos auf YouTube läuft hingegen flüssig und ohne Dropped Frames ab.
| DPC Latencies / LatencyMon - interrupt to process latency (max), Web, Youtube, Prime95 | |
| HP Omen 15-ek0456ng | |
| Asus ROG Zephyrus M15 GU502LU-BI7N4 | |
| Gateway Creator Series 15.6 GWTN156-3BK | |
| Asus ROG Zephyrus M15 GU502L | |
| MSI GP65 10SFK-047US | |
| Lenovo Legion 5 15IMH05H | |
* ... kleinere Werte sind besser
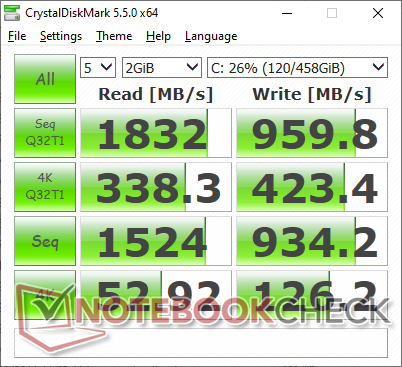
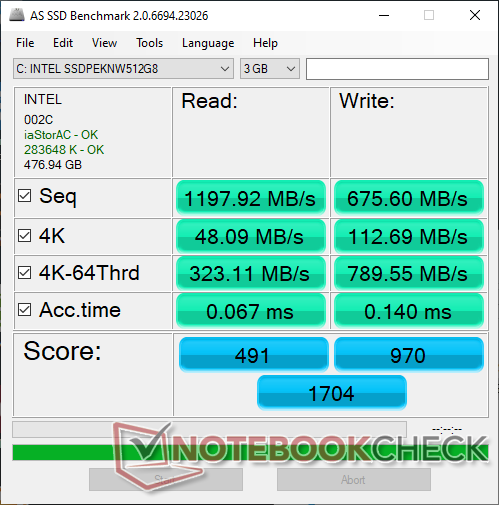
Massenspeicher
Aufgeboten werden zwei M.2-PCIe-Schächte, leider gibt es keine 2.5-Zoll-Option. Die meisten Asus-Gaming-Laptops werden mit der Mittelklasse-SSD Intel 660p NVMe ausgeliefert und unser GU502LU bildet da keine Ausnahme. Die teureren SSDs Samsung PM981a oder Toshiba XG6 bieten deutlich höhere Übertragungsraten.
| Asus ROG Zephyrus M15 GU502LU-BI7N4 Intel SSD 660p SSDPEKNW512G8 | Asus ROG Zephyrus M15 GU502L 2x Intel SSD 660p SSDPEKNW512G8 (RAID 0) | HP Omen 15-ek0456ng Toshiba XG6 KXG60ZNV512G | Gateway Creator Series 15.6 GWTN156-3BK Phison PS5013 PM8256GPTCB4B8TF | Lenovo Legion 5 15IMH05H Samsung PM991 MZALQ512HALU | MSI GP65 10SFK-047US Samsung SSD PM981 MZVLB1T0HALR | |
|---|---|---|---|---|---|---|
| AS SSD | 53% | 109% | 11% | 37% | 148% | |
| Seq Read (MB/s) | 1198 | 2523 111% | 2053 71% | 1592 33% | 2012 68% | 2066 72% |
| Seq Write (MB/s) | 676 | 1578 133% | 2562 279% | 1057 56% | 1261 87% | 2418 258% |
| 4K Read (MB/s) | 48.09 | 50.4 5% | 42.46 -12% | 34.12 -29% | 43.66 -9% | 54.2 13% |
| 4K Write (MB/s) | 112.7 | 115.6 3% | 97.2 -14% | 120.4 7% | 109.3 -3% | 129 14% |
| 4K-64 Read (MB/s) | 323.1 | 634 96% | 1414 338% | 410.1 27% | 851 163% | 1865 477% |
| 4K-64 Write (MB/s) | 790 | 1114 41% | 1471 86% | 634 -20% | 780 -1% | 1878 138% |
| Access Time Read * (ms) | 0.067 | 0.095 -42% | 0.079 -18% | 0.072 -7% | 0.117 -75% | 0.042 37% |
| Access Time Write * (ms) | 0.14 | 0.038 73% | 0.039 72% | 0.105 25% | 0.036 74% | 0.091 35% |
| Score Read (Points) | 491 | 936 91% | 1662 238% | 613 25% | 1096 123% | 2126 333% |
| Score Write (Points) | 970 | 1388 43% | 1825 88% | 860 -11% | 1016 5% | 2249 132% |
| Score Total (Points) | 1704 | 2770 63% | 4364 156% | 1771 4% | 2643 55% | 5482 222% |
| Copy ISO MB/s (MB/s) | 898 | 2106 135% | 1913 113% | 1255 40% | 1481 65% | 2927 226% |
| Copy Program MB/s (MB/s) | 523 | 549 5% | 833 59% | 508 -3% | 467.5 -11% | 728 39% |
| Copy Game MB/s (MB/s) | 948 | 854 -10% | 1667 76% | 986 4% | 734 -23% | 1614 70% |
| CrystalDiskMark 5.2 / 6 | 43% | 46% | 21% | 17% | 63% | |
| Write 4K (MB/s) | 126.2 | 123 -3% | 120 -5% | 170.2 35% | 145.4 15% | 145 15% |
| Read 4K (MB/s) | 52.9 | 52.5 -1% | 36.09 -32% | 52.5 -1% | 51.6 -2% | 46.84 -11% |
| Write Seq (MB/s) | 934 | 1698 82% | 1778 90% | 1105 18% | 1007 8% | 2377 154% |
| Read Seq (MB/s) | 1524 | 2440 60% | 1362 -11% | 1507 -1% | 1145 -25% | 2185 43% |
| Write 4K Q32T1 (MB/s) | 423.4 | 450.4 6% | 429.1 1% | 380.8 -10% | 468.4 11% | 463.5 9% |
| Read 4K Q32T1 (MB/s) | 338.3 | 550 63% | 493.2 46% | 531 57% | 528 56% | 527 56% |
| Write Seq Q32T1 (MB/s) | 960 | 1794 87% | 2936 206% | 1253 31% | 1381 44% | 2395 149% |
| Read Seq Q32T1 (MB/s) | 1832 | 2812 53% | 3227 76% | 2543 39% | 2291 25% | 3470 89% |
| Write 4K Q8T8 (MB/s) | 1536 | |||||
| Read 4K Q8T8 (MB/s) | 1490 | |||||
| Durchschnitt gesamt (Programm / Settings) | 48% /
50% | 78% /
87% | 16% /
15% | 27% /
30% | 106% /
117% |
* ... kleinere Werte sind besser

Disk Throttling: DiskSpd Read Loop, Queue Depth 8
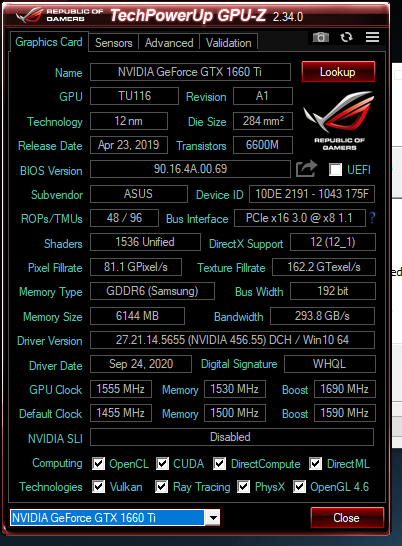
Grafikleistung
Die hier verbaute GTX 1660 Ti ist im Turbo-Modus nur etwa 5 bis 8 Prozent langsamer als die RTX 2070 Max-Q im Performance-Modus. Wird die RTX 2070 Max-Q ebenfalls in den Turbo-Modus versetzt, so wächst der Unterschied auf 20 Prozent an. Im Akkumodus sinkt sowohl die CPU- als auch die GPU-Leistung beträchtlich.
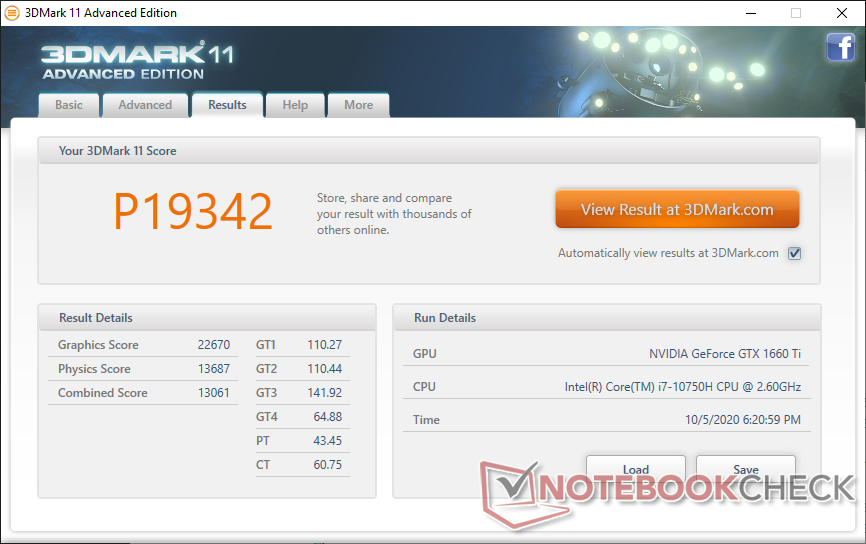
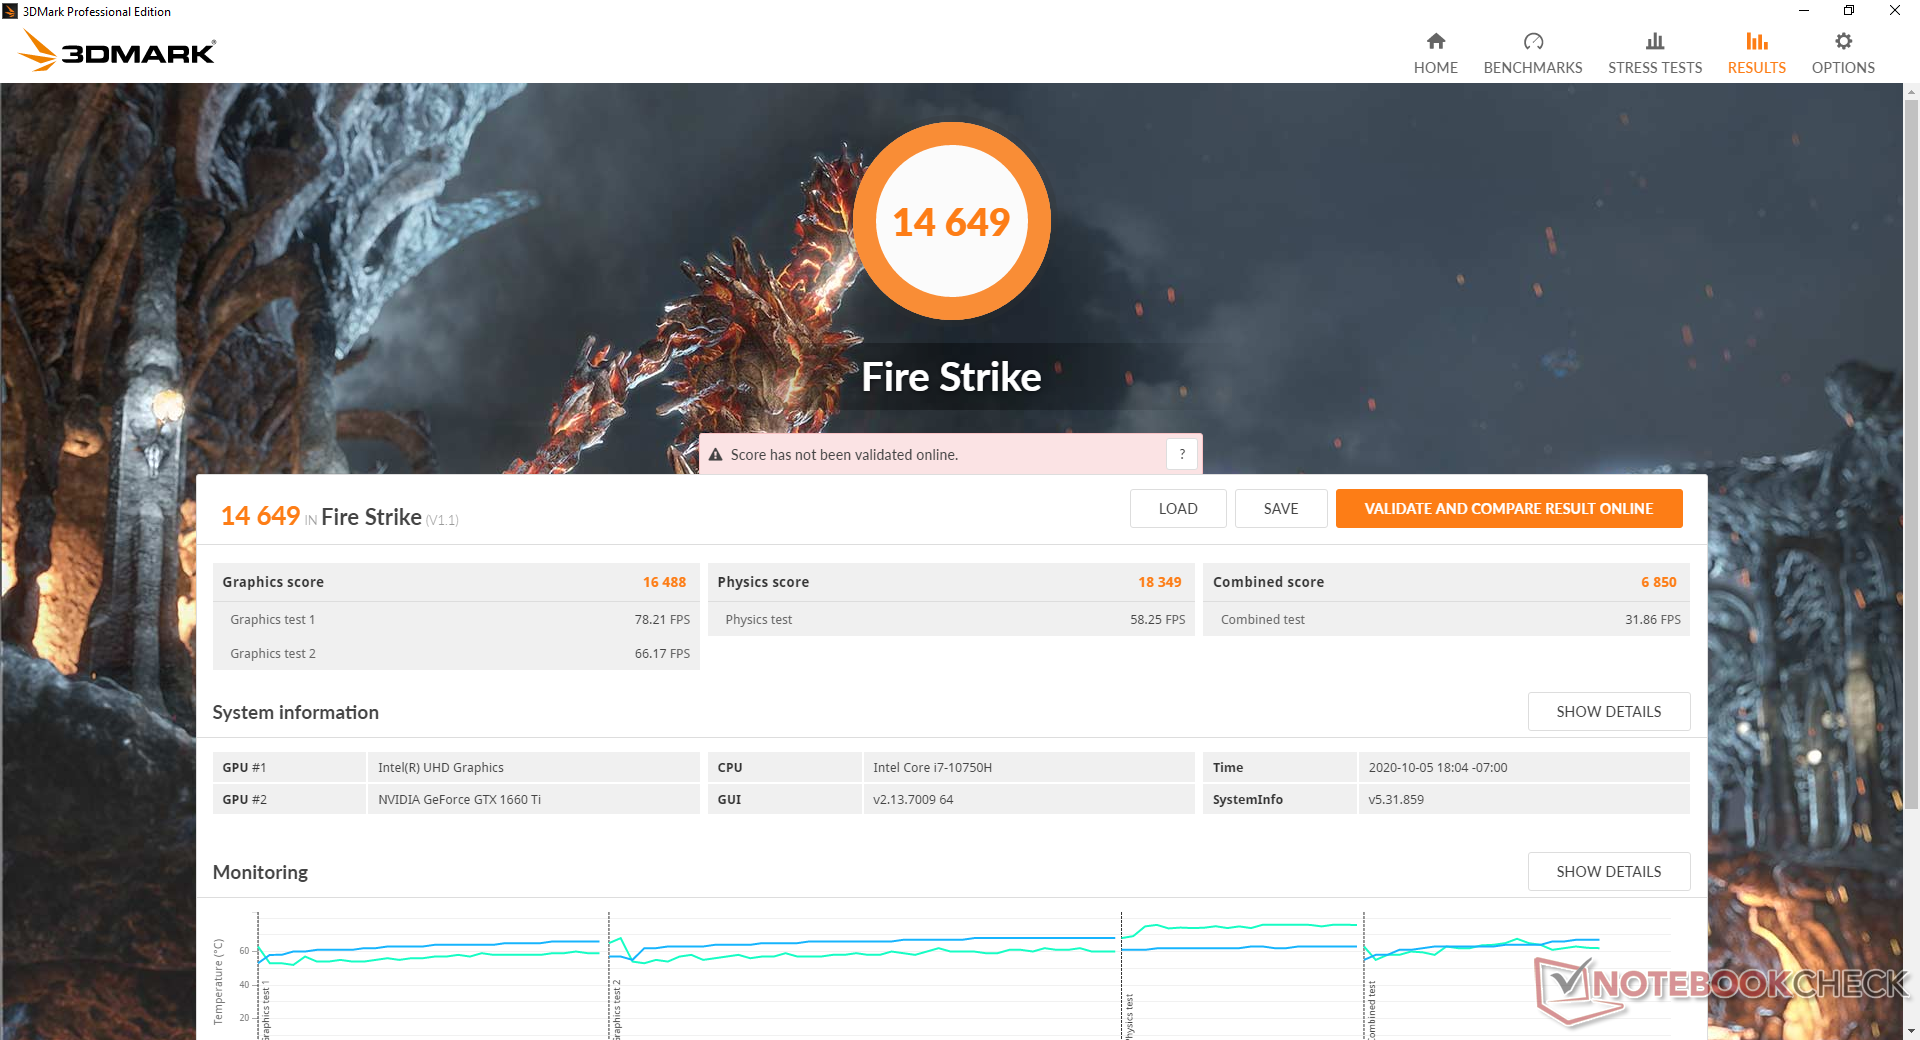
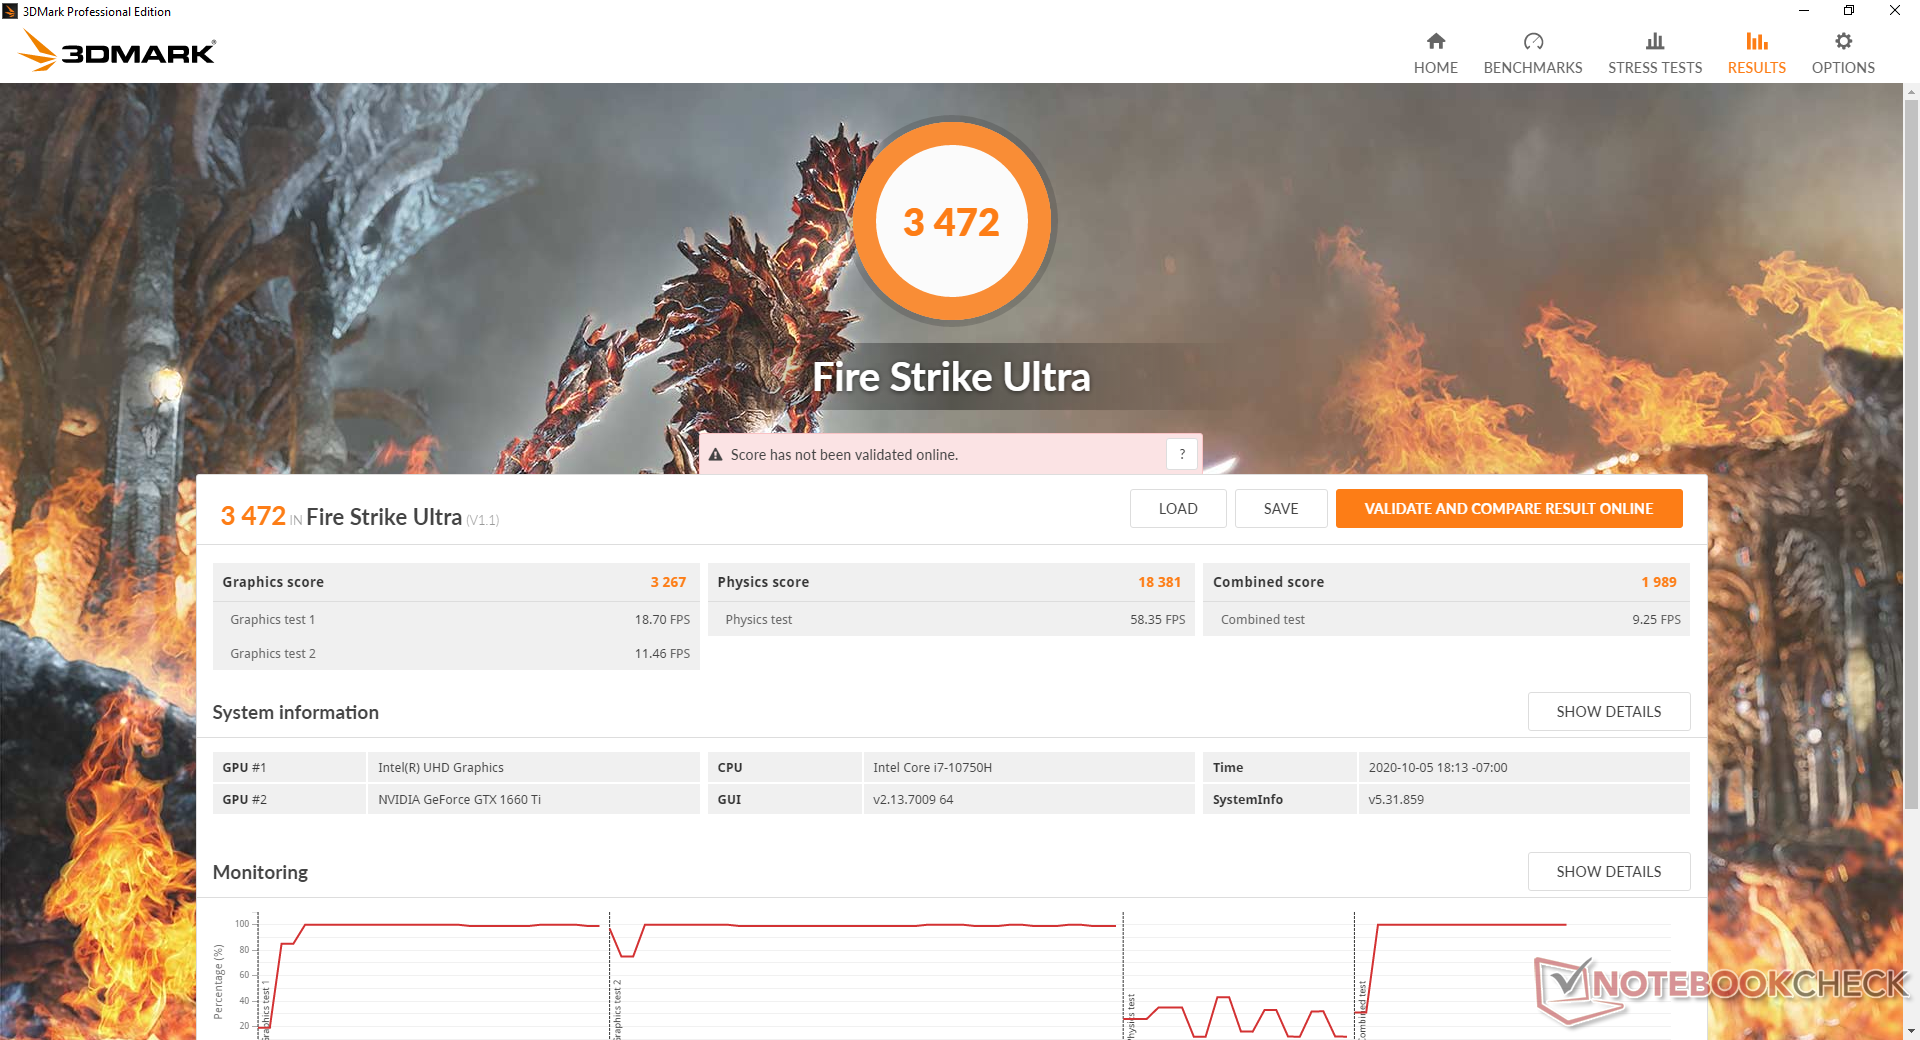

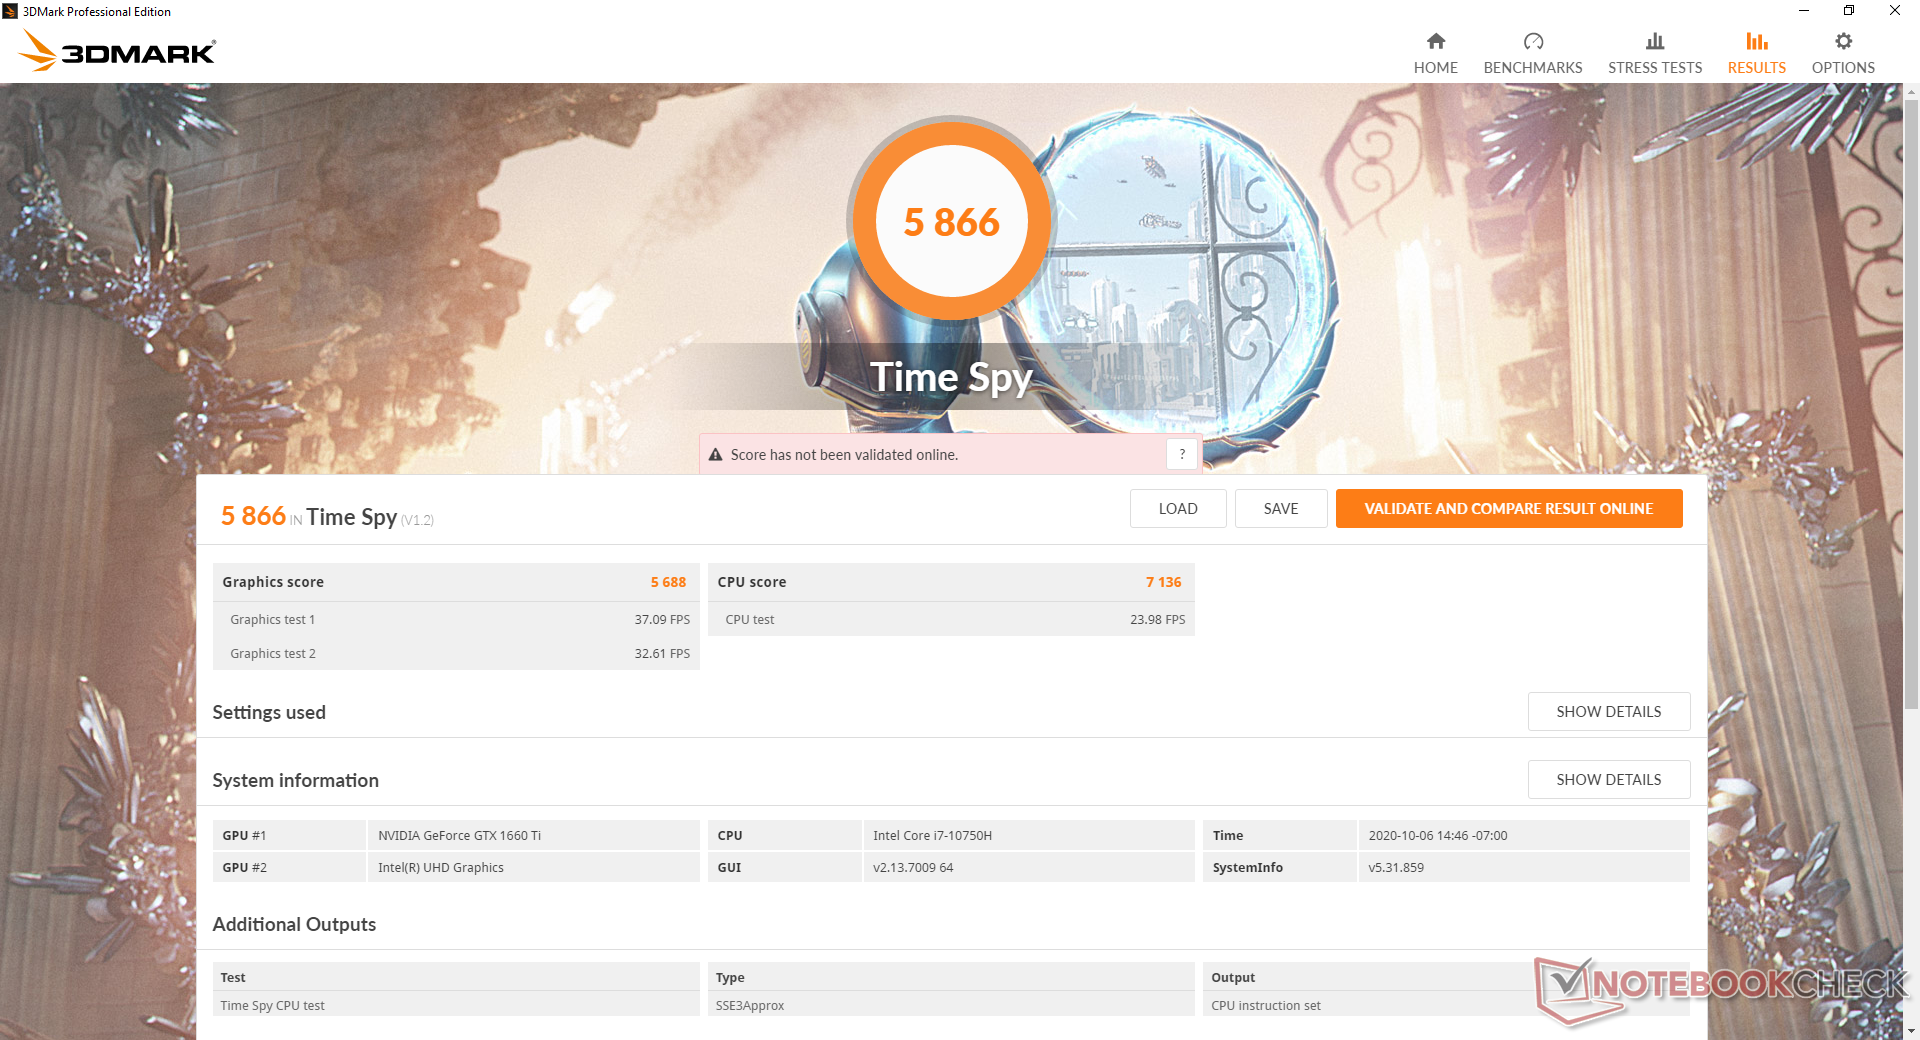

| 3DMark 11 Performance | 19342 Punkte | |
| 3DMark Cloud Gate Standard Score | 38136 Punkte | |
| 3DMark Fire Strike Score | 14649 Punkte | |
| 3DMark Time Spy Score | 6261 Punkte | |
Hilfe | ||
| min. | mittel | hoch | max. | |
|---|---|---|---|---|
| GTA V (2015) | 178 | 171 | 140 | 76 |
| The Witcher 3 (2015) | 288.3 | 193.2 | 117.6 | 65.1 |
| Dota 2 Reborn (2015) | 150 | 135 | 124 | 118 |
| Final Fantasy XV Benchmark (2018) | 137 | 87.6 | 63.9 | |
| X-Plane 11.11 (2018) | 101 | 89 | 75.2 | |
| Strange Brigade (2018) | 311 | 150 | 122 | 104 |
Emissionen
Systemlautstärke
Die Lüfter sind fast immer aktiv und mit 32 dB(A) auch im Silent-Modus hörbar. Spielt man hingegen im Performance-Modus, so spielen die Lüfter bei 53 dB(A) mit, was angesichts der lauten 61 dB(A) im Turbo-Modus fast schon moderat erscheint. Der Turbo-Modus quetscht somit zwar noch ein deutliches Plus an Leistung aus dem Laptop, der Geräuschunterschied bei den Lüftern ist aber ebenso deutlich.
| Asus ROG Zephyrus M15 GU502LU-BI7N4 GeForce GTX 1660 Ti Mobile, i7-10750H, Intel SSD 660p SSDPEKNW512G8 | Asus ROG Zephyrus M15 GU502L GeForce RTX 2070 Max-Q, i7-10750H, 2x Intel SSD 660p SSDPEKNW512G8 (RAID 0) | HP Omen 15-ek0456ng GeForce GTX 1660 Ti Mobile, i5-10300H, Toshiba XG6 KXG60ZNV512G | Gateway Creator Series 15.6 GWTN156-3BK GeForce RTX 2060 Mobile, i5-10300H, Phison PS5013 PM8256GPTCB4B8TF | Lenovo Legion 5 15IMH05H GeForce RTX 2060 Mobile, i5-10300H, Samsung PM991 MZALQ512HALU | MSI GP65 10SFK-047US GeForce RTX 2070 Mobile, i7-10750H, Samsung SSD PM981 MZVLB1T0HALR | |
|---|---|---|---|---|---|---|
| Geräuschentwicklung | -7% | 3% | -2% | 3% | -6% | |
| aus / Umgebung * (dB) | 25.8 | 25 3% | 27 -5% | 26.5 -3% | 30.7 -19% | 29.3 -14% |
| Idle min * (dB) | 25.8 | 31 -20% | 32.4 -26% | 26.5 -3% | 30.7 -19% | 31.9 -24% |
| Idle avg * (dB) | 33.2 | 32 4% | 32.4 2% | 26.5 20% | 30.7 8% | 31.9 4% |
| Idle max * (dB) | 33.2 | 36 -8% | 32.4 2% | 32.4 2% | 30.7 8% | 33.5 -1% |
| Last avg * (dB) | 37.3 | 55 -47% | 32.5 13% | 55.4 -49% | 36.6 2% | 47 -26% |
| Witcher 3 ultra * (dB) | 60.8 | 53 13% | 47.2 22% | 55.3 9% | 47 23% | 53.8 12% |
| Last max * (dB) | 60.8 | 57 6% | 51.9 15% | 55.3 9% | 50.9 16% | 56.7 7% |
* ... kleinere Werte sind besser
Lautstärkediagramm
| Idle |
| 25.8 / 33.2 / 33.2 dB(A) |
| Last |
| 37.3 / 60.8 dB(A) |
 | ||
30 dB leise 40 dB(A) deutlich hörbar 50 dB(A) störend |
||
min: | ||
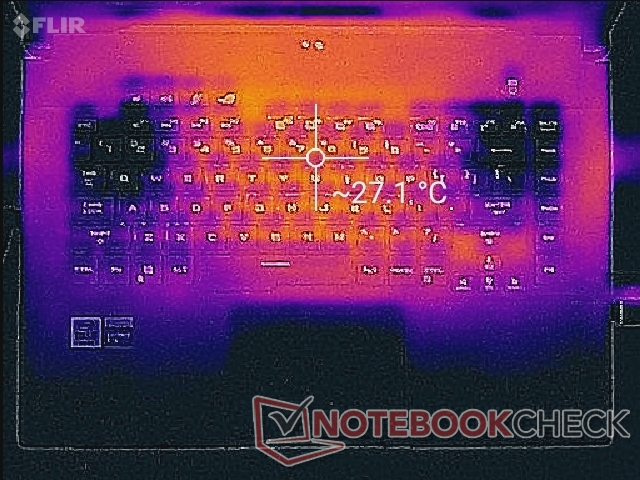
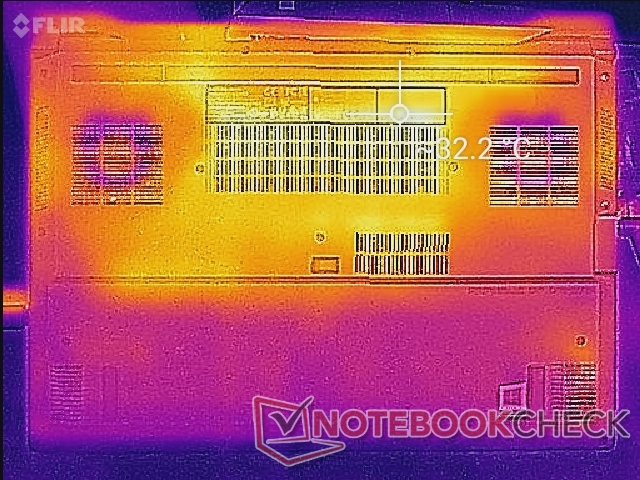
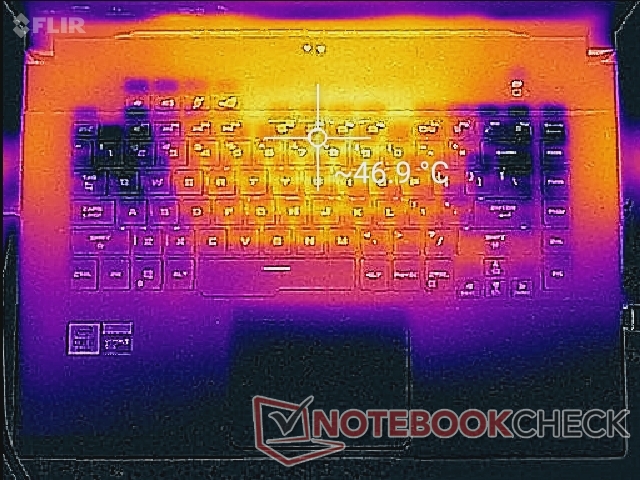
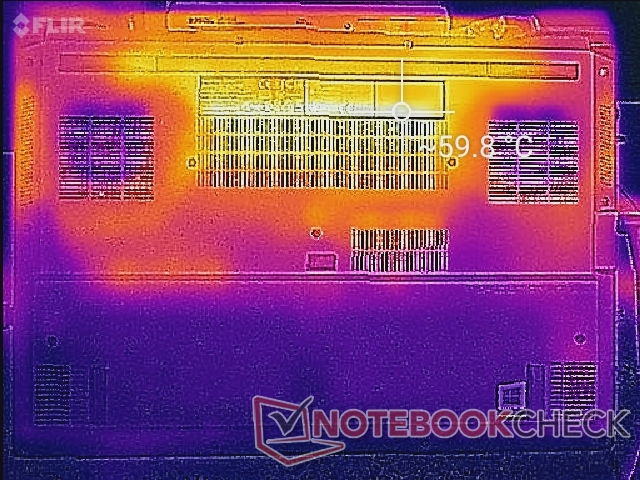
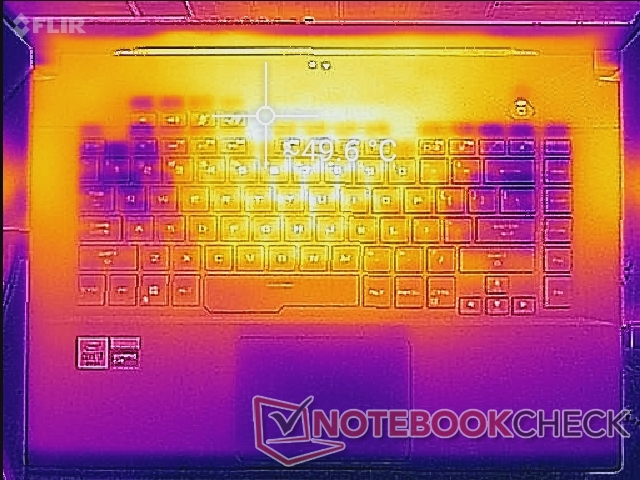
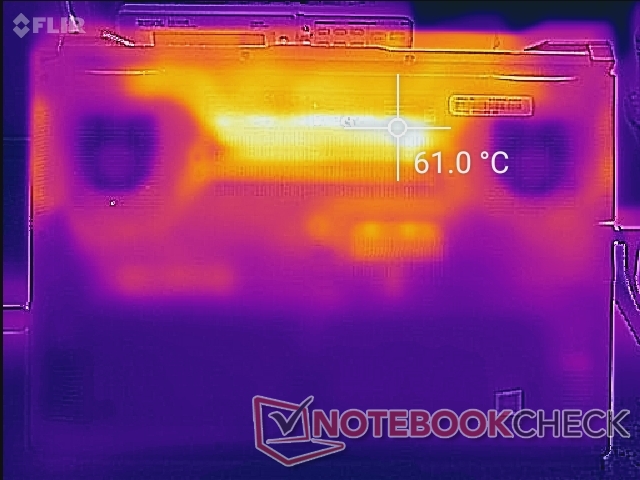
Temperatur
Die Oberflächentemperaturen bleiben im Turbo-Modus kühler als im Performance- oder Ausbalancierten Modus. Die Tastatur bildet dabei den Hot Spot, im Turbo-Modus werden durch die höhere Lüfterdrehzahl beispielsweise 47 °C erreicht, 51 °C sind es in den beiden anderen Modi.
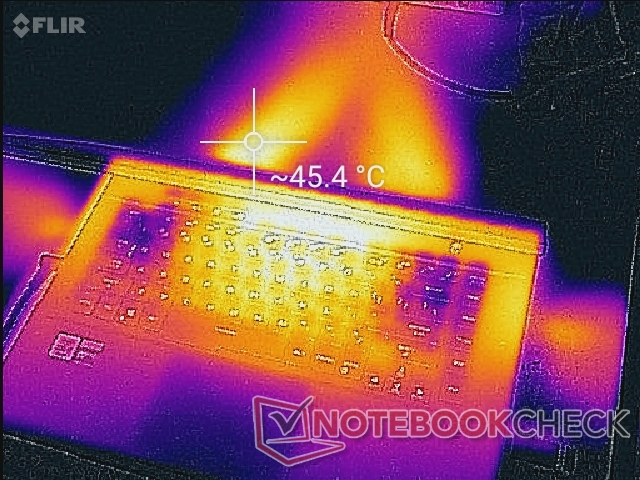
(-) Die maximale Temperatur auf der Oberseite ist 49.4 °C. Im Vergleich liegt der Klassendurchschnitt bei 40.4 °C (von 21.2 bis 68.8 °C für die Klasse Gaming).
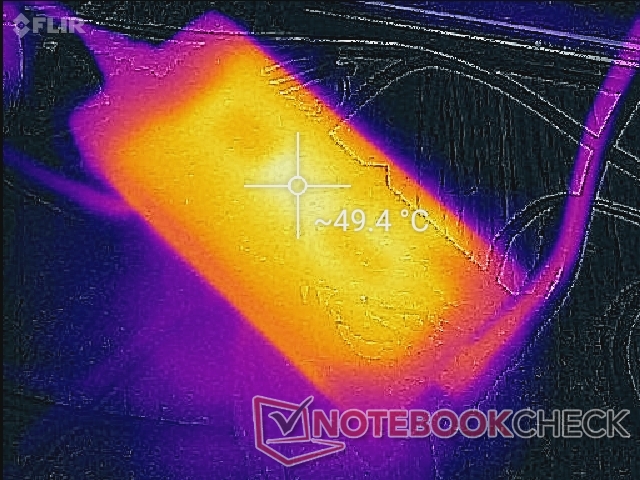
(-) Auf der Unterseite messen wir eine maximalen Wert von 60 °C (im Vergleich zum Durchschnitt von 43.2 °C).
(+) Ohne Last messen wir eine durchschnittliche Temperatur von 26.2 °C auf der Oberseite. Der Klassendurchschnitt erreicht 33.9 °C.
(±) Beim längeren Spielen von The Witcher 3 erhitzt sich das Gerät durchschnittlich auf 36 °C. Der Durchschnitt der Klasse ist derzeit 33.9 °C.
(+) Die Handballen und der Touchpad-Bereich sind mit gemessenen 30 °C kühler als die typische Hauttemperatur und fühlen sich dadurch kühl an.
(±) Die durchschnittliche Handballen-Temperatur anderer getesteter Geräte war 28.8 °C (-1.2 °C).
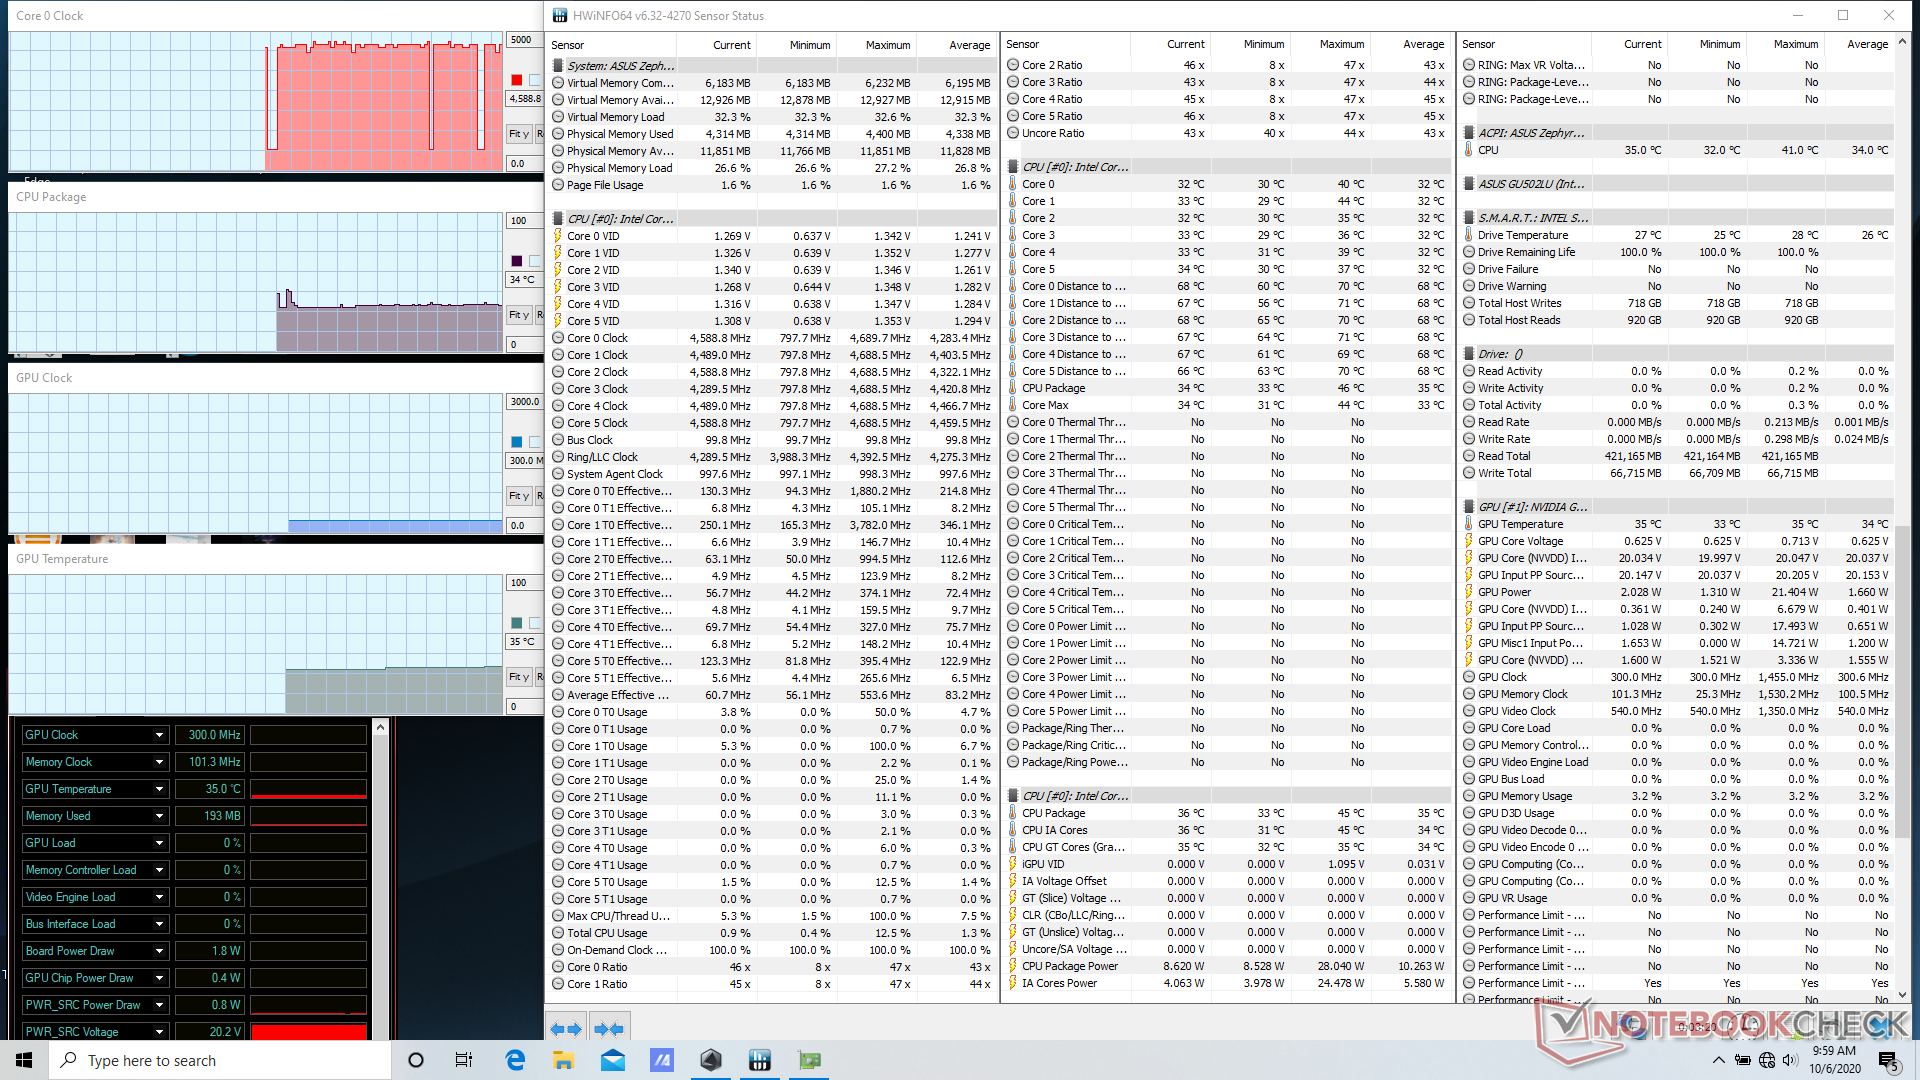
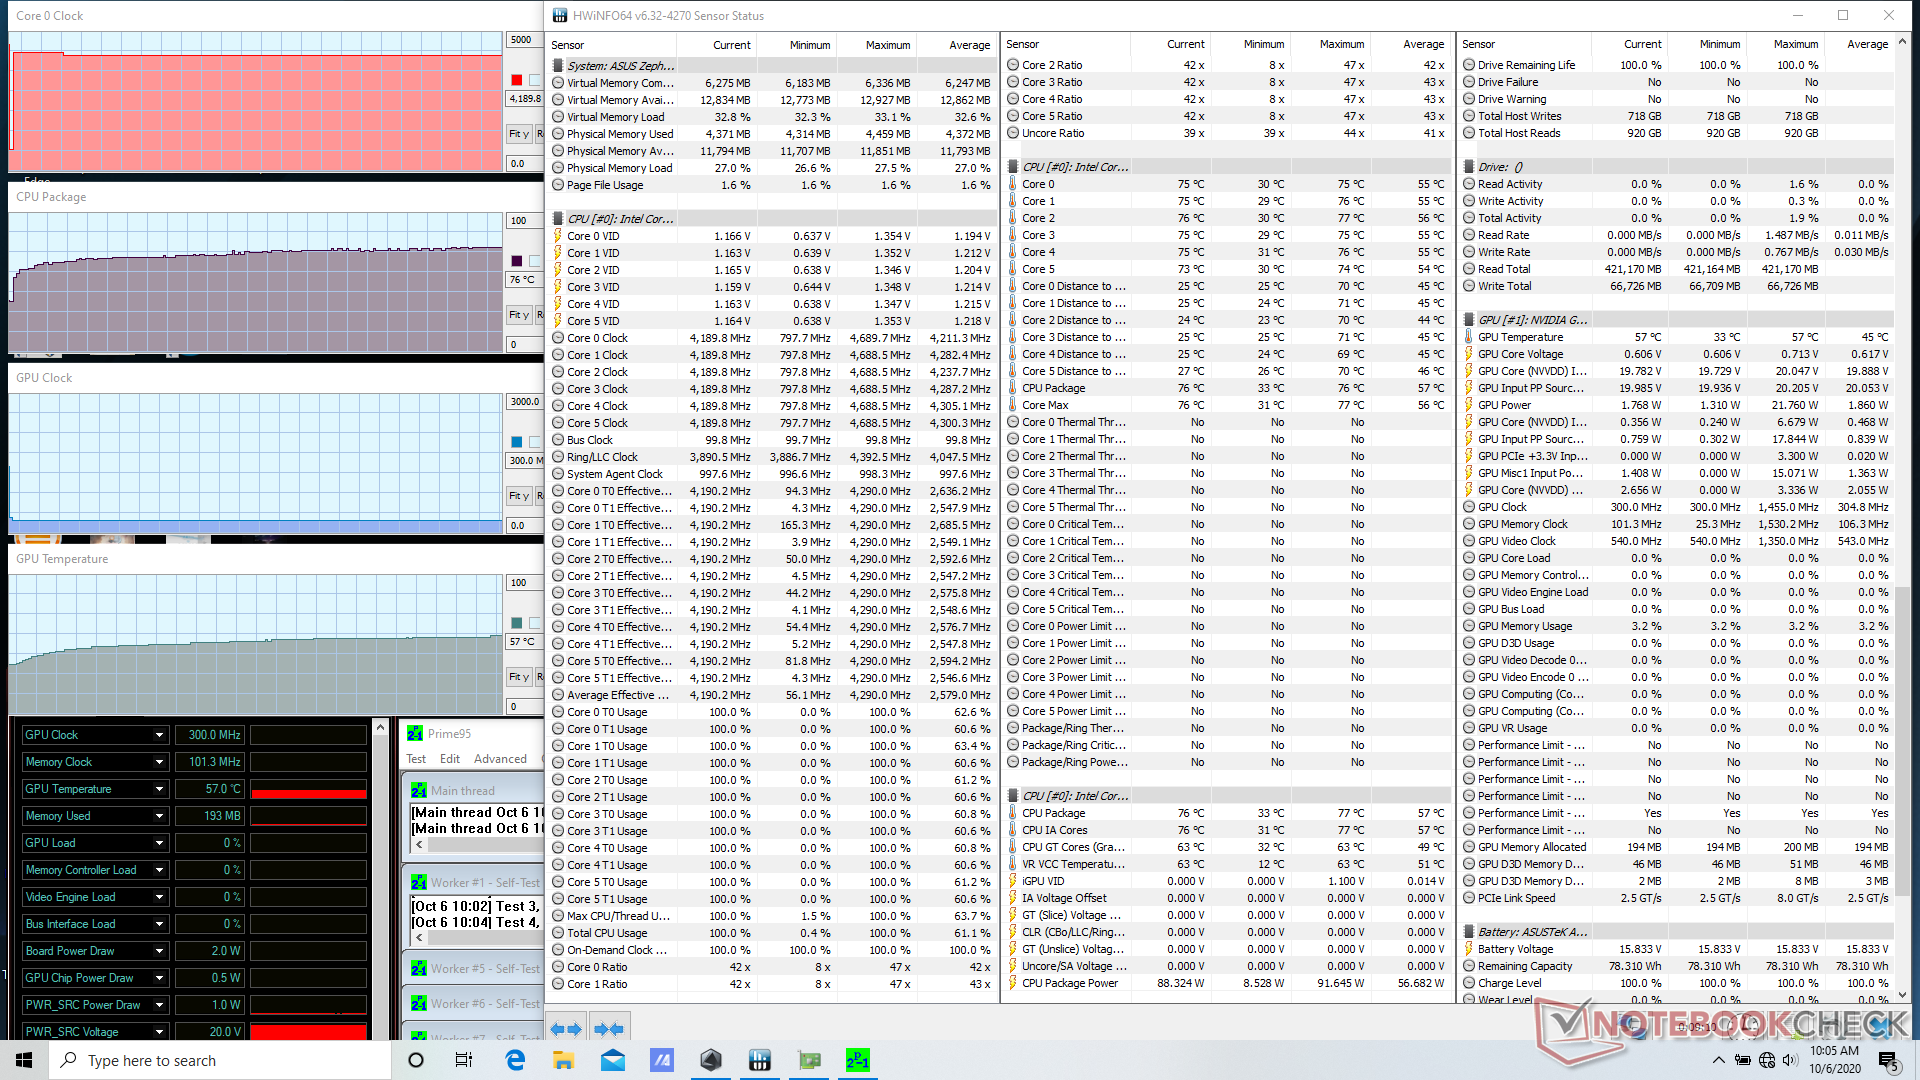
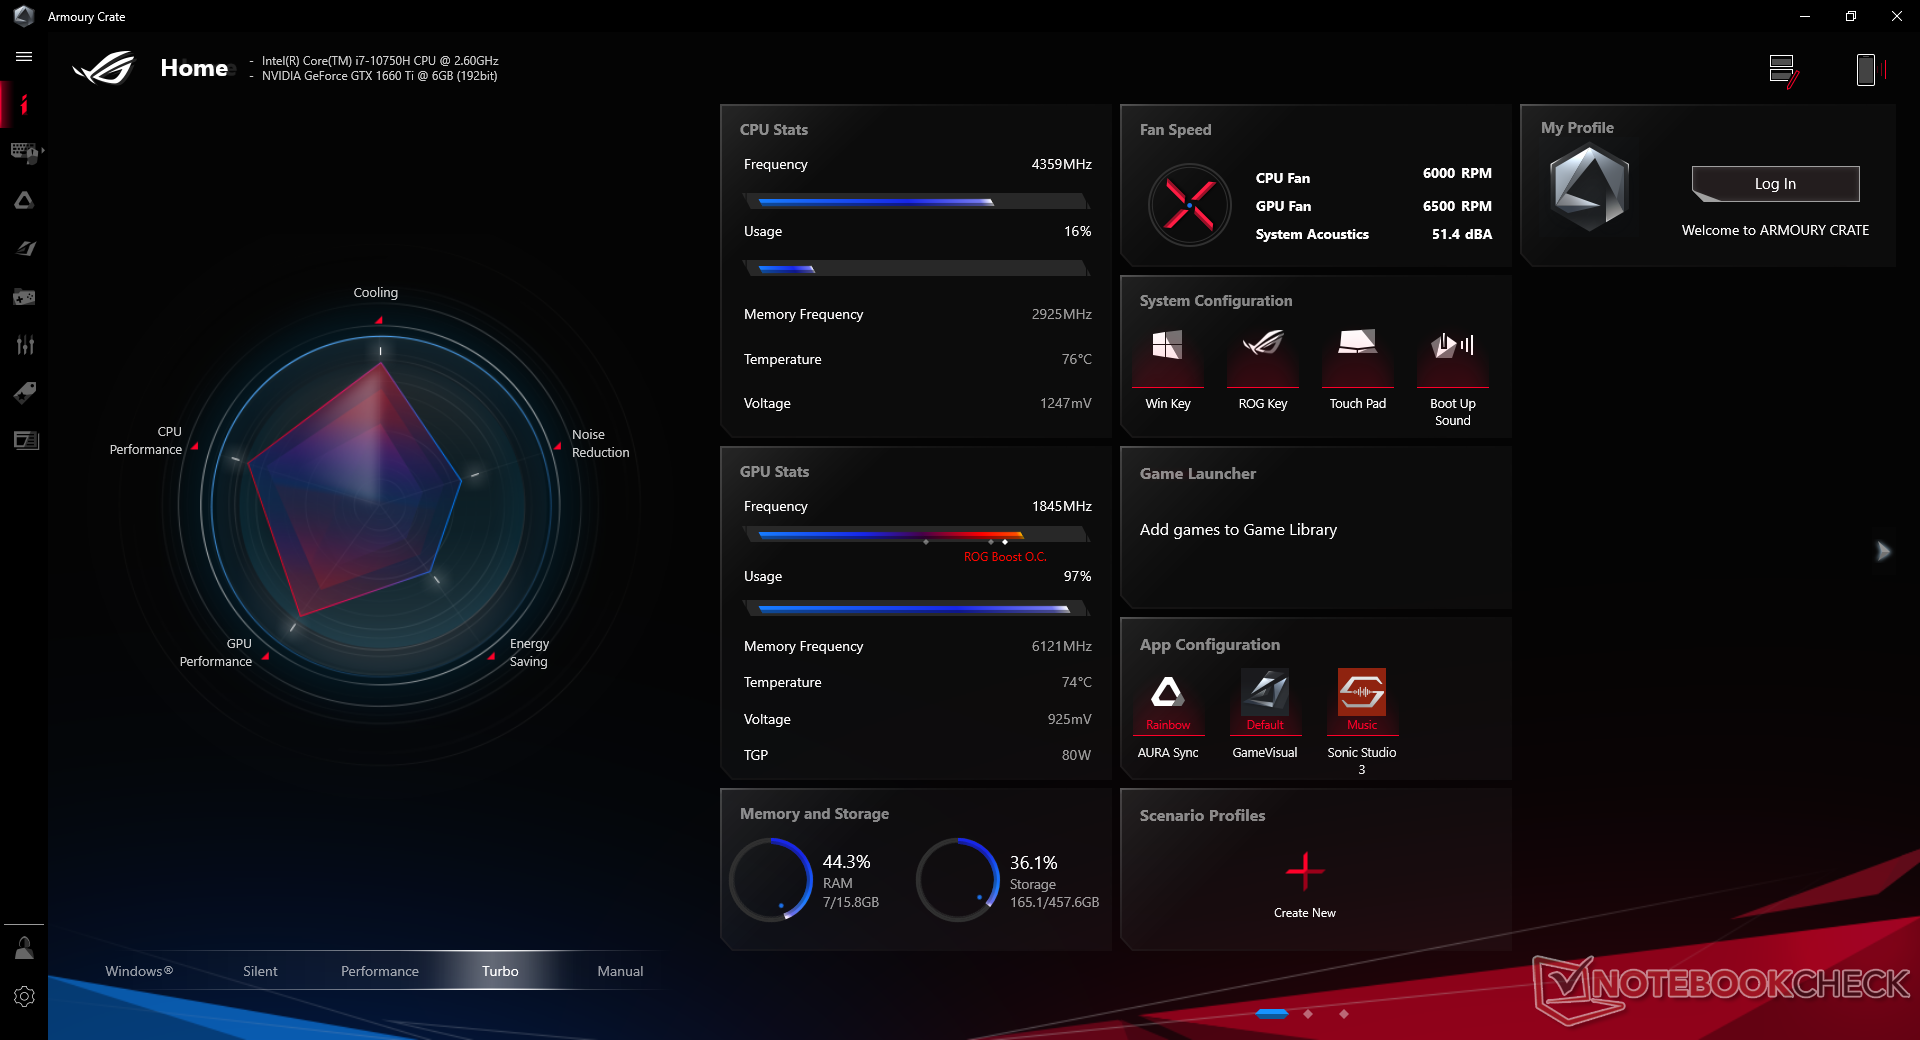
Stresstest
Wird die CPU mittels Prime95 im Turbo-Modus gestresst, so kann sie recht hohe Bosst-Taktraten von 4,2 GHz aufrechterhalten. Im Performance-Modus fallen die Taktraten hingegen auf 3,7 bis 3,8 GHz. Auch die GPU taktet im Turbo-Modus höher und bleibt gleichzeitig kühler als im Performance-Modus.

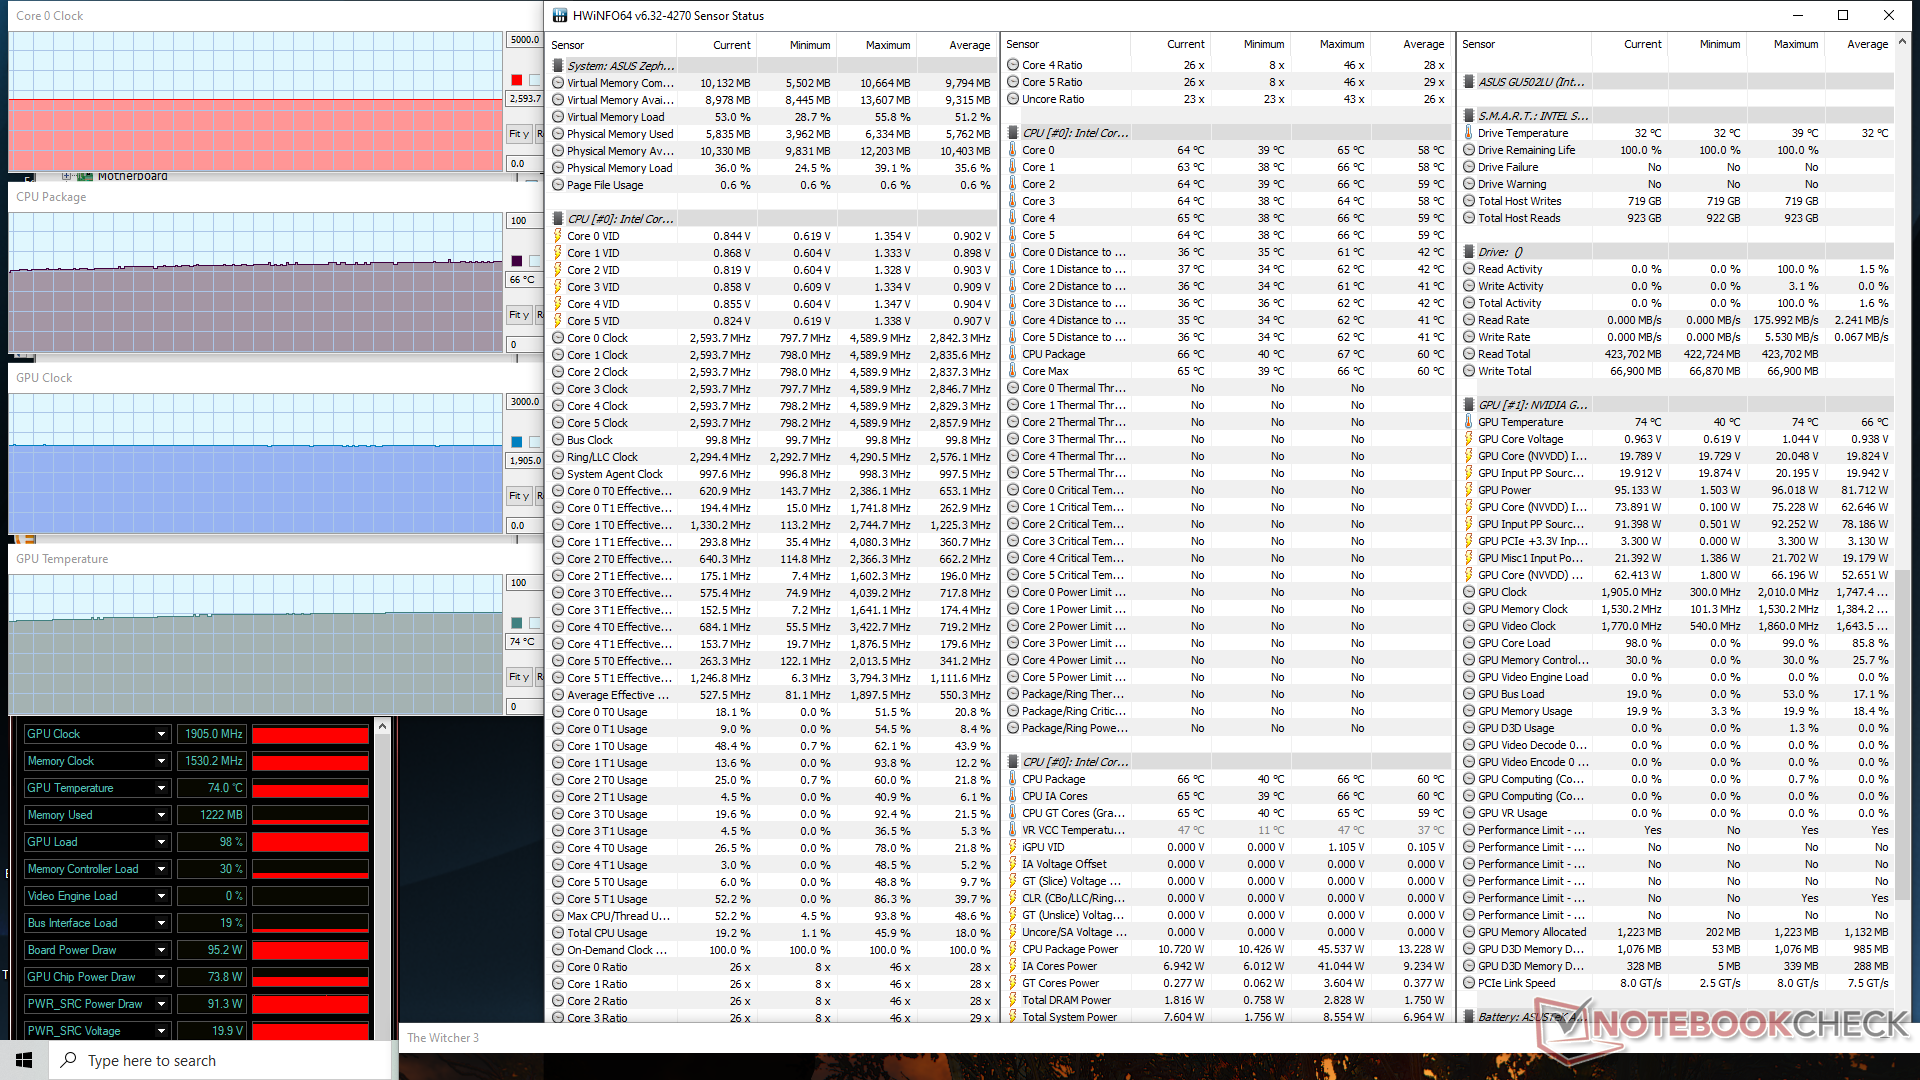
| CPU Clock (GHz) | GPU Clock (MHz) | Average CPU Temperature (°C) | Average GPU Temperature (°C) | |
| System Idle | -- | -- | 34 | 35 |
| Prime95 Stress (Performance mode) | 3.7 - 3.8 | -- | 77 | 63 |
| Prime95 Stress (Turbo mode) | 4.2 | -- | 76 | 57 |
| Prime95 + FurMark Stress (Turbo mode) | 3.3 | 1785 | 76 | 73 |
| Witcher 3 Stress (Performance mode) | 0.8 - 4.3 | 1785 | 76 | 77 |
| Witcher 3 stress (Turbo mode) | 2.6 | 1905 | 66 | 74 |
Lautsprecher

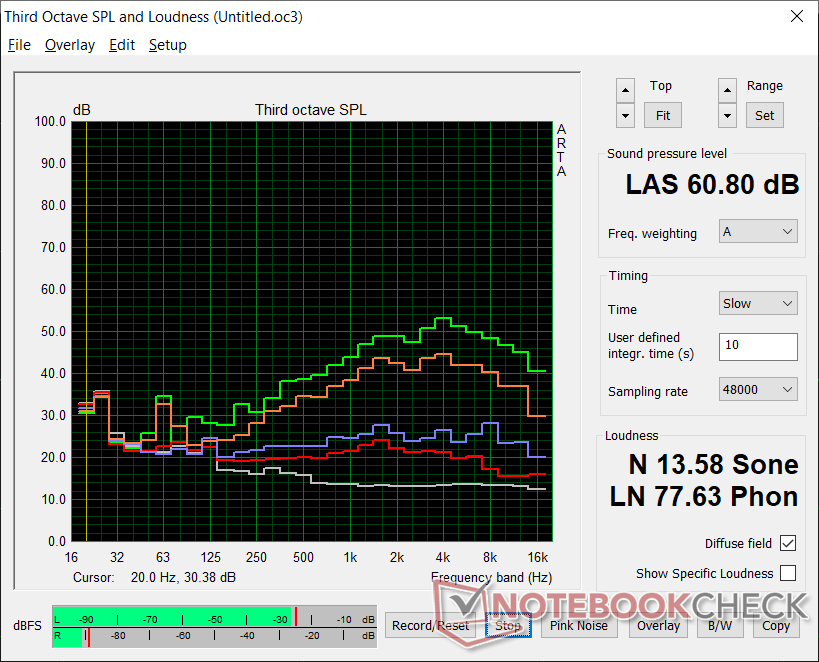
Asus ROG Zephyrus M15 GU502LU-BI7N4 Audio Analyse
(+) | Die Lautsprecher können relativ laut spielen (83.9 dB)
Bass 100 - 315 Hz
(±) | abgesenkter Bass - 9.4% geringer als der Median
(±) | durchschnittlich lineare Bass-Wiedergabe (10.2% Delta zum Vorgänger)
Mitteltöne 400 - 2000 Hz
(+) | ausgeglichene Mitten, vom Median nur 2.2% abweichend
(+) | lineare Mitten (5.2% Delta zum Vorgänger)
Hochtöne 2 - 16 kHz
(+) | ausgeglichene Hochtöne, vom Median nur 3.7% abweichend
(+) | sehr lineare Hochtöne (5.8% Delta zum Vorgänger)
Gesamt im hörbaren Bereich 100 - 16.000 Hz
(+) | hörbarer Bereich ist sehr linear (9.9% Abstand zum Median
Im Vergleich zu allen Geräten derselben Klasse
» 5% aller getesteten Geräte dieser Klasse waren besser, 2% vergleichbar, 94% schlechter
» Das beste Gerät hat einen Delta-Wert von 6%, durchschnittlich ist 18%, das schlechteste Gerät hat 132%
Im Vergleich zu allen Geräten im Test
» 4% aller getesteten Geräte waren besser, 1% vergleichbar, 95% schlechter
» Das beste Gerät hat einen Delta-Wert von 4%, durchschnittlich ist 24%, das schlechteste Gerät hat 134%
Apple MacBook 12 (Early 2016) 1.1 GHz Audio Analyse
(+) | Die Lautsprecher können relativ laut spielen (83.6 dB)
Bass 100 - 315 Hz
(±) | abgesenkter Bass - 11.3% geringer als der Median
(±) | durchschnittlich lineare Bass-Wiedergabe (14.2% Delta zum Vorgänger)
Mitteltöne 400 - 2000 Hz
(+) | ausgeglichene Mitten, vom Median nur 2.4% abweichend
(+) | lineare Mitten (5.5% Delta zum Vorgänger)
Hochtöne 2 - 16 kHz
(+) | ausgeglichene Hochtöne, vom Median nur 2% abweichend
(+) | sehr lineare Hochtöne (4.5% Delta zum Vorgänger)
Gesamt im hörbaren Bereich 100 - 16.000 Hz
(+) | hörbarer Bereich ist sehr linear (10.2% Abstand zum Median
Im Vergleich zu allen Geräten derselben Klasse
» 7% aller getesteten Geräte dieser Klasse waren besser, 2% vergleichbar, 91% schlechter
» Das beste Gerät hat einen Delta-Wert von 5%, durchschnittlich ist 18%, das schlechteste Gerät hat 53%
Im Vergleich zu allen Geräten im Test
» 5% aller getesteten Geräte waren besser, 1% vergleichbar, 94% schlechter
» Das beste Gerät hat einen Delta-Wert von 4%, durchschnittlich ist 24%, das schlechteste Gerät hat 134%
Energiemanagement
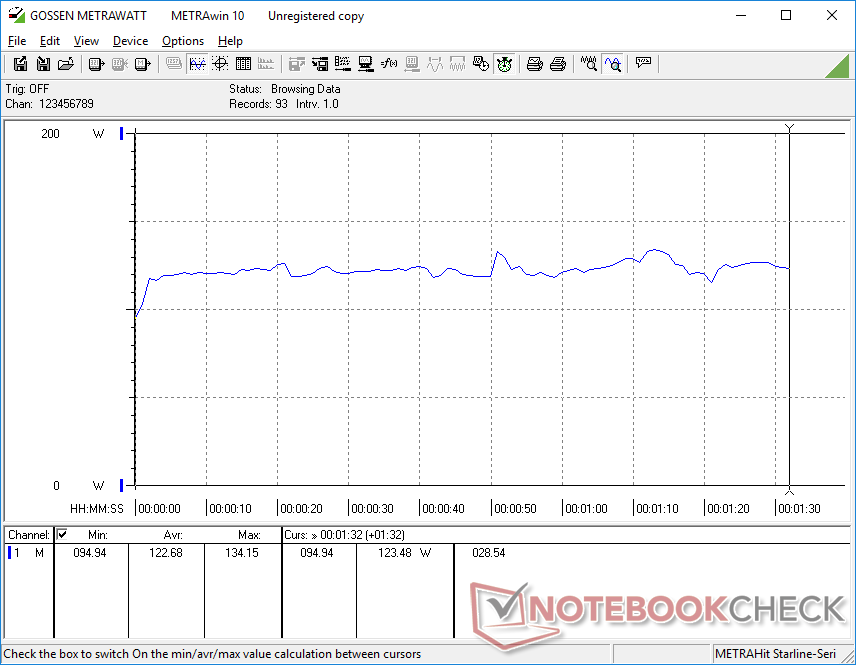
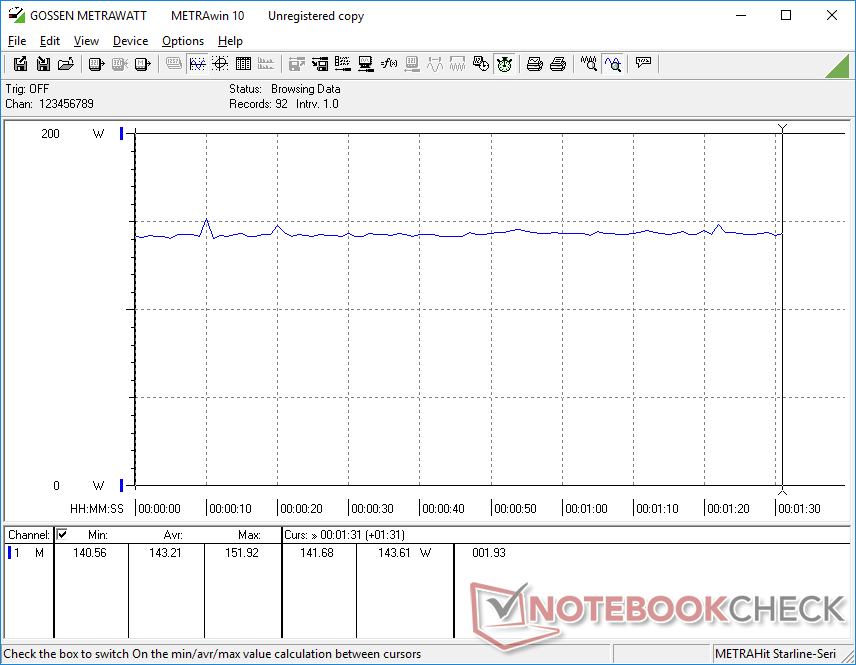
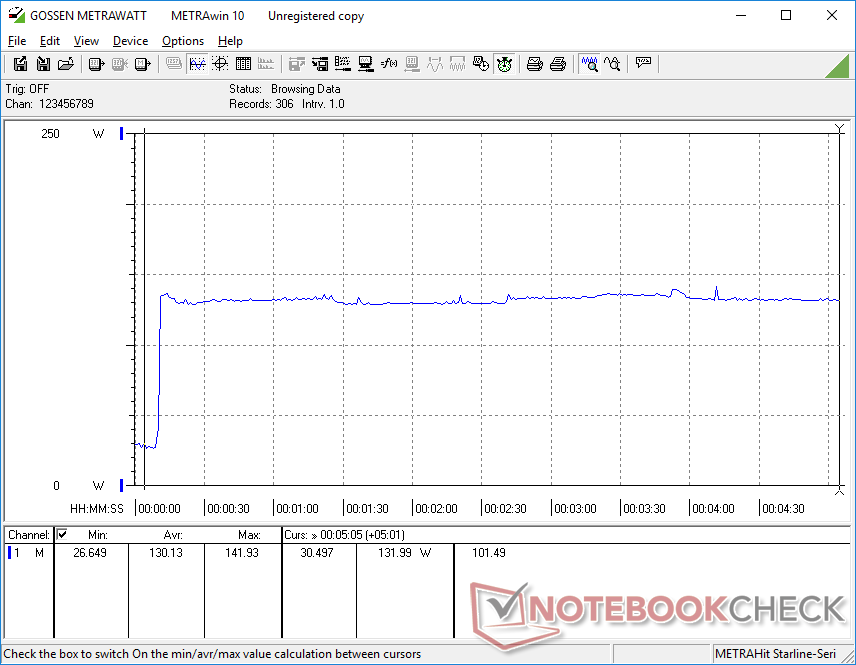
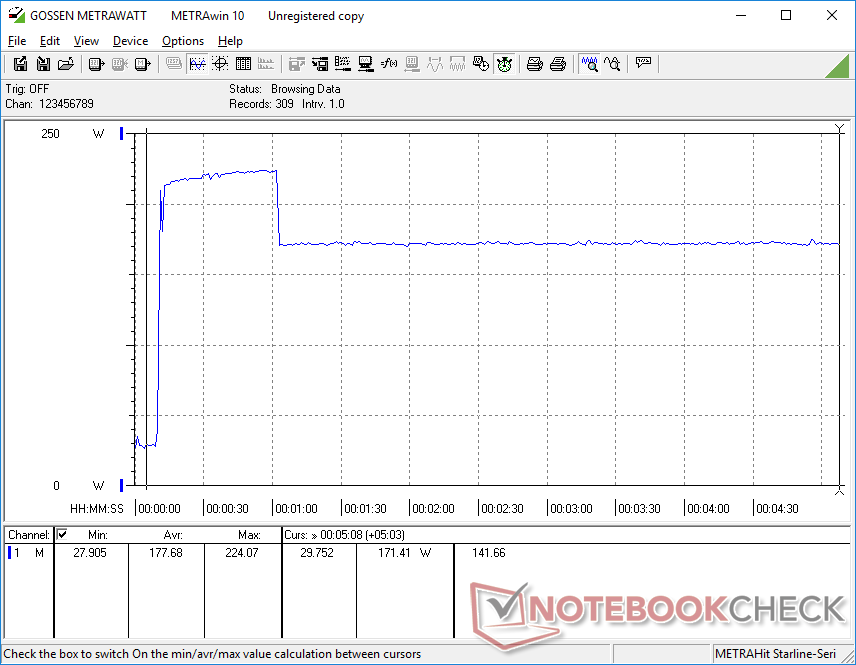
Energieverbrauch
Im Systemleerlauf werden zwischen 10 W und 29 W verbraucht, je nach Leistungsprofil und Displayhelligkeit. Interessant ist, dass der Verbrauch beim Gaming in etwa dem des GU502LW entspricht, auch wenn Letzterer mit einer teureren und leistungsstärkeren RTX 2070 Max-Q ausgestattet ist.
Das mittelgroße Netzteil (~16.5 x 7.6 x 3.2 cm) erlaubt mit seinen 230 W das Aufladen auch während schwerer Workloads.
| Aus / Standby | |
| Idle | |
| Last |
|
Legende:
min: | |
| Asus ROG Zephyrus M15 GU502LU-BI7N4 i7-10750H, GeForce GTX 1660 Ti Mobile, Intel SSD 660p SSDPEKNW512G8, IPS, 1920x1080, 15.6" | Asus ROG Zephyrus M15 GU502L i7-10750H, GeForce RTX 2070 Max-Q, 2x Intel SSD 660p SSDPEKNW512G8 (RAID 0), IPS, 3840x2160, 15.6" | HP Omen 15-ek0456ng i5-10300H, GeForce GTX 1660 Ti Mobile, Toshiba XG6 KXG60ZNV512G, IPS, 1920x1080, 15.6" | Gateway Creator Series 15.6 GWTN156-3BK i5-10300H, GeForce RTX 2060 Mobile, Phison PS5013 PM8256GPTCB4B8TF, IPS, 1920x1080, 15.6" | Lenovo Legion 5 15IMH05H i5-10300H, GeForce RTX 2060 Mobile, Samsung PM991 MZALQ512HALU, IPS, 1920x1080, 15.6" | MSI GP65 10SFK-047US i7-10750H, GeForce RTX 2070 Mobile, Samsung SSD PM981 MZVLB1T0HALR, IPS, 1920x1080, 15.6" | |
|---|---|---|---|---|---|---|
| Stromverbrauch | 6% | 17% | 2% | 38% | -8% | |
| Idle min * (Watt) | 10 | 10 -0% | 9.2 8% | 9.9 1% | 3.2 68% | 14.2 -42% |
| Idle avg * (Watt) | 16.9 | 13 23% | 14.6 14% | 17 -1% | 8.3 51% | 18.8 -11% |
| Idle max * (Watt) | 28.3 | 23 19% | 18.1 36% | 31.9 -13% | 8.7 69% | 23.9 16% |
| Last avg * (Watt) | 122.7 | 137 -12% | 84 32% | 90.5 26% | 82 33% | 96.9 21% |
| Witcher 3 ultra * (Watt) | 143.2 | 140 2% | 142 1% | 162.3 -13% | 151 -5% | 185 -29% |
| Last max * (Watt) | 224.1 | 222 1% | 194 13% | 202.1 10% | 195 13% | 233.4 -4% |
* ... kleinere Werte sind besser
Akkulaufzeit
| Asus ROG Zephyrus M15 GU502LU-BI7N4 i7-10750H, GeForce GTX 1660 Ti Mobile, 76 Wh | Asus ROG Zephyrus M15 GU502L i7-10750H, GeForce RTX 2070 Max-Q, 76 Wh | HP Omen 15-ek0456ng i5-10300H, GeForce GTX 1660 Ti Mobile, 70.91 Wh | Gateway Creator Series 15.6 GWTN156-3BK i5-10300H, GeForce RTX 2060 Mobile, 46.74 Wh | Lenovo Legion 5 15IMH05H i5-10300H, GeForce RTX 2060 Mobile, 60 Wh | MSI GP65 10SFK-047US i7-10750H, GeForce RTX 2070 Mobile, 51 Wh | |
|---|---|---|---|---|---|---|
| Akkulaufzeit | -7% | 10% | 37% | 22% | -37% | |
| WLAN (h) | 5.9 | 5.5 -7% | 6.5 10% | 8.1 37% | 7.2 22% | 3.7 -37% |
| Idle (h) | 8.6 | 11.7 | 14.1 | |||
| Last (h) | 1.5 | 1.7 | 1.4 |
Pro
Contra
Fazit
Bei den Asus-Zephyrus-Laptops hat der Turbo-Modus eine größere Auswirkung als bei den meisten MSI-Laptops. Nutzer sollten daher den Turbo-Modus nicht mit dem Performance-Modus verwechseln. Letzterer bietet durch eine niedrigere Lüfterdrehzahl (und damit leisere Lüfter) nur geringere Taktraten bei gleichzeitig höheren Temperaturen.
Abgesehen von den verwirrenden Leistungsprofilen und ihren Effekten auf die Performance könnte das GU502LU angesichts des Preises von 1.400 US-Dollar (~1.200 Euro) durchaus besser sein. Die verbaute GTX 1660 Ti GPU, die schwache Farbraumabdeckung und die langsamen Display-Reaktionszeiten sind eigentlich in Budget-Laptops üblich, die normalerweise einige hundert Euro weniger kosten als das Asus. Stattdessen bezahlt man den höheren Preis für das relativ dünne und leichte Gehäuse, denn preiswertere Alternativen, wie das Acer Nitro series, das HP Pavilion Gaming, das MSI GP65 oder das Dell G3, warten zumeist mit dickeren, schwereren und oft auch optisch weniger ansprechenden Designs auf.
Hier trifft eine Budget-Gaming-Leistung auf einen Mittelklassepreis. Letzteren zahlt man vor allem für das dünnere, leichtere und somit portablere Gehäusedesign. Ansonsten findet man die gleiche CPU-/GPU-Kombination mit dem gleichen Display in preiswerteren, aber auch schwereren Gaming-Laptops.
Asus ROG Zephyrus M15 GU502LU-BI7N4
- 12.10.2020 v7 (old)
Allen Ngo
Preisvergleich

