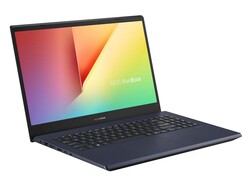
Asus VivoBook 15 K571LI Laptop im Test: Gaming-Multimedia-Hybrid
Die VivoBook-Serie umfasst Multimedia-Laptops und Ultrabooks der mittleren Preisklasse, die Asus als günstigere Alternative zur Flaggschiff-ZenBook-Serie entwickelt. In diesem Fall handelt es sich bei unserem VivoBook 15 K571LI um ein höherwertiges Modell der Familie, das sich an Performance-Nutzer richtet, die nicht bereit sind, hunderte von Euros mehr für ein HP Envy 15, MacBook Pro 15 oder Dell XPS 15 auszugeben. Es bietet viele der gleichen Hochleistungskomponenten, einschließlich CPUs der Core-H-Serie und GeForce-GTX-Grafikprozessoren, ohne dabei das Konto zu räumen.
Unsere vollausgestattete Testeinheit kommt von Computer Upgrade King und kostet derzeit rund 1000 Euro. Jedoch gibt es auch kleinere SKUs ohne Core-i7-CPU, 120 Hz 1080p-Display, 1 TB SSD und 40 GB RAM.
Weitere Asus-Laptops im Notebookcheck:
Bew. | Datum | Modell | Gewicht | Dicke | Größe | Auflösung | Preis ab |
|---|---|---|---|---|---|---|---|
| 78.6 % v7 (old) | 09 / 2020 | Asus VivoBook 15 K571LI-PB71 i7-10750H, GeForce GTX 1650 Ti Mobile | 2.1 kg | 21.9 mm | 15.60" | 1920x1080 | |
| 83 % v7 (old) | 08 / 2020 | HP Envy 15-ep0098nr i7-10750H, GeForce RTX 2060 Max-Q | 2 kg | 19 mm | 15.60" | 3840x2160 | |
| 81.5 % v7 (old) | 04 / 2020 | Acer Aspire 5 A515-54G i5-10210U, GeForce MX250 | 1.7 kg | 17.9 mm | 15.60" | 1920x1080 | |
| 85.2 % v7 (old) | 03 / 2020 | Asus ZenBook 15 UX534FTC-A8190T i7-10510U, GeForce GTX 1650 Max-Q | 1.6 kg | 18.9 mm | 15.60" | 1920x1080 | |
| 81.4 % v7 (old) | 01 / 2020 | Lenovo Ideapad S540-15IML i5-10210U, GeForce MX250 | 1.9 kg | 17 mm | 15.60" | 1920x1080 | |
| 79.7 % v6 (old) | 08 / 2019 | Dell Inspiron 15 5000 5585 R7 3700U, Vega 10 | 1.8 kg | 19.5 mm | 15.60" | 1920x1080 |
Gehäuse
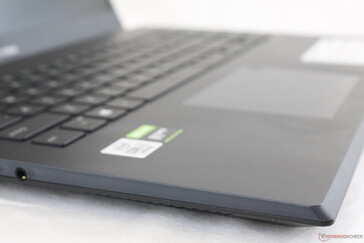
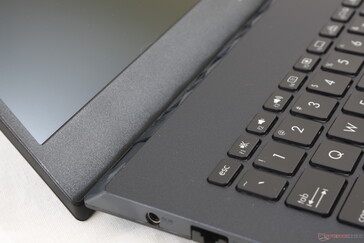
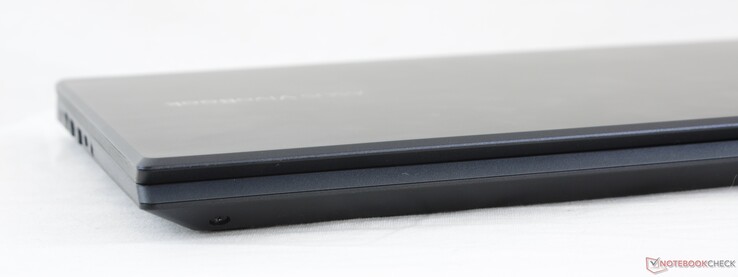
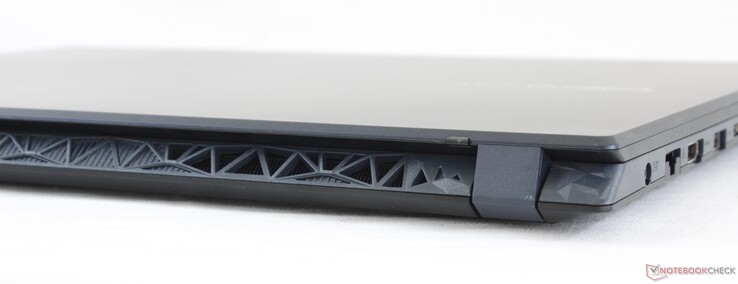
Die VivoBook-15-K571-Serie verwendet ein anderes Gehäusedesign als die VivoBook-15-F512-Serie, um die schnelleren Prozessoren unterzubringen. Die Steifigkeit des Chassis bleibt in etwa gleich, da es nach wie vor überwiegend aus Kunststoff besteht. Sowohl der Boden als auch der Deckel lassen sich im Vergleich zur HP-Pavilion-Gaming-Serie leichter auf Druck biegen und sind etwas steifer als die Lenovo-Legion-Y540-Serie. Es ist angemessen für ein System unter 1000 Euro, solange die Benutzer keine Razer-, MacBook- oder ZenBook-Metallmaterialien erwarten.
Das Gehäuse ist größer und schwerer als viele andere Multimedia-Notebooks wie das HP Envy, ZenBook 15 oder Lenovo IdeaPad S540, was vorallem auf die leistungsstärkeren CPU- und GPU-Optionen zurückzuführen ist. Es liegt zwischen traditionelleren Ultrabooks und Gaming-Notebooks der Einstiegsklasse wie dem MSI-GP65- oder der TUF-A15-Serie und ist damit für seine Leistung recht kompakt.
Konnektivität
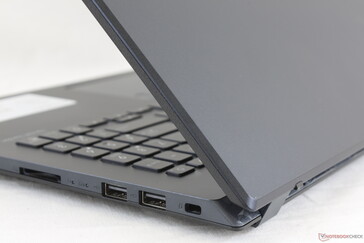
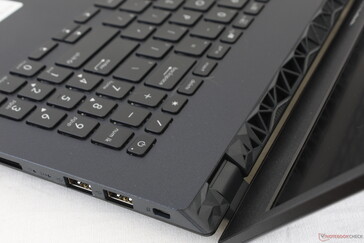
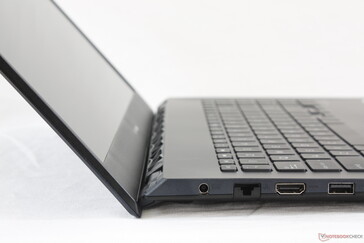
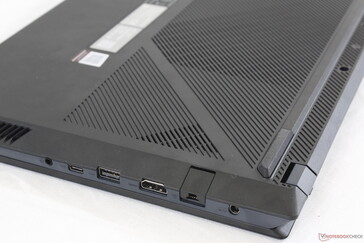
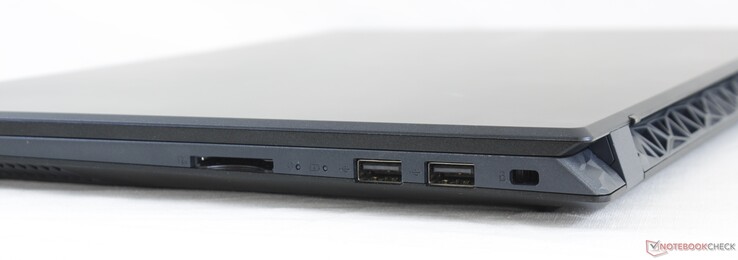
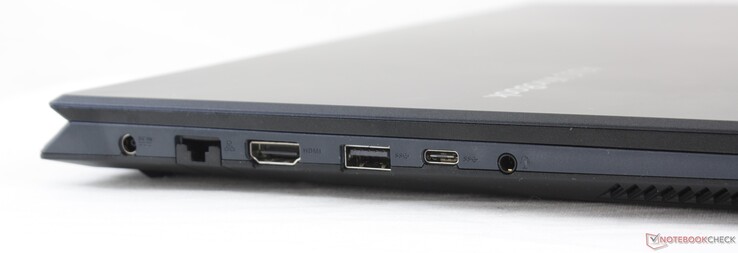
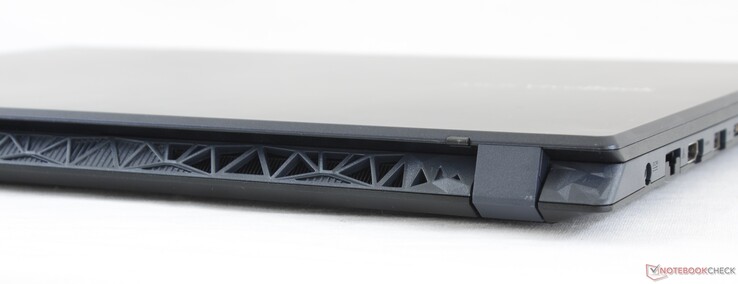
Obwohl das System eine gute Auswahl an Anschlüssen integriert, ist zu bedenken, dass diese dicht beieinander liegen. Dicke Kabel und Stecker könnten zum Problem werden. Wir haben versucht, einen externen Monitor über USB-C anzuschließen, aber ohne Erfolg.
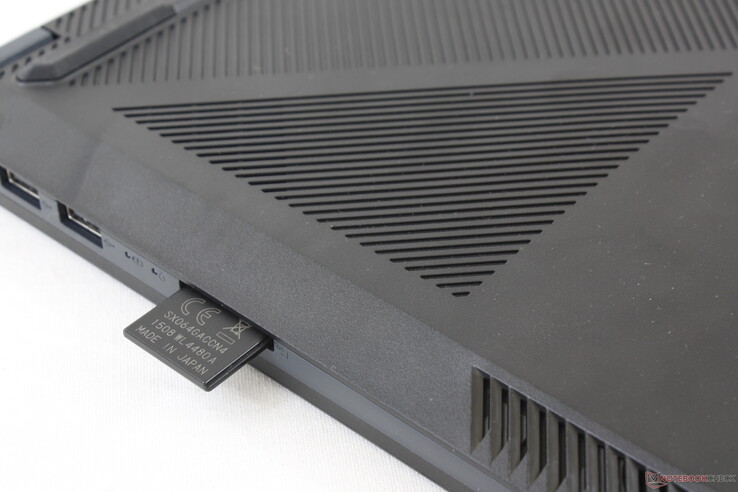
SD-Kartenlesegerät
| SD Card Reader | |
| average JPG Copy Test (av. of 3 runs) | |
| Lenovo Ideapad S540-15IML (Toshiba Exceria Pro SDXC 64 GB UHS-II) | |
| HP Envy 15-ep0098nr (Toshiba Exceria Pro M501 UHS-II) | |
| Dell Inspiron 15 5000 5585 (Toshiba Exceria Pro SDXC 64 GB UHS-II) | |
| Asus VivoBook 15 K571LI-PB71 (Toshiba Exceria Pro SDXC 64 GB UHS-II) | |
| maximum AS SSD Seq Read Test (1GB) | |
| HP Envy 15-ep0098nr (Toshiba Exceria Pro M501 UHS-II) | |
| Lenovo Ideapad S540-15IML (Toshiba Exceria Pro SDXC 64 GB UHS-II) | |
| Dell Inspiron 15 5000 5585 (Toshiba Exceria Pro SDXC 64 GB UHS-II) | |
| Asus VivoBook 15 K571LI-PB71 (Toshiba Exceria Pro SDXC 64 GB UHS-II) | |
Kommunikation
Webcam
Wartung
Zubehör und Garantie
Außer dem Netzteil und dem Papierkram enthält die Box keine Extras. Es gilt die standardmäßige einjährige beschränkte Garantie, während, wie in unserem Fall, einzelne vom Verkäufer aufgerüstete Komponenten gegebenenfalls länger abgedeckt sind.
Eingabegeräte
Tastatur
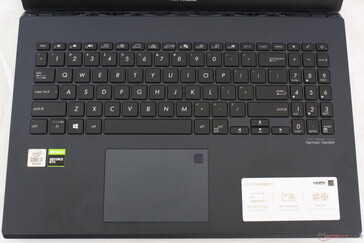
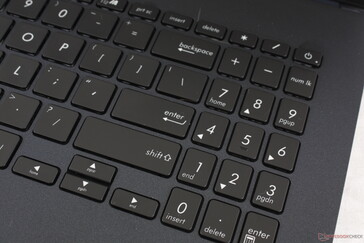
Das Tippen auf der hintergrundbeleuchteten Tastatur ist aufgrund des zufriedenstellenden Tastenfeedbacks und des geringen Wegs komfortabel. Wir bevorzugen die festeren und tieferen Tasten eines HP Envy, Spectre, MSI SteelSeries oder der Lenovo-ThinkPad-T-Serie, doch sind diese Laptops alle wesentlich teurer. Nutzen Sie regelmäßig Pfeiltasten und NumPad, sind Sie mit einer USB-Tastatur besser bedient, da diese Tasten schwammiger und kleiner als die regulären QWERTZ-Tasten sind.
Touchpad
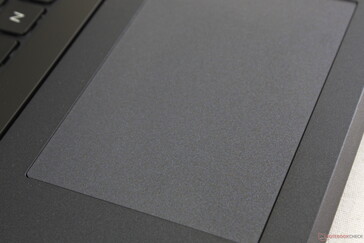
Das glatte Clickpad (10,5 x 7,5 cm) ist kleiner als das des HP Envy 15 (12,5 x 7,5 cm). Es funktioniert gut genug für eine einfache Cursorsteuerung mit genau dem richtigen Maß an Haftung beim Gleiten bei langsamen Geschwindigkeiten, aber die integrierten Maustasten könnten fester sein. Drag&Drop-Aktionen werden erschwert, da der Cursor manchmal springt oder an Ort und Stelle verharrt, wenn zwei oder mehr Finger die Oberfläche berühren. Seine Multi-Touch-Erkennung könnte in dieser Hinsicht definitiv besser sein.
Display
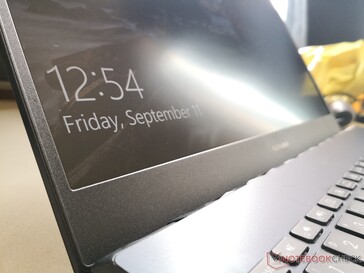
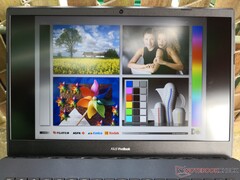
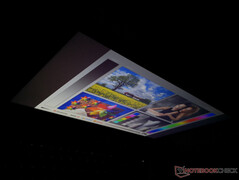
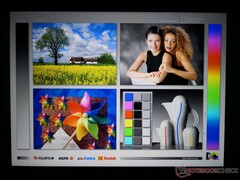
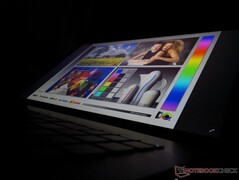
Das Panda-LM156LF-IPS-Panel ähnelt dem im ROG Strix G GL531GV, TUF FX505DY, ROG Strix G15 G512LI oder Acer Nitro 5 AN515. Es zeichnet sich durch eine native Bildwiederholrate von 120 Hz für ultraglatte Cursorsteuerung und -bewegung aus, aber seine Farben und Reaktionszeiten sind anderen Displays mit hoher Bildwiederholrate von LG oder BOE unterlegen. Im Vergleich zu anderen Laptops dieser Preisklasse sind hier die Farben weniger lebhaft und Ghosting deutlicher wahrnehmbar.
Asus bietet zwar eine Displayoption mit breiterer Farbdeckung an, diese ist jedoch im Gegensatz zu unserem 120-Hz-Panel auf eine Bildwiederholrate von 60 Hz beschränkt, sodass Kunden vor der Entscheidung stehen, was ihnen wichtiger ist.
| |||||||||||||||||||||||||
Ausleuchtung: 87 %
Helligkeit Akku: 263.9 cd/m²
Kontrast: 1015:1 (Schwarzwert: 0.26 cd/m²)
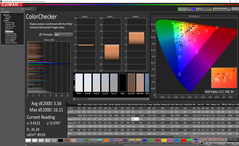
ΔE ColorChecker Calman: 5.56 | ∀{0.5-29.43 Ø4.77}
calibrated: 4.3
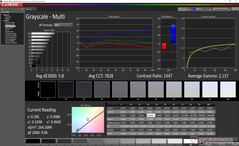
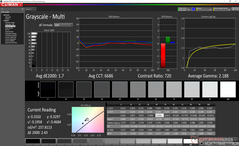
ΔE Greyscale Calman: 5.8 | ∀{0.09-98 Ø5}
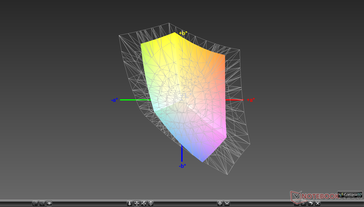
60.1% sRGB (Argyll 1.6.3 3D)
38.2% AdobeRGB 1998 (Argyll 1.6.3 3D)
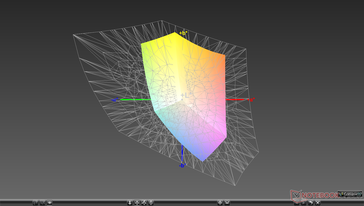
41.56% AdobeRGB 1998 (Argyll 3D)
60.4% sRGB (Argyll 3D)
40.2% Display P3 (Argyll 3D)
Gamma: 2.16
CCT: 7828 K
| Asus VivoBook 15 K571LI-PB71 Panda LM156LF-GL03, IPS, 15.6", 1920x1080 | HP Envy 15-ep0098nr Samsung SDC4145, AMOLED, 15.6", 3840x2160 | Acer Aspire 5 A515-54G LG Display LP156WFC SPD1, IPS, 15.6", 1920x1080 | Asus ZenBook 15 UX534FTC-A8190T BOE CQ NV156FHM-N63, IPS, 15.6", 1920x1080 | Lenovo Ideapad S540-15IML BOEhydis NV156FHM-N61 (BOE06FB), IPS, 15.6", 1920x1080 | Dell Inspiron 15 5000 5585 LG Philips 156WFC, IPS, 15.6", 1920x1080 | |
|---|---|---|---|---|---|---|
| Display | 109% | -16% | 52% | 54% | -7% | |
| Display P3 Coverage (%) | 40.2 | 88.5 120% | 33.78 -16% | 65 62% | 66.8 66% | 37.31 -7% |
| sRGB Coverage (%) | 60.4 | 100 66% | 50.8 -16% | 86.2 43% | 86.5 43% | 56.2 -7% |
| AdobeRGB 1998 Coverage (%) | 41.56 | 99.9 140% | 34.9 -16% | 62.9 51% | 63.2 52% | 38.55 -7% |
| Response Times | 93% | -16% | -46% | -60% | -7% | |
| Response Time Grey 50% / Grey 80% * (ms) | 28.4 ? | 0.8 ? 97% | 36 ? -27% | 45 ? -58% | 49.6 ? -75% | 28.4 ? -0% |
| Response Time Black / White * (ms) | 24 ? | 2.7 ? 89% | 25 ? -4% | 32 ? -33% | 34.8 ? -45% | 27.2 ? -13% |
| PWM Frequency (Hz) | 242.7 ? | 202 ? | ||||
| Bildschirm | 45% | 6% | 28% | 25% | -1% | |
| Helligkeit Bildmitte (cd/m²) | 263.9 | 374.3 42% | 248 -6% | 299 13% | 299 13% | 253.6 -4% |
| Brightness (cd/m²) | 246 | 379 54% | 238 -3% | 280 14% | 278 13% | 227 -8% |
| Brightness Distribution (%) | 87 | 91 5% | 86 -1% | 89 2% | 87 0% | 84 -3% |
| Schwarzwert * (cd/m²) | 0.26 | 0.23 12% | 0.21 19% | 0.25 4% | 0.27 -4% | |
| Kontrast (:1) | 1015 | 1078 6% | 1424 40% | 1196 18% | 939 -7% | |
| Delta E Colorchecker * | 5.56 | 5.47 2% | 5.05 9% | 4.76 14% | 4.32 22% | 6.05 -9% |
| Colorchecker dE 2000 max. * | 16.11 | 8.22 49% | 14.34 11% | 9 44% | 9.3 42% | 14.03 13% |
| Colorchecker dE 2000 calibrated * | 4.3 | 4.61 -7% | 4.76 -11% | 2.58 40% | 4.97 -16% | |
| Delta E Graustufen * | 5.8 | 2.3 60% | 1.37 76% | 3.53 39% | 4.21 27% | 3.2 45% |
| Gamma | 2.16 102% | 2.09 105% | 2.4 92% | 2.3 96% | 2.39 92% | 2 110% |
| CCT | 7828 83% | 6340 103% | 6592 99% | 7228 90% | 6799 96% | 6820 95% |
| Farbraum (Prozent von AdobeRGB 1998) (%) | 38.2 | 87.8 130% | 32 -16% | 56 47% | 57 49% | 35.5 -7% |
| Color Space (Percent of sRGB) (%) | 60.1 | 100 66% | 51 -15% | 86 43% | 86 43% | 55.6 -7% |
| Durchschnitt gesamt (Programm / Settings) | 82% /
65% | -9% /
-1% | 11% /
23% | 6% /
20% | -5% /
-3% |
* ... kleinere Werte sind besser
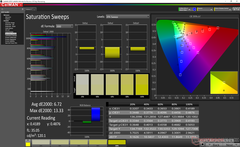
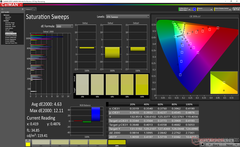
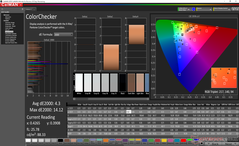
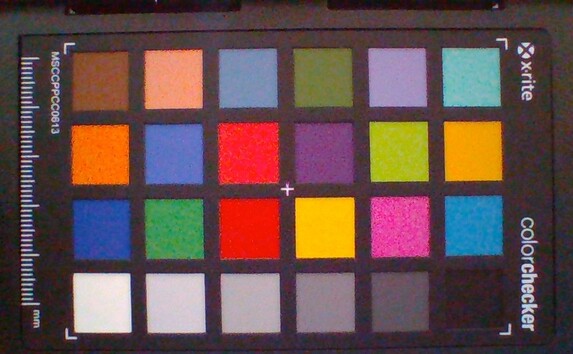
Die Anzeige ist im Lieferzustand mit einer zu kühlen Farbtemperatur und einem relativ hohen Graustufen-DeltaE-Wert von 5,8 nicht gut kalibriert. Wir konnten die Werte durch eigene Kalibrierung deutlich verbessern, doch wurden die Farben aufgrund des oben erwähnten begrenzten Farbraumes mit größeren Sättigungen zunehmend ungenau.
Reaktionszeiten (Response Times) des Displays
| ↔ Reaktionszeiten Schwarz zu Weiß | ||
|---|---|---|
| 24 ms ... steigend ↗ und fallend ↘ kombiniert | ↗ 13.2 ms steigend | |
| ↘ 10.8 ms fallend | ||
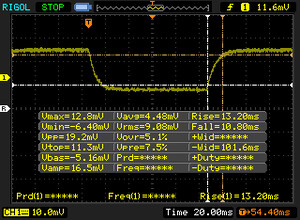
| Die gemessenen Reaktionszeiten sind gut, für anspruchsvolle Spieler könnten der Bildschirm jedoch zu langsam sein. Im Vergleich rangierten die bei uns getesteten Geräte von 0.1 (Minimum) zu 240 (Maximum) ms. » 53 % aller Screens waren schneller als der getestete. Daher sind die gemessenen Reaktionszeiten schlechter als der Durchschnitt aller vermessenen Geräte (20.2 ms). | ||
| ↔ Reaktionszeiten 50% Grau zu 80% Grau | ||
| 28.4 ms ... steigend ↗ und fallend ↘ kombiniert | ↗ 16.8 ms steigend | |
| ↘ 11.6 ms fallend | ||
| Die gemessenen Reaktionszeiten sind mittelmäßig und dadurch für Spieler eventuell zu langsam. Im Vergleich rangierten die bei uns getesteten Geräte von 0.165 (Minimum) zu 636 (Maximum) ms. » 37 % aller Screens waren schneller als der getestete. Daher sind die gemessenen Reaktionszeiten durchschnittlich (31.5 ms). | ||
Bildschirm-Flackern / PWM (Pulse-Width Modulation)
| Flackern / PWM nicht festgestellt | |||
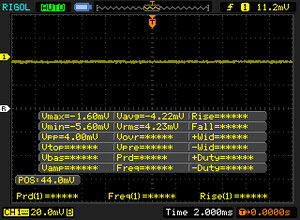
Im Vergleich: 53 % aller getesteten Geräte nutzten kein PWM um die Helligkeit zu reduzieren. Wenn PWM eingesetzt wurde, dann bei einer Frequenz von durchschnittlich 8070 (Minimum 5, Maximum 343500) Hz. | |||
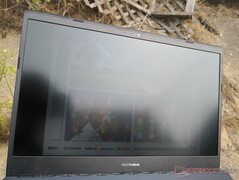
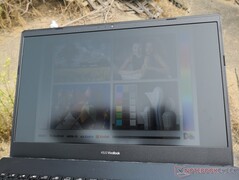
Die Sichtbarkeit im Freien ist aufgrund der zu schwachen 250-Nit-Hintergrundbeleuchtung und der unvermeidlichen Umgebungsreflexionen gerade so durchschnittlich. ZenBooks und insbesondere das Dell XPS 15 oder MacBook Pro 15 bieten hellere Bildschirme.
Leistung
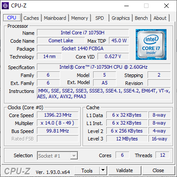
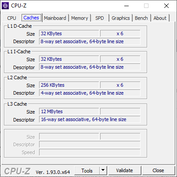
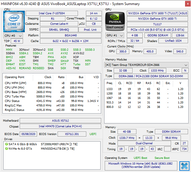
Der Core i7-10750H, die GeForce GTX 1650 Ti und das 120-Hz-Display sind die kennzeichnenden Merkmale der VivoBook-15-K571-Serie. Während solche Komponenten bei Gaming-Notebooks der Einstiegsklasse üblich sind, können auch "normale" Leistungsanwender von der Hardware profitieren, insbesondere diejenigen, die etwas schnelleres als die übliche Core-U-Serie oder integrierte Grafiklösungen möchten.
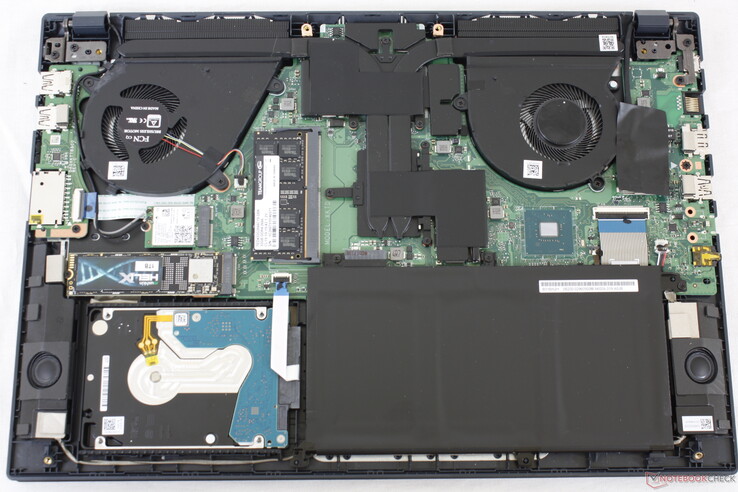
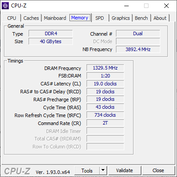
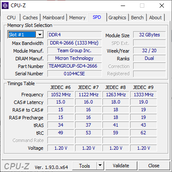
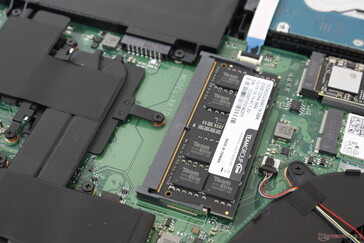
Sowohl gelöteter als auch entfernbarer RAM sind ähnlich wie bei einigen Asus-ROG-Laptops vorhanden. 4 GB oder 8 GB sind je nach Konfiguration neben einem einzelnen SODIMM-Steckplatz verlötet, der bis zu 32 GB für ein kombiniertes Maximum von 40 GB unterstützt.
Optimus sorgt für automatische Grafikumschaltung. Unser Gerät wurde für die nachfolgenden Leistungsbenchmarks auf High-Performance-Modus gesetzt.
Prozessor
Die CPU-Leistung ist enttäuschend und etwa 15 bis 20 Prozent langsamer als ein durchschnittlicher Laptop unserer Datenbank mit der gleichen Core i7-10750H-CPU. Dieses Defizit reicht aus, um unseren Asus unter den Core i7-9750H der letzten Generation zu stellen, den der Core i7-10750H verdrängen sollte. Das Turbo-Boost-Potenzial ist ebenfalls gering, wie die untenstehenden Ergebnisse unserer CineBench-R15-xT-Schleife zeigen. Nichtsdestotrotz wird die Multi-Thread-Leistung immer noch etwa 20 Prozent besser sein als die kleinere Core-i5-10300H-Option.
Weitere technische Informationen und Benchmarks finden Sie auf unserer speziellen Seite über den Core i7-10750H.
Cinebench R15: CPU Multi 64Bit | CPU Single 64Bit
Blender: v2.79 BMW27 CPU
7-Zip 18.03: 7z b 4 -mmt1 | 7z b 4
Geekbench 5.5: Single-Core | Multi-Core
HWBOT x265 Benchmark v2.2: 4k Preset
LibreOffice : 20 Documents To PDF
R Benchmark 2.5: Overall mean
| Cinebench R20 / CPU (Multi Core) | |
| Dell G5 15 SE 5505 P89F | |
| Asus ROG Strix Scar 15 G532LWS | |
| HP Pavilion Gaming 15-ec1206ng | |
| Dell XPS 15 9500 Core i7 4K UHD | |
| Durchschnittliche Intel Core i7-10750H (1749 - 3325, n=43) | |
| Lenovo IdeaPad S740-15IRH | |
| Asus VivoBook 15 K571LI-PB71 | |
| Dell XPS 15 9500 Core i5 | |
| Asus ZenBook 15 UX534FTC-A8190T | |
| Dell G5 15 5590-PCNJJ | |
| Cinebench R20 / CPU (Single Core) | |
| Dell XPS 15 9500 Core i7 4K UHD | |
| Asus ROG Strix Scar 15 G532LWS | |
| Dell G5 15 SE 5505 P89F | |
| Durchschnittliche Intel Core i7-10750H (431 - 504, n=43) | |
| Asus VivoBook 15 K571LI-PB71 | |
| Asus ZenBook 15 UX534FTC-A8190T | |
| Lenovo IdeaPad S740-15IRH | |
| Dell XPS 15 9500 Core i5 | |
| HP Pavilion Gaming 15-ec1206ng | |
| Dell G5 15 5590-PCNJJ | |
| Cinebench R15 / CPU Multi 64Bit | |
| Dell G5 15 SE 5505 P89F | |
| Asus ROG Strix Scar 15 G532LWS | |
| HP Pavilion Gaming 15-ec1206ng | |
| Dell XPS 15 9500 Core i7 4K UHD | |
| Durchschnittliche Intel Core i7-10750H (804 - 1418, n=50) | |
| Lenovo IdeaPad S740-15IRH | |
| Asus VivoBook 15 K571LI-PB71 | |
| Dell XPS 15 9500 Core i5 | |
| Asus ZenBook 15 UX534FTC-A8190T | |
| Dell G5 15 5590-PCNJJ | |
| Cinebench R15 / CPU Single 64Bit | |
| Asus ROG Strix Scar 15 G532LWS | |
| Dell XPS 15 9500 Core i7 4K UHD | |
| Durchschnittliche Intel Core i7-10750H (184 - 213, n=45) | |
| Asus VivoBook 15 K571LI-PB71 | |
| Lenovo IdeaPad S740-15IRH | |
| Dell G5 15 SE 5505 P89F | |
| Asus ZenBook 15 UX534FTC-A8190T | |
| Dell XPS 15 9500 Core i5 | |
| HP Pavilion Gaming 15-ec1206ng | |
| Dell G5 15 5590-PCNJJ | |
| Blender / v2.79 BMW27 CPU | |
| Dell XPS 15 9500 Core i5 | |
| Asus VivoBook 15 K571LI-PB71 | |
| Durchschnittliche Intel Core i7-10750H (322 - 587, n=43) | |
| Dell XPS 15 9500 Core i7 4K UHD | |
| HP Pavilion Gaming 15-ec1206ng | |
| Asus ROG Strix Scar 15 G532LWS | |
| Dell G5 15 SE 5505 P89F | |
| 7-Zip 18.03 / 7z b 4 -mmt1 | |
| Asus ROG Strix Scar 15 G532LWS | |
| Dell XPS 15 9500 Core i7 4K UHD | |
| Asus VivoBook 15 K571LI-PB71 | |
| Durchschnittliche Intel Core i7-10750H (4504 - 5470, n=43) | |
| Dell XPS 15 9500 Core i5 | |
| Dell G5 15 SE 5505 P89F | |
| HP Pavilion Gaming 15-ec1206ng | |
| 7-Zip 18.03 / 7z b 4 | |
| Dell G5 15 SE 5505 P89F | |
| Asus ROG Strix Scar 15 G532LWS | |
| HP Pavilion Gaming 15-ec1206ng | |
| Dell XPS 15 9500 Core i7 4K UHD | |
| Durchschnittliche Intel Core i7-10750H (26040 - 37345, n=43) | |
| Asus VivoBook 15 K571LI-PB71 | |
| Dell XPS 15 9500 Core i5 | |
| Geekbench 5.5 / Single-Core | |
| Asus ROG Strix Scar 15 G532LWS | |
| Dell XPS 15 9500 Core i7 4K UHD | |
| Asus VivoBook 15 K571LI-PB71 | |
| Durchschnittliche Intel Core i7-10750H (1114 - 1333, n=43) | |
| Asus ZenBook 15 UX534FTC-A8190T | |
| Dell XPS 15 9500 Core i5 | |
| Dell G5 15 SE 5505 P89F | |
| HP Pavilion Gaming 15-ec1206ng | |
| Geekbench 5.5 / Multi-Core | |
| Asus ROG Strix Scar 15 G532LWS | |
| Dell XPS 15 9500 Core i7 4K UHD | |
| Dell G5 15 SE 5505 P89F | |
| Asus VivoBook 15 K571LI-PB71 | |
| Durchschnittliche Intel Core i7-10750H (4443 - 6674, n=43) | |
| HP Pavilion Gaming 15-ec1206ng | |
| Asus ZenBook 15 UX534FTC-A8190T | |
| Dell XPS 15 9500 Core i5 | |
| HWBOT x265 Benchmark v2.2 / 4k Preset | |
| Asus ROG Strix Scar 15 G532LWS | |
| Dell G5 15 SE 5505 P89F | |
| HP Pavilion Gaming 15-ec1206ng | |
| Dell XPS 15 9500 Core i7 4K UHD | |
| Durchschnittliche Intel Core i7-10750H (5.54 - 11.6, n=43) | |
| Asus VivoBook 15 K571LI-PB71 | |
| Dell XPS 15 9500 Core i5 | |
| LibreOffice / 20 Documents To PDF | |
| HP Pavilion Gaming 15-ec1206ng | |
| Dell G5 15 SE 5505 P89F | |
| Dell XPS 15 9500 Core i5 | |
| Durchschnittliche Intel Core i7-10750H (43.1 - 99.2, n=43) | |
| Dell XPS 15 9500 Core i7 4K UHD | |
| Asus ROG Strix Scar 15 G532LWS | |
| Asus VivoBook 15 K571LI-PB71 | |
| R Benchmark 2.5 / Overall mean | |
| Dell XPS 15 9500 Core i5 | |
| Durchschnittliche Intel Core i7-10750H (0.578 - 0.708, n=42) | |
| HP Pavilion Gaming 15-ec1206ng | |
| Asus VivoBook 15 K571LI-PB71 | |
| Dell XPS 15 9500 Core i7 4K UHD | |
| Dell G5 15 SE 5505 P89F | |
| Asus ROG Strix Scar 15 G532LWS | |
* ... kleinere Werte sind besser
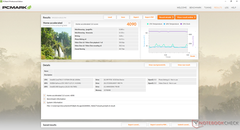
| PCMark 8 Home Score Accelerated v2 | 4090 Punkte | |
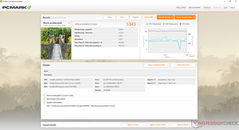
| PCMark 8 Work Score Accelerated v2 | 5343 Punkte | |
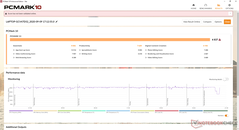
| PCMark 10 Score | 4837 Punkte | |
Hilfe | ||
DPC Latenzen
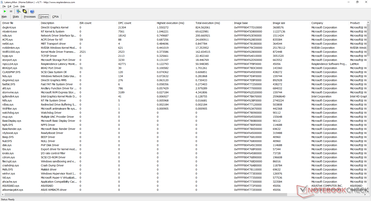
| DPC Latencies / LatencyMon - interrupt to process latency (max), Web, Youtube, Prime95 | |
| Dell XPS 15 9500 Core i7 4K UHD | |
| HP Envy 15-ep0098nr | |
| Dell G5 15 SE 5505 P89F | |
| Dell XPS 15 9500 Core i5 | |
| Asus ROG Strix Scar 15 G532LWS | |
| Asus ROG Strix G15 G512LI | |
| Asus VivoBook 15 K571LI-PB71 | |
| HP Pavilion Gaming 15-ec1206ng | |
| Acer Nitro 5 AN517-52-77DS | |
* ... kleinere Werte sind besser
Massenspeicher
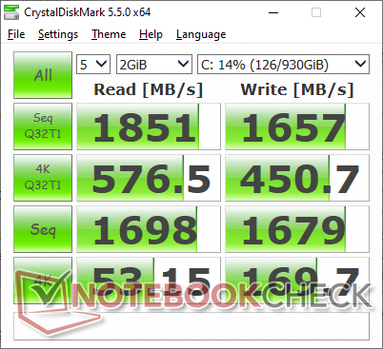
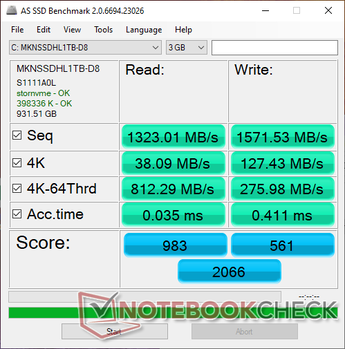
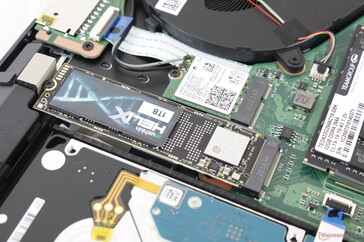
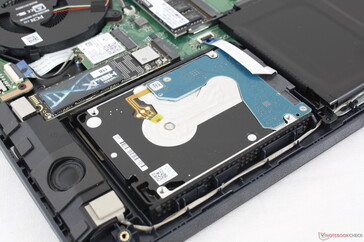
Das System unterstützt eine M.2-2280-SSD und ein zweites 2,5-Zoll-SATA-III-Laufwerk, das sich unter der rechten Handballenauflage befindet. Computer Upgrade King hat unser Gerät mit einer 1-TB-Mushkin-Helix-MKNSSDHL1TB-08-NVMe-SSD konfiguriert. Erwarten Sie andere Hersteller, wenn Sie den Laptop woanders kaufen. Die Mushkin-SSD ist ein NVMe-Laufwerk der Mittelklasse mit sequentiellen Lese- und Schreibraten von 2110 MB/s bzw. 1700 MB/s und hält mit anderen Multimedia-Laptops der Budget- bis Mittelklasse wie dem Acer Aspire 5 mit. Kostspieligere Laptops wie die ZenBook-Serie von Asus neigen dazu, stattdessen mit dem schnelleren Samsung-PM981-Laufwerk ausgeliefert zu werden.
| Asus VivoBook 15 K571LI-PB71 Mushkin Helix-L 1TB MKNSSDHL1TB-08 | HP Envy 15-ep0098nr Intel Optane Memory H10 with Solid State Storage 32GB + 512GB HBRPEKNX0202A(L/H) | Acer Aspire 5 A515-54G Kingston RBUSNS8154P3512GJ1 | Asus ZenBook 15 UX534FTC-A8190T Samsung SSD PM981 MZVLB1T0HALR | Lenovo Ideapad S540-15IML Samsung SSD PM981a MZVLB512HBJQ | Dell Inspiron 15 5000 5585 WDC PC SN520 SDAPNUW-512G | |
|---|---|---|---|---|---|---|
| AS SSD | -5% | 31% | 63% | 119% | -0% | |
| Seq Read (MB/s) | 1323 | 1005 -24% | 1405 6% | 2643 100% | 2642 100% | 398.9 -70% |
| Seq Write (MB/s) | 1572 | 436.8 -72% | 953 -39% | 1533 -2% | 2433 55% | 884 -44% |
| 4K Read (MB/s) | 38.09 | 51.5 35% | 54 42% | 49.12 29% | 58 52% | 34.54 -9% |
| 4K Write (MB/s) | 127.4 | 88 -31% | 93 -27% | 134.7 6% | 145.3 14% | 82.1 -36% |
| 4K-64 Read (MB/s) | 812 | 517 -36% | 959 18% | 1028 27% | 1431 76% | 647 -20% |
| 4K-64 Write (MB/s) | 276 | 839 204% | 772 180% | 1353 390% | 1753 535% | 985 257% |
| Access Time Read * (ms) | 0.035 | 0.088 -151% | 0.051 -46% | 0.033 6% | 0.072 -106% | 0.072 -106% |
| Access Time Write * (ms) | 0.411 | 0.151 63% | 0.044 89% | 0.028 93% | 0.027 93% | 0.047 89% |
| Score Read (Points) | 983 | 669 -32% | 1153 17% | 1342 37% | 1753 78% | 721 -27% |
| Score Write (Points) | 561 | 970 73% | 961 71% | 1641 193% | 2142 282% | 1155 106% |
| Score Total (Points) | 2066 | 1972 -5% | 2695 30% | 3622 75% | 4790 132% | 2279 10% |
| Copy ISO MB/s (MB/s) | 2846 | 1173 -59% | 2226 -22% | 862 -70% | ||
| Copy Program MB/s (MB/s) | 728 | 769 6% | 506 -30% | 457 -37% | ||
| Copy Game MB/s (MB/s) | 1610 | 1045 -35% | 1230 -24% | 902 -44% | ||
| CrystalDiskMark 5.2 / 6 | -5% | -27% | 15% | 11% | -43% | |
| Write 4K (MB/s) | 169.7 | 100.2 -41% | 100.4 -41% | 138.1 -19% | 170.7 1% | 105.9 -38% |
| Read 4K (MB/s) | 53.2 | 112.8 112% | 47.16 -11% | 45.89 -14% | 49.51 -7% | 36.56 -31% |
| Write Seq (MB/s) | 1679 | 537 -68% | 993 -41% | 2147 28% | 1156 -31% | 1165 -31% |
| Read Seq (MB/s) | 1698 | 1270 -25% | 1176 -31% | 2188 29% | 1136 -33% | 423.2 -75% |
| Write 4K Q32T1 (MB/s) | 450.7 | 480.6 7% | 354.7 -21% | 427.8 -5% | 420.5 -7% | 332.1 -26% |
| Read 4K Q32T1 (MB/s) | 577 | 364.9 -37% | 473 -18% | 404 -30% | 527 -9% | 229.3 -60% |
| Write Seq Q32T1 (MB/s) | 1657 | 1224 -26% | 1034 -38% | 2396 45% | 2984 80% | 1460 -12% |
| Read Seq Q32T1 (MB/s) | 1851 | 2635 42% | 1635 -12% | 3454 87% | 3550 92% | 472.5 -74% |
| Durchschnitt gesamt (Programm / Settings) | -5% /
-5% | 2% /
7% | 39% /
45% | 65% /
74% | -22% /
-16% |
* ... kleinere Werte sind besser
Disk Throttling: DiskSpd Read Loop, Queue Depth 8
Grafikleistung
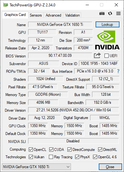
Die mobile GeForce GTX 1650 Ti bewegt sich auf der Grenze zwischen einem Multimedia-Grafikprozessor und einem vollwertigen Gaming-Grafikprozessor. Die Gesamtleistung ist der der mobilen GTX 1060 am ähnlichsten, insbesondere beim Ausführen von DX12-Titeln. Die Grafikleistung ist dort, wo wir sie im Vergleich zu anderen Laptops mit derselben Grafikprozessoroption erwarten.
Weitere technische Informationen und Benchmarks finden Sie auf unserer speziellen Seite über die mobile GTX 1650 Ti.
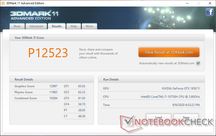
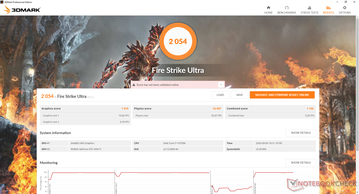
| 3DMark 11 Performance | 12523 Punkte | |
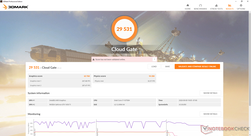
| 3DMark Cloud Gate Standard Score | 29531 Punkte | |
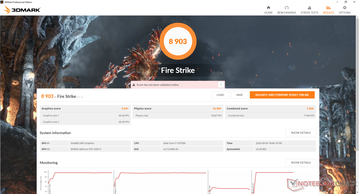
| 3DMark Fire Strike Score | 8903 Punkte | |
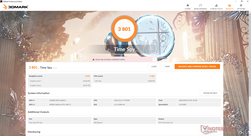
| 3DMark Time Spy Score | 3801 Punkte | |
Hilfe | ||
| Final Fantasy XV Benchmark | |
| 1280x720 Lite Quality | |
| MSI RTX 2060 Gaming Z 6G | |
| HP Envy 15-ep0098nr | |
| Asus VivoBook 15 K571LI-PB71 | |
| MSI Alpha 15 A3DDK-034 | |
| 1920x1080 Standard Quality | |
| MSI RTX 2060 Gaming Z 6G | |
| HP Envy 15-ep0098nr | |
| MSI Alpha 15 A3DDK-034 | |
| Asus VivoBook 15 K571LI-PB71 | |
| 1920x1080 High Quality | |
| MSI RTX 2060 Gaming Z 6G | |
| HP Envy 15-ep0098nr | |
| Asus VivoBook 15 K571LI-PB71 | |
| MSI Alpha 15 A3DDK-034 | |
| min. | mittel | hoch | max. | |
|---|---|---|---|---|
| The Witcher 3 (2015) | 199.3 | 126.6 | 74.5 | 38.8 |
| Dota 2 Reborn (2015) | 138 | 124 | 115 | 109 |
| Final Fantasy XV Benchmark (2018) | 104 | 54.9 | 39.3 | |
| X-Plane 11.11 (2018) | 95.6 | 80.5 | 71 |
Emissionen
Geräuschemissionen
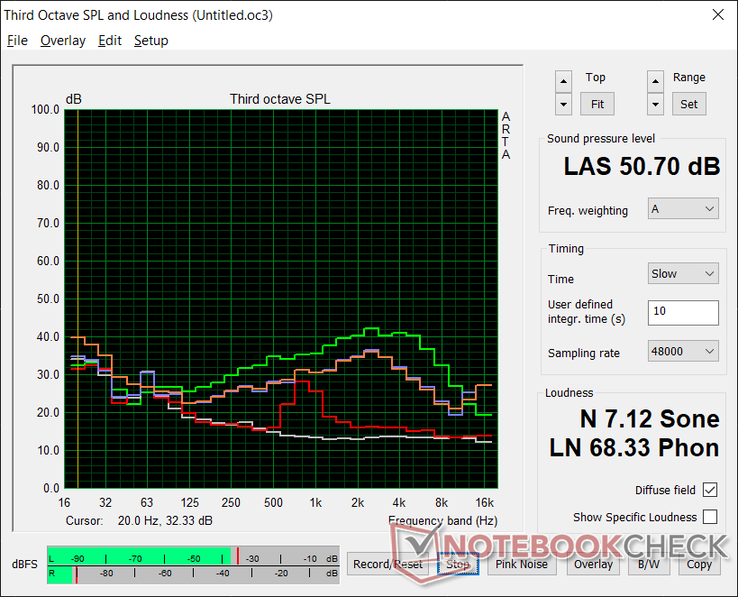
Die Lüfter sind mit einem Geräuschpegel von mindestens 31,9 dB(A) vor einem Hintergrund von 25,7 dB(A) permanent zu hören, selbst wenn das Power-Saver-Profil aktiviert ist. Obwohl es nicht sonderlich stört, sind moderne Ultrabooks im Energiesparmodus in leisen Umgebungen wie Klassenzimmern oder Bibliotheken gewöhnlich still.
Bei höheren Lasten wie z. B. Spielen wird ein Lüftergeräusch von 43,9 dB(A) bis sogar 50 dB(A) erzeugt, was mehr einem Spielegerät entspricht als einem Multimedia-Laptop. Der HP Pavilion Gaming 15 liefert ähnliche Spieleleistung deutlich leiser.
| Asus VivoBook 15 K571LI-PB71 GeForce GTX 1650 Ti Mobile, i7-10750H, Mushkin Helix-L 1TB MKNSSDHL1TB-08 | HP Envy 15-ep0098nr GeForce RTX 2060 Max-Q, i7-10750H, Intel Optane Memory H10 with Solid State Storage 32GB + 512GB HBRPEKNX0202A(L/H) | Acer Aspire 5 A515-54G GeForce MX250, i5-10210U, Kingston RBUSNS8154P3512GJ1 | Asus ZenBook 15 UX534FTC-A8190T GeForce GTX 1650 Max-Q, i7-10510U, Samsung SSD PM981 MZVLB1T0HALR | Lenovo Ideapad S540-15IML GeForce MX250, i5-10210U, Samsung SSD PM981a MZVLB512HBJQ | Dell Inspiron 15 5000 5585 Vega 10, R7 3700U, WDC PC SN520 SDAPNUW-512G | |
|---|---|---|---|---|---|---|
| Geräuschentwicklung | -8% | 7% | 9% | 1% | 11% | |
| aus / Umgebung * (dB) | 25.7 | 26.4 -3% | 29.8 -16% | 30.3 -18% | 30 -17% | 28.3 -10% |
| Idle min * (dB) | 31.9 | 32.2 -1% | 29.8 7% | 30.3 5% | 30 6% | 28.3 11% |
| Idle avg * (dB) | 31.9 | 32.2 -1% | 29.8 7% | 30.3 5% | 32 -0% | 28.3 11% |
| Idle max * (dB) | 31.9 | 32.2 -1% | 29.8 7% | 30.9 3% | 37 -16% | 28.3 11% |
| Last avg * (dB) | 44.2 | 48.3 -9% | 37.3 16% | 31.3 29% | 41 7% | 31.4 29% |
| Witcher 3 ultra * (dB) | 43.9 | 53.7 -22% | 38.1 13% | 39 11% | 41.4 6% | |
| Last max * (dB) | 50.7 | 58.8 -16% | 40.1 21% | 38.2 25% | 42 17% | 41.4 18% |
* ... kleinere Werte sind besser
Lautstärkediagramm
| Idle |
| 31.9 / 31.9 / 31.9 dB(A) |
| Last |
| 44.2 / 50.7 dB(A) |
 | ||
30 dB leise 40 dB(A) deutlich hörbar 50 dB(A) störend |
||
min: | ||
Temperaturen
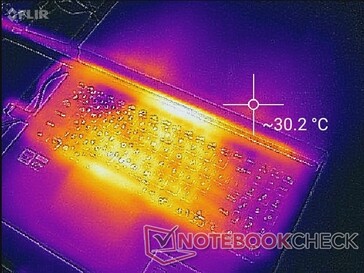
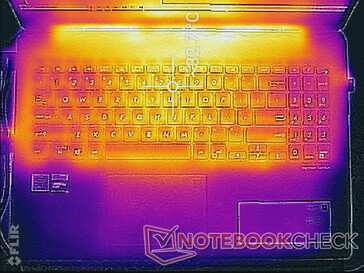
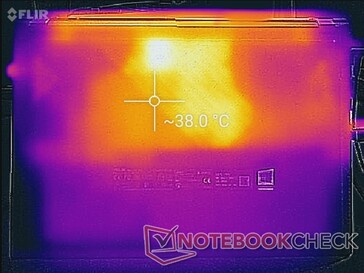
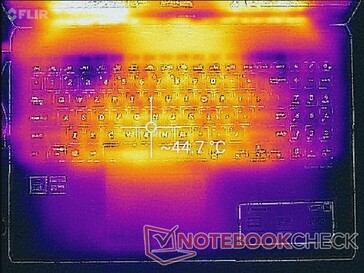
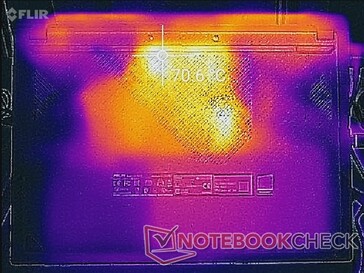
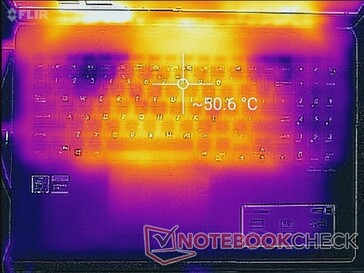
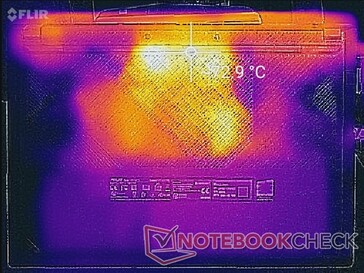
Die Oberflächentemperaturen sind selbst im Leerlauf auf dem Desktop recht warm, wobei die Hot Spots oben und unten über 32 °C bzw. 38 °C erreichen. Dieselben Stellen können an der Unterseite bis zu 44 °C bis sogar 70 °C warm werden, da die Heatpipes die Bodenplatte berühren. Diese Bereiche befinden sich glücklicherweise auf der Rückseite des Chassis und weg von den Handballenauflagen. Trotzdem empfehlen wir bei solch extremen Belastungen die Verwendung eines flachen Schreibtisches.
(-) Die maximale Temperatur auf der Oberseite ist 53 °C. Im Vergleich liegt der Klassendurchschnitt bei 36.9 °C (von 21.1 bis 71 °C für die Klasse Multimedia).
(-) Auf der Unterseite messen wir eine maximalen Wert von 72 °C (im Vergleich zum Durchschnitt von 39.2 °C).
(+) Ohne Last messen wir eine durchschnittliche Temperatur von 28.9 °C auf der Oberseite. Der Klassendurchschnitt erreicht 31.3 °C.
(±) Beim längeren Spielen von The Witcher 3 erhitzt sich das Gerät durchschnittlich auf 34.7 °C. Der Durchschnitt der Klasse ist derzeit 31.3 °C.
(+) Die Handballen und der Touchpad-Bereich sind mit gemessenen 30 °C kühler als die typische Hauttemperatur und fühlen sich dadurch kühl an.
(±) Die durchschnittliche Handballen-Temperatur anderer getesteter Geräte war 28.7 °C (-1.3 °C).
Belastungstest
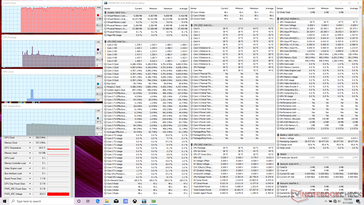
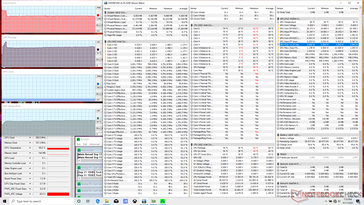
Bei der Ausführung von Prime95 stiegen die CPU-Taktraten auf 4,2 GHz, bis sie etwa 10 Sekunden später eine Kerntemperatur von 95 °C erreichten. Danach sanken die Taktraten in den Bereich von 3,1 bis 3,2 GHz und hielten so eine kühlere Temperatur von 76 °C. Der Alienware m15 R3 mit dem gleichen Core i7-10750H stabilisiert sich unter ähnlichen Bedingungen bei viel höheren 4,2 GHz, was unsere oben genannten unterdurchschnittlichen CineBench-Ergebnisse für den Asus erklärt.
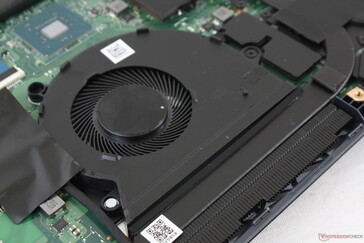
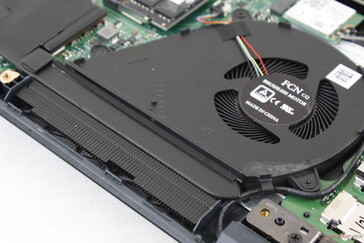
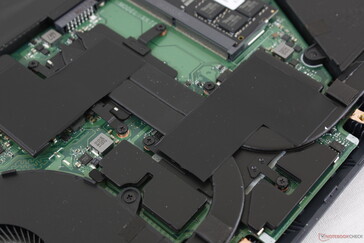
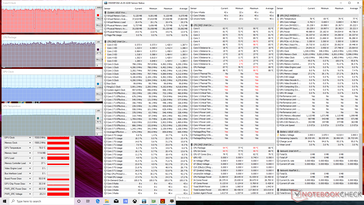
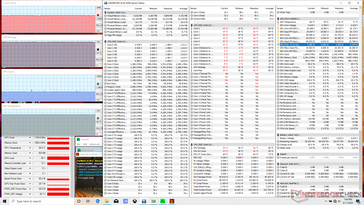
Beim Spielen stabilisierten sich die CPU- und GPU-Temperaturen bei 87 °C bzw. 78 °C, im Vergleich zu 71 °C und 68 °C beim HP Pavilion Gaming 15. Derartige Temperaturen sind äußerst hoch, was darauf schließen lässt, dass die Kühllösung speziell auf die TDP-Level der CPU der Core-H-Serie und der GTX-1650-Ti-GPU zugeschnitten ist - nicht mehr.
Der Akkubetrieb schränkt die Leistung ein. Ein Fire-Strike-Test mit Akkubetrieb ergab für Physik und Grafik Werte von 10274 bzw. 7804 Punkten im Vergleich zu 16969 bzw. 9691 Punkten bei Netzbetrieb.
| CPU Clock (GHz) | GPU Clock (MHz) | Average CPU Temperature (°C) | Average GPU Temperature (°C) | |
| System Idle | -- | -- | 40 | 39 |
| Prime95 Stress | 3.1 - 3.2 | -- | 76 | 58 |
| Prime95 + FurMark Stress | 3.2 - 3.3 | 1125 | 94 | 80 |
| Witcher 3 Stress | ~4.2 | 1530 | ~87 | 78 |
Lautsprecher
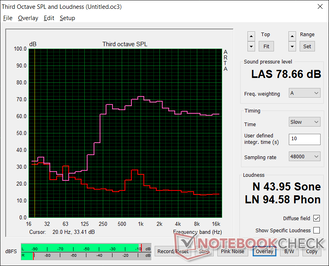
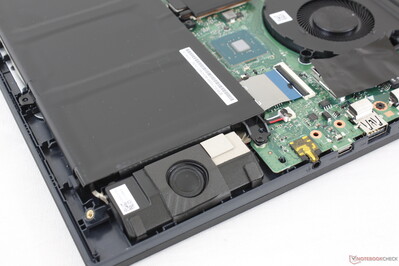
Asus VivoBook 15 K571LI-PB71 Audio Analyse
(±) | Mittelmäßig laut spielende Lautsprecher (78.7 dB)
Bass 100 - 315 Hz
(-) | kaum Bass - 20.1% niedriger als der Median
(±) | durchschnittlich lineare Bass-Wiedergabe (14.6% Delta zum Vorgänger)
Mitteltöne 400 - 2000 Hz
(±) | zu hohe Mitten, vom Median 5% abweichend
(+) | lineare Mitten (3.9% Delta zum Vorgänger)
Hochtöne 2 - 16 kHz
(+) | ausgeglichene Hochtöne, vom Median nur 1.1% abweichend
(+) | sehr lineare Hochtöne (3.4% Delta zum Vorgänger)
Gesamt im hörbaren Bereich 100 - 16.000 Hz
(±) | hörbarer Bereich ist durchschnittlich linear (17.8% Abstand zum Median)
Im Vergleich zu allen Geräten derselben Klasse
» 50% aller getesteten Geräte dieser Klasse waren besser, 8% vergleichbar, 42% schlechter
» Das beste Gerät hat einen Delta-Wert von 5%, durchschnittlich ist 17%, das schlechteste Gerät hat 45%
Im Vergleich zu allen Geräten im Test
» 35% aller getesteten Geräte waren besser, 8% vergleichbar, 57% schlechter
» Das beste Gerät hat einen Delta-Wert von 4%, durchschnittlich ist 24%, das schlechteste Gerät hat 134%
Apple MacBook 12 (Early 2016) 1.1 GHz Audio Analyse
(+) | Die Lautsprecher können relativ laut spielen (83.6 dB)
Bass 100 - 315 Hz
(±) | abgesenkter Bass - 11.3% geringer als der Median
(±) | durchschnittlich lineare Bass-Wiedergabe (14.2% Delta zum Vorgänger)
Mitteltöne 400 - 2000 Hz
(+) | ausgeglichene Mitten, vom Median nur 2.4% abweichend
(+) | lineare Mitten (5.5% Delta zum Vorgänger)
Hochtöne 2 - 16 kHz
(+) | ausgeglichene Hochtöne, vom Median nur 2% abweichend
(+) | sehr lineare Hochtöne (4.5% Delta zum Vorgänger)
Gesamt im hörbaren Bereich 100 - 16.000 Hz
(+) | hörbarer Bereich ist sehr linear (10.2% Abstand zum Median
Im Vergleich zu allen Geräten derselben Klasse
» 7% aller getesteten Geräte dieser Klasse waren besser, 2% vergleichbar, 91% schlechter
» Das beste Gerät hat einen Delta-Wert von 5%, durchschnittlich ist 18%, das schlechteste Gerät hat 53%
Im Vergleich zu allen Geräten im Test
» 4% aller getesteten Geräte waren besser, 1% vergleichbar, 94% schlechter
» Das beste Gerät hat einen Delta-Wert von 4%, durchschnittlich ist 24%, das schlechteste Gerät hat 134%
Energieverwaltung
Energieaufnahme
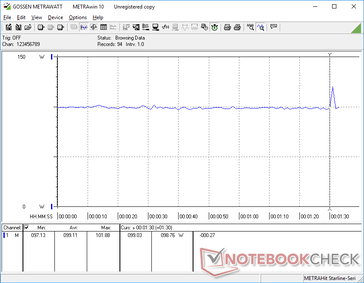
Im Leerlauf auf dem Desktop werden zwischen 6 W und 19 W verbraucht, was weniger stromsparend ist als die meisten Ultrabooks. Der hohe Verbrauch erklärt auch die Zahlen zu den kurzen Akkulaufzeiten in unserem nächsten Abschnitt unten.
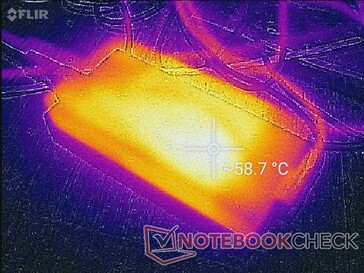
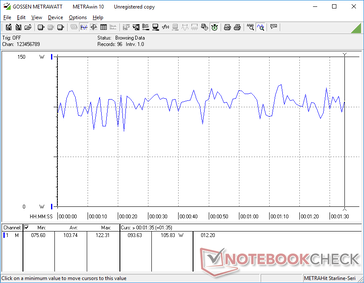
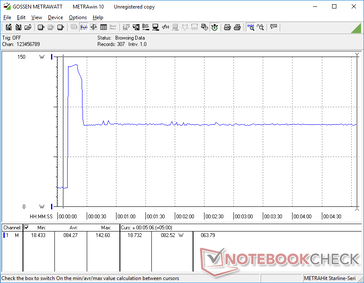
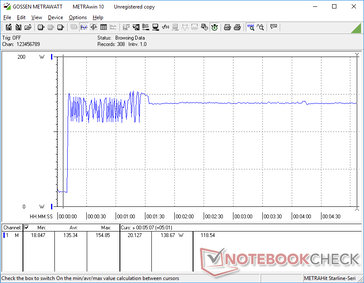
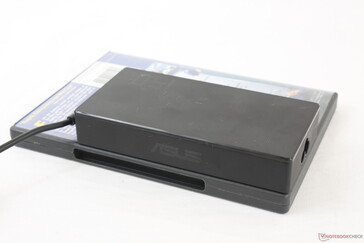
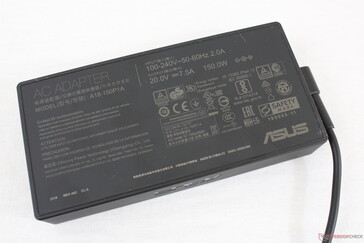
Der Gesamtstromverbrauch ähnelt eher Gaming-Geräten wie dem ROG Strix G15 G512LI als anderen Multimedia-Laptops. Spiele ziehen nicht weniger als 99 W aus dem mittelgroßen (~13,8 x 6,8 x 2,4 cm) 150 W-Netzadapter. Anspruchsvollere Arbeitslasten verlangsamen bereits die Akkuladegeschwindigkeit.
| Aus / Standby | |
| Idle | |
| Last |
|
Legende:
min: | |
| Asus VivoBook 15 K571LI-PB71 i7-10750H, GeForce GTX 1650 Ti Mobile, Mushkin Helix-L 1TB MKNSSDHL1TB-08, IPS, 1920x1080, 15.6" | HP Envy 15-ep0098nr i7-10750H, GeForce RTX 2060 Max-Q, Intel Optane Memory H10 with Solid State Storage 32GB + 512GB HBRPEKNX0202A(L/H), AMOLED, 3840x2160, 15.6" | Acer Aspire 5 A515-54G i5-10210U, GeForce MX250, Kingston RBUSNS8154P3512GJ1, IPS, 1920x1080, 15.6" | Asus ZenBook 15 UX534FTC-A8190T i7-10510U, GeForce GTX 1650 Max-Q, Samsung SSD PM981 MZVLB1T0HALR, IPS, 1920x1080, 15.6" | Lenovo Ideapad S540-15IML i5-10210U, GeForce MX250, Samsung SSD PM981a MZVLB512HBJQ, IPS, 1920x1080, 15.6" | Dell Inspiron 15 5000 5585 R7 3700U, Vega 10, WDC PC SN520 SDAPNUW-512G, IPS, 1920x1080, 15.6" | |
|---|---|---|---|---|---|---|
| Stromverbrauch | -23% | 52% | 40% | 42% | 55% | |
| Idle min * (Watt) | 6.4 | 9.2 -44% | 3.4 47% | 2.8 56% | 5 22% | 4.2 34% |
| Idle avg * (Watt) | 10.6 | 14.5 -37% | 6.4 40% | 7.7 27% | 7 34% | 6.8 36% |
| Idle max * (Watt) | 18.4 | 18 2% | 9.2 50% | 9.4 49% | 10 46% | 7 62% |
| Last avg * (Watt) | 103.7 | 110.9 -7% | 38 63% | 57 45% | 64 38% | 36.5 65% |
| Witcher 3 ultra * (Watt) | 99.1 | 125.5 -27% | 62 37% | 44 56% | 37.9 62% | |
| Last max * (Watt) | 154.9 | 194.6 -26% | 59 62% | 116 25% | 67 57% | 44 72% |
* ... kleinere Werte sind besser
Akkulaufzeit
Die Akkukapazität ist gering mit nur 42 Wh, was in Kombination mit dem oben genannten hohen Stromverbrauch zu kurzen Laufzeiten führt. Rechnen Sie mit etwas mehr als 3,5 Stunden realer WLAN-Nutzung, wenn das Profil "Ausgewogene Leistung" bei aktiver integrierter GPU eingestellt ist. Benutzer können möglicherweise mehr aus dem Akku herausholen, wenn er auf den Energiesparmodus eingestellt ist.
Das Aufladen von leerer auf volle Kapazität dauert etwa 1,5 Stunden. Das System kann nicht über USB-C aufgeladen werden.
| Asus VivoBook 15 K571LI-PB71 i7-10750H, GeForce GTX 1650 Ti Mobile, 42 Wh | HP Envy 15-ep0098nr i7-10750H, GeForce RTX 2060 Max-Q, 83 Wh | Acer Aspire 5 A515-54G i5-10210U, GeForce MX250, 48 Wh | Asus ZenBook 15 UX534FTC-A8190T i7-10510U, GeForce GTX 1650 Max-Q, 71 Wh | Lenovo Ideapad S540-15IML i5-10210U, GeForce MX250, 70 Wh | Dell Inspiron 15 5000 5585 R7 3700U, Vega 10, 42 Wh | |
|---|---|---|---|---|---|---|
| Akkulaufzeit | 62% | 141% | 190% | 160% | 62% | |
| Idle (h) | 10.2 | 15 47% | 27.2 167% | 30.2 196% | 14.3 40% | |
| WLAN (h) | 3.7 | 6 62% | 8.9 141% | 12.4 235% | 12.1 227% | 7 89% |
| Last (h) | 0.9 | 1.6 78% | 2.4 167% | 1.4 56% | 1.4 56% |
Pro
Contra
Fazit
Das VivoBook 15 K571 eignet sich am besten für Schüler und Studenten, die einen erschwinglichen Laptop sowohl für Spiele als auch für den Unterricht suchen, der zudem relativ tragbar ist. Für seine Größe und sein Gewicht ist er recht leistungsstark und stellt eine Zwischenlösung zwischen einem traditionellen Ultrabook und einem Gaming-Notebook der Einstiegsklasse dar. Nur sehr wenige Laptops dieser Preiskategorie bieten ein 120-Hz-Panel.
Wenn eine CPU der Core H-Serie oder eine GTX-1650-Ti-GPU keinen großen Mehrwert für Sie darstellt, dann wäre ein ZenBook die bessere Option. Akkulaufzeit, Lüftergeräusch und Temperaturen sind beim VivoBook 15 aufgrund der anspruchsvollen Prozessoren im Inneren nur mittelmäßig.
Wir empfehlen, der Wahl des Displays Aufmerksamkeit zu widmen. Asus bietet drei Optionen an: 1080p120 45 % NTSC, 1080p60 45 % NTSC oder 1080p60 72 % NTSC. Die Option 1080p120 45 % NTSC eignet sich am besten für Spiele, selbst wenn man die mittleren Schwarz-Weiß-Reaktionszeiten berücksichtigt. Für Editing- und Grafikarbeiten ist die Option 1080p60 72 % NTSC wegen ihrer tieferen Farben besser geeignet.
Kein Punkt des Asus VivoBook 15 K571 besticht durch Exzellenz, doch schafft es eine gute Balance zwischen Multimedia-Gerät und Gaming-Maschine zu einem super Preis.
Asus VivoBook 15 K571LI-PB71
- 13.09.2020 v7 (old)
Allen Ngo


