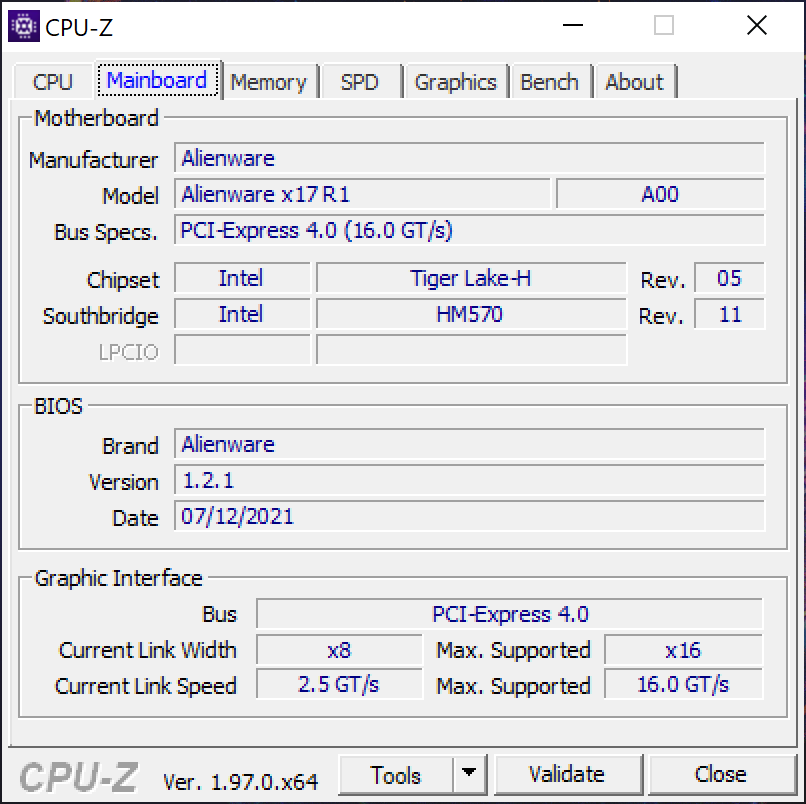
Alienware x17 R1 RTX 3080 Laptop im Test: Ein Neuanfang

Die 17,3 Zoll großen Gaming-Laptops von Alienware haben in den letzten Jahren viele Veränderungen durchgemacht. 2019 hat Alienware das brandneue m17 R1 präsentiert, welches mit dem m17 R2 aber schon ein Jahr später einen komplett neuen Nachfolger bekam. Für 2021 gibt es nun erneut ein komplett neues Modell, das die m17-Serie komplett ersetzt: das Alienware x17.
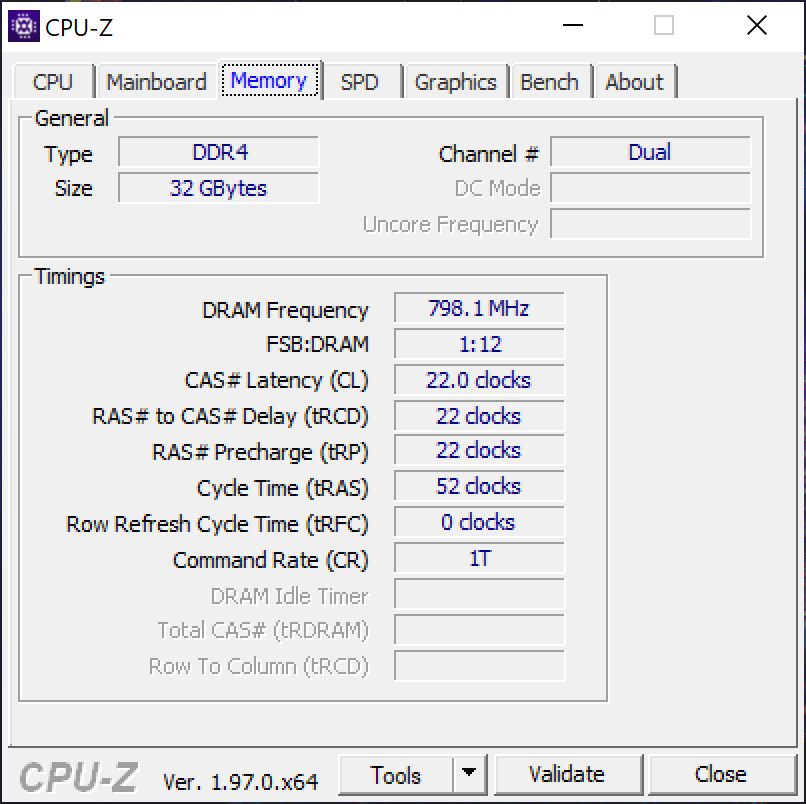
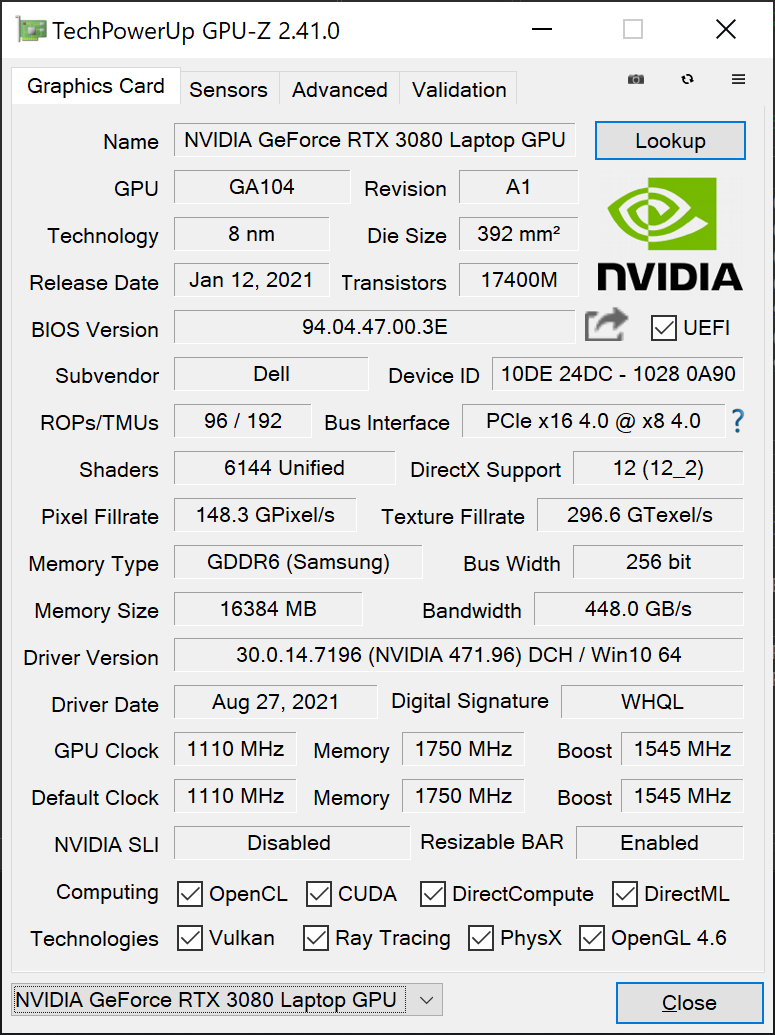
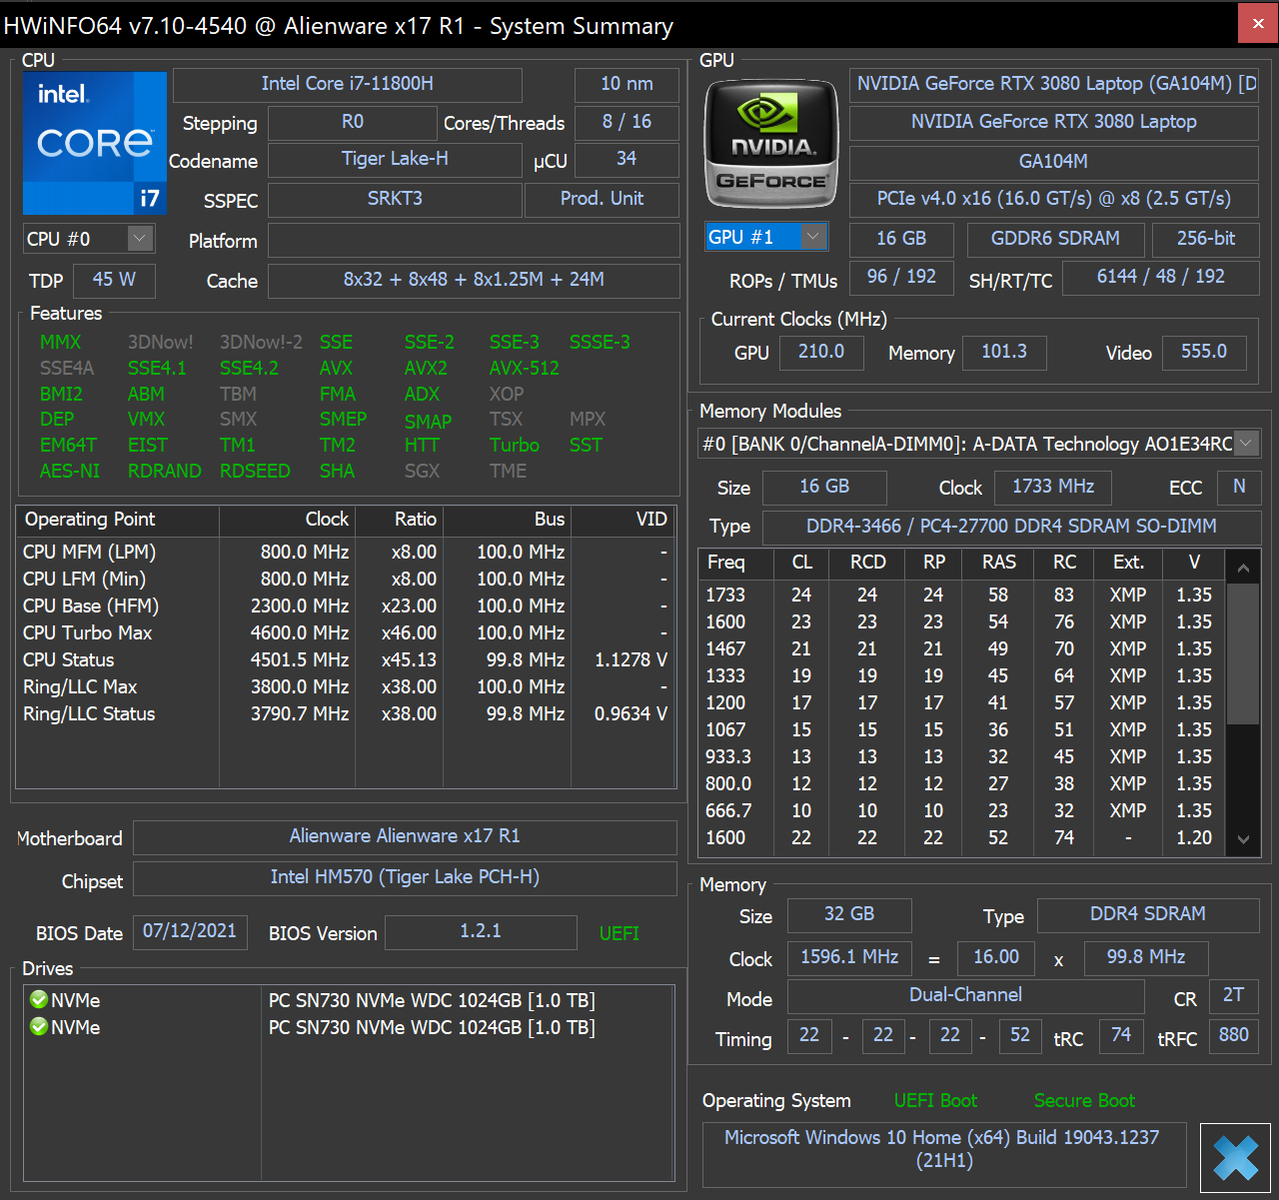
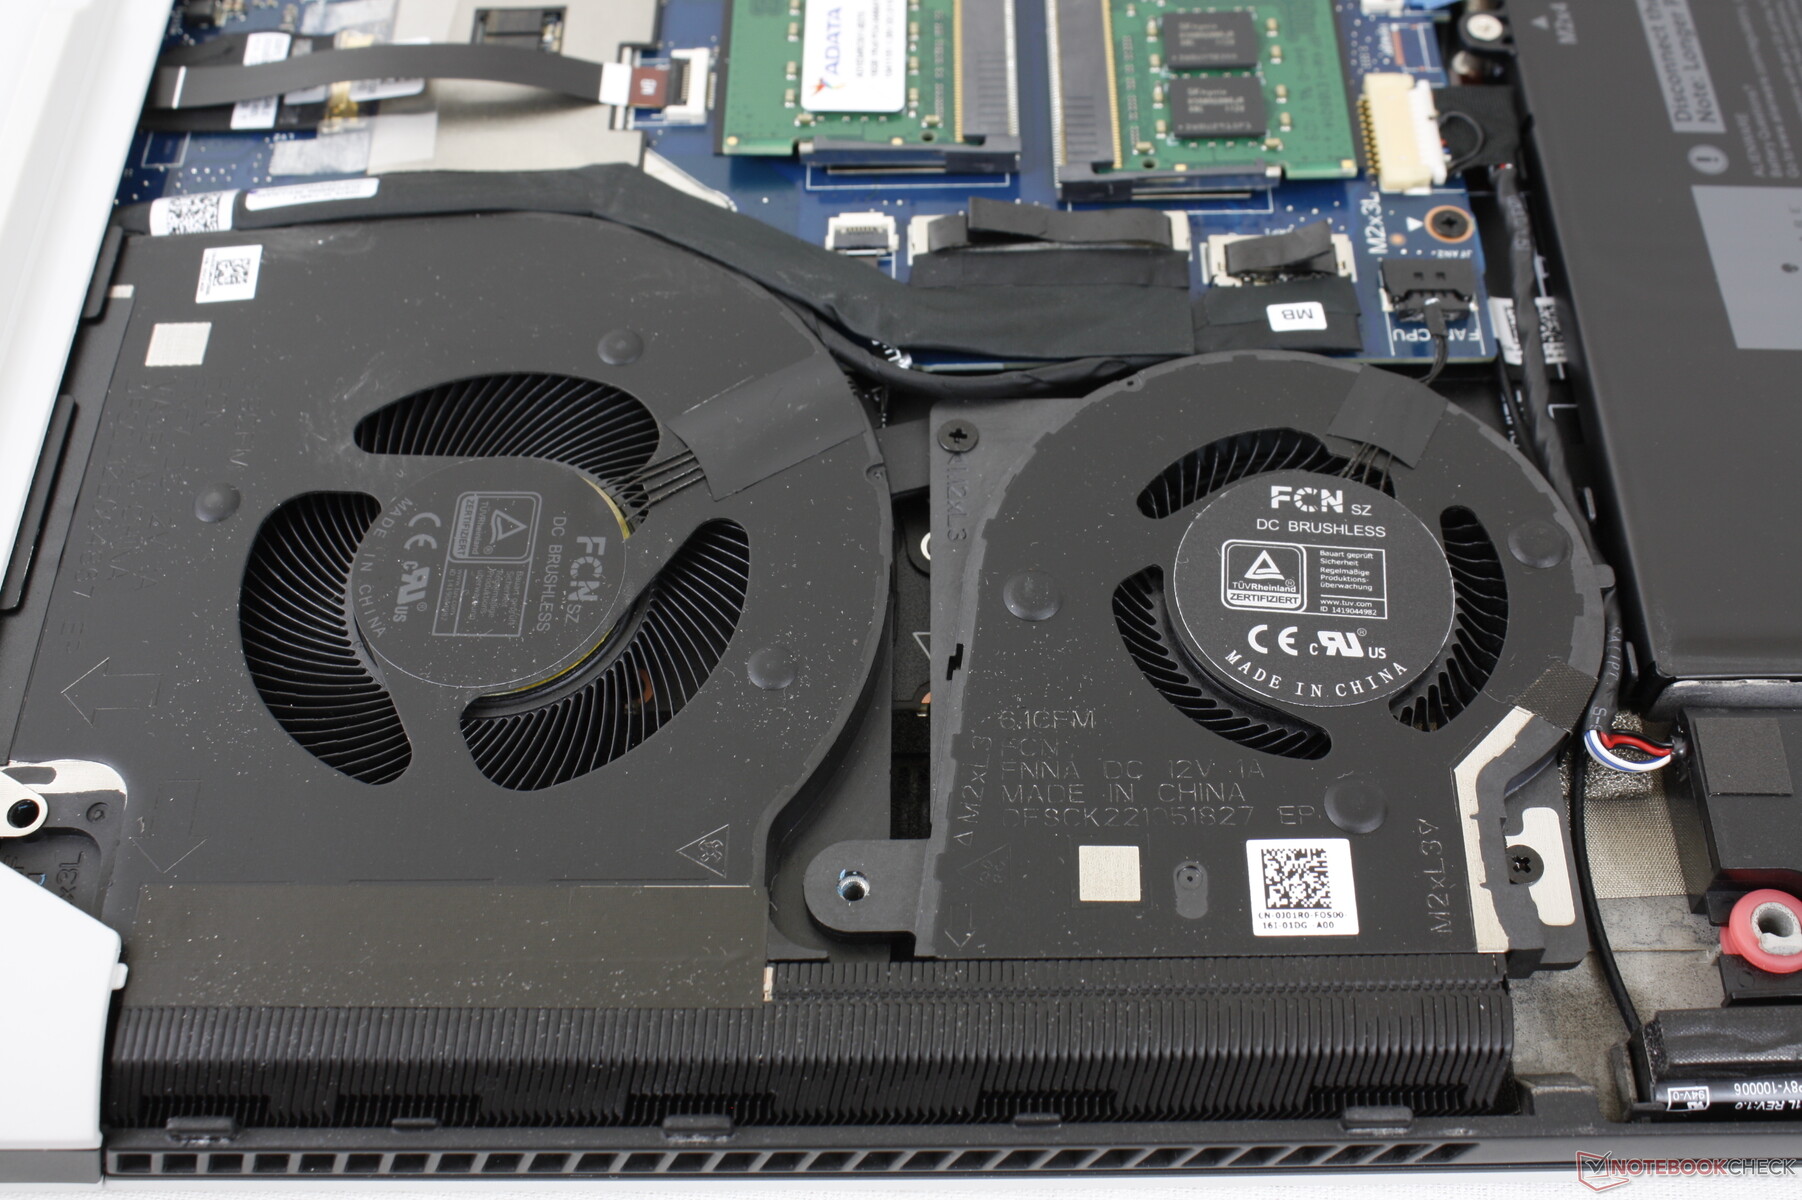
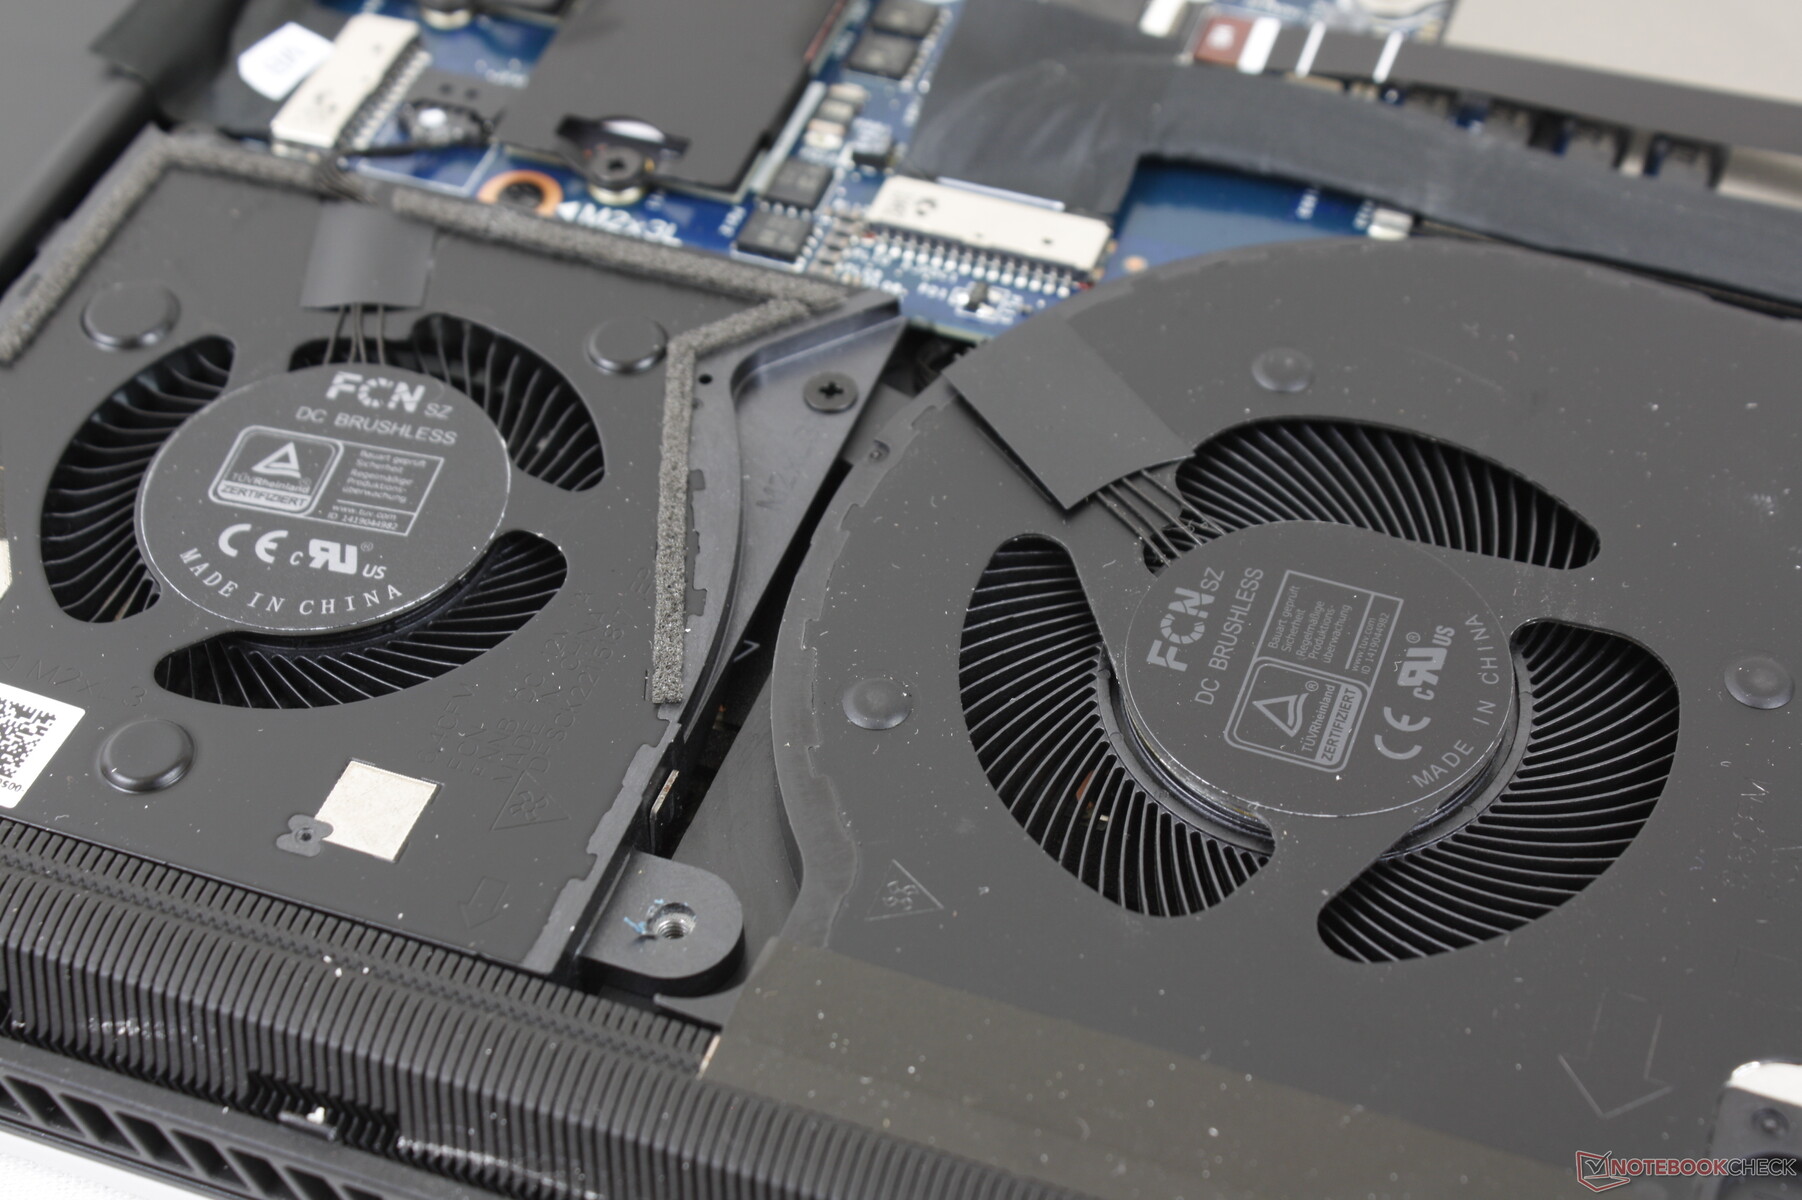
Unser Testgerät ist eine ziemliche High-End-Konfiguration mit dem Core-i7-11800H-Prozessor, der GeForce-RTX-3080-GPU, einen 4K-UHD-Display (120 Hz), mechanischer Tastatur (CherryMX) sowie 32 GB RAM für 3.749 Euro. Es gibt aber auch günstigere Modelle, zum Beispiel mit der RTX 3060, oder teurere Versionen mit dem Core i9-11980HK. Die vielleicht wichtigste Veränderung ist die überarbeitete Kühlung, die nun deutlich mehr Lüfter beinhaltet und eine neues, gekapseltes Wärmeleitmaterial (Gallium-Silikon) für die CPU verwendet. Wer es lieber etwas kompakter mag, bekommt mit dem Alienware x15 R1 auch eine 15,6-Zoll-Version.
Zu den Konkurrenten für das Alienware x17 R1 zählen andere dünne 17,3-Zoll Gaming-Laptops wie das MSI GS76, Razer Blade 17, Asus ROG Zephyrus S17 und das Maingear Vector Pro.
Weitere Testberichte von Dell-Notebooks:
mögliche Konkurrenten im Vergleich
Bew. | Datum | Modell | Gewicht | Dicke | Größe | Auflösung | Preis ab |
|---|---|---|---|---|---|---|---|
| 89 % v7 (old) | 09 / 2021 | Alienware x17 RTX 3080 P48E i7-11800H, GeForce RTX 3080 Laptop GPU | 3.2 kg | 21.4 mm | 17.30" | 3840x2160 | |
| 85.3 % v7 (old) | 04 / 2021 | Alienware m17 R4 i9-10980HK, GeForce RTX 3080 Laptop GPU | 3 kg | 22 mm | 17.30" | 1920x1080 | |
| 89.4 % v7 (old) | 09 / 2021 | Razer Blade 17 RTX 3070 i7-11800H, GeForce RTX 3070 Laptop GPU | 2.8 kg | 19.9 mm | 17.30" | 1920x1080 | |
| 90.1 % v7 (old) | 07 / 2021 | Asus ROG Zephyrus S17 GX703HSD i9-11900H, GeForce RTX 3080 Laptop GPU | 2.8 kg | 19.9 mm | 17.30" | 2560x1440 | |
| 86.2 % v7 (old) | 09 / 2021 | MSI GS76 Stealth 11UH i9-11900H, GeForce RTX 3080 Laptop GPU | 2.4 kg | 20 mm | 17.30" | 3840x2160 | |
| 88 % v7 (old) | 05 / 2021 | Gigabyte Aero 17 HDR YD i9-11980HK, GeForce RTX 3080 Laptop GPU | 2.8 kg | 22 mm | 17.30" | 3840x2160 |
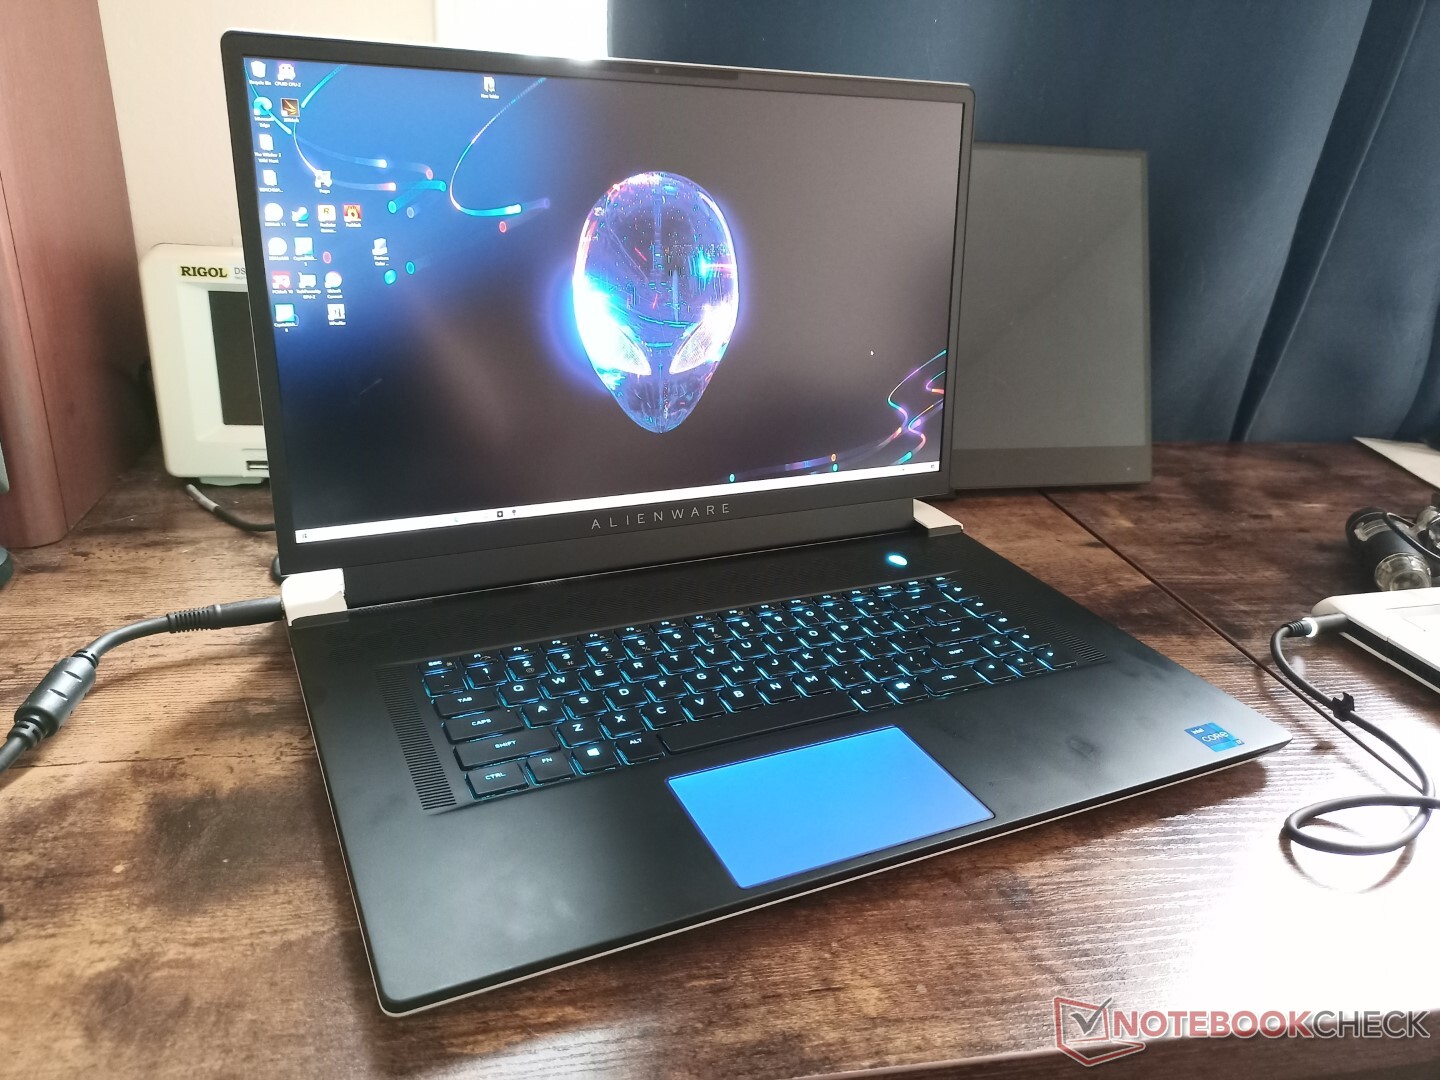
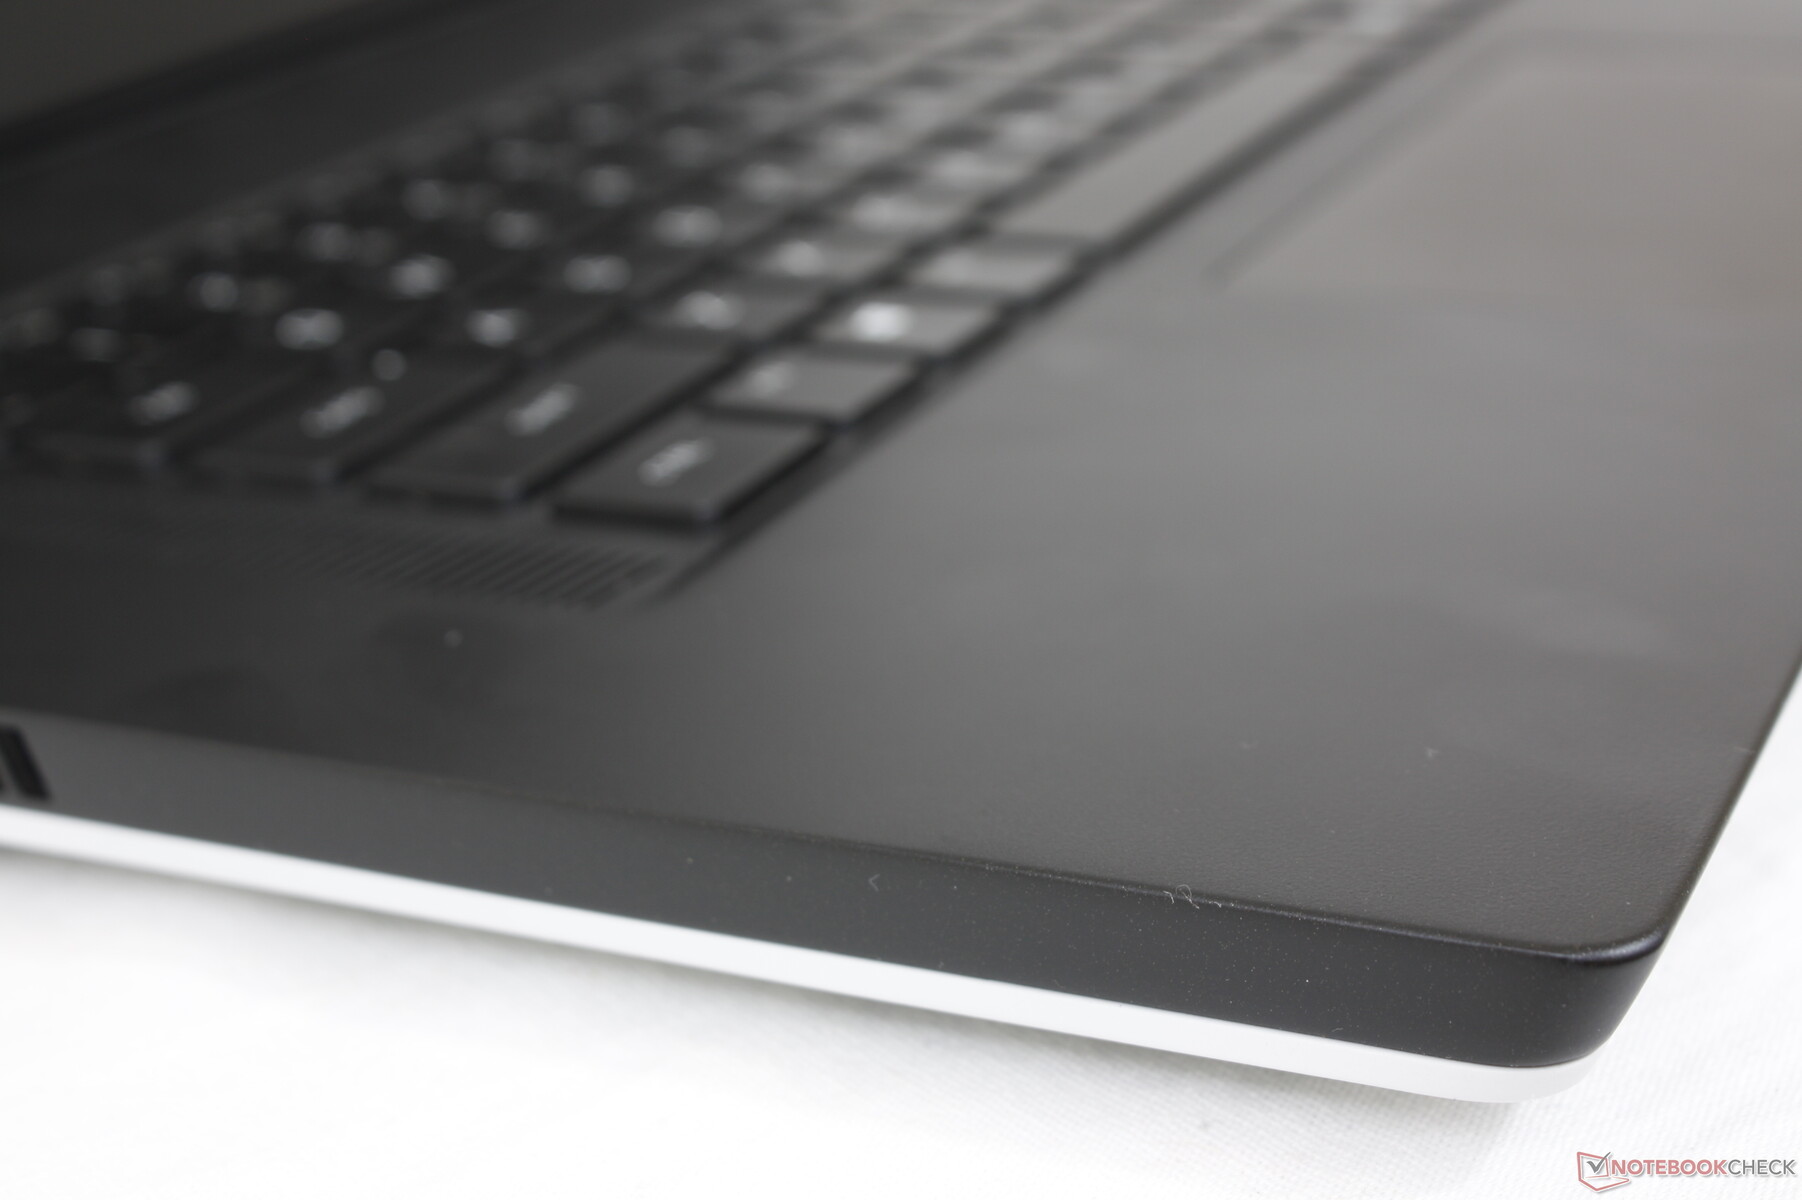
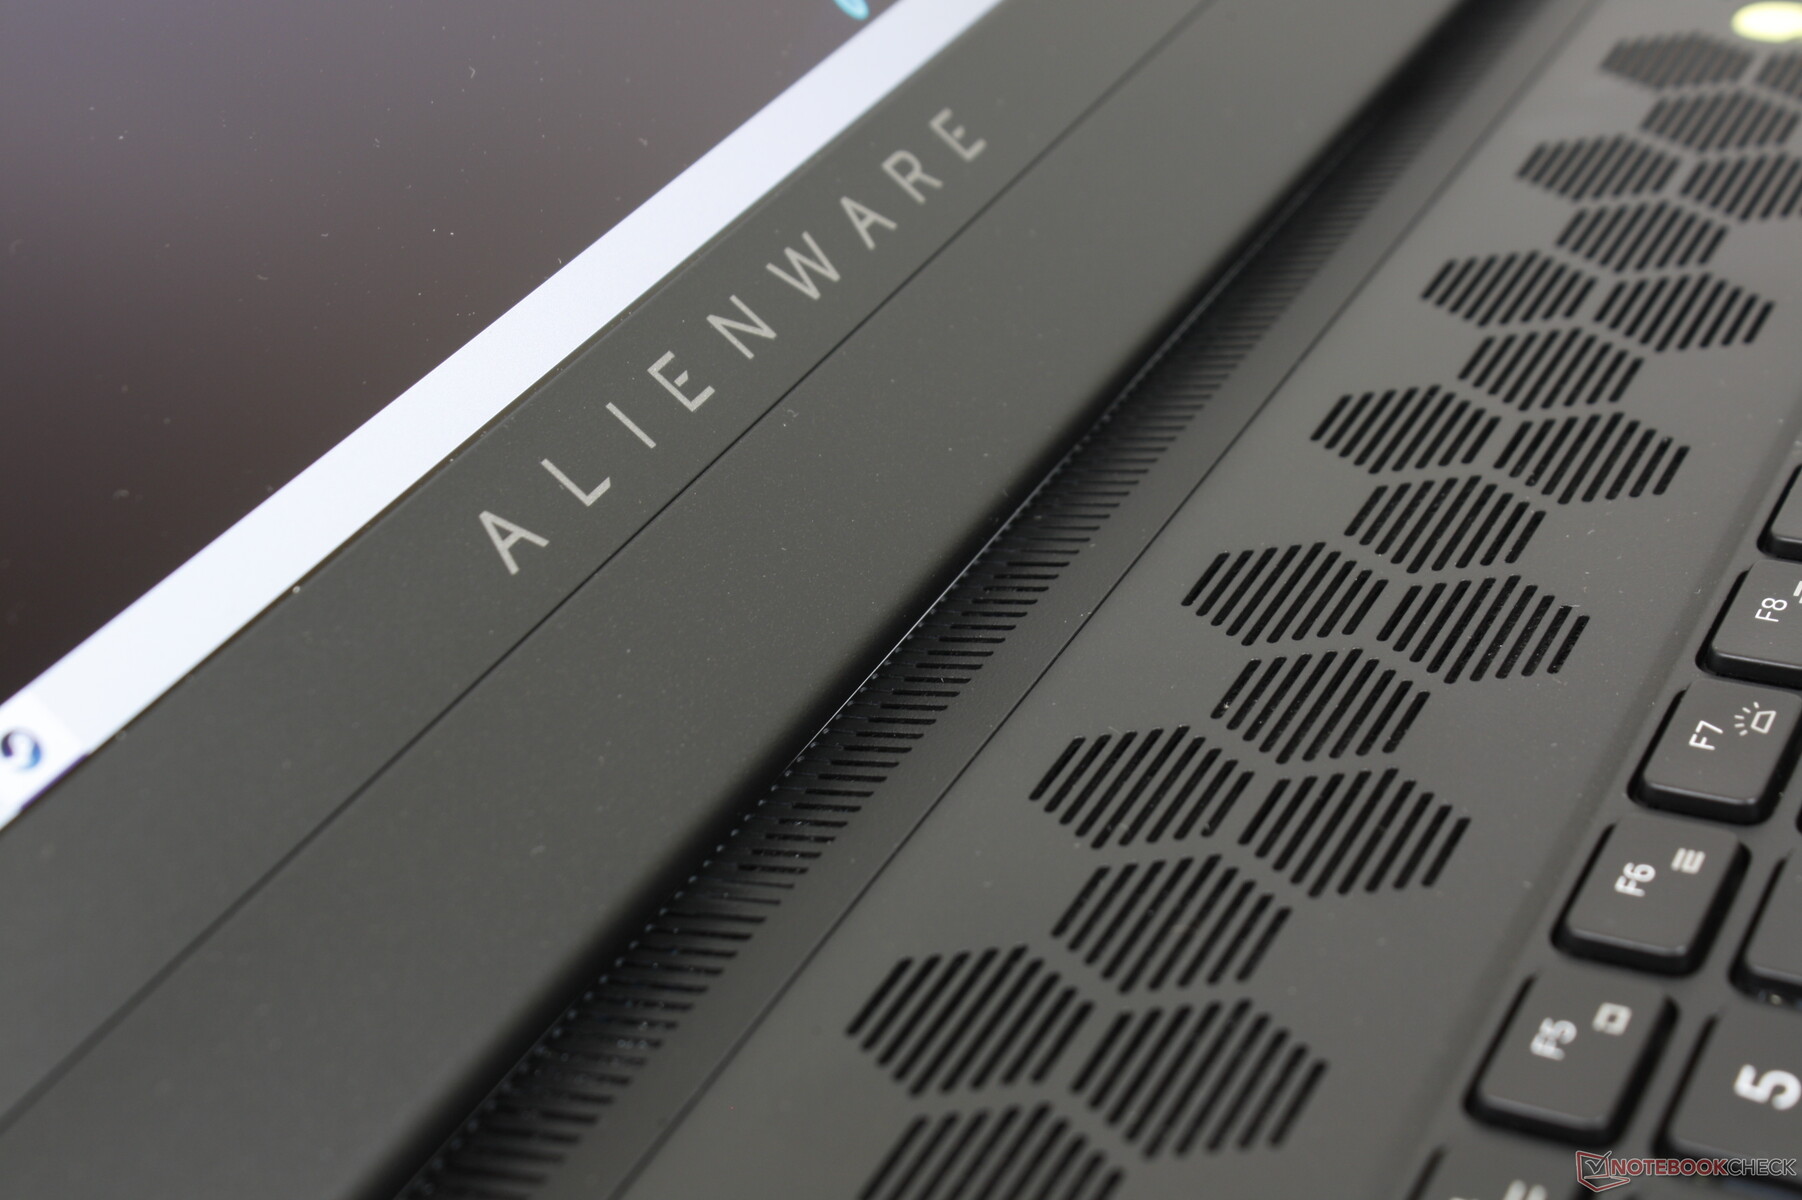
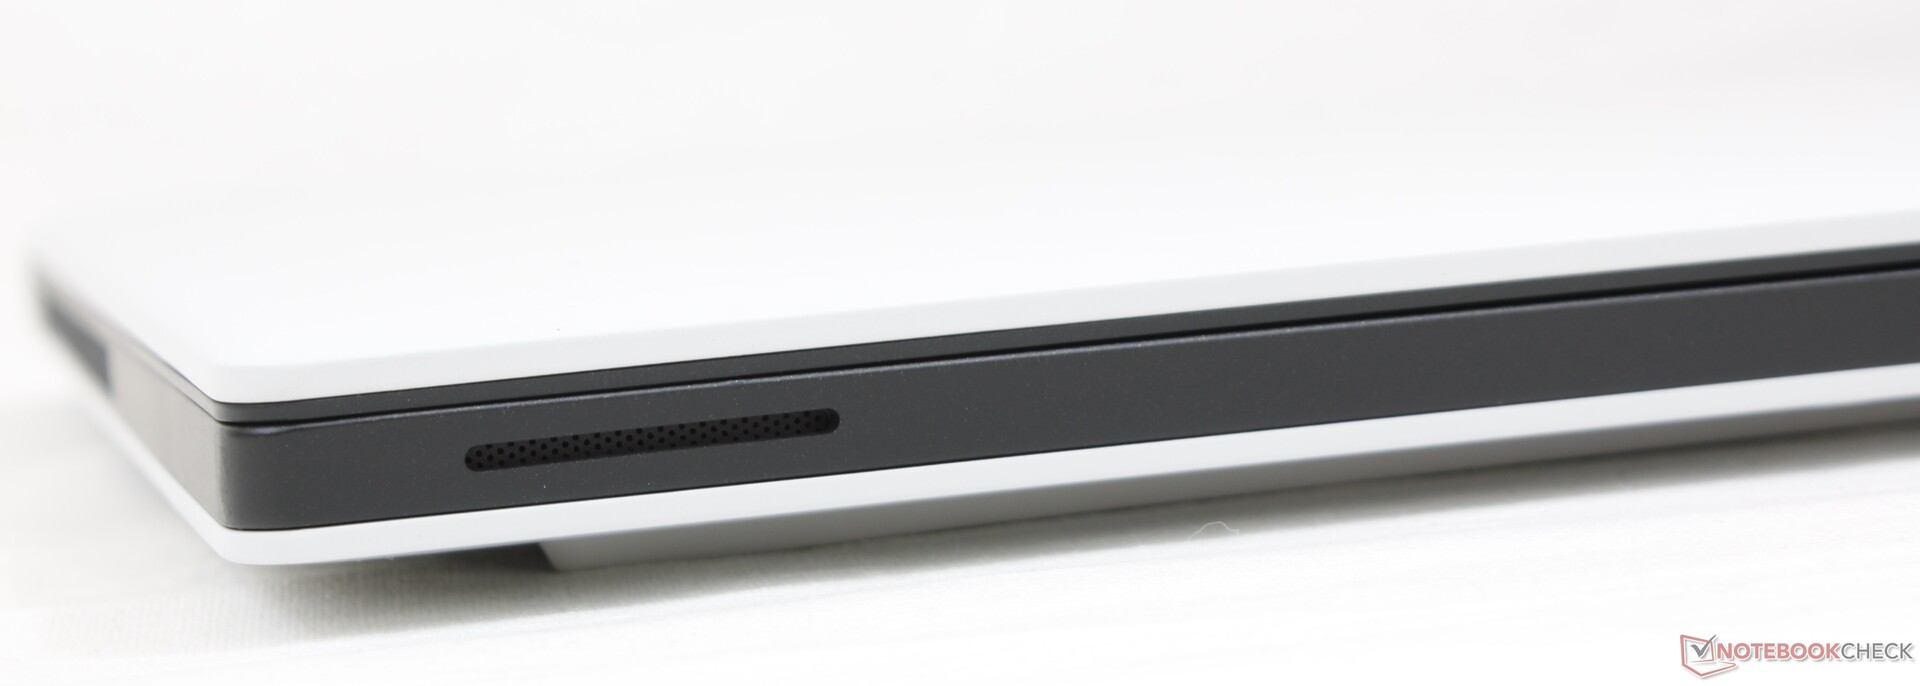
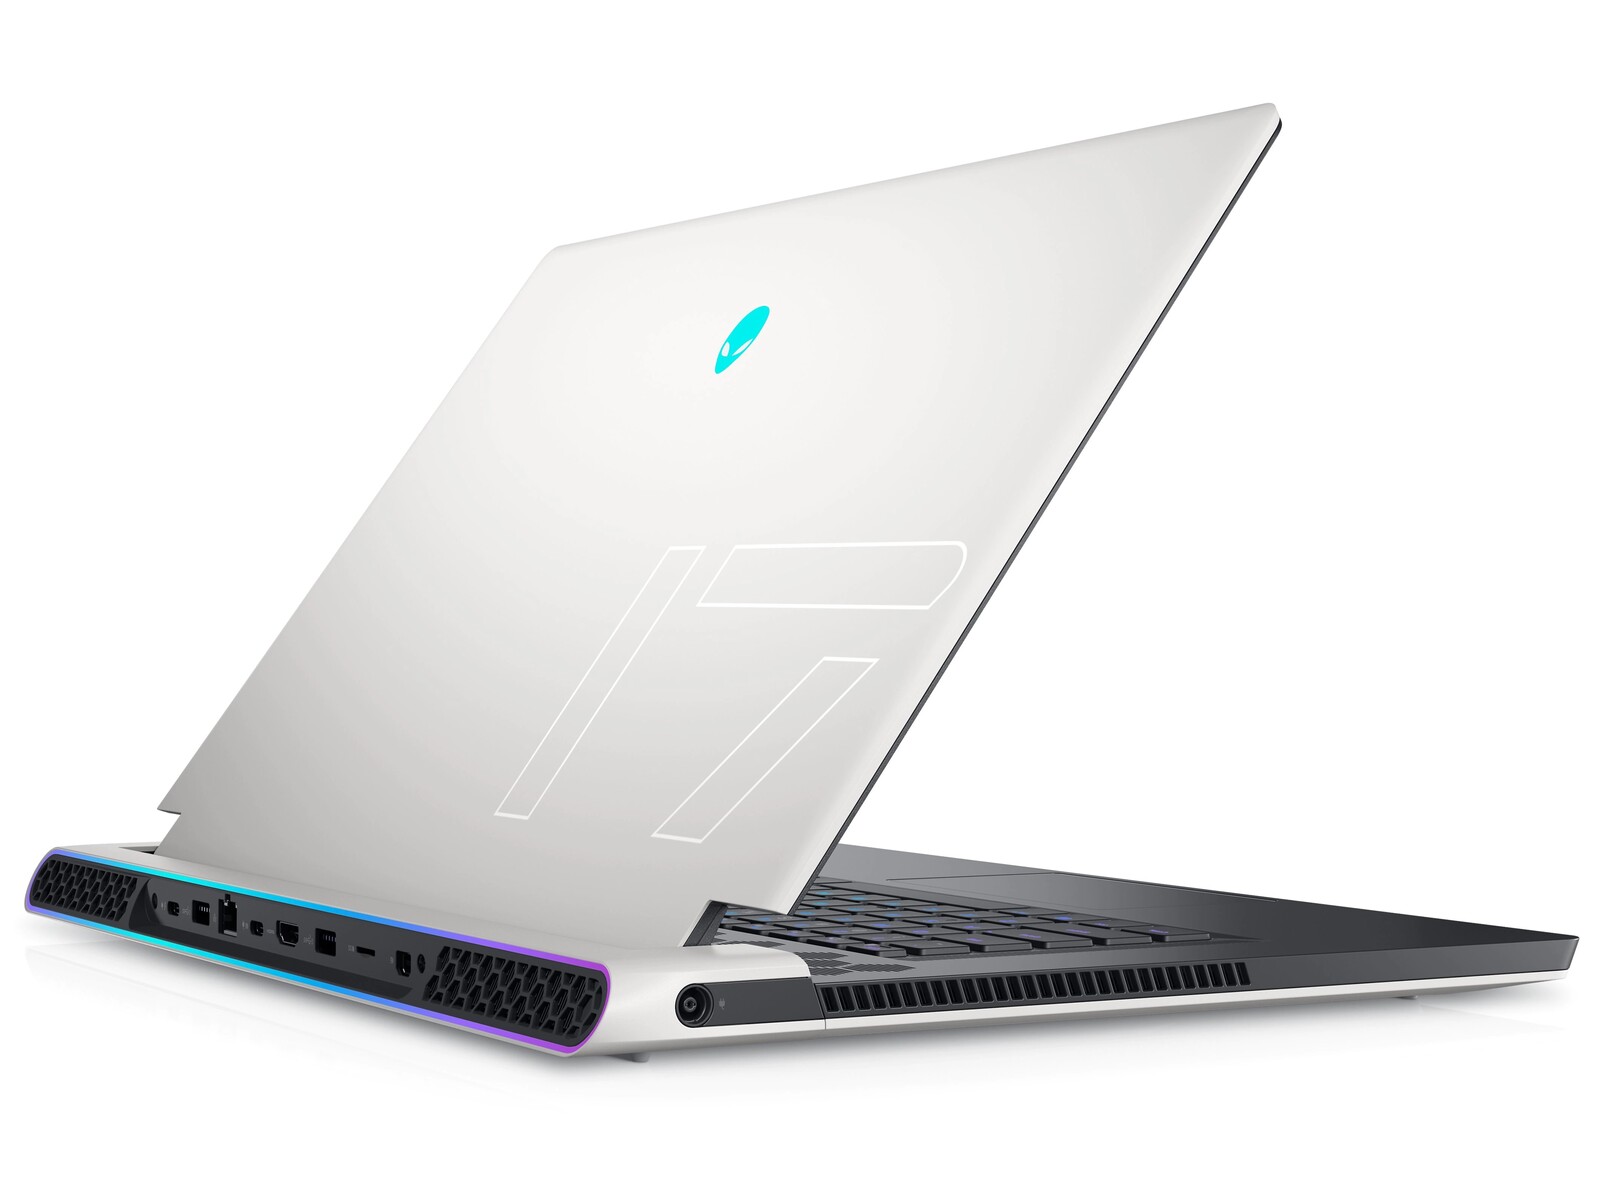
Gehäuse - Legend Reborn
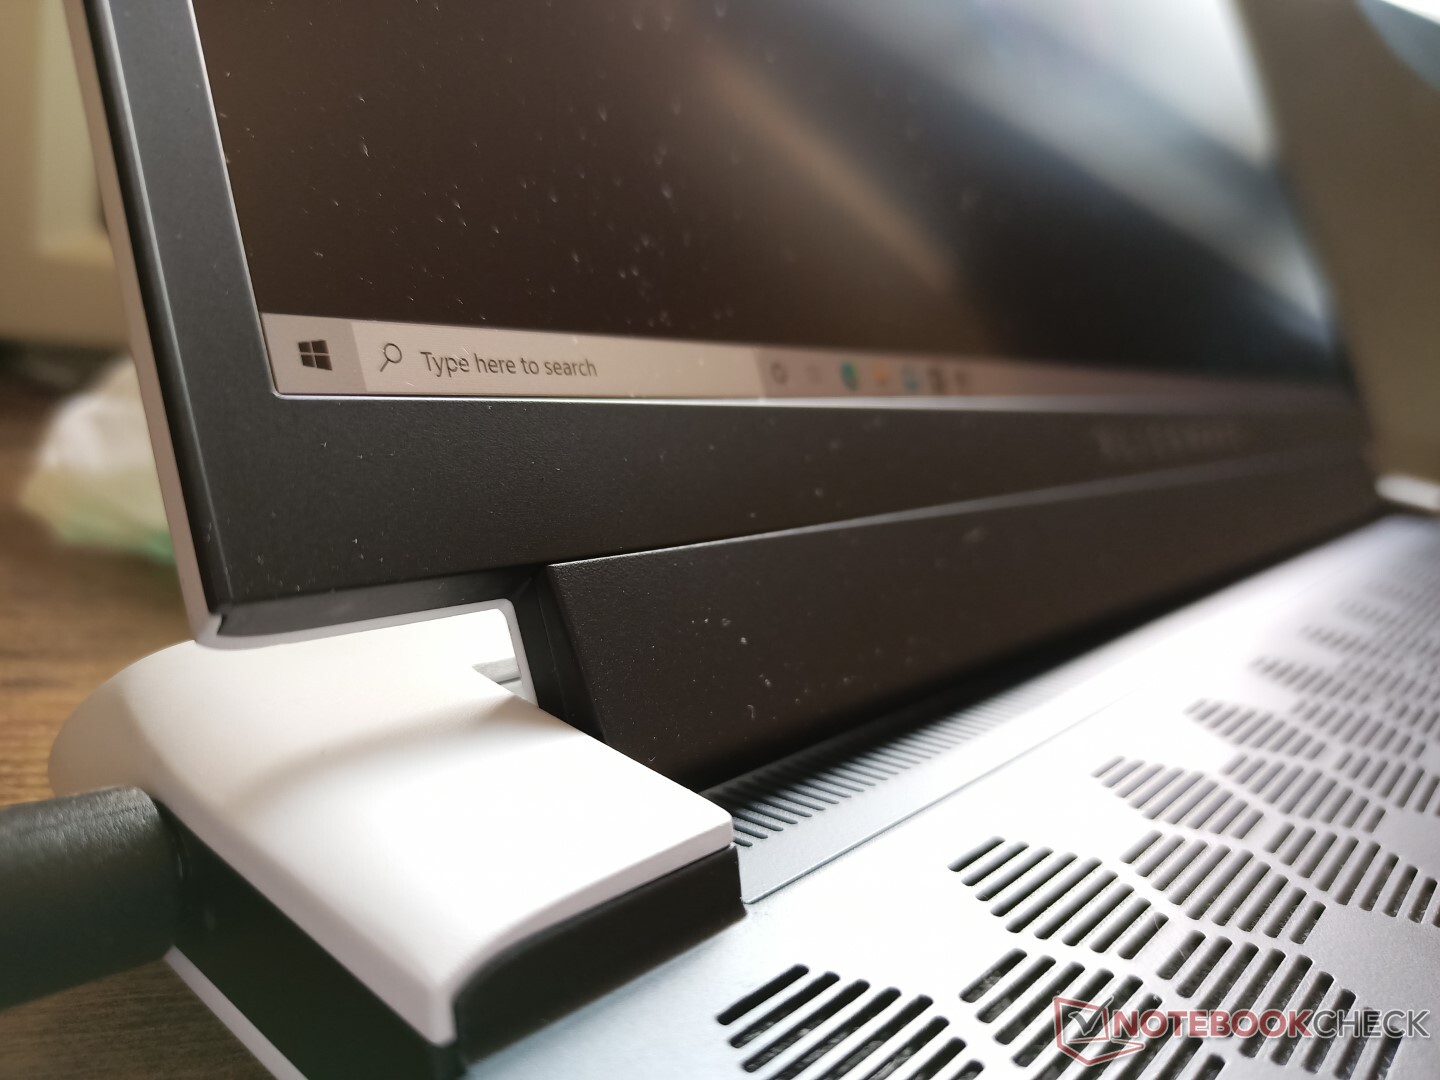
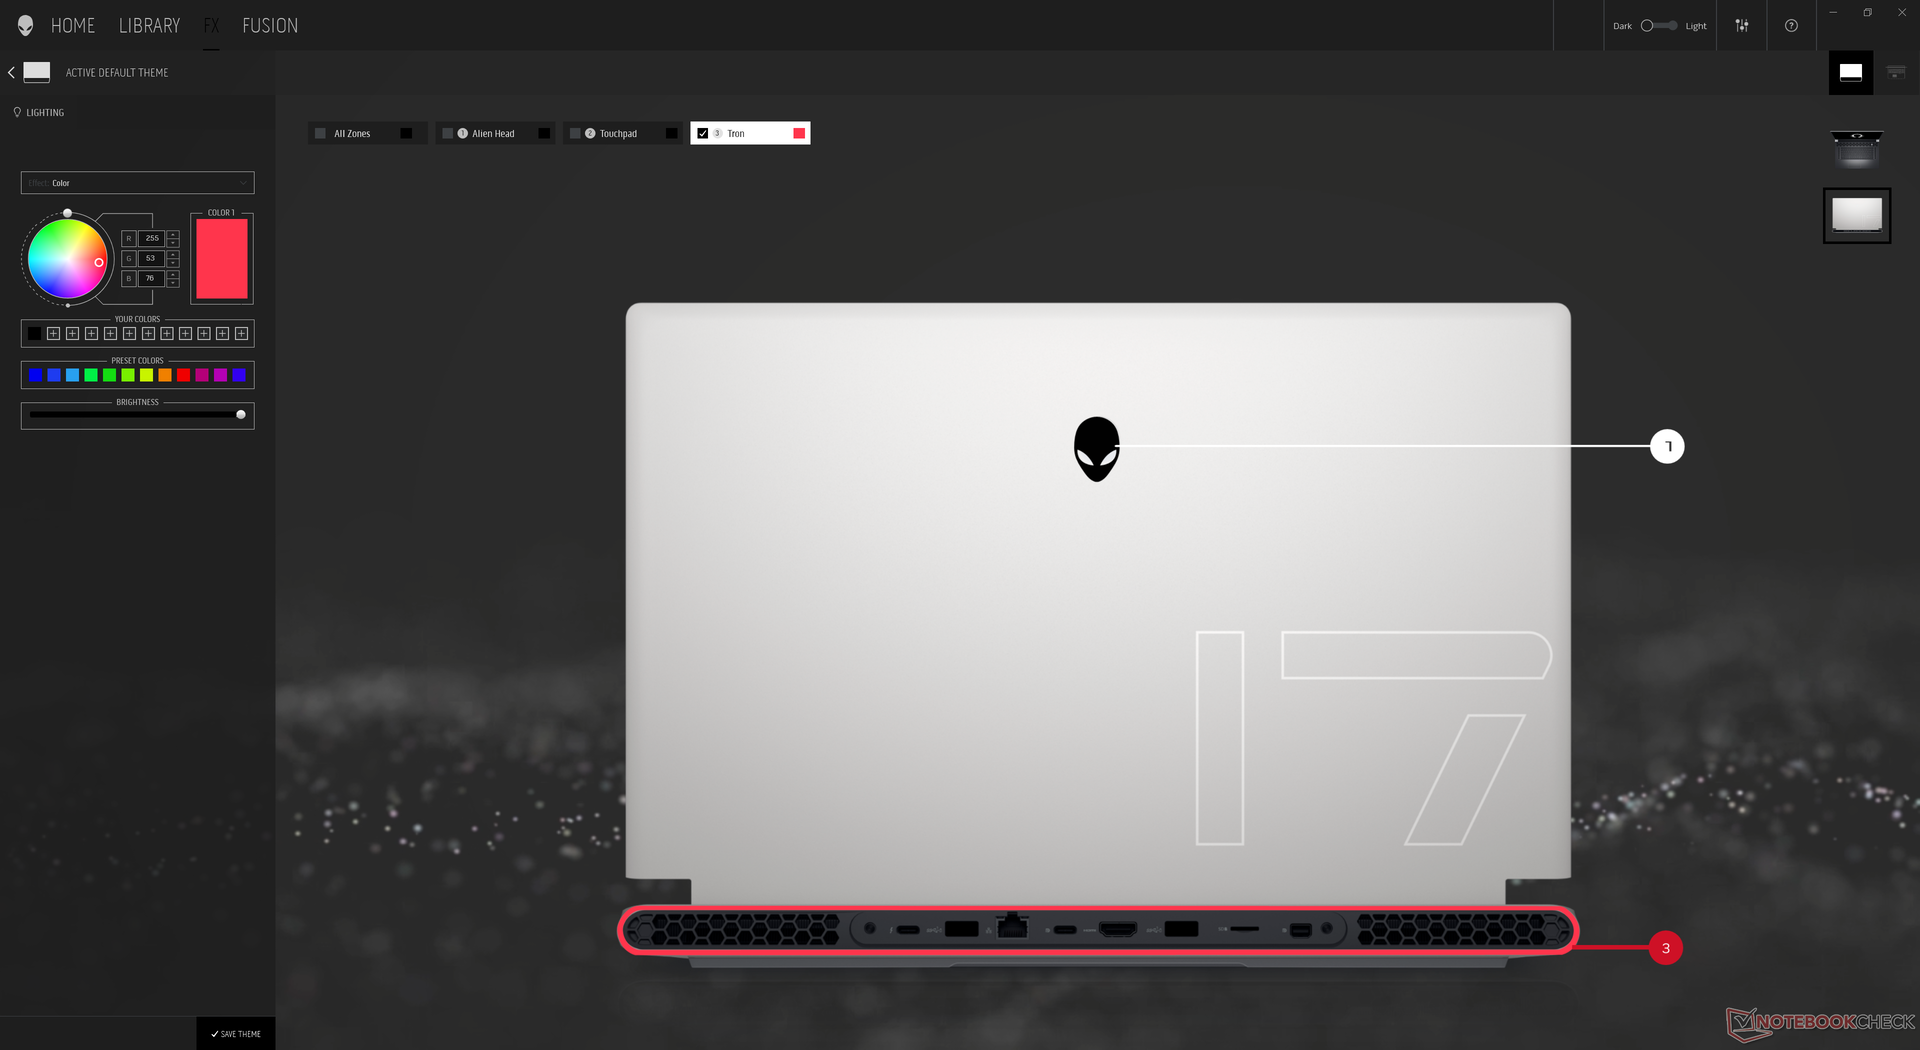
Das überarbeitete "Legend" Gehäusedesign verwendet die bekannten Soft-Touch-Kunststoffe vom m17 R2, aber mit insgesamt flacheren Proportionen, um das dünne Gehäuse zu unterstreichen. Der weiße Bildschirmdeckel und die wabenförmigen Kühlöffnungen bleiben bestehen, während die Oberseite der Baseunit nun schwarz und etwas kantiger ist. Die Stabilität ist weiterhin exzellent, vor allem die Baseunit lässt sich nicht verwinden und es gibt auch keine Knarzgeräusche.
Der Bildschirmdeckel ist etwas flexibler als beim Blade 17, aber stabiler als beim MSI GS75. Vor allem der untere Bildschirmrand ist sehr breit und trägt seinen Teil zur sehr großen Stellfläche bei.
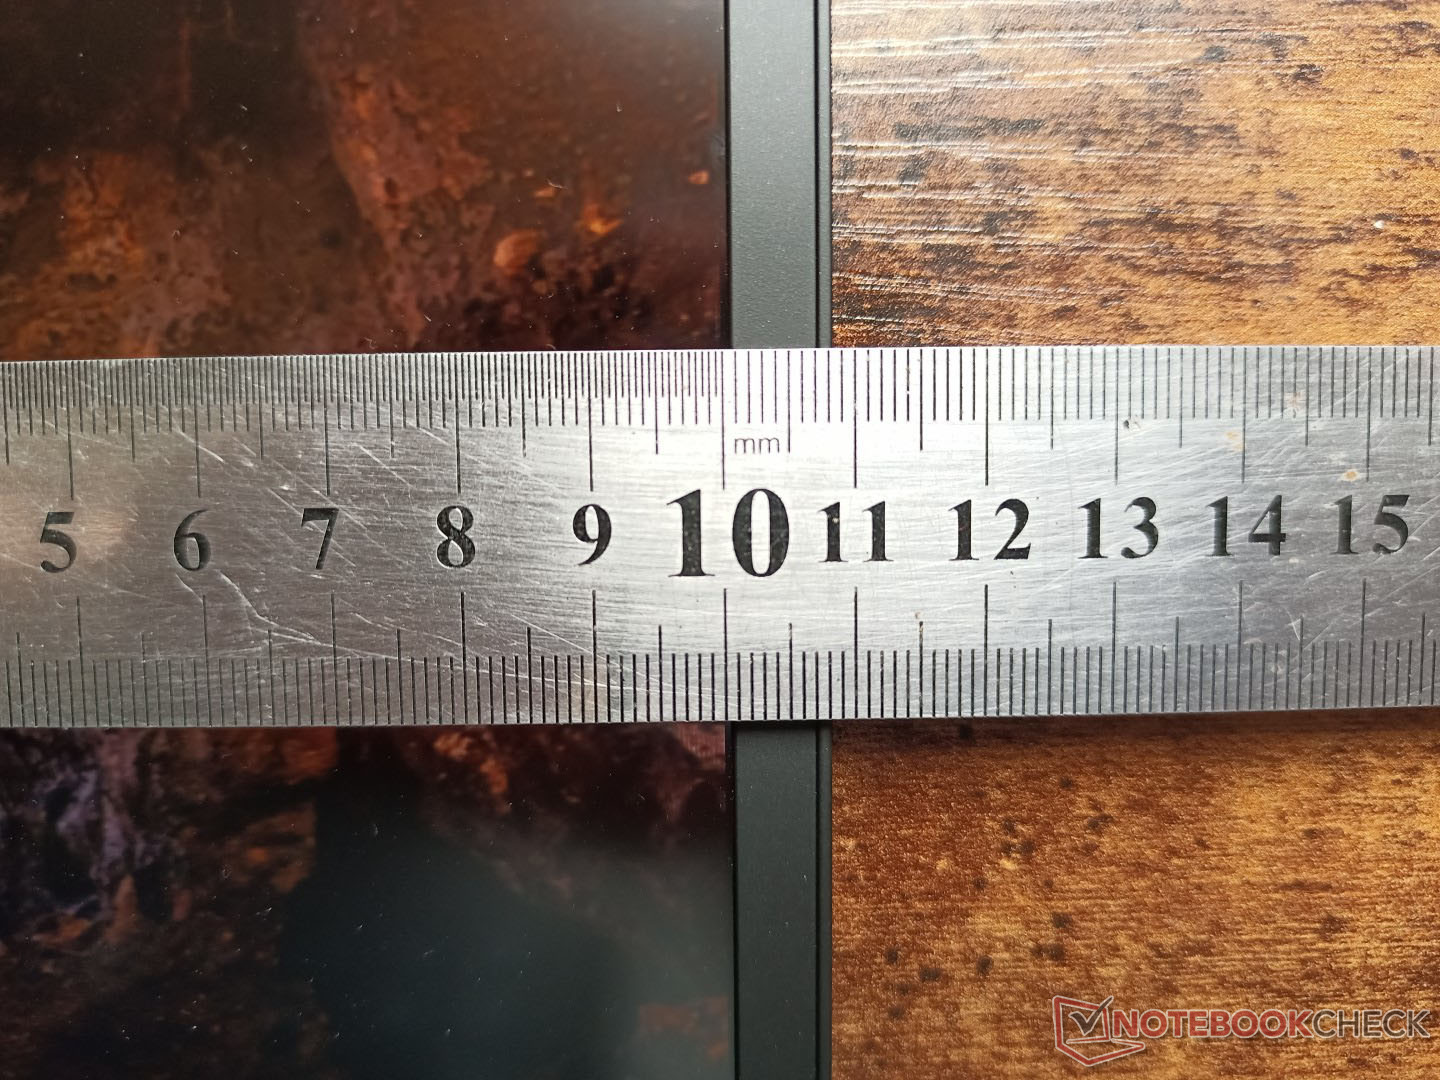
Alienware-Notebooks sind traditionell recht groß und auch das neue x17 R1 ist ein sehr großes Gerät, auch wenn Dell die dünne Konstruktion bewirbt. Tatsächlich ist das x17 R1 sogar deutlich größer und schwerer als die meisten Konkurrenten wie das MSI GS76, Blade 17 oder Zephyrus S17. Selbst das alte Alienware m17 R4 ist rund 200 Gramm leichter als das x17 R1, trotz des praktisch identischen Gehäusevolumens. Das zusätzliche Gewicht macht sich aber positiv bei der stabileren Baseunit bemerkbar.
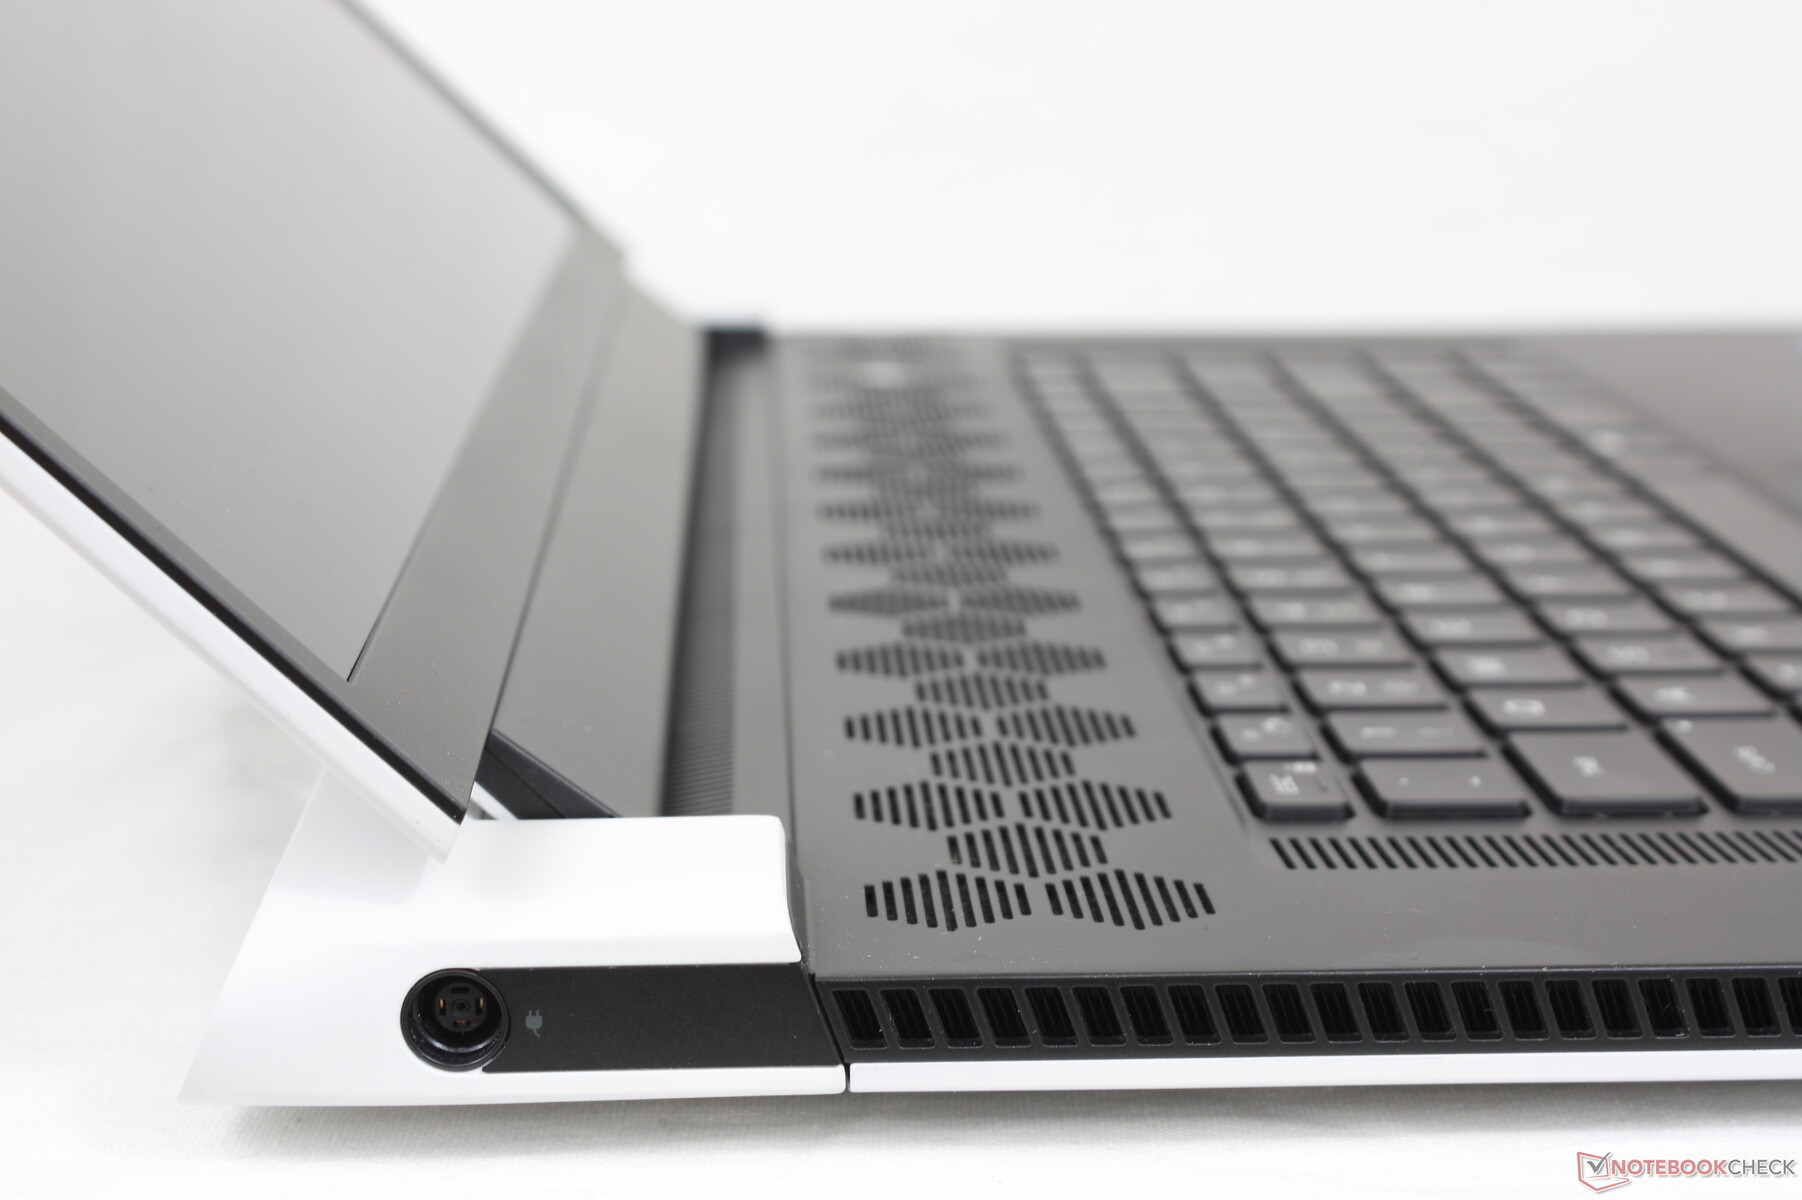
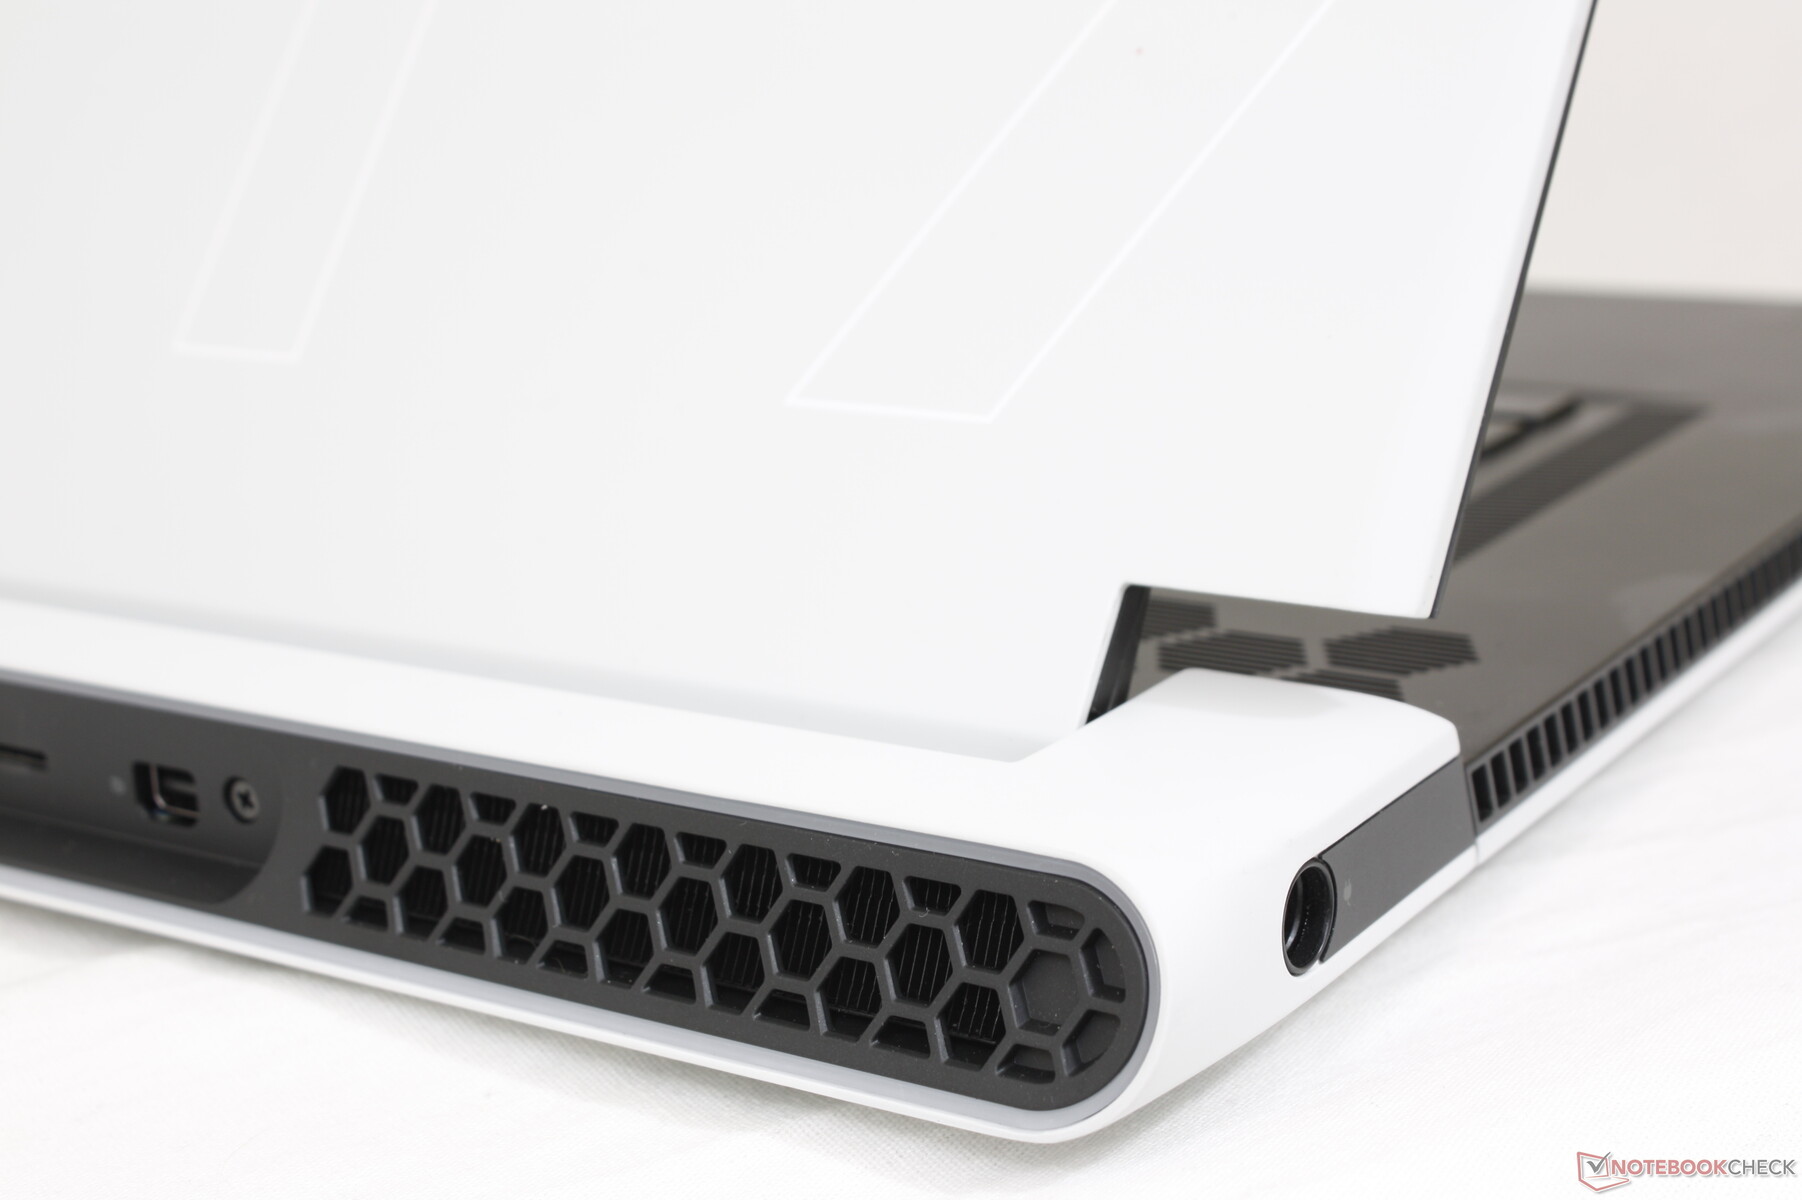
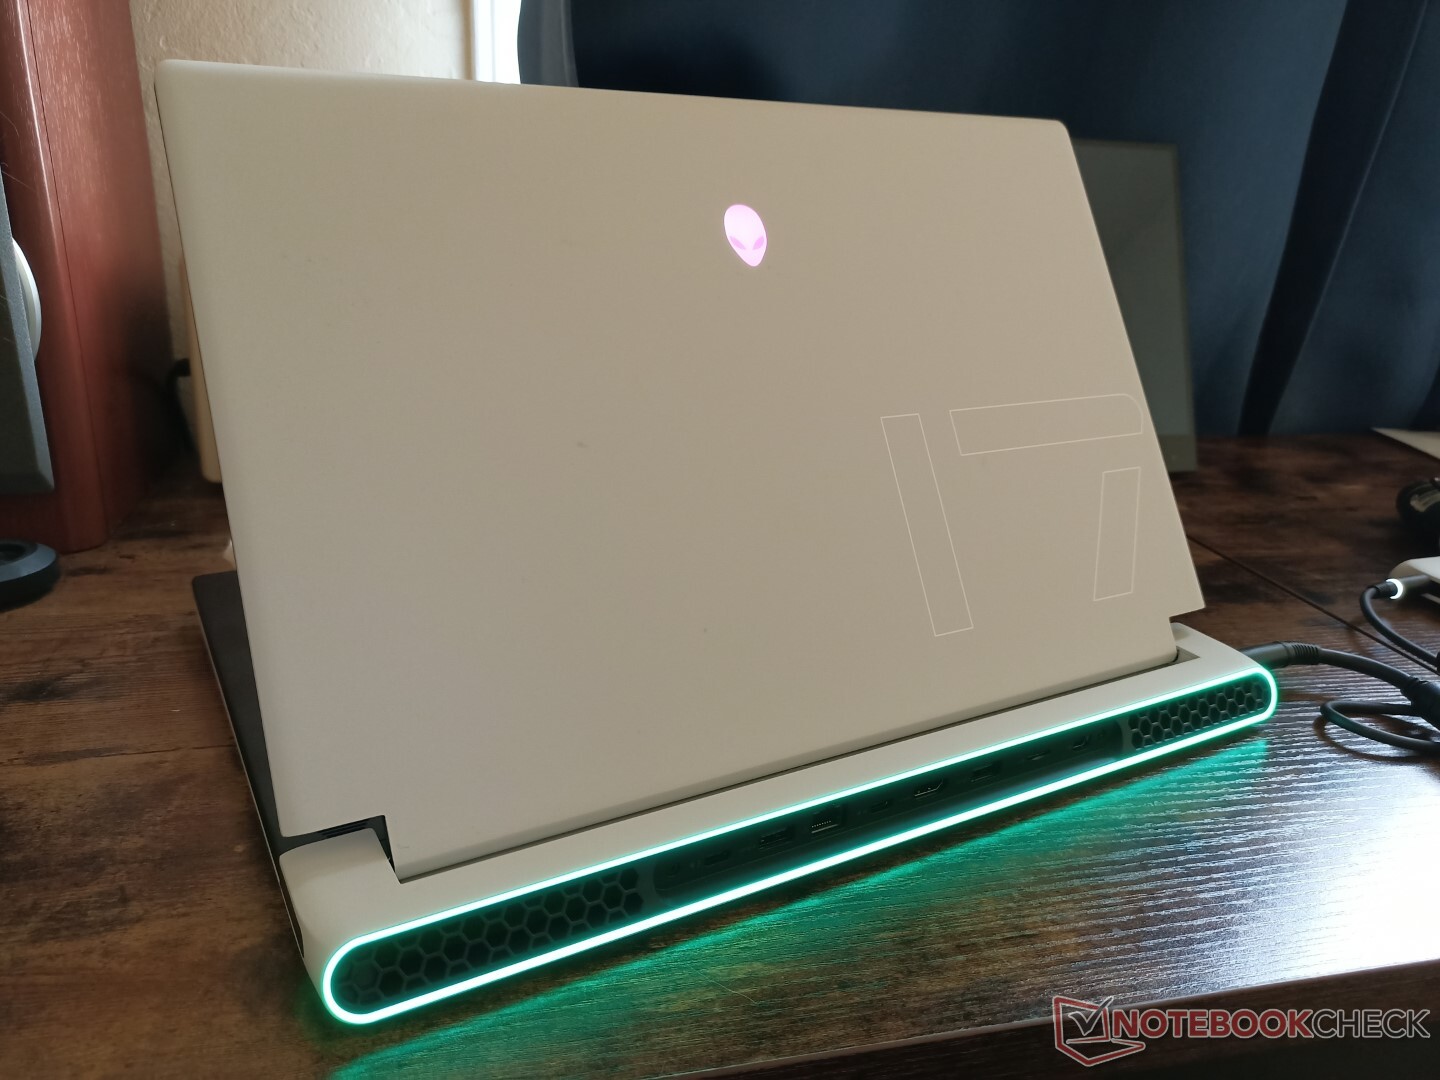
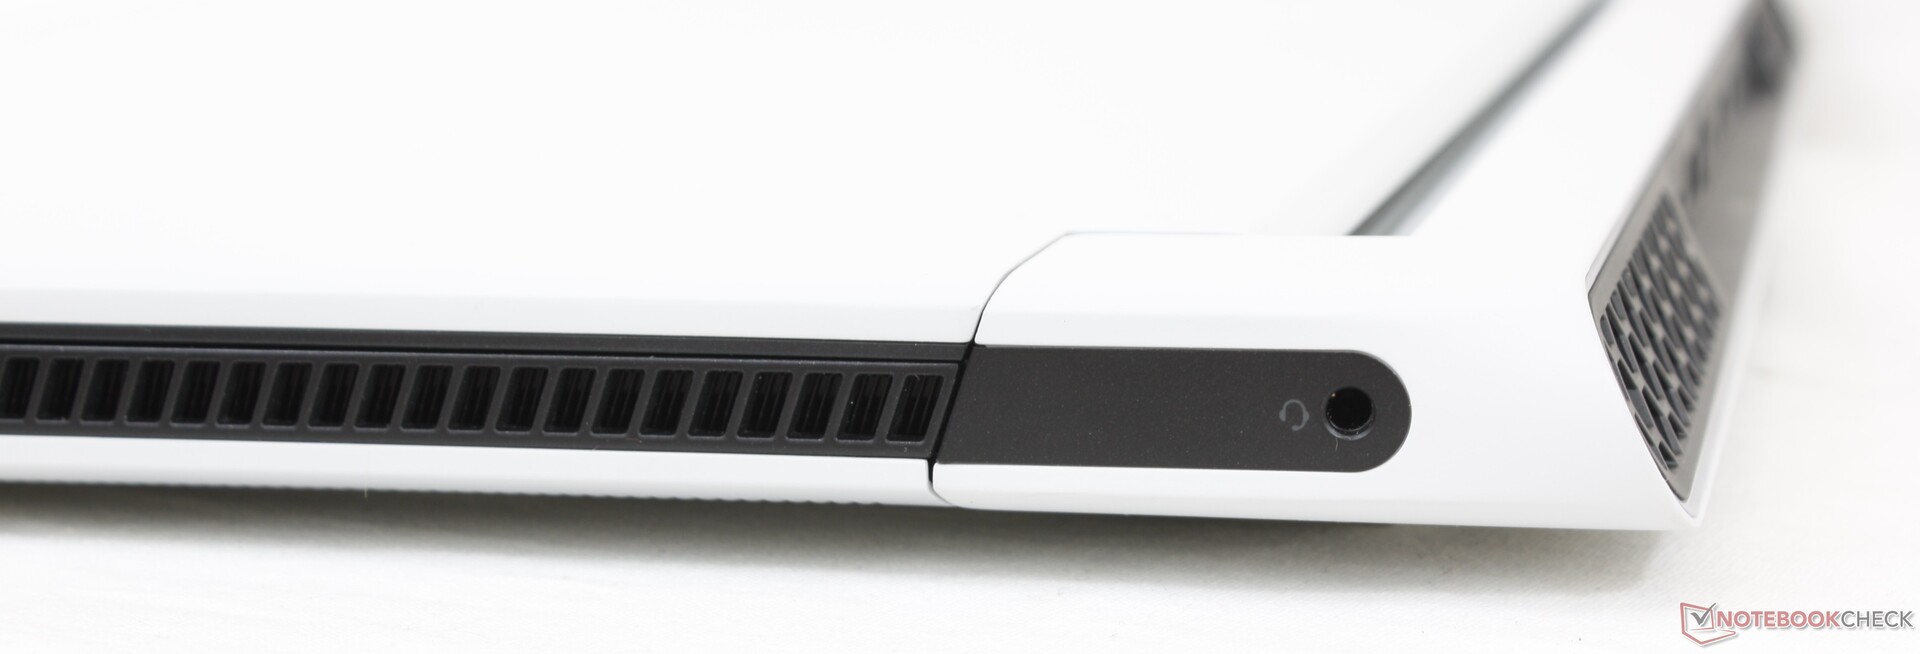
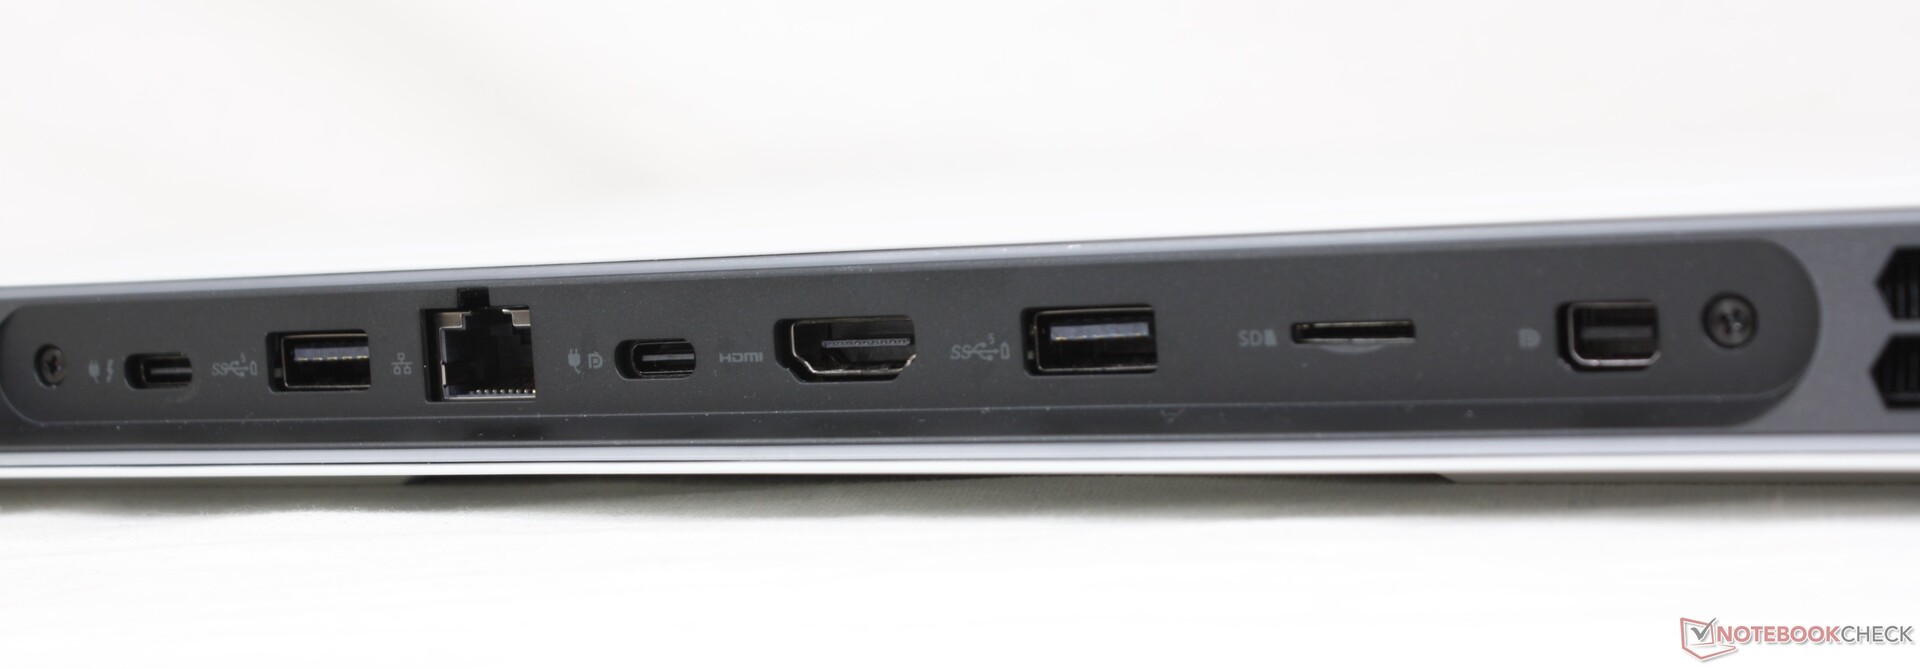
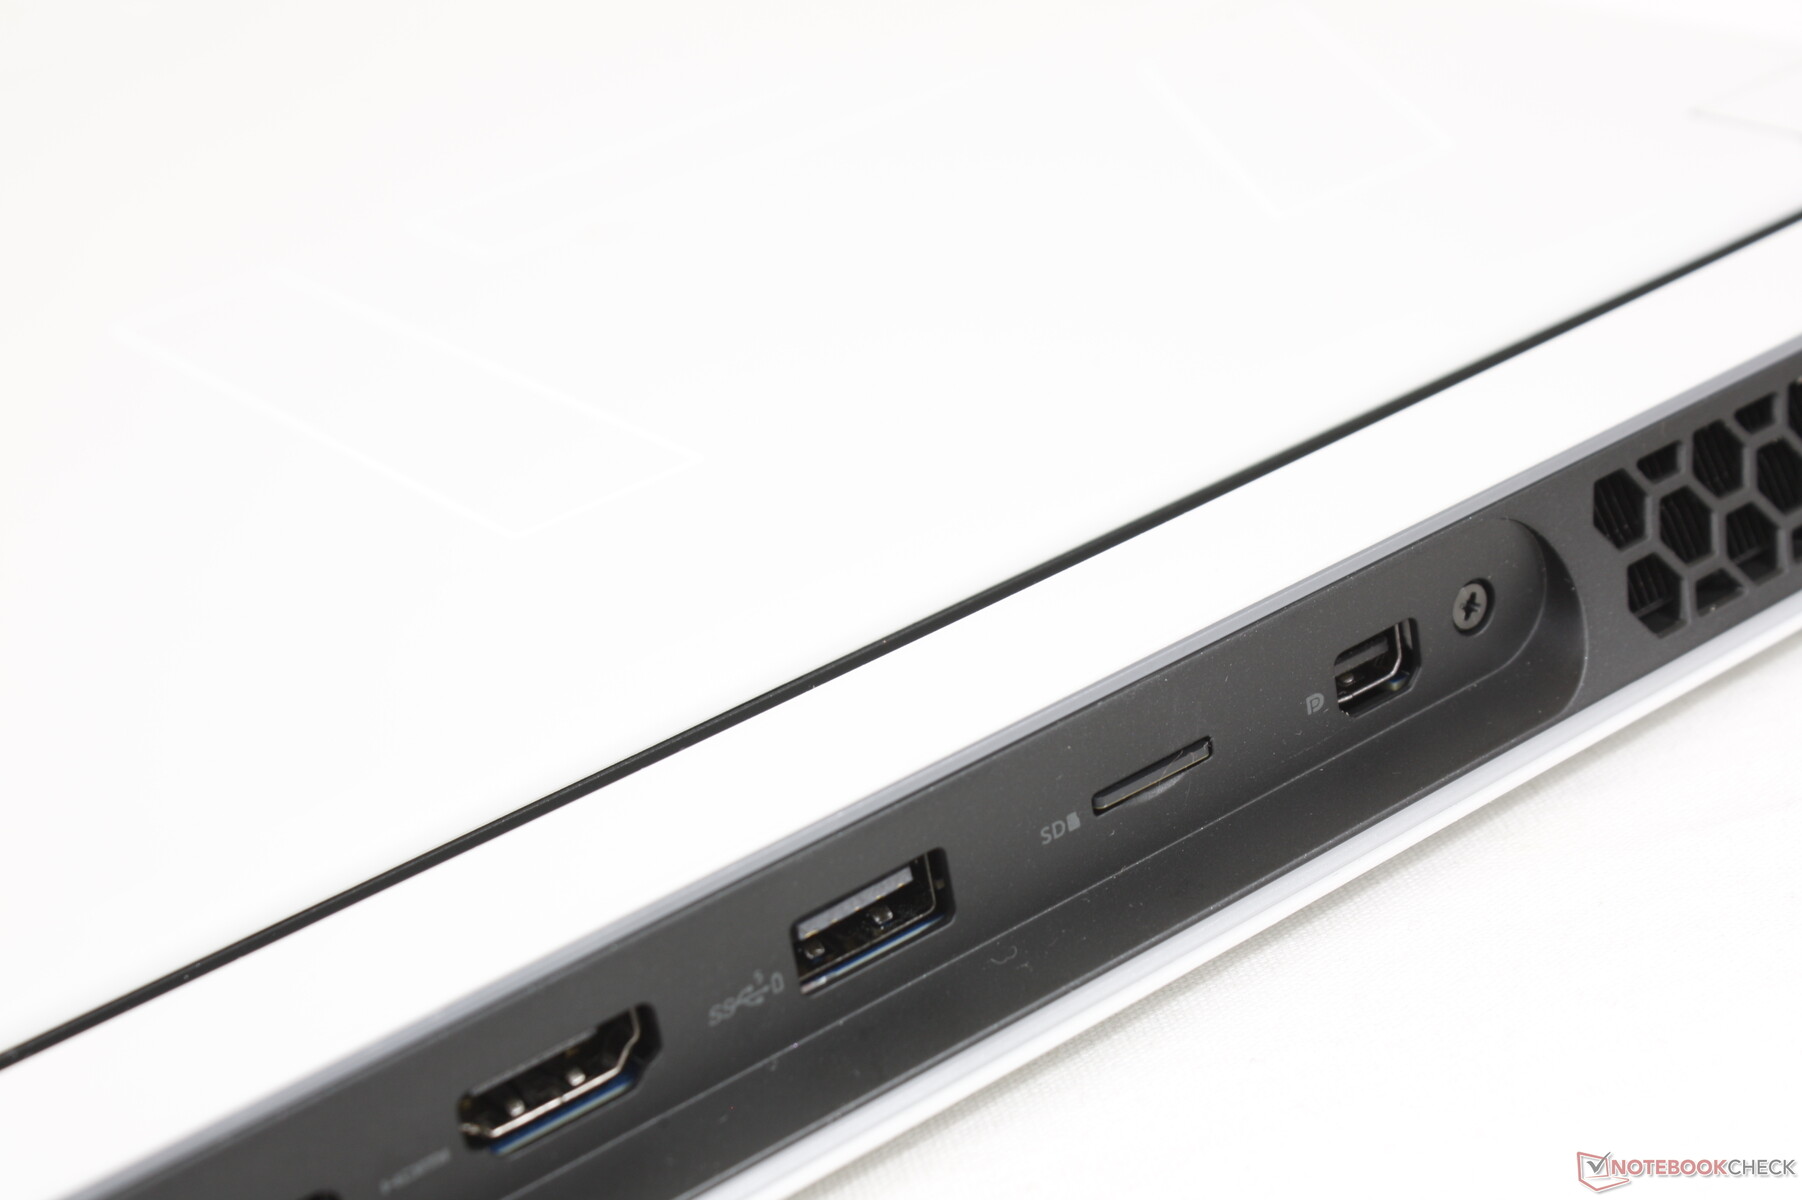
Ausstattung - Alles am Heck
Die Anschlüsse entsprechen größtenteils dem letztjährigen Alienware m17 R4, aber es gibt ein paar wichtige Veränderungen. Der selten genutzte Graphics-Amplifier-Port wurde beispielsweise durch einen zweiten USB-C-Anschluss ersetzt und es gibt jetzt einen USB-A-Port weniger. Außerdem befinden sich alle Anschlüsse nun auf der Rückseite, weshalb sie schwerer zu erreichen sind.
Beide USB-C-Anschlüsse unterstützen den DisplayPort-ALT-Modus und Power Delivery, aber nur einer von beiden unterstützt Thunderbolt 4.
SDCardreader
Mit unserer UHS-II-Referenzkarte (AV Pro v60) ermitteln wir sehr hohe Transferraten von fast 250 MB/s. Der Kartenleser ist an der Rückseite zwar schwer zu erreichen, aber lieber so also gar keinen Kartenleser.
| SD Card Reader | |
| average JPG Copy Test (av. of 3 runs) | |
| Razer Blade 17 RTX 3070 (AV Pro V60) | |
| MSI GS76 Stealth 11UH (AV PRO microSD 128 GB V60) | |
| Alienware m17 R4 (AV PRO microSD 128 GB V60) | |
| Gigabyte Aero 17 HDR YD (AV PRO microSD 128 GB V60) | |
| Asus ROG Zephyrus S17 GX703HSD | |
| Alienware x17 RTX 3080 P48E (AV Pro V60) | |
| maximum AS SSD Seq Read Test (1GB) | |
| Asus ROG Zephyrus S17 GX703HSD | |
| Alienware x17 RTX 3080 P48E (AV Pro V60) | |
| Alienware m17 R4 (AV PRO microSD 128 GB V60) | |
| MSI GS76 Stealth 11UH (AV PRO microSD 128 GB V60) | |
| Razer Blade 17 RTX 3070 (AV Pro V60) | |
| Gigabyte Aero 17 HDR YD (AV PRO microSD 128 GB V60) | |
Kommunikation
Wie schon beim Vorgänger ist das Wi-Fi-6E-Modul von Killer (AX1675x) auf dem Mainboard verlötet. Beim kleineren Alienware x15 kann man es interessanterweise austauschen, trotz des kompakteren 15,6-Zoll-Gehäuses.
Webcam - IR, aber keine mechanische Blende
Die Kameraqualität hat sich beim neuen Modell kaum verbessert und setzt nach wie vor auf einen 720p-Sensor. Einige Gaming-Notebooks wie das Razer Blade 17 setzen mittlerweile auf 1080p-Module. Eine mechanische Blende ist ebenfalls nicht vorhanden.

")
")
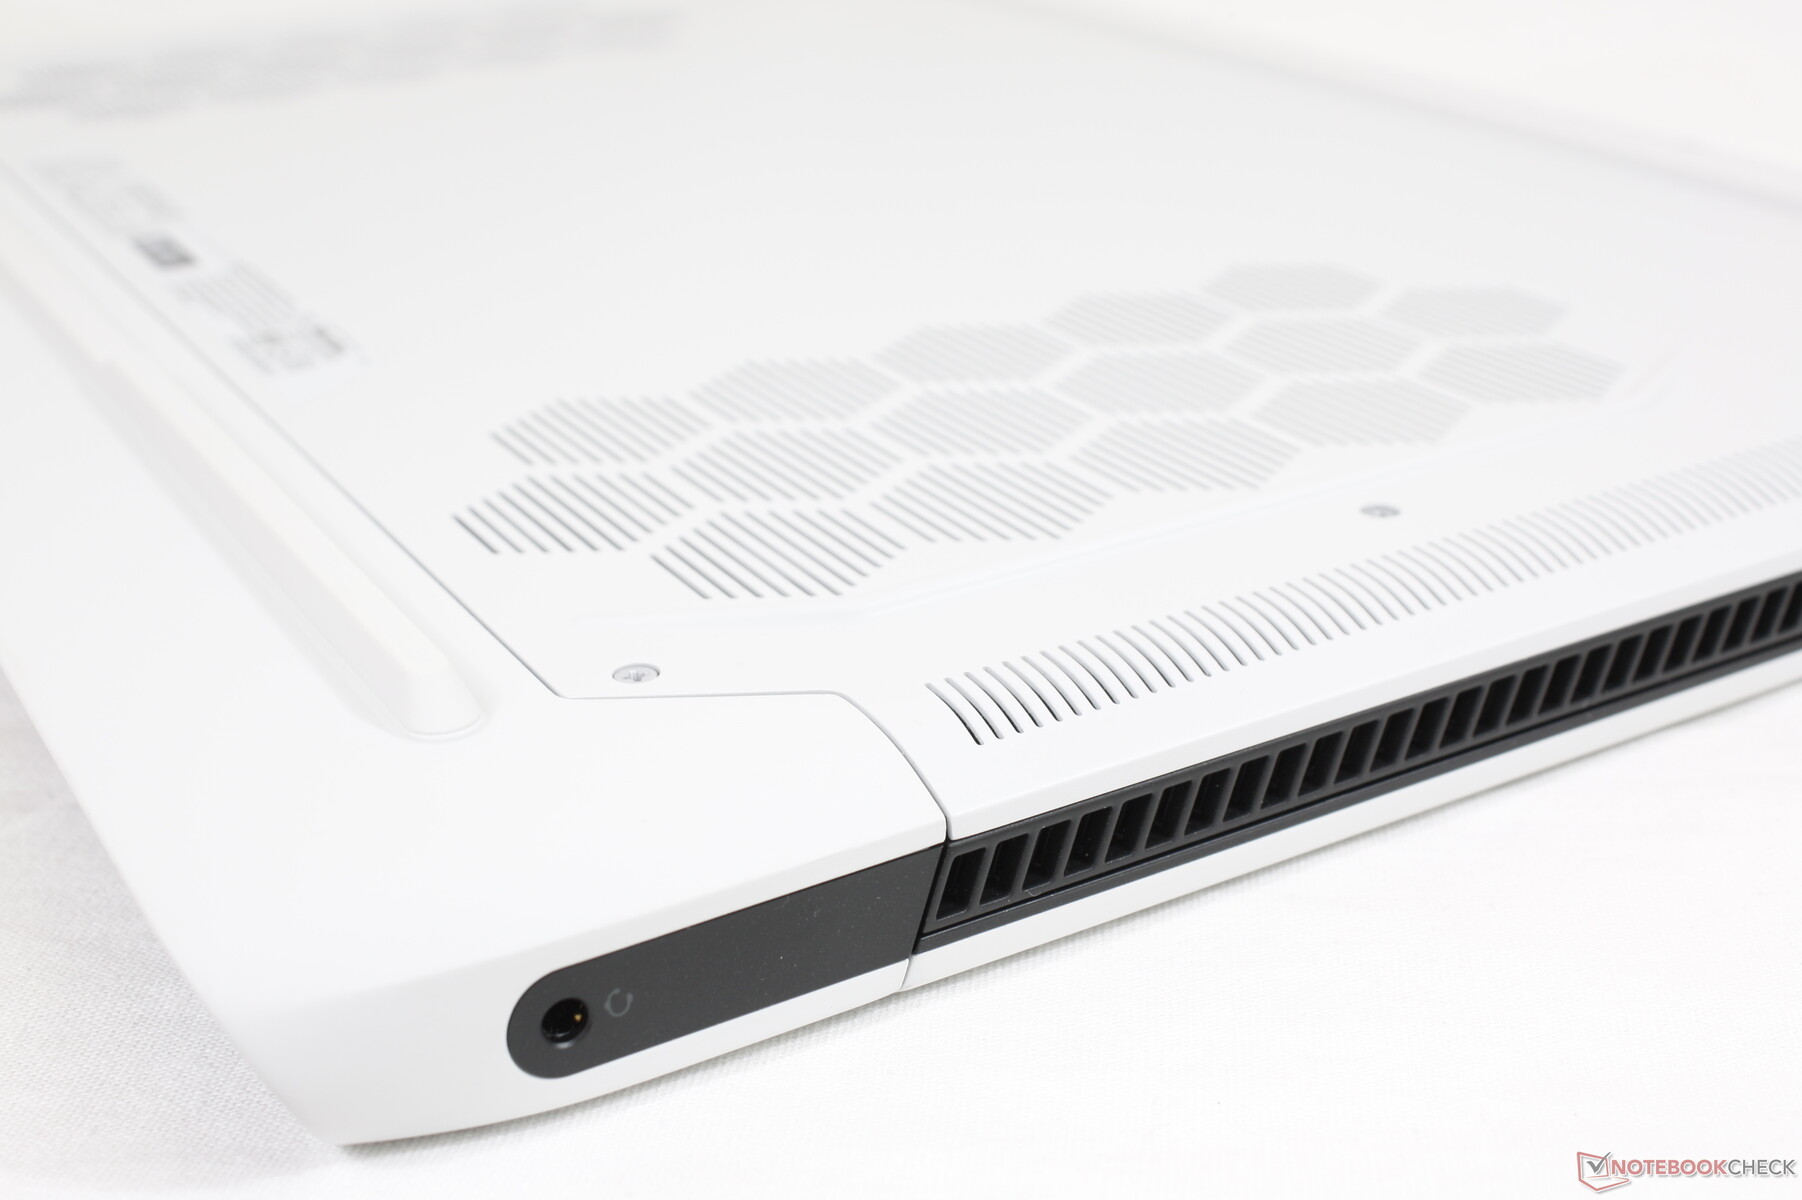
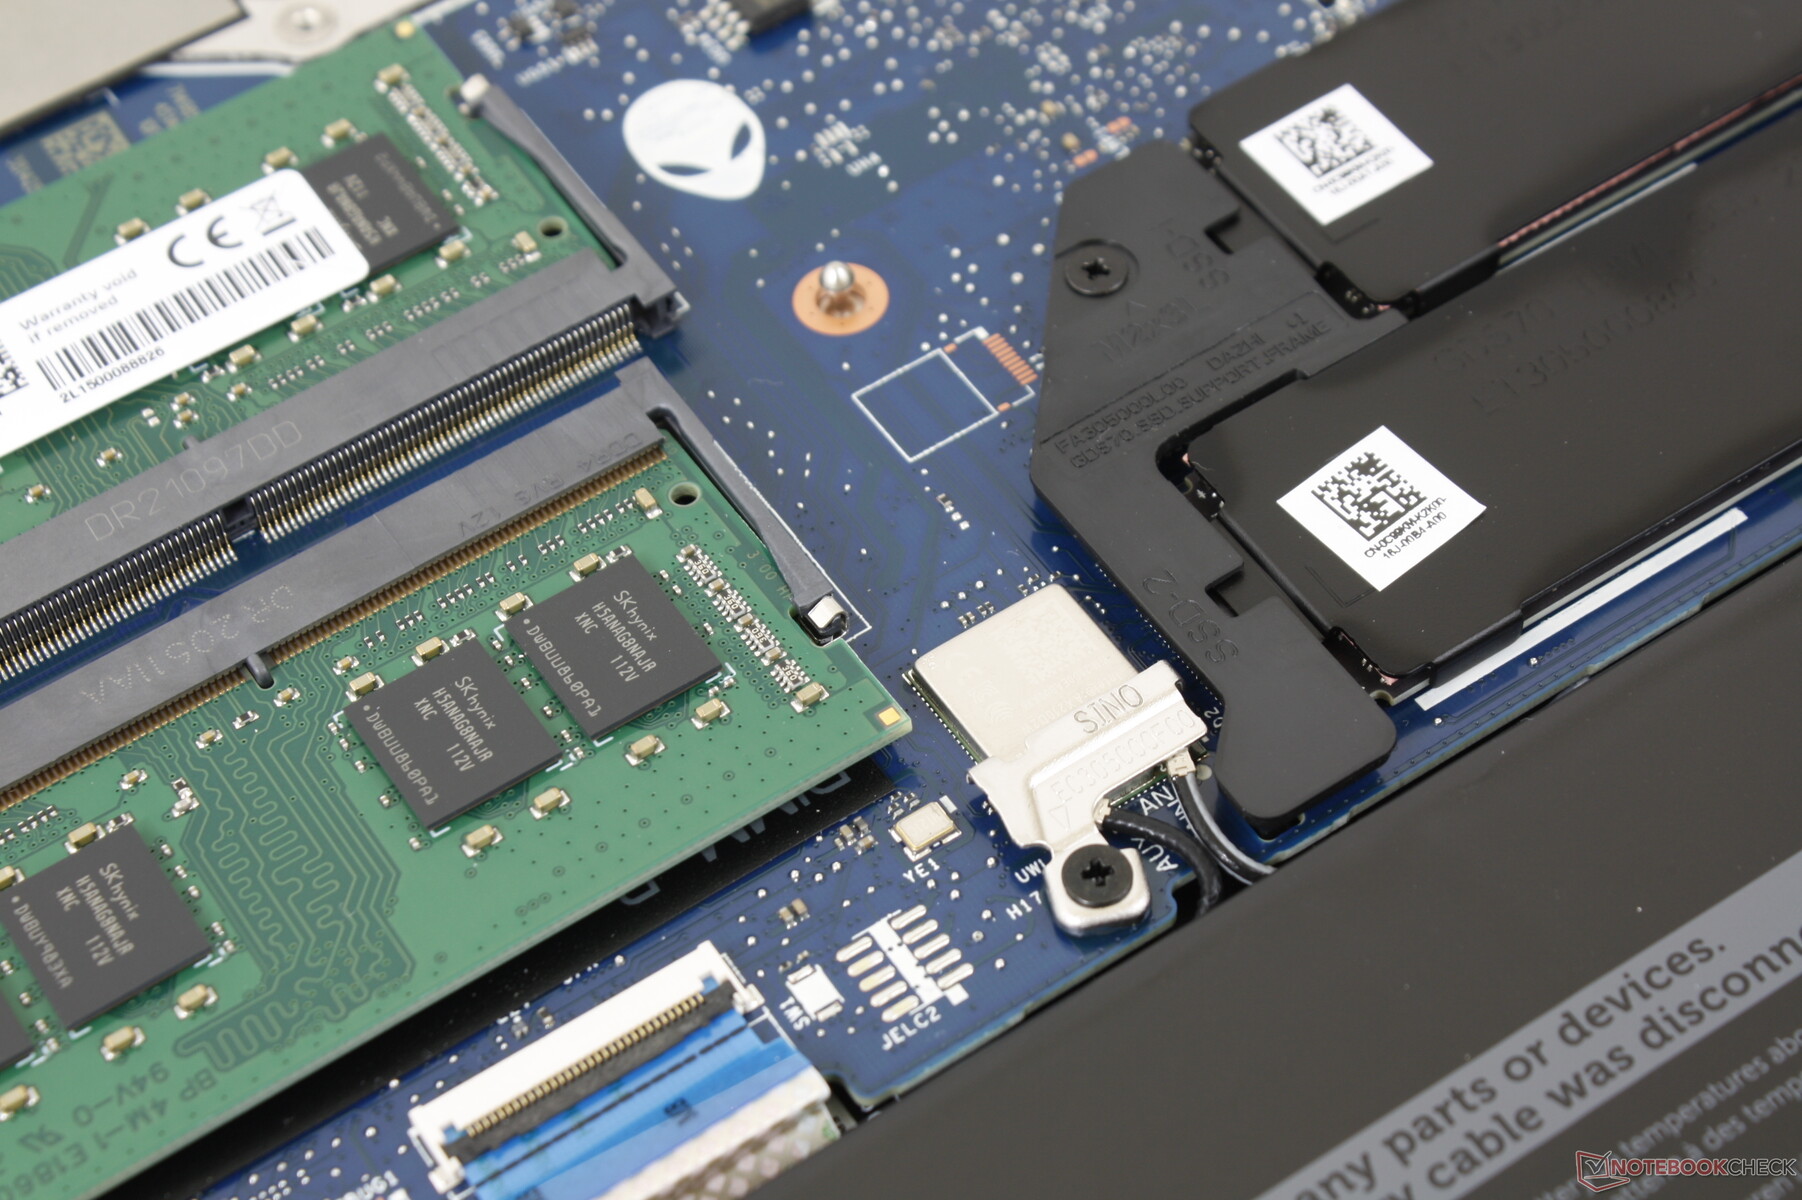
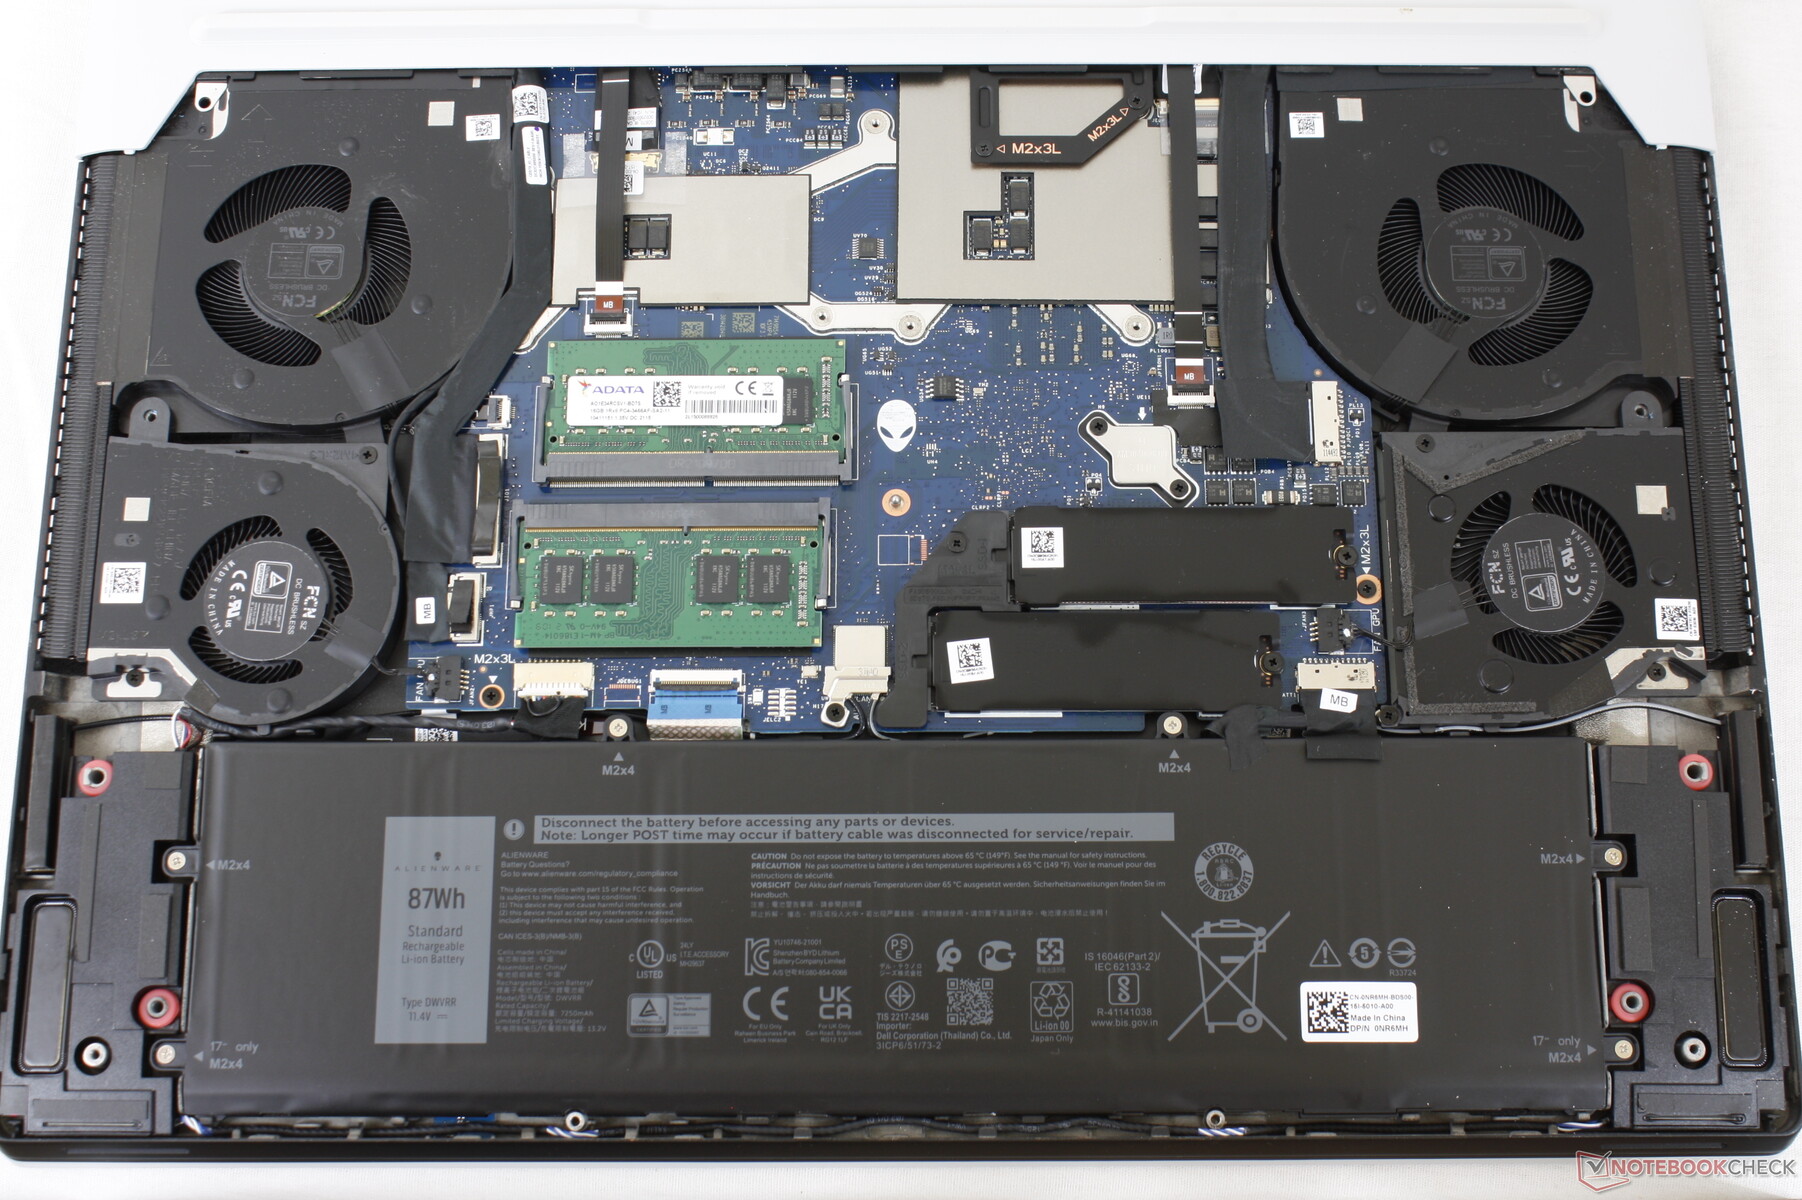
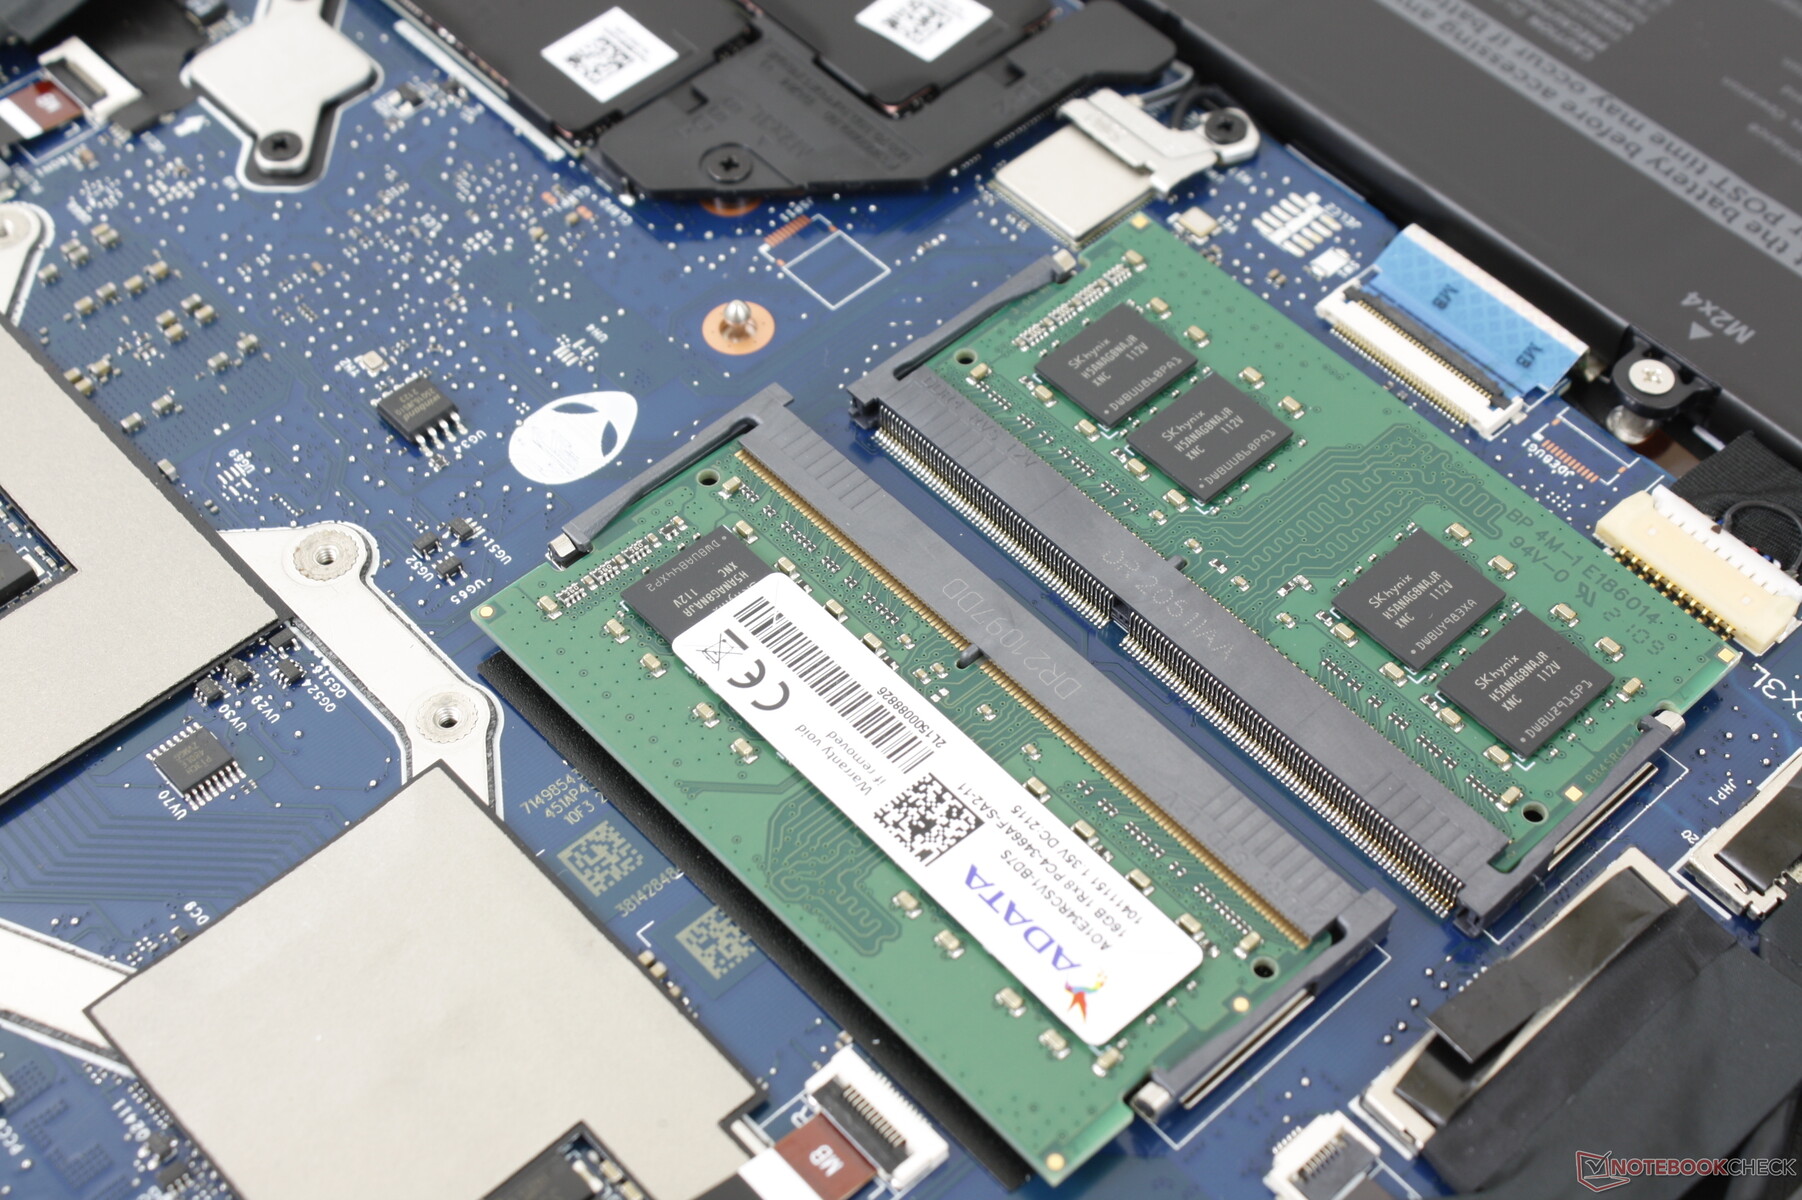
Wartung
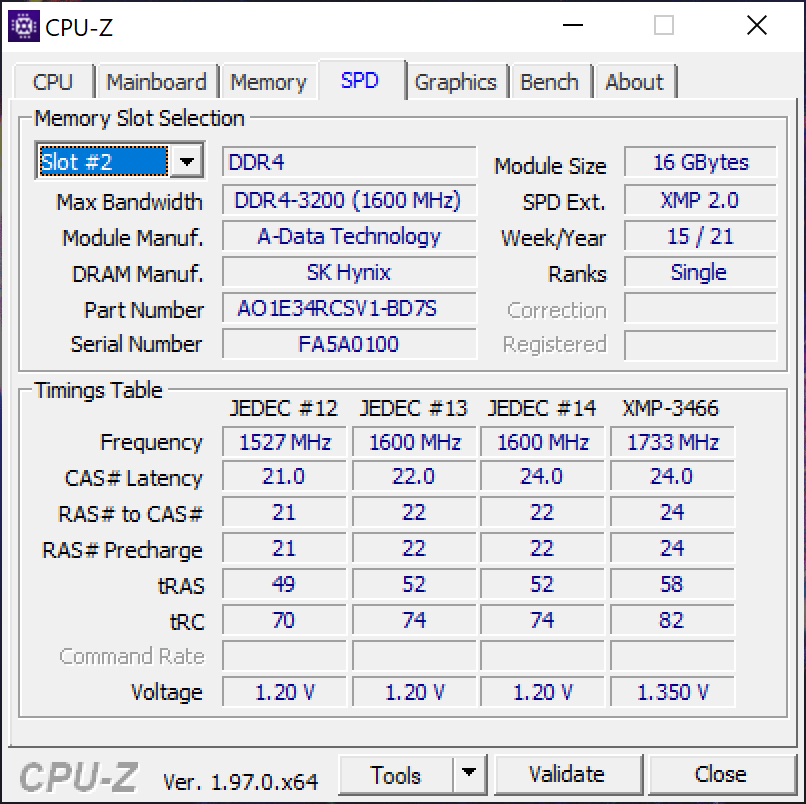
Die untere Abdeckung lässt sich mit einem normalen Kreuzschraubendreher und einem spitzen Gegenstand leicht entfernen. Der Arbeitsspeicher lässt sich mit zwei SODIMM-Steckplätzen erweitern, während er beim alten m17 R2 noch verlötet war.
Zubehör und Garantie
Abgesehen von dem Netzteil und einigen Broschüren gibt es kein Zubehör. Standardmäßig liegt die Garantie bei einem Jahr, kann gegen Aufpreis aber direkt bei Dell auf maximal 5 Jahre verlängert werden.
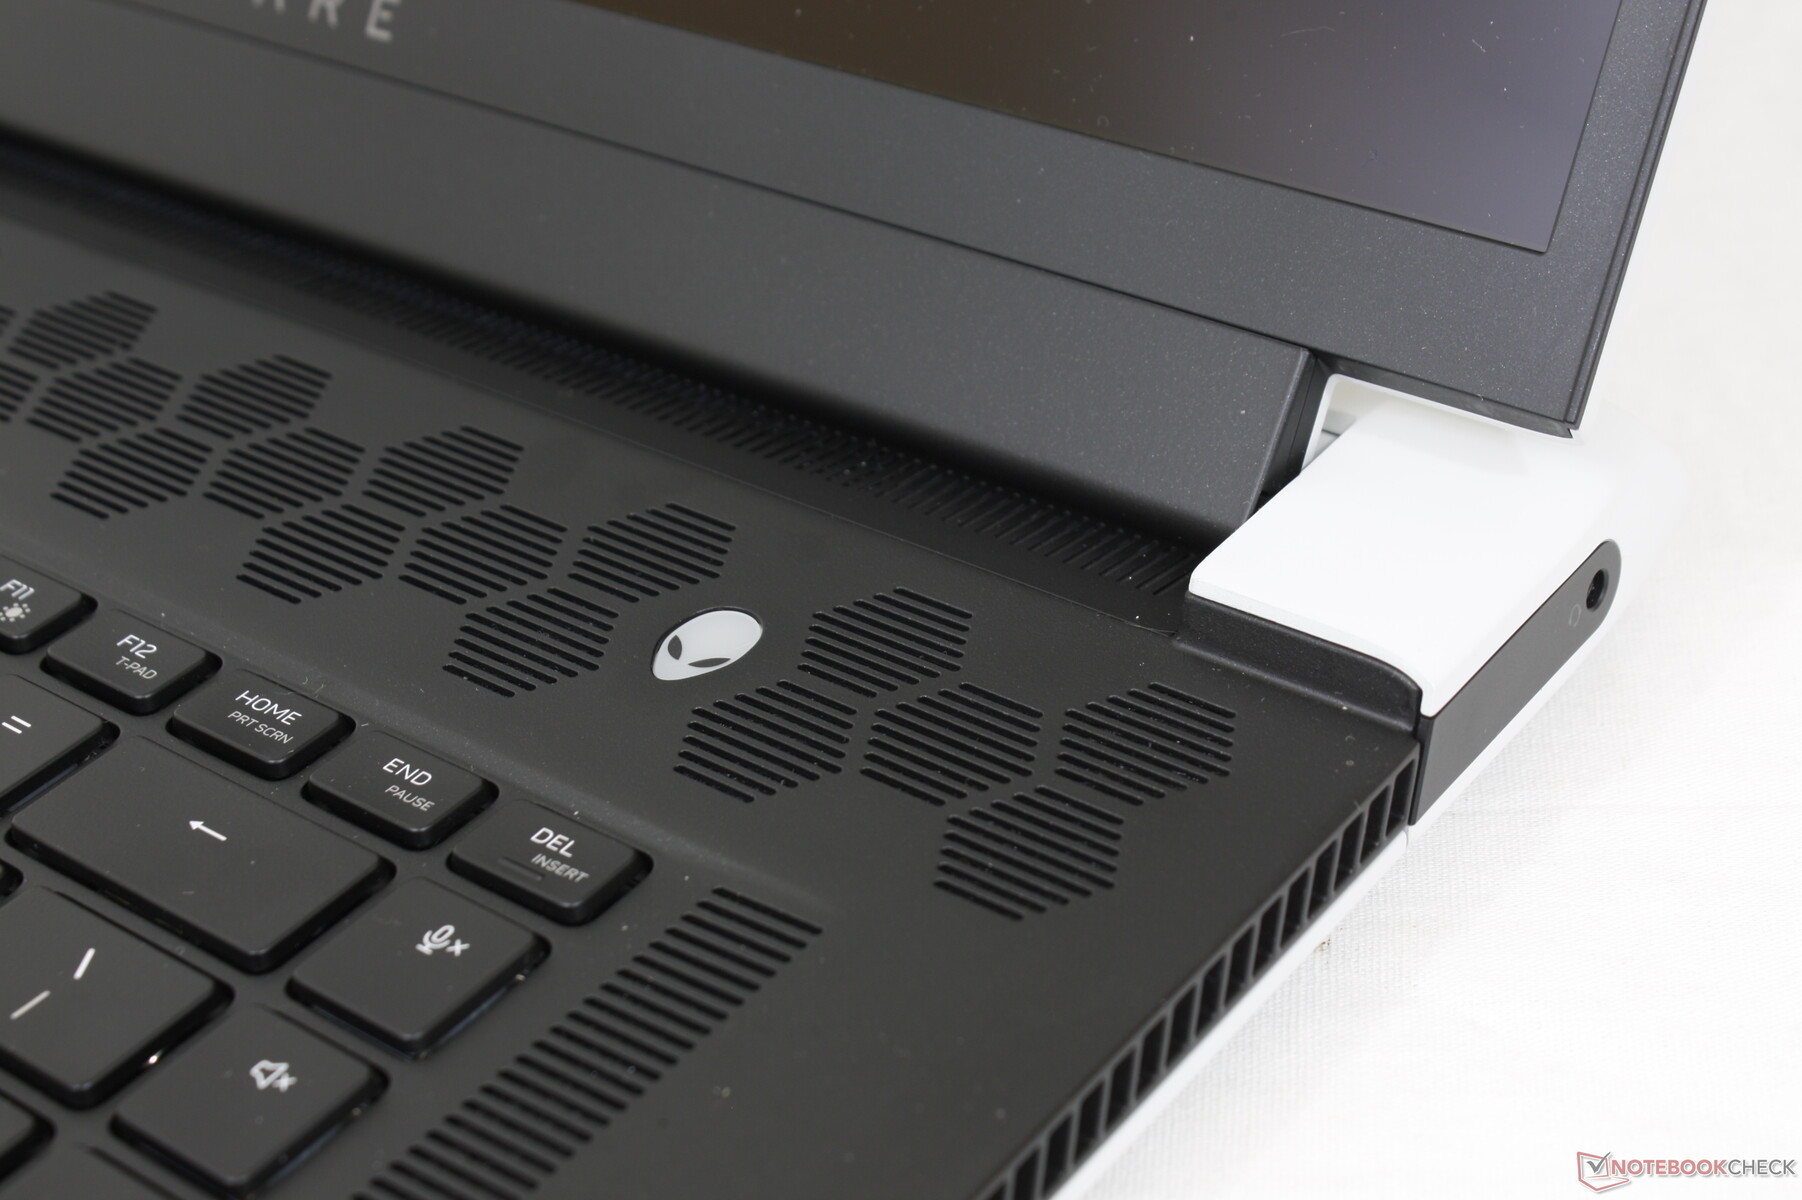
Eingabegeräte — CherryMX weiterhin optional
Tastatur
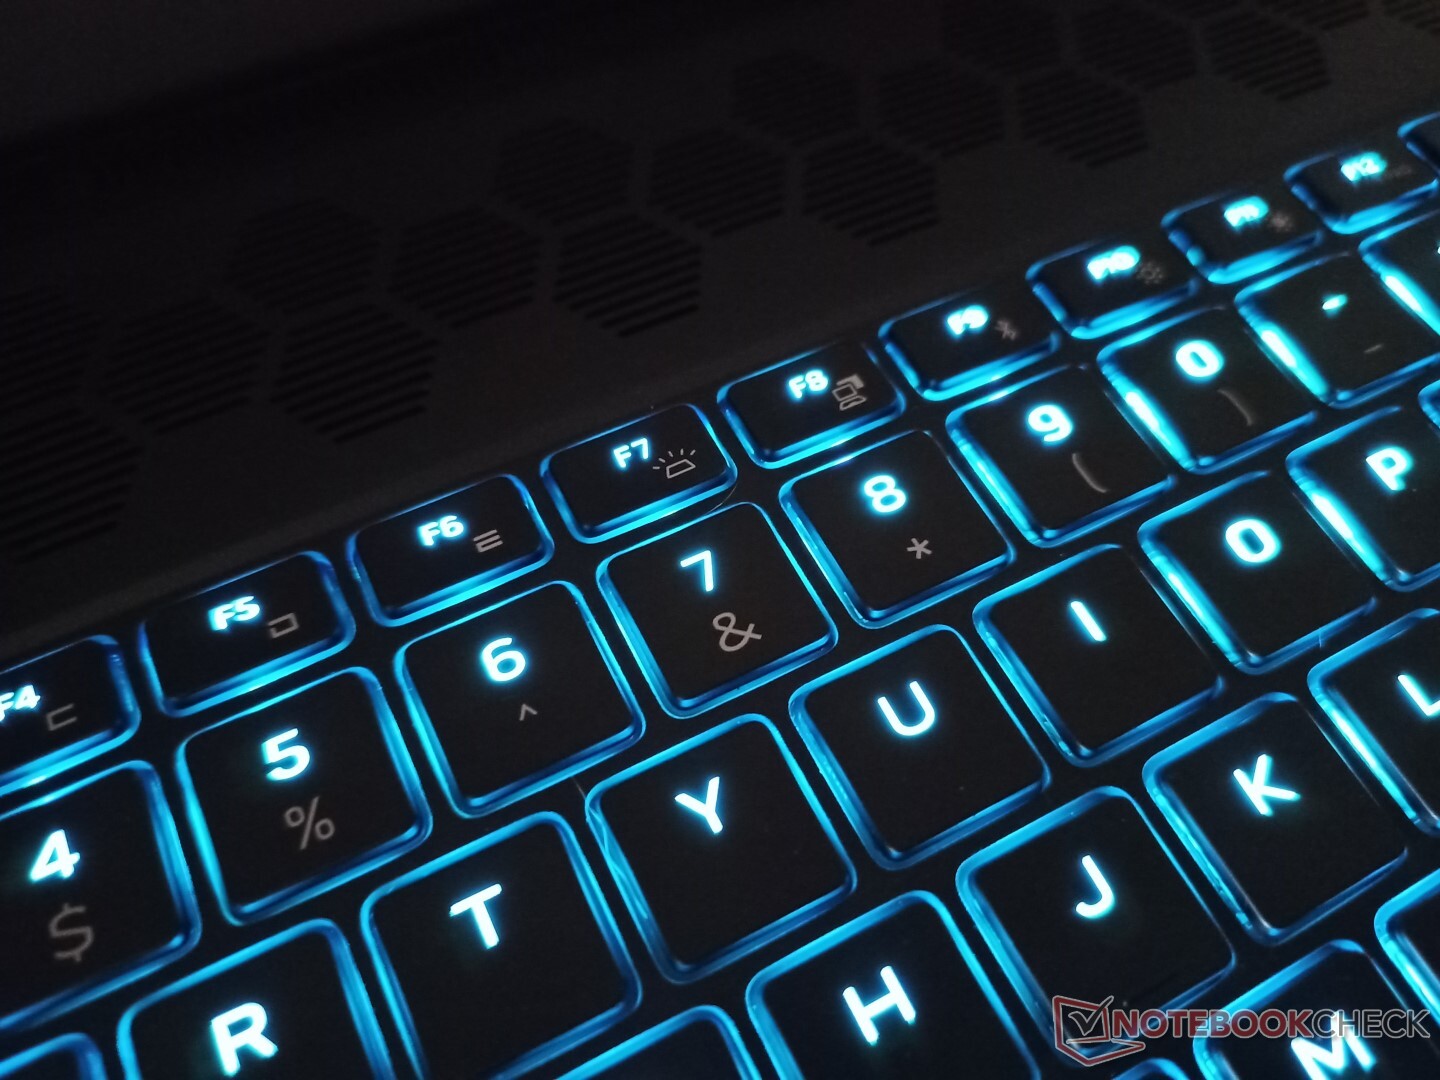
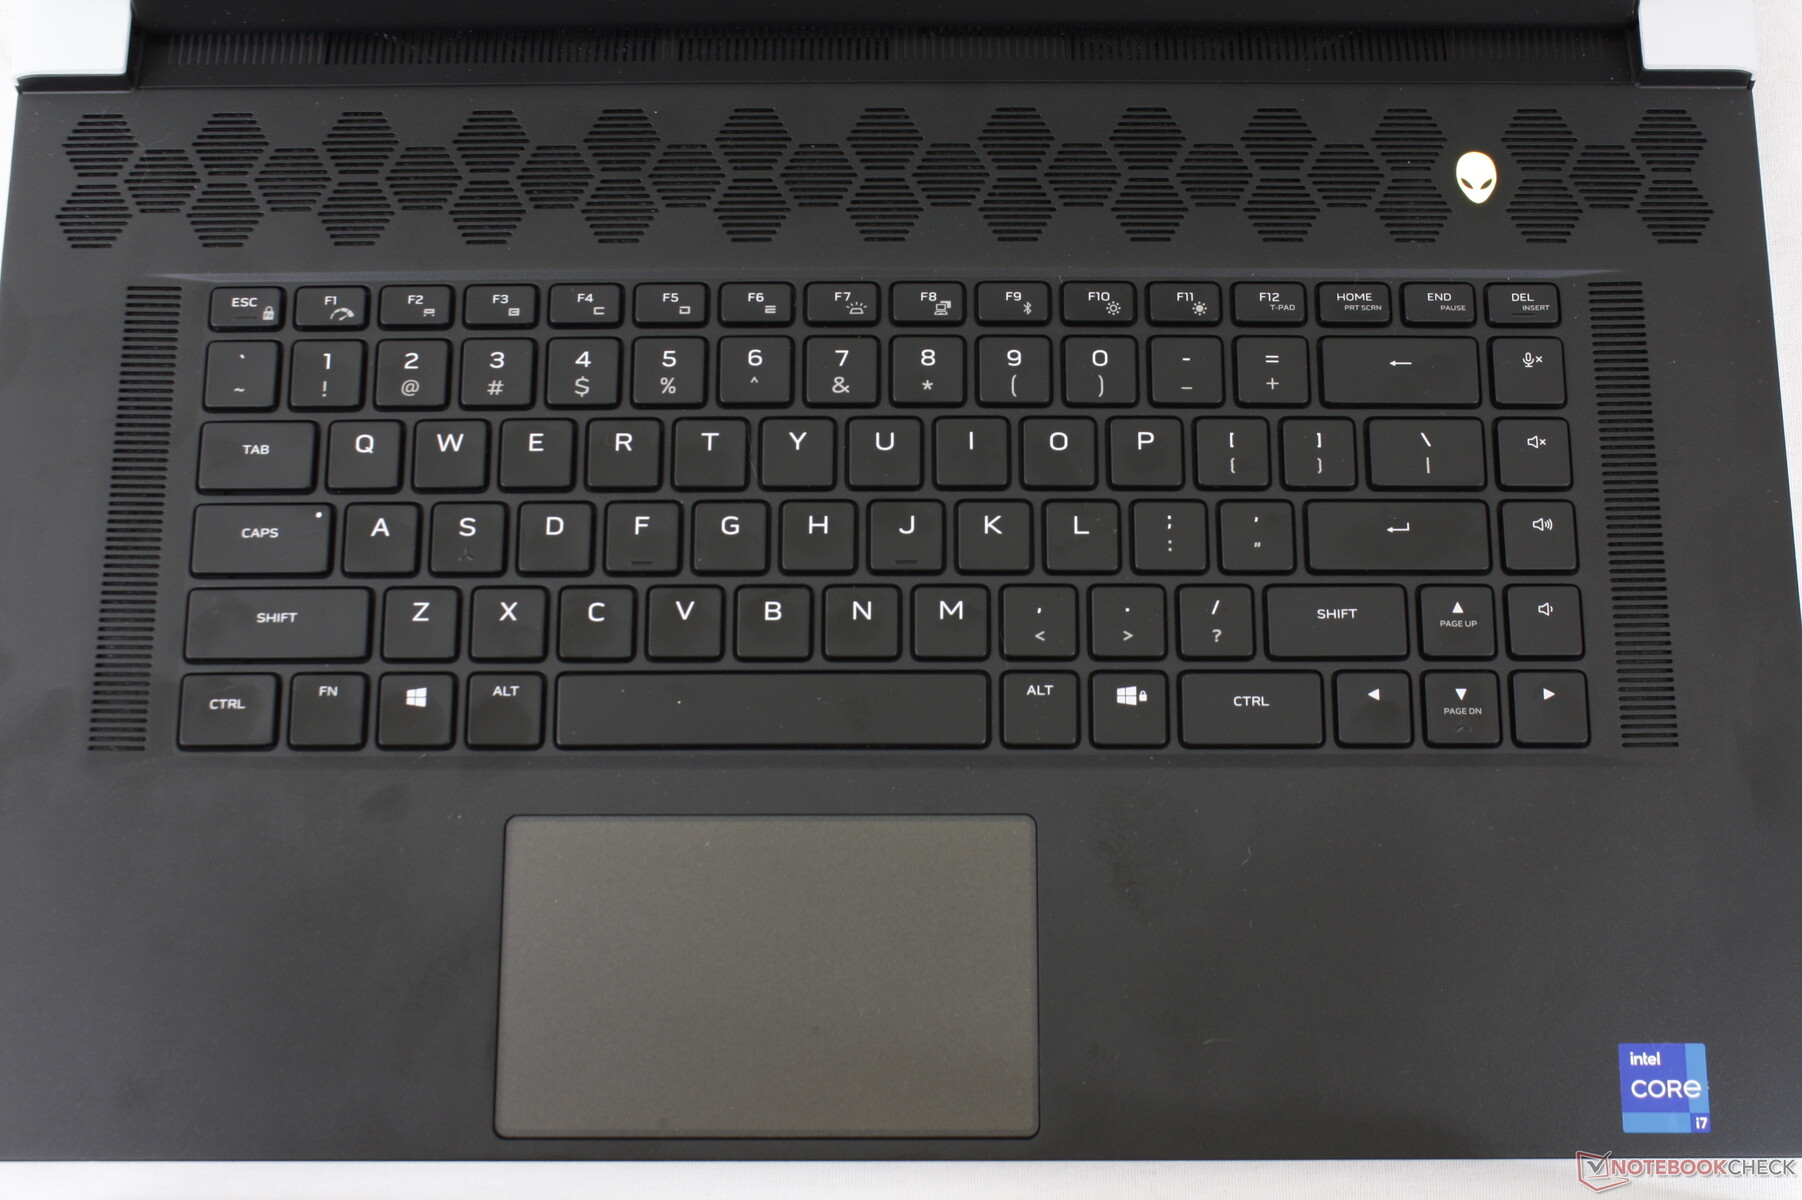
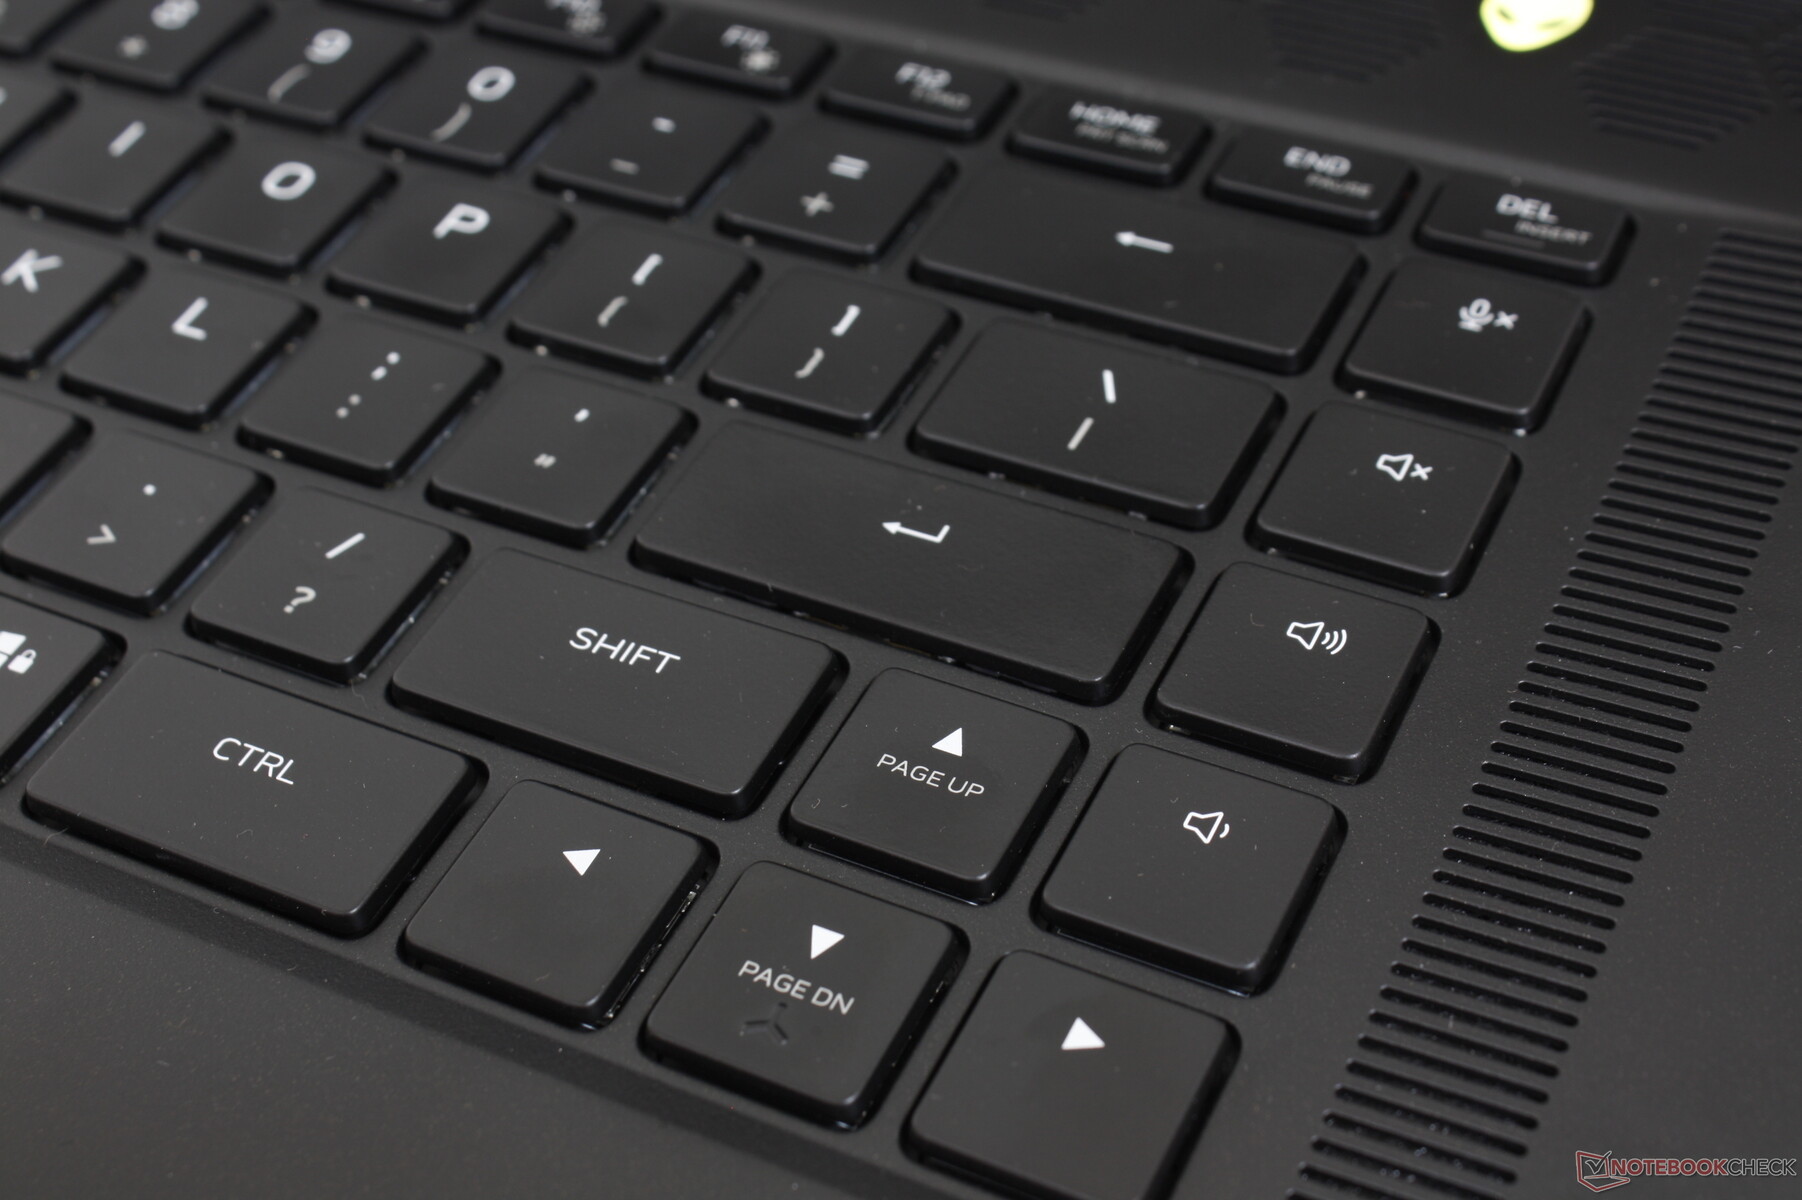
Die ultraflachen mechanischen CherryMX-Taster, die erstmals beim letztjährigen Alienware m17 R4 eingeführt wurden, sind auch beim x17 R1 optional verfügbar. Zunächst waren wir etwas misstrauisch, denn mechanische oder optische Taster waren in der Vergangenheit bei Geräten wie dem MSI GT80 Titan, dem 2019er Blade 15 oder dem Lenovo Legion Y920 oftmals problematisch. Diese neuen CherryMX-Taster haben sich aber schnell zu unseren Favoriten unter den Gaming-Laptops entwickelt. Das Feedback ist gleichmäßig und im Vergleich zu Laptops wie dem Razer Blade 17 oder MSI GS76 bieten die Taster eine präzisere Rückmeldung und mehr Hubweg. Die Tasten mit individuell steuerbarer Beleuchtung funktionieren sowohl beim Schreiben von Texten als auch Gaming sehr gut, allerdings muss man auch das lautere Anschlaggeräusch bedenken. Gerade bei regelmäßiger Nutzung in Räumen mit anderen Leuten sollte man daher lieber die normale Tastatur mit den traditionellen Membran-Tastern wählen.
Unser größter Kritikpunkt an der Tastatur betrifft die sekundären Symbole, die bei den meisten tasten nicht beleuchtet sind. Dinge wie die Helligkeitssteuerung, Druck, Pause usw. sind in dunklen Umgebungen daher praktisch unmöglich zu sehen, wenn man in dunklen Umgebungen arbeitet. Beim Blade 17 sind beispielsweise alle Symbole beleuchtet. Die erste Reihe der Funktionstasten nutzt zudem keine mechanischen Taster.
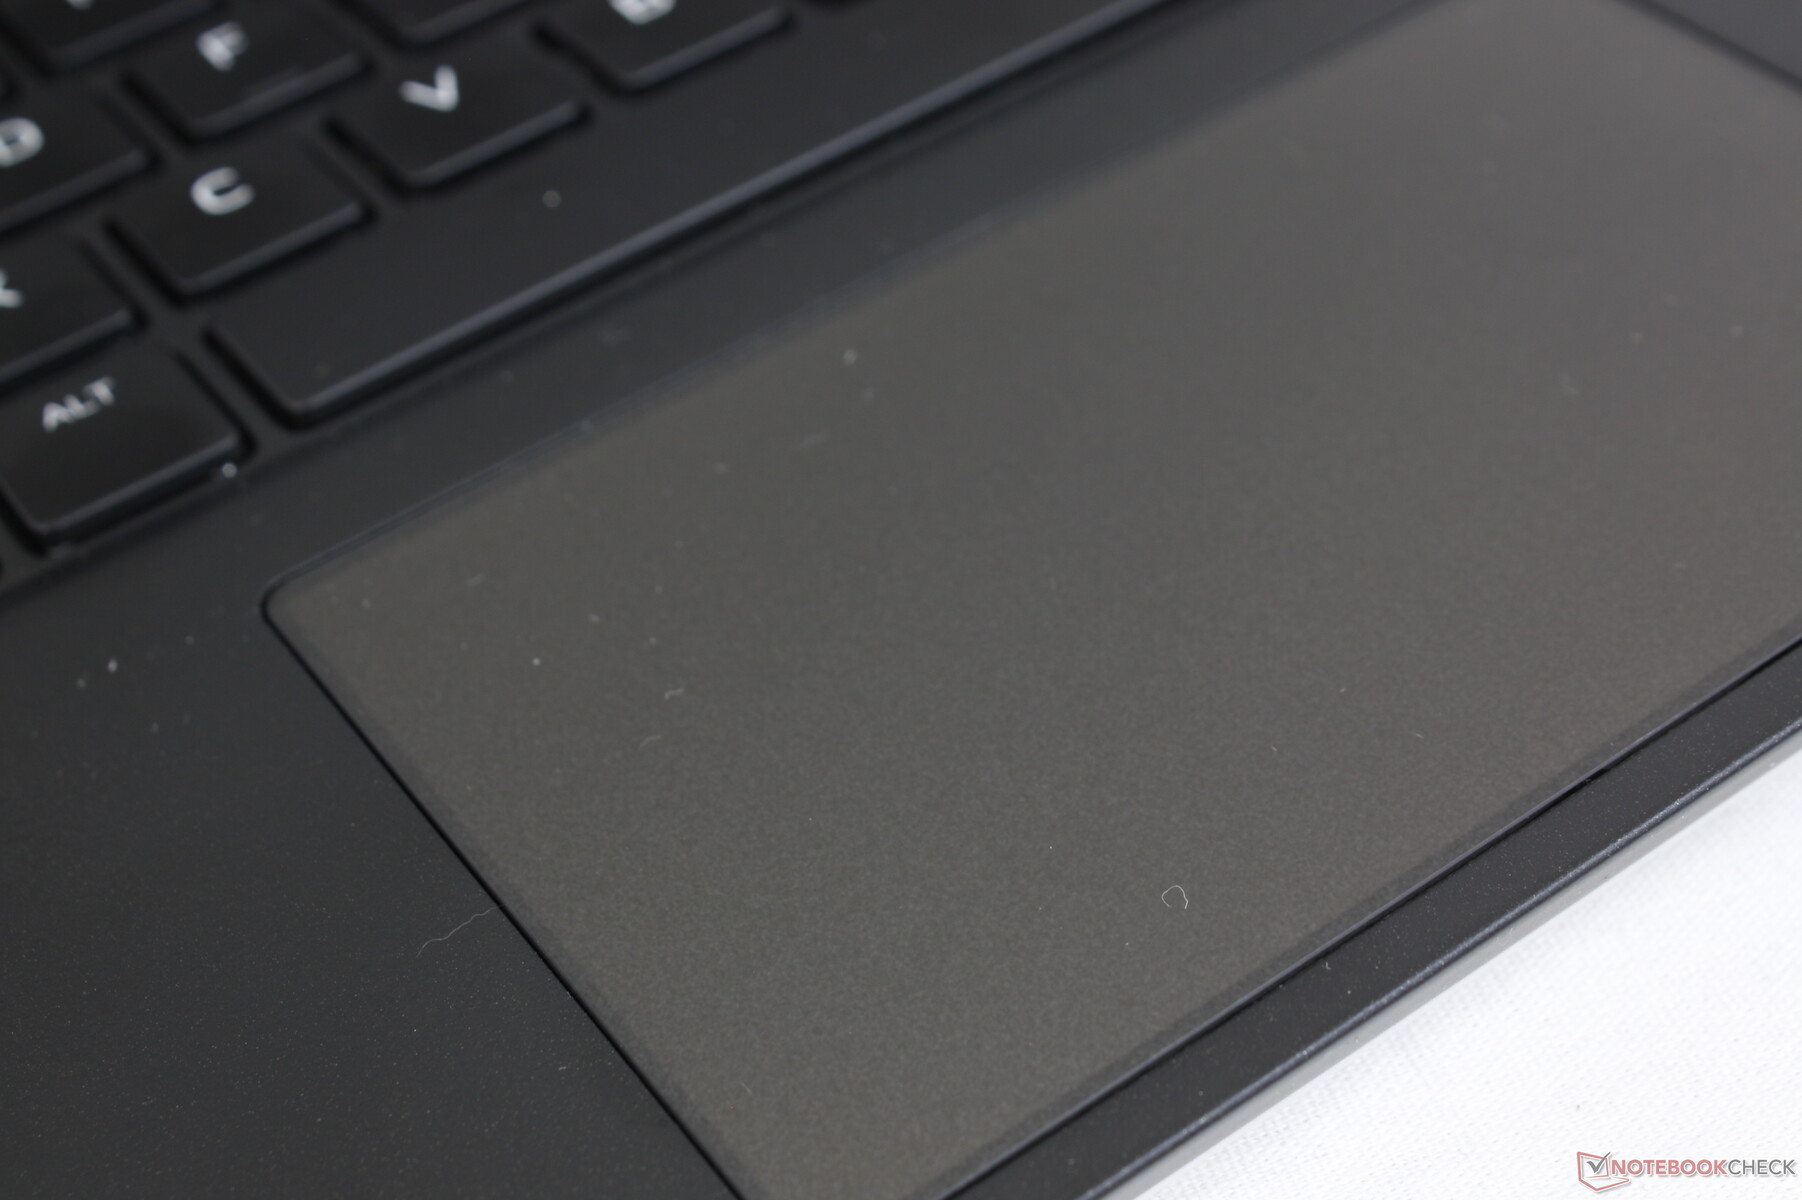
Touchpad
Das Precision-ClickPad ist mit 11,3 x 6,8 cm relativ klein, wenn man es mit anderen Geräten wie dem MSI GS75 vergleicht (14 x 6,5 cm). Die glatte Oberfläche bietet aber ordentliche Gleiteigenschaften, lediglich bei langsamen Bewegungen bleibt man schon mal etwas hängen. Der Hub ist sehr seicht und die Rückmeldung eher weich. Eine größere Fläche hätte bei Multi-Touch-Gesten geholfen, aber zumindest ist das ClickPad nicht so schwammig wie bei den Blade-Laptops von Razer.
Dell bietet bei einigen Modellen ein beleuchtete ClickPad, was man schon von älteren Alienware-Modellen kennt. Beim kleineren Alienware x15 R1 ist dieses Feature hingegen nicht verfügbar.

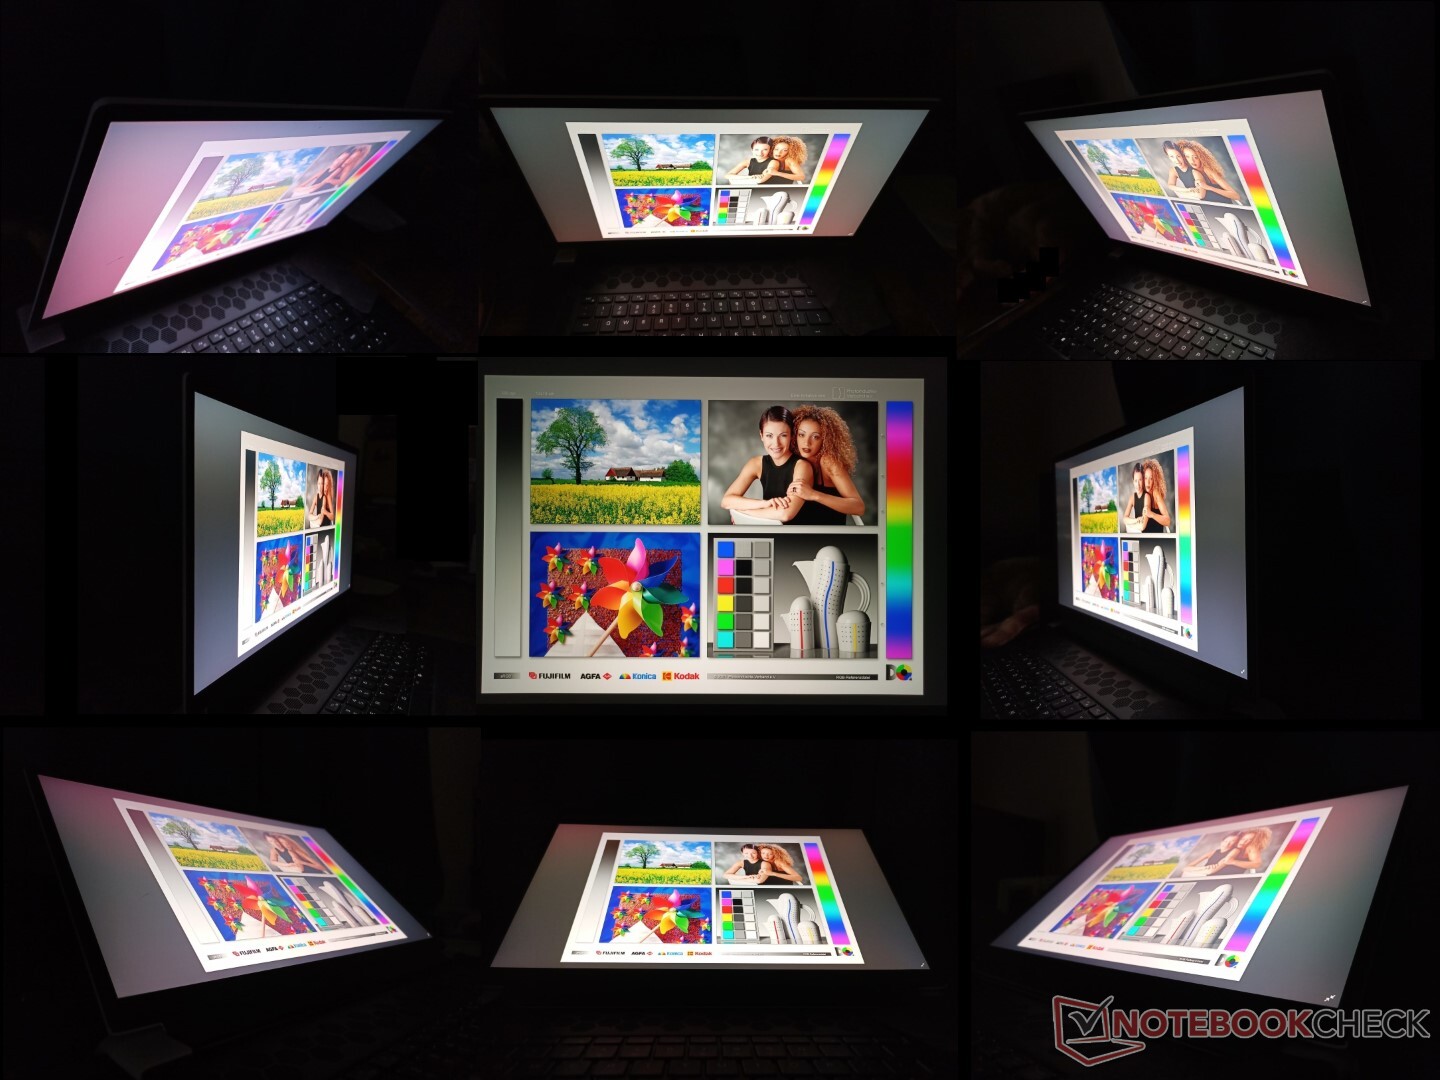
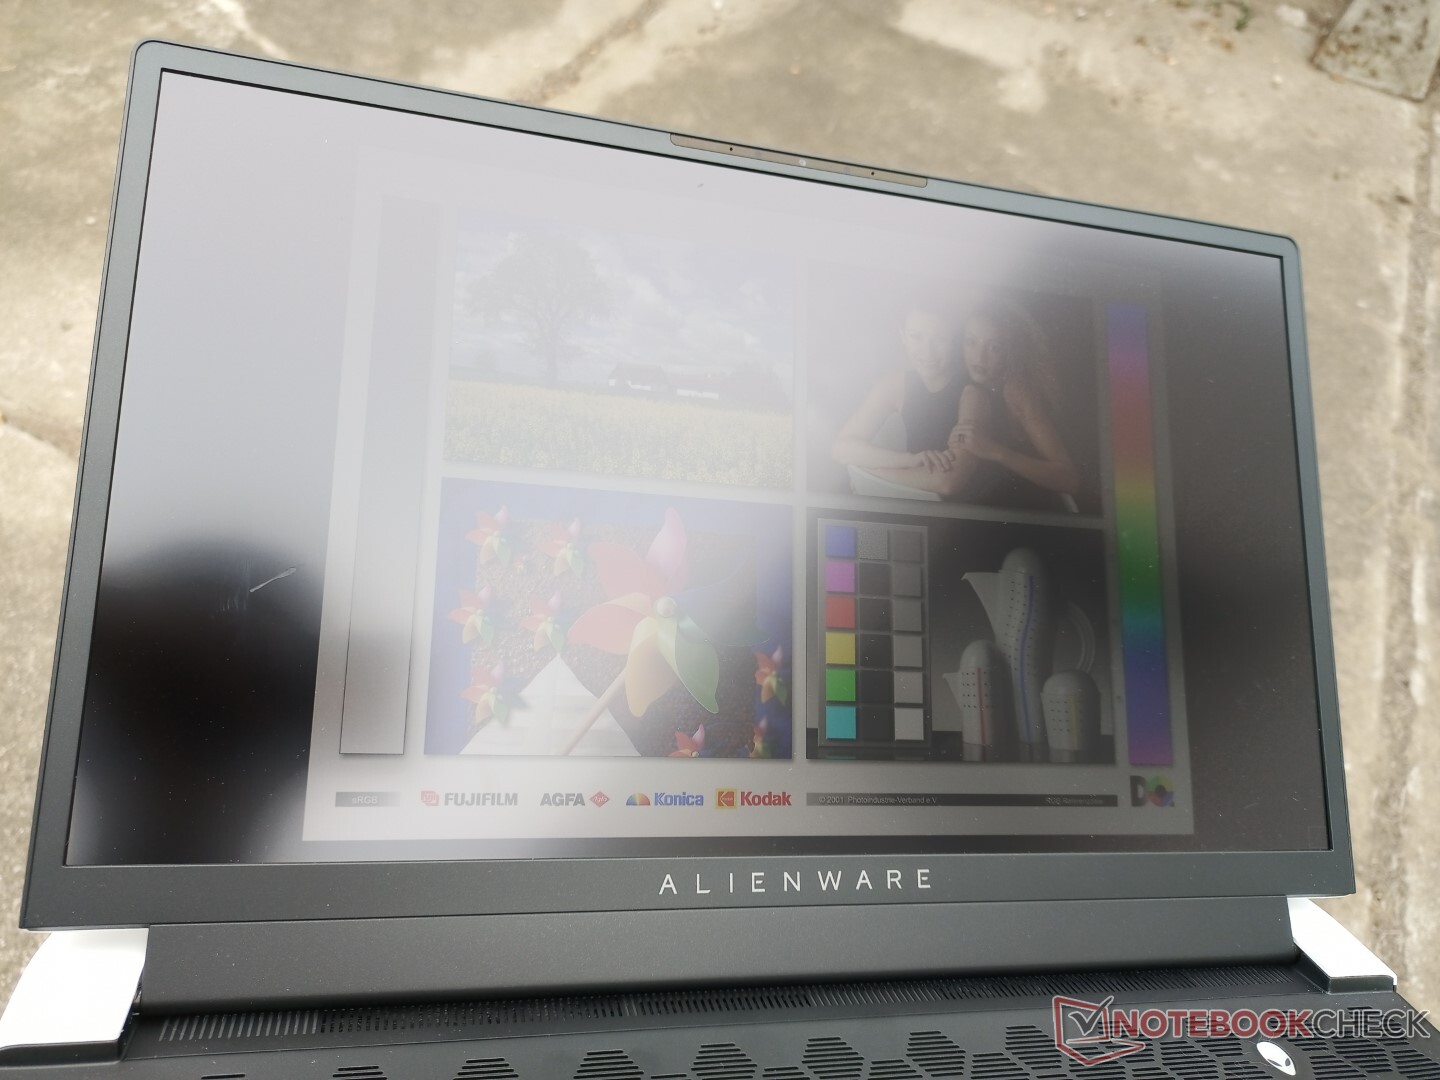
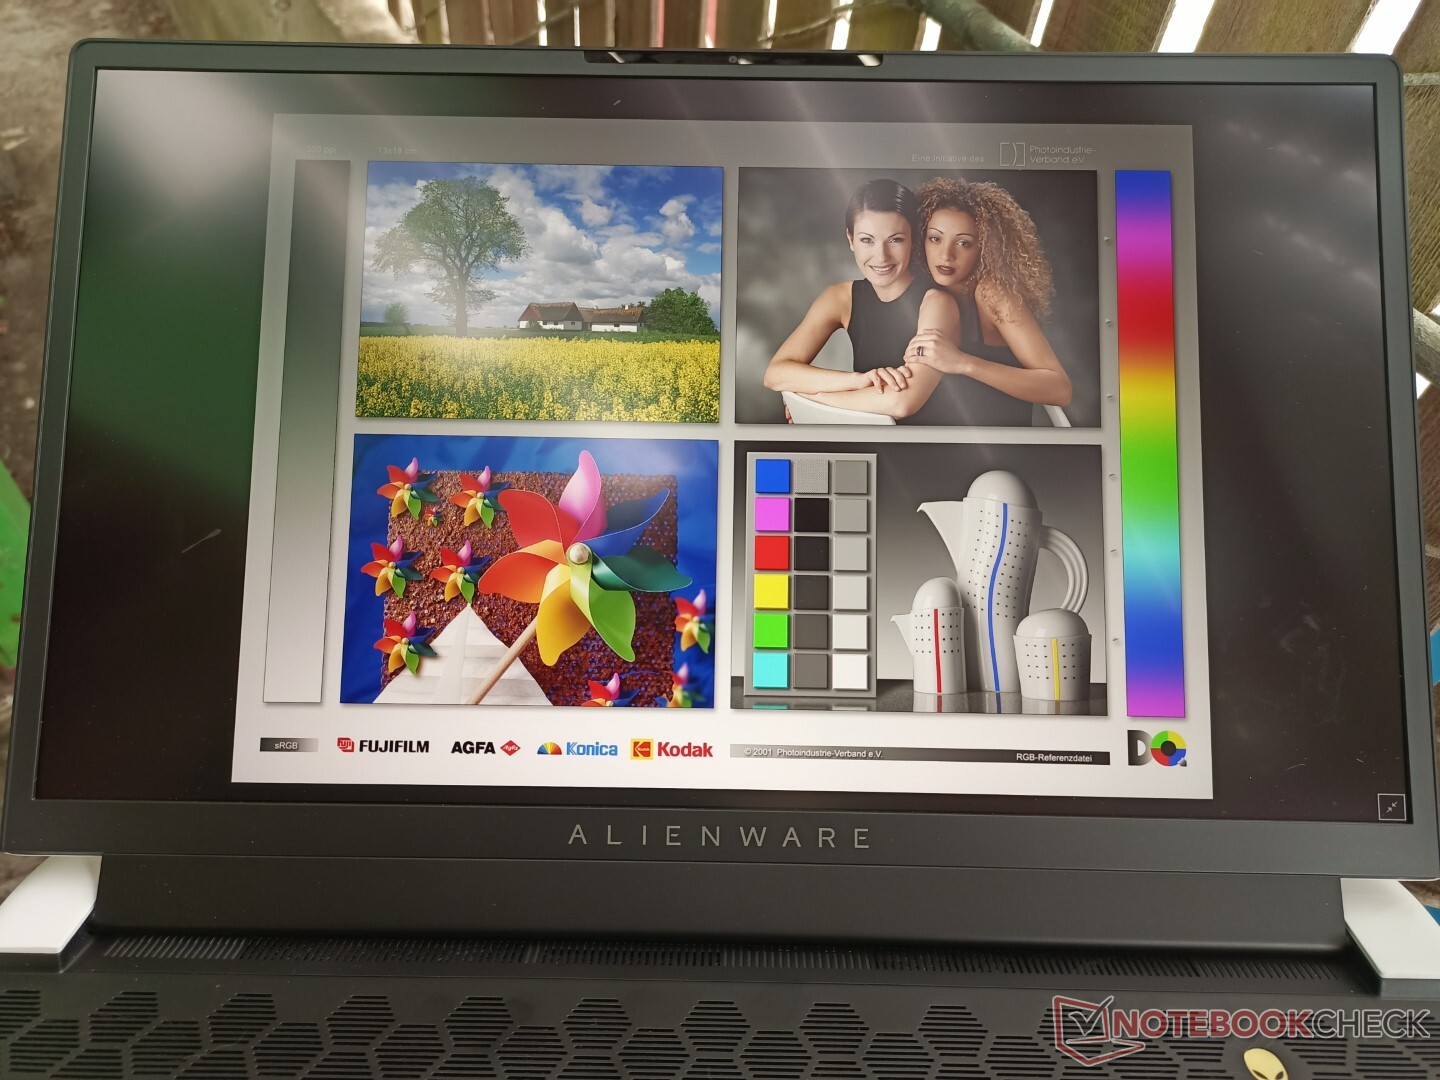
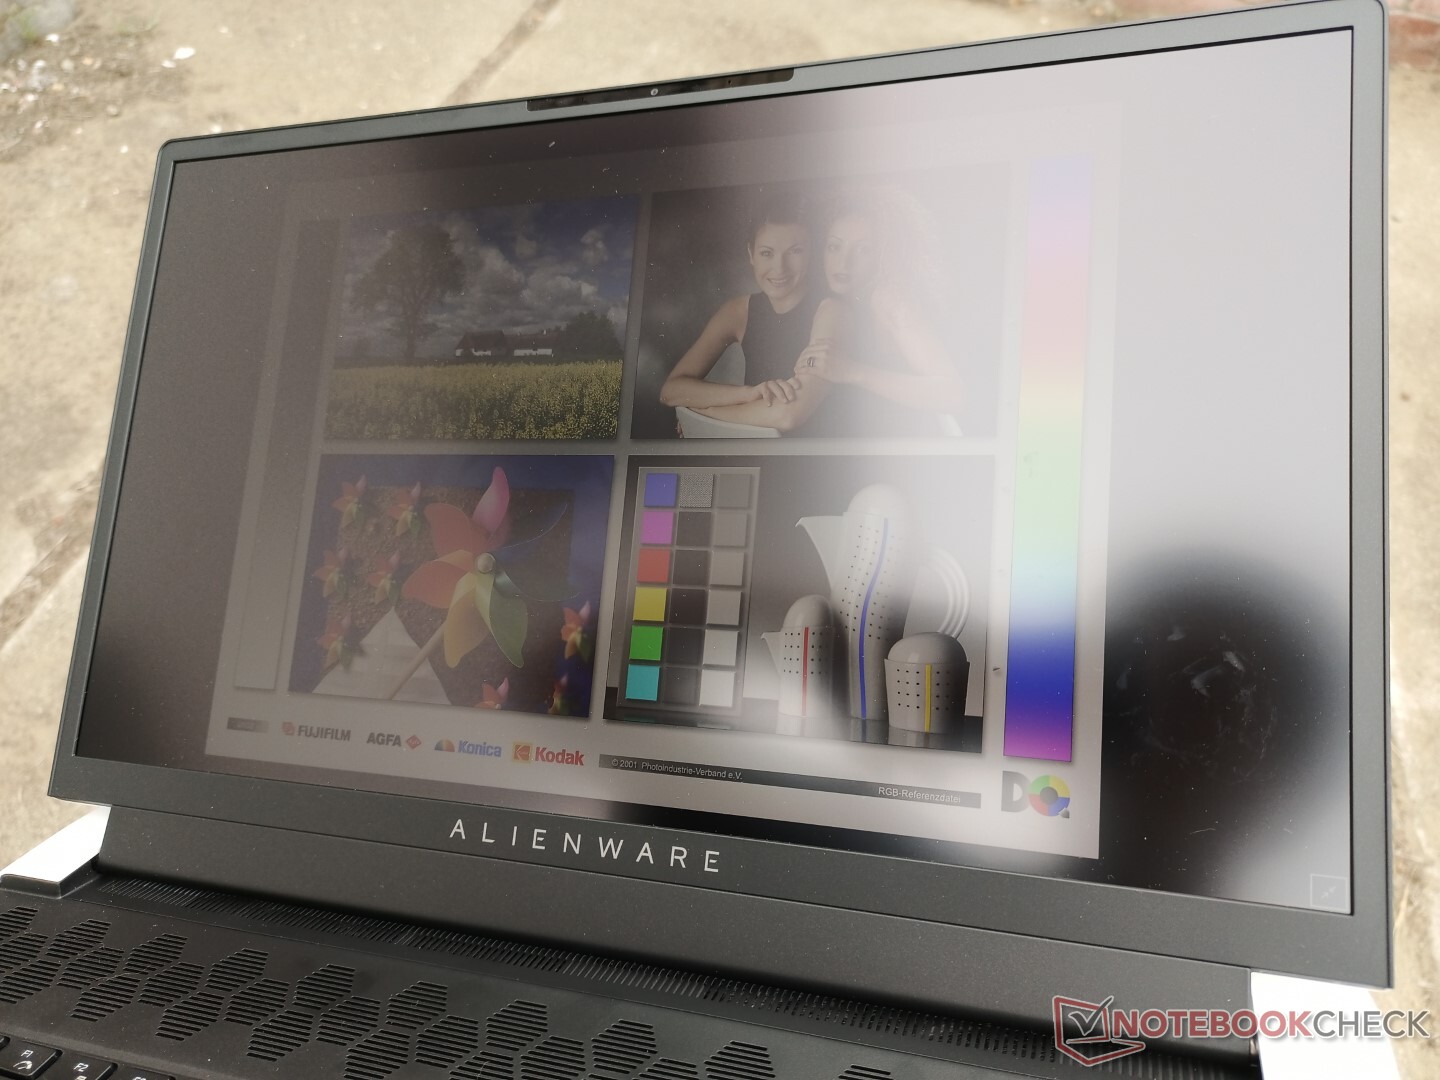
Display — 4K, 120 Hz, 100% AdobeRGB, 5 ms
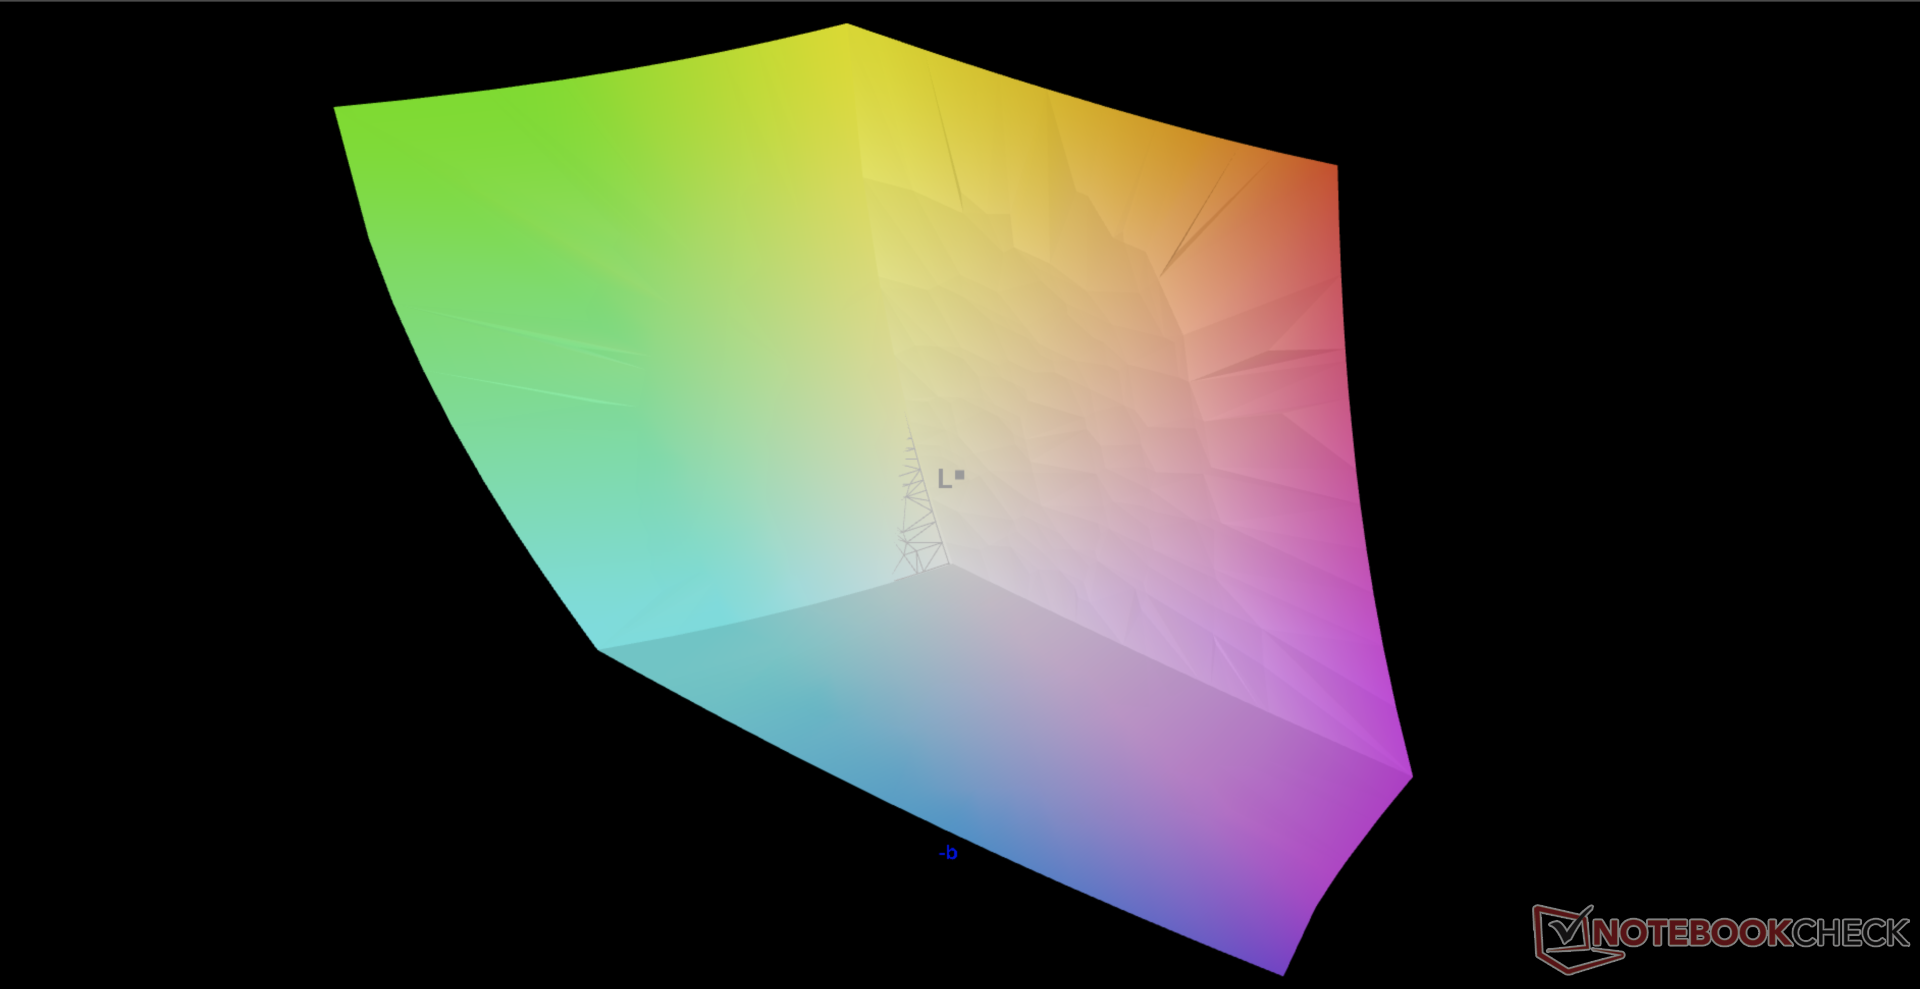
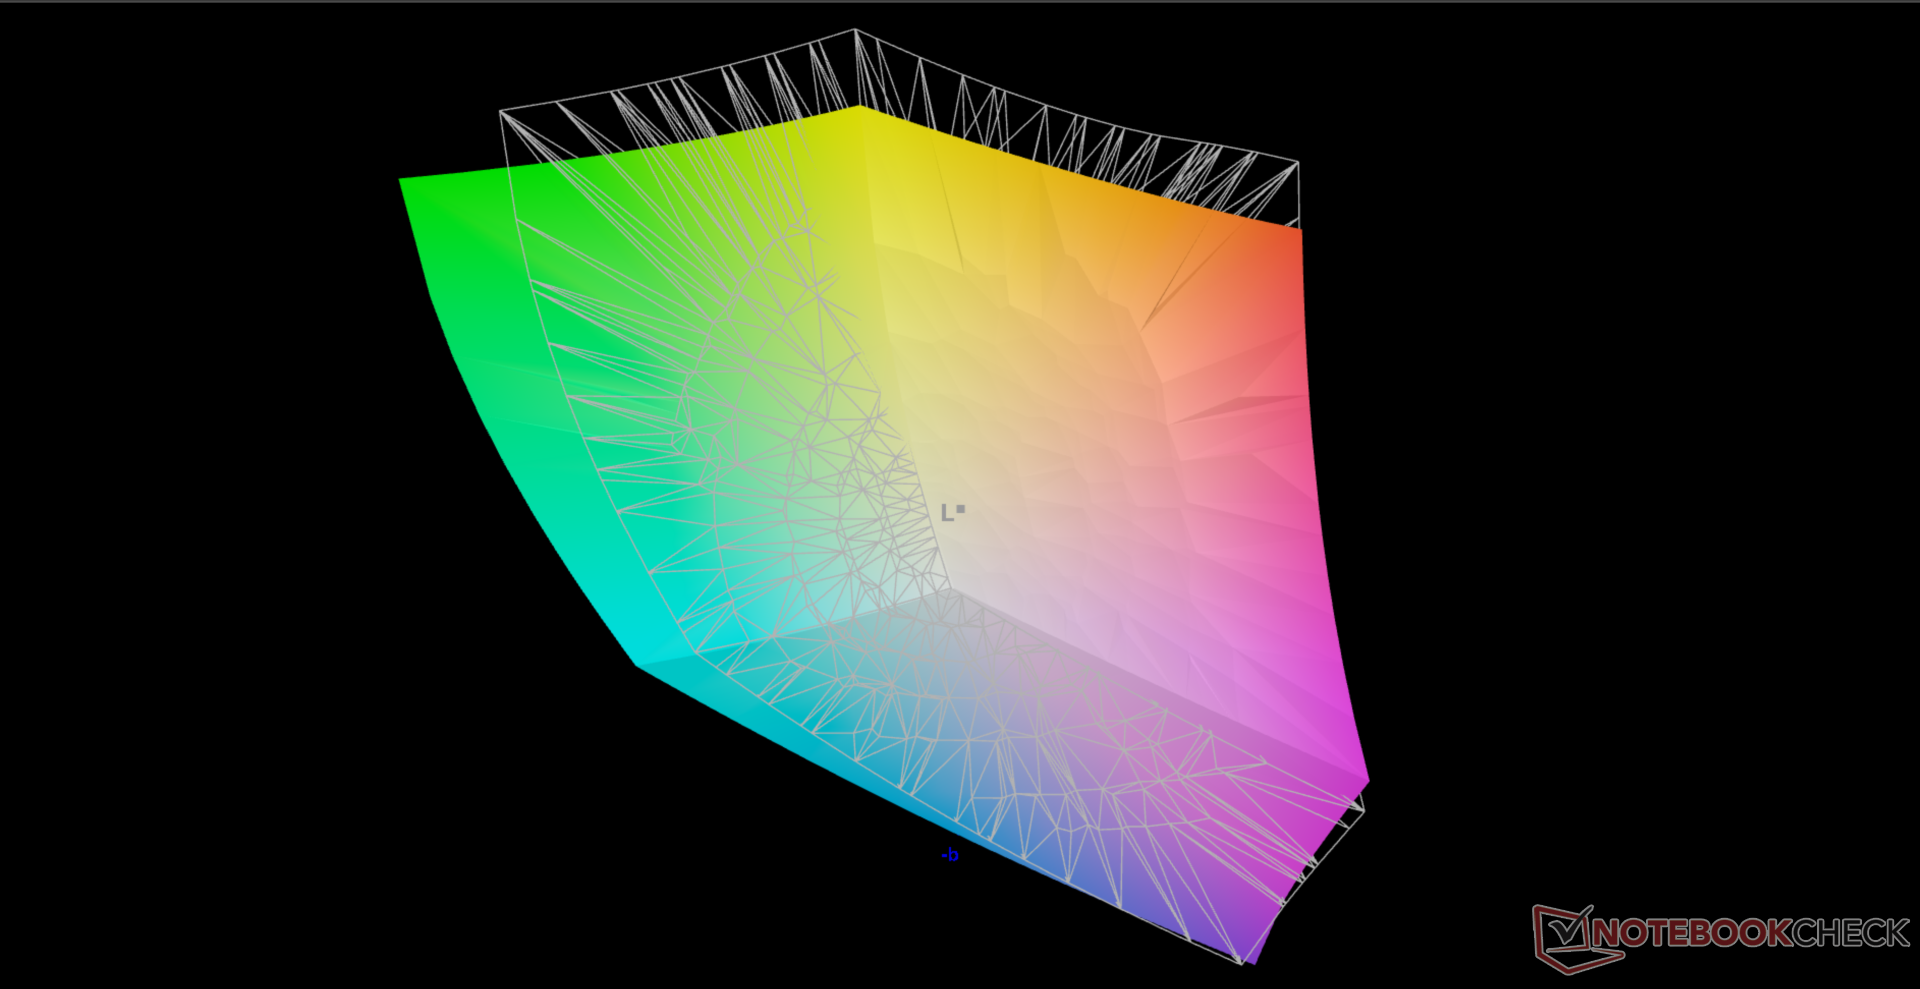
Das Panel von AU Optronics (B173ZAN) kommt auch in anderen Geräten wie dem Schenker XMG Ultra 17 zum Einsatz, doch bei unserem Alienware-Testgerät liegt die native Bildwiederholfrequenz bei 120 Hz anstatt den üblichen 60 Hz. Zudem sind die Reaktionszeiten sehr schnell und auch die maximale Helligkeit ist deutlich höher als bei vielen anderen Gaming-Notebooks. Das MSI GS76 verwendet ein ähnliches 4K-Panel mit noch schnelleren Reaktionszeiten als bei unserem Alienware, dafür ist die Farbraumabdeckung aber geringer. Damit kann das Panel unseres Testgerätes in praktisch allen Disziplinen überzeugen, was sehr selten ist.
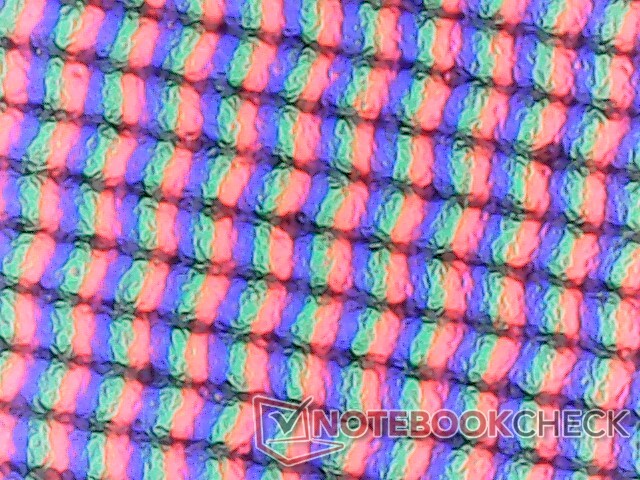
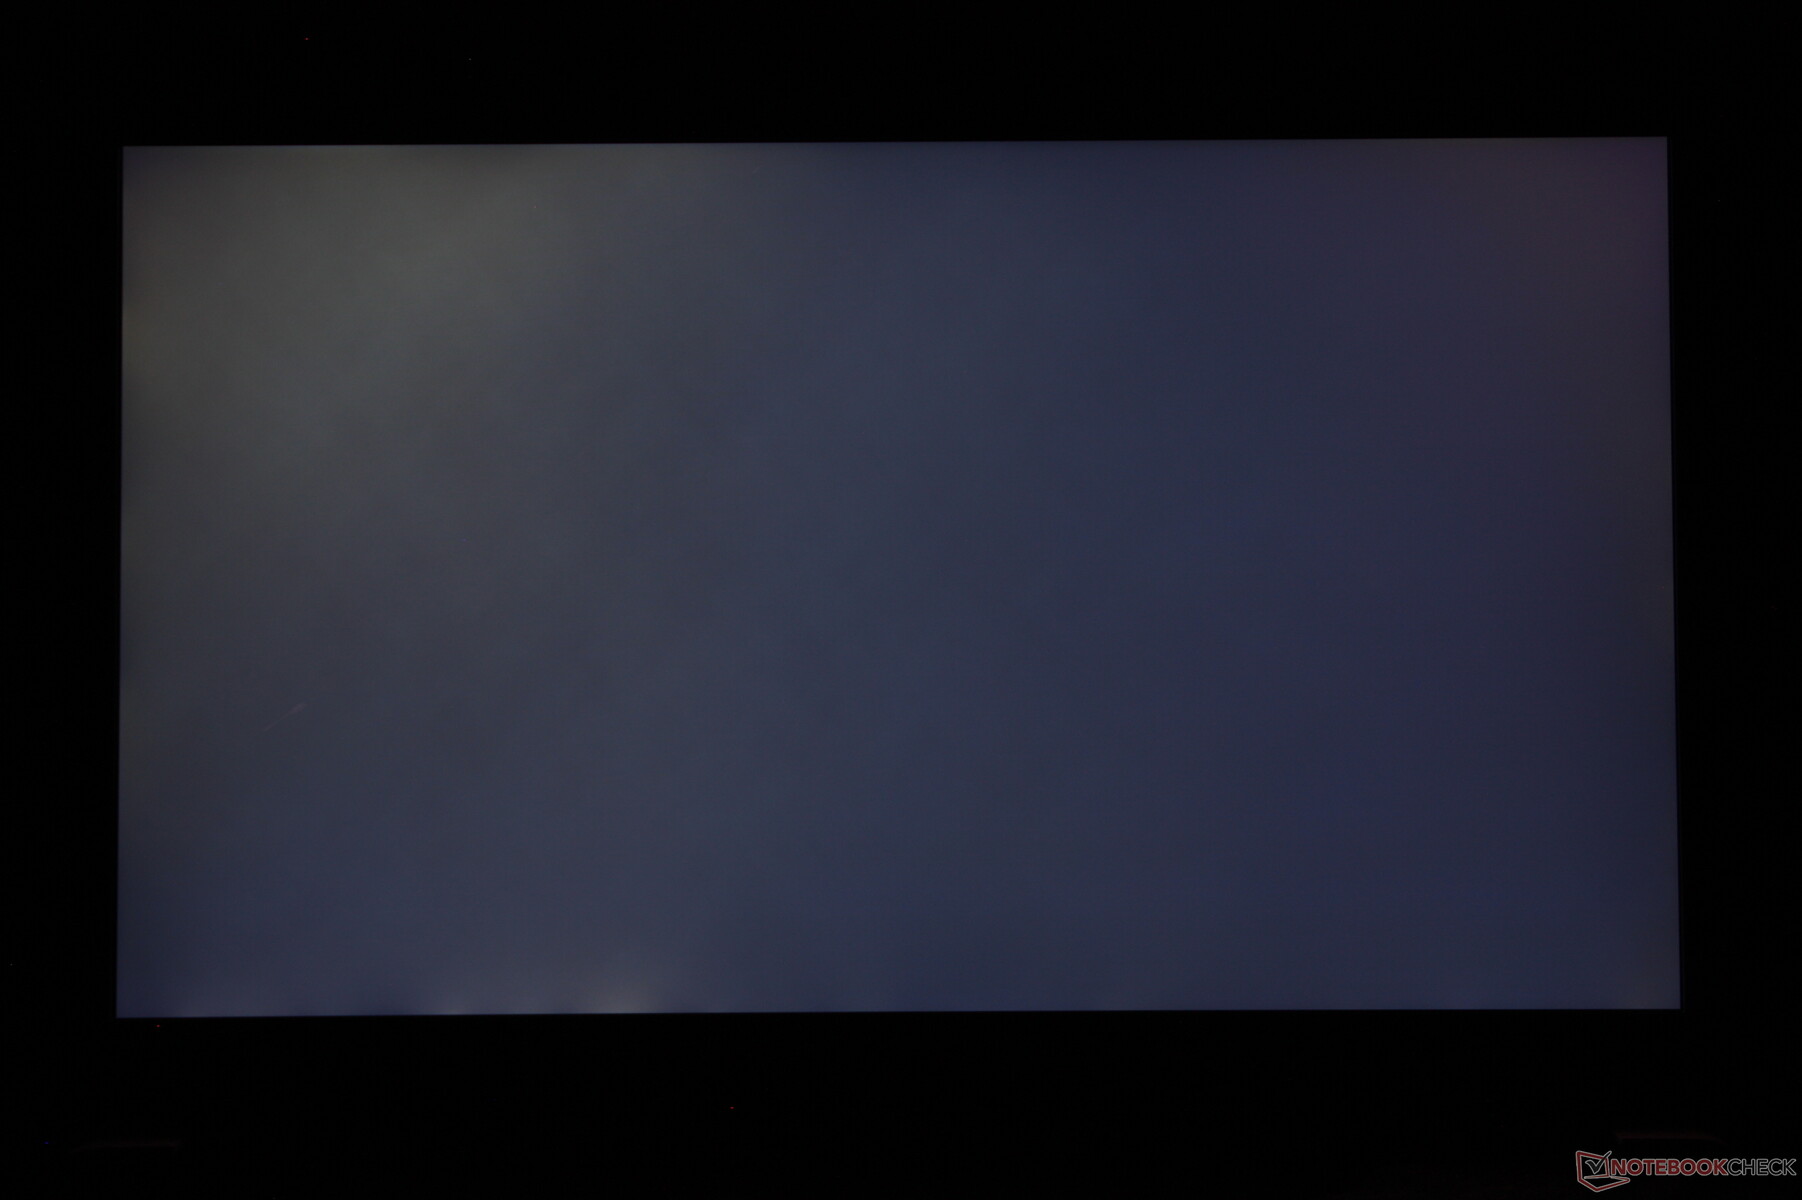
Die matte Oberfläche ist minimal körniger als bei spiegelnden Panels und auch Screen-Bleeding ist bei unserem Modell vorhanden. Die nachfolgenden Messungen gelten ausschließlich fpr das 4K-120-Hz-Panel und nicht die anderen Display-Optionen, die für das Alienware x17 R1 verfügbar sind.
Nvidias Advanced-Optimus-Technologie wird nur in Verbindung mit dem 360-Hz-1080p-Bildschirm unterstützt. Die anderen Modelle inklusive unserem Testgerät unterstützen Optimus 1.0 mit einer manuellen Diskreten-GPU-Option im BIOS.
| |||||||||||||||||||||||||
Ausleuchtung: 91 %
Helligkeit Akku: 438.7 cd/m²
Kontrast: 914:1 (Schwarzwert: 0.48 cd/m²)
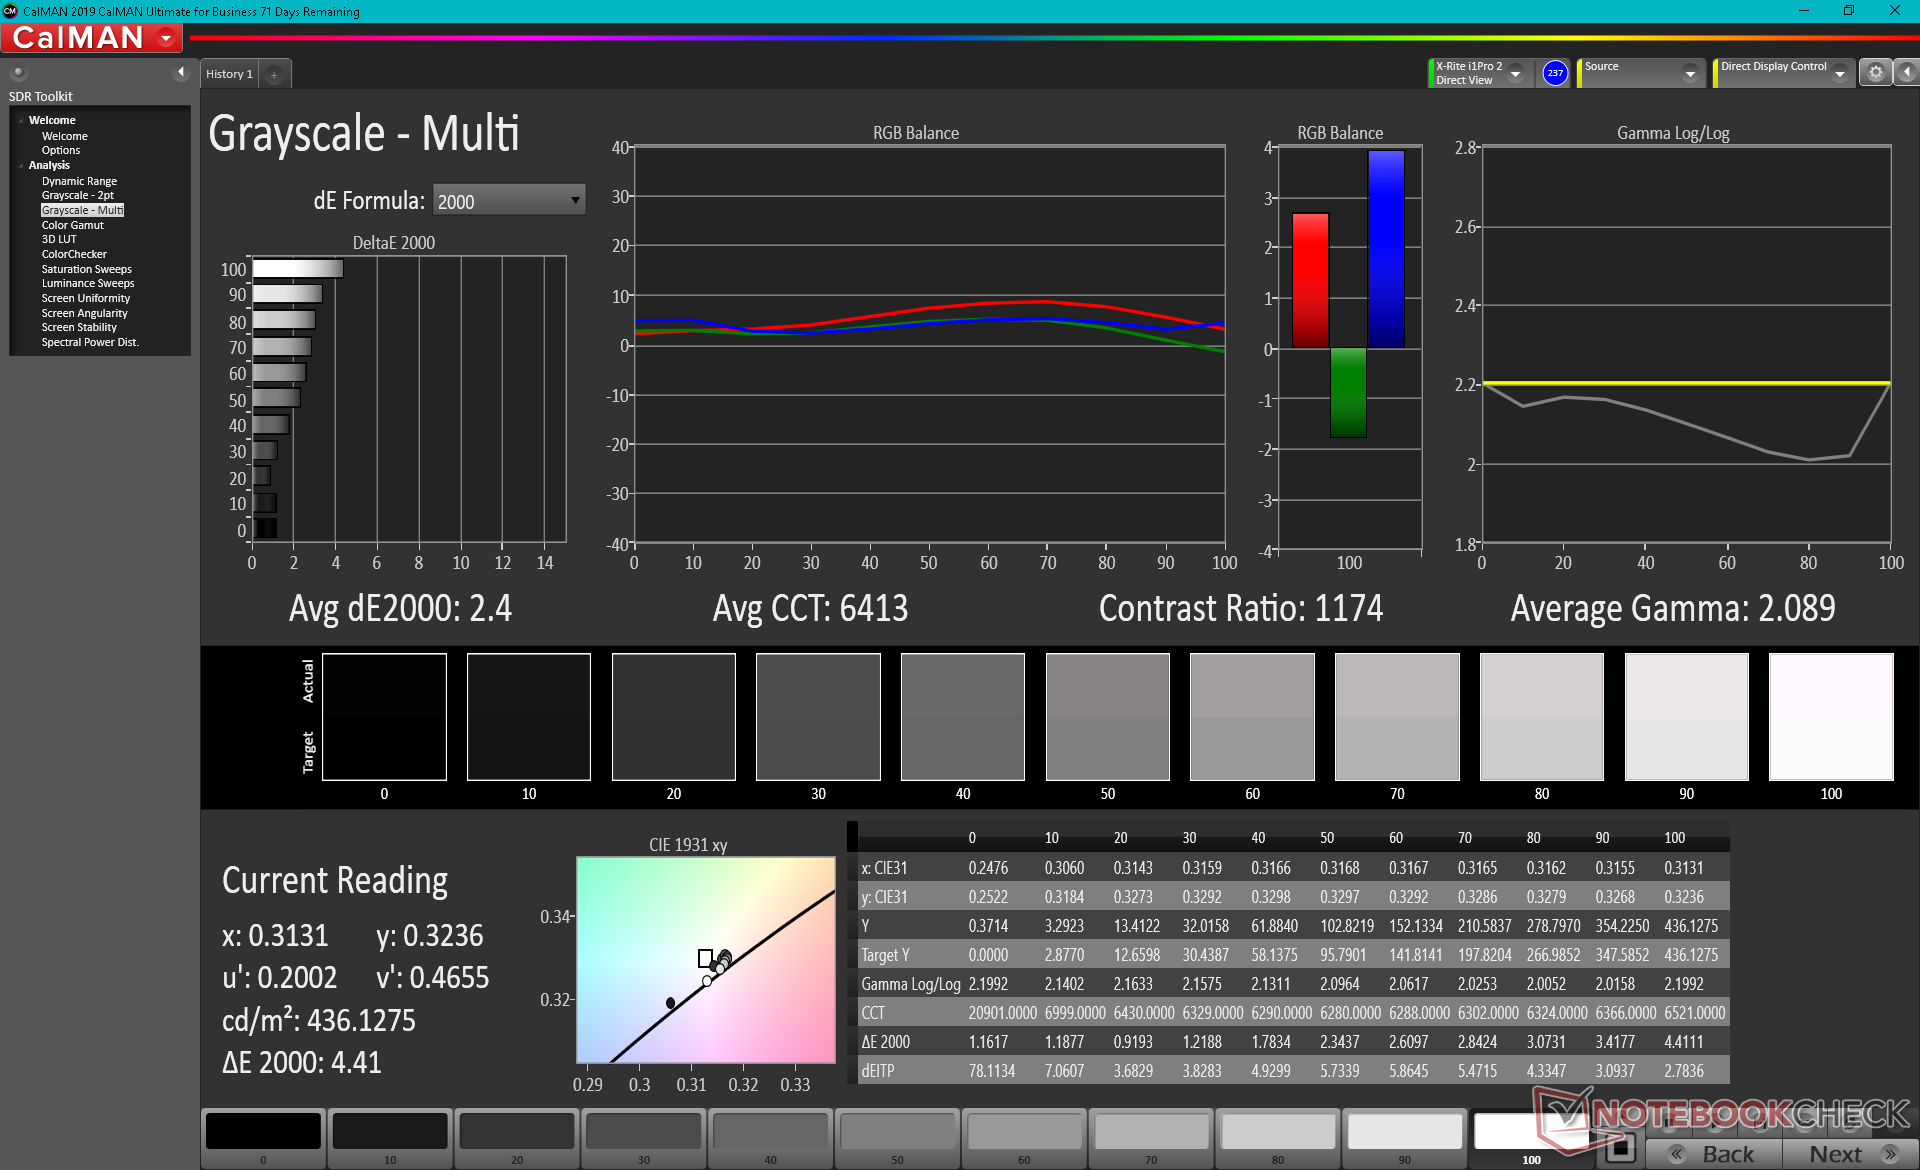
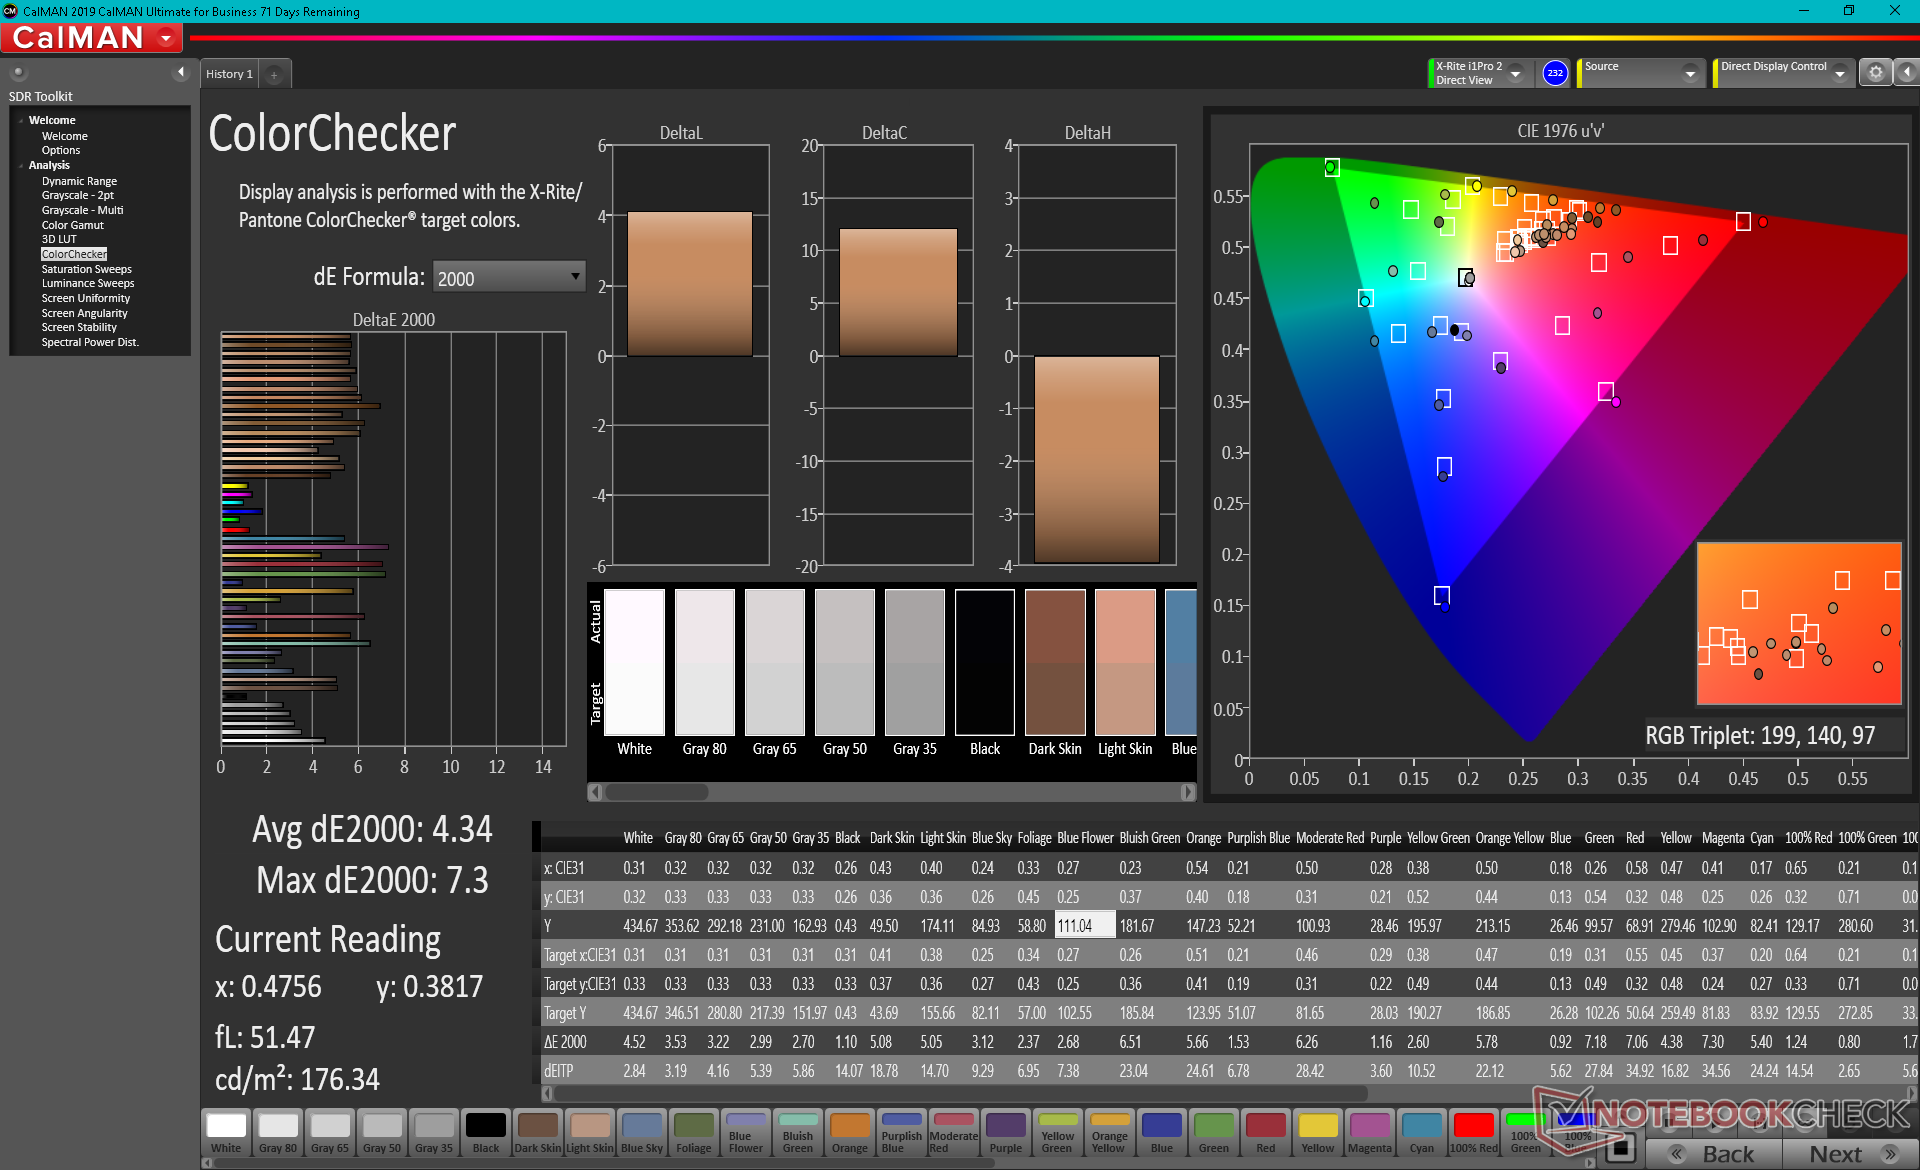
ΔE ColorChecker Calman: 4.34 | ∀{0.5-29.43 Ø4.72}
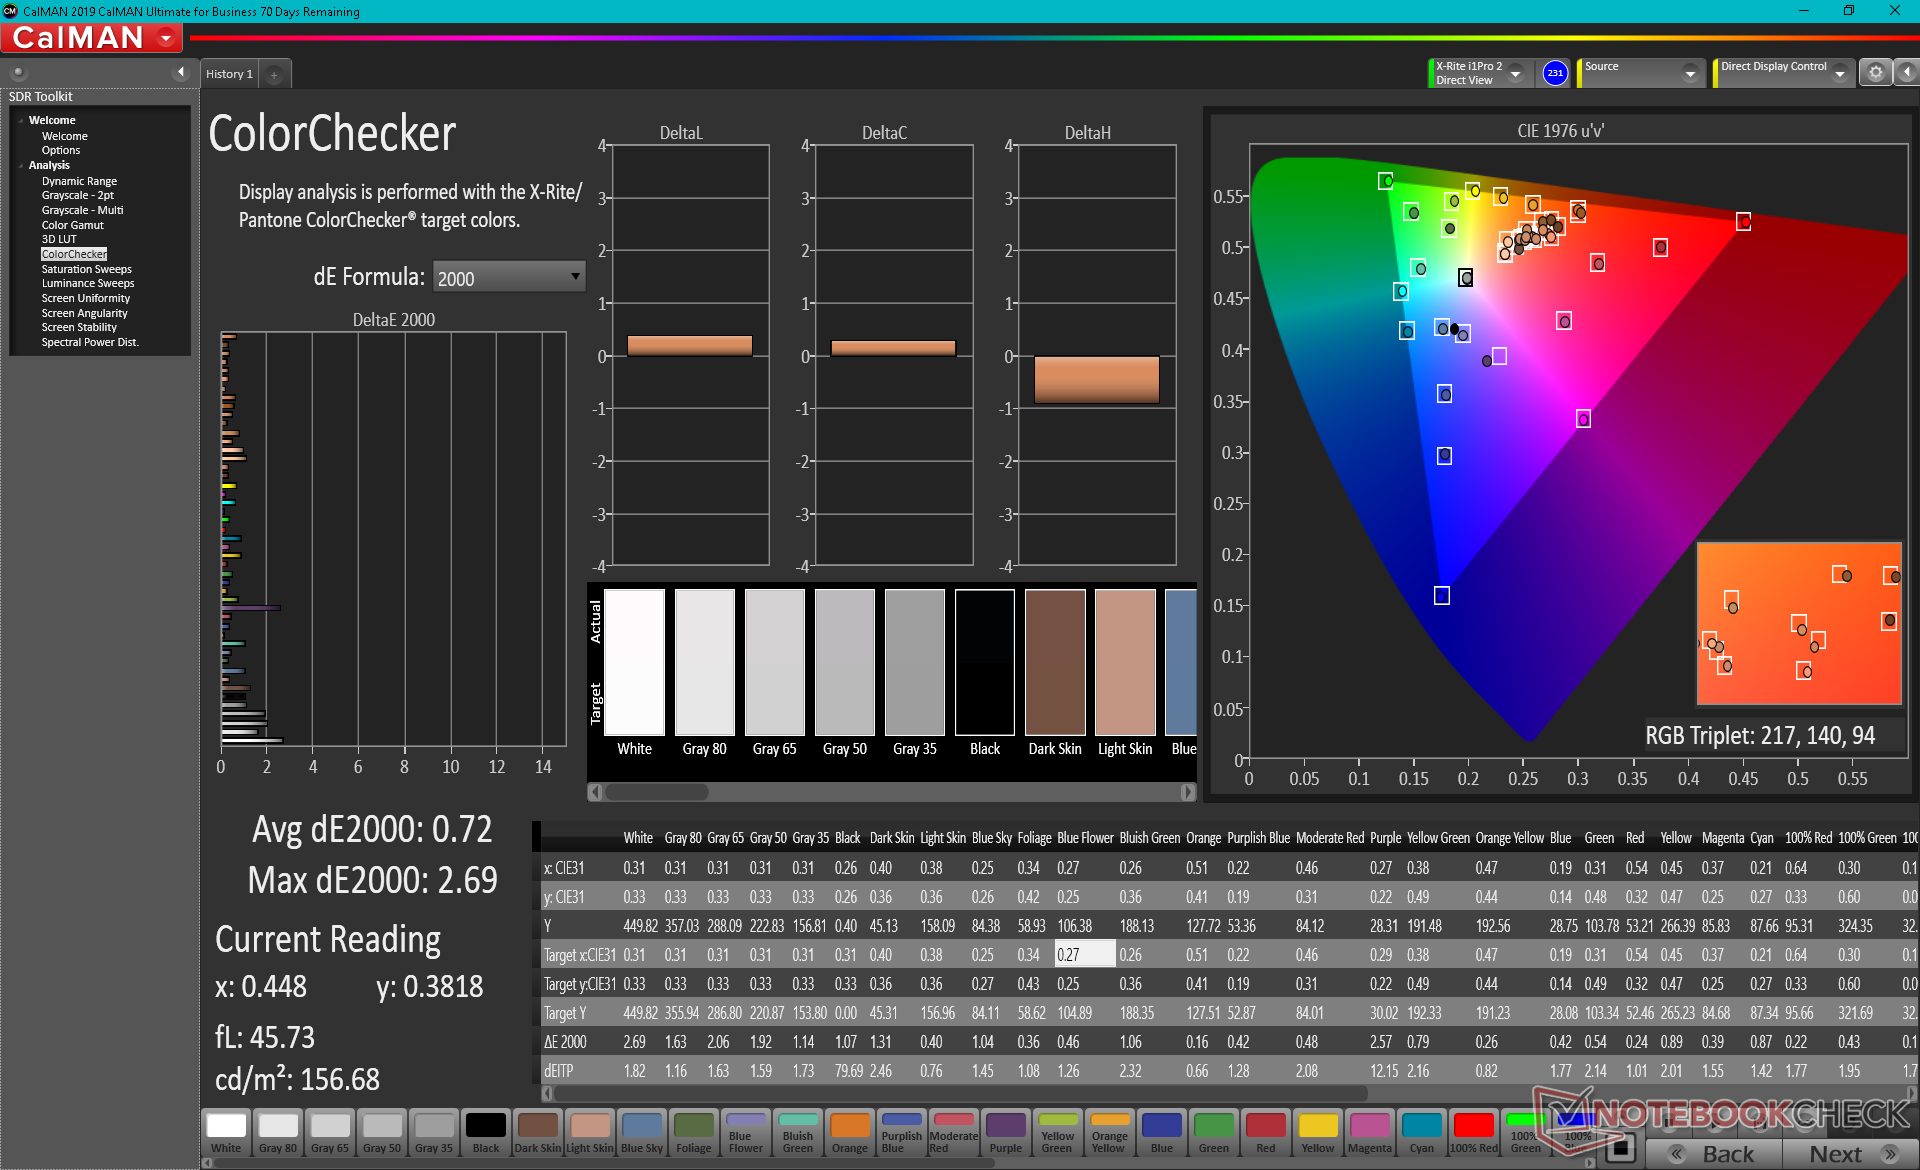
calibrated: 0.72
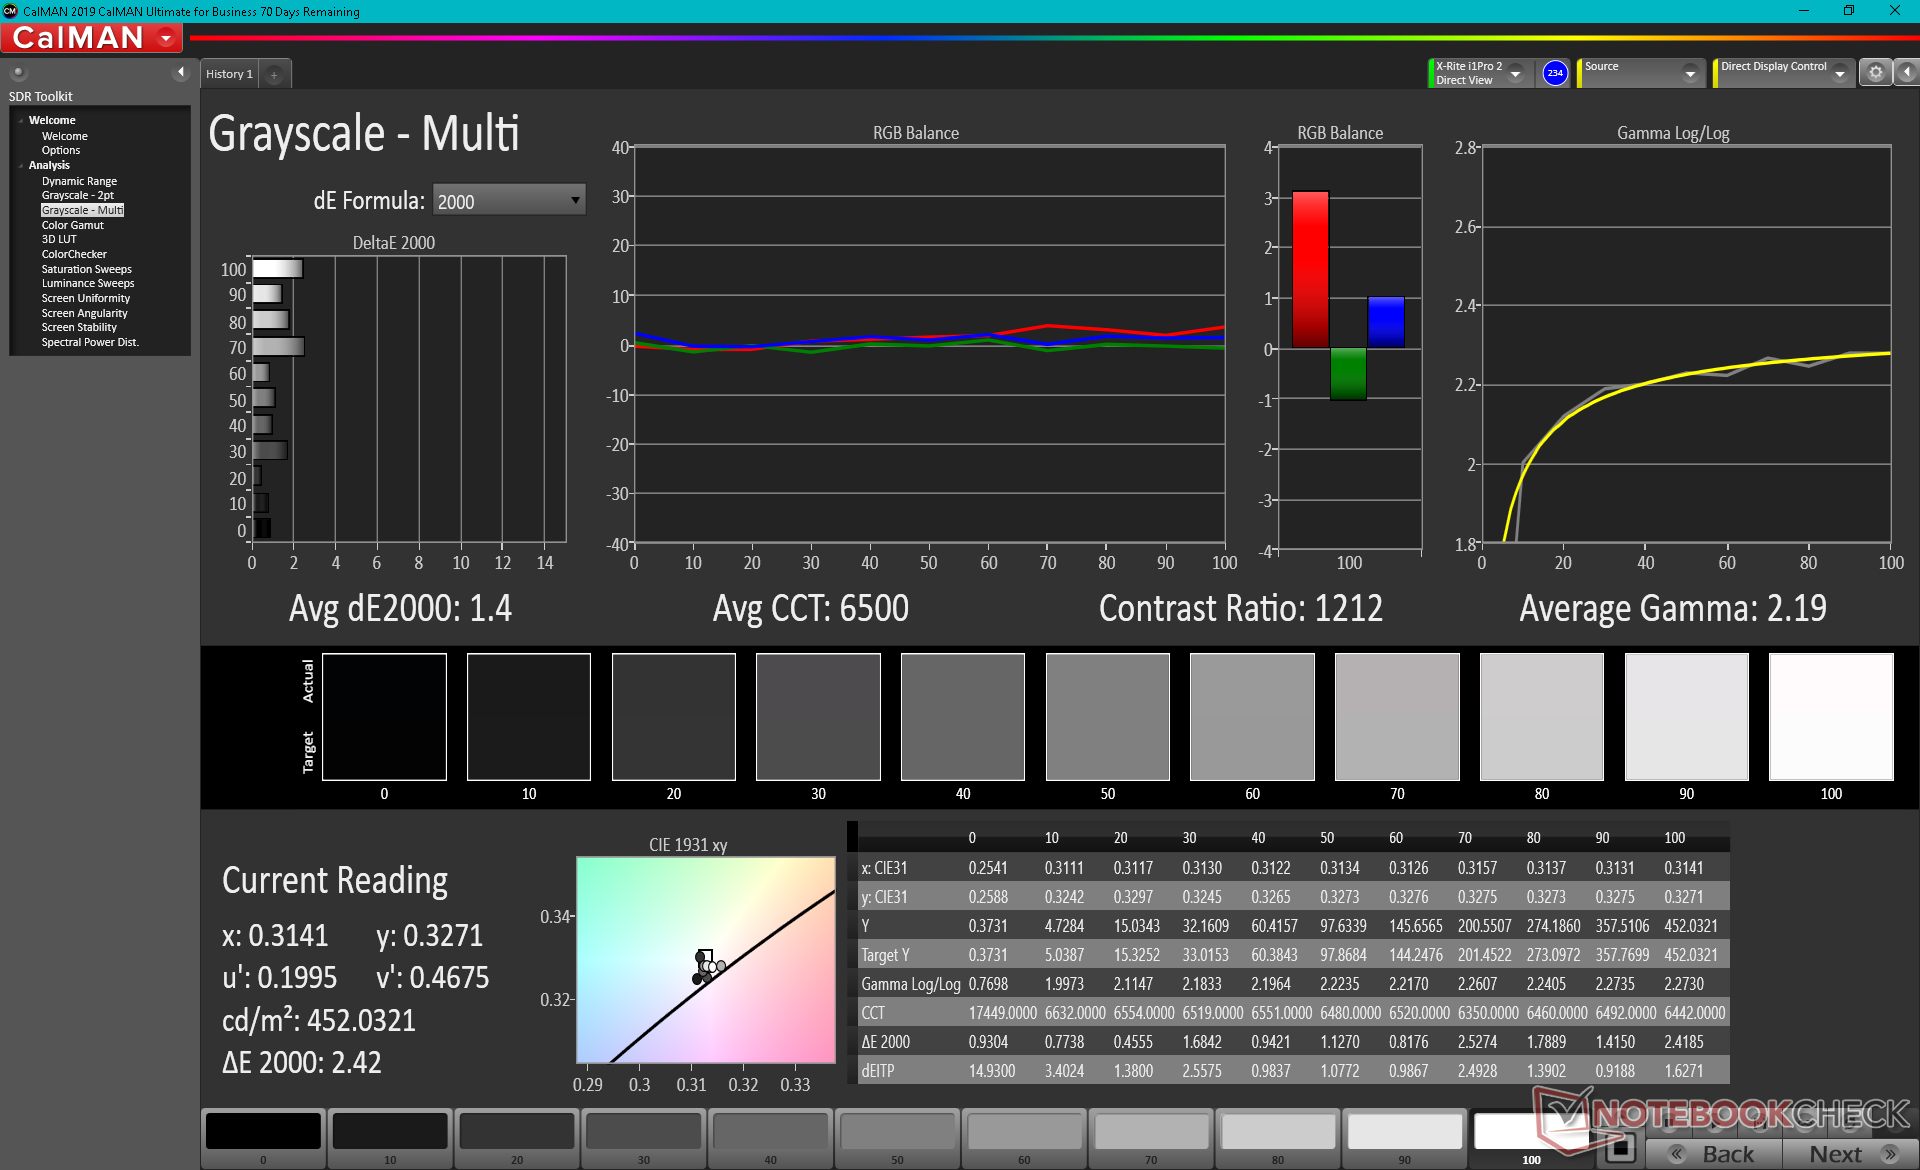
ΔE Greyscale Calman: 2.4 | ∀{0.09-98 Ø4.97}
100% AdobeRGB 1998 (Argyll 3D)
100% sRGB (Argyll 3D)
88.3% Display P3 (Argyll 3D)
Gamma: 2.09
CCT: 6413 K
| Alienware x17 RTX 3080 P48E AU Optronics B173ZAN, IPS, 17.3", 3840x2160 | Alienware m17 R4 AU Optronics AUOEC91, IPS, 17.3", 1920x1080 | Razer Blade 17 RTX 3070 AU Optronics B173HAN05.4, IPS, 17.3", 1920x1080 | Asus ROG Zephyrus S17 GX703HSD BOE099D (BOE CQ NE173QHM-NY3), IPS, 17.3", 2560x1440 | MSI GS76 Stealth 11UH AUO B173ZAN06.1 (AUODE95), IPS, 17.3", 3840x2160 | Gigabyte Aero 17 HDR YD AU Optronics AUO329B, IPS, 17.3", 3840x2160 | |
|---|---|---|---|---|---|---|
| Display | -16% | -15% | -3% | -23% | -1% | |
| Display P3 Coverage (%) | 88.3 | 69.8 -21% | 71.7 -19% | 94.2 7% | 63 -29% | 86.9 -2% |
| sRGB Coverage (%) | 100 | 99.7 0% | 98.8 -1% | 98.7 -1% | 94.8 -5% | 100 0% |
| AdobeRGB 1998 Coverage (%) | 100 | 71.6 -28% | 73.6 -26% | 84.4 -16% | 65 -35% | 99.6 0% |
| Response Times | 10% | 43% | 45% | 39% | -206% | |
| Response Time Grey 50% / Grey 80% * (ms) | 14.4 ? | 13.2 ? 8% | 4.2 ? 71% | 4.8 67% | 8.8 ? 39% | 52 ? -261% |
| Response Time Black / White * (ms) | 10.4 ? | 9.2 ? 12% | 8.8 ? 15% | 8 23% | 6.4 ? 38% | 26 ? -150% |
| PWM Frequency (Hz) | ||||||
| Bildschirm | 21% | -44% | -19% | 9% | 30% | |
| Helligkeit Bildmitte (cd/m²) | 438.7 | 305 -30% | 323.3 -26% | 322 -27% | 474 8% | 488 11% |
| Brightness (cd/m²) | 435 | 301 -31% | 315 -28% | 288 -34% | 454 4% | 467 7% |
| Brightness Distribution (%) | 91 | 93 2% | 91 0% | 72 -21% | 88 -3% | 86 -5% |
| Schwarzwert * (cd/m²) | 0.48 | 0.19 60% | 0.33 31% | 0.3 37% | 0.46 4% | 0.33 31% |
| Kontrast (:1) | 914 | 1605 76% | 980 7% | 1073 17% | 1030 13% | 1479 62% |
| Delta E Colorchecker * | 4.34 | 1.31 70% | 4.59 -6% | 3.05 30% | 1.5 65% | 1.23 72% |
| Colorchecker dE 2000 max. * | 7.3 | 2.32 68% | 10.82 -48% | 5.23 28% | 5.59 23% | 2.94 60% |
| Colorchecker dE 2000 calibrated * | 0.72 | 0.91 -26% | 1.4 -94% | 1.92 -167% | 0.86 -19% | 0.77 -7% |
| Delta E Graustufen * | 2.4 | 2.3 4% | 7.9 -229% | 3.11 -30% | 2.8 -17% | 1.5 37% |
| Gamma | 2.09 105% | 2.281 96% | 2.28 96% | 2.13 103% | 2.158 102% | 2.169 101% |
| CCT | 6413 101% | 6449 101% | 5941 109% | 6553 99% | 6597 99% | 6614 98% |
| Farbraum (Prozent von AdobeRGB 1998) (%) | 72 | 84 | 99 | |||
| Color Space (Percent of sRGB) (%) | 94 | 99 | 99 | |||
| Durchschnitt gesamt (Programm / Settings) | 5% /
12% | -5% /
-25% | 8% /
-6% | 8% /
6% | -59% /
-10% |
* ... kleinere Werte sind besser
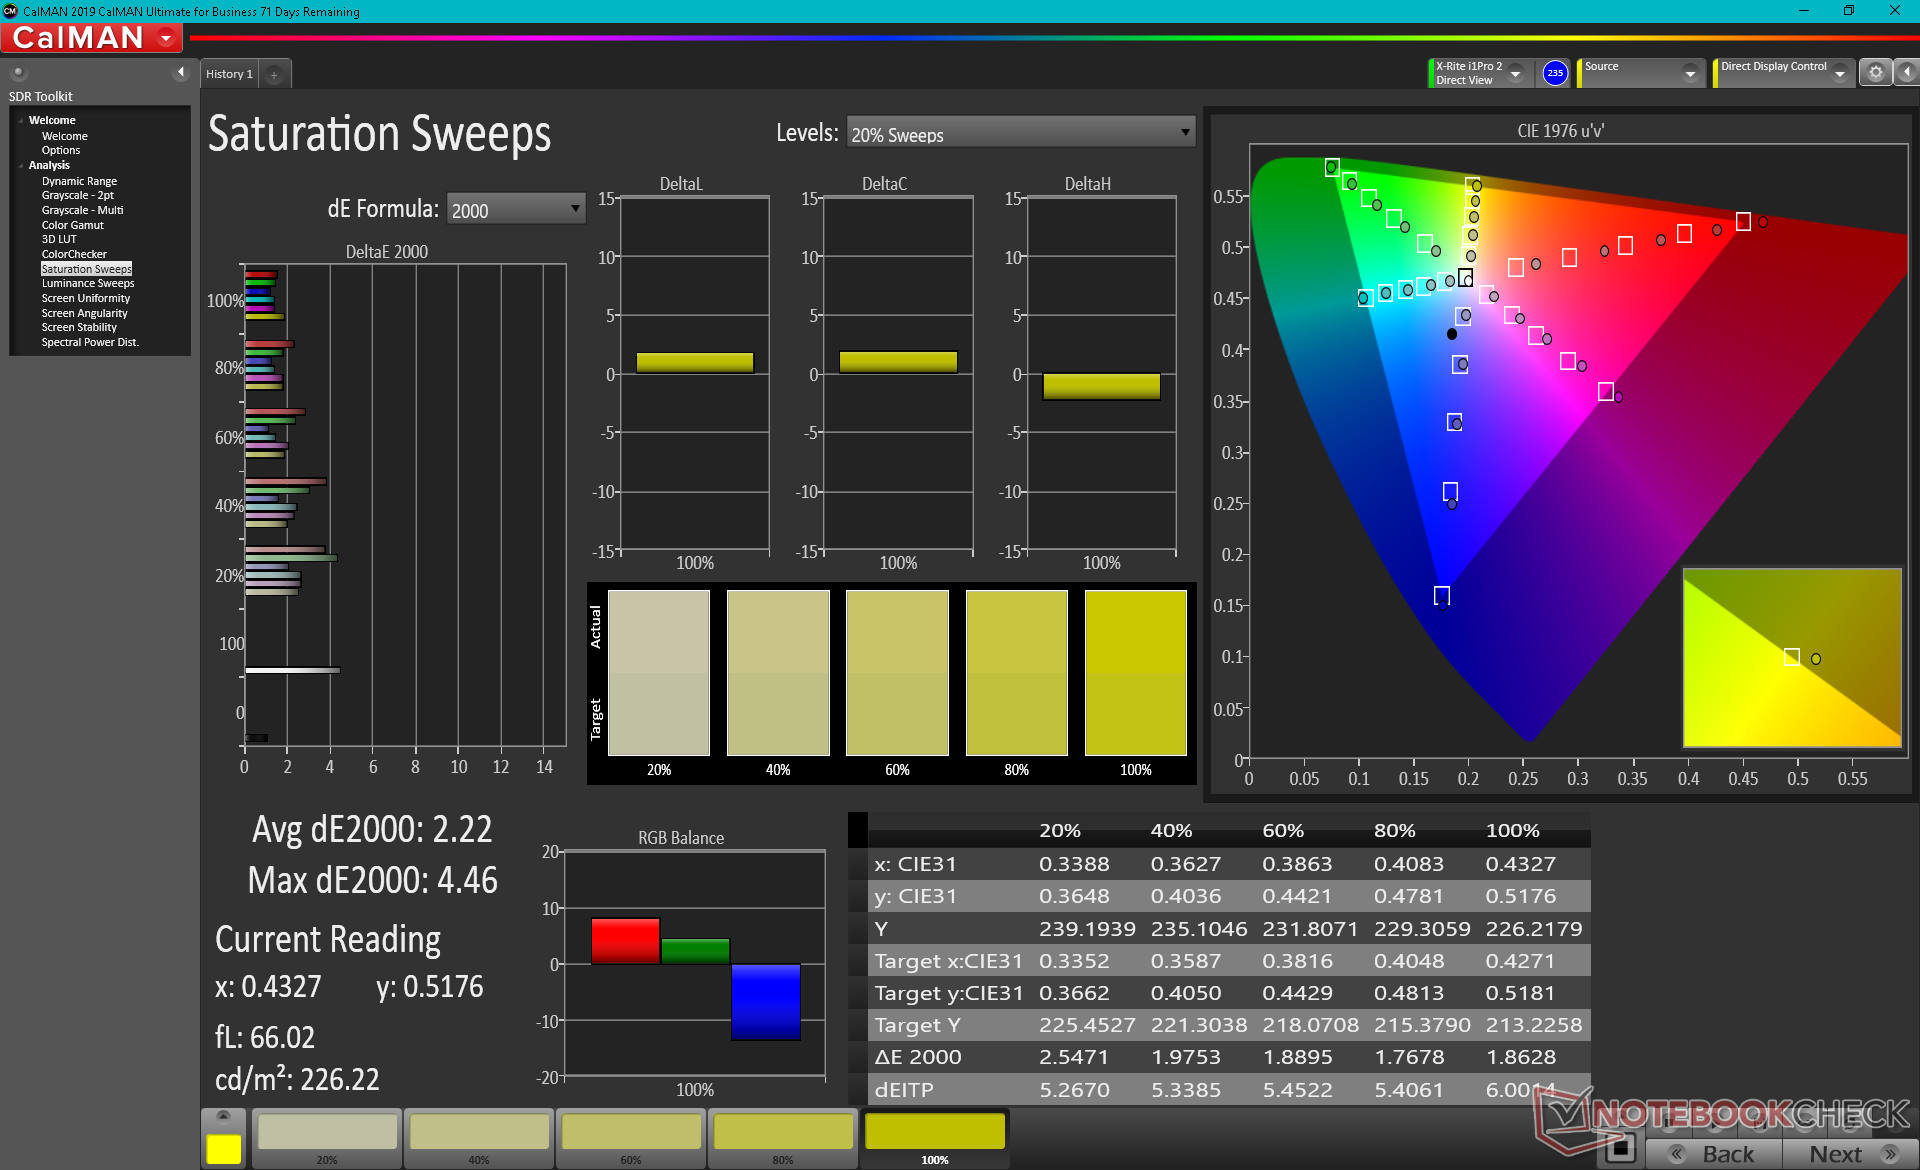
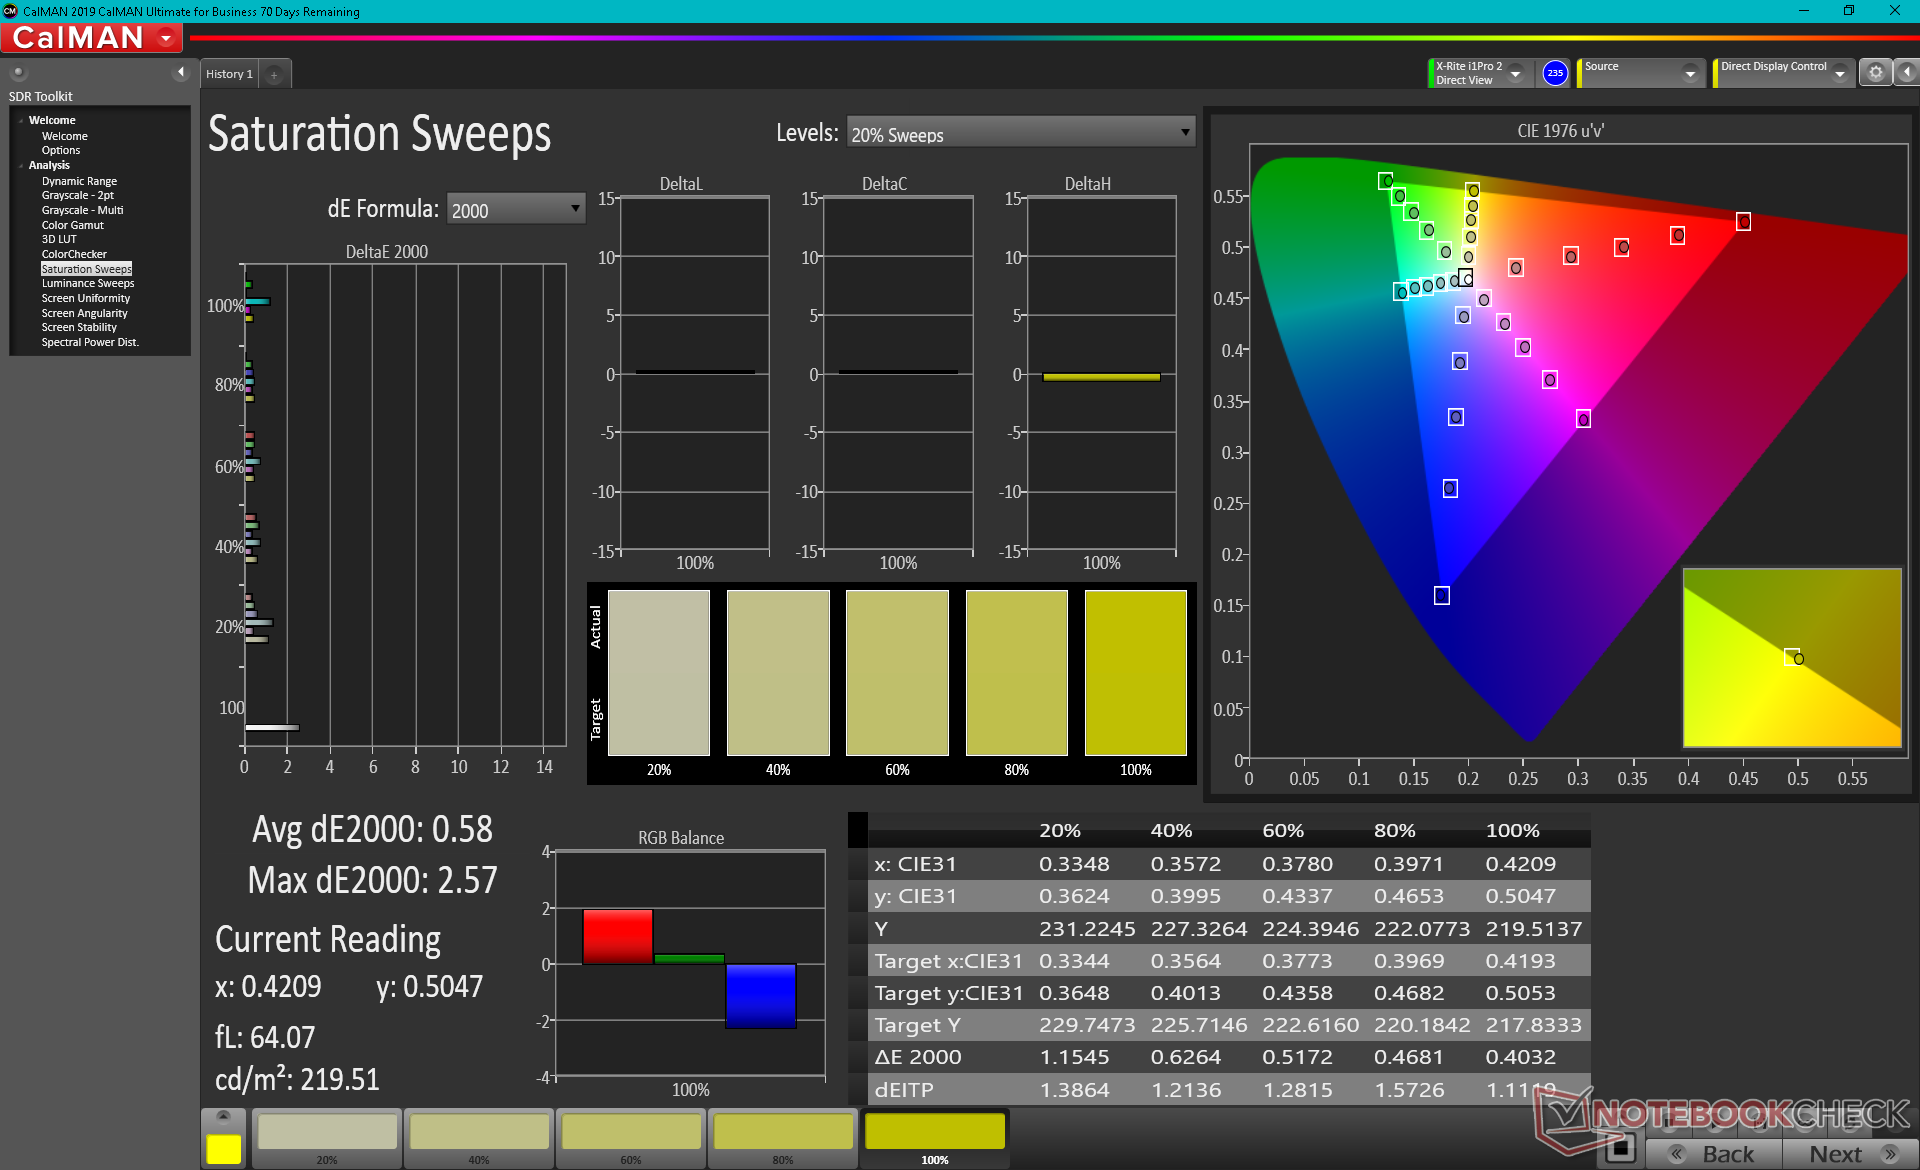
Die beiden Farbräume sRGB und AdobeRGB werden, wie beworben, vollständig abgedeckt, während die DCI-P3-Abdeckung bei rund 88 Prozent liegt. Dank den kräftigen Farben, den schnellen Reaktionszeiten und der hohen Bildwiederholfrequenz eignet sich das 4K-Panel sowohl für Gaming als auch Bildbearbeitung.
Unsere Messungen mit dem X-Rite Spektralfotometer zeigen bereits im Werkszustand eine ordentliche Kalibrierung mit durchschnittlichen DeltaE-2000-Abweichungen von 2,4 für die Graustufen bzw. 4,34 für die Farben gegenüber der AdobeRGB-Referenz. Das Wechseln auf sRGB und die Kalibrierung liefert durch die Bank exzellente DeltaE-Werte kleiner 2.
Reaktionszeiten (Response Times) des Displays
| ↔ Reaktionszeiten Schwarz zu Weiß | ||
|---|---|---|
| 10.4 ms ... steigend ↗ und fallend ↘ kombiniert | ↗ 5.2 ms steigend | 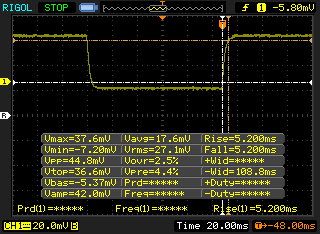 |
| ↘ 5.2 ms fallend | ||
| Die gemessenen Reaktionszeiten sind gut, für anspruchsvolle Spieler könnten der Bildschirm jedoch zu langsam sein. Im Vergleich rangierten die bei uns getesteten Geräte von 0.1 (Minimum) zu 240 (Maximum) ms. » 28 % aller Screens waren schneller als der getestete. Daher sind die gemessenen Reaktionszeiten besser als der Durchschnitt aller vermessenen Geräte (19.8 ms). | ||
| ↔ Reaktionszeiten 50% Grau zu 80% Grau | ||
| 14.4 ms ... steigend ↗ und fallend ↘ kombiniert | ↗ 7.6 ms steigend | 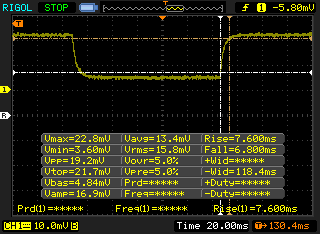 |
| ↘ 6.8 ms fallend | ||
| Die gemessenen Reaktionszeiten sind gut, für anspruchsvolle Spieler könnten der Bildschirm jedoch zu langsam sein. Im Vergleich rangierten die bei uns getesteten Geräte von 0.165 (Minimum) zu 636 (Maximum) ms. » 28 % aller Screens waren schneller als der getestete. Daher sind die gemessenen Reaktionszeiten besser als der Durchschnitt aller vermessenen Geräte (31 ms). | ||
Bildschirm-Flackern / PWM (Pulse-Width Modulation)
| Flackern / PWM nicht festgestellt | 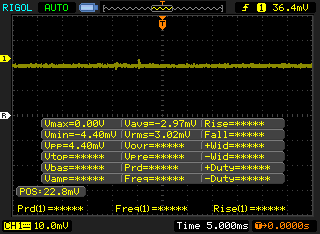 | ||
Im Vergleich: 52 % aller getesteten Geräte nutzten kein PWM um die Helligkeit zu reduzieren. Wenn PWM eingesetzt wurde, dann bei einer Frequenz von durchschnittlich 7775 (Minimum 5, Maximum 343500) Hz. | |||
Typischerweise erreichen Gaming-laptops eine Helligkeit von rund 300 cd/m², dank der matten Oberfläche und Helligkeitswerten von mehr als 400 cd/m² schlägt sich das Alienware x17 R1 im Freien besser als die meisten anderen 17,3-Zoll-Konkurrenten. Die Größe und das hohe Gewicht lassen sich aber nur schwer ignorieren, weshalb man vermutlich lieber am Schreibtisch arbeitet/spielt.
Leistung - Beeindruckende CPU-Performance
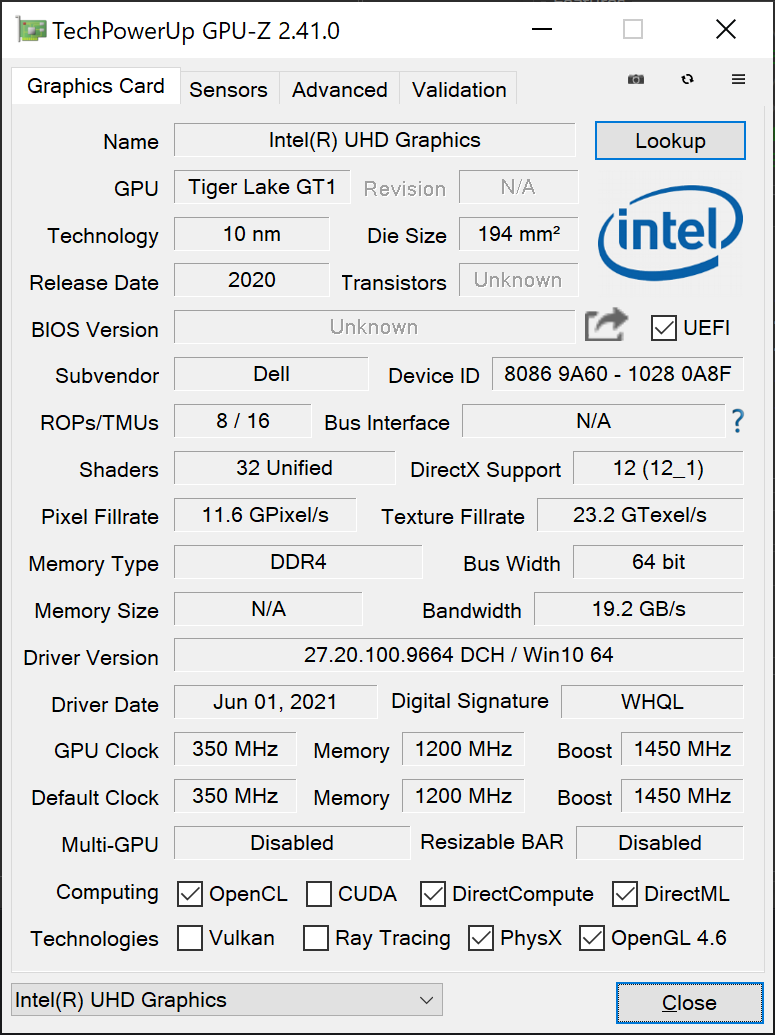
Dell bietet zwei Prozessoren (Core i7-11800H & Core i9, 11980HK) sowie drei GeForce-GPUs (RTX 3060, RTX 3070 & RTX 3080) an. Wir erwarten zwischen den beiden CPUs keine großen Unterschiede, da bereits der i7 unter Last mehr als 90 °C erreicht, aber die drei GPUs arbeiten mit unterschiedlichen TGP-Werten von 130 Watt, 140 Watt bzw. 165 Watt. Zum Vergleich: Die RTX 3080 im Razer Blade 17 arbeitet "nur" mit 130 Watt.
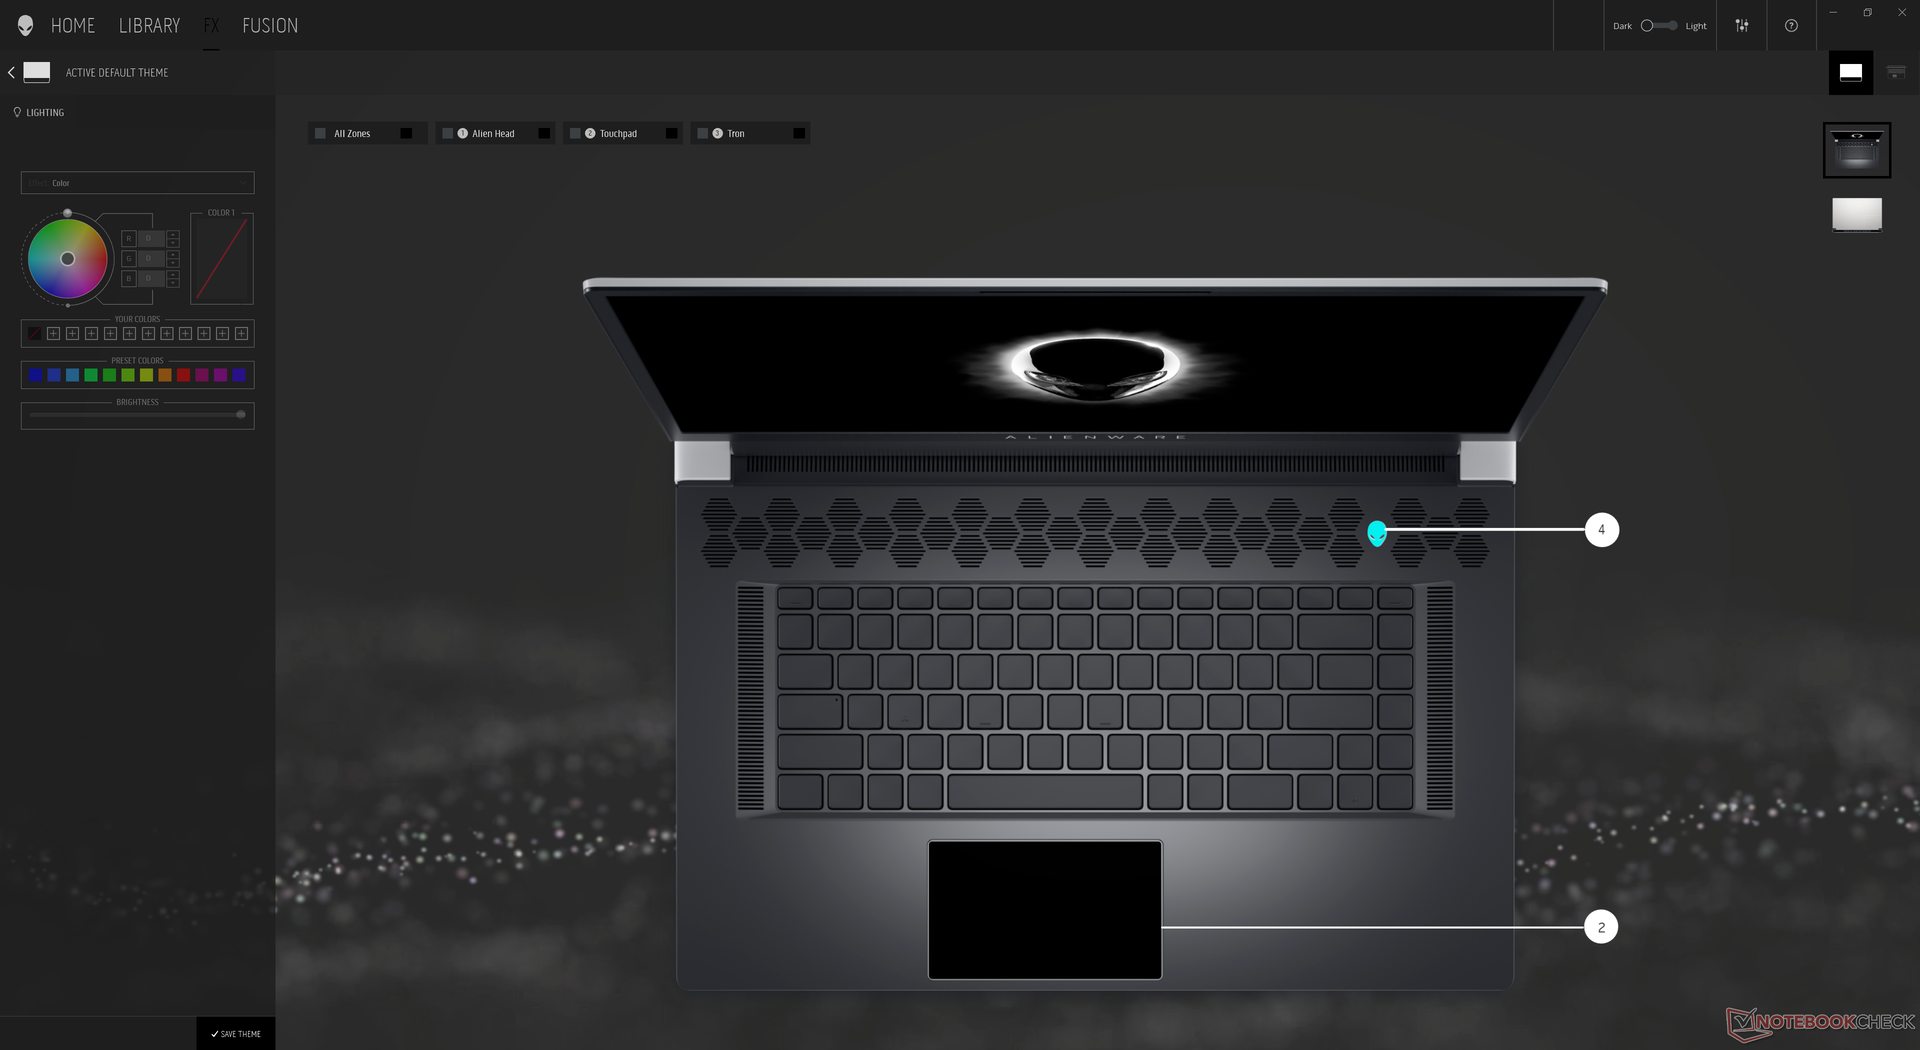
Um die beste Leistung zu erzielen, haben wir für die Benchmarks den Höchstleistungsmodus in Alienwares Command Center ausgewählt. Mit dieser Software sollte man sich etwas beschäftigen, da es hier neben den Leistungs- auch die Beleuchtungseinstellungen gibt. Im BIOS kann man zudem auswählen, ob beide GPUs oder nur die dedizierte GeForce-GPU genutzt wird.
Advanced Optimus und damit auch G-Sync werden nur in Kombination mit dem 360-Hz-1080p-Bildschirm unterstützt.
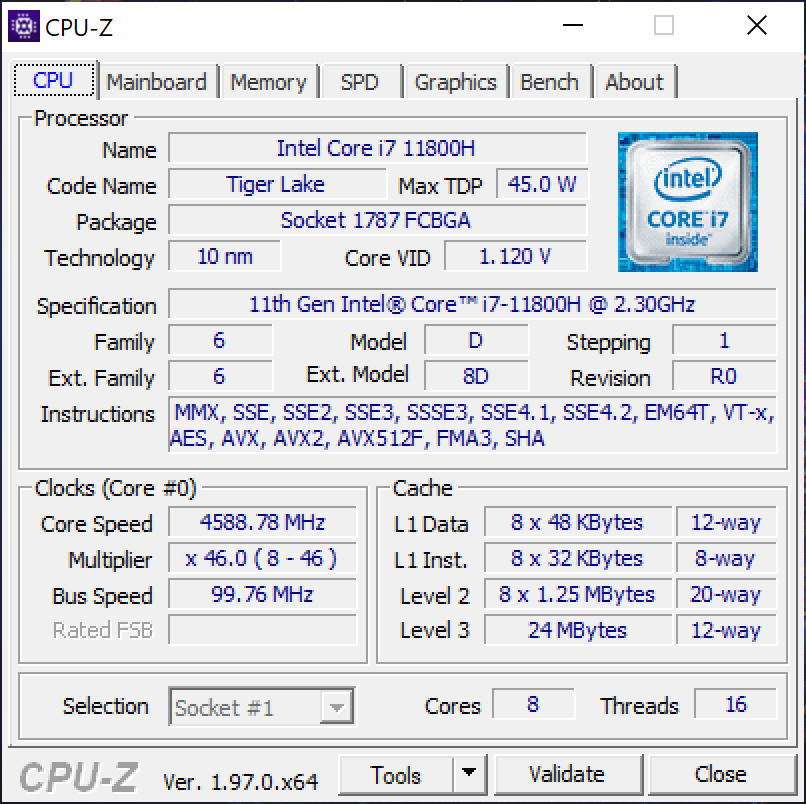
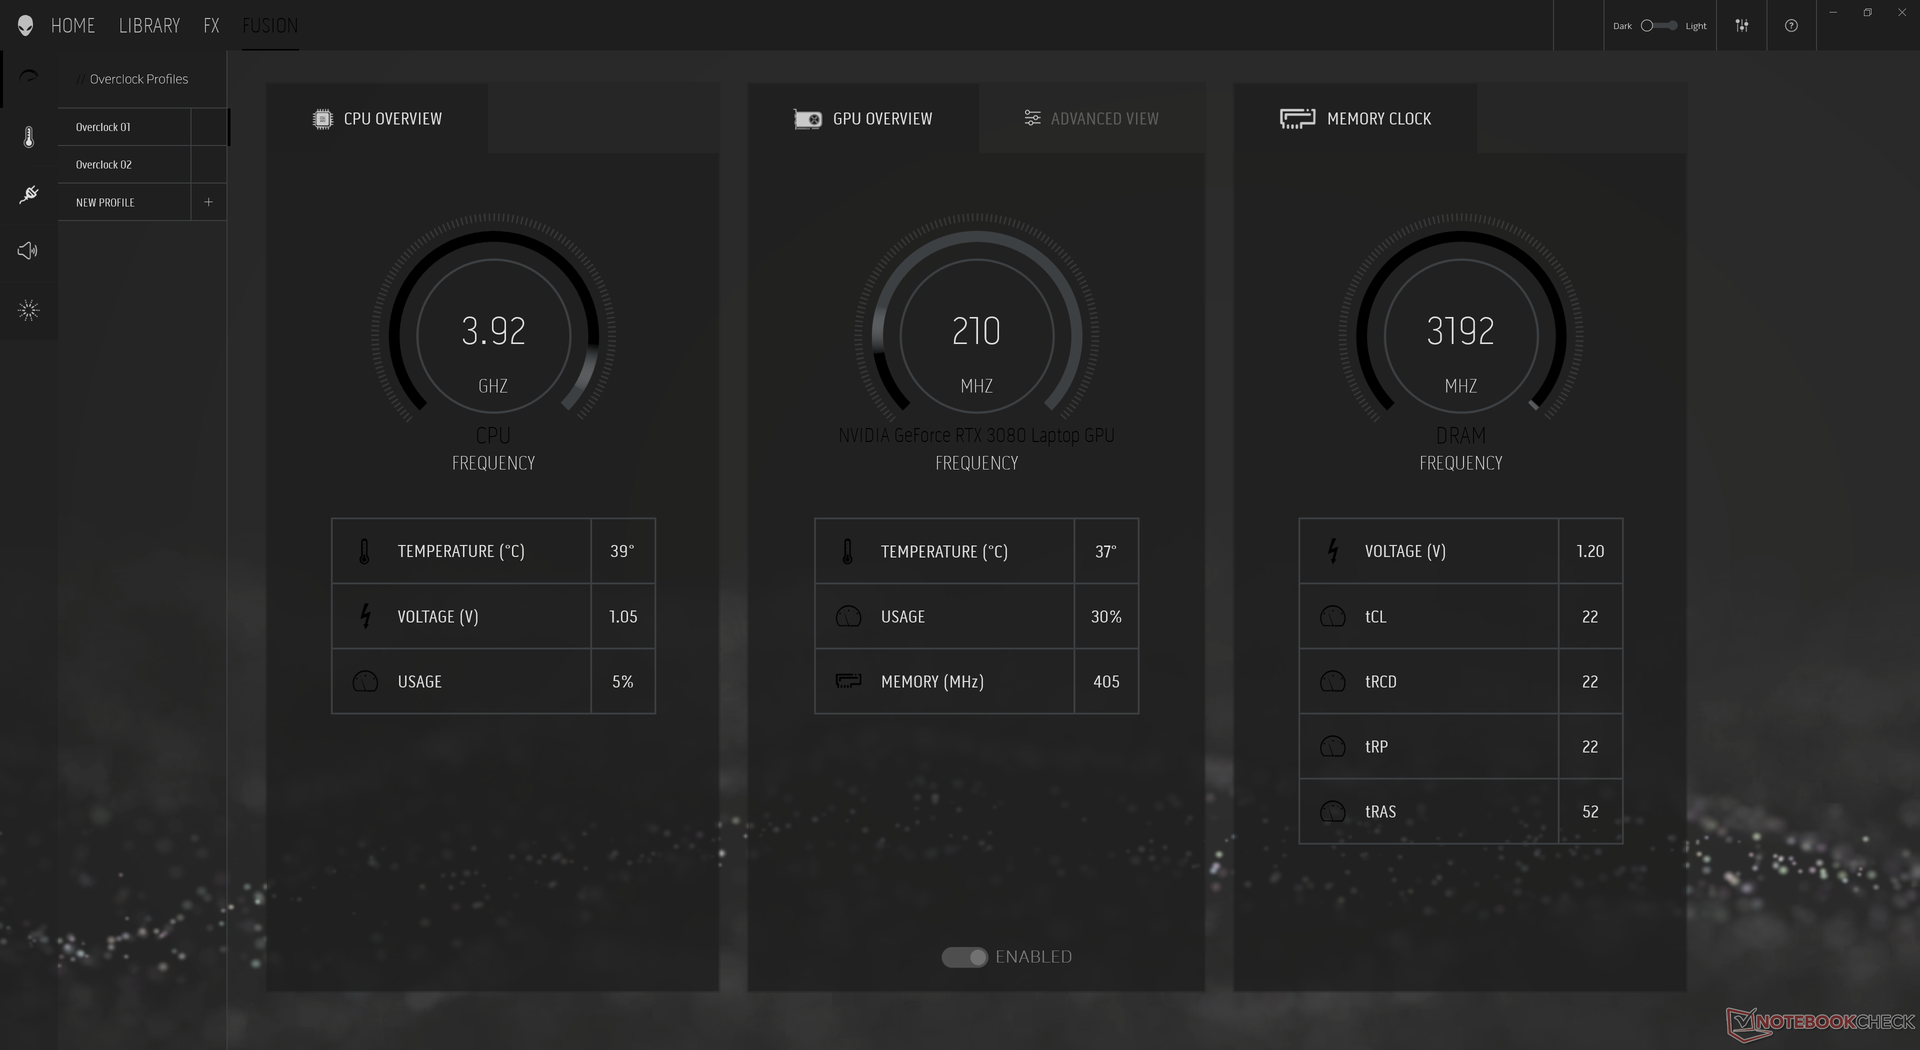
Prozessor
Die CPU-Leistung ist hervorragend und die Cinebench-Multi-Ergebnisse liegen 20% über den durchschnittlichen Werten für den Core i7-11800H in unserer Datenbank. Damit ist das Alienware x17 R1 auch eines der schnellsten Notebooks auf dem Markt mit diesem Prozessor. Dank der guten Leistung schneidet das Testgerät in Multi-Core-Tests sogar besser ab als viele Konkurrenten mit dem Ryzen 9 5900HX oder Core i9-11900K, was normalerweise nicht der Fall ist.
Die hohe Leistung liegt an den hohen TDP-Einstellungen, denn Alienware setzt beide Limits (PL1/PL2) auf 165 Watt und lässt dem Prozessor damit praktisch freien Lauf, der einzige begrenzende Faktor ist demnach die CPU-Temperatur. In der Praxis kann ein i7-11800H diese Werte natürlich nicht erreichen, doch er hält stabil die hohen Turbo-Boost-Werte (auch bei längerer Belastung) und verbraucht dabei zwischen 98-108 Watt - exzellente Ergebnisse. Wie man später noch sehen wird, hat die hohe Leistung aber Auswirkungen auf die Temperaturen und natürlich auch den Stromverbrauch.
Cinebench R15 Multi Loop
Cinebench R23: Multi Core | Single Core
Cinebench R15: CPU Multi 64Bit | CPU Single 64Bit
Blender: v2.79 BMW27 CPU
7-Zip 18.03: 7z b 4 -mmt1 | 7z b 4
Geekbench 5.5: Single-Core | Multi-Core
HWBOT x265 Benchmark v2.2: 4k Preset
LibreOffice : 20 Documents To PDF
R Benchmark 2.5: Overall mean
| Cinebench R20 / CPU (Multi Core) | |
| Alienware x17 RTX 3080 P48E | |
| Asus Strix Scar 17 G733QSA-XS99 | |
| Schenker XMG Ultra 17 Rocket Lake | |
| Asus ROG Strix G17 G713QE-RB74 | |
| MSI GS76 Stealth 11UH | |
| Eluktronics RP-17 | |
| Durchschnittliche Intel Core i7-11800H (2498 - 5408, n=50) | |
| Alienware m17 R4 | |
| MSI GS75 10SF-609US | |
| Medion Erazer Beast X20 | |
| Schenker XMG Pro 17 PB71RD-G | |
| Lenovo Legion 5 17IMH05 | |
| Cinebench R20 / CPU (Single Core) | |
| Schenker XMG Ultra 17 Rocket Lake | |
| MSI GS76 Stealth 11UH | |
| Alienware x17 RTX 3080 P48E | |
| Durchschnittliche Intel Core i7-11800H (520 - 586, n=47) | |
| Asus Strix Scar 17 G733QSA-XS99 | |
| Asus ROG Strix G17 G713QE-RB74 | |
| Alienware m17 R4 | |
| Eluktronics RP-17 | |
| MSI GS75 10SF-609US | |
| Medion Erazer Beast X20 | |
| Schenker XMG Pro 17 PB71RD-G | |
| Lenovo Legion 5 17IMH05 | |
| Cinebench R23 / Multi Core | |
| Schenker XMG Ultra 17 Rocket Lake | |
| Alienware x17 RTX 3080 P48E | |
| Asus Strix Scar 17 G733QSA-XS99 | |
| MSI GS76 Stealth 11UH | |
| Asus ROG Strix G17 G713QE-RB74 | |
| Durchschnittliche Intel Core i7-11800H (6508 - 14088, n=48) | |
| Alienware m17 R4 | |
| Medion Erazer Beast X20 | |
| Cinebench R23 / Single Core | |
| Schenker XMG Ultra 17 Rocket Lake | |
| MSI GS76 Stealth 11UH | |
| Alienware x17 RTX 3080 P48E | |
| Asus Strix Scar 17 G733QSA-XS99 | |
| Durchschnittliche Intel Core i7-11800H (1386 - 1522, n=45) | |
| Asus ROG Strix G17 G713QE-RB74 | |
| Alienware m17 R4 | |
| Medion Erazer Beast X20 | |
| Cinebench R15 / CPU Multi 64Bit | |
| Schenker XMG Ultra 17 Rocket Lake | |
| Asus Strix Scar 17 G733QSA-XS99 | |
| Alienware x17 RTX 3080 P48E | |
| MSI GS76 Stealth 11UH | |
| Asus ROG Strix G17 G713QE-RB74 | |
| Eluktronics RP-17 | |
| Durchschnittliche Intel Core i7-11800H (1342 - 2173, n=50) | |
| Alienware m17 R4 | |
| MSI GS75 10SF-609US | |
| Medion Erazer Beast X20 | |
| Schenker XMG Pro 17 PB71RD-G | |
| Lenovo Legion 5 17IMH05 | |
| Cinebench R15 / CPU Single 64Bit | |
| Schenker XMG Ultra 17 Rocket Lake | |
| Asus Strix Scar 17 G733QSA-XS99 | |
| MSI GS76 Stealth 11UH | |
| Asus ROG Strix G17 G713QE-RB74 | |
| Alienware x17 RTX 3080 P48E | |
| Durchschnittliche Intel Core i7-11800H (201 - 231, n=46) | |
| Alienware m17 R4 | |
| Medion Erazer Beast X20 | |
| MSI GS75 10SF-609US | |
| Eluktronics RP-17 | |
| Schenker XMG Pro 17 PB71RD-G | |
| Lenovo Legion 5 17IMH05 | |
| Geekbench 5.5 / Single-Core | |
| Schenker XMG Ultra 17 Rocket Lake | |
| MSI GS76 Stealth 11UH | |
| Durchschnittliche Intel Core i7-11800H (1429 - 1625, n=40) | |
| Asus Strix Scar 17 G733QSA-XS99 | |
| Alienware m17 R4 | |
| MSI GS75 10SF-609US | |
| Medion Erazer Beast X20 | |
| Eluktronics RP-17 | |
| Schenker XMG Pro 17 PB71RD-G | |
| Lenovo Legion 5 17IMH05 | |
| Geekbench 5.5 / Multi-Core | |
| Schenker XMG Ultra 17 Rocket Lake | |
| MSI GS76 Stealth 11UH | |
| Asus Strix Scar 17 G733QSA-XS99 | |
| Durchschnittliche Intel Core i7-11800H (4655 - 9851, n=40) | |
| MSI GS75 10SF-609US | |
| Alienware m17 R4 | |
| Eluktronics RP-17 | |
| Medion Erazer Beast X20 | |
| Schenker XMG Pro 17 PB71RD-G | |
| Lenovo Legion 5 17IMH05 | |
| HWBOT x265 Benchmark v2.2 / 4k Preset | |
| Alienware x17 RTX 3080 P48E | |
| Schenker XMG Ultra 17 Rocket Lake | |
| Asus Strix Scar 17 G733QSA-XS99 | |
| MSI GS76 Stealth 11UH | |
| Asus ROG Strix G17 G713QE-RB74 | |
| Alienware m17 R4 | |
| Durchschnittliche Intel Core i7-11800H (7.38 - 17.4, n=46) | |
| Eluktronics RP-17 | |
| MSI GS75 10SF-609US | |
| Medion Erazer Beast X20 | |
| Schenker XMG Pro 17 PB71RD-G | |
| Lenovo Legion 5 17IMH05 | |
| LibreOffice / 20 Documents To PDF | |
| Lenovo Legion 5 17IMH05 | |
| Eluktronics RP-17 | |
| Asus ROG Strix G17 G713QE-RB74 | |
| Medion Erazer Beast X20 | |
| Alienware m17 R4 | |
| MSI GS75 10SF-609US | |
| MSI GS76 Stealth 11UH | |
| Alienware x17 RTX 3080 P48E | |
| Durchschnittliche Intel Core i7-11800H (38.6 - 59.9, n=45) | |
| Asus Strix Scar 17 G733QSA-XS99 | |
| Schenker XMG Ultra 17 Rocket Lake | |
| R Benchmark 2.5 / Overall mean | |
| Lenovo Legion 5 17IMH05 | |
| Schenker XMG Pro 17 PB71RD-G | |
| Medion Erazer Beast X20 | |
| MSI GS75 10SF-609US | |
| Eluktronics RP-17 | |
| Alienware m17 R4 | |
| Durchschnittliche Intel Core i7-11800H (0.548 - 0.615, n=46) | |
| Alienware x17 RTX 3080 P48E | |
| MSI GS76 Stealth 11UH | |
| Asus ROG Strix G17 G713QE-RB74 | |
| Schenker XMG Ultra 17 Rocket Lake | |
| Asus Strix Scar 17 G733QSA-XS99 | |
* ... kleinere Werte sind besser
System Performance
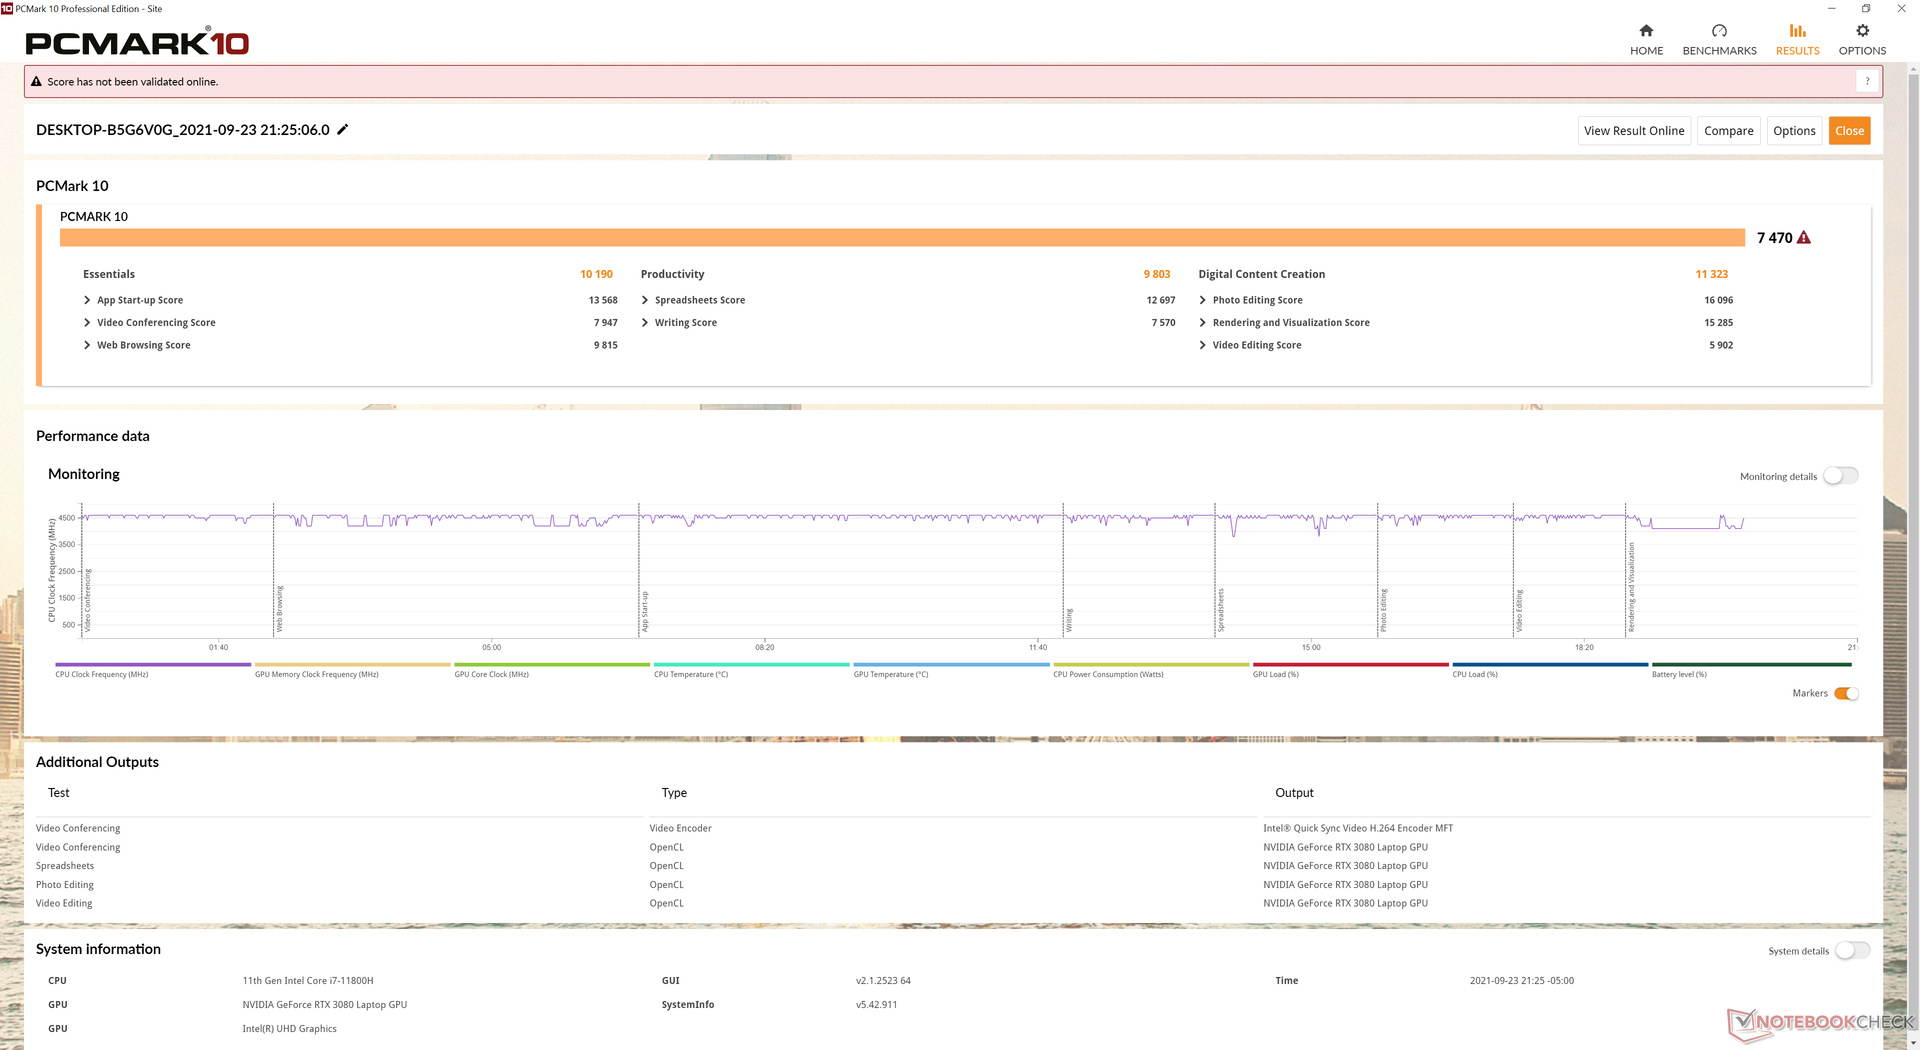
Die PCMark-Ergebnisse liegen im Vergleich zu anderen High-End-Gaming-Laptops auf dem erwarteten Niveau. Die Gesamtergebnisse liegen minimal vor dem Razer Blade 17 mit gleicher CPU-/GPU-Ausstattung.
| PCMark 10 / Score | |
| Alienware x17 RTX 3080 P48E | |
| Razer Blade 17 RTX 3070 | |
| Asus ROG Zephyrus S17 GX703HSD | |
| Durchschnittliche Intel Core i7-11800H, NVIDIA GeForce RTX 3080 Laptop GPU (6673 - 7470, n=11) | |
| Gigabyte Aero 17 HDR YD | |
| MSI GS76 Stealth 11UH | |
| Alienware m17 R4 | |
| PCMark 10 / Essentials | |
| Razer Blade 17 RTX 3070 | |
| Asus ROG Zephyrus S17 GX703HSD | |
| Durchschnittliche Intel Core i7-11800H, NVIDIA GeForce RTX 3080 Laptop GPU (9862 - 11064, n=11) | |
| Gigabyte Aero 17 HDR YD | |
| Alienware x17 RTX 3080 P48E | |
| MSI GS76 Stealth 11UH | |
| Alienware m17 R4 | |
| PCMark 10 / Productivity | |
| Alienware x17 RTX 3080 P48E | |
| Asus ROG Zephyrus S17 GX703HSD | |
| Razer Blade 17 RTX 3070 | |
| Durchschnittliche Intel Core i7-11800H, NVIDIA GeForce RTX 3080 Laptop GPU (8278 - 9803, n=11) | |
| Gigabyte Aero 17 HDR YD | |
| MSI GS76 Stealth 11UH | |
| Alienware m17 R4 | |
| PCMark 10 / Digital Content Creation | |
| Alienware x17 RTX 3080 P48E | |
| Razer Blade 17 RTX 3070 | |
| Asus ROG Zephyrus S17 GX703HSD | |
| Durchschnittliche Intel Core i7-11800H, NVIDIA GeForce RTX 3080 Laptop GPU (9881 - 11323, n=11) | |
| Gigabyte Aero 17 HDR YD | |
| MSI GS76 Stealth 11UH | |
| Alienware m17 R4 | |
| PCMark 10 Score | 7470 Punkte | |
Hilfe | ||
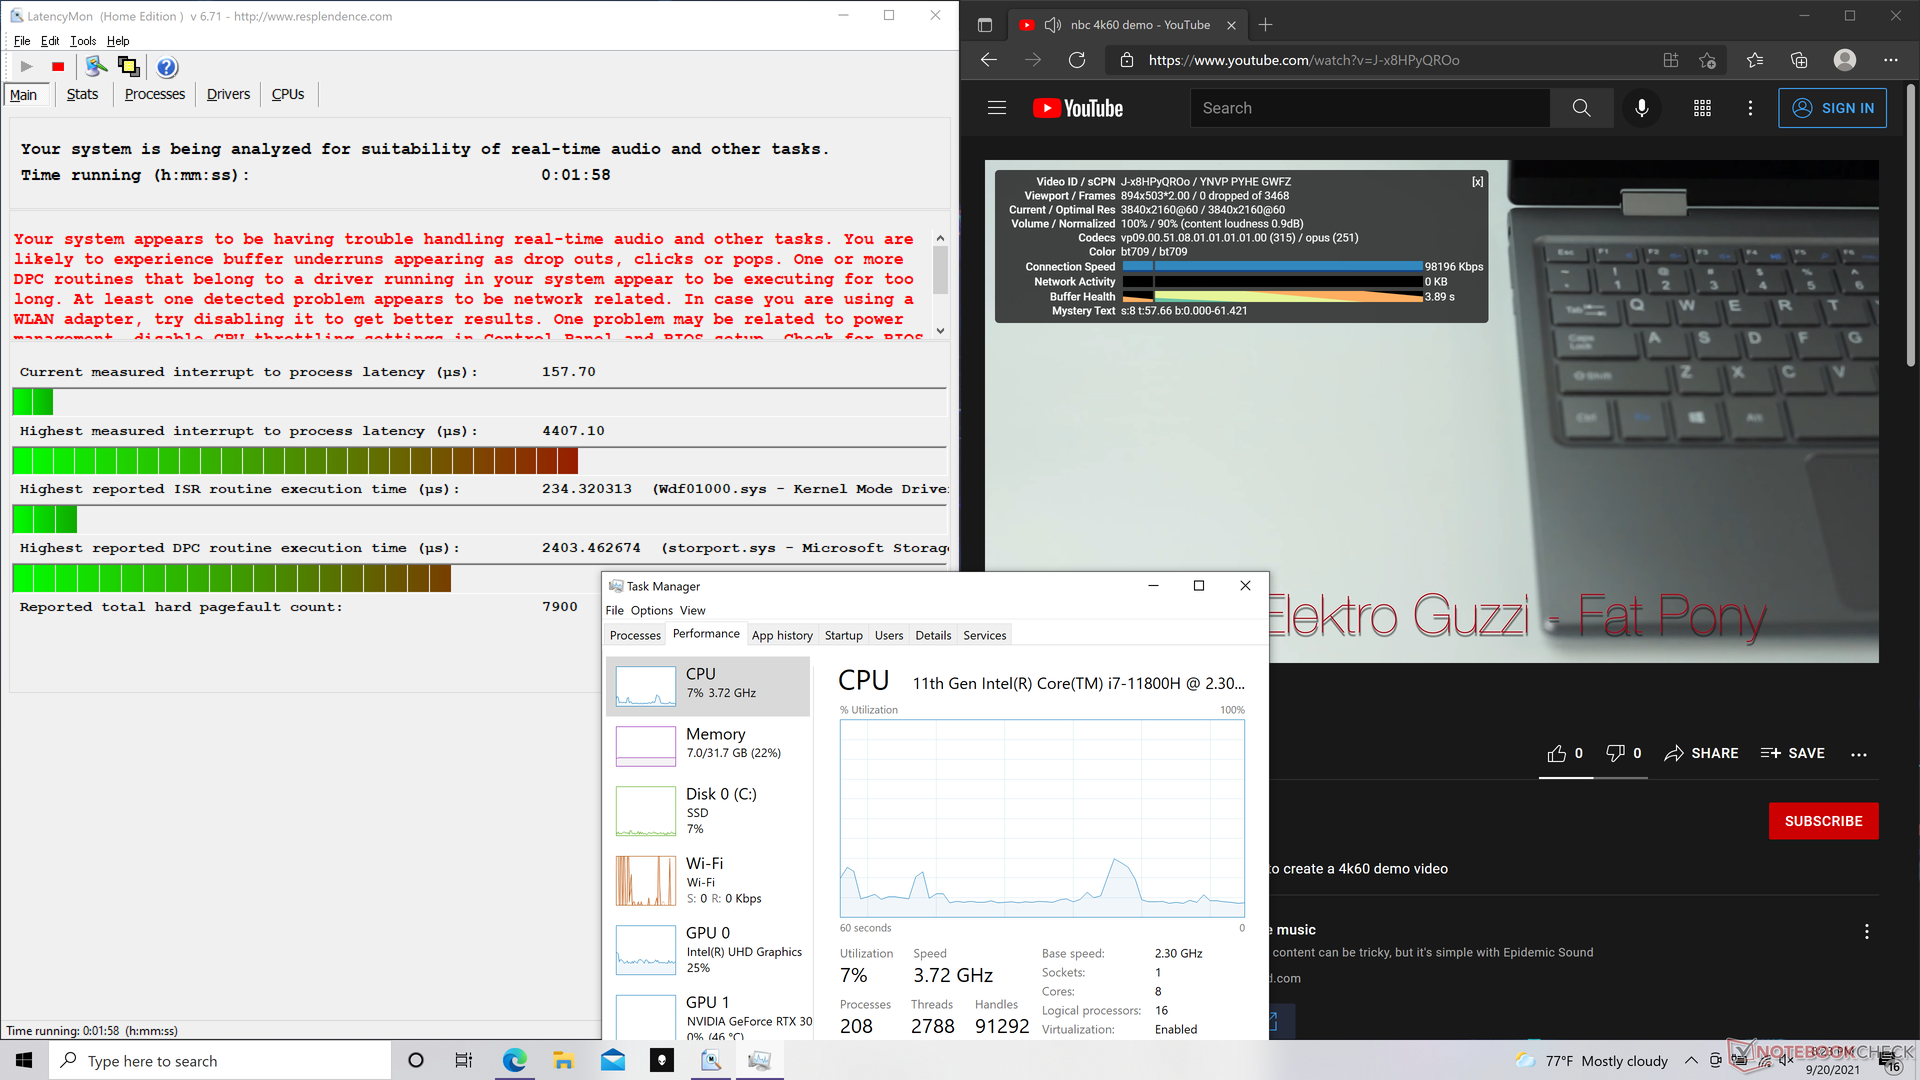
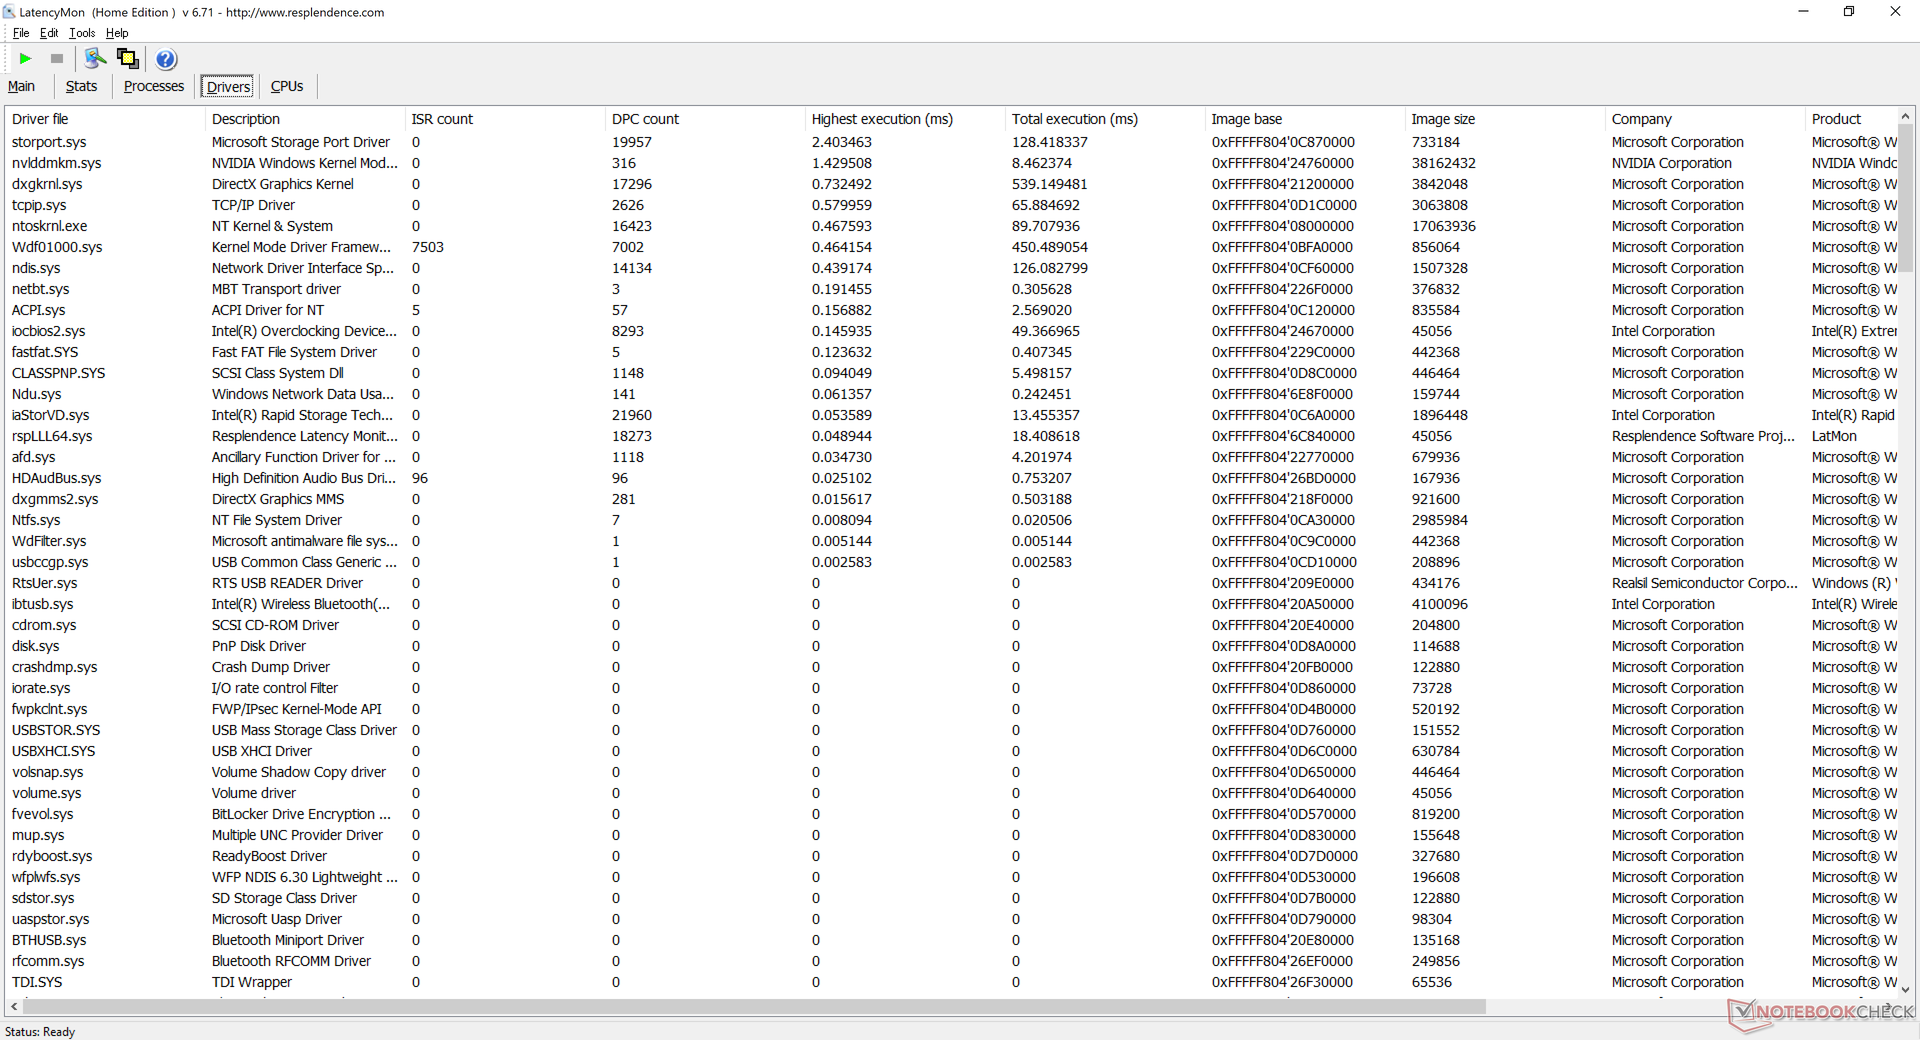
DPC Latency
LatencyMon zeigt Einschränkungen, wenn man mehrere Tabs im Browser öffnet und bei CPU-Last durch Prime95. Die 4K-Videoweidergabe mit 60 FPS ist aber problemlos möglich und es gibt auch keine übersprungenen Einzelbilder (Dropped Frames).
| DPC Latencies / LatencyMon - interrupt to process latency (max), Web, Youtube, Prime95 | |
| Alienware x17 RTX 3080 P48E | |
| Gigabyte Aero 17 HDR YD | |
| Asus ROG Zephyrus S17 GX703HSD | |
| MSI GS76 Stealth 11UH | |
| Alienware m17 R4 | |
| Razer Blade 17 RTX 3070 | |
* ... kleinere Werte sind besser
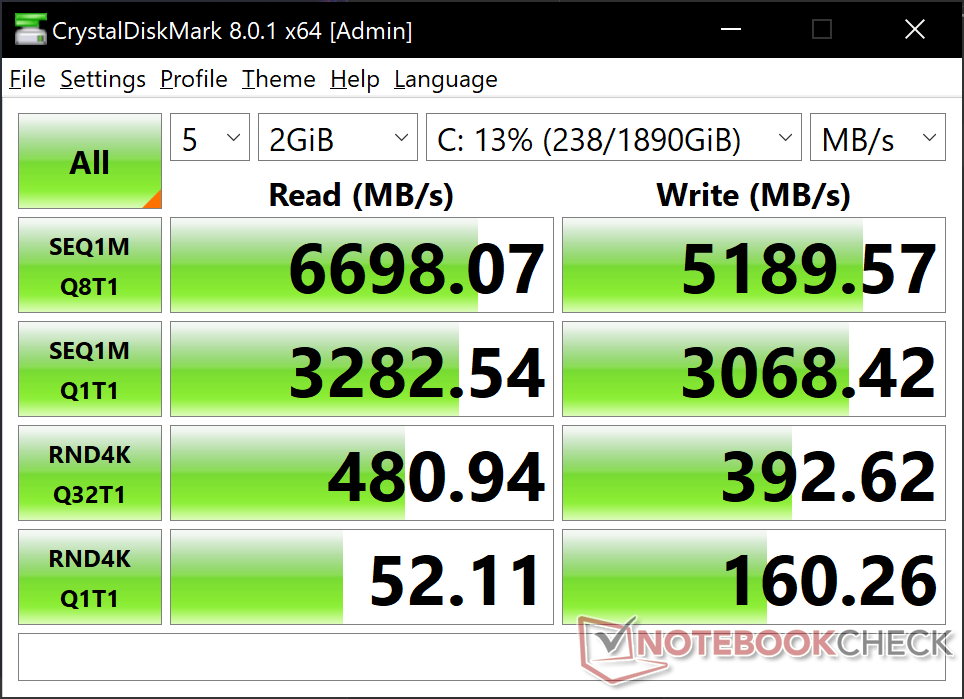
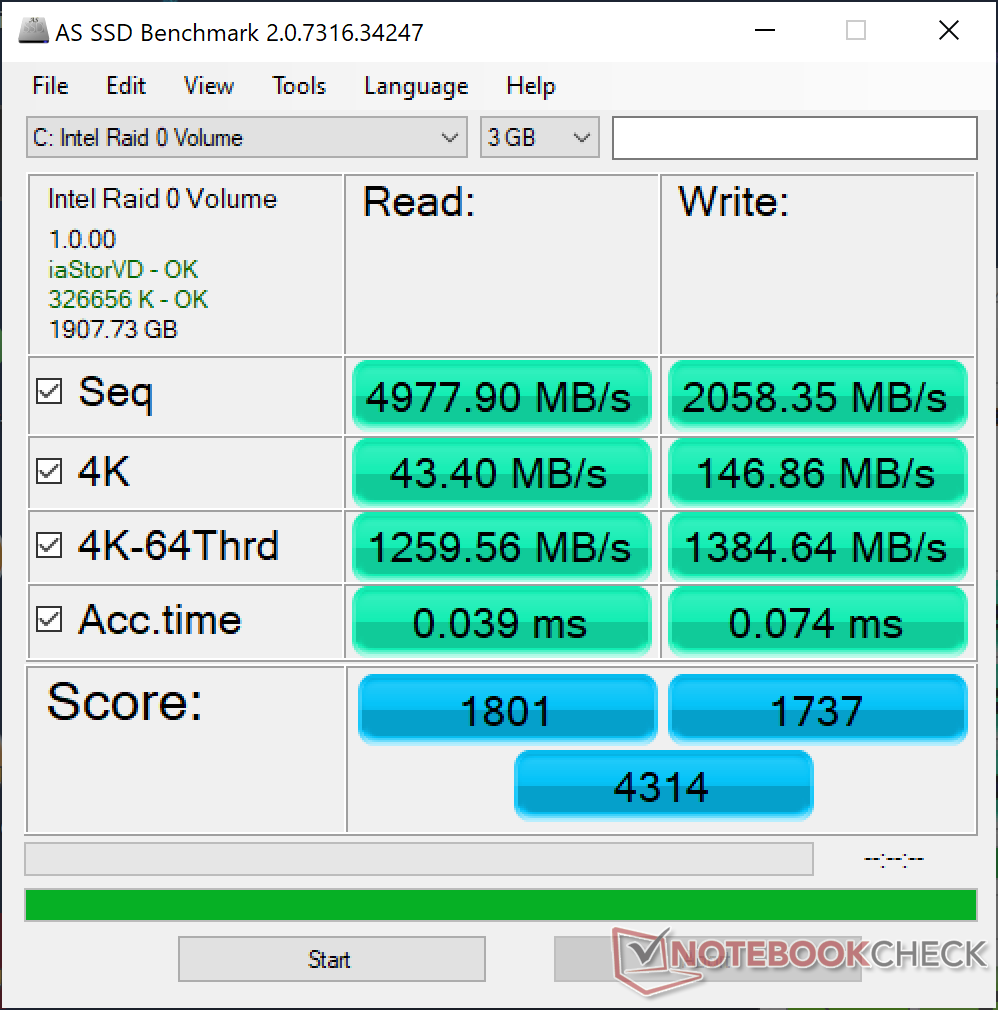
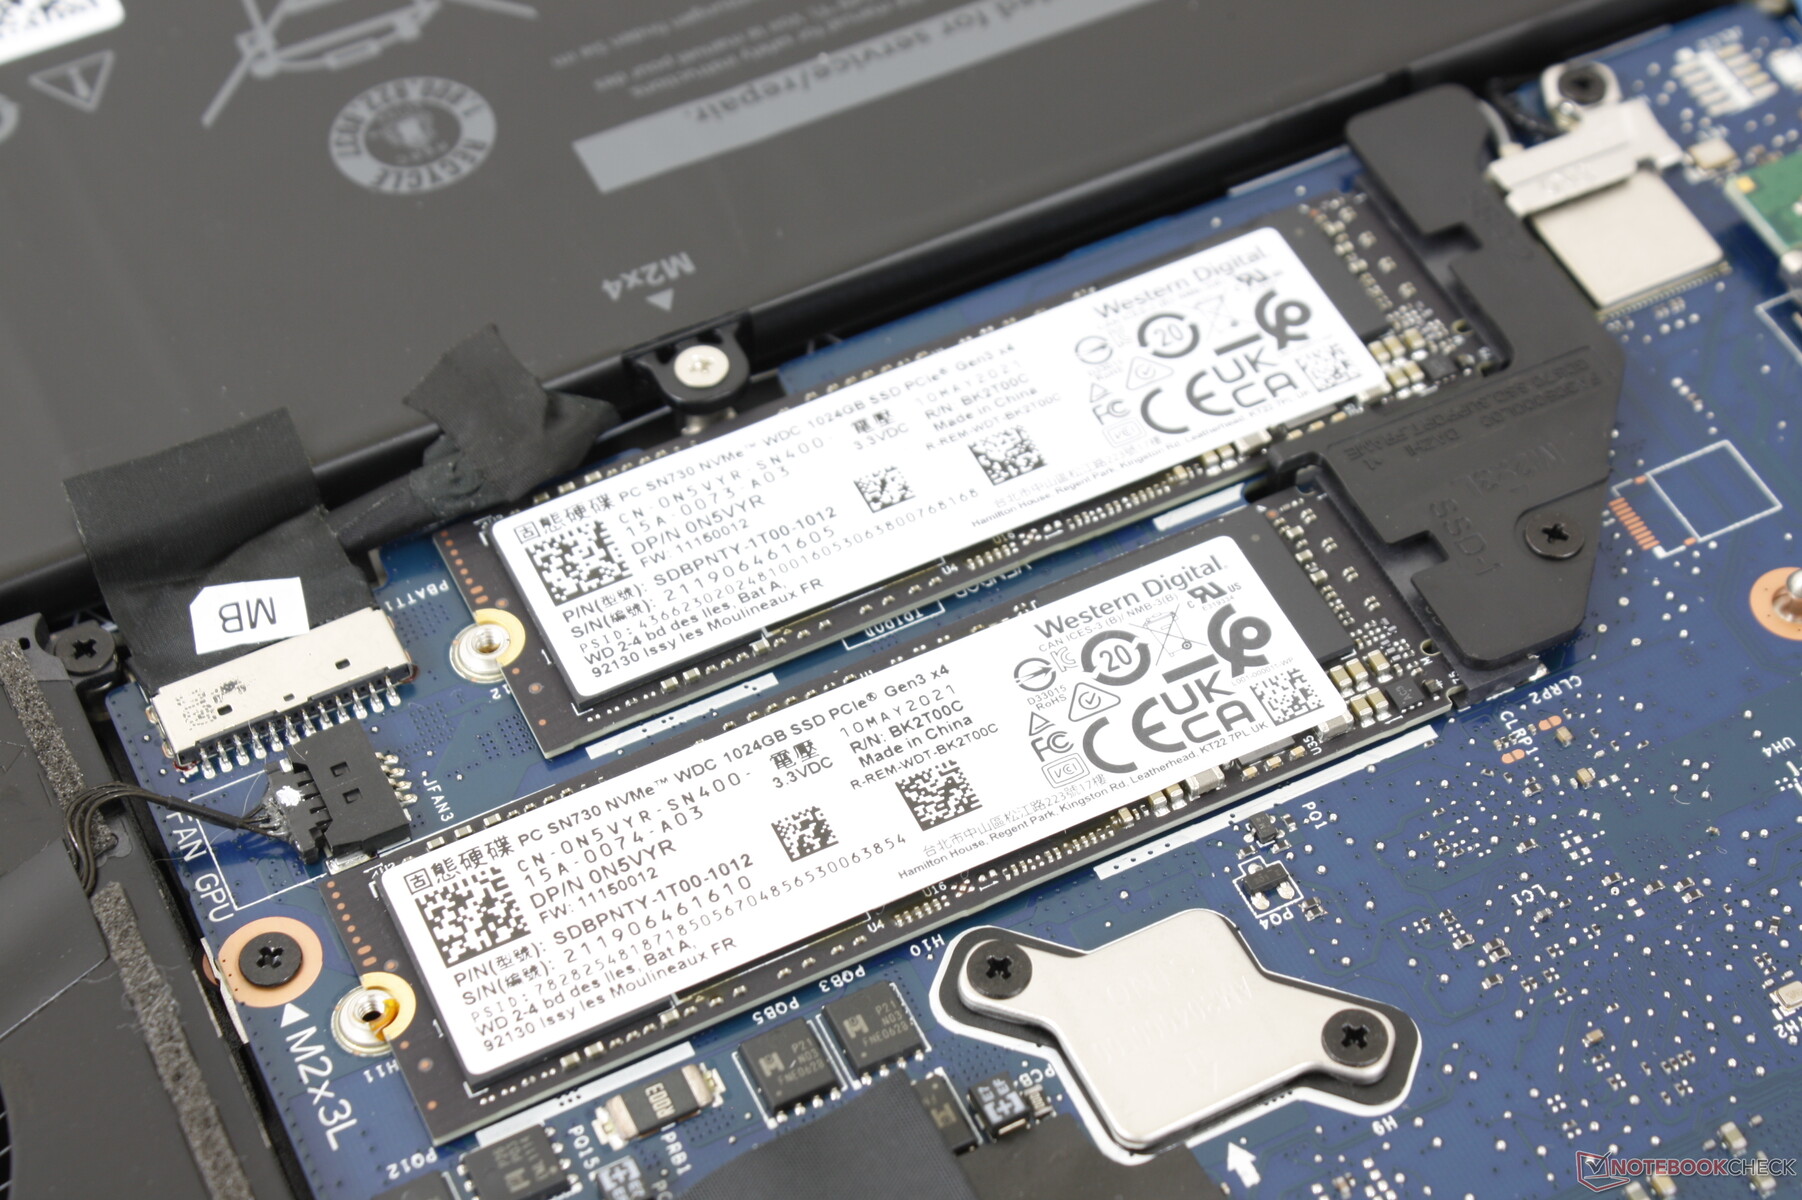
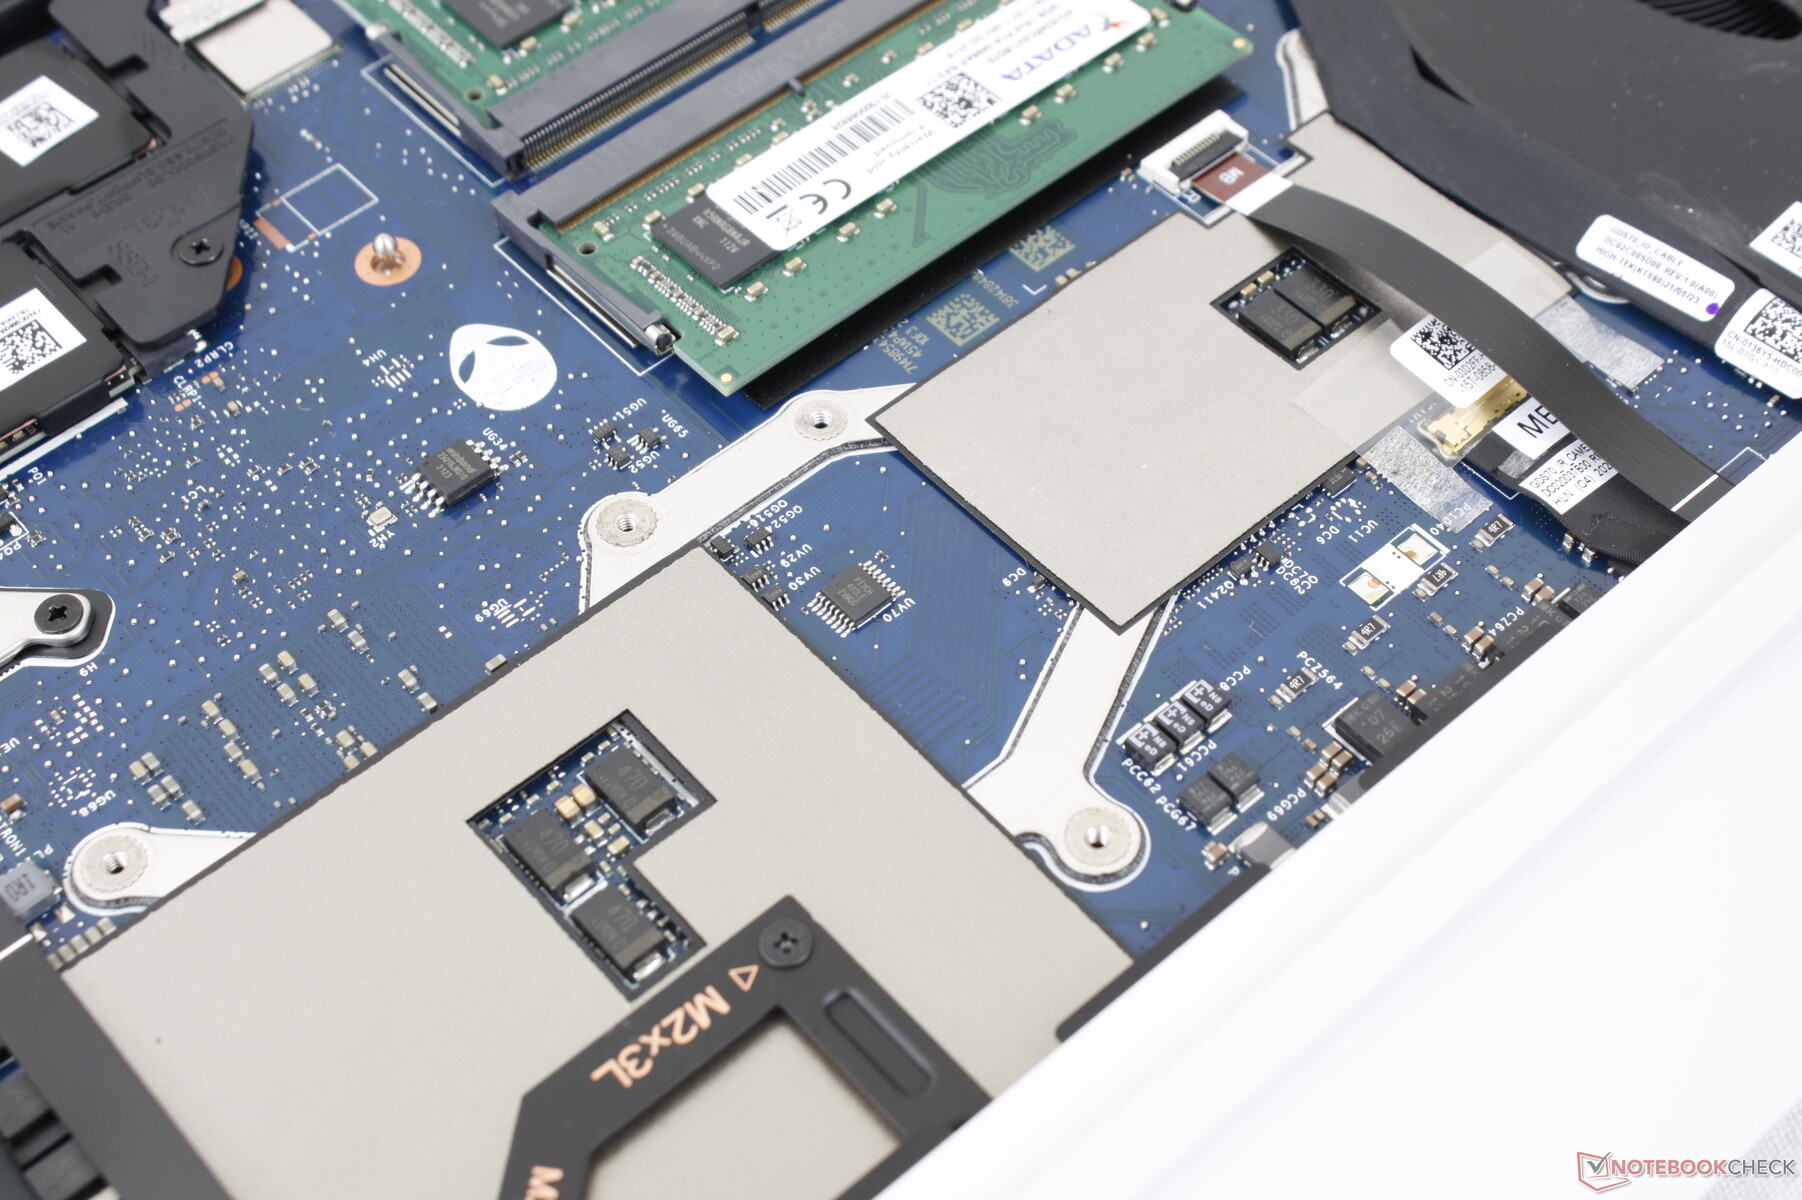
Massenspeicher - 1x PCIe 4.0 und 1x PCIe 3.0
Unser Testgerät verwendet zwei 1 TB große NVMe-SSDs (WD SN730) in einer RAID-0-Konfiguration und erreicht damit hervorragende sequentielle Transferraten von 6.700 MB/s (Lesen) bzw. 4.300 MB/s (Schreiben). Damit ist die Leistung besser als bei der besten PCIe-3.0-SSD, allerdings bieten einzelne PCIe-4.0-Laufwerke wie die Samsung PM9A1 noch mehr Leistung als unser RAID-0-Setup. Laut Dell wird unterstützt ein Steckplatz den schnellen PCIe-4.0-Standard, falls man selbst aufrüsten möchte.
| Alienware x17 RTX 3080 P48E 2x WDC PC SN730 SDBPNTY-1T00 (RAID 0) | Alienware m17 R4 2x Micron 2300 512 GB (RAID 0) | Razer Blade 17 RTX 3070 Samsung PM9A1 MZVL21T0HCLR | Asus ROG Zephyrus S17 GX703HSD Samsung PM9A1 MZVL22T0HBLB | MSI GS76 Stealth 11UH Samsung PM9A1 MZVL22T0HBLB | Gigabyte Aero 17 HDR YD Samsung PM9A1 MZVL2512HCJQ | |
|---|---|---|---|---|---|---|
| AS SSD | -12% | 52% | 67% | 68% | 66% | |
| Seq Read (MB/s) | 4978 | 2733 -45% | 5302 7% | 5085 2% | 5408 9% | 5438 9% |
| Seq Write (MB/s) | 2058 | 2822 37% | 3977 93% | 4434 115% | 3863 88% | 3904 90% |
| 4K Read (MB/s) | 43.4 | 45.04 4% | 55 27% | 80.3 85% | 52.7 21% | 56.2 29% |
| 4K Write (MB/s) | 146.9 | 88.4 -40% | 148.7 1% | 214.7 46% | 153.1 4% | 165.8 13% |
| 4K-64 Read (MB/s) | 1260 | 1388 10% | 2715 115% | 2573 104% | 2692 114% | 2489 98% |
| 4K-64 Write (MB/s) | 1385 | 1227 -11% | 3416 147% | 2972 115% | 3414 146% | 3480 151% |
| Access Time Read * (ms) | 0.039 | 0.079 -103% | 0.044 -13% | 0.018 54% | 0.046 -18% | 0.054 -38% |
| Access Time Write * (ms) | 0.074 | 0.095 -28% | 0.085 -15% | 0.02 73% | 0.027 64% | 0.026 65% |
| Score Read (Points) | 1801 | 1706 -5% | 3300 83% | 3161 76% | 3285 82% | 3089 72% |
| Score Write (Points) | 1737 | 1598 -8% | 3963 128% | 3631 109% | 3953 128% | 4036 132% |
| Score Total (Points) | 4314 | 4184 -3% | 8874 106% | 8380 94% | 8830 105% | 8620 100% |
| Copy ISO MB/s (MB/s) | 2009 | 2414 20% | 2710 35% | 3239 61% | ||
| Copy Program MB/s (MB/s) | 1099 | 1030 -6% | 1114 1% | 899 -18% | ||
| Copy Game MB/s (MB/s) | 1881 | 1991 6% | 2095 11% | 2171 15% | ||
| CrystalDiskMark 5.2 / 6 | -16% | 38% | 41% | 39% | 42% | |
| Write 4K (MB/s) | 159.2 | 93.1 -42% | 233.5 47% | 244.2 53% | 230.7 45% | 230.4 45% |
| Read 4K (MB/s) | 51.9 | 46.79 -10% | 90.1 74% | 89.8 73% | 87.9 69% | 91.6 76% |
| Write Seq (MB/s) | 3115 | 2853 -8% | 4263 37% | 4300 38% | 4216 35% | |
| Read Seq (MB/s) | 3298 | 2556 -22% | 4468 35% | 4392 33% | 4543 38% | |
| Write 4K Q32T1 (MB/s) | 392.6 | 475 21% | 538 37% | 607 55% | 582 48% | 667 70% |
| Read 4K Q32T1 (MB/s) | 474.7 | 529 11% | 703 48% | 658 39% | 730 54% | 728 53% |
| Write Seq Q32T1 (MB/s) | 4331 | 3331 -23% | 5097 18% | 5270 22% | 5152 19% | 5043 16% |
| Read Seq Q32T1 (MB/s) | 6746 | 3319 -51% | 7065 5% | 7091 5% | 7094 5% | 6821 1% |
| Write 4K Q8T8 (MB/s) | 2270 | |||||
| Read 4K Q8T8 (MB/s) | 2490 | |||||
| Durchschnitt gesamt (Programm / Settings) | -14% /
-13% | 45% /
47% | 54% /
59% | 54% /
55% | 54% /
56% |
* ... kleinere Werte sind besser

Dauerleistung Lesen: DiskSpd Read Loop, Queue Depth 8
GPU-Leistung - Nur minimal über dem Durchschnitt
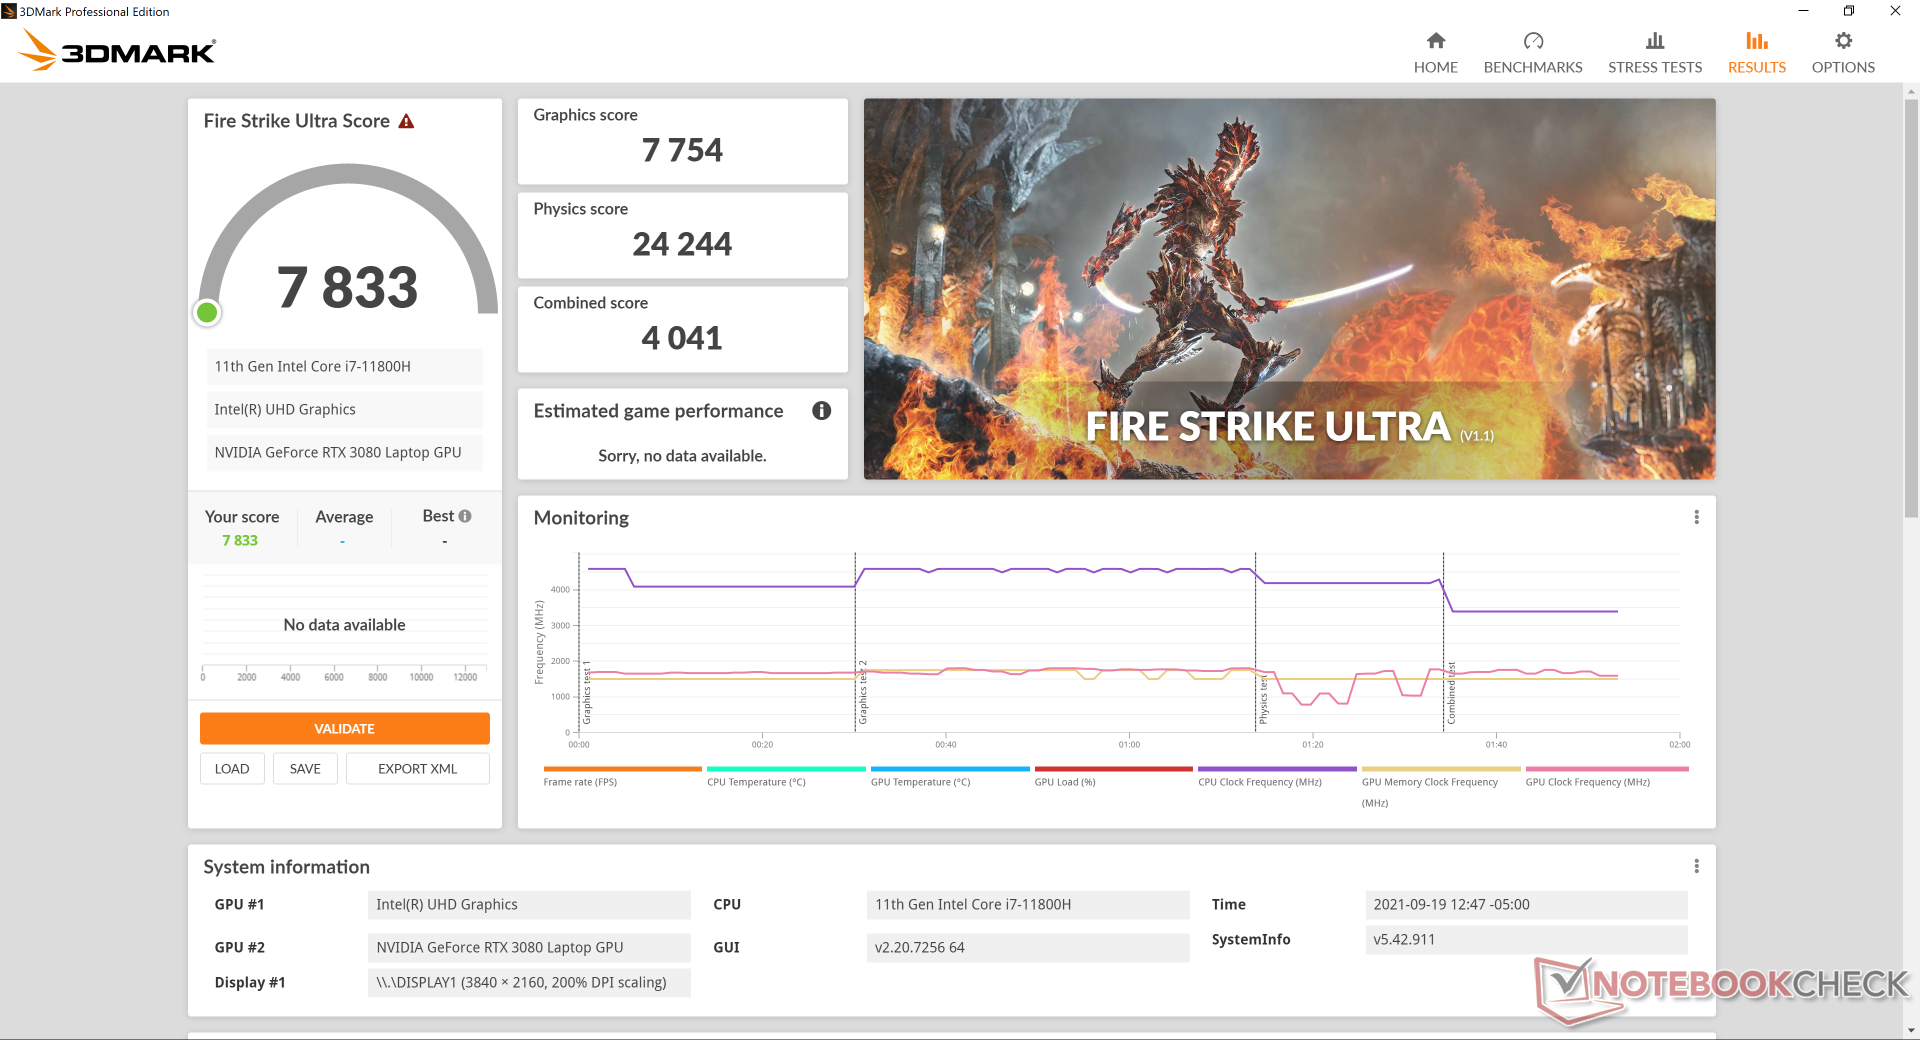
Trotz der RTX 3080 mit 165 Watt liegt die Leistung nur 2-9% vor den durchschnittlichen Werten für Laptops mit der RTX 3080 in unserer Datenbank, da die extrem hohen TGP-Werte keinen großen Vorteil bieten. Der kleine Vorsprung zeigt sich auch beim Spielen, da die Ergebnisse hier ebenfalls nur einige Prozentpunkte über dem Durchschnitt liegen. Größer wird die Differenz, wenn wir das Alienware mit der 90-Watt-Version der RTX 3080 im MSI GS76 vergleichen, denn nun ist das x17 R1 je nach Titel zwischen 15-30% schneller. Ein Desktop-PC mit der RTX-3080-GPU ist aber weiterhin rund 40-45% schneller als jeder Laptop mit einer RTX 3080.
Bei unserem Witcher-3-Langzeittest sehen wir stabile FPS-Ergebnisse ohne Einbrüche, im Gegensatz zu einigen älteren Alienware-m15-Modellen scheint es hier also keine Probleme mit Hintergrundaktivitäten zu geben.
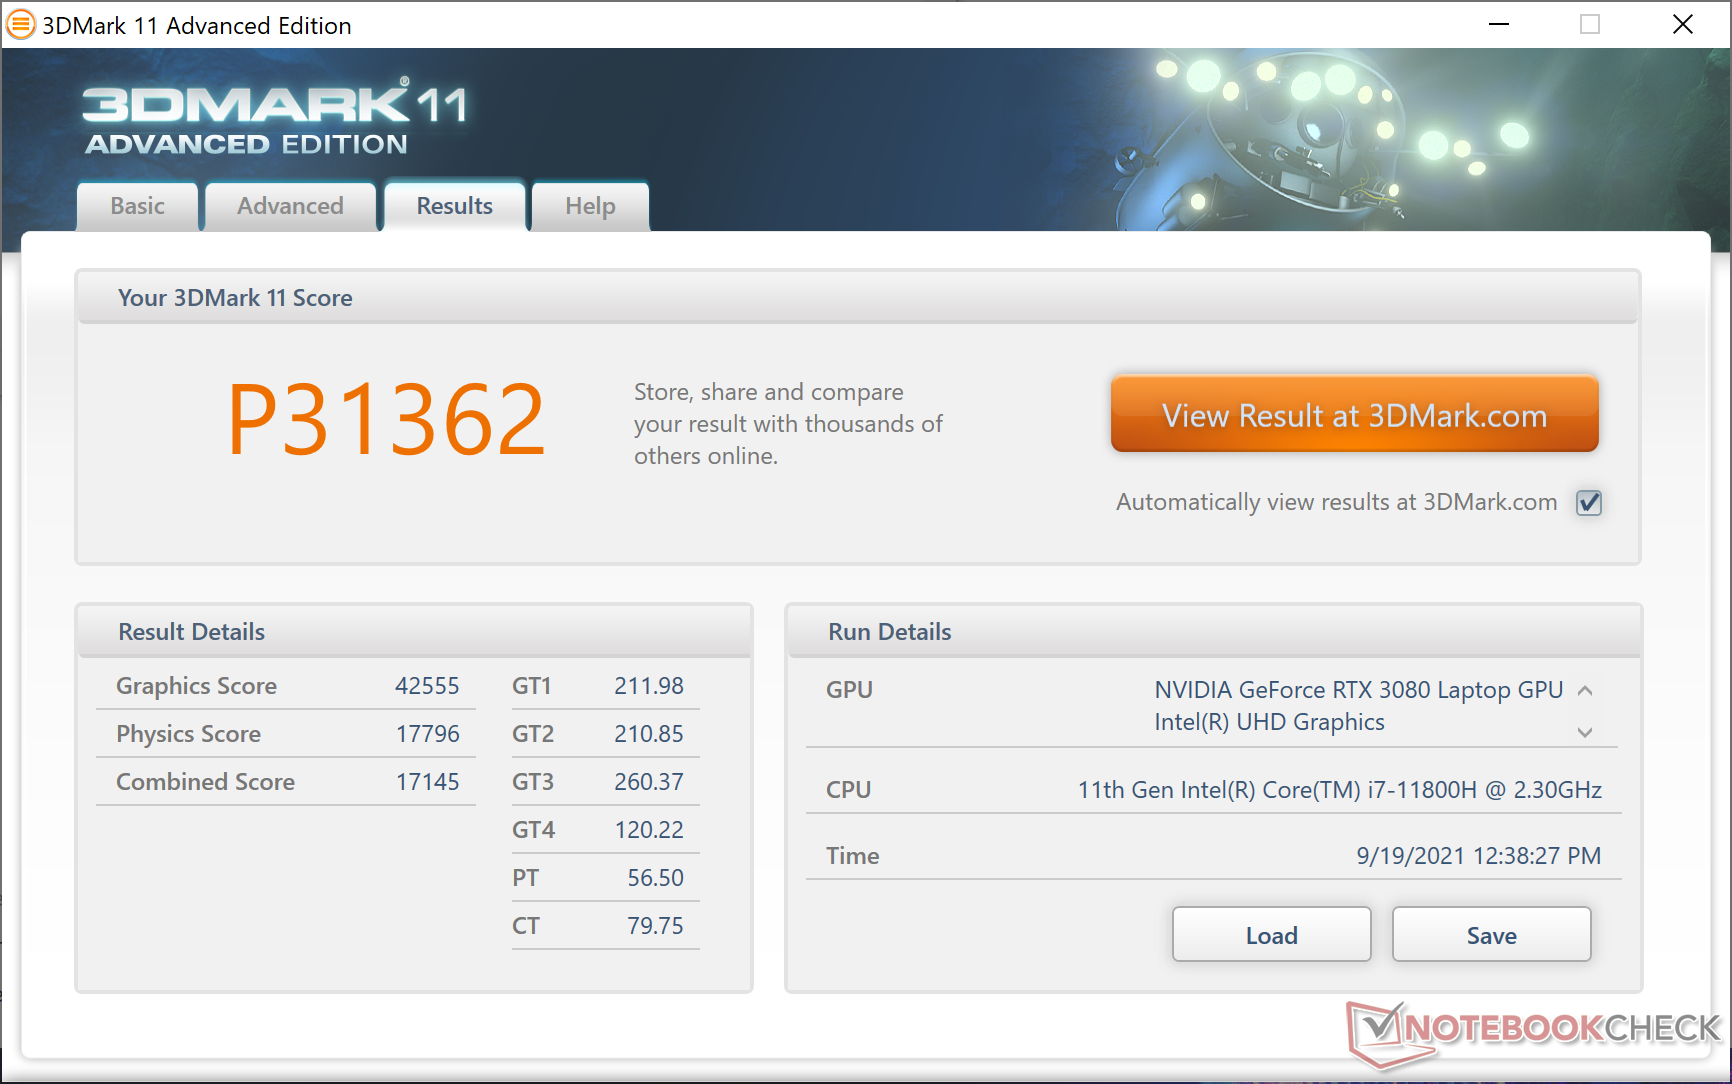
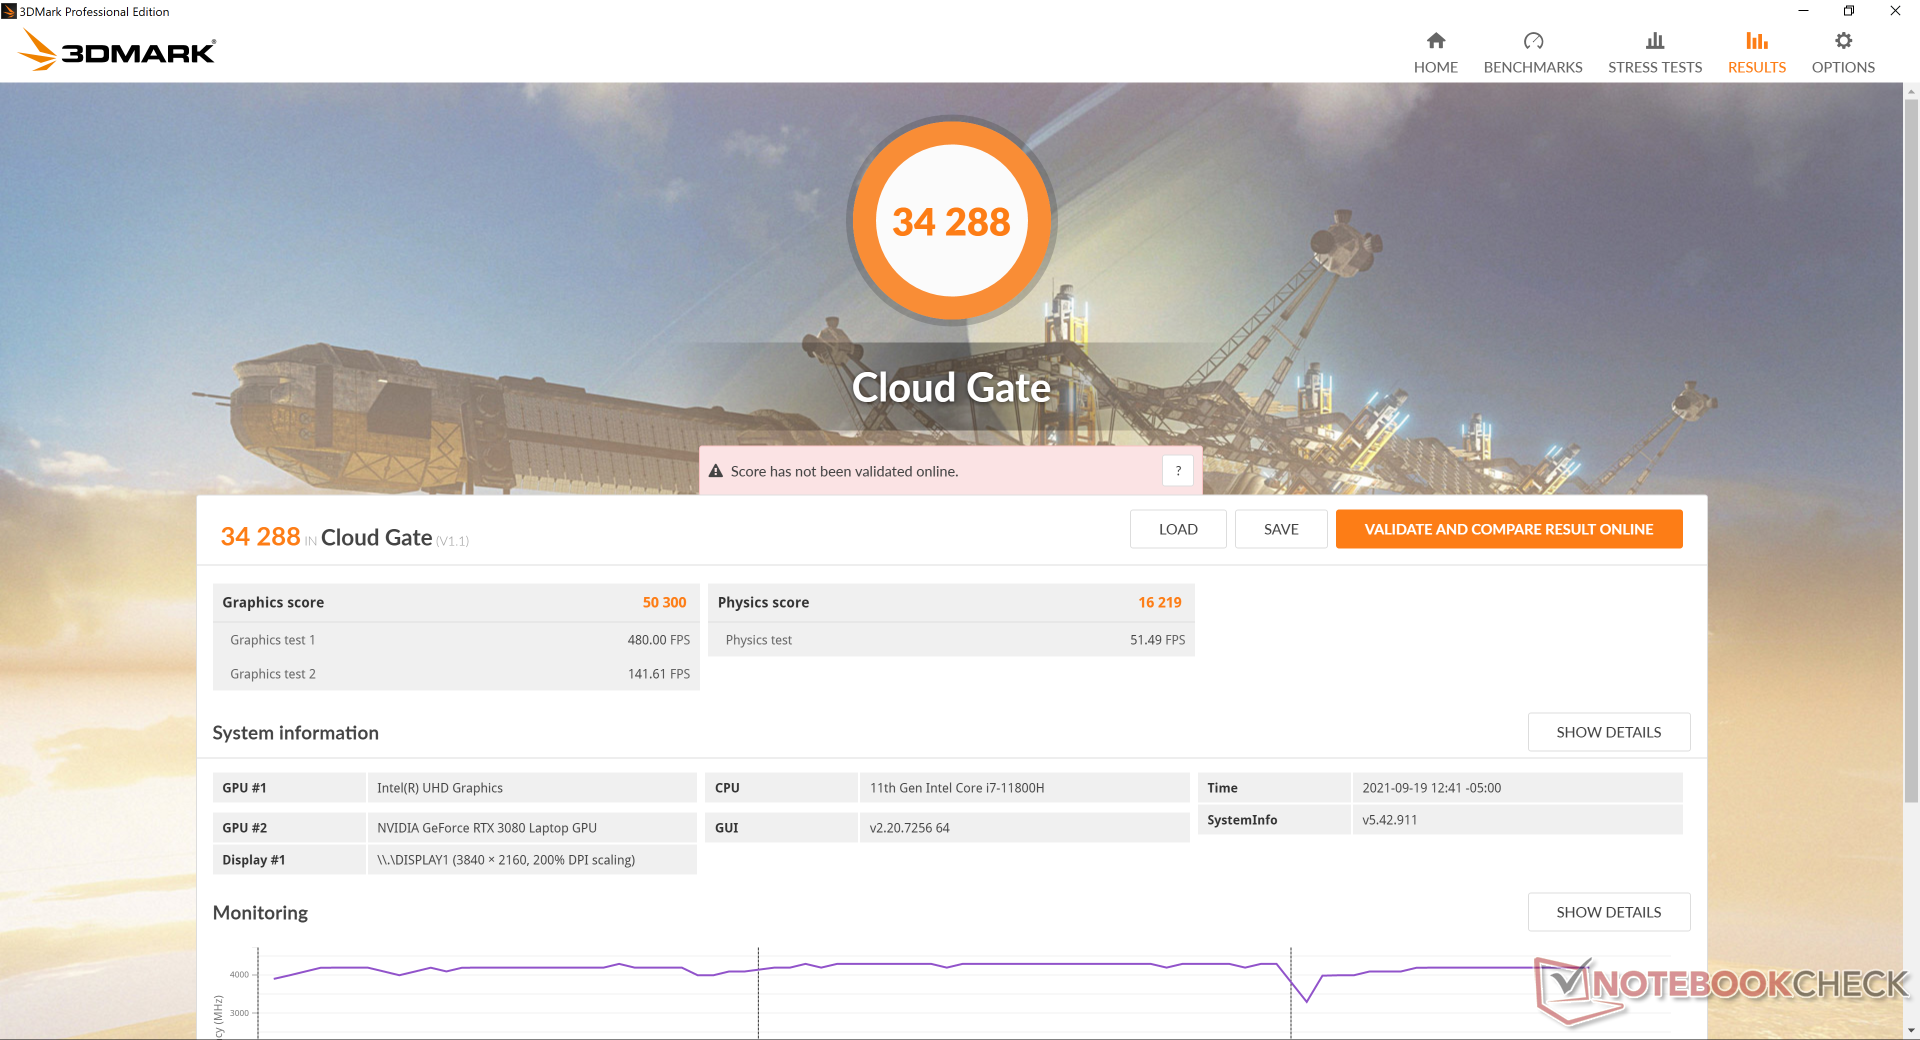
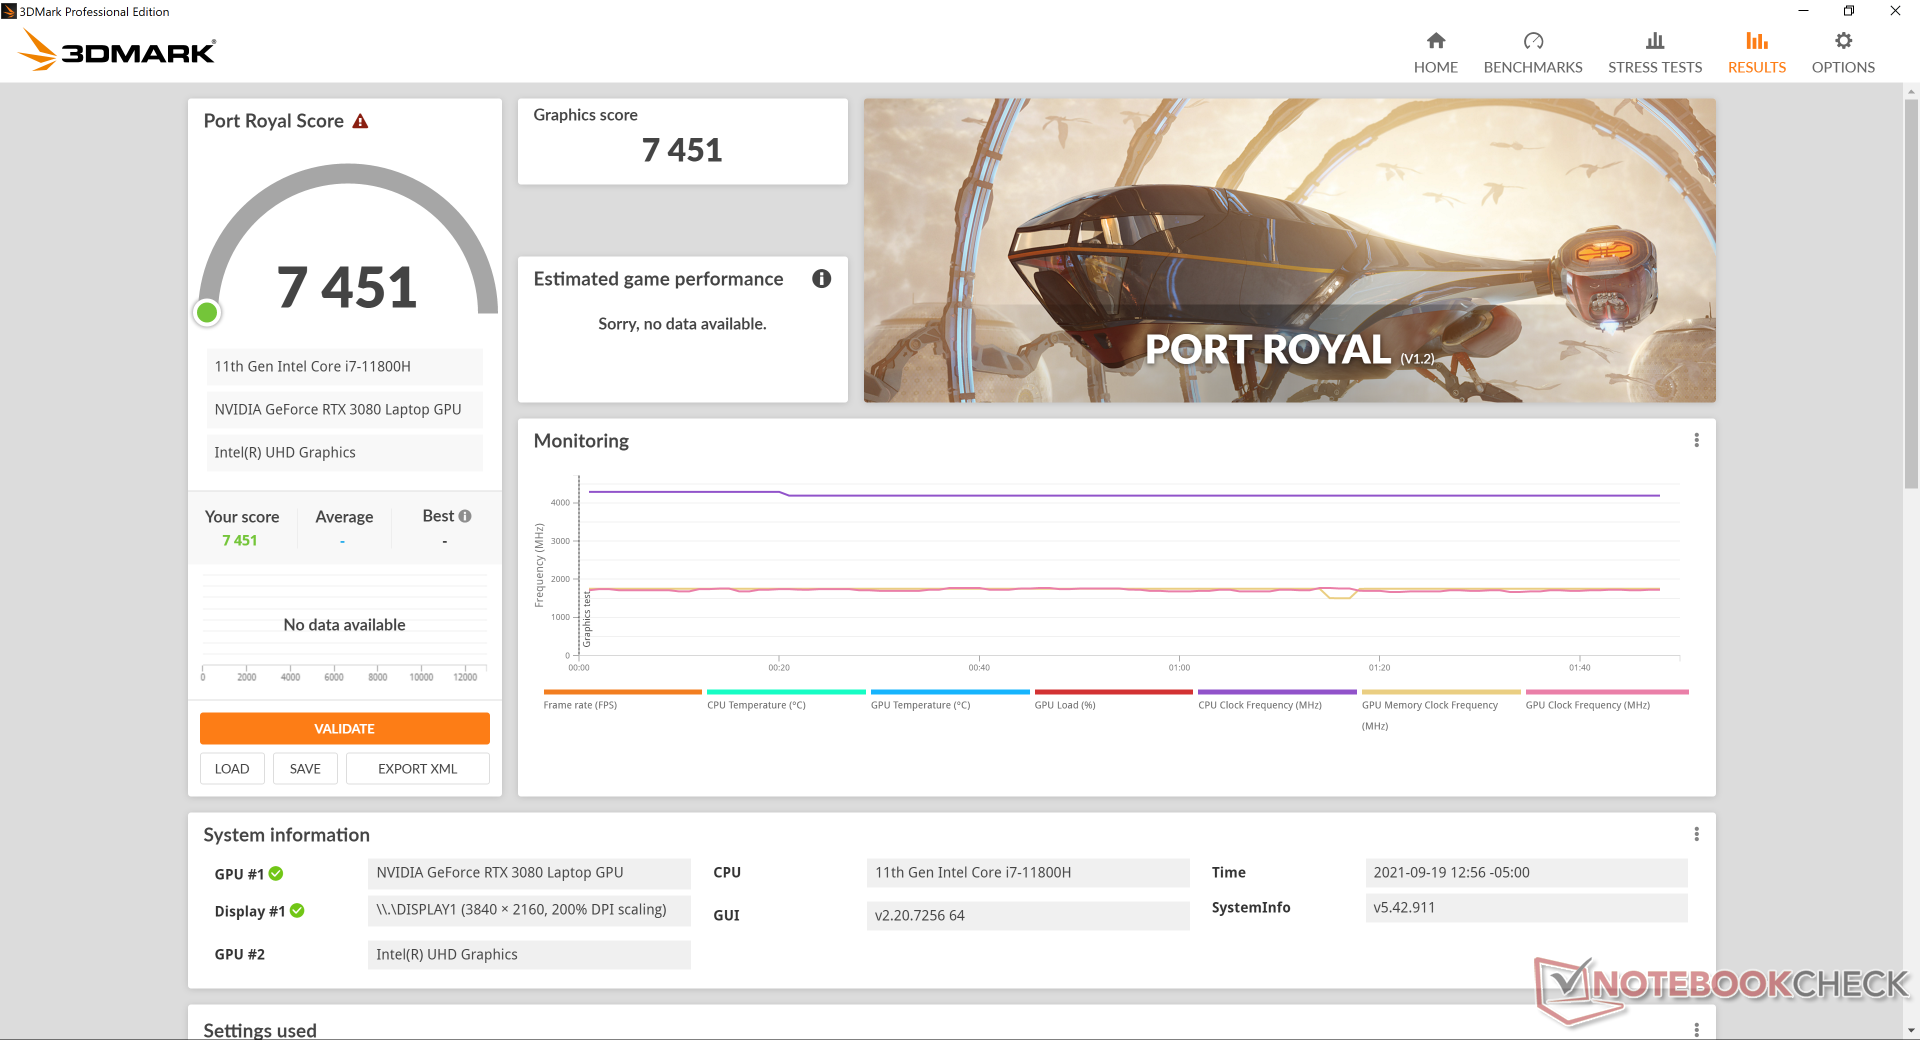
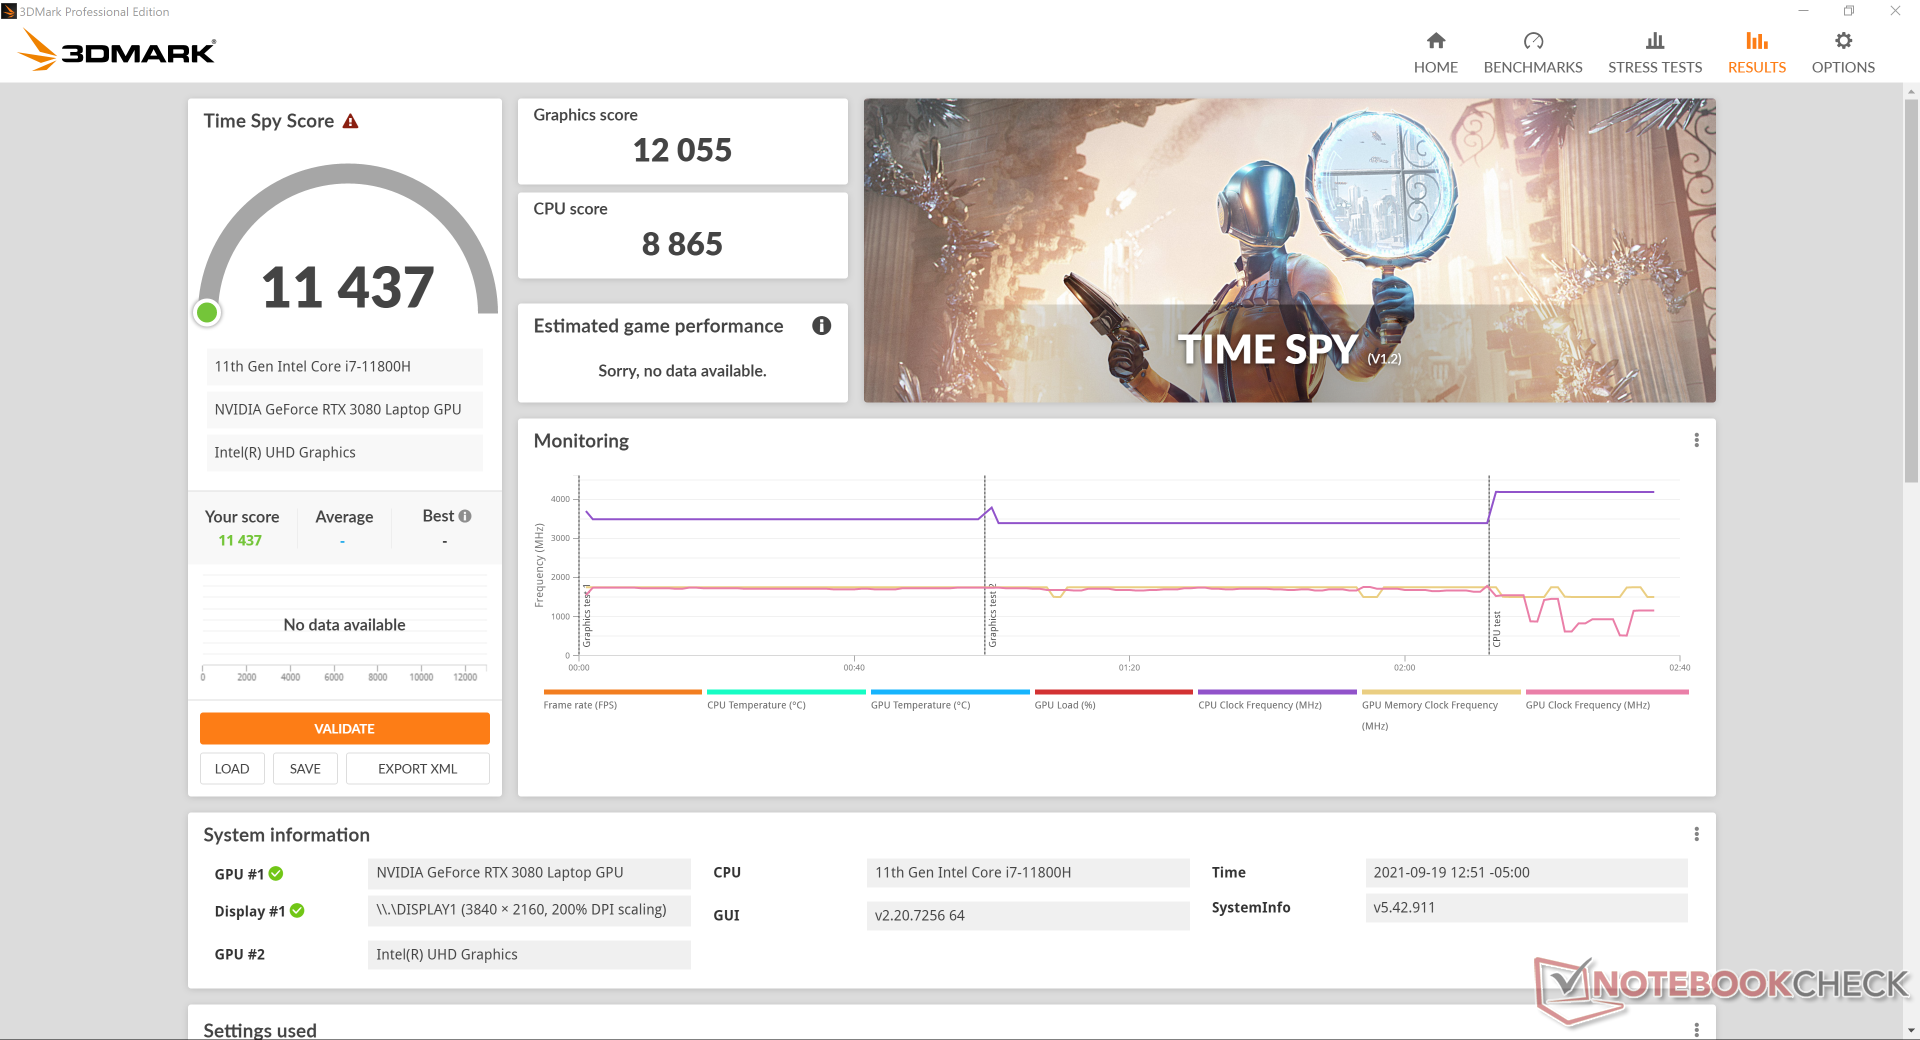
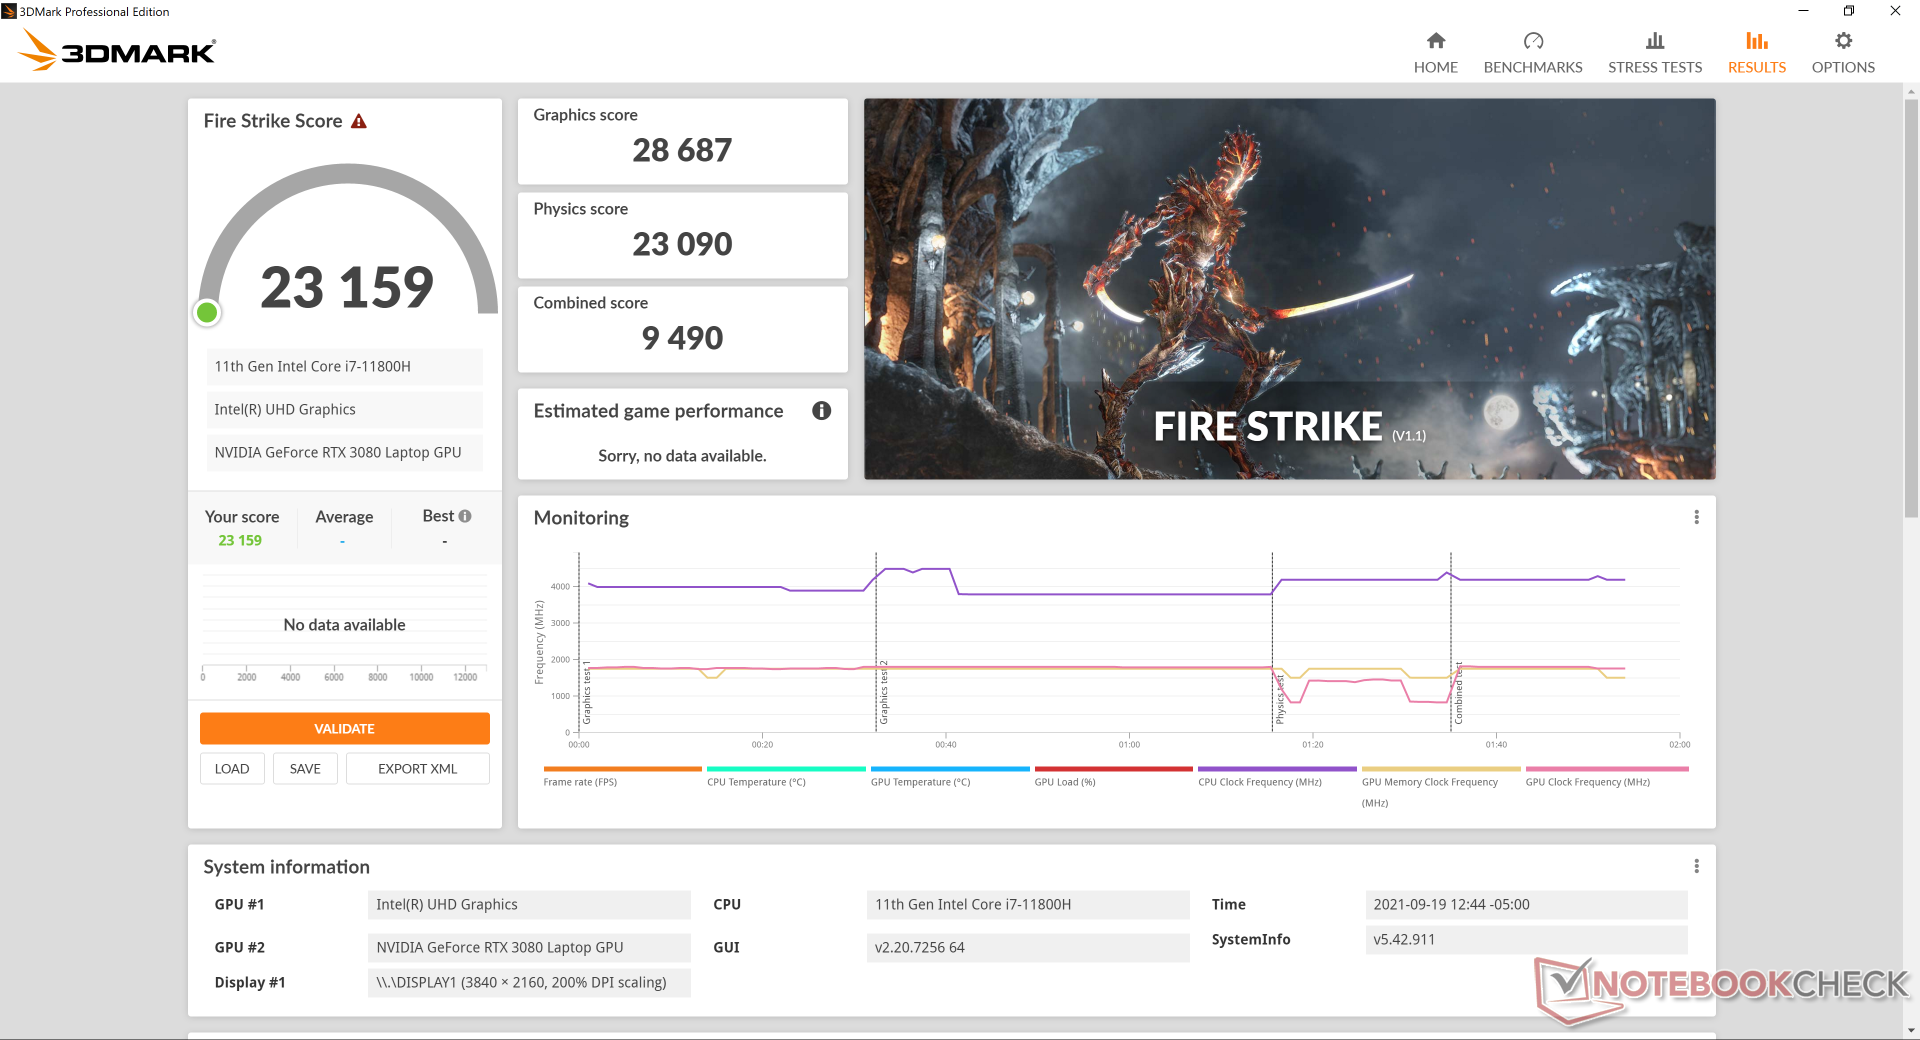
| 3DMark 11 Performance | 31362 Punkte | |
| 3DMark Cloud Gate Standard Score | 34288 Punkte | |
| 3DMark Fire Strike Score | 23159 Punkte | |
| 3DMark Time Spy Score | 11437 Punkte | |
Hilfe | ||
Witcher 3 FPS Chart
| min. | mittel | hoch | max. | QHD | 4K | |
|---|---|---|---|---|---|---|
| GTA V (2015) | 183 | 176 | 163 | 98.1 | 89.2 | 98.1 |
| The Witcher 3 (2015) | 370.2 | 294 | 192 | 105.2 | 80.2 | |
| Dota 2 Reborn (2015) | 164 | 148 | 143 | 135 | 111 | |
| Final Fantasy XV Benchmark (2018) | 181 | 134 | 106 | 81.8 | 50.8 | |
| X-Plane 11.11 (2018) | 118 | 99.3 | 79.7 | 56.9 | ||
| Far Cry 5 (2018) | 144 | 125 | 120 | 112 | 98 | 63 |
| Strange Brigade (2018) | 456 | 269 | 225 | 199 | 152 | 91.6 |
Emissionen - x17 R1 wird warm und laut
Geräuschemissionen - Vapor Chamber + Gallium-Silikon Wärmeleitmaterial
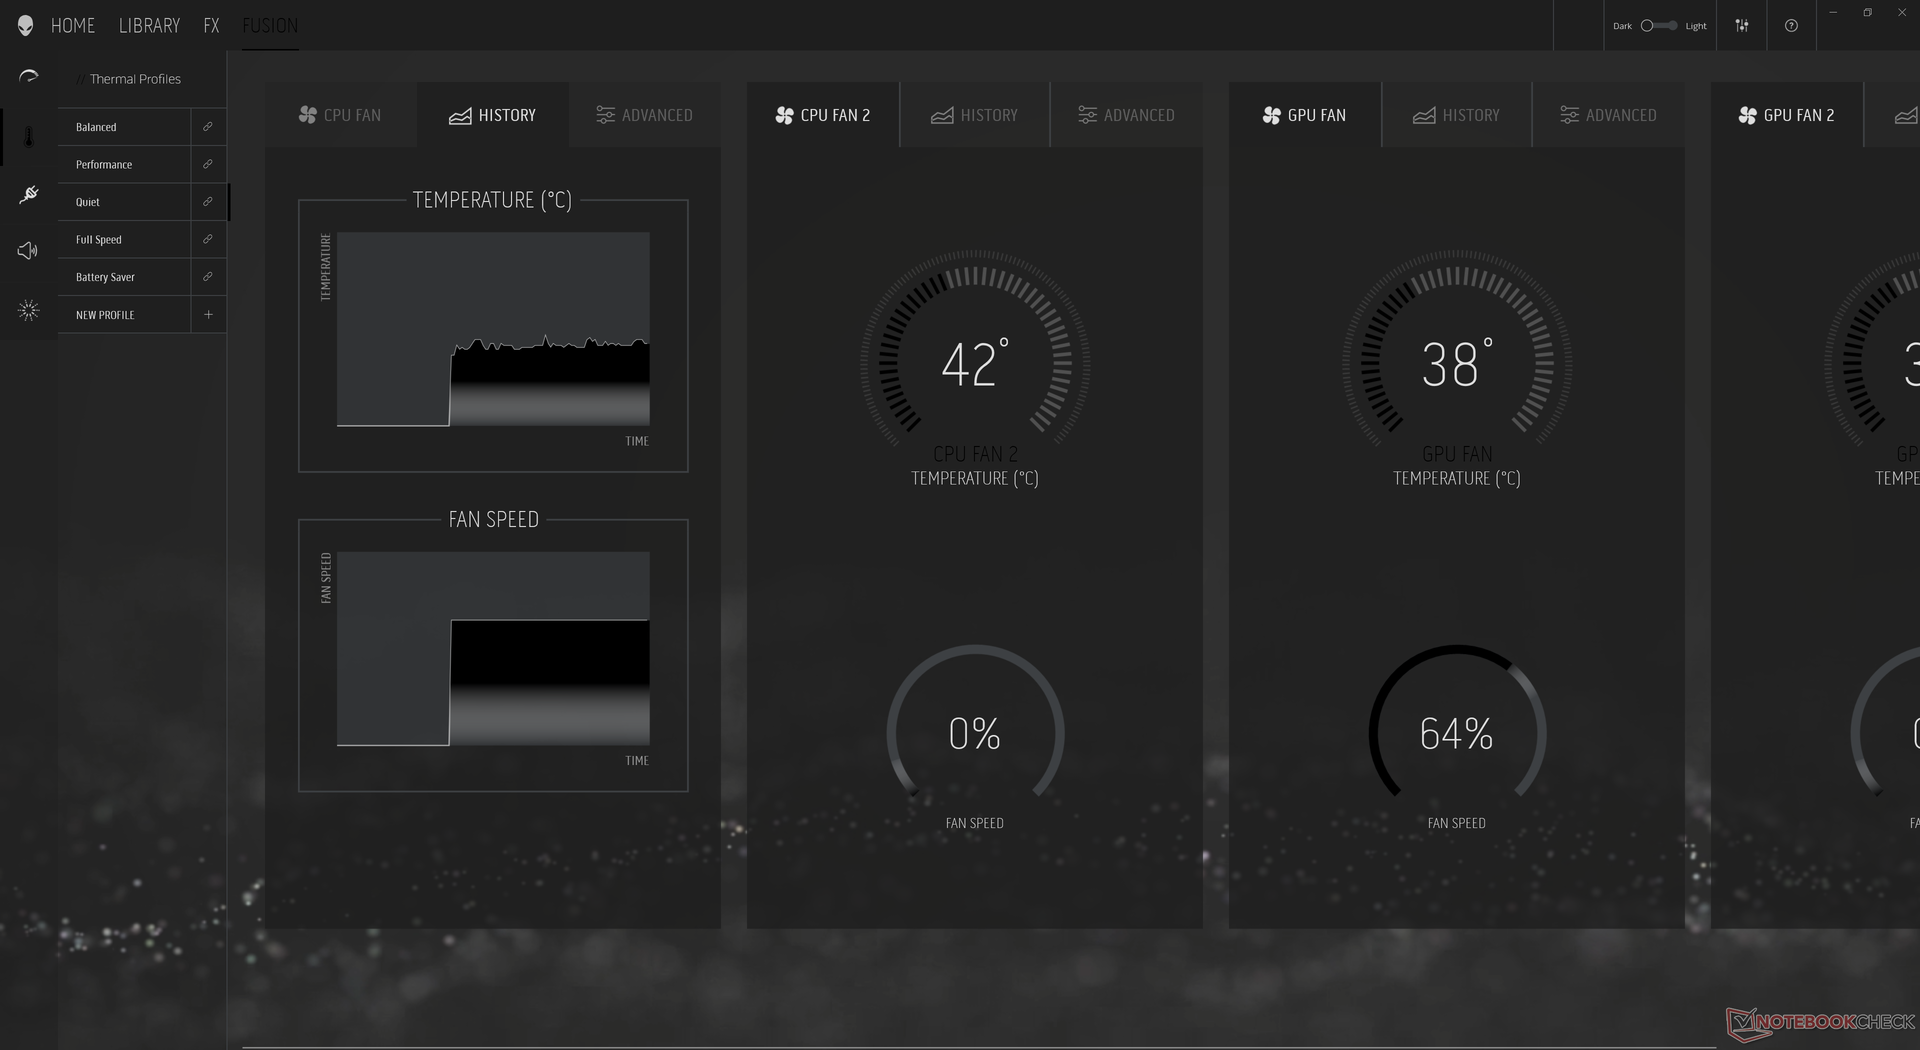
Die Lüftergeräusche hängen maßgeblich von den Leistungseinstellungen in Alienwares Command Center ab (Leise, Leistung, Höchstleistung). Obwohl es doppelt so viele Lüfter gibt wie bei den meisten anderen Gaming-Laptops, bleibt das Alienware x17 R1 bei anspruchslosen Aufgaben (Surfen im Internet, Video-Streaming) in der Regel sehr ruhig, selbst im Leistungsmodus. Wir konnten lediglich 31,3 dB(A) während eines 3DMark-06-Durchgangs messen, der etwa 90 Sekunden dauert. Bei längerer Last steigt die Lautstärke aber auf 43,8 dB(A), was anderen Gaming-Laptops entspricht.
Bei Witcher 3 im Leistungsmodus ermitteln wir ein konstantes Lüftergeräusch von 49,7 dB(A). Interessanterweise bleibt das Geräusch auch kontant, wenn man das System in Ausgeglichen-Modus betreibt. Daher sollte man stets den Leistungsmodus nutzen, damit man von der höchsten Leistung profitiert. Wenn man den Höchstleistungsmodus der Lüfter nutzt, muss man mit 55 dB(A) rechnen, unabhängig von der Auslastung des Systems. Insgesamt bleibt das Alienware x17 R1 bei geringer Last leiser als das Gigabyte Aero 17 oder das alte m17 R4, aber bei hoher Last sind die Kontrahenten alle auf einem vergleichbaren Level.
| Alienware x17 RTX 3080 P48E GeForce RTX 3080 Laptop GPU, i7-11800H, 2x WDC PC SN730 SDBPNTY-1T00 (RAID 0) | Alienware m17 R4 GeForce RTX 3080 Laptop GPU, i9-10980HK, 2x Micron 2300 512 GB (RAID 0) | Razer Blade 17 RTX 3070 GeForce RTX 3070 Laptop GPU, i7-11800H, Samsung PM9A1 MZVL21T0HCLR | Asus ROG Zephyrus S17 GX703HSD GeForce RTX 3080 Laptop GPU, i9-11900H, Samsung PM9A1 MZVL22T0HBLB | MSI GS76 Stealth 11UH GeForce RTX 3080 Laptop GPU, i9-11900H, Samsung PM9A1 MZVL22T0HBLB | Gigabyte Aero 17 HDR YD GeForce RTX 3080 Laptop GPU, i9-11980HK, Samsung PM9A1 MZVL2512HCJQ | |
|---|---|---|---|---|---|---|
| Geräuschentwicklung | -6% | -3% | 4% | -10% | -20% | |
| aus / Umgebung * (dB) | 24.9 | 24 4% | 24.2 3% | 23 8% | 24 4% | 25 -0% |
| Idle min * (dB) | 24.9 | 24 4% | 24.7 1% | 23 8% | 24 4% | 30 -20% |
| Idle avg * (dB) | 24.9 | 25 -0% | 24.7 1% | 23 8% | 25 -0% | 32 -29% |
| Idle max * (dB) | 29.6 | 36 -22% | 24.7 17% | 23 22% | 42 -42% | 41 -39% |
| Last avg * (dB) | 31.1 | 45 -45% | 44.3 -42% | 41 -32% | 46 -48% | 43 -38% |
| Witcher 3 ultra * (dB) | 49.7 | 47 5% | 56.3 -13% | 45 9% | 48 3% | 51 -3% |
| Last max * (dB) | 54.8 | 50 9% | 47.7 13% | 52 5% | 48 12% | 59 -8% |
* ... kleinere Werte sind besser
Lautstärkediagramm
| Idle |
| 24.9 / 24.9 / 29.6 dB(A) |
| Last |
| 31.1 / 54.8 dB(A) |
 | ||
30 dB leise 40 dB(A) deutlich hörbar 50 dB(A) störend |
||
min: | ||
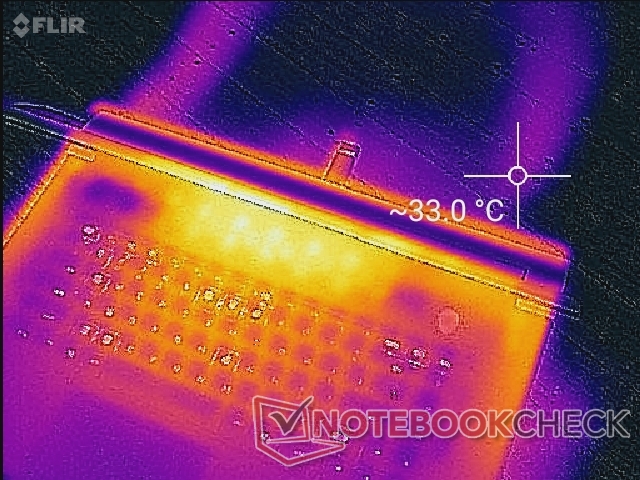
Temperatur
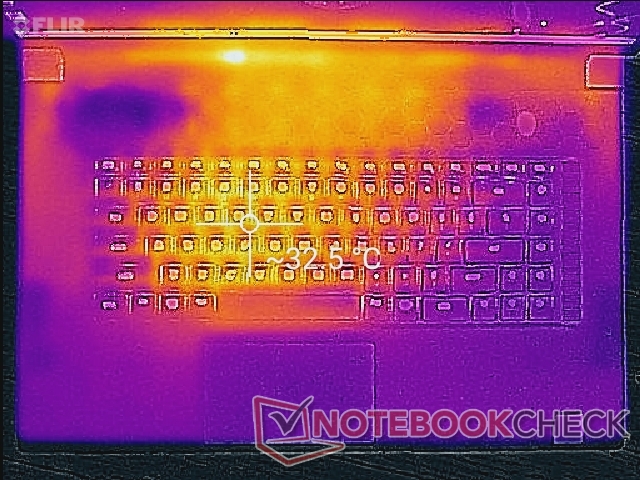
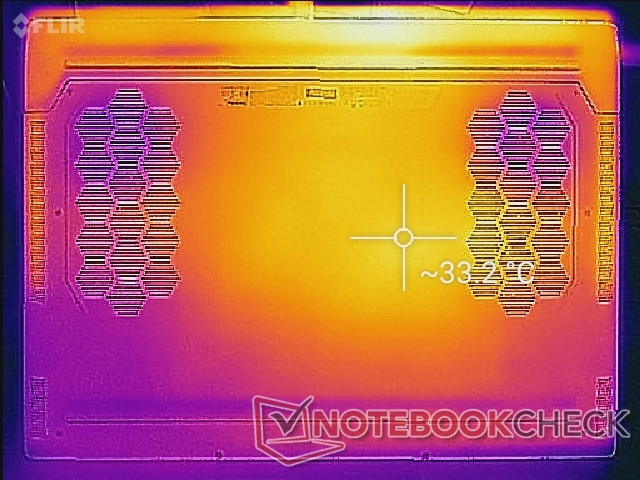
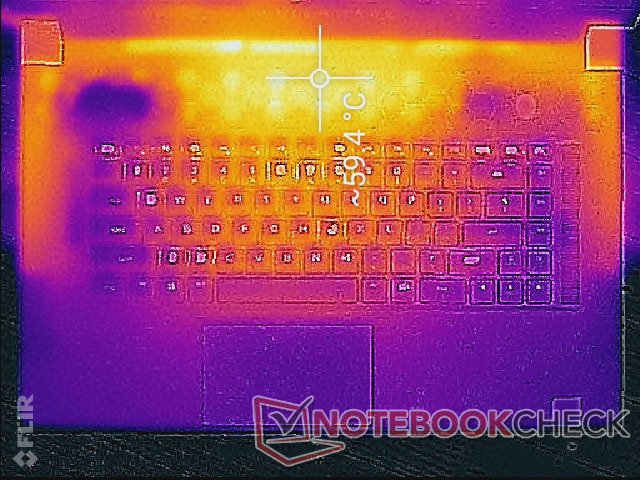
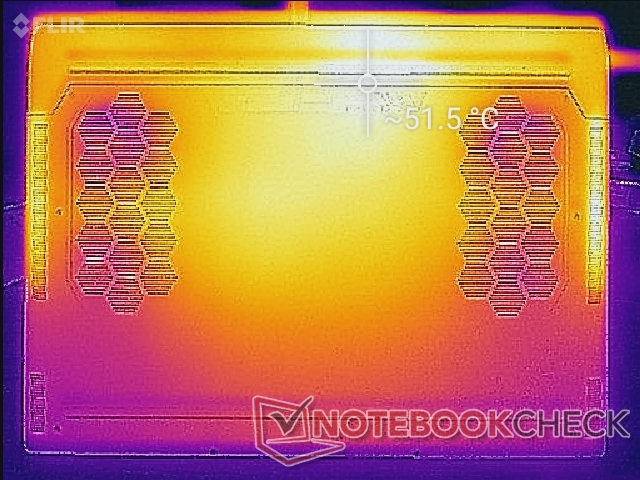
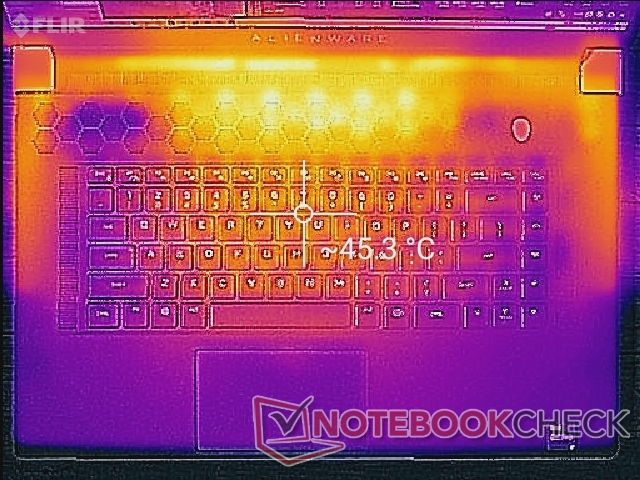
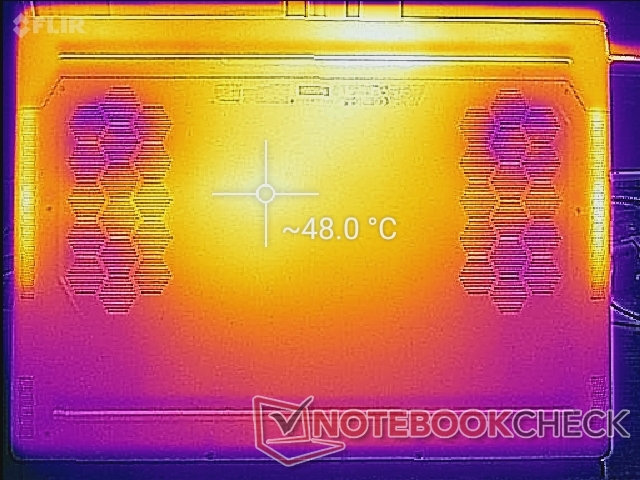
Die Oberflächentemperaturen im Leerlauf bleiben im Bereich der Handballenauflage ziemlich kühl, die Tastatur und die Unterseite erwärmen sich aufgrund der langsam drehenden Lüfter aber auf rund 33 °C. Beim Spielen ermitteln wir Hotspots von 59 °C auf der Ober- bzw. 52 °C auf der Unterseite und 39 °C entlang der Seiten der Tastatur. Diese Hotspots haben in der Regel keinen Hautkontakt und sollten beim Spielen kaum stören, doch man sollte auf keinen Fall die Lüfteröffnungen blockieren.
Insgesamt sind Temperaturen geringer als beim Asus Zephyrus S17, was vermutlich an dem dickeren und größeren Gehäuse des Alienware liegt.
(-) Die maximale Temperatur auf der Oberseite ist 58.4 °C. Im Vergleich liegt der Klassendurchschnitt bei 40.4 °C (von 21.2 bis 68.8 °C für die Klasse Gaming).
(-) Auf der Unterseite messen wir eine maximalen Wert von 49 °C (im Vergleich zum Durchschnitt von 43.2 °C).
(+) Ohne Last messen wir eine durchschnittliche Temperatur von 29.5 °C auf der Oberseite. Der Klassendurchschnitt erreicht 33.9 °C.
(-) Beim längeren Spielen von The Witcher 3 erhitzt sich das Gerät durchschnittlich auf 41.4 °C. Der Durchschnitt der Klasse ist derzeit 33.9 °C.
(+) Die Handballen und der Touchpad-Bereich erreichen maximal 32.4 °C und damit die typische Hauttemperatur und fühlen sich daher nicht heiß an.
(-) Die durchschnittliche Handballen-Temperatur anderer getesteter Geräte war 28.8 °C (-3.6 °C).
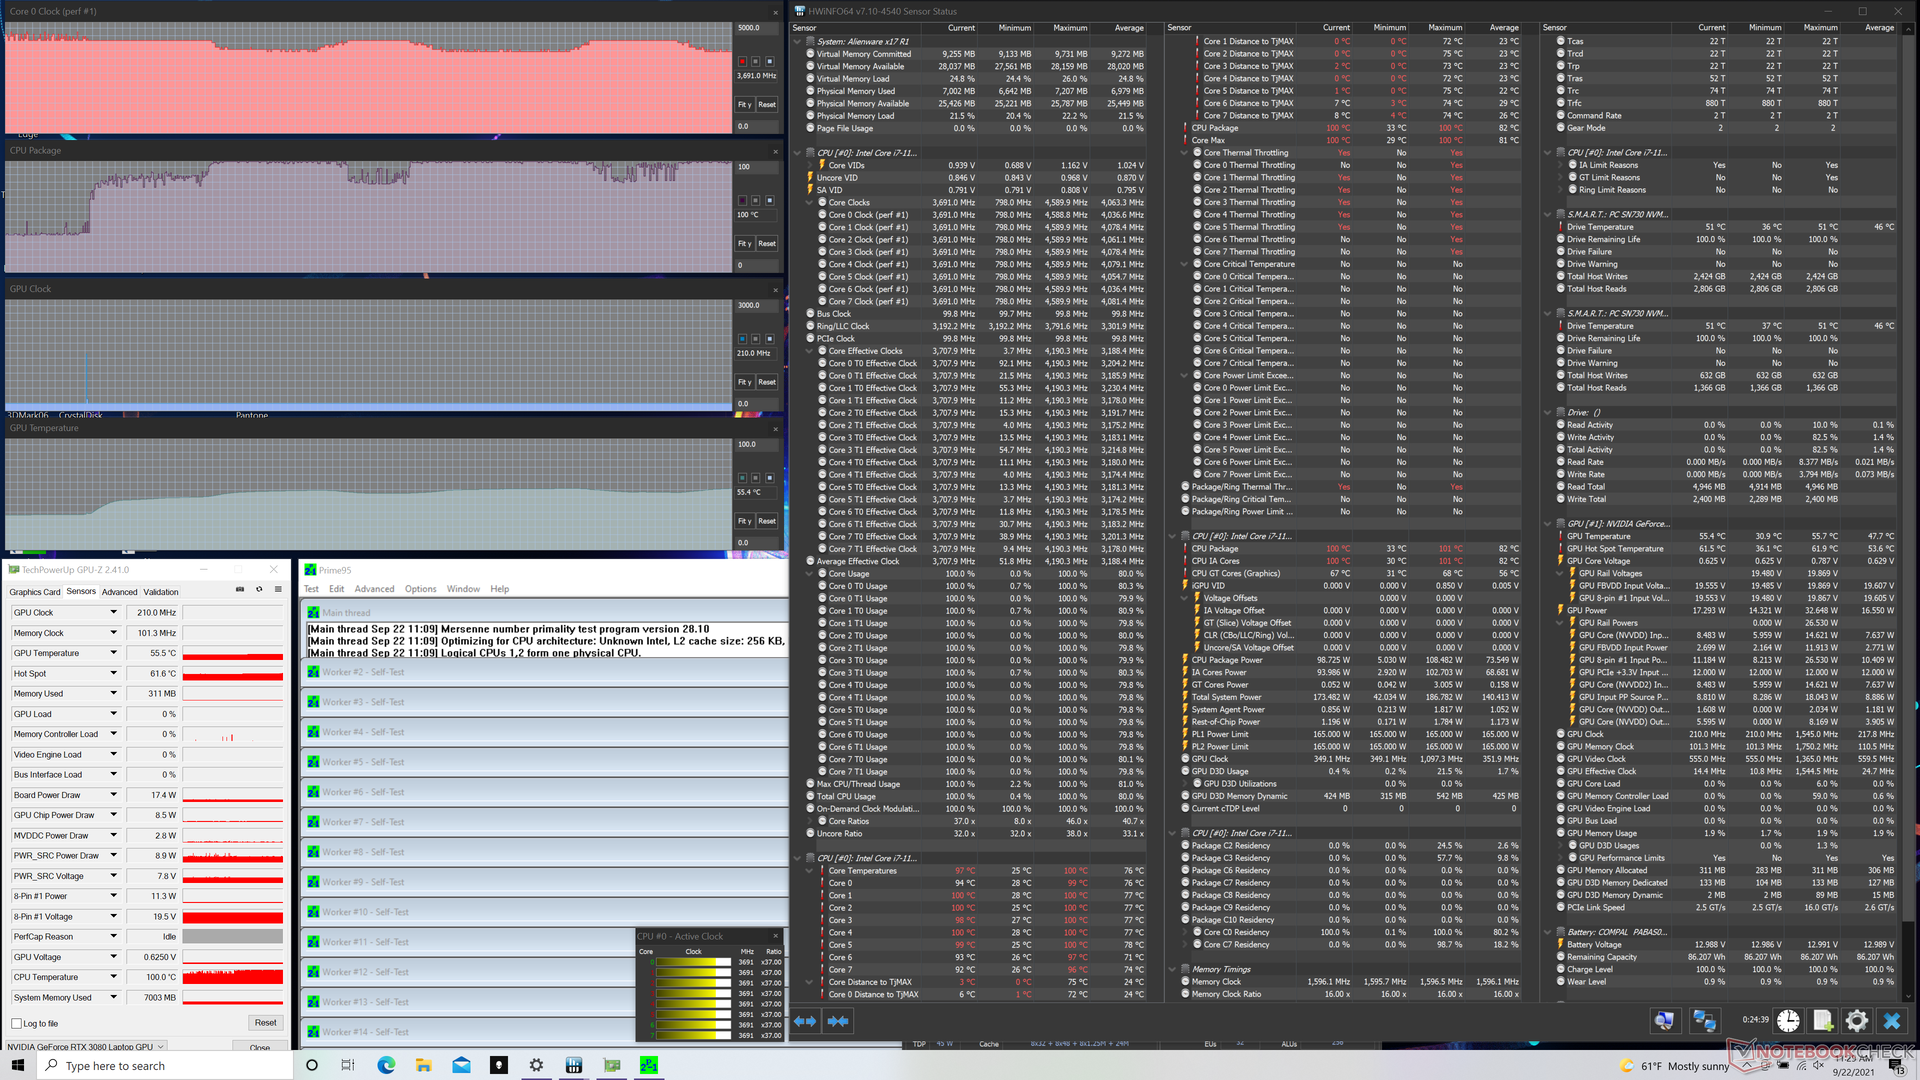
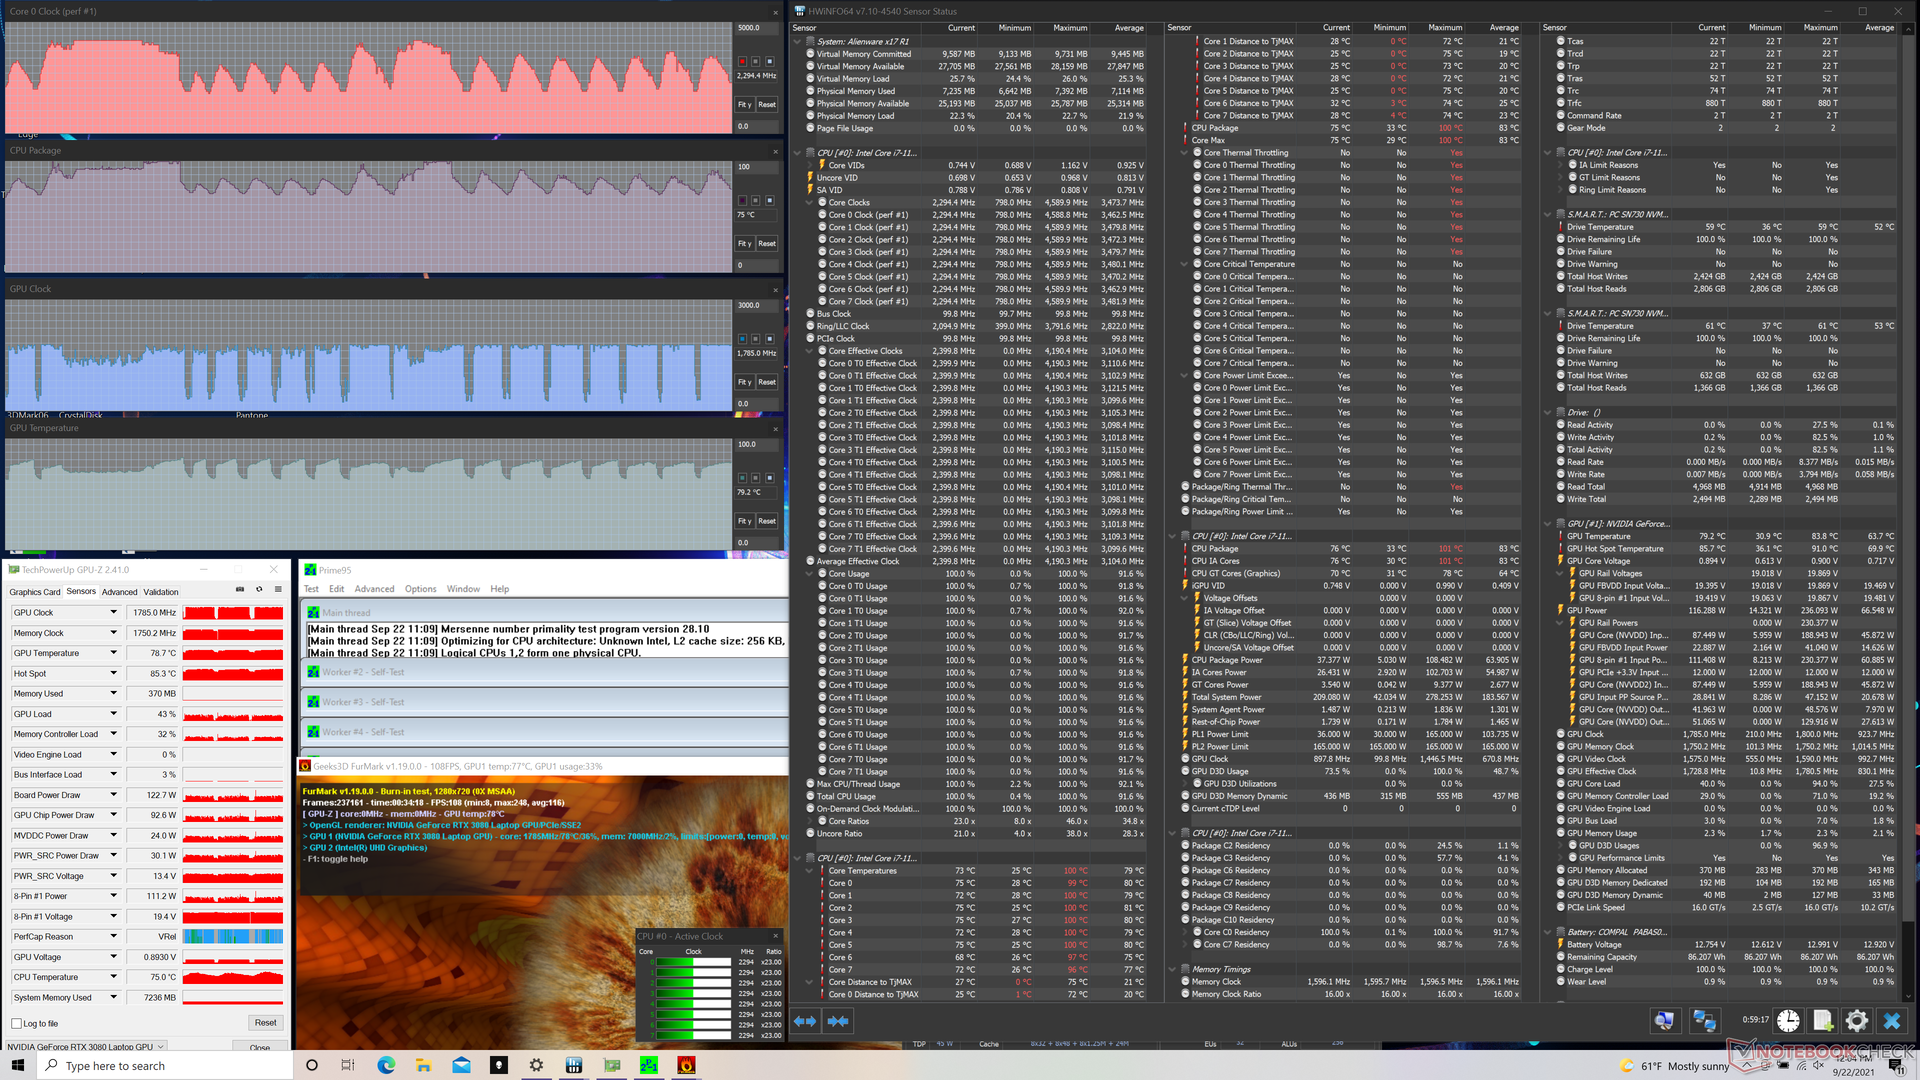
Stresstest
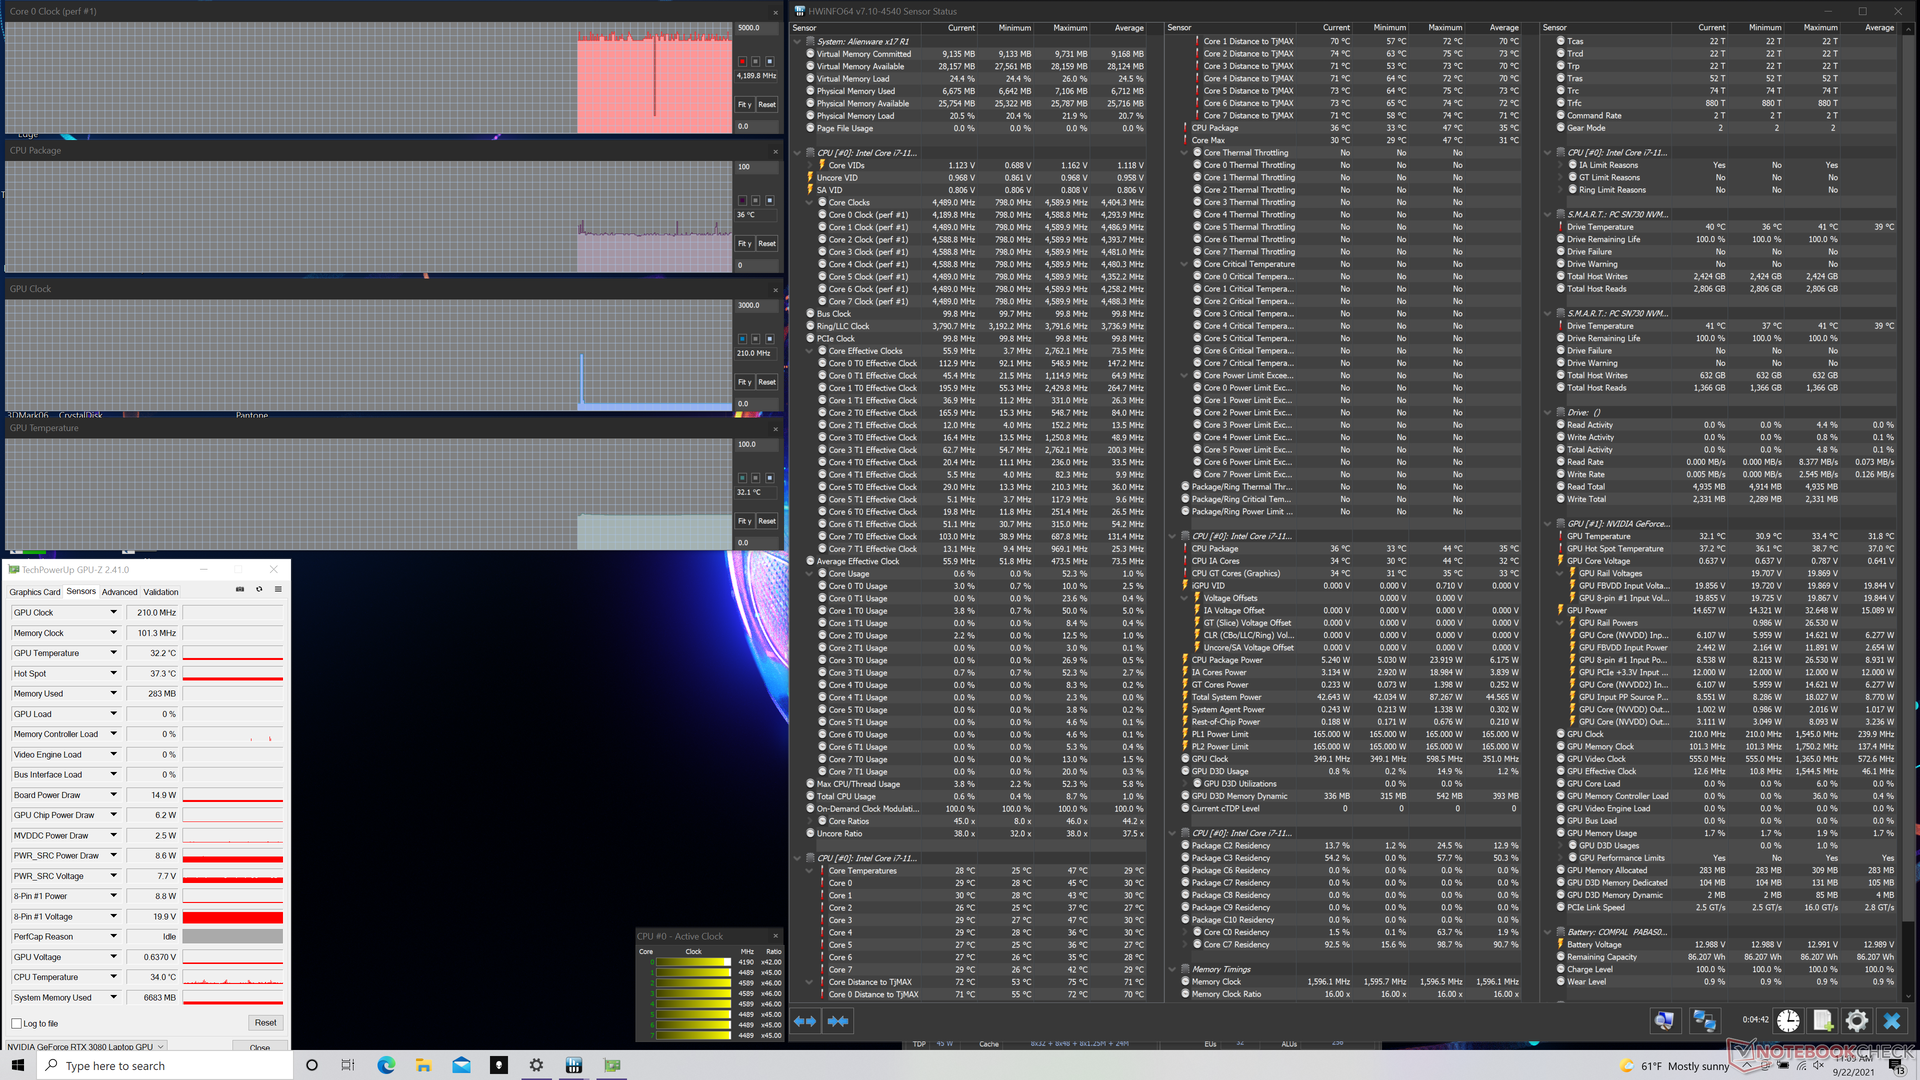
Bei reiner CPU-Last durch Prime95 variieren der CPU-Takt und die Temperatur alle paar Minuten zwischen 3,8-4,2 GHz und 85-100 °C, also auf einem sehr hohen Niveau. Zum Vergleich: Das Razer Blade 17 mit dem gleichen Core i7-11800H pendelt sich im gleichen Test nur bei 2,8 GHz und 78 °C ein. Sowohl der CPU- als auch der GPU-Takt werden bei 100% Auslastung durch Prime95 bzw. FurMark reduziert.
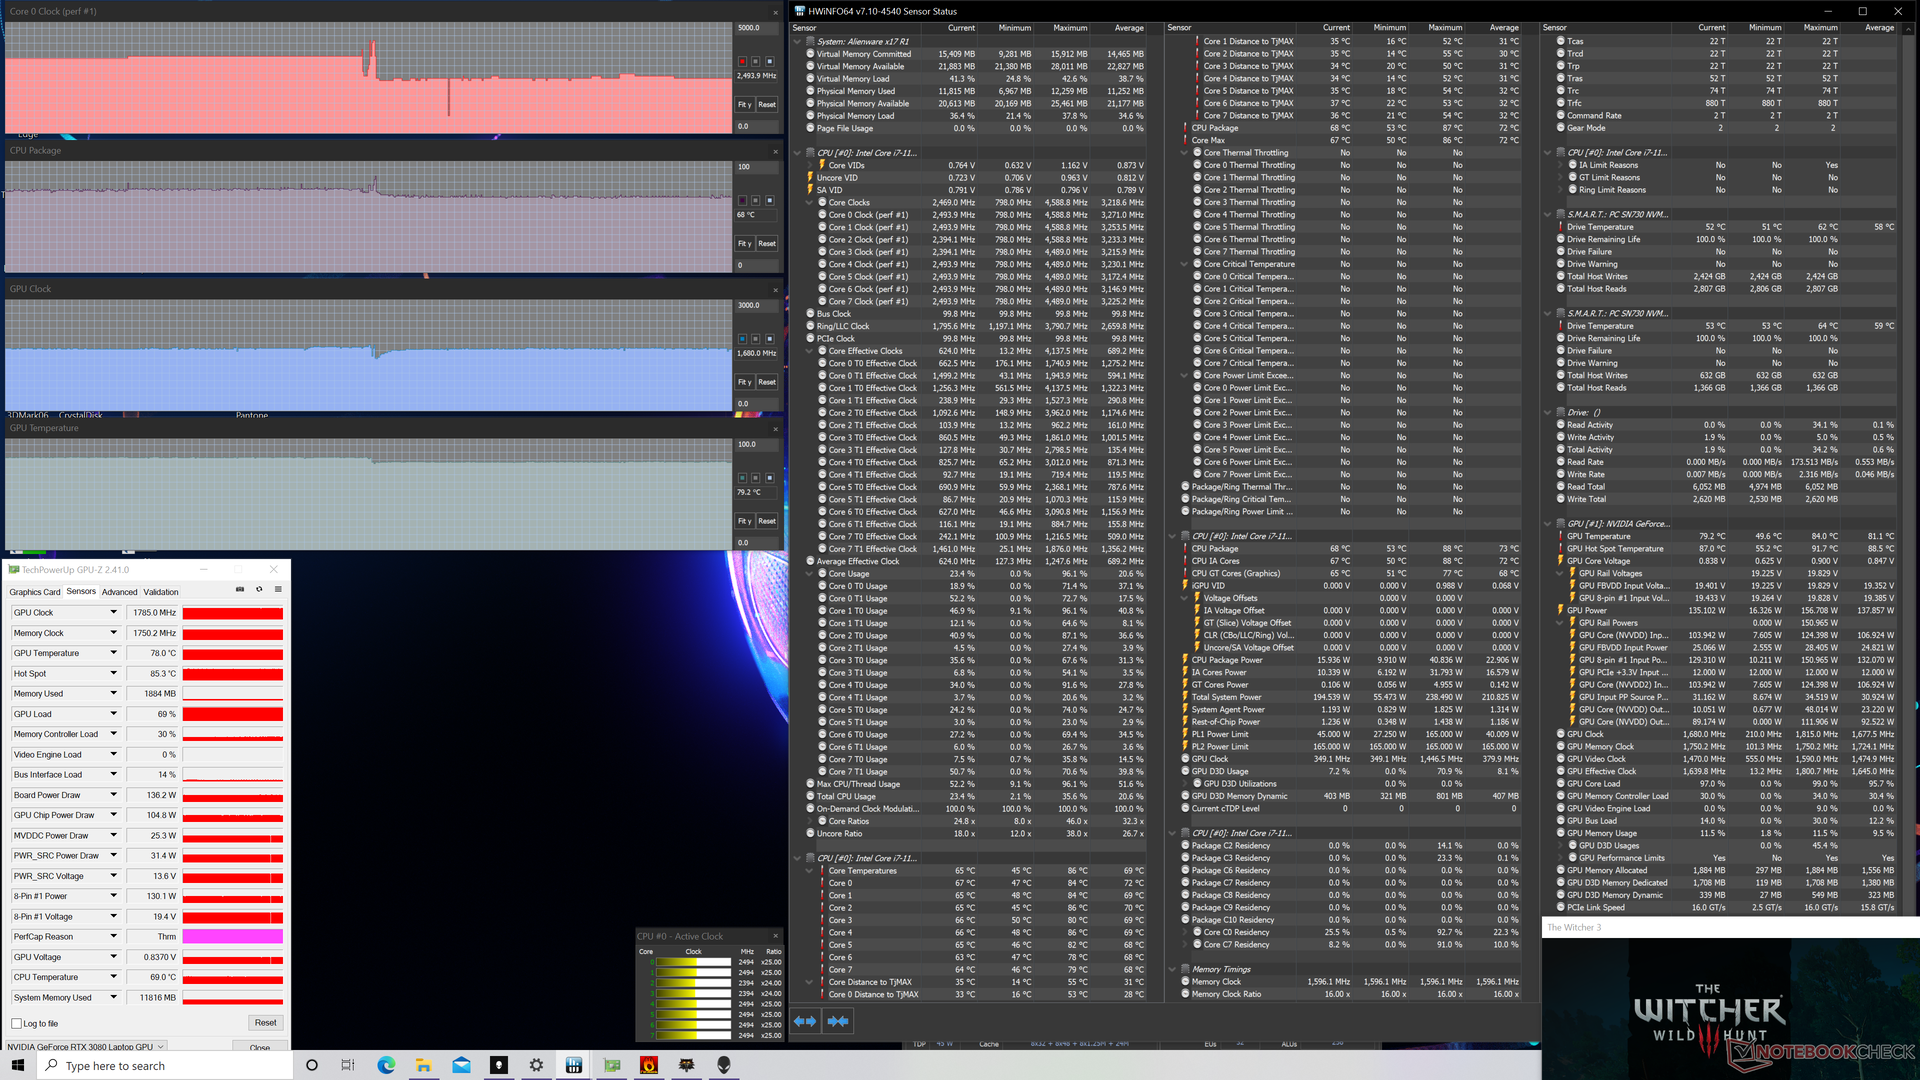
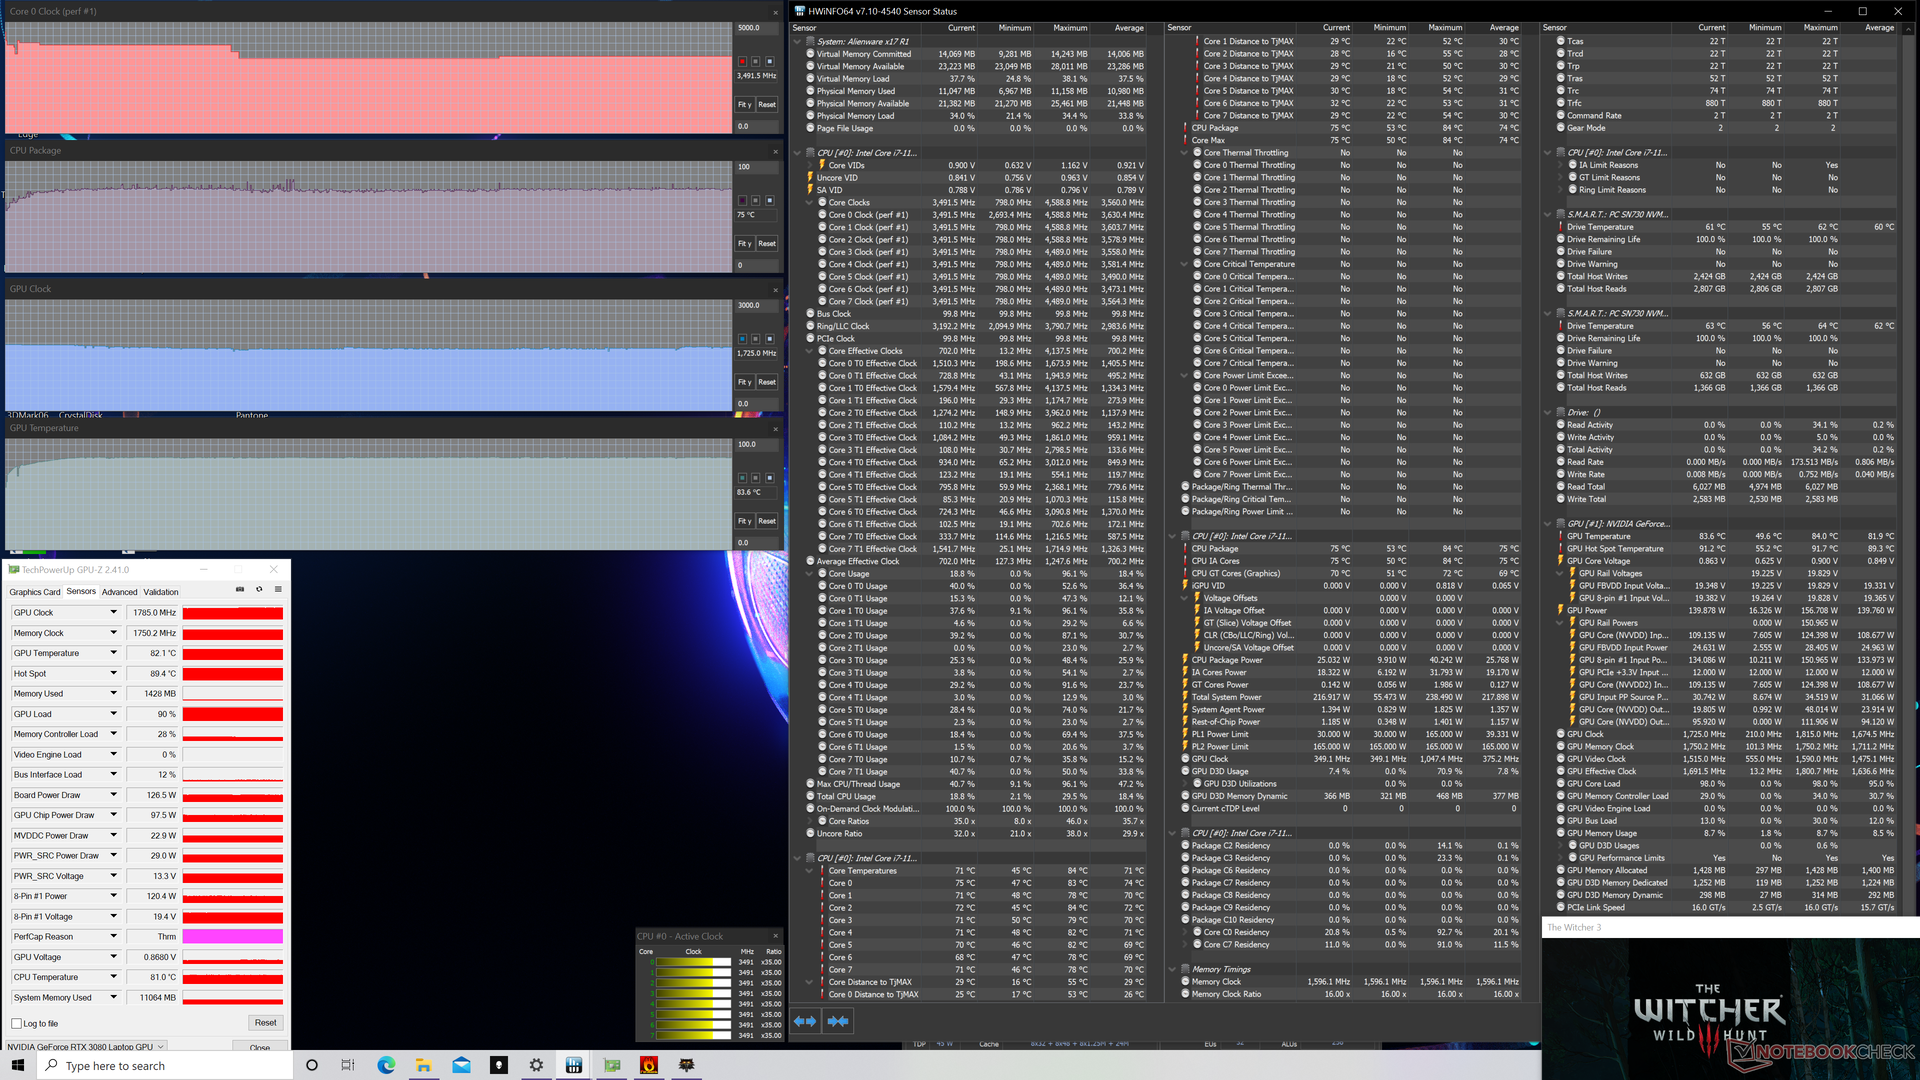
Während der Witcher-3-Schleife im Höchstleistungsmodus arbeiten die CPU und GPU mit 3,5 GHz bzw. 1.785 MHz mit einem konstanten GPU-Stromverbrauch von 145 Watt. Im Ausbalancierten Modus fällt der CPU-Takt auf 2,5 GHz und der GPU-Takt fällt nur minimal auf 1.680 MHz ab (~135 Watt). Wenn man beim Spielen also die maximale Leistung möchte, sollte man auf jeden Fall den Höchstleistungsmodus in der Alienware-Software auswählen. In beiden Modi sind die GPU-Takte aber höher als erwartet und auch höher als bei den meisten anderen Laptops mit der RTX 3080.
Im Akkubetrieb wird die Grafikleistung deutlich reduziert (3DMark Fire Strike Graphics: 13.281 vs. 29.194 Punkte im Netzbetrieb).
| CPU-Takt (GHz) | GPU-Takt (MHz) | Durchschnittliche CPU-Temperatur (°C) | Durchschnittliche GPU-Temperatur (°C) | |
| Leerlauf | -- | -- | 36 | 32 |
| Prime95 (Höchstleistungsmodus) | 3,8 - 4,2 | -- | 85 - 100 | 55 |
| Prime95 + FurMark (Höchstleistungsmodus) | 1,9 - 3,4 | 300 - 1.785 | 71 - 86 | 65 - 79 |
| Witcher 3 (Ausbalanciert) | 2,5 | 1.785 | 68 | 79 |
| Witcher 3 (Höchstleistungsmodus) | 3,5 | 1.785 | 75 | 84 |
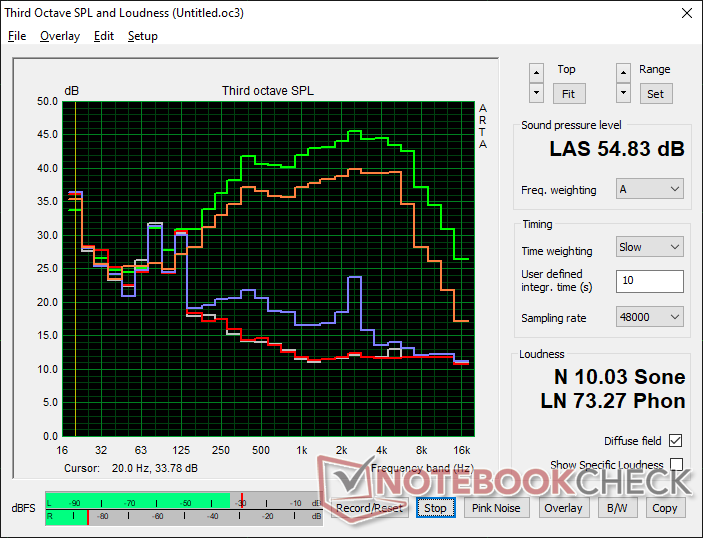
Lautsprecher


Alienware x17 RTX 3080 P48E Audio Analyse
(+) | Die Lautsprecher können relativ laut spielen (88 dB)
Bass 100 - 315 Hz
(-) | kaum Bass - 23% niedriger als der Median
(±) | durchschnittlich lineare Bass-Wiedergabe (9.8% Delta zum Vorgänger)
Mitteltöne 400 - 2000 Hz
(+) | ausgeglichene Mitten, vom Median nur 2.7% abweichend
(+) | lineare Mitten (4% Delta zum Vorgänger)
Hochtöne 2 - 16 kHz
(+) | ausgeglichene Hochtöne, vom Median nur 4.4% abweichend
(±) | durchschnittlich lineare Hochtöne (7% Delta zum Vorgänger)
Gesamt im hörbaren Bereich 100 - 16.000 Hz
(±) | hörbarer Bereich ist durchschnittlich linear (17.3% Abstand zum Median)
Im Vergleich zu allen Geräten derselben Klasse
» 47% aller getesteten Geräte dieser Klasse waren besser, 12% vergleichbar, 41% schlechter
» Das beste Gerät hat einen Delta-Wert von 6%, durchschnittlich ist 18%, das schlechteste Gerät hat 132%
Im Vergleich zu allen Geräten im Test
» 32% aller getesteten Geräte waren besser, 8% vergleichbar, 59% schlechter
» Das beste Gerät hat einen Delta-Wert von 4%, durchschnittlich ist 24%, das schlechteste Gerät hat 134%
Apple MacBook 12 (Early 2016) 1.1 GHz Audio Analyse
(+) | Die Lautsprecher können relativ laut spielen (83.6 dB)
Bass 100 - 315 Hz
(±) | abgesenkter Bass - 11.3% geringer als der Median
(±) | durchschnittlich lineare Bass-Wiedergabe (14.2% Delta zum Vorgänger)
Mitteltöne 400 - 2000 Hz
(+) | ausgeglichene Mitten, vom Median nur 2.4% abweichend
(+) | lineare Mitten (5.5% Delta zum Vorgänger)
Hochtöne 2 - 16 kHz
(+) | ausgeglichene Hochtöne, vom Median nur 2% abweichend
(+) | sehr lineare Hochtöne (4.5% Delta zum Vorgänger)
Gesamt im hörbaren Bereich 100 - 16.000 Hz
(+) | hörbarer Bereich ist sehr linear (10.2% Abstand zum Median
Im Vergleich zu allen Geräten derselben Klasse
» 7% aller getesteten Geräte dieser Klasse waren besser, 2% vergleichbar, 91% schlechter
» Das beste Gerät hat einen Delta-Wert von 5%, durchschnittlich ist 18%, das schlechteste Gerät hat 53%
Im Vergleich zu allen Geräten im Test
» 5% aller getesteten Geräte waren besser, 1% vergleichbar, 94% schlechter
» Das beste Gerät hat einen Delta-Wert von 4%, durchschnittlich ist 24%, das schlechteste Gerät hat 134%
Energieverwaltung - Hohe Stromrechnung
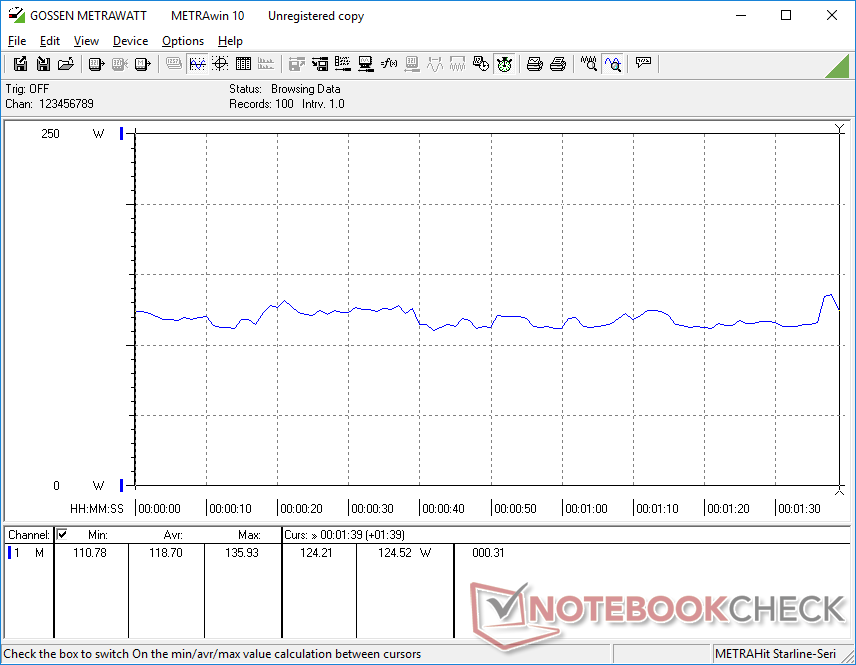
Energieaufnahme
Im Vergleich zum m17 R4 konnte Dell den Stromverbrauch bei wenig Last verbessern, was auch die längere Akkulaufzeit (siehe nächsten Abschnitt) erklärt. Im Leerlauf liegt der Minimalverbrauch bei gerade einmal 10 Watt, womit das neue x17 R1 viermal effizienter als das letztjährige m17 R4 ist.
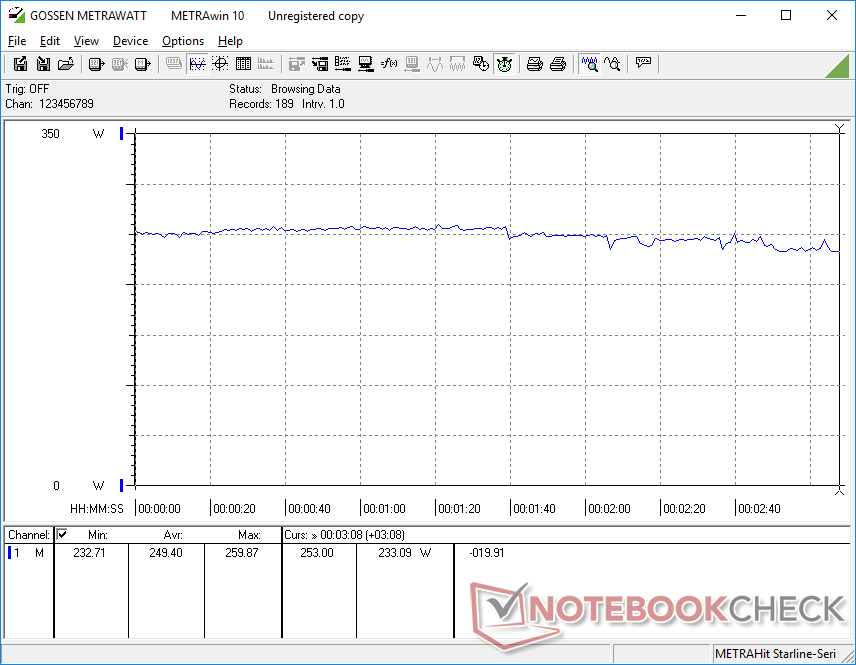
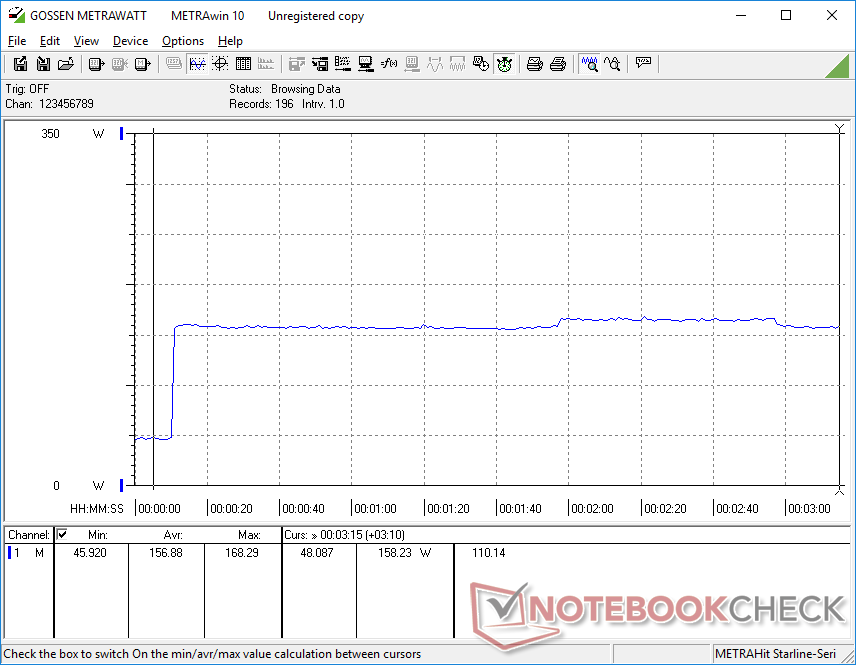
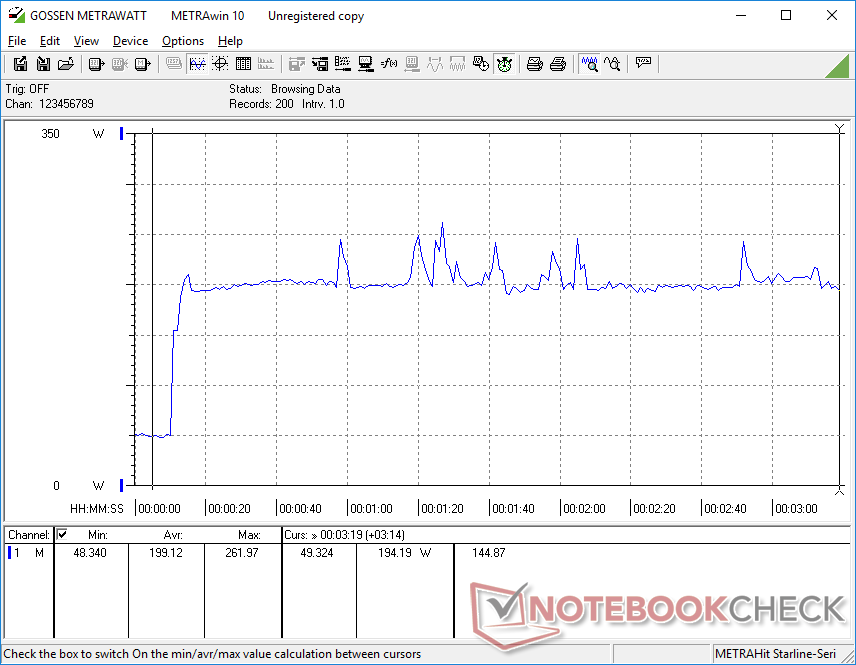
Der Stromverbrauch beim Spielen bleibt überdurchschnittlich hoch, was wir auch schon vom m17 R4 kennen. Bei Witcher 3 sind es durchschnittlich beispielsweise 249 Watt gegenüber 195 W beim Asus ROG Zephyrus S17 bzw. 156 Watt beim MSI GS76. Der erhöhte Verbrauch liegt an den hohen TDP-/TGP-Werten für die beiden Prozessoren.
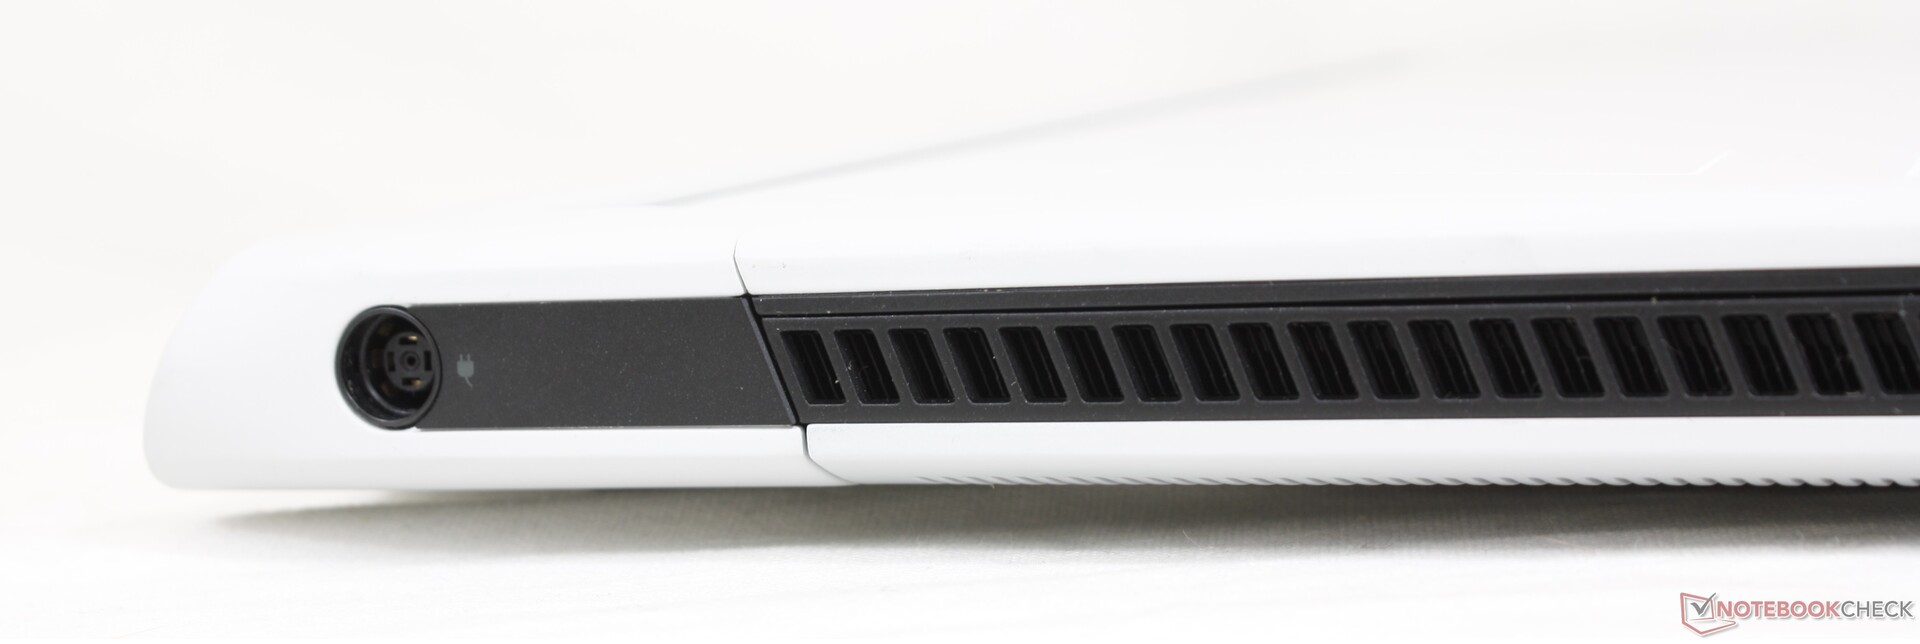
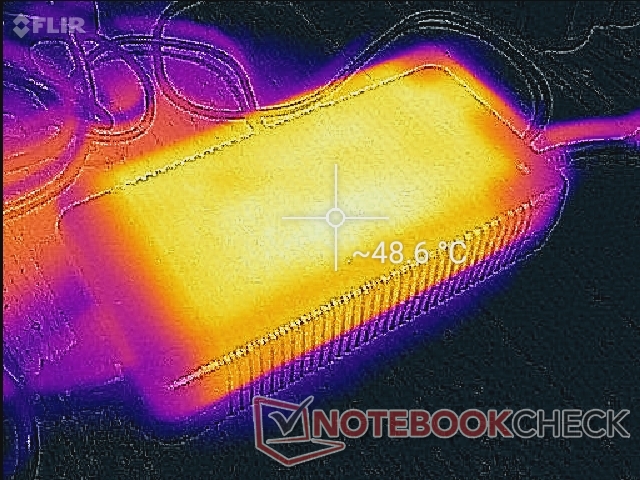
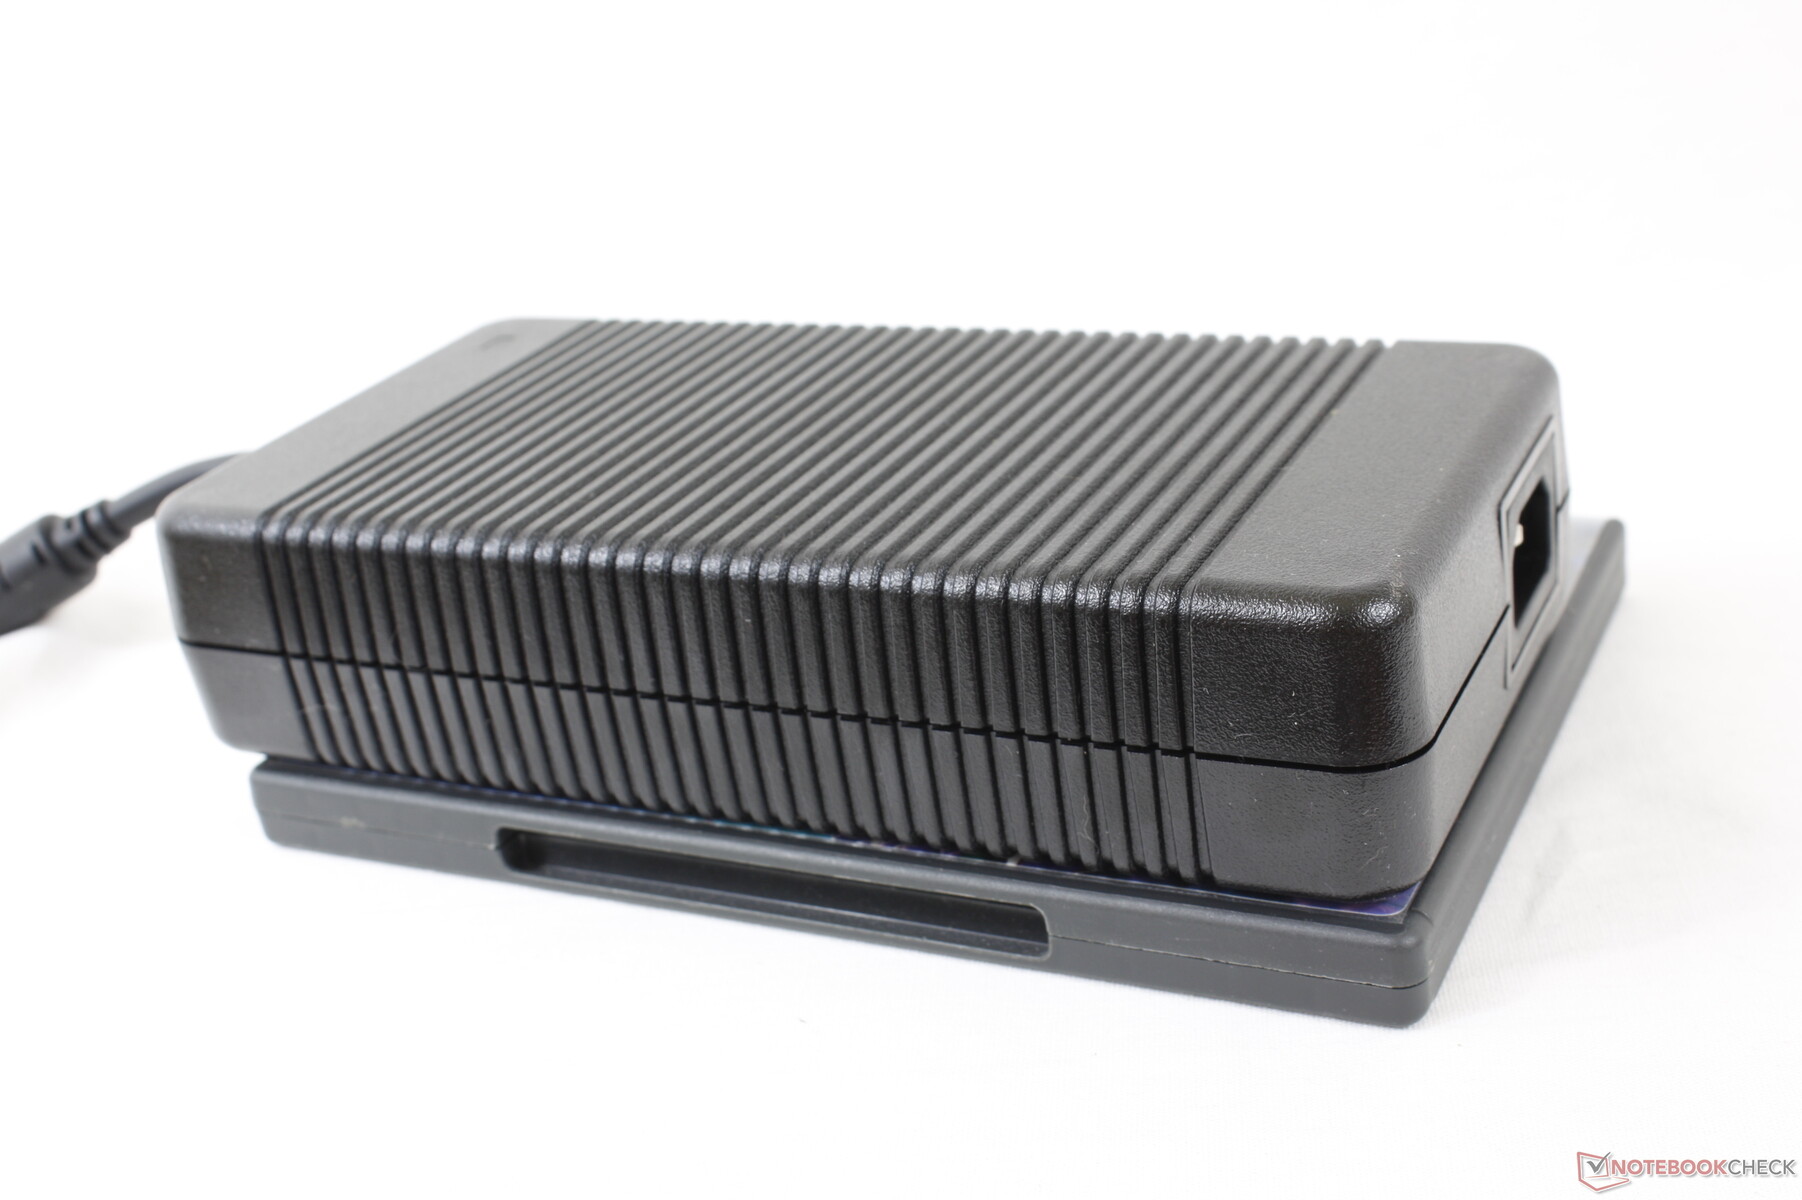
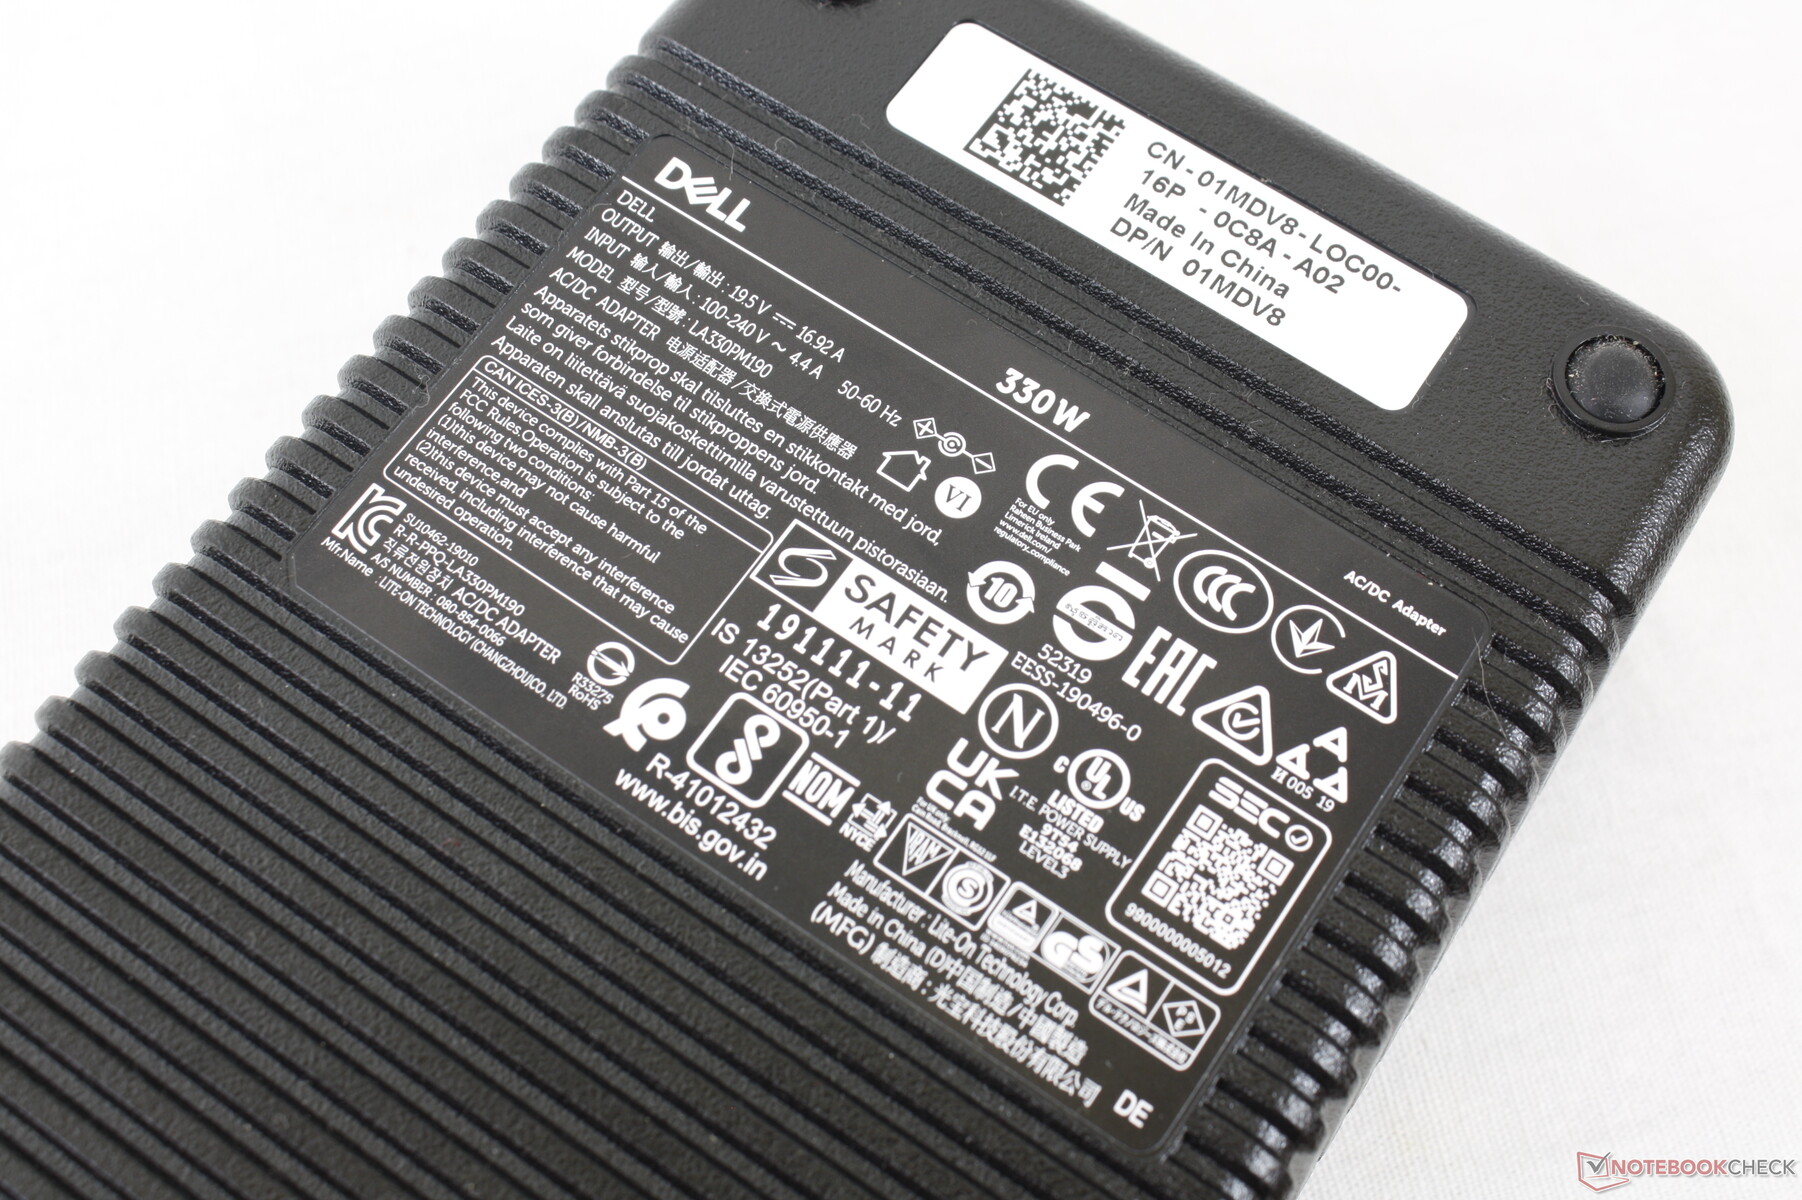
Unser Testgerät wird mit einem großen und schweren (~20 x 9,9 x 4,3 cm; 1,5 kg) 330-Watt-Netzteil ausgeliefert, während die Konkurrenz mit 280 Watt (ROG Zephyrus S17) oder 230 Watt (Razer Blade 17) auskommt. Auch hier fordern die hohen Leistungswerte ihren Tribut und zudem bleibt noch Spielraum, wenn man den Akku beim Spielen beispielsweise Laden will. Die Modelle mit der langsameren GeForce RTX 3060 werden mit einem kleineren 240-Watt-Netzteil ausgeliefert.
| Aus / Standby | |
| Idle | |
| Last |
|
Legende:
min: | |
| Alienware x17 RTX 3080 P48E i7-11800H, GeForce RTX 3080 Laptop GPU, 2x WDC PC SN730 SDBPNTY-1T00 (RAID 0), IPS, 3840x2160, 17.3" | Alienware m17 R4 i9-10980HK, GeForce RTX 3080 Laptop GPU, 2x Micron 2300 512 GB (RAID 0), IPS, 1920x1080, 17.3" | Razer Blade 17 RTX 3070 i7-11800H, GeForce RTX 3070 Laptop GPU, Samsung PM9A1 MZVL21T0HCLR, IPS, 1920x1080, 17.3" | Asus ROG Zephyrus S17 GX703HSD i9-11900H, GeForce RTX 3080 Laptop GPU, Samsung PM9A1 MZVL22T0HBLB, IPS, 2560x1440, 17.3" | MSI GS76 Stealth 11UH i9-11900H, GeForce RTX 3080 Laptop GPU, Samsung PM9A1 MZVL22T0HBLB, IPS, 3840x2160, 17.3" | Gigabyte Aero 17 HDR YD i9-11980HK, GeForce RTX 3080 Laptop GPU, Samsung PM9A1 MZVL2512HCJQ, IPS, 3840x2160, 17.3" | |
|---|---|---|---|---|---|---|
| Stromverbrauch | -80% | -11% | -10% | 13% | -20% | |
| Idle min * (Watt) | 10.2 | 42 -312% | 20.9 -105% | 21.7 -113% | 14 -37% | 25 -145% |
| Idle avg * (Watt) | 21.2 | 48 -126% | 25.1 -18% | 27 -27% | 19 10% | 28 -32% |
| Idle max * (Watt) | 48.4 | 58 -20% | 45 7% | 33 32% | 31 36% | 40 17% |
| Last avg * (Watt) | 118.7 | 124 -4% | 102 14% | 108 9% | 97 18% | 114 4% |
| Witcher 3 ultra * (Watt) | 249 | 219 12% | 189 24% | 195 22% | 156 37% | 176 29% |
| Last max * (Watt) | 262 | 337 -29% | 234.8 10% | 210 20% | 231 12% | 236 10% |
* ... kleinere Werte sind besser
Power Consumption Witcher 3 / Stresstest
Akkulaufzeit
Die Akkulaufzeit bei den alten m17-Modellen selbst mit den minimalen Leistungseinstellungen sehr schlecht. Beim neuen x17 sind die Ergebnisse jetzt aber deutlich besser, obwohl die Akkukapazität nicht erhöht wurde. Im praxisnahen WLAN-Test kann man etwa 6 Stunden erwarten (~2,5h beim m17 R4), was für einen High-End-Gaming-Laptop kein schlechtes Ergebnis ist. Insgesamt sind die Ergebnisse vergleichbar mit dem MSI GS76 oder dem Gigabyte Aero 17, die beide mit einem größeren 99-Wh-Akku ausgestattet sind.
Ein kompletter Ladevorgang dauert mit dem mitgelieferten Netzteil nur 75 Minuten.
| Alienware x17 RTX 3080 P48E i7-11800H, GeForce RTX 3080 Laptop GPU, 87 Wh | Alienware m17 R4 i9-10980HK, GeForce RTX 3080 Laptop GPU, 86 Wh | Razer Blade 17 RTX 3070 i7-11800H, GeForce RTX 3070 Laptop GPU, 70 Wh | Asus ROG Zephyrus S17 GX703HSD i9-11900H, GeForce RTX 3080 Laptop GPU, 90 Wh | MSI GS76 Stealth 11UH i9-11900H, GeForce RTX 3080 Laptop GPU, 99.9 Wh | Gigabyte Aero 17 HDR YD i9-11980HK, GeForce RTX 3080 Laptop GPU, 99 Wh | |
|---|---|---|---|---|---|---|
| Akkulaufzeit | -5% | 24% | 133% | 37% | 23% | |
| Idle (h) | 7 | 6.7 -4% | 9.9 41% | |||
| WLAN (h) | 5.9 | 2.4 -59% | 5.2 -12% | 7.5 27% | 6.4 8% | 5.6 -5% |
| Last (h) | 0.8 | 1.2 50% | 1.5 88% | 2.7 238% | 1.3 63% | 1.2 50% |
| Witcher 3 ultra (h) | 1 |
Pro
Contra
Fazit - Groß und schwer, aber auch viel Leistung
Die Highlights des neuen Alienware x17 sind die hohe Prozessorleistung und die mechanischen CherryMX-Taster. Der Core i7-11800H liefert hier deutlich mehr Leistung als in den meisten anderen Laptops und die taktilen mechanischen Tasten gehören zu den komfortabelsten, die wir bisher bei einem Gaming-Notebook genutzt haben.
Dells Alienware x17 ist auf die maximale Leistung ausgelegt, ist im Gegenzug aber auch etwas größer und schwerer als die Konkurrenz.
Die hohe Leistung wird allerdings mit hohen Kerntemperaturen, dem hohen Stromverbrauch sowie dem großen und schweren Gehäuse erkauft. Konkurrenten wie das Razer Blade 17, MSI GS76 Stealth oder Asus ROG Zephyrus S17 sind kleiner, leichter und effizienter, trotz vergleichbarer Komponenten. Diese Systeme sind aber auch etwas langsamer, die Frage ist also, was man als Nutzer bevorzugt. Wer mit dem Leistungslevel der RTX 3060 zufrieden ist wird vermutlich mit den leichteren Konkurrenten von Razer oder MSI besser bedient sein, doch wenn man die maximale Leistung der RTX 3080 wünscht, bekommt man mit dem Alienware x17 auch die passende Kühlung.
Preis und Verfügbarkeit
Das neue Alienware x17 R1 lässt sich bei Dell konfigurieren, allerdings sind die Modelle mit der RTX 3060 und RTX 3070 erst ab Mitte Oktober verfügbar; Modelle mit der RTX 3080 sogar erst ab November. Bei Händlern sind allerdings schon einige Versionen verfügbar, die zum Beispiel bei Cyberport ab 2.399 Euro starten (i7, FHD 300 cd/m² 165 Hz, 16 GB RAM, 512 GB SSD, RTX 3060).
Alienware x17 RTX 3080 P48E
- 24.09.2021 v7 (old)
Allen Ngo
Preisvergleich

