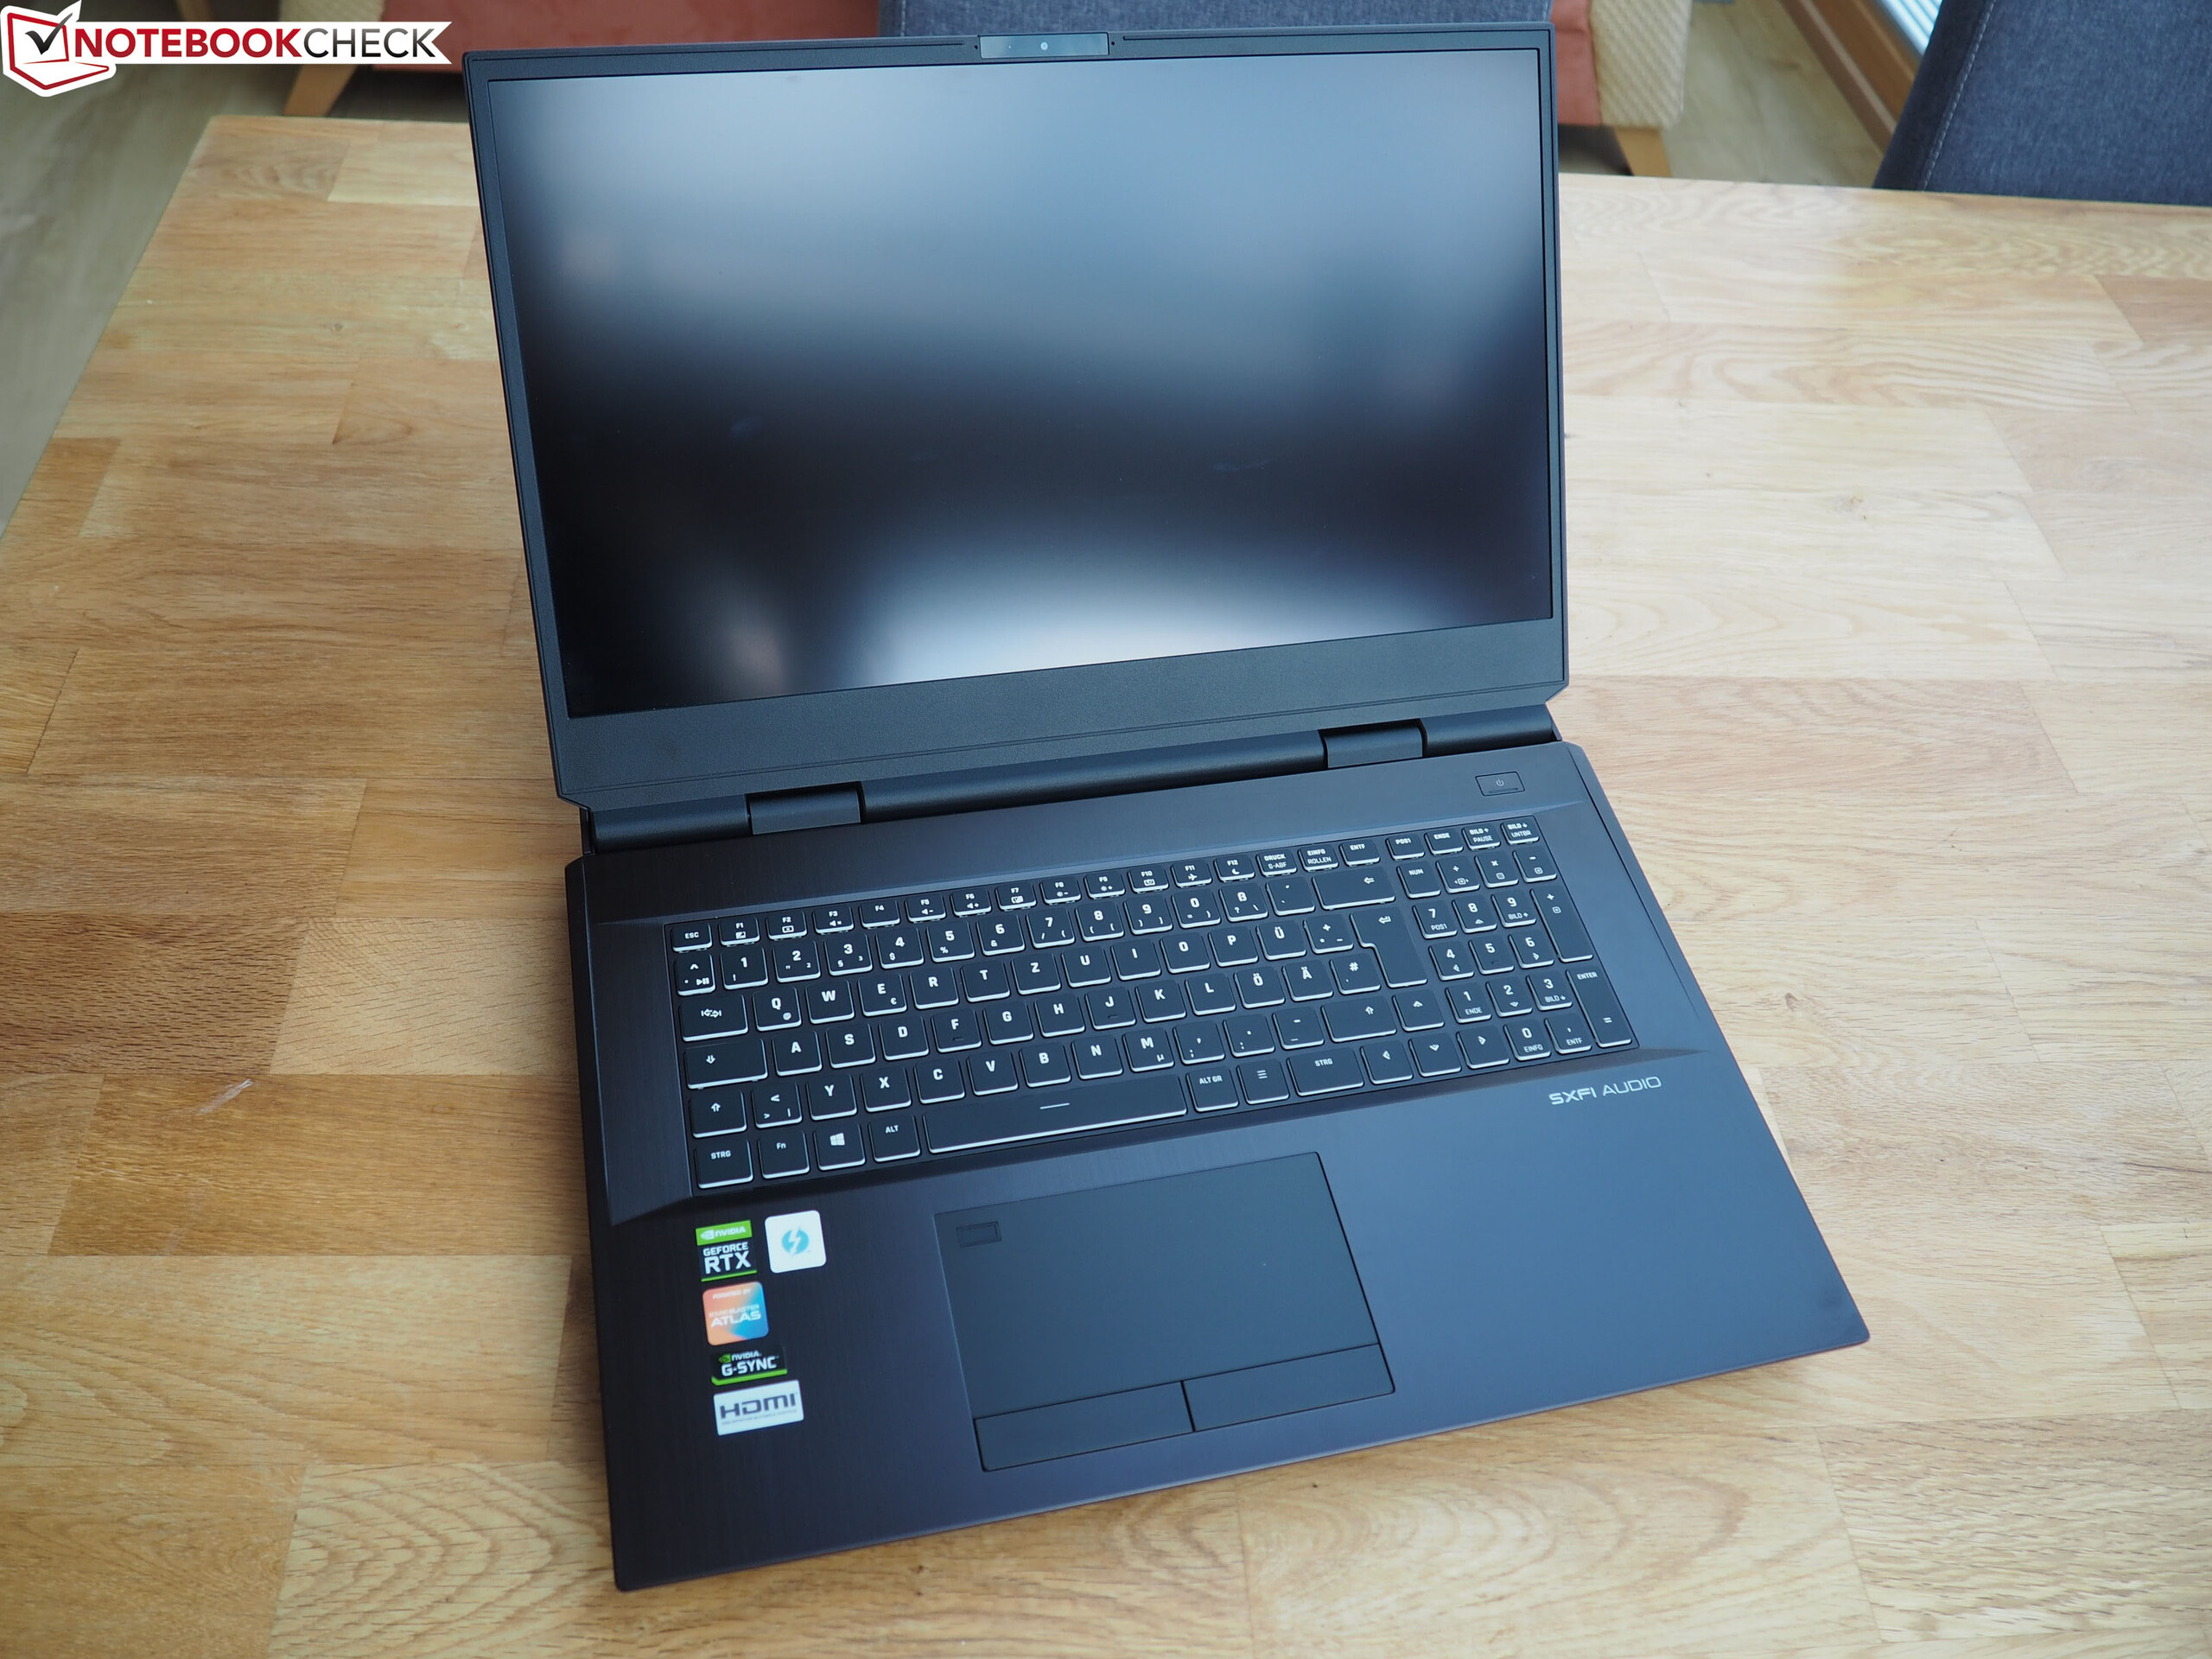
Schenker XMG Ultra 17 (Clevo X170KM-G) im Test: Wuchtiges Kraftpaket mit üppiger Ausstattung

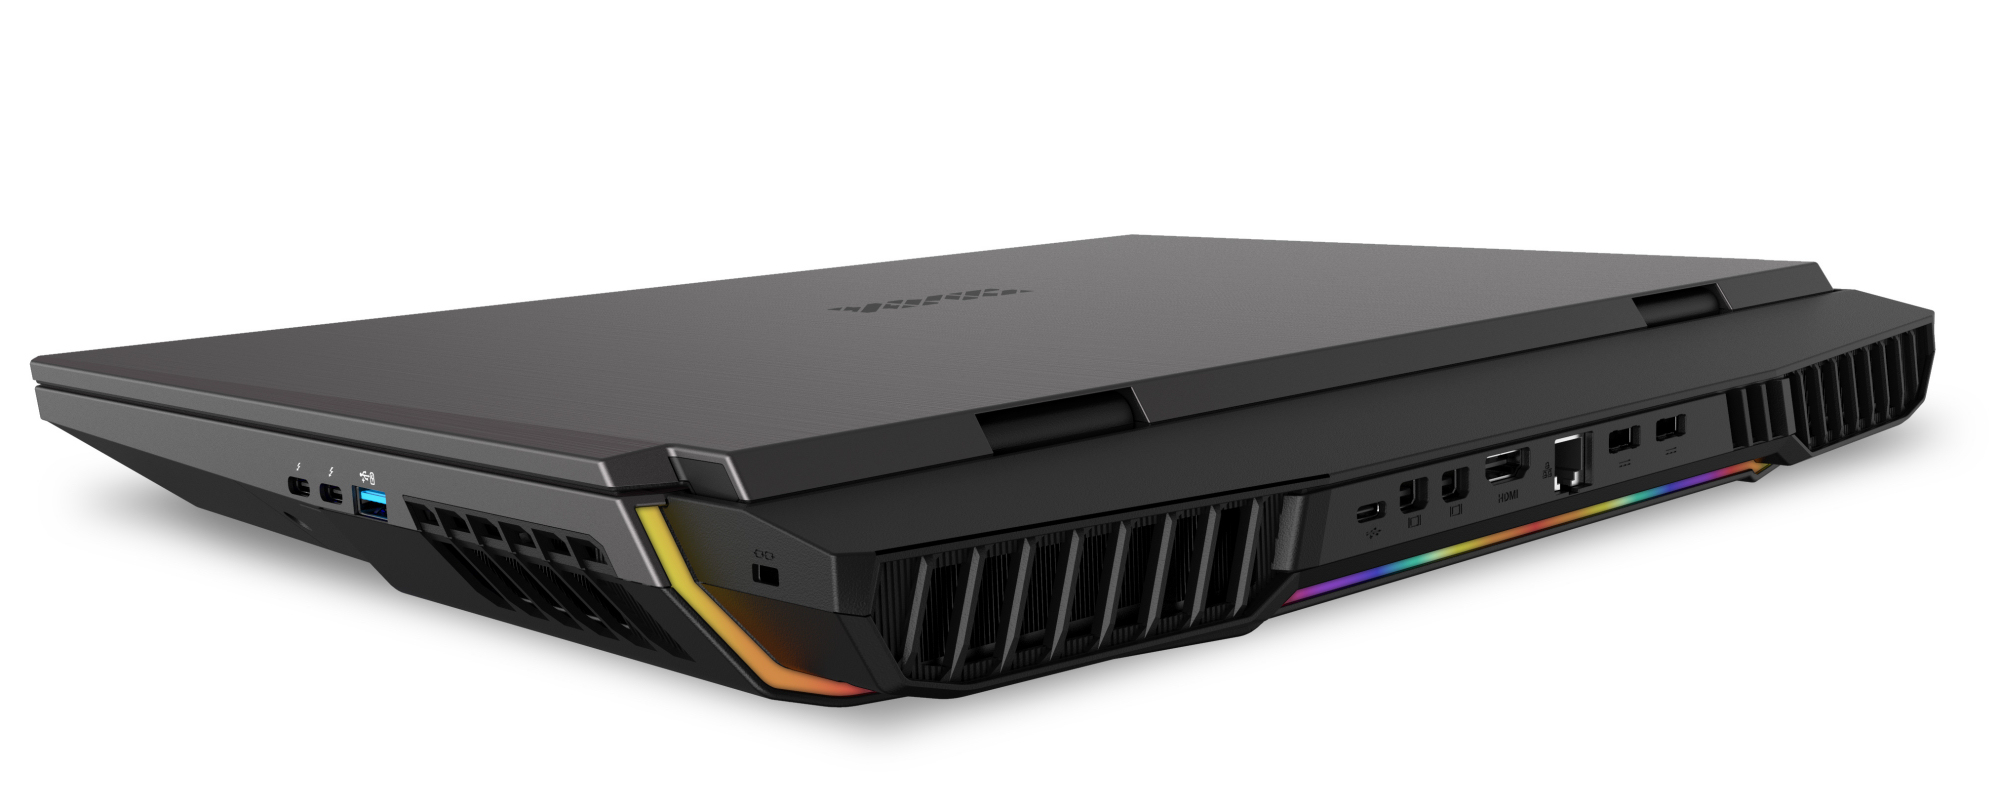
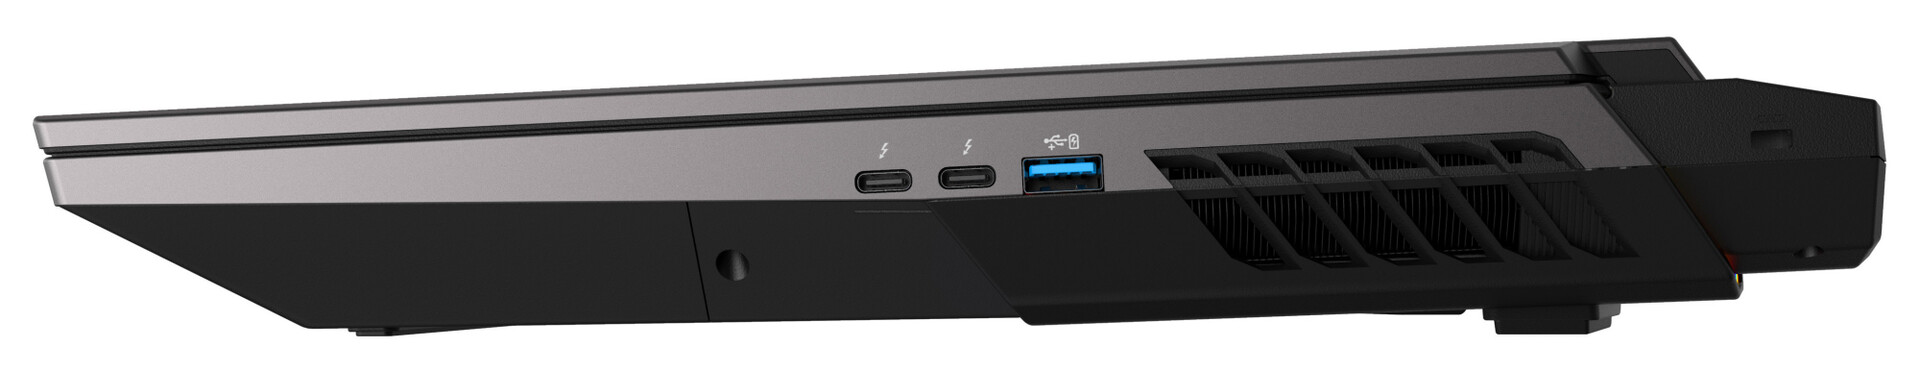
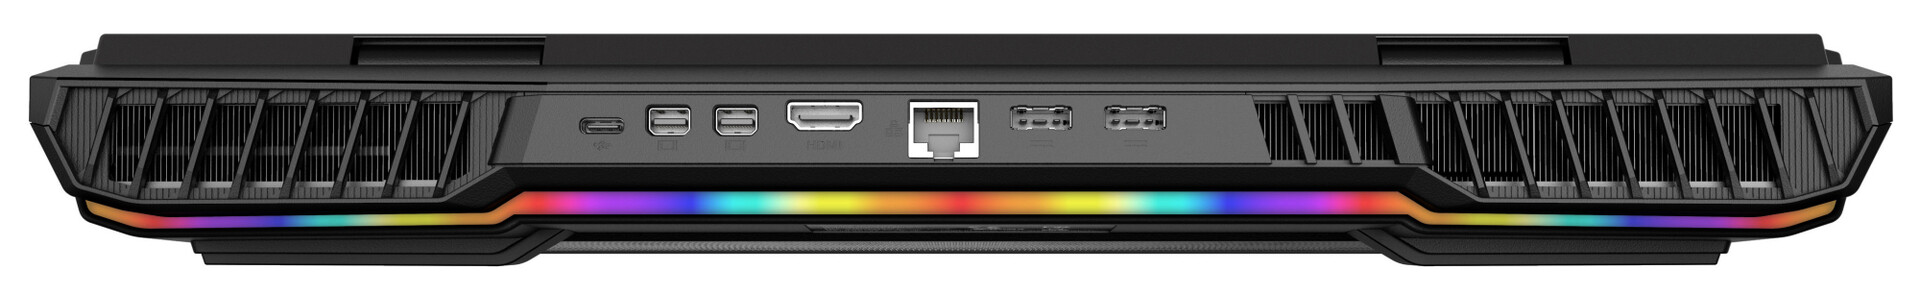
Optisch hat sich beim 2021-Modell des XMG Ultra 17 gegenüber dem Vorgänger nichts getan. Neuerungen finden sich auf technischer Seite. So kommen nun Rocket-Lake-Prozessoren (Comet-Lake-CPUs sind weiterhin verfügbar) und Ampere-GPUs zum Einsatz. Statt eines Thunderbolt-3-Steckplatzes finden zwei Thunderbolt-4-/USB-4-Steckplätze Verwendung. Zu den Konkurrenten zählen Geräte wie das MSI GT76 Titan DT 10SGS, das Alienware m17 R4 und das Asus Strix Scar 17 G732LXS.
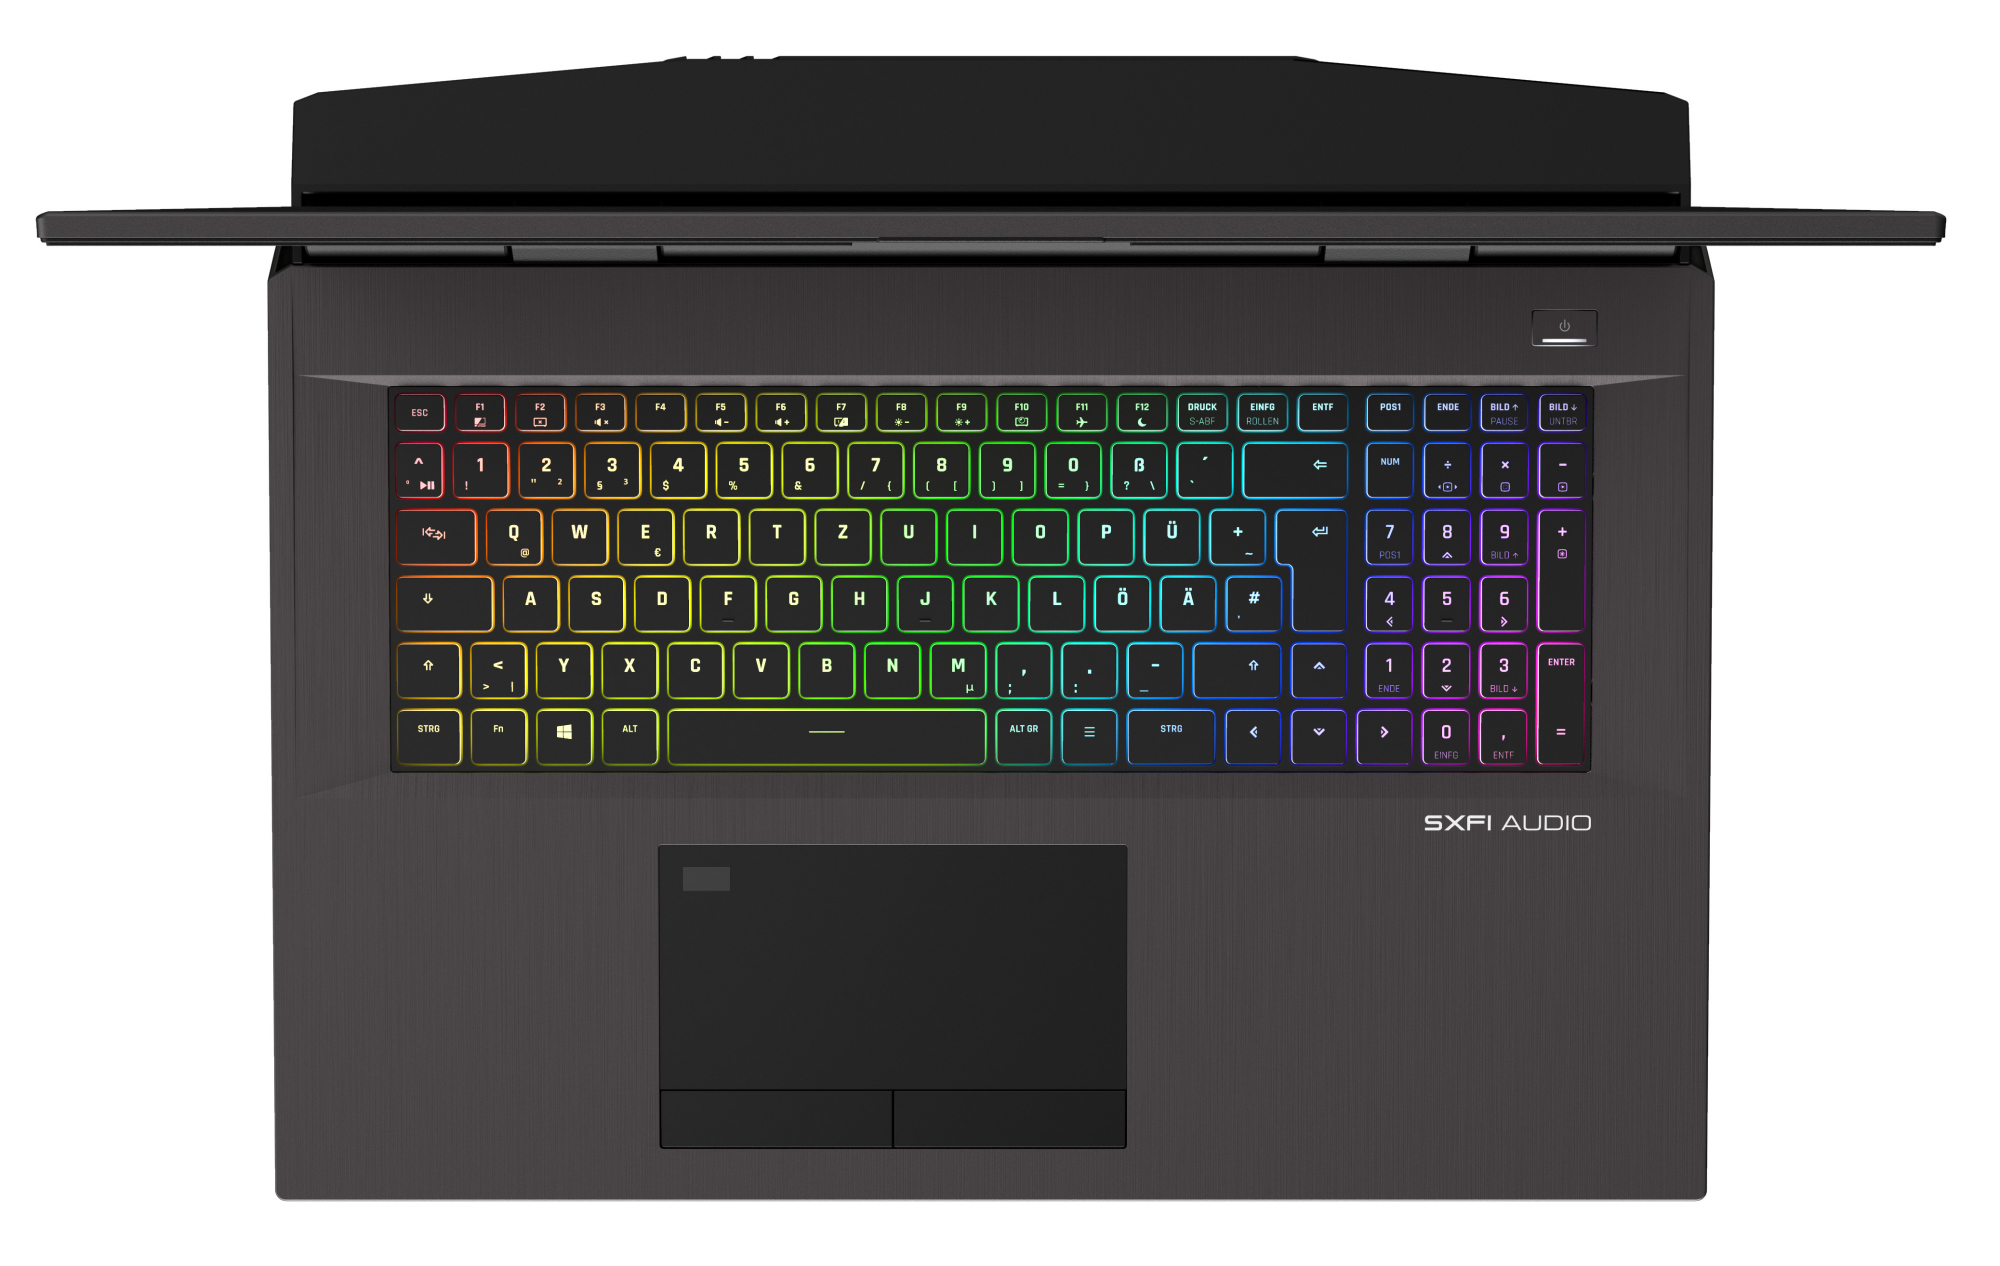
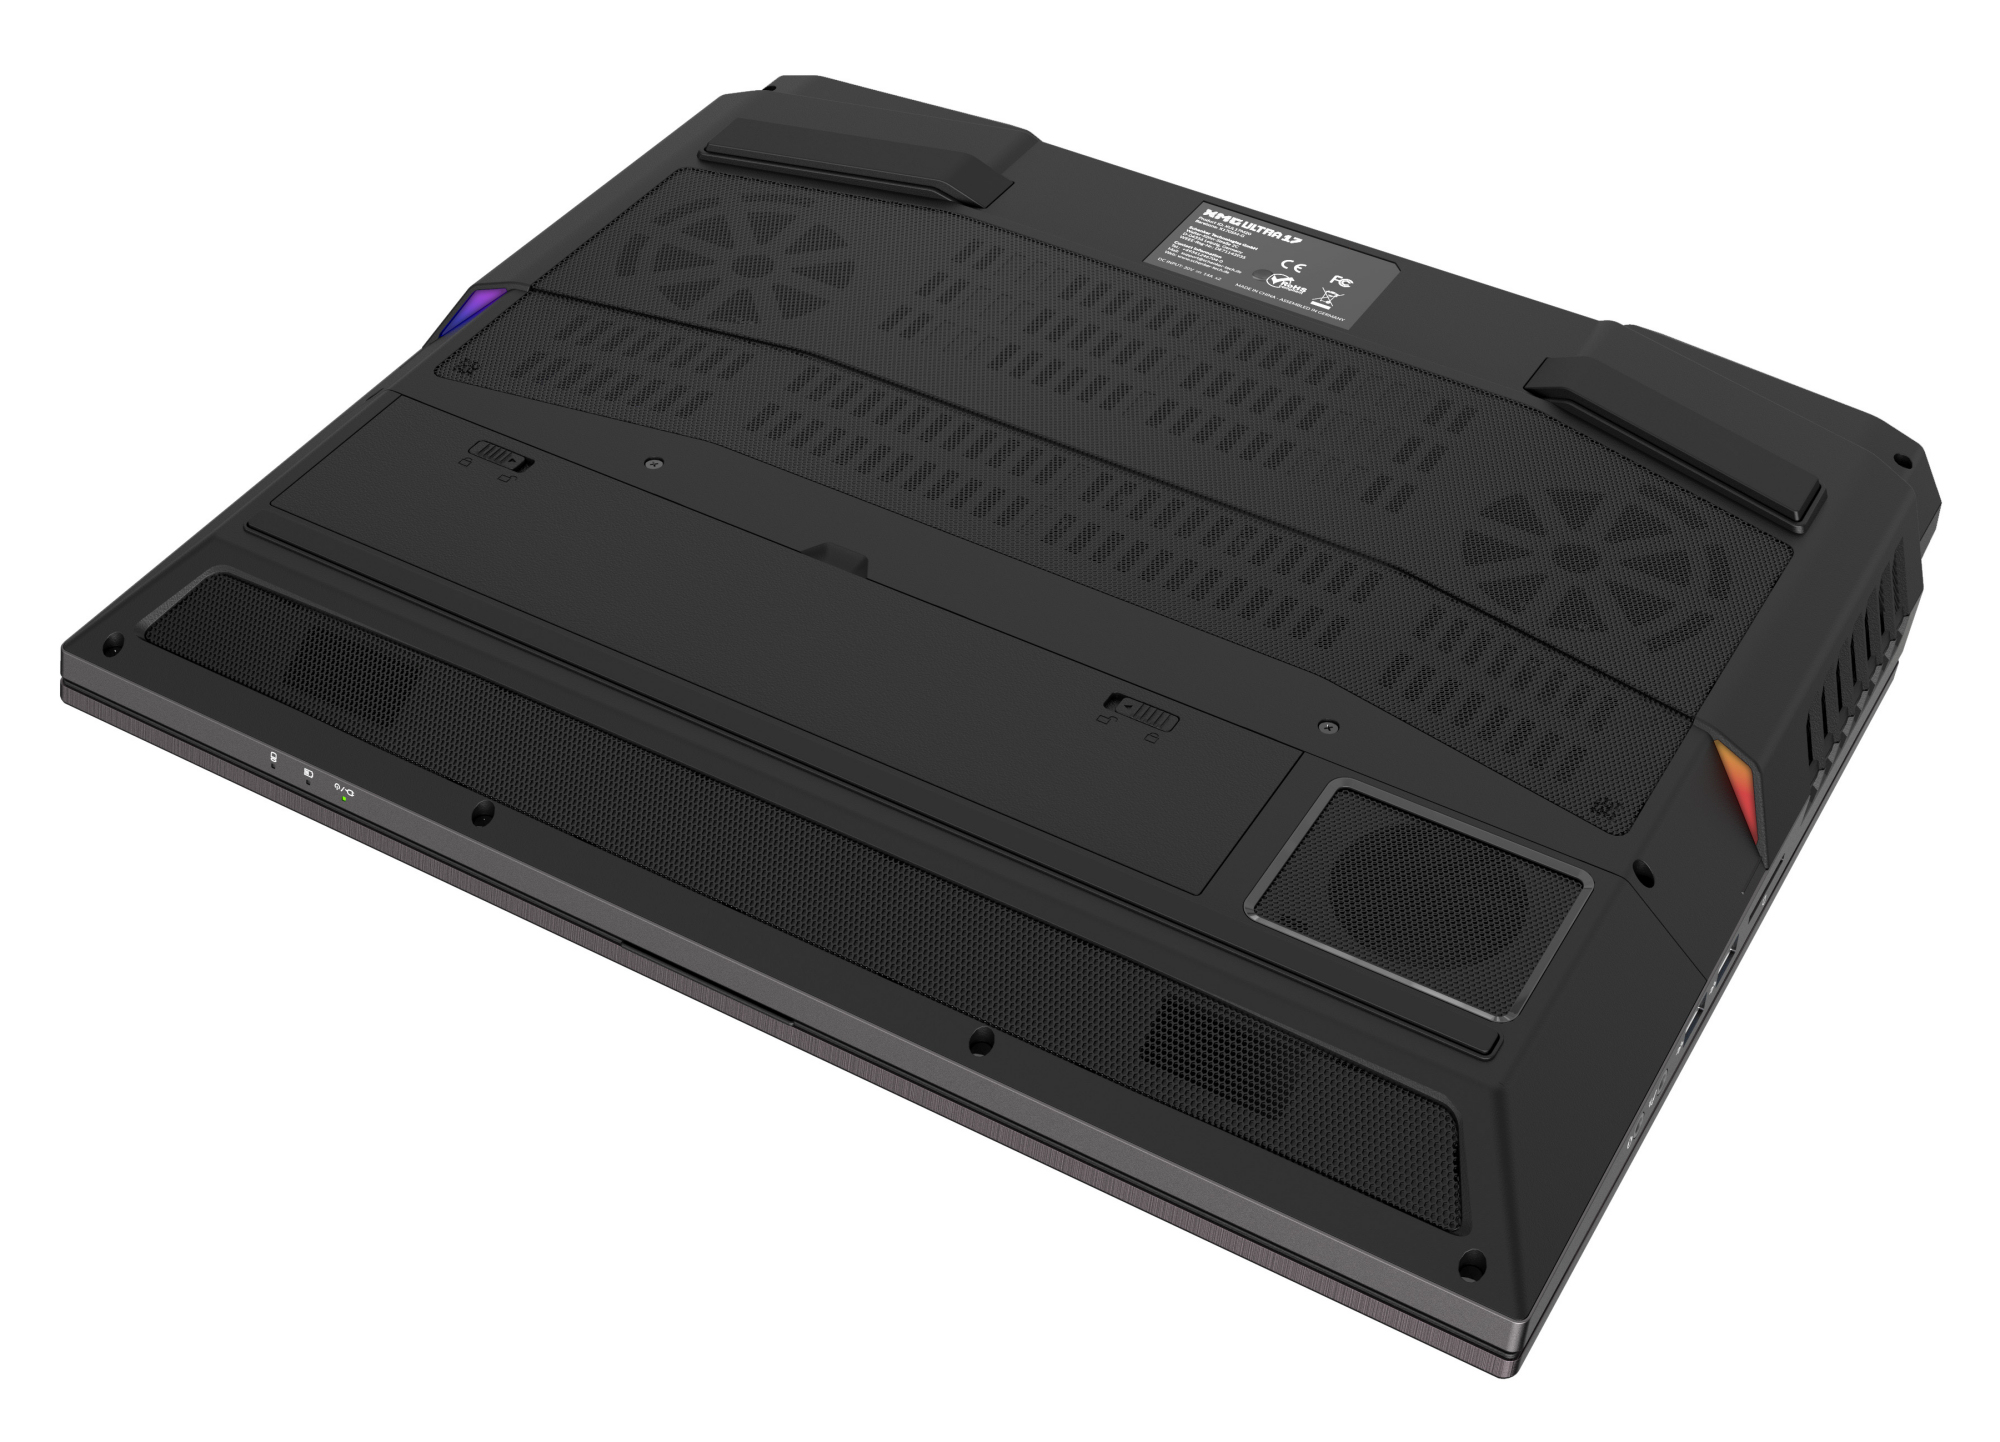
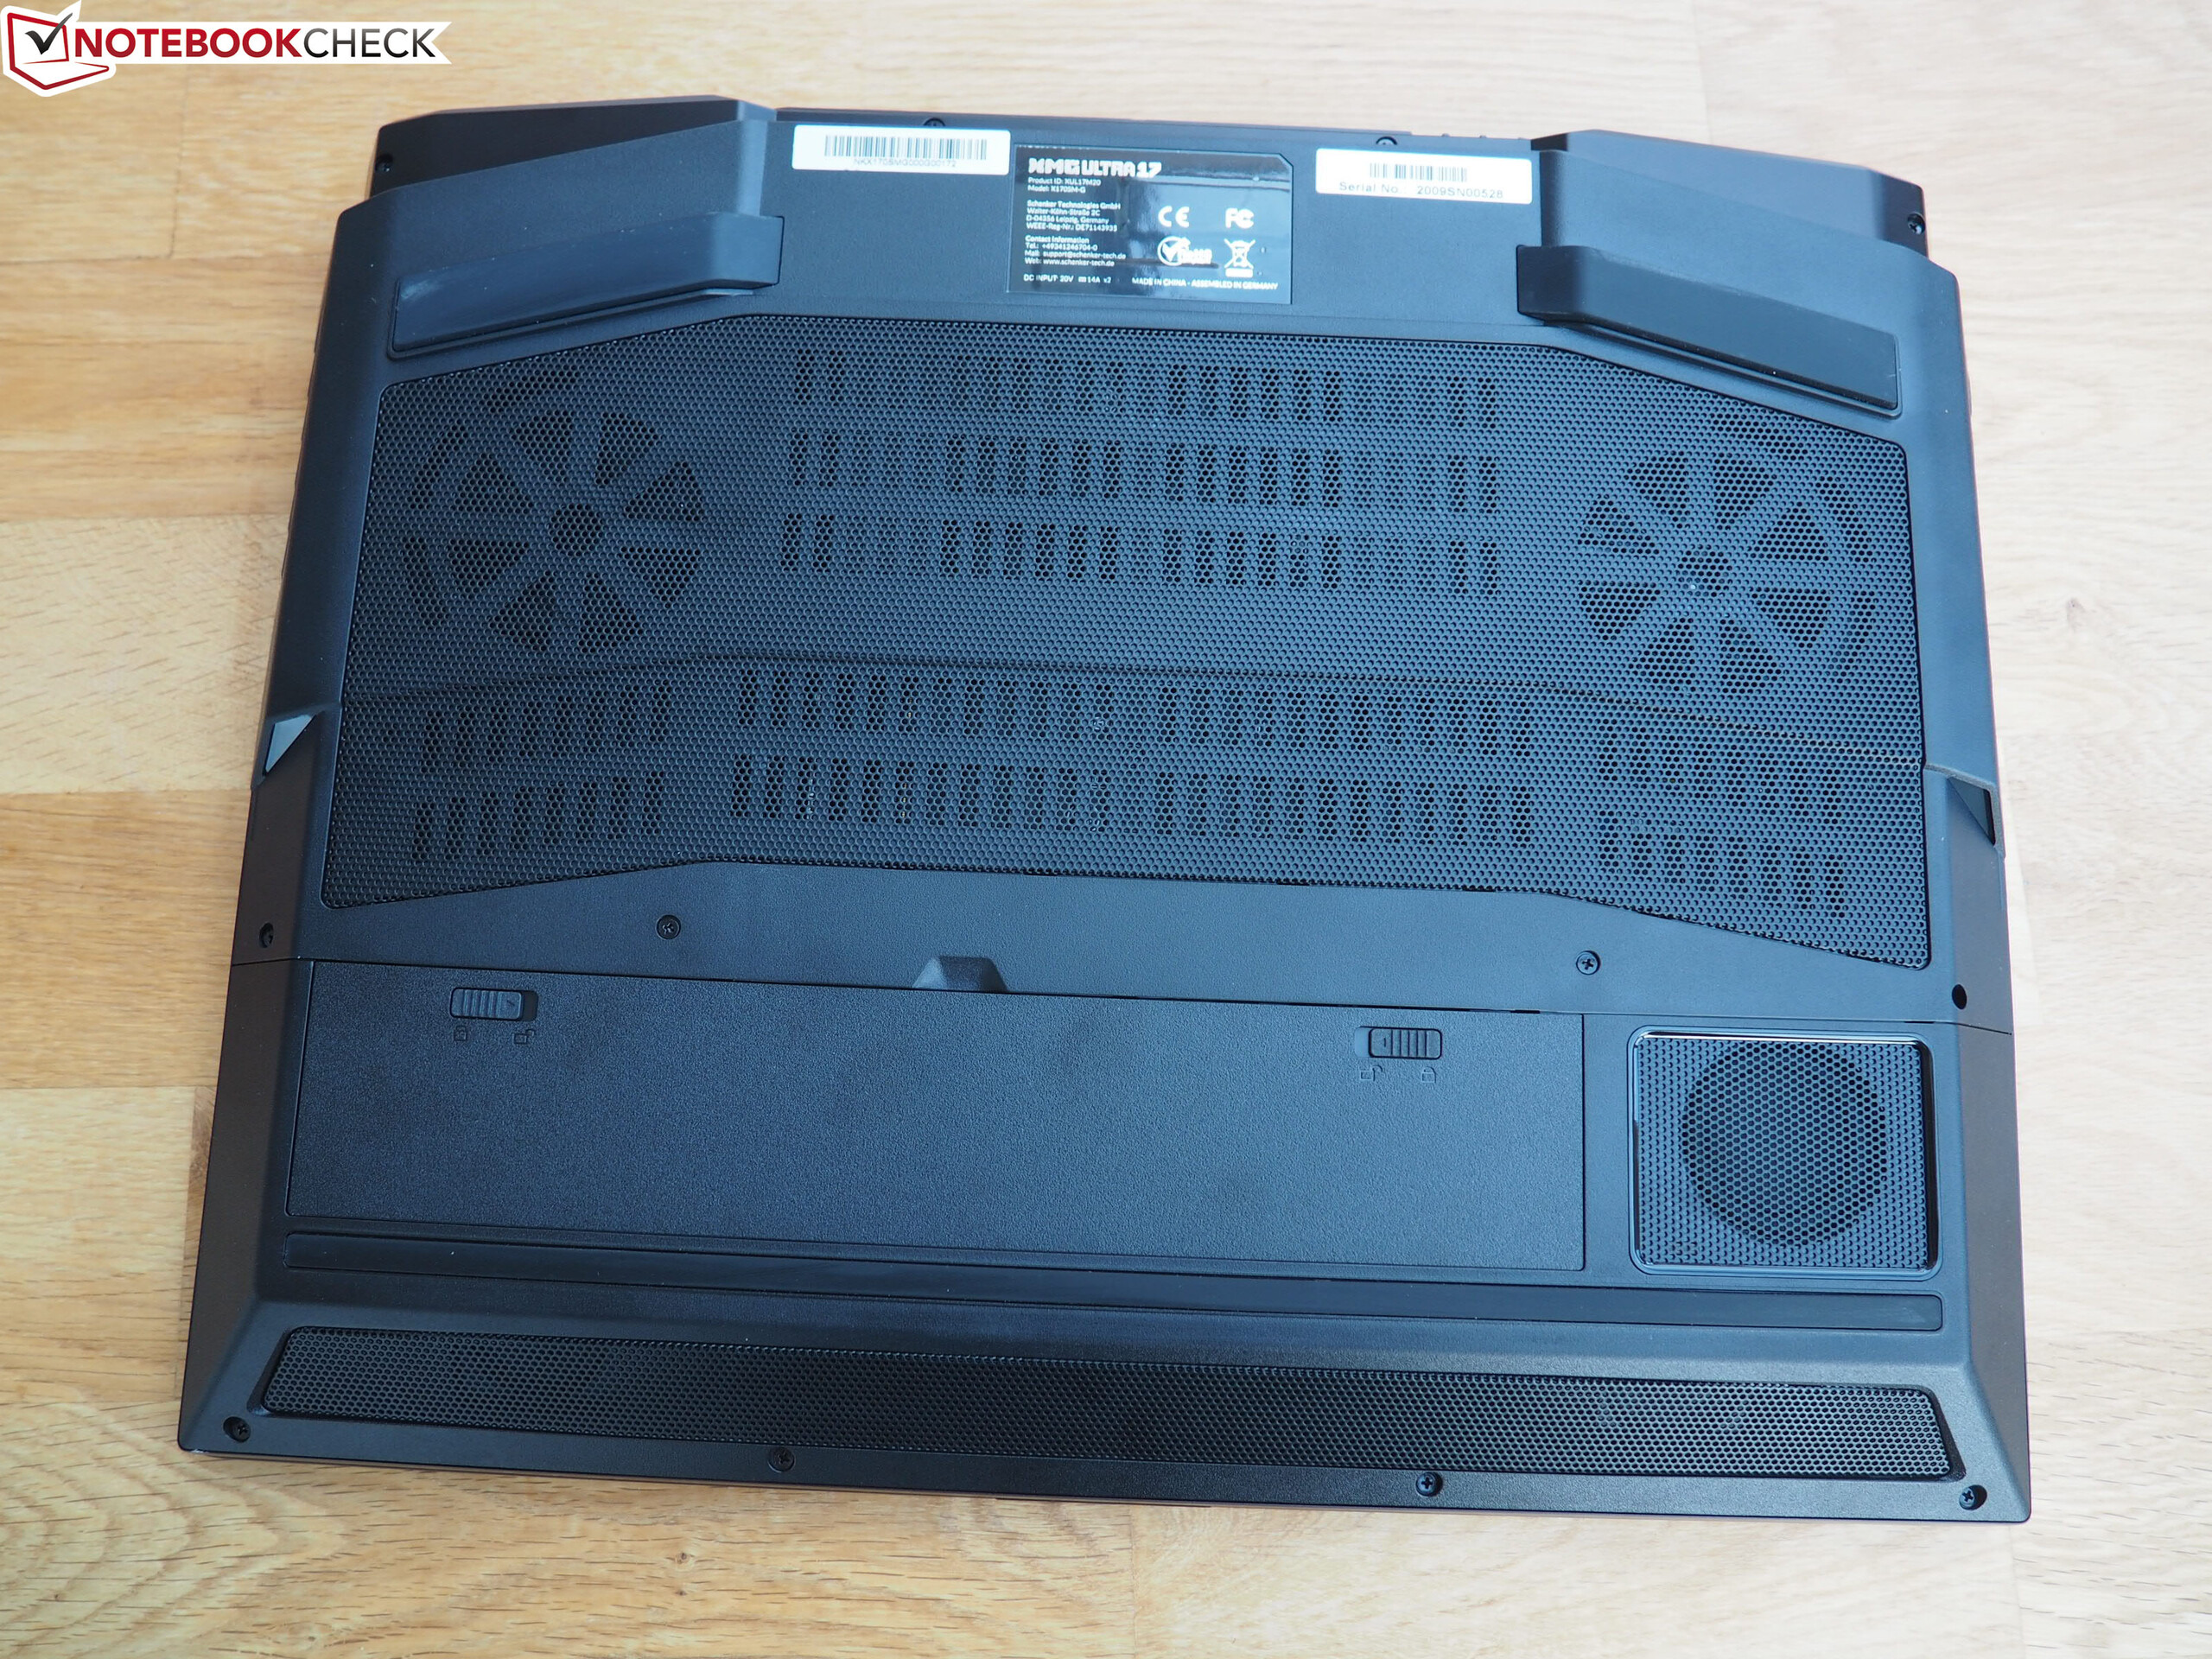
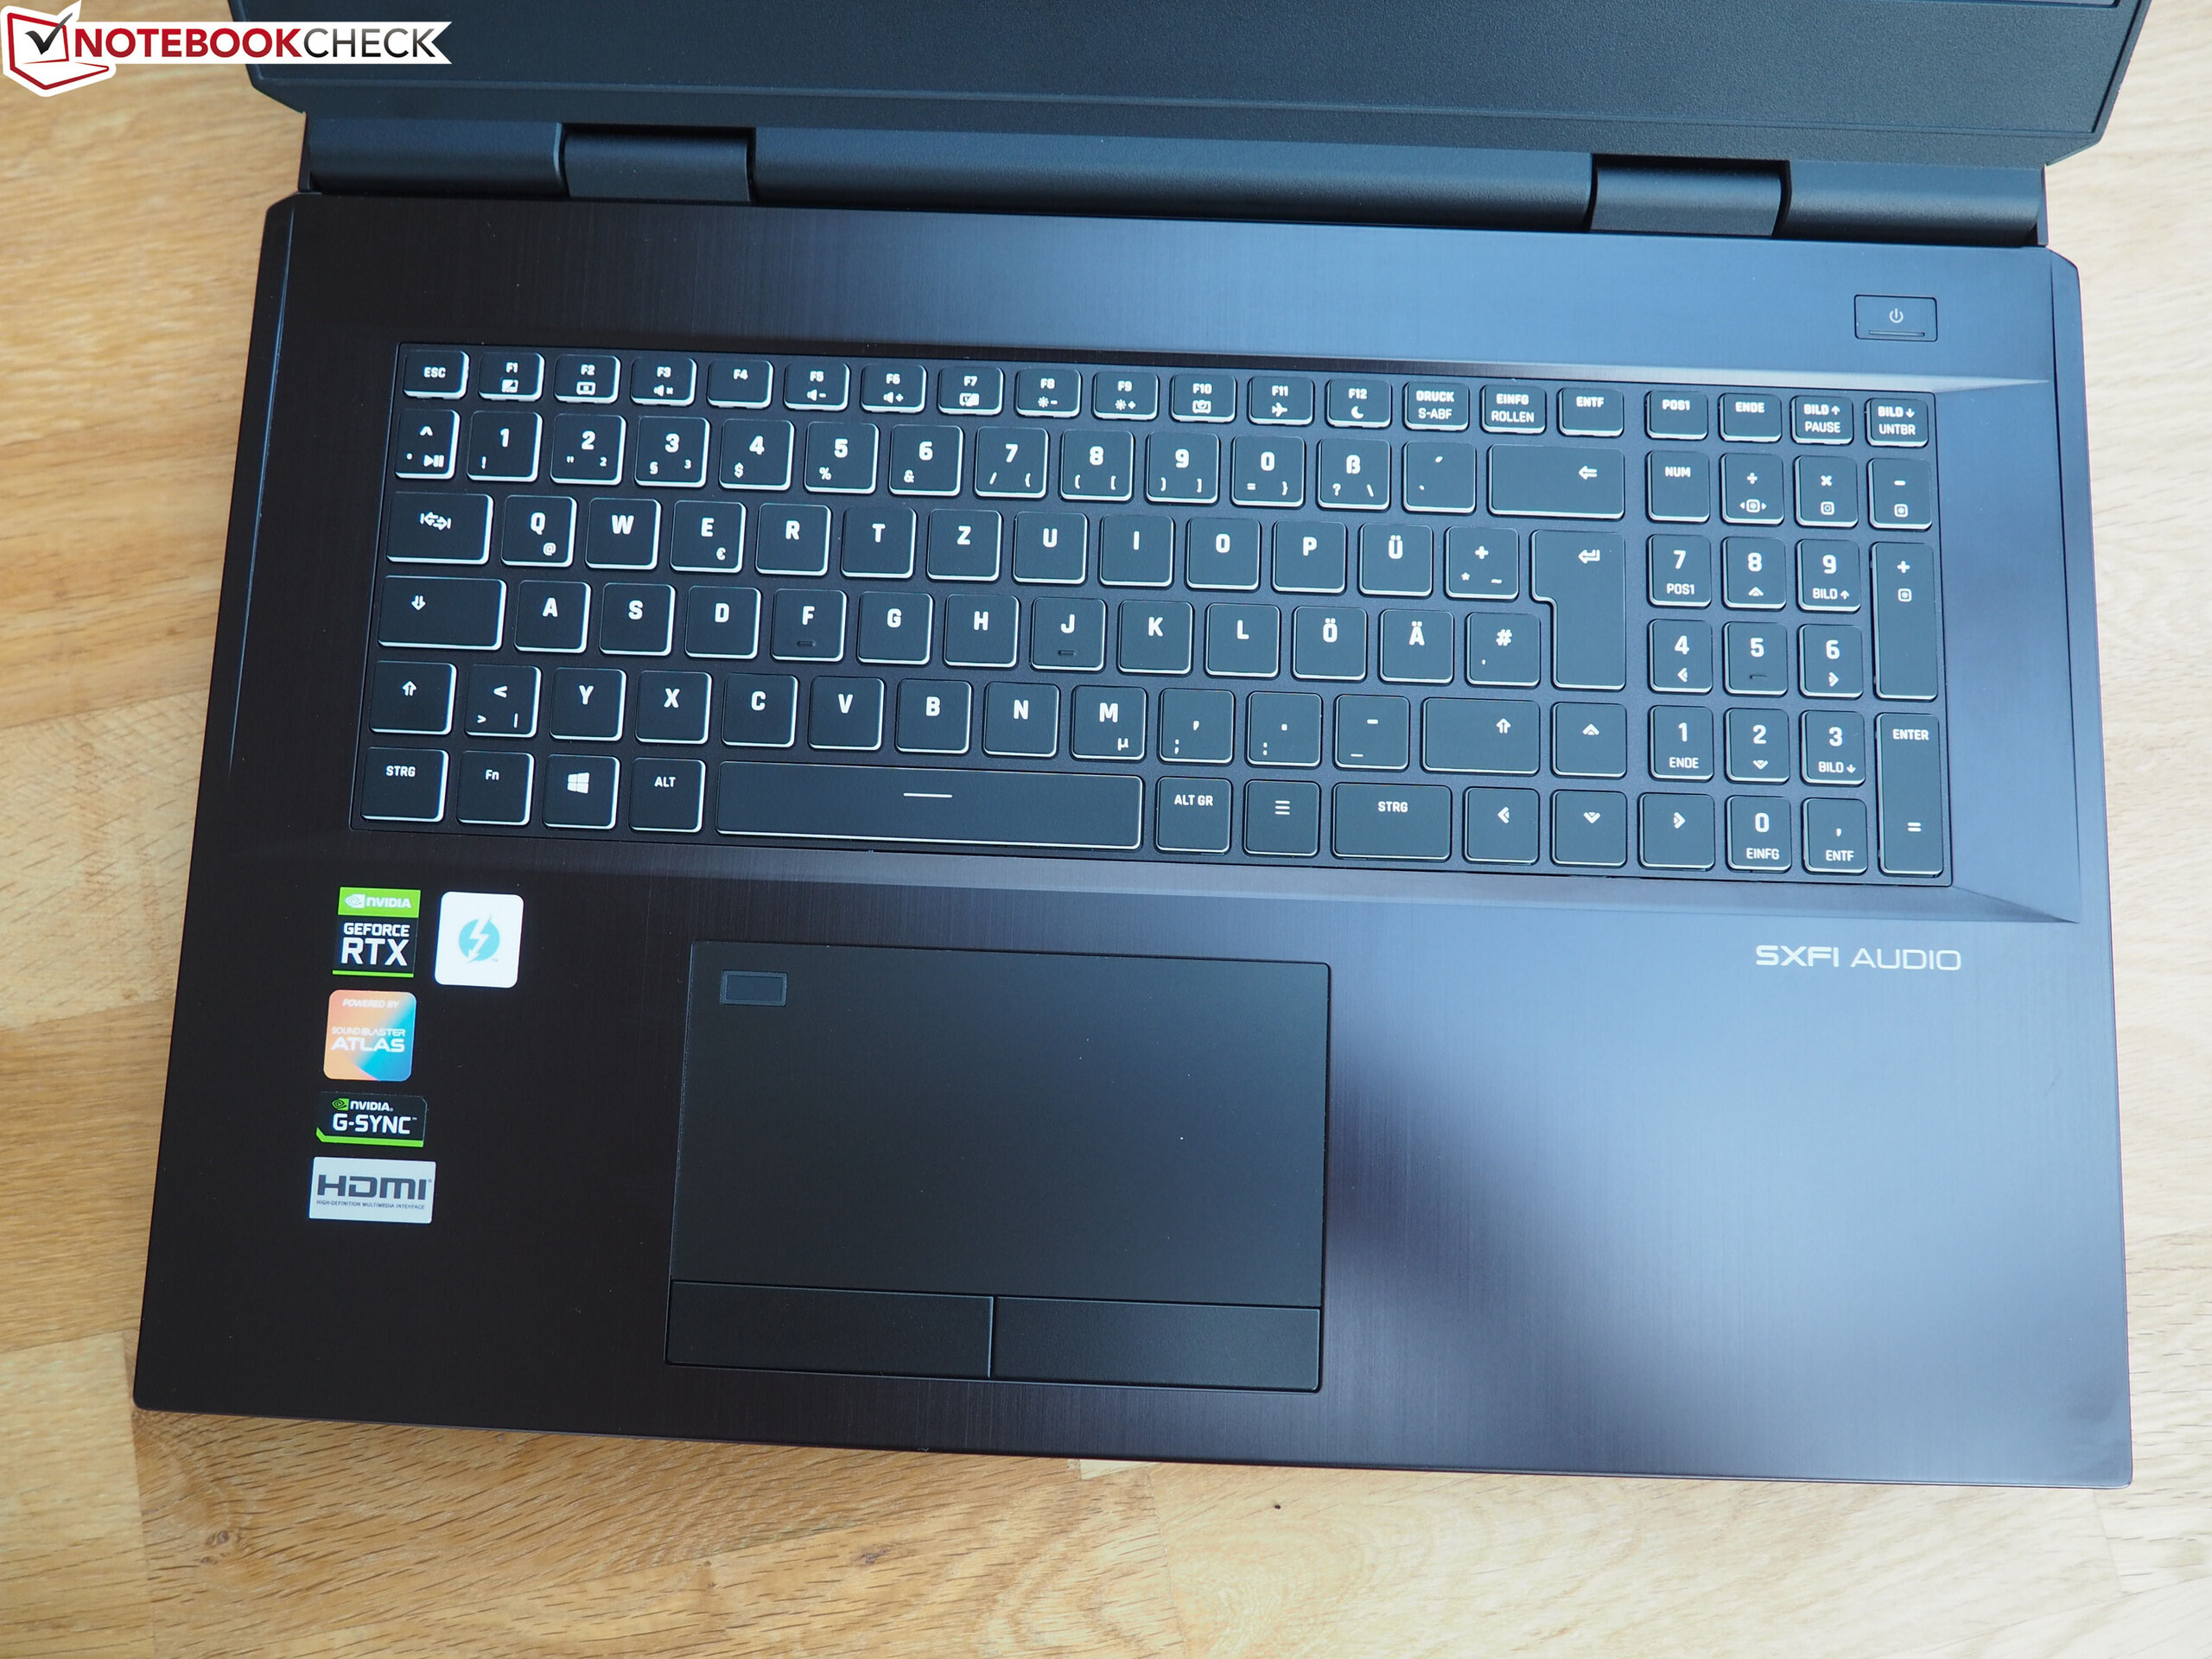
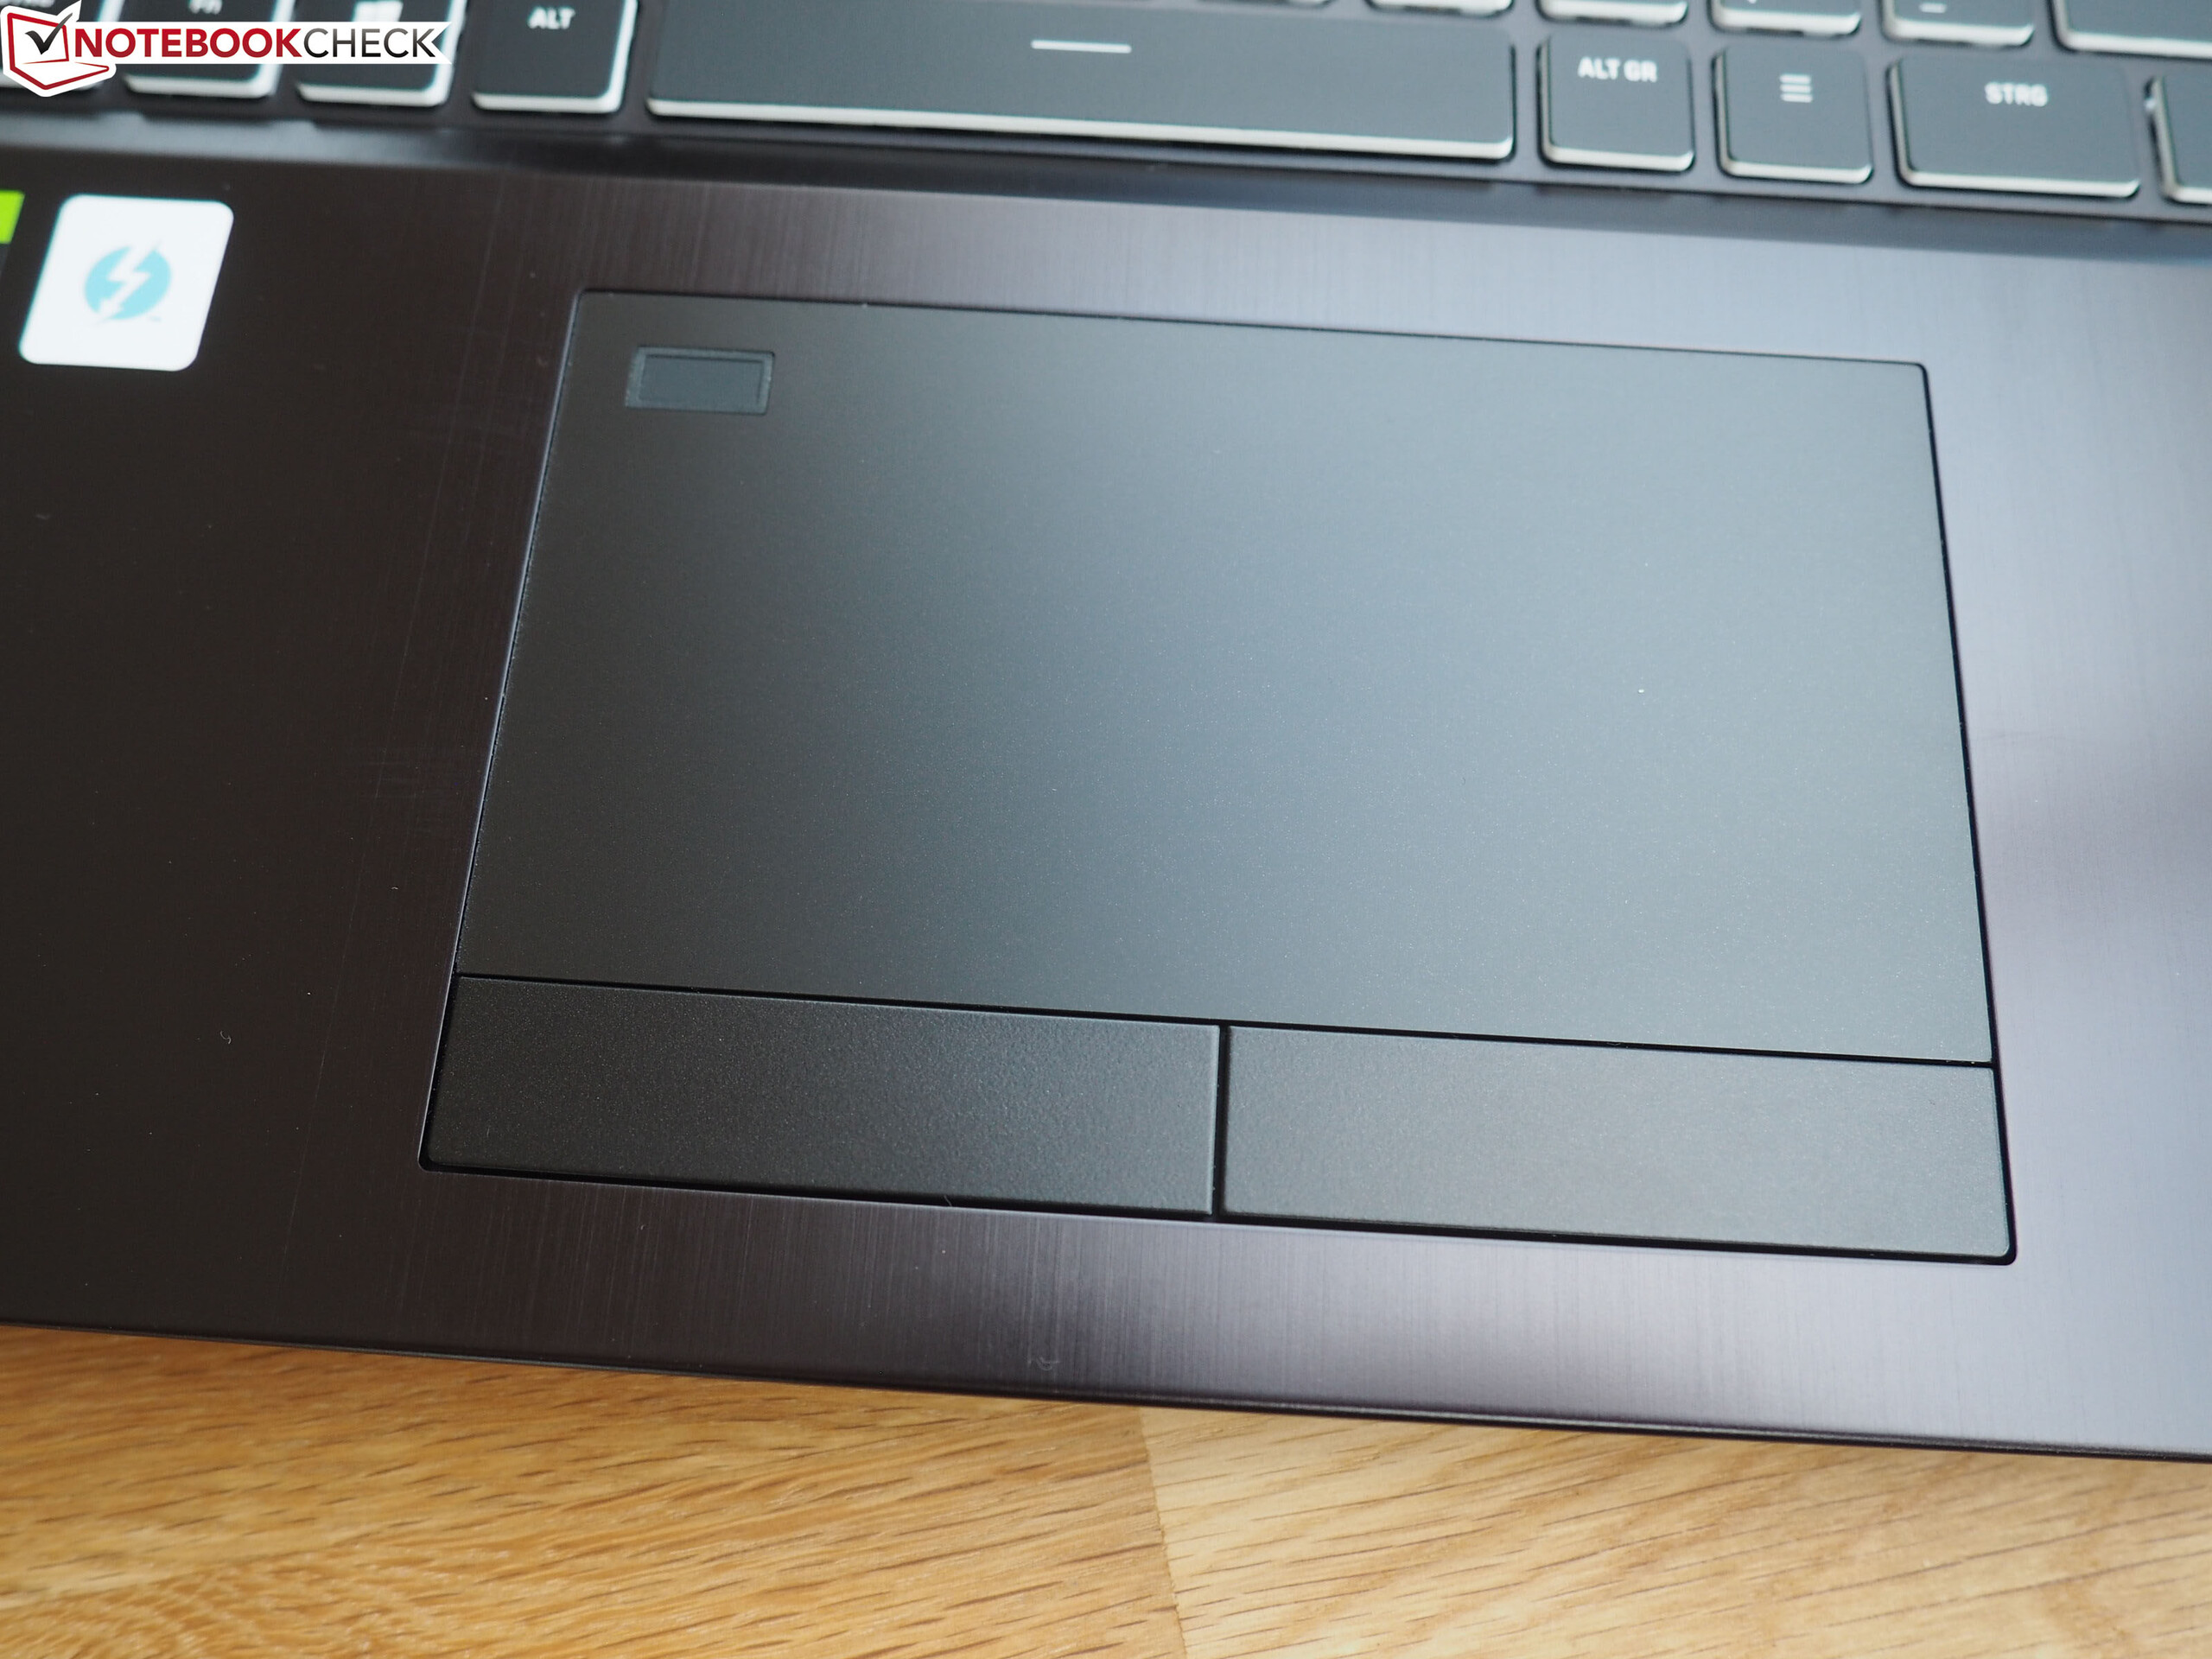
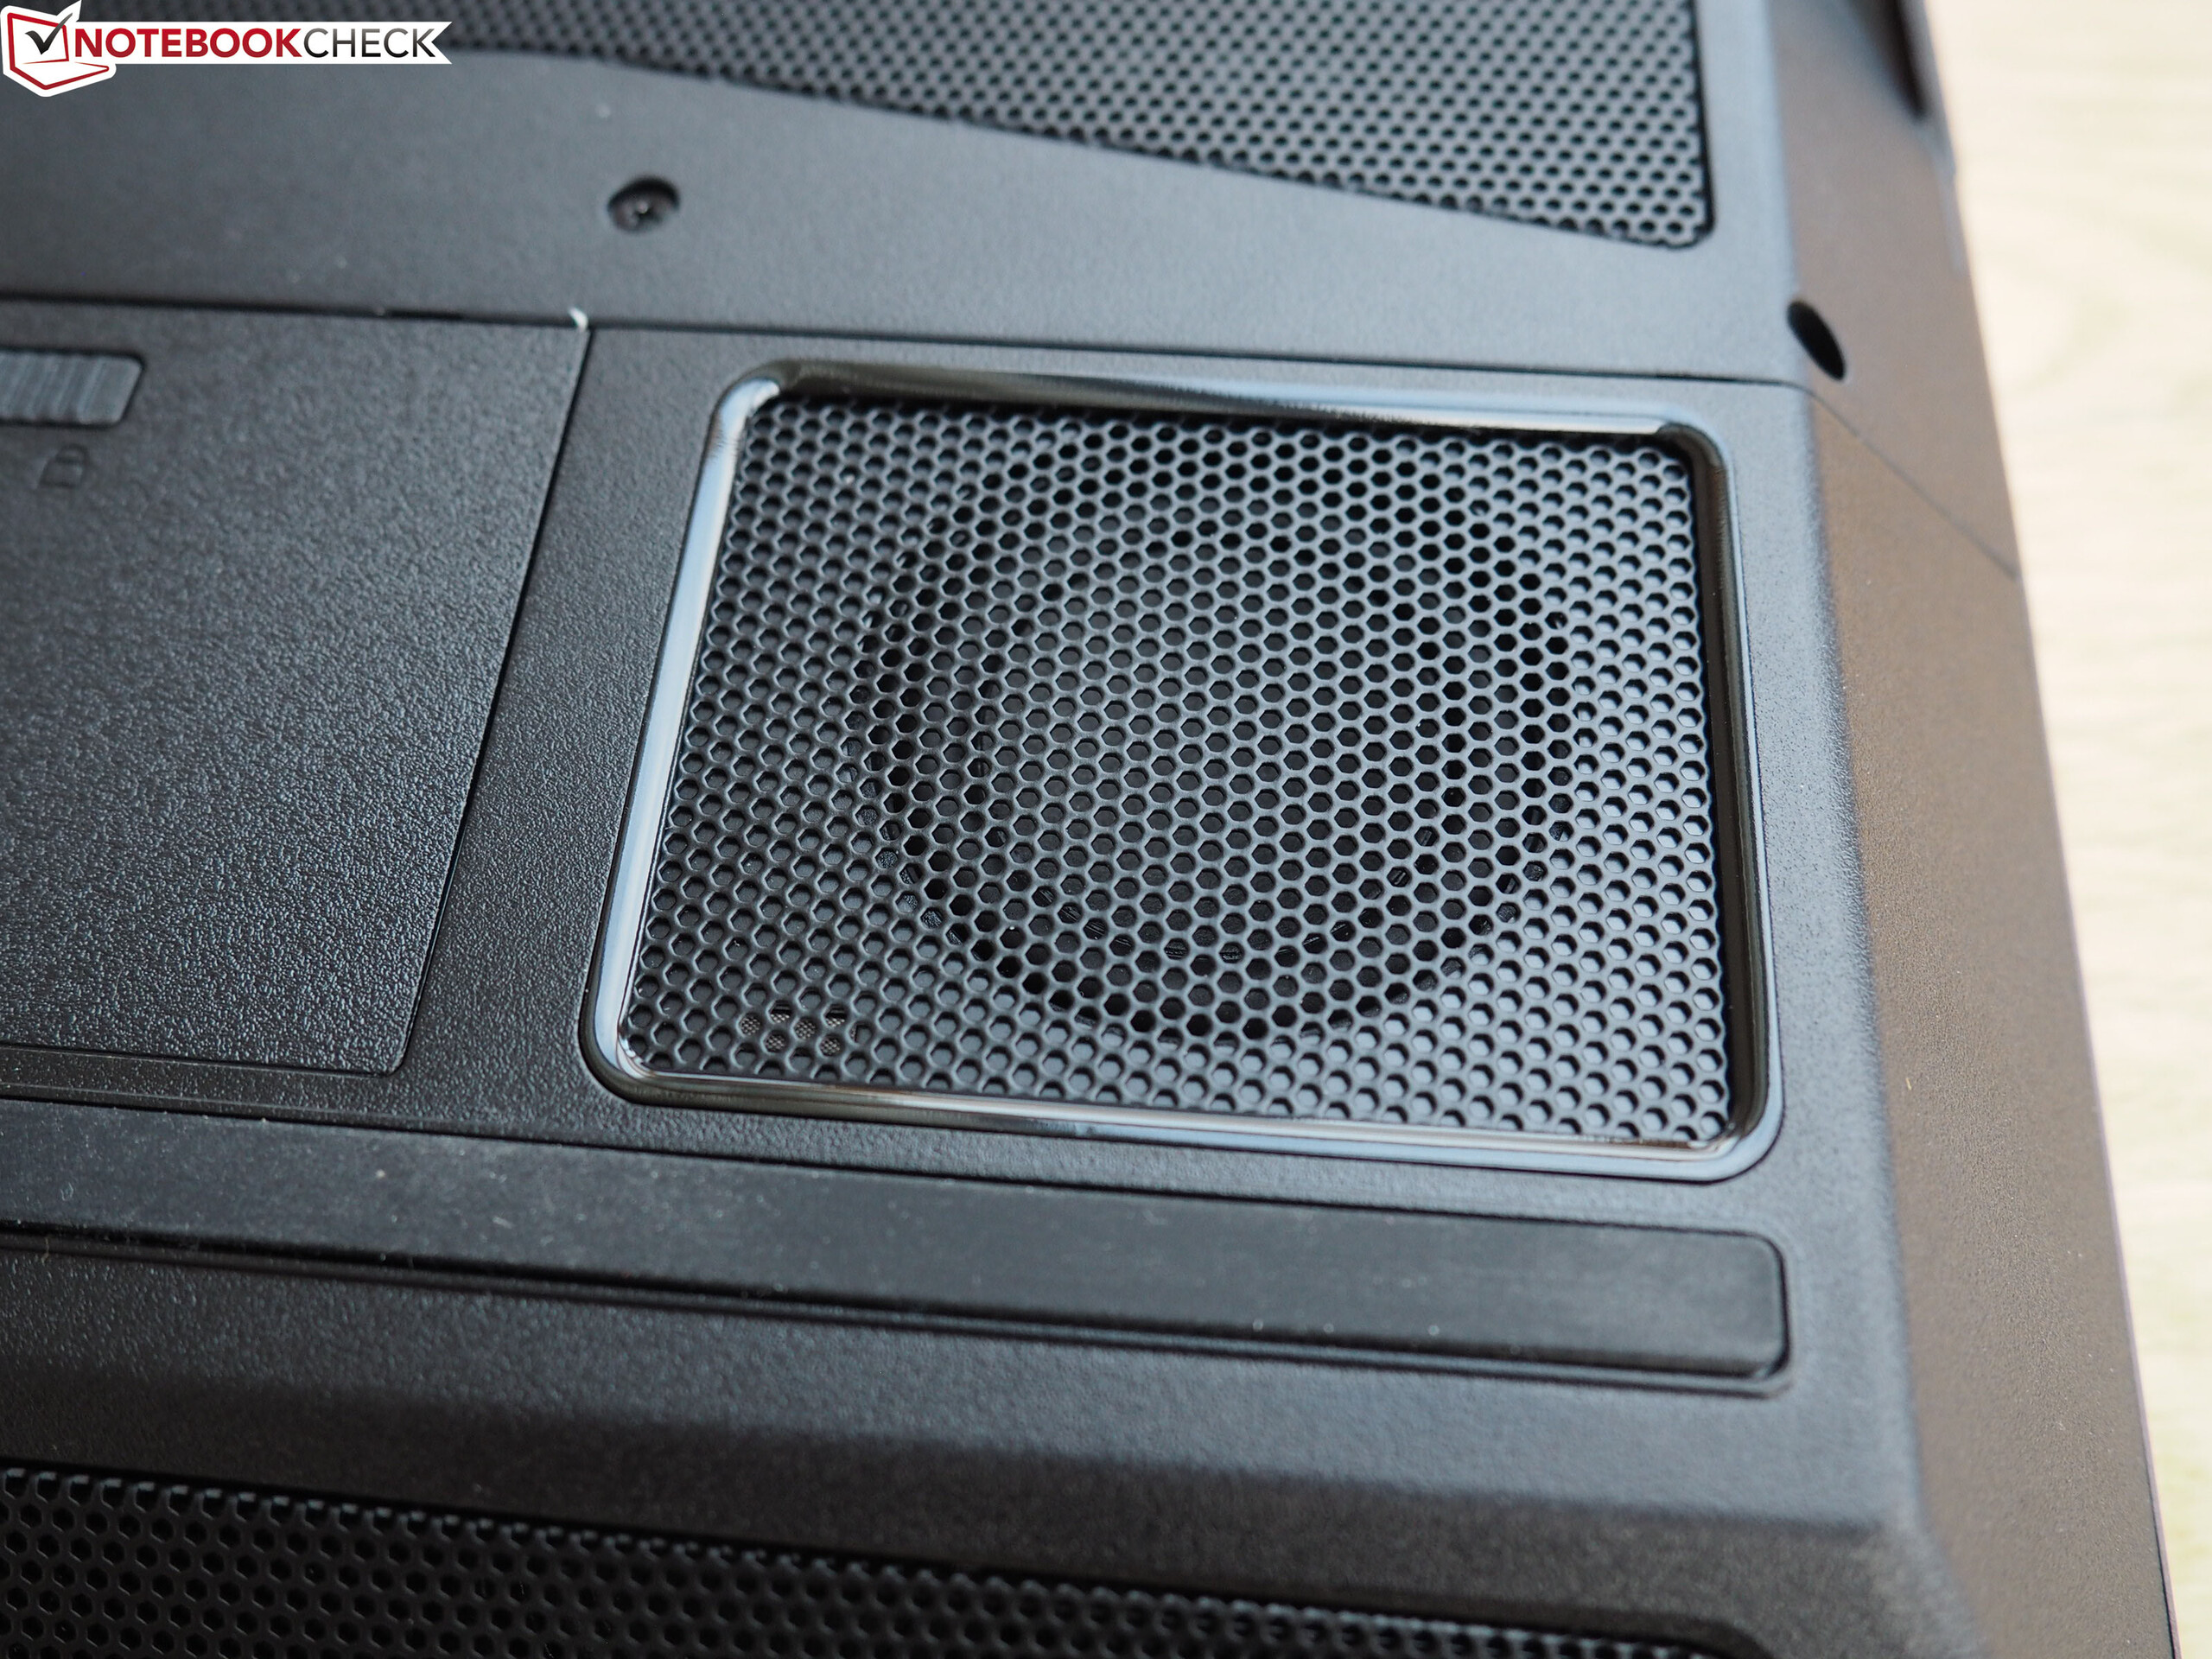
Da das XMG Ultra 17 baugleich mit dem 2020-Modell ist, gehen wir nicht weiter auf das Gehäuse, die Ausstattung, die Eingabegeräte und die Lautsprecher ein. Die entsprechenden Informationen können dem Testbericht zum Schenker XMG Ultra 17 (2020) entnommen werden.
mögliche Konkurrenten im Vergleich
Bew. | Datum | Modell | Gewicht | Dicke | Größe | Auflösung |
|---|---|---|---|---|---|---|
| 84.9 % v7 (old) | 04 / 2021 | Schenker XMG Ultra 17 Rocket Lake i9-11900K, GeForce RTX 3080 Laptop GPU | 4.7 kg | 43.5 mm | 17.30" | 1920x1080 |
| 87.4 % v7 (old) | 10 / 2020 | MSI GT76 Titan DT 10SGS i9-10900K, GeForce RTX 2080 Super Mobile | 4.2 kg | 42 mm | 17.30" | 3840x2160 |
| 82.7 % v7 (old) | 07 / 2020 | Asus Strix Scar 17 G732LXS i9-10980HK, GeForce RTX 2080 Super Mobile | 2.9 kg | 26.5 mm | 17.30" | 1920x1080 |
| 85.3 % v7 (old) | 04 / 2021 | Alienware m17 R4 i9-10980HK, GeForce RTX 3080 Laptop GPU | 3 kg | 22 mm | 17.30" | 1920x1080 |
| SD Card Reader | |
| average JPG Copy Test (av. of 3 runs) | |
| Schenker XMG Ultra 17 Rocket Lake | |
| Schenker XMG Ultra 17 Comet Lake (Toshiba Exceria Pro SDXC 64 GB UHS-II) | |
| Alienware m17 R4 (AV PRO microSD 128 GB V60) | |
| MSI GT76 Titan DT 10SGS (Toshiba Exceria Pro M501 UHS-II) | |
| Durchschnitt der Klasse Gaming (20.9 - 210, n=53, der letzten 2 Jahre) | |
| maximum AS SSD Seq Read Test (1GB) | |
| Alienware m17 R4 (AV PRO microSD 128 GB V60) | |
| Schenker XMG Ultra 17 Comet Lake (Toshiba Exceria Pro SDXC 64 GB UHS-II) | |
| Schenker XMG Ultra 17 Rocket Lake (AV PRO microSD 128 GB V60) | |
| MSI GT76 Titan DT 10SGS (Toshiba Exceria Pro M501 UHS-II) | |
| Durchschnitt der Klasse Gaming (25.5 - 261, n=50, der letzten 2 Jahre) | |


")
")


")
")


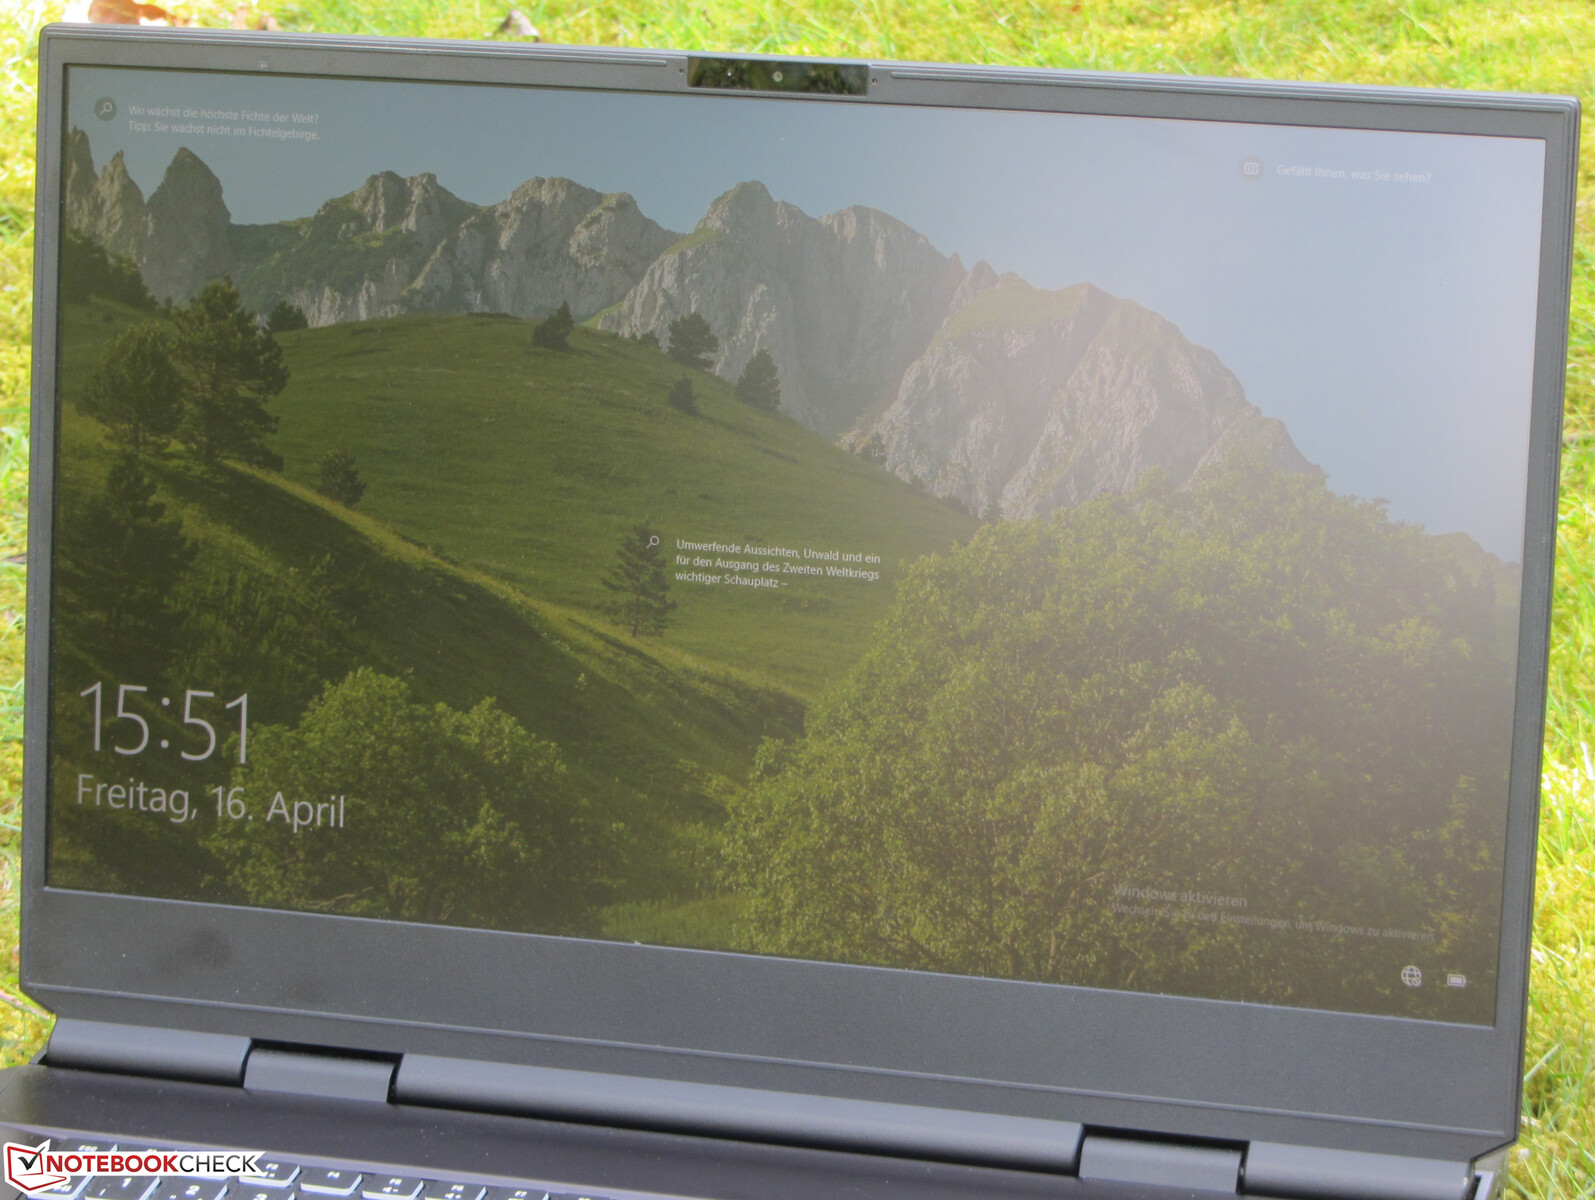
Display - 300-Hz-IPS
Während der matte 17,3-Zoll-Bildschirm (1.920 x 1.080 Bildpunkte) einen guten Kontrast (1.391:1) liefert, erfüllt die Helligkeit (299,3 cd/m²) mit Ach und Krach das Soll (> 300 cd/m²). Das 300-Hz-Panel bietet kurze Reaktionszeiten und zeigt kein PWM-Flimmern.
Das Display unterstützt Nvidias G-Sync Technologie. Hierdurch werden die Bildwiederholraten von Display und GPU dynamisch aneinander angepasst. So soll - insbesondere bei Computerspielen - ein möglichst flüssiges Bild erzeugt werden.
| |||||||||||||||||||||||||
Ausleuchtung: 93 %
Helligkeit Akku: 306 cd/m²
Kontrast: 1391:1 (Schwarzwert: 0.22 cd/m²)
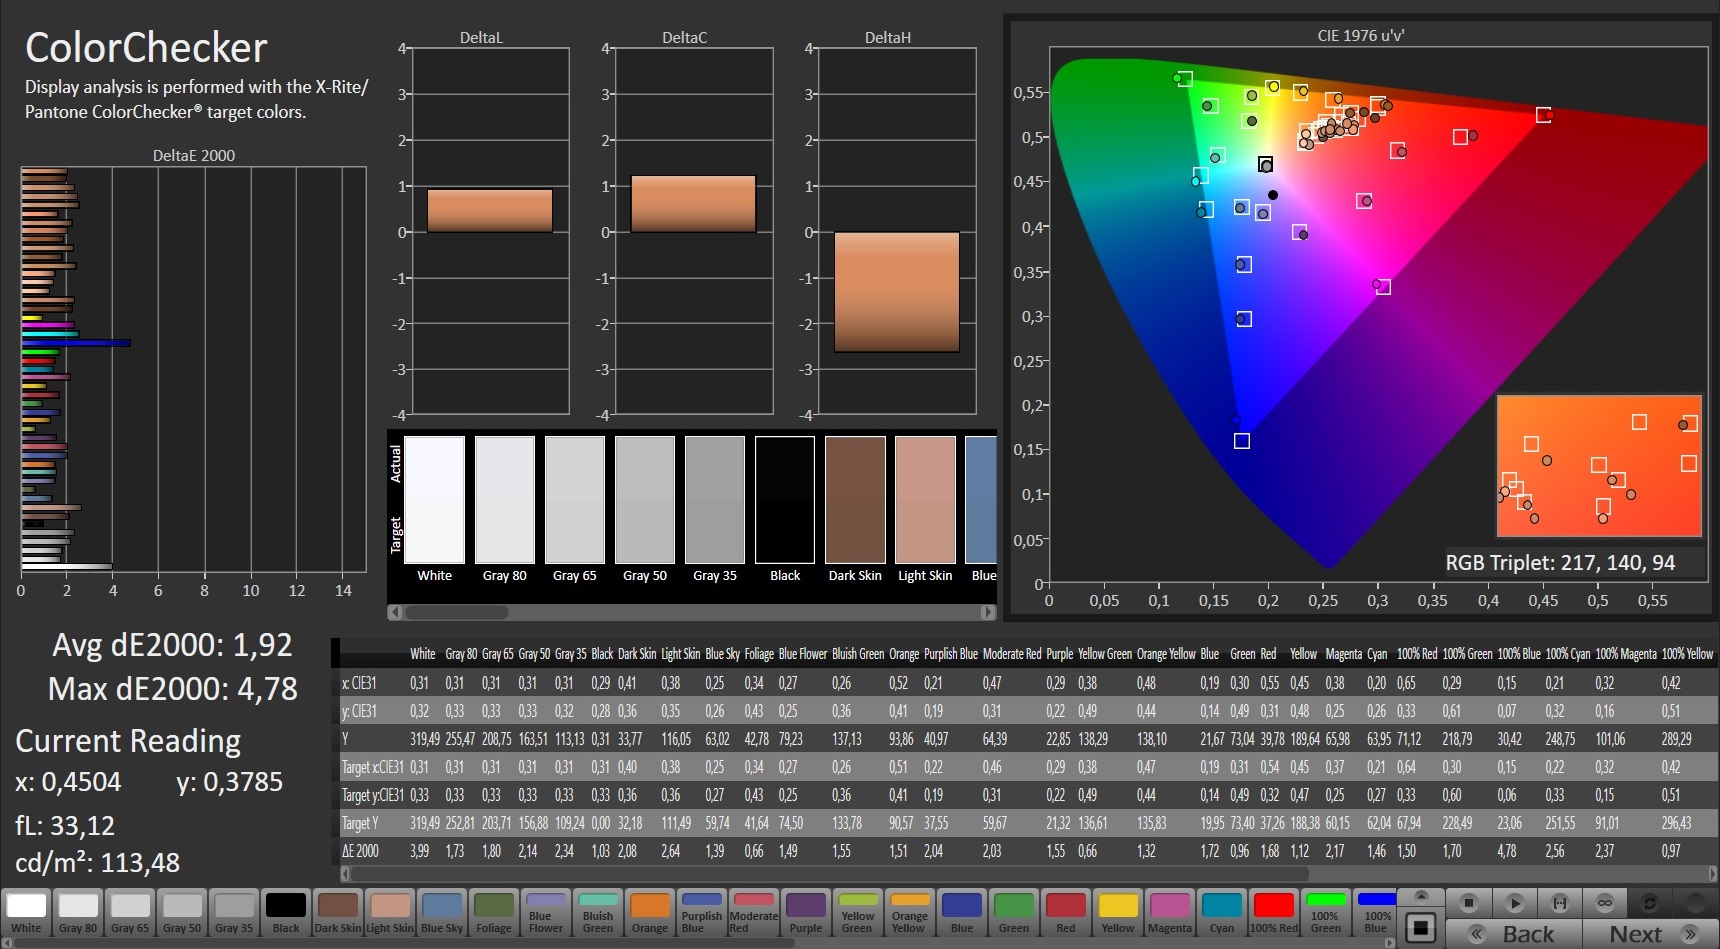
ΔE ColorChecker Calman: 1.92 | ∀{0.5-29.43 Ø4.72}
calibrated: 1.34
ΔE Greyscale Calman: 2 | ∀{0.09-98 Ø4.97}
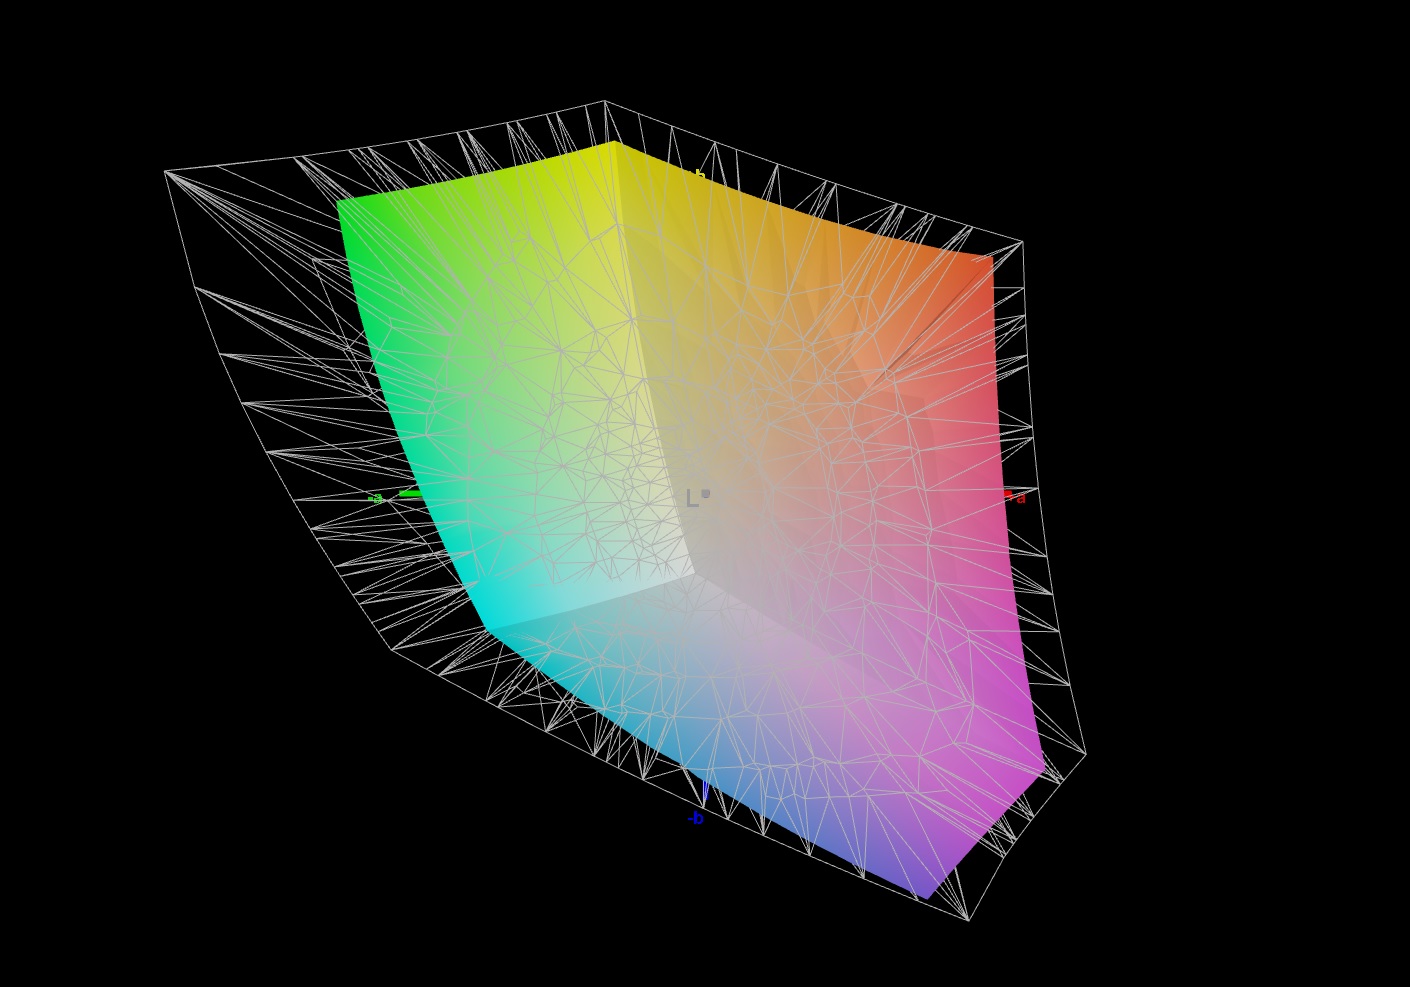
93% sRGB (Argyll 1.6.3 3D)
72% AdobeRGB 1998 (Argyll 1.6.3 3D)
72% AdobeRGB 1998 (Argyll 3D)
97.2% sRGB (Argyll 3D)
69.8% Display P3 (Argyll 3D)
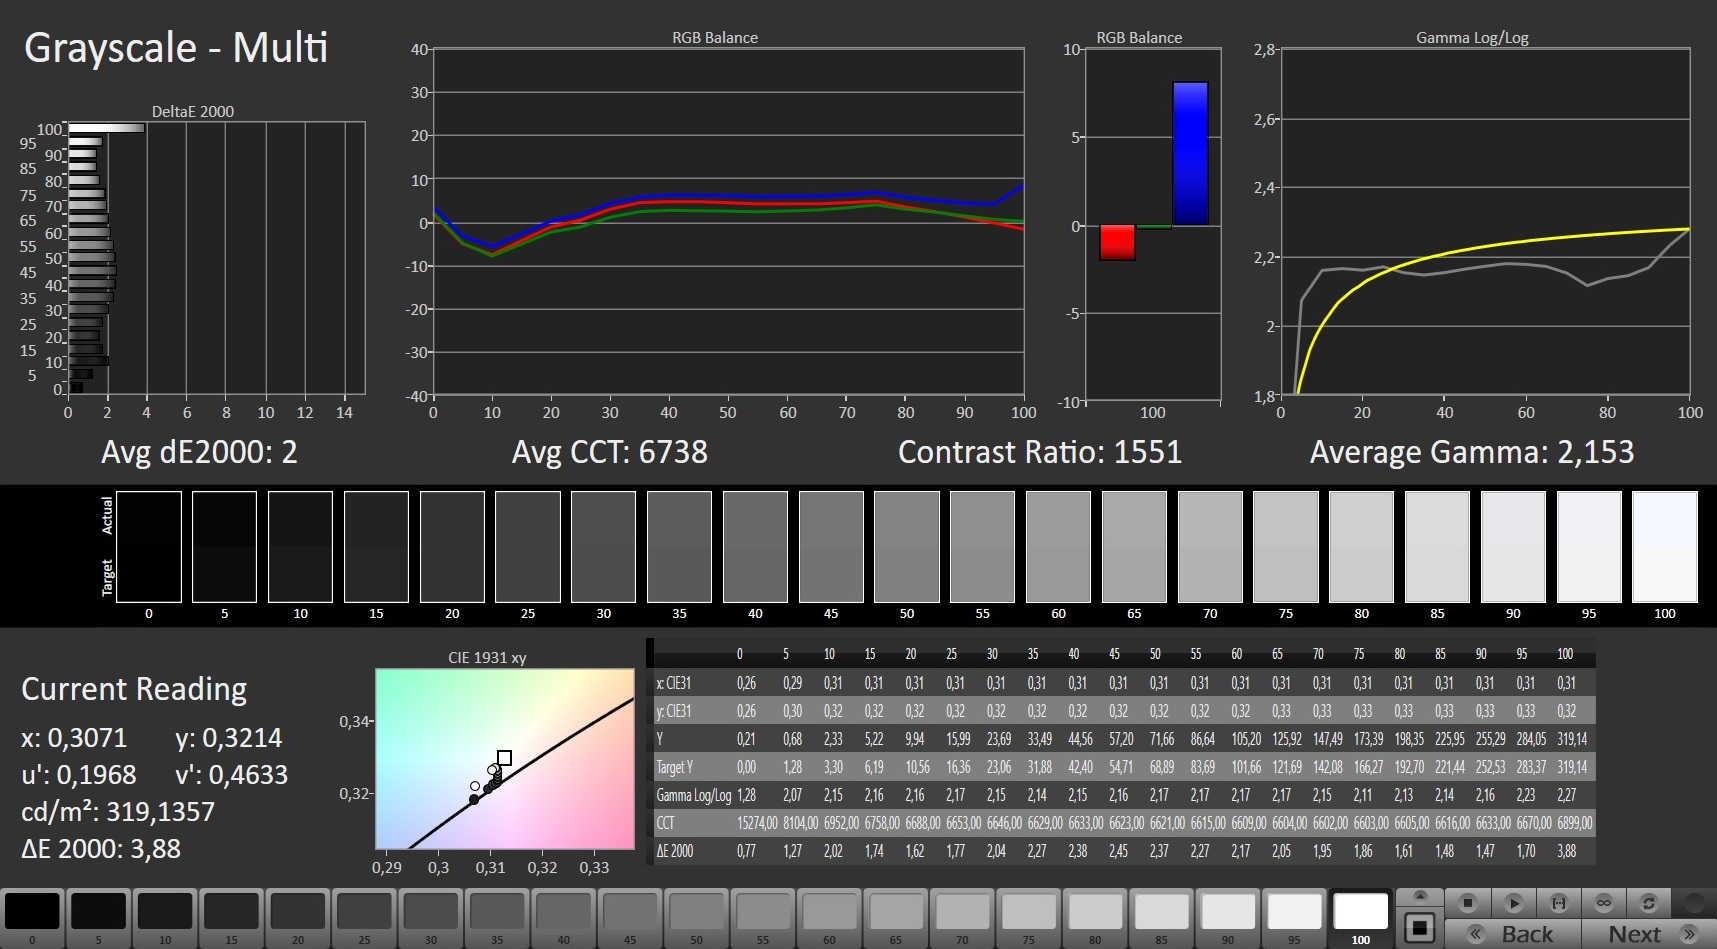
Gamma: 2.153
CCT: 6738 K
| Schenker XMG Ultra 17 Rocket Lake AU Optronics B173HAN05.1, IPS, 1920x1080, 17.3" | MSI GT76 Titan DT 10SGS AU Optronics B173ZAN03.3, IPS, 3840x2160, 17.3" | Asus Strix Scar 17 G732LXS LQ173M1JW03 (SHP14DC), IPS, 1920x1080, 17.3" | Schenker XMG Ultra 17 Comet Lake AUO B173ZAN03.0 (AUO309B), IPS, 3840x2160, 17.3" | Alienware m17 R4 AU Optronics AUOEC91, IPS, 1920x1080, 17.3" | |
|---|---|---|---|---|---|
| Display | 18% | 1% | 19% | 1% | |
| Display P3 Coverage (%) | 69.8 | 82.5 18% | 71 2% | 83 19% | 69.8 0% |
| sRGB Coverage (%) | 97.2 | 98 1% | 99 2% | 99.1 2% | 99.7 3% |
| AdobeRGB 1998 Coverage (%) | 72 | 96.6 34% | 71.6 -1% | 97.9 36% | 71.6 -1% |
| Response Times | -170% | 3% | -468% | -68% | |
| Response Time Grey 50% / Grey 80% * (ms) | 5.6 ? | 23.2 ? -314% | 5.8 ? -4% | 50.4 ? -800% | 13.2 ? -136% |
| Response Time Black / White * (ms) | 9.2 ? | 11.6 ? -26% | 8.4 ? 9% | 21.6 ? -135% | 9.2 ? -0% |
| PWM Frequency (Hz) | |||||
| Bildschirm | -26% | -31% | -38% | 12% | |
| Helligkeit Bildmitte (cd/m²) | 306 | 419.5 37% | 310 1% | 442 44% | 305 0% |
| Brightness (cd/m²) | 299 | 413 38% | 311 4% | 423 41% | 301 1% |
| Brightness Distribution (%) | 93 | 93 0% | 82 -12% | 92 -1% | 93 0% |
| Schwarzwert * (cd/m²) | 0.22 | 0.4 -82% | 0.41 -86% | 0.36 -64% | 0.19 14% |
| Kontrast (:1) | 1391 | 1049 -25% | 756 -46% | 1228 -12% | 1605 15% |
| Delta E Colorchecker * | 1.92 | 3.4 -77% | 2.41 -26% | 4.38 -128% | 1.31 32% |
| Colorchecker dE 2000 max. * | 4.78 | 7.4 -55% | 8.59 -80% | 10.85 -127% | 2.32 51% |
| Colorchecker dE 2000 calibrated * | 1.34 | 3.28 -145% | 1.13 16% | 0.66 51% | 0.91 32% |
| Delta E Graustufen * | 2 | 2 -0% | 4.3 -115% | 7.3 -265% | 2.3 -15% |
| Gamma | 2.153 102% | 2.14 103% | 2.149 102% | 2.17 101% | 2.281 96% |
| CCT | 6738 96% | 6858 95% | 7059 92% | 6906 94% | 6449 101% |
| Farbraum (Prozent von AdobeRGB 1998) (%) | 72 | 84.6 17% | 72 0% | 98 36% | 72 0% |
| Color Space (Percent of sRGB) (%) | 93 | 97.9 5% | 94 1% | 98 5% | 94 1% |
| Durchschnitt gesamt (Programm / Settings) | -59% /
-36% | -9% /
-21% | -162% /
-81% | -18% /
-0% |
* ... kleinere Werte sind besser
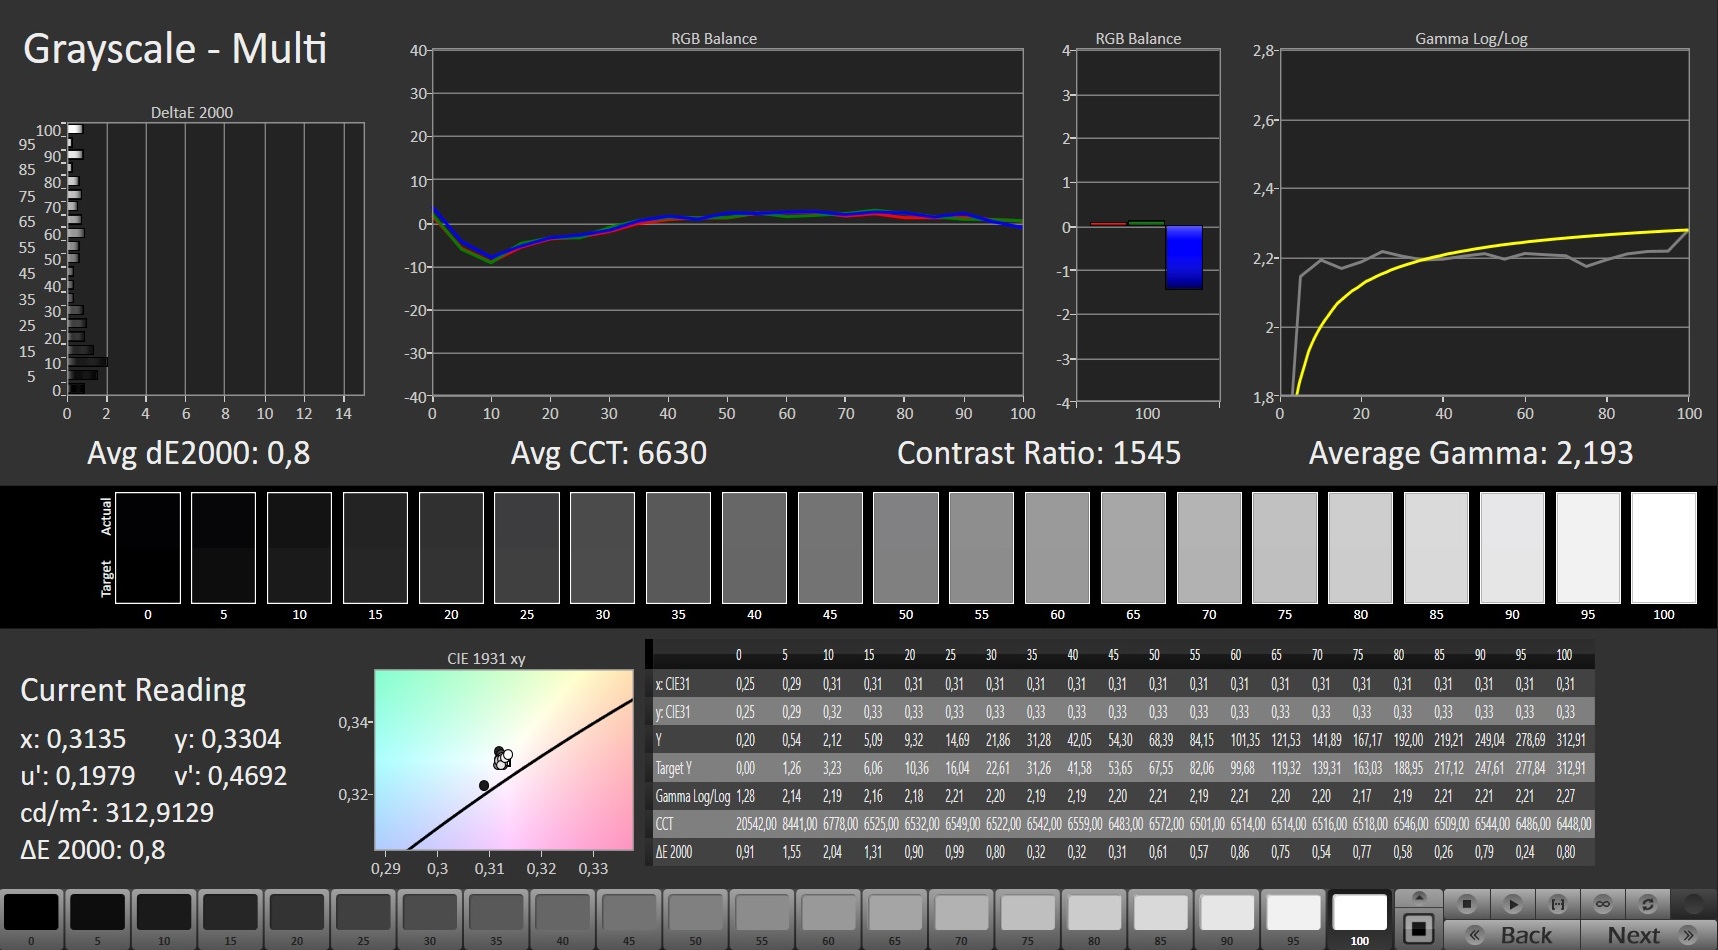
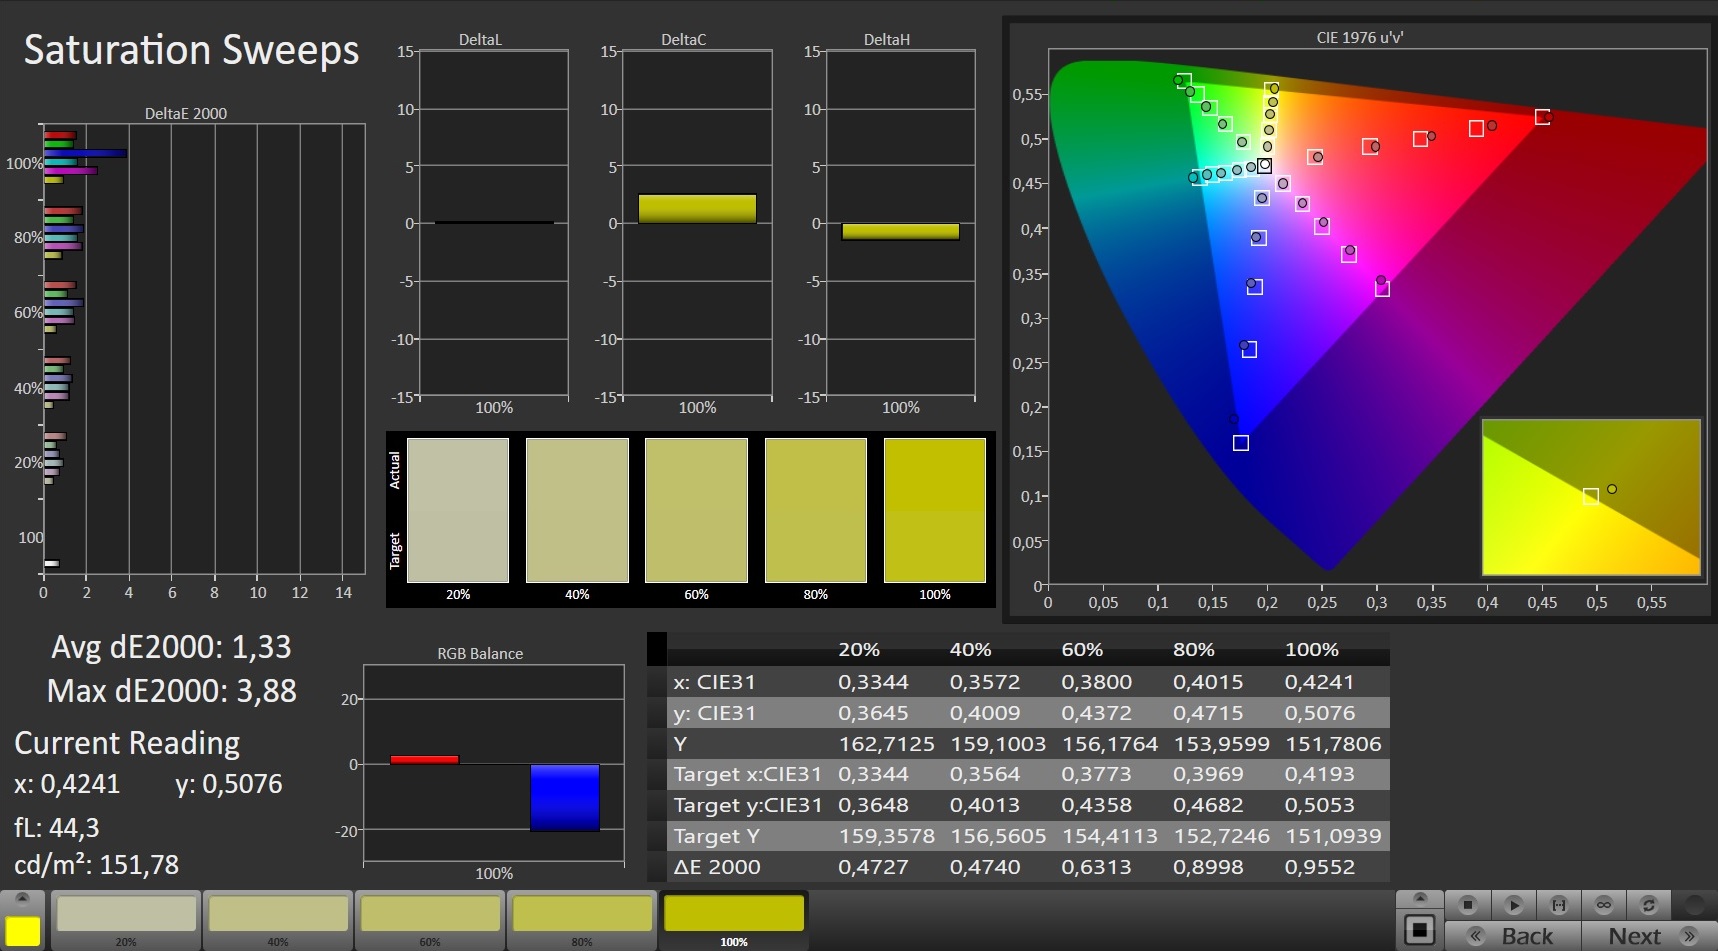
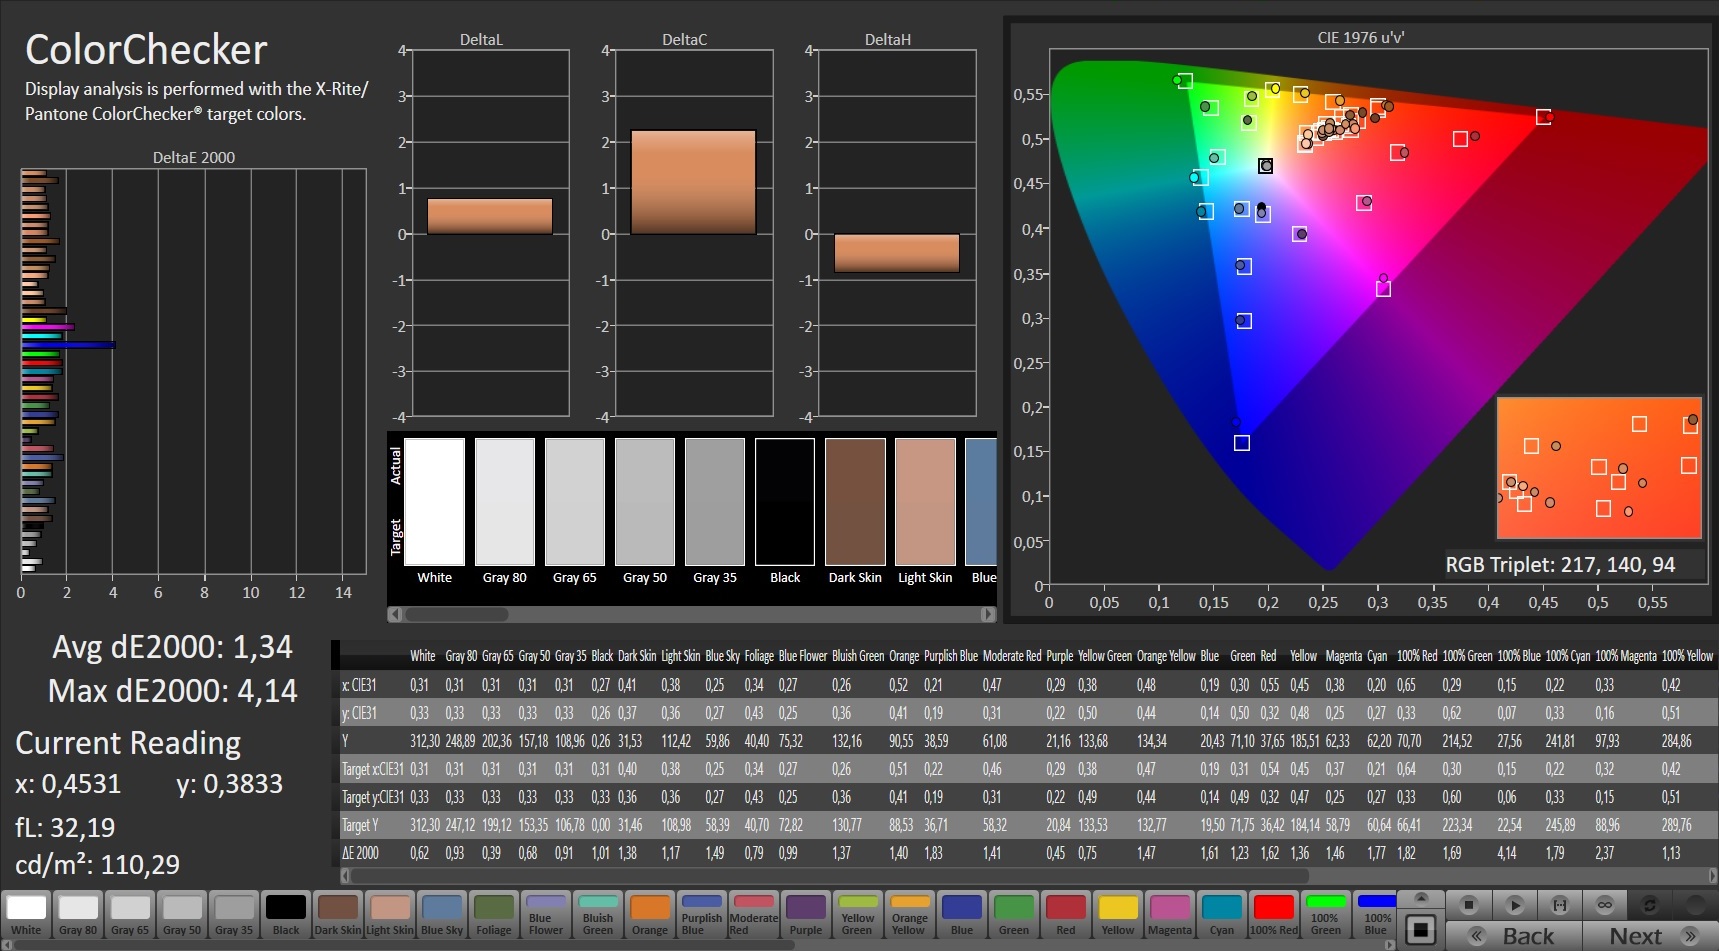
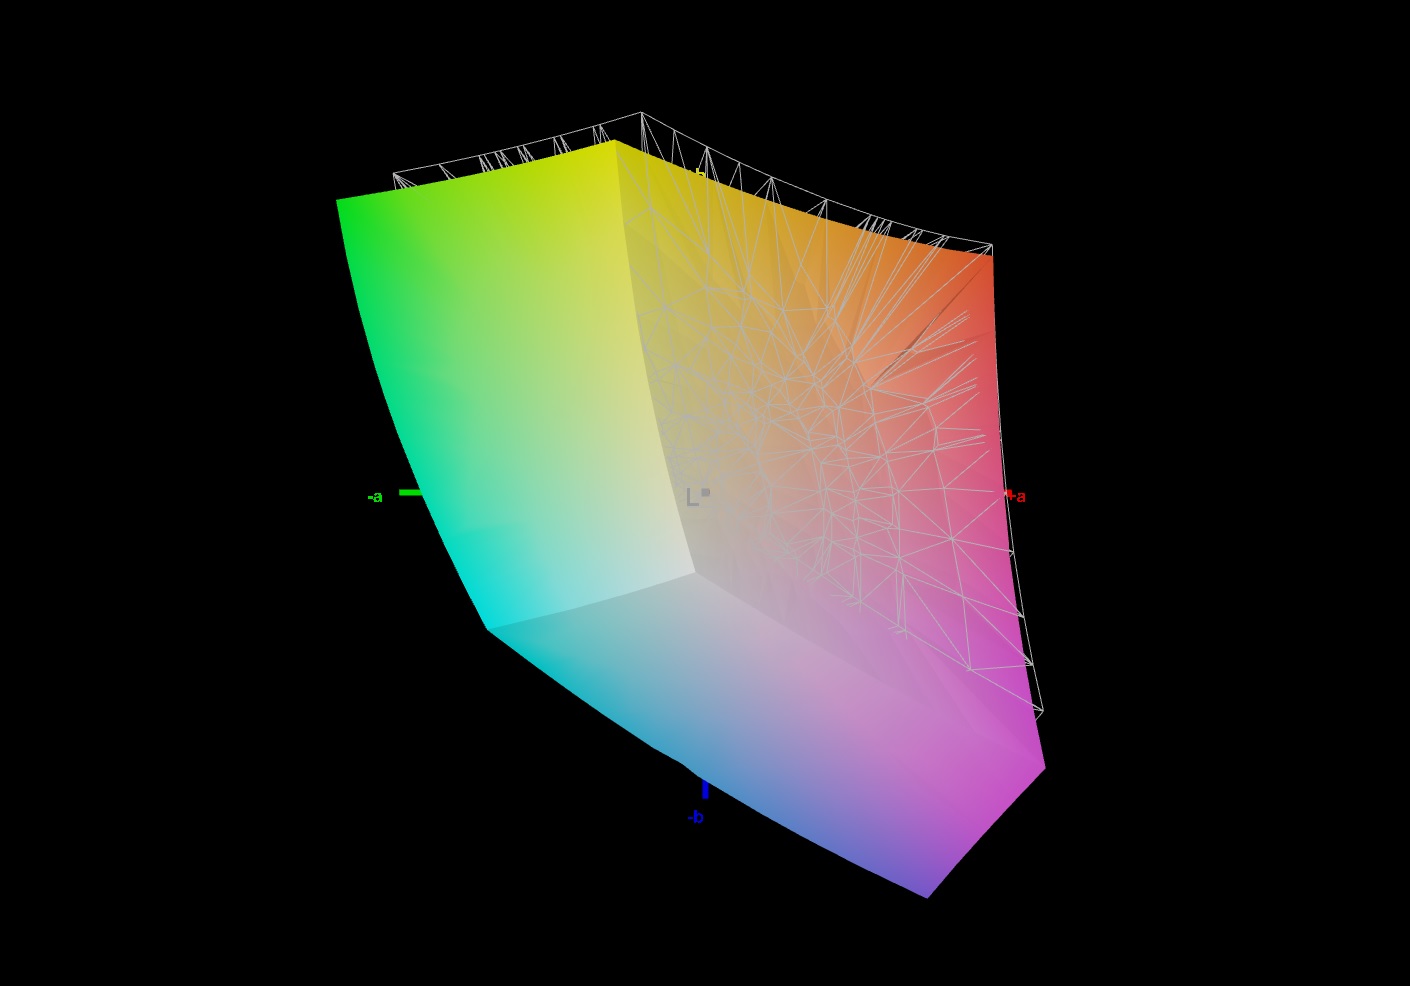
Im Auslieferungszustand zeigt der Bildschirm bereits eine gute Farbdarstellung und erfüllt mit einer Abweichung von knapp 2 das Soll (Delta E kleiner 3). Unter einem Blaustich leidet er nicht. Eine Kalibrierung sorgt für Verbesserungen: So sinkt die Farbabweichung auf 1,34 und die Graustufen werden ausgewogener dargestellt. Die Farbräume AdobeRGB (72 Prozent) und sRGB (93 Prozent) kann das Display nicht vollständig abbilden.

Reaktionszeiten (Response Times) des Displays
| ↔ Reaktionszeiten Schwarz zu Weiß | ||
|---|---|---|
| 9.2 ms ... steigend ↗ und fallend ↘ kombiniert | ↗ 4.8 ms steigend | 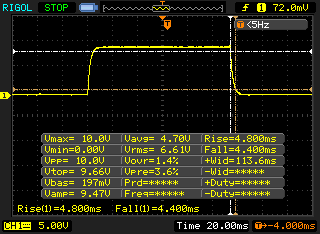 |
| ↘ 4.4 ms fallend | ||
| Die gemessenen Reaktionszeiten sind kurz wodurch sich der Bildschirm auch für Spiele gut eignen sollte. Im Vergleich rangierten die bei uns getesteten Geräte von 0.1 (Minimum) zu 240 (Maximum) ms. » 26 % aller Screens waren schneller als der getestete. Daher sind die gemessenen Reaktionszeiten besser als der Durchschnitt aller vermessenen Geräte (19.8 ms). | ||
| ↔ Reaktionszeiten 50% Grau zu 80% Grau | ||
| 5.6 ms ... steigend ↗ und fallend ↘ kombiniert | ↗ 2.8 ms steigend | 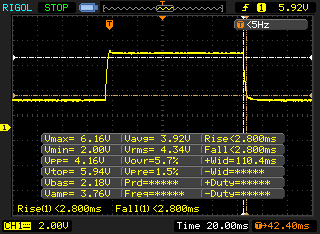 |
| ↘ 2.8 ms fallend | ||
| Die gemessenen Reaktionszeiten sind sehr kurz, wodurch sich der Bildschirm auch für schnelle 3D Spiele eignen sollte. Im Vergleich rangierten die bei uns getesteten Geräte von 0.165 (Minimum) zu 636 (Maximum) ms. » 18 % aller Screens waren schneller als der getestete. Daher sind die gemessenen Reaktionszeiten besser als der Durchschnitt aller vermessenen Geräte (31 ms). | ||
Bildschirm-Flackern / PWM (Pulse-Width Modulation)
| Flackern / PWM nicht festgestellt | 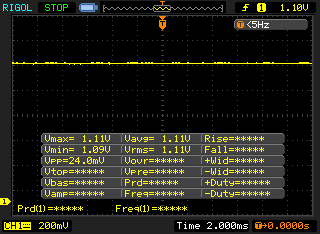 | ||
Im Vergleich: 52 % aller getesteten Geräte nutzten kein PWM um die Helligkeit zu reduzieren. Wenn PWM eingesetzt wurde, dann bei einer Frequenz von durchschnittlich 7763 (Minimum 5, Maximum 343500) Hz. | |||
Das blickwinkelstabile IPS-Panel ist aus jeder Position heraus ablesbar. Im Freien ist ein Ablesen des Displays durchaus möglich, wenn die Sonne nicht zu hell strahlt.

Leistung - XMG Ultra 17 erlaubt CPU- und GPU-Tausch
Schenkers Desktop-Replacement-Notebook bietet sehr viel Rechenleistung und gibt entsprechend in allen gängigen Anwendungsbereichen eine gute Figur ab. Das Gerät kann sehr individuell konfiguriert werden.

Testbedingungen
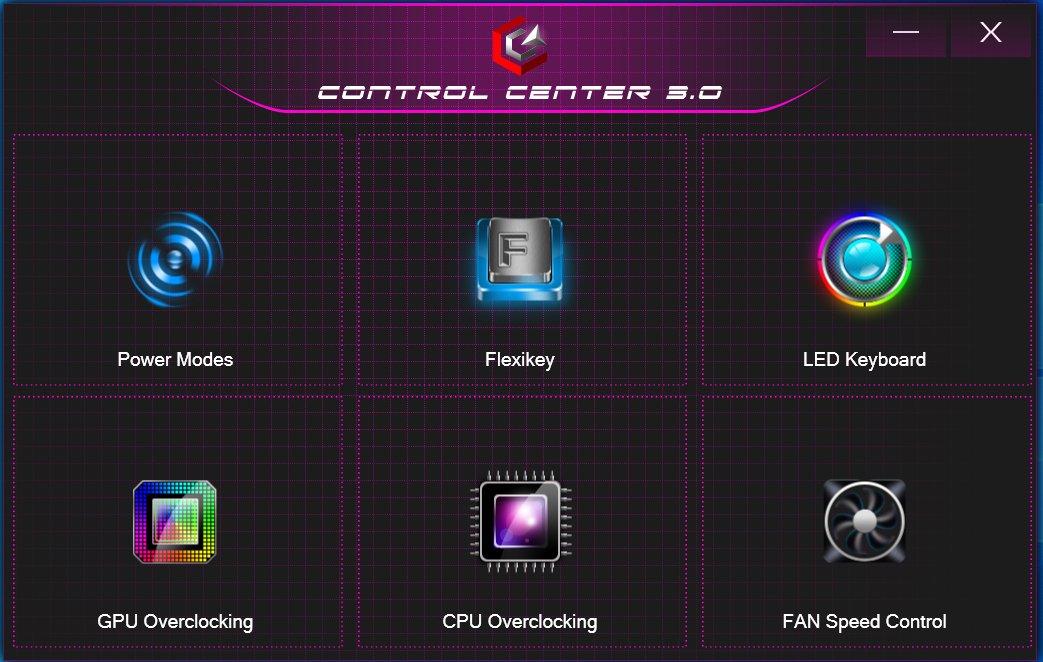
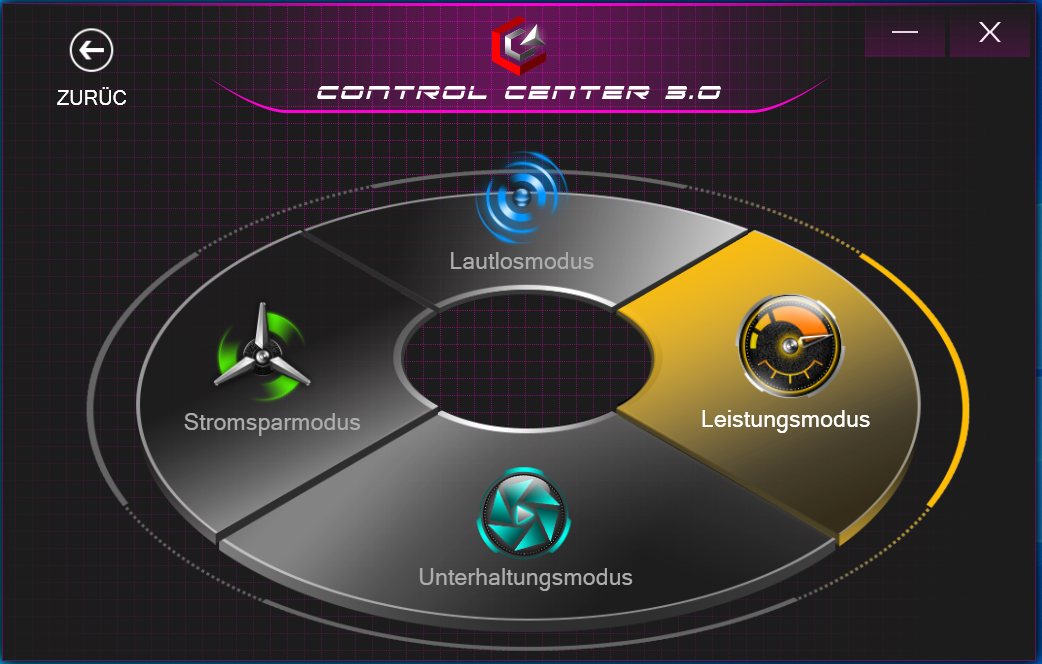
Das vorinstallierte Control Center ermöglicht u. a. die Wahl eines Leistungsprofils. Wir haben unsere 3D-Tests bei aktivem "Leistungsmodus"-Profil und automatischer Lüftersteuerung durchgeführt. Für die Idle- und Akkutests haben wir das "Unterhaltungsmodus"-Profil genutzt.
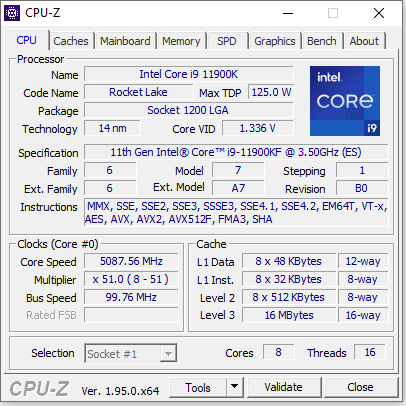
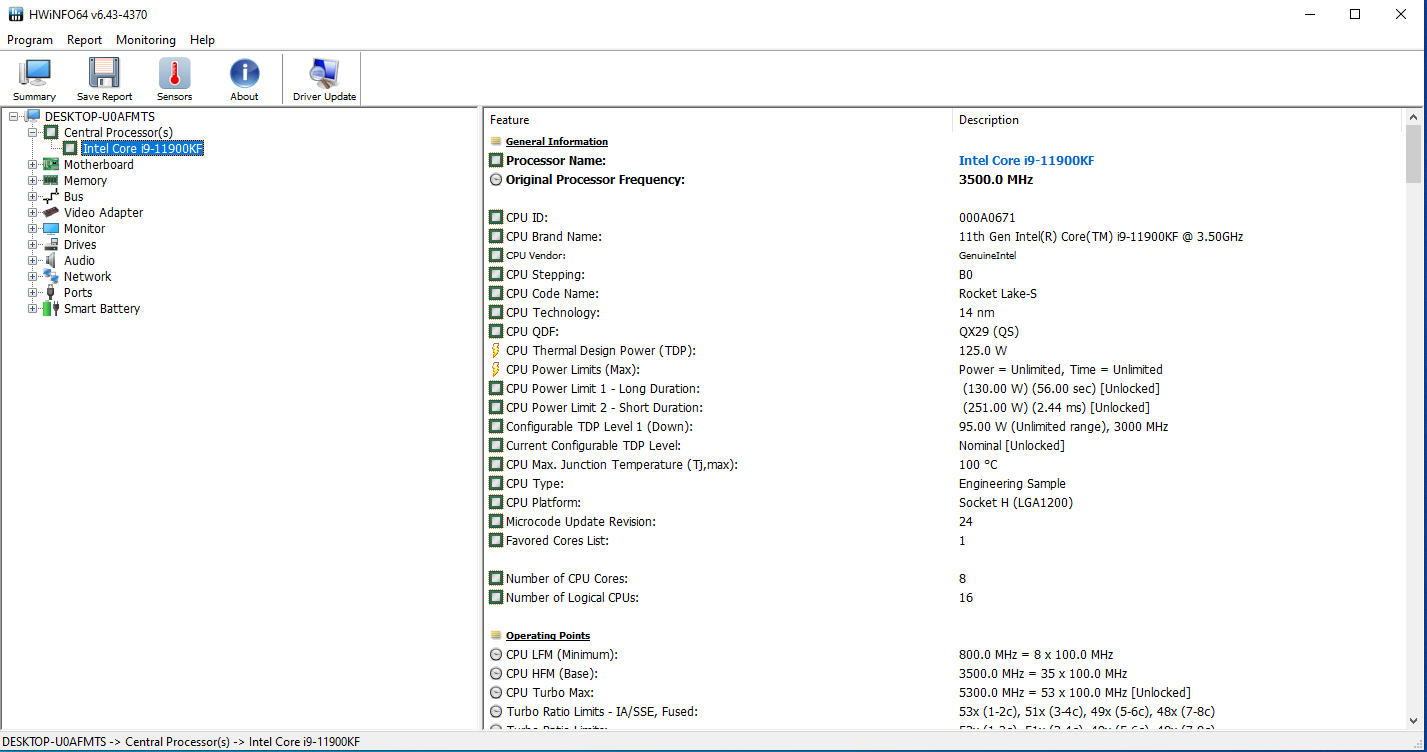
Prozessor
Der Core-i9-11900K-Achtkernprozessor (Rocket Lake) arbeitet mit einem Basistakt von 3,5 GHz. Per Turbo kann der Takt auf 4,8 GHz (acht Kerne) bis 5,3 GHz (ein Kern) gesteigert werden. Hyperthreading (zwei Threads pro Kern) wird unterstützt. Dank des freien Multiplikators ließe sich der Prozessor recht einfach übertakten. Die CPU steckt in einem Sockel und könnte somit getauscht werden.
Die CPU-Tests des Cinebench-R15-Benchmarks werden mit 4,6 bis 4,8 GHz (Multi-Thread) bzw. 4,8 bis 5,3 GHz (Single-Thread) durchlaufen. Im Akkubetrieb werkelt die CPU mit 800 MHz bis 4,8 GHz (Multi-Thread) bzw. 3,6 bis 5,1 GHz (Single-Thread).
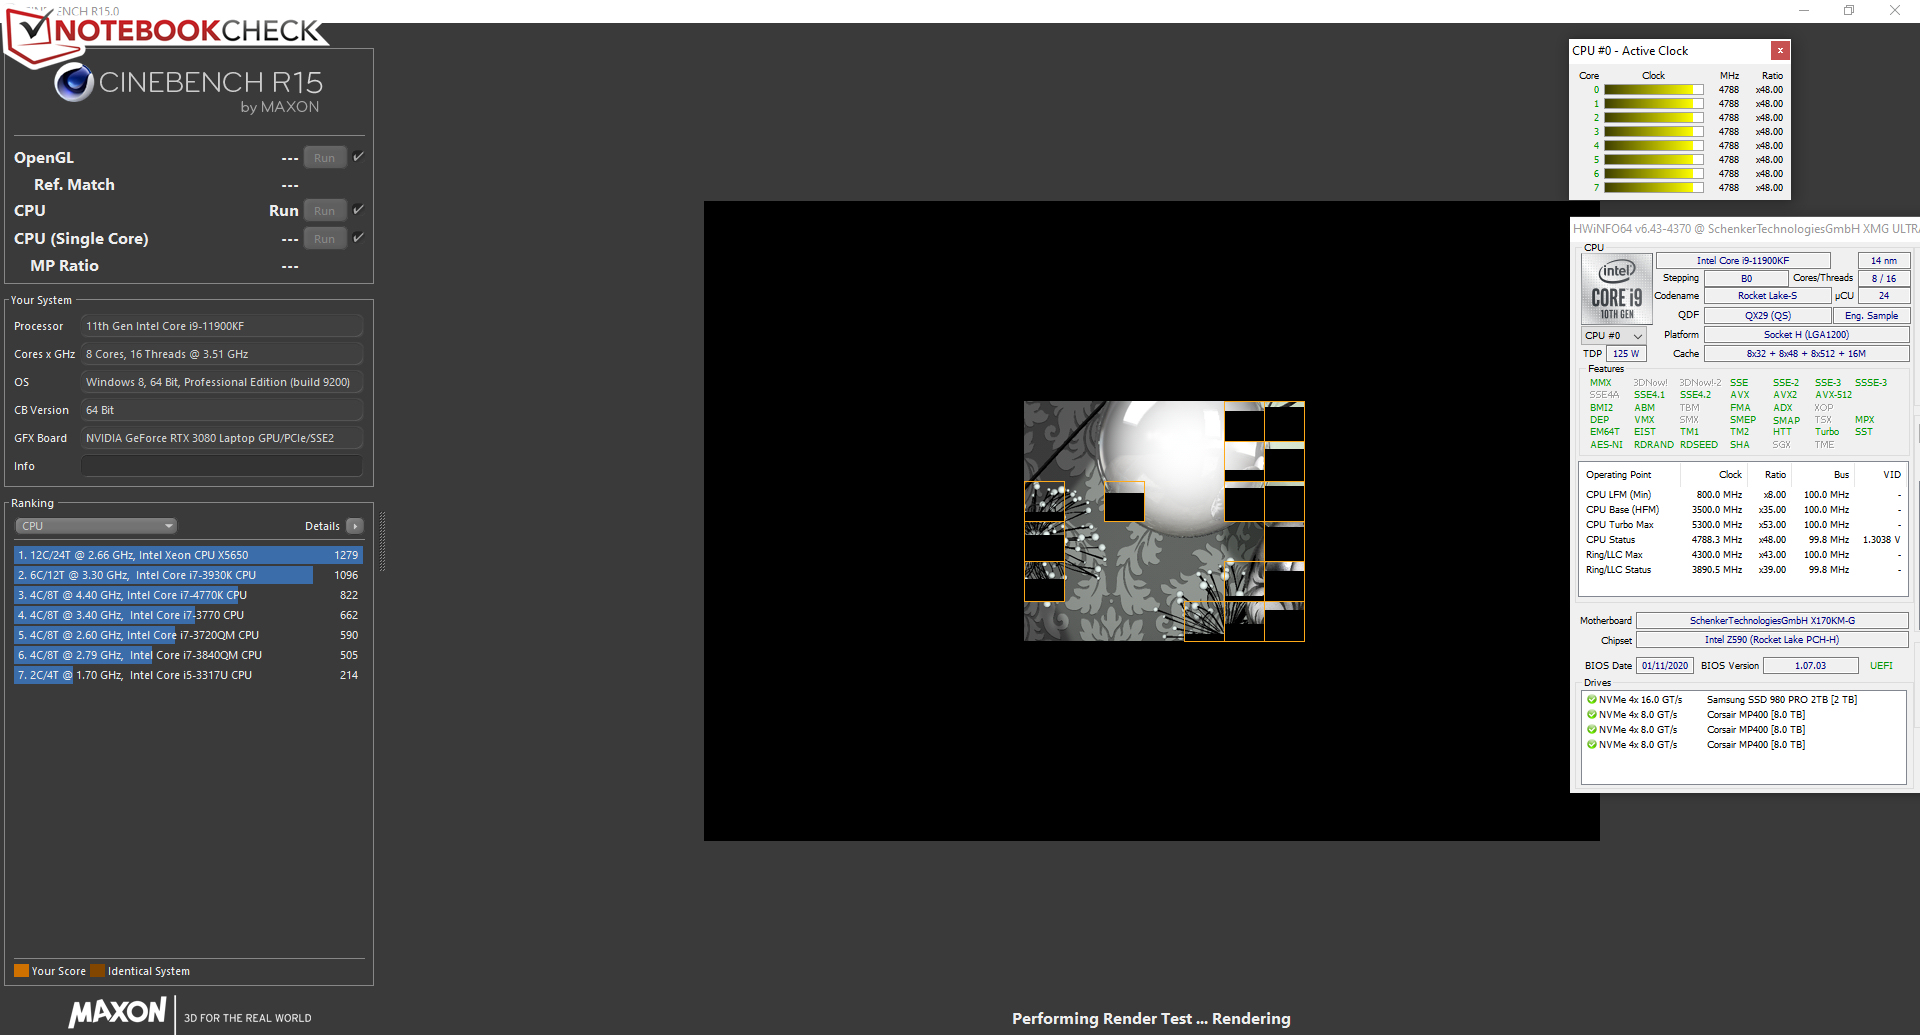
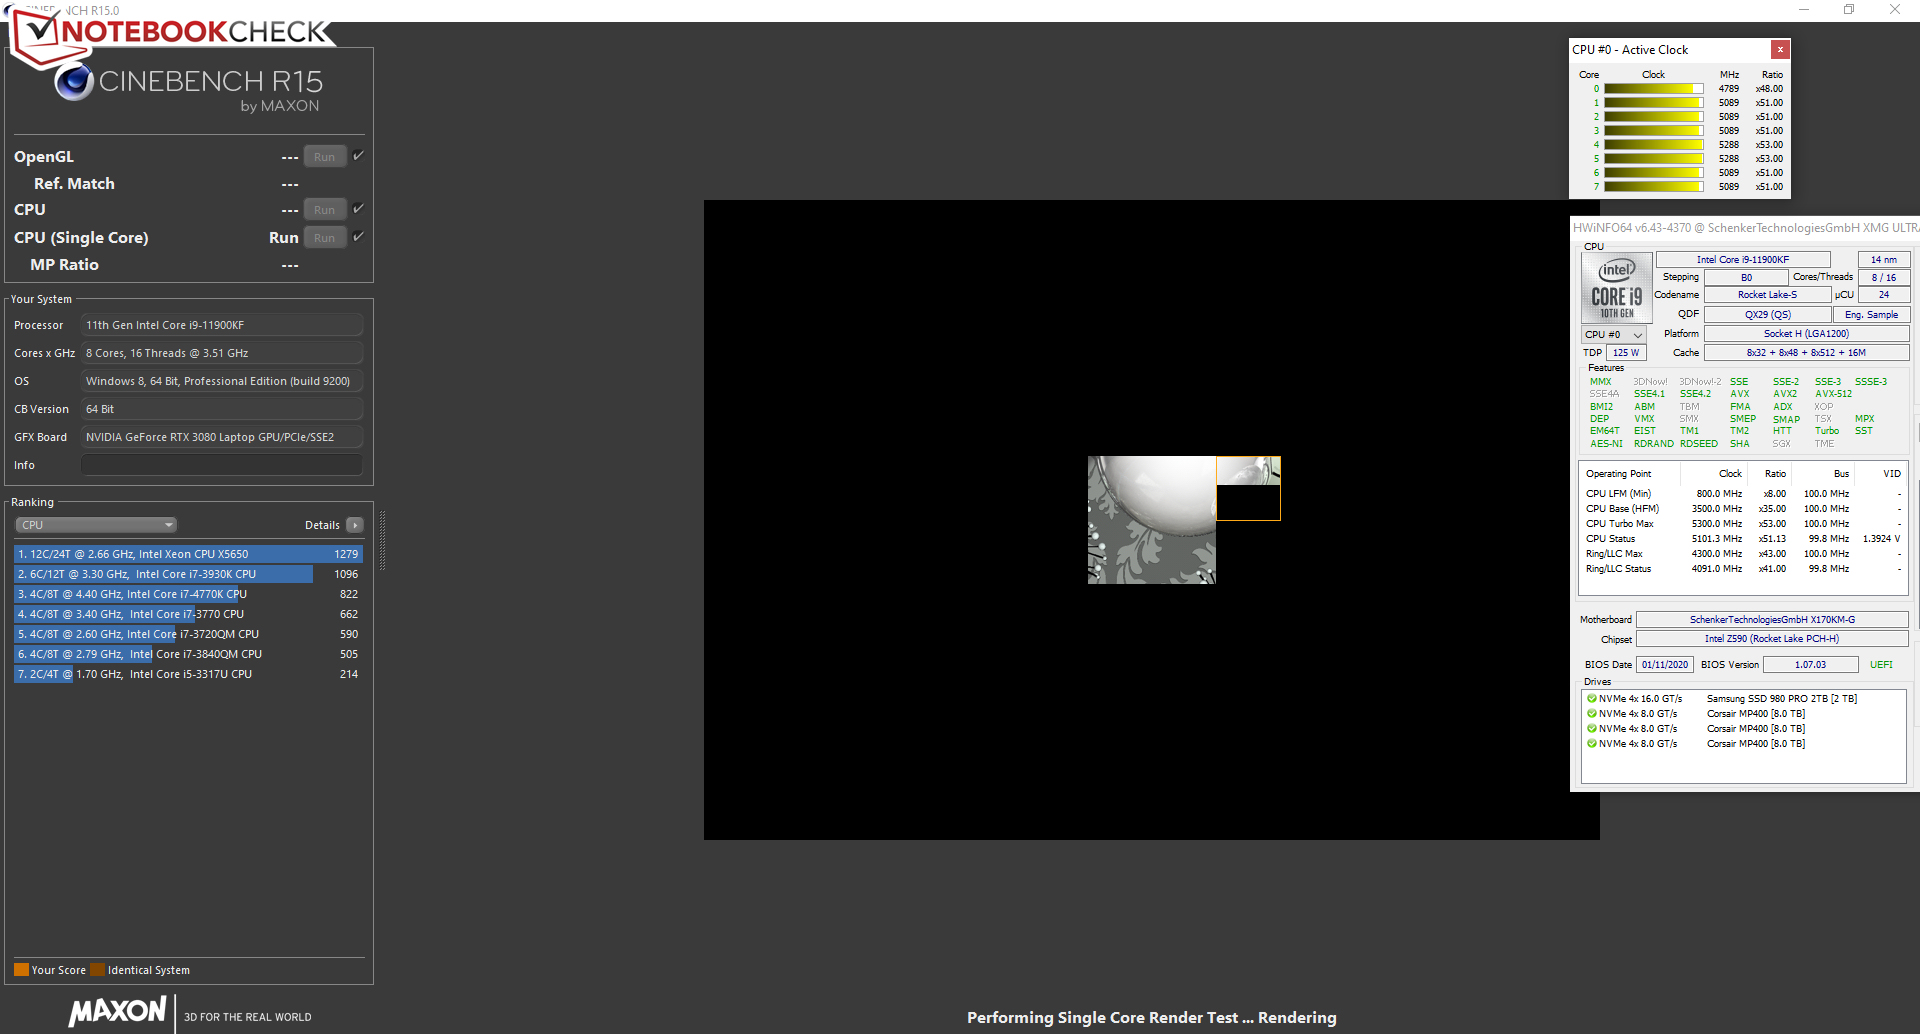
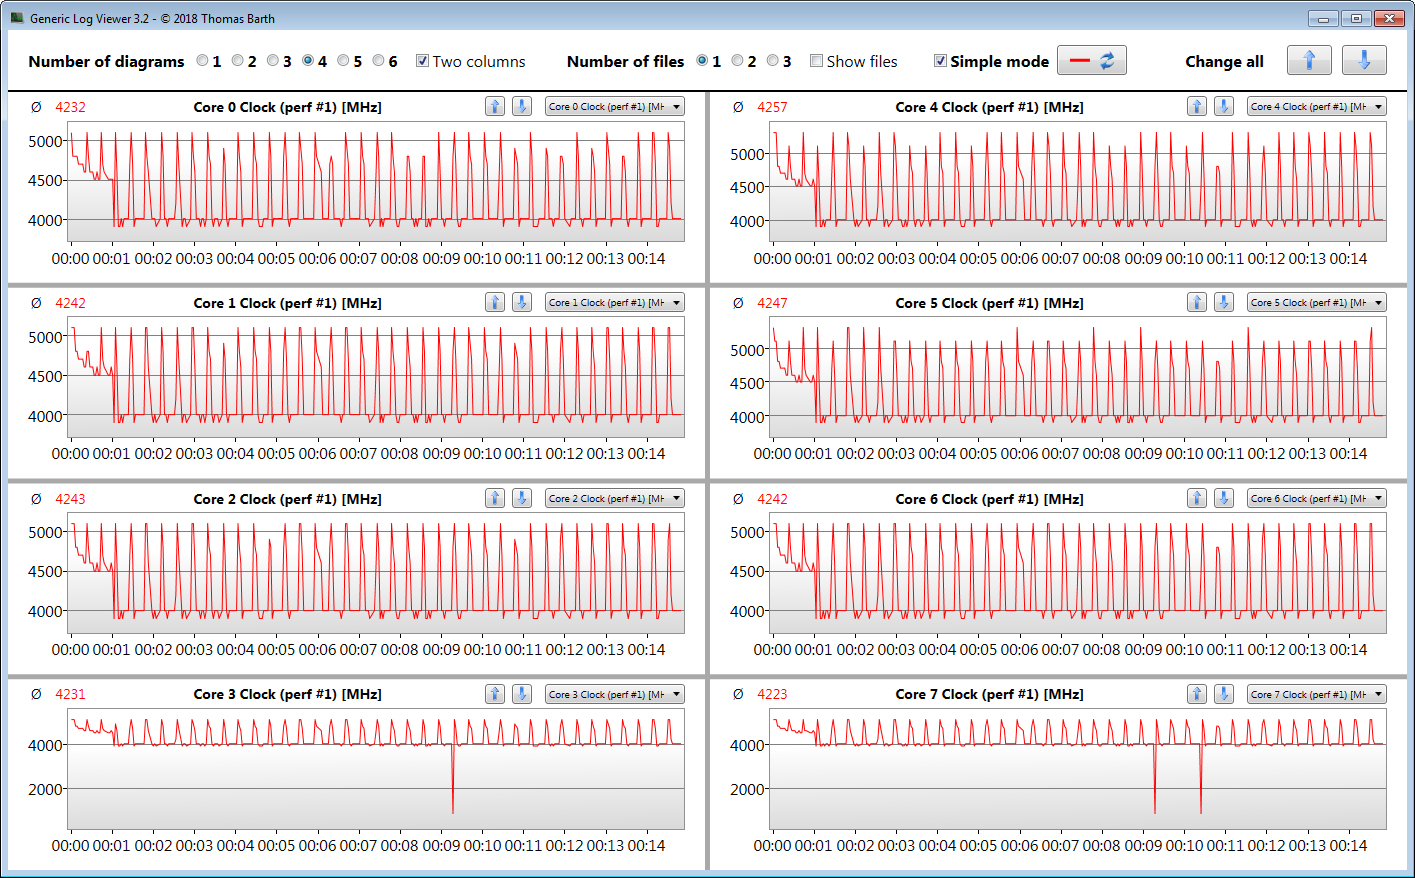
Ob der CPU-Turbo im Netzbetrieb auch dauerhaft genutzt wird, überprüfen wir, indem wir den Multi-Thread-Test des Cinebench-R15-Benchmarks in einer Schleife laufen lassen. Innerhalb der ersten Minute des Tests werden hohe Geschwindigkeiten erreicht. Dann sinkt der Takt auf Werte um 4 GHz.
Rocket Lake hinterlässt einen guten Eindruck. Intel konnte die Pro-MHz-Leistung deutlich steigern. In der Folge kann das Fehlen zweier CPU-Kerne gegenüber dem Comet-Lake-Vorgänger (Core i9-10900K) bei Multi-Thread-Anwendungen bis zu einem gewissen Grad kompensiert werden. Auftrumpfen kann der 11900K in Sachen Single-Thread-Leistung. Hier liegt er vor seinem Vorgänger.
* ... kleinere Werte sind besser
System Performance
Dass kein Mangel an Rechenleistung besteht, dürfte angesichts der Hardwareausstattung nicht überraschen. Der Rechner gibt in allen gängigen Anwendungsbereichen eine gute Figur ab. Die sehr guten PC-Mark-Resultate bestätigen dies.
| PCMark 8 Home Score Accelerated v2 | 5529 Punkte | |
| PCMark 8 Creative Score Accelerated v2 | 7020 Punkte | |
| PCMark 8 Work Score Accelerated v2 | 6151 Punkte | |
| PCMark 10 Score | 7884 Punkte | |
Hilfe | ||
DPC-Latenzen
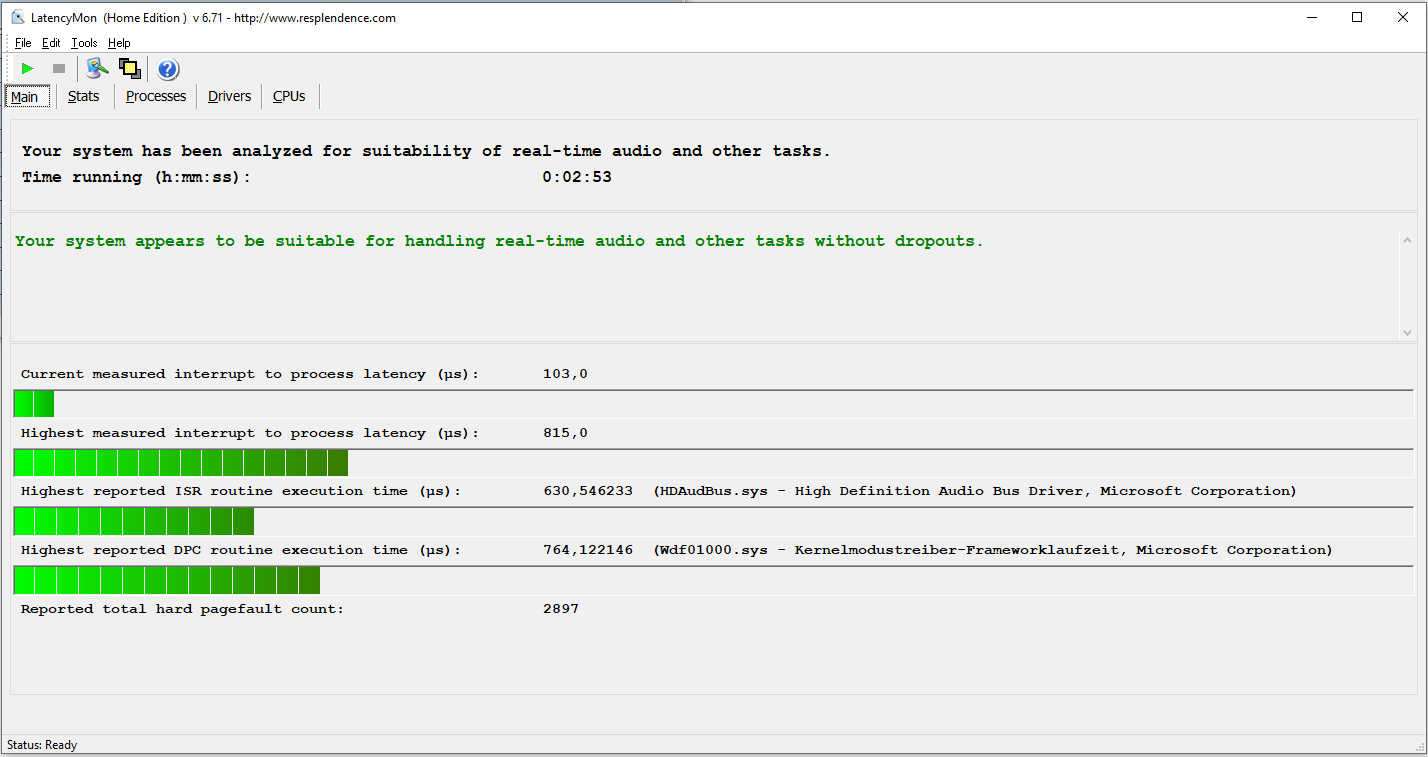
In unserem standardisierten Latency-Monitor-Test (Websurfen, 4K-Videowiedergabe, Prime95 High-Load) konnten wir keine Auffälligkeiten bei den DPC-Latenzen beobachten. Das System scheint für Video- und Audiobearbeitung in Echtzeit geeignet zu sein.
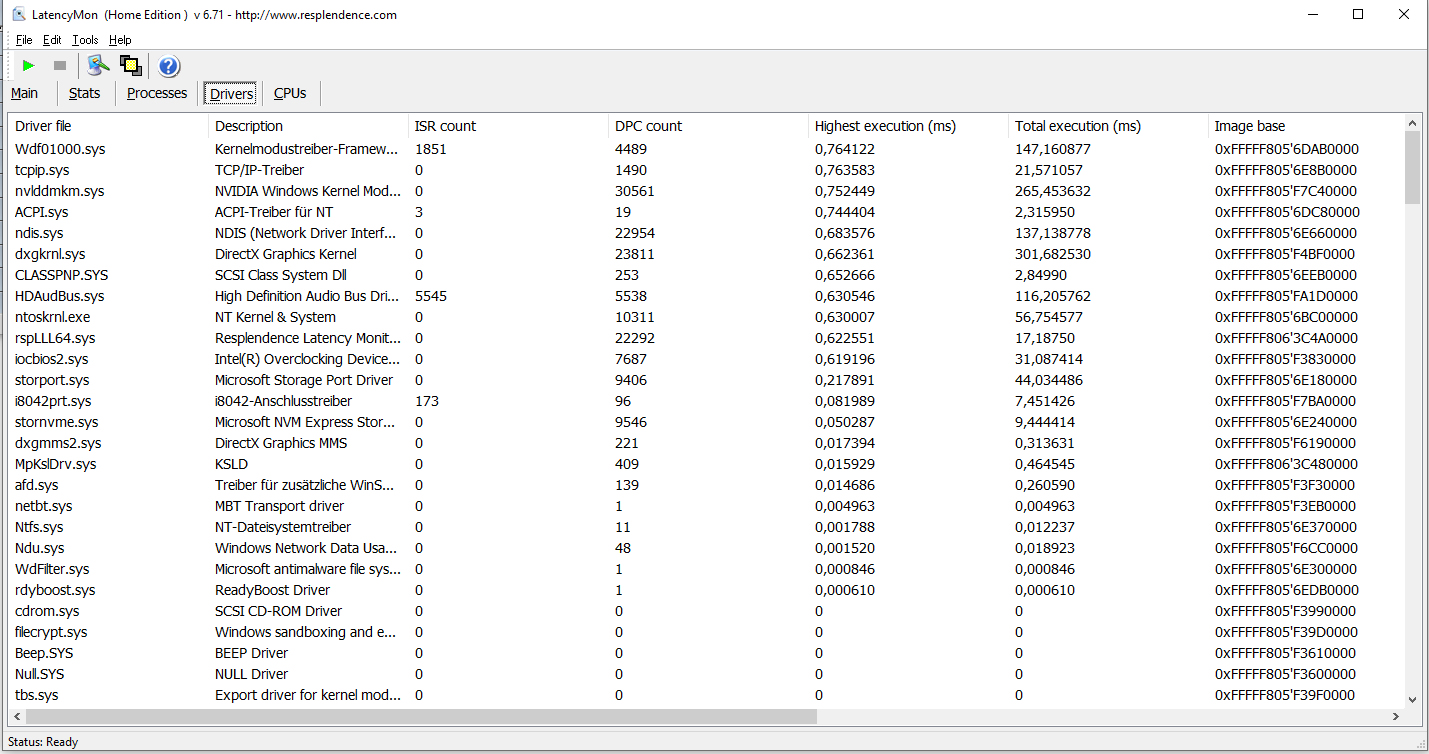
| DPC Latencies / LatencyMon - interrupt to process latency (max), Web, Youtube, Prime95 | |
| MSI GT76 Titan DT 10SGS | |
| Asus Strix Scar 17 G732LXS | |
| Schenker XMG Ultra 17 Rocket Lake | |
| Alienware m17 R4 | |
| Schenker XMG Ultra 17 Comet Lake | |
* ... kleinere Werte sind besser
Massenspeicher
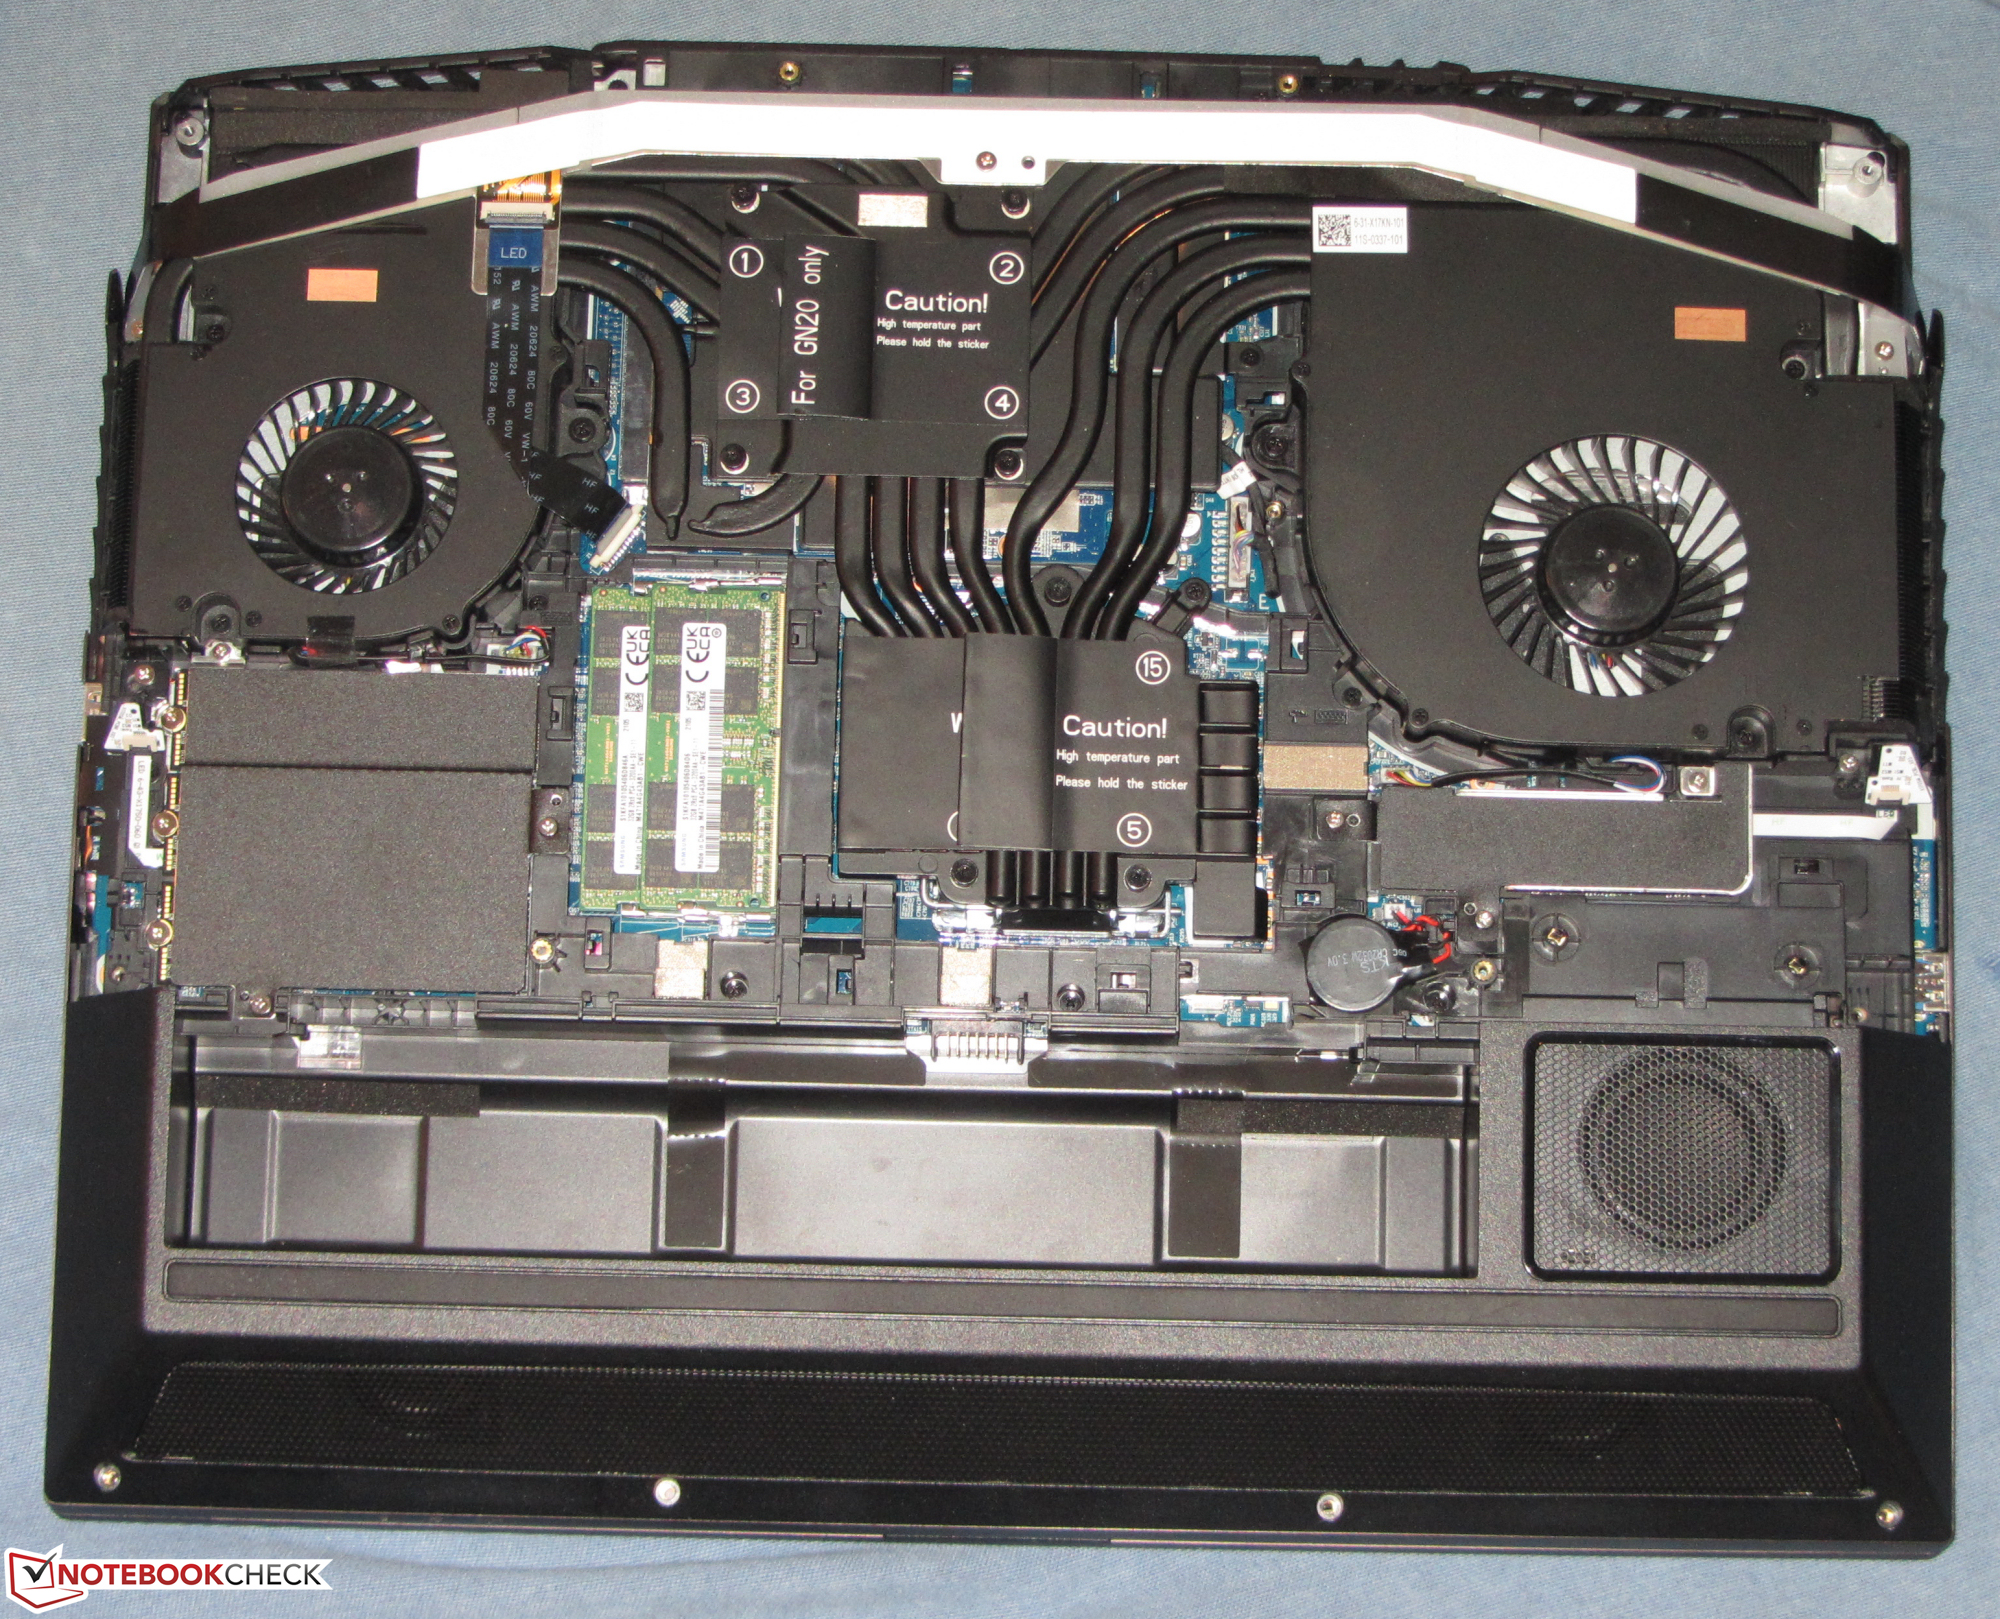
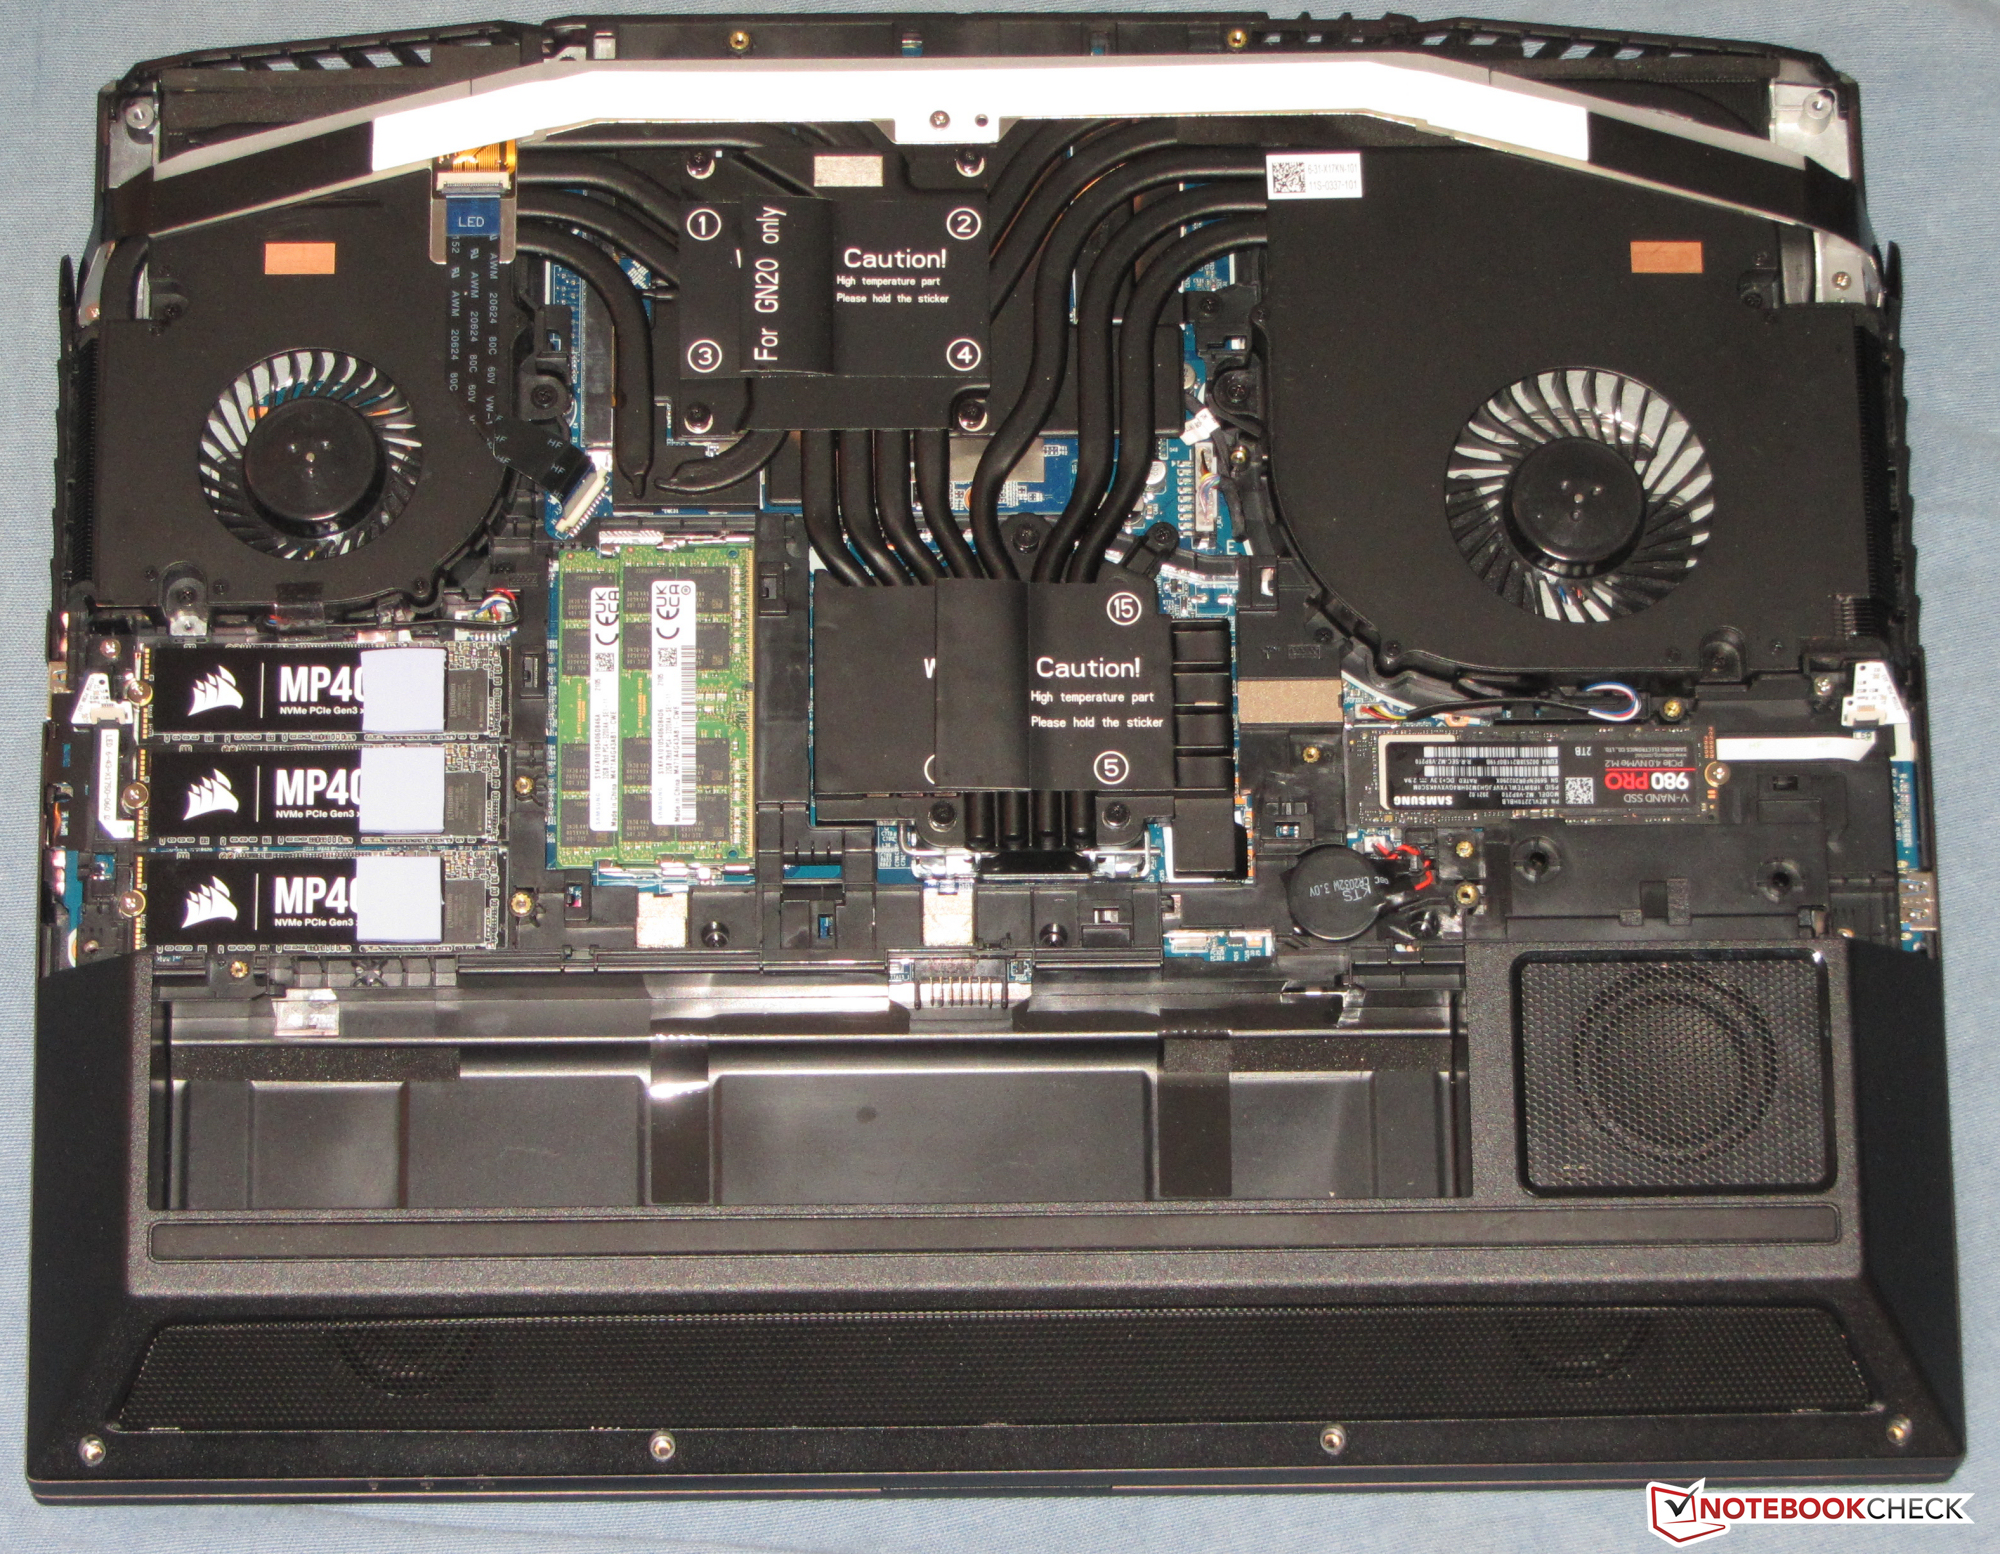
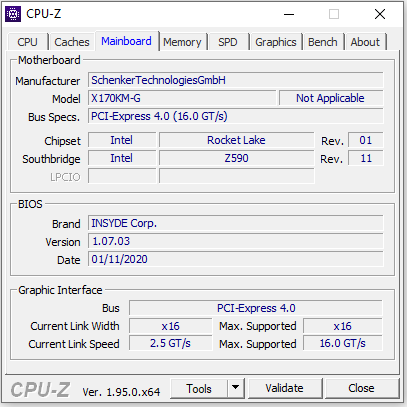
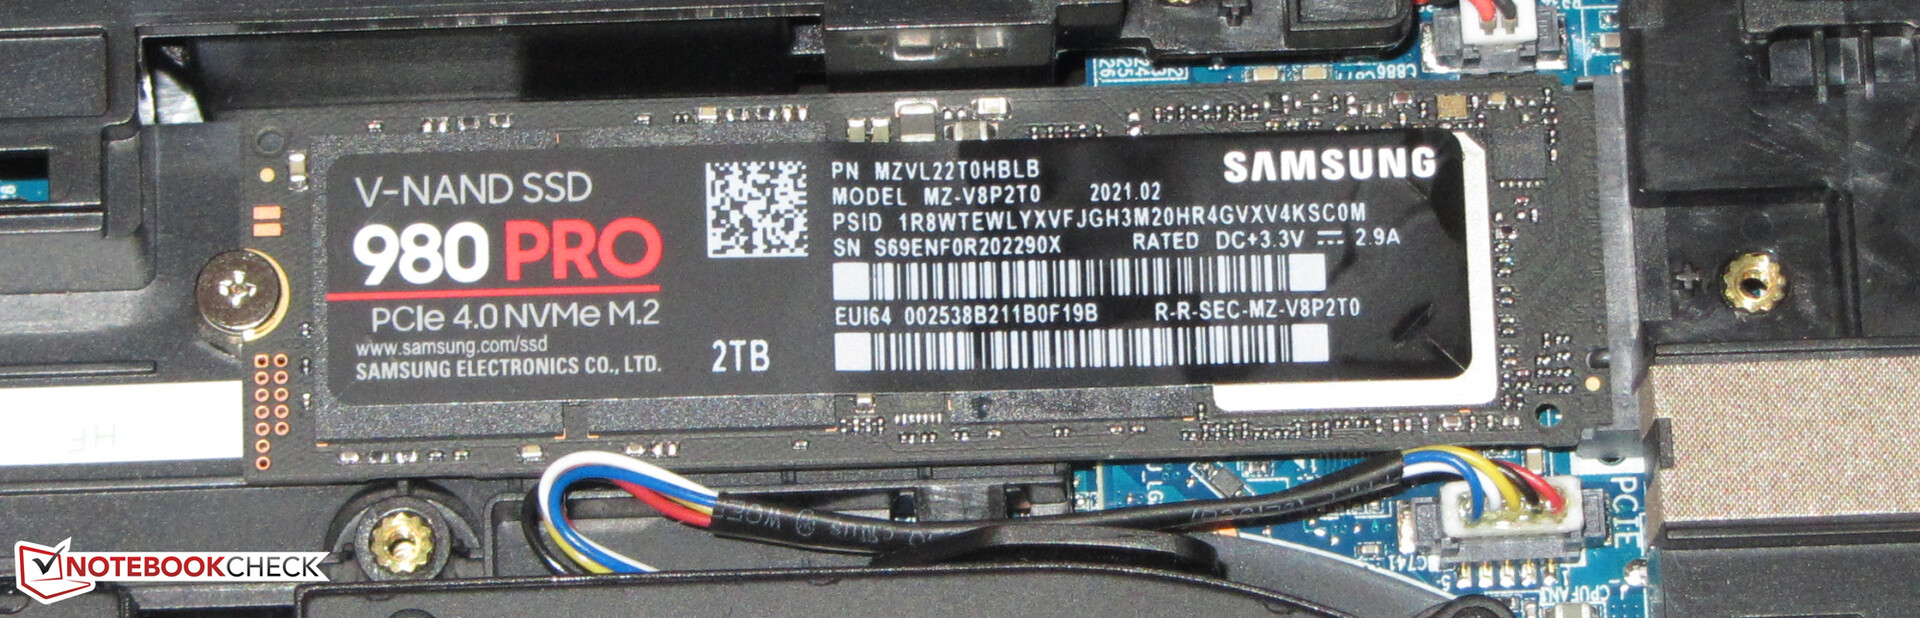
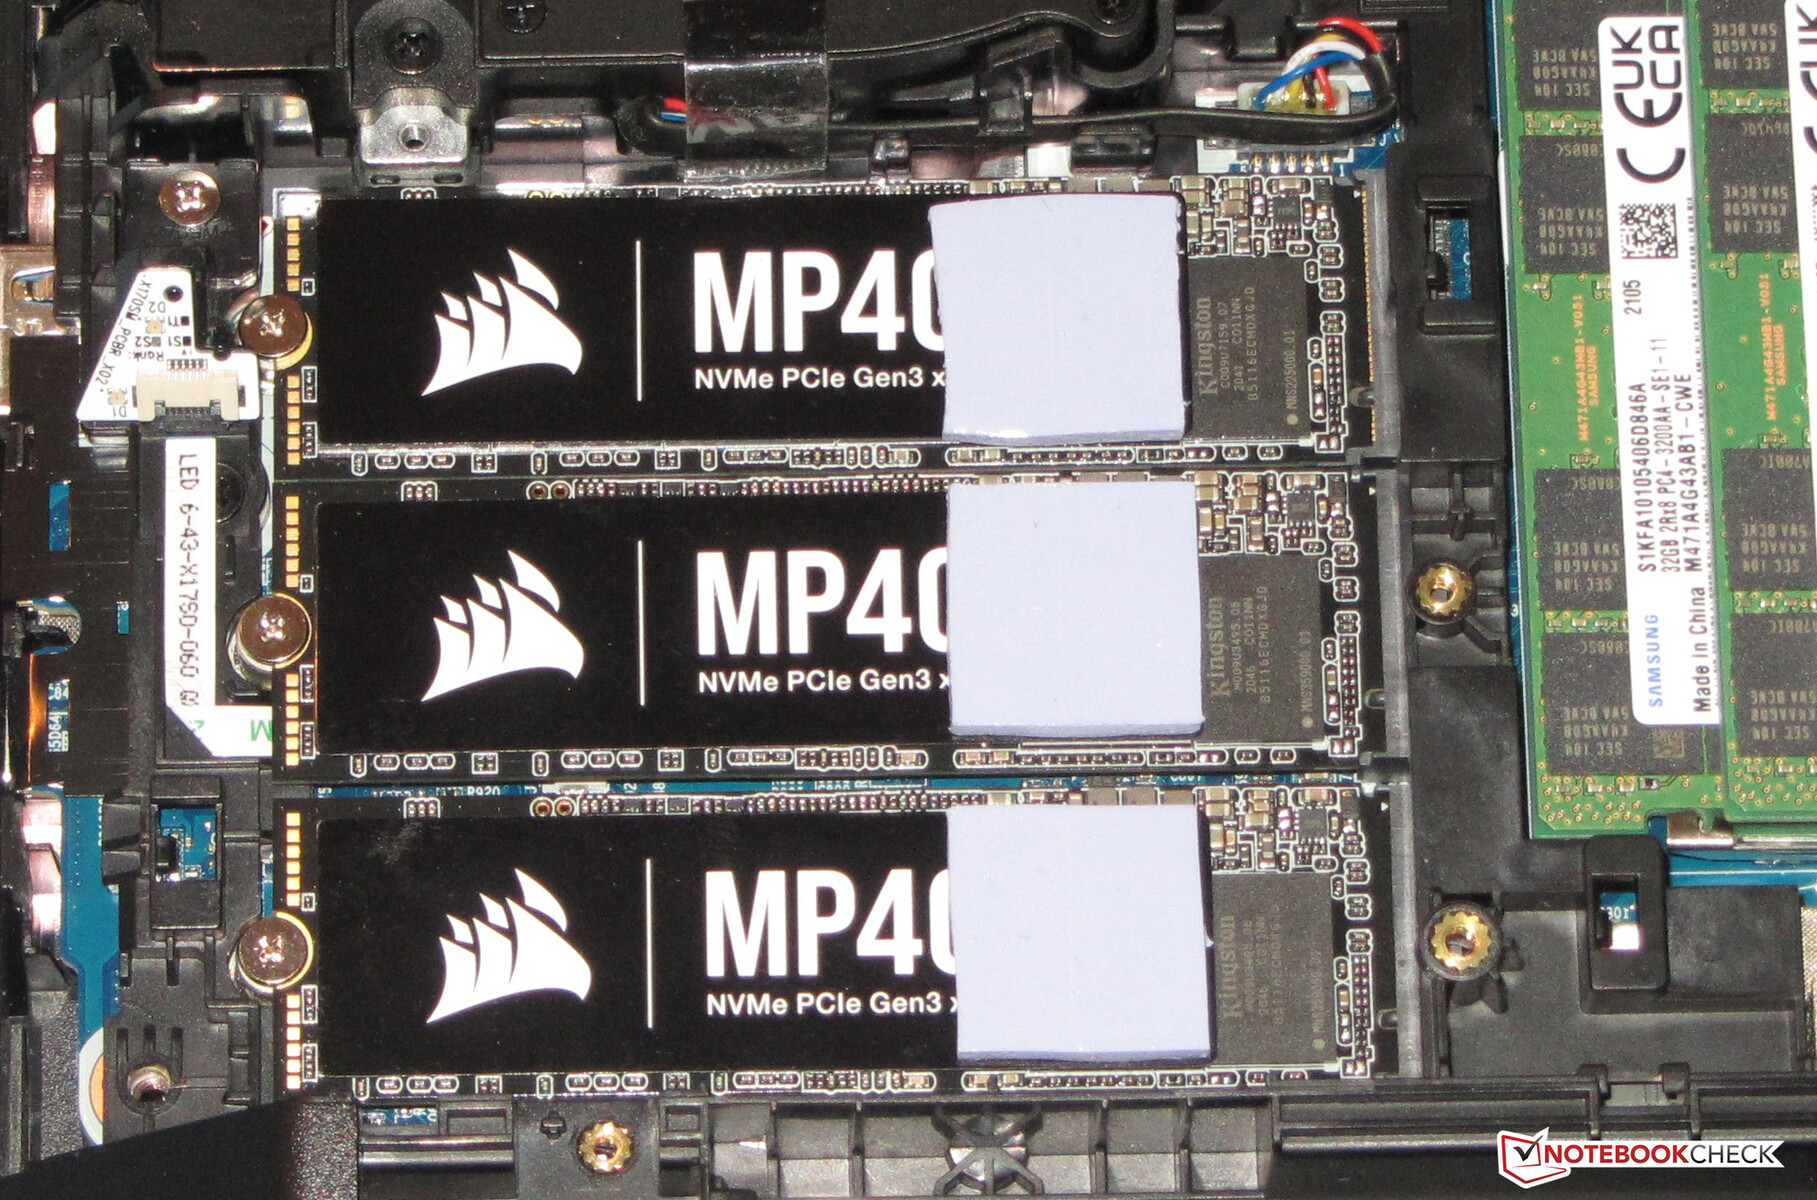
Als Systemlaufwerk dient eine NVMe-SSD (M.2-2280) der Firma Samsung. Sie stellt 2 TB Speicherplatz bereit und liefert dank der Anbindung per PCI Express 4 hervorragende Transferraten. Das Notebook verfügt über drei weitere M.2-2280-Steckplätze, die mit NVMe-SSDs (Anbindung per PCI Express 3.0) bestückt werden können. Zwei der drei Steckplätze könnten alternativ SATA-SSDs aufnehmen. RAID-0/1/5 wird unterstützt.

| Schenker XMG Ultra 17 Rocket Lake Samsung SSD 980 Pro 2TB MZ-V8P2T0 | MSI GT76 Titan DT 10SGS 2x WDC PC SN730 SDBPNTY-1T00 (RAID 0) | Asus Strix Scar 17 G732LXS 2x Intel SSD 660p 1TB SSDPEKNW010T8 (RAID 0) | Schenker XMG Ultra 17 Comet Lake Samsung SSD 970 EVO Plus 2TB | Alienware m17 R4 2x Micron 2300 512 GB (RAID 0) | |
|---|---|---|---|---|---|
| CrystalDiskMark 5.2 / 6 | -42% | -48% | -35% | -42% | |
| Write 4K (MB/s) | 240 | 116.4 -51% | 125.8 -48% | 172 -28% | 93.1 -61% |
| Read 4K (MB/s) | 87.8 | 43.85 -50% | 52.9 -40% | 47.3 -46% | 46.79 -47% |
| Write Seq (MB/s) | 4281 | 2927 -32% | 1795 -58% | 2980 -30% | 2853 -33% |
| Read Seq (MB/s) | 4228 | 1997 -53% | 2315 -45% | 2790 -34% | 2556 -40% |
| Write 4K Q32T1 (MB/s) | 696 | 467.6 -33% | 407.1 -42% | 481.8 -31% | 475 -32% |
| Read 4K Q32T1 (MB/s) | 778 | 538 -31% | 411.9 -47% | 565 -27% | 529 -32% |
| Write Seq Q32T1 (MB/s) | 5195 | 3362 -35% | 2844 -45% | 3295 -37% | 3331 -36% |
| Read Seq Q32T1 (MB/s) | 7099 | 3558 -50% | 3130 -56% | 3550 -50% | 3319 -53% |
| AS SSD | -52% | -54% | -16% | -53% | |
| Seq Read (MB/s) | 5010 | 2406 -52% | 2450 -51% | 2980 -41% | 2733 -45% |
| Seq Write (MB/s) | 3974 | 2867 -28% | 1436 -64% | 2585 -35% | 2822 -29% |
| 4K Read (MB/s) | 51.9 | 41.51 -20% | 49.48 -5% | 52.7 2% | 45.04 -13% |
| 4K Write (MB/s) | 156.8 | 108.8 -31% | 119.4 -24% | 163.1 4% | 88.4 -44% |
| 4K-64 Read (MB/s) | 2611 | 1525 -42% | 1032 -60% | 1954 -25% | 1388 -47% |
| 4K-64 Write (MB/s) | 3859 | 1424 -63% | 1229 -68% | 2347 -39% | 1227 -68% |
| Access Time Read * (ms) | 0.072 | 0.041 43% | 0.145 -101% | 0.039 46% | 0.079 -10% |
| Access Time Write * (ms) | 0.026 | 0.102 -292% | 0.036 -38% | 0.023 12% | 0.095 -265% |
| Score Read (Points) | 3164 | 1807 -43% | 1327 -58% | 2304 -27% | 1706 -46% |
| Score Write (Points) | 4414 | 1819 -59% | 1492 -66% | 2768 -37% | 1598 -64% |
| Score Total (Points) | 9134 | 4573 -50% | 3456 -62% | 6232 -32% | 4184 -54% |
| Copy ISO MB/s (MB/s) | 3424 | 2605 -24% | 2414 -29% | ||
| Copy Program MB/s (MB/s) | 1091 | 651 -40% | 1030 -6% | ||
| Copy Game MB/s (MB/s) | 2365 | 1709 -28% | 1991 -16% | ||
| Durchschnitt gesamt (Programm / Settings) | -47% /
-48% | -51% /
-51% | -26% /
-24% | -48% /
-49% |
* ... kleinere Werte sind besser
Dauerleistung Lesen: DiskSpd Read Loop, Queue Depth 8
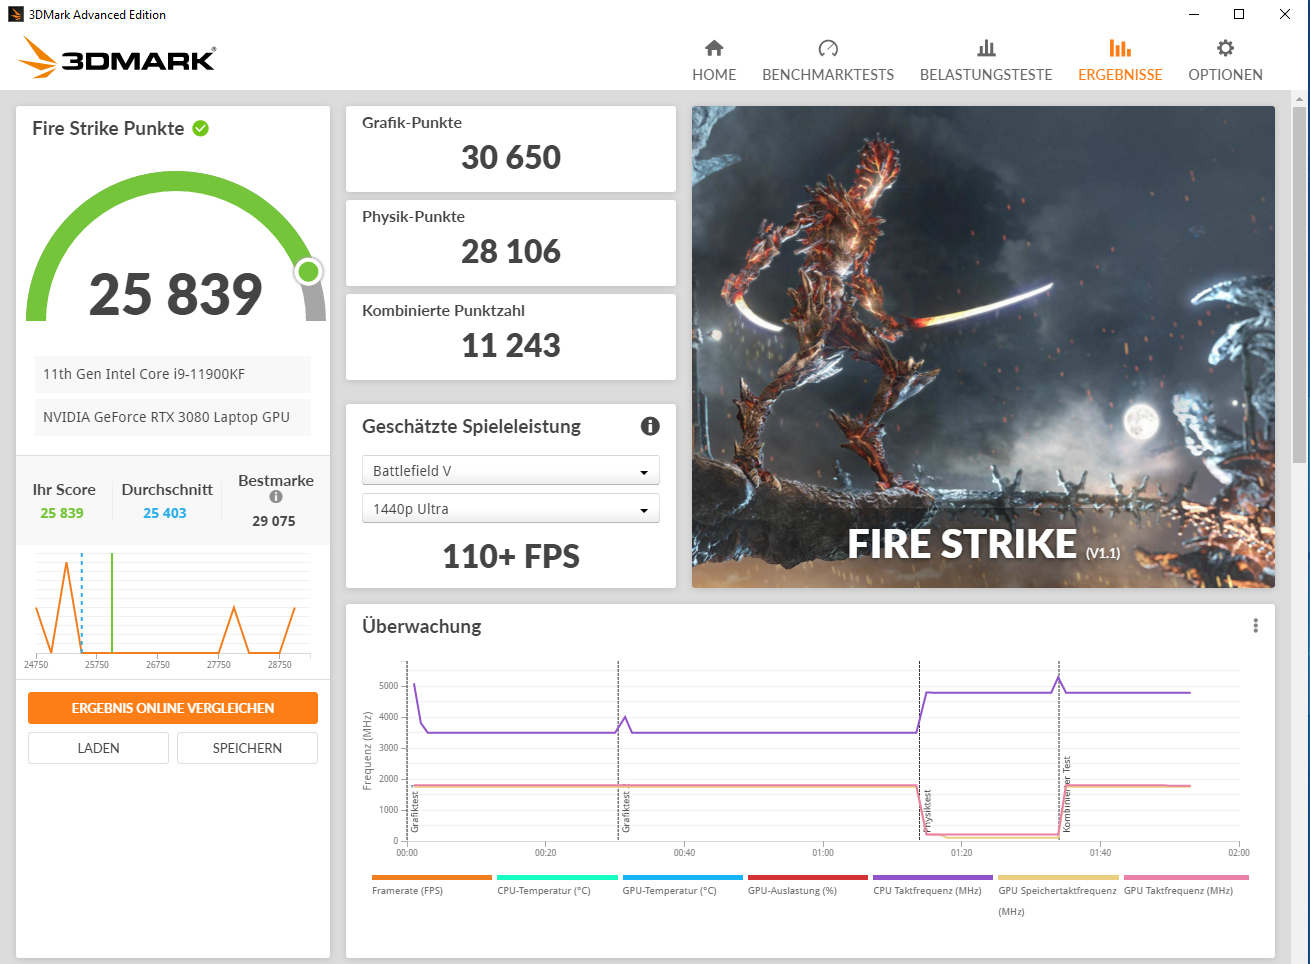
Grafikkarte
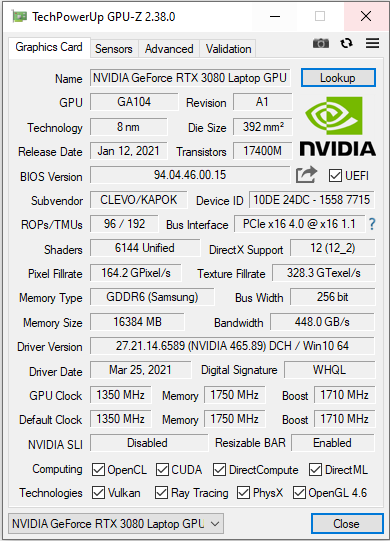
Der GeForce-RTX-3080-Laptop-Grafikkern stellt Nvidias aktuell leistungsstärkste Notebook-GPU dar. Sie kann auf schnellen GDDR6-Grafikspeicher (16.384 MB) zurückgreifen. GPU und Speicher sind nicht fest auf die Hauptplatine gelötet, sondern sitzen auf einer MXM-Steckkarte. Ein Tausch der Karte wäre möglich. Die im Prozessor integrierte UHD-Graphics-Xe-750-32EUs-GPU ist ab Werk deaktiviert und das Notebook arbeitet nicht mit Nvidias Umschaltgrafiklösung Optimus.
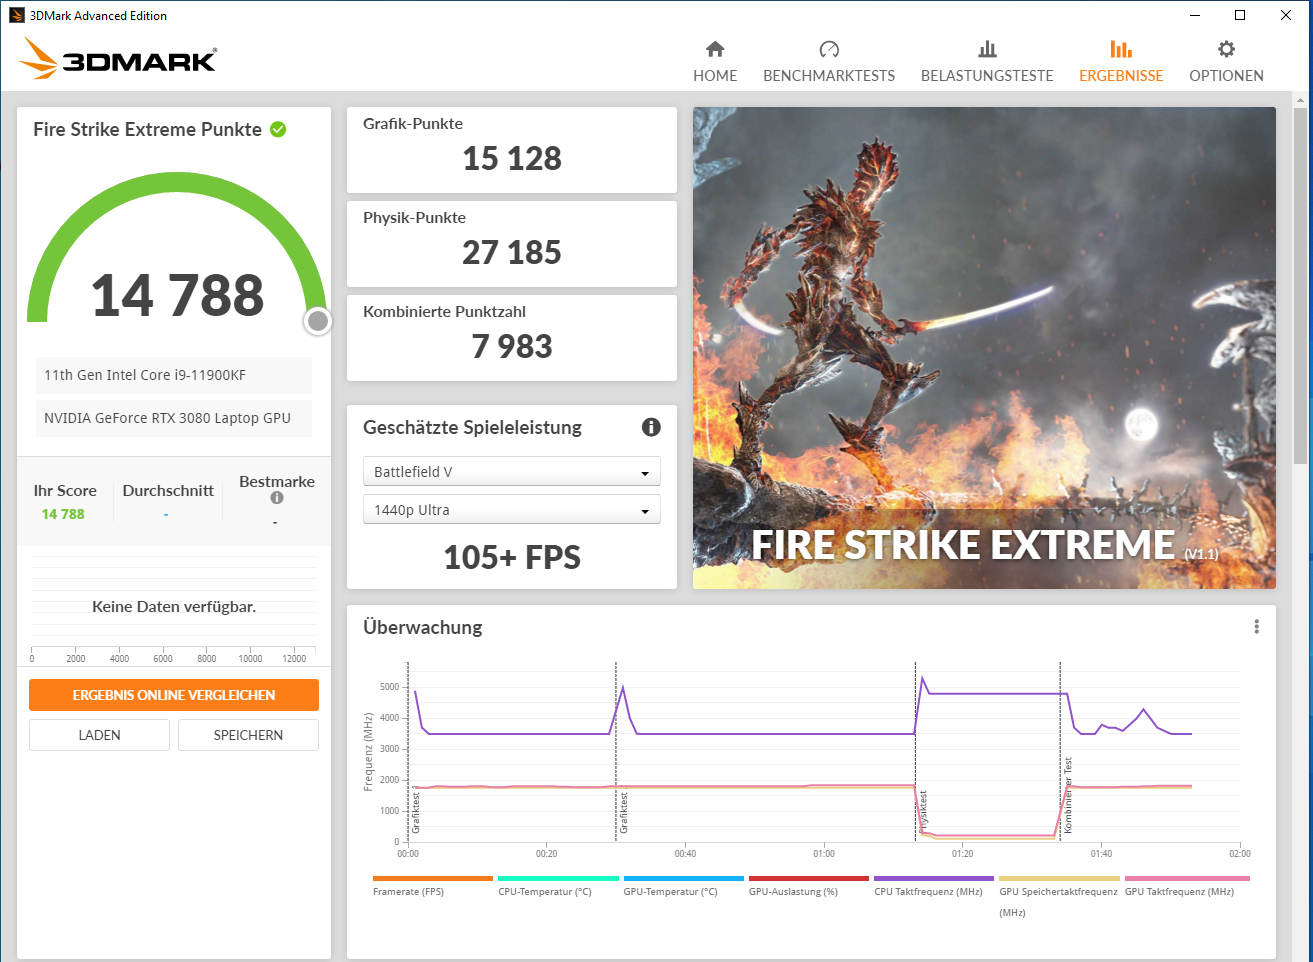
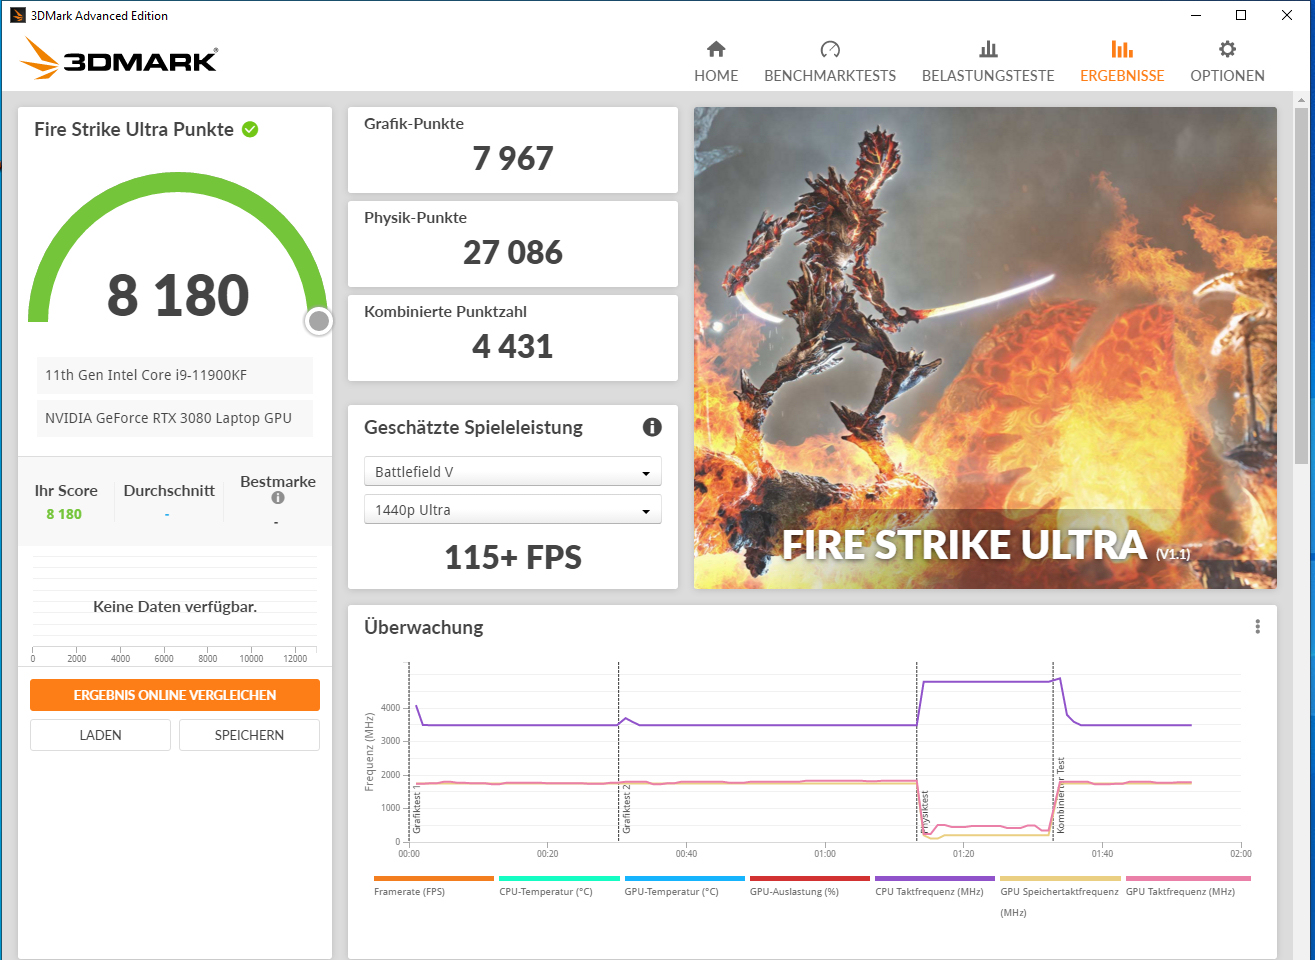
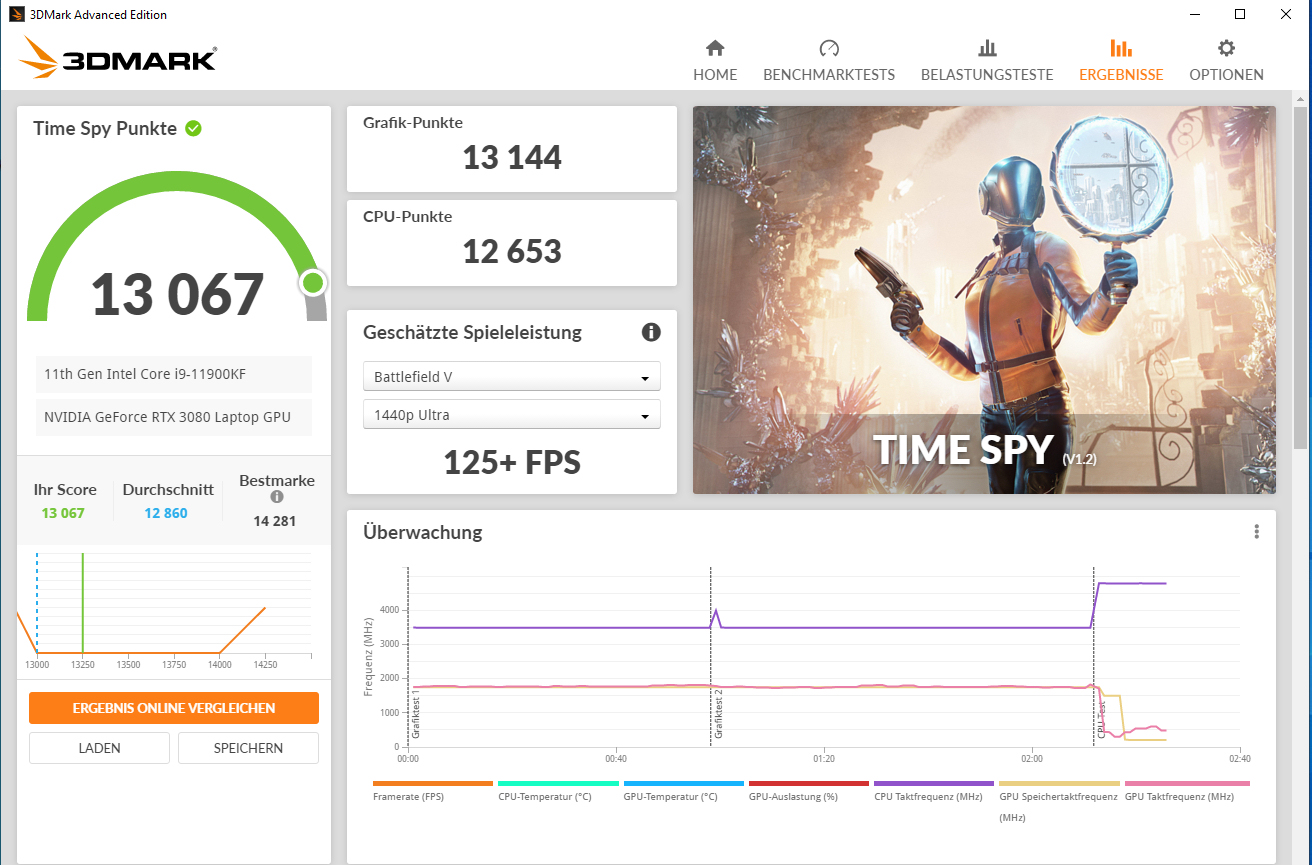
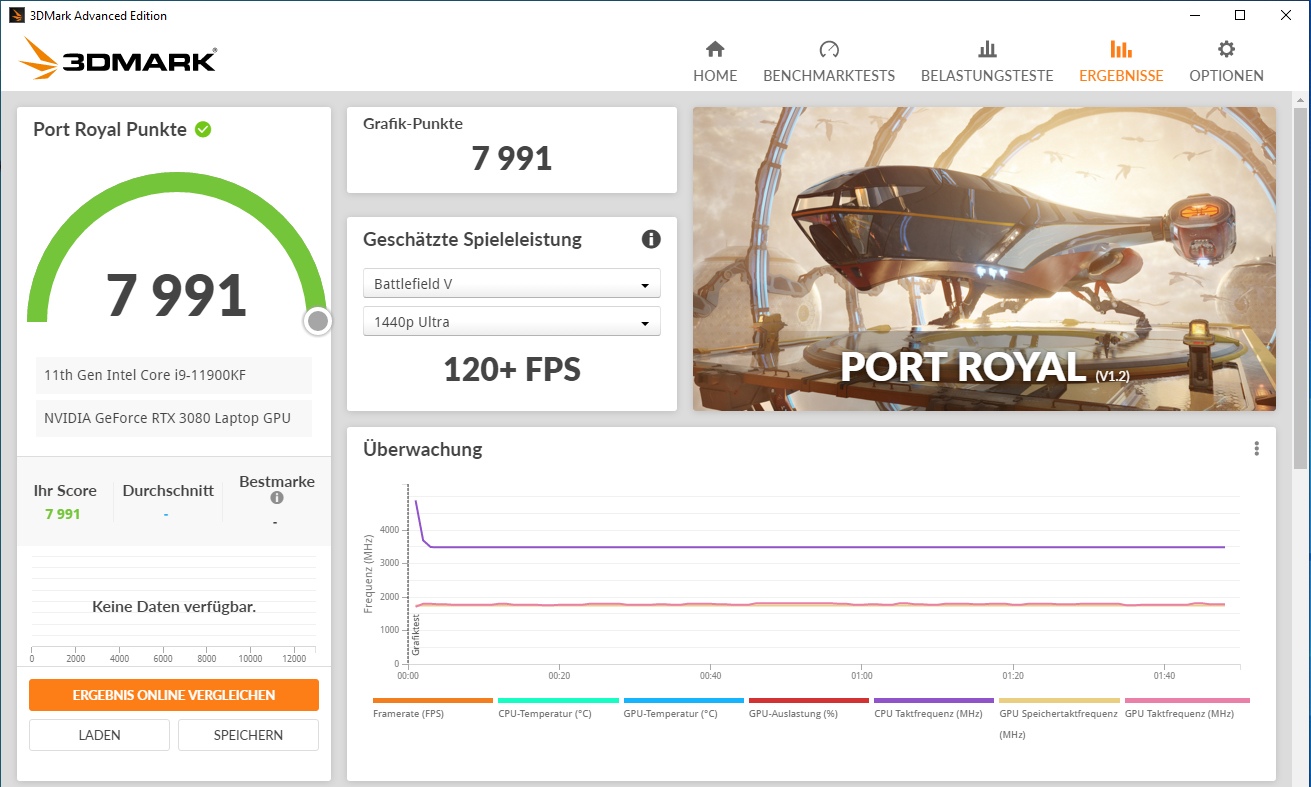
Notebookhersteller können die TGP und somit die maximal zur Verfügung stehende Rechenleistung eines RTX-3000-Grafikkerns innerhalb der von Nvidia definierten Grenzen recht frei wählen (Übersicht aller RTX-3080-Laptops samt der TGPs). Schenker wählt das Maximum von 165 Watt (150 Watt + 15 Watt Dynamic Boost). In der Folge schneidet das Ultra 17 in den GPU- und Spieletests sehr gut ab.
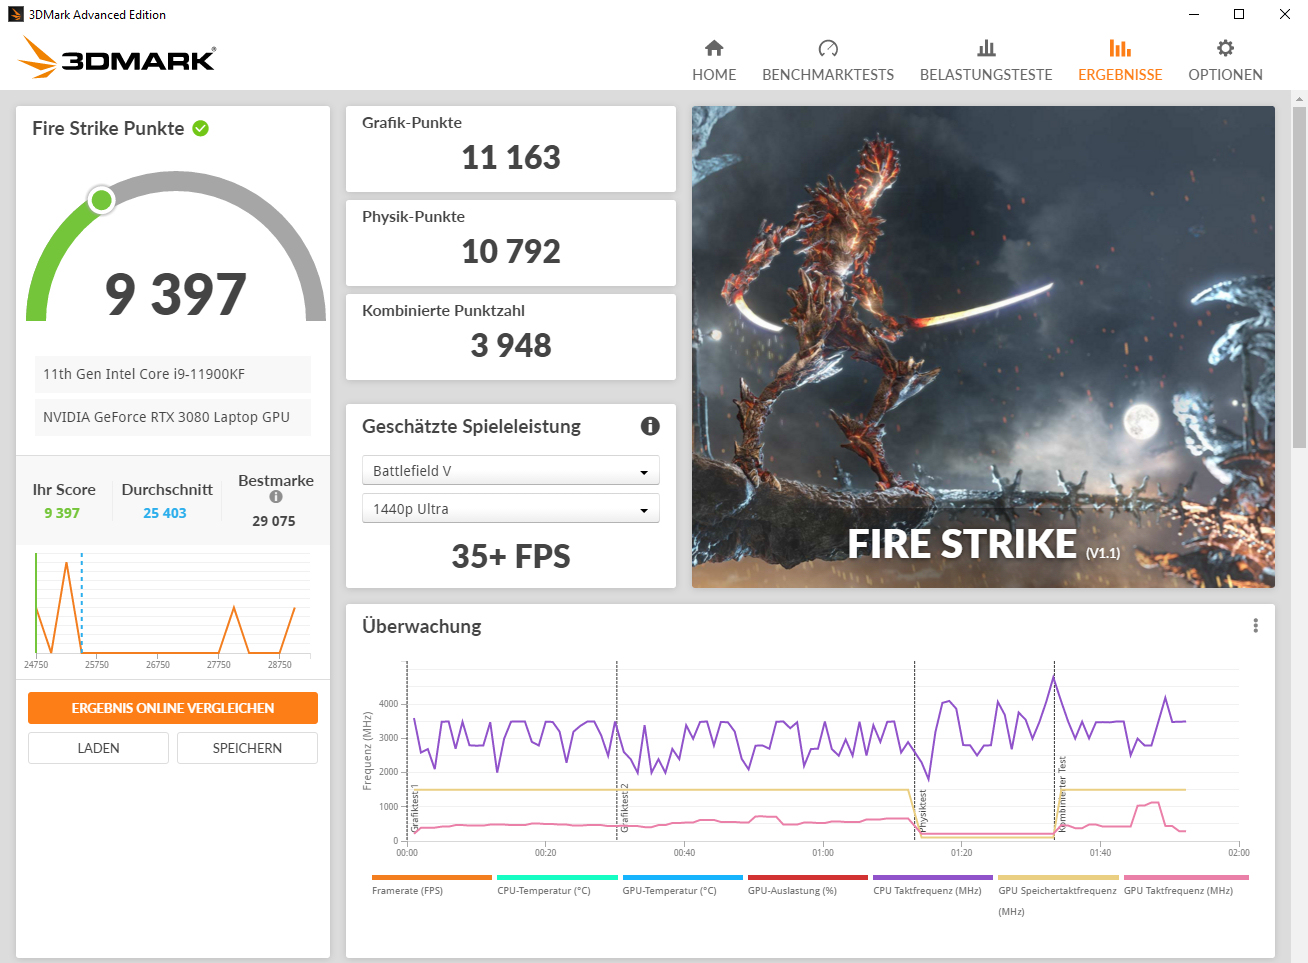
| 3DMark 11 Performance | 32922 Punkte | |
| 3DMark Cloud Gate Standard Score | 65479 Punkte | |
| 3DMark Fire Strike Score | 25839 Punkte | |
| 3DMark Fire Strike Extreme Score | 14788 Punkte | |
| 3DMark Time Spy Score | 13067 Punkte | |
Hilfe | ||
Gaming Performance
Der Rechner bringt alle aktuellen Spiele flüssig auf den Bildschirm. Dabei können in der Regel FHD-Auflösung und maximale Qualitätseinstellungen gewählt werden. Höhere Auflösungen (hierfür müsste ein entsprechender Monitor angeschlossen werden) bewältigt die GPU ebenfalls.
| The Witcher 3 - 1920x1080 Ultra Graphics & Postprocessing (HBAO+) | |
| Durchschnitt der Klasse Gaming (95 - 240, n=7, der letzten 2 Jahre) | |
| Schenker XMG Ultra 17 Rocket Lake | |
| Alienware m17 R4 | |
| MSI GT76 Titan DT 10SGS | |
| Schenker XMG Ultra 17 Comet Lake | |
| Durchschnittliche NVIDIA GeForce RTX 3080 Laptop GPU (85.1 - 123, n=40) | |
| Asus Strix Scar 17 G732LXS | |
| Far Cry 5 - 1920x1080 Ultra Preset AA:T | |
| Schenker XMG Ultra 17 Rocket Lake | |
| Alienware m17 R4 | |
| Durchschnitt der Klasse Gaming (70 - 151, n=8, der letzten 2 Jahre) | |
| Durchschnittliche NVIDIA GeForce RTX 3080 Laptop GPU (75 - 146, n=33) | |
| Shadow of the Tomb Raider - 1920x1080 Highest Preset AA:T | |
| Schenker XMG Ultra 17 Rocket Lake | |
| Schenker XMG Ultra 17 Comet Lake | |
| Asus Strix Scar 17 G732LXS | |
| Durchschnittliche NVIDIA GeForce RTX 3080 Laptop GPU (76.6 - 151, n=13) | |
| Durchschnitt der Klasse Gaming (96 - 116, n=2, der letzten 2 Jahre) | |
| Doom Eternal - 1920x1080 Ultra Preset | |
| Schenker XMG Ultra 17 Comet Lake | |
| Asus Strix Scar 17 G732LXS | |
| Schenker XMG Ultra 17 Rocket Lake | |
| Durchschnittliche NVIDIA GeForce RTX 3080 Laptop GPU (163 - 190, n=4) | |
| Serious Sam 4 - 1920x1080 Ultra (DX12) AA:2xMS | |
| Schenker XMG Ultra 17 Rocket Lake | |
| Schenker XMG Ultra 17 Comet Lake | |
| Durchschnittliche NVIDIA GeForce RTX 3080 Laptop GPU (72.6 - 107, n=5) | |
| Cyberpunk 2077 1.0 | |
| 1920x1080 Ultra Preset | |
| Schenker XMG Ultra 17 Rocket Lake | |
| Alienware m17 R4 | |
| Durchschnittliche NVIDIA GeForce RTX 3080 Laptop GPU (52.9 - 84.3, n=9) | |
| 1920x1080 Ray Tracing Ultra Preset (DLSS off) | |
| Schenker XMG Ultra 17 Rocket Lake | |
| Alienware m17 R4 | |
| Durchschnittliche NVIDIA GeForce RTX 3080 Laptop GPU (30.6 - 43.2, n=5) | |
| Watch Dogs Legion | |
| 1920x1080 Ultra Preset (DX12) | |
| Schenker XMG Ultra 17 Rocket Lake | |
| Durchschnittliche NVIDIA GeForce RTX 3080 Laptop GPU (65 - 91.1, n=6) | |
| 1920x1080 Ultra Preset + Ultra Ray Tracing (DX12) | |
| Schenker XMG Ultra 17 Rocket Lake | |
| Durchschnittliche NVIDIA GeForce RTX 3080 Laptop GPU (41 - 61, n=6) | |
| Hitman 3 - 1920x1080 Maximum Settings AF:16x | |
| Schenker XMG Ultra 17 Rocket Lake | |
| Durchschnittliche NVIDIA GeForce RTX 3080 Laptop GPU (129.1 - 201, n=3) | |
Um zu überprüfen, ob die Bildwiederholraten über einen längeren Zeitraum weitgehend konstant bleiben, lassen wir das Spiel "The Witcher 3" für etwa 60 Minuten mit Full-HD-Auflösung und maximalen Qualitätseinstellungen laufen. Die Spielfigur wird nicht bewegt. Ein Einbruch der Bildwiederholraten ist nicht festzustellen.
| min. | mittel | hoch | max. | |
|---|---|---|---|---|
| The Witcher 3 (2015) | 453 | 374 | 242 | 123 |
| Dota 2 Reborn (2015) | 183 | 170 | 161 | 156 |
| X-Plane 11.11 (2018) | 156 | 139 | 113 | |
| Far Cry 5 (2018) | 189 | 162 | 155 | 146 |
| Shadow of the Tomb Raider (2018) | 181 | 164 | 160 | 151 |
| Doom Eternal (2020) | 211 | 199 | 193 | 190 |
| Serious Sam 4 (2020) | 162 | 118 | 111 | 107 |
| Watch Dogs Legion (2020) | 127 | 123 | 110 | 91.1 |
| Dirt 5 (2020) | 110 | 97.1 | 93.3 | 92.4 |
| Immortals Fenyx Rising (2020) | 172 | 125 | 116 | 108 |
| Cyberpunk 2077 1.0 (2020) | 147 | 116 | 96.1 | 84.3 |
| Hitman 3 (2021) | 255.1 | 216.6 | 207.7 | 200.5 |
Emissionen - Der Schenker Rechner kann sehr laut werden
Geräuschemissionen
Im Leerlauf und bei geringer Last halten sich die Lüfter meistens zurück und sind kaum bis gar nicht zu hören. Nichtsdestotrotz: Ab und an drehen sie auch im Leerlauf kurzzeitig stark auf. Dabei wird annähernd ein Lärmniveau erreicht wie unter Volllast. Mit anderen Worten: Es wird sehr laut. Bei maximalen Schalldruckpegeln von 63 dB(A) (Stresstest) bzw. 61 dB(A) (Witcher-3-Test) kommt man um die Nutzung eines Headsets kaum herum. Die Energieprofile "Lautlosmodus" und "Stromsparmodus" senken die Lärmentwicklung - allerdings auf Kosten der Rechenleistung.
Lautstärkediagramm
| Idle |
| 30 / 31 / 57 dB(A) |
| Last |
| 63 / 63 dB(A) |
 | ||
30 dB leise 40 dB(A) deutlich hörbar 50 dB(A) störend |
||
min: | ||
| Schenker XMG Ultra 17 Rocket Lake i9-11900K, GeForce RTX 3080 Laptop GPU | MSI GT76 Titan DT 10SGS i9-10900K, GeForce RTX 2080 Super Mobile | Asus Strix Scar 17 G732LXS i9-10980HK, GeForce RTX 2080 Super Mobile | Schenker XMG Ultra 17 Comet Lake i9-10900K, GeForce RTX 2080 Super Mobile | Alienware m17 R4 i9-10980HK, GeForce RTX 3080 Laptop GPU | Durchschnitt der Klasse Gaming | |
|---|---|---|---|---|---|---|
| Geräuschentwicklung | 15% | 4% | 4% | 21% | 20% | |
| aus / Umgebung * (dB) | 24 | 26.4 -10% | 25 -4% | 25 -4% | 24 -0% | 24.1 ? -0% |
| Idle min * (dB) | 30 | 27.5 8% | 33 -10% | 27 10% | 24 20% | 25.9 ? 14% |
| Idle avg * (dB) | 31 | 27.5 11% | 38 -23% | 32 -3% | 25 19% | 27.4 ? 12% |
| Idle max * (dB) | 57 | 29.8 48% | 45 21% | 57 -0% | 36 37% | 29.9 ? 48% |
| Last avg * (dB) | 63 | 30.9 51% | 54 14% | 56 11% | 45 29% | 43.3 ? 31% |
| Witcher 3 ultra * (dB) | 61 | 60.7 -0% | 50 18% | 55 10% | 47 23% | |
| Last max * (dB) | 63 | 66.6 -6% | 55 13% | 62 2% | 50 21% | 54.2 ? 14% |
* ... kleinere Werte sind besser
Temperatur
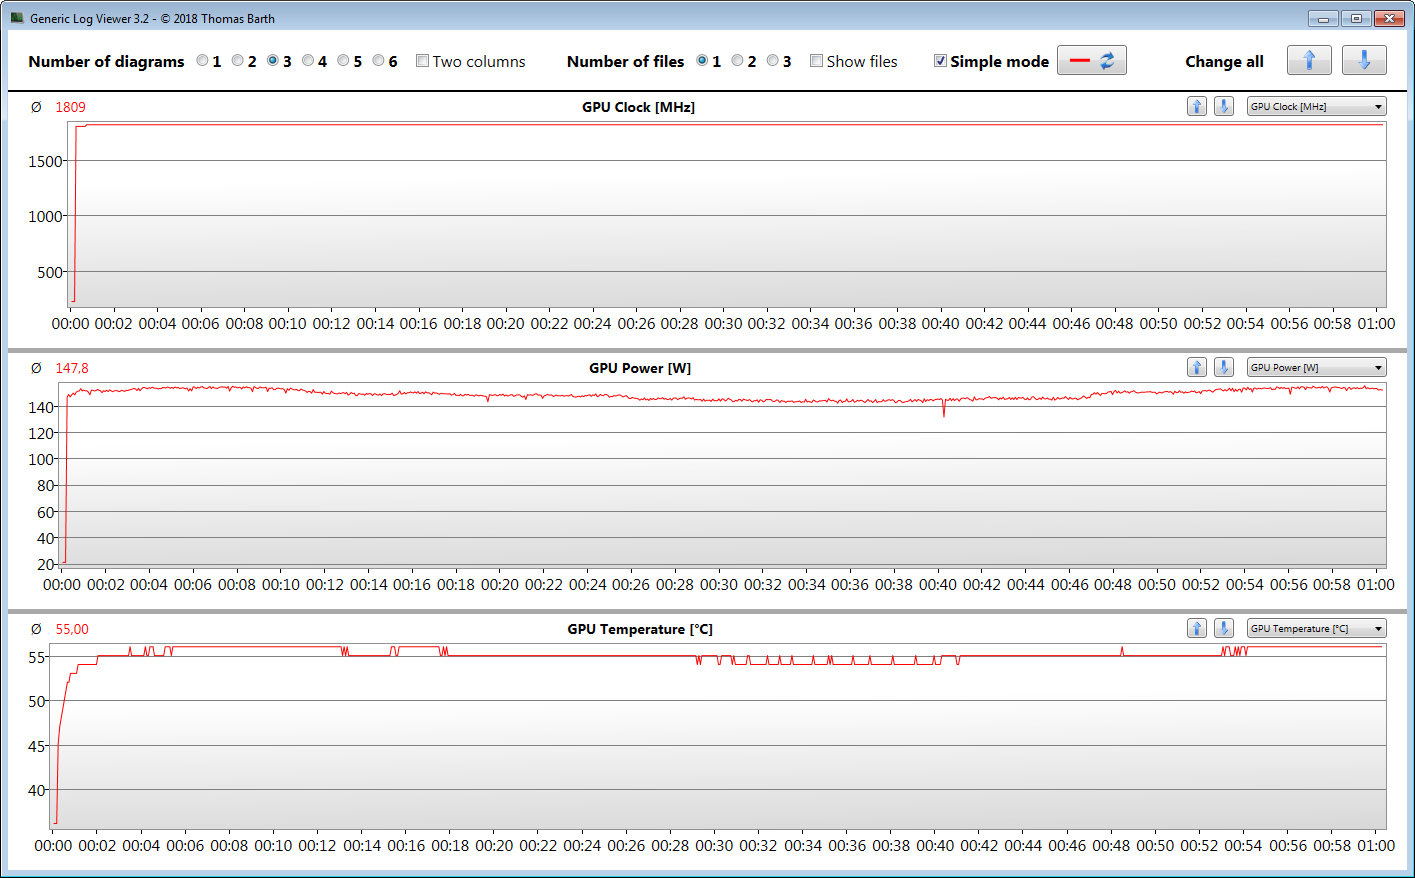
Unseren Stresstest (Prime95 und Furmark laufen für mindestens eine Stunde) bearbeiten CPU bzw. GPU mit 3,4 GHz bzw. 1.725 MHz. Der Stresstest stellt ein Extremszenario dar, welches so im Alltag nicht auftritt. Wir überprüfen mit diesem Test, ob das System auch bei voller Auslastung stabil läuft.

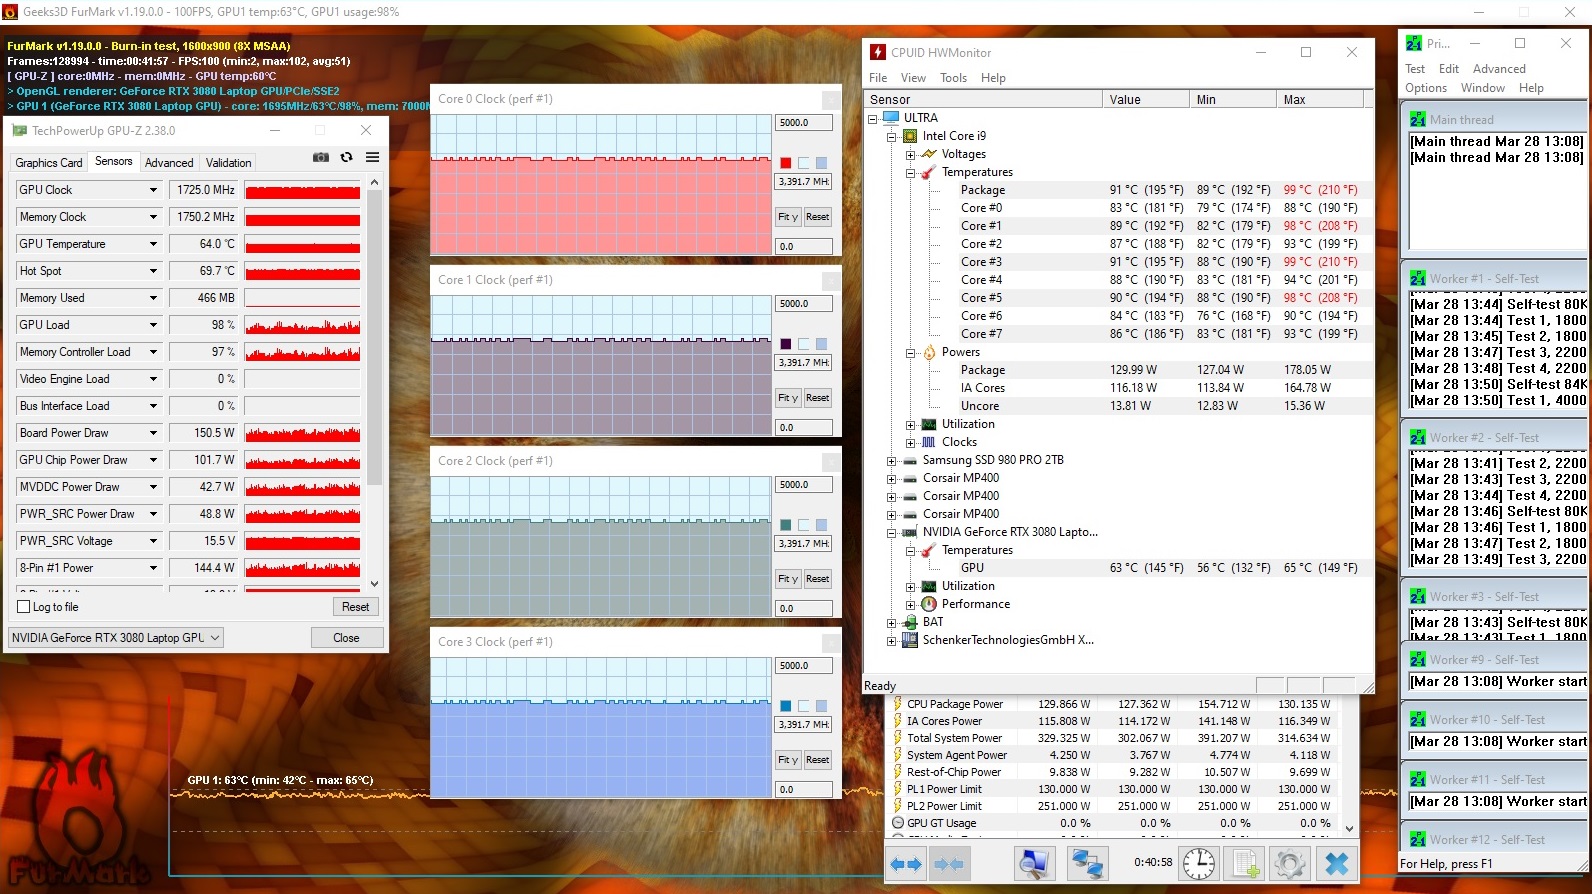
Sonderlich stark erwärmt sich das XMG Ultra nicht. Während des Stresstests registrieren wir an drei Messpunkten Temperaturen im unteren 40-Grad-Celsius-Bereich. Geringer fällt die Erwärmung bei der Durchführung des Witcher-3-Tests aus. Im Leerlauf liegen die Temperaturen teilweise höher als unter Last, da die Lüfter dann nur mit geringen Geschwindigkeiten arbeiten.
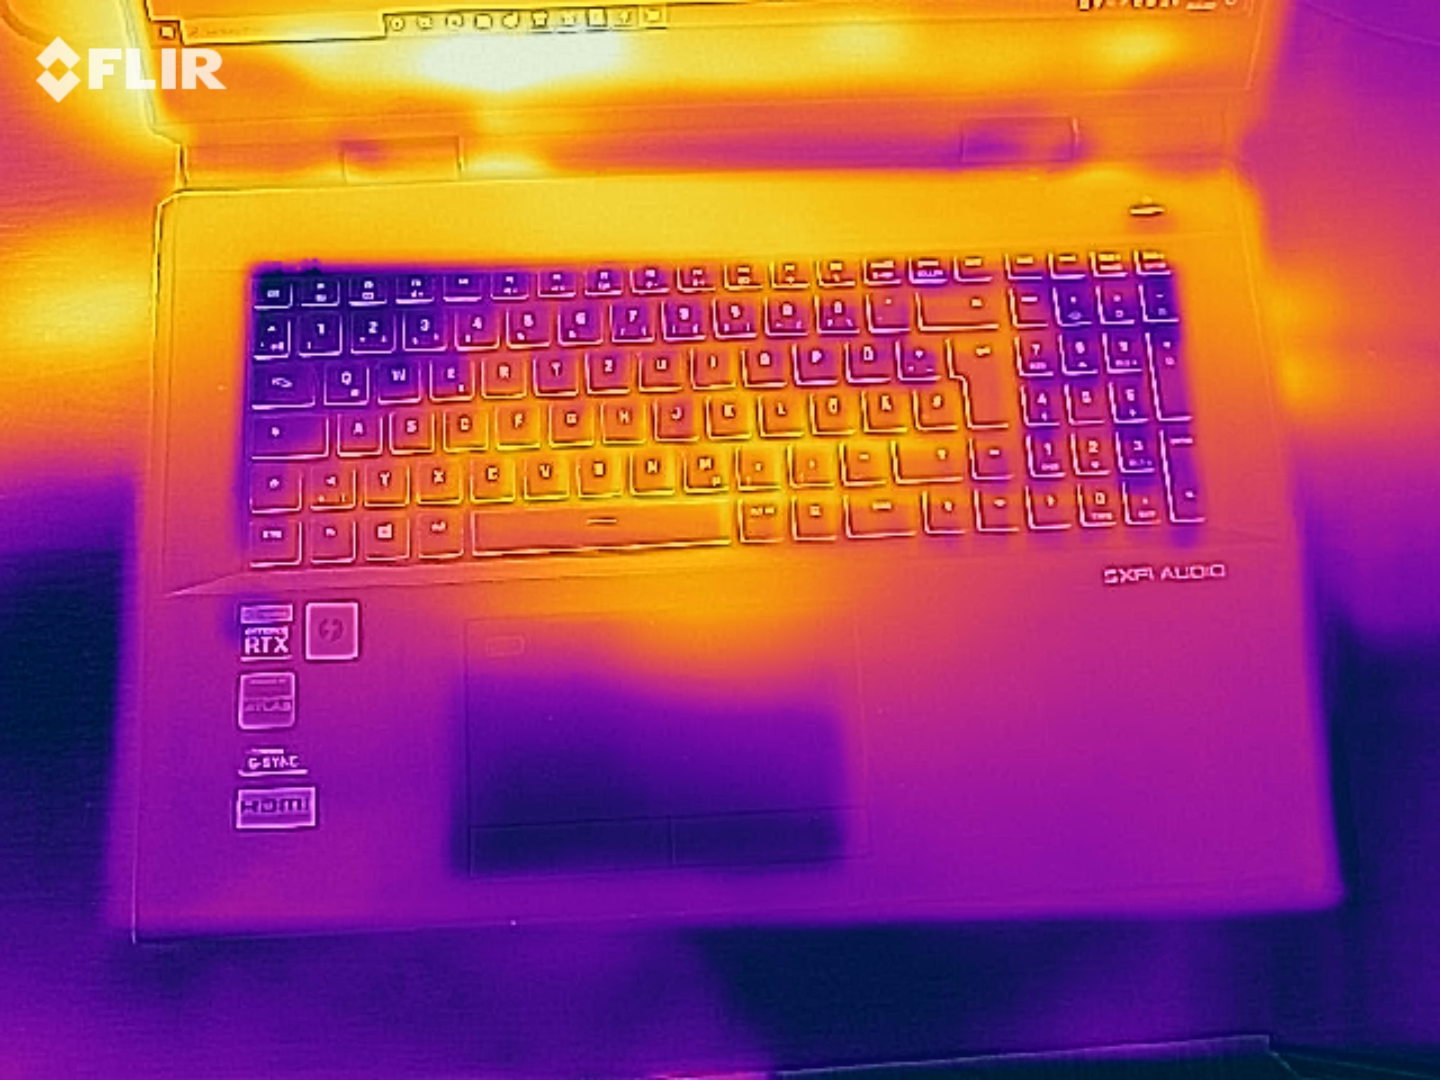
(+) Die maximale Temperatur auf der Oberseite ist 34 °C. Im Vergleich liegt der Klassendurchschnitt bei 40.4 °C (von 21.2 bis 68.8 °C für die Klasse Gaming).
(±) Auf der Unterseite messen wir eine maximalen Wert von 43 °C (im Vergleich zum Durchschnitt von 43.2 °C).
(±) Ohne Last messen wir eine durchschnittliche Temperatur von 33 °C auf der Oberseite. Der Klassendurchschnitt erreicht 33.9 °C.
(+) Beim längeren Spielen von The Witcher 3 erhitzt sich das Gerät durchschnittlich auf 28.2 °C. Der Durchschnitt der Klasse ist derzeit 33.9 °C.
(+) Die Handballen und der Touchpad-Bereich sind mit gemessenen 30 °C kühler als die typische Hauttemperatur und fühlen sich dadurch kühl an.
(±) Die durchschnittliche Handballen-Temperatur anderer getesteter Geräte war 28.8 °C (-1.2 °C).
| Schenker XMG Ultra 17 Rocket Lake i9-11900K, GeForce RTX 3080 Laptop GPU | MSI GT76 Titan DT 10SGS i9-10900K, GeForce RTX 2080 Super Mobile | Asus Strix Scar 17 G732LXS i9-10980HK, GeForce RTX 2080 Super Mobile | Schenker XMG Ultra 17 Comet Lake i9-10900K, GeForce RTX 2080 Super Mobile | Alienware m17 R4 i9-10980HK, GeForce RTX 3080 Laptop GPU | Durchschnitt der Klasse Gaming | |
|---|---|---|---|---|---|---|
| Hitze | 8% | -12% | 1% | -29% | -4% | |
| Last oben max * (°C) | 34 | 36.4 -7% | 59 -74% | 39 -15% | 58 -71% | 45.2 ? -33% |
| Last unten max * (°C) | 43 | 43 -0% | 52 -21% | 46 -7% | 46 -7% | 48.2 ? -12% |
| Idle oben max * (°C) | 38 | 28 26% | 30 21% | 32 16% | 45 -18% | 31 ? 18% |
| Idle unten max * (°C) | 39 | 33.4 14% | 29 26% | 35 10% | 46 -18% | 34.3 ? 12% |
* ... kleinere Werte sind besser
Lautsprecher
Schenker XMG Ultra 17 Rocket Lake Audio Analyse
(+) | Die Lautsprecher können relativ laut spielen (91 dB)
Bass 100 - 315 Hz
(±) | abgesenkter Bass - 8.1% geringer als der Median
(+) | lineare Bass-Wiedergabe (5.9% Delta zum Vorgänger)
Mitteltöne 400 - 2000 Hz
(+) | ausgeglichene Mitten, vom Median nur 3.4% abweichend
(+) | lineare Mitten (3.8% Delta zum Vorgänger)
Hochtöne 2 - 16 kHz
(±) | zu hohe Hochtöne, vom Median nur 5.2% abweichend
(+) | sehr lineare Hochtöne (6.4% Delta zum Vorgänger)
Gesamt im hörbaren Bereich 100 - 16.000 Hz
(+) | hörbarer Bereich ist sehr linear (10.3% Abstand zum Median
Im Vergleich zu allen Geräten derselben Klasse
» 6% aller getesteten Geräte dieser Klasse waren besser, 2% vergleichbar, 93% schlechter
» Das beste Gerät hat einen Delta-Wert von 6%, durchschnittlich ist 18%, das schlechteste Gerät hat 132%
Im Vergleich zu allen Geräten im Test
» 5% aller getesteten Geräte waren besser, 1% vergleichbar, 94% schlechter
» Das beste Gerät hat einen Delta-Wert von 4%, durchschnittlich ist 23%, das schlechteste Gerät hat 134%
Energieverwaltung - Schenker DTR mit großem Energiehunger
Energieaufnahme
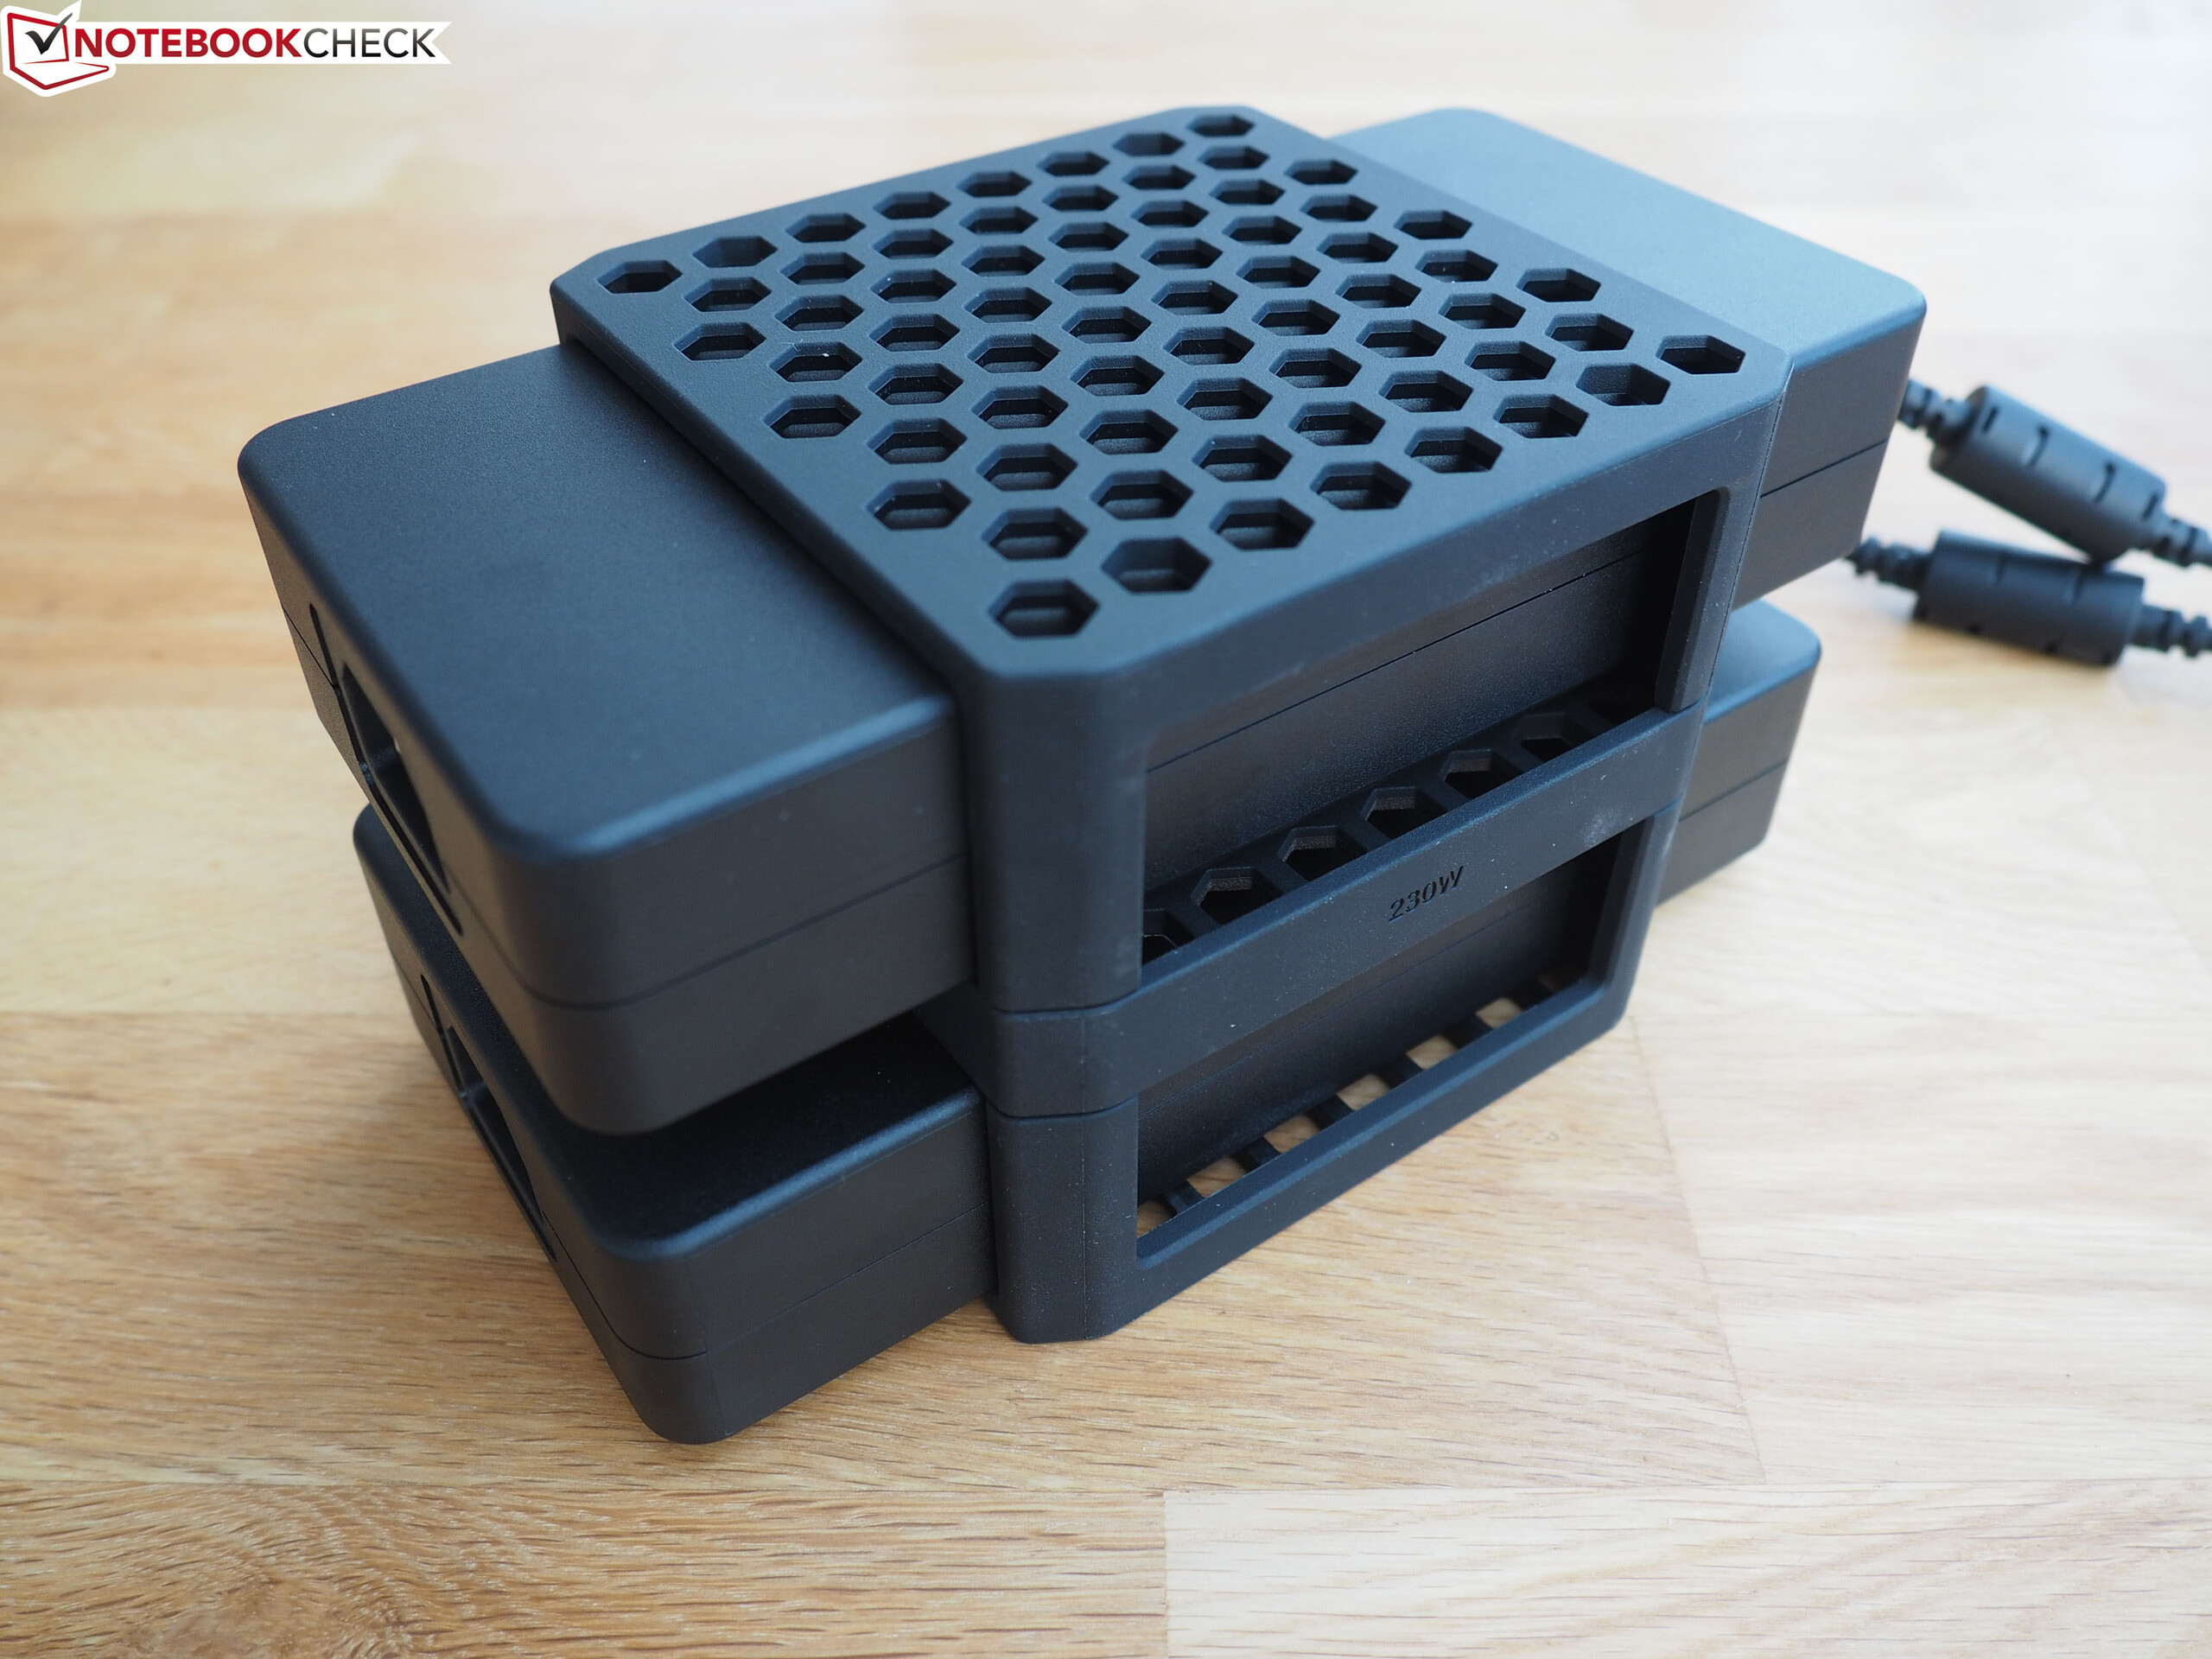
Im Leerlauf registrieren wir eine maximale Leistungsaufnahme von 69 Watt - ein Wert, den viele Office-Notebooks unter Volllast nicht erreichen. Hier macht sich die Kombination aus Hochleistungs-CPU und permanent aktiver GeForce-GPU bemerkbar. Stresstest bzw. Witcher-3-Test lassen den Bedarf auf bis zu 368 Watt bzw. durchschnittlich 297 Watt ansteigen. Die zwei Netzteile liefern eine Nennleistung von jeweils 280 Watt.
| Aus / Standby | |
| Idle | |
| Last |
|
Legende:
min: | |
| Schenker XMG Ultra 17 Rocket Lake i9-11900K, GeForce RTX 3080 Laptop GPU | MSI GT76 Titan DT 10SGS i9-10900K, GeForce RTX 2080 Super Mobile | Asus Strix Scar 17 G732LXS i9-10980HK, GeForce RTX 2080 Super Mobile | Schenker XMG Ultra 17 Comet Lake i9-10900K, GeForce RTX 2080 Super Mobile | Alienware m17 R4 i9-10980HK, GeForce RTX 3080 Laptop GPU | Durchschnitt der Klasse Gaming | |
|---|---|---|---|---|---|---|
| Stromverbrauch | 21% | 39% | 16% | 23% | 57% | |
| Idle min * (Watt) | 62 | 25.9 58% | 16 74% | 34 45% | 42 32% | 12.8 ? 79% |
| Idle avg * (Watt) | 64 | 38 41% | 25 61% | 40 37% | 48 25% | 18.5 ? 71% |
| Idle max * (Watt) | 69 | 53.2 23% | 35 49% | 47 32% | 58 16% | 24 ? 65% |
| Last avg * (Watt) | 183 | 123.8 32% | 177 3% | 130 29% | 124 32% | 108.2 ? 41% |
| Witcher 3 ultra * (Watt) | 297 | 312.5 -5% | 227 24% | 318 -7% | 219 26% | |
| Last max * (Watt) | 368 | 459.8 -25% | 280 24% | 512 -39% | 337 8% | 254 ? 31% |
* ... kleinere Werte sind besser
Akkulaufzeit
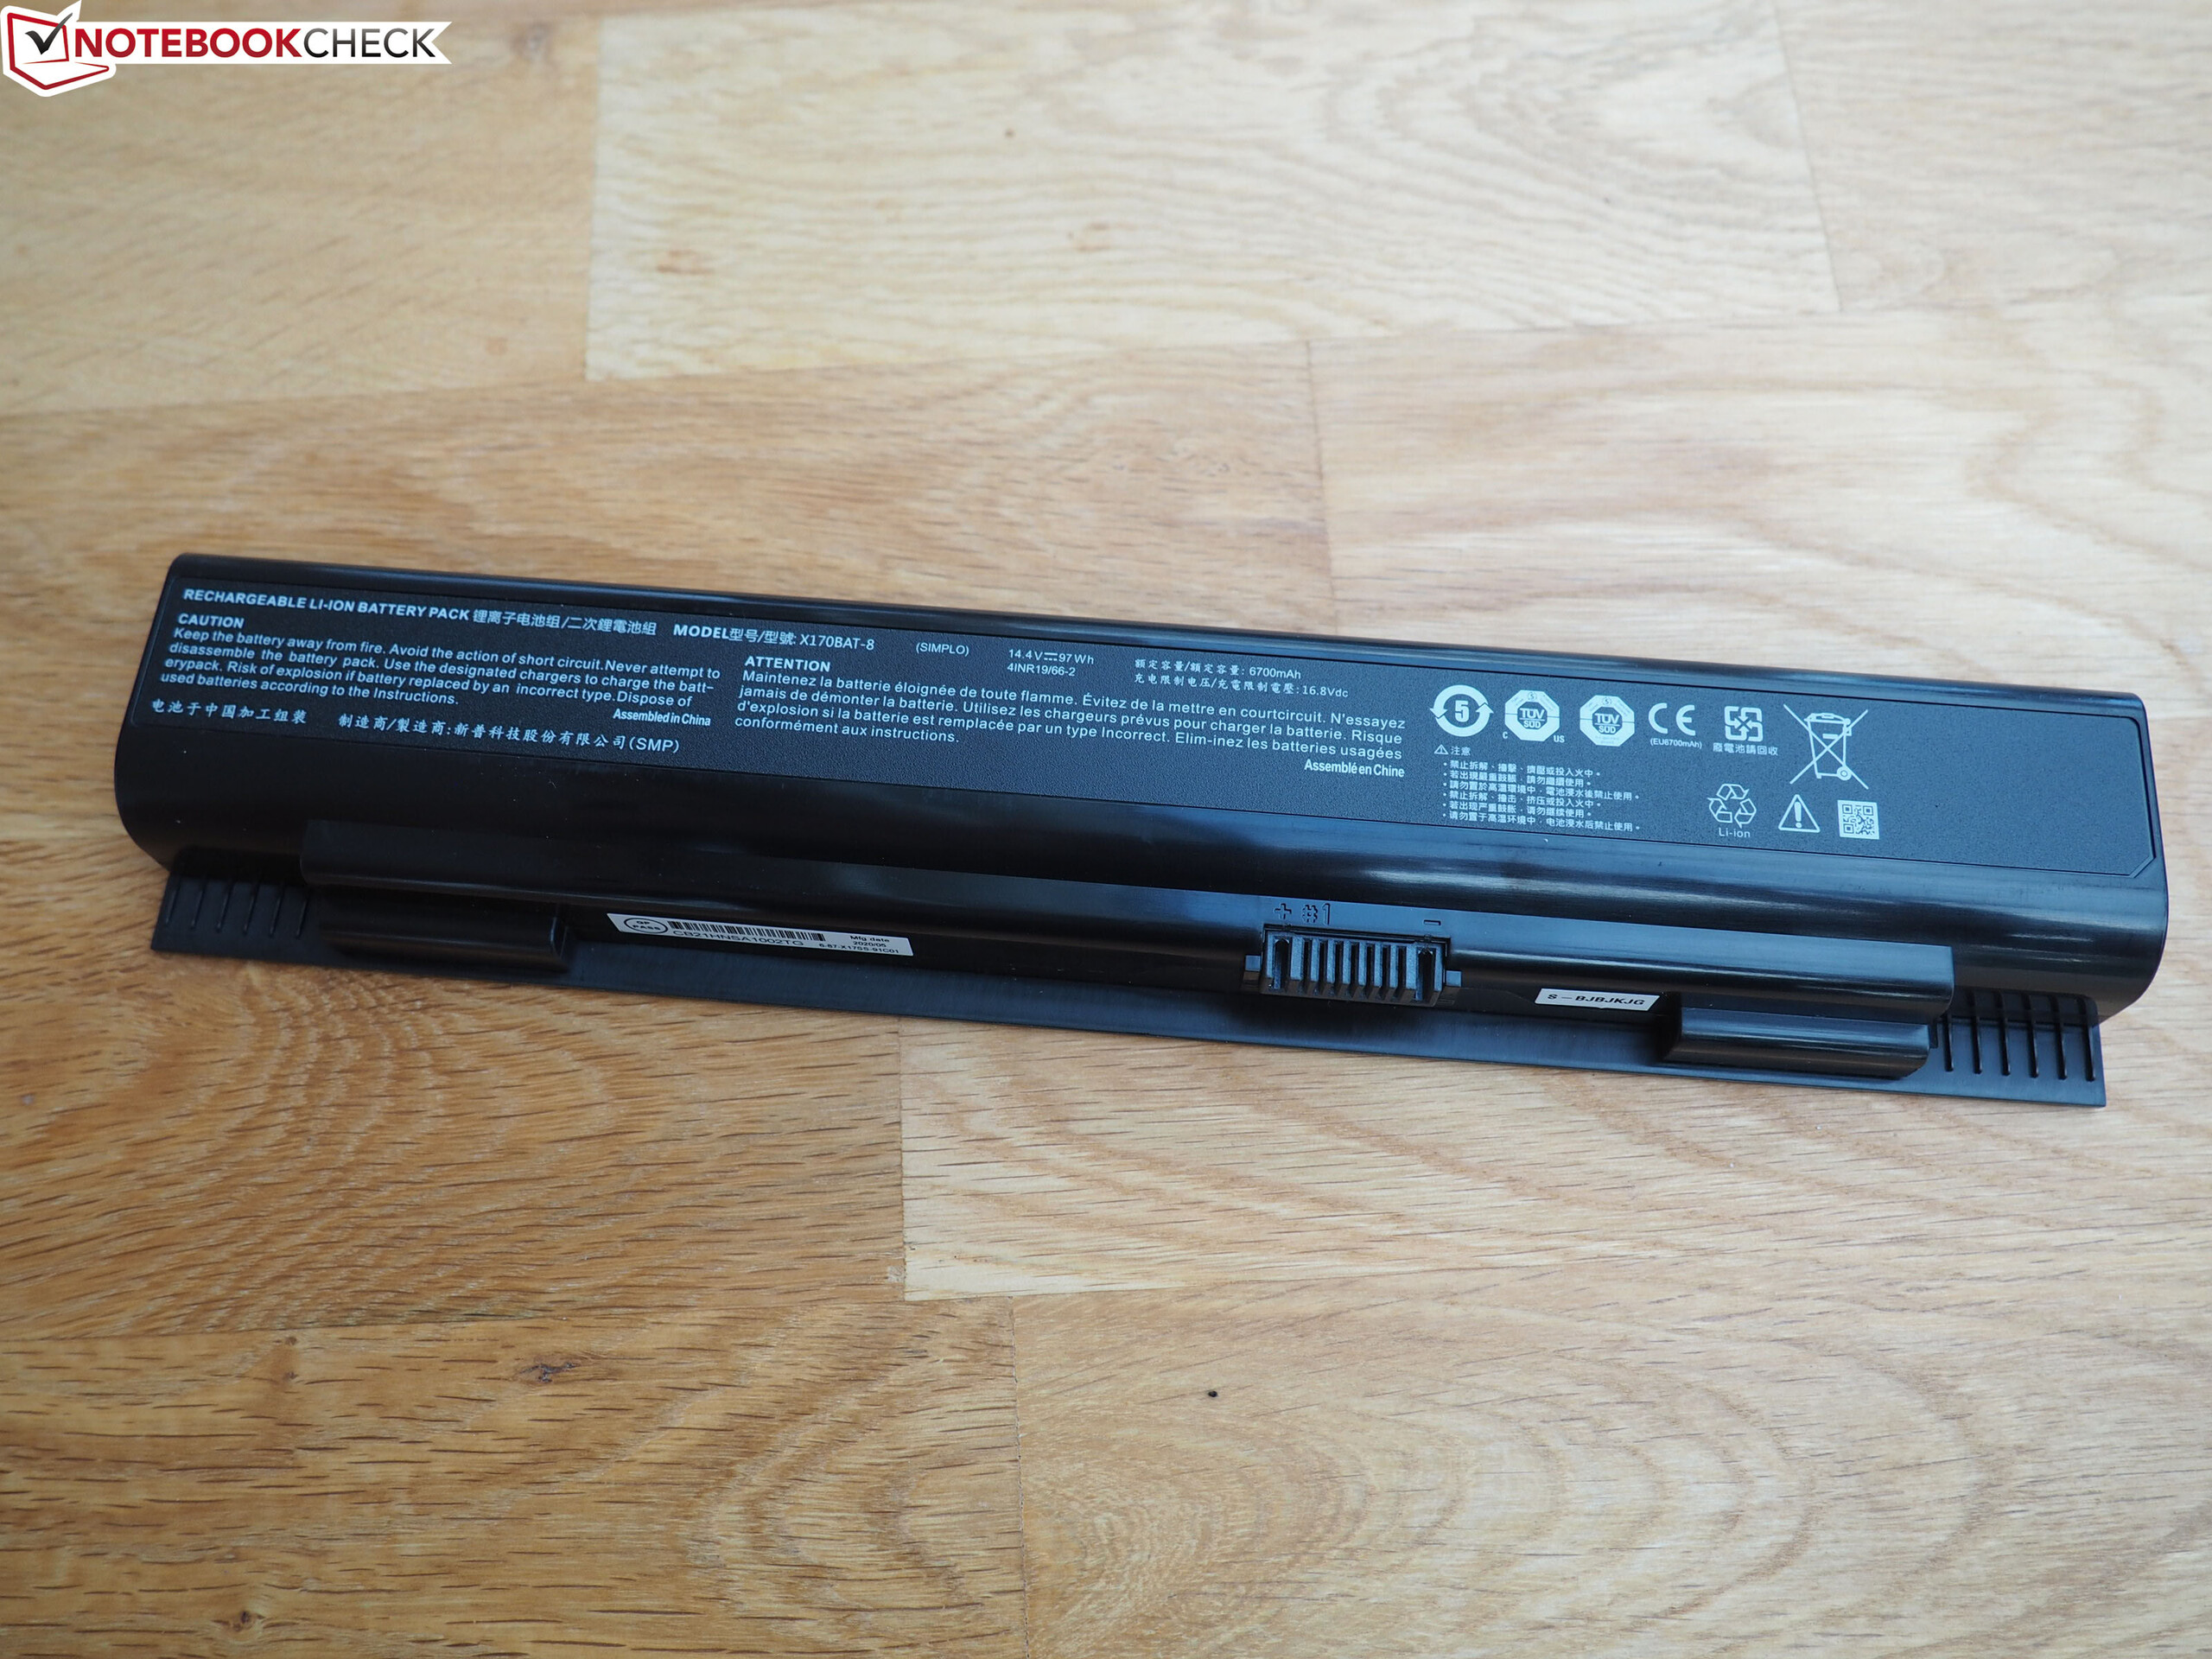
Der unbändige Energiehunger der Hardware führt dazu, dass auch der verbaute 97-Wh-Akku nur für mickrige Laufzeiten gut ist. Der 17,3-Zöller erreicht im WLAN-Test (Aufruf von Webseiten mittels eines Skripts) bzw. Videotest (Kurzfilm Big Buck Bunny (H.264-Kodierung, FHD) in Schleife) Laufzeiten von 1:50 h bzw. 1:55 h. Der Akku dient bei einem Gerät wie dem Ultra 17 mehr als Notstromversorgung denn als Mobilitätsfaktor.
| Schenker XMG Ultra 17 Rocket Lake i9-11900K, GeForce RTX 3080 Laptop GPU, 97 Wh | MSI GT76 Titan DT 10SGS i9-10900K, GeForce RTX 2080 Super Mobile, 90 Wh | Asus Strix Scar 17 G732LXS i9-10980HK, GeForce RTX 2080 Super Mobile, 66 Wh | Schenker XMG Ultra 17 Comet Lake i9-10900K, GeForce RTX 2080 Super Mobile, 97 Wh | Alienware m17 R4 i9-10980HK, GeForce RTX 3080 Laptop GPU, 86 Wh | Durchschnitt der Klasse Gaming | |
|---|---|---|---|---|---|---|
| Akkulaufzeit | 33% | 166% | 61% | 19% | 222% | |
| Idle (h) | 3 | 10 233% | 4.9 63% | 8.71 ? 190% | ||
| H.264 (h) | 1.9 | 2.2 16% | 8.9 ? 368% | |||
| WLAN (h) | 1.8 | 2.4 33% | 5.9 228% | 3.8 111% | 2.4 33% | 7.09 ? 294% |
| Last (h) | 1.1 | 1.5 36% | 1.2 9% | 1.2 9% | 1.51 ? 37% |
Pro
Contra
Fazit
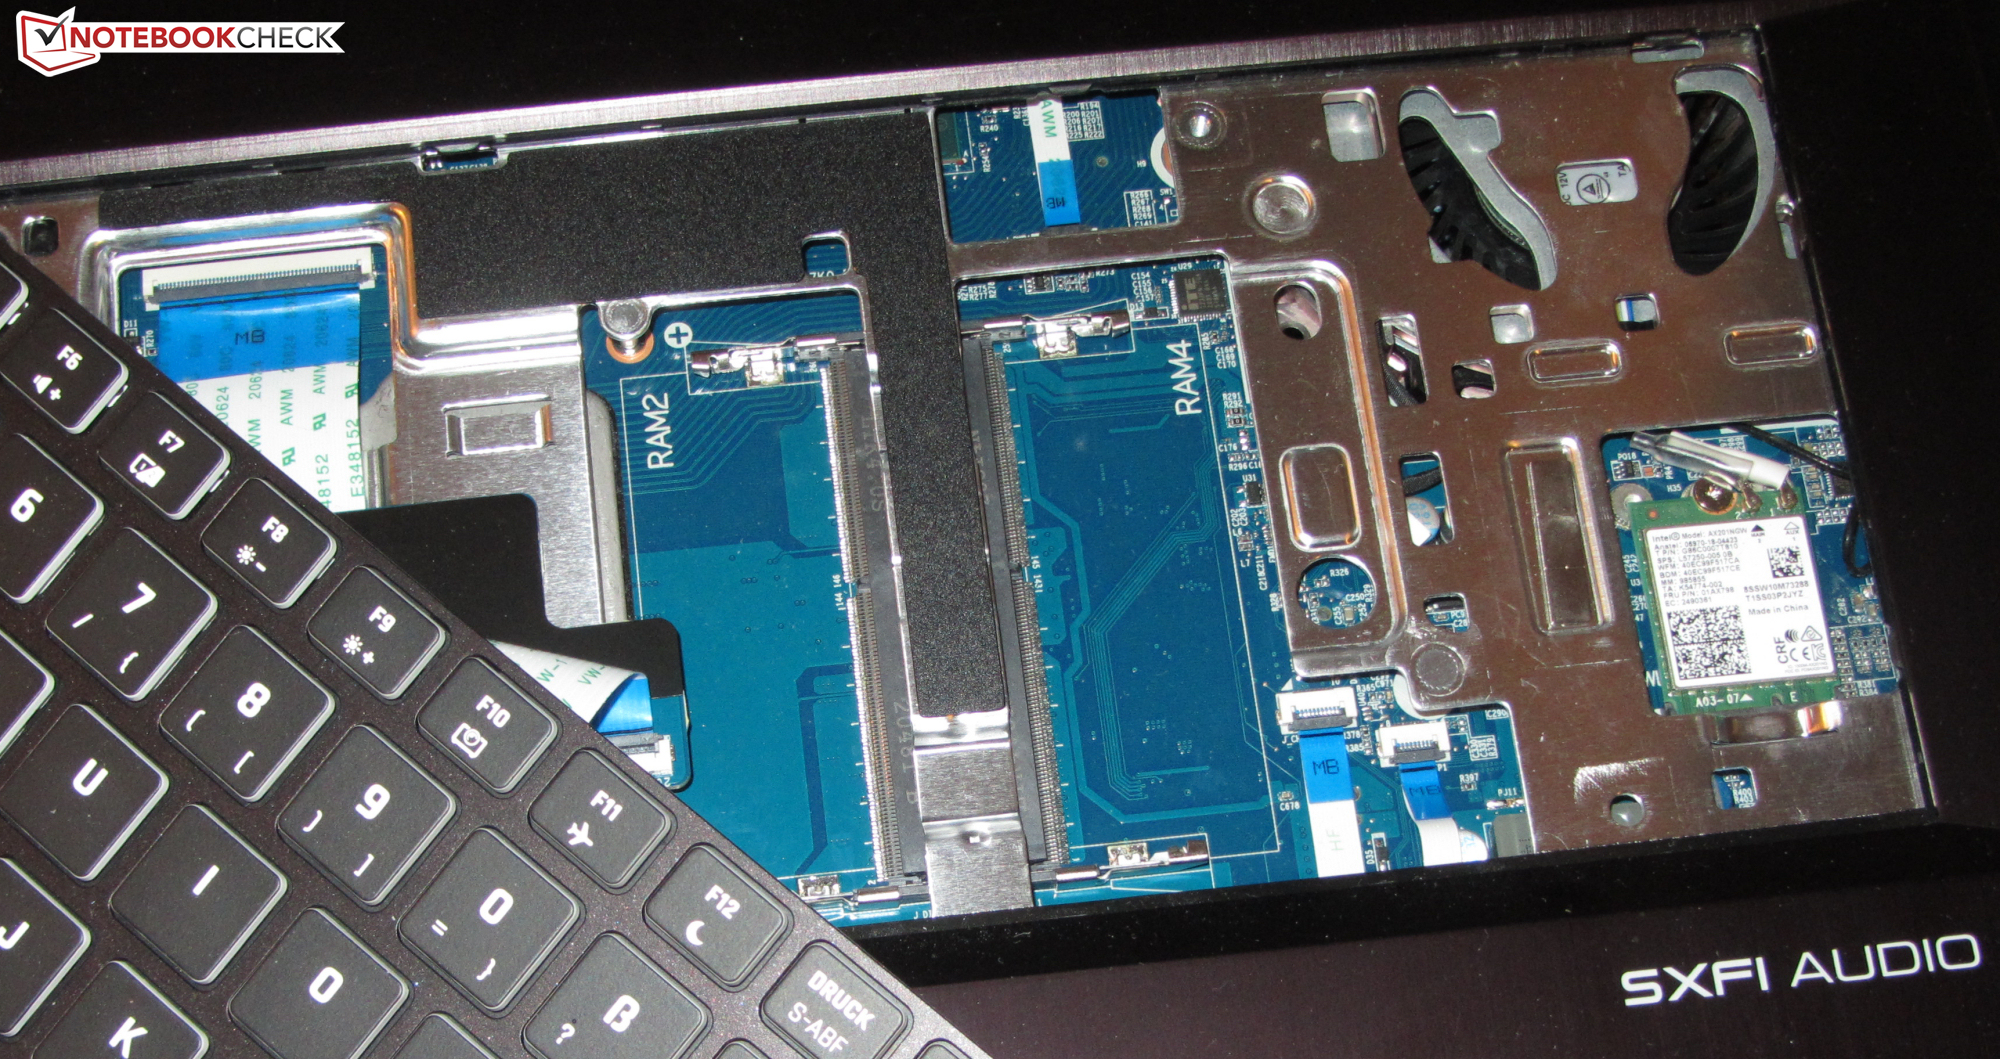
Schenkers wuchtiges Desktop-Replacement-Notebook geht bezüglich Ausstattung und Rechenleistung keine Kompromisse ein. Da nicht nur Arbeitsspeicher und Speichermedien, sondern auch CPU (gesockelt) und GPU (MXM) austauschbar sind, kann das Notebook sehr individuell konfiguriert werden. Es stehen drei GPUs (Ampere) und zehn CPUs (Comet Lake, Rocket Lake) zur Auswahl bereit.
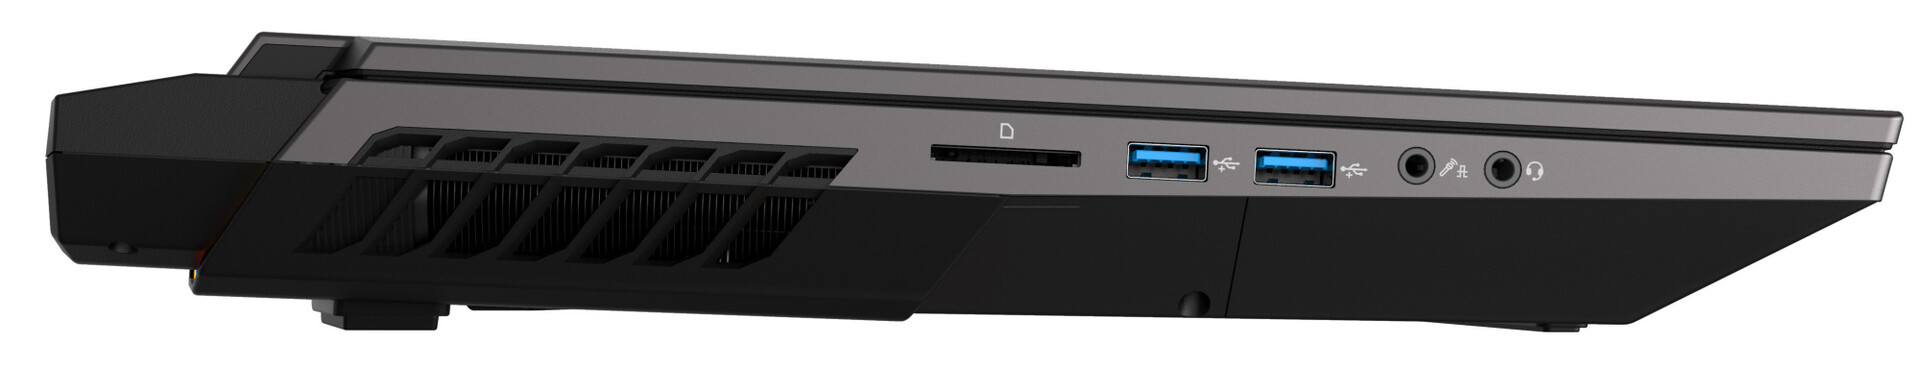
Das Schenker XMG Ultra 17 bietet viel Rechenleistung, zahlreiche Schnittstellen und reichlich Erweiterungsmöglichkeiten.
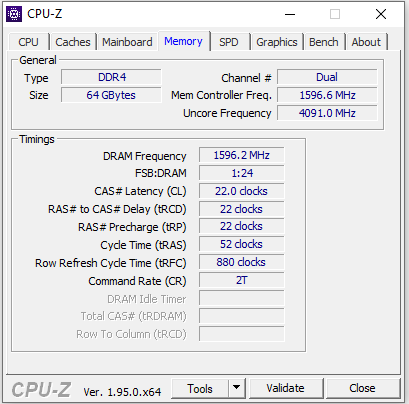
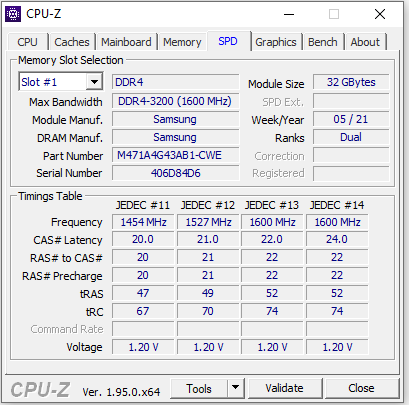
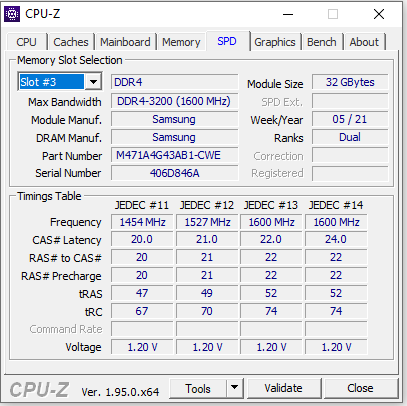
Das uns zur Verfügung gestellte Testgerät ist dank der Kombination aus Core-i9-11900K-Prozessor, GeForce-RTX-3080-Laptop-GPU, 64 GB Arbeitsspeicher (max. 128 GB) und 4 NVMe-SSDs mit insgesamt 26 TB Speicherplatz für alle gängigen Anwendungsbereiche mehr als gerüstet. Office, Internet, Videoschnitt, Bildbearbeitung, Streaming und Gaming bewältigt der Rechner anstandslos.
Nvidias G-Sync-Technologie sorgt für eine flüssige Darstellung der Bilder auf dem 300-Hz-IPS-Display. Letzteres punktet mit matter Oberfläche, gutem Kontrast, kurzen Reaktionszeiten, stabilen Blickwinkeln, toller Farbdarstellung und ordentlicher Farbraumabdeckung. Die Maximalhelligkeit dürfte aber etwas höher ausfallen. Da das Gerät aufgrund geringer Mobilität in erster Linie stationär in Innenräumen genutzt werden dürfte, kann damit gelebt werden.
Preis und Verfügbarkeit
Das Schenker XMG Ultra 17 (2021) kann individuell im Schenker-Onlineshop konfiguriert werden. Die uns zur Verfügung gestellte Ausstattungsvariante ist für knapp 9.000 Euro zu bekommen. Einstiegsmodelle sind ab etwa 2.500 Euro zu haben.
Schenker XMG Ultra 17 Rocket Lake
- 19.04.2021 v7 (old)
Sascha Mölck
Preisvergleich
