Alienware x17 R2 Laptop Test: Spitzenleistung der 175 W GeForce RTX 3080 Ti
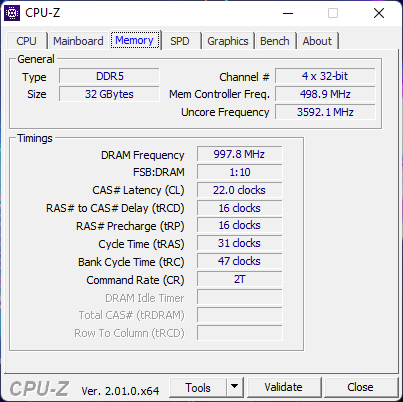
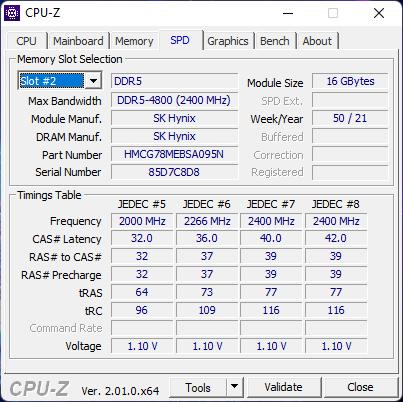
Dell hat seine Alienware-x17-Serie Ende letzten Jahres mit einem komplett neuen Gehäuse-Design eingeführt, um sie von der bestehenden Alienware-m17-Serie zu unterscheiden. Für dieses Jahr hat der Hersteller das Line-up mit der Einführung des Alienware x17 R2 aufgefrischt, komplett mit Intel-Alder-Lake-P-CPUs der 12. Generation und GeForce-RTX-3070/3080-Ti-Grafiken, um die letztjährigen Tiger-Lake-H- und -RTX-3070/3080-Optionen der 11. Generation zu ersetzen. Andere Aktualisierungen sind ebenfalls vorhanden, einschließlich des schnelleren Arbeitsspeichers (DDR4-3466 zu DDR5-4800), neuerer Display-Optionen und Unterstützung für MUX und Advanced Optimus.
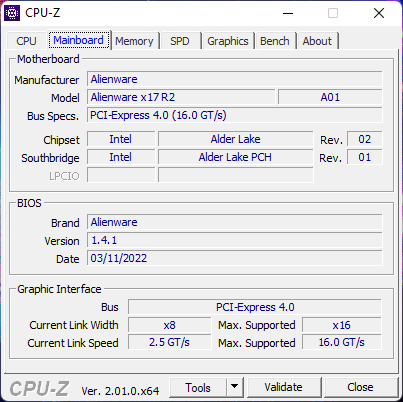
Abgesehen von den oben erwähnten internen Updates verwendet das Alienware x17 R2 das gleiche Gehäuse wie das Alienware x17 R1. Wir empfehlen einen Blick auf unseren Test des x17 R1 zu werfen, da unsere bestehenden Kommentare zum Gehäuse, zur mechanischen Cherry Tastatur und zu den Anschlüssen auch für das x17 R2 relevant sind.
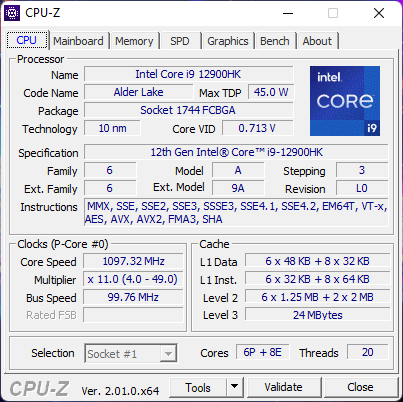
Alle konfigurierbaren Optionen finden Sie in den offiziellen technischen Daten unten. Bei unserem Testgerät handelt es sich um ein höherwertiges Modell mit Core i9-12900HK, 360-Hz-1080p-Display und 175-W-GeForce-RTX-3080-Ti-Grafikkarte für knapp unter 4.000 US-Dollar. Zu den Konkurrenten in diesem Bereich gehören andere ultradünne 17,3-Zoll-Gaming-Laptops wie das MSI GS77, Razer Blade 17 und Asus Zephyrus S17.
Weitere Alienware Tests:
Mögliche Konkurrenten im Vergleich
Bew | Datum | Modell | Gewicht | Dicke | Größe | Auflösung | Preis ab |
|---|---|---|---|---|---|---|---|
| 89.2 % v7 (old) | 05 / 2022 | Alienware x17 R2 P48E i9-12900HK, GeForce RTX 3080 Ti Laptop GPU | 3.1 kg | 20.9 mm | 17.30" | 1920x1080 | |
| 89 % v7 (old) | 09 / 2021 | Alienware x17 RTX 3080 P48E i7-11800H, GeForce RTX 3080 Laptop GPU | 3.2 kg | 21.4 mm | 17.30" | 3840x2160 | |
| 90.1 % v7 (old) | 07 / 2021 | Asus ROG Zephyrus S17 GX703HSD i9-11900H, GeForce RTX 3080 Laptop GPU | 2.8 kg | 19.9 mm | 17.30" | 2560x1440 | |
| 87.2 % v7 (old) | 04 / 2022 | MSI Stealth GS77 12UHS-083US i7-12700H, GeForce RTX 3080 Ti Laptop GPU | 2.9 kg | 20.8 mm | 17.30" | 2560x1440 | |
| 87.4 % v7 (old) | 10 / 2020 | MSI GT76 Titan DT 10SGS i9-10900K, GeForce RTX 2080 Super Mobile | 4.2 kg | 42 mm | 17.30" | 3840x2160 | |
| 83.2 % v7 (old) | 10 / 2021 | Gigabyte A7 X1 R9 5900HX, GeForce RTX 3070 Laptop GPU | 2.5 kg | 34 mm | 17.30" | 1920x1080 |
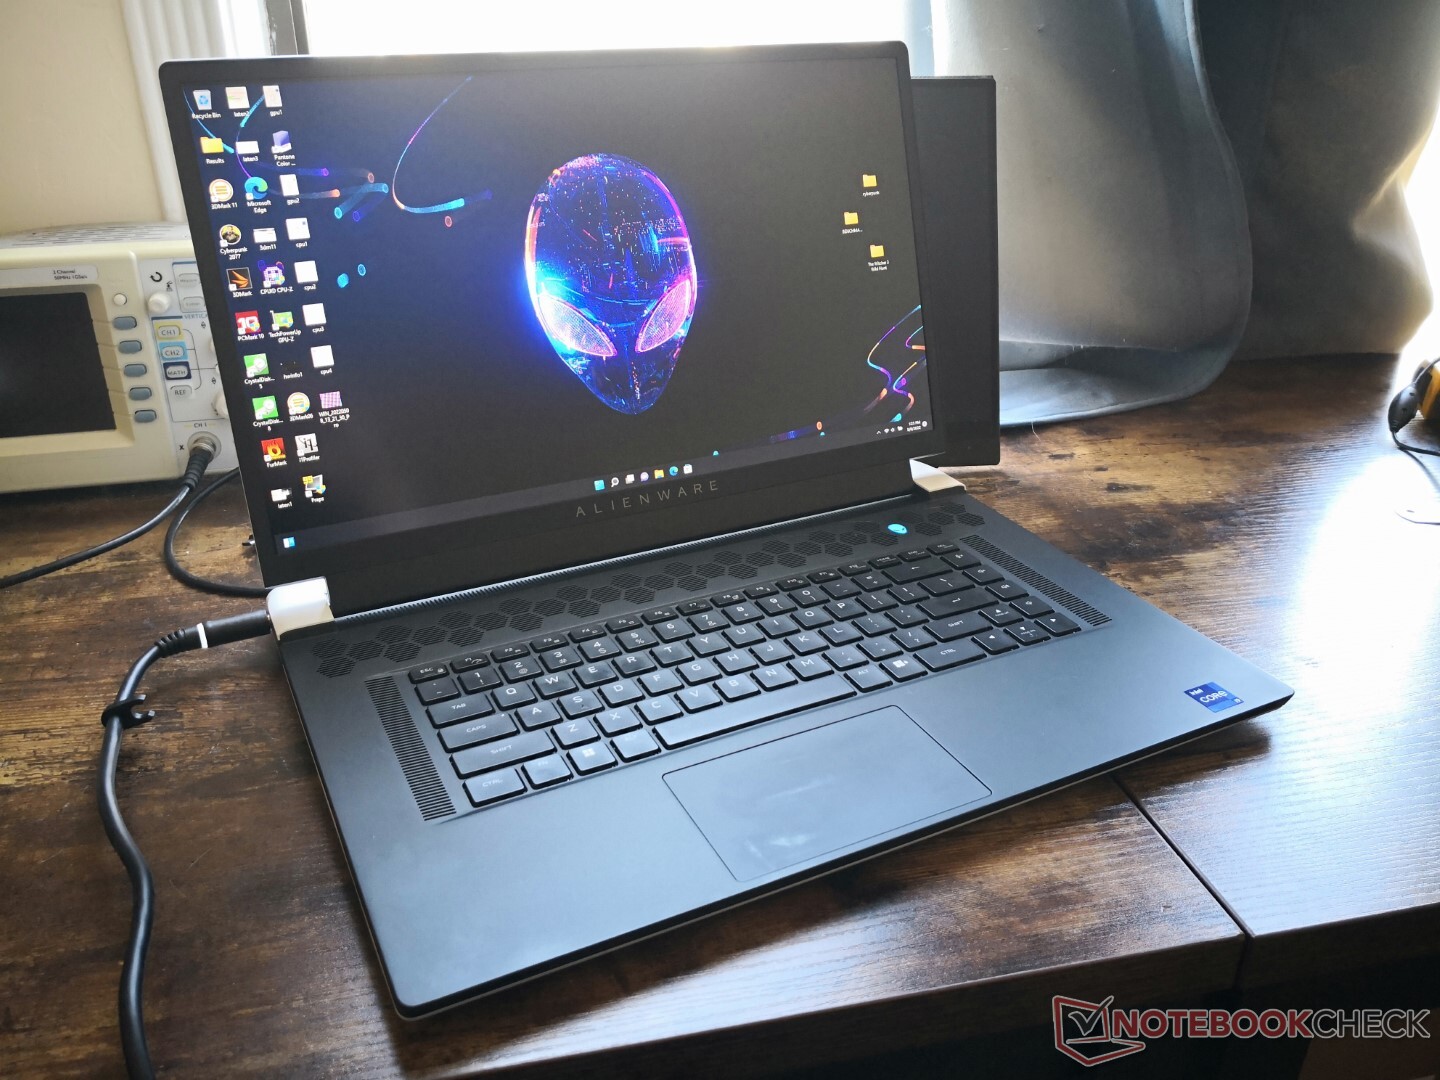
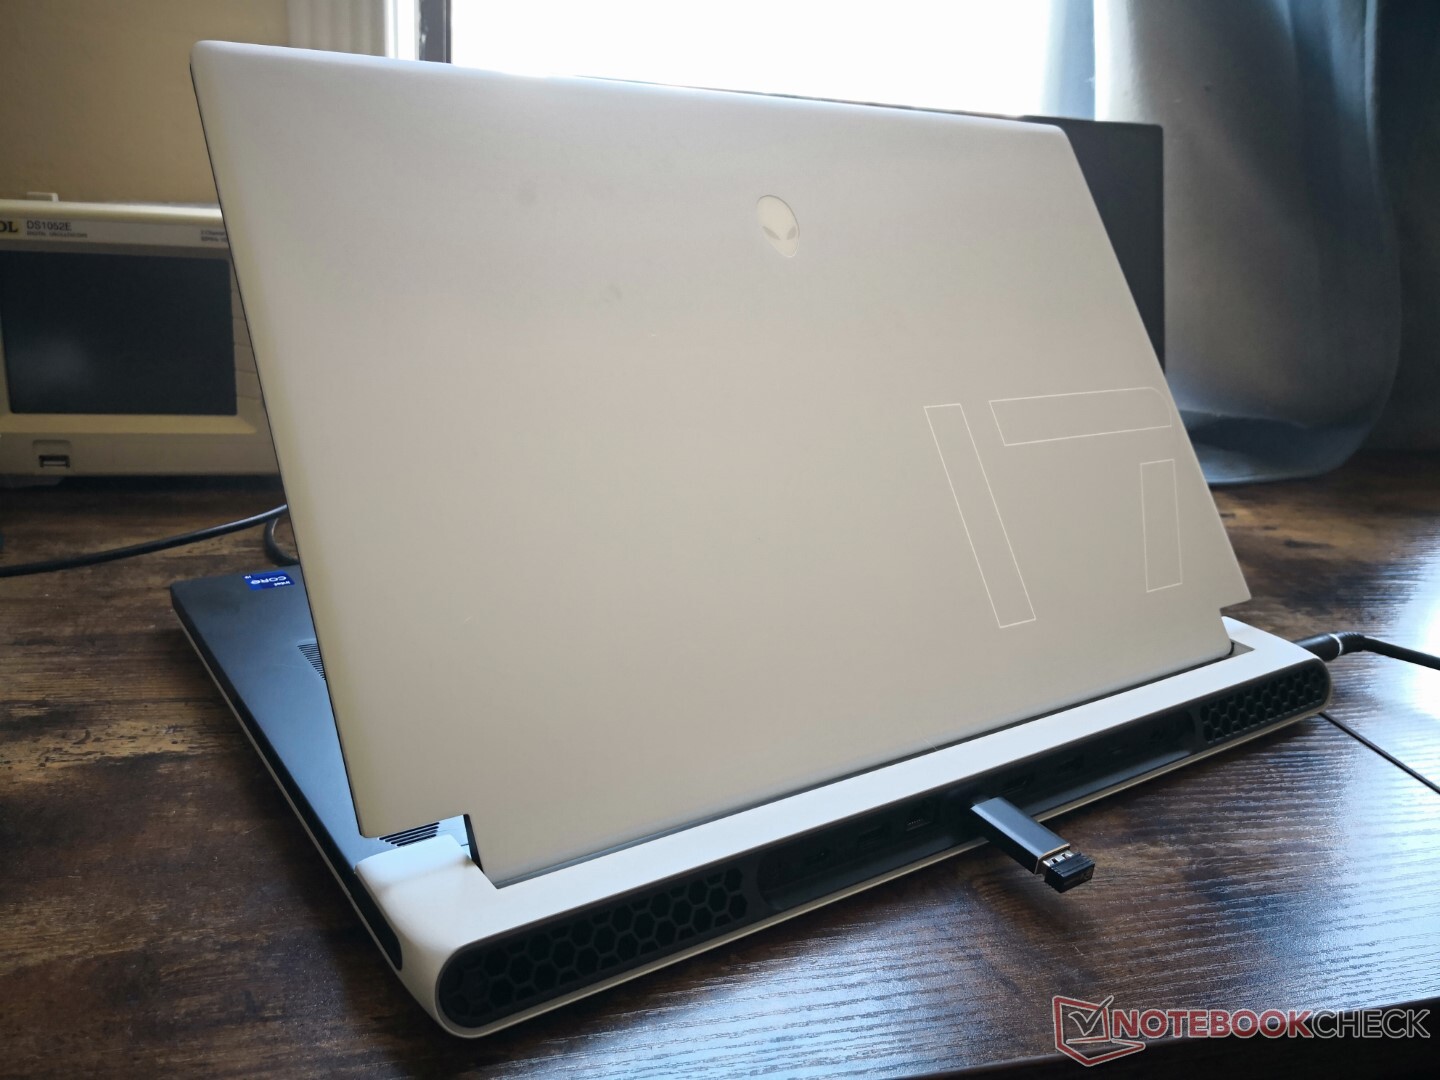
Gehäuse
Obwohl es als ultradünnes Gaming-Notebook vermarktet wird, ist das Alienware-x17-R2-Gehäuse immer noch merklich schwerer und größer als Alternativen wie das Asus Zephyrus S17, MSI GS77 oder Razer Blade 17. Im Gegenzug ist das Alienware System in der Lage, eine leistungsstärkere 175-W-GPU zu tragen, während die meisten anderen ultradünnen Gaming-Laptops auf 140 W oder weniger beschränkt sind.
SD-Kartenleser
| SD Card Reader | |
| average JPG Copy Test (av. of 3 runs) | |
| MSI GT76 Titan DT 10SGS (Toshiba Exceria Pro M501 UHS-II) | |
| Asus ROG Zephyrus S17 GX703HSD | |
| Alienware x17 R2 P48E (AV Pro V60) | |
| Alienware x17 RTX 3080 P48E (AV Pro V60) | |
| MSI Stealth GS77 12UHS-083US (AV Pro V60) | |
| maximum AS SSD Seq Read Test (1GB) | |
| Asus ROG Zephyrus S17 GX703HSD | |
| Alienware x17 RTX 3080 P48E (AV Pro V60) | |
| Alienware x17 R2 P48E (AV Pro V60) | |
| MSI GT76 Titan DT 10SGS (Toshiba Exceria Pro M501 UHS-II) | |
| MSI Stealth GS77 12UHS-083US (AV Pro V60) | |
Kommunikation
Webcam
Die Webcam bleibt bei 720p ohne physischen Privacy Shutter im Vergleich zu 1.080p beim aktuellen Razer Blade 17. Windows Hello wird unterstützt.

")
")
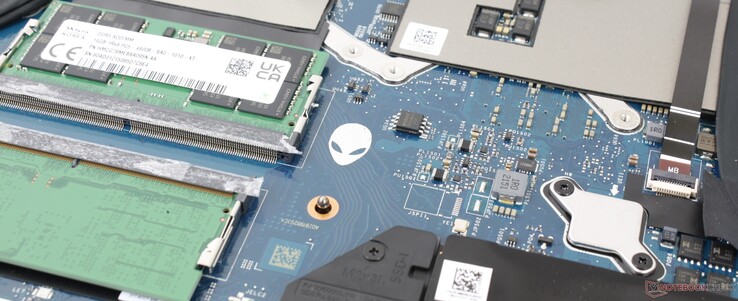
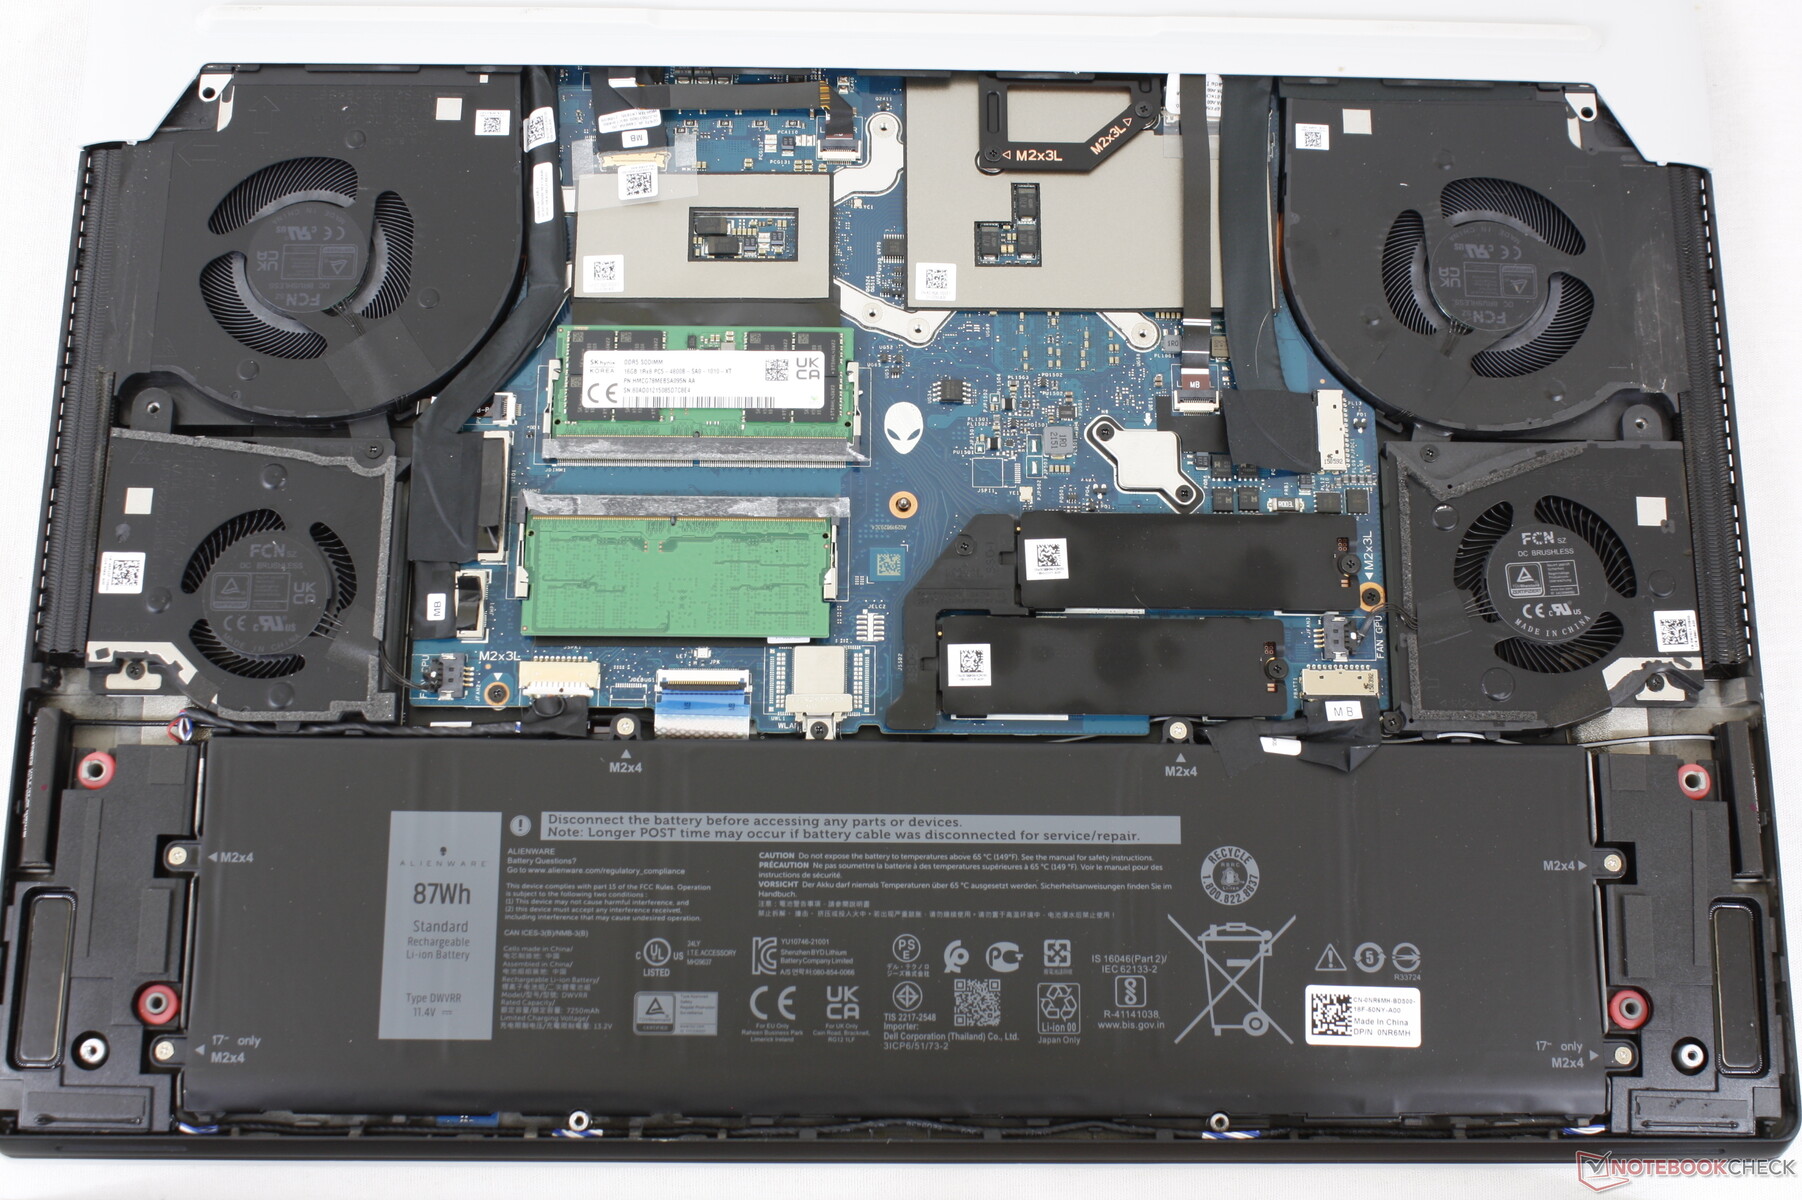
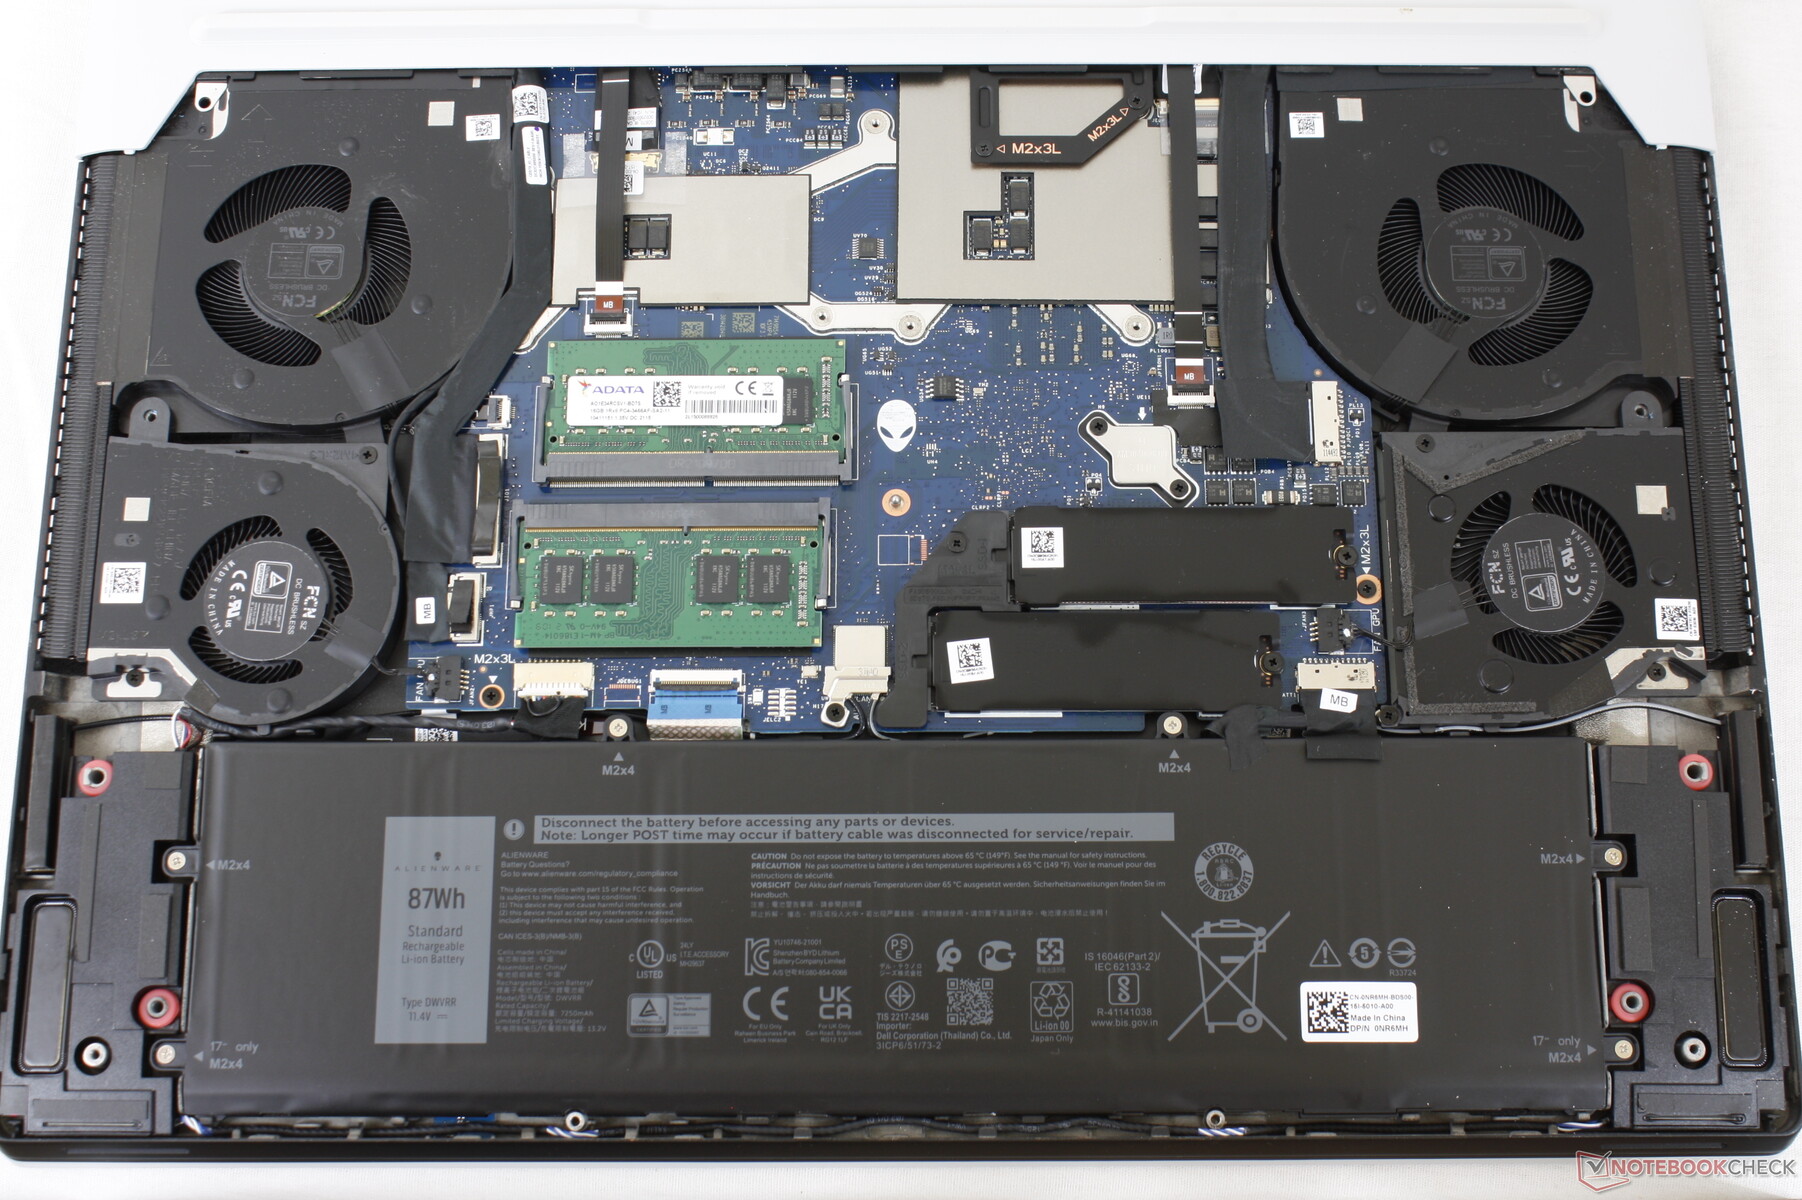
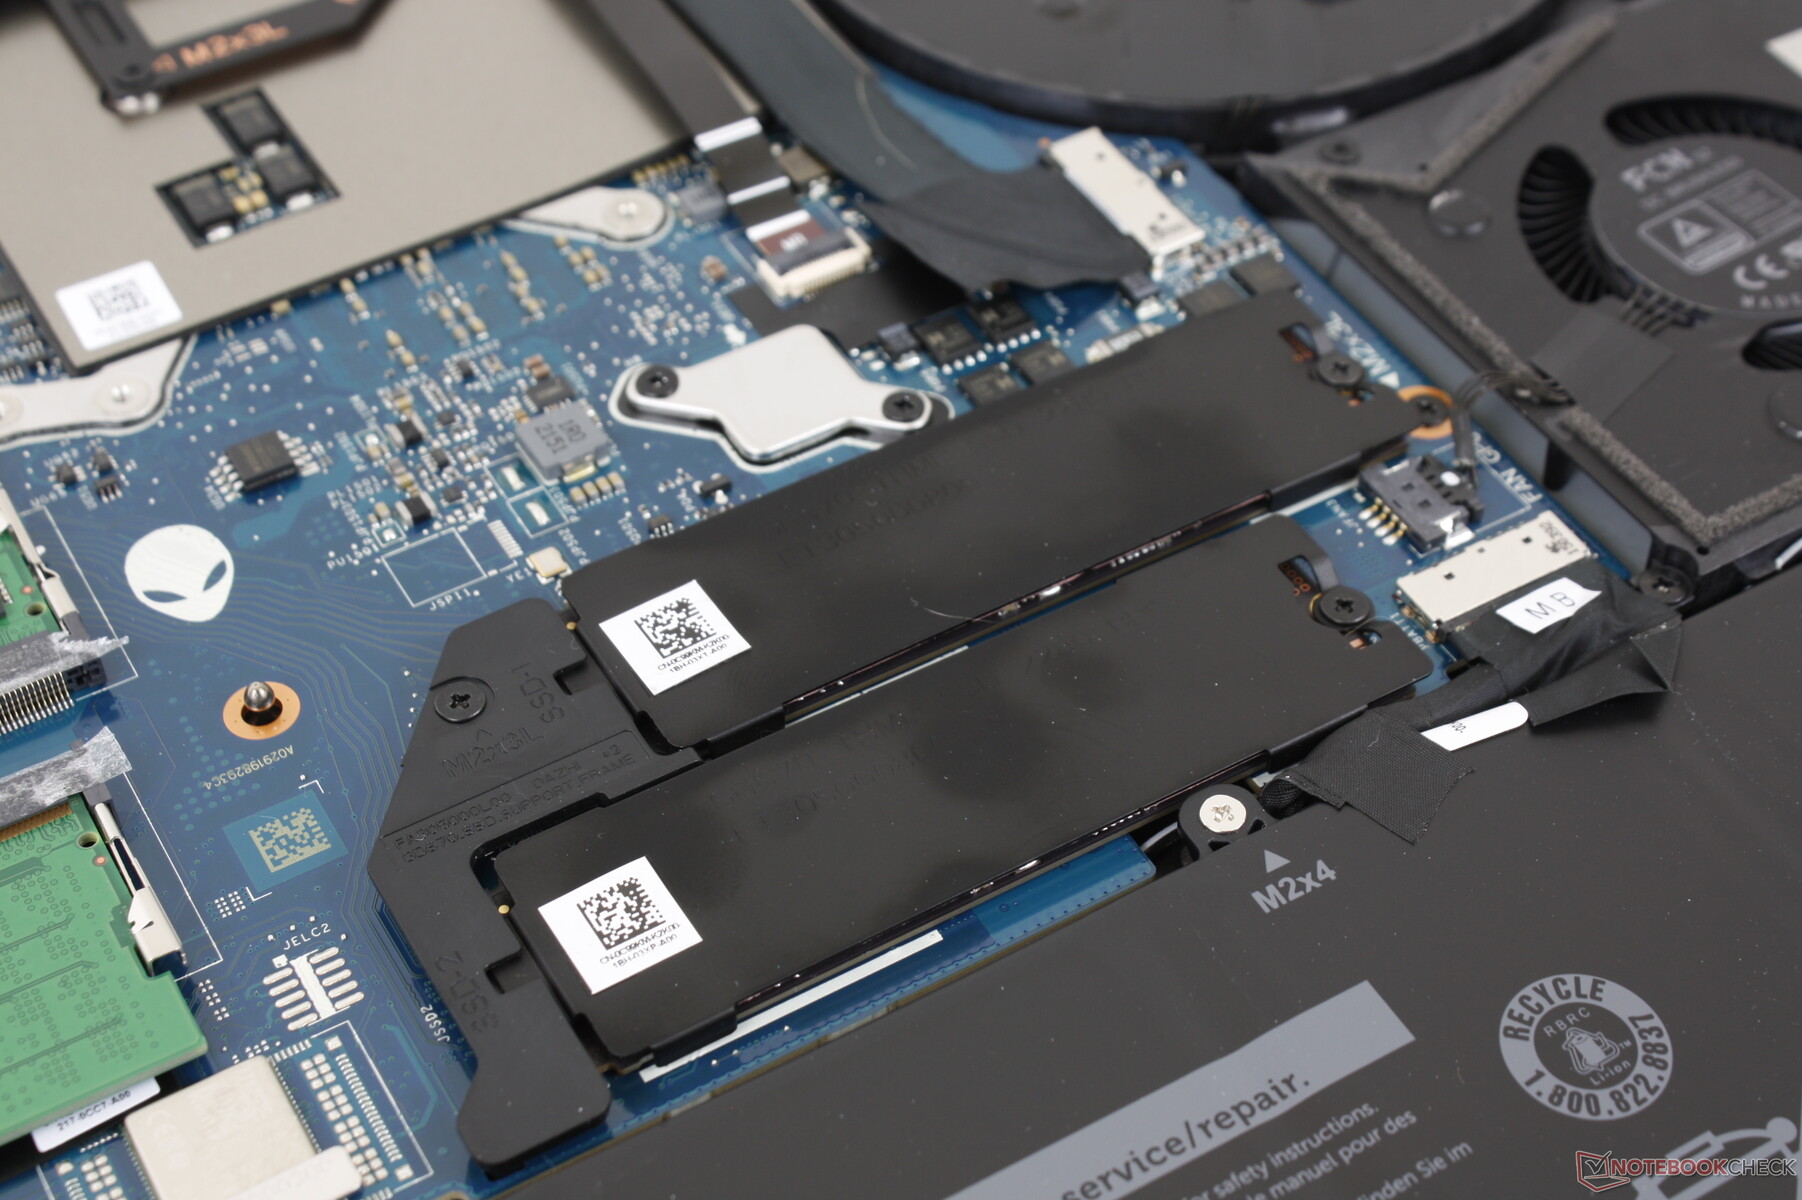
Wartung
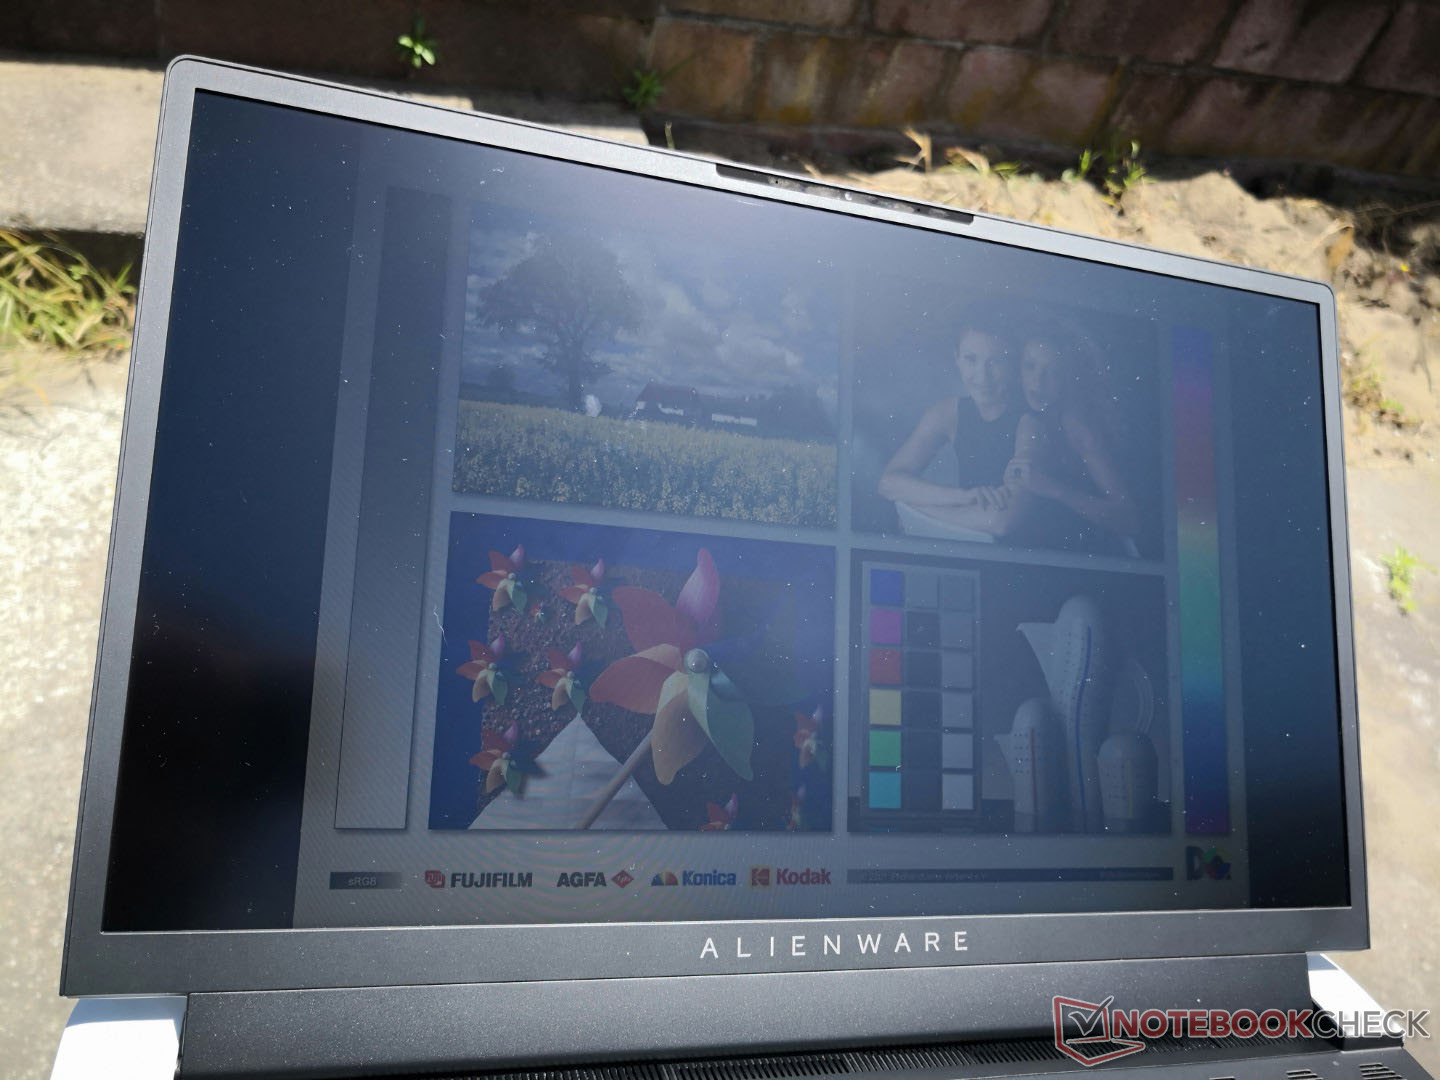
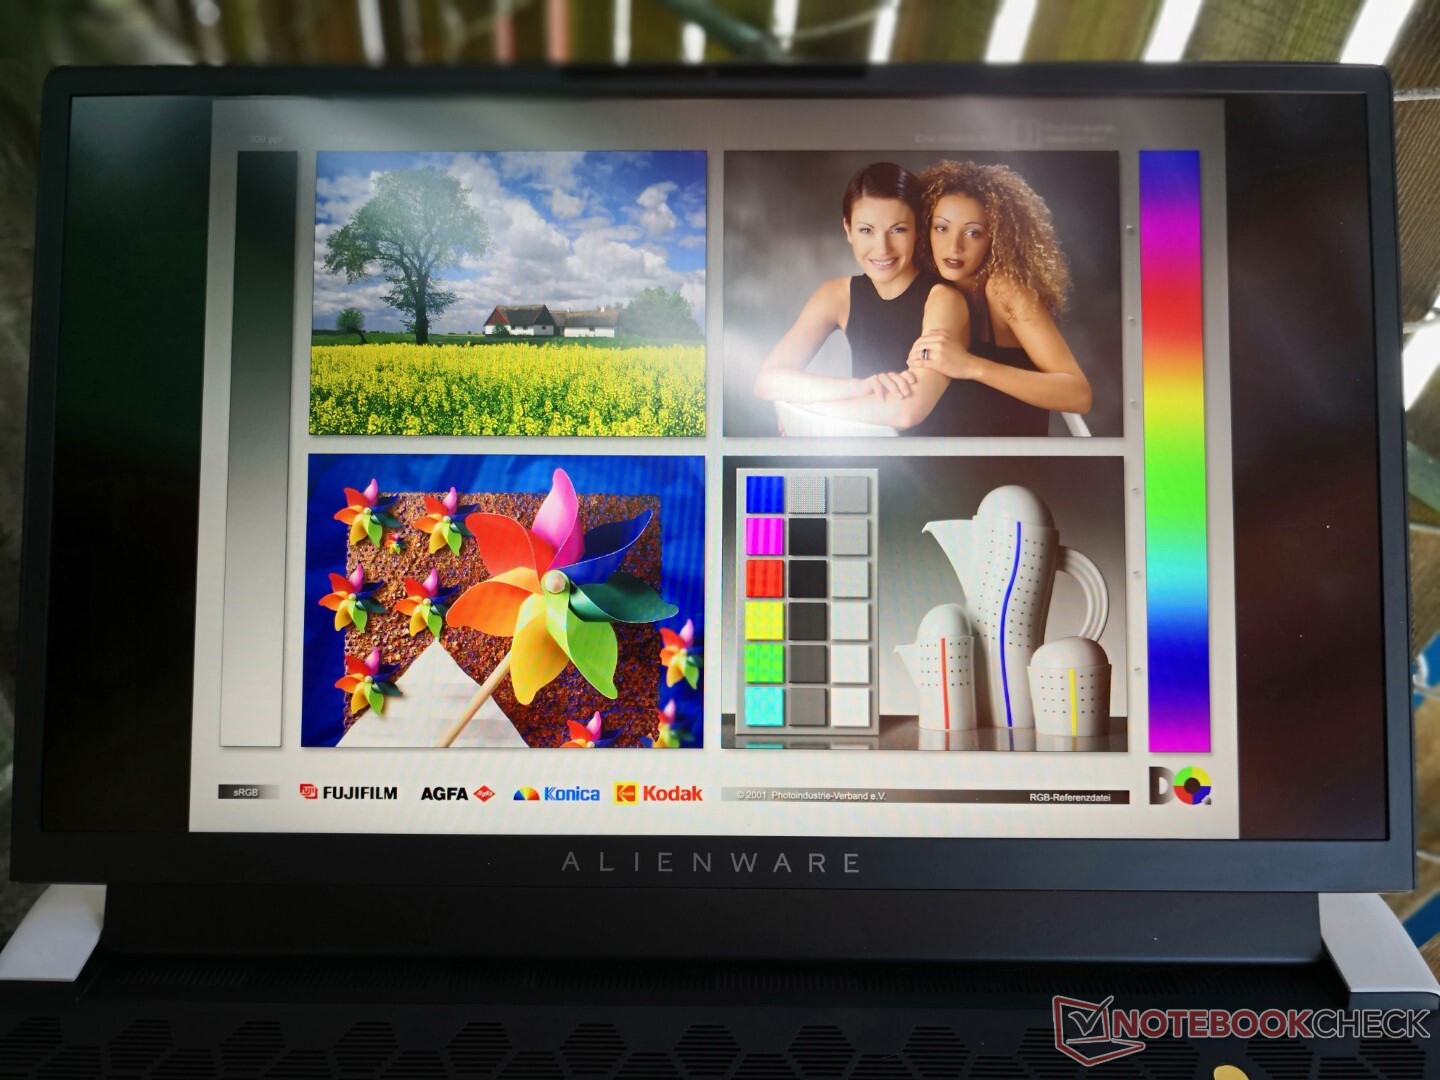
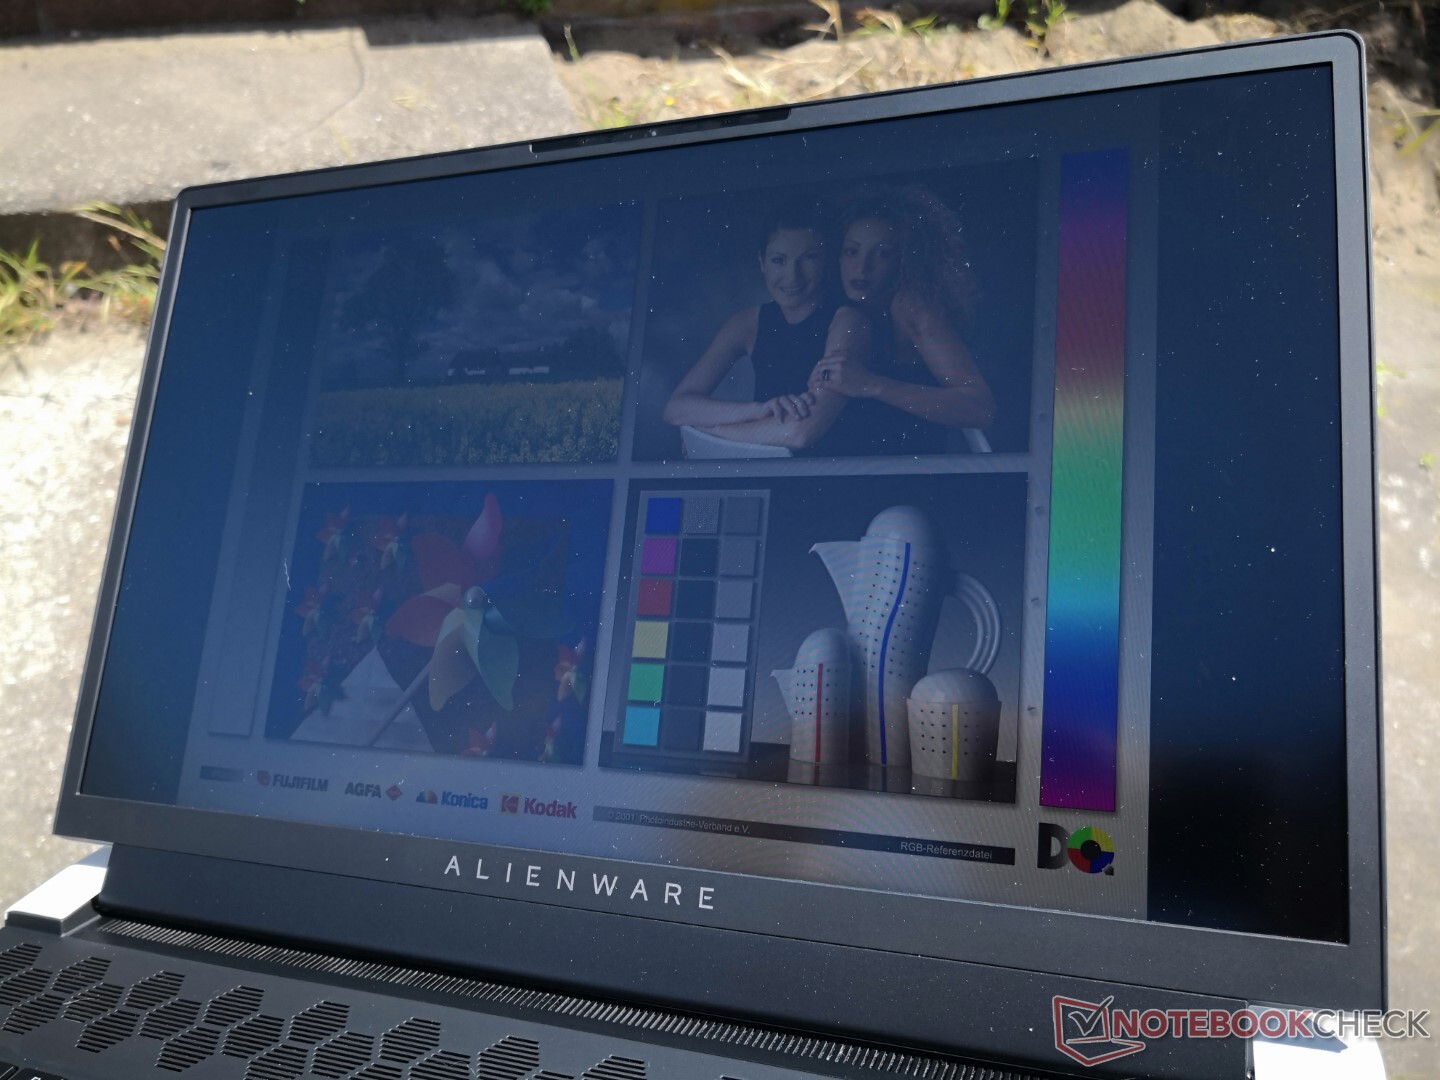
Display
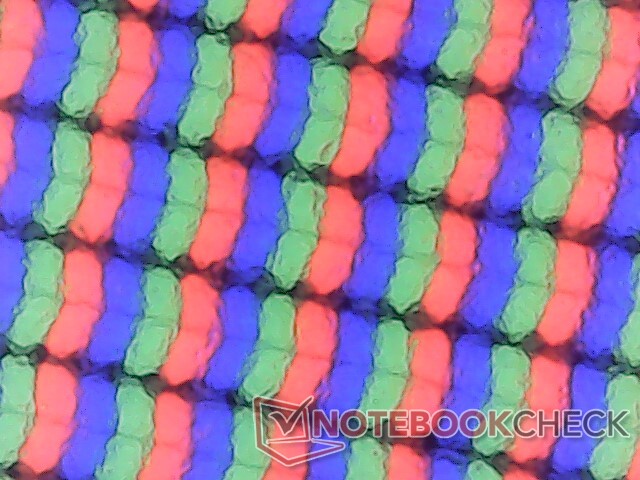
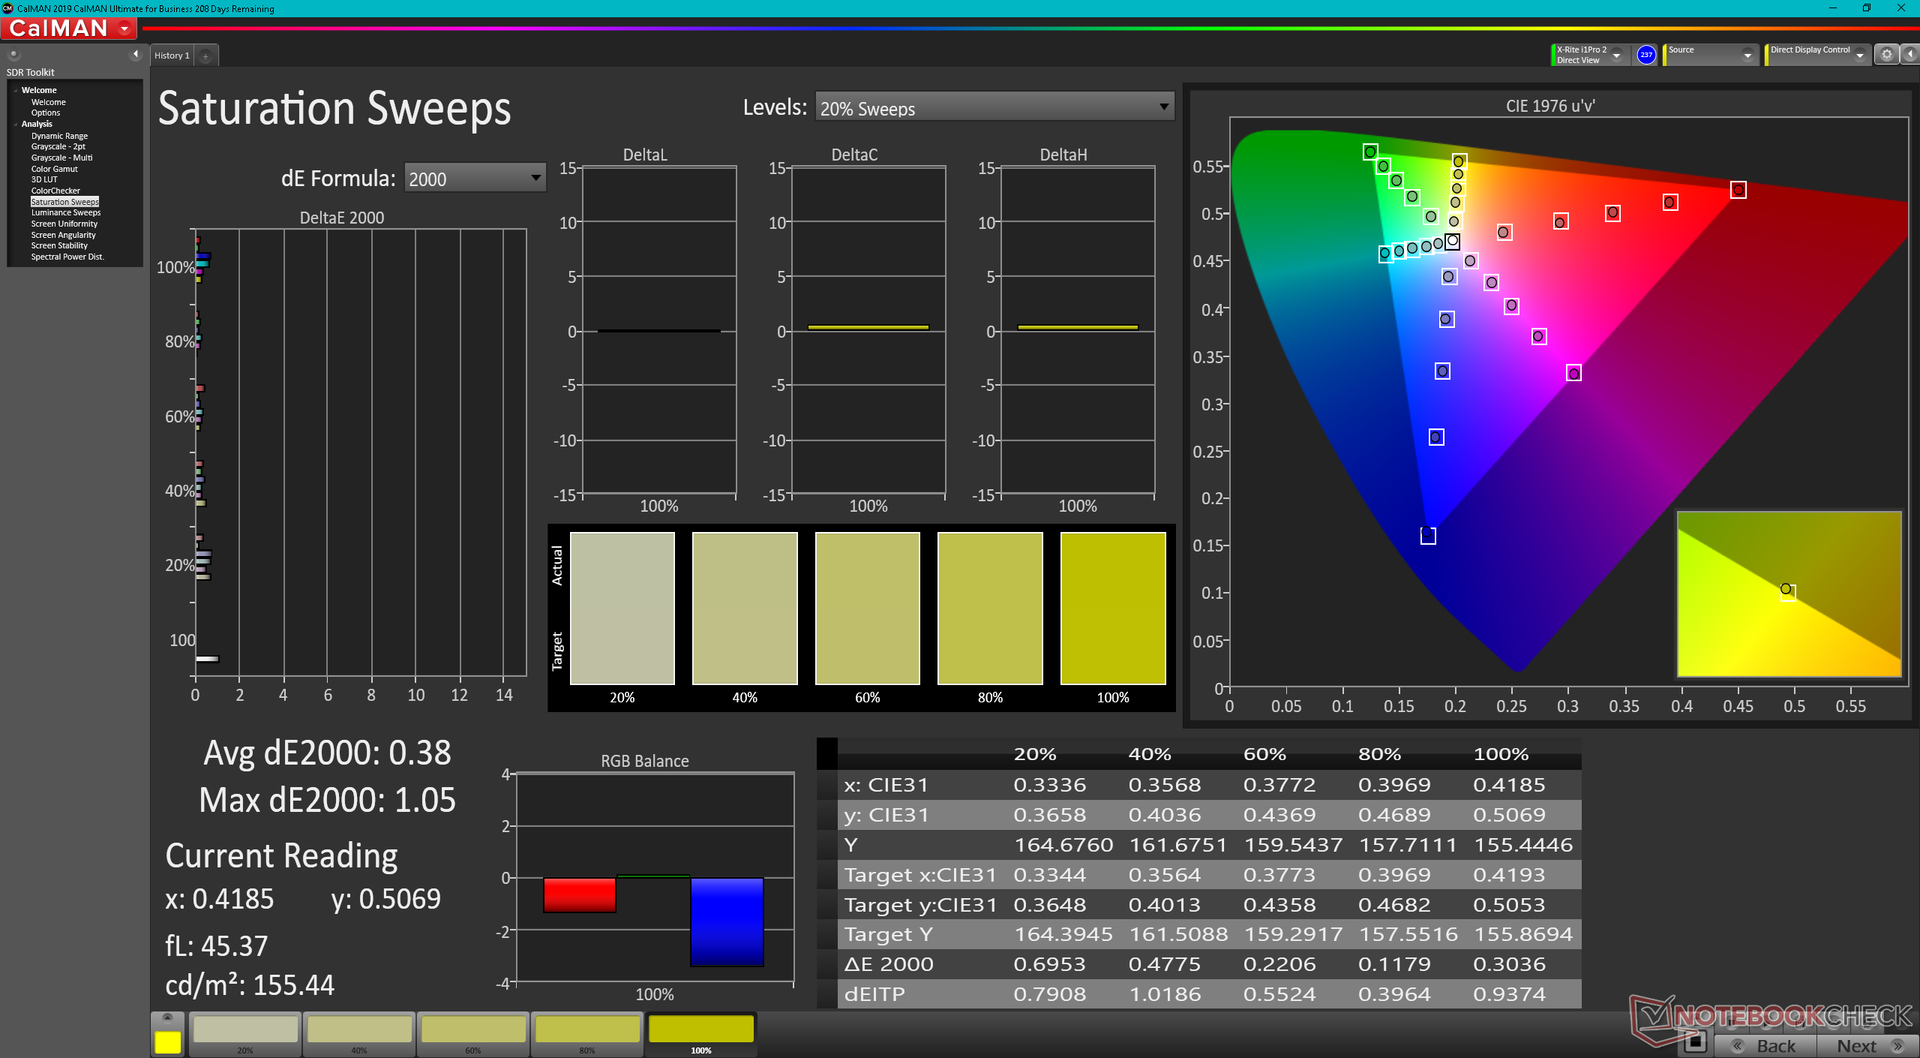
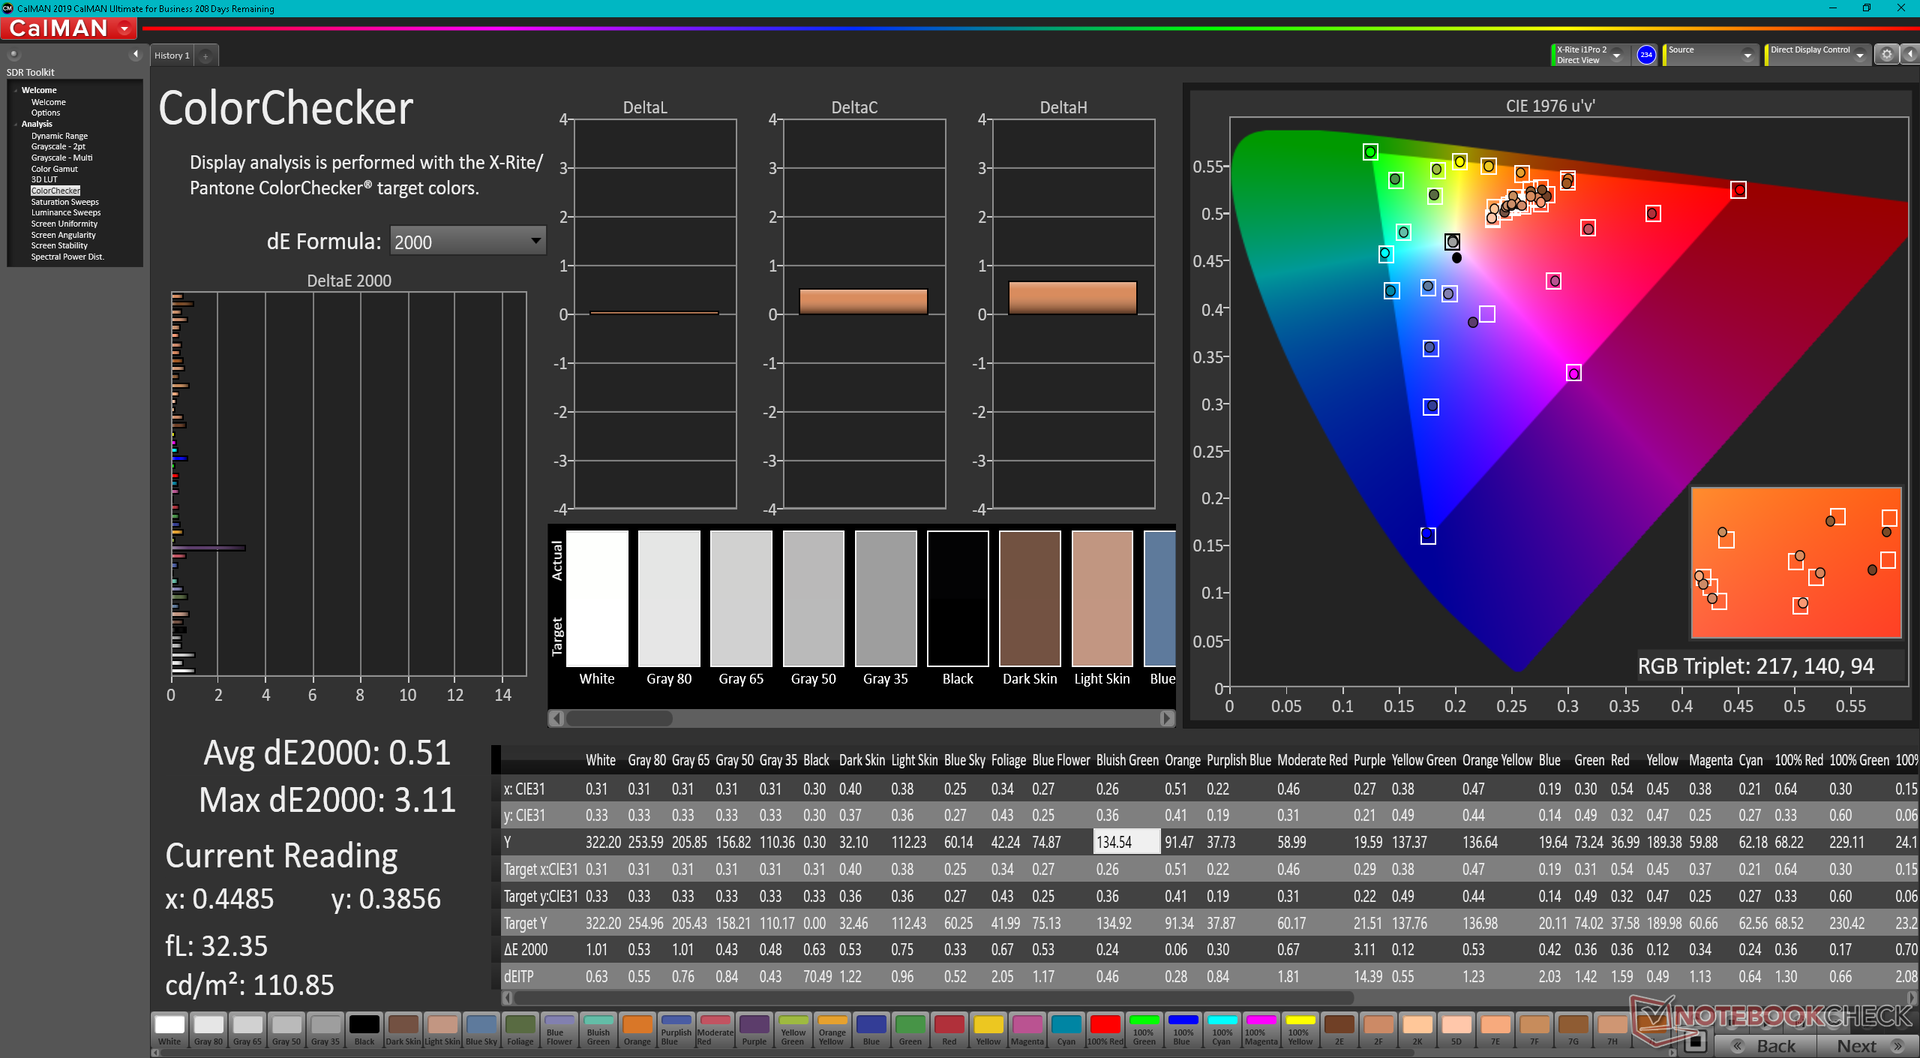
Unser AU Optronics B173HAN IPS-Panel erfüllt fast alle typischen Anforderungen, darunter eine schnelle 360-Hz-Bildwiederholrate, schnelle Schwarz-Weiß- und Graustufen-Reaktionszeiten und eine vollständige sRGB-Abdeckung, um sowohl für Spiele als auch für die meisten Grafikbearbeitungen geeignet zu sein. Andere Notebook-Hersteller mit 17,3-Zoll-1080p-360-Hz-Display-Optionen verwenden wahrscheinlich das gleiche AU-Optronics-Panel wie bei unserem Alienware nutzen. Eine höherwertige 4K-120-Hz-Option ist ebenfalls verfügbar, alle mit G-Sync-Unterstützung.
Es gibt derzeit keine OLED-Optionen, die eine größere DCI-P3-Farbabdeckung und tiefere Schwarzwerte als die übliche IPS-Lösung bieten würden.
Interessanterweise ist unser FHD-Panel nicht so hell wie das 4K-UHD-Panel des ursprünglichen x17 R1. Wir konnten hier eine maximale Helligkeit von 365 Nits messen, verglichen mit 439 Nits beim 4K x17 R1.
| |||||||||||||||||||||||||
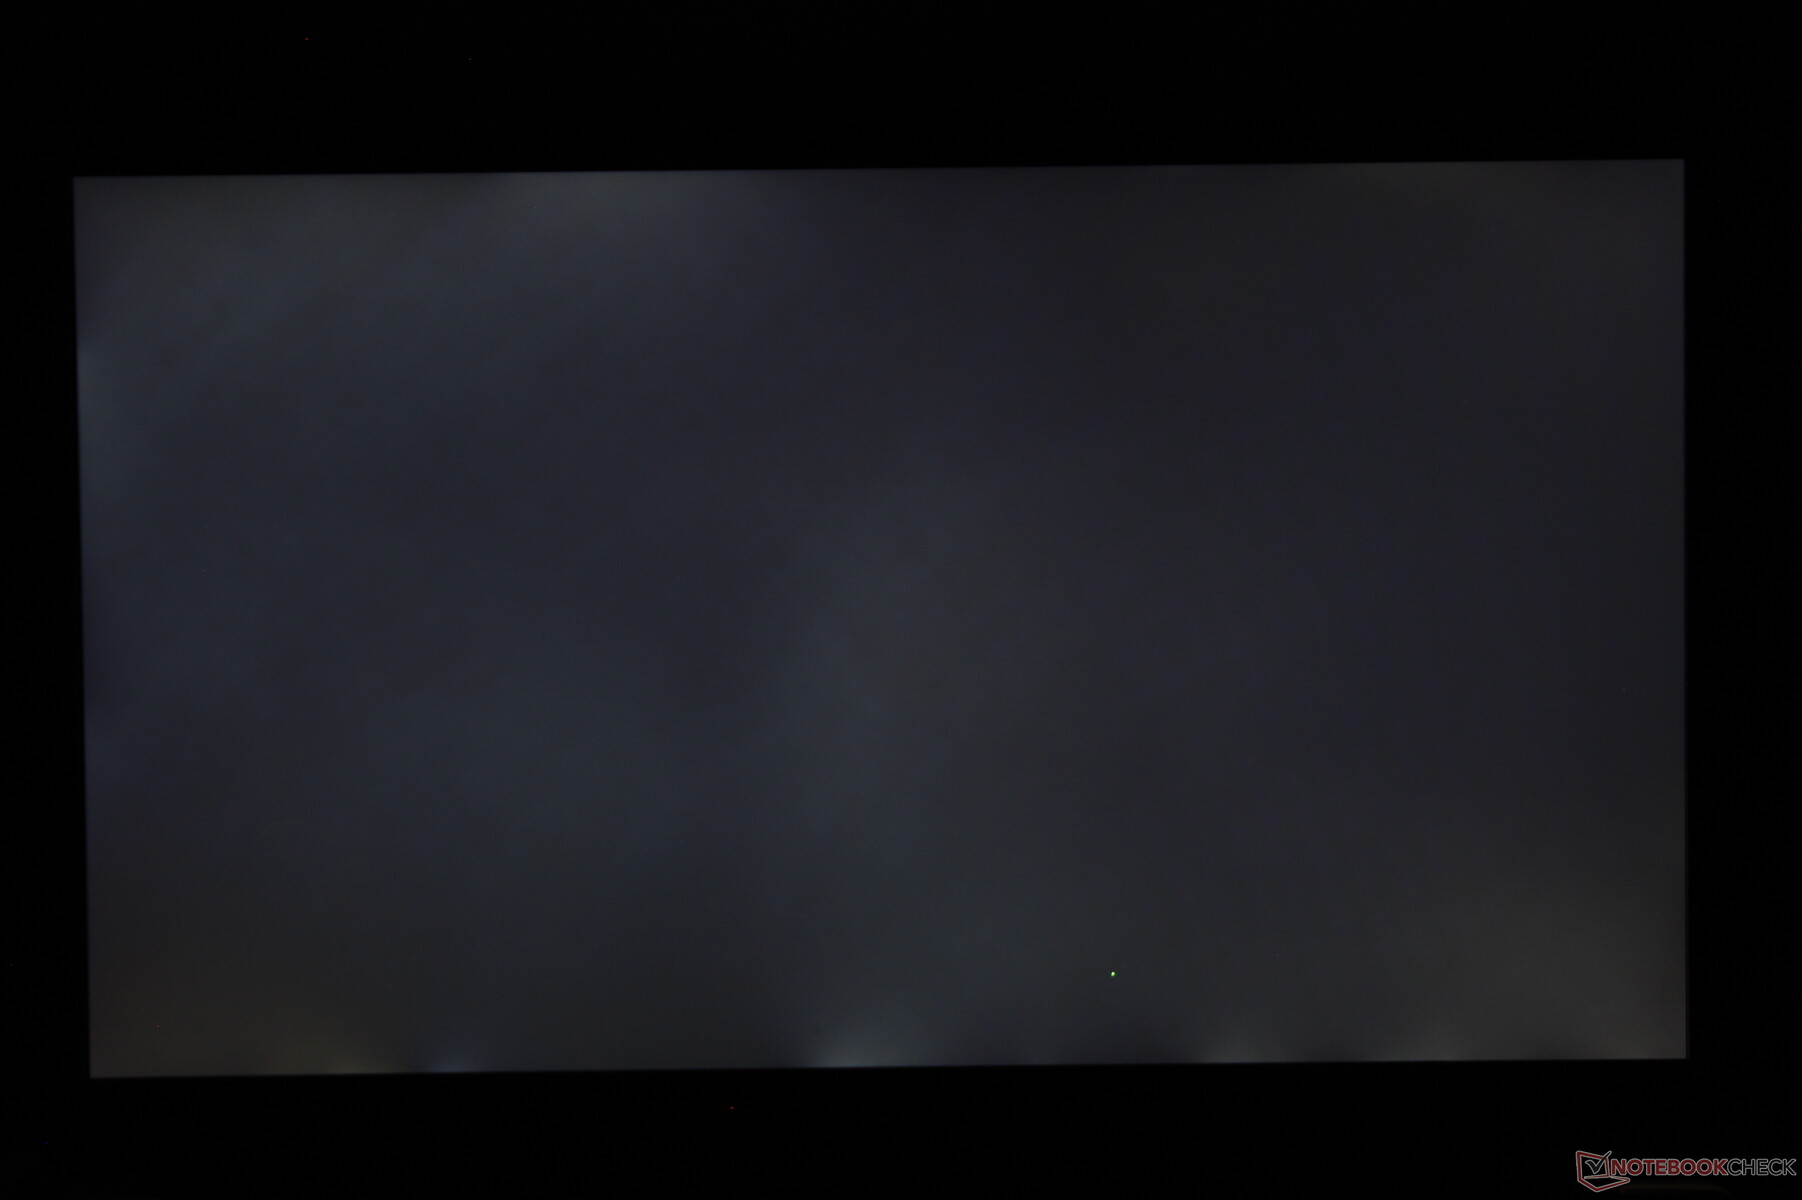
Ausleuchtung: 85 %
Helligkeit Akku: 365.4 cd/m²
Kontrast: 1260:1 (Schwarzwert: 0.29 cd/m²)
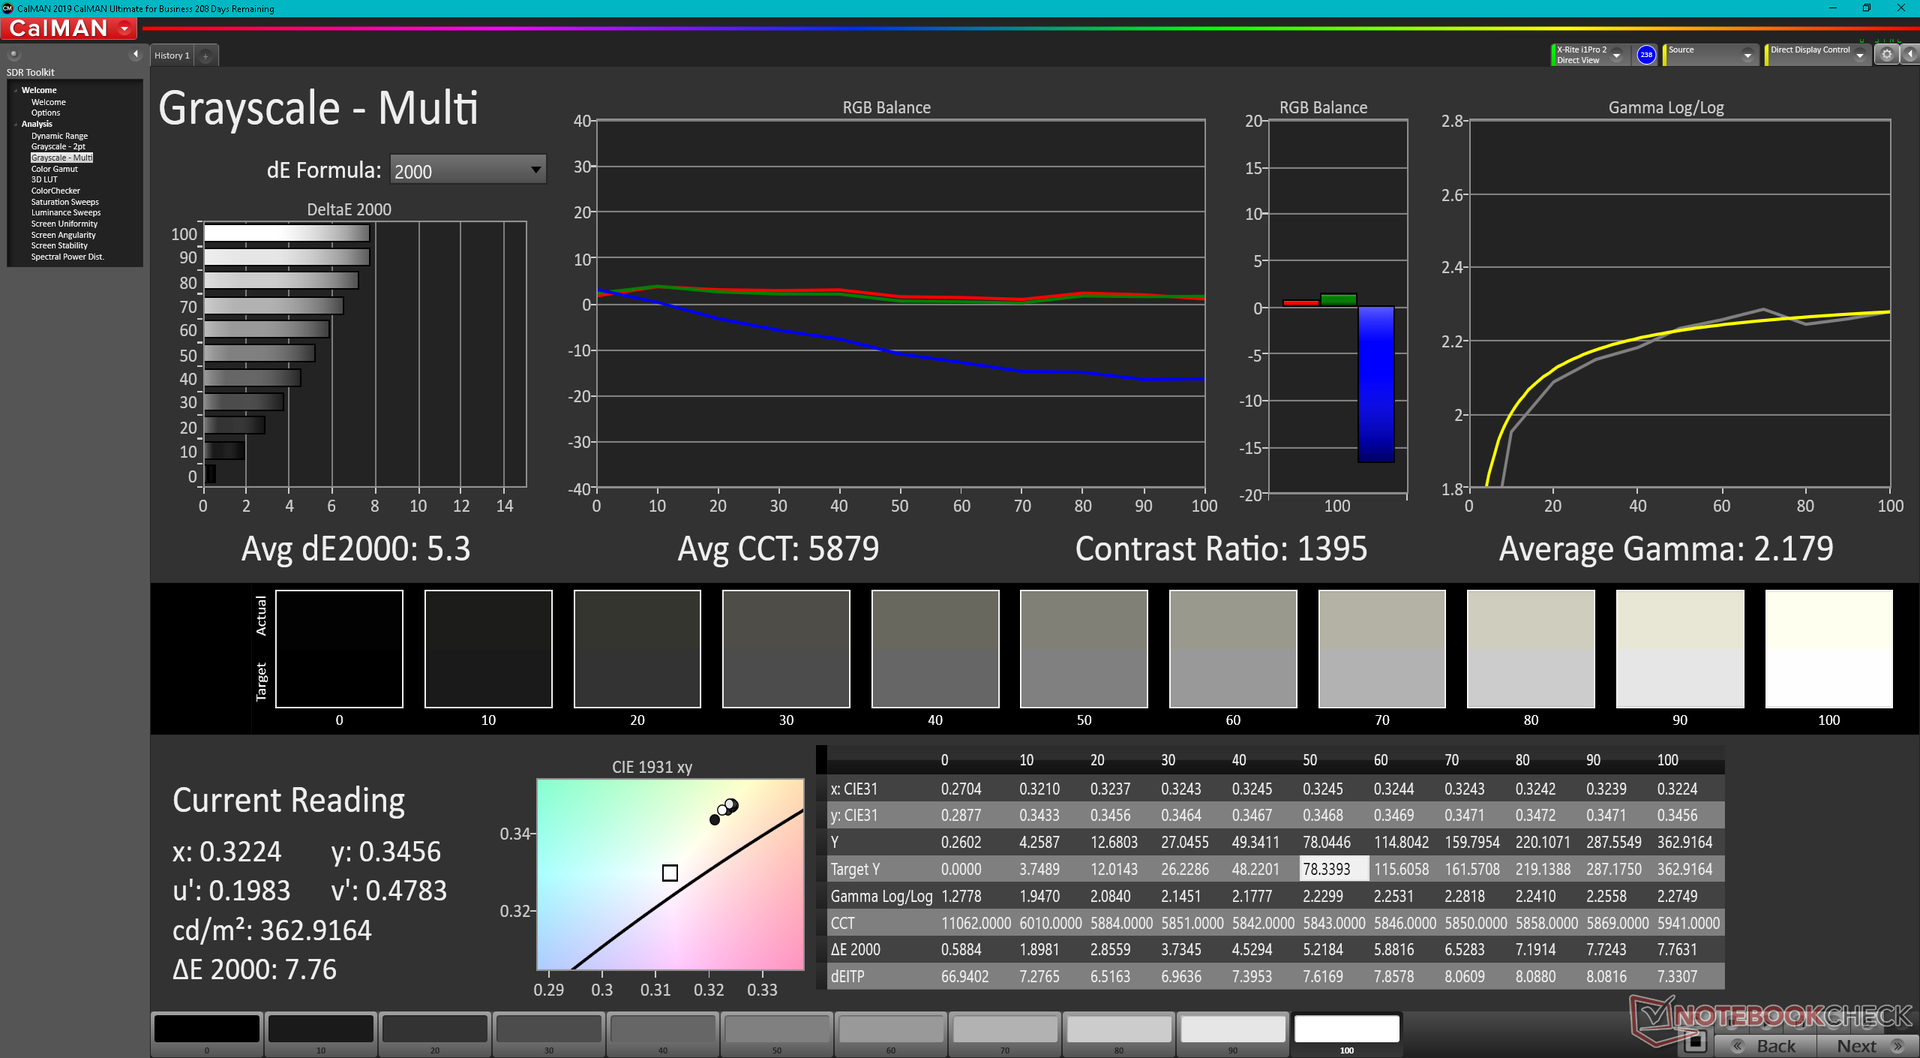
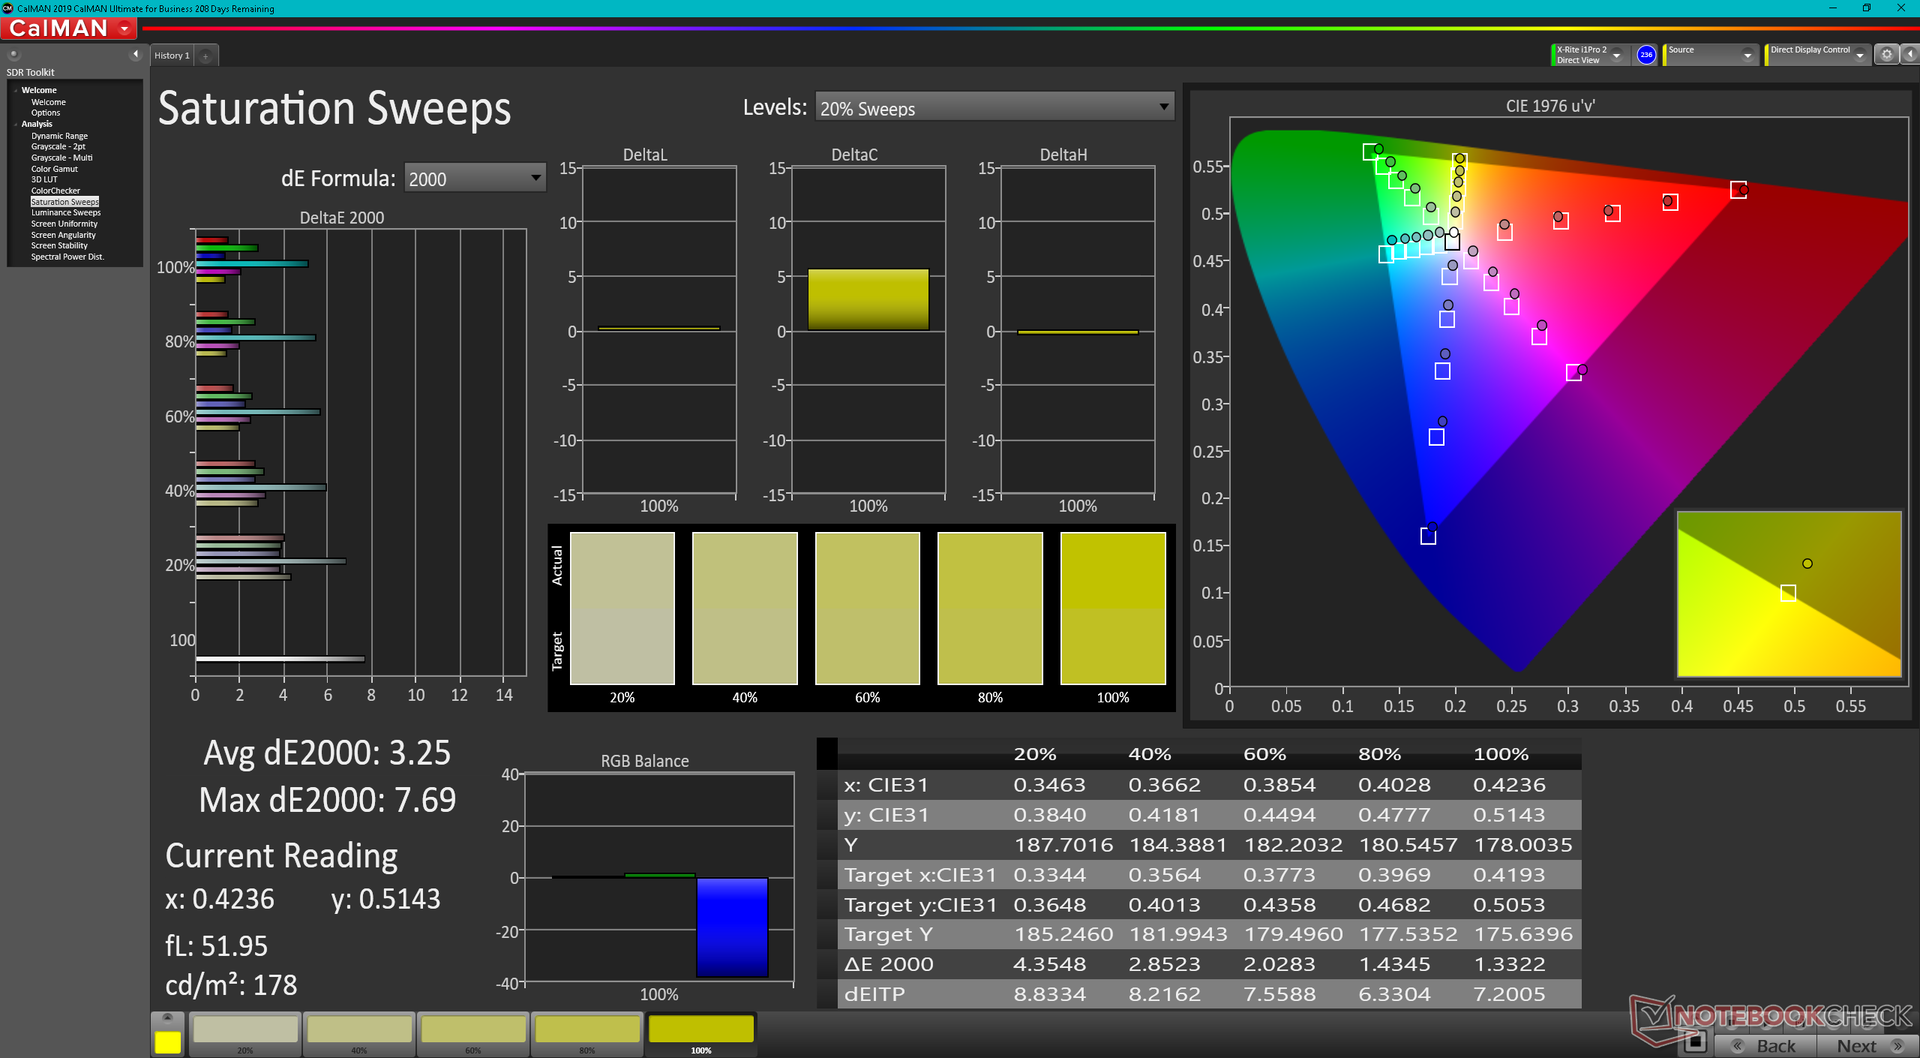
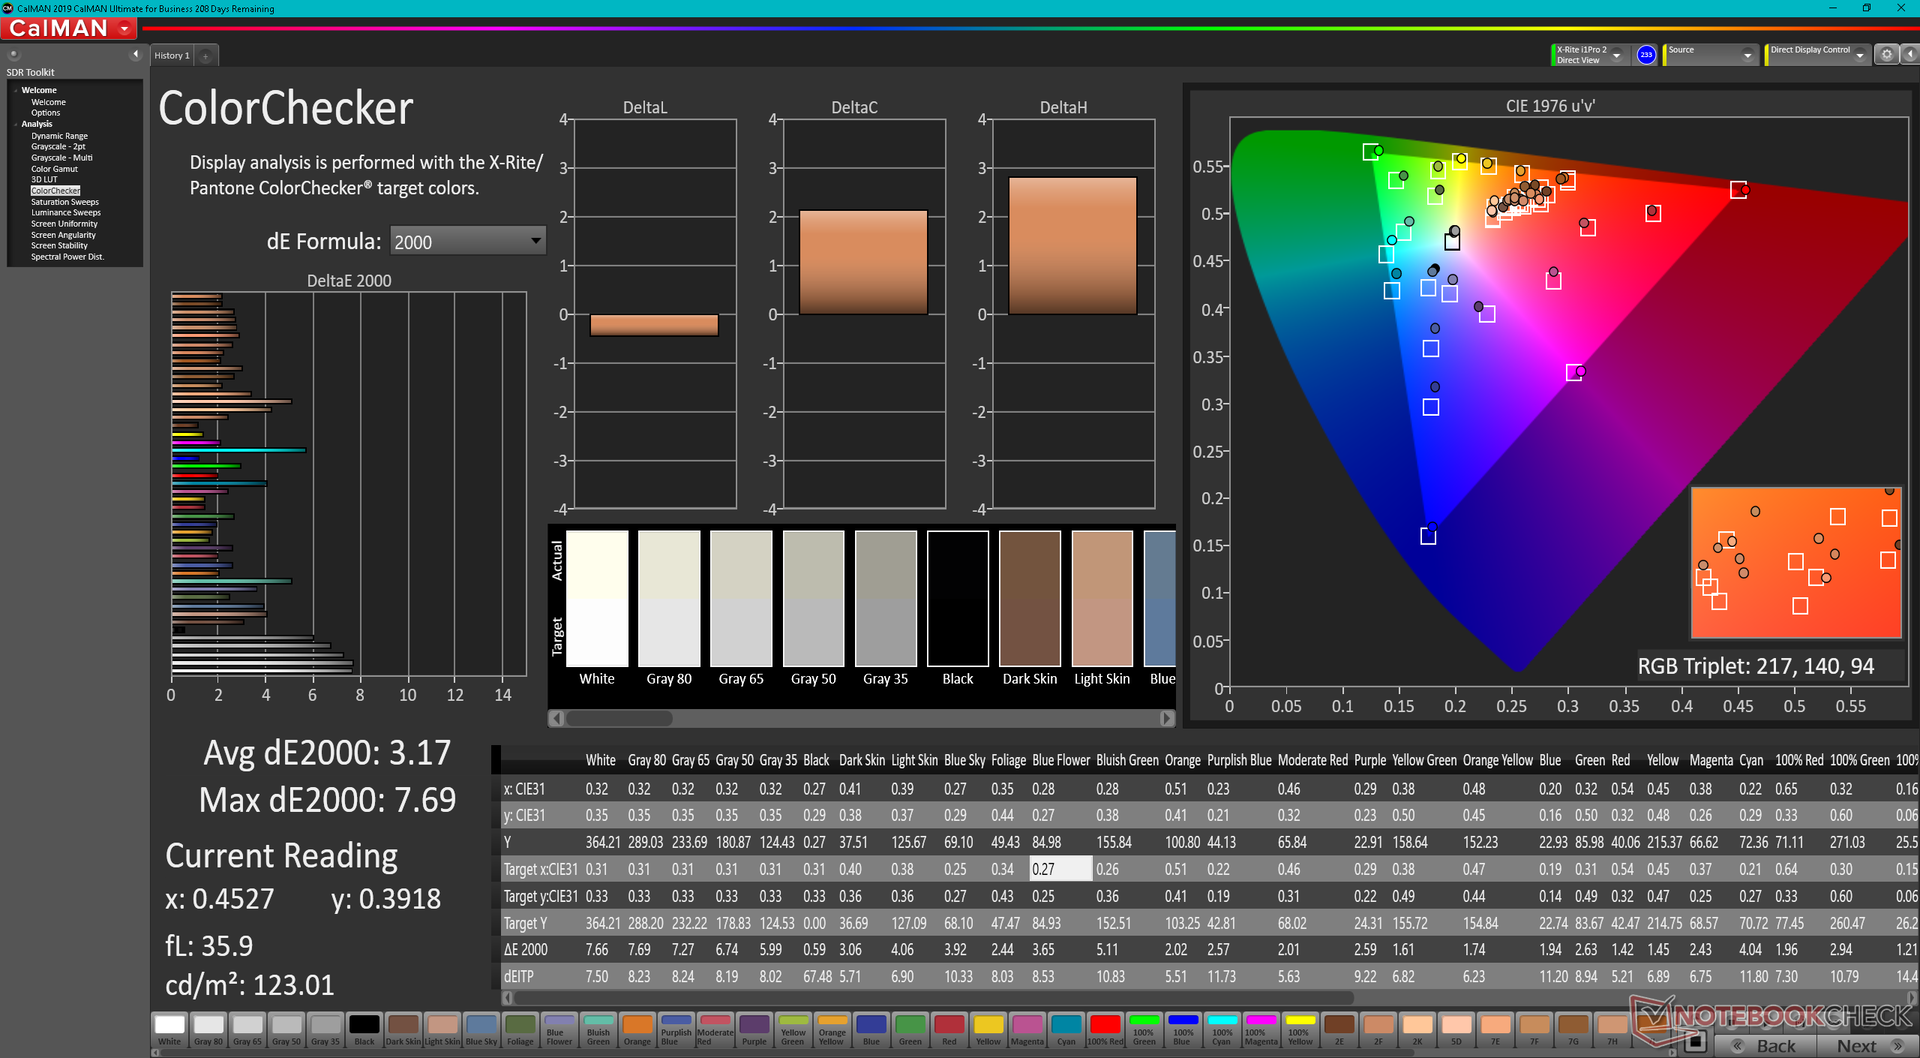
ΔE ColorChecker Calman: 3.17 | ∀{0.5-29.43 Ø4.72}
calibrated: 0.51
ΔE Greyscale Calman: 5.3 | ∀{0.09-98 Ø4.97}
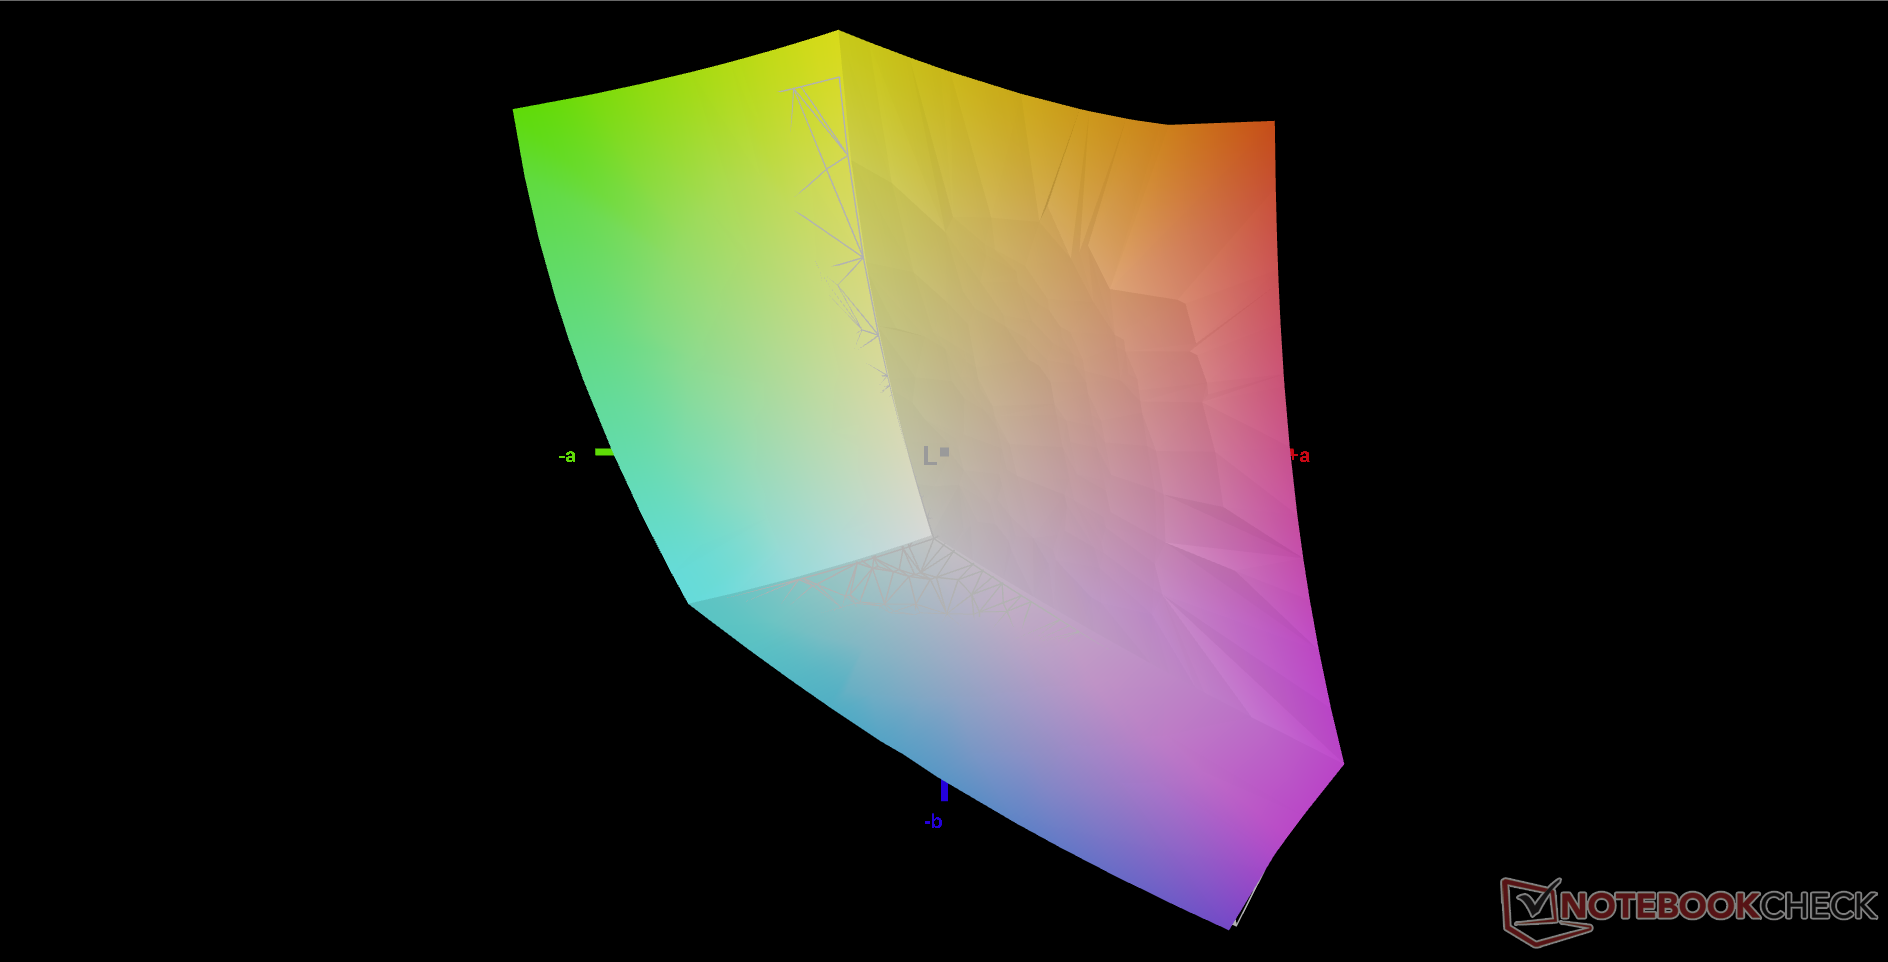
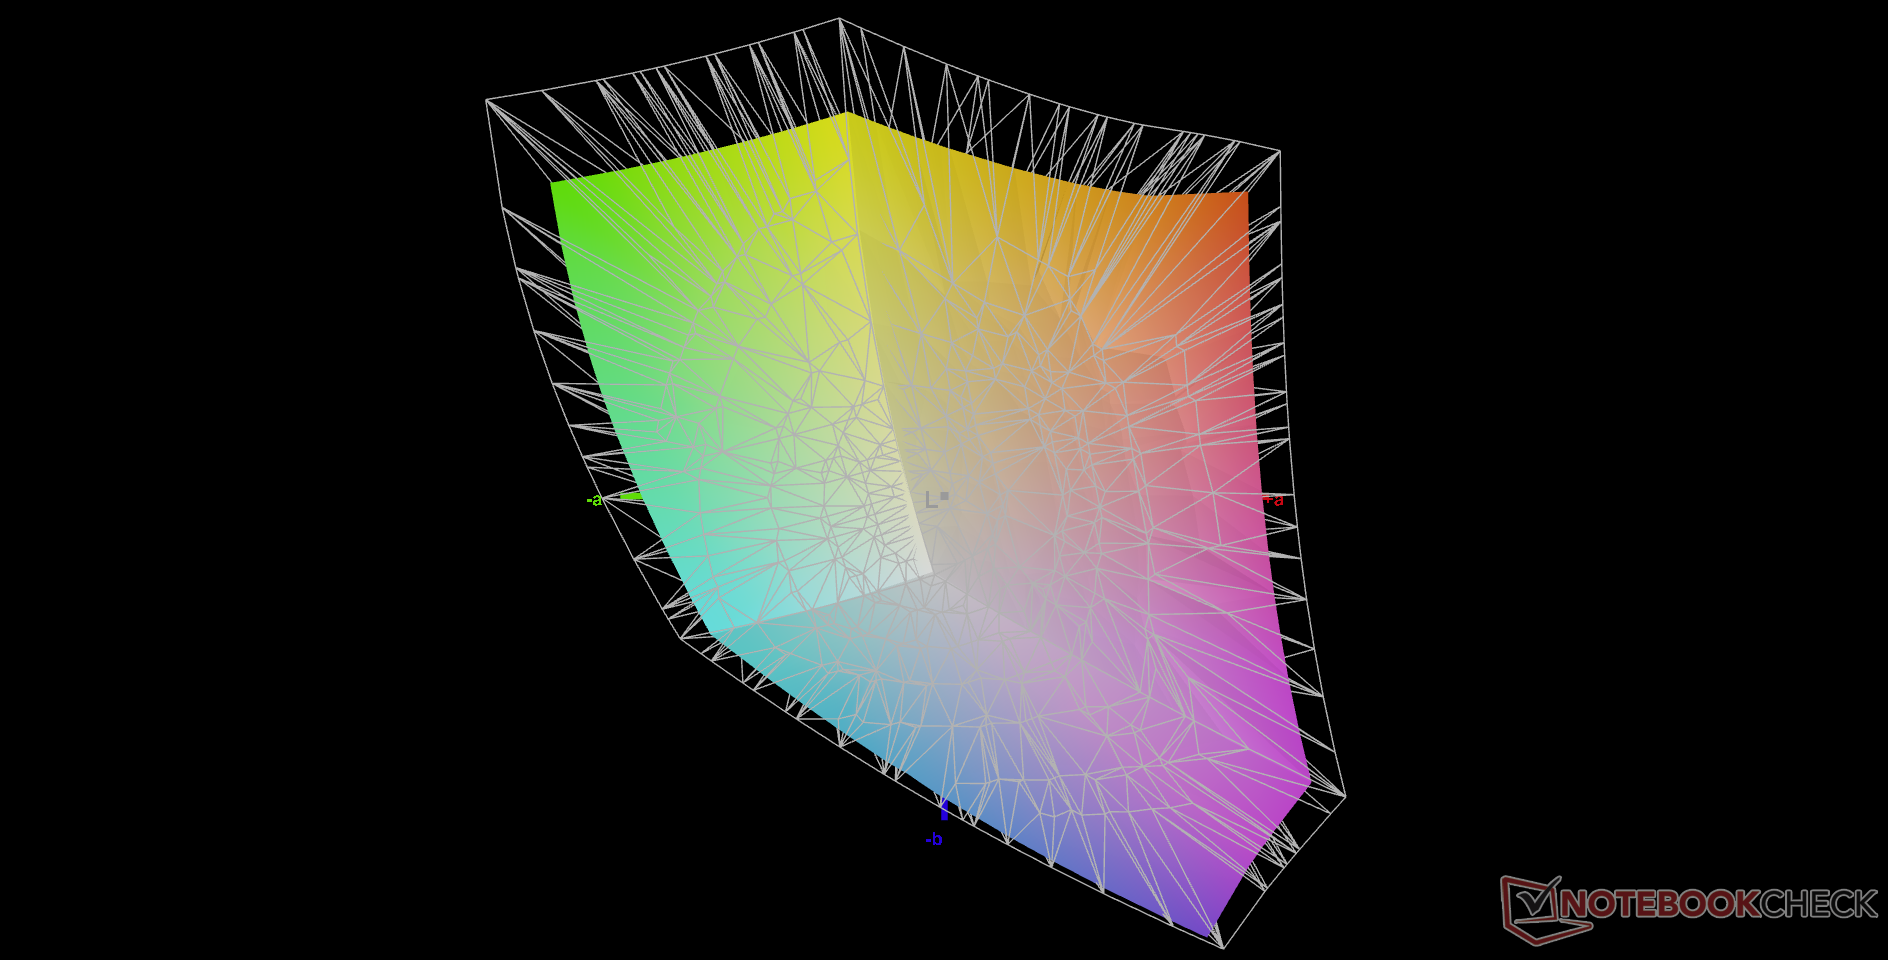
79.6% AdobeRGB 1998 (Argyll 3D)
99.8% sRGB (Argyll 3D)
79.2% Display P3 (Argyll 3D)
Gamma: 2.18
CCT: 5879 K
| Alienware x17 R2 P48E AU Optronics B173HAN, IPS, 1920x1080, 17.3" | Alienware x17 RTX 3080 P48E AU Optronics B173ZAN, IPS, 3840x2160, 17.3" | Asus ROG Zephyrus S17 GX703HSD BOE099D (BOE CQ NE173QHM-NY3), IPS, 2560x1440, 17.3" | MSI Stealth GS77 12UHS-083US BOE NE173QHM-NZ1, IPS, 2560x1440, 17.3" | MSI GT76 Titan DT 10SGS AU Optronics B173ZAN03.3, IPS, 3840x2160, 17.3" | Gigabyte A7 X1 AU Optronics AUO8E8D, IPS, 1920x1080, 17.3" | |
|---|---|---|---|---|---|---|
| Display | 12% | 8% | 10% | 8% | -17% | |
| Display P3 Coverage (%) | 79.2 | 88.3 11% | 94.2 19% | 96.2 21% | 82.5 4% | 61.5 -22% |
| sRGB Coverage (%) | 99.8 | 100 0% | 98.7 -1% | 99.7 0% | 98 -2% | 90.9 -9% |
| AdobeRGB 1998 Coverage (%) | 79.6 | 100 26% | 84.4 6% | 85.8 8% | 96.6 21% | 63.2 -21% |
| Response Times | -15% | 37% | -41% | -57% | -23% | |
| Response Time Grey 50% / Grey 80% * (ms) | 12.4 ? | 14.4 ? -16% | 4.8 61% | 17.6 ? -42% | 23.2 ? -87% | 16 ? -29% |
| Response Time Black / White * (ms) | 9.2 ? | 10.4 ? -13% | 8 13% | 12.8 ? -39% | 11.6 ? -26% | 10.8 ? -17% |
| PWM Frequency (Hz) | ||||||
| Bildschirm | -6% | -29% | -12% | -55% | -39% | |
| Helligkeit Bildmitte (cd/m²) | 365.4 | 438.7 20% | 322 -12% | 334.8 -8% | 419.5 15% | 325 -11% |
| Brightness (cd/m²) | 344 | 435 26% | 288 -16% | 305 -11% | 413 20% | 318 -8% |
| Brightness Distribution (%) | 85 | 91 7% | 72 -15% | 79 -7% | 93 9% | 95 12% |
| Schwarzwert * (cd/m²) | 0.29 | 0.48 -66% | 0.3 -3% | 0.34 -17% | 0.4 -38% | 0.29 -0% |
| Kontrast (:1) | 1260 | 914 -27% | 1073 -15% | 985 -22% | 1049 -17% | 1121 -11% |
| Delta E Colorchecker * | 3.17 | 4.34 -37% | 3.05 4% | 4.1 -29% | 3.4 -7% | 4.33 -37% |
| Colorchecker dE 2000 max. * | 7.69 | 7.3 5% | 5.23 32% | 7.28 5% | 7.4 4% | 8.6 -12% |
| Colorchecker dE 2000 calibrated * | 0.51 | 0.72 -41% | 1.92 -276% | 3.28 -543% | 1.95 -282% | |
| Delta E Graustufen * | 5.3 | 2.4 55% | 3.11 41% | 5.6 -6% | 2 62% | 5.5 -4% |
| Gamma | 2.18 101% | 2.09 105% | 2.13 103% | 2.16 102% | 2.14 103% | 2.142 103% |
| CCT | 5879 111% | 6413 101% | 6553 99% | 6314 103% | 6858 95% | 7893 82% |
| Farbraum (Prozent von AdobeRGB 1998) (%) | 84 | 84.6 | ||||
| Color Space (Percent of sRGB) (%) | 99 | 97.9 | ||||
| Durchschnitt gesamt (Programm / Settings) | -3% /
-4% | 5% /
-12% | -14% /
-11% | -35% /
-42% | -26% /
-32% |
* ... kleinere Werte sind besser
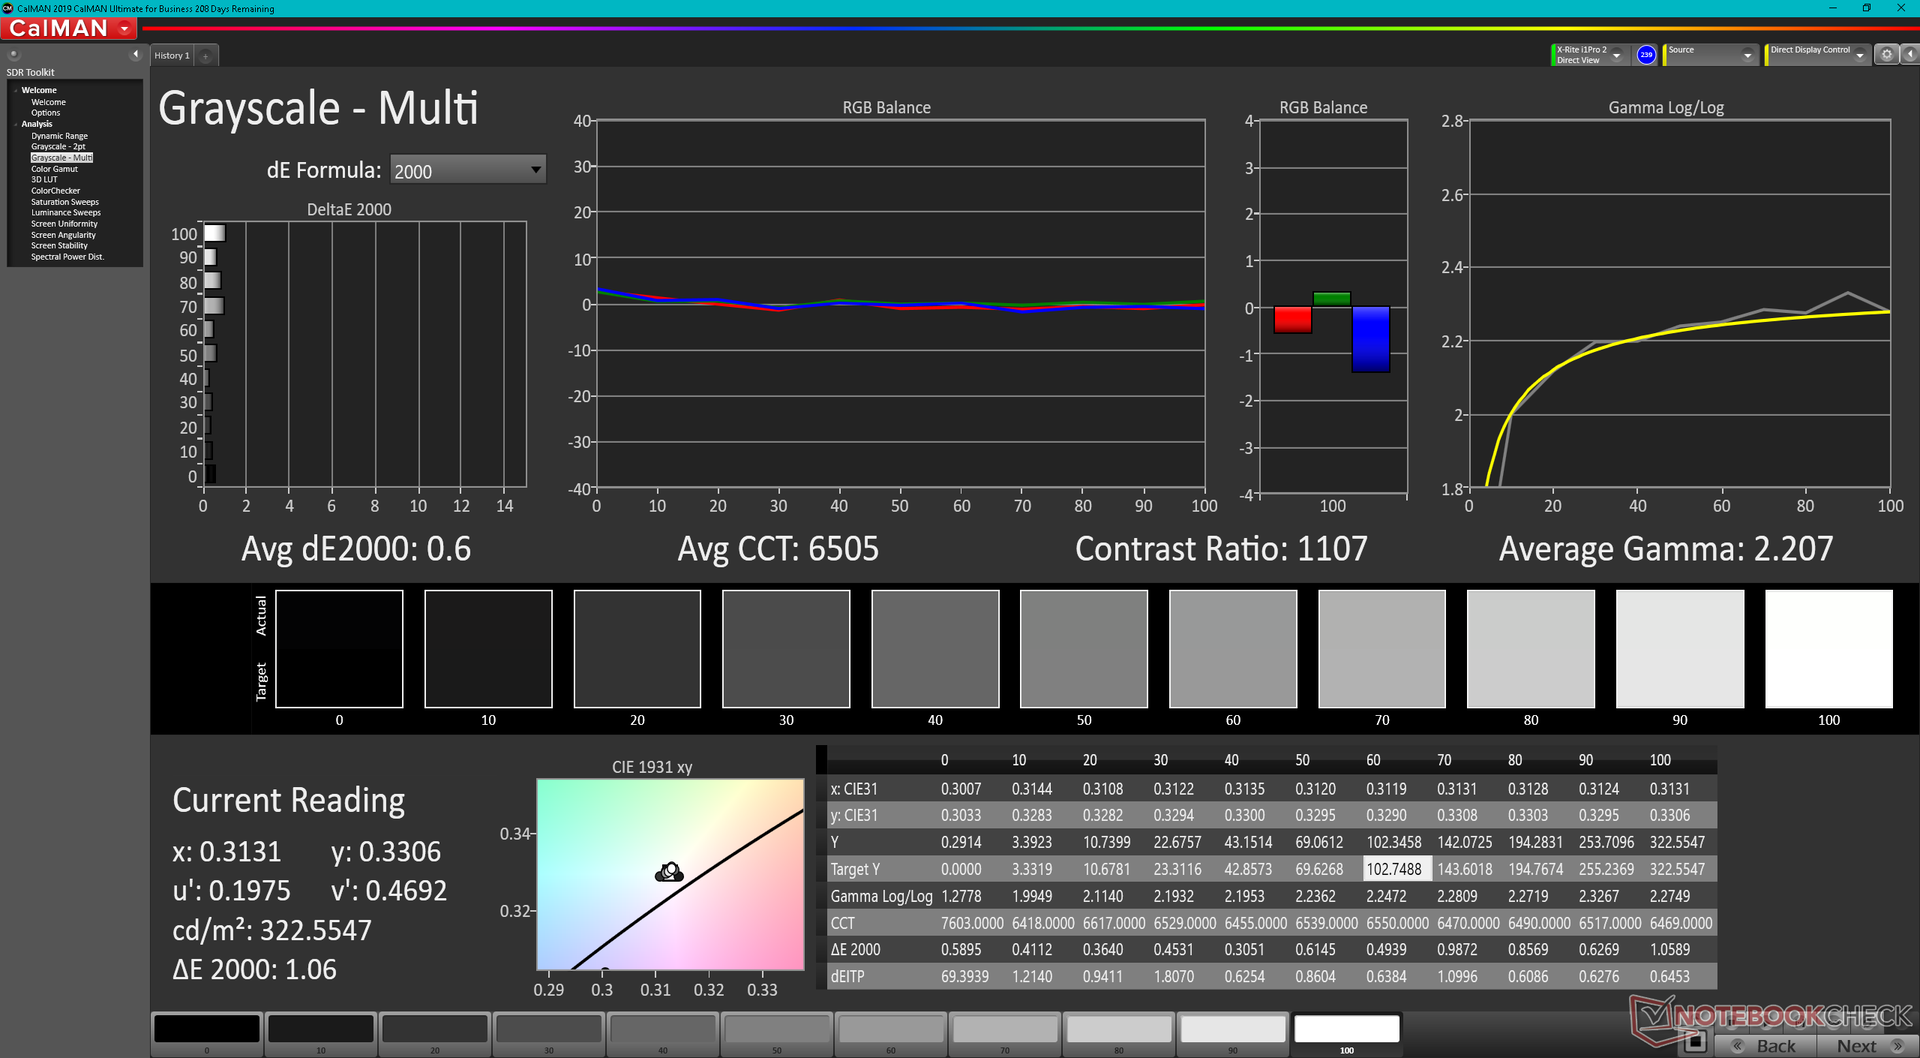
Das Display ist nicht sehr gut kalibriert ab Werk, zumal die Farbtemperatur übermäßig warm ist. Nach einer korrekten Kalibrierung gegen sRGB können wir jedoch durchschnittliche Graustufen- und Farb-DeltaE-Werte von nur 0,6 bzw. 0,51 erreichen.
Reaktionszeiten (Response Times) des Displays
| ↔ Reaktionszeiten Schwarz zu Weiß | ||
|---|---|---|
| 9.2 ms ... steigend ↗ und fallend ↘ kombiniert | ↗ 5.2 ms steigend | 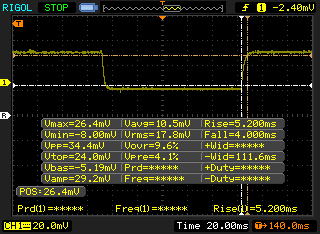 |
| ↘ 4 ms fallend | ||
| Die gemessenen Reaktionszeiten sind kurz wodurch sich der Bildschirm auch für Spiele gut eignen sollte. Im Vergleich rangierten die bei uns getesteten Geräte von 0.1 (Minimum) zu 240 (Maximum) ms. » 26 % aller Screens waren schneller als der getestete. Daher sind die gemessenen Reaktionszeiten besser als der Durchschnitt aller vermessenen Geräte (19.8 ms). | ||
| ↔ Reaktionszeiten 50% Grau zu 80% Grau | ||
| 12.4 ms ... steigend ↗ und fallend ↘ kombiniert | ↗ 6.4 ms steigend | 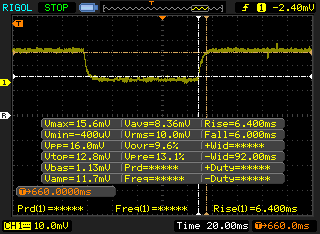 |
| ↘ 6 ms fallend | ||
| Die gemessenen Reaktionszeiten sind gut, für anspruchsvolle Spieler könnten der Bildschirm jedoch zu langsam sein. Im Vergleich rangierten die bei uns getesteten Geräte von 0.165 (Minimum) zu 636 (Maximum) ms. » 26 % aller Screens waren schneller als der getestete. Daher sind die gemessenen Reaktionszeiten besser als der Durchschnitt aller vermessenen Geräte (31 ms). | ||
Bildschirm-Flackern / PWM (Pulse-Width Modulation)
| Flackern / PWM nicht festgestellt |  | ||
Im Vergleich: 52 % aller getesteten Geräte nutzten kein PWM um die Helligkeit zu reduzieren. Wenn PWM eingesetzt wurde, dann bei einer Frequenz von durchschnittlich 7775 (Minimum 5, Maximum 343500) Hz. | |||

Performance
Testbedingungen
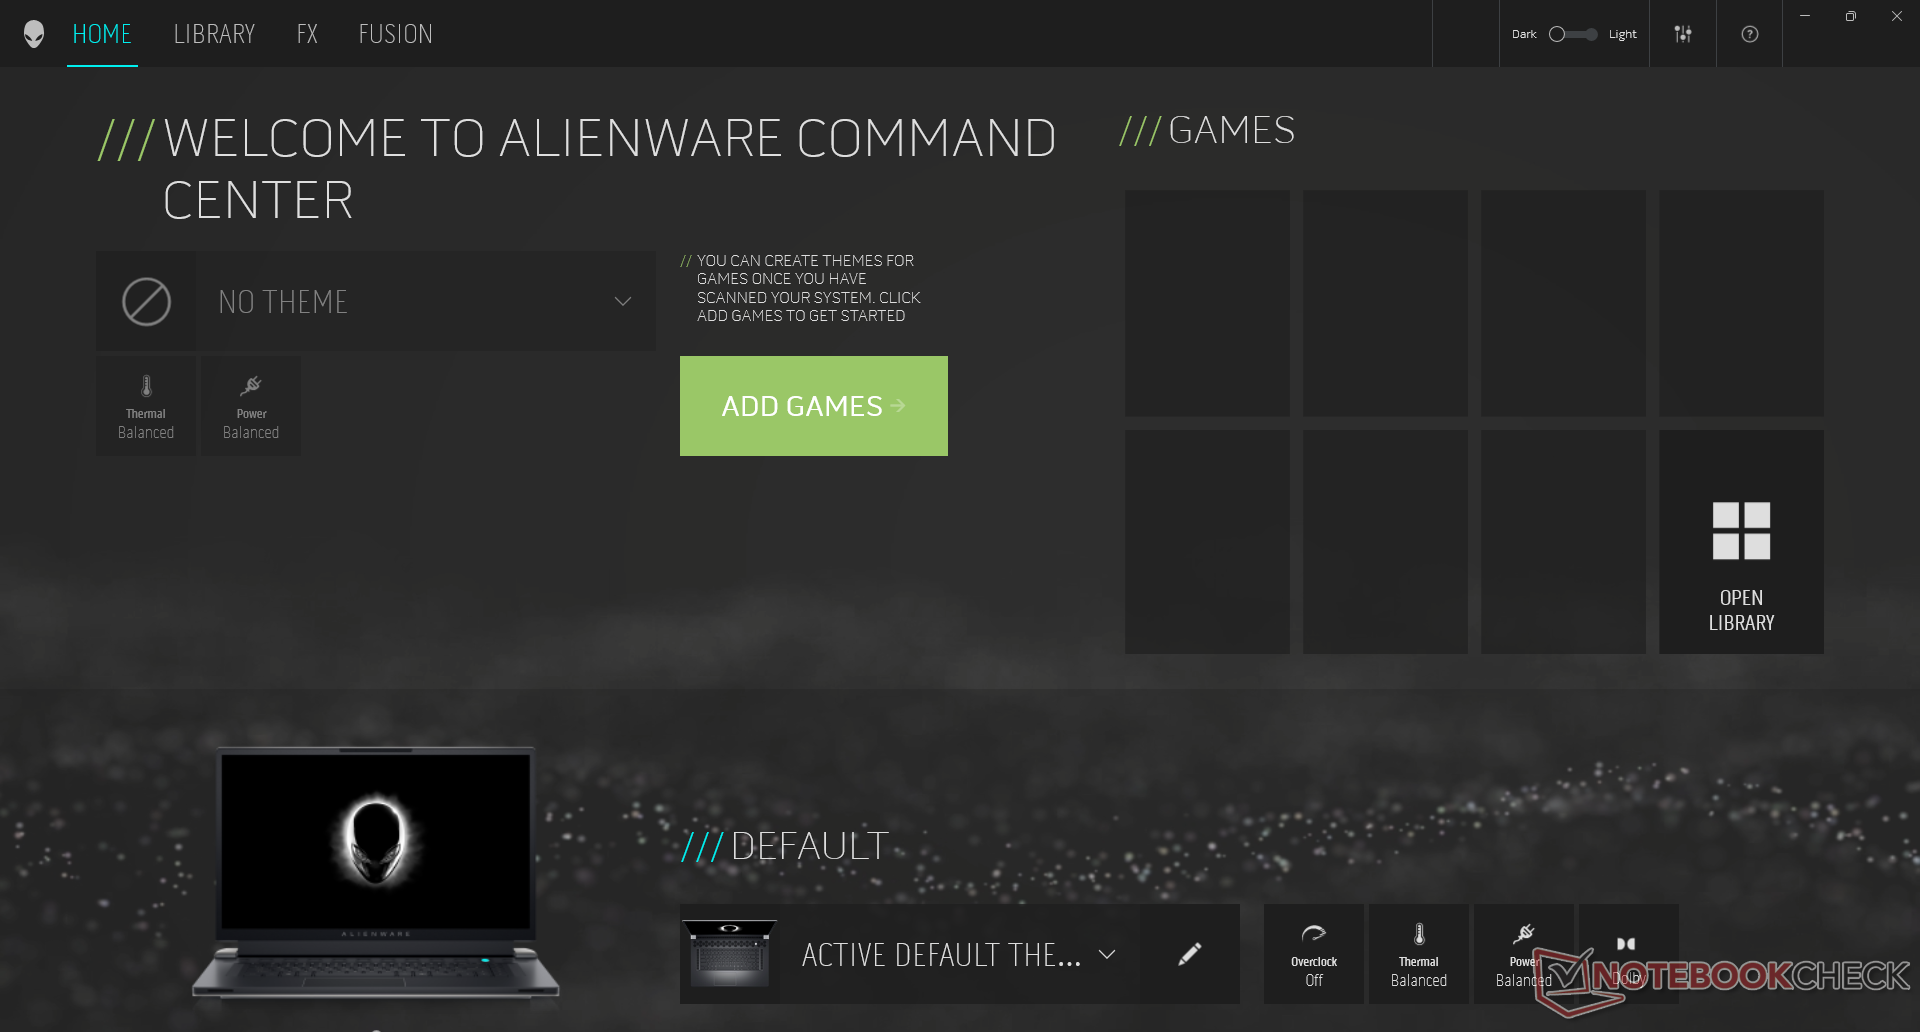
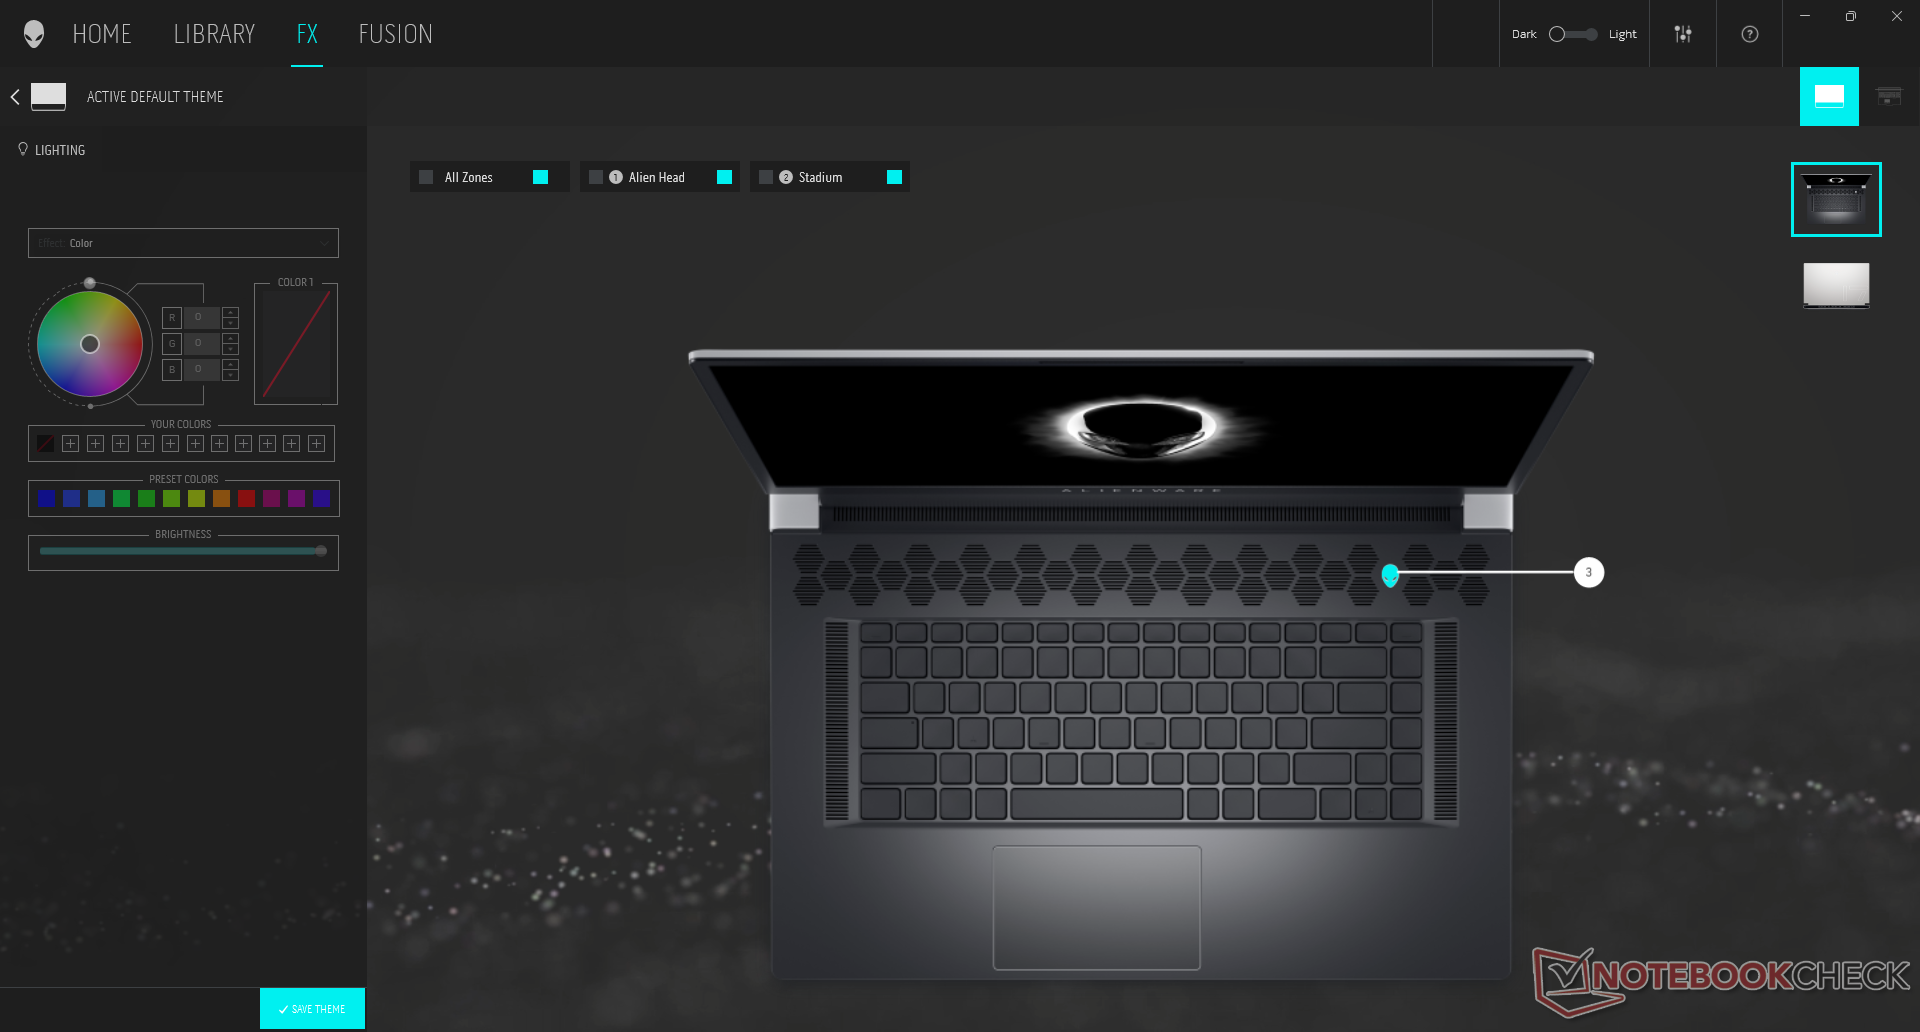
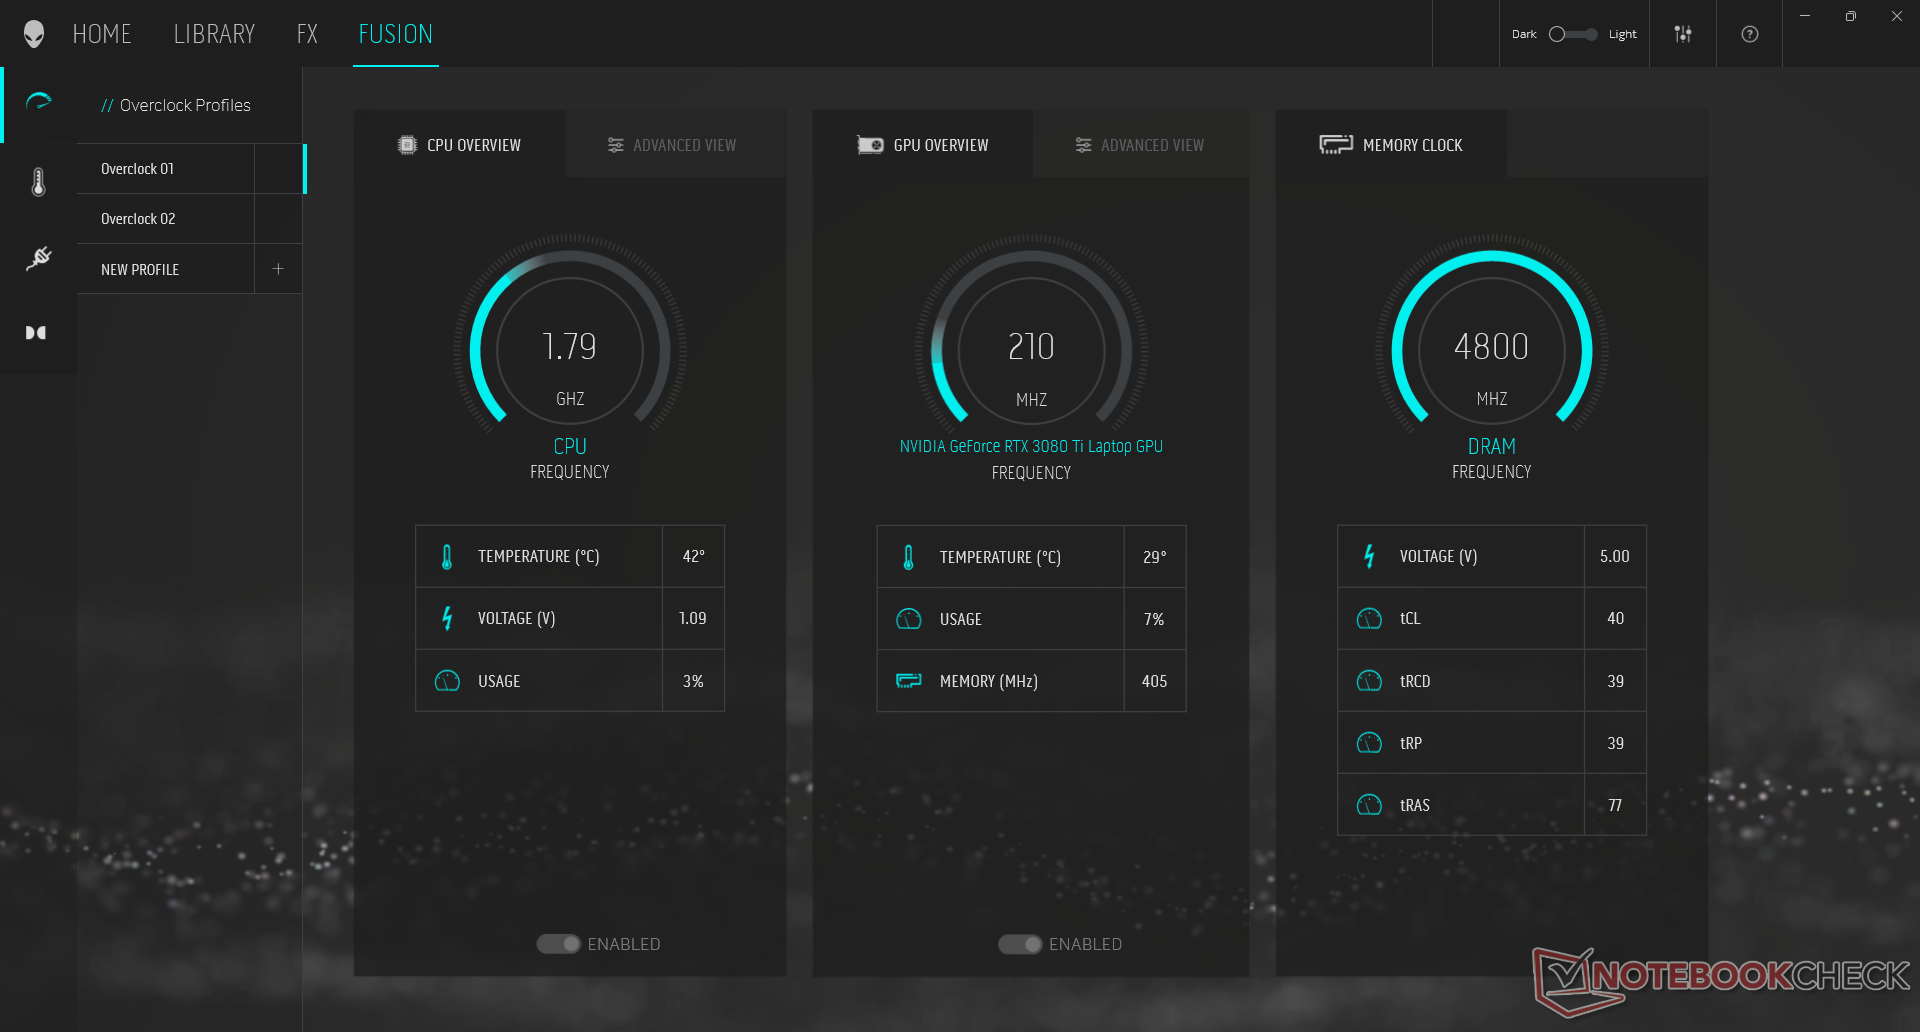
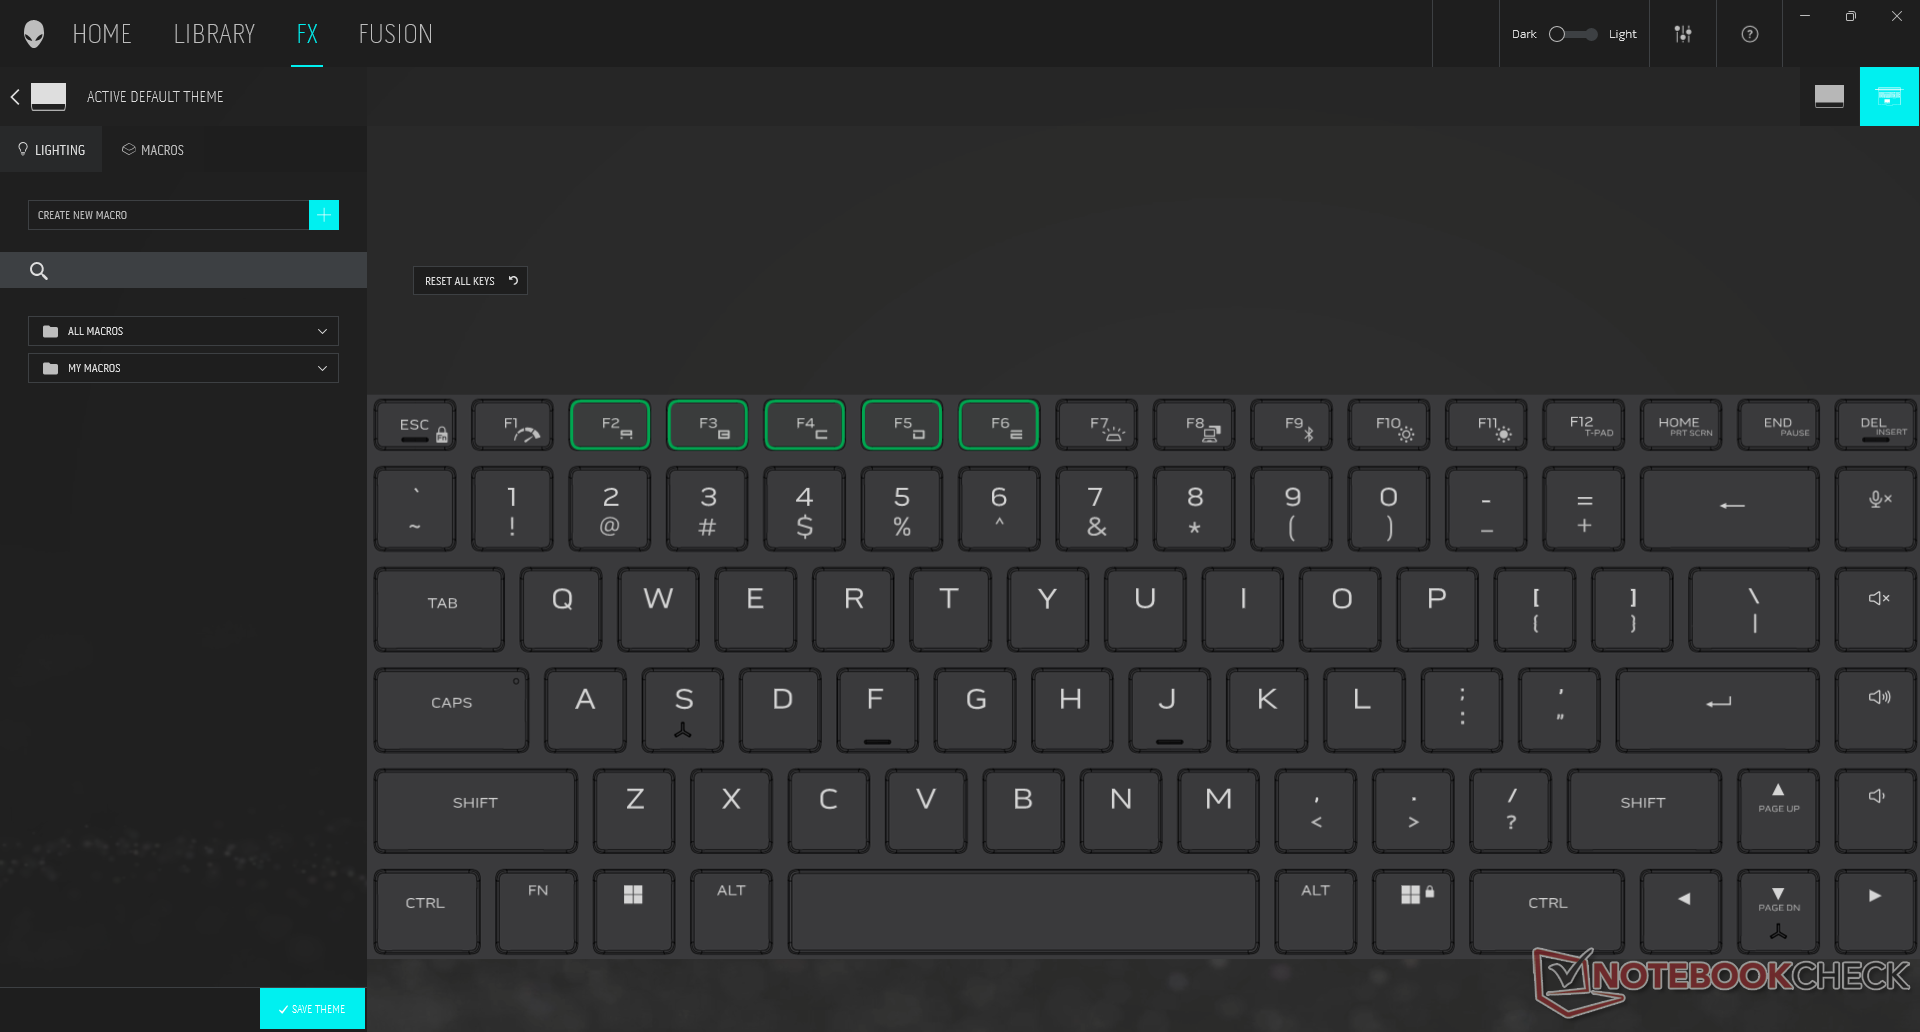
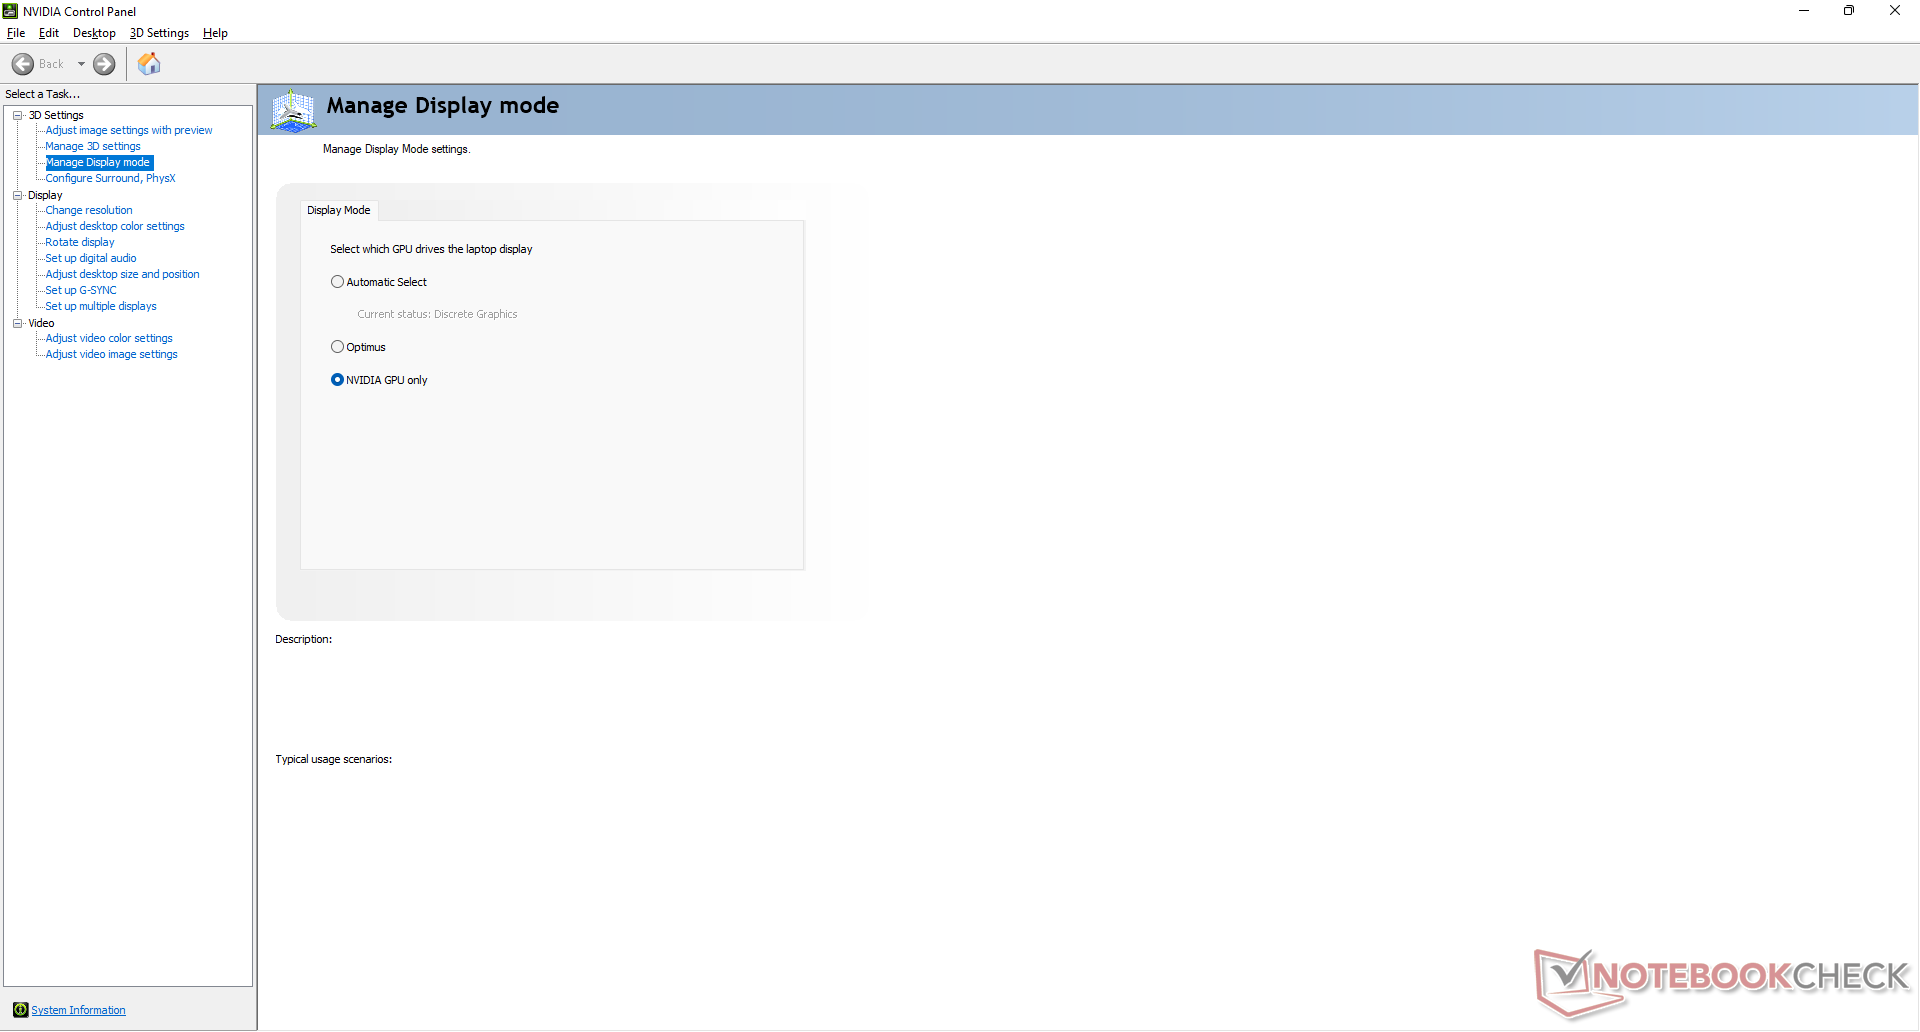
Wir haben unser Gerät auf den Modus "High Performance" eingestellt und die diskrete GPU aktiviert, bevor wir die folgenden Leistungs-Benchmarks durchgeführt haben, um die bestmöglichen Ergebnisse zu erzielen. Der Modus "High Performance" kann einfach über Fn+F1 umgeschaltet werden, während der MUX-Schalter über das Nvidia Control Panel zugänglich ist. Wir empfehlen dringend, sich mit der Alienware Command Center Software vertraut zu machen, da sich hier die Energieprofile, RGB-Einstellungen, Echtzeitüberwachung und andere Funktionen befinden.
Prozessor
Die reine CPU-Leistung ist etwa zehn bis 15 Prozent schneller als die eines durchschnittlichen Notebooks in unserer Datenbank mit dem gleichen Core i9-12900HK. Das ist eine ordentliche Steigerung gegenüber dem Core i7-12800H oder der letzten Generation Core i7-11800H um jeweils bis zu 30 Prozent bei Multi-Thread-Workloads. AMDs neueste Zen 3+ CPU, der Ryzen 9 6900HX, ist in den CineBench Benchmarks durchweg langsamer, übertrifft aber den Core i9-12900HK in bestimmten AIDA64 Benchmarks.
Cinebench R15 Multi Loop
Cinebench R23: Multi Core | Single Core
Cinebench R15: CPU Multi 64Bit | CPU Single 64Bit
Blender: v2.79 BMW27 CPU
7-Zip 18.03: 7z b 4 | 7z b 4 -mmt1
Geekbench 5.5: Multi-Core | Single-Core
HWBOT x265 Benchmark v2.2: 4k Preset
LibreOffice : 20 Documents To PDF
R Benchmark 2.5: Overall mean
| Cinebench R20 / CPU (Multi Core) | |
| AMD Radeon RX 6800 XT | |
| Corsair One i300 | |
| Alienware x17 R2 P48E | |
| Durchschnittliche Intel Core i9-12900HK (1828 - 7366, n=14) | |
| Razer Blade 14 Ryzen 9 6900HX | |
| Alienware x17 RTX 3080 P48E | |
| Razer Blade 17 (i7-12800H, RTX 3070 Ti) | |
| Gigabyte A7 X1 | |
| Razer Blade Pro 17 2021 (QHD Touch) | |
| Lenovo Legion Y740-17IRHg-81UJ001VGE | |
| Cinebench R20 / CPU (Single Core) | |
| Corsair One i300 | |
| Alienware x17 R2 P48E | |
| Razer Blade 17 (i7-12800H, RTX 3070 Ti) | |
| Durchschnittliche Intel Core i9-12900HK (316 - 739, n=14) | |
| AMD Radeon RX 6800 XT | |
| Razer Blade 14 Ryzen 9 6900HX | |
| Alienware x17 RTX 3080 P48E | |
| Gigabyte A7 X1 | |
| Razer Blade Pro 17 2021 (QHD Touch) | |
| Lenovo Legion Y740-17IRHg-81UJ001VGE | |
| Cinebench R23 / Multi Core | |
| Corsair One i300 | |
| AMD Radeon RX 6800 XT | |
| Alienware x17 R2 P48E | |
| Durchschnittliche Intel Core i9-12900HK (4796 - 19282, n=14) | |
| Razer Blade 17 (i7-12800H, RTX 3070 Ti) | |
| Razer Blade 14 Ryzen 9 6900HX | |
| Alienware x17 RTX 3080 P48E | |
| Gigabyte A7 X1 | |
| Razer Blade Pro 17 2021 (QHD Touch) | |
| Cinebench R23 / Single Core | |
| Corsair One i300 | |
| Alienware x17 R2 P48E | |
| Razer Blade 17 (i7-12800H, RTX 3070 Ti) | |
| Durchschnittliche Intel Core i9-12900HK (819 - 1940, n=15) | |
| AMD Radeon RX 6800 XT | |
| Razer Blade 14 Ryzen 9 6900HX | |
| Alienware x17 RTX 3080 P48E | |
| Gigabyte A7 X1 | |
| Razer Blade Pro 17 2021 (QHD Touch) | |
| Cinebench R15 / CPU Multi 64Bit | |
| AMD Radeon RX 6800 XT | |
| Corsair One i300 | |
| Alienware x17 R2 P48E | |
| Razer Blade 17 (i7-12800H, RTX 3070 Ti) | |
| Durchschnittliche Intel Core i9-12900HK (965 - 2944, n=14) | |
| Razer Blade 14 Ryzen 9 6900HX | |
| Alienware x17 RTX 3080 P48E | |
| Gigabyte A7 X1 | |
| Razer Blade Pro 17 2021 (QHD Touch) | |
| Lenovo Legion Y740-17IRHg-81UJ001VGE | |
| Cinebench R15 / CPU Single 64Bit | |
| Corsair One i300 | |
| Alienware x17 R2 P48E | |
| Razer Blade 17 (i7-12800H, RTX 3070 Ti) | |
| AMD Radeon RX 6800 XT | |
| Razer Blade 14 Ryzen 9 6900HX | |
| Gigabyte A7 X1 | |
| Durchschnittliche Intel Core i9-12900HK (119 - 279, n=14) | |
| Alienware x17 RTX 3080 P48E | |
| Razer Blade Pro 17 2021 (QHD Touch) | |
| Lenovo Legion Y740-17IRHg-81UJ001VGE | |
| Blender / v2.79 BMW27 CPU | |
| Lenovo Legion Y740-17IRHg-81UJ001VGE | |
| Razer Blade Pro 17 2021 (QHD Touch) | |
| Gigabyte A7 X1 | |
| Durchschnittliche Intel Core i9-12900HK (172.5 - 483, n=13) | |
| Razer Blade 14 Ryzen 9 6900HX | |
| Razer Blade 17 (i7-12800H, RTX 3070 Ti) | |
| Alienware x17 RTX 3080 P48E | |
| Alienware x17 R2 P48E | |
| Corsair One i300 | |
| AMD Radeon RX 6800 XT | |
| 7-Zip 18.03 / 7z b 4 -mmt1 | |
| AMD Radeon RX 6800 XT | |
| Corsair One i300 | |
| Razer Blade 14 Ryzen 9 6900HX | |
| Alienware x17 R2 P48E | |
| Razer Blade 17 (i7-12800H, RTX 3070 Ti) | |
| Gigabyte A7 X1 | |
| Durchschnittliche Intel Core i9-12900HK (2898 - 6186, n=14) | |
| Alienware x17 RTX 3080 P48E | |
| Razer Blade Pro 17 2021 (QHD Touch) | |
| Lenovo Legion Y740-17IRHg-81UJ001VGE | |
| Geekbench 5.5 / Multi-Core | |
| Corsair One i300 | |
| AMD Radeon RX 6800 XT | |
| Alienware x17 R2 P48E | |
| Razer Blade 17 (i7-12800H, RTX 3070 Ti) | |
| Durchschnittliche Intel Core i9-12900HK (5869 - 14294, n=13) | |
| Razer Blade 14 Ryzen 9 6900HX | |
| Razer Blade Pro 17 2021 (QHD Touch) | |
| Gigabyte A7 X1 | |
| Lenovo Legion Y740-17IRHg-81UJ001VGE | |
| Geekbench 5.5 / Single-Core | |
| Corsair One i300 | |
| Alienware x17 R2 P48E | |
| Razer Blade 17 (i7-12800H, RTX 3070 Ti) | |
| Durchschnittliche Intel Core i9-12900HK (843 - 1918, n=13) | |
| AMD Radeon RX 6800 XT | |
| Razer Blade 14 Ryzen 9 6900HX | |
| Gigabyte A7 X1 | |
| Razer Blade Pro 17 2021 (QHD Touch) | |
| Lenovo Legion Y740-17IRHg-81UJ001VGE | |
| HWBOT x265 Benchmark v2.2 / 4k Preset | |
| AMD Radeon RX 6800 XT | |
| Corsair One i300 | |
| Alienware x17 R2 P48E | |
| Razer Blade 14 Ryzen 9 6900HX | |
| Alienware x17 RTX 3080 P48E | |
| Durchschnittliche Intel Core i9-12900HK (5.33 - 21.6, n=14) | |
| Razer Blade 17 (i7-12800H, RTX 3070 Ti) | |
| Gigabyte A7 X1 | |
| Razer Blade Pro 17 2021 (QHD Touch) | |
| Lenovo Legion Y740-17IRHg-81UJ001VGE | |
| LibreOffice / 20 Documents To PDF | |
| Gigabyte A7 X1 | |
| AMD Radeon RX 6800 XT | |
| Razer Blade 14 Ryzen 9 6900HX | |
| Durchschnittliche Intel Core i9-12900HK (34.8 - 89.1, n=14) | |
| Alienware x17 RTX 3080 P48E | |
| Razer Blade Pro 17 2021 (QHD Touch) | |
| Razer Blade 17 (i7-12800H, RTX 3070 Ti) | |
| Alienware x17 R2 P48E | |
| Corsair One i300 | |
| R Benchmark 2.5 / Overall mean | |
| Lenovo Legion Y740-17IRHg-81UJ001VGE | |
| Razer Blade Pro 17 2021 (QHD Touch) | |
| Alienware x17 RTX 3080 P48E | |
| Durchschnittliche Intel Core i9-12900HK (0.4155 - 0.994, n=14) | |
| Gigabyte A7 X1 | |
| Razer Blade 14 Ryzen 9 6900HX | |
| AMD Radeon RX 6800 XT | |
| Razer Blade 17 (i7-12800H, RTX 3070 Ti) | |
| Alienware x17 R2 P48E | |
| Corsair One i300 | |
* ... kleinere Werte sind besser
AIDA64: FP32 Ray-Trace | FPU Julia | CPU SHA3 | CPU Queen | FPU SinJulia | FPU Mandel | CPU AES | CPU ZLib | FP64 Ray-Trace | CPU PhotoWorxx
| Performance Rating | |
| Razer Blade 14 Ryzen 9 6900HX | |
| Gigabyte A7 X1 | |
| Alienware x17 R2 P48E | |
| MSI Stealth GS77 12UHS-083US | |
| Durchschnittliche Intel Core i9-12900HK | |
| AIDA64 / FP32 Ray-Trace | |
| Razer Blade 14 Ryzen 9 6900HX | |
| Gigabyte A7 X1 | |
| Alienware x17 R2 P48E | |
| Durchschnittliche Intel Core i9-12900HK (2677 - 13948, n=15) | |
| MSI Stealth GS77 12UHS-083US | |
| AIDA64 / FPU Julia | |
| Razer Blade 14 Ryzen 9 6900HX | |
| Gigabyte A7 X1 | |
| Durchschnittliche Intel Core i9-12900HK (12762 - 70764, n=15) | |
| Alienware x17 R2 P48E | |
| MSI Stealth GS77 12UHS-083US | |
| AIDA64 / CPU SHA3 | |
| Alienware x17 R2 P48E | |
| Razer Blade 14 Ryzen 9 6900HX | |
| Gigabyte A7 X1 | |
| MSI Stealth GS77 12UHS-083US | |
| Durchschnittliche Intel Core i9-12900HK (841 - 3504, n=15) | |
| AIDA64 / CPU Queen | |
| Alienware x17 R2 P48E | |
| Razer Blade 14 Ryzen 9 6900HX | |
| Gigabyte A7 X1 | |
| MSI Stealth GS77 12UHS-083US | |
| Durchschnittliche Intel Core i9-12900HK (60202 - 107161, n=15) | |
| AIDA64 / FPU SinJulia | |
| Razer Blade 14 Ryzen 9 6900HX | |
| Gigabyte A7 X1 | |
| Alienware x17 R2 P48E | |
| MSI Stealth GS77 12UHS-083US | |
| Durchschnittliche Intel Core i9-12900HK (3225 - 10402, n=15) | |
| AIDA64 / FPU Mandel | |
| Razer Blade 14 Ryzen 9 6900HX | |
| Gigabyte A7 X1 | |
| Alienware x17 R2 P48E | |
| Durchschnittliche Intel Core i9-12900HK (7417 - 34233, n=15) | |
| MSI Stealth GS77 12UHS-083US | |
| AIDA64 / CPU AES | |
| Razer Blade 14 Ryzen 9 6900HX | |
| Gigabyte A7 X1 | |
| Alienware x17 R2 P48E | |
| MSI Stealth GS77 12UHS-083US | |
| Durchschnittliche Intel Core i9-12900HK (32382 - 112498, n=15) | |
| AIDA64 / CPU ZLib | |
| Alienware x17 R2 P48E | |
| MSI Stealth GS77 12UHS-083US | |
| Durchschnittliche Intel Core i9-12900HK (314 - 1209, n=15) | |
| Razer Blade 14 Ryzen 9 6900HX | |
| Gigabyte A7 X1 | |
| AIDA64 / FP64 Ray-Trace | |
| Razer Blade 14 Ryzen 9 6900HX | |
| Gigabyte A7 X1 | |
| Alienware x17 R2 P48E | |
| Durchschnittliche Intel Core i9-12900HK (1501 - 7616, n=15) | |
| MSI Stealth GS77 12UHS-083US | |
| AIDA64 / CPU PhotoWorxx | |
| MSI Stealth GS77 12UHS-083US | |
| Durchschnittliche Intel Core i9-12900HK (24446 - 42462, n=15) | |
| Alienware x17 R2 P48E | |
| Razer Blade 14 Ryzen 9 6900HX | |
| Gigabyte A7 X1 | |
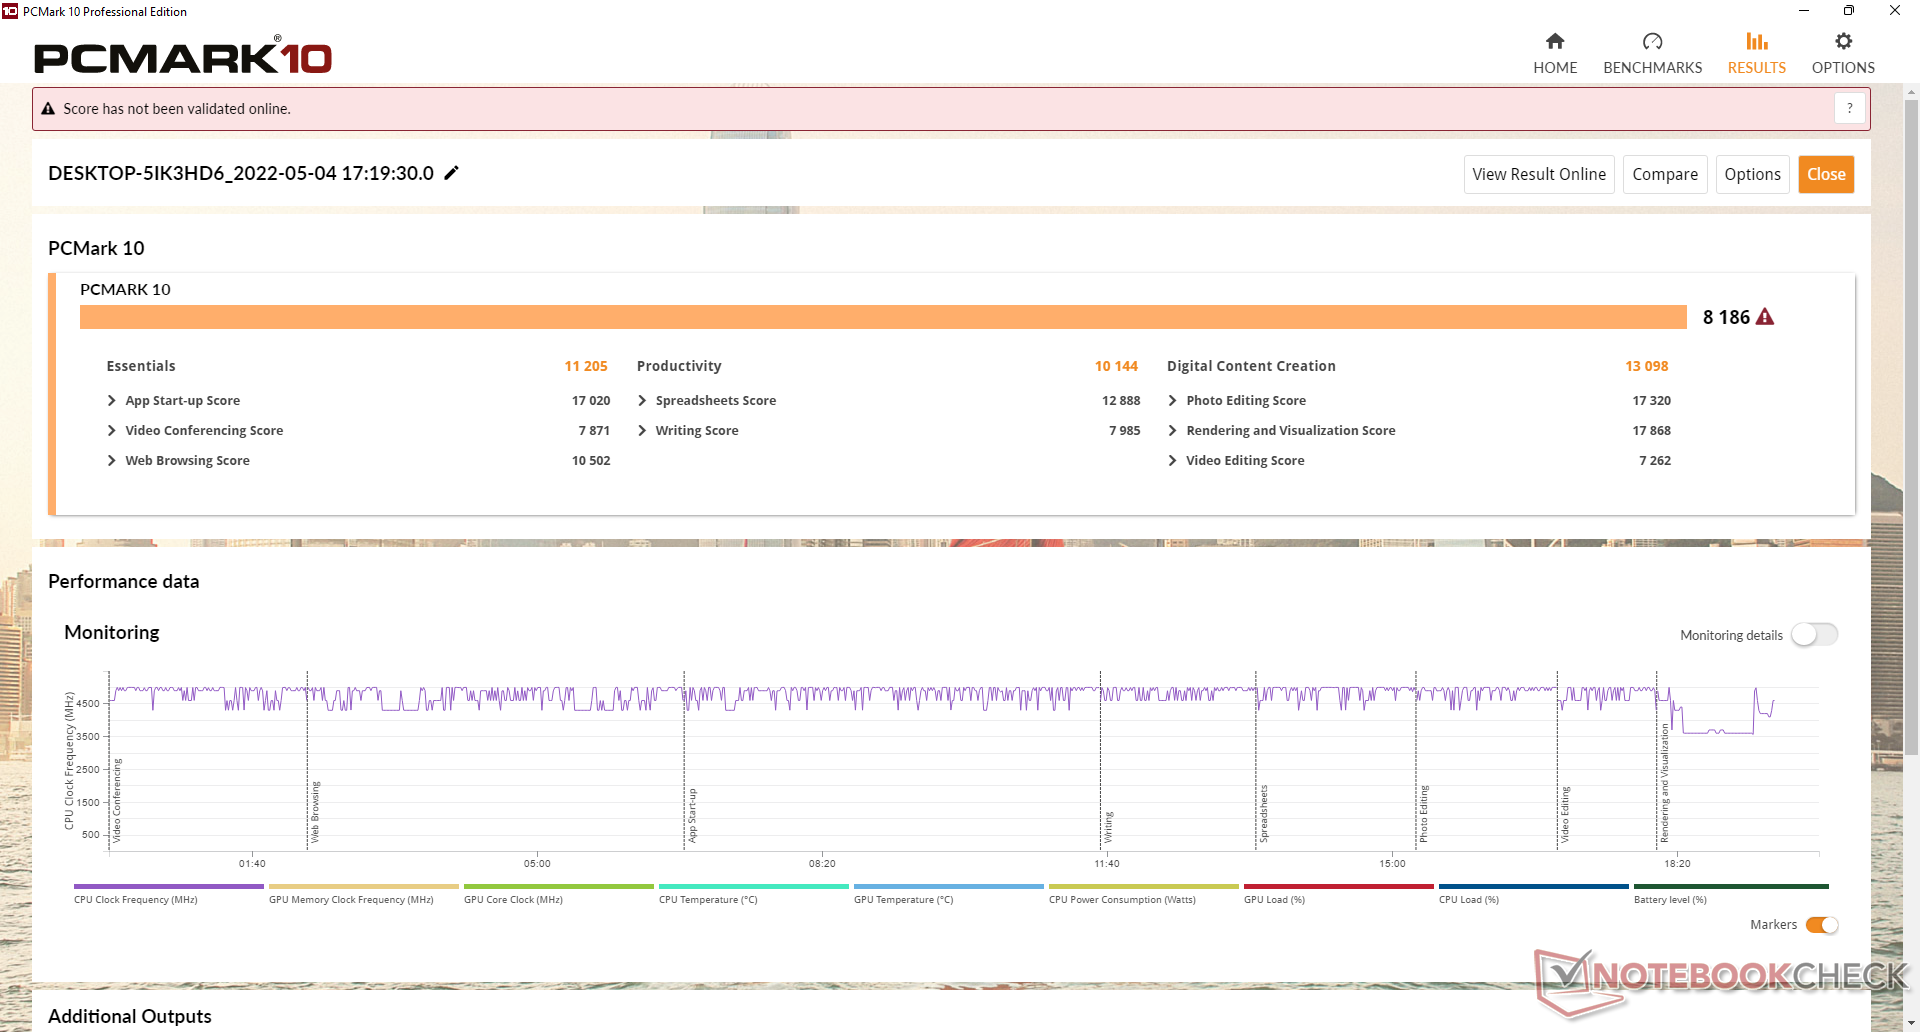
System Performance
Die PCMark Ergebnisse sind durchweg besser als die, welche wir mit dem x17 R1 im letzten Jahr gemessen haben, und zwar mit relativ geringen Abständen.
Es ist erwähnenswert, dass das Notebook selbst im Standby- oder Ruhezustand viel Strom verbraucht. Wir konnten einen Verbrauch von fast 12 W im Ruhezustand feststellen, verglichen mit <2 W bei den meisten anderen Laptops. Darüber hinaus waren die Lüfter in unserem Testgerät manchmal sogar im Ruhezustand aktiv, und das Gerät hatte manchmal auch Probleme, richtig aufzuwachen.
CrossMark: Overall | Productivity | Creativity | Responsiveness
| PCMark 10 / Score | |
| Alienware x17 R2 P48E | |
| Durchschnittliche Intel Core i9-12900HK, NVIDIA GeForce RTX 3080 Ti Laptop GPU (7149 - 8186, n=5) | |
| Alienware x17 RTX 3080 P48E | |
| MSI Stealth GS77 12UHS-083US | |
| MSI GT76 Titan DT 10SGS | |
| Asus ROG Zephyrus S17 GX703HSD | |
| Gigabyte A7 X1 | |
| PCMark 10 / Essentials | |
| Alienware x17 R2 P48E | |
| Durchschnittliche Intel Core i9-12900HK, NVIDIA GeForce RTX 3080 Ti Laptop GPU (9870 - 11205, n=5) | |
| Asus ROG Zephyrus S17 GX703HSD | |
| MSI GT76 Titan DT 10SGS | |
| MSI Stealth GS77 12UHS-083US | |
| Alienware x17 RTX 3080 P48E | |
| Gigabyte A7 X1 | |
| PCMark 10 / Productivity | |
| Alienware x17 R2 P48E | |
| Durchschnittliche Intel Core i9-12900HK, NVIDIA GeForce RTX 3080 Ti Laptop GPU (9173 - 10422, n=5) | |
| Alienware x17 RTX 3080 P48E | |
| MSI Stealth GS77 12UHS-083US | |
| Gigabyte A7 X1 | |
| Asus ROG Zephyrus S17 GX703HSD | |
| MSI GT76 Titan DT 10SGS | |
| PCMark 10 / Digital Content Creation | |
| Alienware x17 R2 P48E | |
| Durchschnittliche Intel Core i9-12900HK, NVIDIA GeForce RTX 3080 Ti Laptop GPU (10951 - 13098, n=5) | |
| MSI GT76 Titan DT 10SGS | |
| Alienware x17 RTX 3080 P48E | |
| MSI Stealth GS77 12UHS-083US | |
| Asus ROG Zephyrus S17 GX703HSD | |
| Gigabyte A7 X1 | |
| CrossMark / Overall | |
| Alienware x17 R2 P48E | |
| Durchschnittliche Intel Core i9-12900HK, NVIDIA GeForce RTX 3080 Ti Laptop GPU (970 - 2138, n=5) | |
| CrossMark / Productivity | |
| Alienware x17 R2 P48E | |
| Durchschnittliche Intel Core i9-12900HK, NVIDIA GeForce RTX 3080 Ti Laptop GPU (921 - 2038, n=5) | |
| CrossMark / Creativity | |
| Alienware x17 R2 P48E | |
| Durchschnittliche Intel Core i9-12900HK, NVIDIA GeForce RTX 3080 Ti Laptop GPU (1007 - 2210, n=5) | |
| CrossMark / Responsiveness | |
| Durchschnittliche Intel Core i9-12900HK, NVIDIA GeForce RTX 3080 Ti Laptop GPU (1012 - 2234, n=5) | |
| Alienware x17 R2 P48E | |
| PCMark 10 Score | 8186 Punkte | |
Hilfe | ||
| AIDA64 / Memory Copy | |
| MSI Stealth GS77 12UHS-083US | |
| Durchschnittliche Intel Core i9-12900HK (42967 - 62959, n=15) | |
| Alienware x17 R2 P48E | |
| Gigabyte A7 X1 | |
| AIDA64 / Memory Read | |
| MSI Stealth GS77 12UHS-083US | |
| Durchschnittliche Intel Core i9-12900HK (44419 - 66989, n=15) | |
| Alienware x17 R2 P48E | |
| Gigabyte A7 X1 | |
| AIDA64 / Memory Write | |
| MSI Stealth GS77 12UHS-083US | |
| Durchschnittliche Intel Core i9-12900HK (42144 - 65268, n=15) | |
| Alienware x17 R2 P48E | |
| Gigabyte A7 X1 | |
| AIDA64 / Memory Latency | |
| Alienware x17 R2 P48E | |
| MSI Stealth GS77 12UHS-083US | |
| Gigabyte A7 X1 | |
| Durchschnittliche Intel Core i9-12900HK (79.9 - 109, n=15) | |
| Asus ROG Zephyrus S17 GX703HSD | |
| Alienware x17 RTX 3080 P48E | |
* ... kleinere Werte sind besser
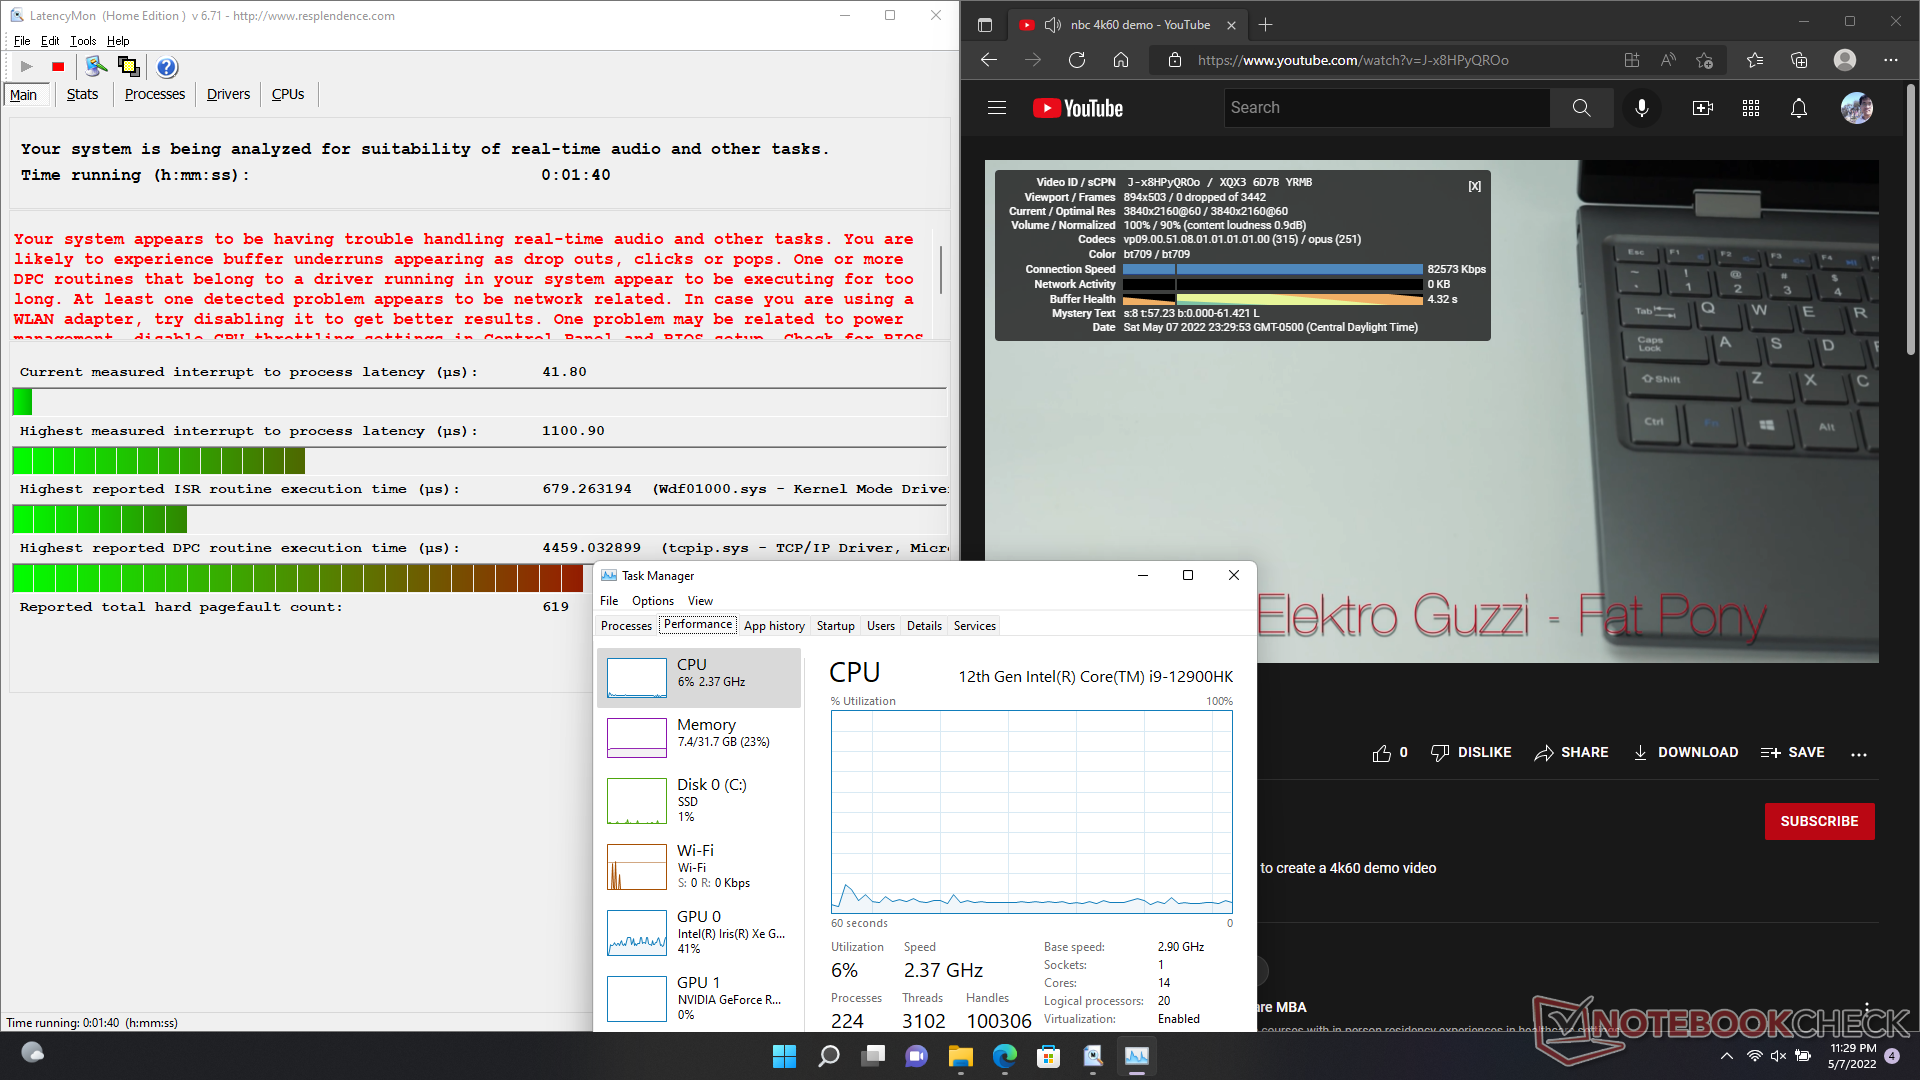
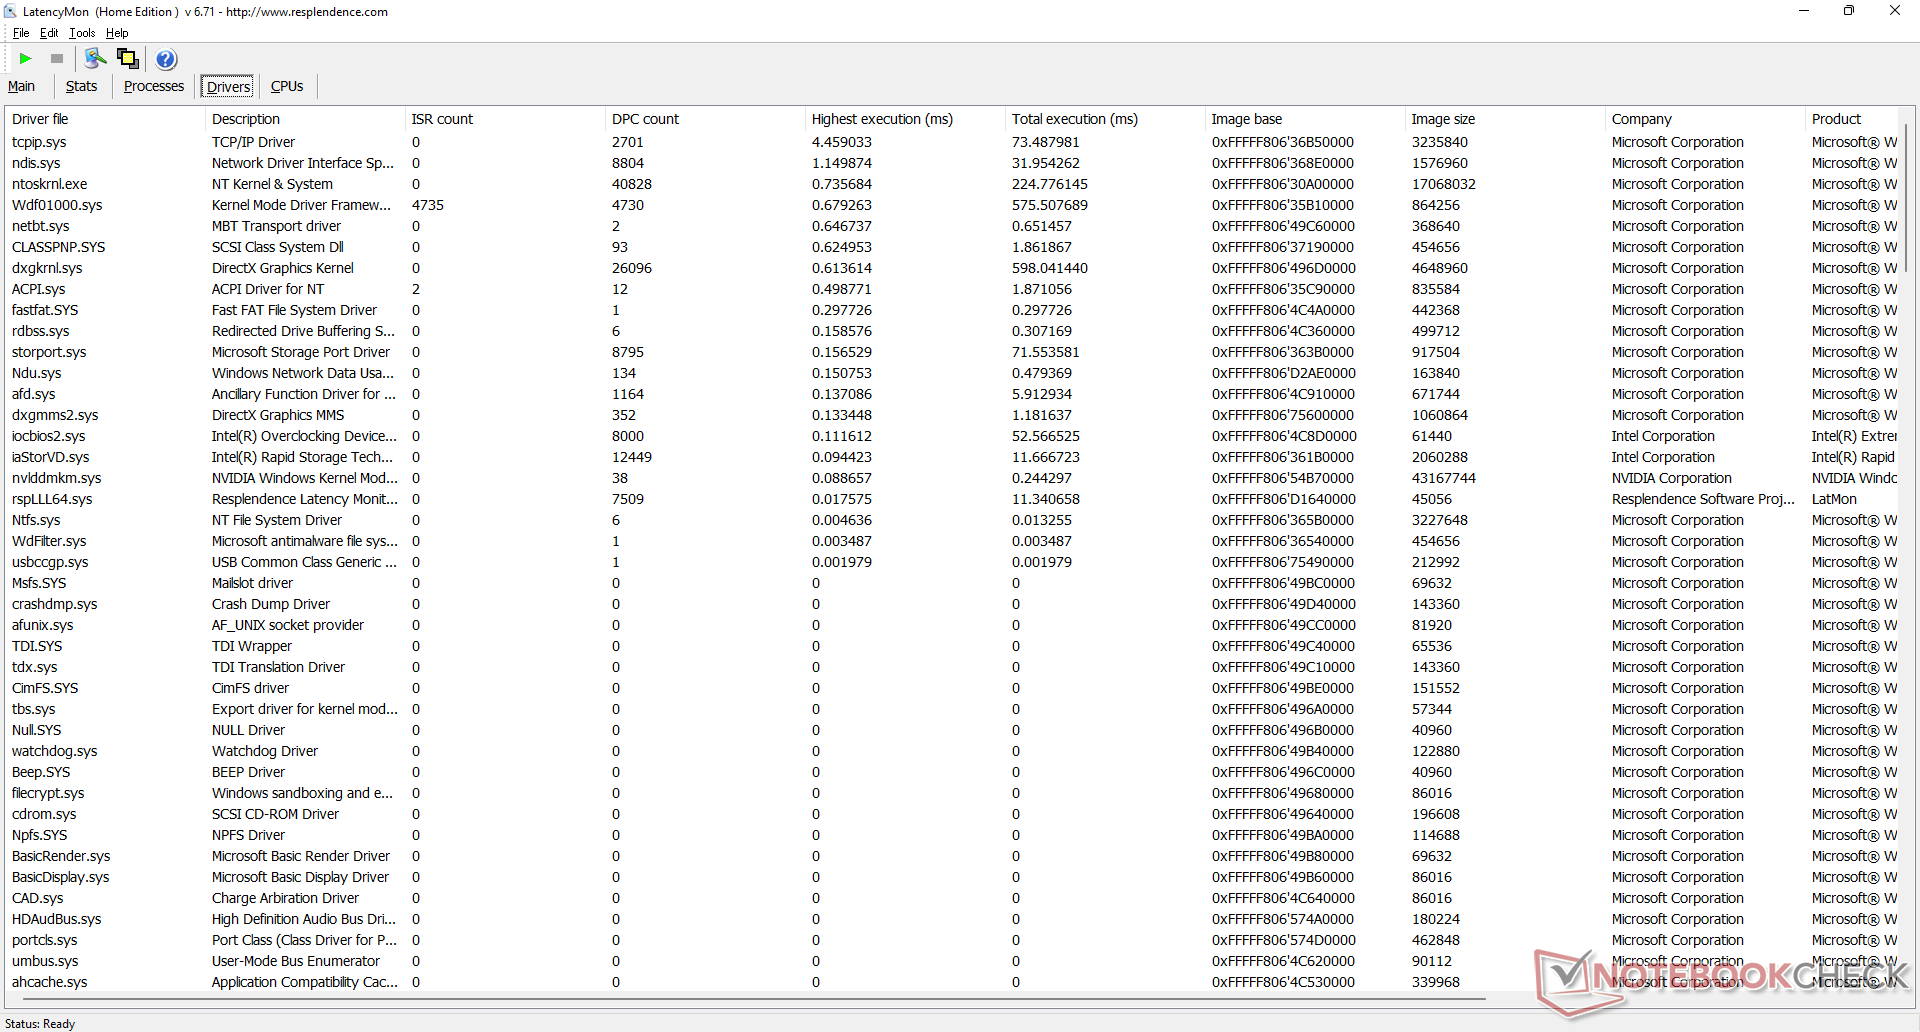
DPC-Latenzzeit
LatencyMon zeigt DPC-Probleme beim Öffnen mehrerer Browser Tabs der Homepage. Die Wiedergabe von 4K-Videos bei 60 fps erfolgt ansonsten flüssig und ohne Bildaussetzer.
| DPC Latencies / LatencyMon - interrupt to process latency (max), Web, Youtube, Prime95 | |
| MSI GT76 Titan DT 10SGS | |
| Alienware x17 RTX 3080 P48E | |
| MSI Stealth GS77 12UHS-083US | |
| Asus ROG Zephyrus S17 GX703HSD | |
| Alienware x17 R2 P48E | |
| Gigabyte A7 X1 | |
* ... kleinere Werte sind besser
Speichergeräte
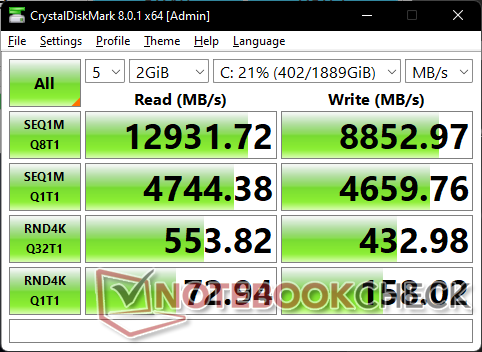

* ... kleinere Werte sind besser
Dauerleistung Lesen: DiskSpd Read Loop, Queue Depth 8
GPU Performance
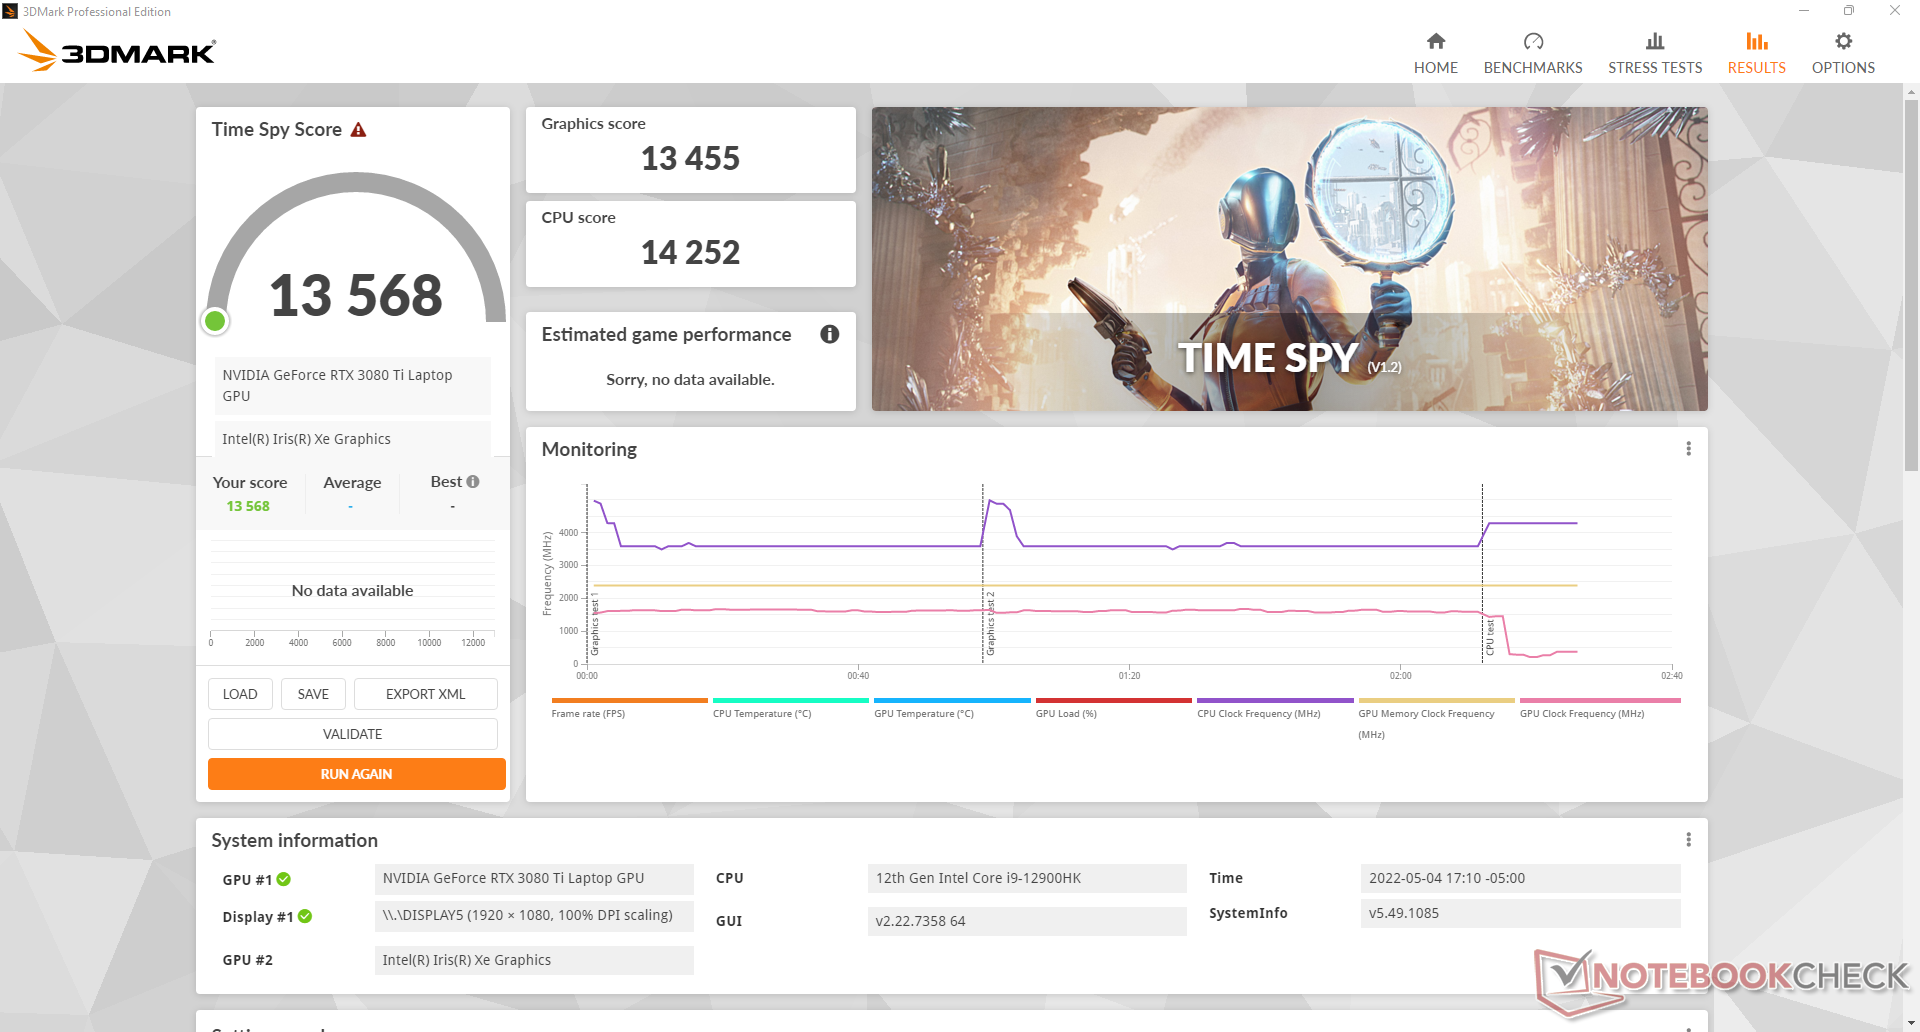
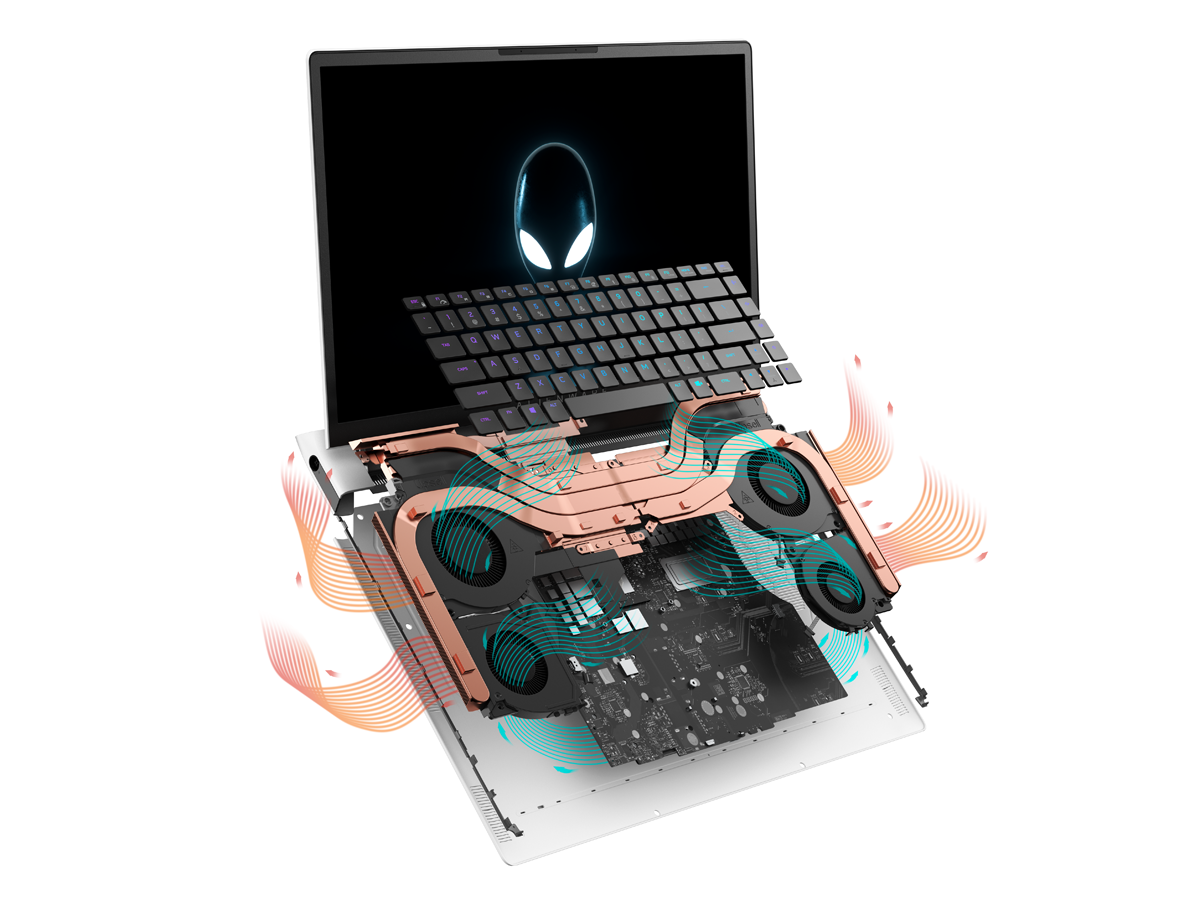
Mit seinem sehr hohen TGP-Ziel von 175 W ist die Grafikleistung eine der schnellsten aller Gaming-Notebooks. Das 2022 Razer Blade 15 zum Beispiel ist mit der gleichen GeForce RTX 3080 Ti GPU ausgestattet, allerdings mit einem niedrigeren TGP-Ziel von 110 W, was zu einer um 25 bis 30 % geringeren Leistung führt. Ähnliche Defizite sind zu beobachten, wenn man die GPU im Alienware mit der gleichen GPU im MSI GS77 vergleichen. In Kombination mit der überdurchschnittlich schnellen CPU können Nutzer mit etwas höheren Frame-Raten rechnen als bei den meisten anderen Gaming-Laptops, die mit GeForce-RTX-3080-Grafik ausgestattet sind.
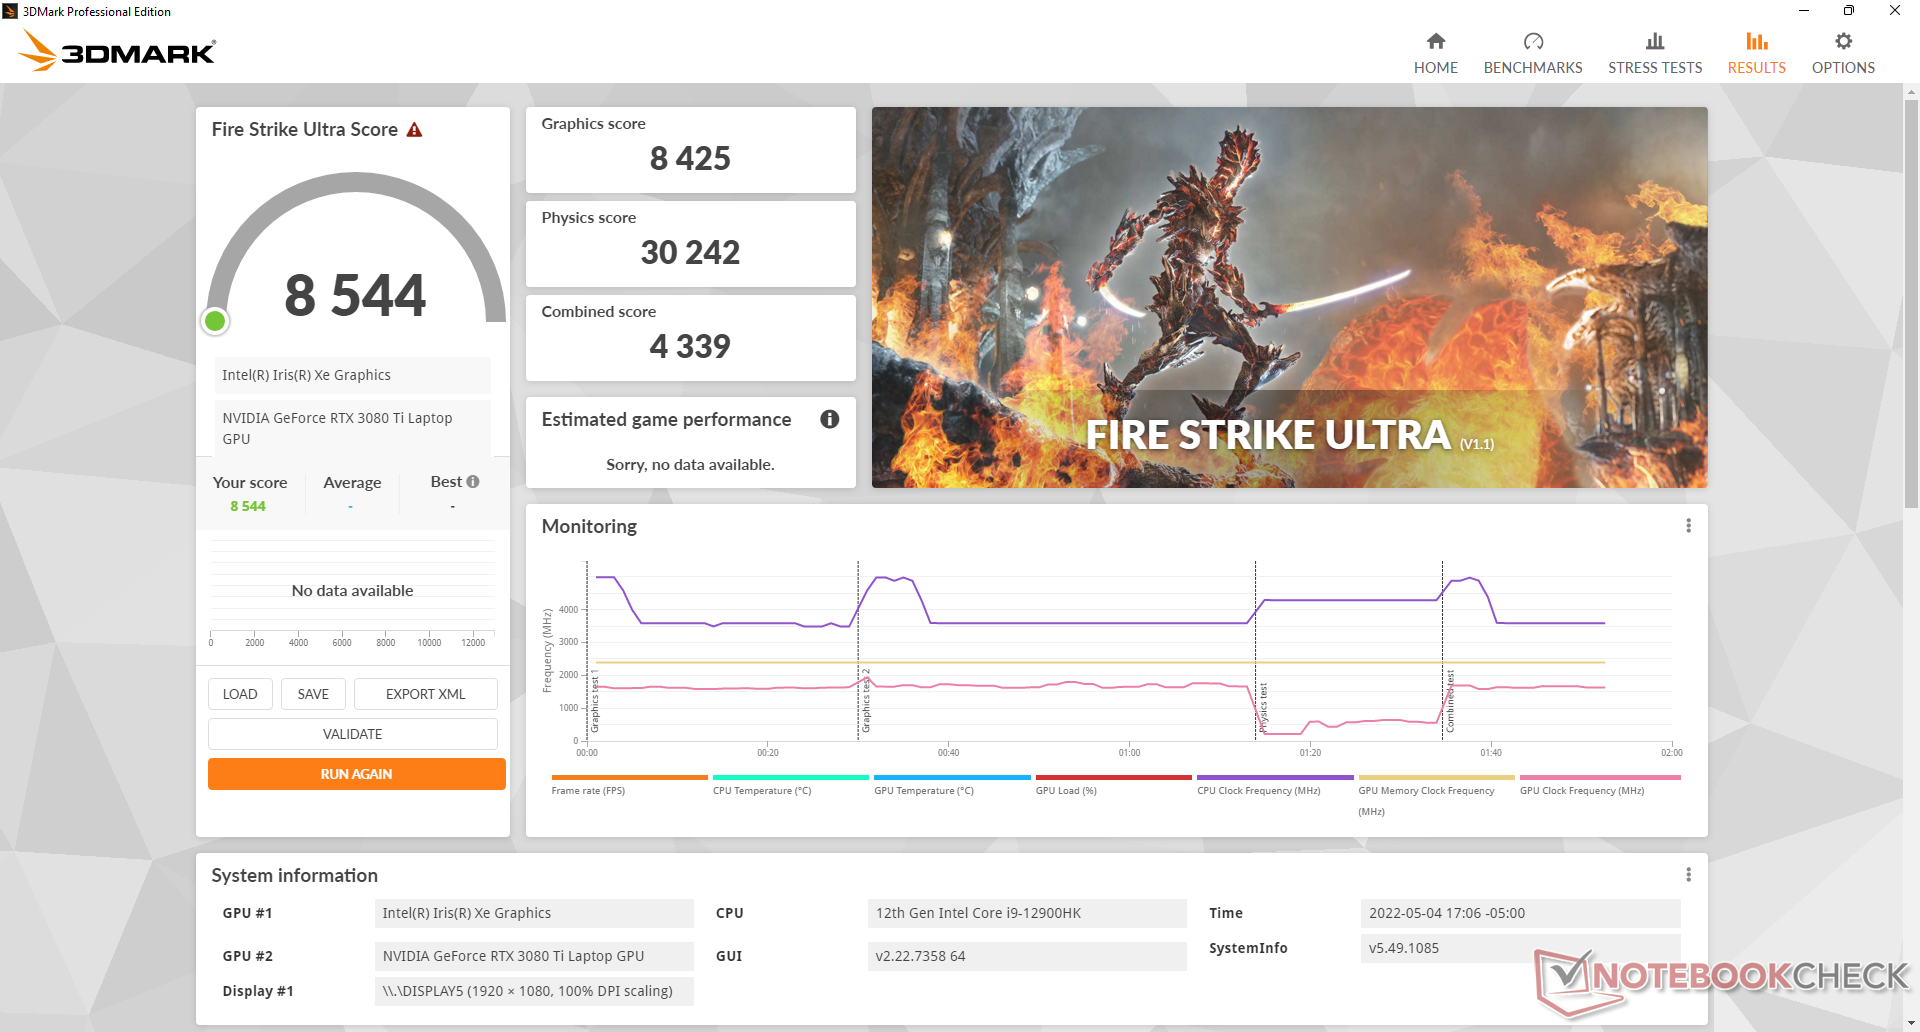
Die mobile RTX 3080 Ti in unserem Alienware x17 R2 ähnelt am meisten der Desktop GeForce RTX 3070. Eine Desktop-RTX 3080 Ti kann immer noch fast 50 Prozent mehr Leistung bieten als unsere mobile Alienware Version.
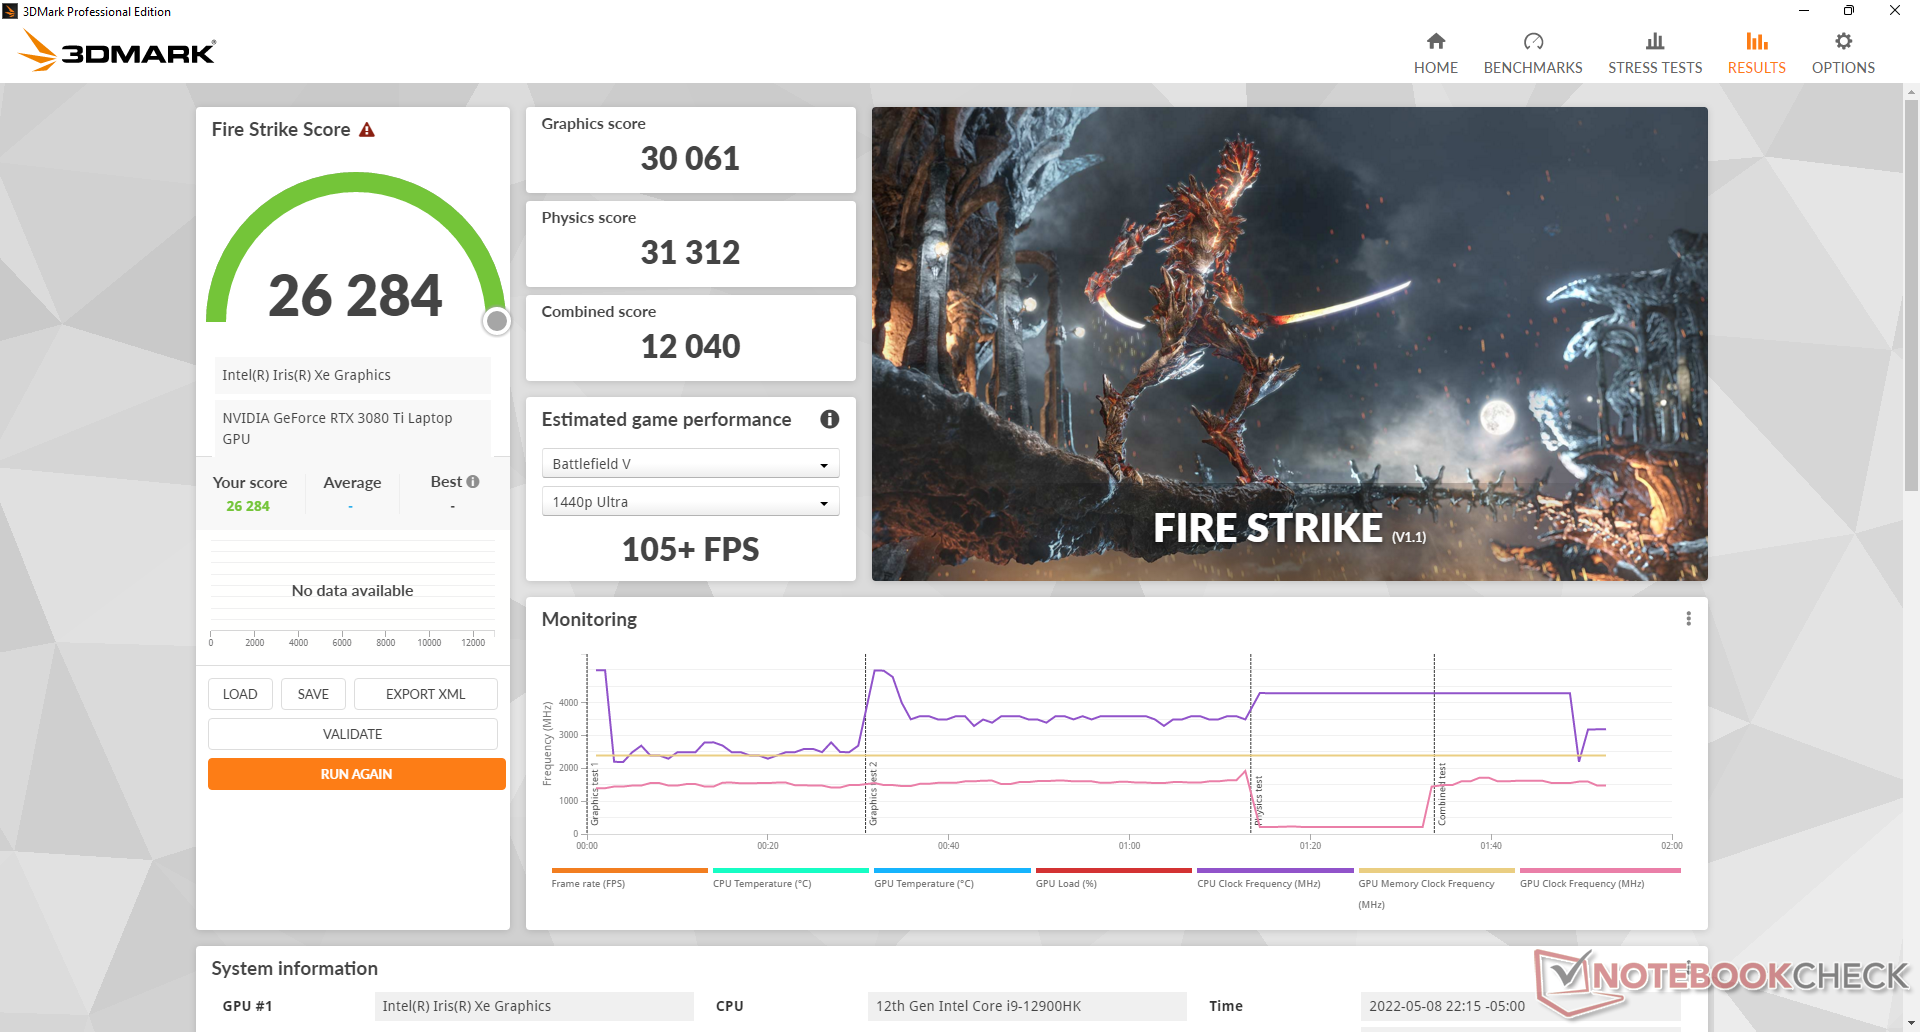
Beachten Sie, dass die Grafikleistung langsamer ist, wenn Sie den Modus "Ausbalanciert" anstelle des Modus "Maximaler Lüfter" verwenden. Die Punktzahl der Fire Strike Graphics ist im Energieprofil "Ausbalanciert" etwa 8 bis 9 Prozent niedriger.
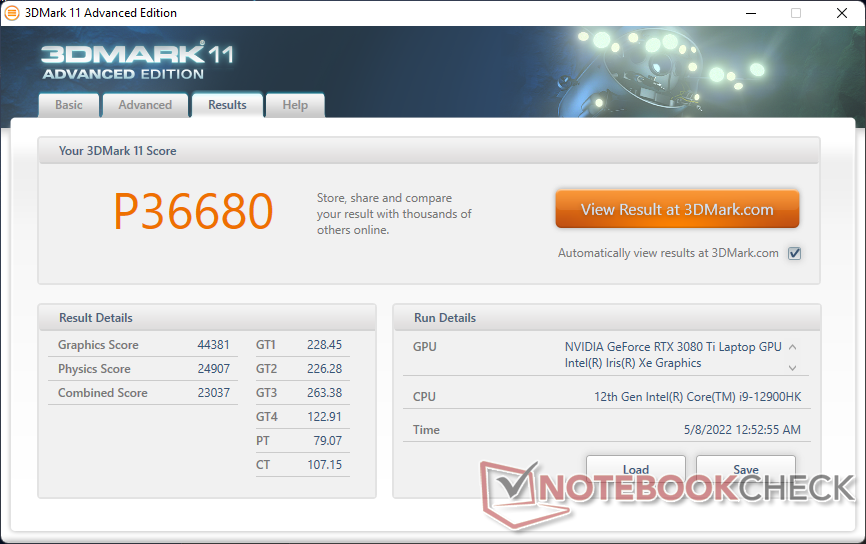
| 3DMark 11 Performance | 36680 Punkte | |
| 3DMark Cloud Gate Standard Score | 63911 Punkte | |
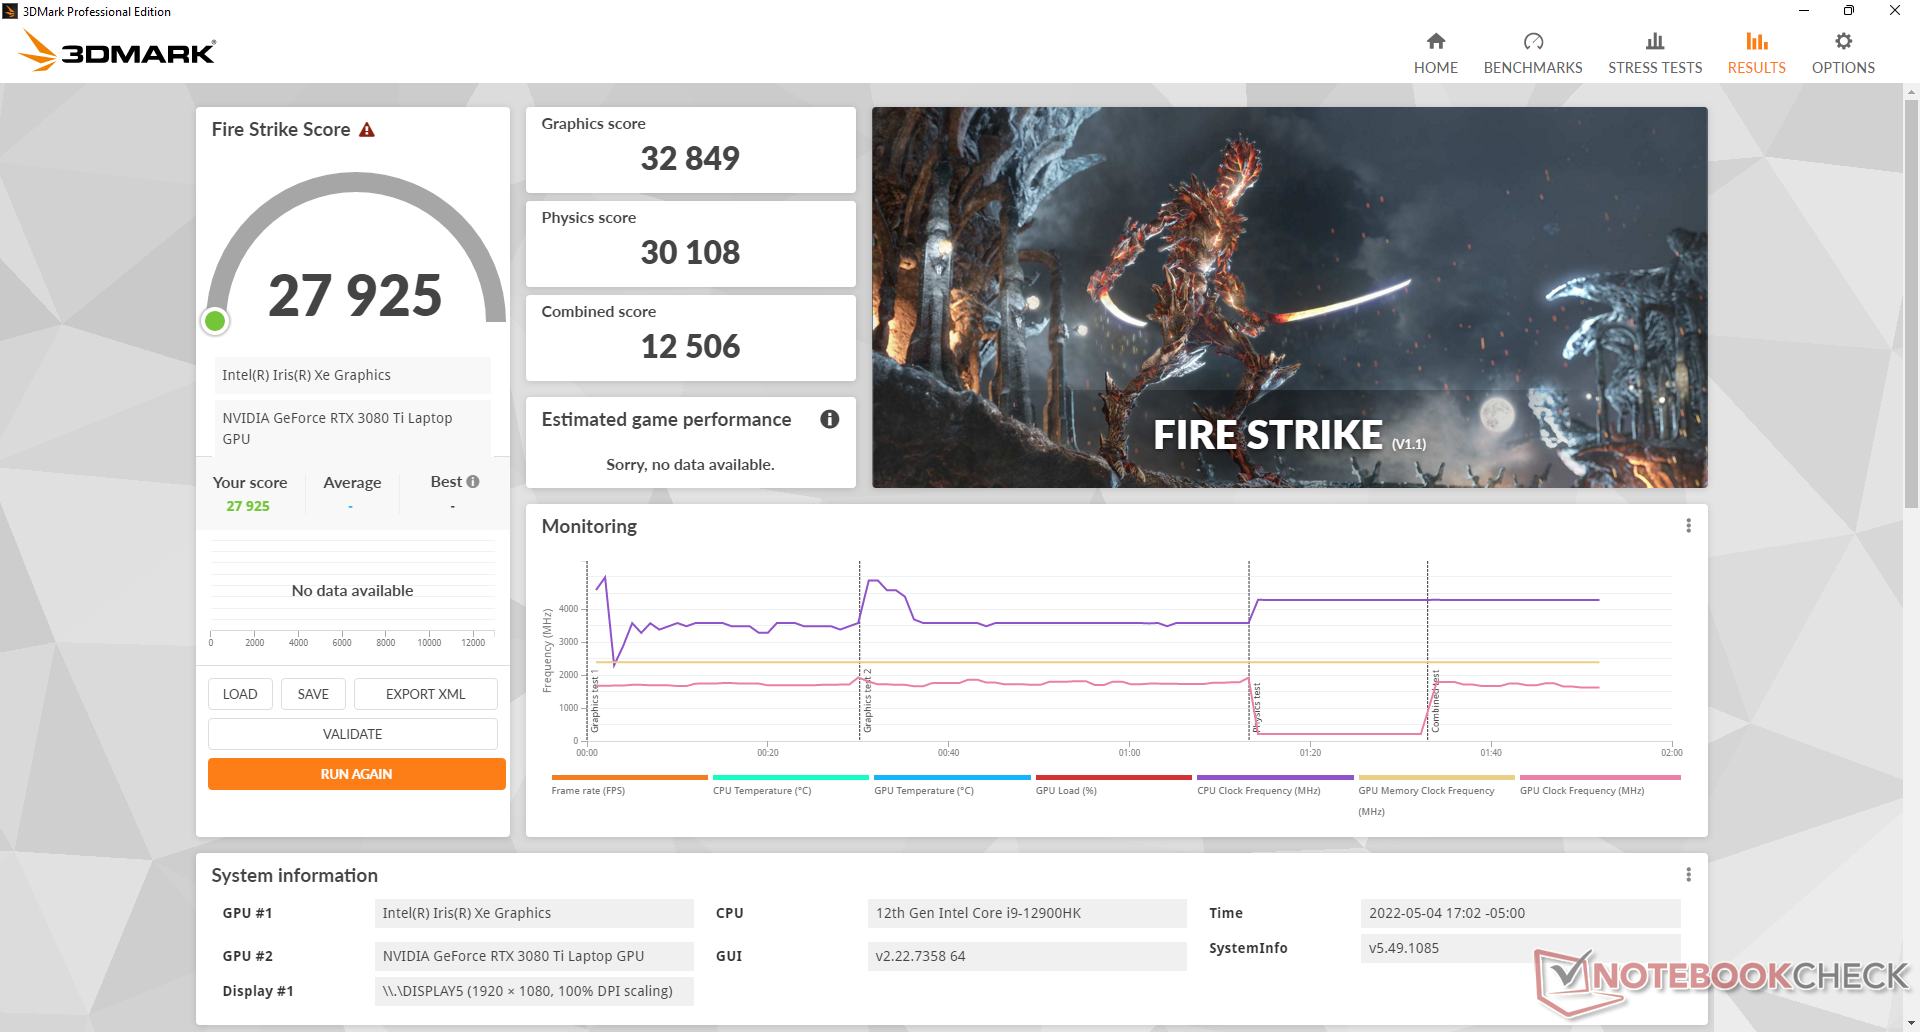
| 3DMark Fire Strike Score | 27925 Punkte | |
| 3DMark Time Spy Score | 13568 Punkte | |
Hilfe | ||
Witcher 3 FPS Chart
| min. | mittel | hoch | max. | |
|---|---|---|---|---|
| GTA V (2015) | 187 | 185.1 | 180.8 | 126.3 |
| The Witcher 3 (2015) | 500.9 | 388.5 | 267.7 | 128 |
| Dota 2 Reborn (2015) | 186.1 | 172.3 | 166.6 | 158.9 |
| Final Fantasy XV Benchmark (2018) | 215 | 167.8 | 127.8 | |
| X-Plane 11.11 (2018) | 161 | 143.9 | 112.9 | |
| Strange Brigade (2018) | 474 | 300 | 243 | 213 |
| Cyberpunk 2077 1.6 (2022) | 167.7 | 142 | 116.2 | 115.7 |
Emissionen
Systemgeräusch
Das Lüftergeräusch ist abhängig von den Einstellungen im Alienware Command Center. Die Lüfter des Alienware neigen dazu, häufig zu pulsieren, wenn der Modus "Ausbalanciert" oder höher eingestellt ist, daher wird der Modus "Leise" zum Surfen, Mailen oder Streamen empfohlen. Unser Gerät überschreitet nur selten 32 dB(A), wenn es mit solch anspruchslosen Lasten betrieben wird, was zwar spürbar, aber nicht störend ist.
Beim Spielen im Modus "Ausgewogen" stabilisiert sich das Lüftergeräusch bei etwa 43,3 dB(A) gegenüber 52,5 dB(A) im Modus "Maximaler Lüfter". Trotz der oben erwähnten Leistungseinbußen kann es sich lohnen, im Modus "Ausbalanciert" zu spielen, da das Lüftergeräusch dann deutlich leiser ist.
Lautstärkediagramm
| Idle |
| 23.1 / 23.1 / 23.1 dB(A) |
| Last |
| 31.9 / 52.5 dB(A) |
 | ||
30 dB leise 40 dB(A) deutlich hörbar 50 dB(A) störend |
||
min: | ||
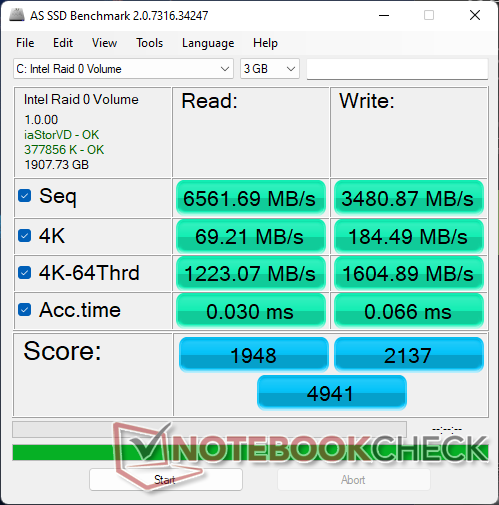
| Alienware x17 R2 P48E GeForce RTX 3080 Ti Laptop GPU, i9-12900HK, 2x Samsung PM9A1 1TB (RAID 0) | Alienware x17 RTX 3080 P48E GeForce RTX 3080 Laptop GPU, i7-11800H, 2x WDC PC SN730 SDBPNTY-1T00 (RAID 0) | Asus ROG Zephyrus S17 GX703HSD GeForce RTX 3080 Laptop GPU, i9-11900H, Samsung PM9A1 MZVL22T0HBLB | MSI Stealth GS77 12UHS-083US GeForce RTX 3080 Ti Laptop GPU, i7-12700H, Micron 3400 1TB MTFDKBA1T0TFH | MSI GT76 Titan DT 10SGS GeForce RTX 2080 Super Mobile, i9-10900K, 2x WDC PC SN730 SDBPNTY-1T00 (RAID 0) | Gigabyte A7 X1 GeForce RTX 3070 Laptop GPU, R9 5900HX, ESR512GTLCG-EAC-4 | |
|---|---|---|---|---|---|---|
| Geräuschentwicklung | -7% | -2% | -8% | -18% | -28% | |
| aus / Umgebung * (dB) | 22.7 | 24.9 -10% | 23 -1% | 24.5 -8% | 26.4 -16% | 24 -6% |
| Idle min * (dB) | 23.1 | 24.9 -8% | 23 -0% | 24.5 -6% | 27.5 -19% | 25 -8% |
| Idle avg * (dB) | 23.1 | 24.9 -8% | 23 -0% | 24.5 -6% | 27.5 -19% | 29 -26% |
| Idle max * (dB) | 23.1 | 29.6 -28% | 23 -0% | 30.8 -33% | 29.8 -29% | 35 -52% |
| Last avg * (dB) | 31.9 | 31.1 3% | 41 -29% | 34.6 -8% | 30.9 3% | 58 -82% |
| Witcher 3 ultra * (dB) | 52.5 | 49.7 5% | 45 14% | 46.2 12% | 60.7 -16% | 57 -9% |
| Last max * (dB) | 52.5 | 54.8 -4% | 52 1% | 56.8 -8% | 66.6 -27% | 59 -12% |
* ... kleinere Werte sind besser
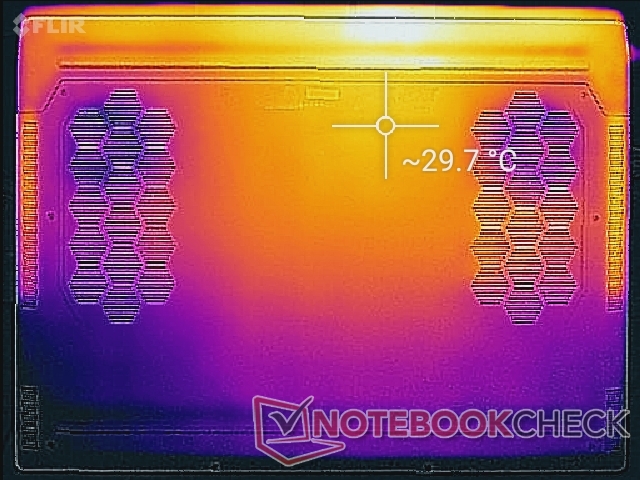
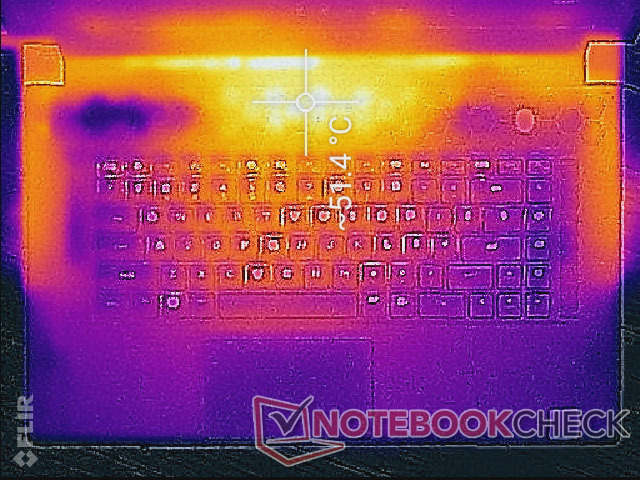
Temperatur
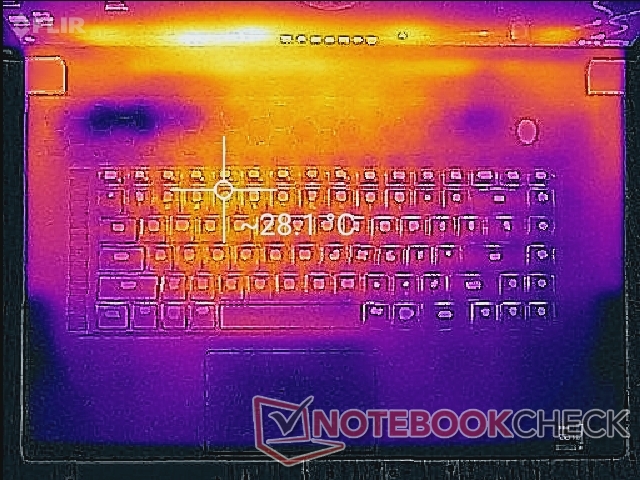
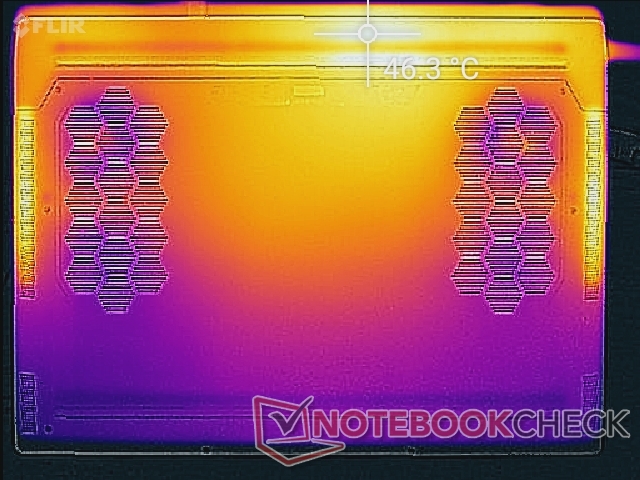
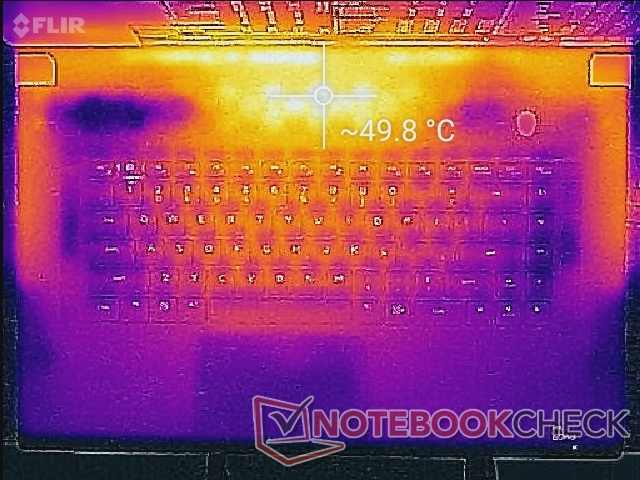
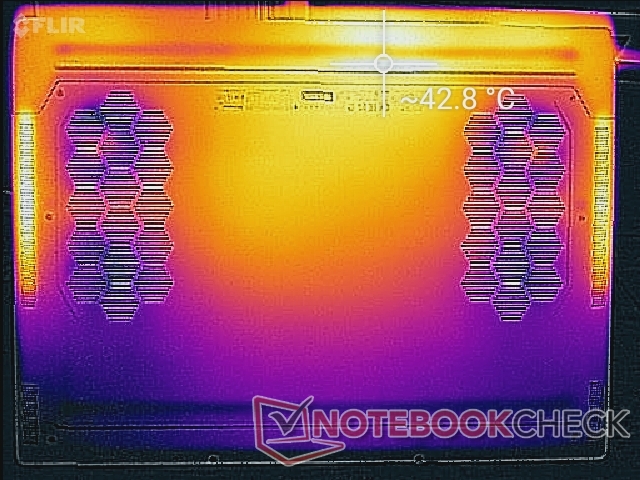
Die Oberflächentemperaturen sind im Allgemeinen kühler, als wir angesichts der extremen Leistungswerte, die Dell mit einem so dünnen Design anstrebt, erwartet haben. Heiße Stellen können bei hoher Last über 45 oder 50 °C erreichen, aber diese Bereiche befinden sich auf der Rückseite des Gehäuses und weit weg von den Tastaturtasten und Handballenablagen. Das System ist warm, aber nie unangenehm beim Spielen.
Denken Sie daran, dass es viele Lüftungsgitter an fast allen Seiten des Systems gibt. Da die CPU-Temperaturen unter Last so hoch sind, ist es wichtig, die Öffnungen nach Möglichkeit nicht zu blockieren.
(-) Die maximale Temperatur auf der Oberseite ist 49.6 °C. Im Vergleich liegt der Klassendurchschnitt bei 40.4 °C (von 21.2 bis 68.8 °C für die Klasse Gaming).
(±) Auf der Unterseite messen wir eine maximalen Wert von 42.4 °C (im Vergleich zum Durchschnitt von 43.2 °C).
(+) Ohne Last messen wir eine durchschnittliche Temperatur von 26.1 °C auf der Oberseite. Der Klassendurchschnitt erreicht 33.9 °C.
(±) Beim längeren Spielen von The Witcher 3 erhitzt sich das Gerät durchschnittlich auf 34.7 °C. Der Durchschnitt der Klasse ist derzeit 33.9 °C.
(+) Die Handballen und der Touchpad-Bereich sind mit gemessenen 29.2 °C kühler als die typische Hauttemperatur und fühlen sich dadurch kühl an.
(±) Die durchschnittliche Handballen-Temperatur anderer getesteter Geräte war 28.8 °C (-0.4 °C).
| Alienware x17 R2 P48E Intel Core i9-12900HK, NVIDIA GeForce RTX 3080 Ti Laptop GPU | Alienware x17 RTX 3080 P48E Intel Core i7-11800H, NVIDIA GeForce RTX 3080 Laptop GPU | Asus ROG Zephyrus S17 GX703HSD Intel Core i9-11900H, NVIDIA GeForce RTX 3080 Laptop GPU | MSI Stealth GS77 12UHS-083US Intel Core i7-12700H, NVIDIA GeForce RTX 3080 Ti Laptop GPU | MSI GT76 Titan DT 10SGS Intel Core i9-10900K, NVIDIA GeForce RTX 2080 Super Mobile | Gigabyte A7 X1 AMD Ryzen 9 5900HX, NVIDIA GeForce RTX 3070 Laptop GPU | |
|---|---|---|---|---|---|---|
| Hitze | -14% | -18% | -16% | 7% | 2% | |
| Last oben max * (°C) | 49.6 | 58.4 -18% | 59 -19% | 50.6 -2% | 36.4 27% | 44 11% |
| Last unten max * (°C) | 42.4 | 49 -16% | 53 -25% | 59.6 -41% | 43 -1% | 49 -16% |
| Idle oben max * (°C) | 29.2 | 33.6 -15% | 35 -20% | 30 -3% | 28 4% | 27 8% |
| Idle unten max * (°C) | 32 | 34.6 -8% | 35 -9% | 37.4 -17% | 33.4 -4% | 30 6% |
* ... kleinere Werte sind besser
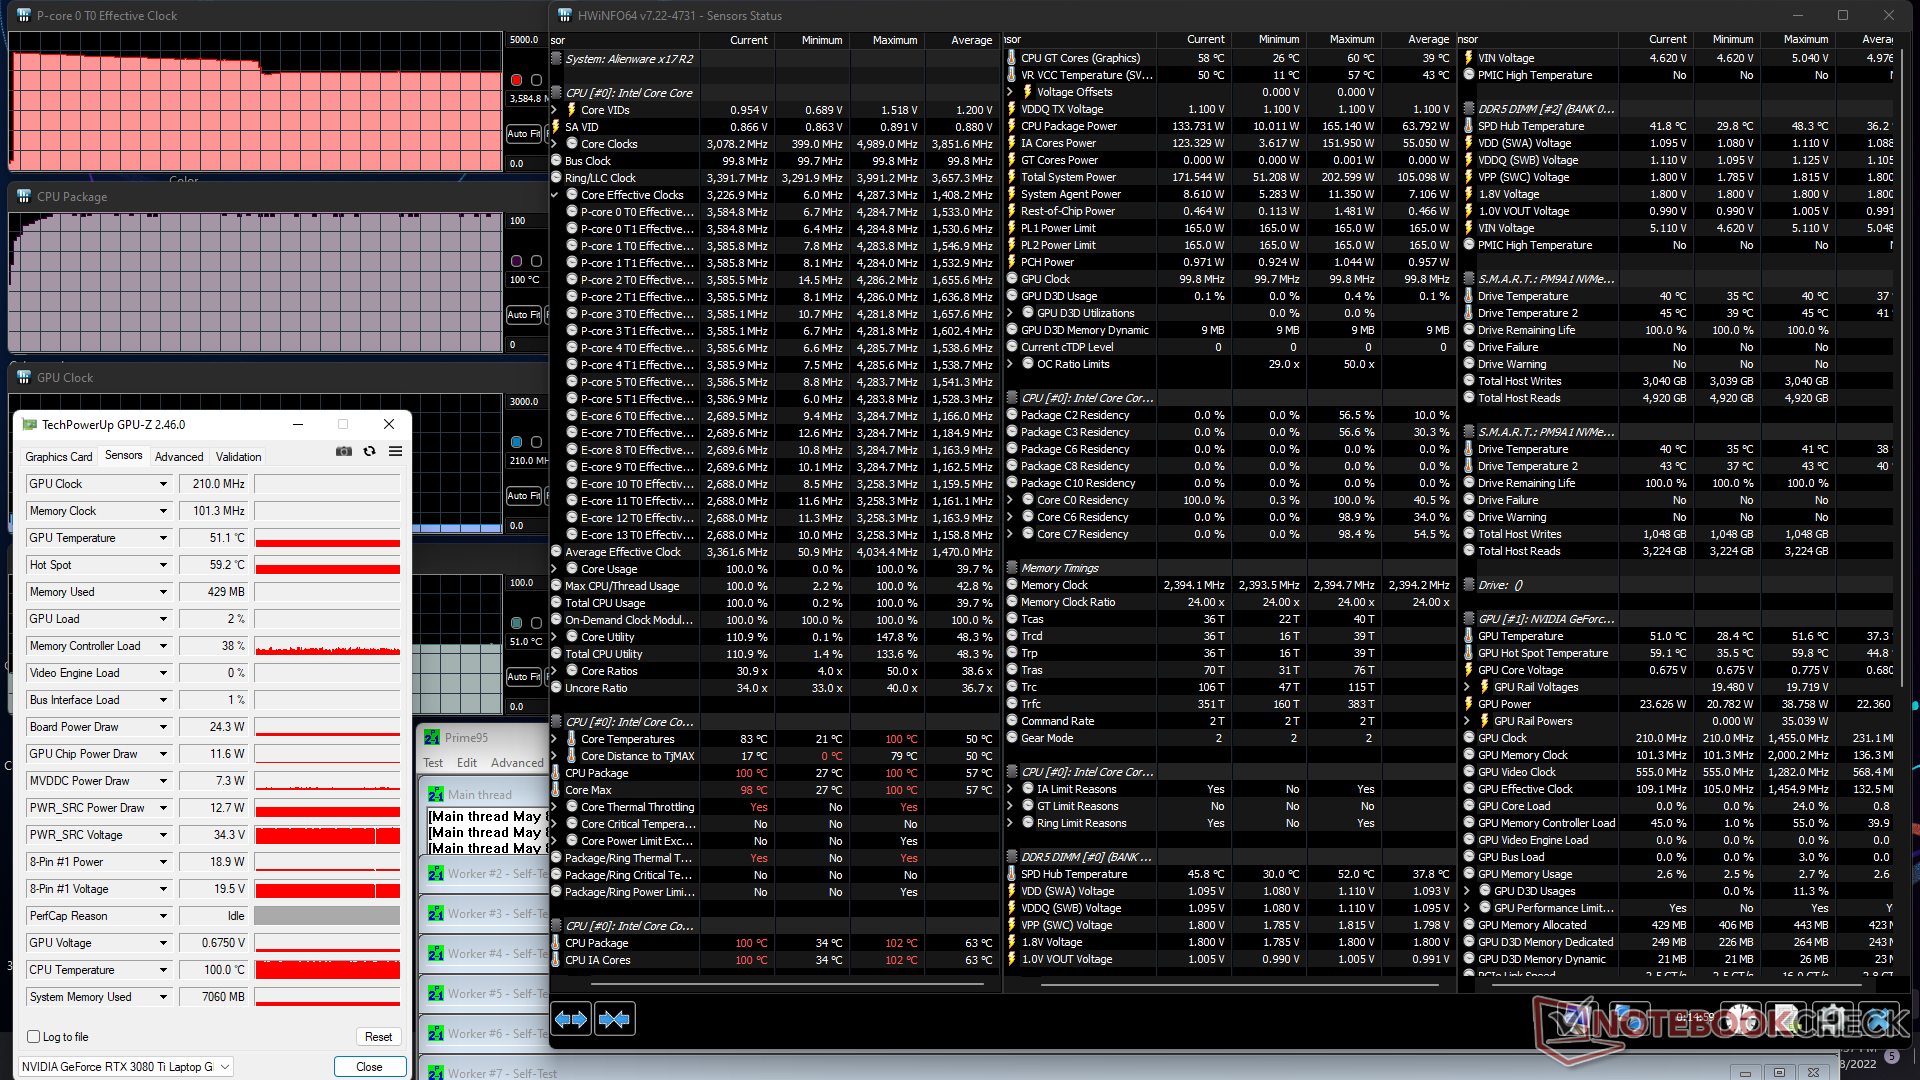
Stresstest
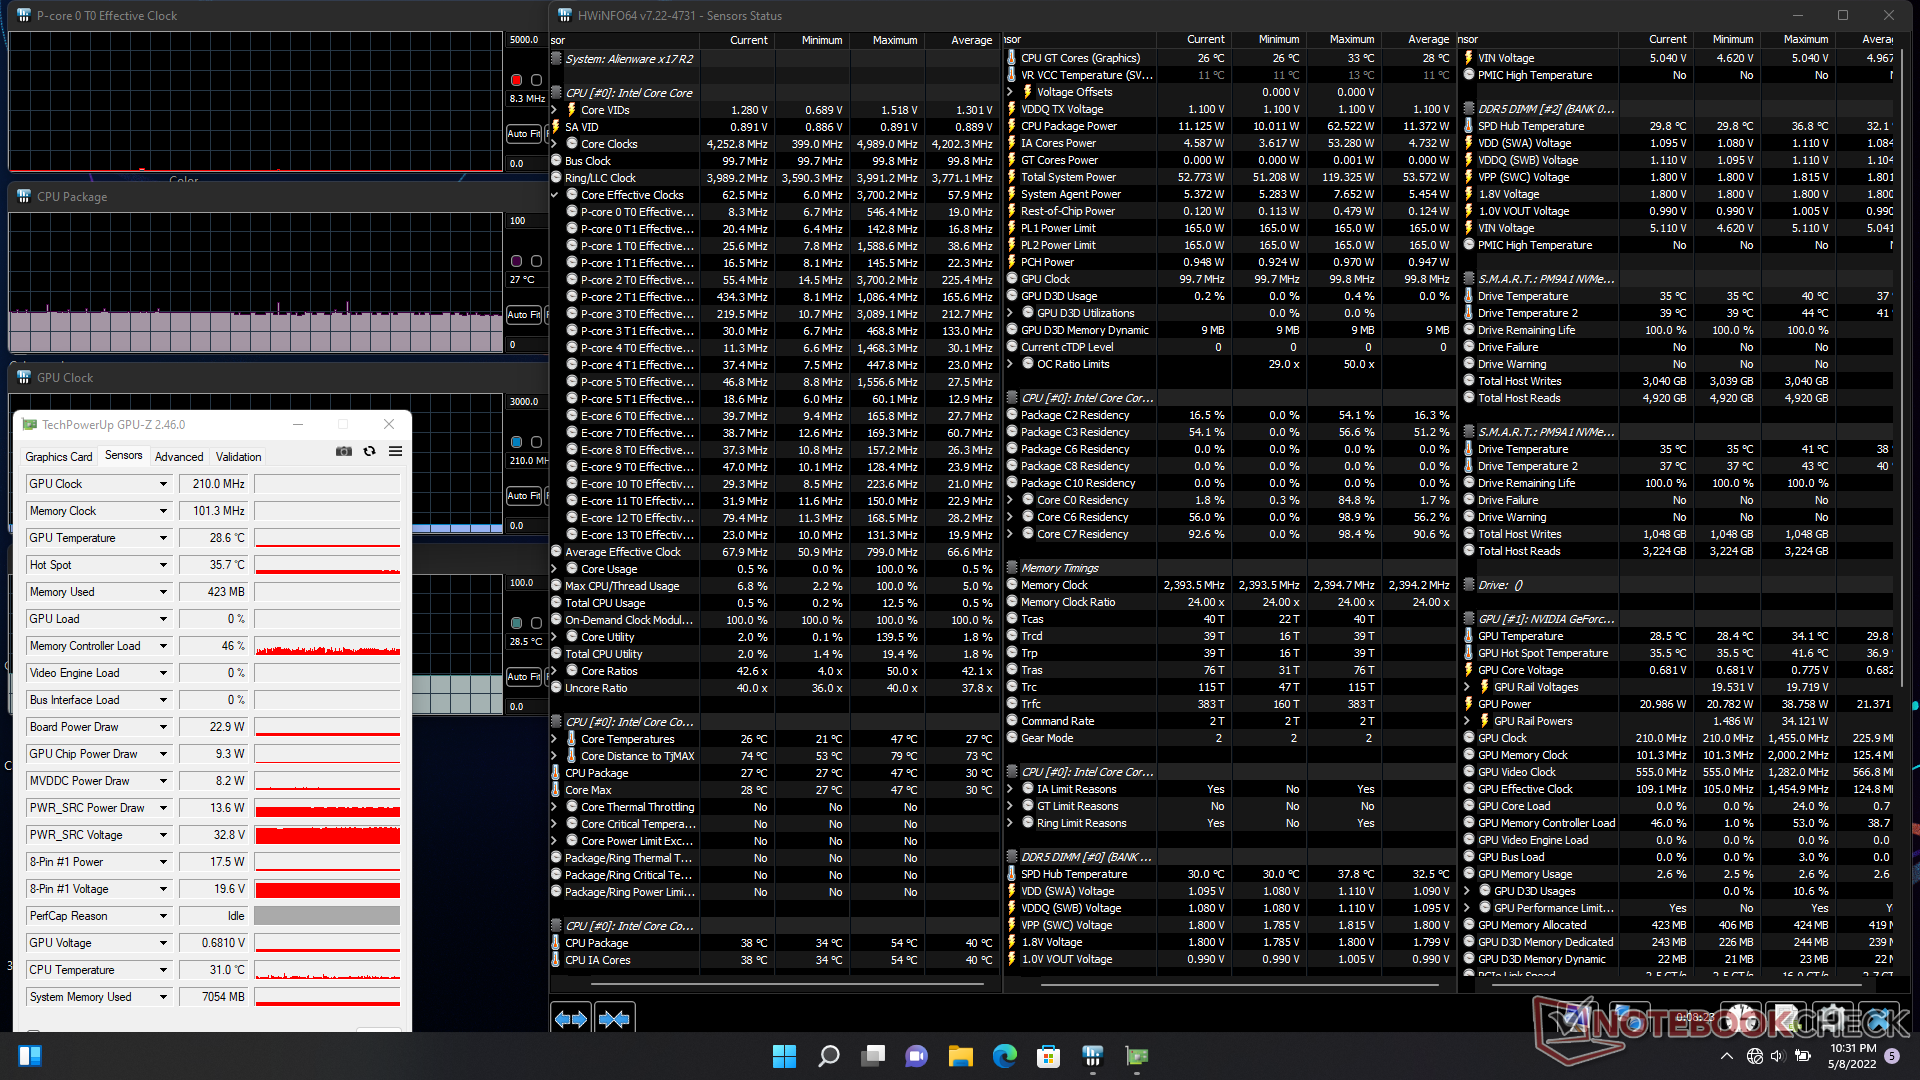
Bei der Ausführung von Prime95 stiegen die CPU-Taktraten für ein paar Sekunden auf 4,3 GHz, bevor sie eine Kerntemperatur von 100 °C erreichten. Die Taktraten stabilisierten sich schließlich bei 3,6 GHz, und die Kerntemperatur blieb knapp unter 100 °C. Die Leistungsaufnahme des CPU-Pakets lag zu Beginn des Tests bei 165 W, bevor sie sich aufgrund der thermischen Einschränkungen bei 134 W stabilisierte. Es ist klar, dass die CPU so schnell und so gut läuft, wie es die Alienware Kühllösung zulässt. Im Vergleich dazu würde sich der Core i7-12700H im MSI GS77 unter ähnlichen Bedingungen im Bereich von 2,7 bis 3 GHz einpendeln.
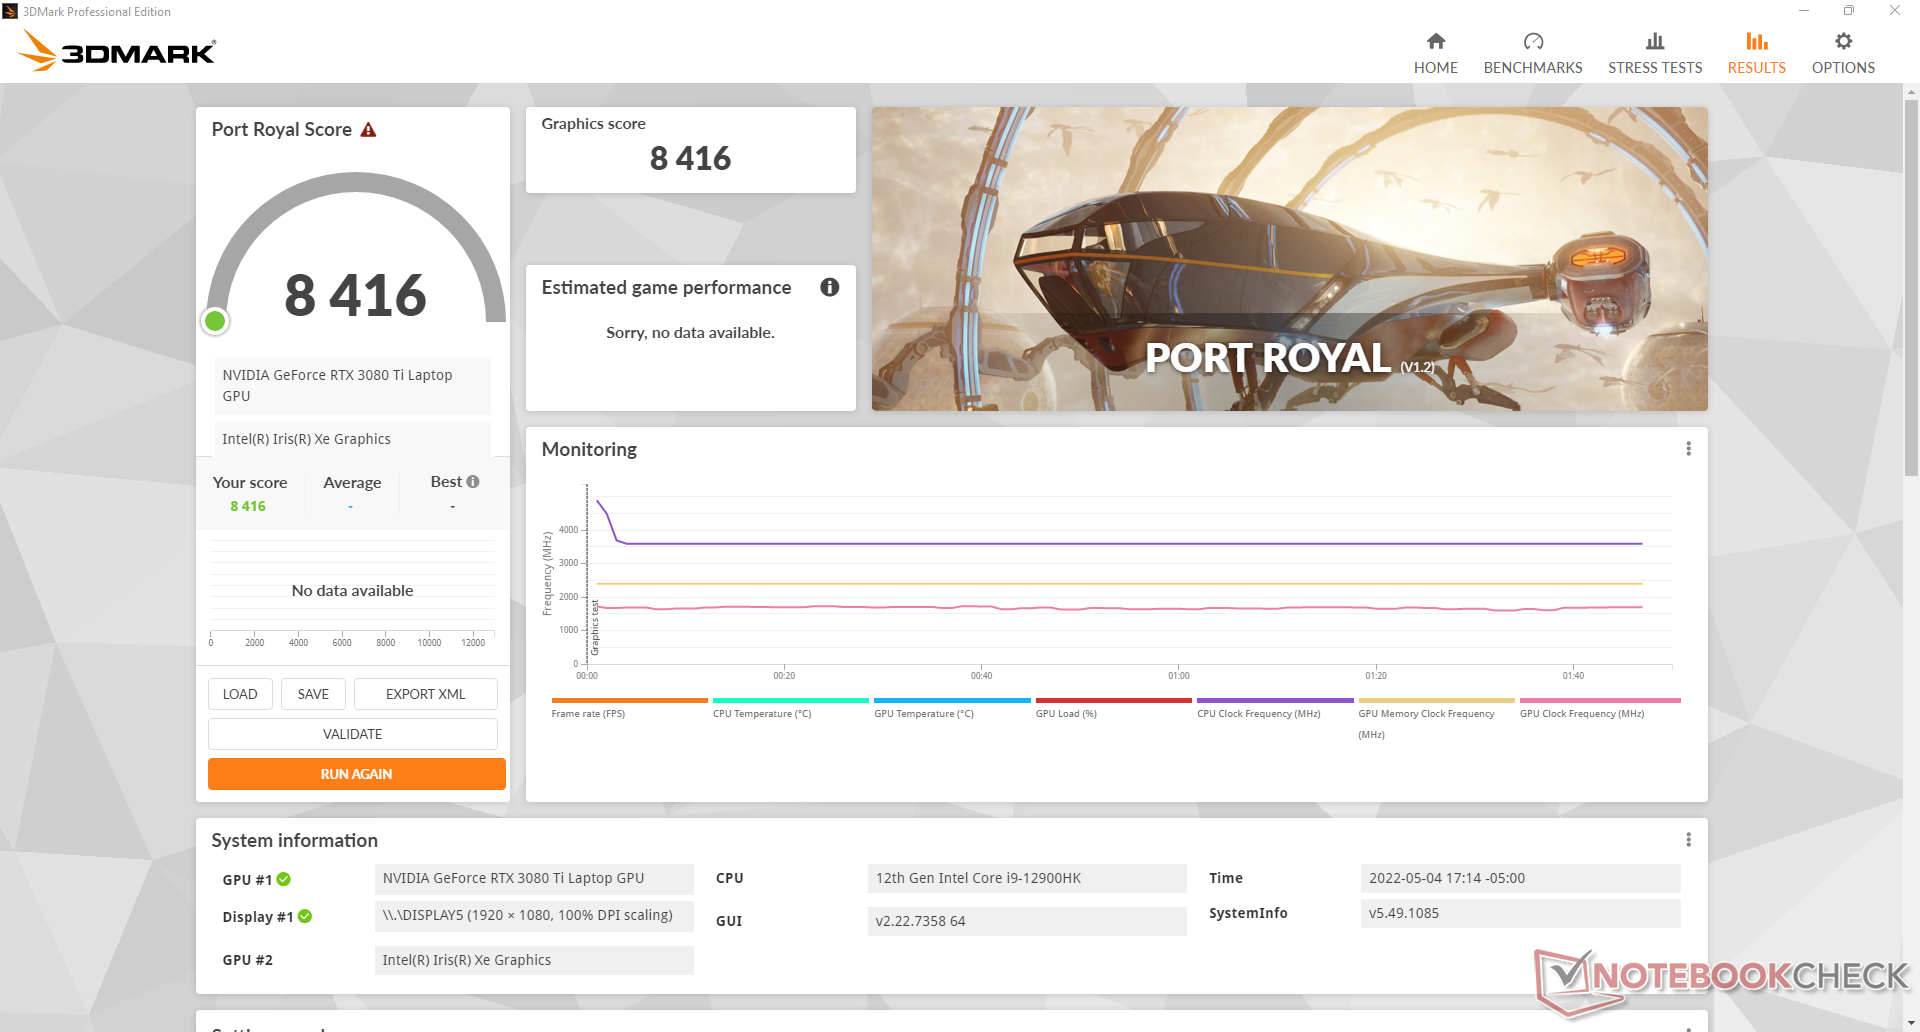
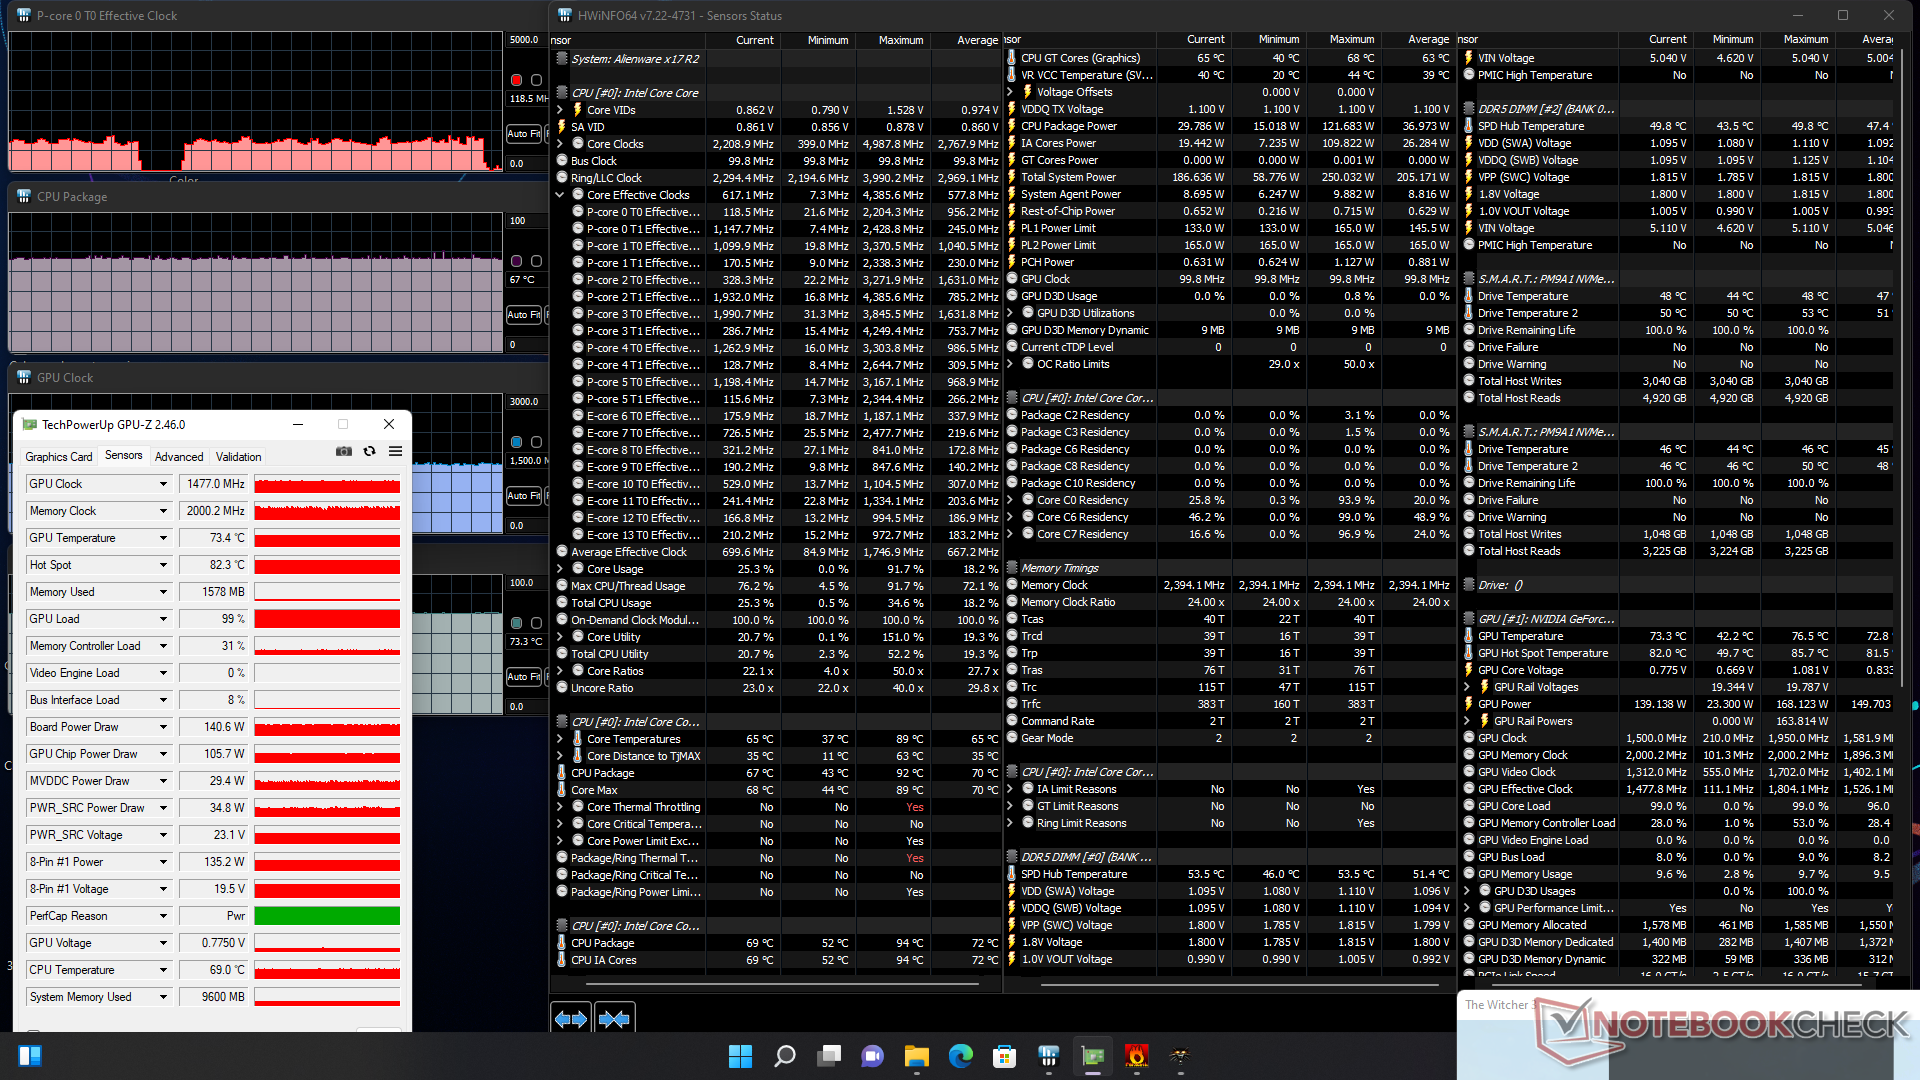
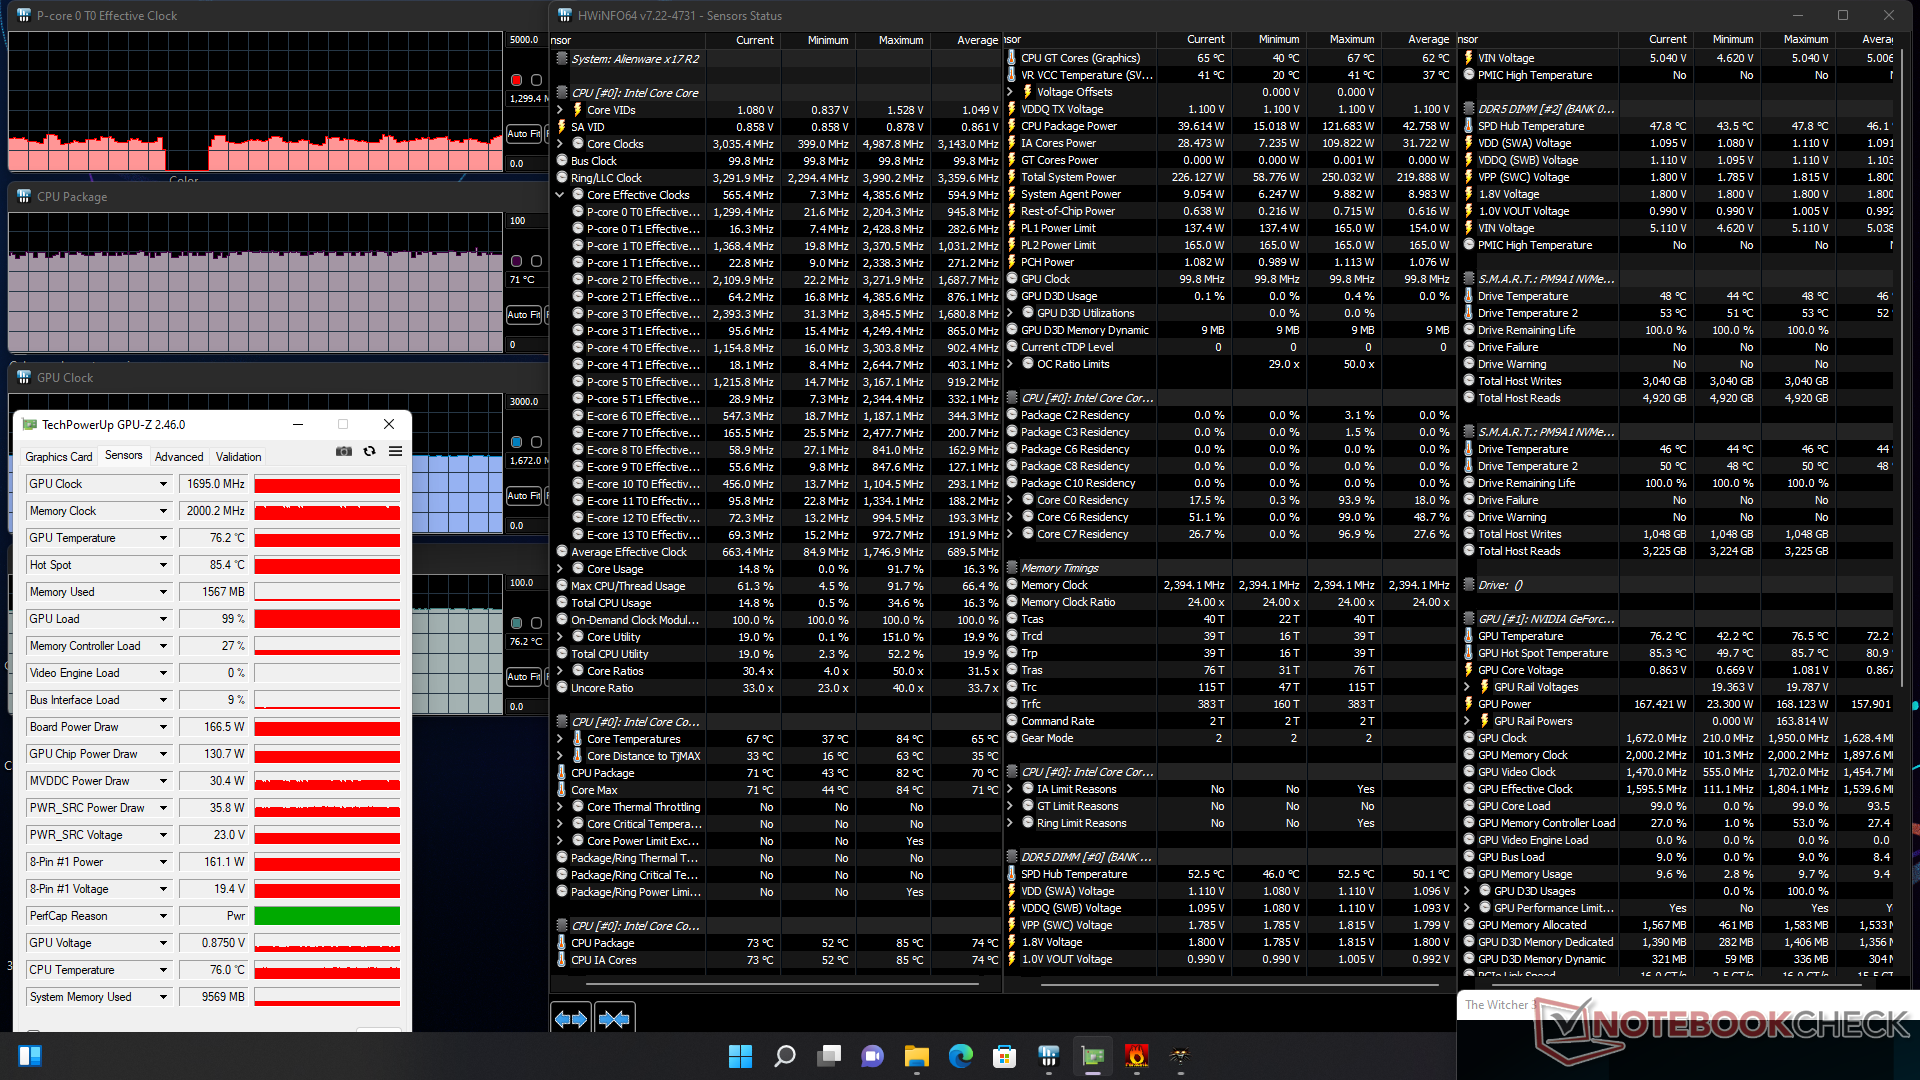
Die GPU-Taktrate, der Speichertakt und die Leistungsaufnahme der Karte würden sich bei 1.695 MHz, 2.000 MHz bzw. 167 W stabilisieren, wenn Witcher 3 im maximalen Lüftermodus läuft. Im Modus "Ausbalanciert" sinken der GPU-Takt und die Leistungsaufnahme der Karte auf 1.477 MHz bzw. 141 W. Daher müssen Benutzer den Modus mit maximalem Lüftergeräusch aushalten, wenn sie das volle Leistungspotenzial des x17 R2 nutzen wollen. Würde man den gleichen Test mit dem MSI GS77 durchführen, würden der GPU-Takt und der Speichertakt auf 1.432 MHz bzw. 1.750 MHz sinken.
Der Betrieb im Akkubetrieb schränkt die Leistung erheblich ein. Ein Fire-Strike-Test im Akkubetrieb würde Physik- und Grafik-Scores von 27.369 bzw. 12.095 Punkten liefern, verglichen mit 30.108 und 32.849 Punkten im Netzbetrieb.
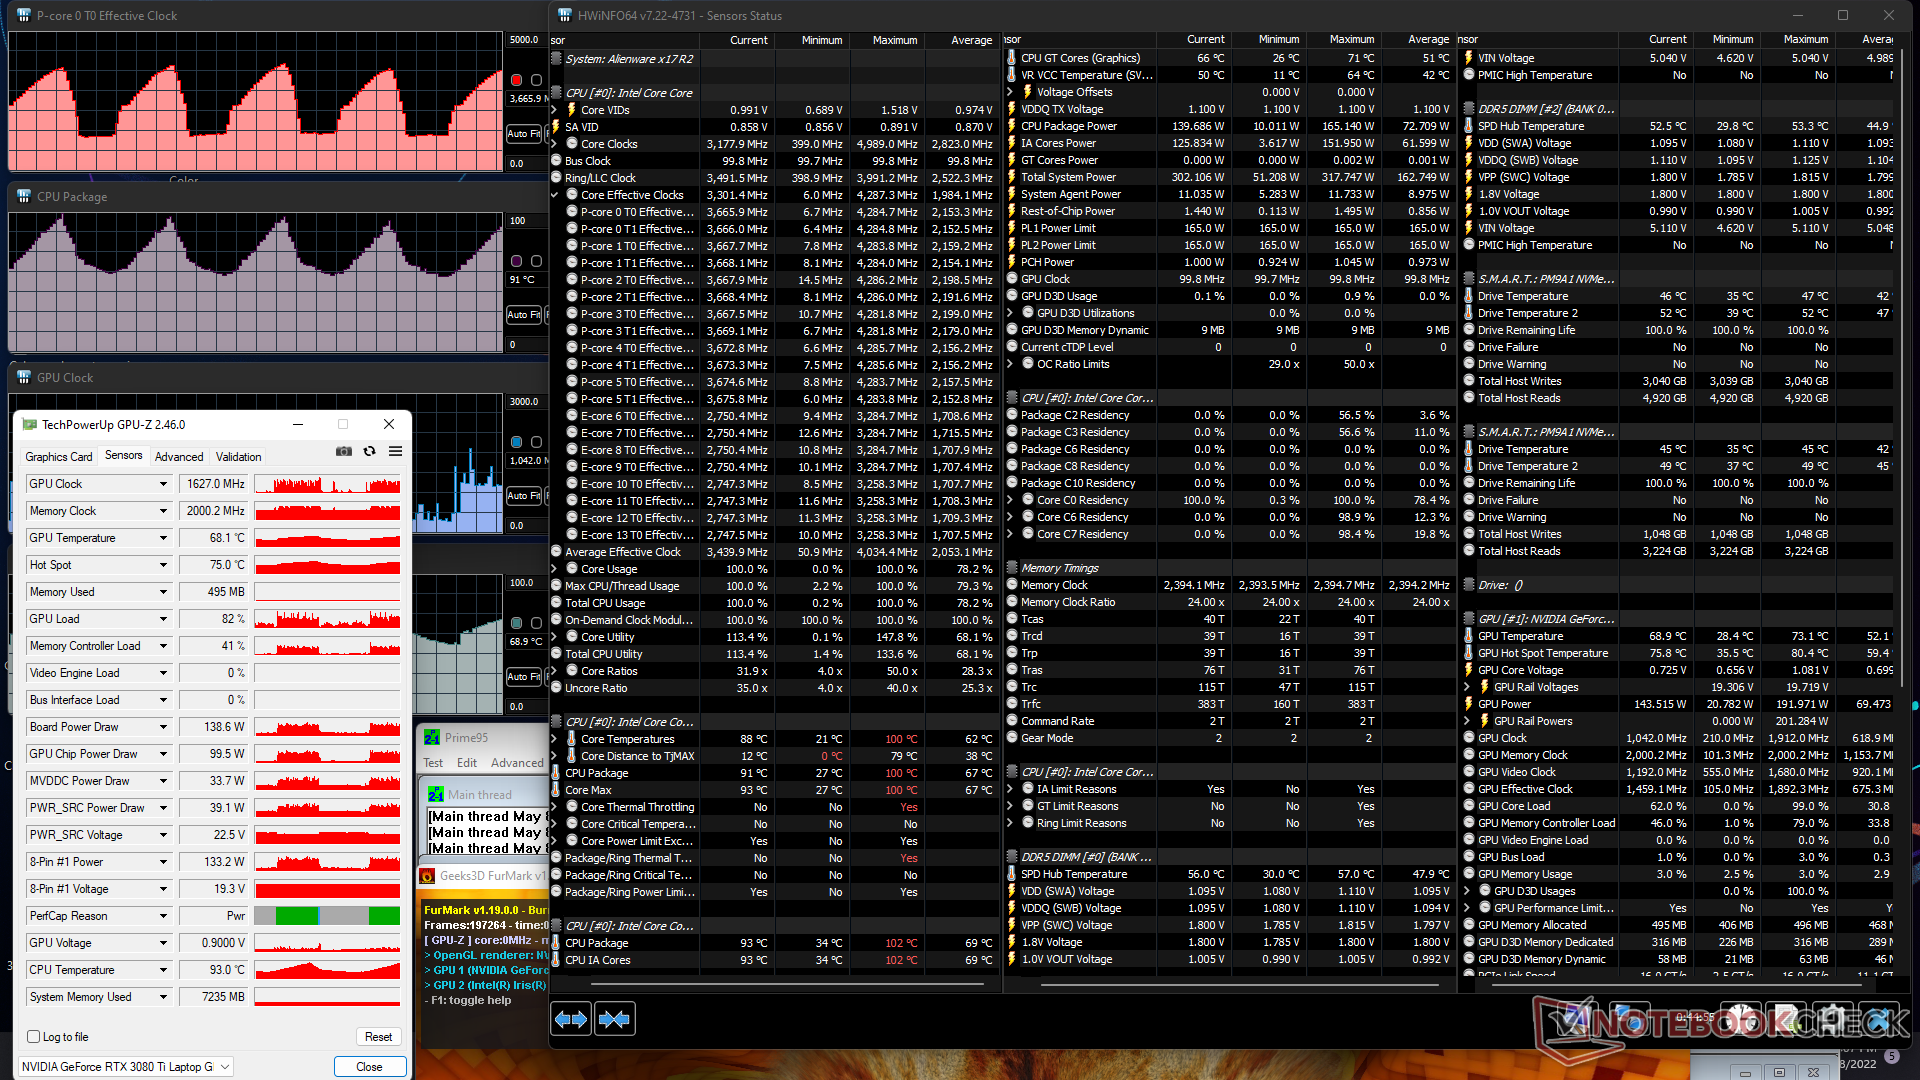
| CPU-Takt (GHz) | GPU-Takt (MHz) | durchschnittliche CPU-Temperatur (°C) | durchschnittliche GPU-Temperatur (°C) | |
| System Leerlauf (maximaler Lüftermodus) | -- | -- | 27 | 29 |
| Prime95 Stress (maximaler Lüftermodus) | 3,6 | -- | -- | 100 |
| Prime95 + FurMark Stress (maximaler Lüftermodus) | 1,4 - 3,7 | 337 - 1.770 | 53 - 100 | 49 - 71 |
| Witcher 3 Stress (ausgeglichener Modus) | ~0,6 | 1.477 | 67 | 73 |
| Witcher 3 Stress (maximaler Lüftermodus) | ~1,3 | 1.695 | 71 | 76 |
Lautsprecher
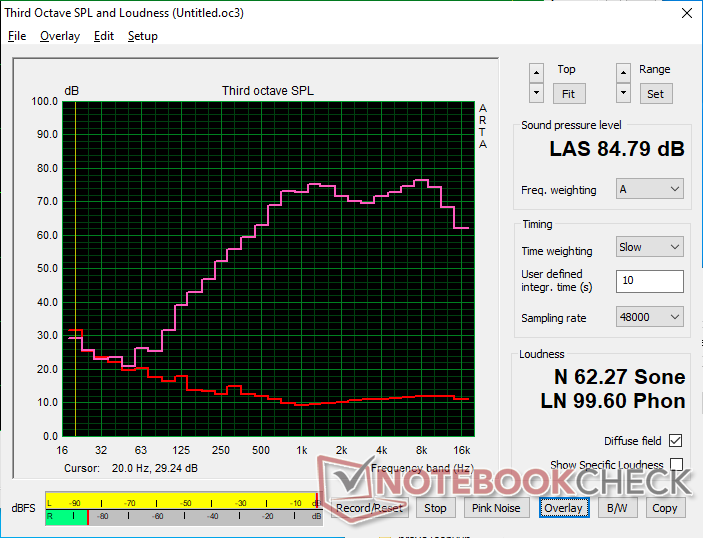
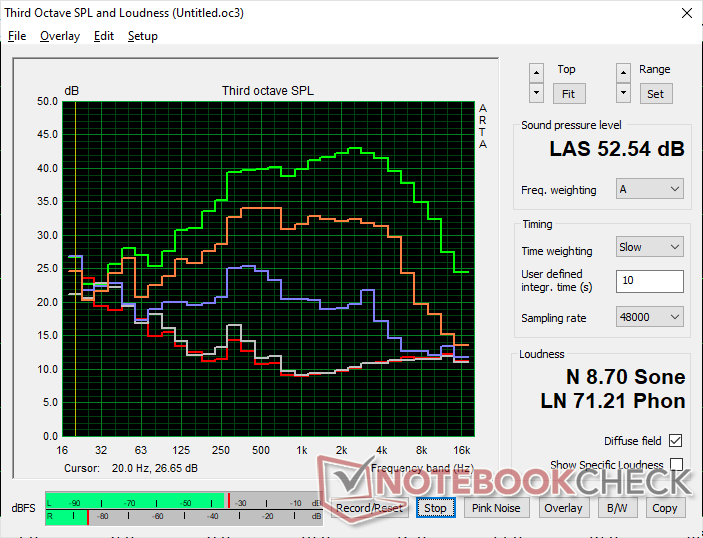
Alienware x17 R2 P48E Audio Analyse
(+) | Die Lautsprecher können relativ laut spielen (84.3 dB)
Bass 100 - 315 Hz
(±) | abgesenkter Bass - 9.7% geringer als der Median
(+) | lineare Bass-Wiedergabe (5.5% Delta zum Vorgänger)
Mitteltöne 400 - 2000 Hz
(+) | ausgeglichene Mitten, vom Median nur 1.6% abweichend
(+) | lineare Mitten (3% Delta zum Vorgänger)
Hochtöne 2 - 16 kHz
(±) | zu hohe Hochtöne, vom Median nur 5% abweichend
(±) | durchschnittlich lineare Hochtöne (7.6% Delta zum Vorgänger)
Gesamt im hörbaren Bereich 100 - 16.000 Hz
(+) | hörbarer Bereich ist sehr linear (9.3% Abstand zum Median
Im Vergleich zu allen Geräten derselben Klasse
» 3% aller getesteten Geräte dieser Klasse waren besser, 2% vergleichbar, 95% schlechter
» Das beste Gerät hat einen Delta-Wert von 6%, durchschnittlich ist 18%, das schlechteste Gerät hat 132%
Im Vergleich zu allen Geräten im Test
» 3% aller getesteten Geräte waren besser, 1% vergleichbar, 96% schlechter
» Das beste Gerät hat einen Delta-Wert von 4%, durchschnittlich ist 24%, das schlechteste Gerät hat 134%
Apple MacBook Pro 16 2021 M1 Pro Audio Analyse
(+) | Die Lautsprecher können relativ laut spielen (84.7 dB)
Bass 100 - 315 Hz
(+) | guter Bass - nur 3.8% Abweichung vom Median
(+) | lineare Bass-Wiedergabe (5.2% Delta zum Vorgänger)
Mitteltöne 400 - 2000 Hz
(+) | ausgeglichene Mitten, vom Median nur 1.3% abweichend
(+) | lineare Mitten (2.1% Delta zum Vorgänger)
Hochtöne 2 - 16 kHz
(+) | ausgeglichene Hochtöne, vom Median nur 1.9% abweichend
(+) | sehr lineare Hochtöne (2.7% Delta zum Vorgänger)
Gesamt im hörbaren Bereich 100 - 16.000 Hz
(+) | hörbarer Bereich ist sehr linear (4.6% Abstand zum Median
Im Vergleich zu allen Geräten derselben Klasse
» 0% aller getesteten Geräte dieser Klasse waren besser, 0% vergleichbar, 100% schlechter
» Das beste Gerät hat einen Delta-Wert von 5%, durchschnittlich ist 17%, das schlechteste Gerät hat 45%
Im Vergleich zu allen Geräten im Test
» 0% aller getesteten Geräte waren besser, 0% vergleichbar, 100% schlechter
» Das beste Gerät hat einen Delta-Wert von 4%, durchschnittlich ist 24%, das schlechteste Gerät hat 134%
Energieverwaltung
Stromverbrauch
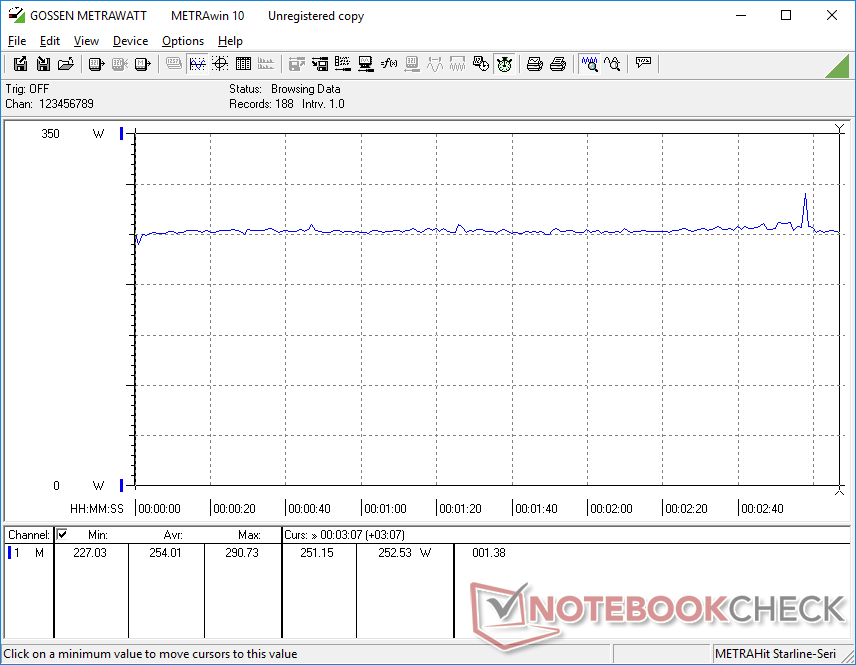
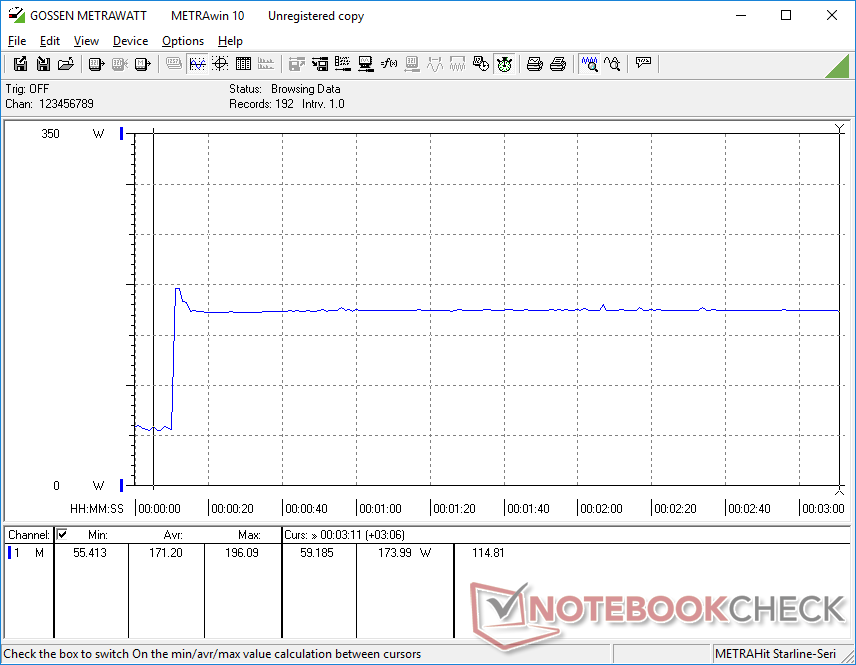
Alienware Notebooks waren schon immer stromhungriger als konkurrierende Alternativen, und das x17 R2 ist nicht anders. Allein im Leerlauf auf dem Desktop kann es bis zu 60 W verbrauchen, wenn es auf den Modus High Performance eingestellt ist, was mehr ist als bei den meisten Ultrabooks der U-Serie unter Last. Der sehr hohe Verbrauch ist wahrscheinlich für die schlechten Ergebnisse der Akkulaufzeit im nächsten Abschnitt verantwortlich.
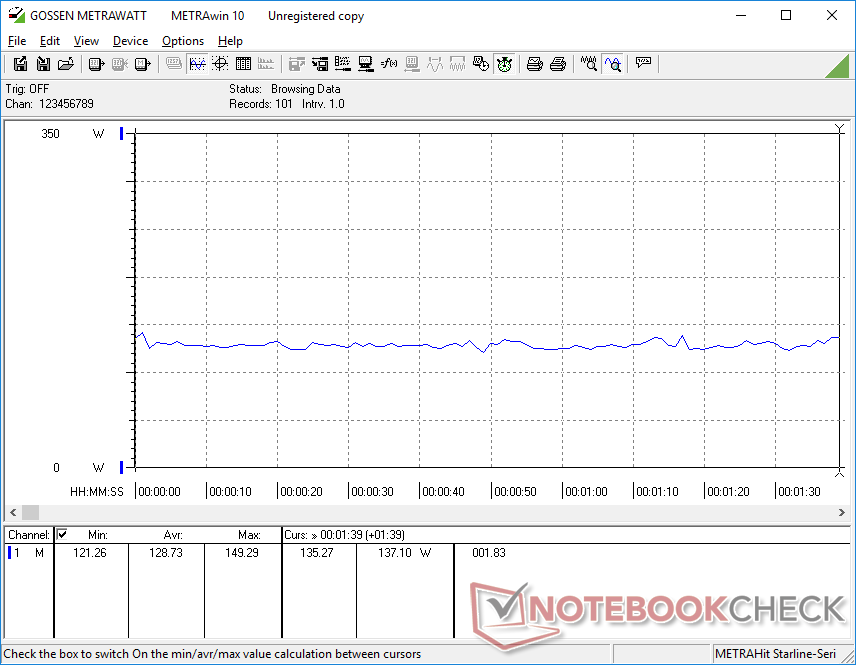
Die Ausführung von Witcher 3 verbraucht 54 Prozent mehr Strom als beim MSI GS77, obwohl beide mit Core-H-CPUs der 12. Generation und der gleichen GeForce RTX-3080-Ti-GPU ausgestattet sind. Im Gegenzug bietet das Alienware System eine bis zu 15 Prozent bzw. 25 Prozent schnellere CPU- und Grafikleistung als das konkurrierende MSI.
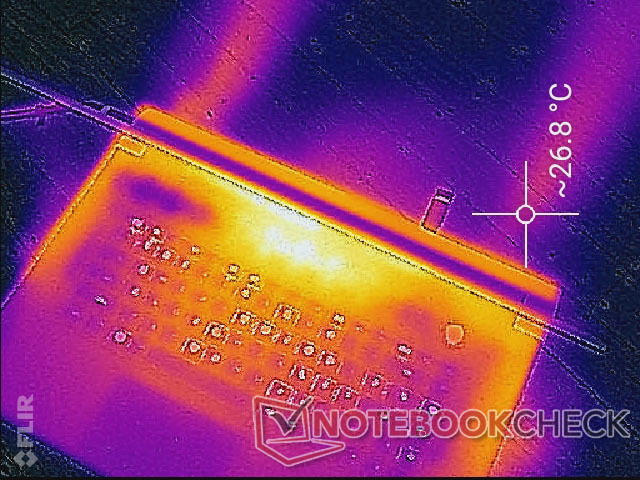
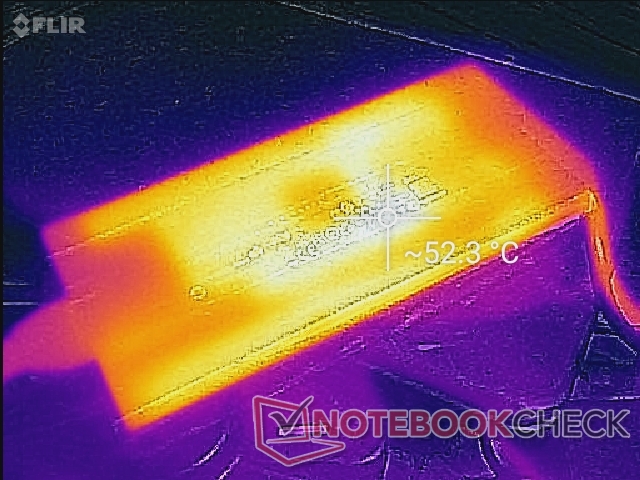
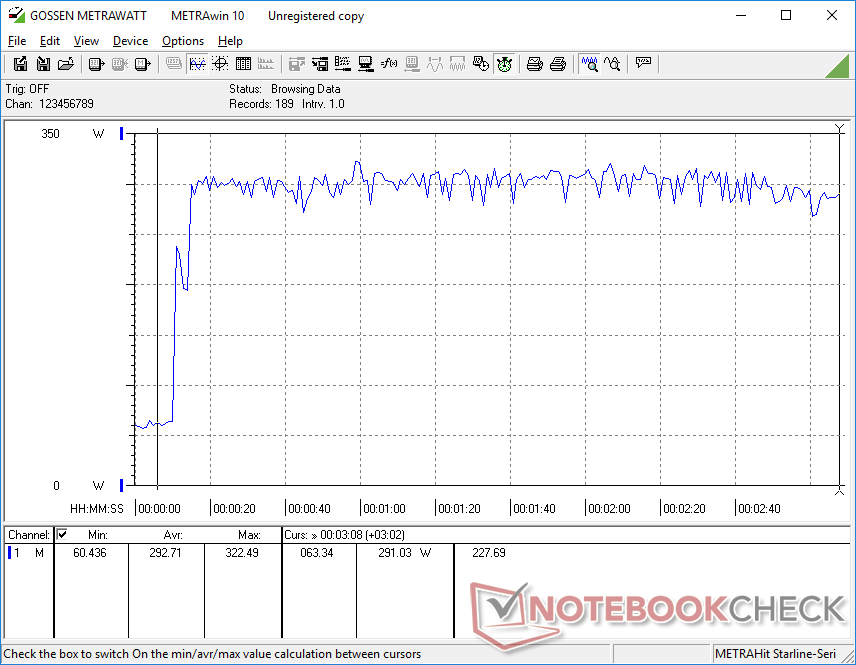
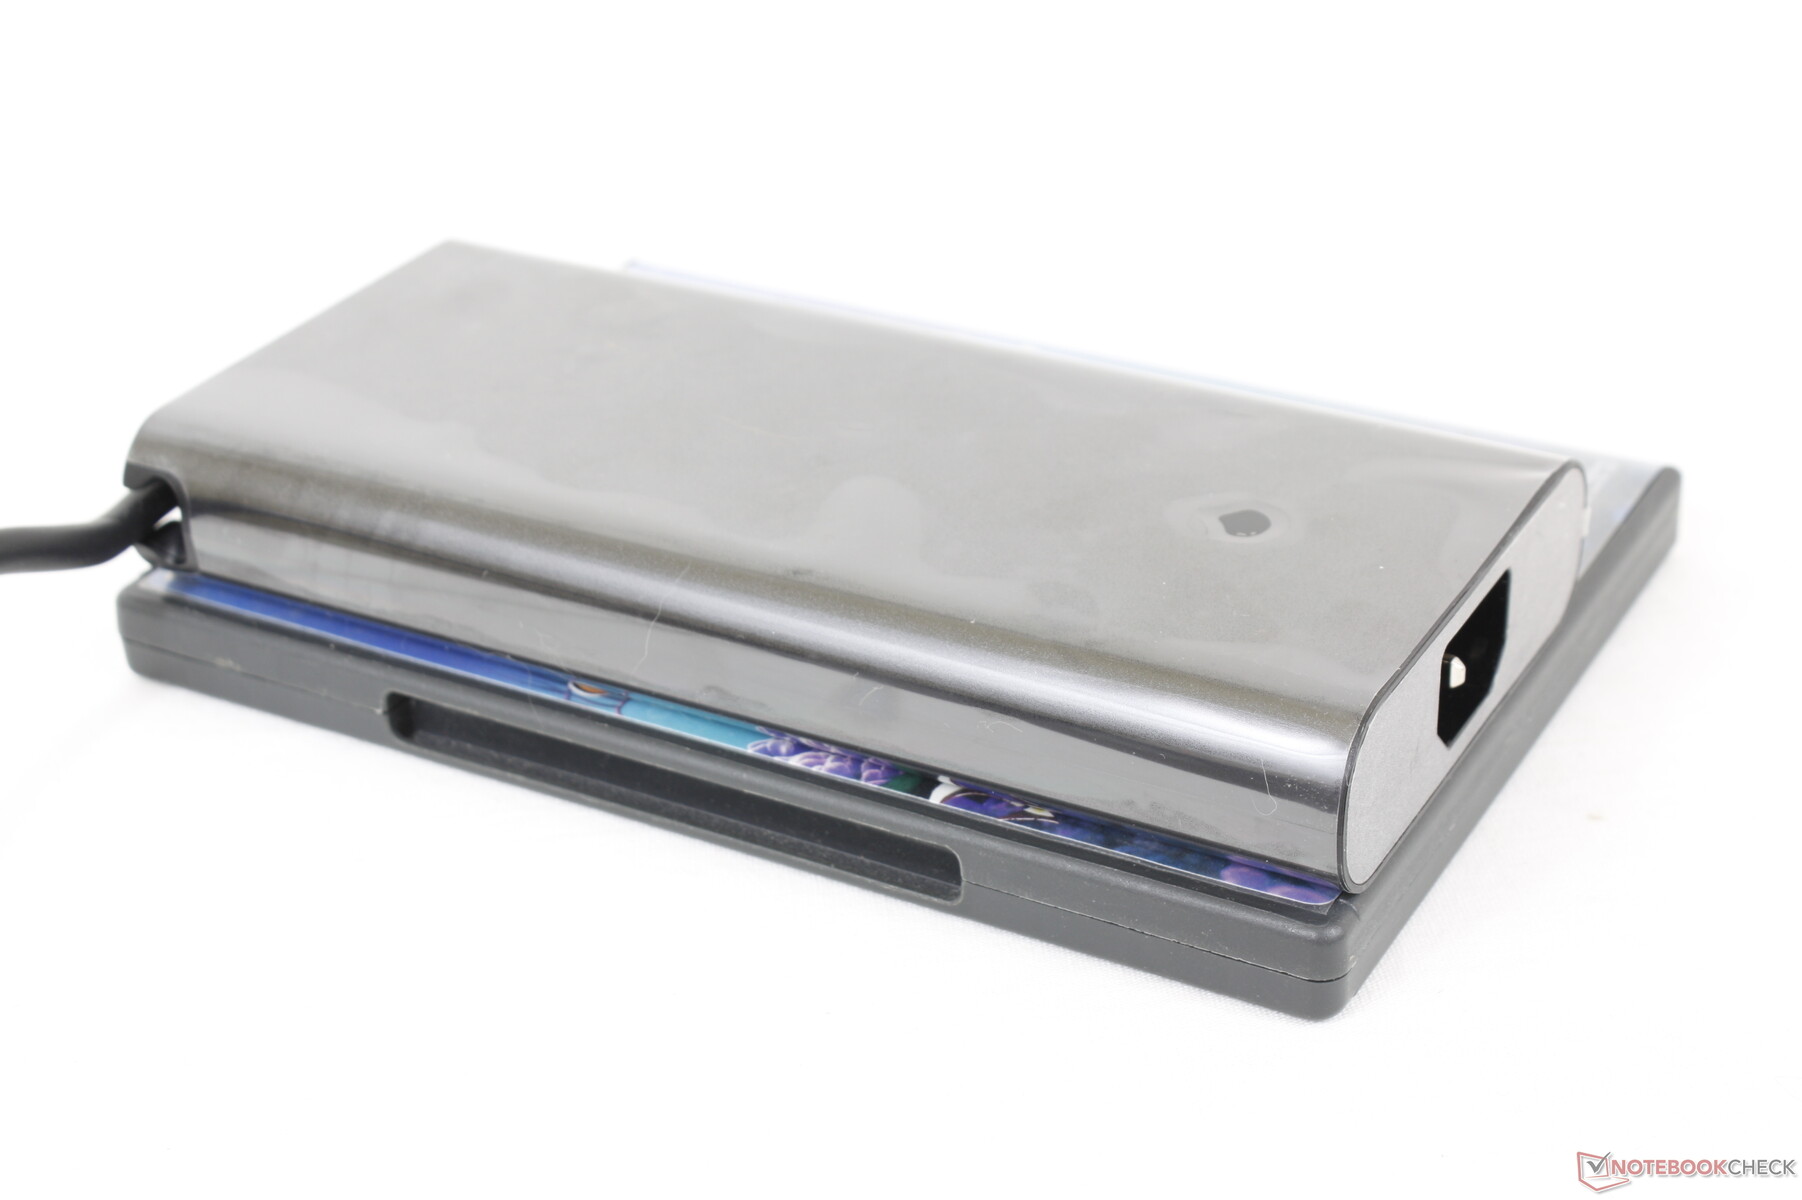
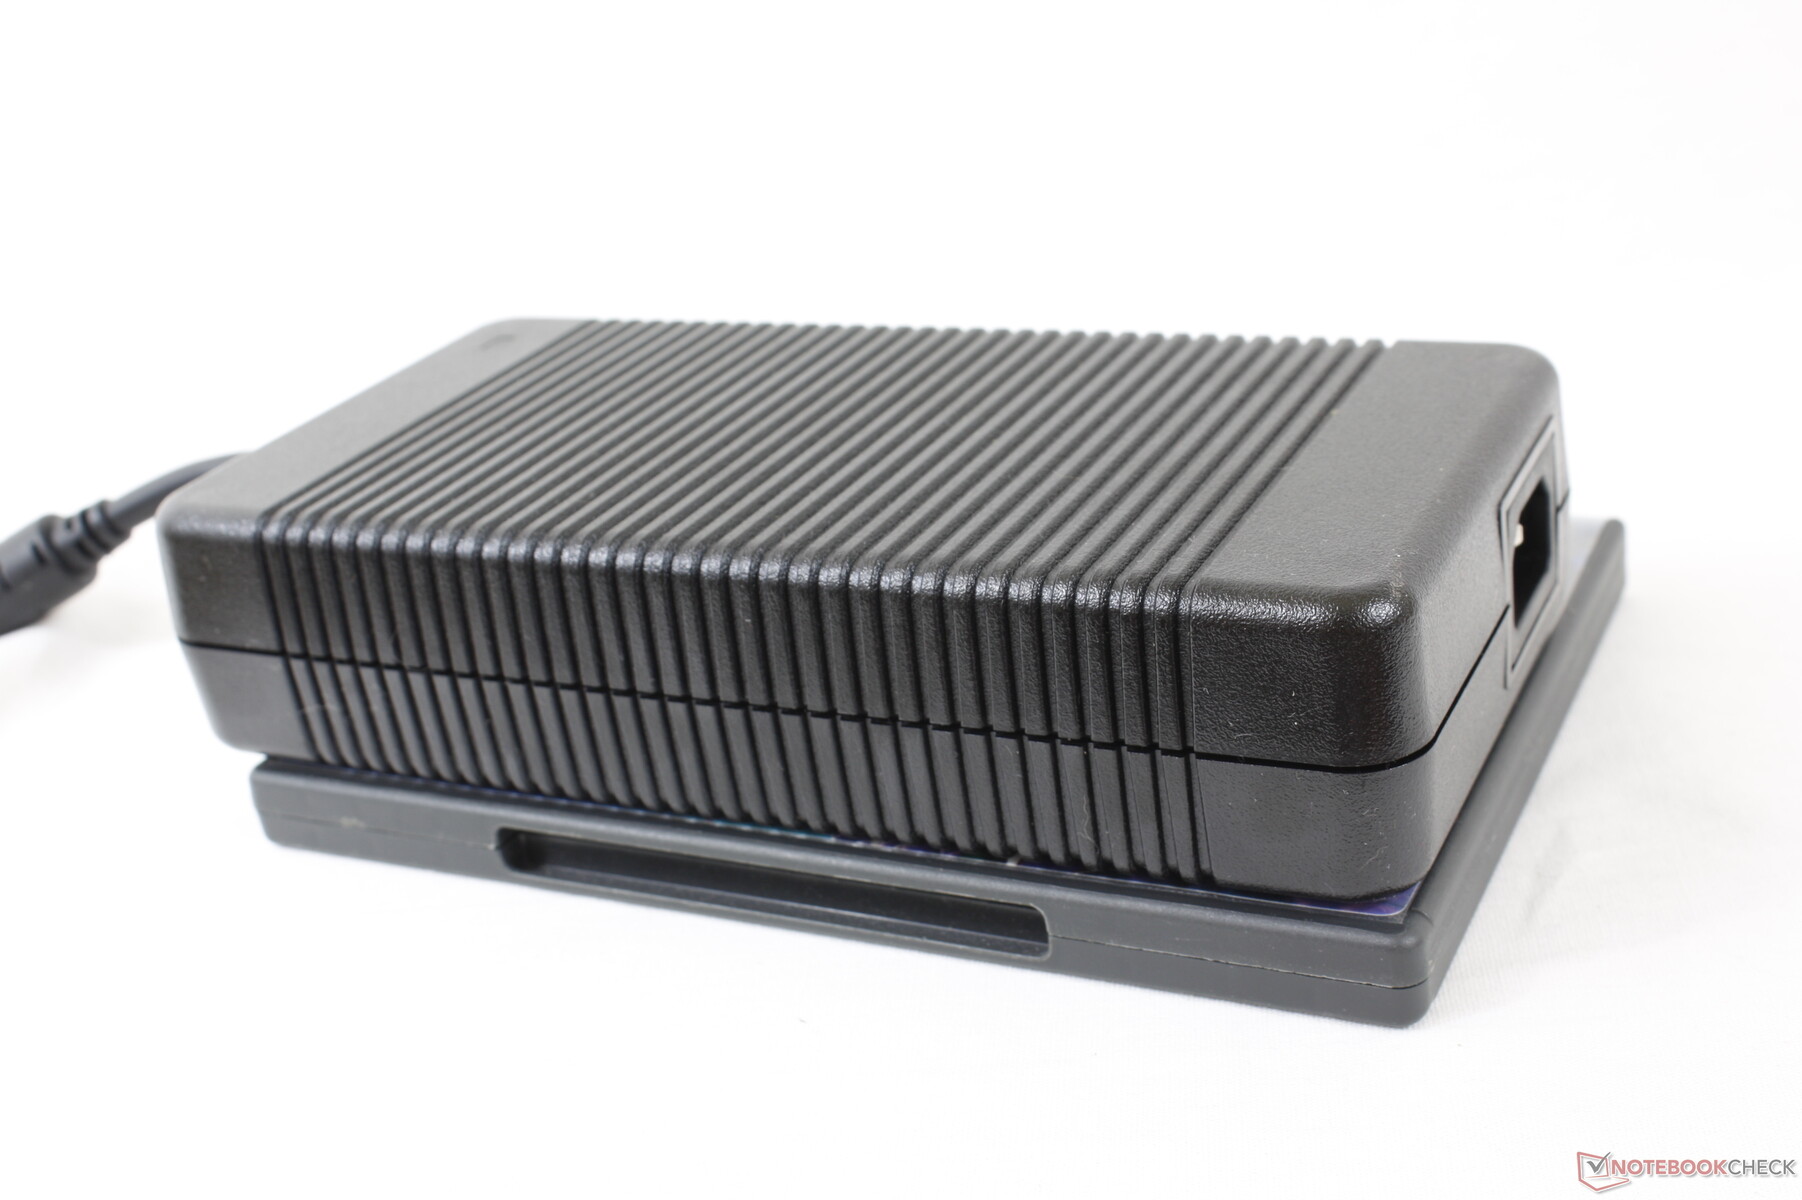
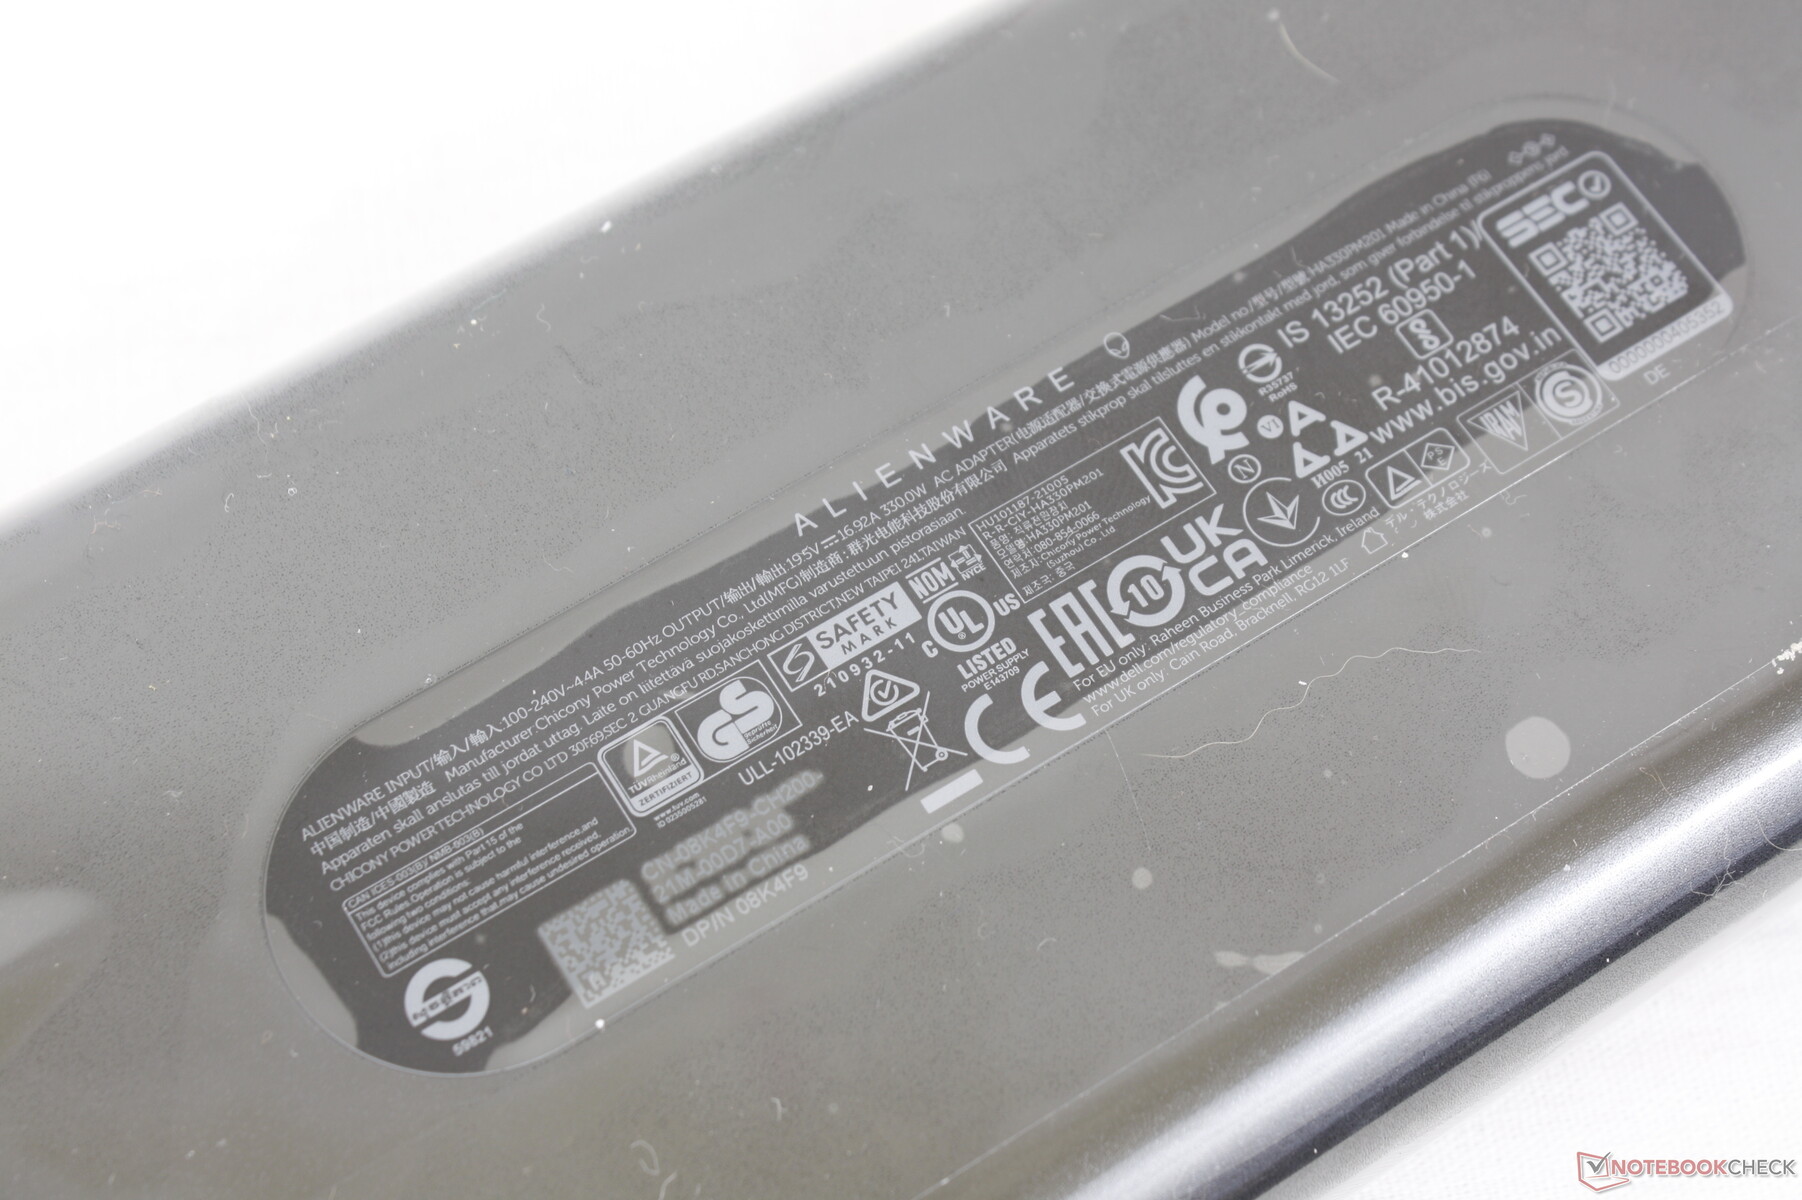
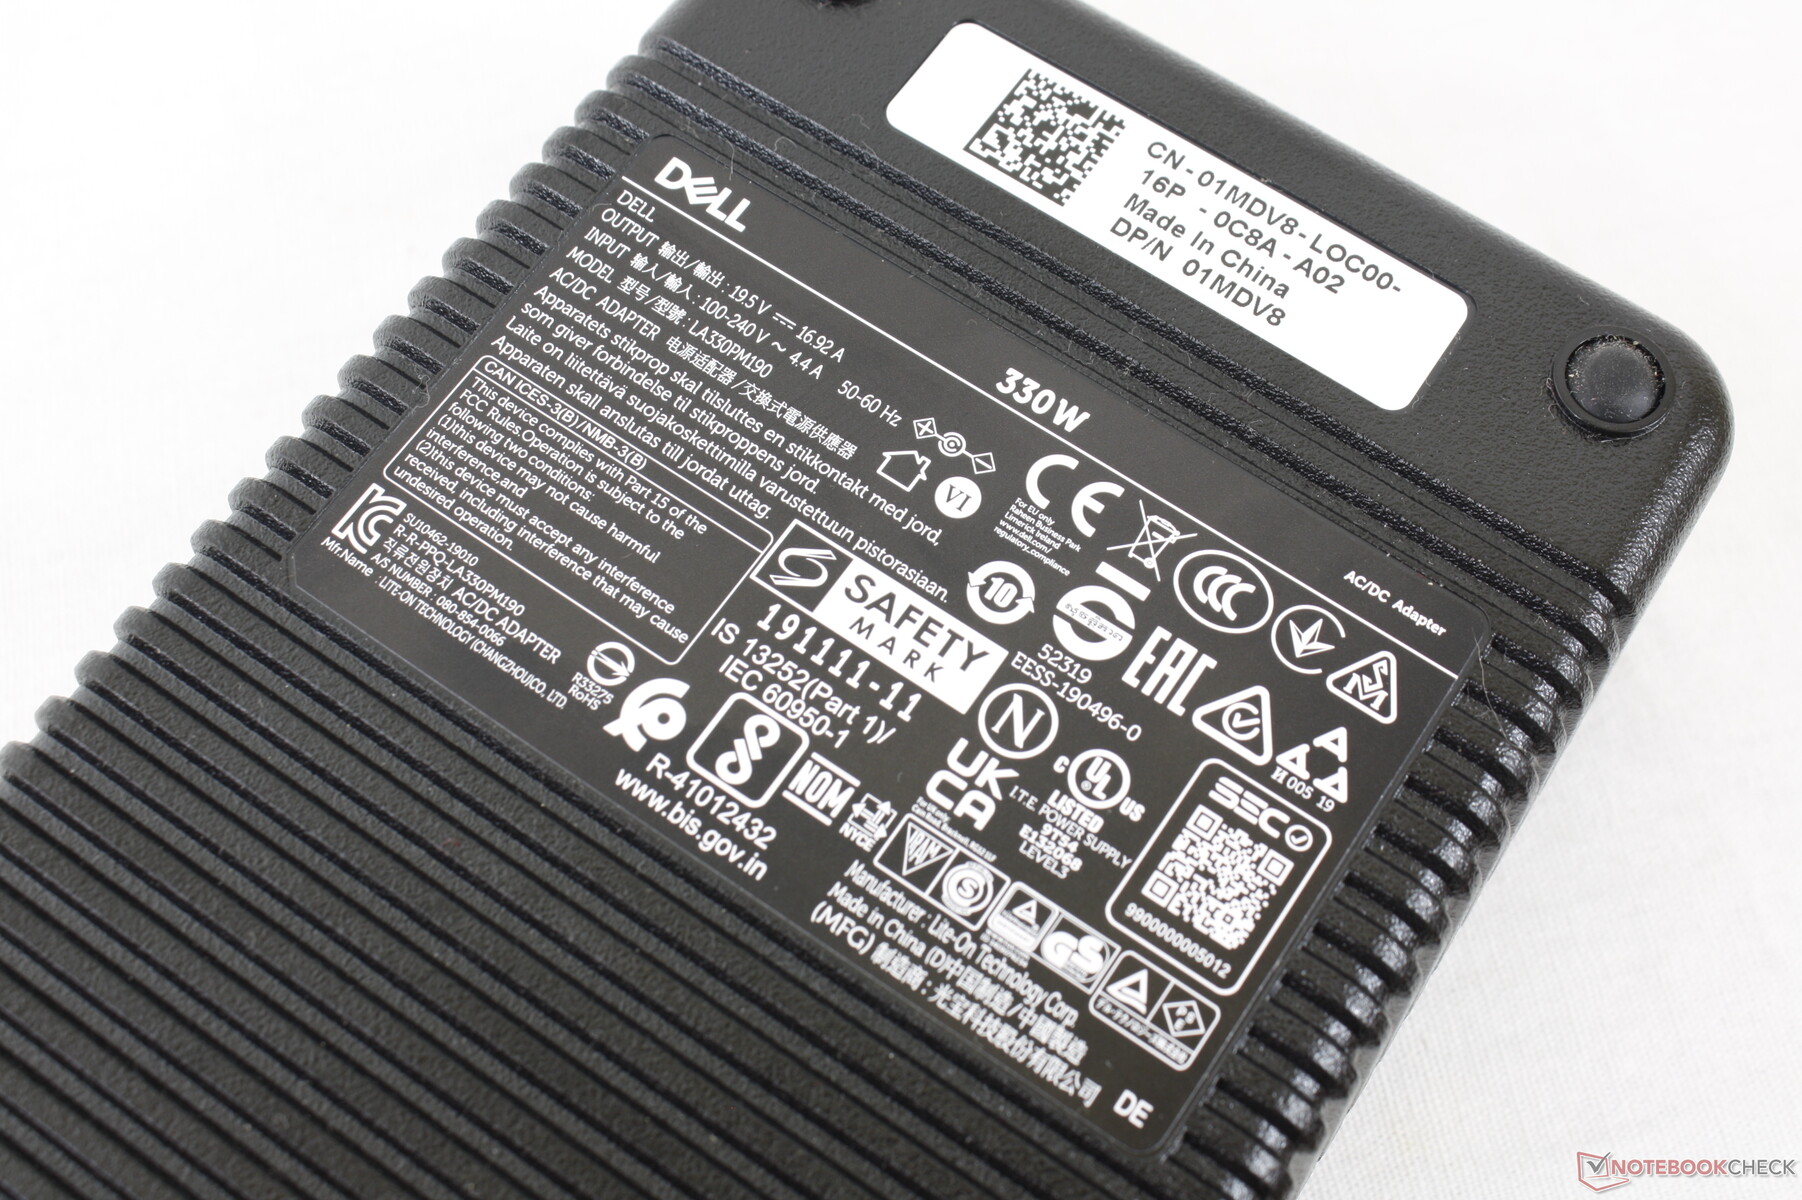
Wir konnten einen maximalen Verbrauch von 323 W aus dem 330-W-Netzteil aufzeichnen, wenn sowohl die CPU als auch die GPU zu 100 Prozent ausgelastet sind. Das Netzteil ist dieses Mal kleiner als das des letztjährigen x17 R1 (~18,3 x 8,7 x 2,5 cm vs. ~20 x 9,9 x 4,3 cm). Beachten Sie, dass die meisten anderen Gaming-Notebooks mit kleineren Netzteilen von deutlich unter 280 W ausgeliefert werden. Kleinere Alienware-x17-R2-Konfigurationen können mit noch kleineren Netzteilen ausgeliefert werden.
| Aus / Standby | |
| Idle | |
| Last |
|
Legende:
min: | |
| Alienware x17 R2 P48E i9-12900HK, GeForce RTX 3080 Ti Laptop GPU, 2x Samsung PM9A1 1TB (RAID 0), IPS, 1920x1080, 17.3" | Alienware x17 RTX 3080 P48E i7-11800H, GeForce RTX 3080 Laptop GPU, 2x WDC PC SN730 SDBPNTY-1T00 (RAID 0), IPS, 3840x2160, 17.3" | Asus ROG Zephyrus S17 GX703HSD i9-11900H, GeForce RTX 3080 Laptop GPU, Samsung PM9A1 MZVL22T0HBLB, IPS, 2560x1440, 17.3" | MSI Stealth GS77 12UHS-083US i7-12700H, GeForce RTX 3080 Ti Laptop GPU, Micron 3400 1TB MTFDKBA1T0TFH, IPS, 2560x1440, 17.3" | MSI GT76 Titan DT 10SGS i9-10900K, GeForce RTX 2080 Super Mobile, 2x WDC PC SN730 SDBPNTY-1T00 (RAID 0), IPS, 3840x2160, 17.3" | Gigabyte A7 X1 R9 5900HX, GeForce RTX 3070 Laptop GPU, ESR512GTLCG-EAC-4, IPS, 1920x1080, 17.3" | |
|---|---|---|---|---|---|---|
| Stromverbrauch | 22% | 22% | 30% | -15% | 38% | |
| Idle min * (Watt) | 24.1 | 10.2 58% | 21.7 10% | 20 17% | 25.9 -7% | 12 50% |
| Idle avg * (Watt) | 28.5 | 21.2 26% | 27 5% | 21.4 25% | 38 -33% | 14 51% |
| Idle max * (Watt) | 60 | 48.4 19% | 33 45% | 27 55% | 53.2 11% | 19 68% |
| Last avg * (Watt) | 128.7 | 118.7 8% | 108 16% | 100.5 22% | 123.8 4% | 118 8% |
| Witcher 3 ultra * (Watt) | 254 | 249 2% | 195 23% | 165 35% | 312.5 -23% | 205 19% |
| Last max * (Watt) | 323 | 262 19% | 210 35% | 247.1 23% | 459.8 -42% | 229 29% |
* ... kleinere Werte sind besser
Power Consumption Witcher 3 / Stresstest
Power Consumption external Monitor
Akkulaufzeit
Die Akkulaufzeiten gehören zu den schlechtesten, die wir je bei einem Gaming-Laptop gesehen haben. Selbst im Leerlauf auf dem Desktop bei niedrigster Helligkeitseinstellung, niedrigstem Energieprofil und aktiver Optimus-Grafik hält es nur knapp vier Stunden durch. Im Vergleich zu über sieben Stunden beim Asus ROG Zephyrus S17 kann man mit nur zwei Stunden WLAN-Surfen im Alltag rechnen.
Das Aufladen von leerer zu voller Kapazität dauert etwa 100 Minuten. Nutzer können das Gerät auch mit USB-C-Adaptern von Drittanbietern aufladen.
| Alienware x17 R2 P48E i9-12900HK, GeForce RTX 3080 Ti Laptop GPU, 87 Wh | Alienware x17 RTX 3080 P48E i7-11800H, GeForce RTX 3080 Laptop GPU, 87 Wh | Asus ROG Zephyrus S17 GX703HSD i9-11900H, GeForce RTX 3080 Laptop GPU, 90 Wh | MSI Stealth GS77 12UHS-083US i7-12700H, GeForce RTX 3080 Ti Laptop GPU, 99 Wh | MSI GT76 Titan DT 10SGS i9-10900K, GeForce RTX 2080 Super Mobile, 90 Wh | Gigabyte A7 X1 R9 5900HX, GeForce RTX 3070 Laptop GPU, 48.96 Wh | |
|---|---|---|---|---|---|---|
| Akkulaufzeit | 91% | 257% | 154% | 20% | 93% | |
| Idle (h) | 3.9 | 7 79% | 10.8 177% | |||
| WLAN (h) | 2 | 5.9 195% | 7.5 275% | 6.2 210% | 2.4 20% | 4.7 135% |
| Last (h) | 0.8 | 0.8 0% | 2.7 238% | 1.4 75% | 1.2 50% | |
| H.264 (h) | 7.2 | |||||
| Witcher 3 ultra (h) | 1 |
Pro
Contra
Fazit - Ein höherer TGP bedeutet eine höhere Performance
Als Nvidia die GeForce RTX 3080 Ti für Laptops ankündigte, waren wir enttäuscht, dass einige Modelle auf sehr niedrige TGP-Werte von nur ca. 100 W abzielen würden. Das Alienware x17 R2 erkennt diesen Kompromiss und zielt stattdessen auf einen deutlich höheren TGP-Wert von 175 W ab, was einen Leistungsschub von etwa 30 % gegenüber Laptops mit einer ~100 W GeForce RTX 3080 Ti wie dem Razer Blade 15 oder Gigabyte Aero YE5. Ähnliche Ergebnisse sind auch bei der CPU zu finden. Dieser einzelne Aspekt des Alienware ist vielleicht das größte Unterscheidungsmerkmal zwischen ihm und anderen ultradünnen Gaming-Laptops.
Natürlich hat der Ansatz "Leistung um jeden Preis" auch seine Nachteile: Vor allem der Stromverbrauch geht durch die Decke, und die Akkulaufzeit leidet darunter, selbst wenn man die niedrigsten Leistungseinstellungen wählt. Außerdem ist das System spürbar schwerer bzw. größer als andere ultradünne Gaming-Laptops, obwohl das Gehäuse immer noch als ultradünn gilt. Auch die Positionierung der Anschlüsse ist etwas gewöhnungsbedürftig.
Wenn Sie die Leistung maximieren wollen, ohne sich für riesige Gaming-Laptops wie die MSI-GT-Serie, Asus ROG-Chimera-Serie oder die Alienware Area-51m-Serie zu entscheiden, dann ist das Alienware x17 R2 und seine überraschend zufriedenstellende mechanische Tastatur eine Überlegung wert.
Preis und Verfügbarkeit
Alienware x17 R2 P48E
- 11.05.2022 v7 (old)
Allen Ngo
Preisvergleich

