Test Razer Blade 17 2022 Core i7 RTX 3080 Ti Laptop: Geboostete Leistung
Man kann sich darauf verlassen, dass jedes Mal dann, wenn Intel und Nvidia neue Chips auf den Markt bringen, Razer die Blade-Reihe mit dem neuesten CPU- und GPU-Optionen aktualisiert. Beim Blade 17 2022 ersetzen die Alder-Lake-H-Prozessoren aus Intels 12. Prozessorgeneration und die GeForce RTX 3070 Ti bzw. 3080 Ti die Tiger-Lake-H-CPUs aus der 11. Generation und die RTX-3070- bzw. 3080- Optionen des Blade 17 2021 aus dem Vorjahr. Wie wir in unserer Alder-Lake-Übersicht erwähnt haben, verfügt die CPUs aus Intels 12. Generation über leistungsfähige P- und effiziente E-Kerne, während die mobile GeForce-Ti-Reihe mehr Leistung aus dem gleichen Nvidia-Ampere-Chipsatz herauskitzelt.
Bei unserem Blade-17-Testgerät handelt es sich um eine sehr leistungsfähige Konfiguration mit dem Core i7-12800H, einer RTX 3080 Ti und einem 240-Hz-QHD-Panel für ca. 4.300 Euro. Andere Modelle mit RTX 3060 oder RTX 3070 Ti, FHD- oder UHD-Displays und dem Core i9-12900H sind ebenfalls verfügbar. Im Gegensatz zur 100-W-GPU im Blade 17 mit Intels 10.-Gen.-CPUs und der 130-W-GPU im Blade 17 mit Intels 11.-Gen.-CPUs steckt im aktuellen Blade 17 mit Intels 12.-Gen.-CPU eine GPU mit einer noch höheren TGP von 165 W, was ihr eine potenziell noch größeres Leistungspotenzial ermöglicht.
Zu den Alternativen des Blade 17 zählen andere, ultradünne Gaming-Laptops wie das MSI GS76 bzw. GS77, Asus Zephyrus S17, Aorus 17G, Alienware x17 und das Maingear Vector Pro.
Weitere Razer-Tests:
Mögliche Konkurrenten im Vergleich
Bew. | Datum | Modell | Gewicht | Dicke | Größe | Auflösung | Preis ab |
|---|---|---|---|---|---|---|---|
| 91.2 % v7 (old) | 04 / 2022 | Razer Blade 17 RTX 3080 Ti i7-12800H, GeForce RTX 3080 Ti Laptop GPU | 2.7 kg | 19.9 mm | 17.30" | 2560x1440 | |
| 87.8 % v7 (old) | 02 / 2021 | Razer Blade Pro 17 2021 (QHD Touch) i7-10875H, GeForce RTX 3080 Laptop GPU | 3 kg | 19.9 mm | 17.30" | 3840x2160 | |
| 86.2 % v7 (old) | 09 / 2021 | MSI GS76 Stealth 11UH i9-11900H, GeForce RTX 3080 Laptop GPU | 2.4 kg | 20 mm | 17.30" | 3840x2160 | |
| 90.1 % v7 (old) | 07 / 2021 | Asus ROG Zephyrus S17 GX703HSD i9-11900H, GeForce RTX 3080 Laptop GPU | 2.8 kg | 19.9 mm | 17.30" | 2560x1440 | |
| 86 % v7 (old) | 06 / 2021 | Aorus 17G YD i7-11800H, GeForce RTX 3080 Laptop GPU | 2.8 kg | 26 mm | 17.30" | 1920x1080 | |
| 89 % v7 (old) | 09 / 2021 | Alienware x17 RTX 3080 P48E i7-11800H, GeForce RTX 3080 Laptop GPU | 3.2 kg | 21.4 mm | 17.30" | 3840x2160 |
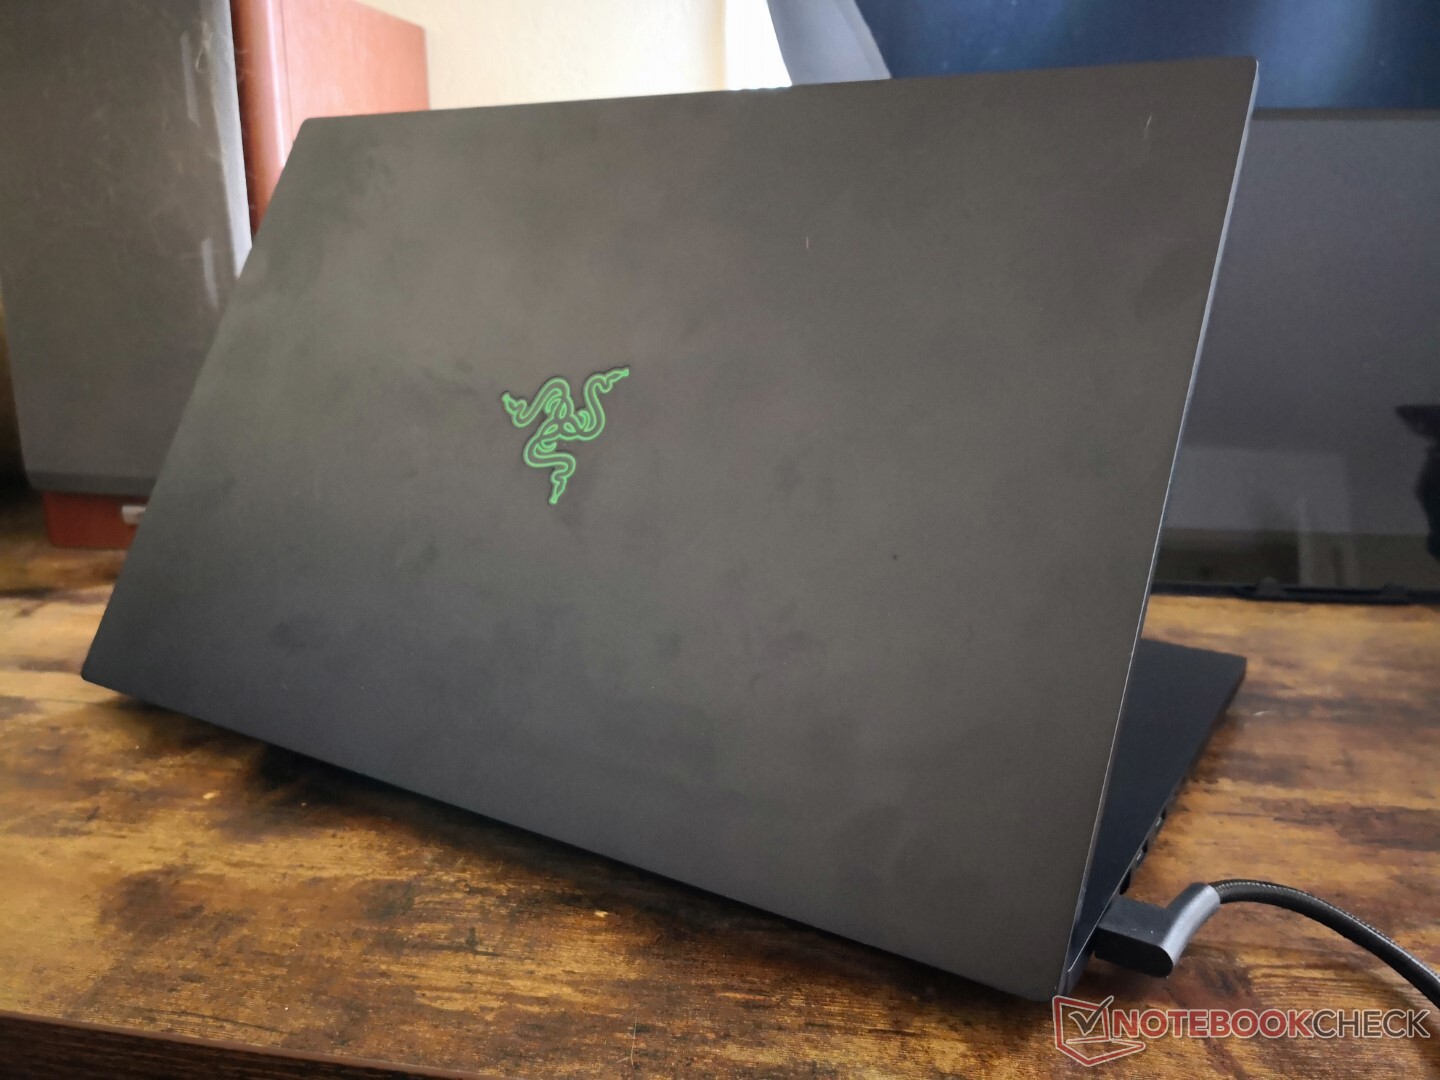
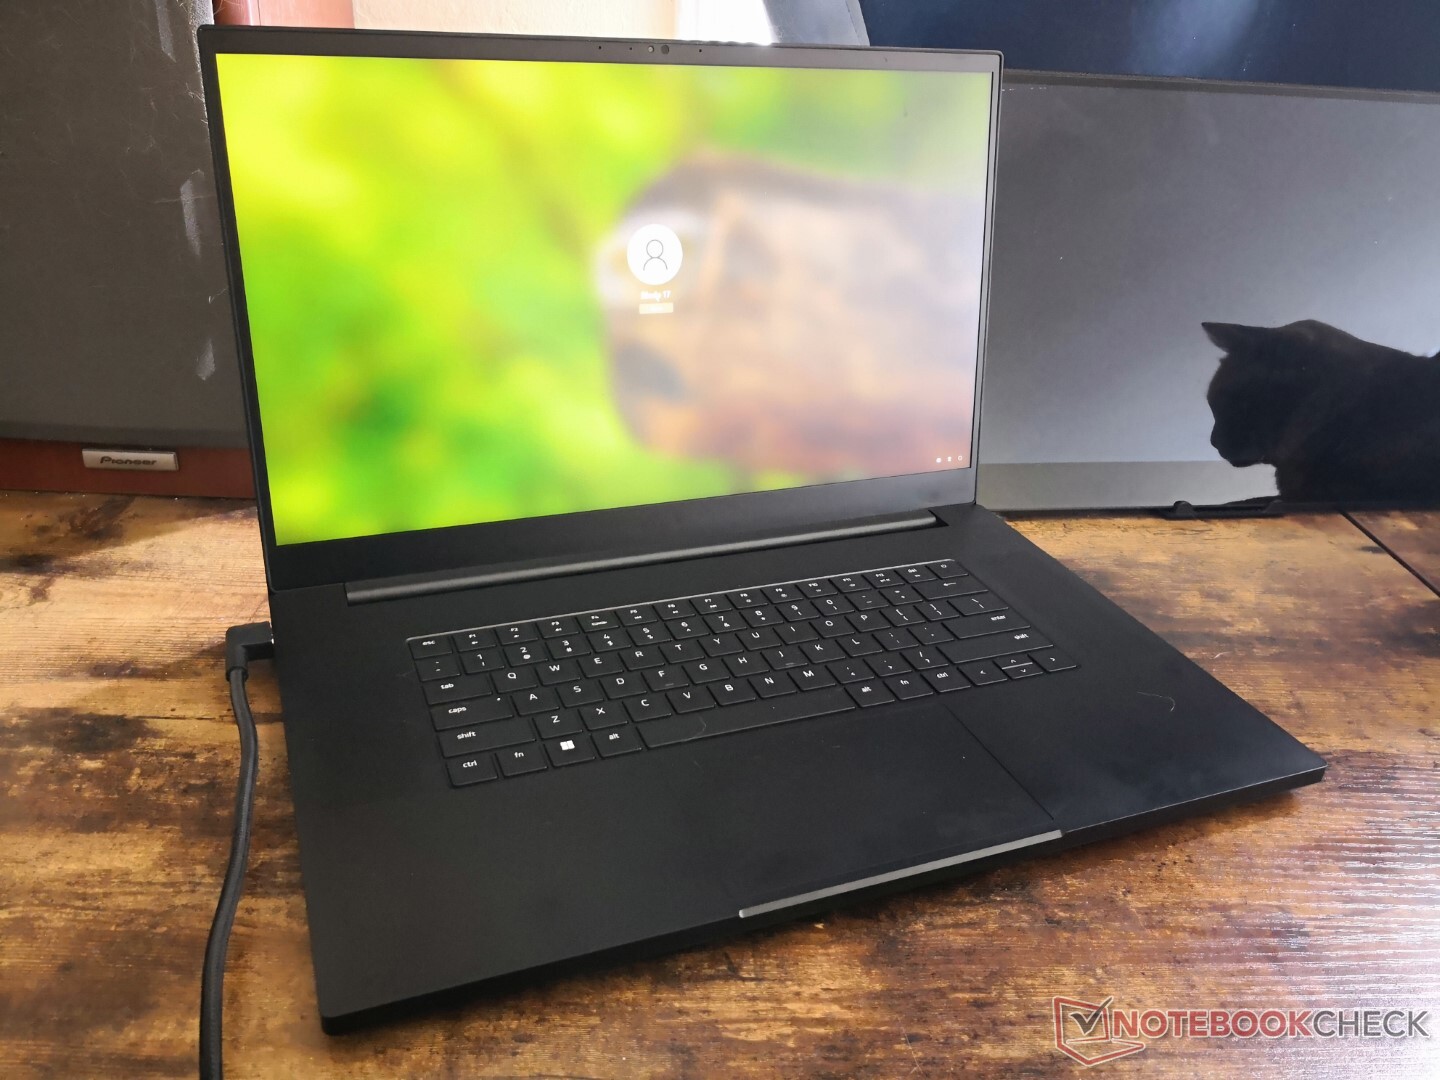
Gehäuse — Identisch, bis auf...
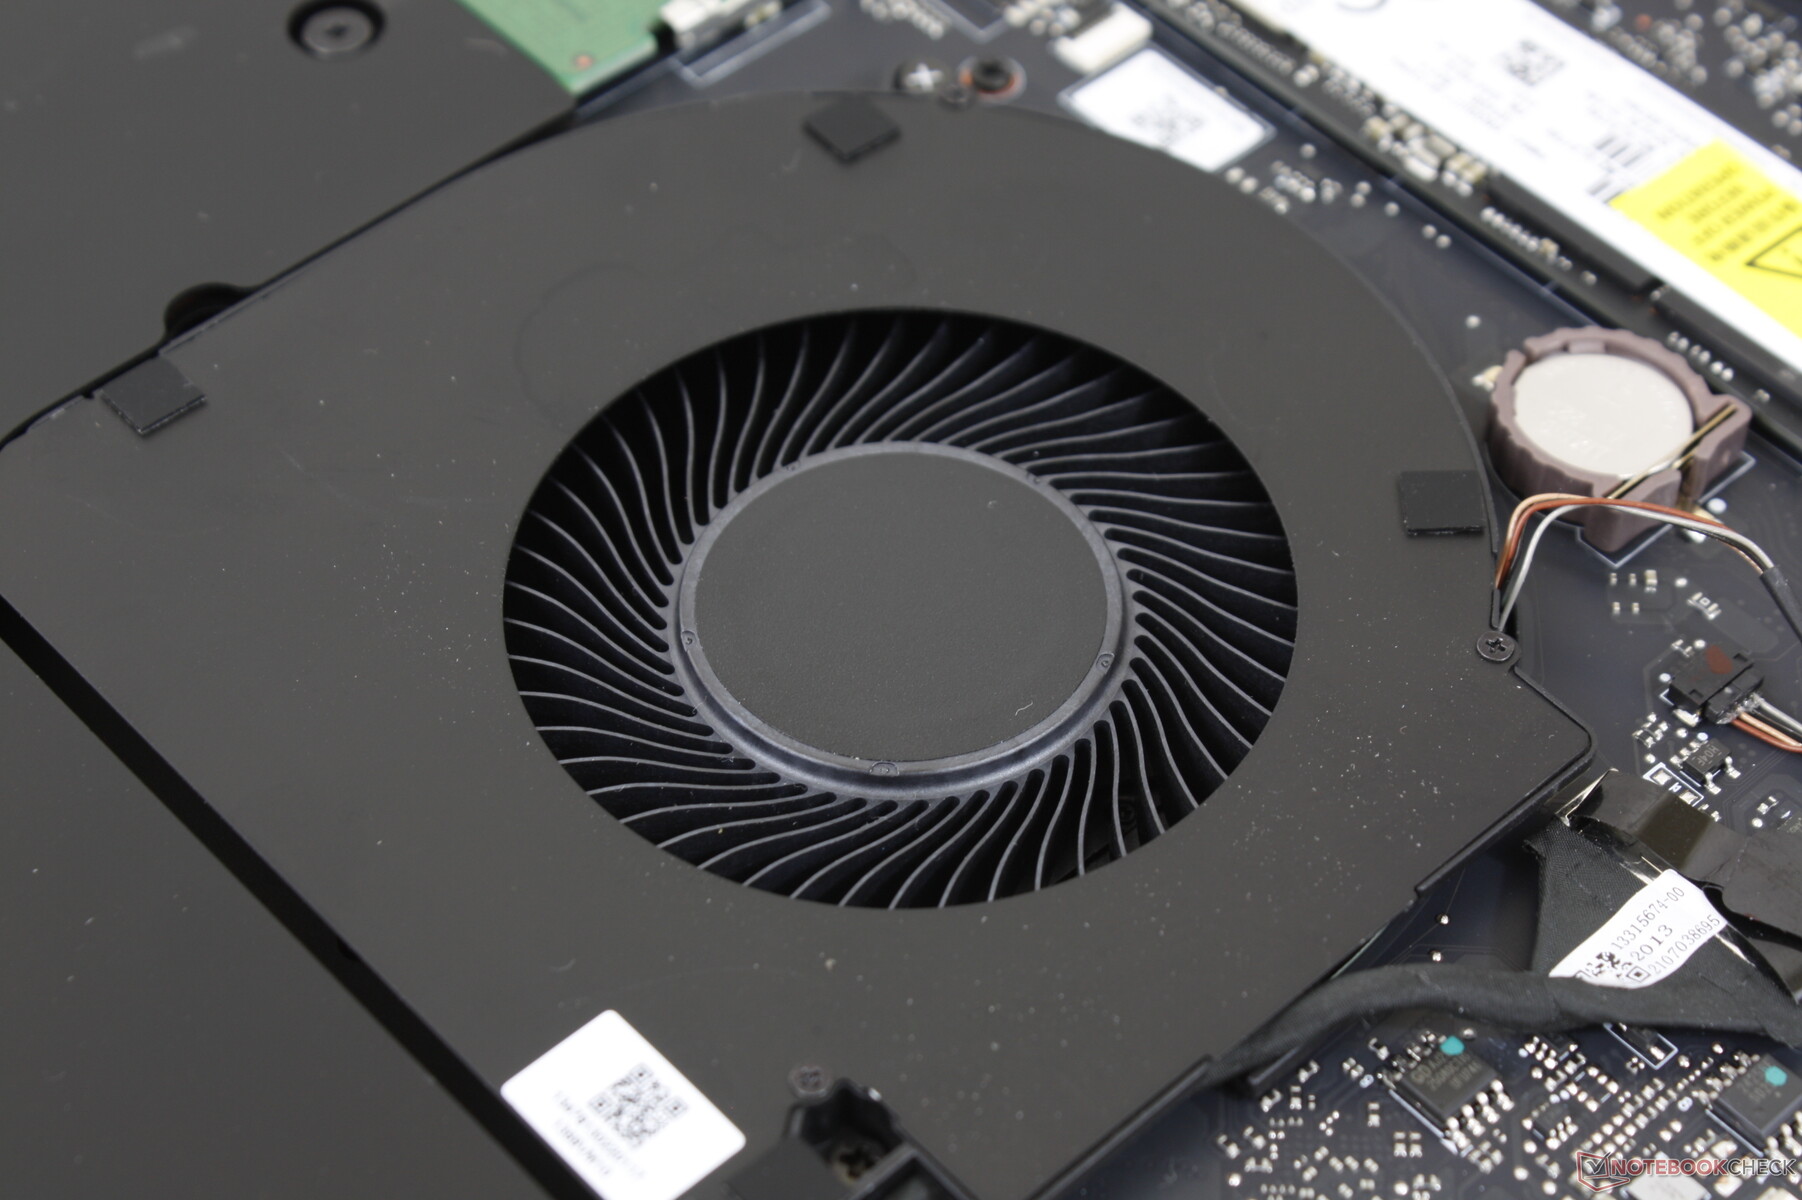
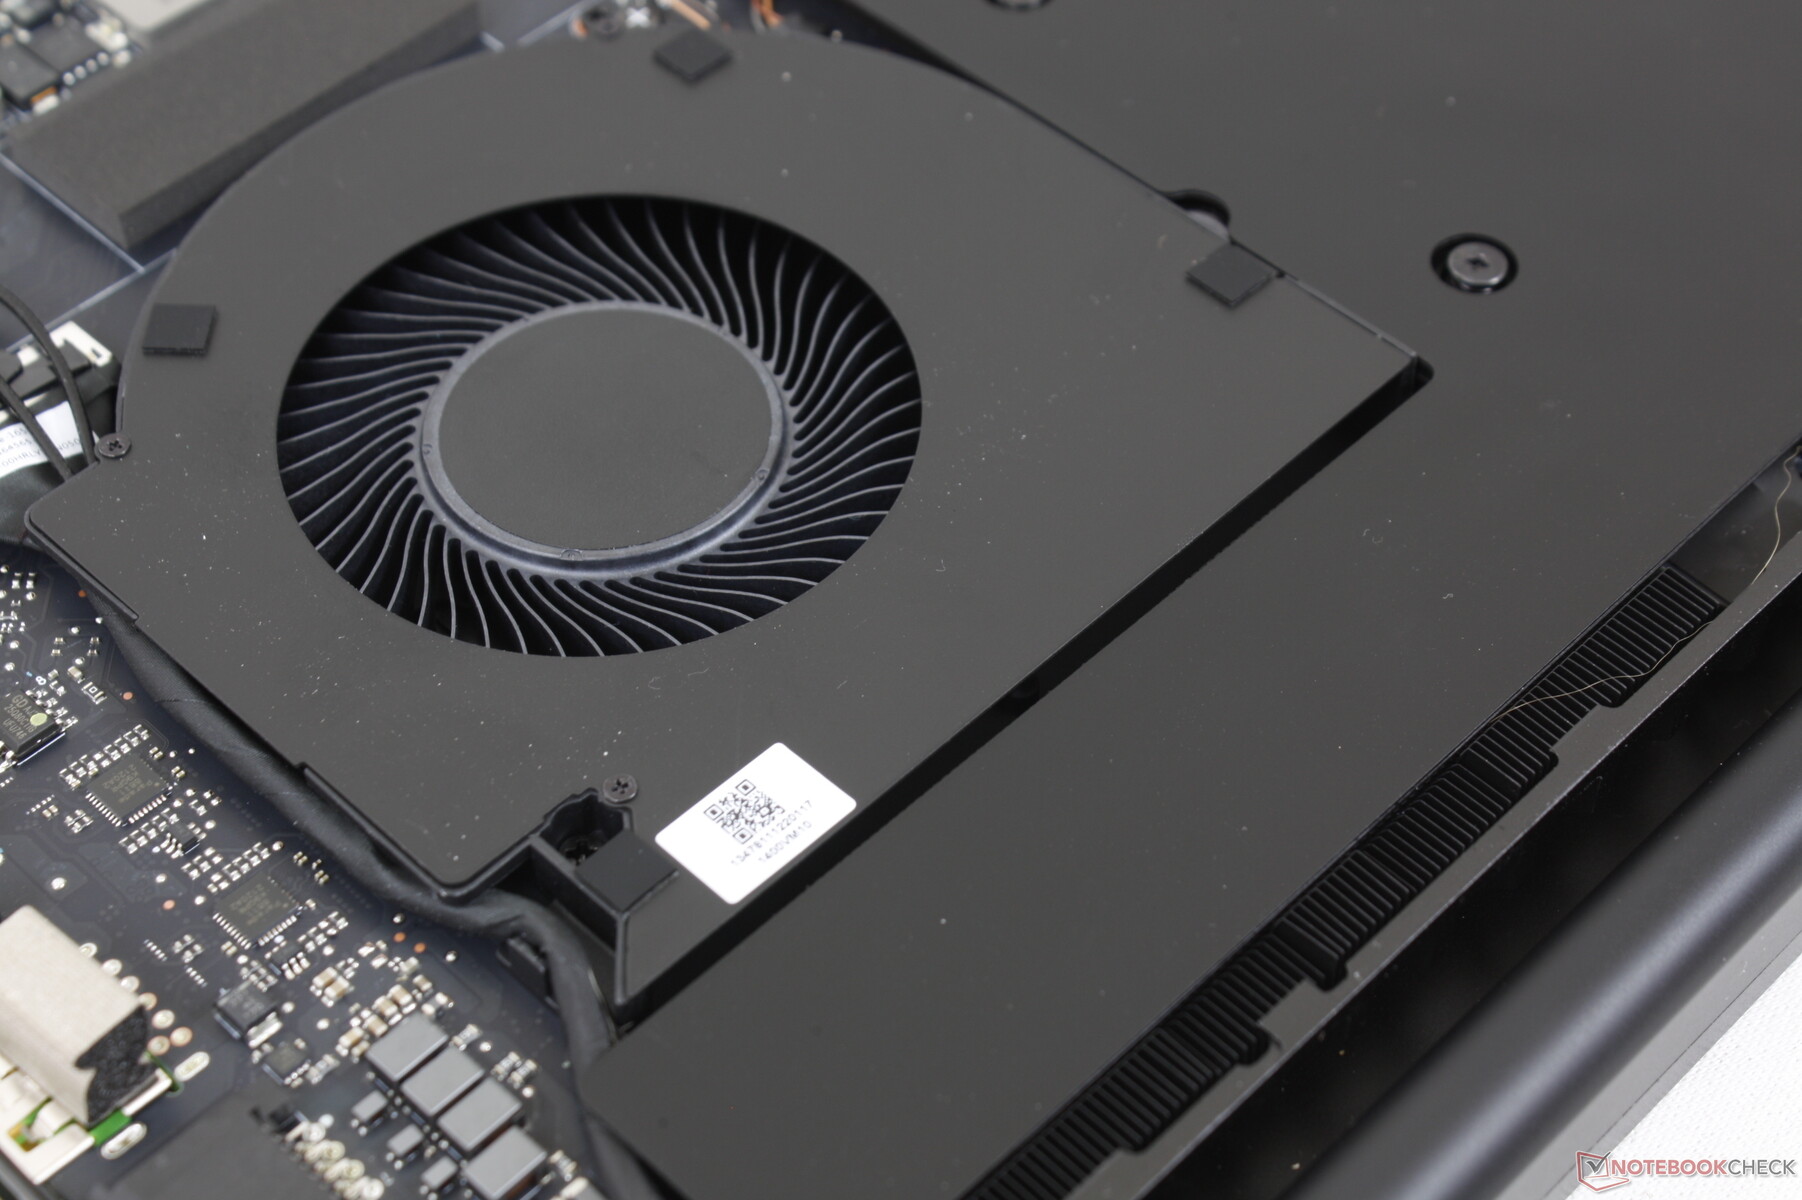
Bis auf zwei wichtige optische Unterschiede ist das Gehäuse mit dem aus dem letzten Jahr identisch. Erstens sind die Tastenkappen hier größer als bei früheren Modellen. Zweitens sieht man nun dre Lüfter durch die Lüftungsschlitze auf der Unterseite statt vier, da Razer einen der Lüfter gestrichen hat. Wie unsere Messungen zeigen werden, wirken sich diese kleinen Änderungen auf die Akkulaufzeit und die Temperaturen aus.

Ausstattung — Jetzt mit zwei Thunderbolt-4-Ports
Die Anschlussausstattung ist mit der des 10.-Gen.-Intel-Modells bis auf einen wichtigen Unterschied identisch: Beide USB-C-Anschlüsse unterstützen Thunderbolt statt nur einem. Das neue Modell ist mit dem Netzteil des Vorgängers kompatibel, allerdings könnte sich das negativ auf die Leistung auswirken, da das neue 2022er-Modell auf ein stärkeres 280-W-Netzteil setzt.
SD-Kartenleser
| SD Card Reader - average JPG Copy Test (av. of 3 runs) | |
| Razer Blade Pro 17 2021 (QHD Touch) (Toshiba Exceria Pro SDXC 64 GB UHS-II) | |
| MSI GS76 Stealth 11UH (AV PRO microSD 128 GB V60) | |
| Aorus 17G YD (AV PRO microSD 128 GB V60) | |
| Asus ROG Zephyrus S17 GX703HSD | |
| Alienware x17 RTX 3080 P48E (AV Pro V60) | |
| Razer Blade 17 RTX 3080 Ti (AV Pro V60) | |
Kommunikation
Webcam
Im Gegensatz zu den 720p- bzw. 1-MP-Webcams der meisten anderen Laptops kommt hier eine 1080p- bzw. 2-MP-Webcam mit einer höheren Bildschärfe zum Einsatz. Windows Hello wird ebenfalls unterstützt, eine Webcam-Abdeckung gibt es jedoch immer noch nicht.


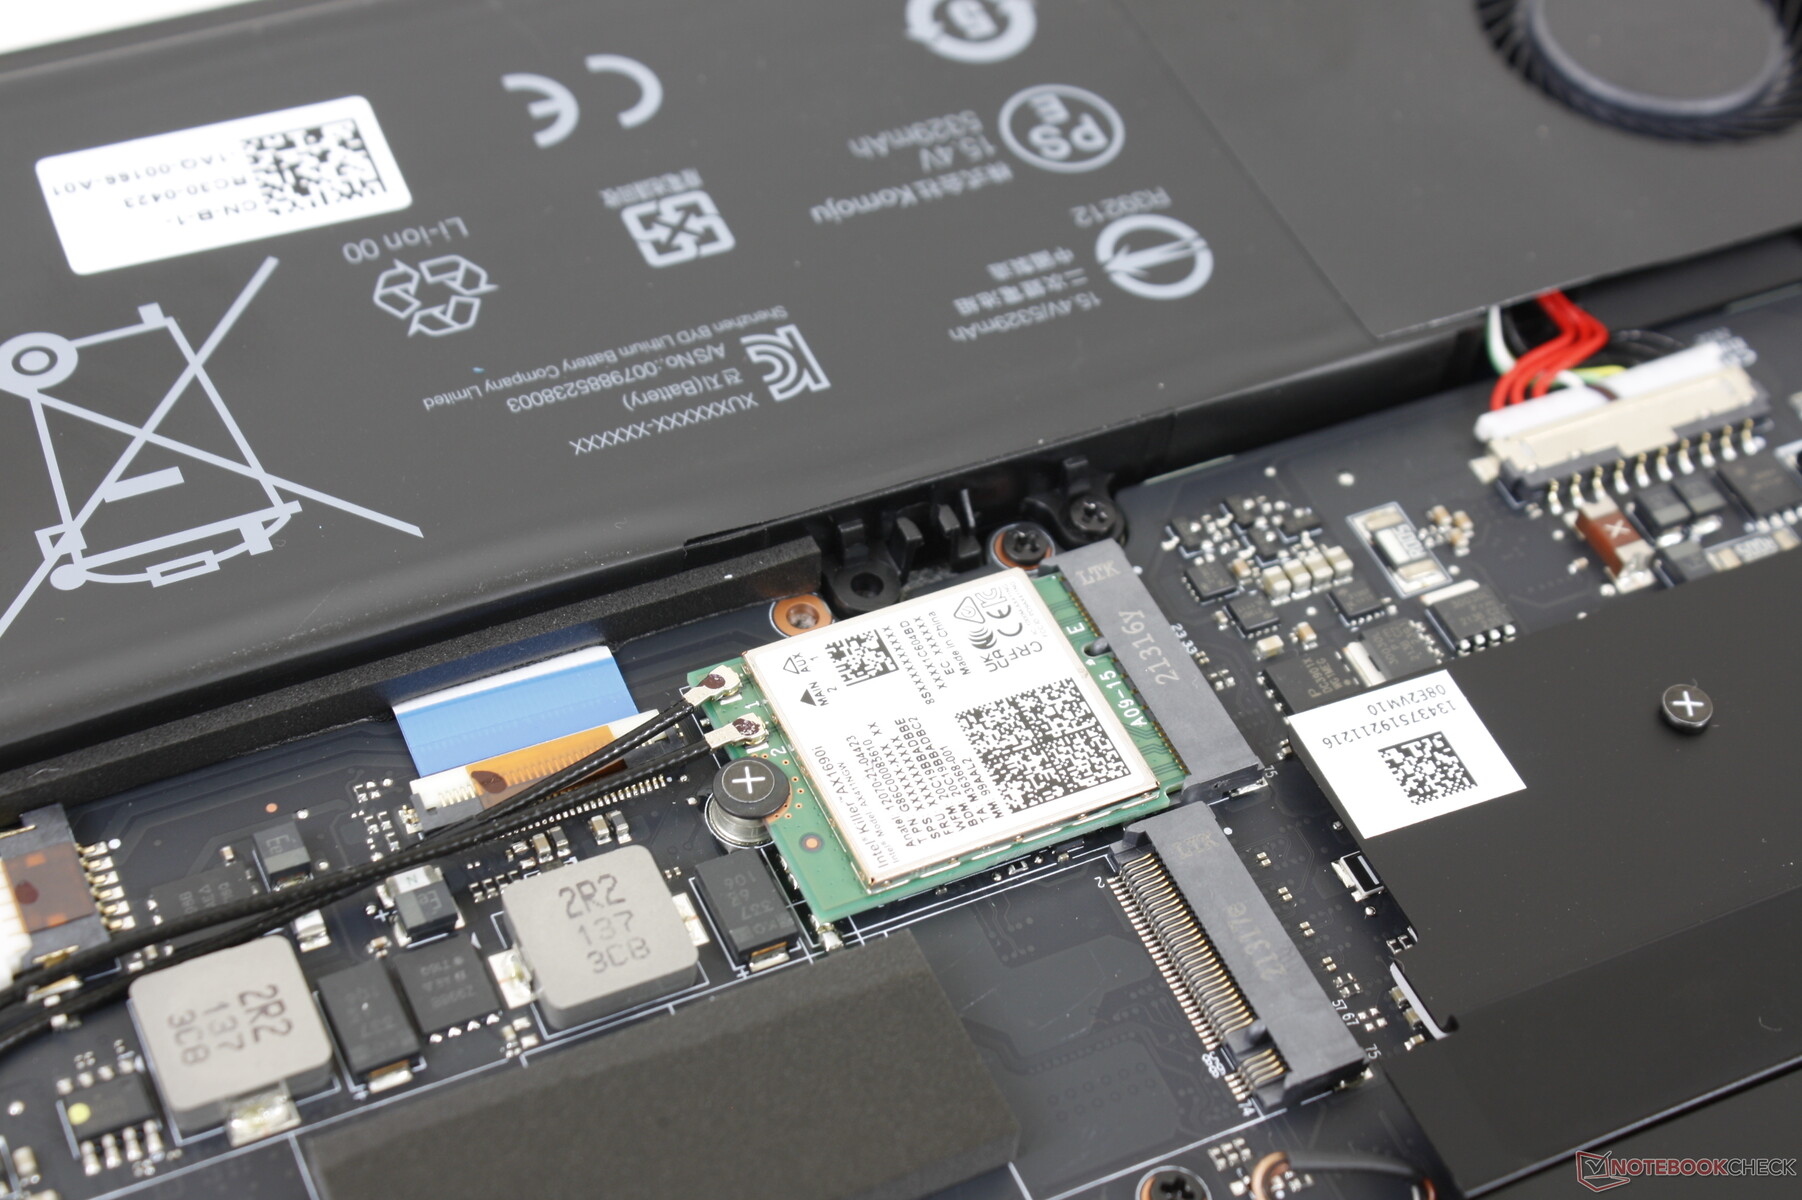
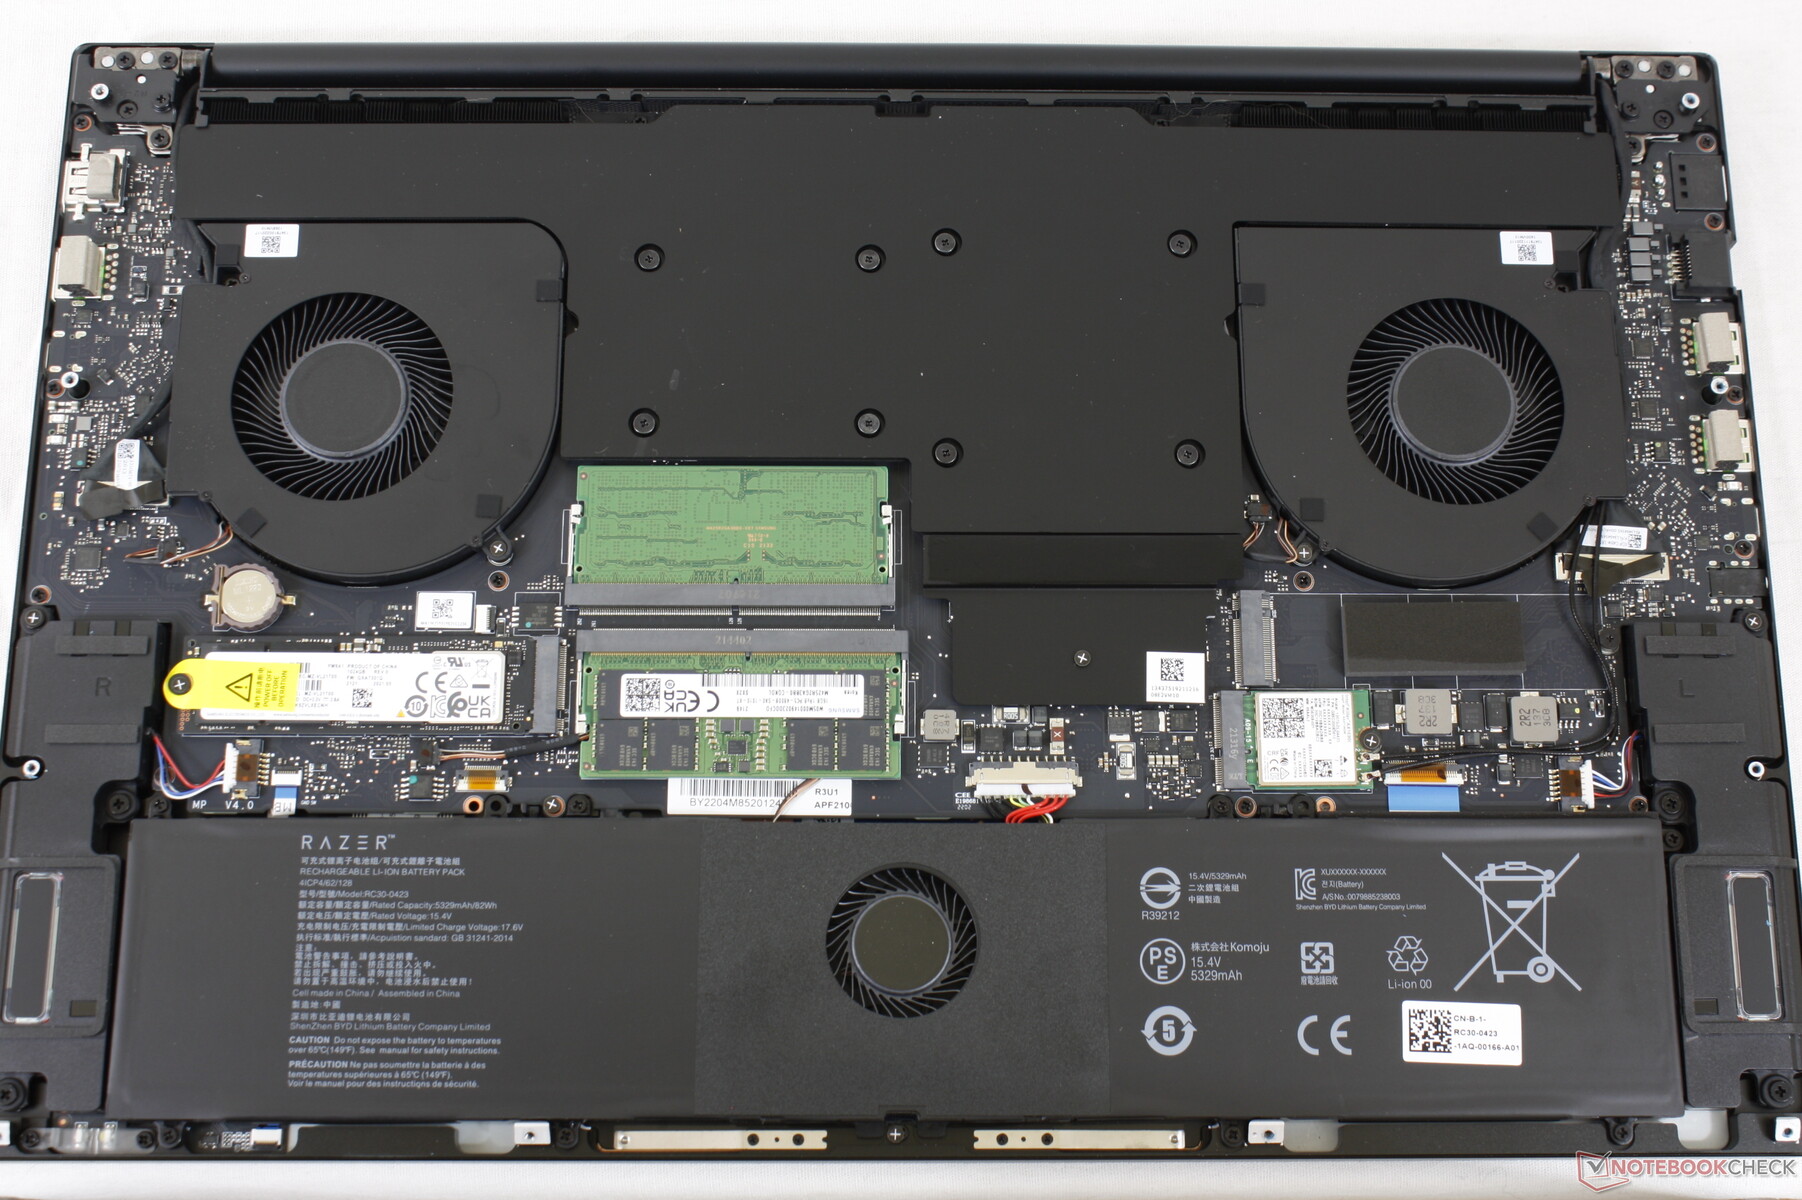
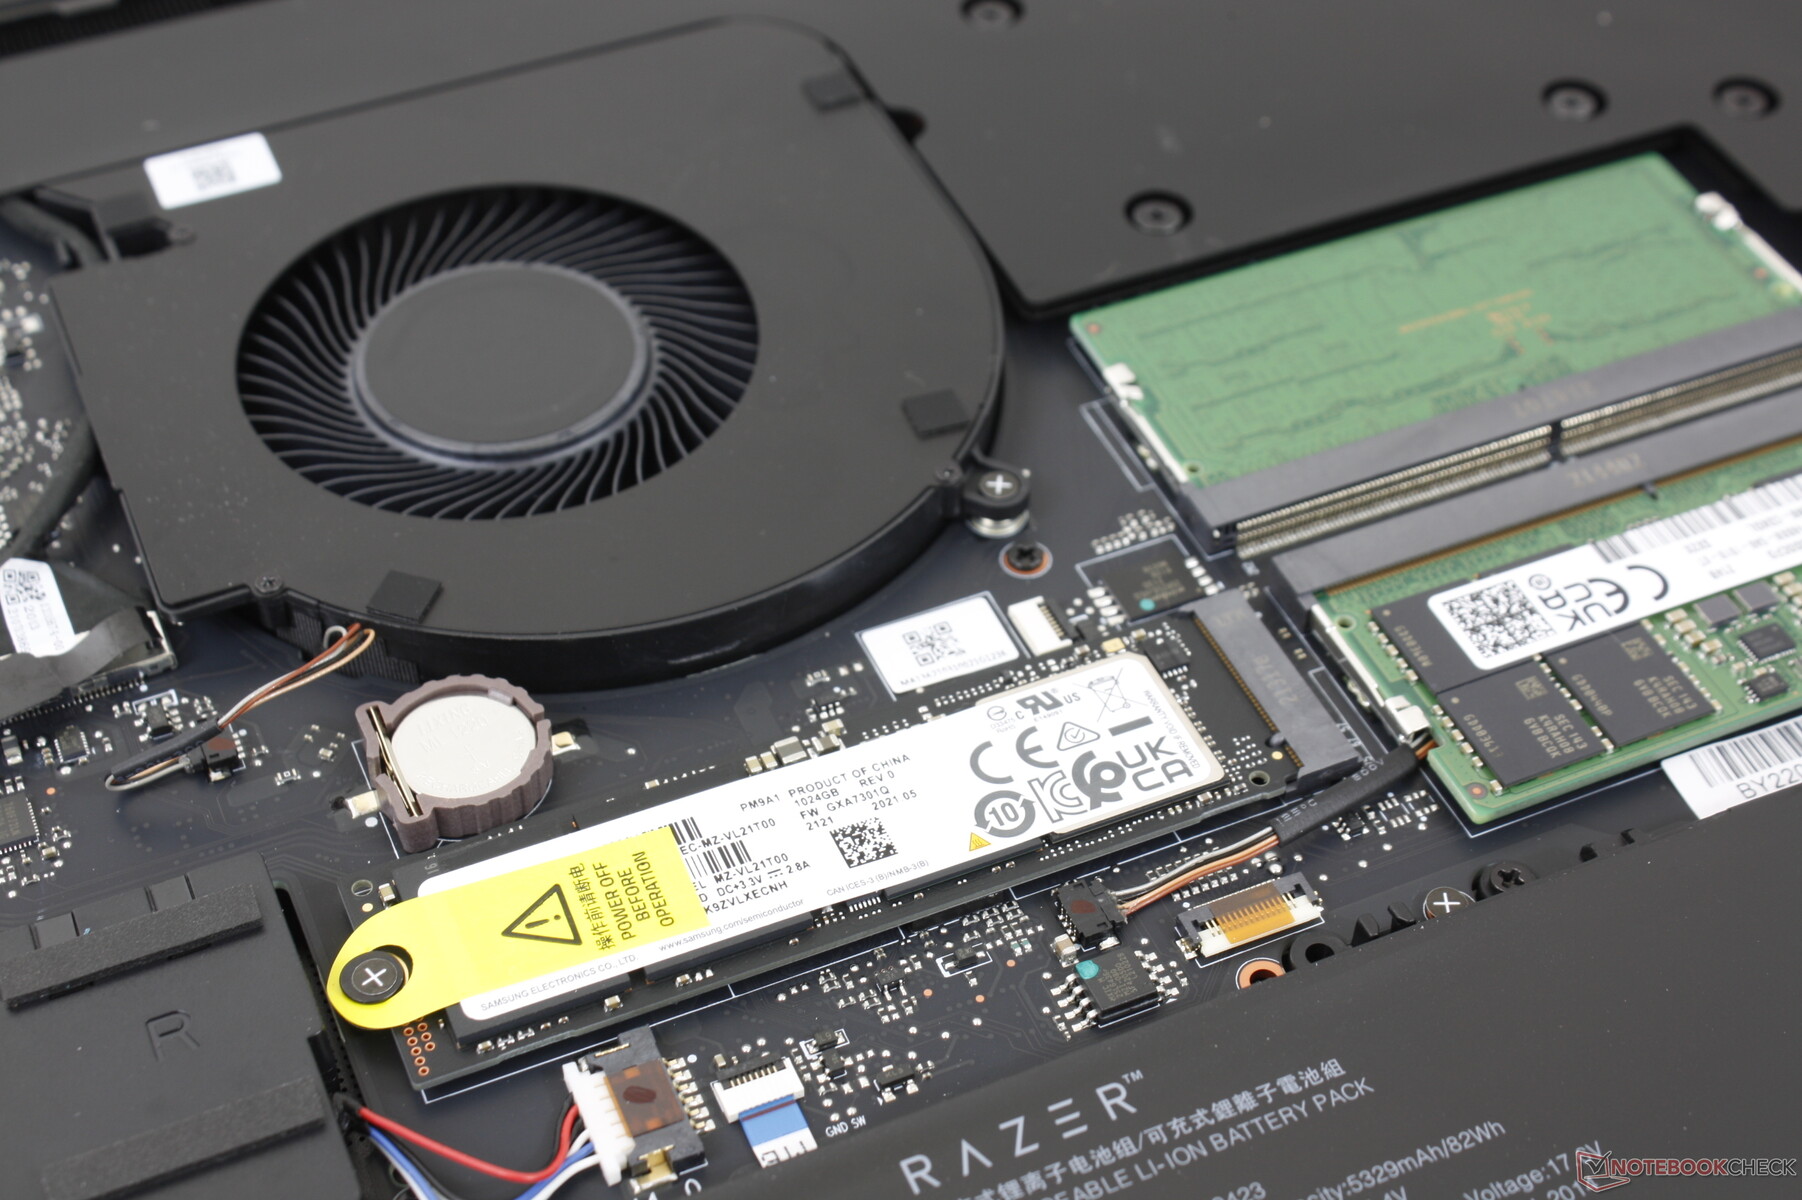
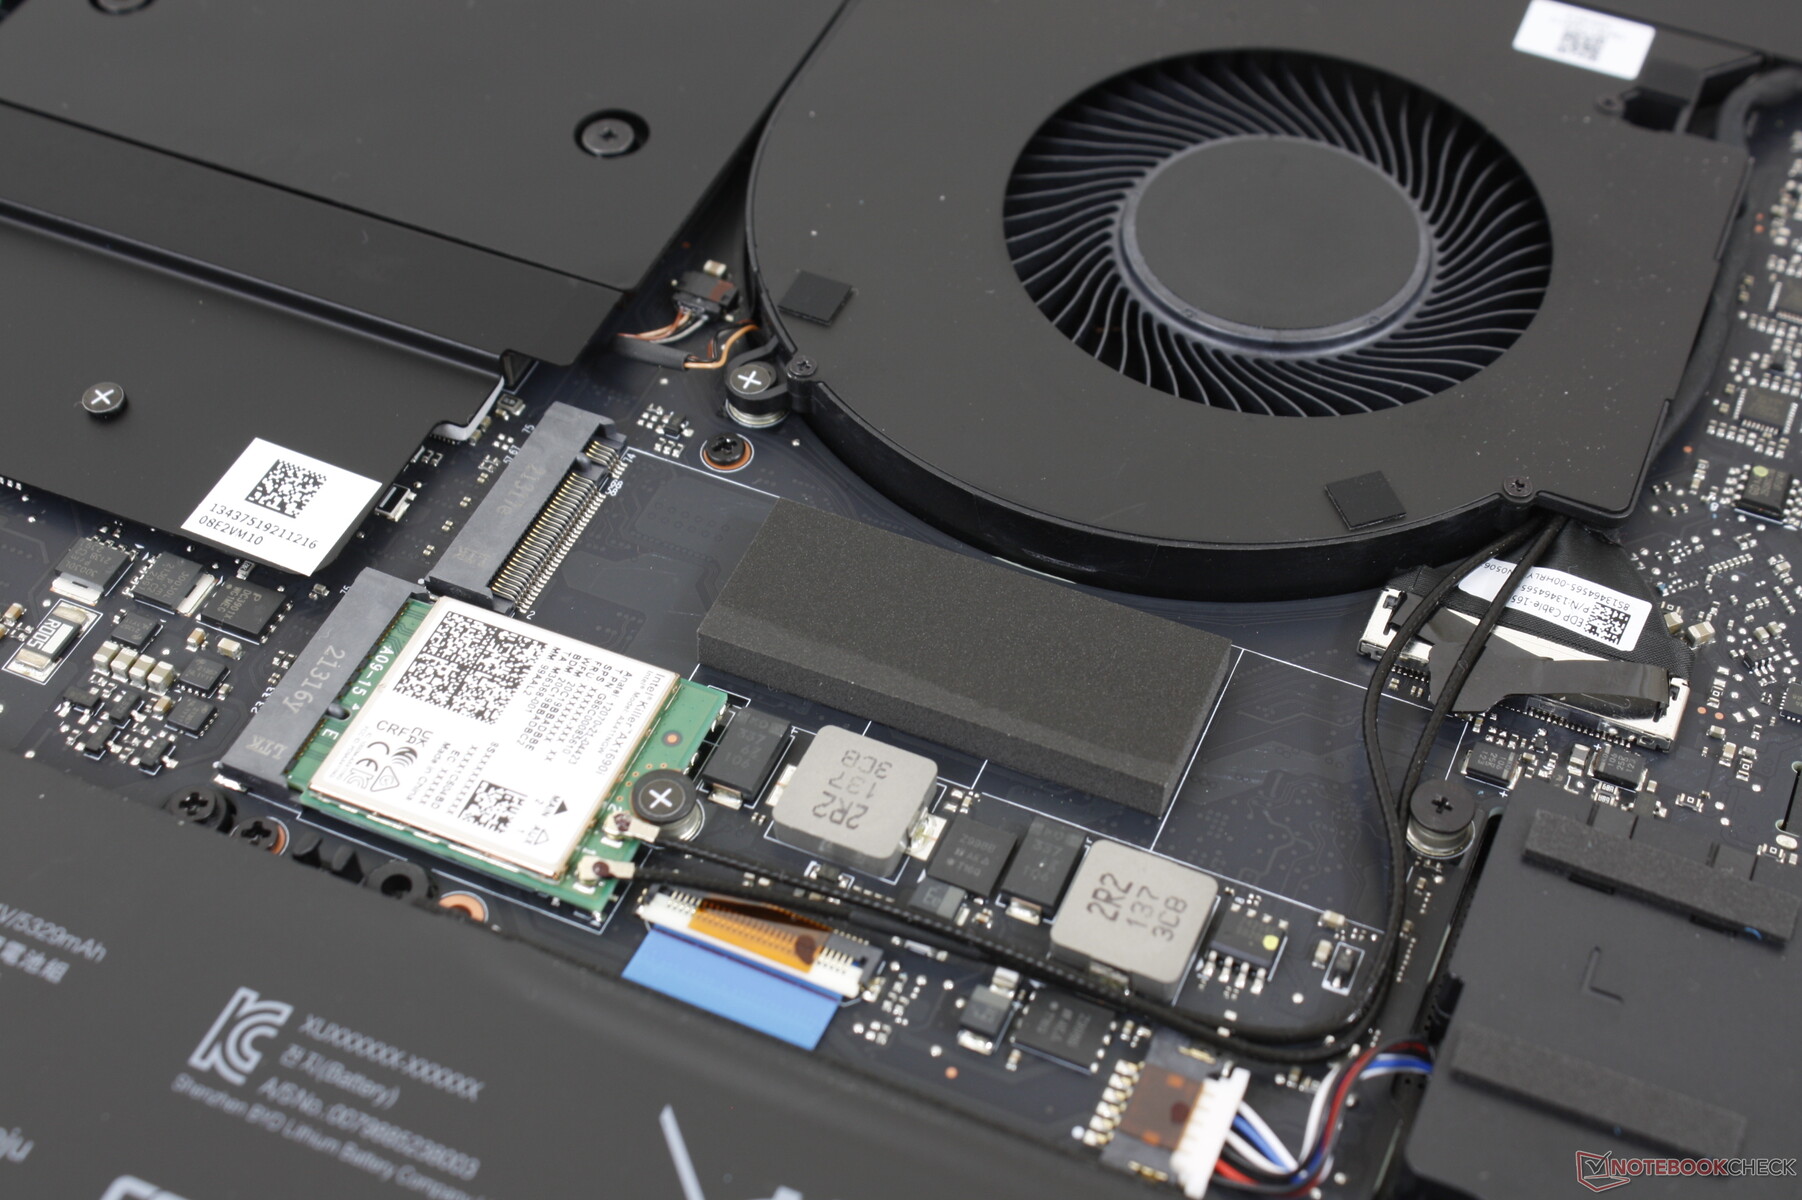
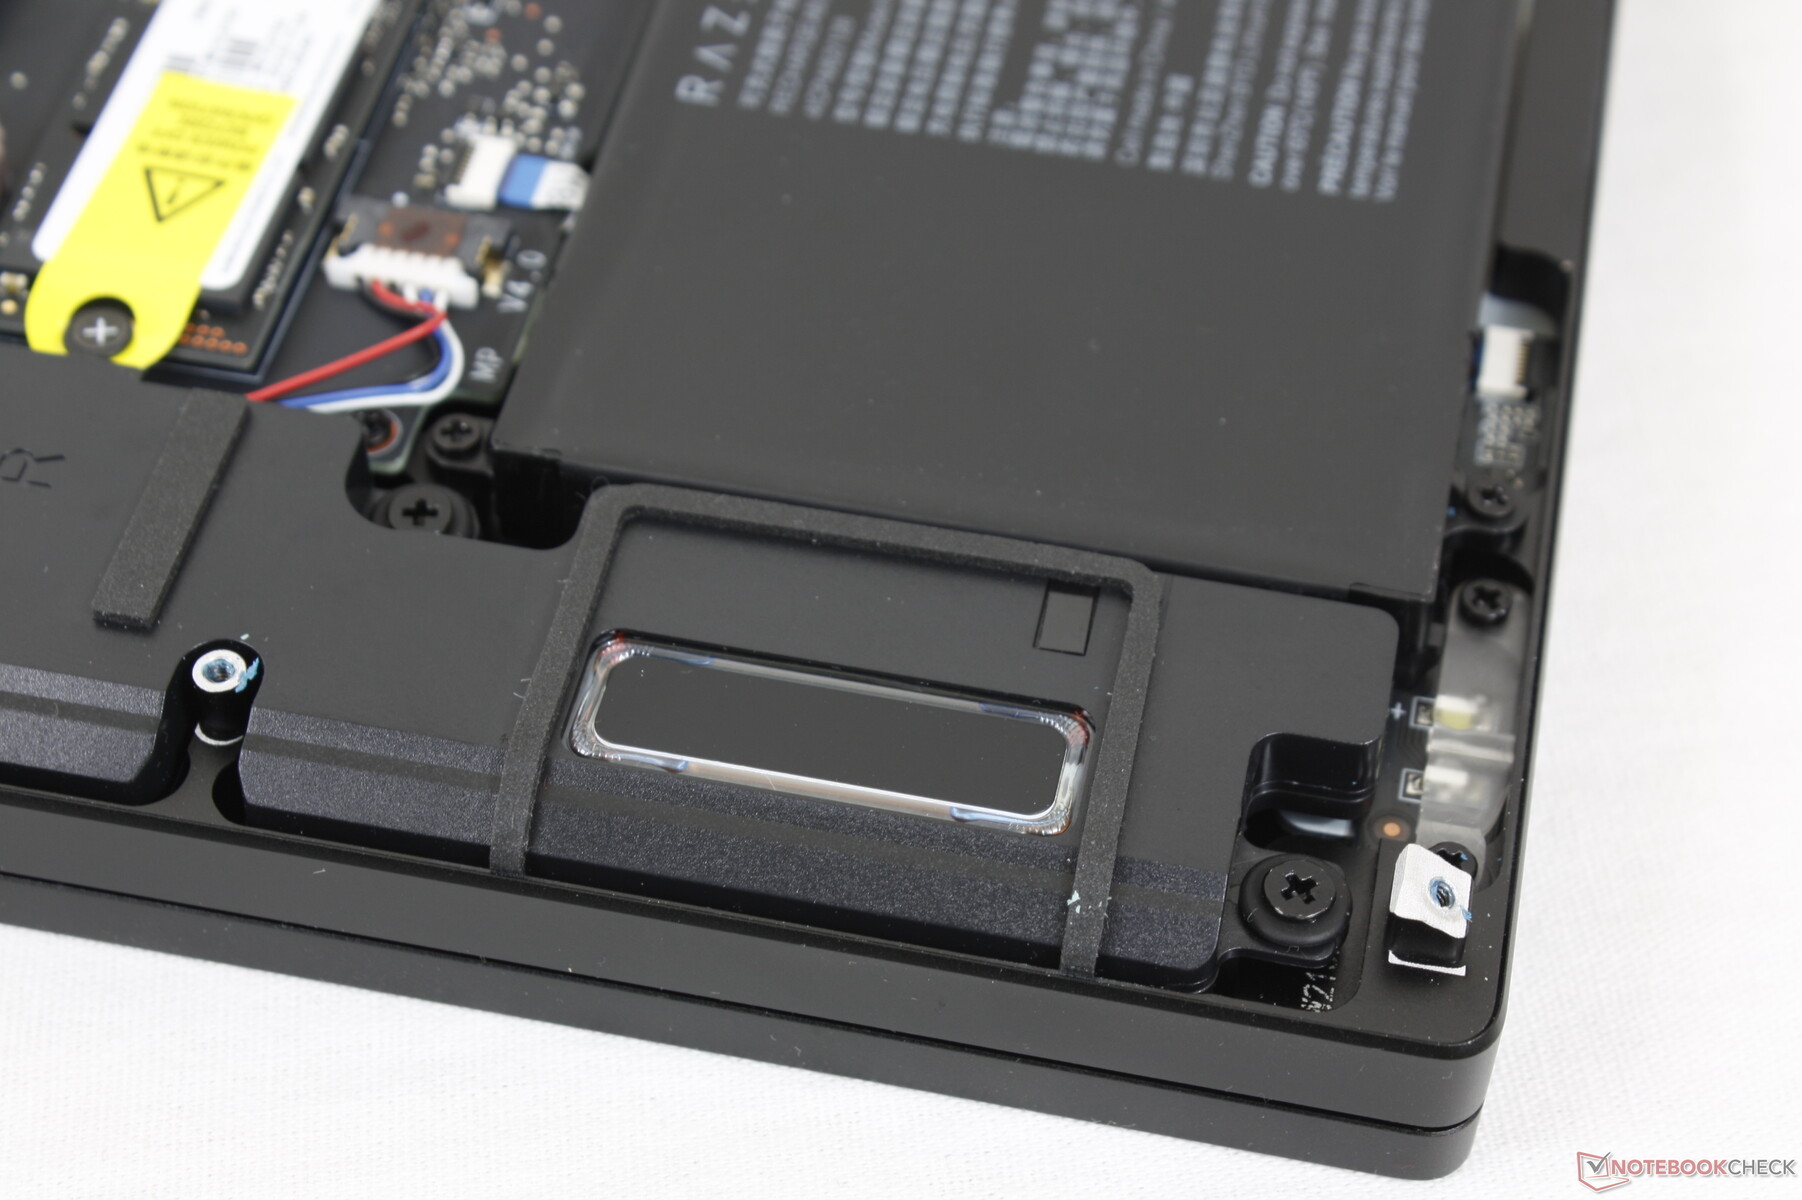
Wartung
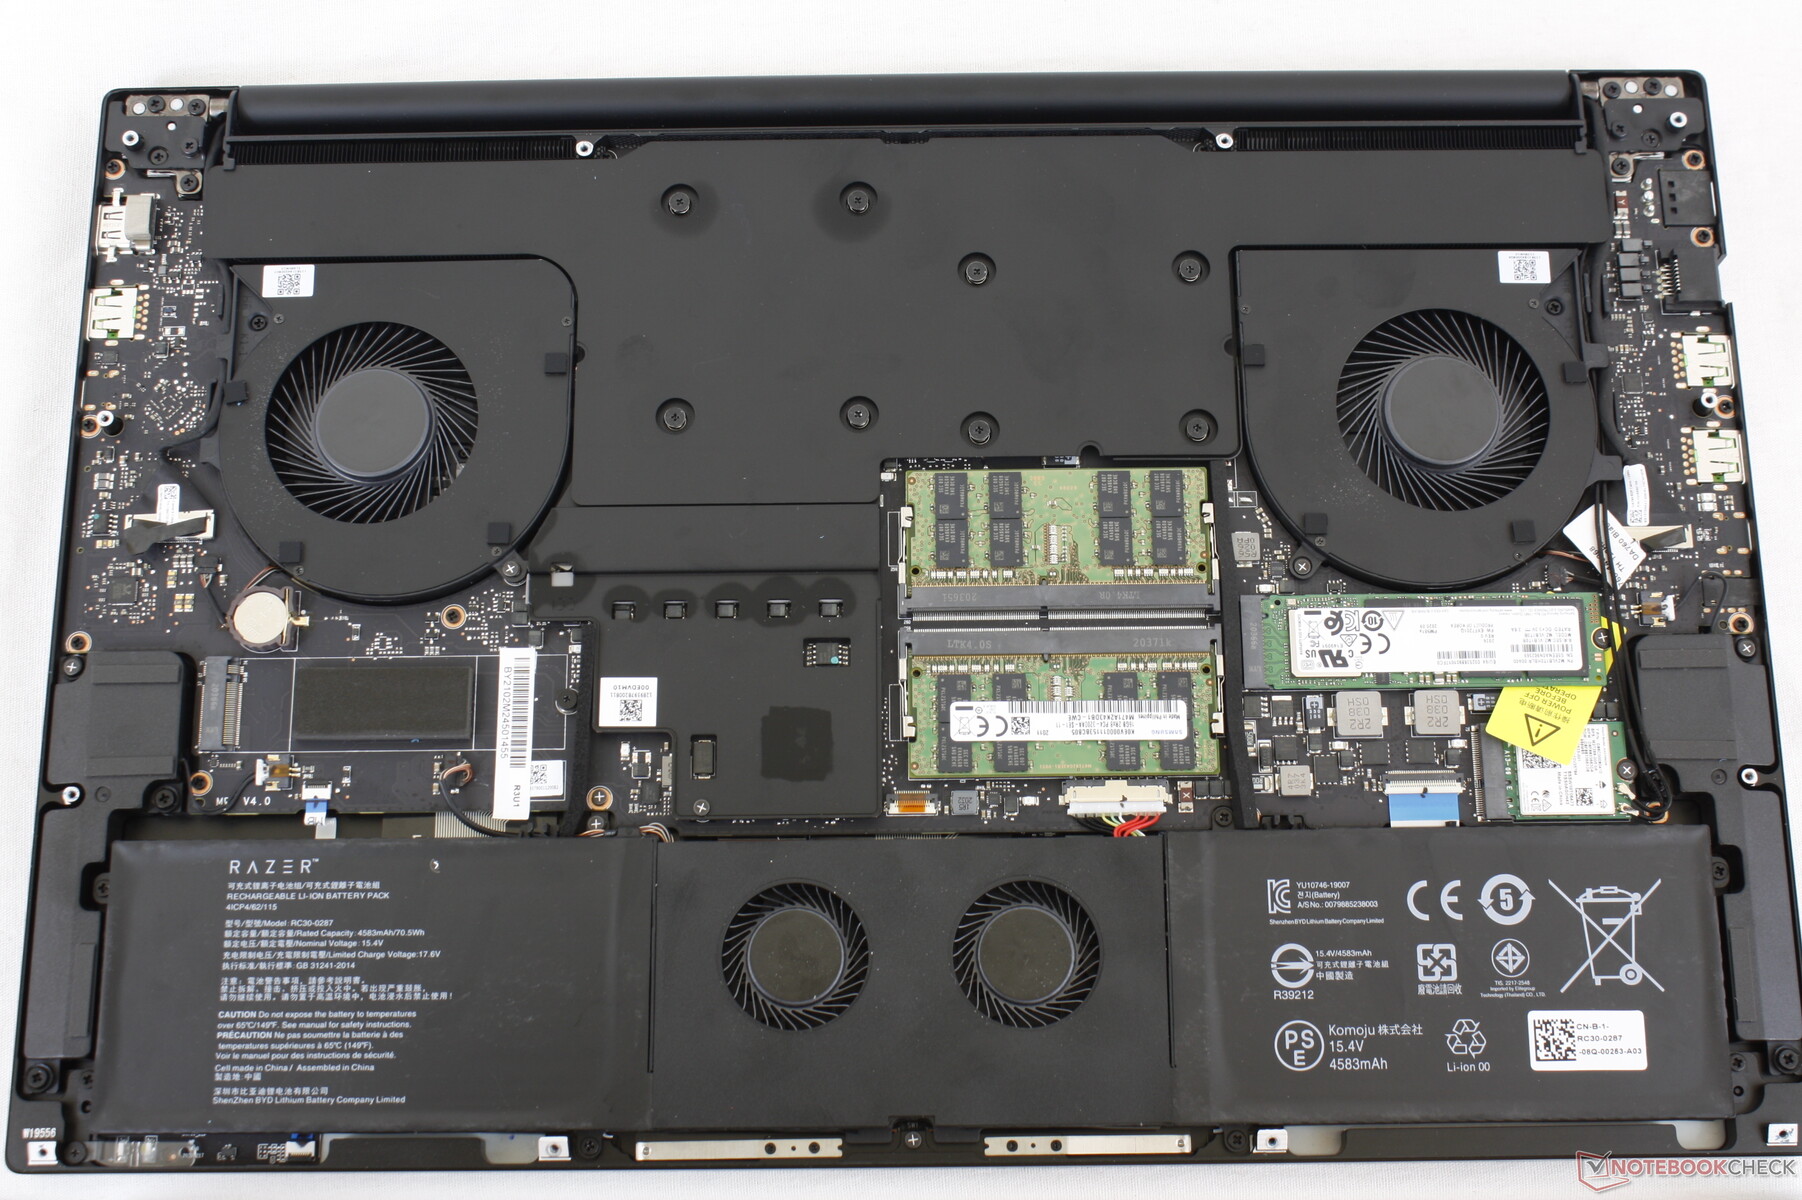
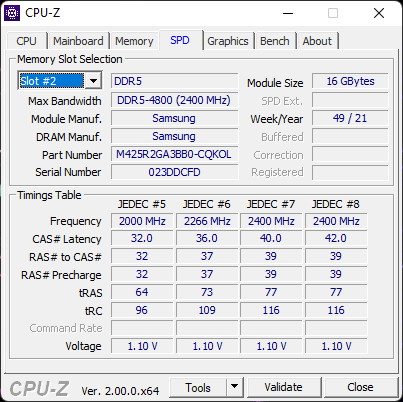
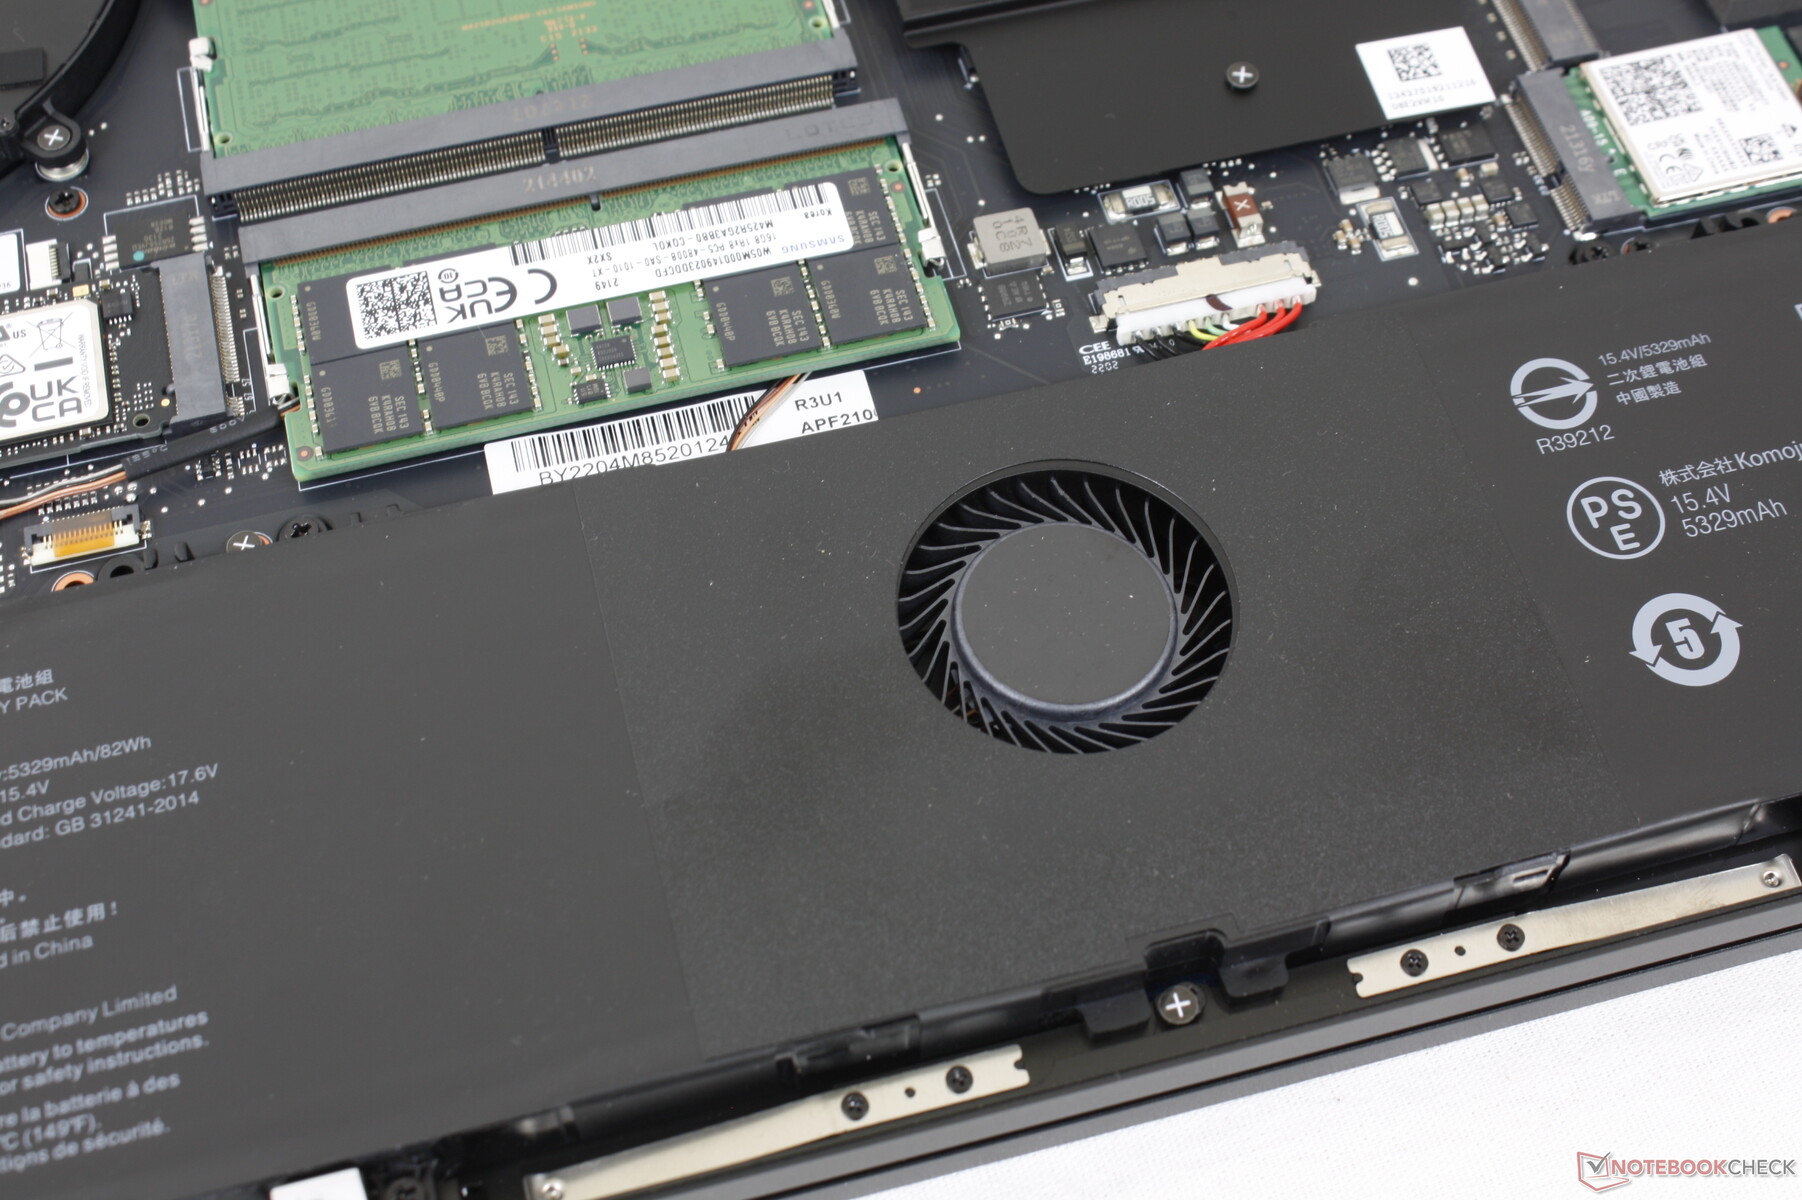
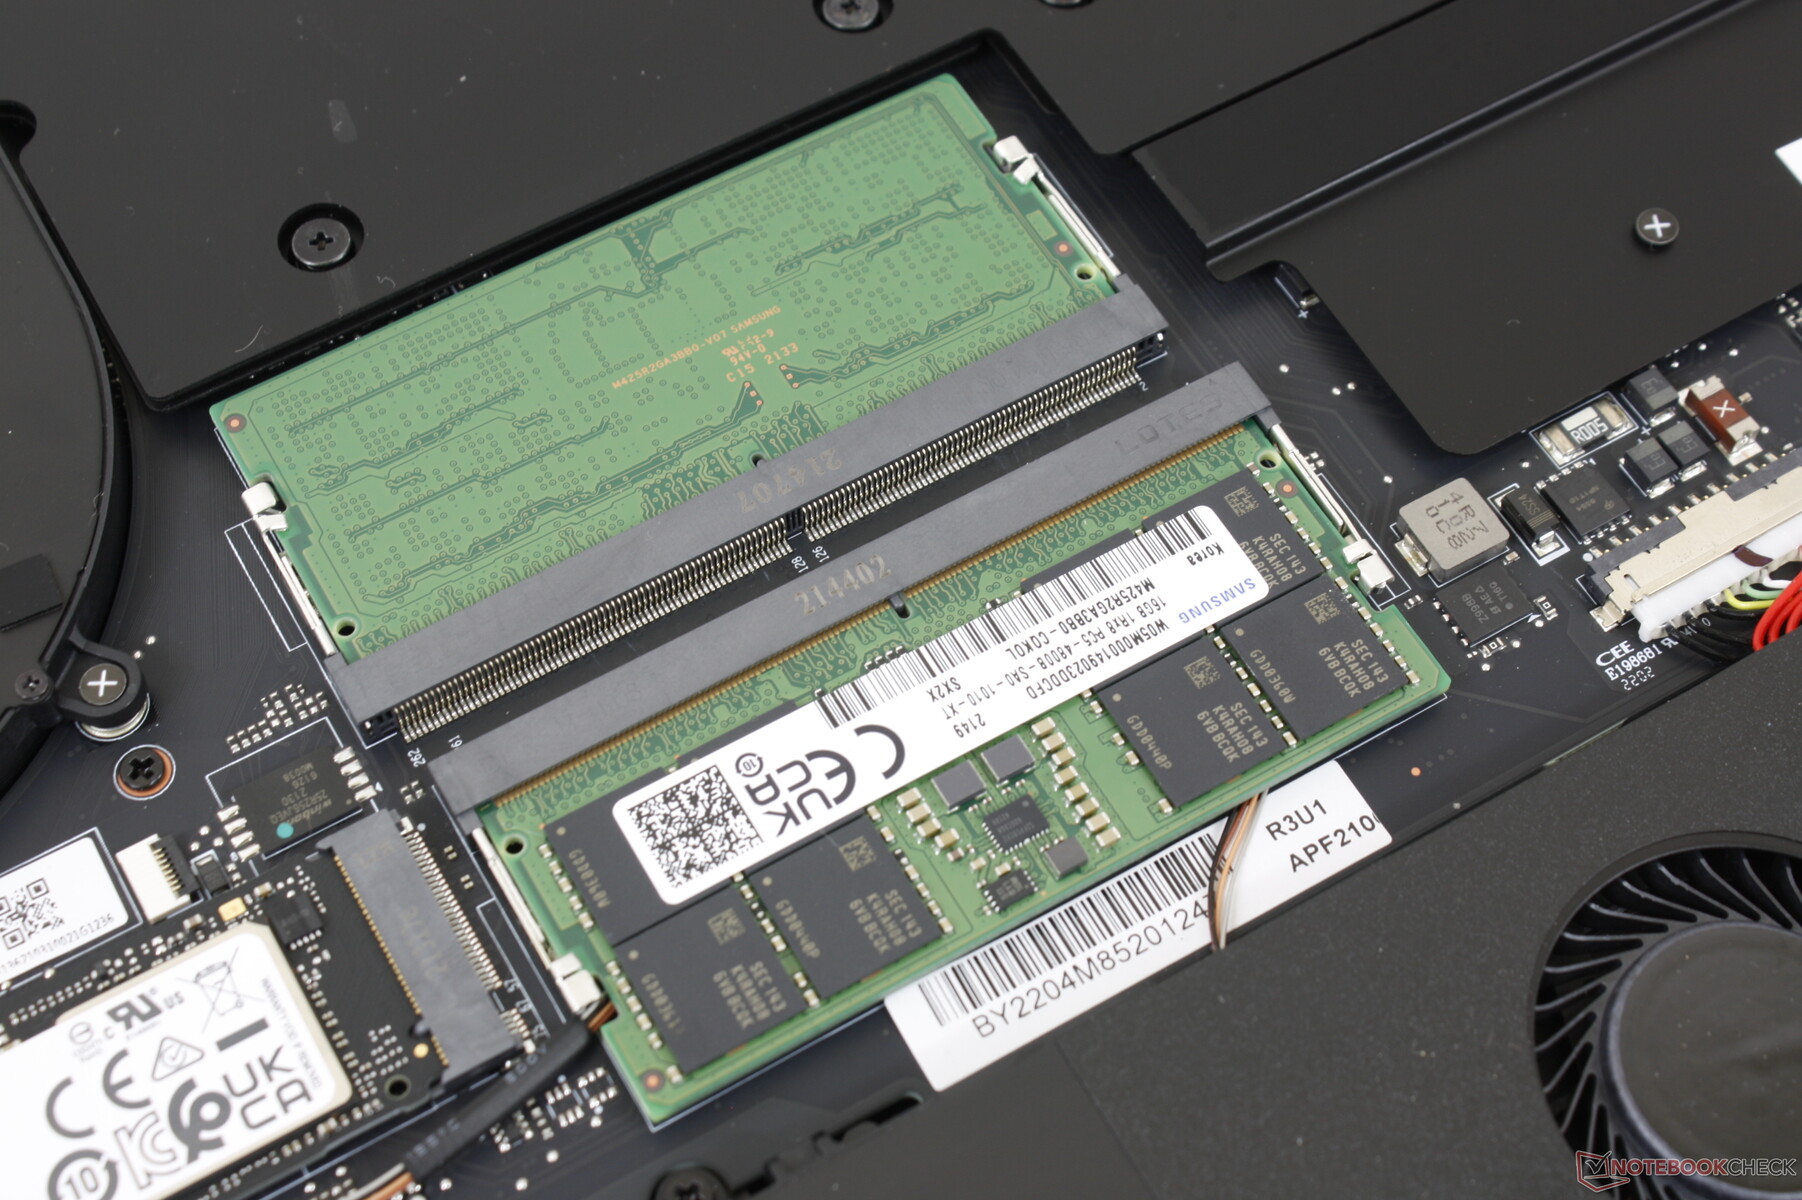
Die Bodenplatte kann mithilfe eines T5-Torxschraubenziehers relativ einfach entfernt werden. Im Inneren hat man zwar weiterhin direkten Zugang zu beiden DDR5-SODIMM-Steckplätzen und zwei M.2-PCIe4-SSD-Slots, das Layout des Mainboards hat sich jedoch gegenüber dem des Vorgängers deutlich verändert, wie die Bilder unten zeigen.
Garantie und Zubehör
Im Lieferumfang befinden sich das Netzteil, Dokumente und einige Razer-Logo-Sticker. Mit dem 12.-Generation-Blade-Modell führt Razer zusätzlich zur standardmäßigen, einjährigen Garantie eine zweijährige Standardgarantie auf den Akku ein.
Eingabegeräte — Größere Tasten, gleiches ClickPad
Tastatur
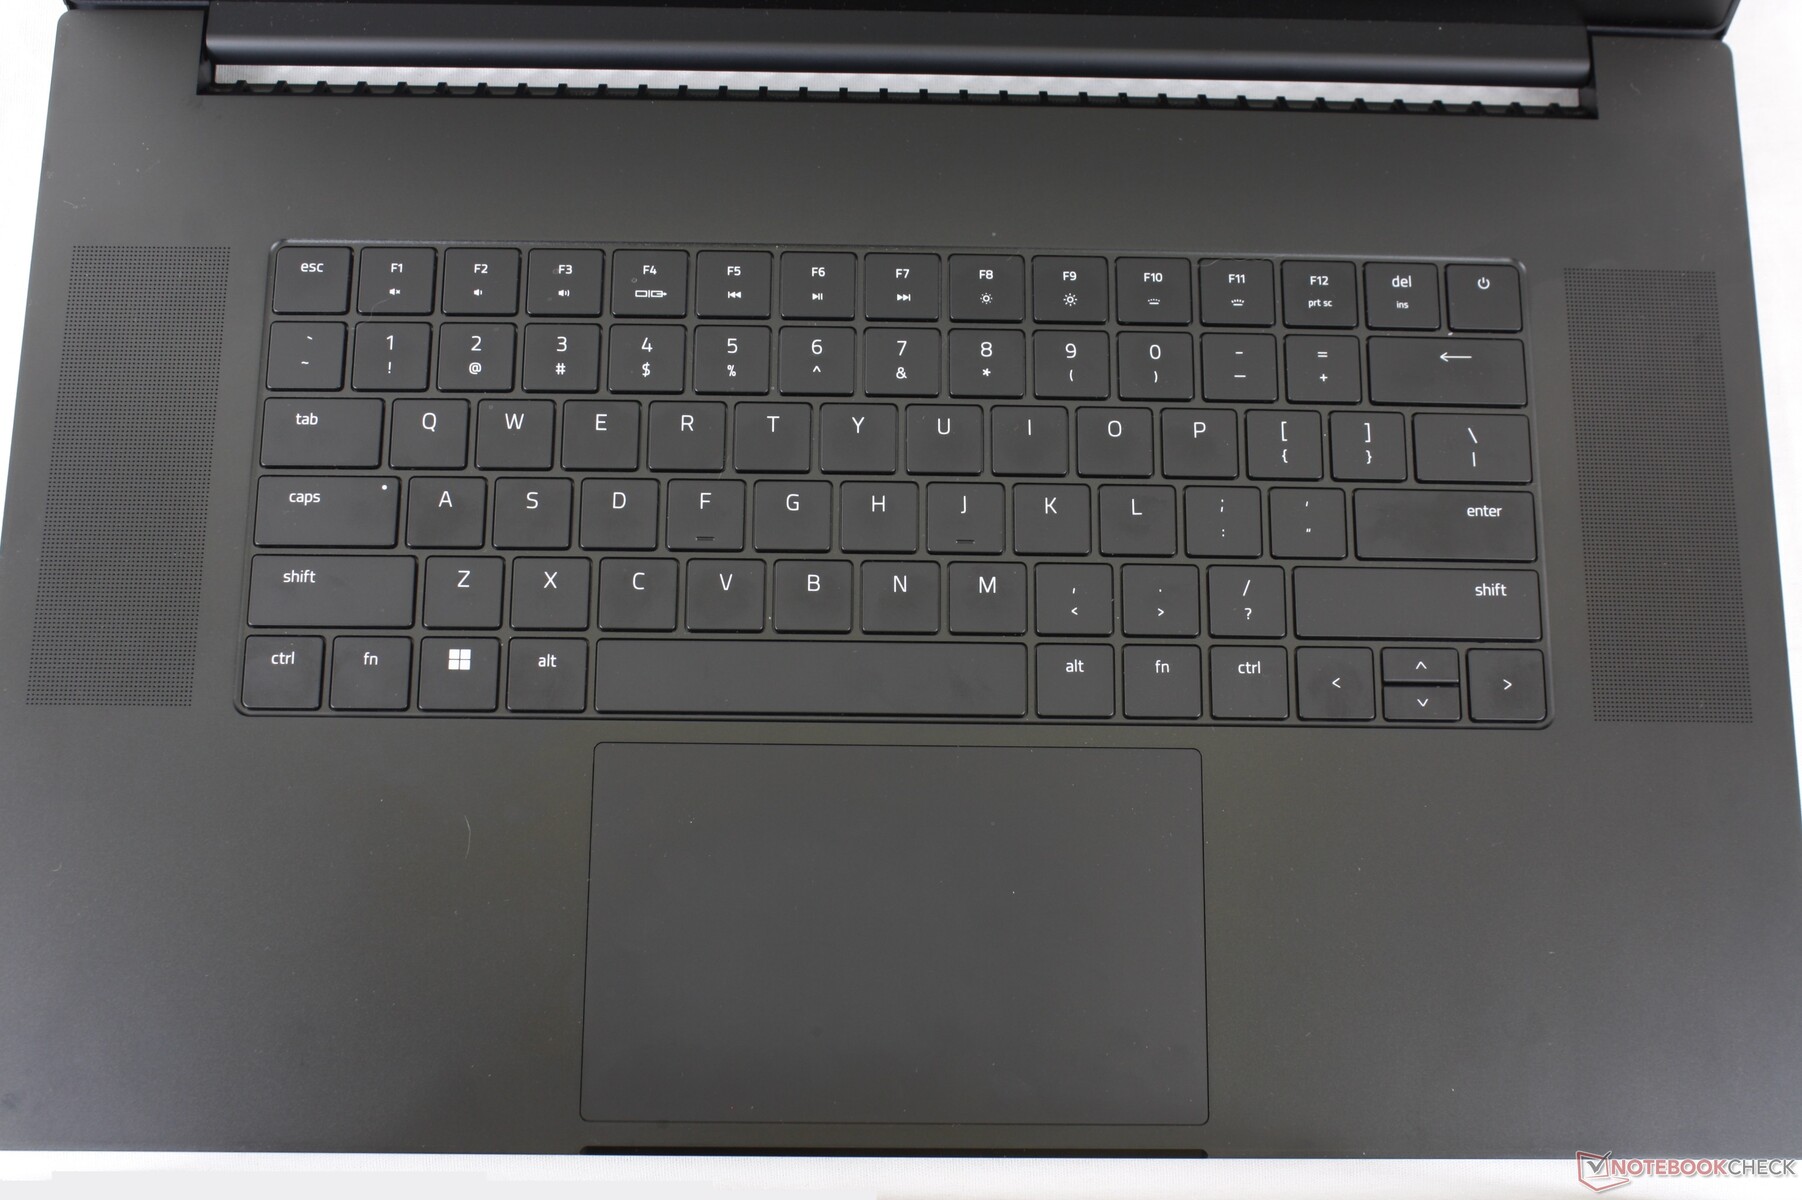
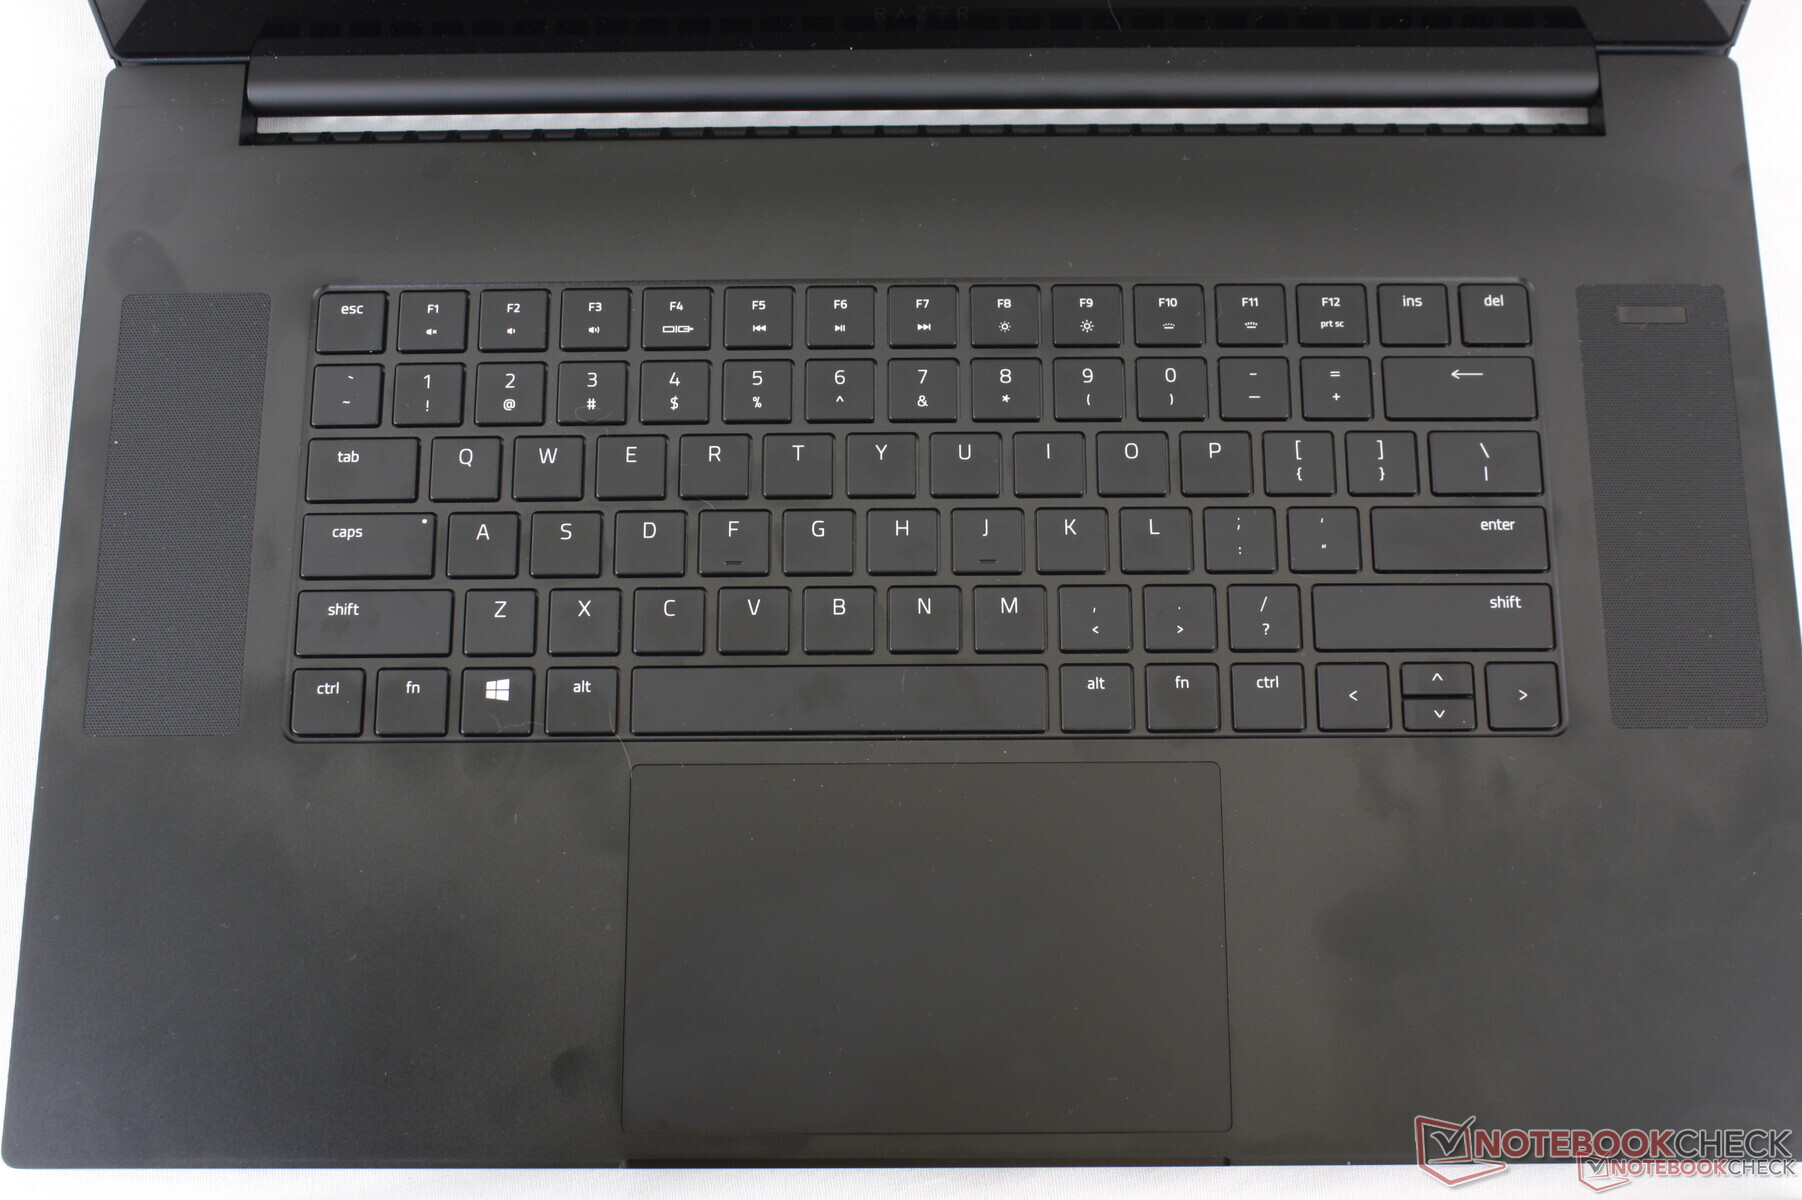
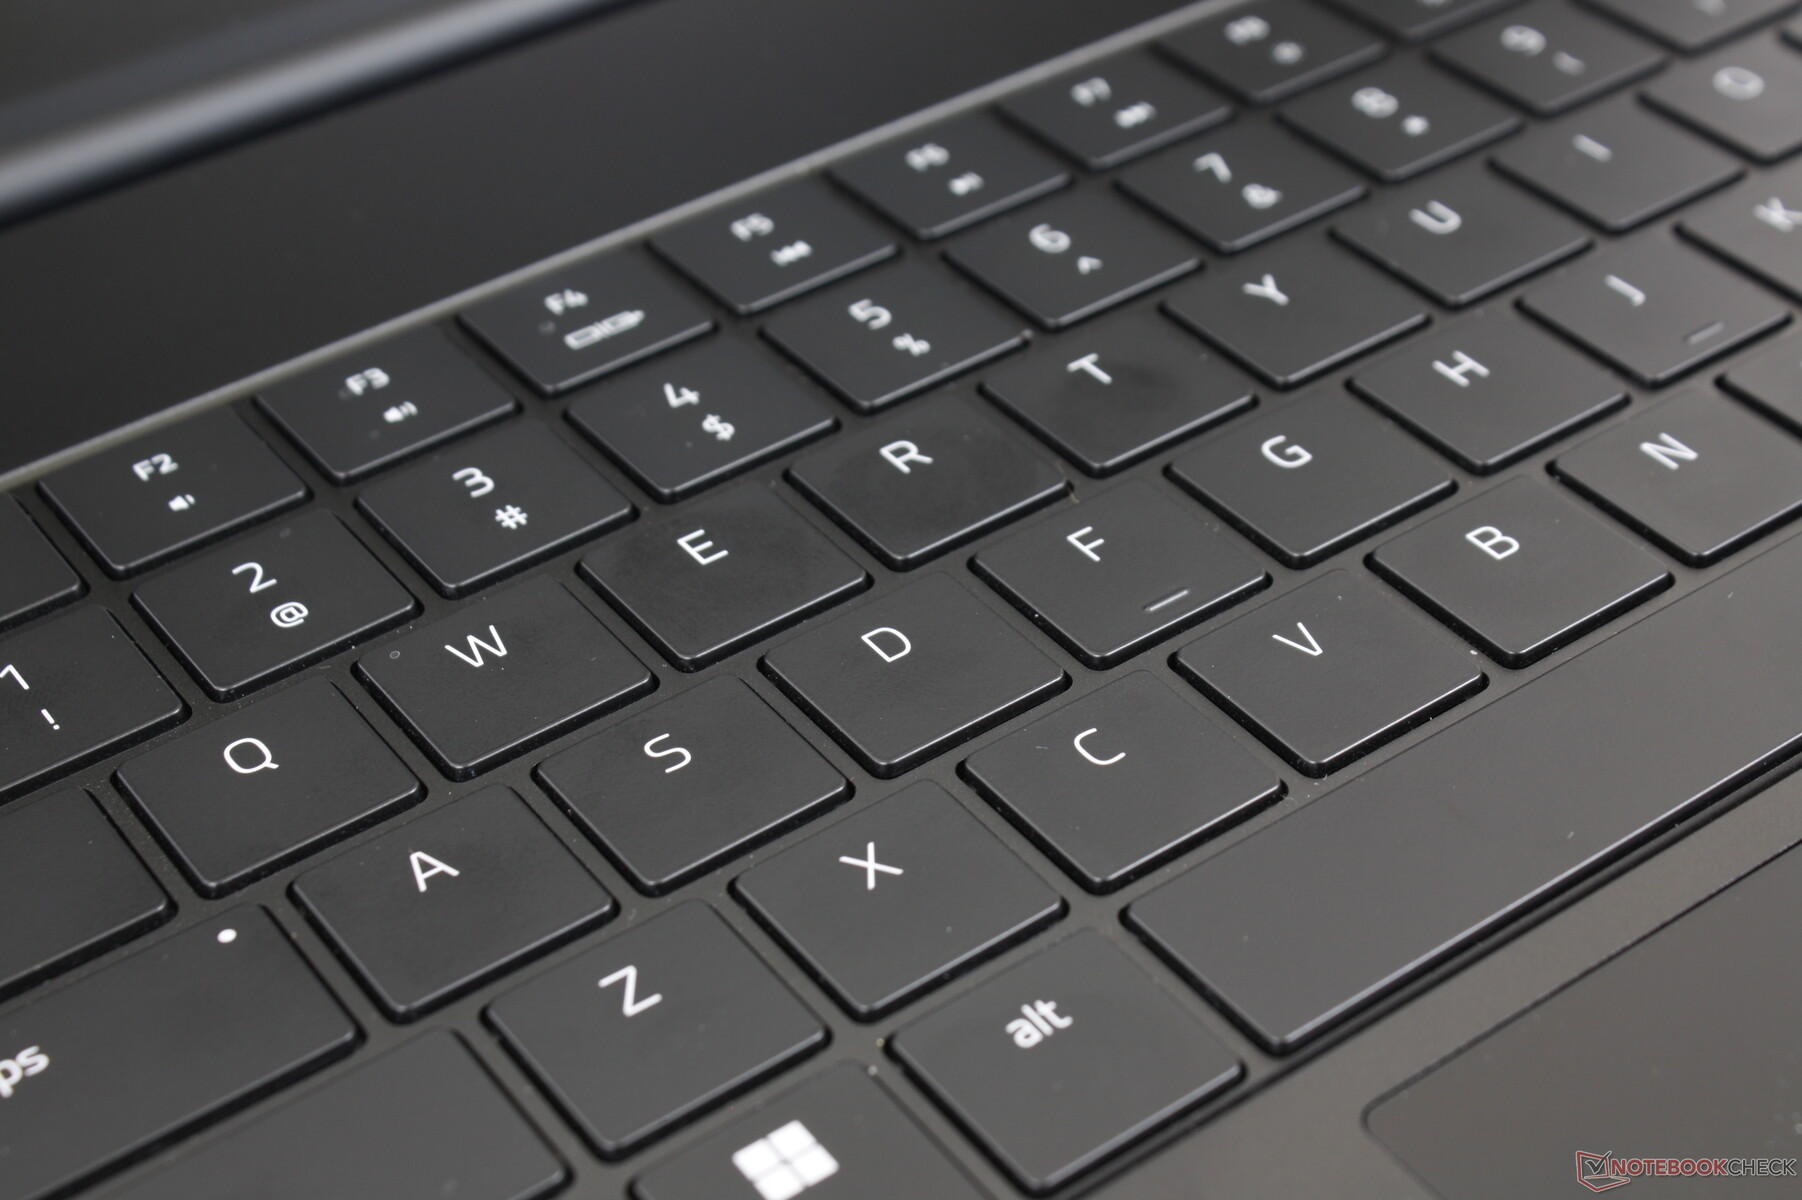
Beim Blade 17 2022 kommt die gleiche Tastatur wie beim Blade 15 2022 zum Einsatz. Die Tasten der Tastatur, welche noch immer die gleiche Gesamtfläche einnimmt, sind größer und erleichtern somit das Tippen. Trotz dieser Änderung bleiben das Tastenfeedback und der Tastenhub unverändert. Wir vermuten, dass diese kleine, iterative Verbesserung der Tastatur weniger kontrovers sein wird als eine neue, mechanische bzw. optomechanische Tastatur.
Touchpad
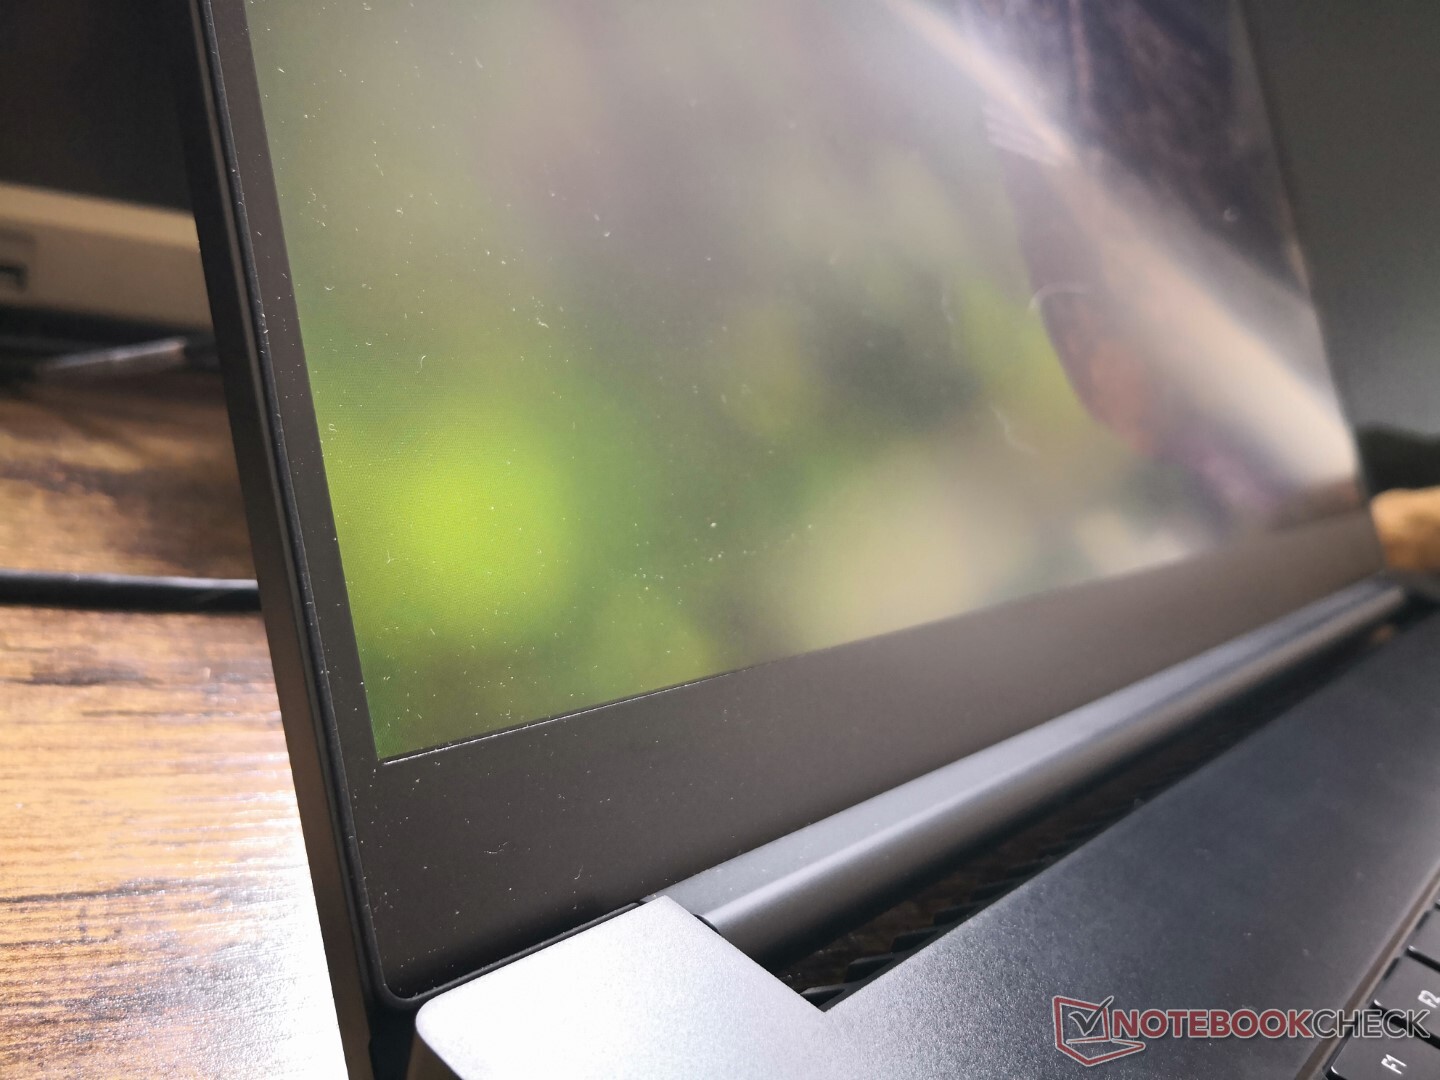
Das Touchpad bleibt - mit all seinen guten und schlechten Seiten - unverändert. Uns gefallen zwar die große Oberfläche (13 x 8 cm) und die guten Gleiteigenschaften, das schwammige Feedback ist jedoch weiterhin unbefriedigend. Im Vergleich zu Laptops mit dedizierten Maustasten wie dem Asus TUF FX506 erschwert das Drag-and-Drop-Vorgänge. Außerdem sammelt sich auf der matten Oberfläche schnell Schmutz.

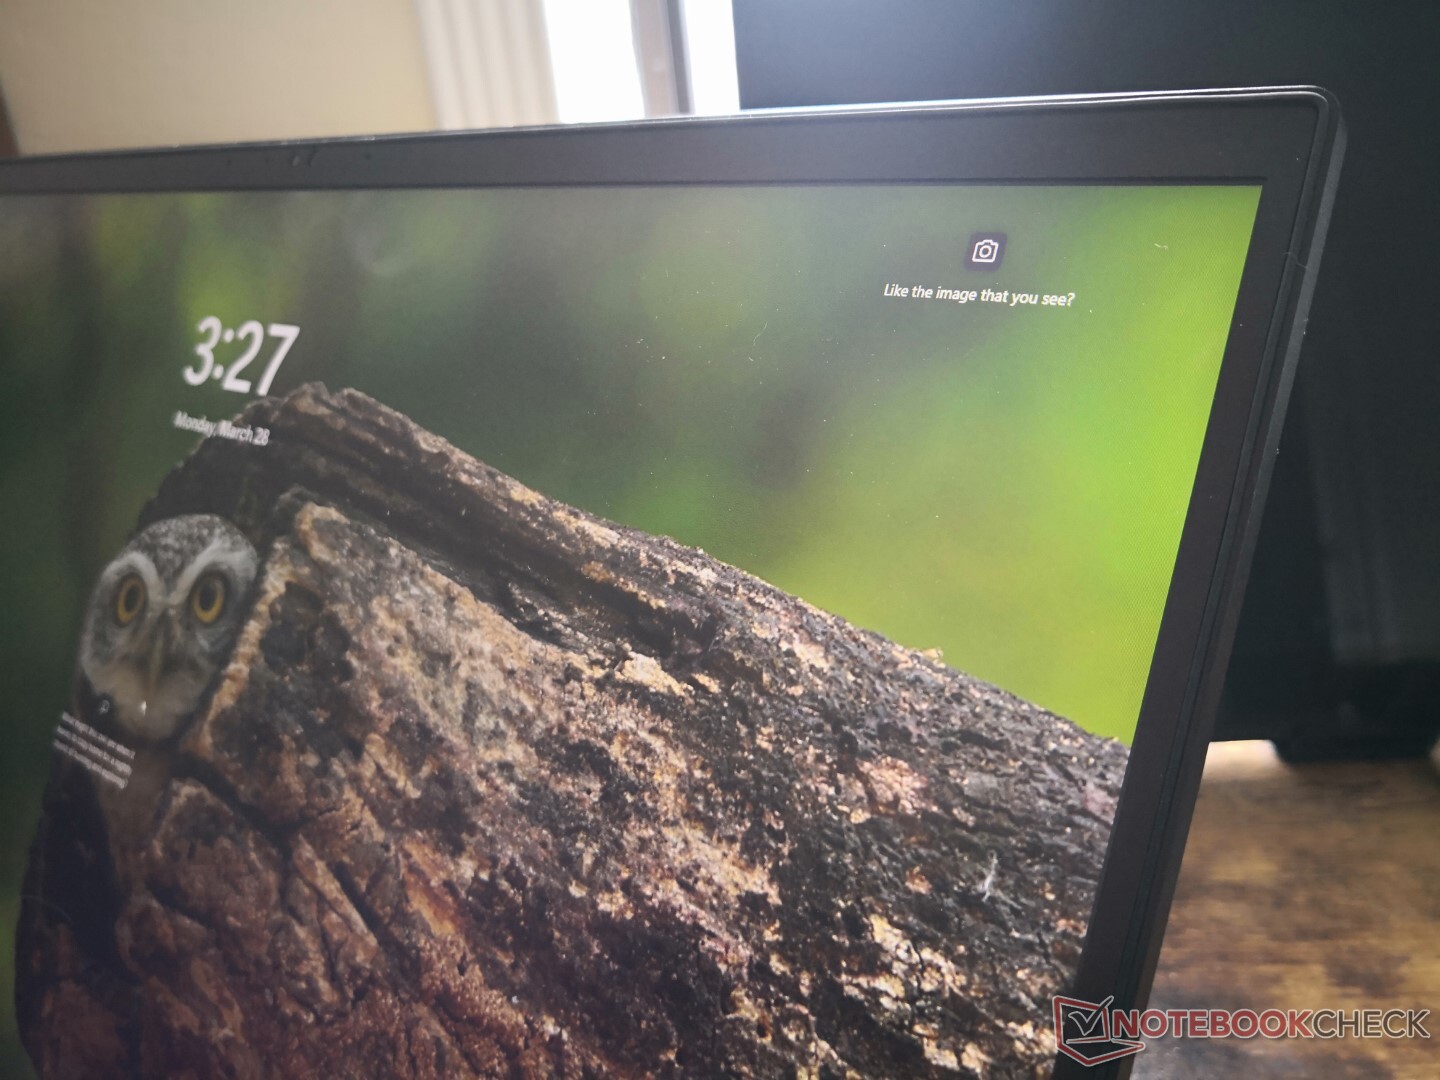
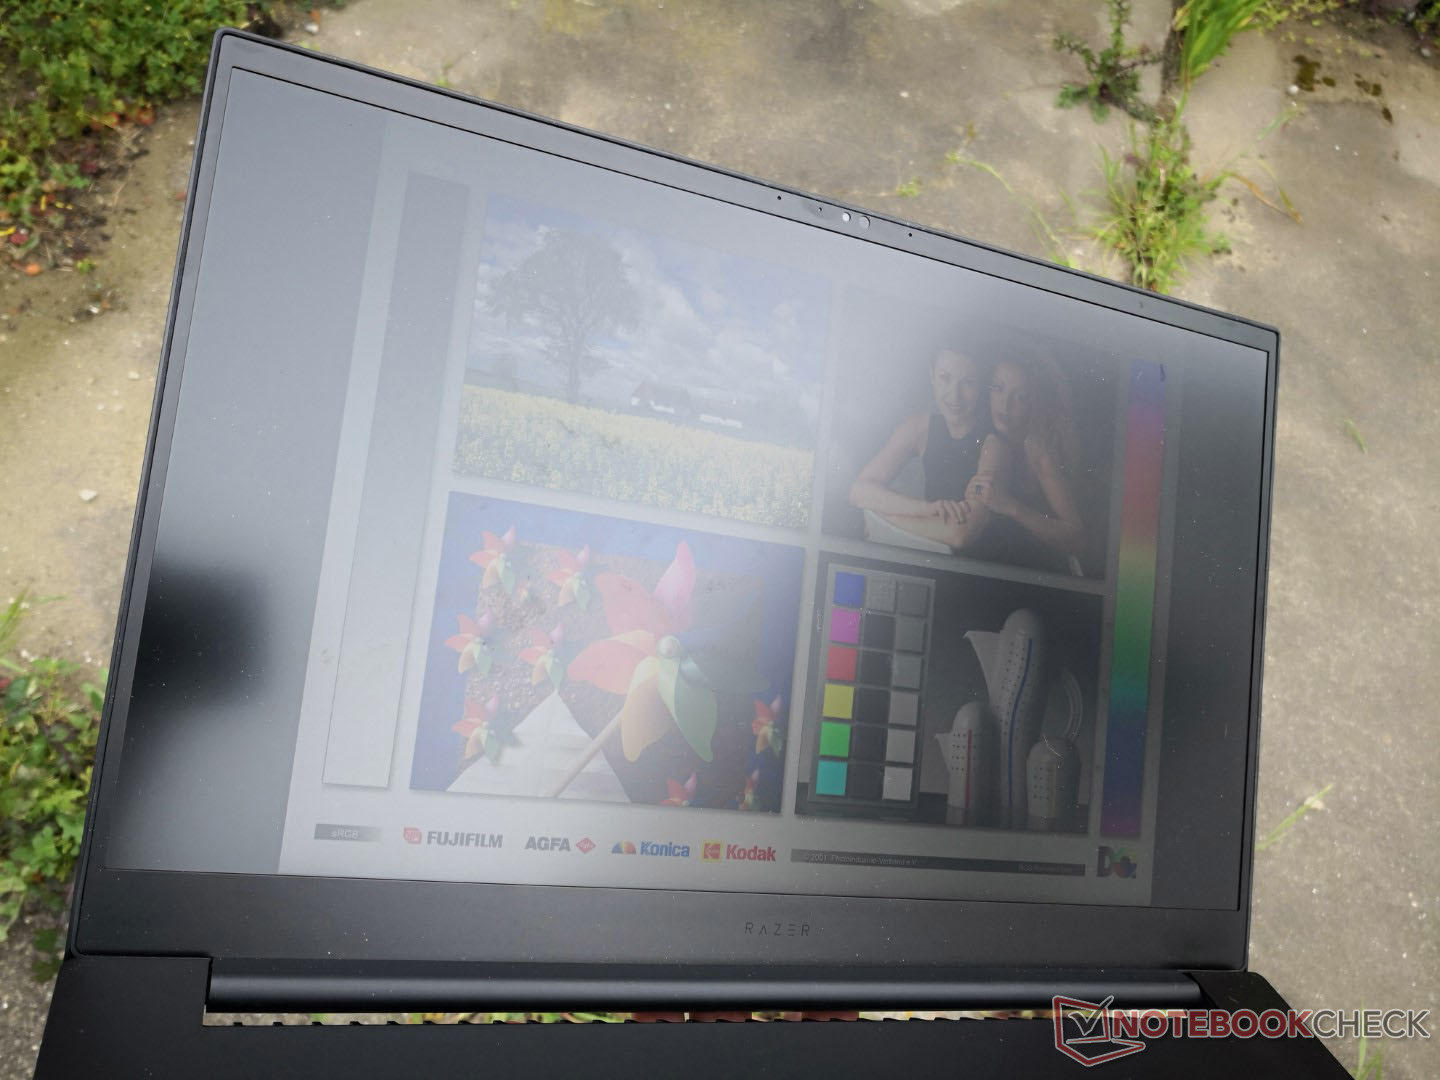
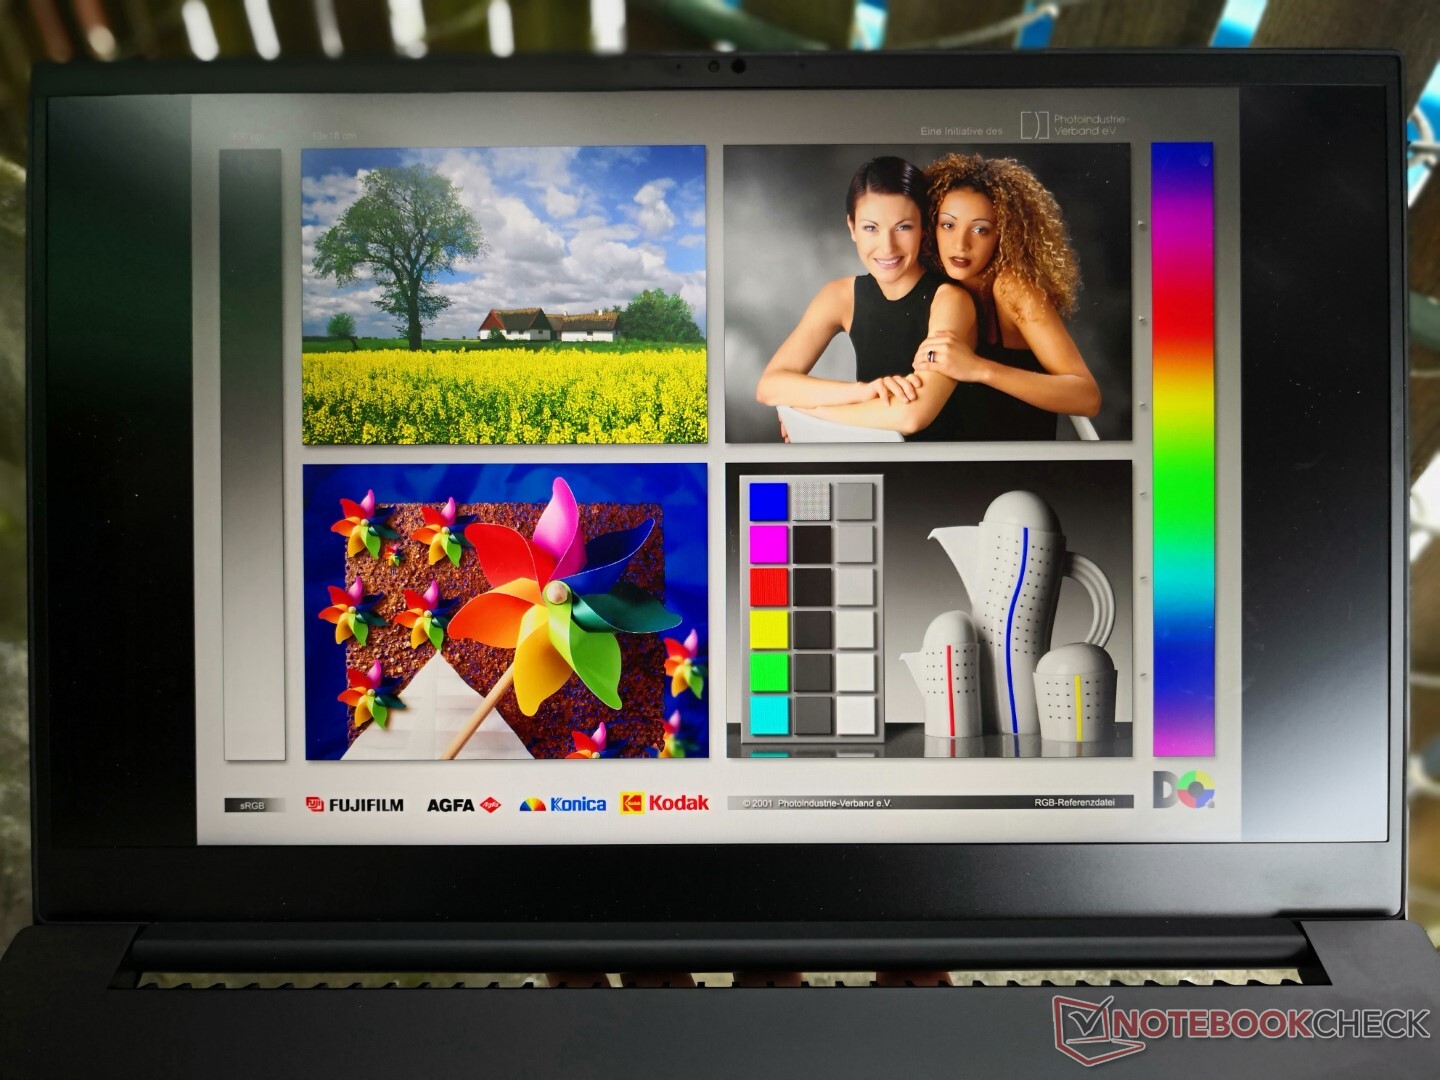
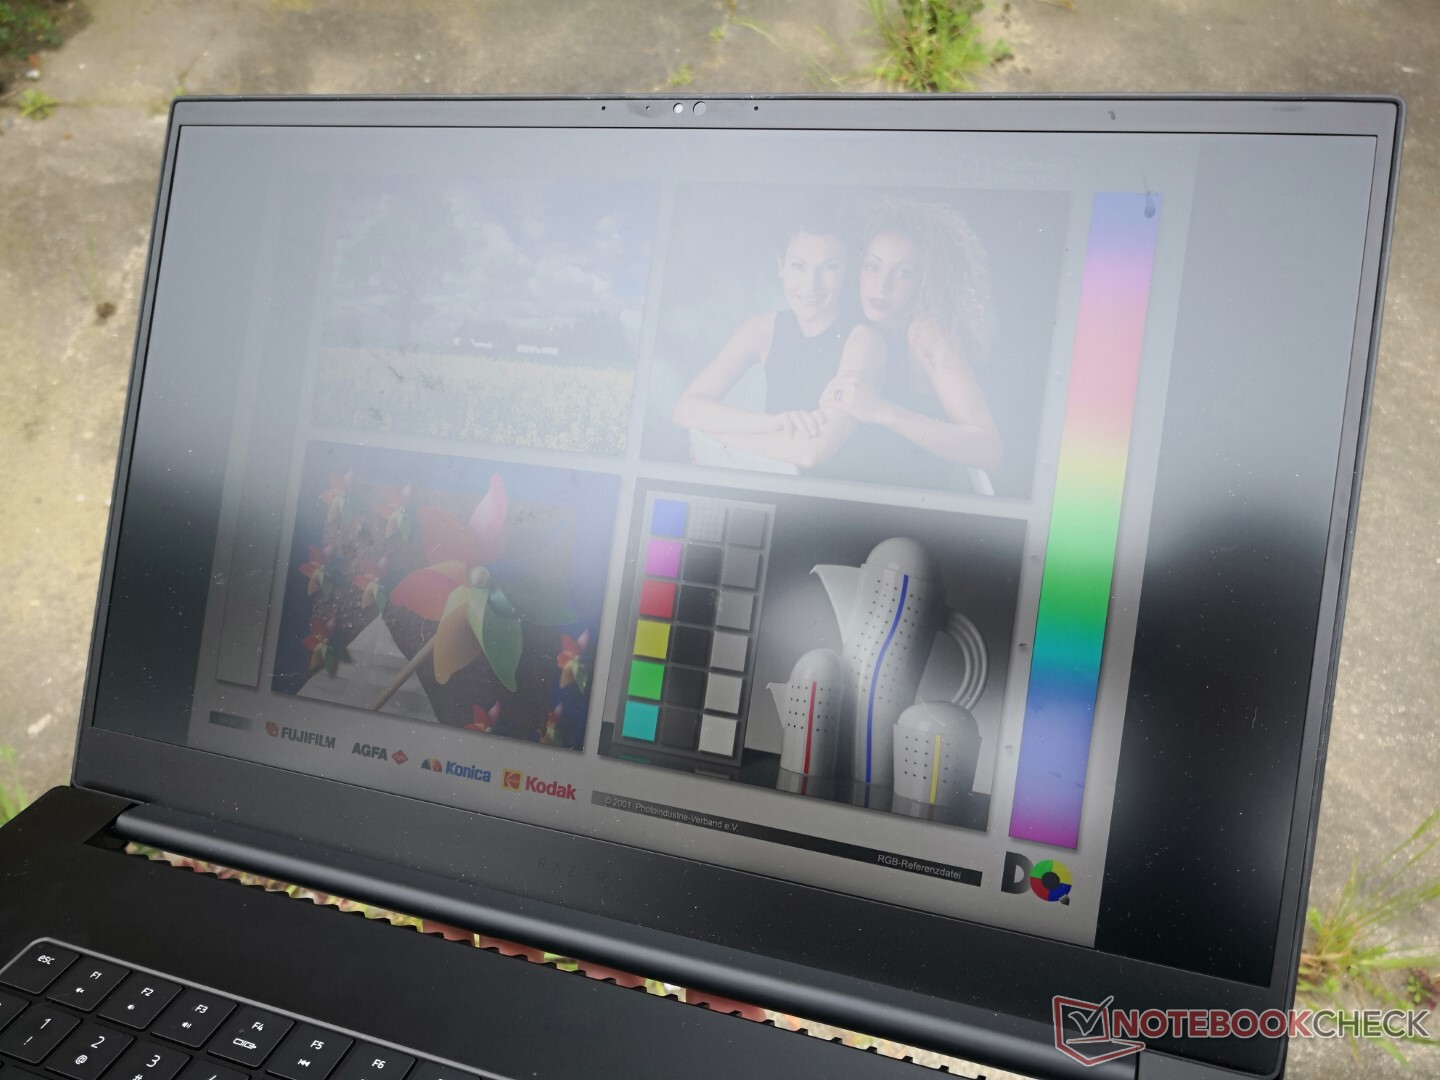
Display — Aktuell ohne OLED-Optionen
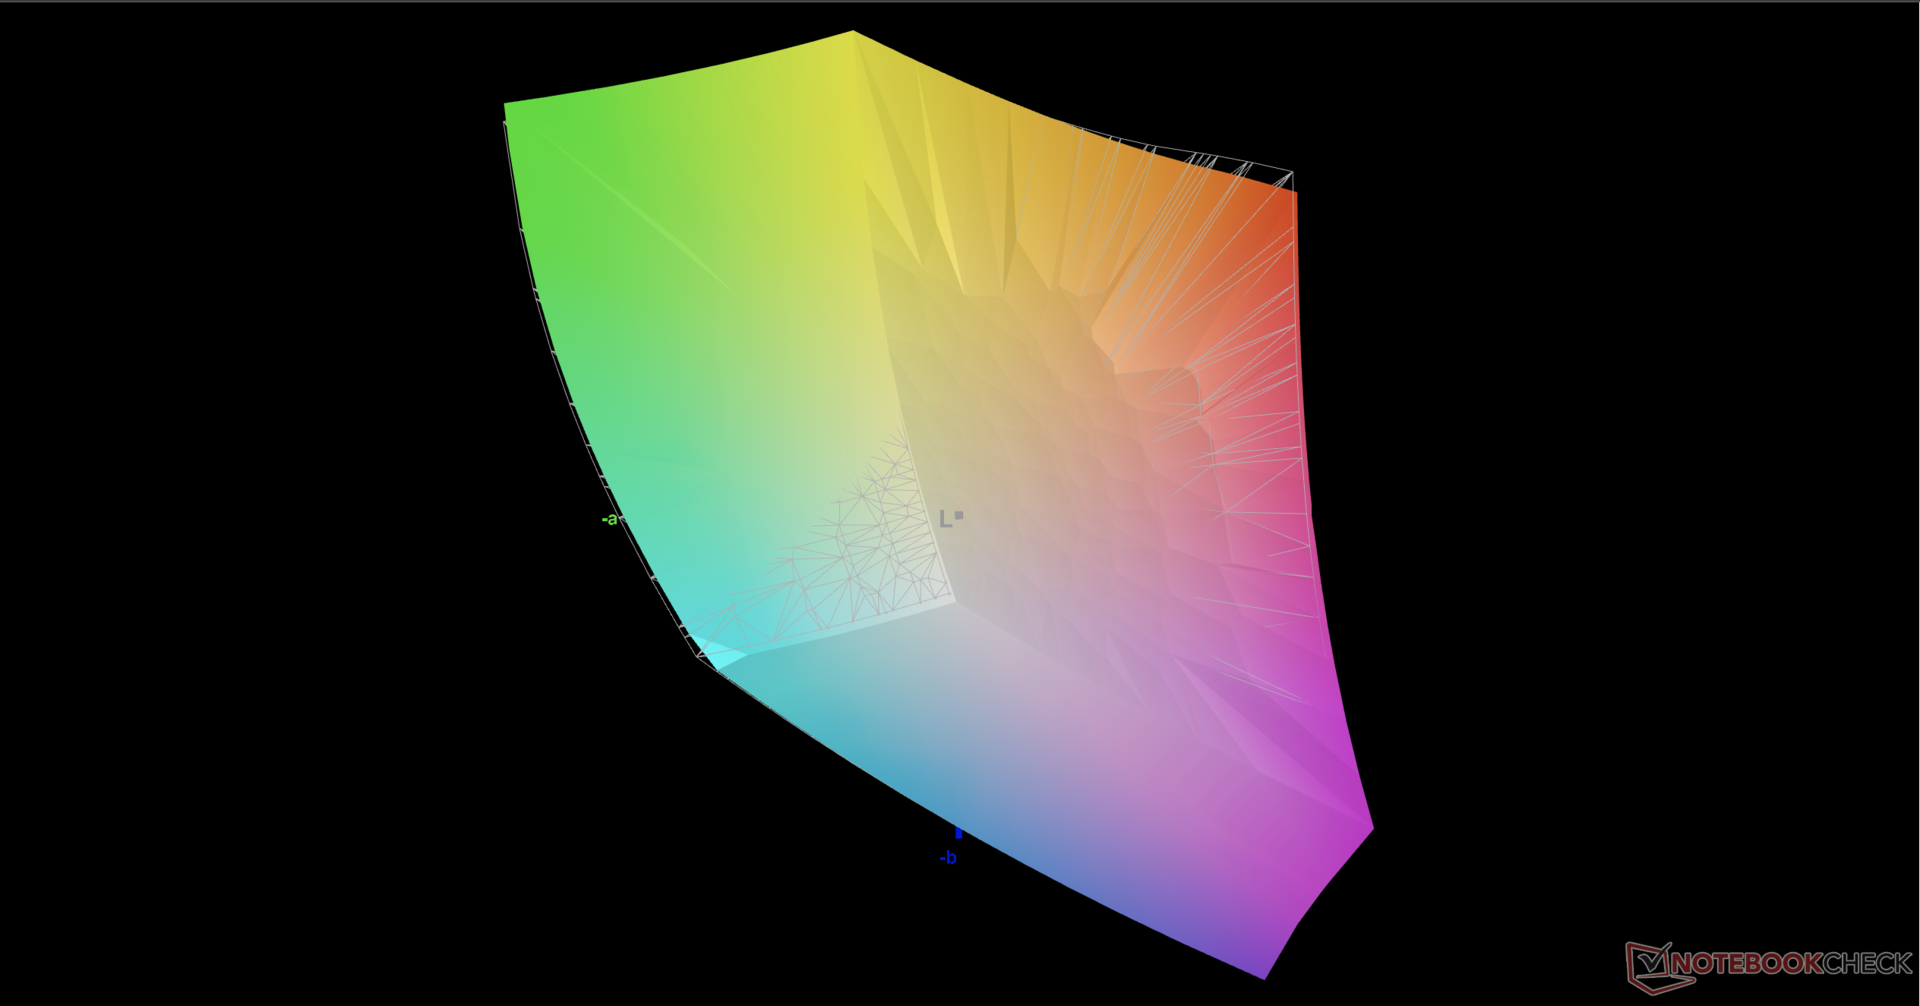
Das IPS-Panel BOE NE173QHM-NZ1 macht unser Testgerät fit für die Bildbearbeitung und Spiele. Es bietet eine vollständige Abdeckung des DCI-P3-Farbspektrums für digitale Mediengestalter und macht Gamer mit schnellen Schwarz-zu-Weiß-Reaktionszeiten, einer schnellen Bildwiederholrate und G-Sync-Unterstützung glücklich. Der Kontrast könnte zwar vor allem im Vergleich zu den OLED-Panels mancher Blade-15-Modelle besser sein, für ein IPS-Panel liegt er jedoch auf einem üblichen Niveau.

| |||||||||||||||||||||||||
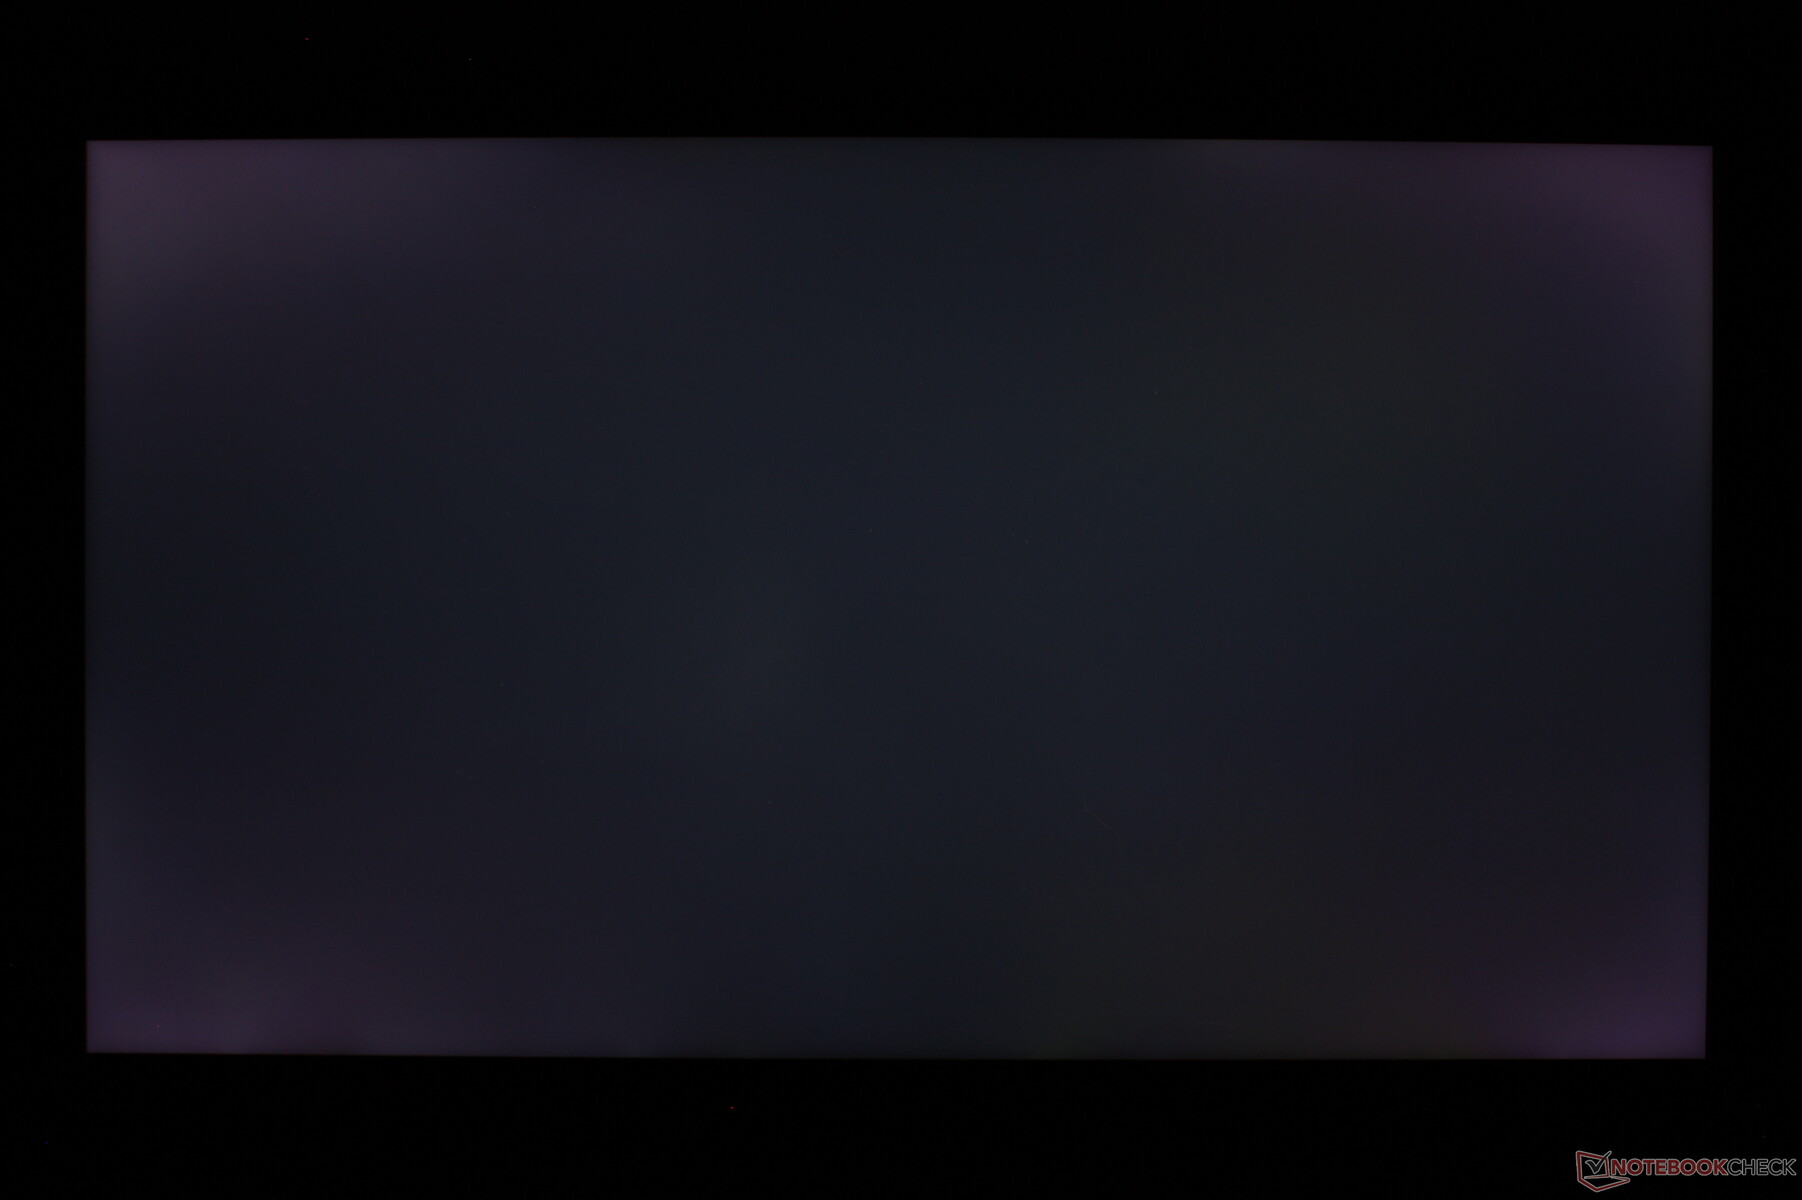
Ausleuchtung: 75 %
Helligkeit Akku: 335.8 cd/m²
Kontrast: 884:1 (Schwarzwert: 0.38 cd/m²)
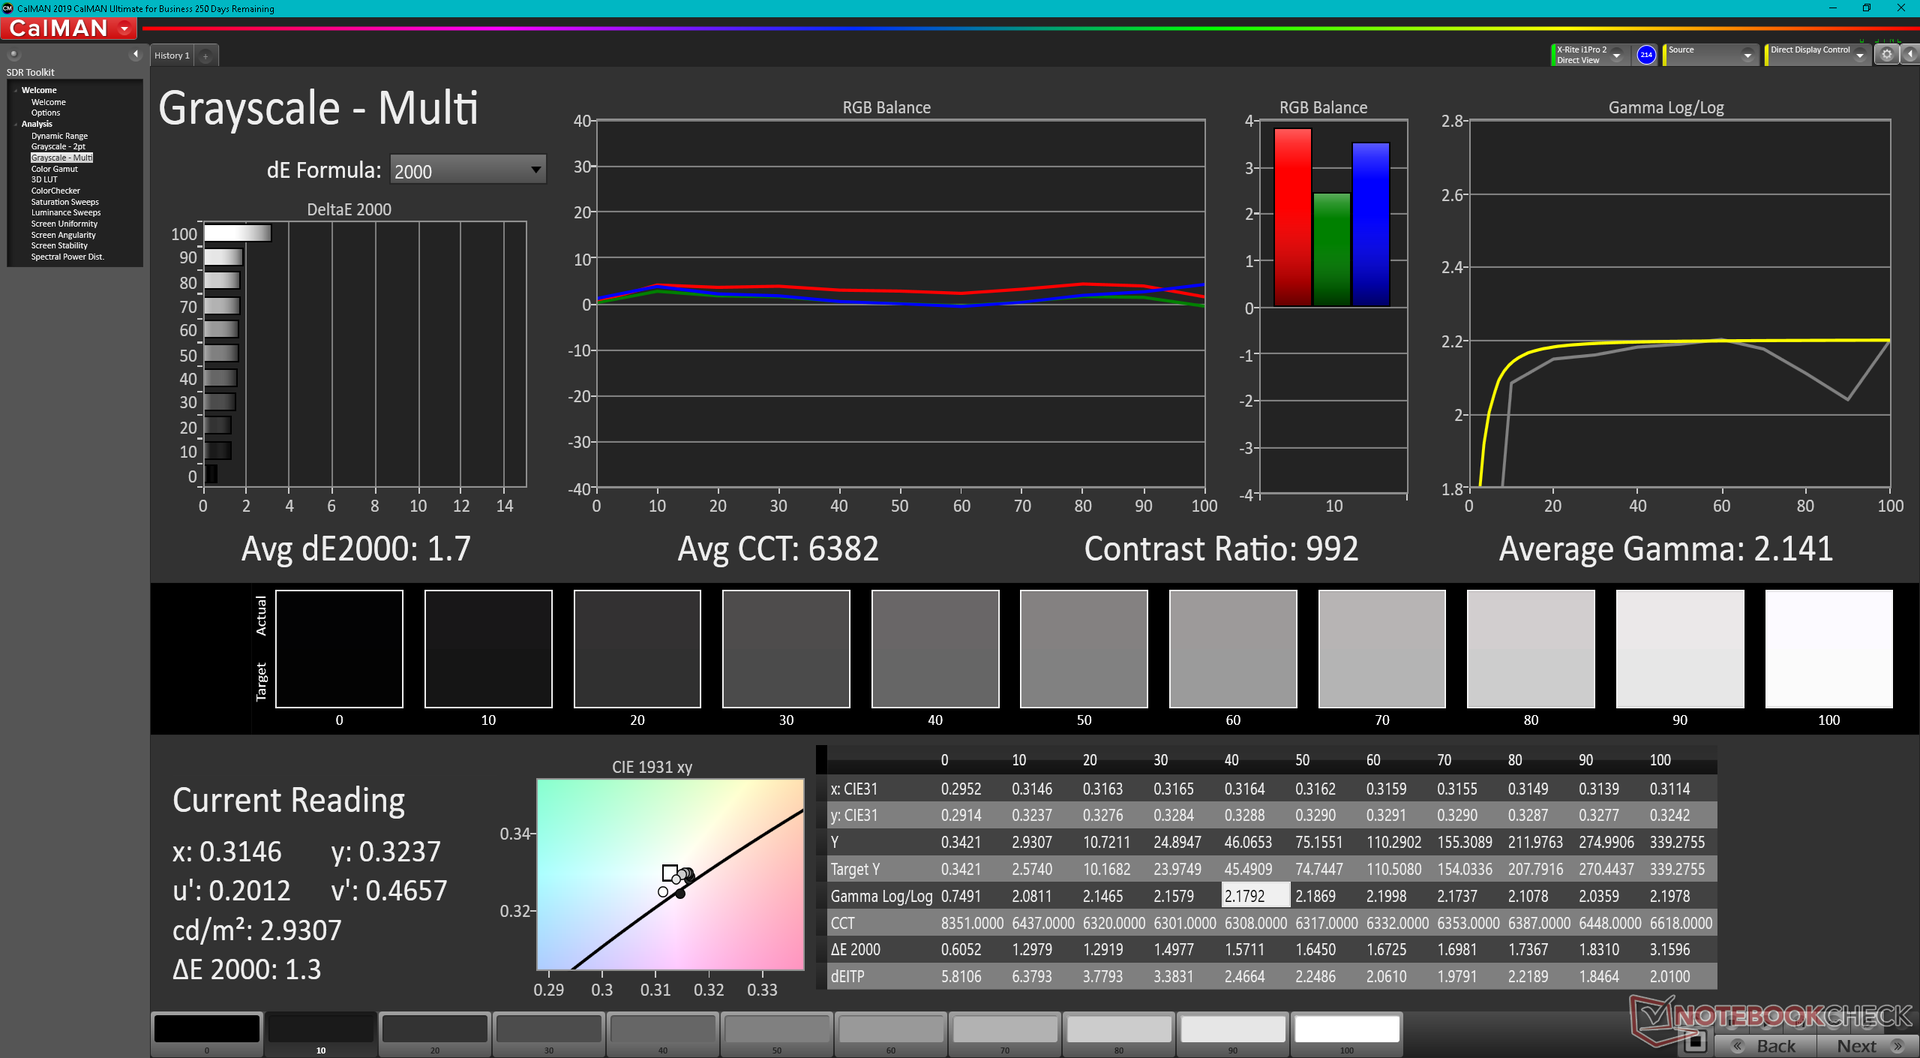
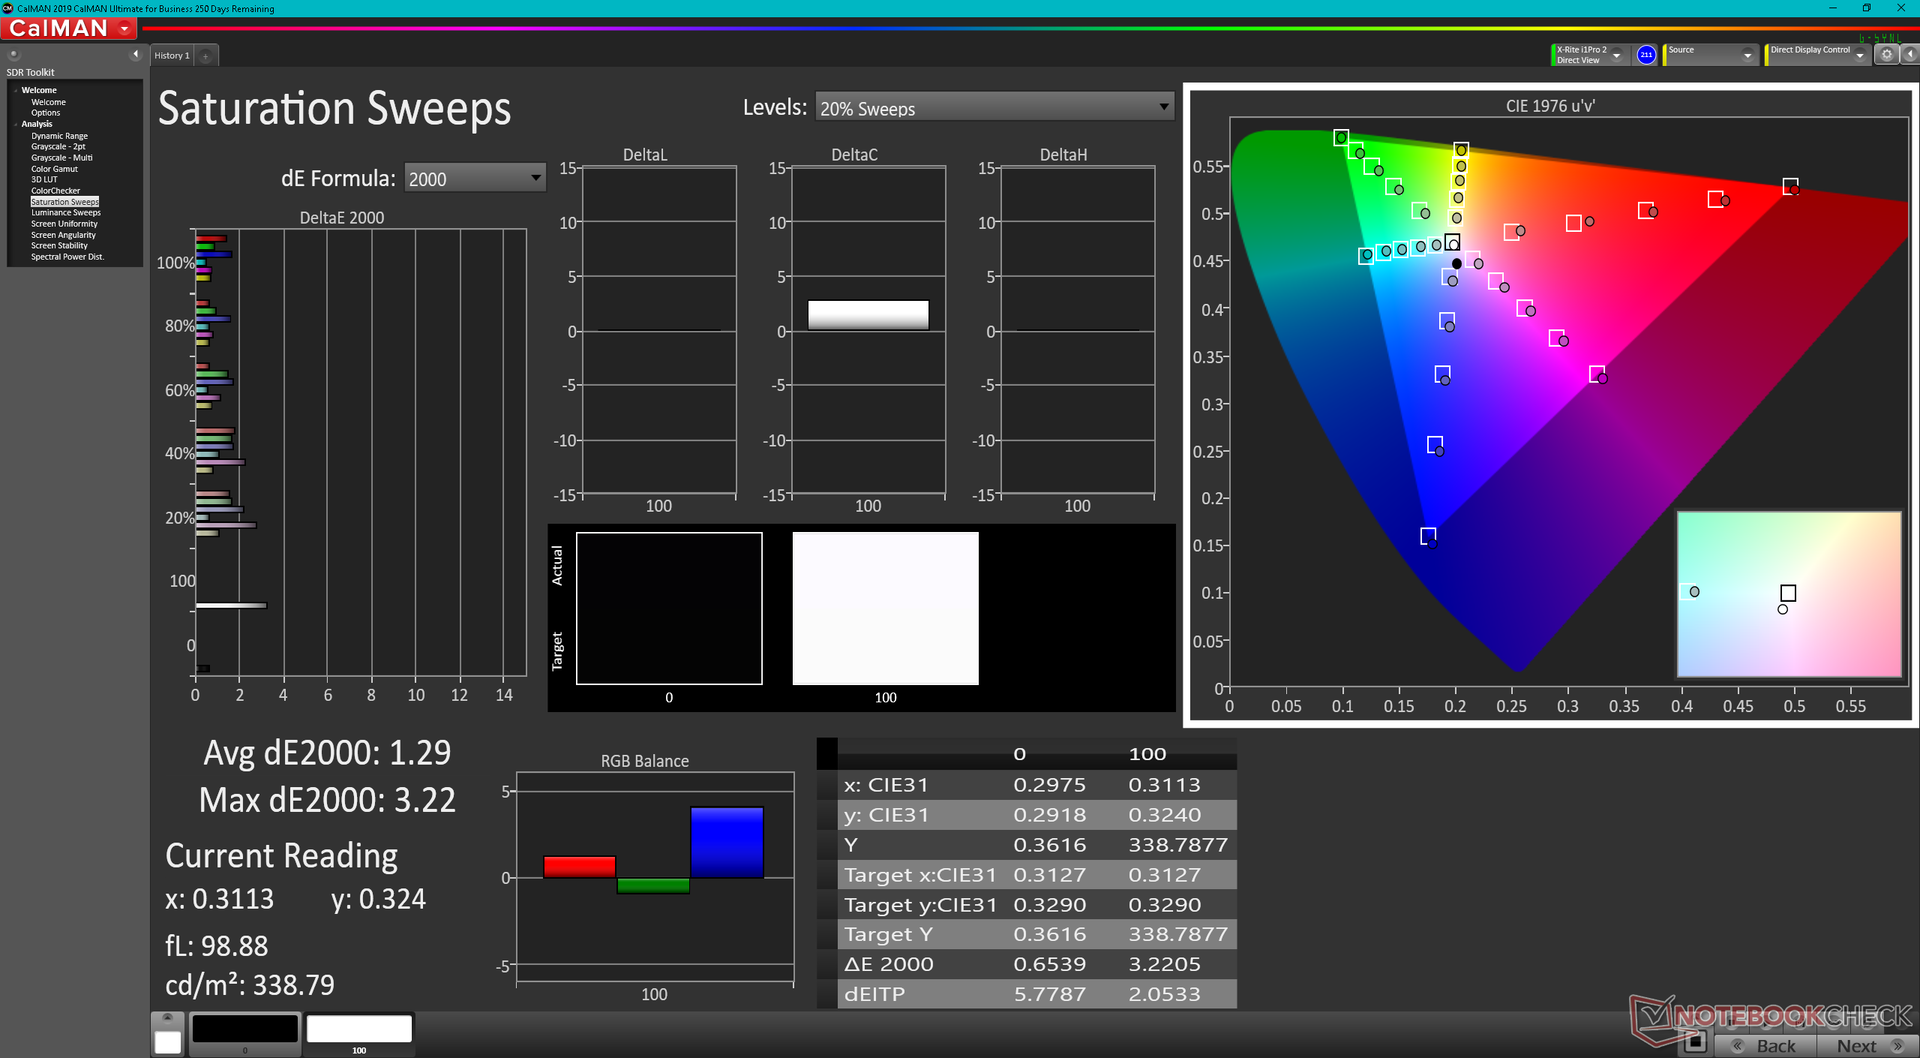
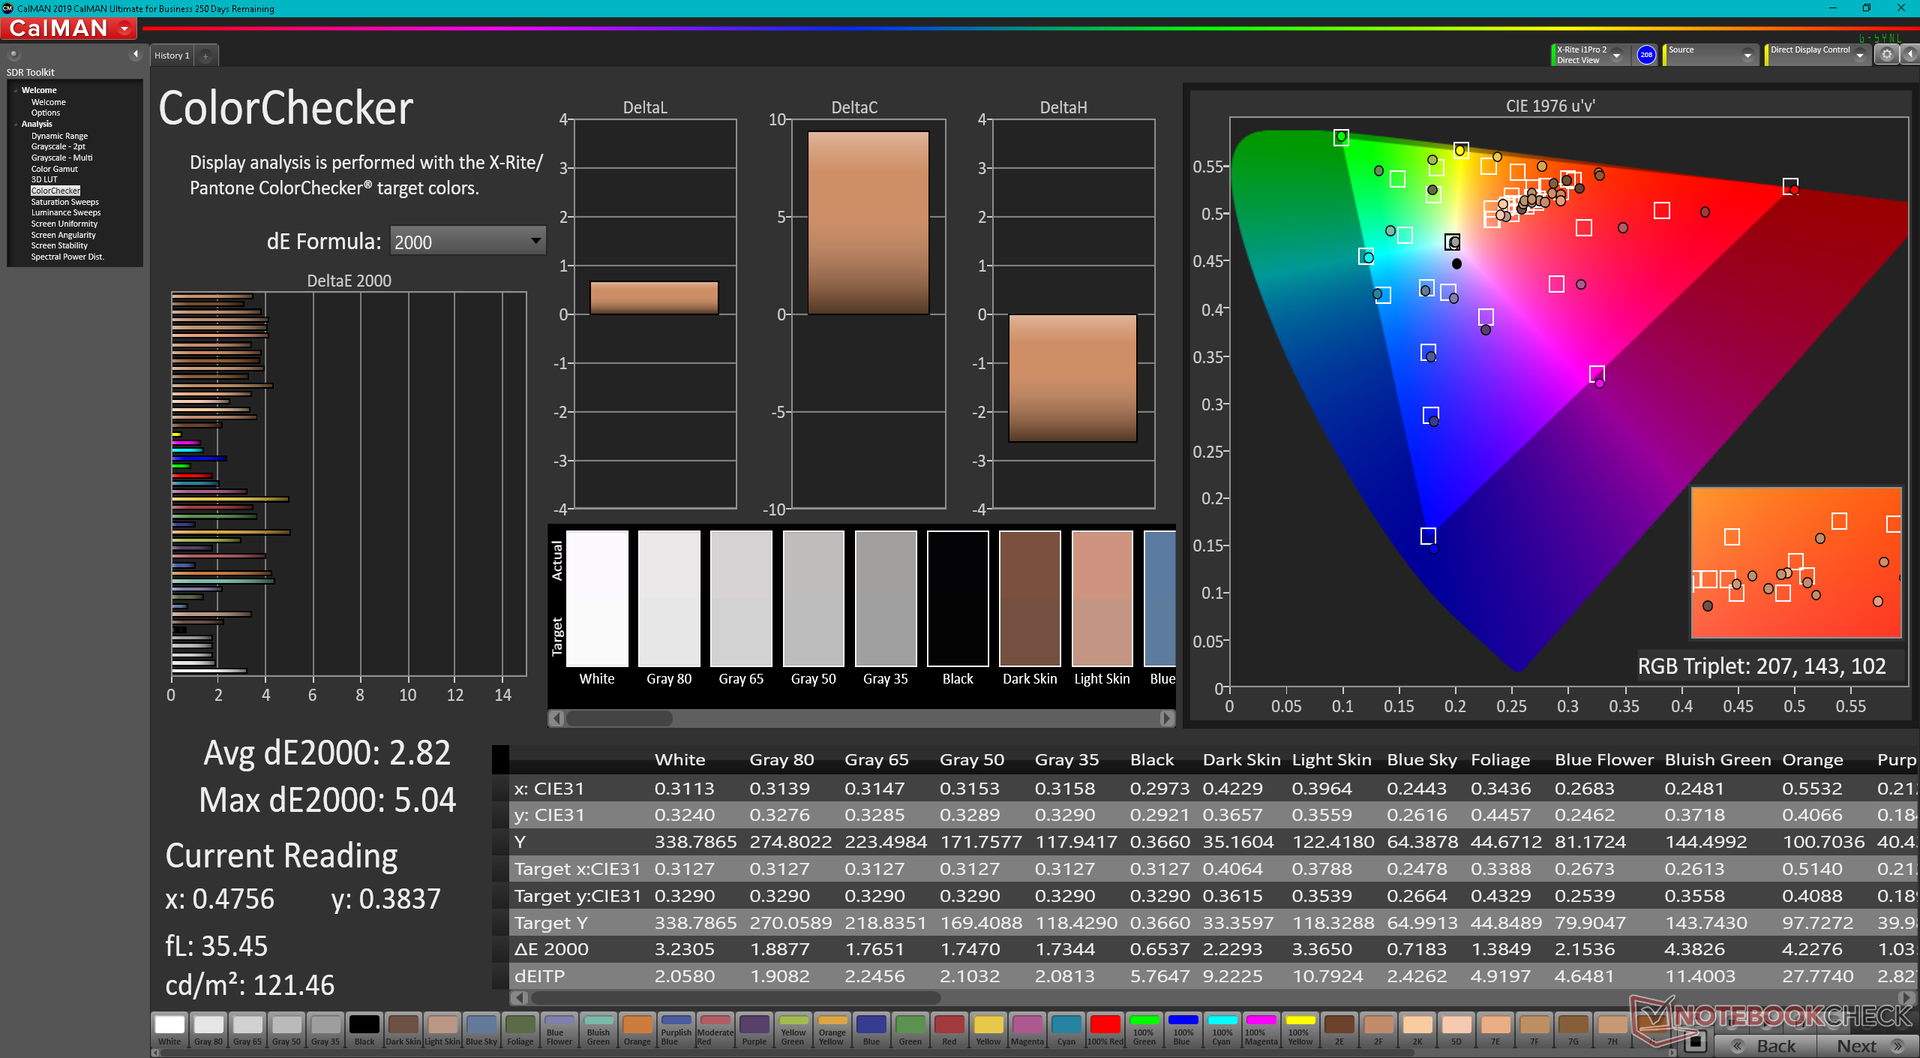
ΔE ColorChecker Calman: 2.82 | ∀{0.5-29.43 Ø4.71}
ΔE Greyscale Calman: 1.7 | ∀{0.09-98 Ø4.96}
86.2% AdobeRGB 1998 (Argyll 3D)
99.9% sRGB (Argyll 3D)
98.7% Display P3 (Argyll 3D)
Gamma: 2.14
CCT: 6382 K
| Razer Blade 17 RTX 3080 Ti BOE NE173QHM-NZ1, IPS, 2560x1440, 17.3" | Razer Blade Pro 17 2021 (QHD Touch) AU Optronics B173ZAN03.3, IPS, 3840x2160, 17.3" | MSI GS76 Stealth 11UH AUO B173ZAN06.1 (AUODE95), IPS, 3840x2160, 17.3" | Asus ROG Zephyrus S17 GX703HSD BOE099D (BOE CQ NE173QHM-NY3), IPS, 2560x1440, 17.3" | Aorus 17G YD Sharp LQ173M1JW04, IPS, 1920x1080, 17.3" | Alienware x17 RTX 3080 P48E AU Optronics B173ZAN, IPS, 3840x2160, 17.3" | |
|---|---|---|---|---|---|---|
| Display | 2% | -22% | -3% | -14% | 2% | |
| Display P3 Coverage (%) | 98.7 | 88.6 -10% | 63 -36% | 94.2 -5% | 72.3 -27% | 88.3 -11% |
| sRGB Coverage (%) | 99.9 | 100 0% | 94.8 -5% | 98.7 -1% | 100 0% | 100 0% |
| AdobeRGB 1998 Coverage (%) | 86.2 | 99.9 16% | 65 -25% | 84.4 -2% | 73.7 -15% | 100 16% |
| Response Times | 5% | 47% | 52% | 21% | 14% | |
| Response Time Grey 50% / Grey 80% * (ms) | 17.6 ? | 15.2 ? 14% | 8.8 ? 50% | 4.8 73% | 13.6 ? 23% | 14.4 ? 18% |
| Response Time Black / White * (ms) | 11.4 ? | 12 ? -5% | 6.4 ? 44% | 8 30% | 9.2 ? 19% | 10.4 ? 9% |
| PWM Frequency (Hz) | ||||||
| Bildschirm | -76% | 10% | -8% | -10% | -8% | |
| Helligkeit Bildmitte (cd/m²) | 335.9 | 407.2 21% | 474 41% | 322 -4% | 286 -15% | 438.7 31% |
| Brightness (cd/m²) | 294 | 403 37% | 454 54% | 288 -2% | 282 -4% | 435 48% |
| Brightness Distribution (%) | 75 | 90 20% | 88 17% | 72 -4% | 73 -3% | 91 21% |
| Schwarzwert * (cd/m²) | 0.38 | 0.42 -11% | 0.46 -21% | 0.3 21% | 0.24 37% | 0.48 -26% |
| Kontrast (:1) | 884 | 970 10% | 1030 17% | 1073 21% | 1192 35% | 914 3% |
| Delta E Colorchecker * | 2.82 | 7.25 -157% | 1.5 47% | 3.05 -8% | 2.79 1% | 4.34 -54% |
| Colorchecker dE 2000 max. * | 5.04 | 12.51 -148% | 5.59 -11% | 5.23 -4% | 6.23 -24% | 7.3 -45% |
| Delta E Graustufen * | 1.7 | 8.1 -376% | 2.8 -65% | 3.11 -83% | 3.5 -106% | 2.4 -41% |
| Gamma | 2.14 103% | 2.24 98% | 2.158 102% | 2.13 103% | 2.358 93% | 2.09 105% |
| CCT | 6382 102% | 5925 110% | 6597 99% | 6553 99% | 6147 106% | 6413 101% |
| Colorchecker dE 2000 calibrated * | 3.62 | 0.86 | 1.92 | 0.82 | 0.72 | |
| Farbraum (Prozent von AdobeRGB 1998) (%) | 88.1 | 84 | 74 | |||
| Color Space (Percent of sRGB) (%) | 100 | 99 | 96 | |||
| Durchschnitt gesamt (Programm / Settings) | -23% /
-45% | 12% /
8% | 14% /
2% | -1% /
-6% | 3% /
-2% |
* ... kleinere Werte sind besser
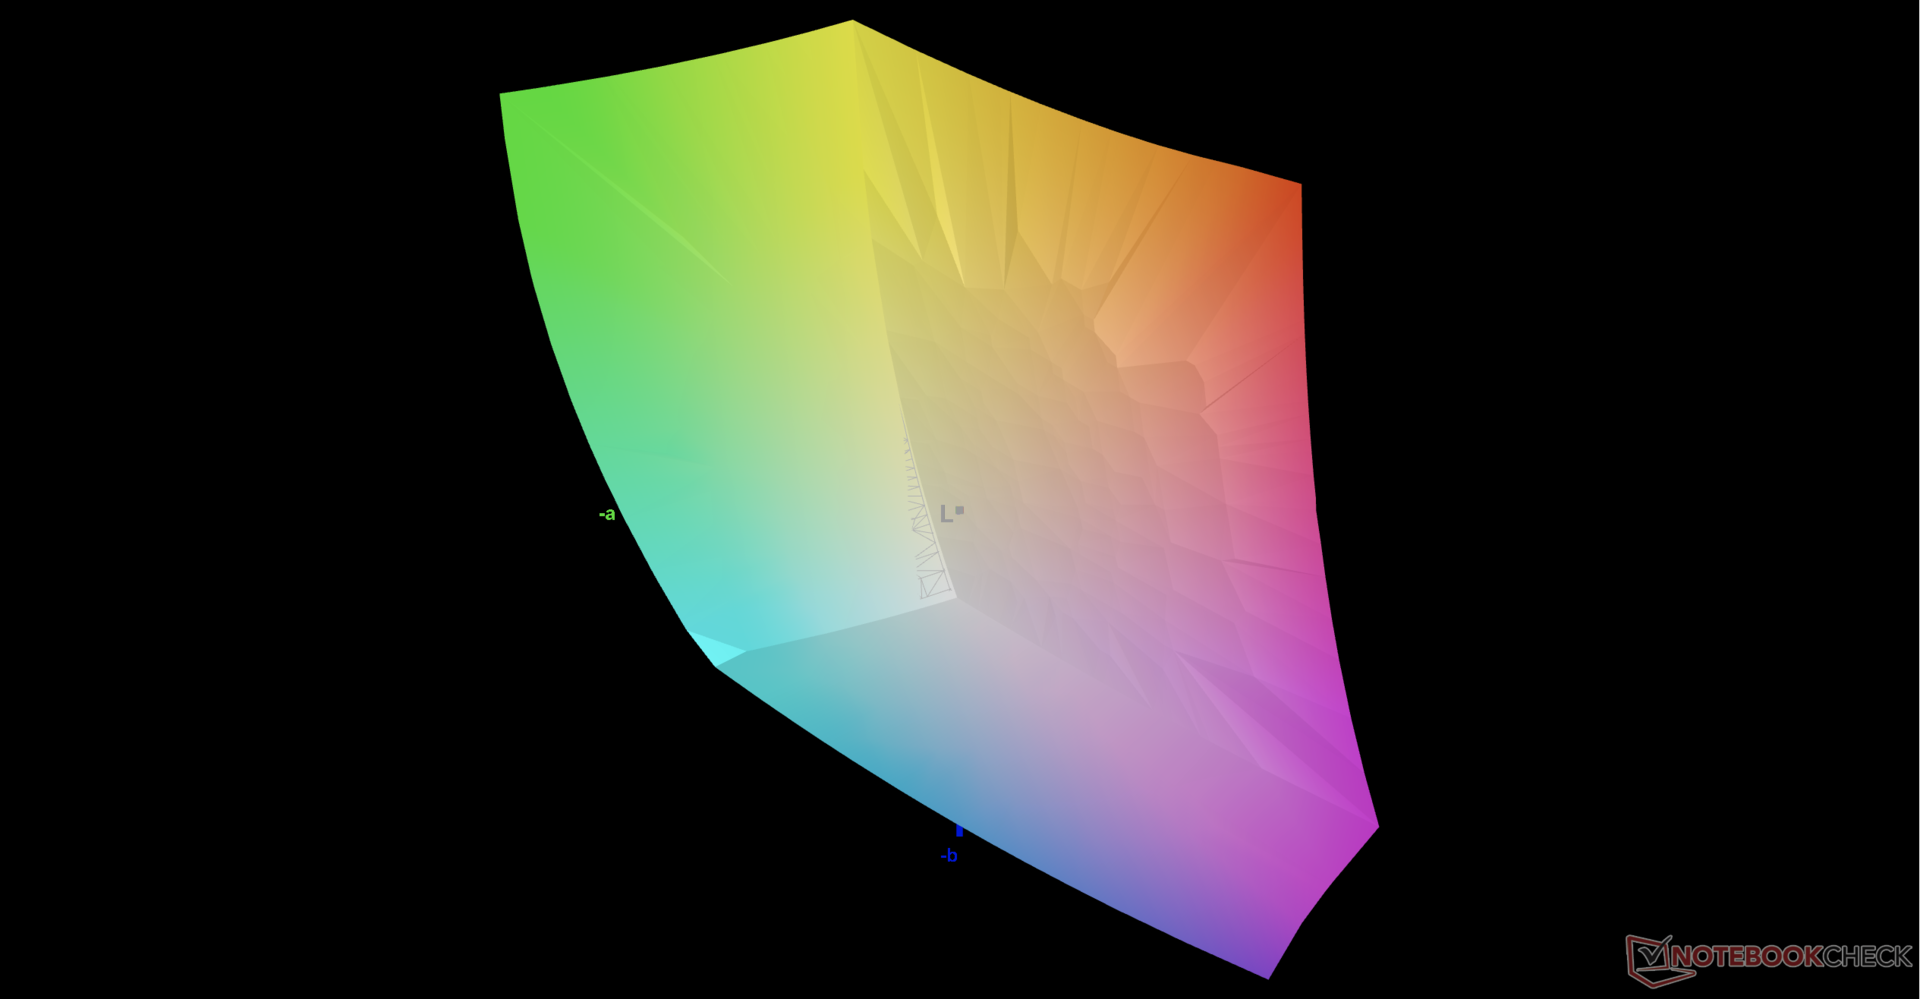
Razer kalibriert jedes Display ab Werk und unsere Messungen mit einem X-Rite-Farbmessgerät scheinen dies zu bestätigen. Die durchschnittlichen Graustufen- und Farb-DeltaE-Werte liegen bei nur 1,7 bzw. 2,82, wodurch eine nachträgliche Kalibrierung nicht erforderlich ist.
Reaktionszeiten (Response Times) des Displays
| ↔ Reaktionszeiten Schwarz zu Weiß | ||
|---|---|---|
| 11.4 ms ... steigend ↗ und fallend ↘ kombiniert | ↗ 4.8 ms steigend | 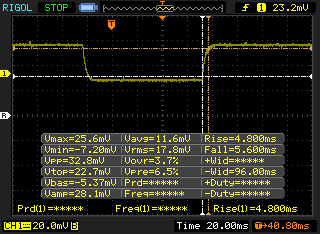 |
| ↘ 5.6 ms fallend | ||
| Die gemessenen Reaktionszeiten sind gut, für anspruchsvolle Spieler könnten der Bildschirm jedoch zu langsam sein. Im Vergleich rangierten die bei uns getesteten Geräte von 0.1 (Minimum) zu 240 (Maximum) ms. » 31 % aller Screens waren schneller als der getestete. Daher sind die gemessenen Reaktionszeiten besser als der Durchschnitt aller vermessenen Geräte (19.8 ms). | ||
| ↔ Reaktionszeiten 50% Grau zu 80% Grau | ||
| 17.6 ms ... steigend ↗ und fallend ↘ kombiniert | ↗ 8.4 ms steigend | 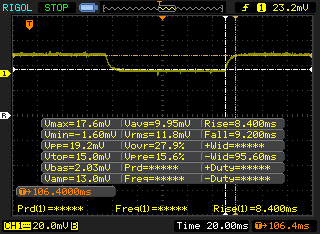 |
| ↘ 9.2 ms fallend | ||
| Die gemessenen Reaktionszeiten sind gut, für anspruchsvolle Spieler könnten der Bildschirm jedoch zu langsam sein. Im Vergleich rangierten die bei uns getesteten Geräte von 0.165 (Minimum) zu 636 (Maximum) ms. » 32 % aller Screens waren schneller als der getestete. Daher sind die gemessenen Reaktionszeiten besser als der Durchschnitt aller vermessenen Geräte (30.9 ms). | ||
Bildschirm-Flackern / PWM (Pulse-Width Modulation)
| Flackern / PWM nicht festgestellt | 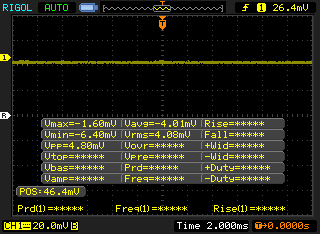 | ||
Im Vergleich: 52 % aller getesteten Geräte nutzten kein PWM um die Helligkeit zu reduzieren. Wenn PWM eingesetzt wurde, dann bei einer Frequenz von durchschnittlich 7741 (Minimum 5, Maximum 343500) Hz. | |||

Leistung — 165-W-Grafik und 12. Generation Intel

Testbedingungen
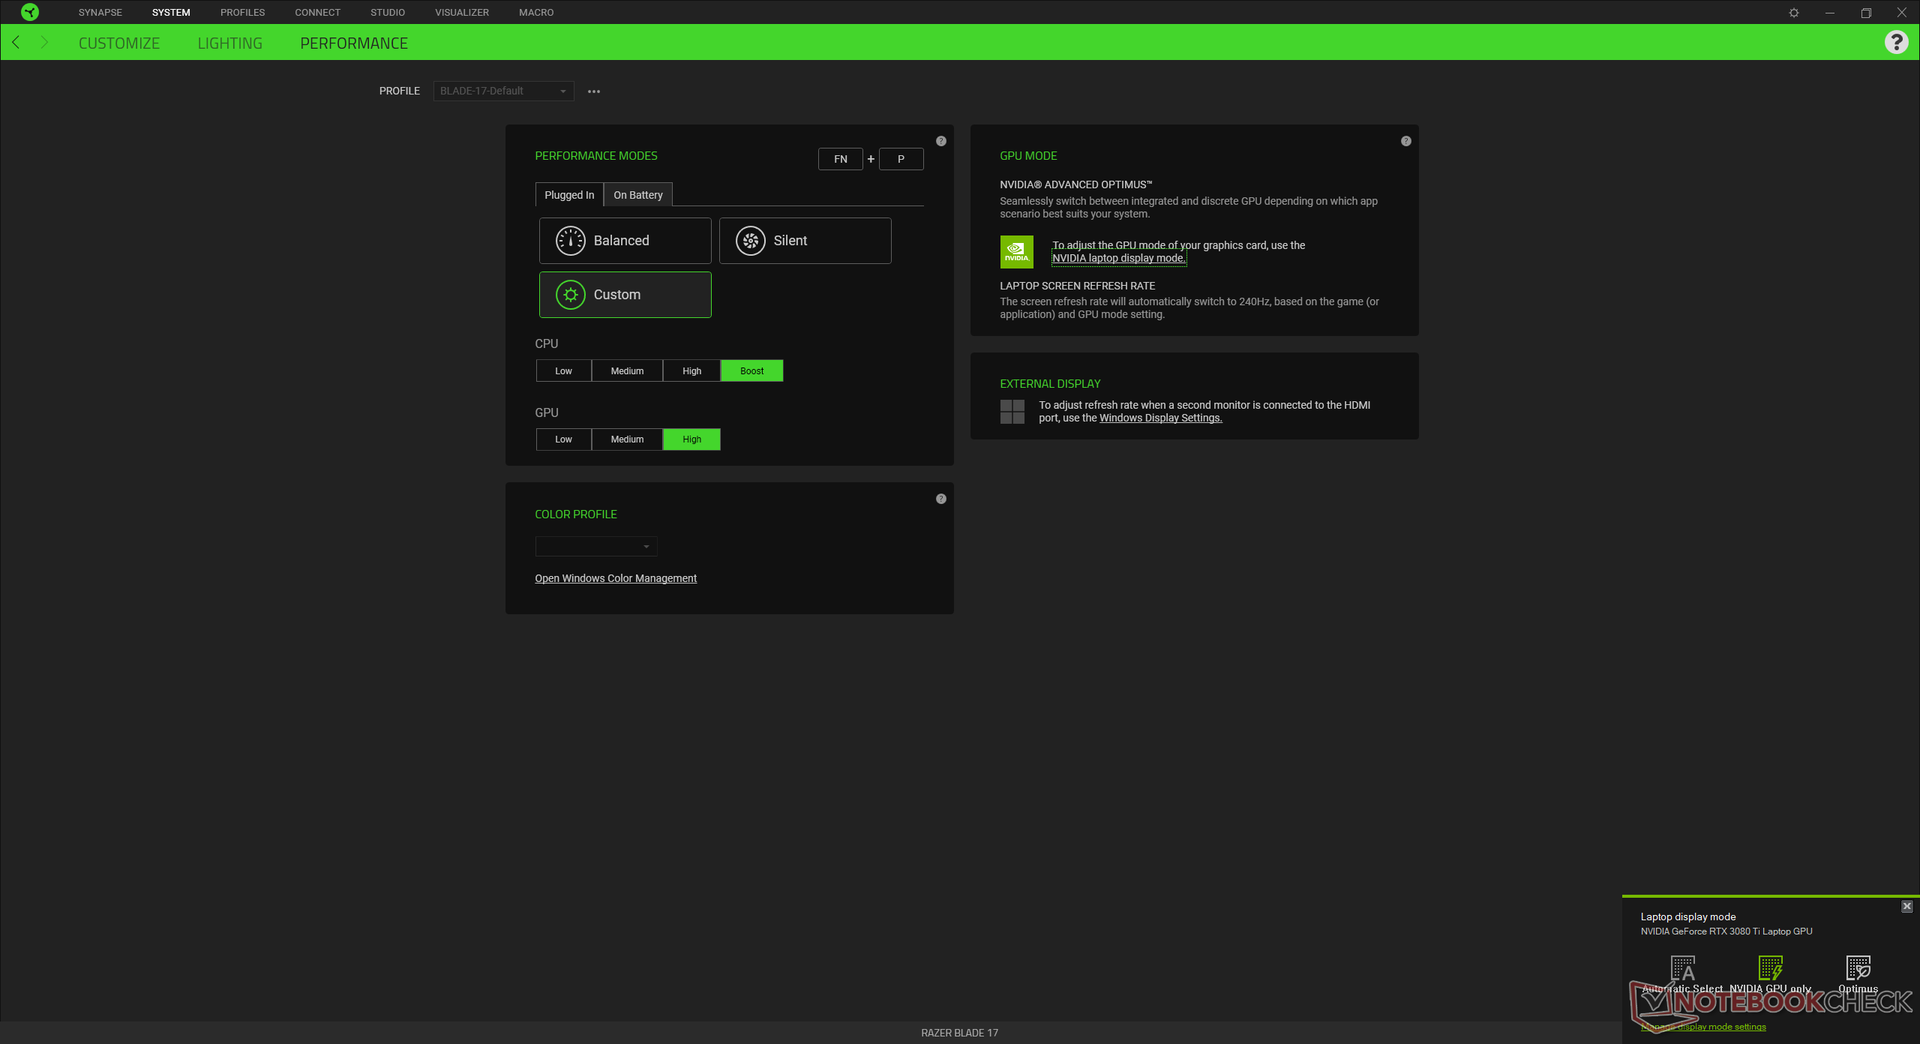
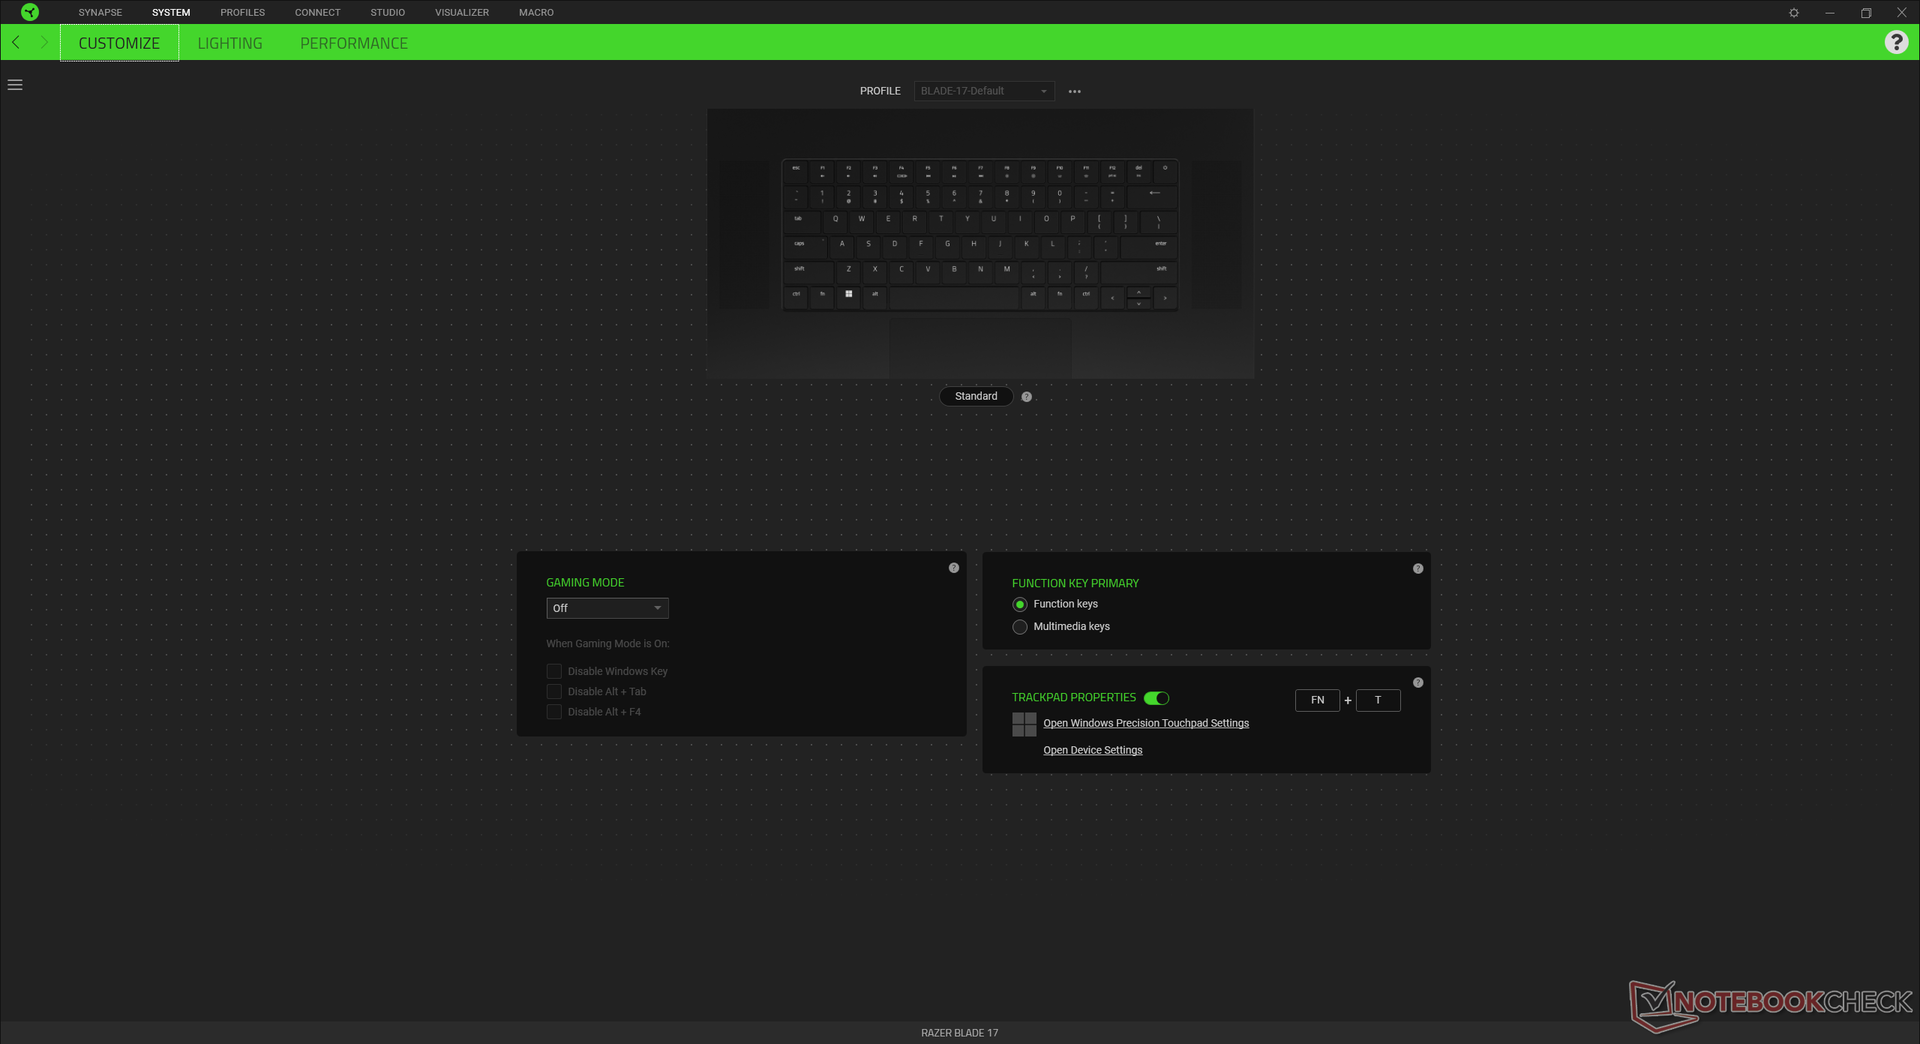
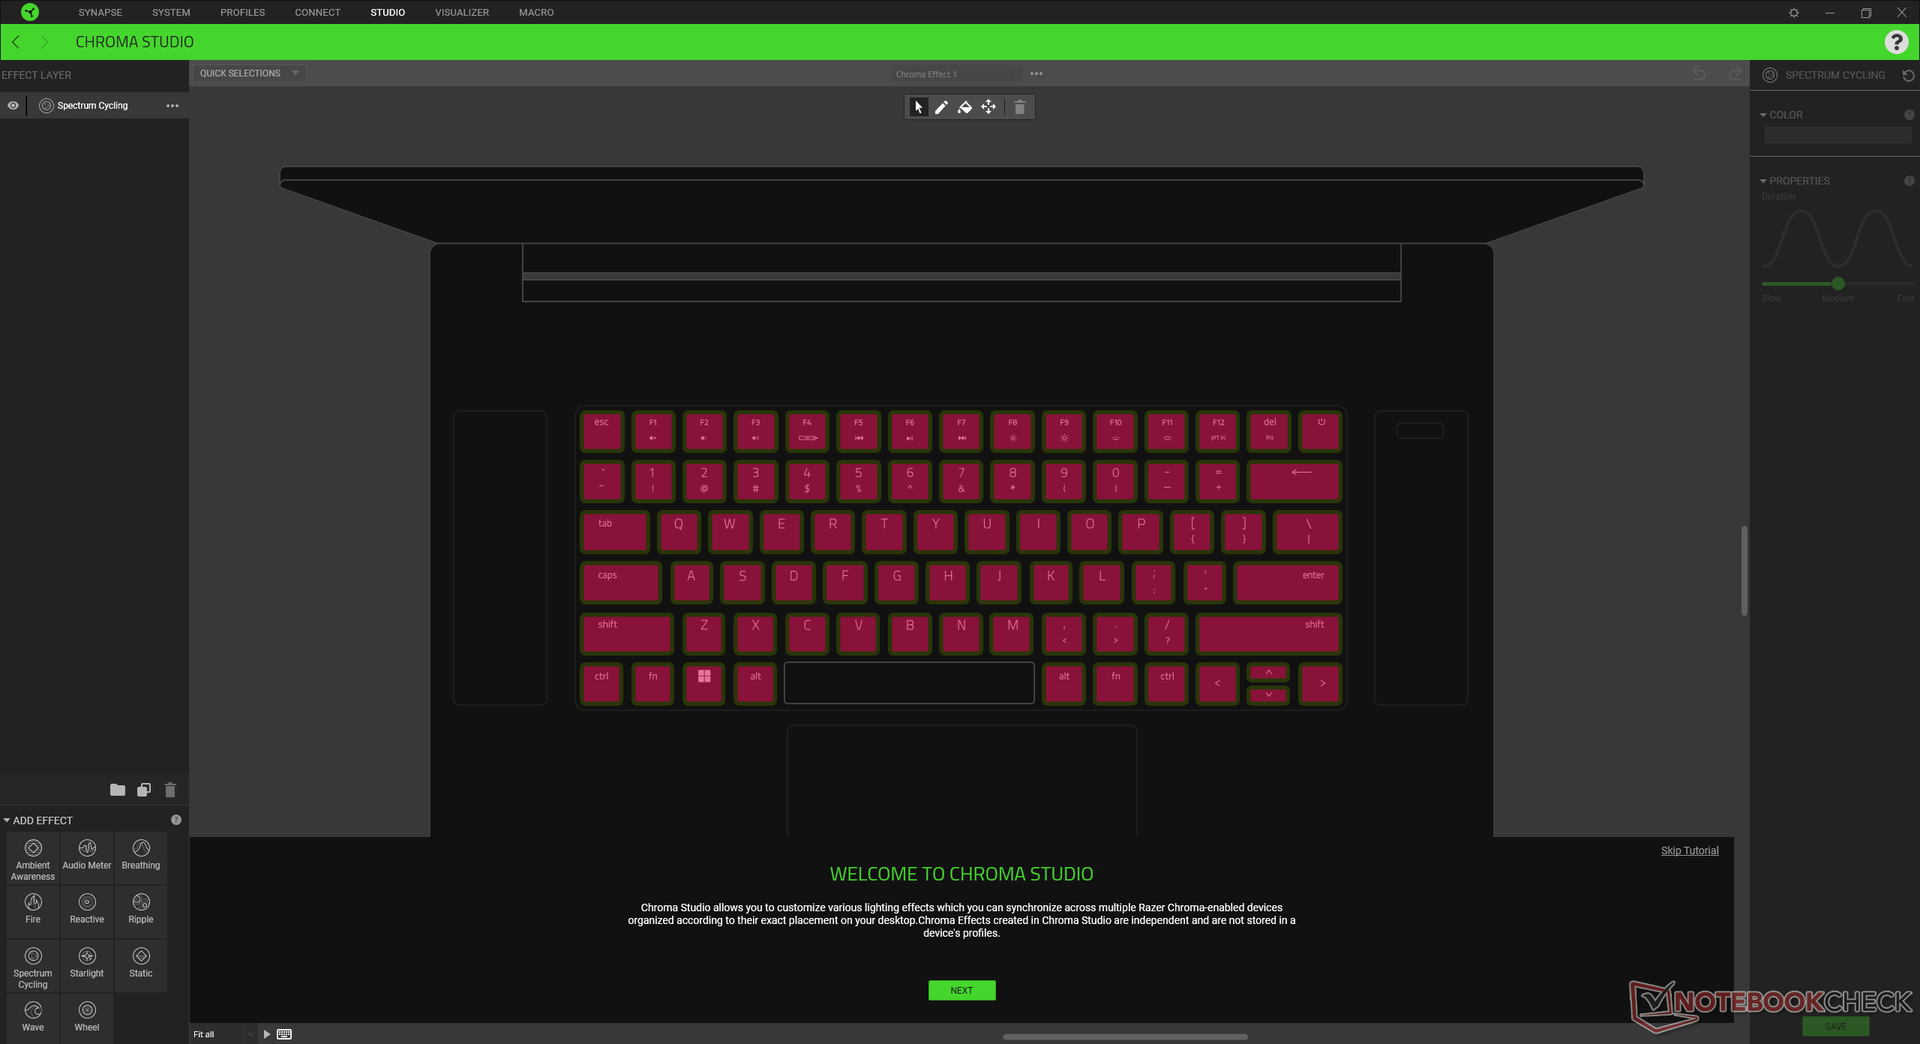
Um die höchstmöglichen Benchmarkergebnisse zu erreichen, haben wir bei unserem Testgerät über den manuellen Modus die Presets "Boost" und "Hoch" für die CPU und GPU ausgewählt. Man sollte sich mit der Synapse-Software vertraut machen, da sie das Steuerungszentrum für systemspezifische Funktionen und Leistungsprofile ist.
Das Blade 17 ist einer der wenigen Gaming-Laptops, die Advanced Optimus unterstützen und demnach ohne Neustart zwischen dem Optimus- und dem dGPU-G-Sync-Modus wechseln können.
Prozessor
Die CPU-Leistung entspricht relativ zu anderen Laptops mit dem Core i7-12800H unseren Erwartungen. Die reine Leistung liegt ca. 20 bis 25 % und 50 bis 70 % über der eines Core i7-11800H aus der 11. bzw. Core i7-10875H aus der 10. Prozessorgeneration in früheren Blade-Modellen. Bei dem Core-i9-12900H-Modell kann man mit einem Leistungssprung von nur ca. 10 % gegenüber unserer Core-i7-12800H-Konfiguration rechnen.
Die Leistung wird hervorragend aufrechterhalten und die Taktfrequenz bright im Laufe des Cinebench-R15-xT-Schleifentests nicht großartig ein.
Cinebench R15 Multi Dauertest
Cinebench R20: CPU (Multi Core) | CPU (Single Core)
Cinebench R15: CPU Multi 64Bit | CPU Single 64Bit
Blender: v2.79 BMW27 CPU
7-Zip 18.03: 7z b 4 | 7z b 4 -mmt1
Geekbench 5.5: Multi-Core | Single-Core
HWBOT x265 Benchmark v2.2: 4k Preset
LibreOffice : 20 Documents To PDF
R Benchmark 2.5: Overall mean
| Cinebench R23 / Multi Core | |
| MSI GE76 Raider | |
| Schenker Uniwill Technology GM7AG8P | |
| Razer Blade 17 RTX 3080 Ti | |
| Durchschnittliche Intel Core i7-12800H (9777 - 16597, n=5) | |
| Schenker XMG Apex 17 M21 | |
| Gigabyte A7 X1 | |
| Razer Blade 17 RTX 3070 | |
| MSI GE76 Raider 10UH | |
| Lenovo Legion 5 17ACH6H-82JY0003GE | |
| Razer Blade Pro 17 2021 (QHD Touch) | |
| Acer Nitro 5 AN517-53-54DQ | |
| Cinebench R23 / Single Core | |
| Schenker Uniwill Technology GM7AG8P | |
| MSI GE76 Raider | |
| Razer Blade 17 RTX 3080 Ti | |
| Durchschnittliche Intel Core i7-12800H (1796 - 1859, n=5) | |
| Razer Blade 17 RTX 3070 | |
| Gigabyte A7 X1 | |
| Schenker XMG Apex 17 M21 | |
| Acer Nitro 5 AN517-53-54DQ | |
| Lenovo Legion 5 17ACH6H-82JY0003GE | |
| Razer Blade Pro 17 2021 (QHD Touch) | |
| MSI GE76 Raider 10UH | |
| Cinebench R20 / CPU (Multi Core) | |
| MSI GE76 Raider | |
| Schenker Uniwill Technology GM7AG8P | |
| Razer Blade 17 RTX 3080 Ti | |
| Durchschnittliche Intel Core i7-12800H (3741 - 6433, n=5) | |
| Schenker XMG Apex 17 M21 | |
| Gigabyte A7 X1 | |
| Razer Blade 17 RTX 3070 | |
| Lenovo Legion 5 17ACH6H-82JY0003GE | |
| MSI GE76 Raider 10UH | |
| Razer Blade Pro 17 2021 (QHD Touch) | |
| Acer Nitro 5 AN517-53-54DQ | |
| Cinebench R20 / CPU (Single Core) | |
| Schenker Uniwill Technology GM7AG8P | |
| MSI GE76 Raider | |
| Razer Blade 17 RTX 3080 Ti | |
| Durchschnittliche Intel Core i7-12800H (690 - 714, n=5) | |
| Gigabyte A7 X1 | |
| Razer Blade 17 RTX 3070 | |
| Schenker XMG Apex 17 M21 | |
| Acer Nitro 5 AN517-53-54DQ | |
| Lenovo Legion 5 17ACH6H-82JY0003GE | |
| Razer Blade Pro 17 2021 (QHD Touch) | |
| MSI GE76 Raider 10UH | |
| Cinebench R15 / CPU Multi 64Bit | |
| MSI GE76 Raider | |
| Schenker Uniwill Technology GM7AG8P | |
| Durchschnittliche Intel Core i7-12800H (1566 - 2697, n=5) | |
| Razer Blade 17 RTX 3080 Ti | |
| Gigabyte A7 X1 | |
| Schenker XMG Apex 17 M21 | |
| Razer Blade 17 RTX 3070 | |
| Lenovo Legion 5 17ACH6H-82JY0003GE | |
| MSI GE76 Raider 10UH | |
| Razer Blade Pro 17 2021 (QHD Touch) | |
| Acer Nitro 5 AN517-53-54DQ | |
| Cinebench R15 / CPU Single 64Bit | |
| MSI GE76 Raider | |
| Schenker Uniwill Technology GM7AG8P | |
| Razer Blade 17 RTX 3080 Ti | |
| Durchschnittliche Intel Core i7-12800H (242 - 269, n=5) | |
| Gigabyte A7 X1 | |
| Schenker XMG Apex 17 M21 | |
| Razer Blade 17 RTX 3070 | |
| Lenovo Legion 5 17ACH6H-82JY0003GE | |
| Acer Nitro 5 AN517-53-54DQ | |
| Razer Blade Pro 17 2021 (QHD Touch) | |
| MSI GE76 Raider 10UH | |
| Blender / v2.79 BMW27 CPU | |
| Acer Nitro 5 AN517-53-54DQ | |
| Razer Blade Pro 17 2021 (QHD Touch) | |
| Lenovo Legion 5 17ACH6H-82JY0003GE | |
| MSI GE76 Raider 10UH | |
| Razer Blade 17 RTX 3070 | |
| Gigabyte A7 X1 | |
| Schenker XMG Apex 17 M21 | |
| Durchschnittliche Intel Core i7-12800H (192 - 306, n=5) | |
| Razer Blade 17 RTX 3080 Ti | |
| Schenker Uniwill Technology GM7AG8P | |
| MSI GE76 Raider | |
| 7-Zip 18.03 / 7z b 4 -mmt1 | |
| MSI GE76 Raider | |
| Schenker Uniwill Technology GM7AG8P | |
| Durchschnittliche Intel Core i7-12800H (5726 - 5976, n=5) | |
| Razer Blade 17 RTX 3080 Ti | |
| Gigabyte A7 X1 | |
| Schenker XMG Apex 17 M21 | |
| Razer Blade 17 RTX 3070 | |
| Lenovo Legion 5 17ACH6H-82JY0003GE | |
| Razer Blade Pro 17 2021 (QHD Touch) | |
| MSI GE76 Raider 10UH | |
| Acer Nitro 5 AN517-53-54DQ | |
| Geekbench 5.5 / Multi-Core | |
| MSI GE76 Raider | |
| Razer Blade 17 RTX 3080 Ti | |
| Schenker Uniwill Technology GM7AG8P | |
| Durchschnittliche Intel Core i7-12800H (9607 - 12940, n=5) | |
| Schenker XMG Apex 17 M21 | |
| Razer Blade Pro 17 2021 (QHD Touch) | |
| MSI GE76 Raider 10UH | |
| Gigabyte A7 X1 | |
| Lenovo Legion 5 17ACH6H-82JY0003GE | |
| Acer Nitro 5 AN517-53-54DQ | |
| Geekbench 5.5 / Single-Core | |
| MSI GE76 Raider | |
| Schenker Uniwill Technology GM7AG8P | |
| Durchschnittliche Intel Core i7-12800H (1739 - 1842, n=5) | |
| Razer Blade 17 RTX 3080 Ti | |
| Gigabyte A7 X1 | |
| Schenker XMG Apex 17 M21 | |
| Lenovo Legion 5 17ACH6H-82JY0003GE | |
| Acer Nitro 5 AN517-53-54DQ | |
| Razer Blade Pro 17 2021 (QHD Touch) | |
| MSI GE76 Raider 10UH | |
| HWBOT x265 Benchmark v2.2 / 4k Preset | |
| MSI GE76 Raider | |
| Schenker Uniwill Technology GM7AG8P | |
| Razer Blade 17 RTX 3080 Ti | |
| Durchschnittliche Intel Core i7-12800H (11.7 - 19.4, n=5) | |
| Schenker XMG Apex 17 M21 | |
| Razer Blade 17 RTX 3070 | |
| Gigabyte A7 X1 | |
| MSI GE76 Raider 10UH | |
| Lenovo Legion 5 17ACH6H-82JY0003GE | |
| Razer Blade Pro 17 2021 (QHD Touch) | |
| Acer Nitro 5 AN517-53-54DQ | |
| LibreOffice / 20 Documents To PDF | |
| Gigabyte A7 X1 | |
| Lenovo Legion 5 17ACH6H-82JY0003GE | |
| Acer Nitro 5 AN517-53-54DQ | |
| MSI GE76 Raider 10UH | |
| Schenker XMG Apex 17 M21 | |
| Razer Blade 17 RTX 3080 Ti | |
| Razer Blade Pro 17 2021 (QHD Touch) | |
| Durchschnittliche Intel Core i7-12800H (41.3 - 51.5, n=5) | |
| Schenker Uniwill Technology GM7AG8P | |
| Razer Blade 17 RTX 3070 | |
| MSI GE76 Raider | |
| R Benchmark 2.5 / Overall mean | |
| Acer Nitro 5 AN517-53-54DQ | |
| MSI GE76 Raider 10UH | |
| Razer Blade Pro 17 2021 (QHD Touch) | |
| Razer Blade 17 RTX 3070 | |
| Lenovo Legion 5 17ACH6H-82JY0003GE | |
| Schenker XMG Apex 17 M21 | |
| Gigabyte A7 X1 | |
| Razer Blade 17 RTX 3080 Ti | |
| Durchschnittliche Intel Core i7-12800H (0.4442 - 0.4715, n=5) | |
| Schenker Uniwill Technology GM7AG8P | |
| MSI GE76 Raider | |
* ... kleinere Werte sind besser
AIDA64: FP32 Ray-Trace | FPU Julia | CPU SHA3 | CPU Queen | FPU SinJulia | FPU Mandel | CPU AES | CPU ZLib | FP64 Ray-Trace | CPU PhotoWorxx
| Performance Rating | |
| Schenker XMG Pro 17 (Late 2021, RTX 3080) | |
| MSI GE76 Raider | |
| Lenovo Legion 5 17ACH6H-82JY0003GE | |
| Schenker Uniwill Technology GM7AG8P | |
| Durchschnittliche Intel Core i7-12800H | |
| Razer Blade 17 RTX 3080 Ti | |
| AIDA64 / FP32 Ray-Trace | |
| Schenker XMG Pro 17 (Late 2021, RTX 3080) | |
| Lenovo Legion 5 17ACH6H-82JY0003GE | |
| MSI GE76 Raider | |
| Durchschnittliche Intel Core i7-12800H (5839 - 15206, n=5) | |
| Schenker Uniwill Technology GM7AG8P | |
| Razer Blade 17 RTX 3080 Ti | |
| AIDA64 / FPU Julia | |
| Lenovo Legion 5 17ACH6H-82JY0003GE | |
| Schenker XMG Pro 17 (Late 2021, RTX 3080) | |
| Durchschnittliche Intel Core i7-12800H (27801 - 80002, n=5) | |
| MSI GE76 Raider | |
| Schenker Uniwill Technology GM7AG8P | |
| Razer Blade 17 RTX 3080 Ti | |
| AIDA64 / CPU SHA3 | |
| Schenker XMG Pro 17 (Late 2021, RTX 3080) | |
| MSI GE76 Raider | |
| Schenker Uniwill Technology GM7AG8P | |
| Durchschnittliche Intel Core i7-12800H (2013 - 3684, n=5) | |
| Lenovo Legion 5 17ACH6H-82JY0003GE | |
| Razer Blade 17 RTX 3080 Ti | |
| AIDA64 / CPU Queen | |
| MSI GE76 Raider | |
| Razer Blade 17 RTX 3080 Ti | |
| Schenker Uniwill Technology GM7AG8P | |
| Durchschnittliche Intel Core i7-12800H (85965 - 108084, n=5) | |
| Schenker XMG Pro 17 (Late 2021, RTX 3080) | |
| Lenovo Legion 5 17ACH6H-82JY0003GE | |
| AIDA64 / FPU SinJulia | |
| MSI GE76 Raider | |
| Schenker Uniwill Technology GM7AG8P | |
| Schenker XMG Pro 17 (Late 2021, RTX 3080) | |
| Lenovo Legion 5 17ACH6H-82JY0003GE | |
| Razer Blade 17 RTX 3080 Ti | |
| Durchschnittliche Intel Core i7-12800H (7027 - 9658, n=5) | |
| AIDA64 / FPU Mandel | |
| Lenovo Legion 5 17ACH6H-82JY0003GE | |
| Schenker XMG Pro 17 (Late 2021, RTX 3080) | |
| MSI GE76 Raider | |
| Durchschnittliche Intel Core i7-12800H (15765 - 38179, n=5) | |
| Schenker Uniwill Technology GM7AG8P | |
| Razer Blade 17 RTX 3080 Ti | |
| AIDA64 / CPU AES | |
| Schenker XMG Pro 17 (Late 2021, RTX 3080) | |
| MSI GE76 Raider | |
| Lenovo Legion 5 17ACH6H-82JY0003GE | |
| Schenker Uniwill Technology GM7AG8P | |
| Durchschnittliche Intel Core i7-12800H (55371 - 73928, n=5) | |
| Razer Blade 17 RTX 3080 Ti | |
| AIDA64 / CPU ZLib | |
| MSI GE76 Raider | |
| Schenker Uniwill Technology GM7AG8P | |
| Durchschnittliche Intel Core i7-12800H (701 - 1047, n=5) | |
| Razer Blade 17 RTX 3080 Ti | |
| Schenker XMG Pro 17 (Late 2021, RTX 3080) | |
| Lenovo Legion 5 17ACH6H-82JY0003GE | |
| AIDA64 / FP64 Ray-Trace | |
| Schenker XMG Pro 17 (Late 2021, RTX 3080) | |
| Lenovo Legion 5 17ACH6H-82JY0003GE | |
| MSI GE76 Raider | |
| Schenker Uniwill Technology GM7AG8P | |
| Durchschnittliche Intel Core i7-12800H (3257 - 8559, n=5) | |
| Razer Blade 17 RTX 3080 Ti | |
| AIDA64 / CPU PhotoWorxx | |
| Razer Blade 17 RTX 3080 Ti | |
| Schenker Uniwill Technology GM7AG8P | |
| MSI GE76 Raider | |
| Durchschnittliche Intel Core i7-12800H (31329 - 40992, n=5) | |
| Schenker XMG Pro 17 (Late 2021, RTX 3080) | |
| Lenovo Legion 5 17ACH6H-82JY0003GE | |
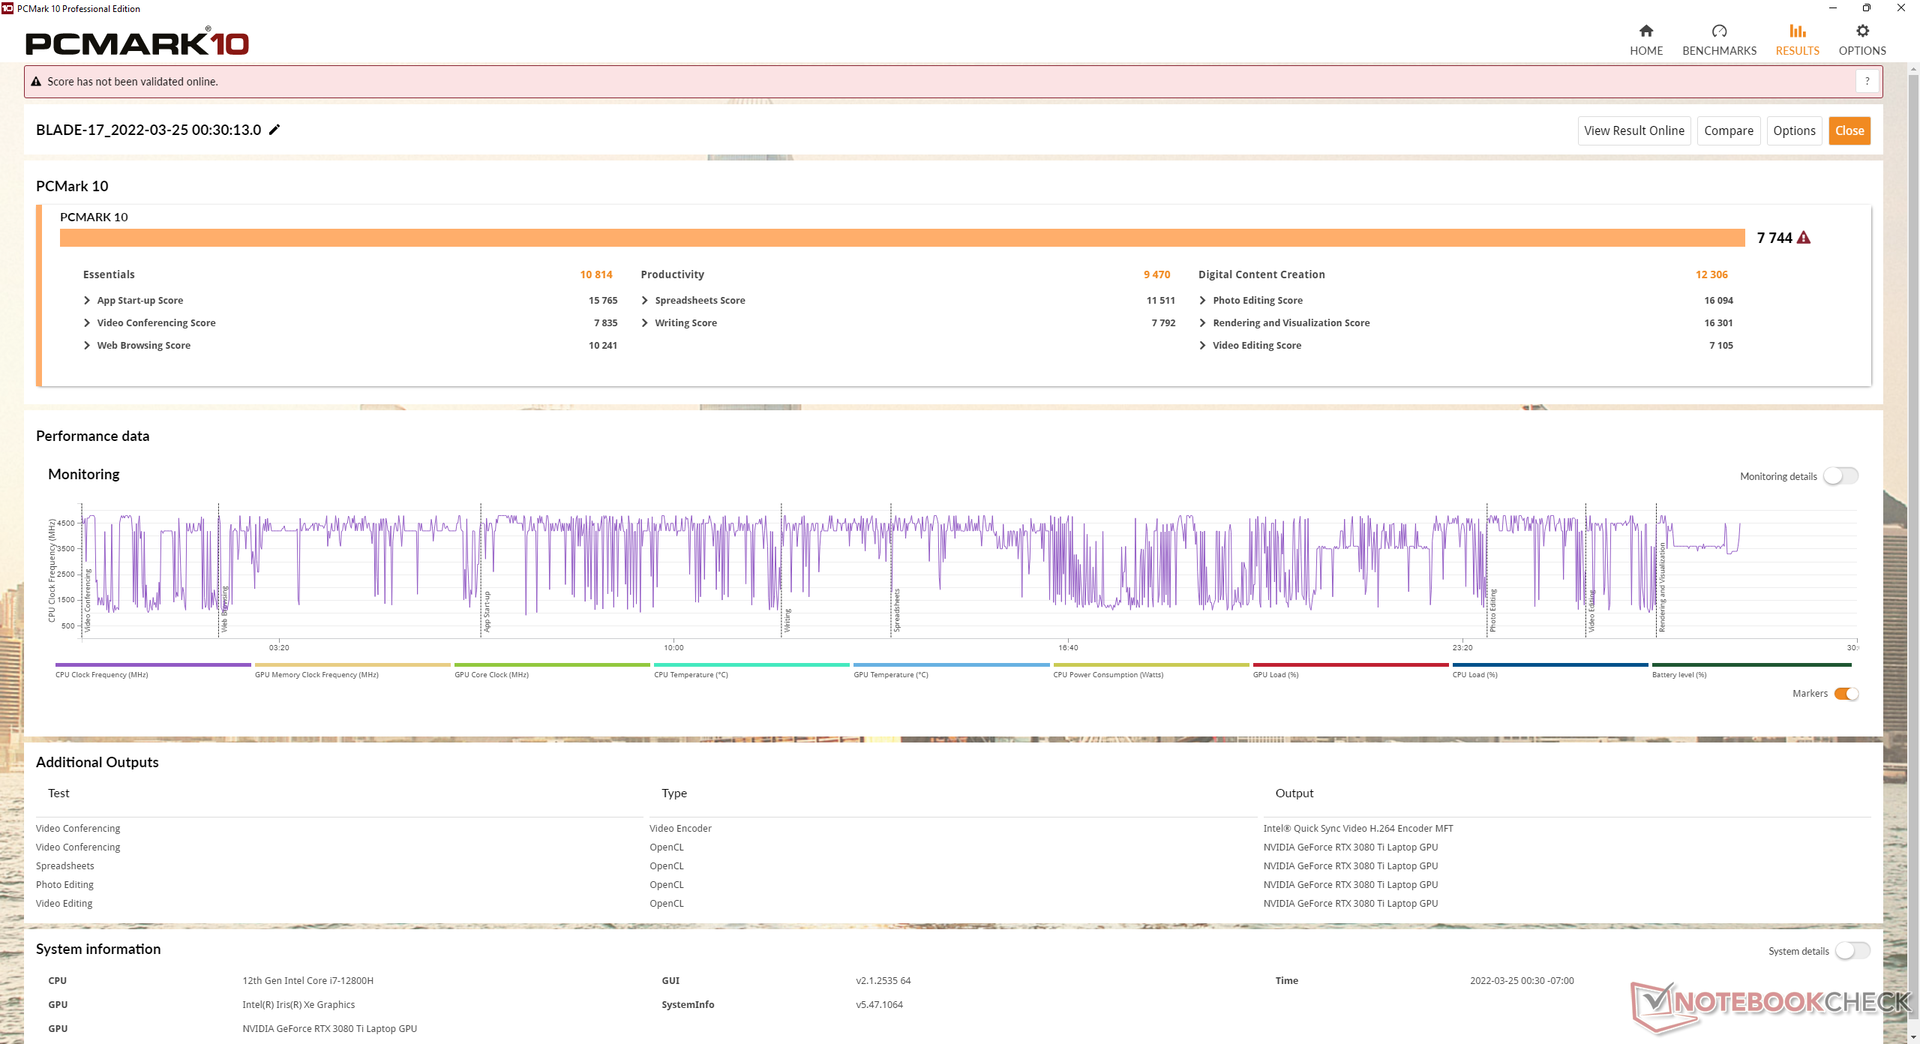
Systemleistung
Die PCMark-10-Ergebnisse und vor allem die Digital-Content-Creation-Teilpunktzahl sind konstant höher als beim Modell aus dem Vorjahr. Razer scheint außerdem ein Problem behoben zu haben, dass das Starten der Synapse-Software ohne aktive Internetverbindung verhindert hat.
| PCMark 10 / Score | |
| Razer Blade 17 RTX 3080 Ti | |
| Durchschnittliche Intel Core i7-12800H, NVIDIA GeForce RTX 3080 Ti Laptop GPU (7313 - 7744, n=3) | |
| Alienware x17 RTX 3080 P48E | |
| Asus ROG Zephyrus S17 GX703HSD | |
| Aorus 17G YD | |
| MSI GS76 Stealth 11UH | |
| Razer Blade Pro 17 2021 (QHD Touch) | |
| PCMark 10 / Essentials | |
| Razer Blade 17 RTX 3080 Ti | |
| Durchschnittliche Intel Core i7-12800H, NVIDIA GeForce RTX 3080 Ti Laptop GPU (10597 - 10814, n=3) | |
| Asus ROG Zephyrus S17 GX703HSD | |
| Aorus 17G YD | |
| Alienware x17 RTX 3080 P48E | |
| Razer Blade Pro 17 2021 (QHD Touch) | |
| MSI GS76 Stealth 11UH | |
| PCMark 10 / Productivity | |
| Alienware x17 RTX 3080 P48E | |
| Durchschnittliche Intel Core i7-12800H, NVIDIA GeForce RTX 3080 Ti Laptop GPU (9470 - 9675, n=3) | |
| Razer Blade 17 RTX 3080 Ti | |
| Aorus 17G YD | |
| Asus ROG Zephyrus S17 GX703HSD | |
| MSI GS76 Stealth 11UH | |
| Razer Blade Pro 17 2021 (QHD Touch) | |
| PCMark 10 / Digital Content Creation | |
| Razer Blade 17 RTX 3080 Ti | |
| Durchschnittliche Intel Core i7-12800H, NVIDIA GeForce RTX 3080 Ti Laptop GPU (10351 - 12306, n=3) | |
| Alienware x17 RTX 3080 P48E | |
| Asus ROG Zephyrus S17 GX703HSD | |
| Aorus 17G YD | |
| MSI GS76 Stealth 11UH | |
| Razer Blade Pro 17 2021 (QHD Touch) | |
| PCMark 10 Score | 7744 Punkte | |
Hilfe | ||
| AIDA64 / Memory Copy | |
| MSI GE76 Raider | |
| Razer Blade 17 RTX 3080 Ti | |
| Schenker Uniwill Technology GM7AG8P | |
| Durchschnittliche Intel Core i7-12800H (48643 - 62522, n=5) | |
| Schenker XMG Pro 17 (Late 2021, RTX 3080) | |
| Schenker XMG Apex 17 M21 | |
| Lenovo Legion 5 17ACH6H-82JY0003GE | |
| AIDA64 / Memory Read | |
| Razer Blade 17 RTX 3080 Ti | |
| MSI GE76 Raider | |
| Schenker Uniwill Technology GM7AG8P | |
| Durchschnittliche Intel Core i7-12800H (56629 - 66199, n=5) | |
| Schenker XMG Pro 17 (Late 2021, RTX 3080) | |
| Schenker XMG Apex 17 M21 | |
| Lenovo Legion 5 17ACH6H-82JY0003GE | |
| AIDA64 / Memory Write | |
| Razer Blade 17 RTX 3080 Ti | |
| Schenker Uniwill Technology GM7AG8P | |
| MSI GE76 Raider | |
| Durchschnittliche Intel Core i7-12800H (50923 - 66074, n=5) | |
| Schenker XMG Apex 17 M21 | |
| Schenker XMG Pro 17 (Late 2021, RTX 3080) | |
| Lenovo Legion 5 17ACH6H-82JY0003GE | |
| AIDA64 / Memory Latency | |
| MSI GE76 Raider | |
| Schenker XMG Pro 17 (Late 2021, RTX 3080) | |
| Schenker XMG Apex 17 M21 | |
| Lenovo Legion 5 17ACH6H-82JY0003GE | |
| Durchschnittliche Intel Core i7-12800H (89.3 - 95.2, n=5) | |
| Schenker Uniwill Technology GM7AG8P | |
| Razer Blade 17 RTX 3080 Ti | |
* ... kleinere Werte sind besser
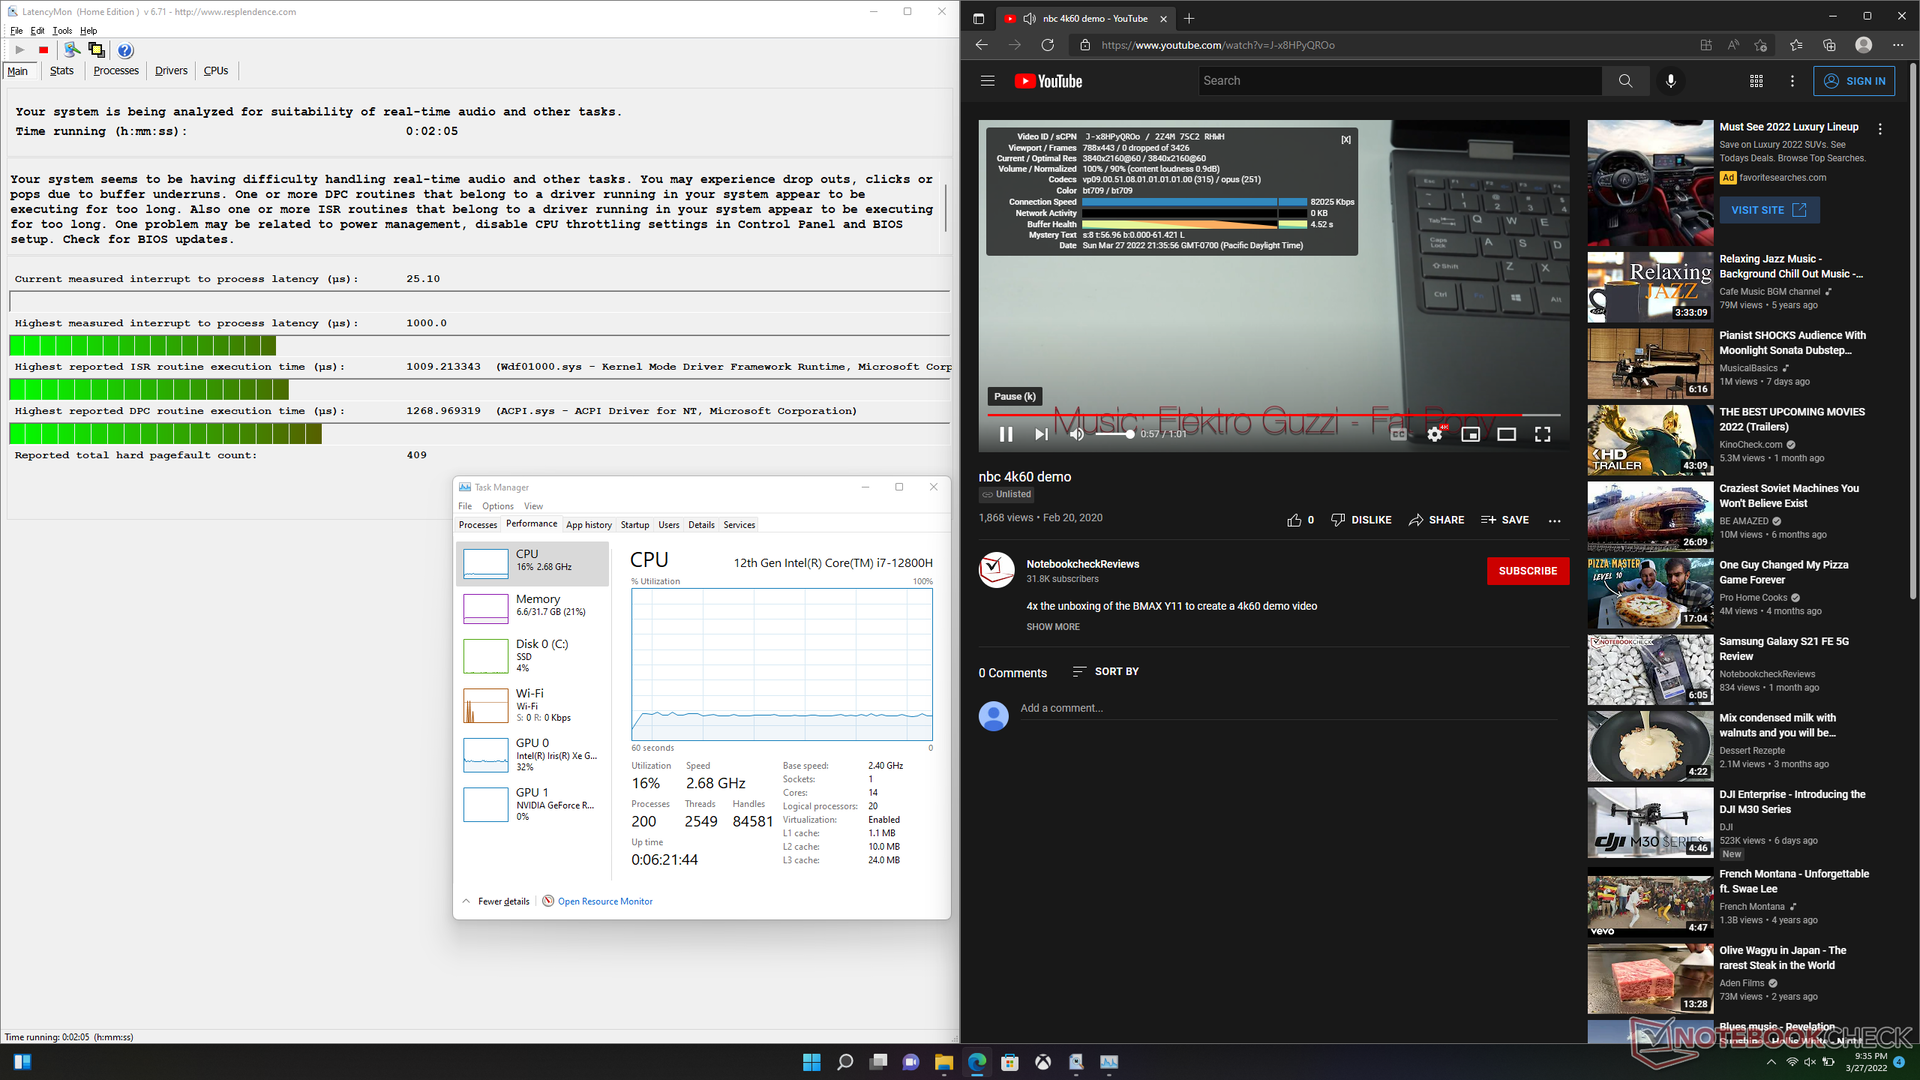
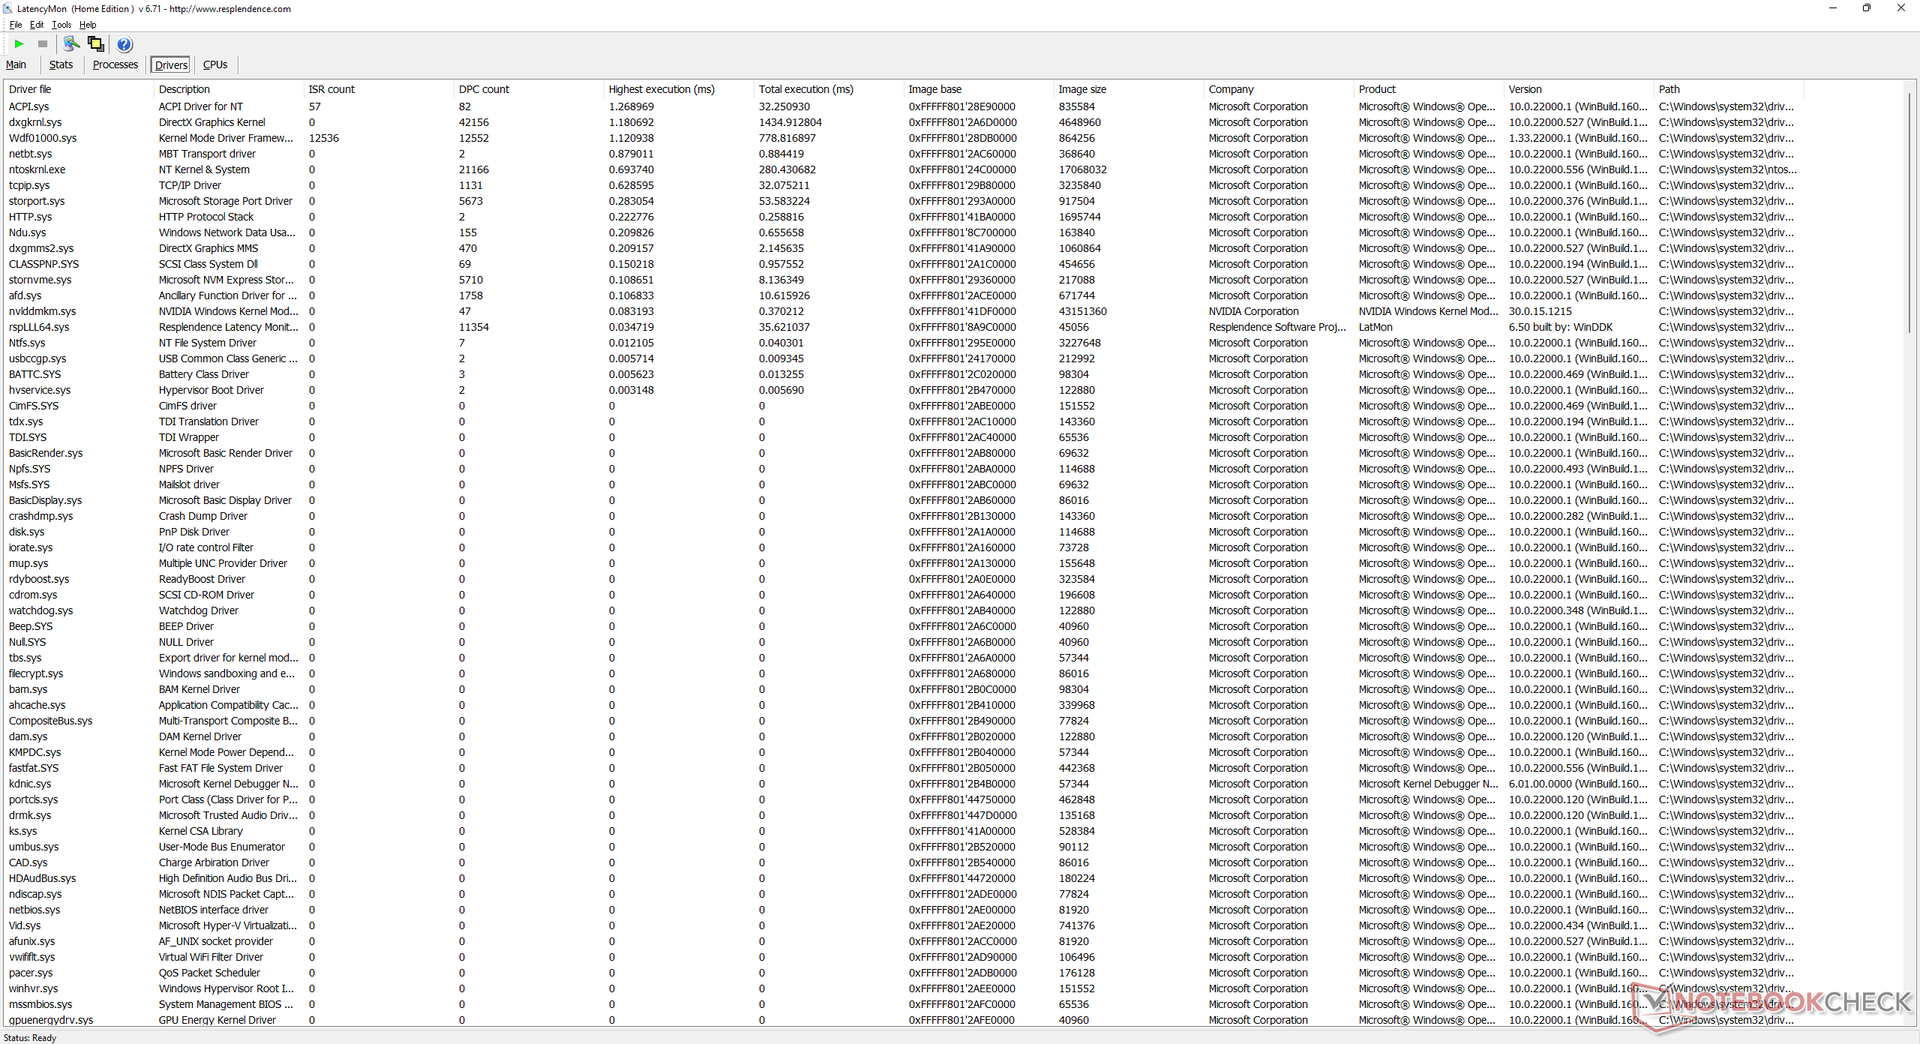
DPC-Latenzen
Beim öffnen unserer Homepage in mehreren Tabs meldet LatencyMon leicht problematische DPC-Latenzen. Die Wiedergabe von 4K-Videos mit 60 Fps funktioniert einwandfrei und ohne verlorene Frames.
| DPC Latencies / LatencyMon - interrupt to process latency (max), Web, Youtube, Prime95 | |
| Alienware x17 RTX 3080 P48E | |
| Razer Blade Pro 17 2021 (QHD Touch) | |
| Asus ROG Zephyrus S17 GX703HSD | |
| Aorus 17G YD | |
| Razer Blade 17 RTX 3080 Ti | |
| MSI GS76 Stealth 11UH | |
* ... kleinere Werte sind besser
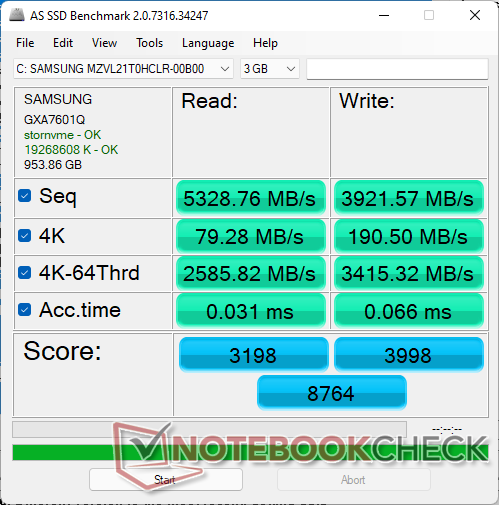
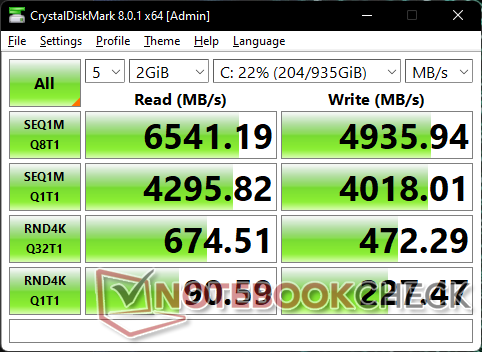
Massenspeicher — Bis zu zwei M.2-PCIe4-x4-SSDs
Die meisten, wenn nicht alle, Blade-17-Modelle sind mit Samsung-SSDs bestückt. Unser Testgerät ist mit der Samsung PM9A1, eine der schnellsten PCIe4-x4-SSDs im Privatanwenderbereich, ausgestattet. Das Laufwerk in unserem Razer-Laptop erhält sehr schnelle Übertragungsraten von mehr als 6.600 MB/s mühelos aufrecht, was im Kontrast zum Uniwill Technology GM7AG8P auf eine ausgezeichnete Wärmeableitung hindeutet.

* ... kleinere Werte sind besser
Dauerleistung Lesen: DiskSpd-Leseschleife, Warteschlangentiefe 8
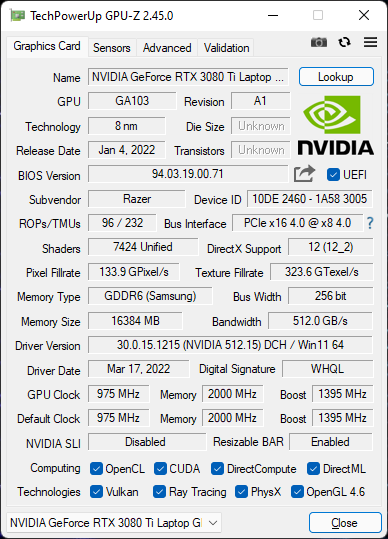
Grafikkarte
Basierend auf Tests von mehr als einem halben Dutzend Laptops mit der mobilen GeForce RTX 3080 Ti zum Zeitpunkt dieses Artikels liegt diese GPU in unserem Blade 17 um ca. 15 % über dem Durchschnitt. Das hohe TGP-Ziel von 165 W ist zweifellos einer der Hauptgründe für den Leistungsvorteil, da andere Laptops mit der RTX 3080 Ti wie das Blade 15 oder das Gigabyte Aero 16 YE5 stattdessen auf deutlich niedrigere TGP-Ziele von um die 100 W abzielen. Relativ zum 10.-Gen.-Intel- und dem 11.-Gen.-Intel-Modell des Blade 17 mit der regulären mobilen RTX 3080 kann man mit einem Leistungszuwachs von ca. 20 % rechnen.
Im ausbalancierten dGPU-Modus muss man gegenüber dem Maximalleistung-dGPU-Modus mit einem Grafikleistungsdefizit von nur rund 5 bis 7 % rechnen.
Die Konfiguration mit der mobilen RTX 3070 Ti liegt nur ca. 10 % hinter der mit der mobilen 3080 Ti.
Natürlich bietet die "richtige" RTX 3080 Ti für den Desktop einen großen GPU-Leistungssprung von fast 50 % gegenüber unserer mobilen Version.
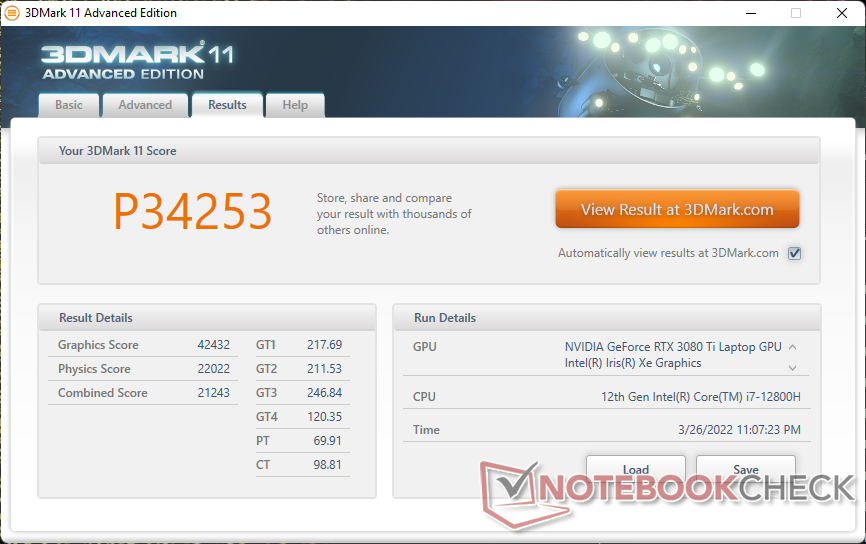
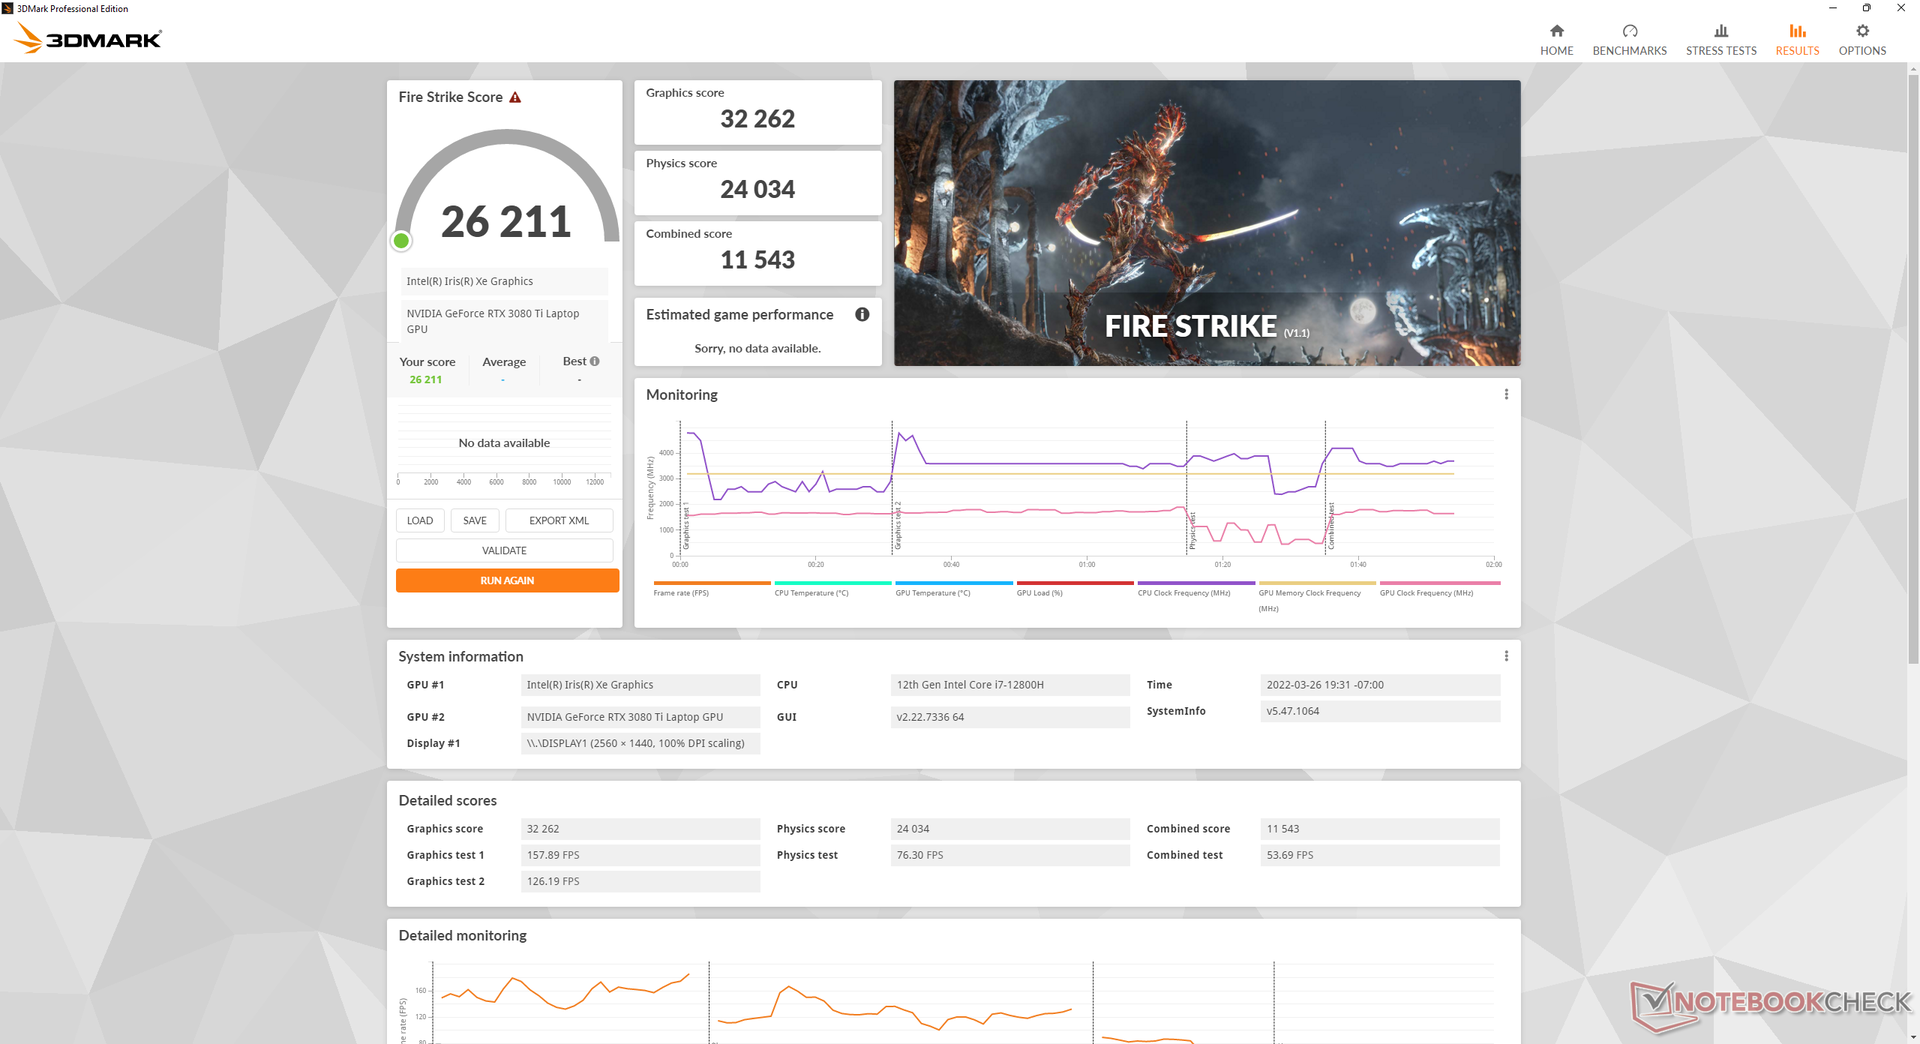
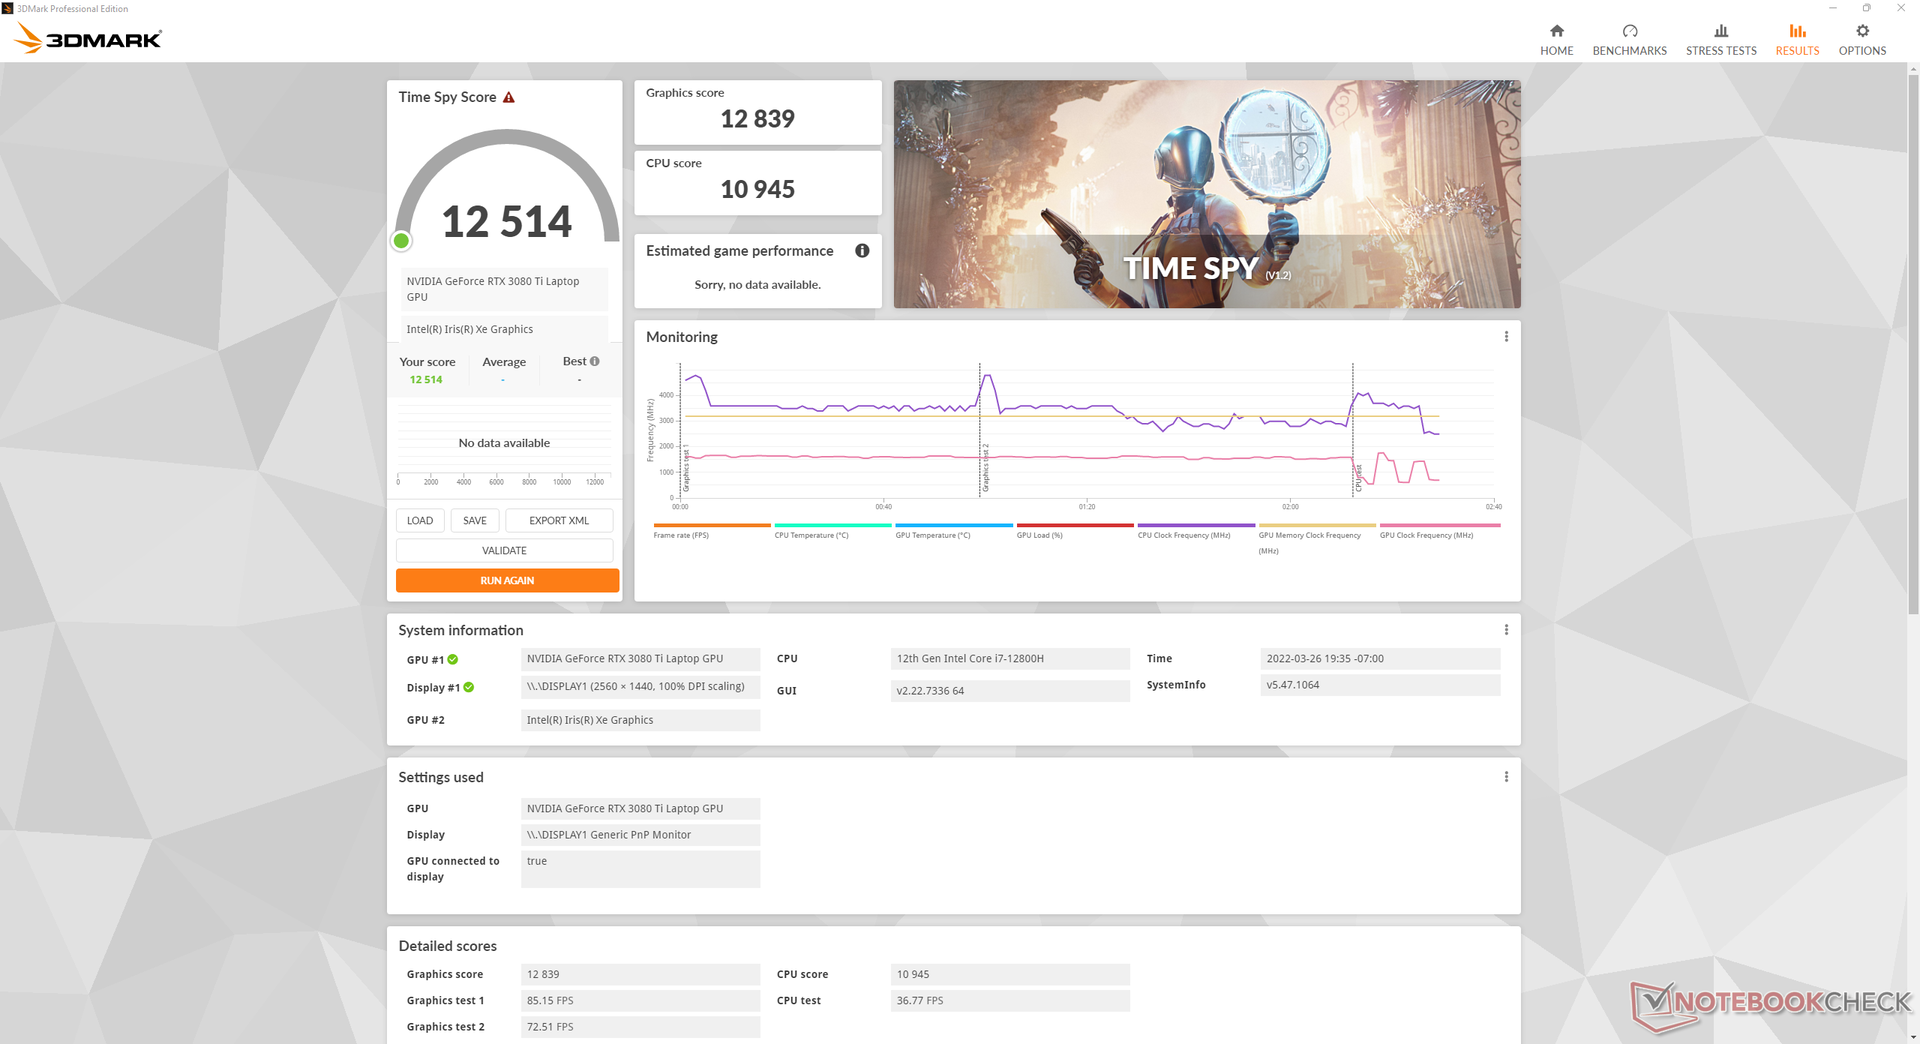


| 3DMark 11 Performance | 34253 Punkte | |
| 3DMark Cloud Gate Standard Score | 62059 Punkte | |
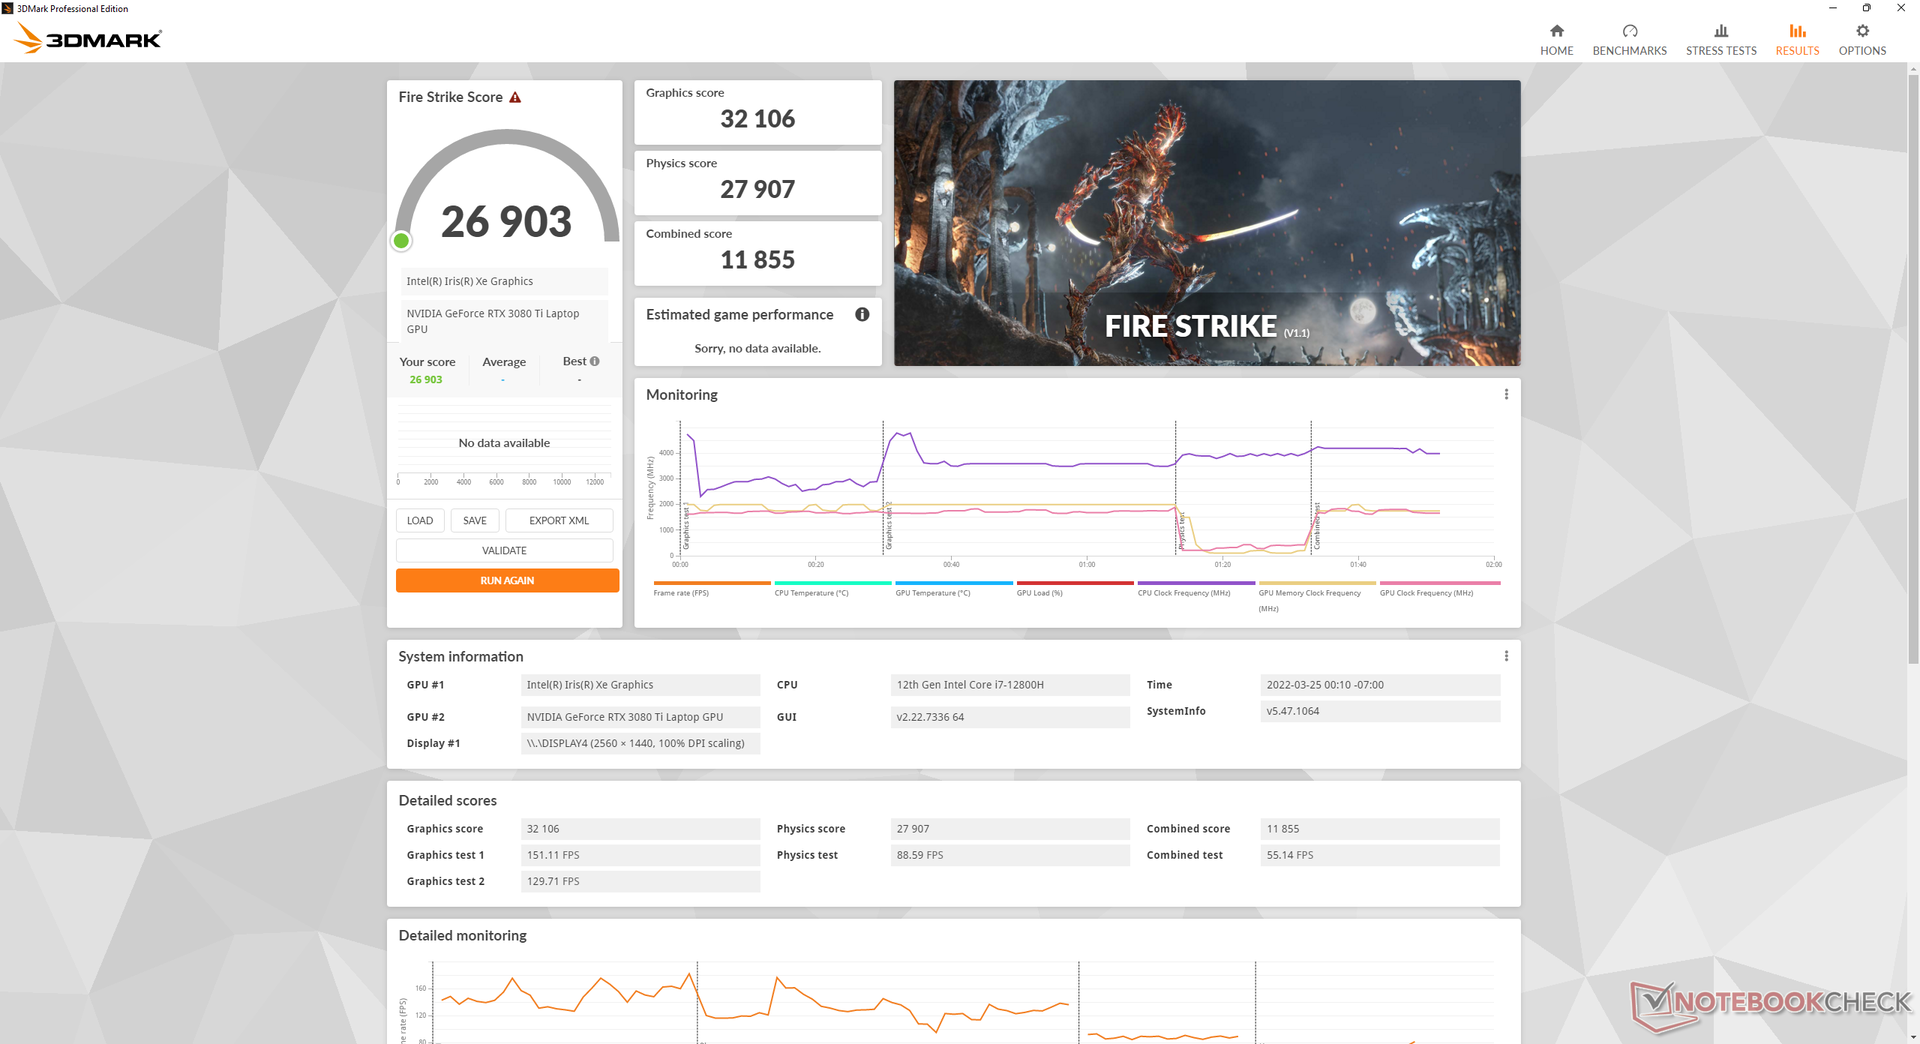
| 3DMark Fire Strike Score | 26903 Punkte | |
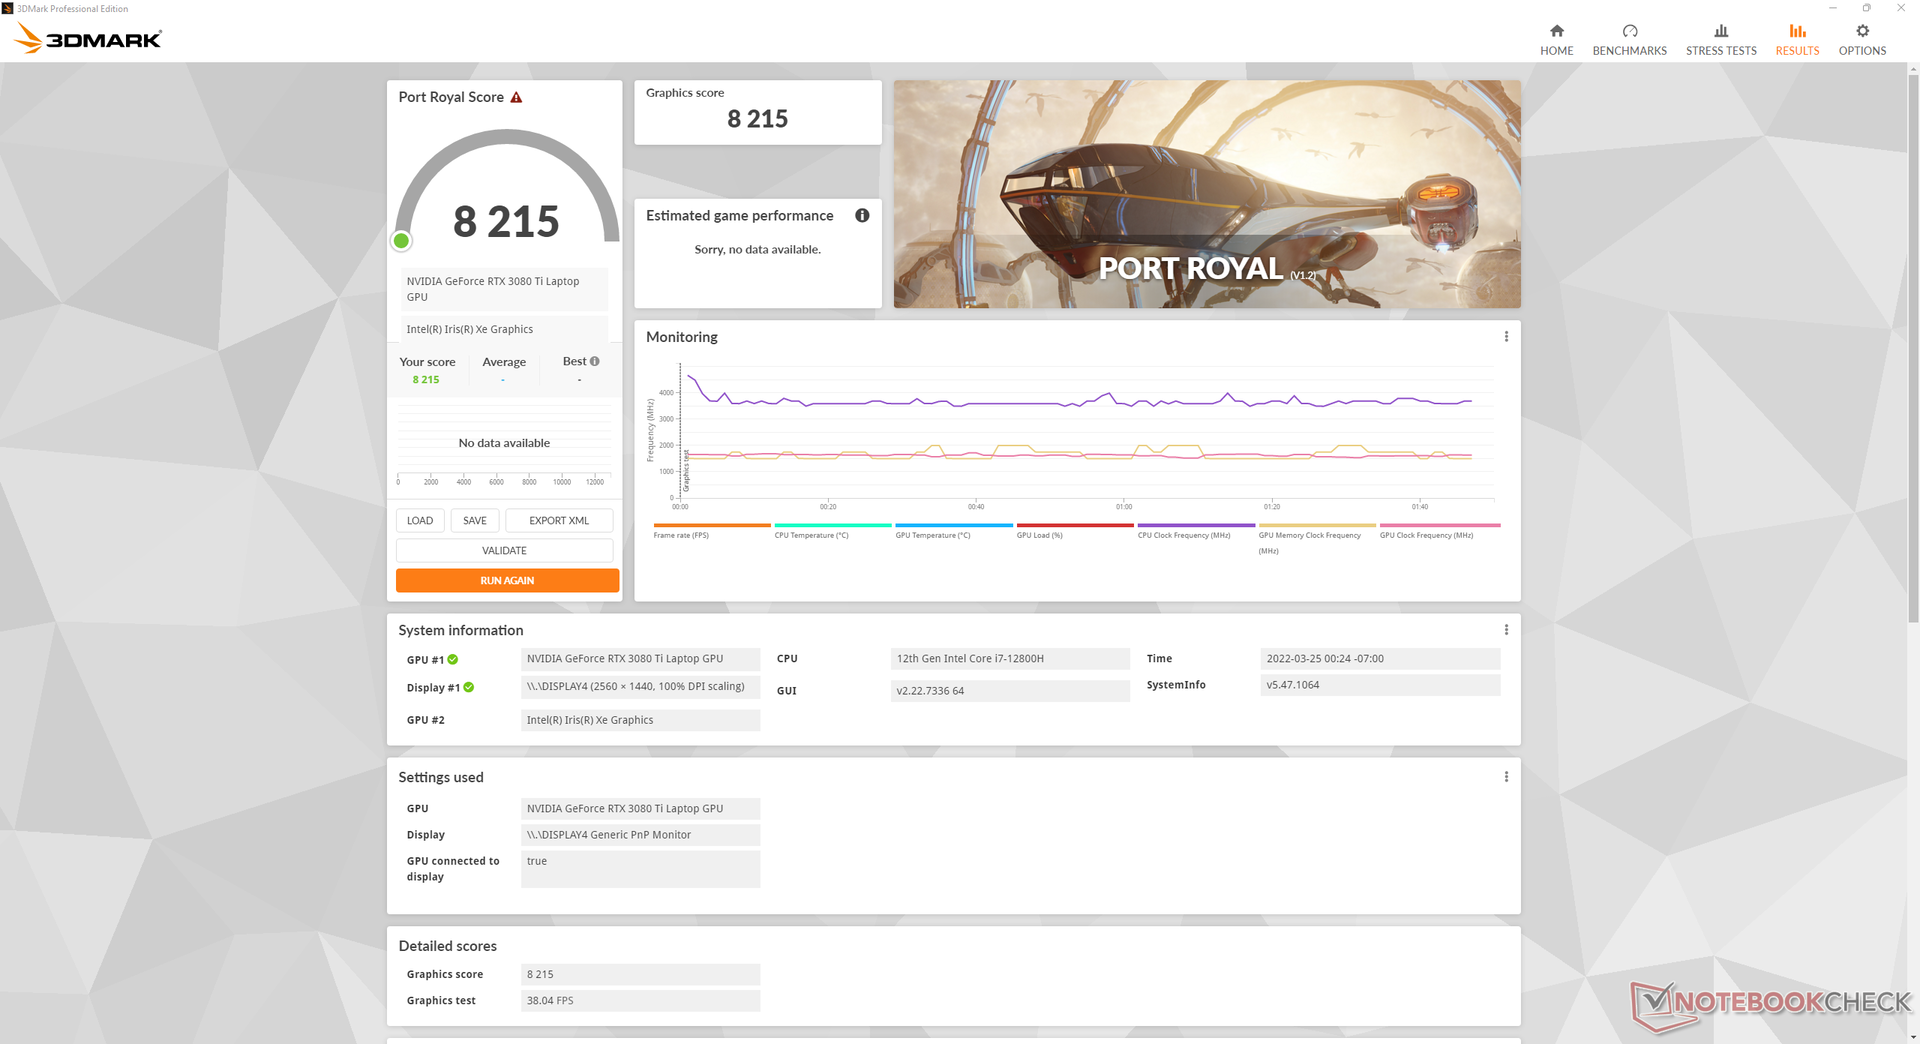
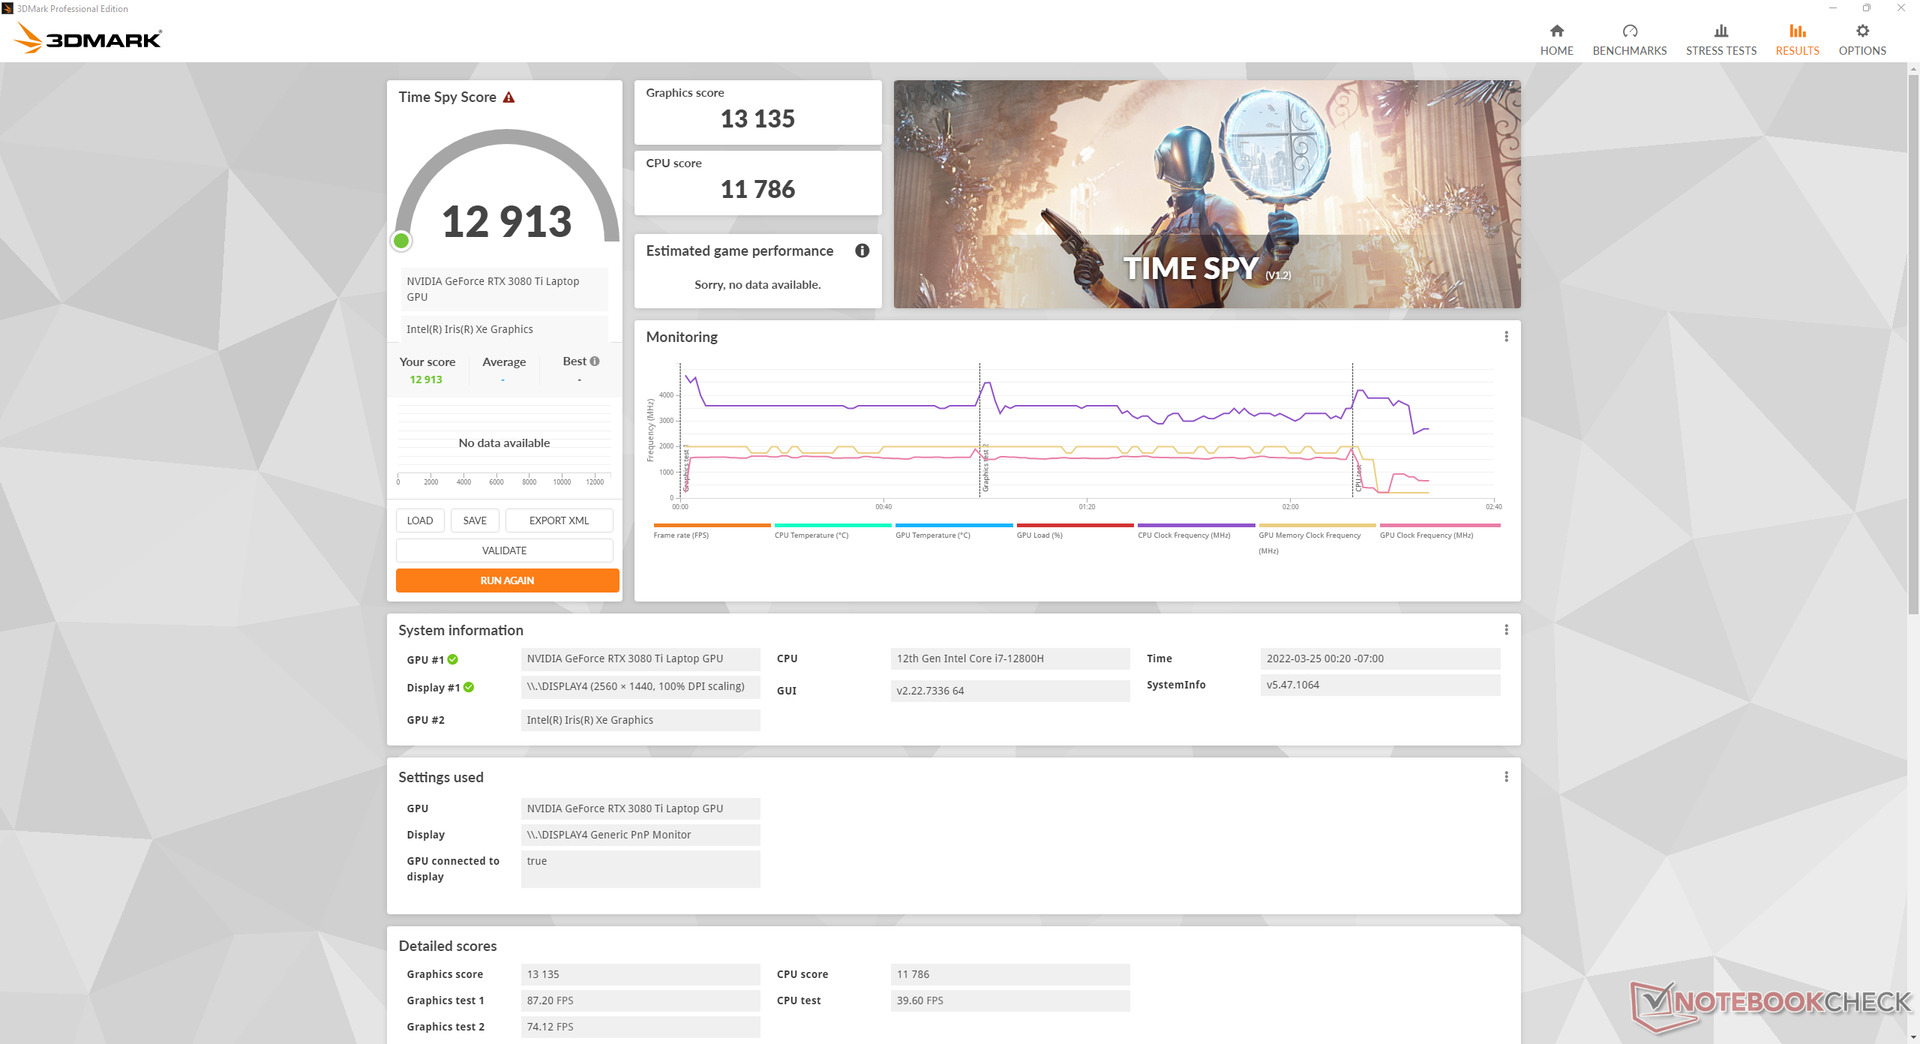
| 3DMark Time Spy Score | 12913 Punkte | |
Hilfe | ||
Witcher 3 FPS-Verlauf
| min. | mittel | hoch | max. | QHD | |
|---|---|---|---|---|---|
| GTA V (2015) | 186 | 182 | 176 | 113 | 105 |
| The Witcher 3 (2015) | 459 | 340.9 | 250.4 | 124.6 | |
| Dota 2 Reborn (2015) | 183 | 171 | 165 | 157 | |
| Final Fantasy XV Benchmark (2018) | 168 | 152 | 121 | 93.3 | |
| X-Plane 11.11 (2018) | 158 | 139 | 111 | ||
| Far Cry 5 (2018) | 171 | 149 | 134 | 125 | 120 |
| Strange Brigade (2018) | 431 | 296 | 242 | 215 | 158 |
| Cyberpunk 2077 1.6 (2022) | 119.1 | 112.1 | 106 | 106.5 | 59.7 |
Emissionen
Geräuschemissionen — Nur im Gaming-Betrieb laut
Obwohl statt vier nur noch drei Lüfter verbaut sind, hat sich das Geräuschprofil nicht grundlegend verändert. Um den Geräuschpegel unter Kontrolle zu halten, sollte man in Niederlastsituationen den Energiesparmodus oder den ausbalancierten Modus nutzen.
Im ausbalancierten Modus erreichen die Lüfter im Gaming-Betrieb rund 43,2 dB(A), während sie trotz des geringen Grafikleistungsvorteil von 5 bis 7 % im Maximalleistungsmodus bis zu 50,9 dB(A) erreichen können. Daher sollte man in Betracht ziehen, den ausbalancierten Modus für Spiele zu nutzen, wenn man sich an den Lüftergeräuschen stört.

Lautstärkediagramm
| Idle |
| 23.3 / 23.3 / 26.3 dB(A) |
| Last |
| 38.2 / 49.1 dB(A) |
 | ||
30 dB leise 40 dB(A) deutlich hörbar 50 dB(A) störend |
||
min: | ||
| Razer Blade 17 RTX 3080 Ti GeForce RTX 3080 Ti Laptop GPU, i7-12800H, Samsung PM9A1 MZVL21T0HCLR | Razer Blade Pro 17 2021 (QHD Touch) GeForce RTX 3080 Laptop GPU, i7-10875H, Samsung PM981a MZVLB1T0HBLR | MSI GS76 Stealth 11UH GeForce RTX 3080 Laptop GPU, i9-11900H, Samsung PM9A1 MZVL22T0HBLB | Asus ROG Zephyrus S17 GX703HSD GeForce RTX 3080 Laptop GPU, i9-11900H, Samsung PM9A1 MZVL22T0HBLB | Aorus 17G YD GeForce RTX 3080 Laptop GPU, i7-11800H, Samsung PM9A1 MZVL2512HCJQ | Alienware x17 RTX 3080 P48E GeForce RTX 3080 Laptop GPU, i7-11800H, 2x WDC PC SN730 SDBPNTY-1T00 (RAID 0) | |
|---|---|---|---|---|---|---|
| Geräuschentwicklung | -12% | -12% | 2% | -25% | -4% | |
| aus / Umgebung * (dB) | 23.3 | 26.1 -12% | 24 -3% | 23 1% | 25 -7% | 24.9 -7% |
| Idle min * (dB) | 23.3 | 26.1 -12% | 24 -3% | 23 1% | 32 -37% | 24.9 -7% |
| Idle avg * (dB) | 23.3 | 26.5 -14% | 25 -7% | 23 1% | 33 -42% | 24.9 -7% |
| Idle max * (dB) | 26.3 | 30.7 -17% | 42 -60% | 23 13% | 39 -48% | 29.6 -13% |
| Last avg * (dB) | 38.2 | 43.5 -14% | 46 -20% | 41 -7% | 43 -13% | 31.1 19% |
| Witcher 3 ultra * (dB) | 50.9 | 54 -6% | 48 6% | 45 12% | 52 -2% | 49.7 2% |
| Last max * (dB) | 49.1 | 55 -12% | 48 2% | 52 -6% | 61 -24% | 54.8 -12% |
* ... kleinere Werte sind besser
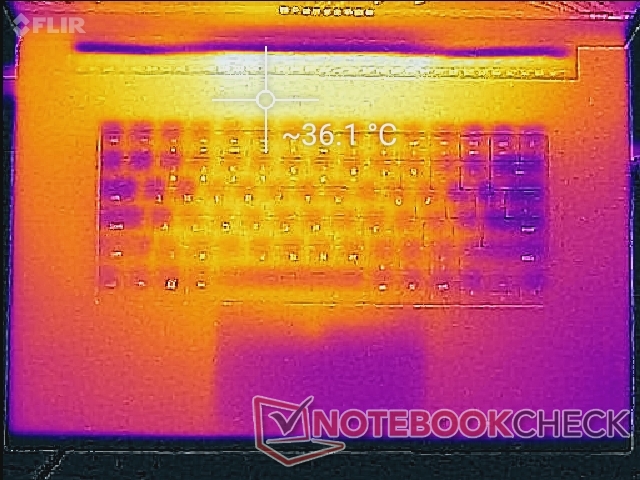
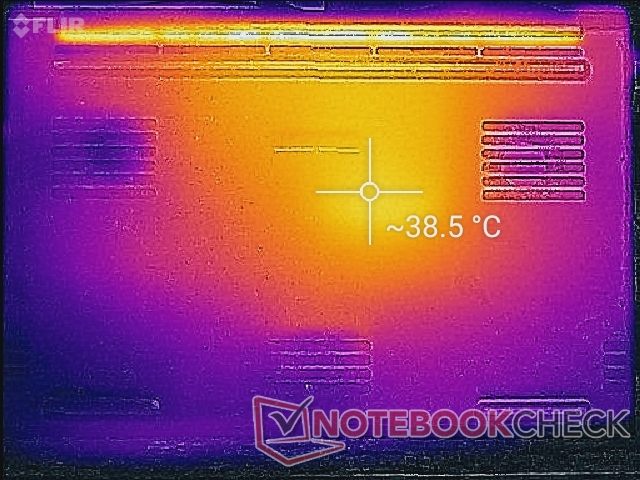
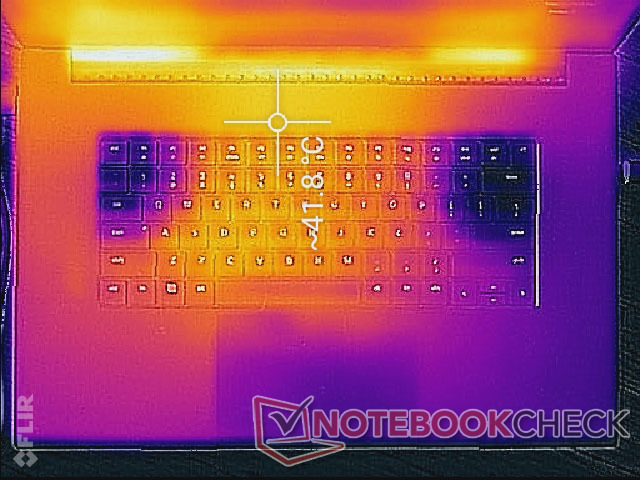
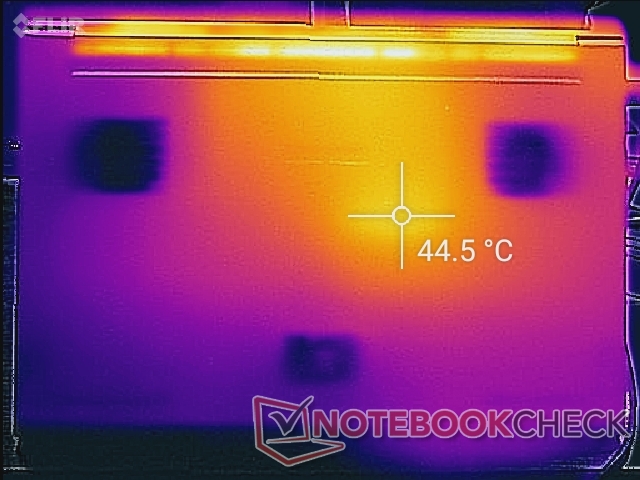
Temperatur — Wärmer als zuvor
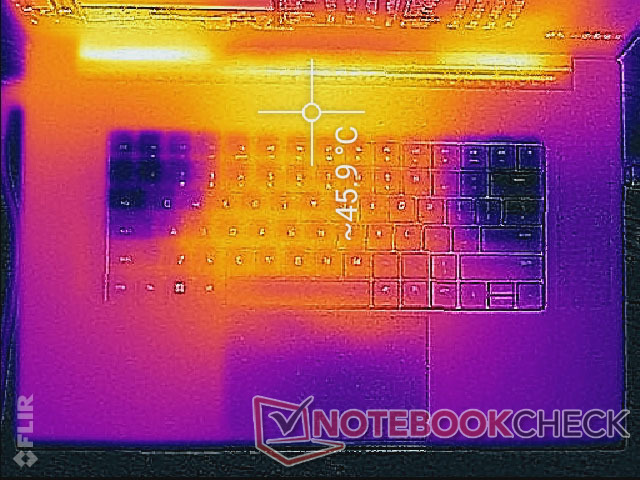
Die Oberflächentemperaturen sind beim 2022er-Modell etwas höher als beim 2021er-Modell. Die Tastaturmitte kann im Gaming-Betrieb bis zu 38 °C erreichen, während die gleiche Stelle beim 2021er-Modell um ein paar Grad kühler bleibt. Außerdem wird der Laptop auch unter niedriger Last mit 31 °C bis 35 °C sehr warm und beispielsweise deutlich wärmer als das MSI GS76 mit nur 27 °C bis 30 °C. Die wärmeren Oberflächen sind eine Konsequenz der leiseren Lüfter bei niedriger Systemauslastung.
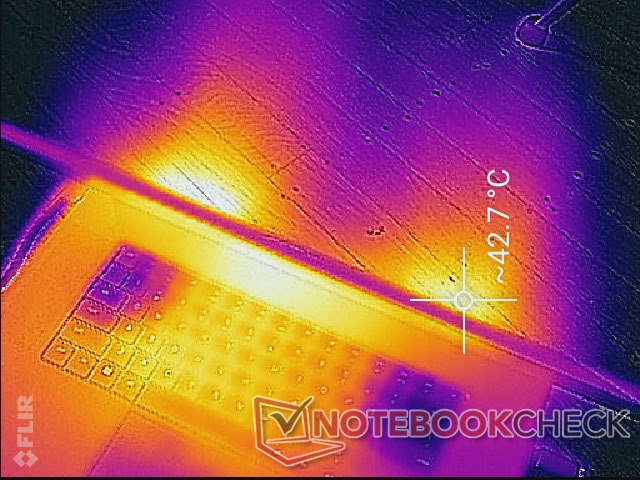
(-) Die maximale Temperatur auf der Oberseite ist 46 °C. Im Vergleich liegt der Klassendurchschnitt bei 40.4 °C (von 21.2 bis 68.8 °C für die Klasse Gaming).
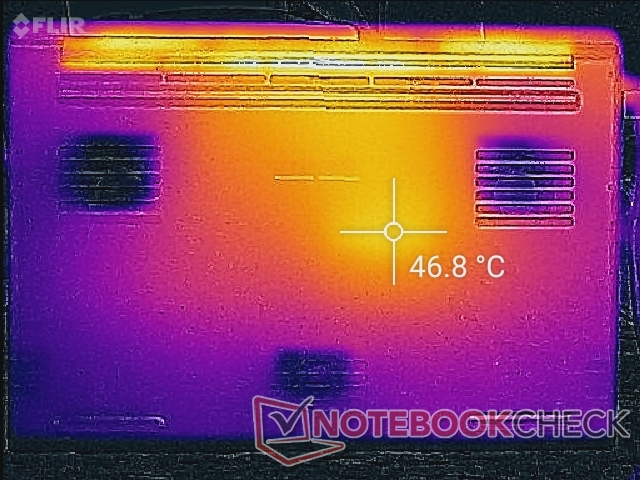
(-) Auf der Unterseite messen wir eine maximalen Wert von 46.8 °C (im Vergleich zum Durchschnitt von 43.2 °C).
(+) Ohne Last messen wir eine durchschnittliche Temperatur von 31.5 °C auf der Oberseite. Der Klassendurchschnitt erreicht 33.9 °C.
(±) Beim längeren Spielen von The Witcher 3 erhitzt sich das Gerät durchschnittlich auf 33.2 °C. Der Durchschnitt der Klasse ist derzeit 33.9 °C.
(+) Die Handballen und der Touchpad-Bereich erreichen maximal 32.4 °C und damit die typische Hauttemperatur und fühlen sich daher nicht heiß an.
(-) Die durchschnittliche Handballen-Temperatur anderer getesteter Geräte war 28.8 °C (-3.6 °C).
| Razer Blade 17 RTX 3080 Ti Intel Core i7-12800H, NVIDIA GeForce RTX 3080 Ti Laptop GPU | Razer Blade Pro 17 2021 (QHD Touch) Intel Core i7-10875H, NVIDIA GeForce RTX 3080 Laptop GPU | MSI GS76 Stealth 11UH Intel Core i9-11900H, NVIDIA GeForce RTX 3080 Laptop GPU | Asus ROG Zephyrus S17 GX703HSD Intel Core i9-11900H, NVIDIA GeForce RTX 3080 Laptop GPU | Aorus 17G YD Intel Core i7-11800H, NVIDIA GeForce RTX 3080 Laptop GPU | Alienware x17 RTX 3080 P48E Intel Core i7-11800H, NVIDIA GeForce RTX 3080 Laptop GPU | |
|---|---|---|---|---|---|---|
| Hitze | 10% | 4% | -7% | 12% | -4% | |
| Last oben max * (°C) | 46 | 38.2 17% | 49 -7% | 59 -28% | 36 22% | 58.4 -27% |
| Last unten max * (°C) | 46.8 | 42.2 10% | 57 -22% | 53 -13% | 52 -11% | 49 -5% |
| Idle oben max * (°C) | 36.2 | 33.6 7% | 28 23% | 35 3% | 29 20% | 33.6 7% |
| Idle unten max * (°C) | 38.6 | 36.2 6% | 30 22% | 35 9% | 33 15% | 34.6 10% |
* ... kleinere Werte sind besser
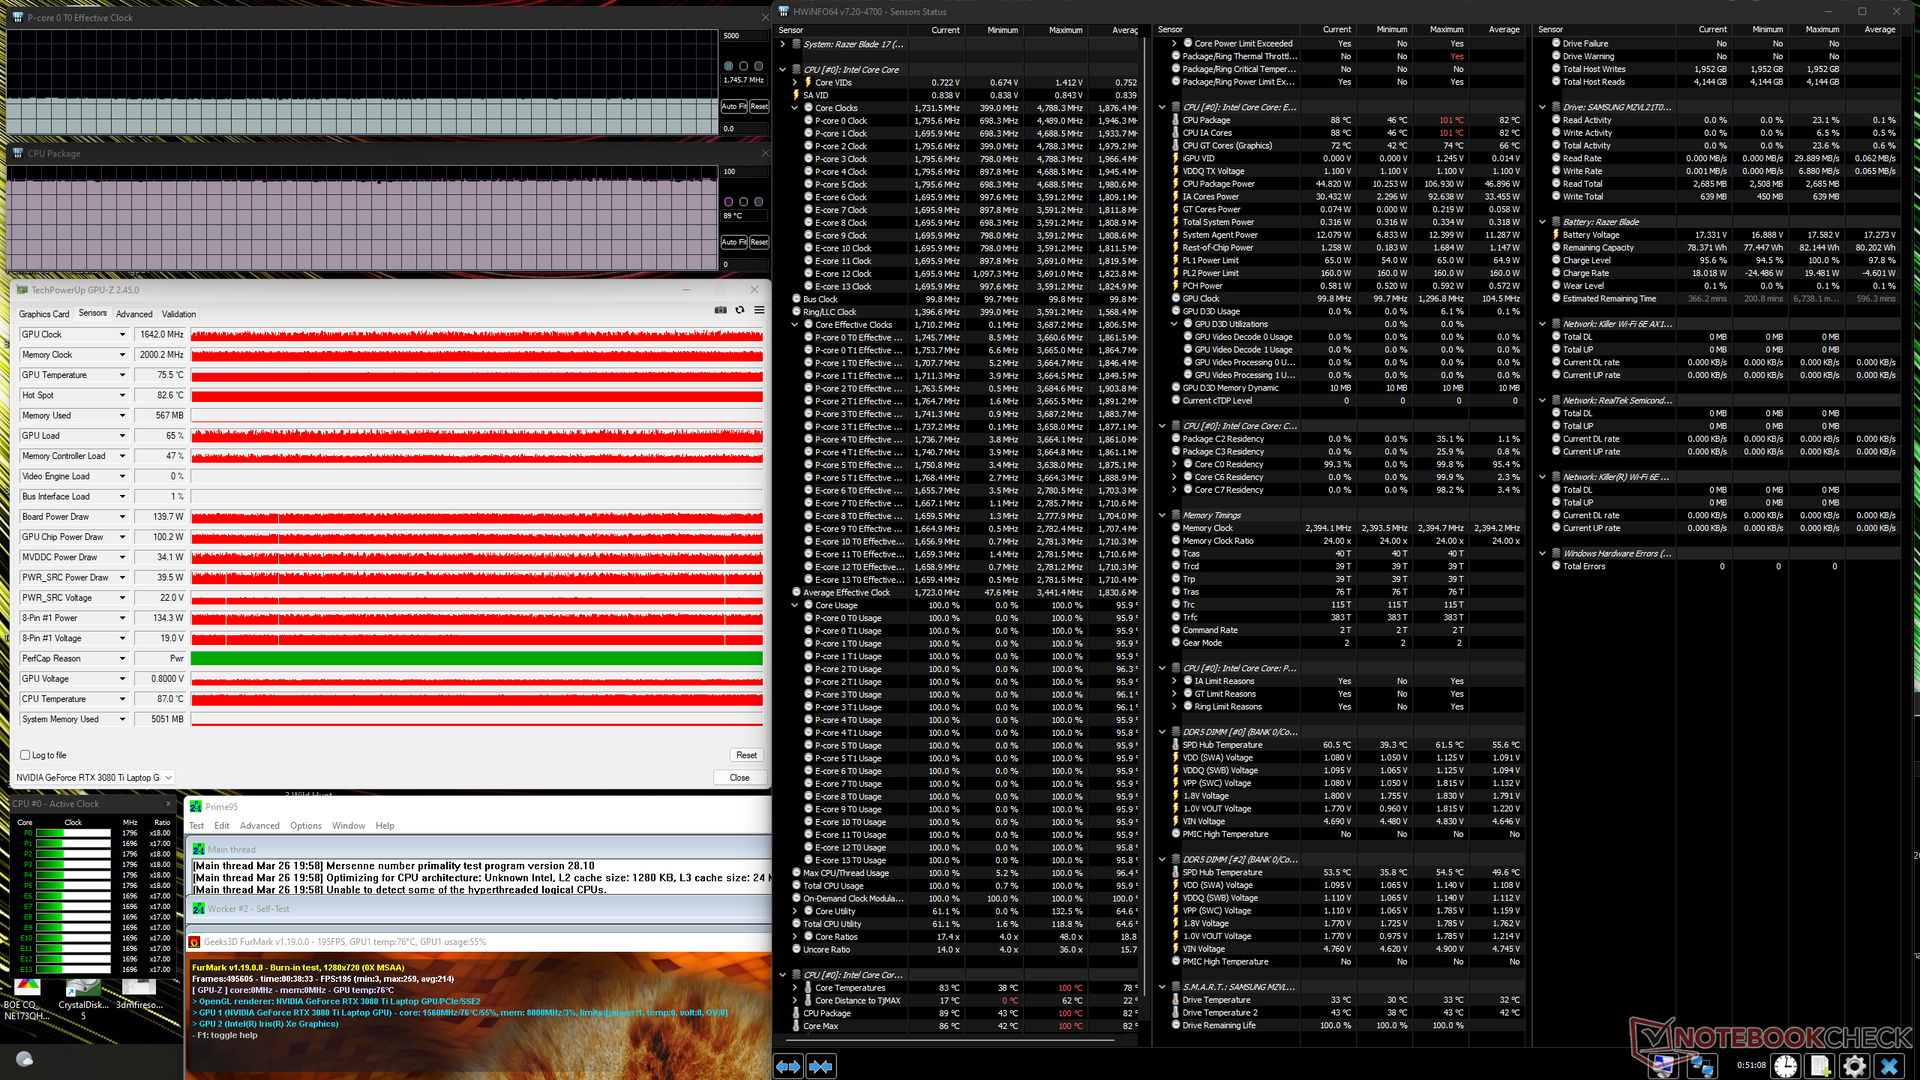
Stresstest
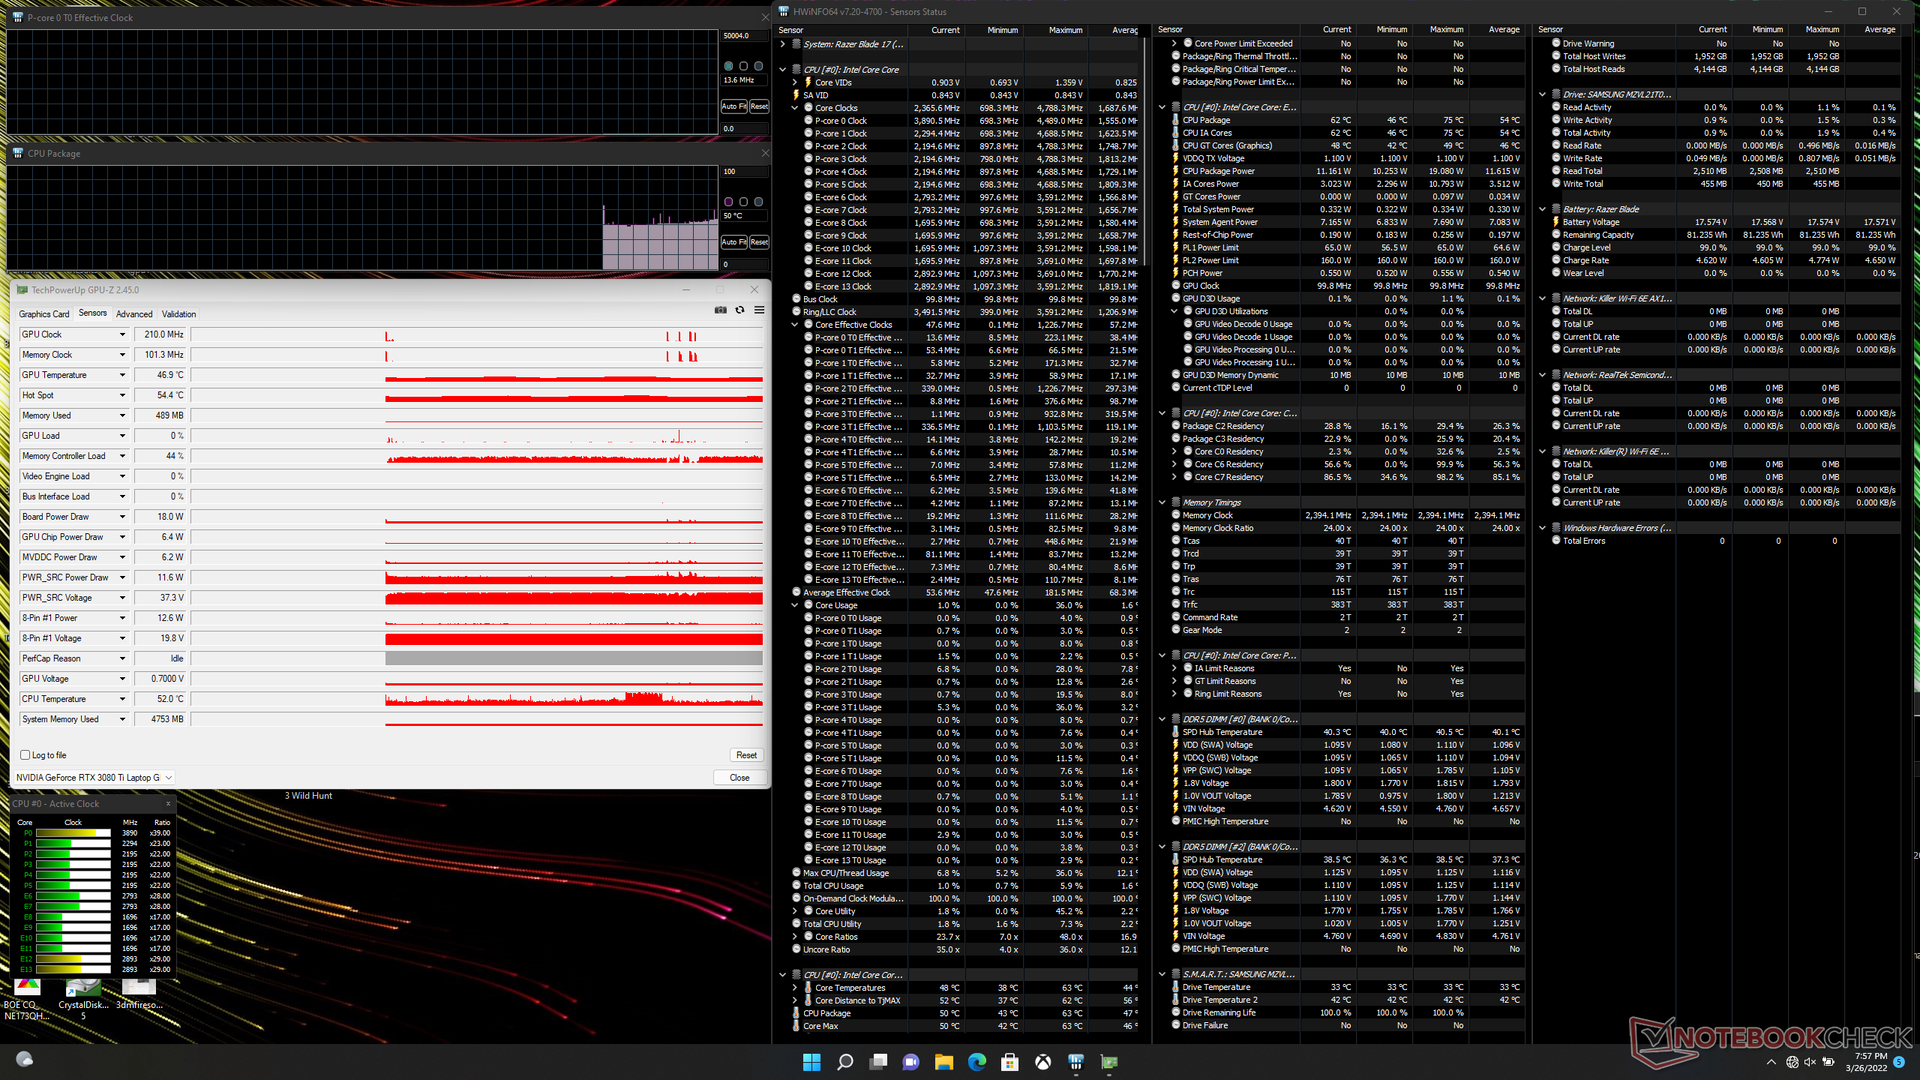
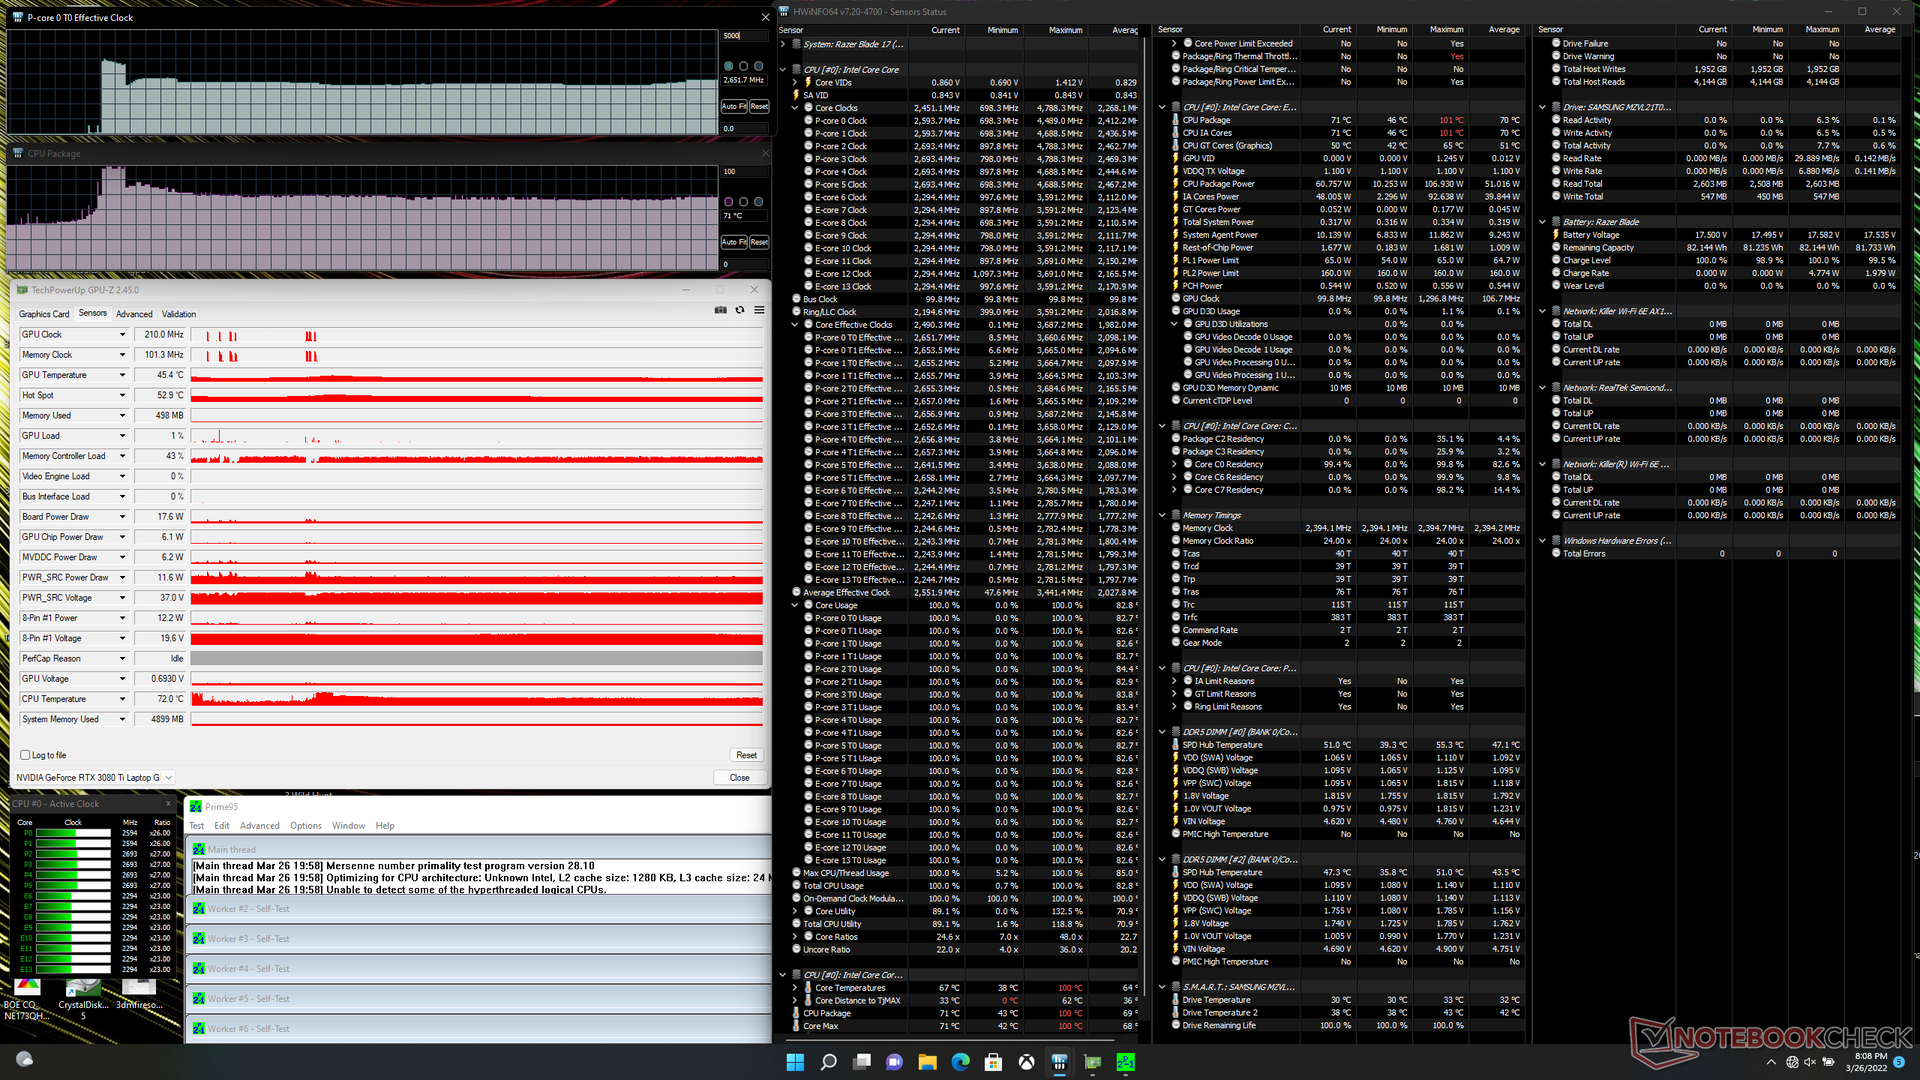
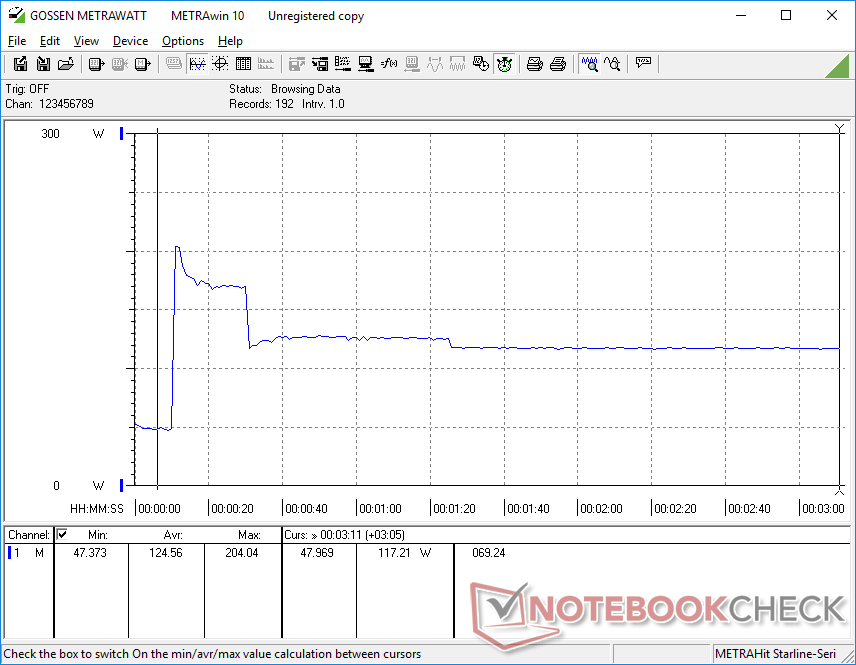
Beim Auslasten des Systems mit Prime95 im Maximalleistungsmodus taktet die CPU in den ersten 20 Sekunden bei einer Kerntemperatur von 99 °C mit 3,6 GHz. Der Takt und die Temperatur fallen dann auf 2,7 GHz bzw. 83 °C und stabilisieren sich schließlich bei 2,5 GHz und 72 °C. Die CPU Package Power liegt zu Beginn des Stresstests bei bis zu 107 W und pendelt sich im Laufe der Zeit bei 61 W, während die Werte beim Blade 17 Intel 11. Gen. bei 90 W bzw. 65 W liegen.
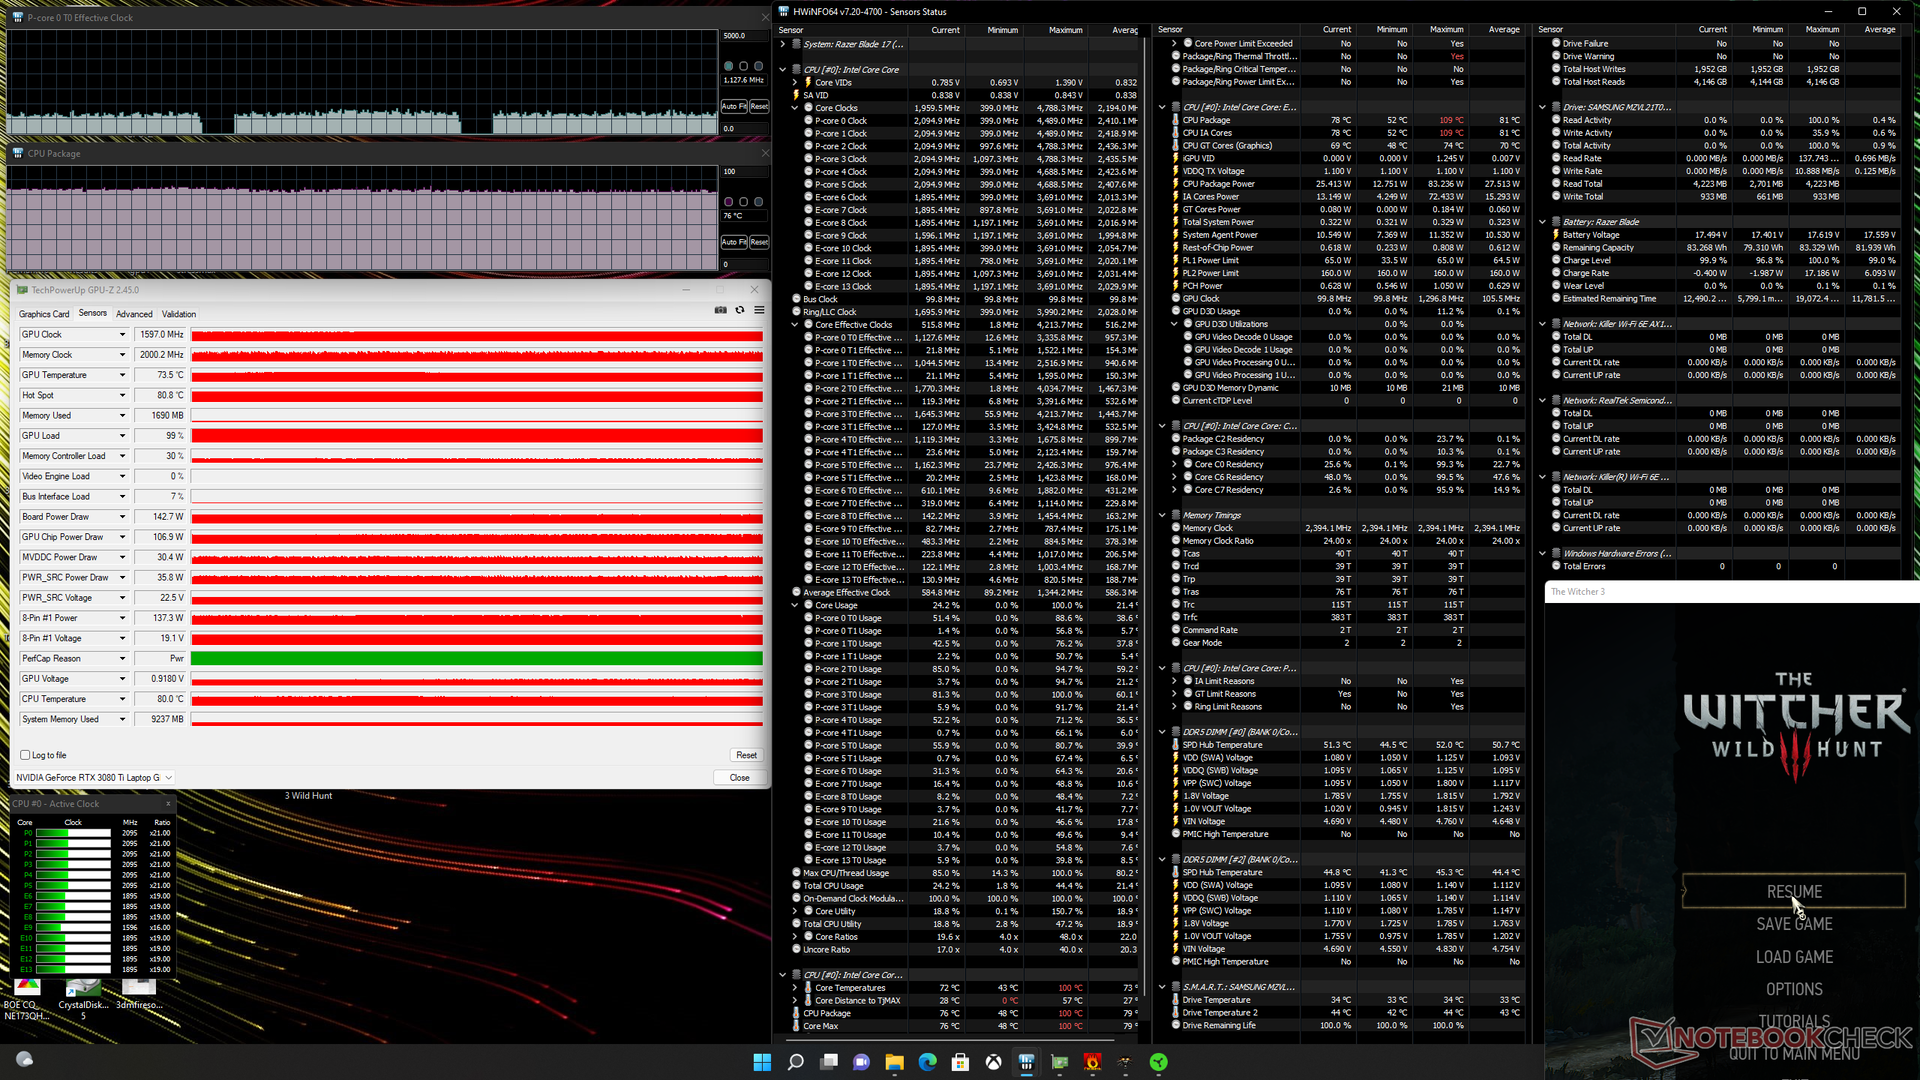
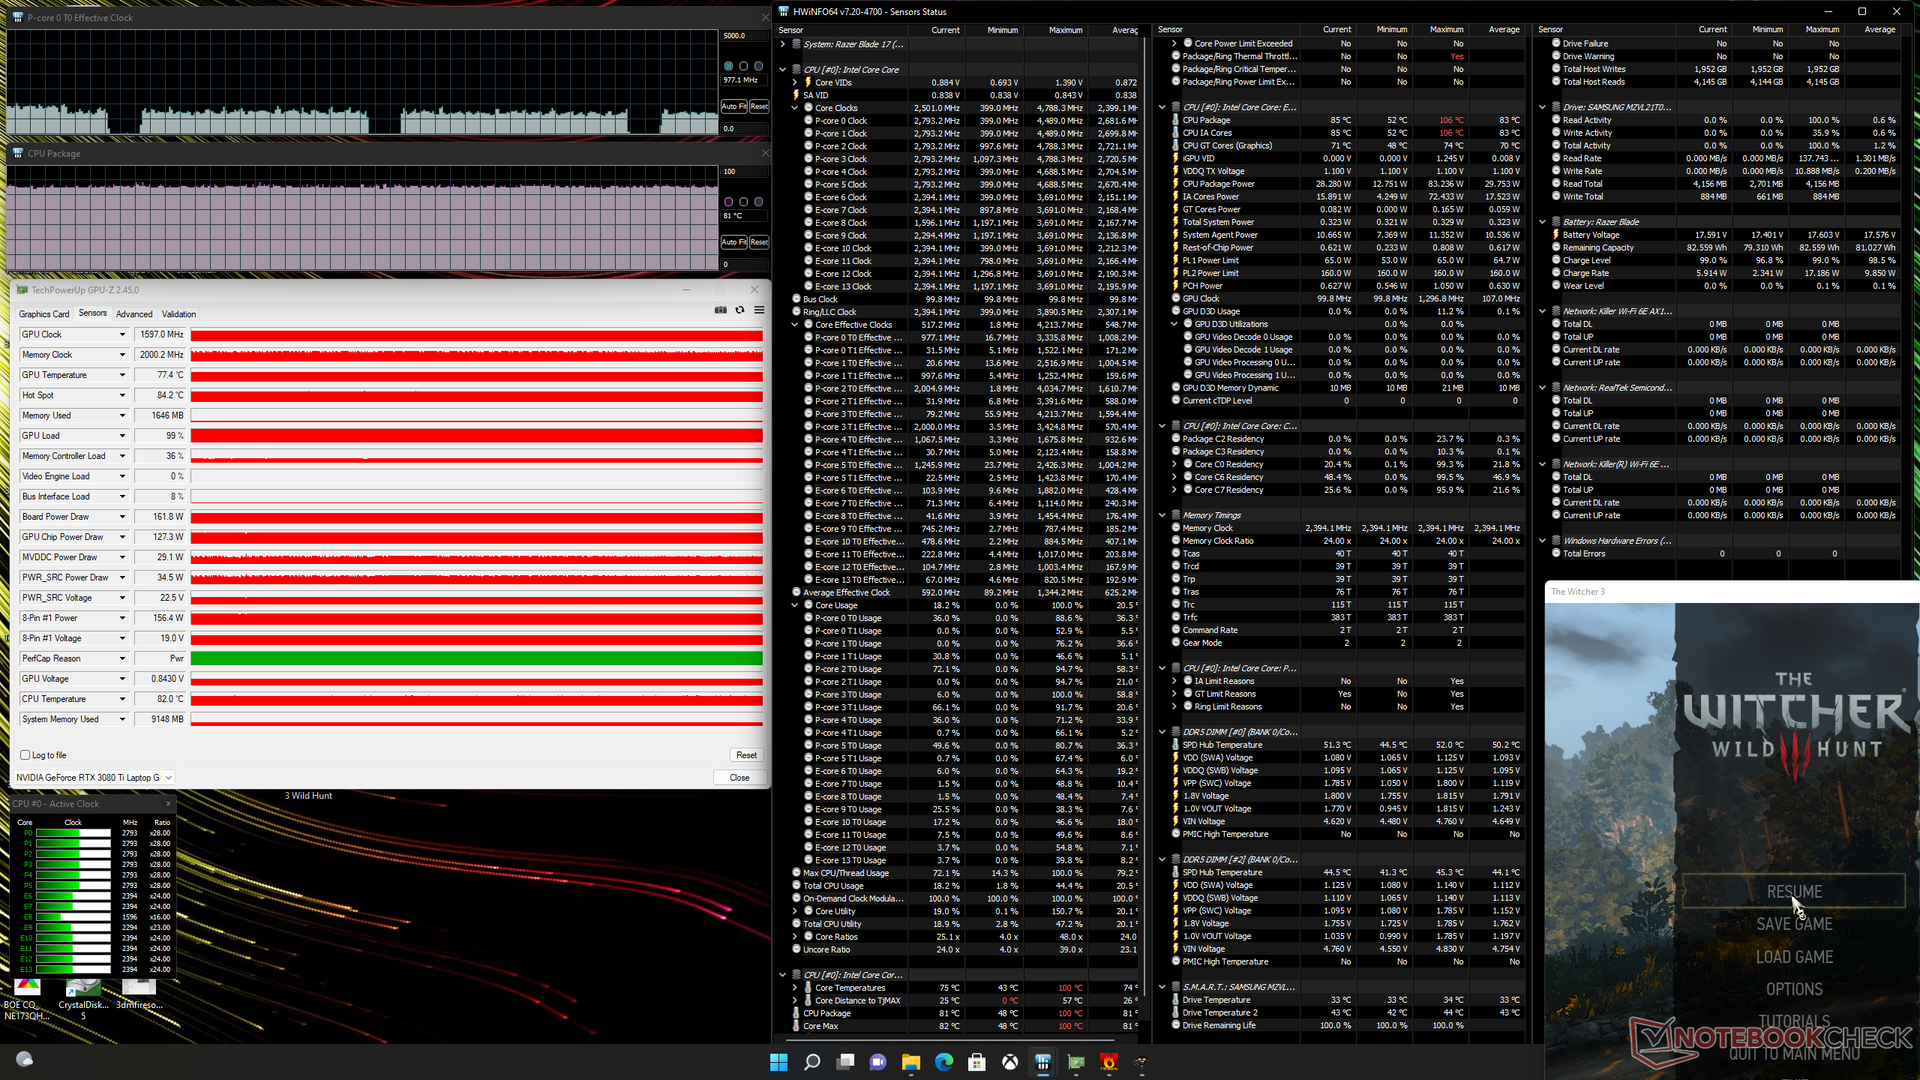
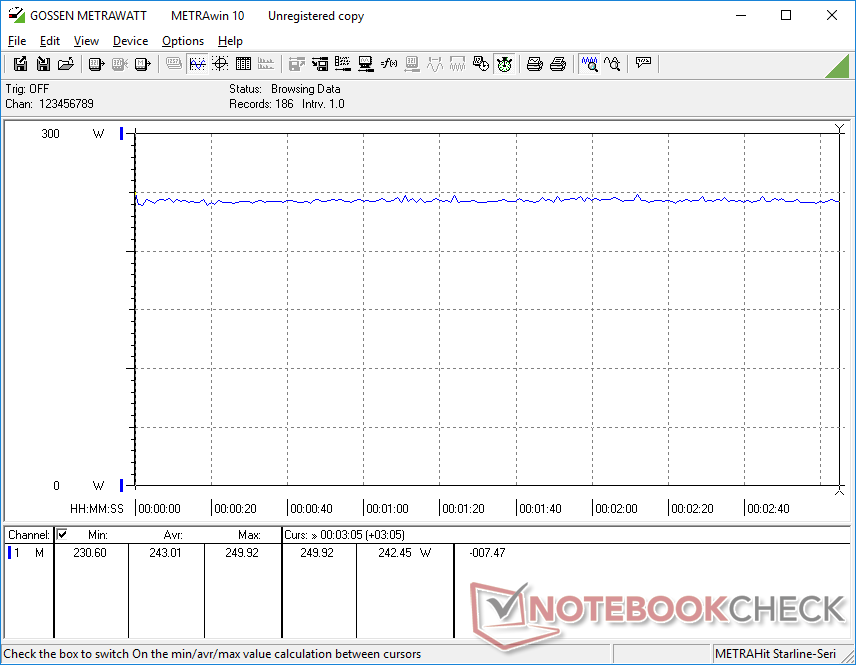
The Witcher 3 im Maximalleistungsmodus zu spielen resultiert in einem GPU-Gesamtverbrauch von 162 W, während im ausbalancierten Modus nur 143 W erreicht werden. Der Maximalleistungsmodus ist also erforderlich, um im Spielebetrieb die maximale Leistung aus dem Blade 17 herauszubekommen. Die CPU- und GPU-Temperaturen stabilisieren sich bei 81 °C bzw. 77°C, während das Blade 17 Intel 11. Gen. mit RTX 3070 ca. 79 °C bzw. 72 °C und das Blade 17 Intel 10. Gen. mit RTX 3080 ca. 65 °C bzw. 64 °C erreicht. In Anbetracht der höheren TDP- und TGP-Ziele unseres 12.-Gen.-Modells sind die höheren Kerntemperaturen keine Überraschung.
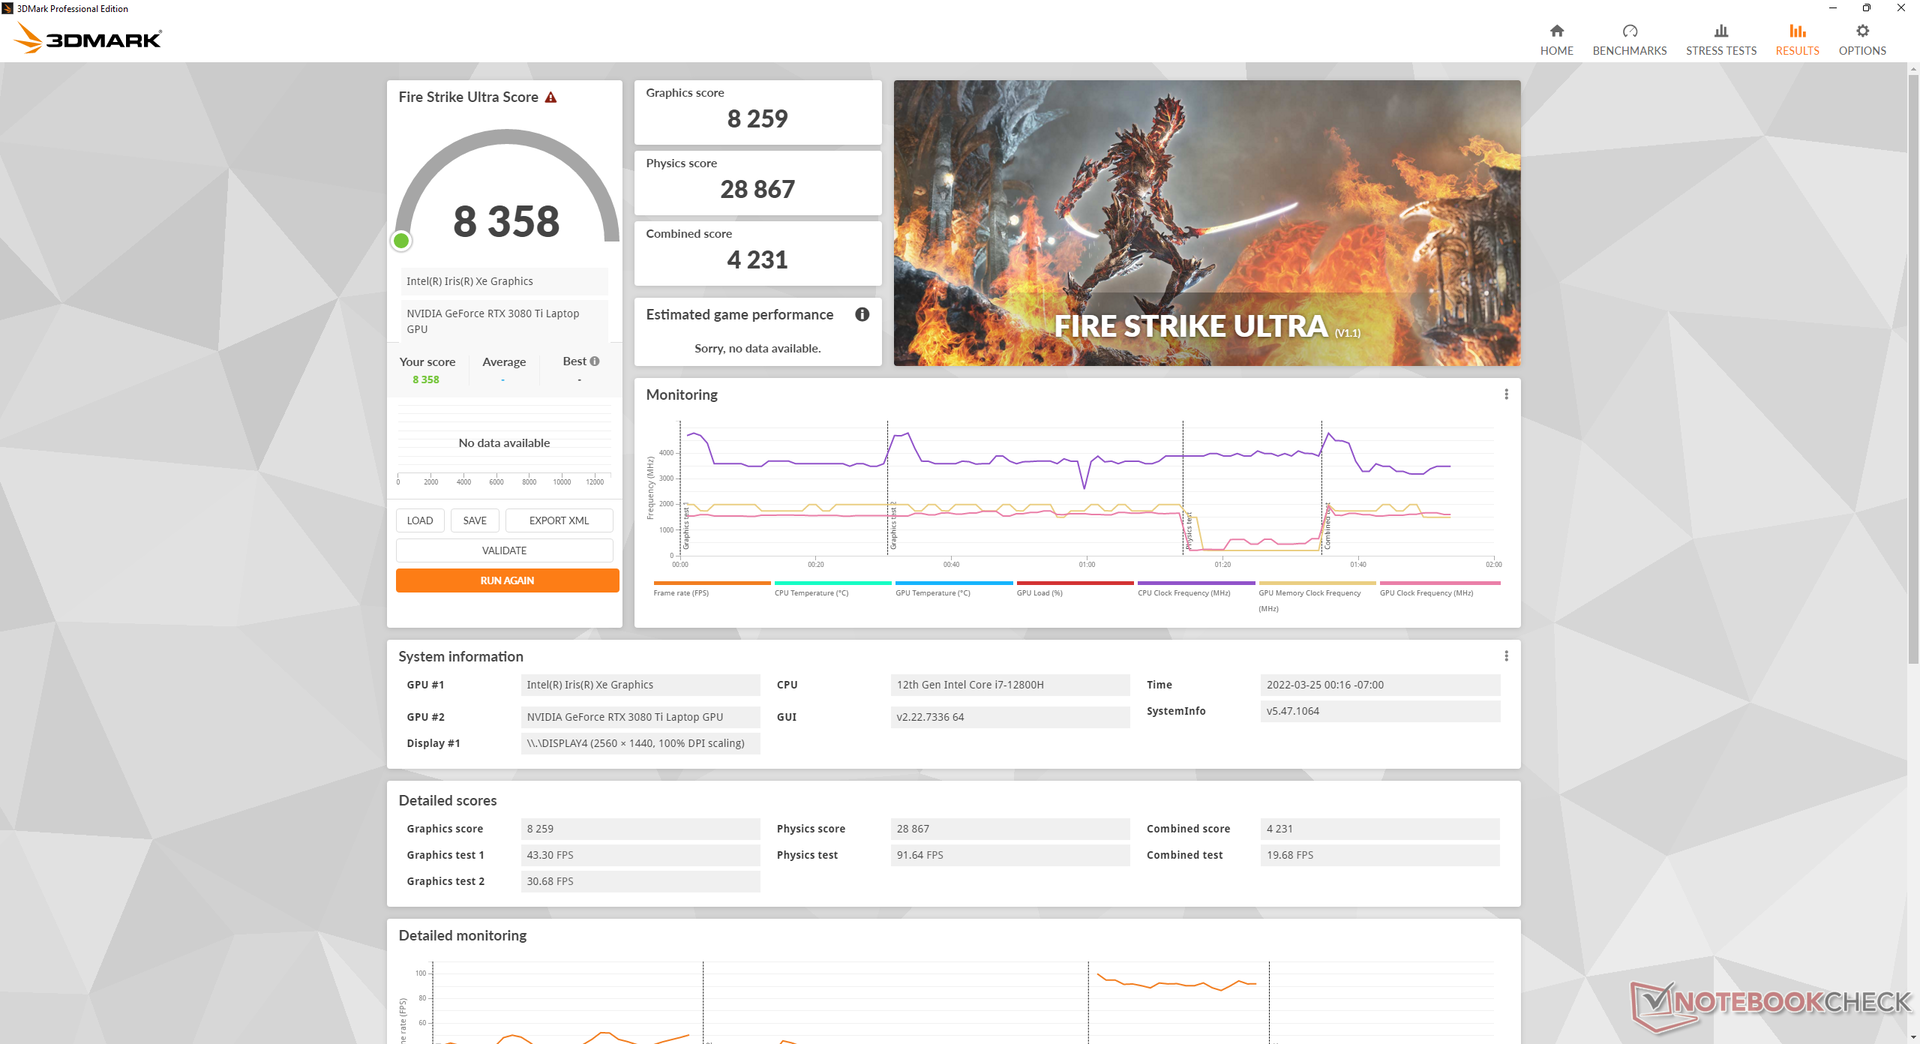
Im Akkumodus ist die Leistung deutlich eingeschränkt, da die Auswahl aggressiverer Leistungsprofile als dem ausbalancierten Modus dann gesperrt ist. Ein Fire-Strike-Durchlauf liefert im Akkumodus Physik- und Grafikpunktzahlen von 11.785 bzw. 9.465 Punkten, während im Netzbetrieb 27.907 bzw. 32.106 Punkte erreicht werden.
| CPU-Takt (GHz) | GPU-Takt (MHz) | Durchschnittliche CPU-Temperatur (°C) | Durchschnittliche GPU-Temperatur (°C) | |
| Leerlauf | -- | -- | 50 | 47 |
| Prime95-Stress | 2,4 - 2,6 | -- | 71 | 45 |
| Prime95-+FurMark-Stress | 1,8 | ~1.642 | 89 | 76 |
| Witcher-3-Stress (ausbalancierter Modus) | ~1,1 | 1.597 | 76 | 74 |
| Witcher-3-Stress (Maximalleistungsmodus) | ~1,1 | 1.597 | 81 | 77 |
Speakers
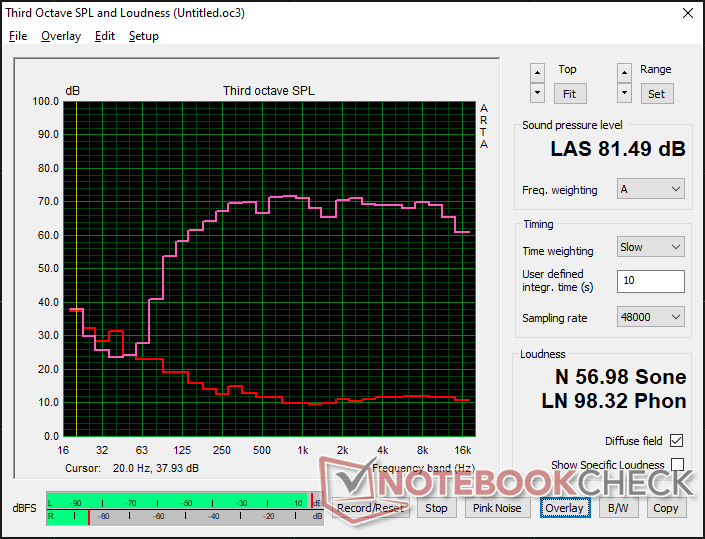
Razer Blade 17 RTX 3080 Ti Audio Analyse
(±) | Mittelmäßig laut spielende Lautsprecher (81.5 dB)
Bass 100 - 315 Hz
(±) | abgesenkter Bass - 6.7% geringer als der Median
(±) | durchschnittlich lineare Bass-Wiedergabe (8.3% Delta zum Vorgänger)
Mitteltöne 400 - 2000 Hz
(+) | ausgeglichene Mitten, vom Median nur 2.1% abweichend
(+) | lineare Mitten (4.3% Delta zum Vorgänger)
Hochtöne 2 - 16 kHz
(+) | ausgeglichene Hochtöne, vom Median nur 0.7% abweichend
(+) | sehr lineare Hochtöne (1.7% Delta zum Vorgänger)
Gesamt im hörbaren Bereich 100 - 16.000 Hz
(+) | hörbarer Bereich ist sehr linear (6.8% Abstand zum Median
Im Vergleich zu allen Geräten derselben Klasse
» 0% aller getesteten Geräte dieser Klasse waren besser, 0% vergleichbar, 99% schlechter
» Das beste Gerät hat einen Delta-Wert von 6%, durchschnittlich ist 18%, das schlechteste Gerät hat 132%
Im Vergleich zu allen Geräten im Test
» 1% aller getesteten Geräte waren besser, 0% vergleichbar, 99% schlechter
» Das beste Gerät hat einen Delta-Wert von 4%, durchschnittlich ist 23%, das schlechteste Gerät hat 134%
Apple MacBook Pro 16 2021 M1 Pro Audio Analyse
(+) | Die Lautsprecher können relativ laut spielen (84.7 dB)
Bass 100 - 315 Hz
(+) | guter Bass - nur 3.8% Abweichung vom Median
(+) | lineare Bass-Wiedergabe (5.2% Delta zum Vorgänger)
Mitteltöne 400 - 2000 Hz
(+) | ausgeglichene Mitten, vom Median nur 1.3% abweichend
(+) | lineare Mitten (2.1% Delta zum Vorgänger)
Hochtöne 2 - 16 kHz
(+) | ausgeglichene Hochtöne, vom Median nur 1.9% abweichend
(+) | sehr lineare Hochtöne (2.7% Delta zum Vorgänger)
Gesamt im hörbaren Bereich 100 - 16.000 Hz
(+) | hörbarer Bereich ist sehr linear (4.6% Abstand zum Median
Im Vergleich zu allen Geräten derselben Klasse
» 0% aller getesteten Geräte dieser Klasse waren besser, 0% vergleichbar, 100% schlechter
» Das beste Gerät hat einen Delta-Wert von 5%, durchschnittlich ist 17%, das schlechteste Gerät hat 45%
Im Vergleich zu allen Geräten im Test
» 0% aller getesteten Geräte waren besser, 0% vergleichbar, 100% schlechter
» Das beste Gerät hat einen Delta-Wert von 4%, durchschnittlich ist 23%, das schlechteste Gerät hat 134%
Energieverwaltung
Energieaufnahme — Rekord für die Blade-Serie
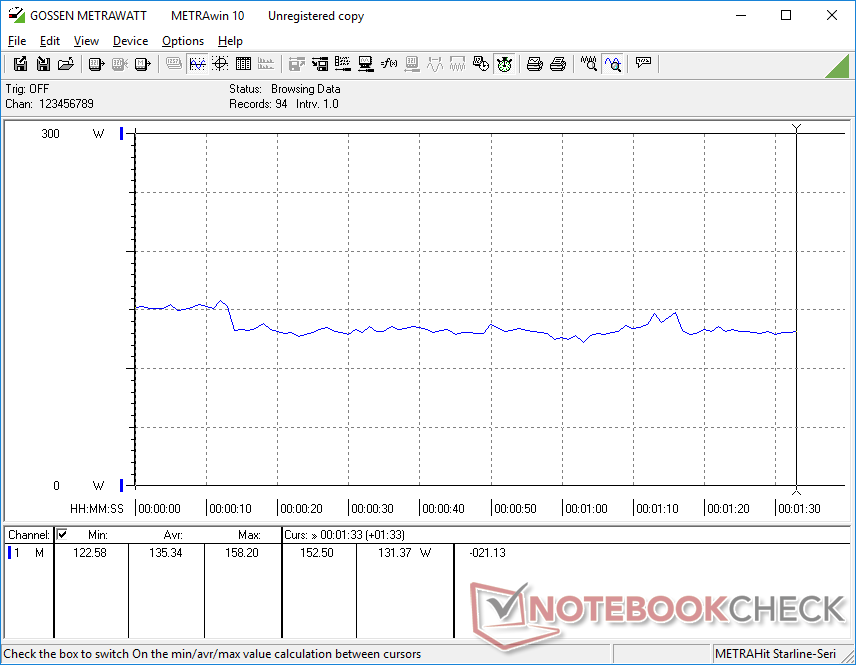
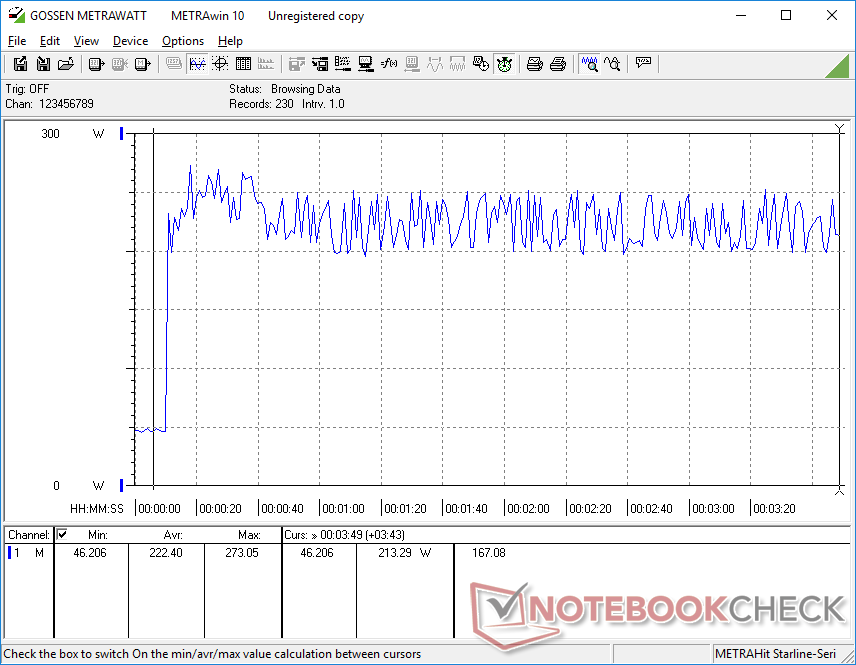
Das neue Modell ist energiehungriger als je zuvor. Im Leerlauf auf dem Desktop werden je nach Helligkeitsstufe und Leistungsprofil ziwschen 30 W und 61 W verbraucht, während das Blade 17 2021, MSI GS76 und das Asus ROG Zephyrus S17 jeweils nur fast die Hälfte verbrauchen. Tatsächlich werden beim Spielen von The Witcher 3 ganze 30 % mehr Strom verbraucht als von der RTX 3070 und dem Core i7-11800H im Blade 17 2021, dabei liegen der Vorsprung in Sachen Grafikleistung und Prozessorleistung nur bei 20-25 % bzw. 25 %.
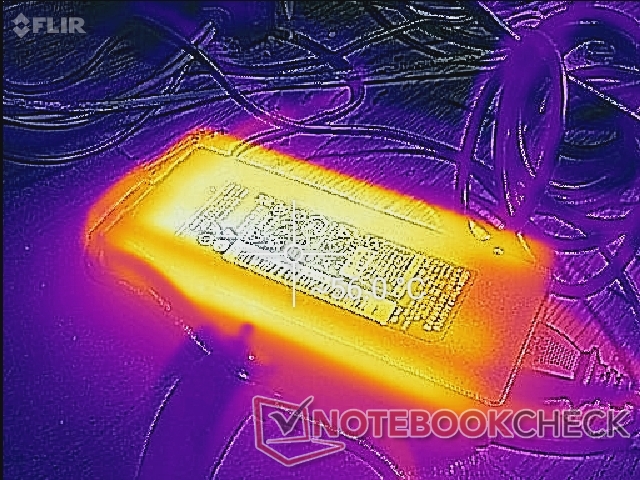
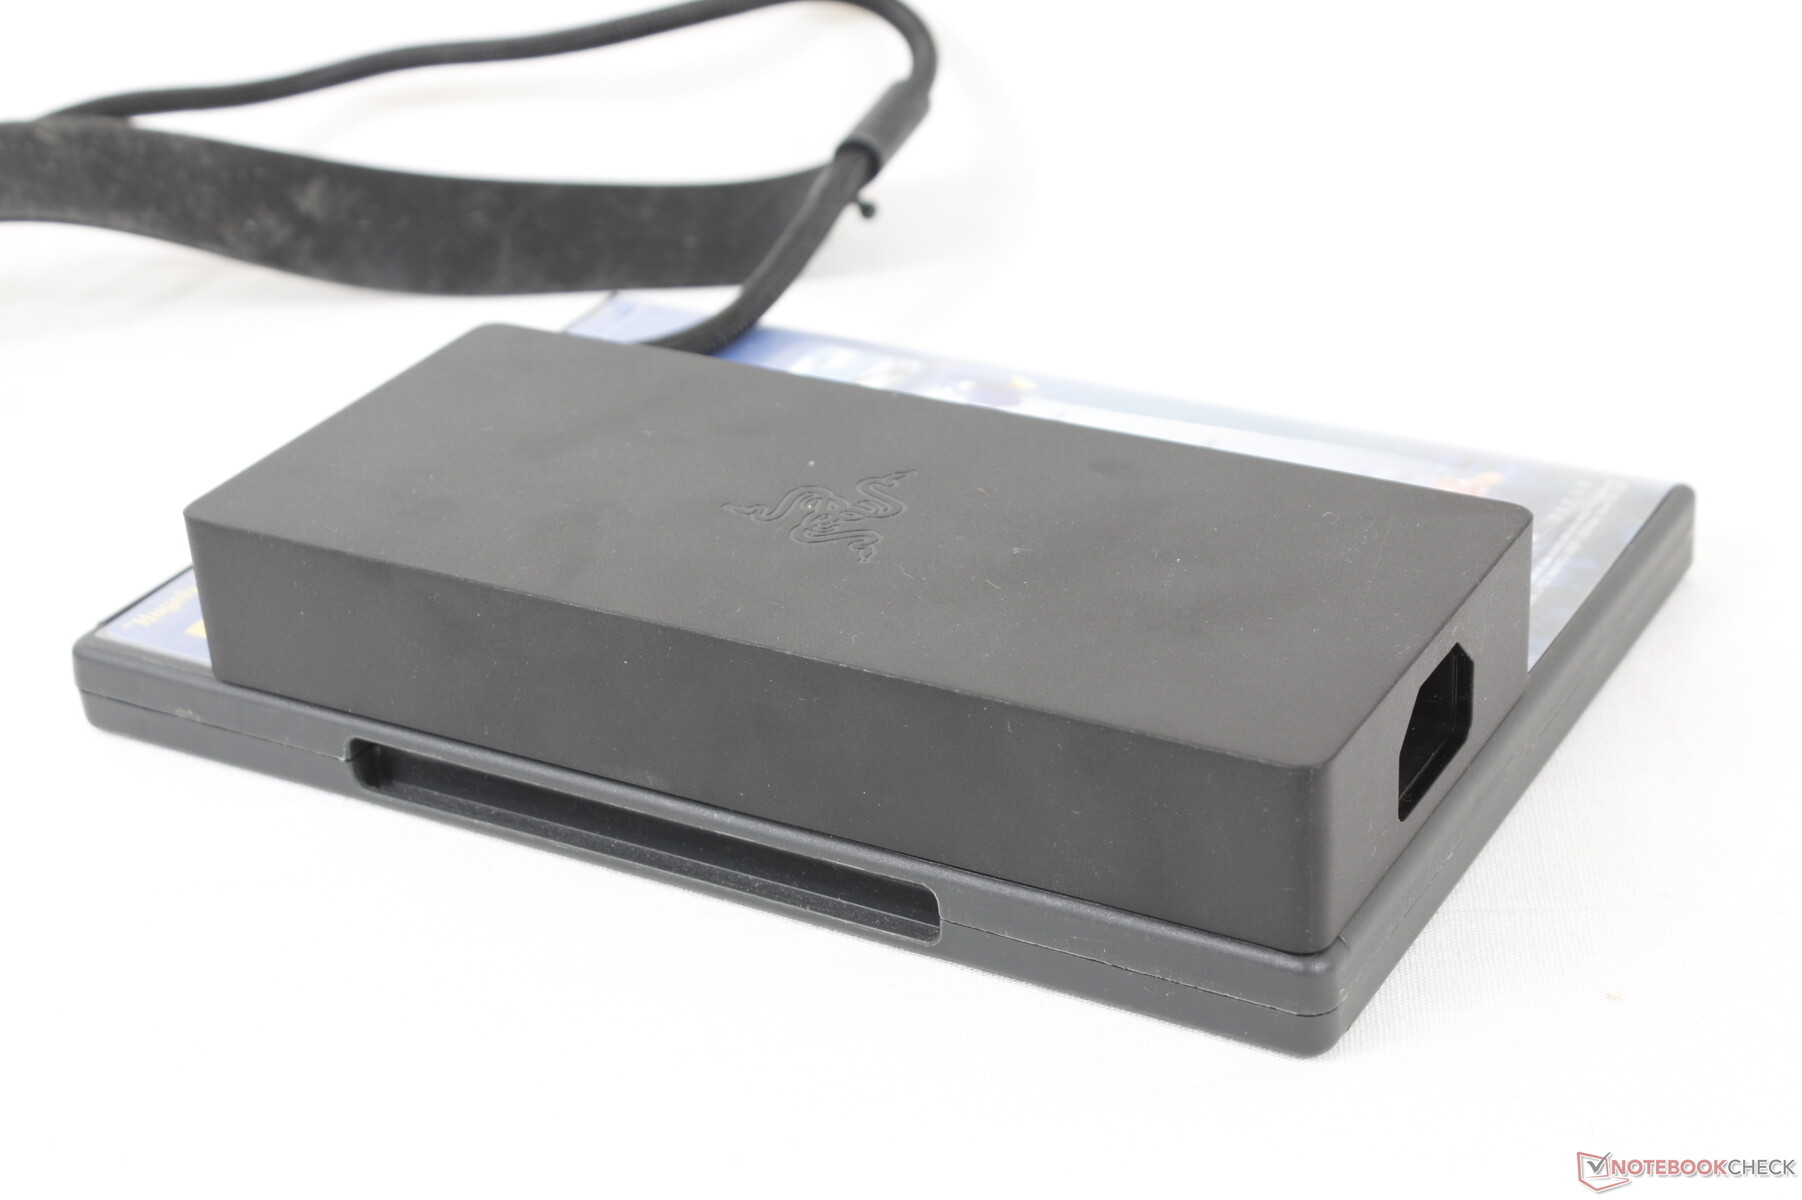
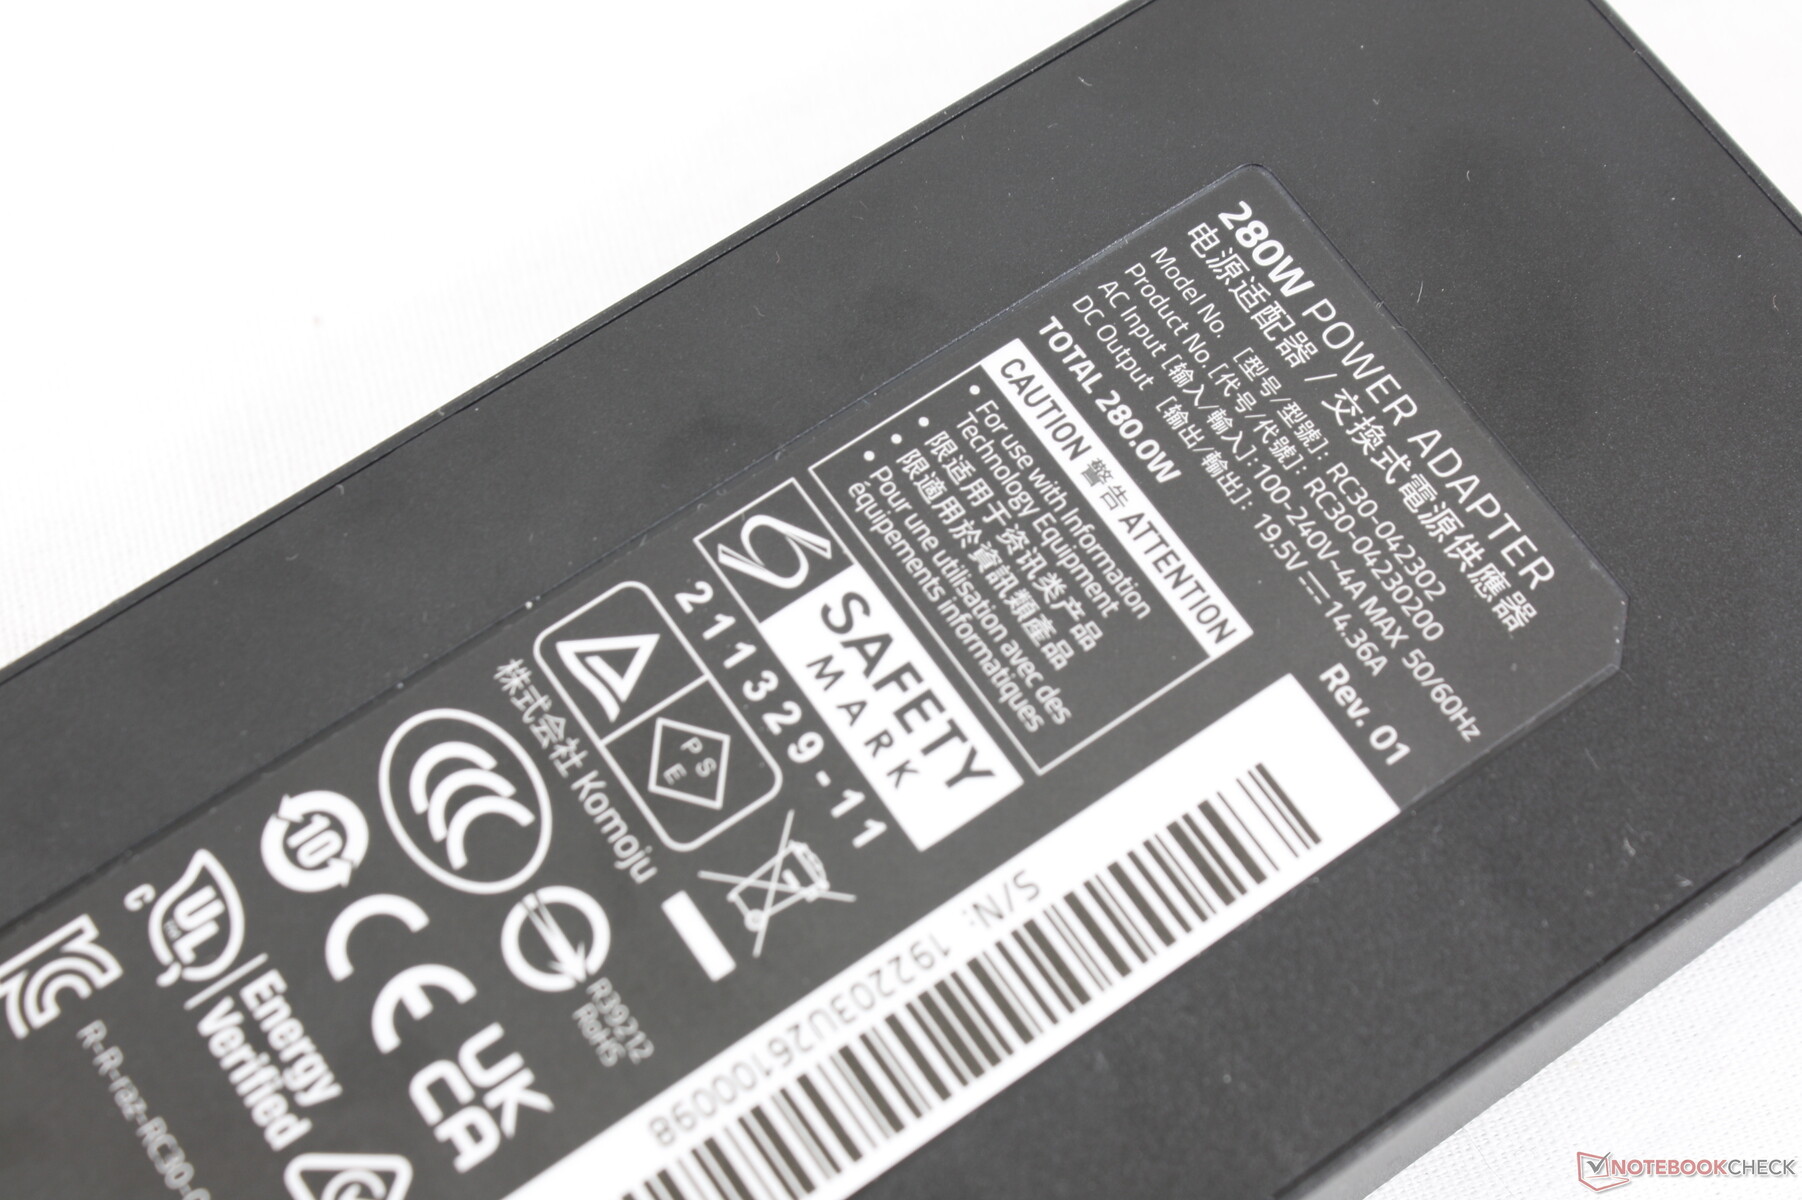
Um die anspruchsvolleren Chips dieses Jahr ausreichend mit Strom versorgen zu können, legt Razer dem Blade 17 2022 statt dem 230-W-Netzteil des 2021er-Modells ein stärkeres 280-W-Netzteil bei. Zum Glück bleibt die Gesamtgröße des Netzteils trotz der höheren Leistung jedoch fast unverändert (~16,4 x 7 x 2,5 cm vs. ~17 x 7 x 2,5 cm).
| Aus / Standby | |
| Idle | |
| Last |
|
Legende:
min: | |
| Razer Blade 17 RTX 3080 Ti i7-12800H, GeForce RTX 3080 Ti Laptop GPU, Samsung PM9A1 MZVL21T0HCLR, IPS, 2560x1440, 17.3" | Razer Blade Pro 17 2021 (QHD Touch) i7-10875H, GeForce RTX 3080 Laptop GPU, Samsung PM981a MZVLB1T0HBLR, IPS, 3840x2160, 17.3" | MSI GS76 Stealth 11UH i9-11900H, GeForce RTX 3080 Laptop GPU, Samsung PM9A1 MZVL22T0HBLB, IPS, 3840x2160, 17.3" | Asus ROG Zephyrus S17 GX703HSD i9-11900H, GeForce RTX 3080 Laptop GPU, Samsung PM9A1 MZVL22T0HBLB, IPS, 2560x1440, 17.3" | Aorus 17G YD i7-11800H, GeForce RTX 3080 Laptop GPU, Samsung PM9A1 MZVL2512HCJQ, IPS, 1920x1080, 17.3" | Alienware x17 RTX 3080 P48E i7-11800H, GeForce RTX 3080 Laptop GPU, 2x WDC PC SN730 SDBPNTY-1T00 (RAID 0), IPS, 3840x2160, 17.3" | |
|---|---|---|---|---|---|---|
| Stromverbrauch | 34% | 38% | 27% | 27% | 24% | |
| Idle min * (Watt) | 29.8 | 15.2 49% | 14 53% | 21.7 27% | 24 19% | 10.2 66% |
| Idle avg * (Watt) | 37.1 | 20.3 45% | 19 49% | 27 27% | 26 30% | 21.2 43% |
| Idle max * (Watt) | 60.8 | 37.3 39% | 31 49% | 33 46% | 38 37% | 48.4 20% |
| Last avg * (Watt) | 135.3 | 114.9 15% | 97 28% | 108 20% | 101 25% | 118.7 12% |
| Witcher 3 ultra * (Watt) | 243 | 158.4 35% | 156 36% | 195 20% | 164 33% | 249 -2% |
| Last max * (Watt) | 273.1 | 223.7 18% | 231 15% | 210 23% | 230 16% | 262 4% |
* ... kleinere Werte sind besser
Verbaruch Witcher 3 / Stresstest
Verbrauch externer Monitor
Akkulaufzeit — Nicht besser, nicht schlechter
Die Akkukapazität ist dank des weggefallenen, vierten Lüfters höher als beim Blade 17 2021. Die Laufzeiten sind jedoch nicht besser, da die neue CPU und GPU einen höheren Stromverbrauch aufweisen. Ein ähnliches Verhalten haben wir auch bei dem 2021er und dem 2022er-Modell des Blade 15 beobachtet.
Den Akku mit dem mitgelieferten Netzteil vollständig aufzuladen dauert ca. 90 Minuten. Im Gegensatz zum Asus TUF Gaming F15 wird das Laden über USB-C hier unterstützt.
| Razer Blade 17 RTX 3080 Ti i7-12800H, GeForce RTX 3080 Ti Laptop GPU, 82 Wh | Razer Blade Pro 17 2021 (QHD Touch) i7-10875H, GeForce RTX 3080 Laptop GPU, 70.5 Wh | MSI GS76 Stealth 11UH i9-11900H, GeForce RTX 3080 Laptop GPU, 99.9 Wh | Asus ROG Zephyrus S17 GX703HSD i9-11900H, GeForce RTX 3080 Laptop GPU, 90 Wh | Aorus 17G YD i7-11800H, GeForce RTX 3080 Laptop GPU, 99 Wh | Alienware x17 RTX 3080 P48E i7-11800H, GeForce RTX 3080 Laptop GPU, 87 Wh | |
|---|---|---|---|---|---|---|
| Akkulaufzeit | 19% | 19% | 91% | 22% | -11% | |
| Idle (h) | 8 | 9.9 24% | 9.9 24% | 9 13% | 7 -12% | |
| WLAN (h) | 5.5 | 5.9 7% | 6.4 16% | 7.5 36% | 6 9% | 5.9 7% |
| Last (h) | 1.1 | 1.4 27% | 1.3 18% | 2.7 145% | 1.6 45% | 0.8 -27% |
| H.264 (h) | 7.2 | 6.2 | ||||
| Witcher 3 ultra (h) | 1 |
Pro
Contra
Fazit — Mehr Watt, mehr Leistung
Das Blade 17 wurde 2019 mit einer 100-W-GeForce-Grafikkarte vorgestellt. Das 2022er-Modell ist mit einer noch leistungsfähigeren 165-W-GPU ausgestattet, besitzt jedoch kein größeres bzw. verändertes Gehäuse. Die Leistung hat sich natürlich verbessert, allerdings bringt der höhere Stromverbrauch höhere Temperaturen, ein größeres Netzteil und tendenziell kürzere Akkulaufzeiten als bei früheren Blade-17-Modellen mit älteren Prozessoren mit sich.
Zum Glück hat Razer einige Aspekte des 2022er-Modells angepasst, um die höhere Leistungsaufnahme auszugleichen. So ist der verbaute Akku nun größer ist, man muss allerdings auf einen Lüfter und damit eine etwas bessere Kühlung verzichten. Das 280-W-Netzteil, das leider oft vernachlässigt wird, ist eines der kleinsten und leichtesten Modelle die wir in dieser anspruchsvollen Leistungsklasse je gesehen haben und gut für unterwegs geeignet. Offenbar war sich der Hersteller der weniger genügsamen Komponenten bewusst und hat während der Entwicklung Schritte unternommen, um die unausweichlichen Nachteile etwas abzufedern.
Da das Hauptaugenmerk hier so deutlich auf der Leistung liegt, schlägt die 165-W-GPU im Razer-Laptop die meisten anderen Laptops mit der gleichen GPU. Andere ultradünne Laptops haben tendenziell niedrigere TGP-Ziele als das Blade 17 und sind deshalb konstant langsamer. Hier bekommt man die maximale, mobile Grafikleistung, ohne auf dickeren Optionen wie die MSI-GT-Reihe oder ein Asus ROG Chimera ausweichen zu müssen. Um die Temperaturen zu verbessern, könnten zukünftige Modelle des Blade 17 zusätzlich Flüssigmetall nutzen.
Preis und Verfügbarkeit
Razer bietet unsere Konfiguration derzeit für 4.300 Euro an. Auf Amazon.de ist der Laptop aktuell nicht auf Lager.
Razer Blade 17 RTX 3080 Ti
- 05.07.2022 v7 (old)
Allen Ngo
Preisvergleich

