Test Acer Nitro 5 AN517-53: Preiswerter Gaming-Laptop mit RTX 3050
Das aufgrund seines meist guten Preis-Leistungs-Verhältnisses sehr beliebte Acer Nitro 5 existiert in diversen CPU- und GPU-Konfigurationen. Wir haben uns mit dem AN517-53-54DQ eines der günstigsten Modelle geschnappt und auf Herz und Nieren getestet. Der 17-Zöller, welcher für knapp 1.000 Euro über die (virtuelle) Ladentheke wandert, kann auf einen Vierkern-Prozessor aus Intels aktueller Tiger-Lake-Generation zurückgreifen, genauer gesagt den Core i5-11300H.
Um anspruchsvolle Grafikberechnungen (das Notebook unterstützt Nvidias Optimus-Technik) kümmert sich die GeForce RTX 3050 Laptop GPU, ein brandneuer Mittelklasse-Chip auf Basis von Nvidias Ampere-Architektur. Das Betriebssystem (Windows 10 Home 64 Bit) ist auf einer 512 GB großen NVMe-SSD im M.2-Format installiert. Als Display dient ein mattes IPS-Panel mit 1.920 x 1.080 Pixeln und 144 Hz.
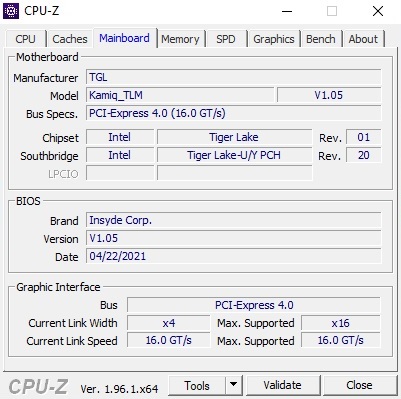
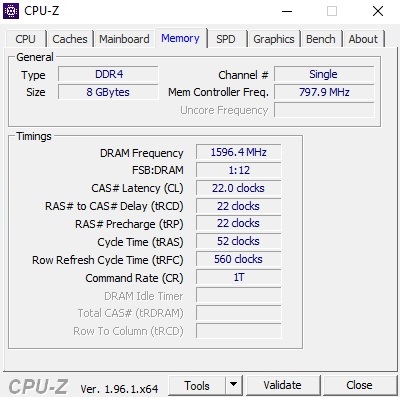
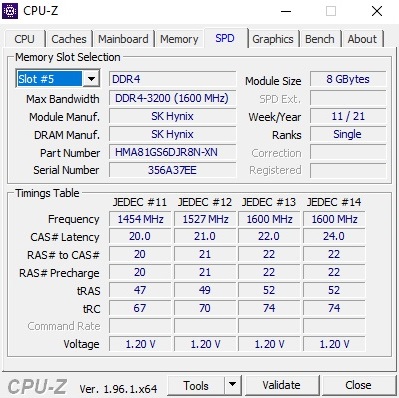
Gewisse Abstriche müssen Käufer beim Arbeitsspeicher machen. Die verbauten 8 GB DDR4-RAM sind nur Single-Rank und laufen lediglich im Single-Channel-Modus, was je nach (3D-)Anwendung mal mehr und mal weniger viel Leistung kostet.
Zu den Konkurrenten des Nitro 5 AN517-53-54DQ zählen andere günstige 17-Zoll-Gamer mit Vierkern-CPU und Midrange-GPU wie das Lenovo Legion 5 17IMH05, das MSI GF75 Thin 10SCXR und das Asus TUF FX705DT-AU068T, welche allesamt noch mit der alten GeForce GTX 1650, also dem Vorgänger der RTX 3050, ausgestattet sind. Als weiteres Vergleichsgerät haben wir für den Test das HP Omen 15-ek0456ng mit GeForce GTX 1660 Ti gewählt.
mögliche Konkurrenten im Vergleich
Bew. | Datum | Modell | Gewicht | Dicke | Größe | Auflösung | Preis ab |
|---|---|---|---|---|---|---|---|
| 81.1 % v7 (old) | 08 / 2021 | Acer Nitro 5 AN517-53-54DQ i5-11300H, GeForce RTX 3050 4GB Laptop GPU | 2.6 kg | 25 mm | 17.30" | 1920x1080 | |
| 82.1 % v7 (old) | 09 / 2020 | HP Omen 15-ek0456ng i5-10300H, GeForce GTX 1660 Ti Mobile | 2.1 kg | 32 mm | 15.60" | 1920x1080 | |
| 81.9 % v7 (old) | 10 / 2020 | Lenovo Legion 5 17IMH05 i5-10300H, GeForce GTX 1650 Mobile | 2.9 kg | 26.2 mm | 17.30" | 1920x1080 | |
| 78.5 % v7 (old) | 04 / 2020 | MSI GF75 Thin 10SCXR i5-10300H, GeForce GTX 1650 Mobile | 2.2 kg | 23.1 mm | 17.30" | 1920x1080 | |
| 77.8 % v7 (old) | 06 / 2019 | Asus TUF FX705DT-AU068T R5 3550H, GeForce GTX 1650 Mobile | 2.7 kg | 26.6 mm | 17.30" | 1920x1080 |
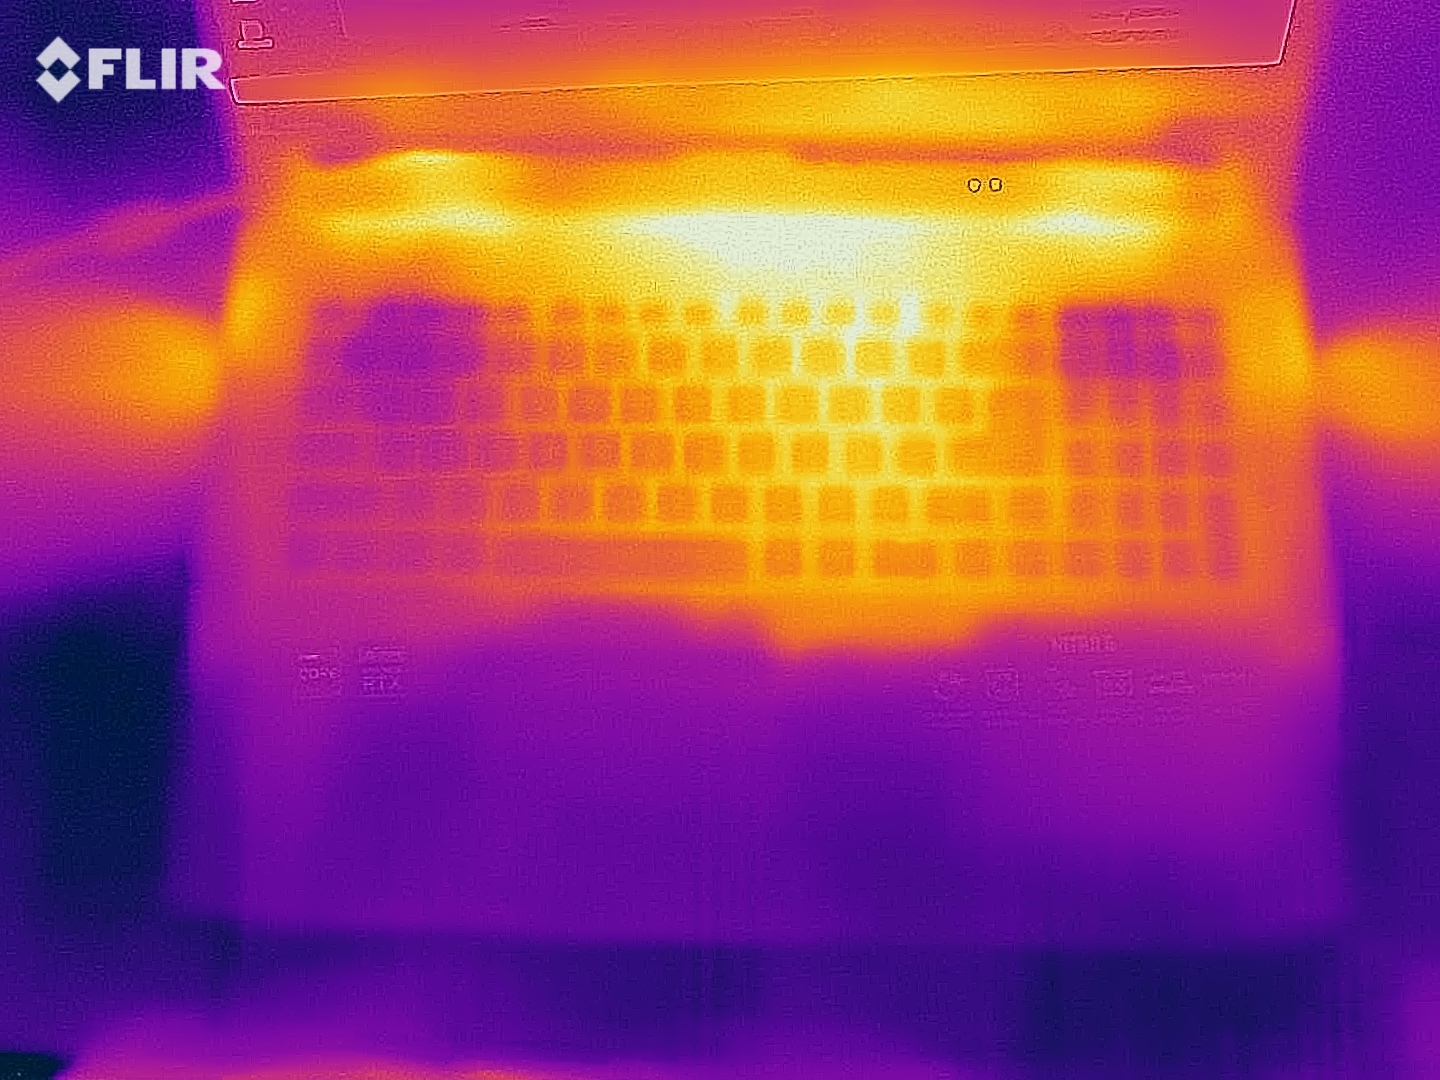
Da das Gehäuse größtenteils identisch zum kürzlich überprüften Acer Nitro 5 AN517-41-R5Z7 ist, gehen wir in diesem Artikel nicht genauer auf das Chassis, die Ausstattung (Schnittstellen etc.) und die Eingabegeräte ein. Sie finden die entsprechenden Informationen im verlinkten Testbericht. Die einzige markante Änderung betrifft das Keyboard. Anstelle einer weiß beschrifteten und RGB-beleuchteten Tastatur bietet das Nitro 5 AN517-53-54DQ ein rotes Modell (sowohl Beschriftung als auch Beleuchtung).

Kommunikation
Webcam


Display - 144 Hz, aber dunkel und farbarm
Obwohl das 144-Hz-Panel mit dem Nitro 5 AN517-41-R5Z7 übereinstimmt, weichen die ermittelten Werte stellenweise etwas voneinander ab. Das ist ein typisches Phänomen, da es in der Serienproduktion immer gewisse Schwankungen gibt.
| |||||||||||||||||||||||||
Ausleuchtung: 83 %
Helligkeit Akku: 286 cd/m²
Kontrast: 1243:1 (Schwarzwert: 0.23 cd/m²)
ΔE ColorChecker Calman: 4.92 | ∀{0.5-29.43 Ø4.73}
calibrated: 4.73
ΔE Greyscale Calman: 1.9 | ∀{0.09-98 Ø4.97}
37.9% AdobeRGB 1998 (Argyll 3D)
55% sRGB (Argyll 3D)
36.7% Display P3 (Argyll 3D)
Gamma: 2.175
CCT: 6782 K
| Acer Nitro 5 AN517-53-54DQ BOE NV173FHM-NX4 (BOE09B4), IPS, 1920x1080, 17.3" | HP Omen 15-ek0456ng LGD05FE, IPS, 1920x1080, 15.6" | Lenovo Legion 5 17IMH05 AU Optronics B173HAN04.3, IPS, 1920x1080, 17.3" | MSI GF75 Thin 10SCXR AU Optronics B173HAN04.7, IPS, 1920x1080, 17.3" | Asus TUF FX705DT-AU068T AU Optronics B173HAN04.2, IPS, 1920x1080, 17.3" | |
|---|---|---|---|---|---|
| Display | 85% | 7% | 67% | ||
| Display P3 Coverage (%) | 36.7 | 69.4 89% | 39.46 8% | 62.3 70% | |
| sRGB Coverage (%) | 55 | 97.1 77% | 58.4 6% | 89.1 62% | |
| AdobeRGB 1998 Coverage (%) | 37.9 | 71.2 88% | 40.77 8% | 63.7 68% | |
| Response Times | 36% | -52% | -39% | -63% | |
| Response Time Grey 50% / Grey 80% * (ms) | 24.8 ? | 17 ? 31% | 38.4 ? -55% | 34 ? -37% | 41 ? -65% |
| Response Time Black / White * (ms) | 18.8 ? | 11 ? 41% | 28 ? -49% | 26.4 ? -40% | 30 ? -60% |
| PWM Frequency (Hz) | |||||
| Bildschirm | 18% | -5% | -21% | 6% | |
| Helligkeit Bildmitte (cd/m²) | 286 | 314 10% | 326 14% | 251.2 -12% | 316 10% |
| Brightness (cd/m²) | 261 | 293 12% | 304 16% | 242 -7% | 294 13% |
| Brightness Distribution (%) | 83 | 87 5% | 89 7% | 92 11% | 84 1% |
| Schwarzwert * (cd/m²) | 0.23 | 0.22 4% | 0.25 -9% | 0.34 -48% | 0.32 -39% |
| Kontrast (:1) | 1243 | 1427 15% | 1304 5% | 739 -41% | 988 -21% |
| Delta E Colorchecker * | 4.92 | 2.51 49% | 4.42 10% | 4.5 9% | 3.39 31% |
| Colorchecker dE 2000 max. * | 19.29 | 4.42 77% | 9.44 51% | 20 -4% | 5.56 71% |
| Colorchecker dE 2000 calibrated * | 4.73 | 1.71 64% | 1.53 68% | 3.91 17% | 2.14 55% |
| Delta E Graustufen * | 1.9 | 3.26 -72% | 5.8 -205% | 4 -111% | 3.17 -67% |
| Gamma | 2.175 101% | 2.42 91% | 2.261 97% | 2.25 98% | 2.39 92% |
| CCT | 6782 96% | 6150 106% | 6822 95% | 5882 111% | 7098 92% |
| Farbraum (Prozent von AdobeRGB 1998) (%) | 71 | 37.3 | 51 | ||
| Color Space (Percent of sRGB) (%) | 93 | 58.1 | 89 | ||
| Durchschnitt gesamt (Programm / Settings) | 27% /
21% | 9% /
8% | -18% /
-17% | 3% /
9% |
* ... kleinere Werte sind besser
Während der Schwarzwert (0,23 cd/m²) und der Kontrast (1.243:1) unseres Testgerätes zu überzeugen wissen, kann die Helligkeit nicht begeistern. Durchschnittlich 261 cd/m² genügen zwar für die meisten Innenräume, sobald es an hellere Plätze (Wintergarten, Terrasse, …) geht, mangelt es dem 17-Zöller jedoch deutlich an Leuchtkraft. Selbst bei einem Budget-Gamer erwarten wir im Schnitt mindestens 300 cd/m².
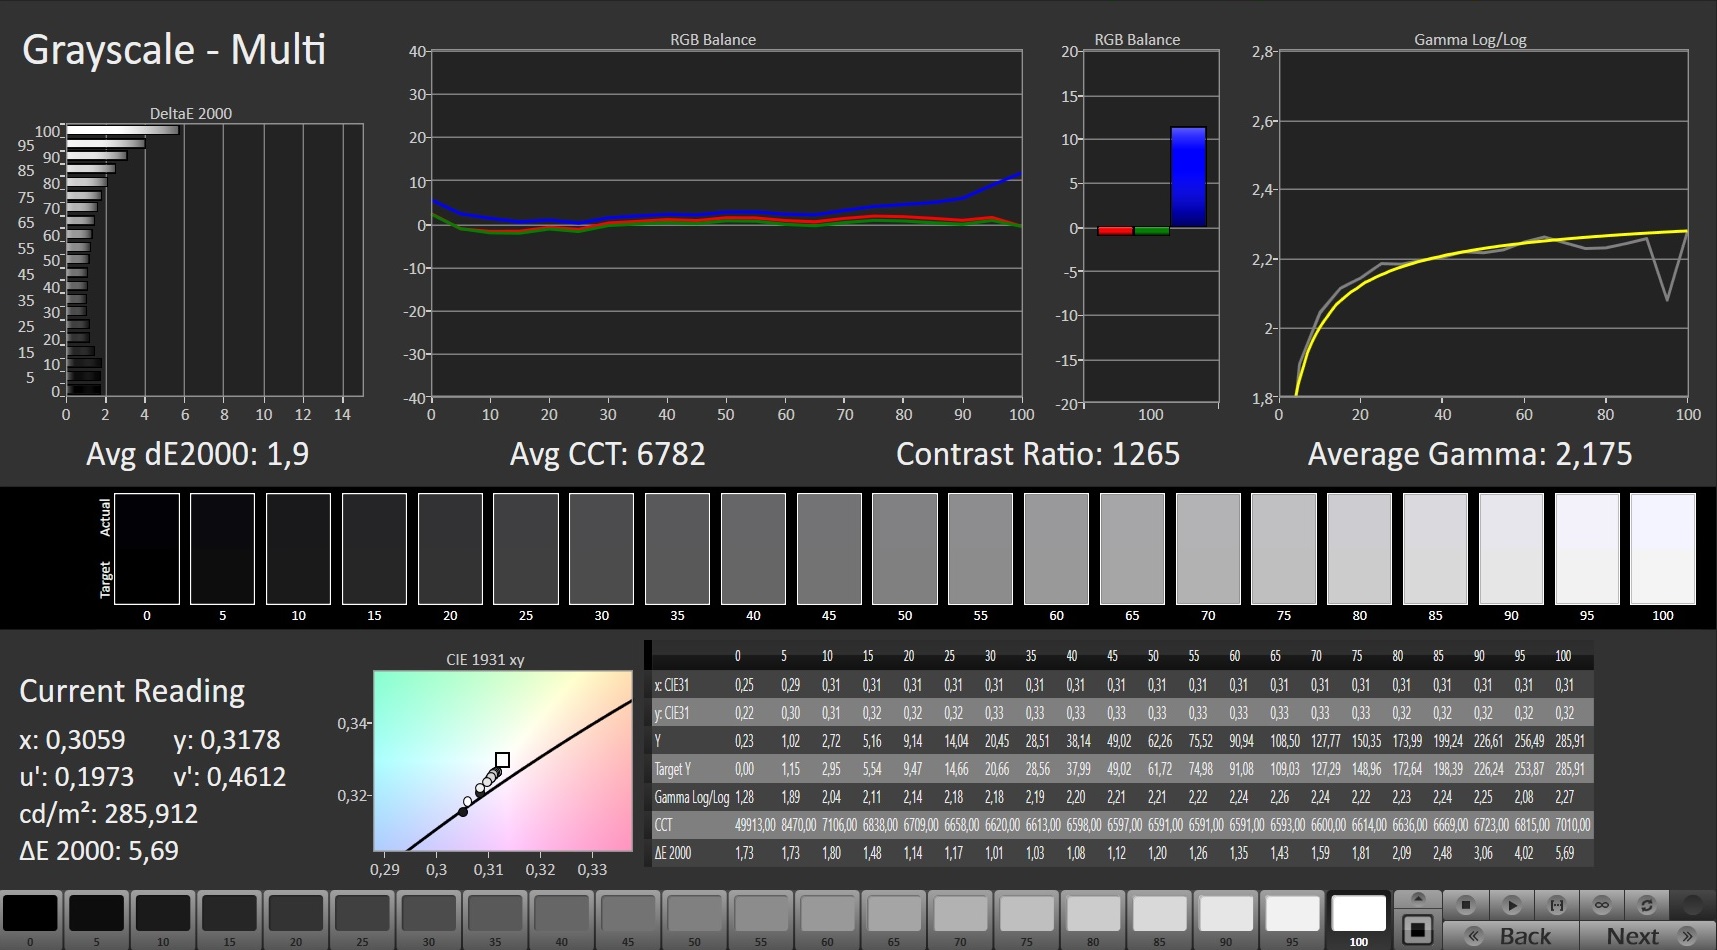
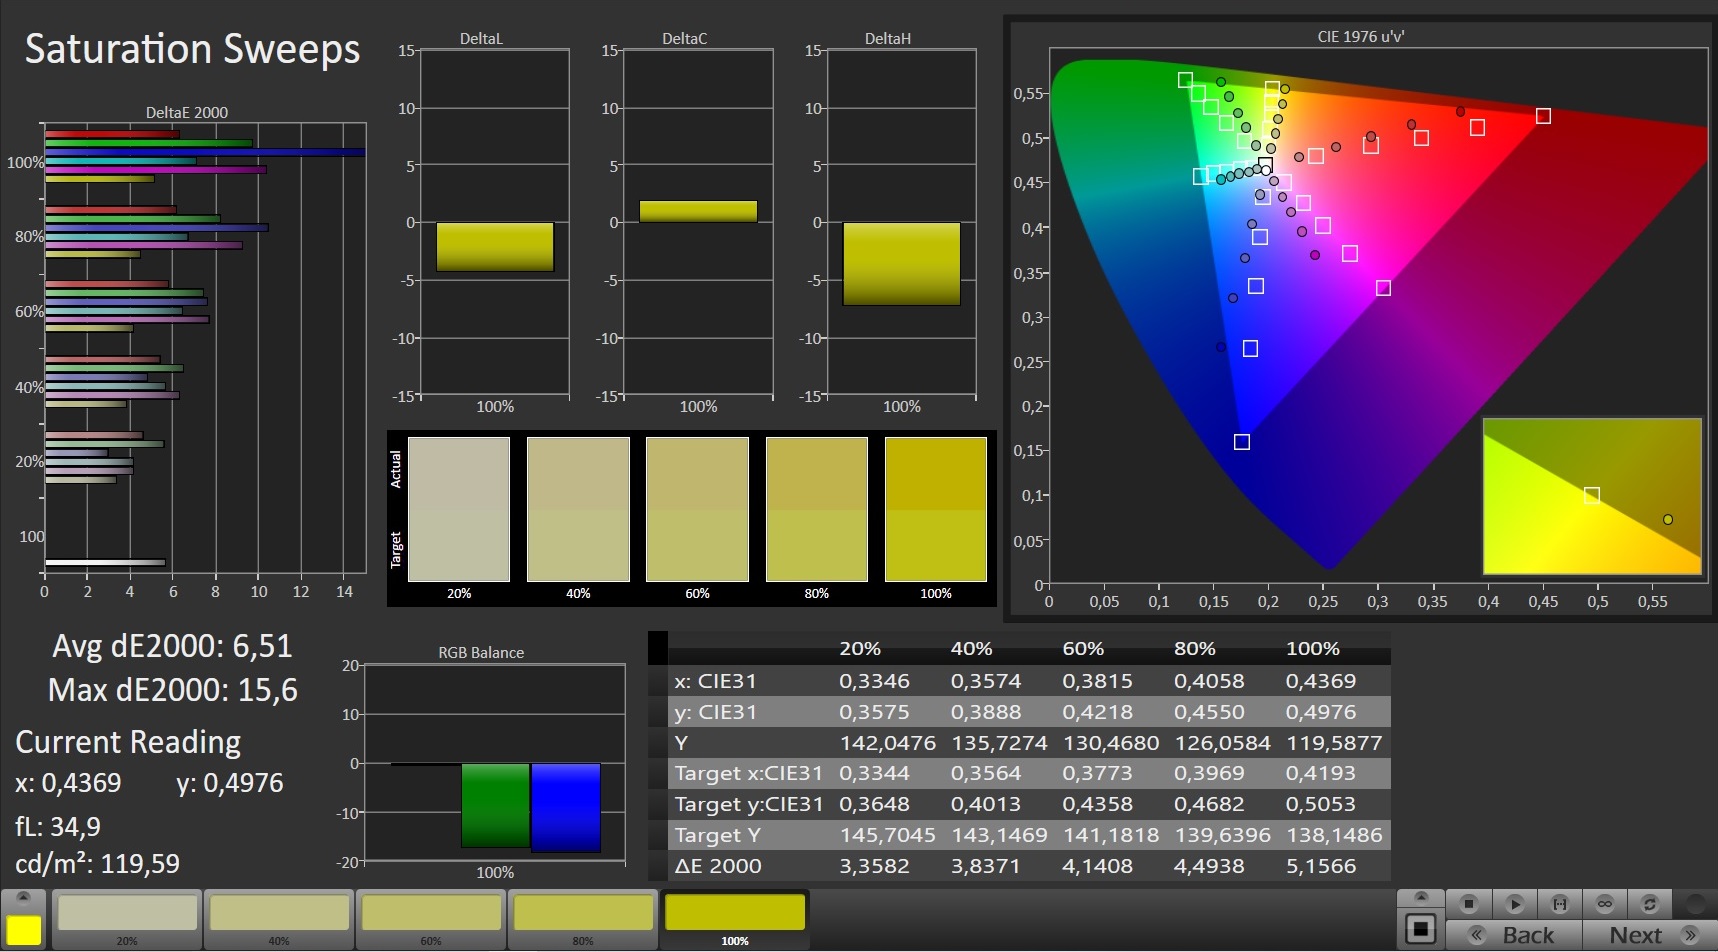

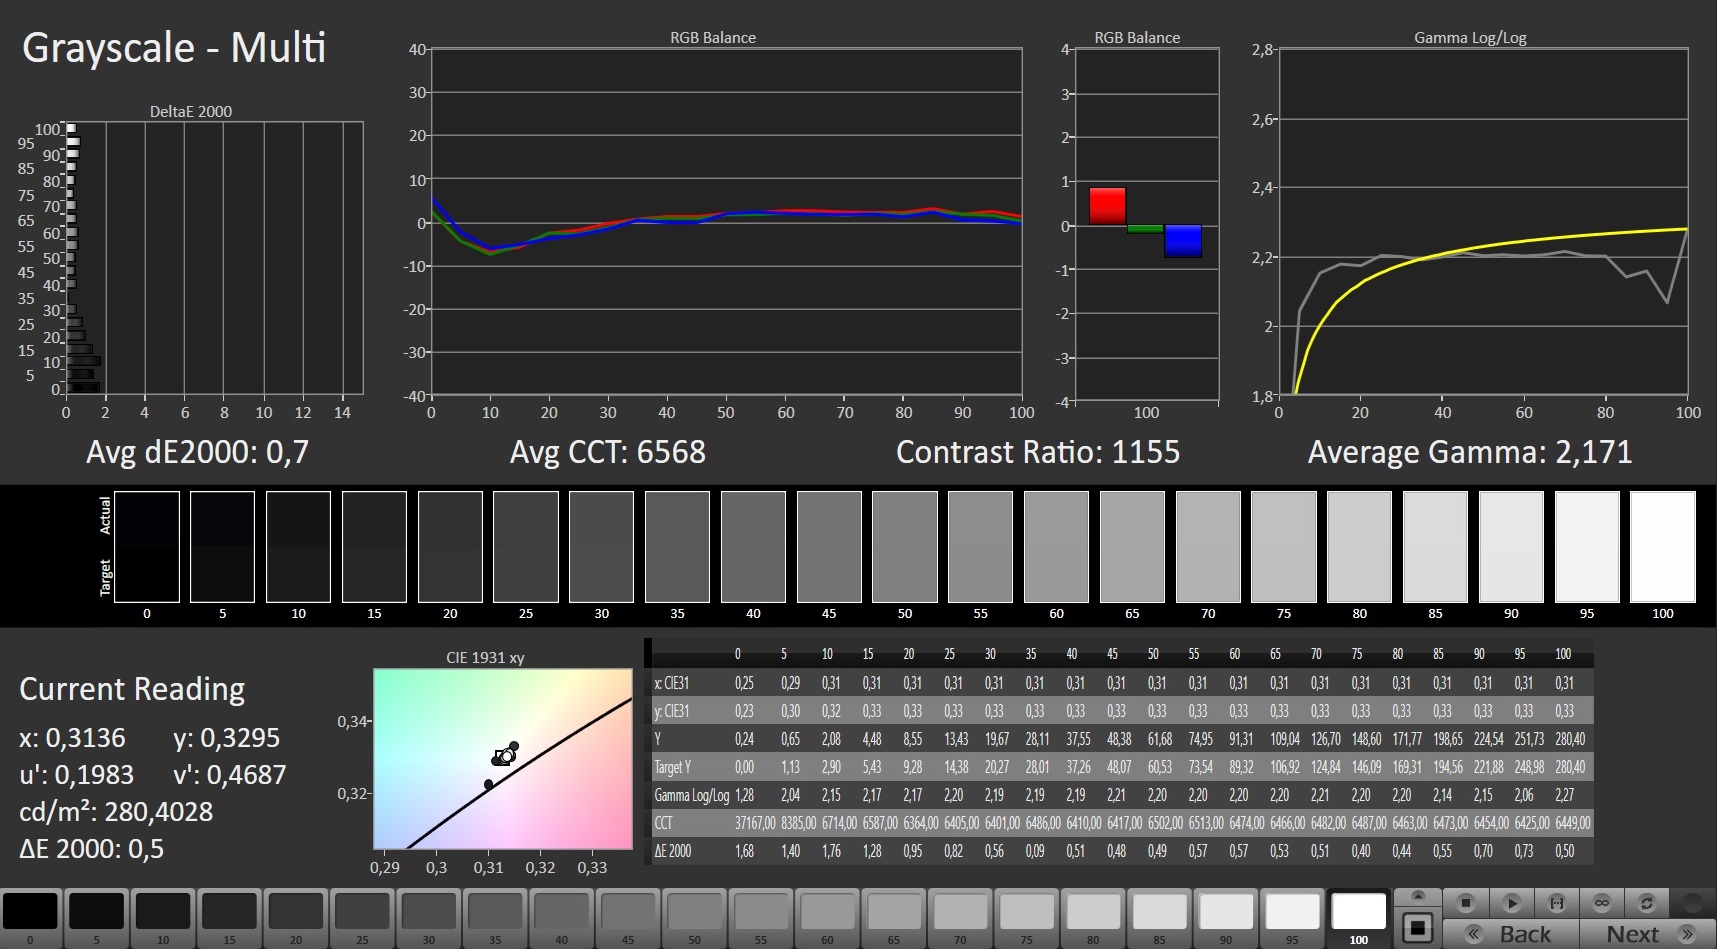

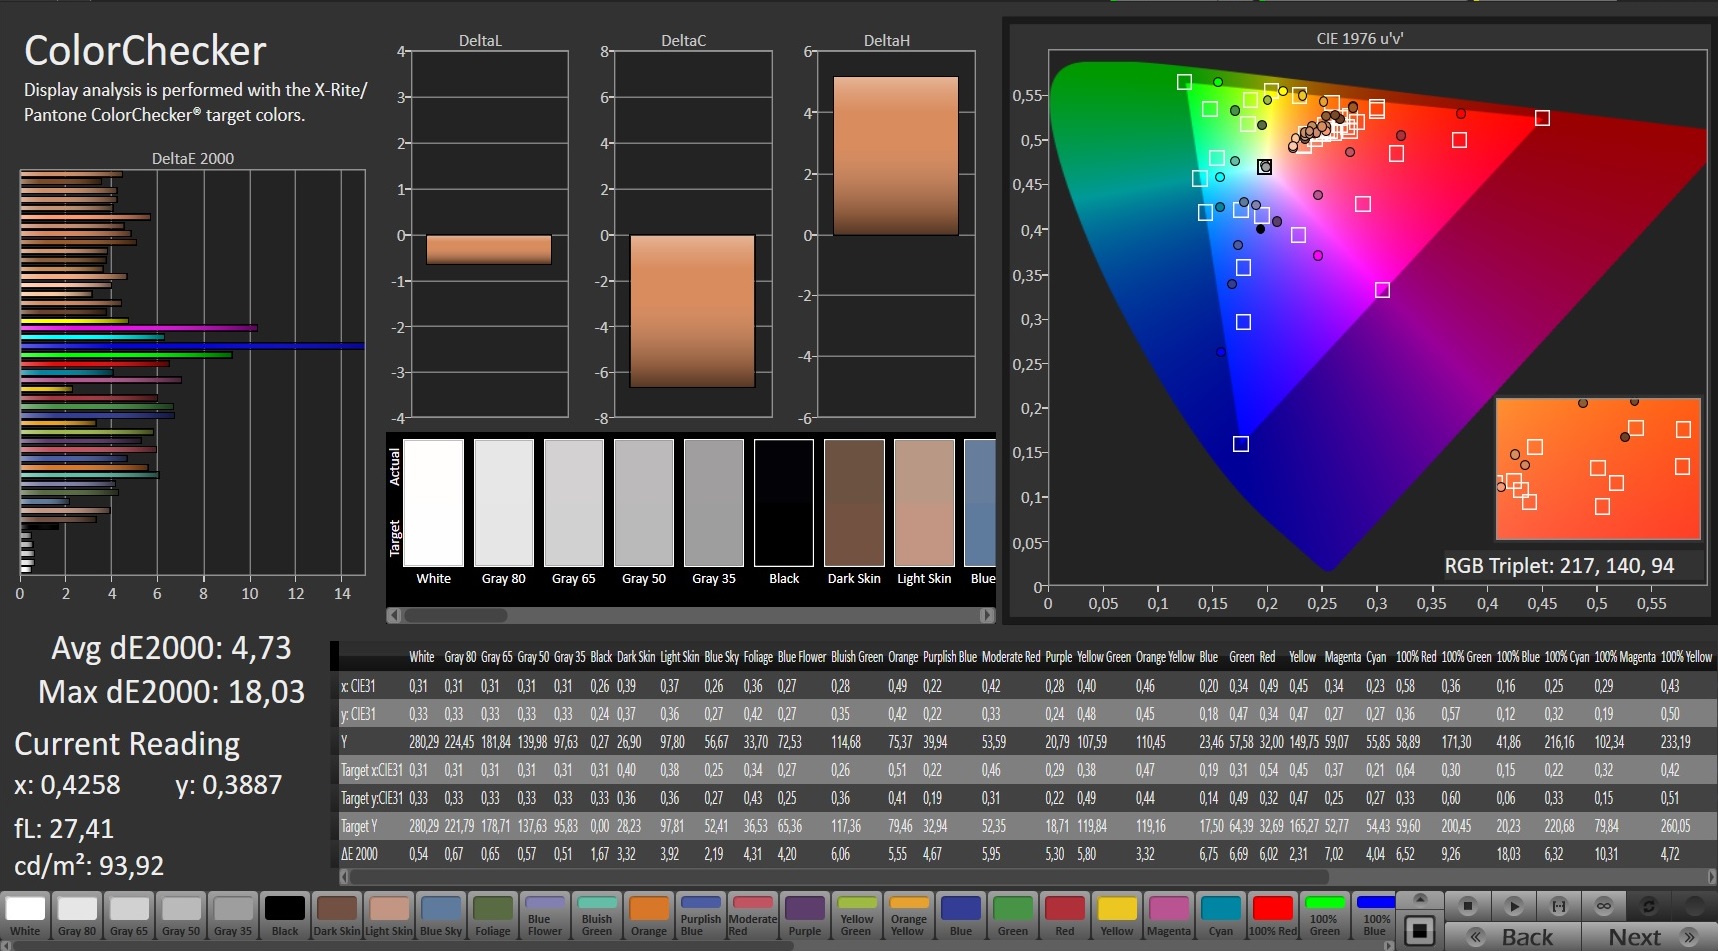
Als größte Schwäche entpuppt sich allerdings der Farbraum. 55 % sRGB-Abdeckung und rund 38 % Adobe-RGB-Abdeckung sind sehr enttäuschend und sorgen für ein recht blasses Bild. Bei den Vergleichsgeräten schneidet nur das MSI GF75 ähnlich schlecht ab. Gleiches gilt für die Farbgenauigkeit, wobei hier auch das Lenovo Legion 5 etwas zu wünschen übrig lässt.

Die restlichen Werte fallen eher unspektakulär aus. So ist beispielsweise die Reaktionszeit mit knapp 19 ms black-to-white und 25 ms grey-to-grey weder mies noch besonders gut. Ein Flackern konnten wir bei reduzierter Helligkeit nicht feststellen. Die Blickwinkel bewegen sich auf dem üblichen IPS-Niveau.
Reaktionszeiten (Response Times) des Displays
| ↔ Reaktionszeiten Schwarz zu Weiß | ||
|---|---|---|
| 18.8 ms ... steigend ↗ und fallend ↘ kombiniert | ↗ 10.8 ms steigend | 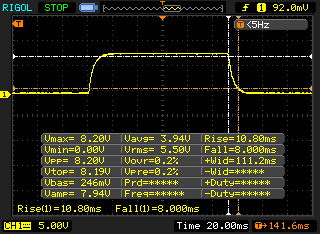 |
| ↘ 8 ms fallend | ||
| Die gemessenen Reaktionszeiten sind gut, für anspruchsvolle Spieler könnten der Bildschirm jedoch zu langsam sein. Im Vergleich rangierten die bei uns getesteten Geräte von 0.1 (Minimum) zu 240 (Maximum) ms. » 42 % aller Screens waren schneller als der getestete. Daher sind die gemessenen Reaktionszeiten durchschnittlich (19.9 ms). | ||
| ↔ Reaktionszeiten 50% Grau zu 80% Grau | ||
| 24.8 ms ... steigend ↗ und fallend ↘ kombiniert | ↗ 12.4 ms steigend | 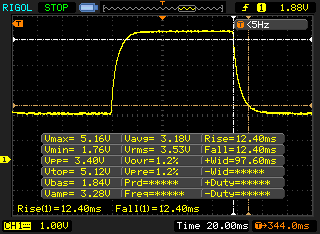 |
| ↘ 12.4 ms fallend | ||
| Die gemessenen Reaktionszeiten sind gut, für anspruchsvolle Spieler könnten der Bildschirm jedoch zu langsam sein. Im Vergleich rangierten die bei uns getesteten Geräte von 0.165 (Minimum) zu 636 (Maximum) ms. » 35 % aller Screens waren schneller als der getestete. Daher sind die gemessenen Reaktionszeiten besser als der Durchschnitt aller vermessenen Geräte (31.1 ms). | ||
Bildschirm-Flackern / PWM (Pulse-Width Modulation)
| Flackern / PWM nicht festgestellt | 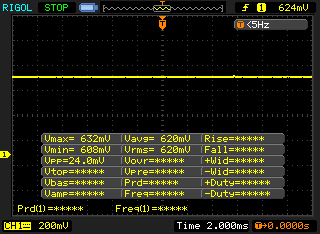 | ||
Im Vergleich: 52 % aller getesteten Geräte nutzten kein PWM um die Helligkeit zu reduzieren. Wenn PWM eingesetzt wurde, dann bei einer Frequenz von durchschnittlich 7798 (Minimum 5, Maximum 343500) Hz. | |||
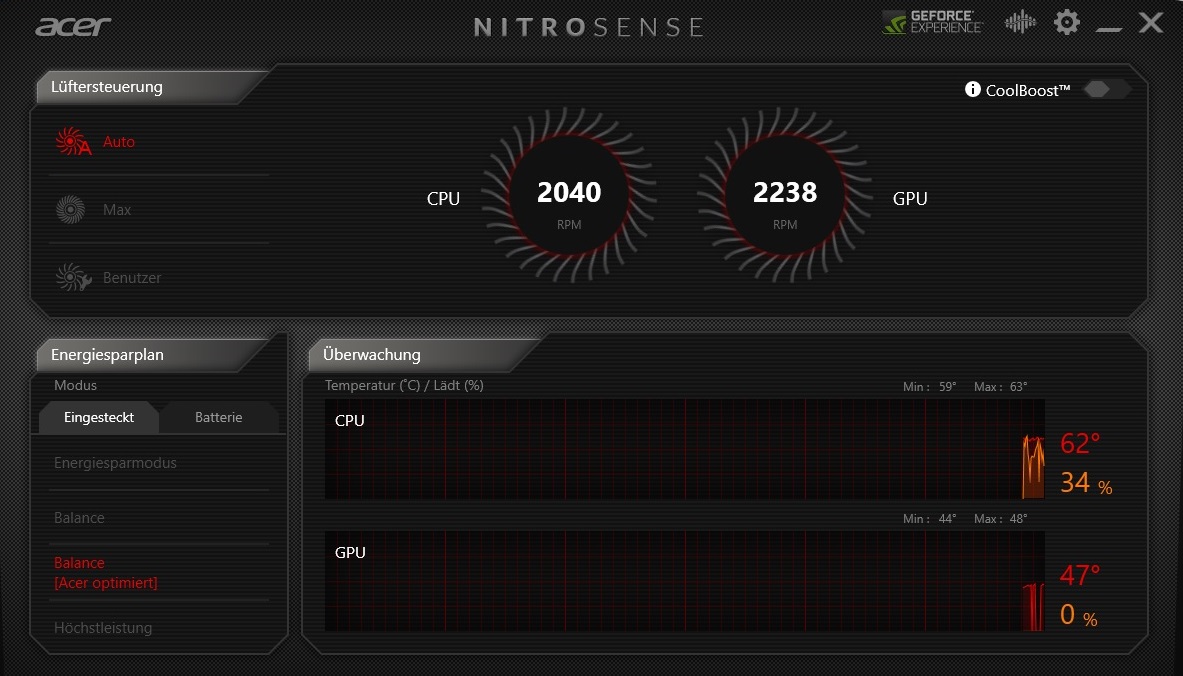
Testbedingungen - Nitro Sense bietet kaum Optionen
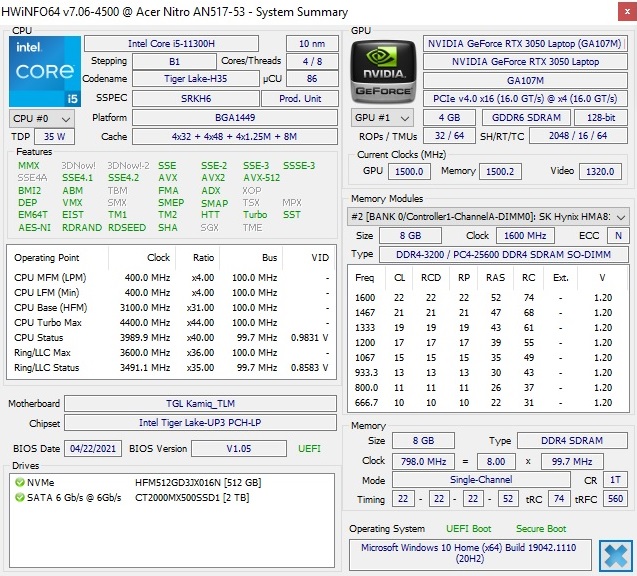
Im Gegensatz zu anderen Gaming-Notebooks aus dem Hause Acer verfügt das vorinstallierte Tool Nitro Sense über recht wenige Funktionen bzw. Optionen. Neben der Lüftersteuerung kann man lediglich den Energiesparplan ändern. Unsere Messungen wurden im Auslieferungszustand durchgeführt (siehe Screenshot).
Leistung - Moderne Mittelklasse-Komponenten
Eine Quad-Core-CPU deutet ebenso auf Mittelklasse-Hardware hin wie 8 GB RAM und eine GPU mit 4 GB VRAM. Wer etwas mehr Geld investiert, bekommt das Nitro 5 auch mit Ausstattungen, die im High-End-Bereich anzusiedeln sind (8-Kern-CPU, 16 GB RAM, 6-8 GB GPU).

Prozessor
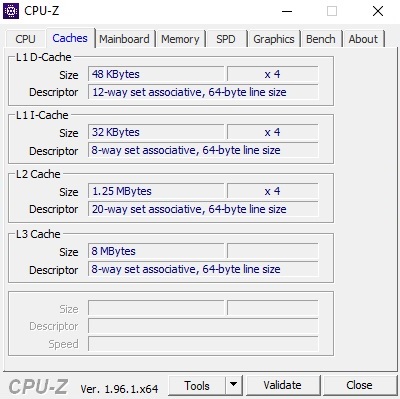
Wie vorher erwähnt, handelt es sich beim Core i5-11300H um ein Vierkern-Modell aus der Tiger-Lake-Serie, welche endlich nicht mehr im veralteten 14-nm-Prozess hergestellt wird, den Intel jahrelang verwendet hat. Die 10-nm-CPU bietet 8 MB L3-Cache und kann per Hyper-Threading bis zu 8 Threads parallel bearbeiten. Im Vergleich zu den klassischen 6- und 8-Kern-Chips beläuft sich die TDP nur auf 35 statt 45 Watt. Laut dem Tool HWiNFO ist der Prozessor im Nitro 5 auf 40 Watt PL1 und 64 Watt PL2 eingestellt. Der Takt beträgt – je nach Anwendung und Beanspruchung – unter Last zwischen 3,1 und 4,4 GHz.
Wie sich die CPU über einen längeren Zeitraum verhält, haben wir mithilfe des Cinebench R15 überprüft. Im Loop blieb die Leistung des Core i5-11300H ziemlich konstant und ordnete sich erwartungsgemäß oberhalb des alten Core i5-10300H ein.
Cinebench R15 Multi Dauertest
* ... kleinere Werte sind besser
System Performance
Trotz der bescheidenen Speicherkonfiguration reicht es bei den Systembenchmarks für den ersten Platz im Testfeld. Der PCMark 10 sieht das Nitro 5 zwischen 8 und 40 % vor der Konkurrenz, wobei sich der Windows-Alltag auf allen Geräten sehr ähnlich anfühlen dürfte, was Bootdauer und Ladezeiten etc. betrifft.
| PCMark 10 / Score | |
| Durchschnitt der Klasse Gaming (5828 - 11574, n=96, der letzten 2 Jahre) | |
| Acer Nitro 5 AN517-53-54DQ | |
| Durchschnittliche Intel Core i5-11300H, NVIDIA GeForce RTX 3050 4GB Laptop GPU (n=1) | |
| MSI GF75 Thin 10SCXR | |
| HP Omen 15-ek0456ng | |
| Asus TUF FX705DT-AU068T | |
| Lenovo Legion 5 17IMH05 | |
| PCMark 10 Score | 5705 Punkte | |
Hilfe | ||
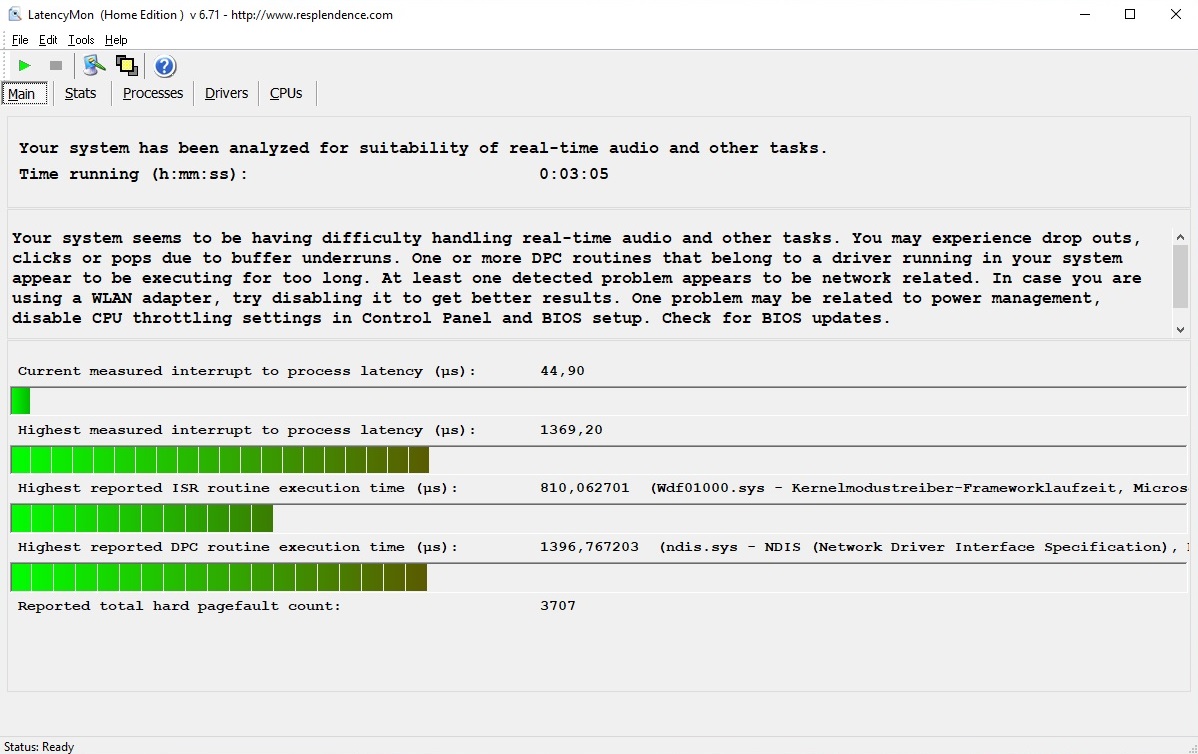
DPC-Latenzen
Obwohl der 17-Zöller im Vergleich zur Konkurrenz mit den niedrigsten Latenzwerten glänzt, deutet das Tool LatencyMon auf mögliche Probleme bei der Echtzeit-Bearbeitung von Audio- und Videoinhalten hin.

| DPC Latencies / LatencyMon - interrupt to process latency (max), Web, Youtube, Prime95 | |
| HP Omen 15-ek0456ng | |
| MSI GF75 Thin 10SCXR | |
| Lenovo Legion 5 17IMH05 | |
| Acer Nitro 5 AN517-53-54DQ | |
* ... kleinere Werte sind besser
Massenspeicher
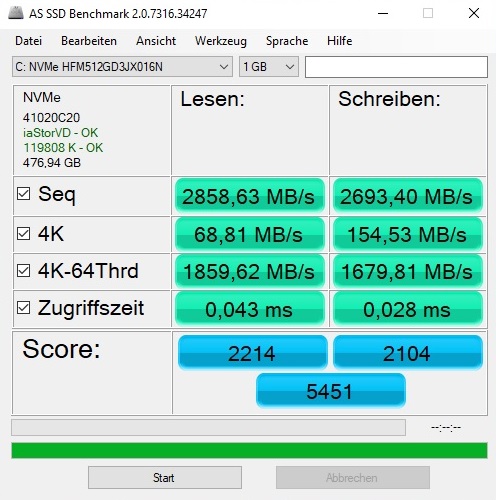
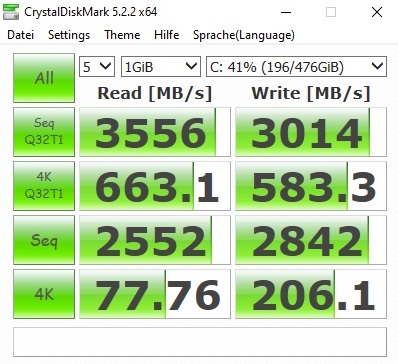
Lob gibt es für den flotten Massenspeicher. Waren im Budget-Bereich früher SATA-III-SSDs mit maximal 500 – 600 MB/s gang und gäbe, gehören langsam aber sicher schnelle PCIe-/NVMe-SSDs zum Standardrepertoire. Das Nitro 5 bietet mit der 512-GB-Version der SK Hynix BC711 einen besonders leistungsfähigen Vertreter dieser Zunft, welcher die NVMe-Modelle der Konkurrenten teils deutlich hinter sich lässt.
Schön: Wer den Speicherplatz erweitern möchte, findet im Inneren des Gehäuse noch einen freien M.2-Slot und einen 2,5-Zoll-Schacht (passendes Kabel liegt bei).
| Acer Nitro 5 AN517-53-54DQ SK Hynix BC711 HFM512GD3HX015N | HP Omen 15-ek0456ng Toshiba XG6 KXG60ZNV512G | Lenovo Legion 5 17IMH05 SK hynix BC511 HFM512GDHTNI-87A0B | MSI GF75 Thin 10SCXR WDC PC SN530 SDBPNPZ-512G | Asus TUF FX705DT-AU068T WDC PC SN520 SDAPNUW-256G | |
|---|---|---|---|---|---|
| CrystalDiskMark 5.2 / 6 | -31% | -41% | -38% | -48% | |
| Write 4K (MB/s) | 206.1 | 120 -42% | 134.7 -35% | 140.7 -32% | 145 -30% |
| Read 4K (MB/s) | 77.8 | 36.09 -54% | 44.84 -42% | 43.18 -44% | 45.28 -42% |
| Write Seq (MB/s) | 2842 | 1778 -37% | 1053 -63% | 1829 -36% | 1301 -54% |
| Read Seq (MB/s) | 2552 | 1362 -47% | 1241 -51% | 1095 -57% | 1362 -47% |
| Write 4K Q32T1 (MB/s) | 583 | 429.1 -26% | 499.8 -14% | 431.7 -26% | 249.1 -57% |
| Read 4K Q32T1 (MB/s) | 663 | 493.2 -26% | 518 -22% | 527 -21% | 342.1 -48% |
| Write Seq Q32T1 (MB/s) | 3014 | 2936 -3% | 1022 -66% | 1831 -39% | 1301 -57% |
| Read Seq Q32T1 (MB/s) | 3556 | 3227 -9% | 2263 -36% | 1708 -52% | 1732 -51% |
| AS SSD | -30% | -46% | -94% | -64% | |
| Seq Read (MB/s) | 2859 | 2053 -28% | 1635 -43% | 1007 -65% | 1546 -46% |
| Seq Write (MB/s) | 2693 | 2562 -5% | 913 -66% | 1755 -35% | 1182 -56% |
| 4K Read (MB/s) | 68.8 | 42.46 -38% | 46.18 -33% | 39.88 -42% | 36.54 -47% |
| 4K Write (MB/s) | 154.5 | 97.2 -37% | 101.7 -34% | 111.6 -28% | 109.2 -29% |
| 4K-64 Read (MB/s) | 1860 | 1414 -24% | 773 -58% | 751 -60% | 612 -67% |
| 4K-64 Write (MB/s) | 1680 | 1471 -12% | 745 -56% | 402.6 -76% | 436.6 -74% |
| Access Time Read * (ms) | 0.043 | 0.079 -84% | 0.05 -16% | 0.084 -95% | 0.113 -163% |
| Access Time Write * (ms) | 0.028 | 0.039 -39% | 0.037 -32% | 0.151 -439% | 0.034 -21% |
| Score Read (Points) | 2214 | 1662 -25% | 983 -56% | 892 -60% | 803 -64% |
| Score Write (Points) | 2104 | 1825 -13% | 938 -55% | 690 -67% | 664 -68% |
| Score Total (Points) | 5451 | 4364 -20% | 2399 -56% | 2085 -62% | 1869 -66% |
| Durchschnitt gesamt (Programm / Settings) | -31% /
-30% | -44% /
-44% | -66% /
-70% | -56% /
-57% |
* ... kleinere Werte sind besser

Dauerleistung Lesen: DiskSpd Read Loop, Queue Depth 8
Grafikkarte
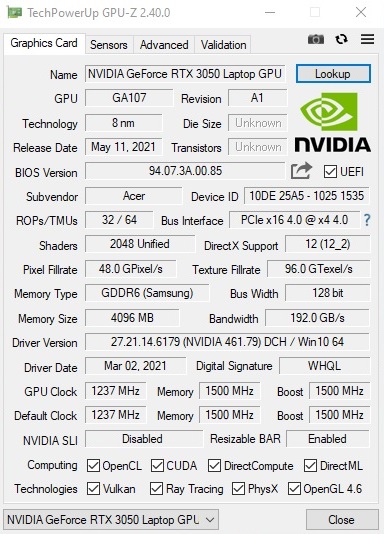
Am interessantesten dürfte für viele Nutzer die verwendete GPU sein. Während wir die mobile GeForce RTX 3050 Ti in der Vergangenheit schon das ein oder andere mal begutachten konnten, gab es zur RTX 3050 bisher kaum Benchmark-Ergebnisse. Das DirectX-12-Modell muss sich im Vergleich zur RTX 3050 Ti mit 2.048 statt 2.560 Shadern begnügen.
Die Leistungsfähigkeit hängt aber primär vom Kühlsystem (Stichwort Taktspielraum) und von der eingestellten TGP ab. Letztere variiert bei der RTX 3050 zwischen 35 und 80 Watt (ohne Dynamic Boost). Im Falle des Nitro 5 sind es inklusive Dynamic Boost 75 Watt, also ein recht guter Wert, der sich im oberen Drittel abspielt.
Als Schwachpunkt sehen wir vor allem den knapp bemessenen Videospeicher. Sowohl die RTX 3050 als auch die RTX 3050 Ti enthält lediglich 4 GB GDDR6-VRAM (128-Bit-Interface), was 2021 und speziell im Hinblick auf den VRAM-Bedarf vieler aktueller Games nicht mehr zeitgemäß ist und negative Auswirkungen auf die Zukunftssicherheit des Laptops hat. Auch im Midrange-Segment wären inzwischen mindestens 6 GB angebracht.
Gegen die alte GTX 1650, welche noch ohne Raytracing-Support auskommen musste, hat die Ampere-GPU jedoch leichtes Spiel. In den 3DMark-Tests beträgt der Vorsprung meist 30 bis 40 %. Das Level der GTX 1660 Ti wird hingegen nicht ganz erreicht – das war im Vorfeld zu erwarten.
| 3DMark 06 Standard Score | 36425 Punkte | |
| 3DMark Vantage P Result | 43216 Punkte | |
| 3DMark 11 Performance | 14587 Punkte | |
| 3DMark Ice Storm Standard Score | 61606 Punkte | |
| 3DMark Cloud Gate Standard Score | 24215 Punkte | |
| 3DMark Fire Strike Score | 11041 Punkte | |
| 3DMark Time Spy Score | 4877 Punkte | |
Hilfe | ||
Gaming Performance
Analog zu den synthetischen Benchmarks ordnet sich die mobile GeForce RTX 3050 auch im Gaming-Parcours zwischen der GTX 1650 (Ti) und der GeForce GTX 1660 Ti ein, wobei die Framerate je nach Spiel und VRAM-Verbrauch mal mehr in die eine und mal mehr in die andere Richtung tendiert.
Insgesamt ist die GeForce RTX 3050 Laptop GPU flott genug, um die meisten Titel in der nativen Auflösung von 1.920 x 1.080 mit hohen bis maximalen Details zu befeuern. Eng wird es nur bei aktiviertem Raytracing bzw. sehr rechenintensiven und/oder mäßig optimierten Games wie Assassin's Creed Valhalla und Cyberpunk 2077, wo bereits mittlere Settings zur Herausforderung werden. Für QHD- und 4K-Diplays ist die RTX 3050 genrell kaum gedacht bzw. geeignet. Hierfür empfehlen wir ein High-End-Gerät mit GeForce RTX 3060 aufwärts.
| Performance Rating - Percent | |
| Durchschnitt der Klasse Gaming -378! | |
| MSI GP65 Leopard 9SD -84! | |
| Acer Nitro 5 AN517-53-54DQ -247! | |
| MSI GP75 -257! | |
| MSI GL75 -267! | |
| Vampire Bloodhunt | |
| 3840x2160 Ultra Preset | |
| MSI GP65 Leopard 9SD | |
| 2560x1440 Ultra Preset | |
| MSI GP65 Leopard 9SD | |
| 1920x1080 Ultra Preset | |
| MSI GP65 Leopard 9SD | |
| MSI GP75 | |
| 1920x1080 High Preset | |
| MSI GP65 Leopard 9SD | |
| MSI GP75 | |
| 1920x1080 Medium Preset | |
| MSI GP65 Leopard 9SD | |
| MSI GP75 | |
| 1920x1080 Low Preset | |
| MSI GP75 | |
| 1280x720 Low Preset | |
| MSI GP75 | |
| Tiny Tina's Wonderlands | |
| 2560x1440 Badass Preset (DX12) | |
| Durchschnitt der Klasse Gaming (58.9 - 111.2, n=3, der letzten 2 Jahre) | |
| MSI GP65 Leopard 9SD | |
| 1920x1080 Badass Preset (DX12) | |
| Durchschnitt der Klasse Gaming (55 - 159.4, n=5, der letzten 2 Jahre) | |
| MSI GP65 Leopard 9SD | |
| MSI GP75 | |
| 1920x1080 High Preset (DX12) | |
| Durchschnitt der Klasse Gaming (72.1 - 203, n=5, der letzten 2 Jahre) | |
| MSI GP65 Leopard 9SD | |
| MSI GP75 | |
| 1920x1080 Medium Preset (DX12) | |
| Durchschnitt der Klasse Gaming (95.6 - 293, n=5, der letzten 2 Jahre) | |
| MSI GP65 Leopard 9SD | |
| MSI GP75 | |
| 1920x1080 Low Preset (DX12) | |
| Durchschnitt der Klasse Gaming (113 - 353, n=5, der letzten 2 Jahre) | |
| MSI GP65 Leopard 9SD | |
| MSI GP75 | |
| 1280x720 Lowest Preset (DX12) | |
| Durchschnitt der Klasse Gaming (154 - 286, n=3, der letzten 2 Jahre) | |
| MSI GP75 | |
| Ghostwire Tokyo | |
| 3840x2160 Highest Settings | |
| MSI GP65 Leopard 9SD | |
| 2560x1440 Highest Settings | |
| MSI GP65 Leopard 9SD | |
| MSI GP75 | |
| 1920x1080 Highest Settings | |
| MSI GP65 Leopard 9SD | |
| MSI GP75 | |
| 1920x1080 High Settings | |
| MSI GP65 Leopard 9SD | |
| MSI GP75 | |
| 1920x1080 Medium Settings | |
| MSI GP65 Leopard 9SD | |
| MSI GP75 | |
| 1920x1080 Low Settings | |
| MSI GP65 Leopard 9SD | |
| MSI GP75 | |
| 1280x720 Lowest Settings | |
| MSI GP75 | |
| Elden Ring | |
| 3840x2160 Maximum Preset | |
| MSI GP65 Leopard 9SD | |
| MSI GP75 | |
| MSI GL75 | |
| 2560x1440 Maximum Preset | |
| MSI GP65 Leopard 9SD | |
| MSI GP75 | |
| MSI GL75 | |
| 1920x1080 Maximum Preset | |
| MSI GP65 Leopard 9SD | |
| MSI GP75 | |
| MSI GL75 | |
| 1920x1080 High Preset | |
| MSI GP65 Leopard 9SD | |
| MSI GP75 | |
| MSI GL75 | |
| 1920x1080 Medium Preset | |
| MSI GP75 | |
| MSI GP65 Leopard 9SD | |
| MSI GL75 | |
| 1920x1080 Low Preset | |
| MSI GP75 | |
| MSI GL75 | |
| Elex 2 | |
| 3840x2160 Ultra / On AA:SM AF:16x | |
| MSI GP65 Leopard 9SD | |
| 2560x1440 Ultra / On AA:SM AF:16x | |
| MSI GP65 Leopard 9SD | |
| 1920x1080 Ultra / On AA:SM AF:16x | |
| MSI GP65 Leopard 9SD | |
| MSI GP75 | |
| MSI GL75 | |
| 1920x1080 High / On AA:FX AF:16x | |
| MSI GP65 Leopard 9SD | |
| MSI GP75 | |
| MSI GL75 | |
| 1920x1080 Medium / On AA:FX AF:16x | |
| MSI GP65 Leopard 9SD | |
| MSI GP75 | |
| MSI GL75 | |
| 1920x1080 Low / Off | |
| MSI GP75 | |
| MSI GL75 | |
| 1280x720 Low / Off | |
| MSI GP75 | |
| MSI GL75 | |
| Cyberpunk 2077 1.6 | |
| 3840x2160 Ultra Preset | |
| MSI GP65 Leopard 9SD | |
| MSI GP75 | |
| MSI GL75 | |
| 2560x1440 Ultra Preset | |
| MSI GP65 Leopard 9SD | |
| MSI GP75 | |
| MSI GL75 | |
| 1920x1080 Ultra Preset | |
| MSI GP65 Leopard 9SD | |
| MSI GP75 | |
| MSI GL75 | |
| 1920x1080 High Preset | |
| MSI GP65 Leopard 9SD | |
| MSI GP75 | |
| MSI GL75 | |
| 1920x1080 Medium Preset | |
| MSI GP65 Leopard 9SD | |
| MSI GP75 | |
| MSI GL75 | |
| 1920x1080 Low Preset | |
| MSI GP65 Leopard 9SD | |
| MSI GP75 | |
| MSI GL75 | |
| 1280x720 Low Preset | |
| MSI GP65 Leopard 9SD | |
| MSI GP75 | |
| MSI GL75 | |
| GRID Legends | |
| 3840x2160 Ultra Preset | |
| MSI GP65 Leopard 9SD | |
| 2560x1440 Ultra Preset | |
| MSI GP65 Leopard 9SD | |
| 1920x1080 Ultra Preset | |
| MSI GP65 Leopard 9SD | |
| MSI GP75 | |
| MSI GL75 | |
| 1920x1080 High Preset | |
| MSI GP65 Leopard 9SD | |
| MSI GP75 | |
| MSI GL75 | |
| 1920x1080 Medium Preset | |
| MSI GP65 Leopard 9SD | |
| MSI GP75 | |
| MSI GL75 | |
| 1920x1080 Low Preset | |
| MSI GP75 | |
| MSI GL75 | |
| 1280x720 Low Preset | |
| MSI GP75 | |
| MSI GL75 | |
| Dying Light 2 | |
| 3840x2160 High Quality | |
| MSI GP65 Leopard 9SD | |
| 2560x1440 High Quality | |
| MSI GP65 Leopard 9SD | |
| 1920x1080 High Quality | |
| MSI GP65 Leopard 9SD | |
| MSI GP75 | |
| MSI GL75 | |
| 1920x1080 Medium Quality | |
| MSI GP65 Leopard 9SD | |
| MSI GP75 | |
| MSI GL75 | |
| 1920x1080 Low Quality | |
| MSI GP65 Leopard 9SD | |
| MSI GP75 | |
| MSI GL75 | |
| 1280x720 Low Quality | |
| MSI GP75 | |
| MSI GL75 | |
| Rainbow Six Extraction | |
| 3840x2160 Ultra Preset (with Fixed Resolution Quality) | |
| MSI GP65 Leopard 9SD | |
| 2560x1440 Ultra Preset (with Fixed Resolution Quality) | |
| MSI GP65 Leopard 9SD | |
| 1920x1080 Ultra Preset (with Fixed Resolution Quality) | |
| MSI GP65 Leopard 9SD | |
| MSI GP75 | |
| MSI GL75 | |
| 1920x1080 High Preset (with Fixed Resolution Quality) | |
| MSI GP65 Leopard 9SD | |
| MSI GP75 | |
| MSI GL75 | |
| 1920x1080 Medium Preset (with Fixed Resolution Quality) | |
| MSI GP65 Leopard 9SD | |
| MSI GP75 | |
| MSI GL75 | |
| 1920x1080 Very Low Preset (with Fixed Resolution Quality) | |
| MSI GP75 | |
| MSI GL75 | |
| 1280x720 Ultra Low Preset (with Fixed Resolution Quality) | |
| MSI GP75 | |
| MSI GL75 | |
| God of War | |
| 3840x2160 Ultra Preset | |
| MSI GP65 Leopard 9SD | |
| 2560x1440 Ultra Preset | |
| Durchschnitt der Klasse Gaming (n=1der letzten 2 Jahre) | |
| MSI GP65 Leopard 9SD | |
| 1920x1080 Ultra Preset | |
| Durchschnitt der Klasse Gaming (n=1der letzten 2 Jahre) | |
| MSI GP65 Leopard 9SD | |
| MSI GP75 | |
| MSI GL75 | |
| 1920x1080 High Preset | |
| Durchschnitt der Klasse Gaming (n=1der letzten 2 Jahre) | |
| MSI GP65 Leopard 9SD | |
| MSI GP75 | |
| MSI GL75 | |
| 1920x1080 Original Preset | |
| Durchschnitt der Klasse Gaming (n=1der letzten 2 Jahre) | |
| MSI GP65 Leopard 9SD | |
| MSI GP75 | |
| MSI GL75 | |
| 1920x1080 Low Preset | |
| Durchschnitt der Klasse Gaming (n=1der letzten 2 Jahre) | |
| MSI GP75 | |
| MSI GL75 | |
| 1280x720 Low Preset | |
| Durchschnitt der Klasse Gaming (n=1der letzten 2 Jahre) | |
| MSI GP75 | |
| MSI GL75 | |
| Halo Infinite | |
| 3840x2160 Ultra Preset | |
| MSI GP65 Leopard 9SD | |
| 2560x1440 Ultra Preset | |
| MSI GP65 Leopard 9SD | |
| 1920x1080 Ultra Preset | |
| MSI GP65 Leopard 9SD | |
| MSI GP75 | |
| MSI GL75 | |
| 1920x1080 High Preset | |
| MSI GP65 Leopard 9SD | |
| MSI GP75 | |
| MSI GL75 | |
| 1920x1080 Medium Preset | |
| MSI GP65 Leopard 9SD | |
| MSI GP75 | |
| MSI GL75 | |
| 1920x1080 Low Preset | |
| MSI GP75 | |
| MSI GL75 | |
| 1280x720 Low Preset | |
| MSI GP75 | |
| MSI GL75 | |
| Farming Simulator 22 | |
| 3840x2160 Very High Preset | |
| MSI GP65 Leopard 9SD | |
| MSI GP75 | |
| MSI GL75 | |
| 2560x1440 Very High Preset | |
| MSI GP65 Leopard 9SD | |
| MSI GP75 | |
| MSI GL75 | |
| 1920x1080 Very High Preset | |
| MSI GP65 Leopard 9SD | |
| MSI GP75 | |
| MSI GL75 | |
| 1920x1080 High Preset | |
| MSI GP65 Leopard 9SD | |
| MSI GP75 | |
| MSI GL75 | |
| 1920x1080 Medium Preset | |
| MSI GP65 Leopard 9SD | |
| MSI GP75 | |
| MSI GL75 | |
| 1280x720 Low Preset | |
| MSI GP75 | |
| MSI GL75 | |
| Battlefield 2042 | |
| 3840x2160 Ultra Preset | |
| MSI GP65 Leopard 9SD | |
| 2560x1440 Ultra Preset | |
| MSI GP65 Leopard 9SD | |
| MSI GL75 | |
| 1920x1080 Ultra Preset | |
| MSI GP65 Leopard 9SD | |
| MSI GL75 | |
| 1920x1080 High Preset | |
| MSI GP65 Leopard 9SD | |
| MSI GL75 | |
| 1920x1080 Medium Preset | |
| MSI GP65 Leopard 9SD | |
| MSI GL75 | |
| 1920x1080 Low Preset | |
| MSI GP65 Leopard 9SD | |
| MSI GL75 | |
| 1280x720 Low Preset | |
| MSI GL75 | |
| Forza Horizon 5 | |
| 3840x2160 Extreme Preset | |
| MSI GP65 Leopard 9SD | |
| MSI GP75 | |
| MSI GL75 | |
| 2560x1440 Extreme Preset | |
| MSI GP65 Leopard 9SD | |
| MSI GP75 | |
| MSI GL75 | |
| 1920x1080 Extreme Preset | |
| MSI GP65 Leopard 9SD | |
| MSI GP75 | |
| MSI GL75 | |
| 1920x1080 High Preset | |
| MSI GP65 Leopard 9SD | |
| MSI GP75 | |
| MSI GL75 | |
| 1920x1080 Medium Preset | |
| MSI GP65 Leopard 9SD | |
| MSI GP75 | |
| MSI GL75 | |
| 1920x1080 Low Preset | |
| MSI GP65 Leopard 9SD | |
| MSI GP75 | |
| MSI GL75 | |
| Call of Duty Vanguard | |
| 3840x2160 Ultra Preset | |
| MSI GP65 Leopard 9SD | |
| MSI GP75 | |
| MSI GL75 | |
| 2560x1440 Ultra Preset | |
| MSI GP65 Leopard 9SD | |
| MSI GP75 | |
| MSI GL75 | |
| 1920x1080 Ultra Preset | |
| MSI GP65 Leopard 9SD | |
| MSI GP75 | |
| MSI GL75 | |
| 1920x1080 High Preset | |
| MSI GP65 Leopard 9SD | |
| MSI GP75 | |
| MSI GL75 | |
| 1920x1080 Medium Preset | |
| MSI GP65 Leopard 9SD | |
| MSI GP75 | |
| MSI GL75 | |
| 1920x1080 Low Preset | |
| MSI GP65 Leopard 9SD | |
| MSI GP75 | |
| MSI GL75 | |
| Riders Republic | |
| 3840x2160 Ultra Preset | |
| MSI GP65 Leopard 9SD | |
| MSI GP75 | |
| MSI GL75 | |
| 2560x1440 Ultra Preset | |
| MSI GP65 Leopard 9SD | |
| MSI GP75 | |
| MSI GL75 | |
| 1920x1080 Ultra Preset | |
| MSI GP65 Leopard 9SD | |
| MSI GP75 | |
| MSI GL75 | |
| 1920x1080 High Preset | |
| MSI GP65 Leopard 9SD | |
| MSI GP75 | |
| MSI GL75 | |
| 1920x1080 Medium Preset | |
| MSI GP65 Leopard 9SD | |
| MSI GP75 | |
| MSI GL75 | |
| 1920x1080 Low Preset | |
| MSI GP65 Leopard 9SD | |
| MSI GP75 | |
| MSI GL75 | |
| Guardians of the Galaxy | |
| 3840x2160 Ultra Preset | |
| MSI GP65 Leopard 9SD | |
| MSI GP75 | |
| MSI GL75 | |
| 2560x1440 Ultra Preset | |
| MSI GP65 Leopard 9SD | |
| MSI GP75 | |
| MSI GL75 | |
| 1920x1080 Ultra Preset | |
| MSI GP65 Leopard 9SD | |
| MSI GP75 | |
| MSI GL75 | |
| 1920x1080 High Preset | |
| MSI GP65 Leopard 9SD | |
| MSI GP75 | |
| MSI GL75 | |
| 1920x1080 Medium Preset | |
| MSI GP65 Leopard 9SD | |
| MSI GP75 | |
| MSI GL75 | |
| 1920x1080 Low Preset | |
| MSI GP65 Leopard 9SD | |
| MSI GP75 | |
| MSI GL75 | |
| Alan Wake Remastered | |
| 3840x2160 High Preset | |
| MSI GP65 Leopard 9SD | |
| 2560x1440 High Preset | |
| MSI GP65 Leopard 9SD | |
| MSI GP75 | |
| MSI GL75 | |
| 1920x1080 High Preset | |
| MSI GP65 Leopard 9SD | |
| MSI GP75 | |
| MSI GL75 | |
| 1920x1080 Medium Preset | |
| MSI GP65 Leopard 9SD | |
| MSI GP75 | |
| MSI GL75 | |
| 1920x1080 Low Preset | |
| MSI GP75 | |
| MSI GP65 Leopard 9SD | |
| MSI GL75 | |
| Back 4 Blood | |
| 3840x2160 Epic Preset (DX12) AA:T | |
| MSI GP65 Leopard 9SD | |
| MSI GP75 | |
| MSI GL75 | |
| 2560x1440 Epic Preset (DX12) AA:T | |
| MSI GP65 Leopard 9SD | |
| MSI GP75 | |
| MSI GL75 | |
| 1920x1080 Epic Preset (DX12) AA:T | |
| MSI GP65 Leopard 9SD | |
| MSI GP75 | |
| MSI GL75 | |
| 1920x1080 High Preset (DX12) AA:T | |
| MSI GP65 Leopard 9SD | |
| MSI GP75 | |
| MSI GL75 | |
| 1920x1080 Medium Preset (DX12) AA:FX | |
| MSI GP65 Leopard 9SD | |
| MSI GP75 | |
| MSI GL75 | |
| 1920x1080 Low Preset (DX12) | |
| MSI GP65 Leopard 9SD | |
| MSI GP75 | |
| MSI GL75 | |
| Far Cry 6 | |
| 2560x1440 Ultra Graphics Quality + HD Textures AA:T | |
| Durchschnitt der Klasse Gaming (74.5 - 116.7, n=2, der letzten 2 Jahre) | |
| MSI GP65 Leopard 9SD | |
| MSI GP75 | |
| MSI GL75 | |
| 1920x1080 Ultra Graphics Quality + HD Textures AA:T | |
| Durchschnitt der Klasse Gaming (96.3 - 135.7, n=3, der letzten 2 Jahre) | |
| MSI GP65 Leopard 9SD | |
| MSI GP75 | |
| MSI GL75 | |
| 1920x1080 High Graphics Quality AA:T | |
| Durchschnitt der Klasse Gaming (120.8 - 136, n=2, der letzten 2 Jahre) | |
| MSI GP65 Leopard 9SD | |
| MSI GP75 | |
| MSI GL75 | |
| 1920x1080 Medium Graphics Quality AA:SM | |
| Durchschnitt der Klasse Gaming (132.1 - 150.2, n=2, der letzten 2 Jahre) | |
| MSI GP65 Leopard 9SD | |
| MSI GP75 | |
| MSI GL75 | |
| 1920x1080 Low Graphics Quality | |
| Durchschnitt der Klasse Gaming (143.7 - 164.6, n=3, der letzten 2 Jahre) | |
| MSI GP65 Leopard 9SD | |
| MSI GP75 | |
| MSI GL75 | |
| FIFA 22 | |
| 3840x2160 Ultra Rendering Quality AA:4x MS | |
| MSI GP65 Leopard 9SD | |
| MSI GP75 | |
| MSI GL75 | |
| 2560x1440 Ultra Rendering Quality AA:4x MS | |
| MSI GP65 Leopard 9SD | |
| MSI GP75 | |
| MSI GL75 | |
| 1920x1080 Ultra Rendering Quality AA:4x MS | |
| MSI GP65 Leopard 9SD | |
| MSI GP75 | |
| MSI GL75 | |
| 1920x1080 High Rendering Quality AA:2x MS | |
| MSI GP65 Leopard 9SD | |
| MSI GP75 | |
| MSI GL75 | |
| 1920x1080 Medium Rendering Quality | |
| MSI GP65 Leopard 9SD | |
| MSI GP75 | |
| MSI GL75 | |
| 1920x1080 Low Rendering Quality | |
| MSI GP65 Leopard 9SD | |
| MSI GP75 | |
| MSI GL75 | |
| New World | |
| 3840x2160 Very High Video Quality | |
| MSI GP65 Leopard 9SD | |
| MSI GP75 | |
| MSI GL75 | |
| 2560x1440 Very High Video Quality | |
| MSI GP65 Leopard 9SD | |
| MSI GP75 | |
| MSI GL75 | |
| 1920x1080 Very High Video Quality | |
| MSI GP65 Leopard 9SD | |
| MSI GP75 | |
| MSI GL75 | |
| 1920x1080 High Video Quality | |
| MSI GP65 Leopard 9SD | |
| MSI GP75 | |
| MSI GL75 | |
| 1920x1080 Medium Video Quality | |
| MSI GP65 Leopard 9SD | |
| MSI GP75 | |
| MSI GL75 | |
| 1920x1080 Low Video Quality | |
| MSI GP65 Leopard 9SD | |
| MSI GP75 | |
| MSI GL75 | |
| Deathloop | |
| 3840x2160 Ultra Preset | |
| MSI GP65 Leopard 9SD | |
| MSI GP75 | |
| MSI GL75 | |
| 2560x1440 Ultra Preset | |
| MSI GP65 Leopard 9SD | |
| MSI GP75 | |
| MSI GL75 | |
| 1920x1080 Ultra Preset | |
| MSI GP65 Leopard 9SD | |
| MSI GP75 | |
| MSI GL75 | |
| 1920x1080 High Preset | |
| MSI GP65 Leopard 9SD | |
| MSI GP75 | |
| MSI GL75 | |
| 1920x1080 Medium Preset | |
| MSI GP65 Leopard 9SD | |
| MSI GP75 | |
| MSI GL75 | |
| 1920x1080 Low Preset | |
| MSI GP65 Leopard 9SD | |
| MSI GP75 | |
| MSI GL75 | |
| Monster Hunter Stories 2 | |
| 3840x2160 High Preset | |
| MSI GP65 Leopard 9SD | |
| Acer Nitro 5 AN517-53-54DQ | |
| MSI GP75 | |
| MSI GL75 | |
| 2560x1440 High Preset | |
| MSI GP65 Leopard 9SD | |
| MSI GP75 | |
| MSI GL75 | |
| Acer Nitro 5 AN517-53-54DQ | |
| 1920x1080 High Preset | |
| MSI GP65 Leopard 9SD | |
| MSI GP75 | |
| MSI GL75 | |
| Acer Nitro 5 AN517-53-54DQ | |
| 1920x1080 Medium Preset | |
| MSI GP65 Leopard 9SD | |
| MSI GP75 | |
| MSI GL75 | |
| Acer Nitro 5 AN517-53-54DQ | |
| 1920x1080 Low Preset | |
| MSI GP75 | |
| MSI GP65 Leopard 9SD | |
| MSI GL75 | |
| F1 2021 | |
| 3840x2160 Ultra High Preset + Raytracing AA:T AF:16x | |
| Acer Nitro 5 AN517-53-54DQ | |
| 2560x1440 Ultra High Preset + Raytracing AA:T AF:16x | |
| Acer Nitro 5 AN517-53-54DQ | |
| 1920x1080 Ultra High Preset + Raytracing AA:T AF:16x | |
| Acer Nitro 5 AN517-53-54DQ | |
| 1920x1080 High Preset AA:T AF:16x | |
| MSI GP65 Leopard 9SD | |
| Acer Nitro 5 AN517-53-54DQ | |
| MSI GP75 | |
| MSI GL75 | |
| 1920x1080 Medium Preset AA:T AF:16x | |
| MSI GP65 Leopard 9SD | |
| Acer Nitro 5 AN517-53-54DQ | |
| MSI GP75 | |
| MSI GL75 | |
| 1920x1080 Ultra Low Preset | |
| MSI GP65 Leopard 9SD | |
| MSI GP75 | |
| MSI GL75 | |
| Days Gone | |
| 3840x2160 Very High Preset | |
| MSI GP65 Leopard 9SD | |
| Acer Nitro 5 AN517-53-54DQ | |
| MSI GP75 | |
| MSI GL75 | |
| 2560x1440 Very High Preset | |
| MSI GP65 Leopard 9SD | |
| Acer Nitro 5 AN517-53-54DQ | |
| MSI GP75 | |
| MSI GL75 | |
| 1920x1080 Very High Preset | |
| MSI GP65 Leopard 9SD | |
| Acer Nitro 5 AN517-53-54DQ | |
| MSI GP75 | |
| MSI GL75 | |
| 1920x1080 High Preset | |
| MSI GP65 Leopard 9SD | |
| Acer Nitro 5 AN517-53-54DQ | |
| MSI GP75 | |
| MSI GL75 | |
| 1920x1080 Medium Preset | |
| MSI GP65 Leopard 9SD | |
| Acer Nitro 5 AN517-53-54DQ | |
| MSI GP75 | |
| MSI GL75 | |
| 1920x1080 Low Preset | |
| MSI GP65 Leopard 9SD | |
| MSI GP75 | |
| MSI GL75 | |
| Mass Effect Legendary Edition | |
| 3840x2160 On | |
| MSI GP65 Leopard 9SD | |
| Acer Nitro 5 AN517-53-54DQ | |
| MSI GP75 | |
| MSI GL75 | |
| 2560x1440 On | |
| MSI GP65 Leopard 9SD | |
| Acer Nitro 5 AN517-53-54DQ | |
| MSI GP75 | |
| MSI GL75 | |
| 1920x1080 On | |
| MSI GP65 Leopard 9SD | |
| MSI GP75 | |
| Acer Nitro 5 AN517-53-54DQ | |
| MSI GL75 | |
| 1280x720 Off | |
| MSI GP75 | |
| MSI GP65 Leopard 9SD | |
| MSI GL75 | |
| Resident Evil Village | |
| 3840x2160 Max Preset | |
| MSI GP65 Leopard 9SD | |
| Acer Nitro 5 AN517-53-54DQ | |
| MSI GP75 | |
| MSI GL75 | |
| 2560x1440 Max Preset | |
| MSI GP65 Leopard 9SD | |
| Acer Nitro 5 AN517-53-54DQ | |
| MSI GP75 | |
| MSI GL75 | |
| 1920x1080 Max Preset | |
| MSI GP65 Leopard 9SD | |
| MSI GP75 | |
| Acer Nitro 5 AN517-53-54DQ | |
| MSI GL75 | |
| 1920x1080 Prioritize Graphics Preset | |
| MSI GP65 Leopard 9SD | |
| MSI GP75 | |
| Acer Nitro 5 AN517-53-54DQ | |
| MSI GL75 | |
| 1920x1080 Balanced Preset | |
| MSI GP65 Leopard 9SD | |
| MSI GP75 | |
| Acer Nitro 5 AN517-53-54DQ | |
| MSI GL75 | |
| 1920x1080 Prioritize Performance Preset | |
| MSI GP65 Leopard 9SD | |
| MSI GP75 | |
| MSI GL75 | |
| Outriders | |
| 3840x2160 Ultra Preset | |
| MSI GP65 Leopard 9SD | |
| MSI GP75 | |
| MSI GL75 | |
| Acer Nitro 5 AN517-53-54DQ | |
| 2560x1440 Ultra Preset | |
| MSI GP65 Leopard 9SD | |
| MSI GP75 | |
| MSI GL75 | |
| Acer Nitro 5 AN517-53-54DQ | |
| 1920x1080 Ultra Preset | |
| MSI GP65 Leopard 9SD | |
| MSI GP75 | |
| Acer Nitro 5 AN517-53-54DQ | |
| MSI GL75 | |
| 1920x1080 High Preset | |
| MSI GP65 Leopard 9SD | |
| MSI GP75 | |
| MSI GL75 | |
| Acer Nitro 5 AN517-53-54DQ | |
| 1920x1080 Medium Preset | |
| MSI GP65 Leopard 9SD | |
| MSI GP75 | |
| MSI GL75 | |
| Acer Nitro 5 AN517-53-54DQ | |
| 1920x1080 Low Preset | |
| MSI GP65 Leopard 9SD | |
| MSI GP75 | |
| MSI GL75 | |
| Hitman 3 | |
| 3840x2160 Maximum Settings AF:16x | |
| MSI GP65 Leopard 9SD | |
| Acer Nitro 5 AN517-53-54DQ | |
| MSI GP75 | |
| MSI GL75 | |
| 2560x1440 Maximum Settings AF:16x | |
| MSI GP65 Leopard 9SD | |
| Acer Nitro 5 AN517-53-54DQ | |
| MSI GP75 | |
| MSI GL75 | |
| 1920x1080 Maximum Settings AF:16x | |
| MSI GP65 Leopard 9SD | |
| MSI GP75 | |
| MSI GL75 | |
| Acer Nitro 5 AN517-53-54DQ | |
| 1920x1080 High Settings AF:16x | |
| MSI GP65 Leopard 9SD | |
| MSI GP75 | |
| MSI GL75 | |
| Acer Nitro 5 AN517-53-54DQ | |
| 1920x1080 Medium Settings AF:16x | |
| MSI GP65 Leopard 9SD | |
| Acer Nitro 5 AN517-53-54DQ | |
| MSI GP75 | |
| MSI GL75 | |
| 1920x1080 Minimum Settings | |
| MSI GP65 Leopard 9SD | |
| MSI GP75 | |
| MSI GL75 | |
| Cyberpunk 2077 1.0 | |
| 1920x1080 Ray Tracing Ultra Preset (DLSS off) | |
| MSI GP65 Leopard 9SD | |
| 3840x2160 Ultra Preset | |
| MSI GP65 Leopard 9SD | |
| MSI GP75 | |
| MSI GL75 | |
| Acer Nitro 5 AN517-53-54DQ | |
| 2560x1440 Ultra Preset | |
| MSI GP65 Leopard 9SD | |
| Acer Nitro 5 AN517-53-54DQ | |
| MSI GP75 | |
| MSI GL75 | |
| 1920x1080 Ultra Preset | |
| MSI GP65 Leopard 9SD | |
| Acer Nitro 5 AN517-53-54DQ | |
| MSI GP75 | |
| MSI GL75 | |
| 1920x1080 High Preset | |
| MSI GP65 Leopard 9SD | |
| Acer Nitro 5 AN517-53-54DQ | |
| MSI GP75 | |
| MSI GL75 | |
| 1920x1080 Medium Preset | |
| MSI GP65 Leopard 9SD | |
| Acer Nitro 5 AN517-53-54DQ | |
| MSI GP75 | |
| MSI GL75 | |
| 1920x1080 Low Preset | |
| MSI GP65 Leopard 9SD | |
| MSI GP75 | |
| MSI GL75 | |
| Immortals Fenyx Rising | |
| 3840x2160 Very High Preset | |
| MSI GP65 Leopard 9SD | |
| MSI GP75 | |
| Acer Nitro 5 AN517-53-54DQ | |
| MSI GL75 | |
| 2560x1440 Very High Preset | |
| MSI GP65 Leopard 9SD | |
| Acer Nitro 5 AN517-53-54DQ | |
| MSI GP75 | |
| MSI GL75 | |
| 1920x1080 Very High Preset | |
| MSI GP65 Leopard 9SD | |
| MSI GP75 | |
| Acer Nitro 5 AN517-53-54DQ | |
| MSI GL75 | |
| 1920x1080 High Preset | |
| MSI GP65 Leopard 9SD | |
| Acer Nitro 5 AN517-53-54DQ | |
| MSI GP75 | |
| MSI GL75 | |
| 1920x1080 Medium Preset | |
| MSI GP65 Leopard 9SD | |
| Acer Nitro 5 AN517-53-54DQ | |
| MSI GP75 | |
| MSI GL75 | |
| Crysis Remastered | |
| 3840x2160 Very High Preset AA:SM | |
| Acer Nitro 5 AN517-53-54DQ | |
| MSI GP65 Leopard 9SD | |
| MSI GL75 | |
| MSI GP75 | |
| 2560x1440 Very High Preset AA:SM | |
| Acer Nitro 5 AN517-53-54DQ | |
| MSI GP65 Leopard 9SD | |
| MSI GL75 | |
| MSI GP75 | |
| 1920x1080 Very High Preset AA:SM | |
| MSI GP65 Leopard 9SD | |
| Acer Nitro 5 AN517-53-54DQ | |
| MSI GL75 | |
| MSI GP75 | |
| 1920x1080 High Preset AA:SM | |
| MSI GP65 Leopard 9SD | |
| Acer Nitro 5 AN517-53-54DQ | |
| MSI GP75 | |
| MSI GL75 | |
| 1920x1080 Medium Preset | |
| MSI GP65 Leopard 9SD | |
| Acer Nitro 5 AN517-53-54DQ | |
| MSI GP75 | |
| MSI GL75 | |
| Yakuza Like a Dragon | |
| 3840x2160 Ultra Preset | |
| MSI GP65 Leopard 9SD | |
| Acer Nitro 5 AN517-53-54DQ | |
| MSI GP75 | |
| MSI GL75 | |
| 2560x1440 Ultra Preset | |
| MSI GP65 Leopard 9SD | |
| Acer Nitro 5 AN517-53-54DQ | |
| MSI GP75 | |
| MSI GL75 | |
| 1920x1080 Ultra Preset | |
| MSI GP65 Leopard 9SD | |
| Acer Nitro 5 AN517-53-54DQ | |
| MSI GP75 | |
| MSI GL75 | |
| 1920x1080 High Preset | |
| MSI GP65 Leopard 9SD | |
| Acer Nitro 5 AN517-53-54DQ | |
| MSI GP75 | |
| MSI GL75 | |
| 1920x1080 Medium Preset | |
| MSI GP65 Leopard 9SD | |
| Acer Nitro 5 AN517-53-54DQ | |
| MSI GP75 | |
| MSI GL75 | |
| Call of Duty Black Ops Cold War | |
| 1920x1080 Highest Settings + Ultra Ray Tracing | |
| MSI GP65 Leopard 9SD | |
| 3840x2160 Highest Settings | |
| MSI GP65 Leopard 9SD | |
| 2560x1440 Highest Settings | |
| MSI GP65 Leopard 9SD | |
| 1920x1080 Highest Settings | |
| MSI GP65 Leopard 9SD | |
| 1920x1080 High Settings | |
| MSI GP65 Leopard 9SD | |
| 1920x1080 Medium Settings | |
| MSI GP65 Leopard 9SD | |
| Assassin´s Creed Valhalla | |
| 3840x2160 Ultra High Preset | |
| MSI GP65 Leopard 9SD | |
| 2560x1440 Ultra High Preset | |
| MSI GP65 Leopard 9SD | |
| Acer Nitro 5 AN517-53-54DQ | |
| 1920x1080 Ultra High Preset | |
| MSI GP65 Leopard 9SD | |
| Acer Nitro 5 AN517-53-54DQ | |
| 1920x1080 High Preset | |
| MSI GP65 Leopard 9SD | |
| Acer Nitro 5 AN517-53-54DQ | |
| 1920x1080 Medium Preset | |
| MSI GP65 Leopard 9SD | |
| Acer Nitro 5 AN517-53-54DQ | |
| Dirt 5 | |
| 3840x2160 Ultra High Preset | |
| MSI GP65 Leopard 9SD | |
| Acer Nitro 5 AN517-53-54DQ | |
| 2560x1440 Ultra High Preset | |
| Acer Nitro 5 AN517-53-54DQ | |
| MSI GP65 Leopard 9SD | |
| 1920x1080 Ultra High Preset | |
| Acer Nitro 5 AN517-53-54DQ | |
| MSI GP65 Leopard 9SD | |
| 1920x1080 High Preset | |
| MSI GP65 Leopard 9SD | |
| Acer Nitro 5 AN517-53-54DQ | |
| 1920x1080 Medium Preset | |
| MSI GP65 Leopard 9SD | |
| Acer Nitro 5 AN517-53-54DQ | |
| Watch Dogs Legion | |
| 1920x1080 Ultra Preset + Ultra Ray Tracing (DX12) | |
| MSI GP65 Leopard 9SD | |
| 3840x2160 Ultra Preset (DX12) | |
| MSI GP65 Leopard 9SD | |
| 2560x1440 Ultra Preset (DX12) | |
| MSI GP65 Leopard 9SD | |
| 1920x1080 Ultra Preset (DX12) | |
| MSI GP65 Leopard 9SD | |
| 1920x1080 High Preset (DX12) | |
| MSI GP65 Leopard 9SD | |
| Acer Nitro 5 AN517-53-54DQ | |
| 1920x1080 Medium Preset (DX12) | |
| MSI GP65 Leopard 9SD | |
| Acer Nitro 5 AN517-53-54DQ | |
| FIFA 21 | |
| 3840x2160 Ultra Preset AA:4xMS | |
| MSI GP65 Leopard 9SD | |
| Acer Nitro 5 AN517-53-54DQ | |
| 2560x1440 Ultra Preset AA:4xMS | |
| MSI GP65 Leopard 9SD | |
| Acer Nitro 5 AN517-53-54DQ | |
| 1920x1080 Ultra Preset AA:4xMS | |
| MSI GP65 Leopard 9SD | |
| Acer Nitro 5 AN517-53-54DQ | |
| 1920x1080 High Preset AA:2xMS | |
| MSI GP65 Leopard 9SD | |
| Acer Nitro 5 AN517-53-54DQ | |
| 1920x1080 Medium Preset | |
| MSI GP65 Leopard 9SD | |
| Acer Nitro 5 AN517-53-54DQ | |
| 1280x720 Low Preset | |
| MSI GP65 Leopard 9SD | |
| Star Wars Squadrons | |
| 3840x2160 Ultra Preset | |
| MSI GP65 Leopard 9SD | |
| Acer Nitro 5 AN517-53-54DQ | |
| 2560x1440 Ultra Preset | |
| MSI GP65 Leopard 9SD | |
| Acer Nitro 5 AN517-53-54DQ | |
| 1920x1080 Ultra Preset | |
| MSI GP65 Leopard 9SD | |
| Acer Nitro 5 AN517-53-54DQ | |
| 1920x1080 High Preset | |
| MSI GP65 Leopard 9SD | |
| Acer Nitro 5 AN517-53-54DQ | |
| 1920x1080 Medium Preset | |
| MSI GP65 Leopard 9SD | |
| Acer Nitro 5 AN517-53-54DQ | |
| 1280x720 Low Preset | |
| MSI GP65 Leopard 9SD | |
| Mafia Definitive Edition | |
| 3840x2160 High Preset | |
| MSI GP65 Leopard 9SD | |
| Acer Nitro 5 AN517-53-54DQ | |
| 2560x1440 High Preset | |
| MSI GP65 Leopard 9SD | |
| Acer Nitro 5 AN517-53-54DQ | |
| 1920x1080 High Preset | |
| MSI GP65 Leopard 9SD | |
| Acer Nitro 5 AN517-53-54DQ | |
| 1920x1080 Medium Preset | |
| MSI GP65 Leopard 9SD | |
| Acer Nitro 5 AN517-53-54DQ | |
| 1280x720 Low Preset | |
| MSI GP65 Leopard 9SD | |
| Serious Sam 4 | |
| 2560x1440 Ultra (DX12) AA:2xMS | |
| MSI GP65 Leopard 9SD | |
| Acer Nitro 5 AN517-53-54DQ | |
| 1920x1080 Ultra (DX12) AA:2xMS | |
| MSI GP65 Leopard 9SD | |
| Acer Nitro 5 AN517-53-54DQ | |
| 1920x1080 High (DX12) | |
| MSI GP65 Leopard 9SD | |
| Acer Nitro 5 AN517-53-54DQ | |
| 1920x1080 Medium (DX12) | |
| MSI GP65 Leopard 9SD | |
| Acer Nitro 5 AN517-53-54DQ | |
| 1280x720 Lowest (DX12) | |
| MSI GP65 Leopard 9SD | |
| Flight Simulator 2020 | |
| 3840x2160 Ultra AA:TAA AF:16x | |
| MSI GP65 Leopard 9SD | |
| 2560x1440 Ultra AA:TAA AF:16x | |
| MSI GP65 Leopard 9SD | |
| 1920x1080 Ultra AA:TAA AF:16x | |
| MSI GP65 Leopard 9SD | |
| 1920x1080 High-End AA:TAA AF:8x | |
| MSI GP65 Leopard 9SD | |
| 1920x1080 Medium AA:TAA AF:4x | |
| MSI GP65 Leopard 9SD | |
| 1280x720 Low-End AA:TAA | |
| MSI GP65 Leopard 9SD | |
| Valorant | |
| 3840x2160 High / On AA:FX AF:16x | |
| MSI GP65 Leopard 9SD | |
| 2560x1440 High / On AA:FX AF:16x | |
| MSI GP65 Leopard 9SD | |
| 1920x1080 High / On AA:FX AF:16x | |
| MSI GP65 Leopard 9SD | |
| 1920x1080 Medium / On AF:8x | |
| MSI GP65 Leopard 9SD | |
| 1280x720 Low / Off AF:1x | |
| MSI GP65 Leopard 9SD | |
| Horizon Zero Dawn | |
| 3840x2160 Ultimate Quality | |
| MSI GP65 Leopard 9SD | |
| 2560x1440 Ultimate Quality | |
| MSI GP65 Leopard 9SD | |
| 1920x1080 Ultimate Quality | |
| MSI GP65 Leopard 9SD | |
| 1920x1080 Favor Quality | |
| MSI GP65 Leopard 9SD | |
| 1920x1080 Original | |
| MSI GP65 Leopard 9SD | |
| 1280x720 Favor Performance | |
| MSI GP65 Leopard 9SD | |
| Strange Brigade | |
| 3840x2160 ultra AA:ultra AF:16 | |
| Durchschnitt der Klasse Gaming (66.7 - 187.2, n=34, der letzten 2 Jahre) | |
| Acer Nitro 5 AN517-53-54DQ | |
| 2560x1440 ultra AA:ultra AF:16 | |
| Durchschnitt der Klasse Gaming (52.8 - 350, n=79, der letzten 2 Jahre) | |
| Acer Nitro 5 AN517-53-54DQ | |
| 1920x1080 ultra AA:ultra AF:16 | |
| Durchschnitt der Klasse Gaming (76.3 - 456, n=94, der letzten 2 Jahre) | |
| Acer Nitro 5 AN517-53-54DQ | |
| 1920x1080 high AA:high AF:8 | |
| Durchschnitt der Klasse Gaming (129.5 - 485, n=80, der letzten 2 Jahre) | |
| Acer Nitro 5 AN517-53-54DQ | |
| 1920x1080 medium AA:medium AF:4 | |
| Durchschnitt der Klasse Gaming (160.9 - 509, n=78, der letzten 2 Jahre) | |
| Acer Nitro 5 AN517-53-54DQ | |
| Death Stranding | |
| 3840x2160 Very High Preset | |
| MSI GP65 Leopard 9SD | |
| Acer Nitro 5 AN517-53-54DQ | |
| 2560x1440 Very High Preset | |
| MSI GP65 Leopard 9SD | |
| Acer Nitro 5 AN517-53-54DQ | |
| 1920x1080 Very High Preset | |
| MSI GP65 Leopard 9SD | |
| Acer Nitro 5 AN517-53-54DQ | |
| 1920x1080 Default Preset | |
| MSI GP65 Leopard 9SD | |
| Acer Nitro 5 AN517-53-54DQ | |
| 1920x1080 Medium Preset | |
| MSI GP65 Leopard 9SD | |
| Acer Nitro 5 AN517-53-54DQ | |
| 1280x720 Low Preset | |
| MSI GP65 Leopard 9SD | |
| F1 2020 | |
| 3840x2160 Ultra High Preset AA:T AF:16x | |
| MSI GP65 Leopard 9SD | |
| 2560x1440 Ultra High Preset AA:T AF:16x | |
| MSI GP65 Leopard 9SD | |
| 1920x1080 Ultra High Preset AA:T AF:16x | |
| MSI GP65 Leopard 9SD | |
| 1920x1080 High Preset AA:T AF:16x | |
| MSI GP65 Leopard 9SD | |
| 1920x1080 Medium Preset AF:16x | |
| MSI GP65 Leopard 9SD | |
| 1280x720 Ultra Low Preset | |
| MSI GP65 Leopard 9SD | |
| Gears Tactics | |
| 3840x2160 Ultra Preset | |
| MSI GP65 Leopard 9SD | |
| Acer Nitro 5 AN517-53-54DQ | |
| 2560x1440 Ultra Preset | |
| MSI GP65 Leopard 9SD | |
| Acer Nitro 5 AN517-53-54DQ | |
| 1920x1080 Ultra Preset | |
| MSI GP65 Leopard 9SD | |
| Acer Nitro 5 AN517-53-54DQ | |
| 1920x1080 High Preset | |
| MSI GP65 Leopard 9SD | |
| Acer Nitro 5 AN517-53-54DQ | |
| 1920x1080 Medium Preset | |
| MSI GP65 Leopard 9SD | |
| Acer Nitro 5 AN517-53-54DQ | |
| 1280x720 Low Preset | |
| MSI GP65 Leopard 9SD | |
| Doom Eternal | |
| 3840x2160 Ultra Preset | |
| MSI GP65 Leopard 9SD | |
| 2560x1440 Ultra Preset | |
| MSI GP65 Leopard 9SD | |
| 1920x1080 Ultra Preset | |
| MSI GP65 Leopard 9SD | |
| 1920x1080 High Preset | |
| MSI GP65 Leopard 9SD | |
| Acer Nitro 5 AN517-53-54DQ | |
| 1920x1080 Medium Preset | |
| MSI GP65 Leopard 9SD | |
| Acer Nitro 5 AN517-53-54DQ | |
| 1280x720 Low Preset | |
| MSI GP65 Leopard 9SD | |
| Hunt Showdown | |
| 3840x2160 High Preset | |
| MSI GP65 Leopard 9SD | |
| Acer Nitro 5 AN517-53-54DQ | |
| 2560x1440 High Preset | |
| MSI GP65 Leopard 9SD | |
| Acer Nitro 5 AN517-53-54DQ | |
| 1920x1080 High Preset | |
| MSI GP65 Leopard 9SD | |
| Acer Nitro 5 AN517-53-54DQ | |
| 1920x1080 Medium Preset | |
| MSI GP65 Leopard 9SD | |
| Acer Nitro 5 AN517-53-54DQ | |
| 1280x720 Low Preset | |
| MSI GP65 Leopard 9SD | |
| Escape from Tarkov | |
| 3840x2160 Ultra Preset | |
| MSI GP65 Leopard 9SD | |
| 2560x1440 Ultra Preset | |
| MSI GP65 Leopard 9SD | |
| 1920x1080 Ultra Preset | |
| MSI GP65 Leopard 9SD | |
| 1920x1080 High Preset | |
| MSI GP65 Leopard 9SD | |
| 1920x1080 Medium Preset | |
| MSI GP65 Leopard 9SD | |
| 1280x720 Low Preset | |
| MSI GP65 Leopard 9SD | |
| Red Dead Redemption 2 | |
| 3840x2160 Maximum Settings | |
| MSI GP65 Leopard 9SD | |
| 2560x1440 Maximum Settings | |
| MSI GP65 Leopard 9SD | |
| 1920x1080 Maximum Settings | |
| MSI GP65 Leopard 9SD | |
| 1920x1080 High Settings | |
| MSI GP65 Leopard 9SD | |
| 1920x1080 Medium Settings | |
| MSI GP65 Leopard 9SD | |
| 1280x720 Minimum Settings | |
| MSI GP65 Leopard 9SD | |
| Star Wars Jedi Fallen Order | |
| 3840x2160 Epic Preset | |
| MSI GP65 Leopard 9SD | |
| Acer Nitro 5 AN517-53-54DQ | |
| 2560x1440 Epic Preset | |
| MSI GP65 Leopard 9SD | |
| Acer Nitro 5 AN517-53-54DQ | |
| 1920x1080 Epic Preset | |
| MSI GP65 Leopard 9SD | |
| Acer Nitro 5 AN517-53-54DQ | |
| 1920x1080 High Preset | |
| MSI GP65 Leopard 9SD | |
| Acer Nitro 5 AN517-53-54DQ | |
| 1920x1080 Medium Preset | |
| MSI GP65 Leopard 9SD | |
| Acer Nitro 5 AN517-53-54DQ | |
| Need for Speed Heat | |
| 3840x2160 Ultra Preset | |
| MSI GP65 Leopard 9SD | |
| Acer Nitro 5 AN517-53-54DQ | |
| 2560x1440 Ultra Preset | |
| MSI GP65 Leopard 9SD | |
| Acer Nitro 5 AN517-53-54DQ | |
| 1920x1080 Ultra Preset | |
| MSI GP65 Leopard 9SD | |
| Acer Nitro 5 AN517-53-54DQ | |
| 1920x1080 High Preset | |
| MSI GP65 Leopard 9SD | |
| Acer Nitro 5 AN517-53-54DQ | |
| 1920x1080 Medium Preset | |
| MSI GP65 Leopard 9SD | |
| Acer Nitro 5 AN517-53-54DQ | |
| 1280x720 Low Preset | |
| MSI GP65 Leopard 9SD | |
| Call of Duty Modern Warfare 2019 | |
| 1920x1080 Maximum Settings with Raytracing AA:T2X Filmic SM | |
| MSI GP65 Leopard 9SD | |
| 3840x2160 Maximum Settings AA:T2X Filmic SM | |
| MSI GP65 Leopard 9SD | |
| 2560x1440 Maximum Settings AA:T2X Filmic SM | |
| MSI GP65 Leopard 9SD | |
| 1920x1080 Maximum Settings AA:T2X Filmic SM | |
| MSI GP65 Leopard 9SD | |
| 1920x1080 High Settings AA:1X SM | |
| MSI GP65 Leopard 9SD | |
| 1920x1080 Medium Settings | |
| MSI GP65 Leopard 9SD | |
| 1280x720 Minimum Settings | |
| MSI GP65 Leopard 9SD | |
| GRID 2019 | |
| 3840x2160 Ultra High Preset | |
| MSI GP65 Leopard 9SD | |
| Acer Nitro 5 AN517-53-54DQ | |
| 2560x1440 Ultra High Preset | |
| MSI GP65 Leopard 9SD | |
| Acer Nitro 5 AN517-53-54DQ | |
| 1920x1080 Ultra High Preset | |
| MSI GP65 Leopard 9SD | |
| Acer Nitro 5 AN517-53-54DQ | |
| 1920x1080 High Preset | |
| MSI GP65 Leopard 9SD | |
| Acer Nitro 5 AN517-53-54DQ | |
| 1920x1080 Medium Preset | |
| MSI GP65 Leopard 9SD | |
| Acer Nitro 5 AN517-53-54DQ | |
| 1280x720 Ultra Low Preset | |
| MSI GP65 Leopard 9SD | |
| Ghost Recon Breakpoint | |
| 3840x2160 Ultra Preset AA:T | |
| MSI GP65 Leopard 9SD | |
| 2560x1440 Ultra Preset AA:T | |
| MSI GP65 Leopard 9SD | |
| 1920x1080 Ultra Preset AA:T | |
| MSI GP65 Leopard 9SD | |
| 1920x1080 High Preset AA:T | |
| MSI GP65 Leopard 9SD | |
| 1920x1080 Medium Preset | |
| MSI GP65 Leopard 9SD | |
| 1280x720 Low Preset | |
| MSI GP65 Leopard 9SD | |
| FIFA 20 | |
| 3840x2160 Ultra Preset AA:4xMS | |
| MSI GP65 Leopard 9SD | |
| 2560x1440 Ultra Preset AA:4xMS | |
| MSI GP65 Leopard 9SD | |
| 1920x1080 Ultra Preset AA:4xMS | |
| MSI GP65 Leopard 9SD | |
| 1920x1080 High Preset AA:2xMS | |
| MSI GP65 Leopard 9SD | |
| 1920x1080 Medium Preset | |
| MSI GP65 Leopard 9SD | |
| 1280x720 Low Preset | |
| MSI GP65 Leopard 9SD | |
| Borderlands 3 | |
| 3840x2160 Badass Overall Quality (DX11) | |
| Acer Nitro 5 AN517-53-54DQ | |
| MSI GP65 Leopard 9SD | |
| 2560x1440 Badass Overall Quality (DX11) | |
| MSI GP65 Leopard 9SD | |
| Acer Nitro 5 AN517-53-54DQ | |
| 1920x1080 Badass Overall Quality (DX11) | |
| MSI GP65 Leopard 9SD | |
| Acer Nitro 5 AN517-53-54DQ | |
| 1920x1080 High Overall Quality (DX11) | |
| MSI GP65 Leopard 9SD | |
| Acer Nitro 5 AN517-53-54DQ | |
| 1920x1080 Medium Overall Quality (DX11) | |
| MSI GP65 Leopard 9SD | |
| Acer Nitro 5 AN517-53-54DQ | |
| 1280x720 Very Low Overall Quality (DX11) | |
| MSI GP65 Leopard 9SD | |
| Control | |
| 1920x1080 High Quality Preset & High Ray Tracing Preset (DX12) | |
| MSI GP65 Leopard 9SD | |
| 3840x2160 High Quality Preset | |
| MSI GP65 Leopard 9SD | |
| Acer Nitro 5 AN517-53-54DQ | |
| 2560x1440 High Quality Preset | |
| MSI GP65 Leopard 9SD | |
| Acer Nitro 5 AN517-53-54DQ | |
| 1920x1080 High Quality Preset | |
| MSI GP65 Leopard 9SD | |
| Acer Nitro 5 AN517-53-54DQ | |
| 1920x1080 Medium Quality Preset | |
| MSI GP65 Leopard 9SD | |
| Acer Nitro 5 AN517-53-54DQ | |
| 1280x720 Low Quality Preset | |
| MSI GP65 Leopard 9SD | |
| F1 2019 | |
| 3840x2160 Ultra High Preset AA:T AF:16x | |
| MSI GP65 Leopard 9SD | |
| 2560x1440 Ultra High Preset AA:T AF:16x | |
| MSI GP65 Leopard 9SD | |
| 1920x1080 Ultra High Preset AA:T AF:16x | |
| MSI GP65 Leopard 9SD | |
| 1920x1080 High Preset AA:T AF:16x | |
| MSI GP65 Leopard 9SD | |
| 1920x1080 Medium Preset AA:T AF:16x | |
| MSI GP65 Leopard 9SD | |
| 1280x720 Ultra Low Preset | |
| MSI GP65 Leopard 9SD | |
| Rage 2 | |
| 3840x2160 Ultra Preset (Resolution Scale Off) | |
| Acer Nitro 5 AN517-53-54DQ | |
| 2560x1440 Ultra Preset (Resolution Scale Off) | |
| Acer Nitro 5 AN517-53-54DQ | |
| 1920x1080 Ultra Preset (Resolution Scale Off) | |
| Acer Nitro 5 AN517-53-54DQ | |
| 1920x1080 High Preset (Resolution Scale Off) | |
| Acer Nitro 5 AN517-53-54DQ | |
| 1920x1080 Medium Preset (Resolution Scale Off) | |
| Acer Nitro 5 AN517-53-54DQ | |
| Anno 1800 | |
| 3840x2160 Ultra Graphics Quality (DX11) | |
| Acer Nitro 5 AN517-53-54DQ | |
| 2560x1440 Ultra Graphics Quality (DX11) | |
| Durchschnitt der Klasse Gaming (n=1der letzten 2 Jahre) | |
| Acer Nitro 5 AN517-53-54DQ | |
| 1920x1080 Ultra Graphics Quality (DX11) | |
| Durchschnitt der Klasse Gaming (n=1der letzten 2 Jahre) | |
| Acer Nitro 5 AN517-53-54DQ | |
| 1920x1080 High Graphics Quality (DX11) | |
| Durchschnitt der Klasse Gaming (n=1der letzten 2 Jahre) | |
| Acer Nitro 5 AN517-53-54DQ | |
| 1920x1080 Medium Graphics Quality (DX11) | |
| Durchschnitt der Klasse Gaming (n=1der letzten 2 Jahre) | |
| Acer Nitro 5 AN517-53-54DQ | |
| The Division 2 | |
| 3840x2160 Ultra Preset | |
| Acer Nitro 5 AN517-53-54DQ | |
| 2560x1440 Ultra Preset | |
| Acer Nitro 5 AN517-53-54DQ | |
| 1920x1080 Ultra Preset | |
| Acer Nitro 5 AN517-53-54DQ | |
| 1920x1080 High Preset | |
| Acer Nitro 5 AN517-53-54DQ | |
| 1920x1080 Medium Preset | |
| Acer Nitro 5 AN517-53-54DQ | |
| Apex Legends | |
| 3840x2160 Maximum Settings AA:TS AF:16x | |
| Acer Nitro 5 AN517-53-54DQ | |
| 2560x1440 Maximum Settings AA:TS AF:16x | |
| Acer Nitro 5 AN517-53-54DQ | |
| 1920x1080 Maximum Settings AA:TS AF:16x | |
| Acer Nitro 5 AN517-53-54DQ | |
| 1920x1080 High Settings AA:TS AF:8x | |
| Acer Nitro 5 AN517-53-54DQ | |
| 1920x1080 Medium Settings AA:TS AF:4x | |
| Acer Nitro 5 AN517-53-54DQ | |
| Metro Exodus | |
| 3840x2160 Ultra Quality AF:16x | |
| Acer Nitro 5 AN517-53-54DQ | |
| 2560x1440 Ultra Quality AF:16x | |
| Acer Nitro 5 AN517-53-54DQ | |
| 1920x1080 Ultra Quality AF:16x | |
| Acer Nitro 5 AN517-53-54DQ | |
| 1920x1080 High Quality AF:16x | |
| Acer Nitro 5 AN517-53-54DQ | |
| 1920x1080 Medium Quality AF:4x | |
| Acer Nitro 5 AN517-53-54DQ | |
| Battlefield V | |
| 3840x2160 Ultra Preset | |
| Acer Nitro 5 AN517-53-54DQ | |
| 2560x1440 Ultra Preset | |
| Acer Nitro 5 AN517-53-54DQ | |
| 1920x1080 Ultra Preset | |
| Acer Nitro 5 AN517-53-54DQ | |
| 1920x1080 High Preset | |
| Acer Nitro 5 AN517-53-54DQ | |
| 1920x1080 Medium Preset | |
| Acer Nitro 5 AN517-53-54DQ | |
| Shadow of the Tomb Raider | |
| 3840x2160 Highest Preset AA:T | |
| Acer Nitro 5 AN517-53-54DQ | |
| 2560x1440 Highest Preset AA:T | |
| Acer Nitro 5 AN517-53-54DQ | |
| 1920x1080 Highest Preset AA:T | |
| Durchschnitt der Klasse Gaming (96 - 116, n=2, der letzten 2 Jahre) | |
| Acer Nitro 5 AN517-53-54DQ | |
| 1920x1080 High Preset AA:SM | |
| Durchschnitt der Klasse Gaming (107 - 127, n=2, der letzten 2 Jahre) | |
| Acer Nitro 5 AN517-53-54DQ | |
| 1920x1080 Medium Preset | |
| Acer Nitro 5 AN517-53-54DQ | |
| Far Cry 5 | |
| 3840x2160 Ultra Preset AA:T | |
| Durchschnitt der Klasse Gaming (61 - 96, n=2, der letzten 2 Jahre) | |
| Acer Nitro 5 AN517-53-54DQ | |
| 2560x1440 Ultra Preset AA:T | |
| Durchschnitt der Klasse Gaming (90 - 149, n=8, der letzten 2 Jahre) | |
| Acer Nitro 5 AN517-53-54DQ | |
| 1920x1080 Ultra Preset AA:T | |
| Durchschnitt der Klasse Gaming (70 - 151, n=10, der letzten 2 Jahre) | |
| Acer Nitro 5 AN517-53-54DQ | |
| 1920x1080 High Preset AA:T | |
| Durchschnitt der Klasse Gaming (82 - 163, n=10, der letzten 2 Jahre) | |
| Acer Nitro 5 AN517-53-54DQ | |
| 1920x1080 Medium Preset AA:T | |
| Durchschnitt der Klasse Gaming (84 - 173, n=10, der letzten 2 Jahre) | |
| Acer Nitro 5 AN517-53-54DQ | |
| X-Plane 11.11 | |
| 1920x1080 high (fps_test=3) | |
| Durchschnitt der Klasse Gaming (52.1 - 143.5, n=116, der letzten 2 Jahre) | |
| Acer Nitro 5 AN517-53-54DQ | |
| 1920x1080 med (fps_test=2) | |
| Durchschnitt der Klasse Gaming (63.8 - 181.2, n=112, der letzten 2 Jahre) | |
| Acer Nitro 5 AN517-53-54DQ | |
| 1280x720 low (fps_test=1) | |
| Durchschnitt der Klasse Gaming (70.1 - 209, n=101, der letzten 2 Jahre) | |
| Acer Nitro 5 AN517-53-54DQ | |
| Final Fantasy XV Benchmark | |
| 3840x2160 High Quality | |
| Durchschnitt der Klasse Gaming (45 - 111.8, n=34, der letzten 2 Jahre) | |
| Acer Nitro 5 AN517-53-54DQ | |
| 2560x1440 High Quality | |
| Durchschnitt der Klasse Gaming (32.5 - 184.3, n=89, der letzten 2 Jahre) | |
| Acer Nitro 5 AN517-53-54DQ | |
| 1920x1080 High Quality | |
| Durchschnitt der Klasse Gaming (41 - 215, n=104, der letzten 2 Jahre) | |
| Acer Nitro 5 AN517-53-54DQ | |
| 1920x1080 Standard Quality | |
| Durchschnitt der Klasse Gaming (85.7 - 236, n=90, der letzten 2 Jahre) | |
| Acer Nitro 5 AN517-53-54DQ | |
| Fortnite | |
| 2560x1440 Epic Preset | |
| MSI GP65 Leopard 9SD | |
| 1920x1080 Epic Preset | |
| MSI GP65 Leopard 9SD | |
| Playerunknown's Battlegrounds (PUBG) - 1920x1080 Ultra Preset | |
| MSI GP65 Leopard 9SD | |
| Dota 2 Reborn | |
| 1920x1080 ultra (3/3) best looking | |
| Durchschnitt der Klasse Gaming (84.8 - 248, n=113, der letzten 2 Jahre) | |
| Acer Nitro 5 AN517-53-54DQ | |
| 1920x1080 high (2/3) | |
| Durchschnitt der Klasse Gaming (82.8 - 275, n=112, der letzten 2 Jahre) | |
| Acer Nitro 5 AN517-53-54DQ | |
| 1366x768 med (1/3) | |
| Durchschnitt der Klasse Gaming (86.3 - 304, n=111, der letzten 2 Jahre) | |
| Acer Nitro 5 AN517-53-54DQ | |
| 1280x720 min (0/3) fastest | |
| Durchschnitt der Klasse Gaming (102.1 - 327, n=99, der letzten 2 Jahre) | |
| Acer Nitro 5 AN517-53-54DQ | |
| Overwatch - 2560x1440 Epic (Render Scale 100 %) AA:SM AF:16x | |
| MSI GP65 Leopard 9SD | |
| The Witcher 3 | |
| 3840x2160 High Graphics & Postprocessing (Nvidia HairWorks Off) | |
| Durchschnitt der Klasse Gaming (114 - 169.8, n=3, der letzten 2 Jahre) | |
| Acer Nitro 5 AN517-53-54DQ | |
| 1920x1080 Ultra Graphics & Postprocessing (HBAO+) | |
| Durchschnitt der Klasse Gaming (95 - 240, n=8, der letzten 2 Jahre) | |
| Acer Nitro 5 AN517-53-54DQ | |
| 1920x1080 High Graphics & Postprocessing (Nvidia HairWorks Off) | |
| Durchschnitt der Klasse Gaming (181 - 341, n=3, der letzten 2 Jahre) | |
| Acer Nitro 5 AN517-53-54DQ | |
| 1366x768 Medium Graphics & Postprocessing | |
| Durchschnitt der Klasse Gaming (295 - 517, n=3, der letzten 2 Jahre) | |
| Acer Nitro 5 AN517-53-54DQ | |
Top: Im 60-Minuten-Test von The Witcher 3 (FHD/Ultra) gab es keine Auffälligkeiten. Die Taktraten und die Performance zeigten sich recht stabil.
Witcher 3 FPS-Diagramm
| min. | mittel | hoch | max. | QHD | 4K | |
|---|---|---|---|---|---|---|
| GTA V (2015) | 157 | 120 | 63.9 | 48 | 46.3 | |
| The Witcher 3 (2015) | 142 | 84.5 | 48.7 | 33.2 | ||
| Dota 2 Reborn (2015) | 115 | 104 | 92.1 | 88.1 | ||
| Final Fantasy XV Benchmark (2018) | 71.8 | 48.6 | 33 | 17.4 | ||
| X-Plane 11.11 (2018) | 85.2 | 65.9 | 57.7 | |||
| Far Cry 5 (2018) | 86 | 80 | 74 | 52 | 19 | |
| Strange Brigade (2018) | 93.4 | 75.7 | 67.9 | 48.7 | 34 | |
| Shadow of the Tomb Raider (2018) | 66 | 63 | 57 | 44 | 23 | |
| Battlefield V (2018) | 92.8 | 89.4 | 83.2 | 65.7 | 35 | |
| Apex Legends (2019) | 126 | 100 | 89.8 | 68.4 | 37.1 | |
| Metro Exodus (2019) | 63.4 | 46.9 | 37.1 | 29 | 17.2 | |
| The Division 2 (2019) | 87 | 69 | 52 | 35 | 16 | |
| Anno 1800 (2019) | 88 | 60.3 | 31.2 | 22.9 | 12.4 | |
| Rage 2 (2019) | 81.3 | 69.8 | 68.8 | 43 | 14.2 | |
| Control (2019) | 62.1 | 45.1 | 29.1 | 13.3 | ||
| Borderlands 3 (2019) | 81.3 | 57.1 | 43.4 | 30.3 | 15.6 | |
| GRID 2019 (2019) | 93.3 | 71.1 | 36.4 | 22.8 | 11.4 | |
| Need for Speed Heat (2019) | 64.7 | 62.5 | 61.1 | 47.1 | 23.3 | |
| Star Wars Jedi Fallen Order (2019) | 86.6 | 80 | 71.6 | 52.6 | 25.3 | |
| Hunt Showdown (2020) | 73.5 | 67.7 | 42 | 19.5 | ||
| Doom Eternal (2020) | 133 | 107 | ||||
| Gears Tactics (2020) | 129 | 84.6 | 62.4 | 42.1 | 21.6 | |
| Death Stranding (2020) | 79.2 | 73.6 | 71 | 38.8 | 19 | |
| Crysis Remastered (2020) | 99.3 | 52.2 | 35.9 | 24.4 | 13.8 | |
| Serious Sam 4 (2020) | 63.5 | 48.9 | 39.1 | 29.9 | ||
| Mafia Definitive Edition (2020) | 64 | 58.9 | 40.1 | 20.4 | ||
| Star Wars Squadrons (2020) | 164 | 145 | 143 | 93.8 | 50.6 | |
| FIFA 21 (2020) | 186 | 180 | 175 | 166 | 112 | |
| Watch Dogs Legion (2020) | 61 | 54 | ||||
| Dirt 5 (2020) | 73.4 | 54.6 | 44.2 | 33 | 16.9 | |
| Assassin´s Creed Valhalla (2020) | 60 | 27 | 20 | 19 | ||
| Yakuza Like a Dragon (2020) | 57.1 | 55.3 | 50.7 | 37.1 | 19.1 | |
| Immortals Fenyx Rising (2020) | 69 | 50 | 45 | 29 | 15 | |
| Cyberpunk 2077 1.0 (2020) | 41.2 | 36 | 29.5 | 16.4 | 4.68 | |
| Hitman 3 (2021) | 103 | 60.5 | 55.7 | 39.7 | 21.4 | |
| Outriders (2021) | 53.2 | 51 | 47.2 | 30.6 | 22.9 | |
| Resident Evil Village (2021) | 73.5 | 66.6 | 57.2 | 41.6 | 17.4 | |
| Mass Effect Legendary Edition (2021) | 96.8 | 78.2 | 43.5 | |||
| Days Gone (2021) | 78.4 | 69.9 | 51.6 | 37.3 | 20.8 | |
| Monster Hunter Stories 2 (2021) | 95.6 | 91.4 | 78.4 | 60.5 | ||
| F1 2021 (2021) | 144 | 115 | 55 | 30 | 12 |
Emissionen - Eher unspektakulär
Geräuschemissionen
Die Geräuschkulisse orientiert sich an der Konkurrenz. Während wir dem 17-Zöller im Idle-Modus 25 bis 33 dB entlocken konnten (unter idealen Bedingungen ist das Gerät lautlos), waren es unter Last 43 bis 47 dB (durchschnittlich 44 dB(A) nach einer Stunde The Witcher 3). Kurzum: Das Nitro 5 ist im 3D-Betrieb weder leise noch unangenehm laut.
Lautstärkediagramm
| Idle |
| 25 / 31 / 33 dB(A) |
| Last |
| 43 / 47 dB(A) |
 | ||
30 dB leise 40 dB(A) deutlich hörbar 50 dB(A) störend |
||
min: | ||
| Acer Nitro 5 AN517-53-54DQ i5-11300H, GeForce RTX 3050 4GB Laptop GPU | HP Omen 15-ek0456ng i5-10300H, GeForce GTX 1660 Ti Mobile | Lenovo Legion 5 17IMH05 i5-10300H, GeForce GTX 1650 Mobile | MSI GF75 Thin 10SCXR i5-10300H, GeForce GTX 1650 Mobile | Asus TUF FX705DT-AU068T R5 3550H, GeForce GTX 1650 Mobile | Durchschnitt der Klasse Gaming | |
|---|---|---|---|---|---|---|
| Geräuschentwicklung | -5% | 4% | -4% | -5% | 1% | |
| aus / Umgebung * (dB) | 25 | 27 -8% | 24 4% | 28.4 -14% | 30.8 -23% | 24.1 ? 4% |
| Idle min * (dB) | 25 | 32.4 -30% | 24 4% | 33 -32% | 30.8 -23% | 25.8 ? -3% |
| Idle avg * (dB) | 31 | 32.4 -5% | 25 19% | 33 -6% | 30.8 1% | 27.5 ? 11% |
| Idle max * (dB) | 33 | 32.4 2% | 29 12% | 33.1 -0% | 32.2 2% | 30 ? 9% |
| Last avg * (dB) | 43 | 32.5 24% | 43 -0% | 37.7 12% | 38.6 10% | 43.1 ? -0% |
| Witcher 3 ultra * (dB) | 44 | 47.2 -7% | 46 -5% | 39.2 11% | ||
| Last max * (dB) | 47 | 51.9 -10% | 51 -9% | 46 2% | 44.8 5% | 54 ? -15% |
* ... kleinere Werte sind besser
Temperatur
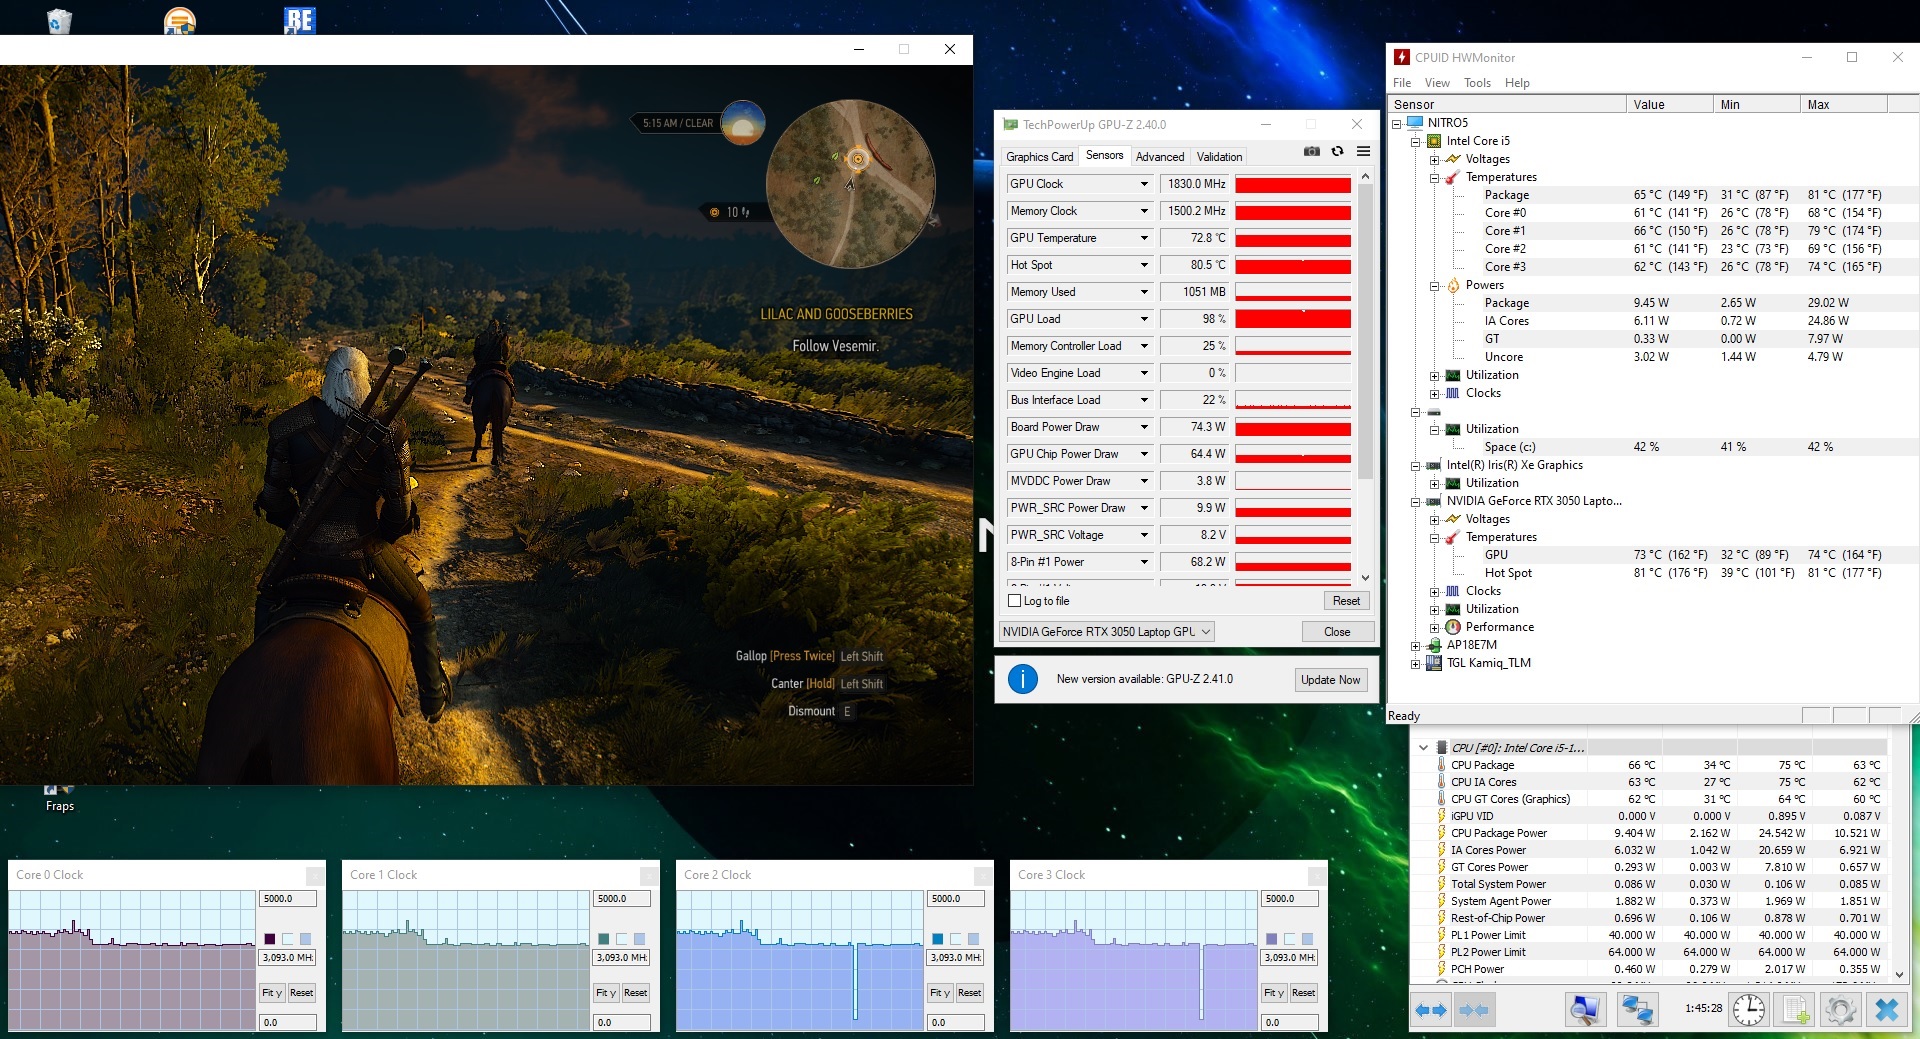
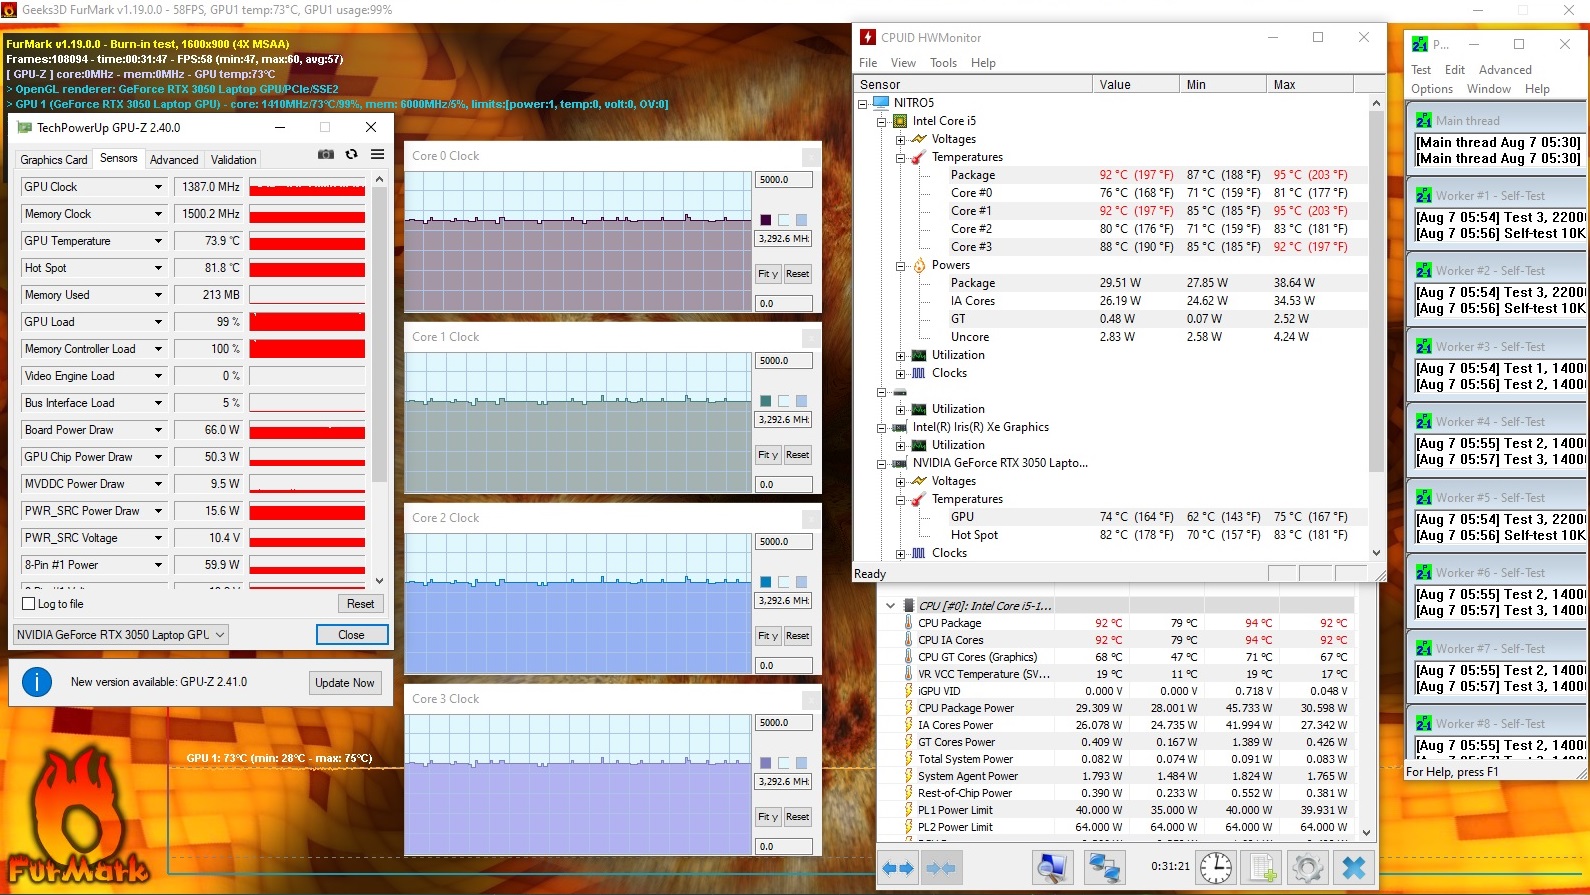
Auch beim Thema Temperaturentwicklung präsentiert sich der 17-Zoll-Spross recht unauffällig. Angesichts der gebotenen Leistung sind die ermittelten Chassis-Werte vertretbar – zumindest auf der Oberseite. Die Unterseite erwärmte sich im Stresstest und nach 60 Minuten The Witcher 3 auf bis zu 54 °C, weshalb man das Notebook beim Zocken nicht unbedingt auf den Schoß stellen sollte. Wenn das Nitro 5 nichts zu tun hat, bleiben die Oberflächen erfreulich kühl (weniger als 30 °C). Die Temperaturen der Komponenten (CPU, GPU etc.) können Sie den Screenshots entnehmen.
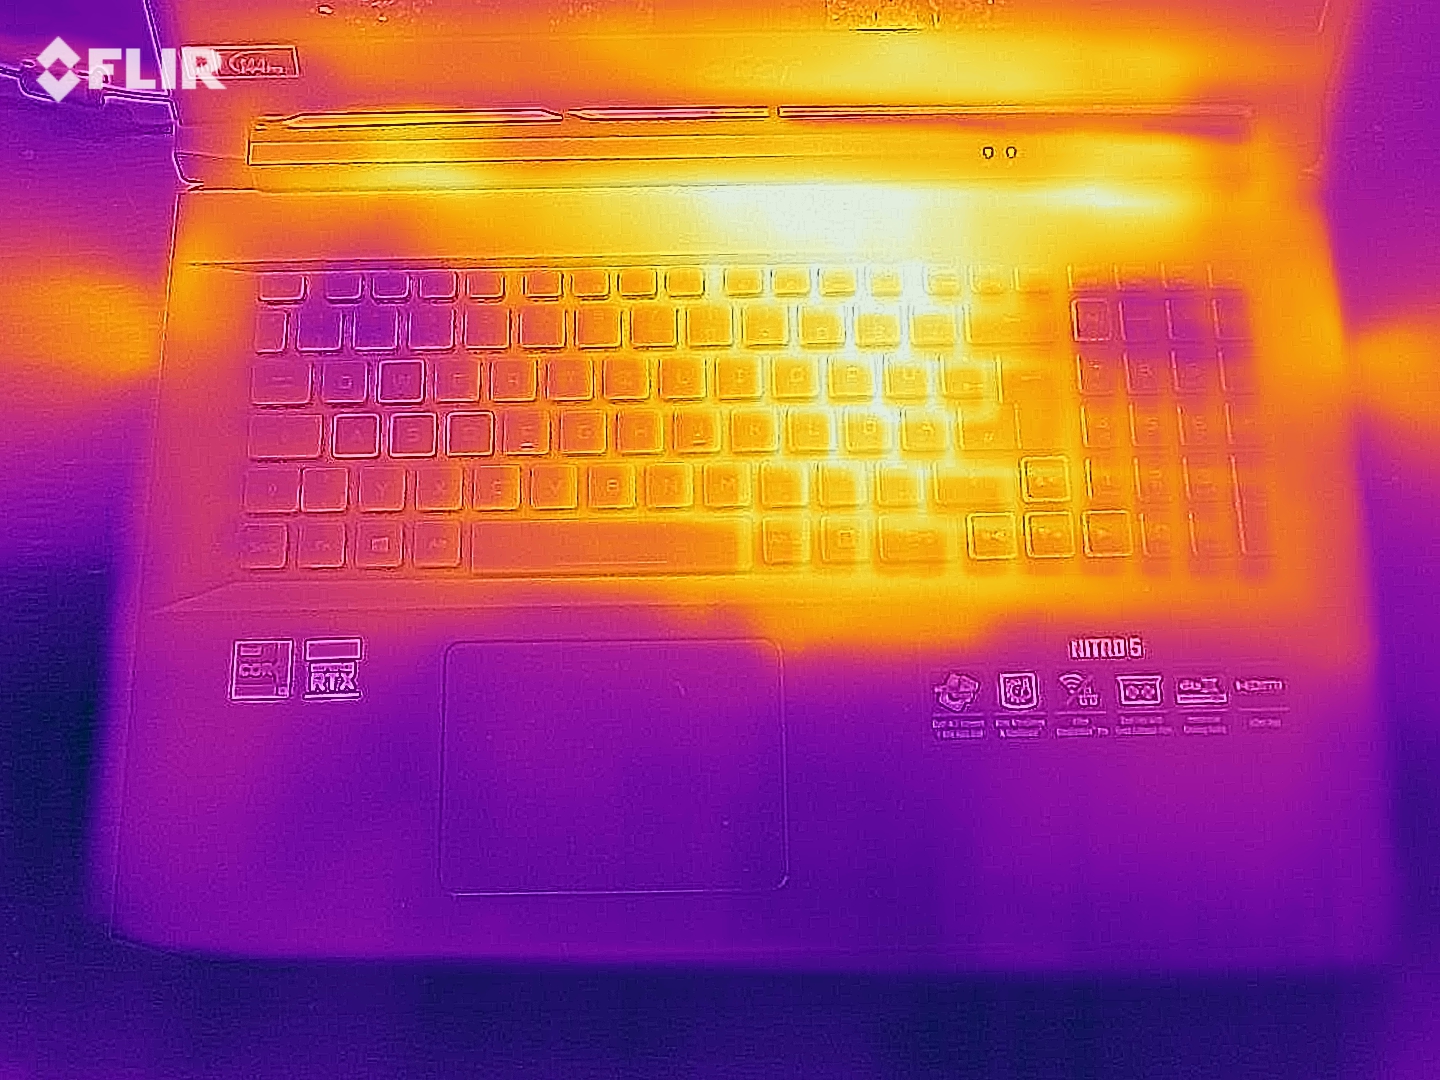

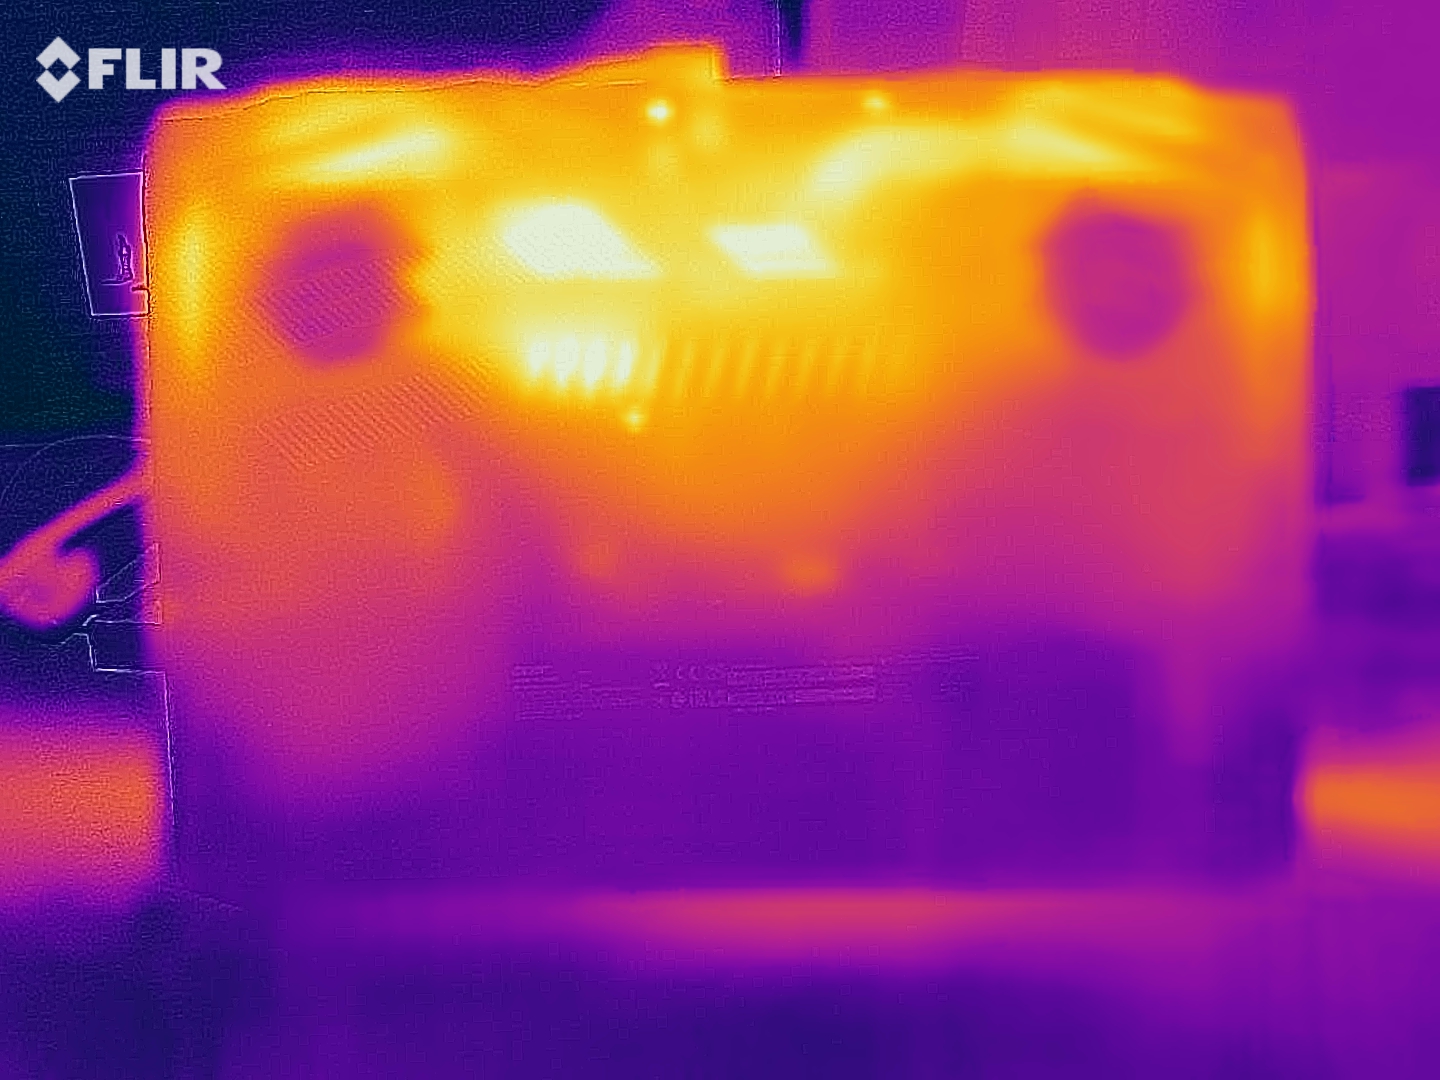
(-) Die maximale Temperatur auf der Oberseite ist 47 °C. Im Vergleich liegt der Klassendurchschnitt bei 40.4 °C (von 21.2 bis 68.8 °C für die Klasse Gaming).
(-) Auf der Unterseite messen wir eine maximalen Wert von 54 °C (im Vergleich zum Durchschnitt von 43.2 °C).
(+) Ohne Last messen wir eine durchschnittliche Temperatur von 24.6 °C auf der Oberseite. Der Klassendurchschnitt erreicht 33.9 °C.
(-) Beim längeren Spielen von The Witcher 3 erhitzt sich das Gerät durchschnittlich auf 38.7 °C. Der Durchschnitt der Klasse ist derzeit 33.9 °C.
(+) Die Handballen und der Touchpad-Bereich erreichen maximal 32 °C und damit die typische Hauttemperatur und fühlen sich daher nicht heiß an.
(-) Die durchschnittliche Handballen-Temperatur anderer getesteter Geräte war 28.8 °C (-3.2 °C).
| Acer Nitro 5 AN517-53-54DQ i5-11300H, GeForce RTX 3050 4GB Laptop GPU | HP Omen 15-ek0456ng i5-10300H, GeForce GTX 1660 Ti Mobile | Lenovo Legion 5 17IMH05 i5-10300H, GeForce GTX 1650 Mobile | MSI GF75 Thin 10SCXR i5-10300H, GeForce GTX 1650 Mobile | Asus TUF FX705DT-AU068T R5 3550H, GeForce GTX 1650 Mobile | Durchschnitt der Klasse Gaming | |
|---|---|---|---|---|---|---|
| Hitze | 4% | -10% | -19% | -1% | -12% | |
| Last oben max * (°C) | 47 | 40.2 14% | 47 -0% | 42 11% | 41.6 11% | 45.2 ? 4% |
| Last unten max * (°C) | 54 | 48.4 10% | 44 19% | 53.4 1% | 38 30% | 48.2 ? 11% |
| Idle oben max * (°C) | 25 | 25.6 -2% | 35 -40% | 34.2 -37% | 31.7 -27% | 31.1 ? -24% |
| Idle unten max * (°C) | 25 | 26.7 -7% | 30 -20% | 37.4 -50% | 29.5 -18% | 34.3 ? -37% |
* ... kleinere Werte sind besser
Lautsprecher
Acer Nitro 5 AN517-53-54DQ Audio Analyse
(±) | Mittelmäßig laut spielende Lautsprecher (79 dB)
Bass 100 - 315 Hz
(-) | kaum Bass - 19.2% niedriger als der Median
(±) | durchschnittlich lineare Bass-Wiedergabe (10.7% Delta zum Vorgänger)
Mitteltöne 400 - 2000 Hz
(±) | zu hohe Mitten, vom Median 5.5% abweichend
(+) | lineare Mitten (5.6% Delta zum Vorgänger)
Hochtöne 2 - 16 kHz
(+) | ausgeglichene Hochtöne, vom Median nur 2% abweichend
(+) | sehr lineare Hochtöne (3.6% Delta zum Vorgänger)
Gesamt im hörbaren Bereich 100 - 16.000 Hz
(±) | hörbarer Bereich ist durchschnittlich linear (17.9% Abstand zum Median)
Im Vergleich zu allen Geräten derselben Klasse
» 54% aller getesteten Geräte dieser Klasse waren besser, 9% vergleichbar, 37% schlechter
» Das beste Gerät hat einen Delta-Wert von 6%, durchschnittlich ist 18%, das schlechteste Gerät hat 132%
Im Vergleich zu allen Geräten im Test
» 37% aller getesteten Geräte waren besser, 8% vergleichbar, 55% schlechter
» Das beste Gerät hat einen Delta-Wert von 4%, durchschnittlich ist 24%, das schlechteste Gerät hat 134%
HP Omen 15-ek0456ng Audio Analyse
(-) | Nicht sonderlich laut spielende Lautsprecher (58.1 dB)
Bass 100 - 315 Hz
(-) | kaum Bass - 17.3% niedriger als der Median
(±) | durchschnittlich lineare Bass-Wiedergabe (13% Delta zum Vorgänger)
Mitteltöne 400 - 2000 Hz
(+) | ausgeglichene Mitten, vom Median nur 3.4% abweichend
(±) | Linearität der Mitten ist durchschnittlich (9.7% Delta zum Vorgänger)
Hochtöne 2 - 16 kHz
(+) | ausgeglichene Hochtöne, vom Median nur 3.2% abweichend
(+) | sehr lineare Hochtöne (5.4% Delta zum Vorgänger)
Gesamt im hörbaren Bereich 100 - 16.000 Hz
(±) | hörbarer Bereich ist durchschnittlich linear (22% Abstand zum Median)
Im Vergleich zu allen Geräten derselben Klasse
» 79% aller getesteten Geräte dieser Klasse waren besser, 6% vergleichbar, 15% schlechter
» Das beste Gerät hat einen Delta-Wert von 6%, durchschnittlich ist 18%, das schlechteste Gerät hat 132%
Im Vergleich zu allen Geräten im Test
» 63% aller getesteten Geräte waren besser, 6% vergleichbar, 30% schlechter
» Das beste Gerät hat einen Delta-Wert von 4%, durchschnittlich ist 24%, das schlechteste Gerät hat 134%
Energieverwaltung - Laufzeitstark
Energieaufnahme
Da das Notebook eine Grafikumschaltung bietet und Acer bei der vorliegenden Ausstattung keine High-End-Hardware nutzt, hält sich der Energieverbrauch mit 4 bis 15 Watt (Idle) respektive 85 bis 135 Watt (Load) in Grenzen. Das 135-Watt-Netzteil scheint ausreichend dimensioniert zu sein.
| Aus / Standby | |
| Idle | |
| Last |
|
Legende:
min: | |
| Acer Nitro 5 AN517-53-54DQ i5-11300H, GeForce RTX 3050 4GB Laptop GPU | HP Omen 15-ek0456ng i5-10300H, GeForce GTX 1660 Ti Mobile | Lenovo Legion 5 17IMH05 i5-10300H, GeForce GTX 1650 Mobile | MSI GF75 Thin 10SCXR i5-10300H, GeForce GTX 1650 Mobile | Asus TUF FX705DT-AU068T R5 3550H, GeForce GTX 1650 Mobile | Durchschnitt der Klasse Gaming | |
|---|---|---|---|---|---|---|
| Stromverbrauch | -49% | 13% | -57% | 17% | -104% | |
| Idle min * (Watt) | 4 | 9.2 -130% | 2 50% | 13 -225% | 3.9 2% | 13.3 ? -233% |
| Idle avg * (Watt) | 9 | 14.6 -62% | 8 11% | 15.7 -74% | 9.6 -7% | 19 ? -111% |
| Idle max * (Watt) | 15 | 18.1 -21% | 16 -7% | 21 -40% | 12.2 19% | 24.5 ? -63% |
| Last avg * (Watt) | 85 | 84 1% | 58 32% | 87 -2% | 59 31% | 108.1 ? -27% |
| Witcher 3 ultra * (Watt) | 104 | 142 -37% | 89 14% | 96.4 7% | ||
| Last max * (Watt) | 135 | 194 -44% | 169 -25% | 145.8 -8% | 80 41% | 254 ? -88% |
* ... kleinere Werte sind besser
Energieaufnahme Witcher 3 / Stresstest
Akkulaufzeit
Eines der größten Highlights des getesteten Nitro 5 ist die üppige Laufzeit. Trotz der nur mittelprächtigen Akkukapazität von 57 Wh (die Konkurrenz besitzt 51 – 80 Wh) hält der 17-Zöller unter perfekten Bedingungen, sprich minimaler Displayleuchtkraft und keiner Auslastung, über 17 Stunden durch. Dieser Wert ist für einen Gaming-Laptop ebenso respektabel wie rund 7 Stunden Internetsurfen per WLAN bei mittlerer Displayhelligkeit.
| Acer Nitro 5 AN517-53-54DQ i5-11300H, GeForce RTX 3050 4GB Laptop GPU, 57 Wh | HP Omen 15-ek0456ng i5-10300H, GeForce GTX 1660 Ti Mobile, 70.91 Wh | Lenovo Legion 5 17IMH05 i5-10300H, GeForce GTX 1650 Mobile, 80 Wh | MSI GF75 Thin 10SCXR i5-10300H, GeForce GTX 1650 Mobile, 51 Wh | Asus TUF FX705DT-AU068T R5 3550H, GeForce GTX 1650 Mobile, 64 Wh | Durchschnitt der Klasse Gaming | |
|---|---|---|---|---|---|---|
| Akkulaufzeit | -7% | 38% | -37% | 12% | -16% | |
| Idle (h) | 17.4 | 11.7 -33% | 23.3 34% | 7.7 -56% | 13.6 -22% | 8.71 ? -50% |
| WLAN (h) | 7.2 | 6.5 -10% | 11.4 58% | 4.7 -35% | 7.8 8% | 7.01 ? -3% |
| Last (h) | 1.4 | 1.7 21% | 1.7 21% | 1.1 -21% | 2.1 50% | 1.47 ? 5% |
| H.264 (h) | 6.4 | 14.3 | 8.1 | 8.26 ? |
Pro
Contra
Fazit - Gute Gesamtvorstellung

Das Acer Nitro 5 AN517-53-54DQ ist eine gute Wahl für preisbewusste Spieler, die maximal 1.000 Euro für ein Gaming-Notebook ausgeben wollen.
Das 17-Zoll-Gerät bietet – abseits der etwas unglücklichen Speicherkonfiguration (Single-Channel, Single-Rank) – eine ausgewogene Hardware-Mischung, welche die meisten aktuellen Games flüssig in hohen bis maximalen Details darstellen kann, sofern man die native Auflösung von 1.920 x 1.080 verwendet.
Der Core i5-11300H und die GeForce RTX 3050 Laptop GPU bilden ein gelungenes und preis-leistungsmäßig ansprechendes Team.
Das Display hinterlässt eher gemischte Gefühle. Auf der einen Seite gefallen der Kontrast und der Schwarzwert, auf der anderen Seite könnten der Farbraum und die Helligkeit deutlich besser sein. Die restlichen Aspekte (Anschlüsse, Gehäusequalität, Eingabegeräte usw.) stechen kaum aus der Masse hervor und bewegen sich überwiegend im Mittelfeld. Zu den wenigen Alleinstellungsmerkmalen gehört die recht üppige Akkulaufzeit mit ca. 7 Stunden beim Internetsurfen.
Aktuelle Gegenspieler auf RTX-3050- oder 3050-Ti-Basis sind nicht zuletzt aufgrund der immer noch herrschenden Chip-Knappheit eher rar gesät bzw. kaum verfügbar, dürften sich in den kommenden Wochen und Monaten allerdings immer häufiger zeigen.
Preis und Verfügbarkeit
Das Acer Nitro 5 AN517-53-54DQ ist derzeit für 999 Euro bei notebooksbilliger.de erhältlich.
Acer Nitro 5 AN517-53-54DQ
- 11.08.2021 v7 (old)
Sebastian Jentsch
Preisvergleich
