MSI Vector GP66 12UGS im Laptop-Test: GeForce RTX 3070 Ti mit 150 W beeindruckt
Als einer der ersten großen Hersteller brachte MSI die ersten Gaming-Laptops mit Intel Gen12 Alder Lake-H auf den Markt. Obwohl die neuen Modelle ihren Gen11-Vorgängern äußerlich stark ähneln, sind sie nun mit neuen CPUs, neuer GPU und einem neuen Display ausgestattet, was Enthusiasten sicher freuen wird.
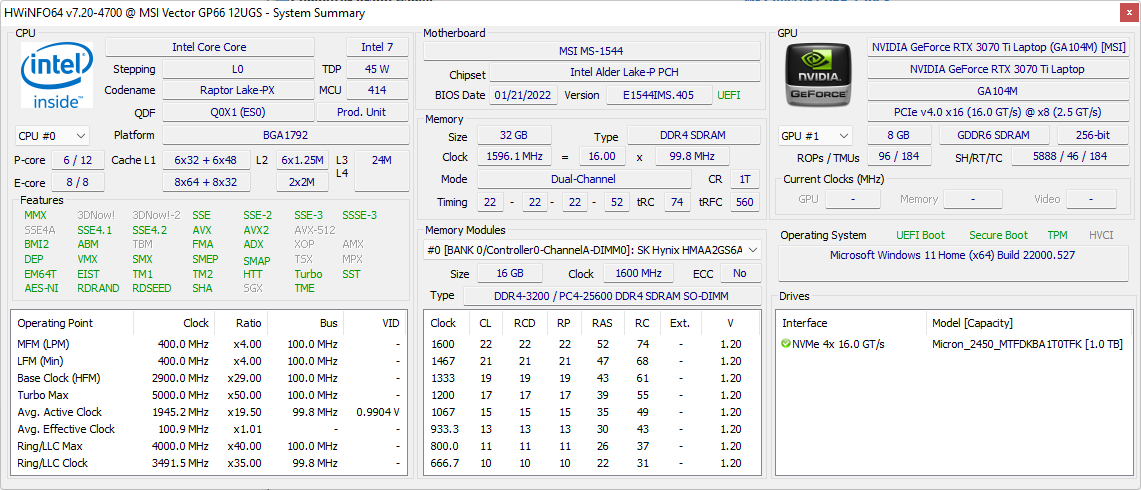
Unser Testmodell ist nennt dich Vector GP66 und tritt quasi die Nachfolge des GP66 Leopard aus dem letzten Jahr an. Unsere Konfiguration beherbergt einen Core i9-12900H, eine GeForce RTX 3070 Ti mit einer TGP von 150 W, 32 GB RAM, ein 360-Hz-1080p-IPS-Display sowie eine 1-TB-NVMe-SSD und kann für etwa 2.800 Euro erworben werden. Andere Ausstattungen kommen hingegen wahlweise mit einer RTX 3060, einer RTX 3080, einem QHD-165-Hz- oder FHD-144-Hz-Display, oder einem Core i7-12700H.
Alternativen zum MSI Vector sehen wir in anderen 15-Zoll-Gaming-Laptops der Mittelklasse wie beispielsweise dem Asus ROG Strix, dem Razer Blade 15 Base Model, dem Dell G15 oder dem Lenovo Legion S7. Das MSI Vector darf man übrigens nicht mit dem Maingear Vector (Test auf englisch) verwechseln.
Weitere MSI-Tests:
Potentielle Konkurrenten im Vergleich
Bew. | Datum | Modell | Gewicht | Dicke | Größe | Auflösung | Preis ab |
|---|---|---|---|---|---|---|---|
| 86.9 % v7 (old) | 03 / 2022 | MSI Vector GP66 12UGS i9-12900H, GeForce RTX 3070 Ti Laptop GPU | 2.3 kg | 23.4 mm | 15.60" | 1920x1080 | |
| 85.4 % v7 (old) | 12 / 2021 | MSI GP66 Leopard 11UH-028 i7-11800H, GeForce RTX 3080 Laptop GPU | 2.3 kg | 23.4 mm | 15.60" | 1920x1080 | |
| 79.2 % v7 (old) | 09 / 2021 | MSI Katana GF66 11UG-220 i7-11800H, GeForce RTX 3070 Laptop GPU | 2.3 kg | 25 mm | 15.60" | 1920x1080 | |
| 85.9 % v7 (old) | 06 / 2021 | Asus TUF Gaming F15 FX506HM i7-11800H, GeForce RTX 3060 Laptop GPU | 2.3 kg | 24.9 mm | 15.60" | 1920x1080 | |
| 85.5 % v7 (old) | 03 / 2021 | Razer Blade 15 Base Edition 2021, i7-10750H RTX 3060 i7-10750H, GeForce RTX 3060 Laptop GPU | 2.1 kg | 19.9 mm | 15.60" | 1920x1080 | |
| 84.7 % v7 (old) | 06 / 2021 | Alienware m15 R5 Ryzen Edition R7 5800H, GeForce RTX 3060 Laptop GPU | 2.5 kg | 22.85 mm | 15.60" | 1920x1080 |
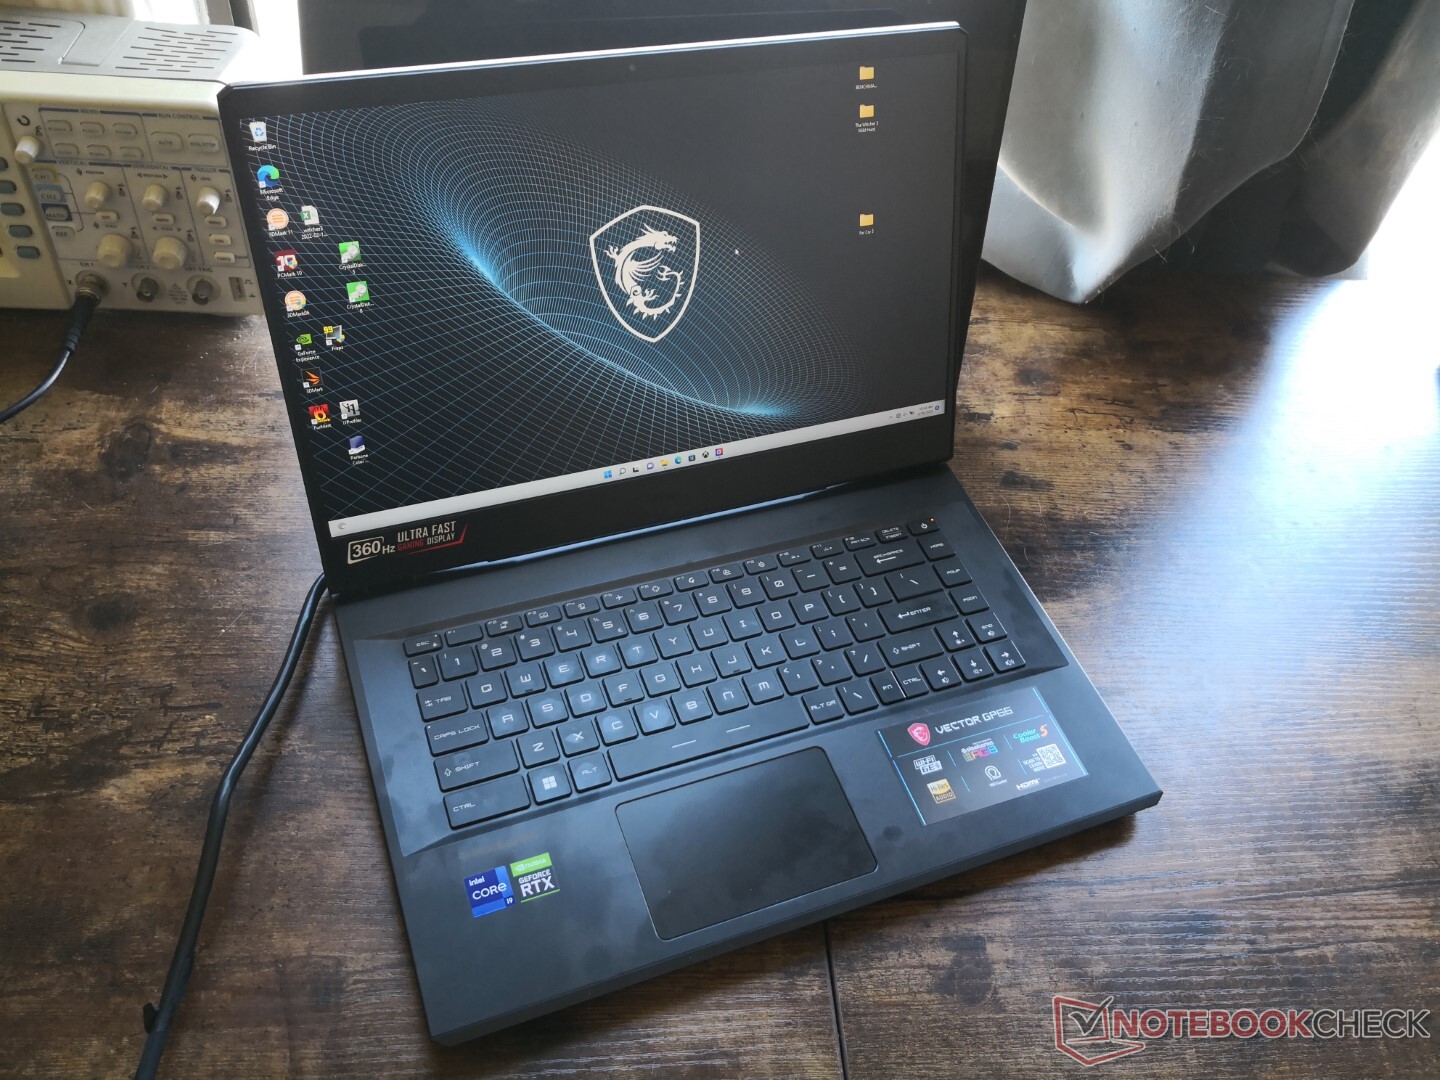
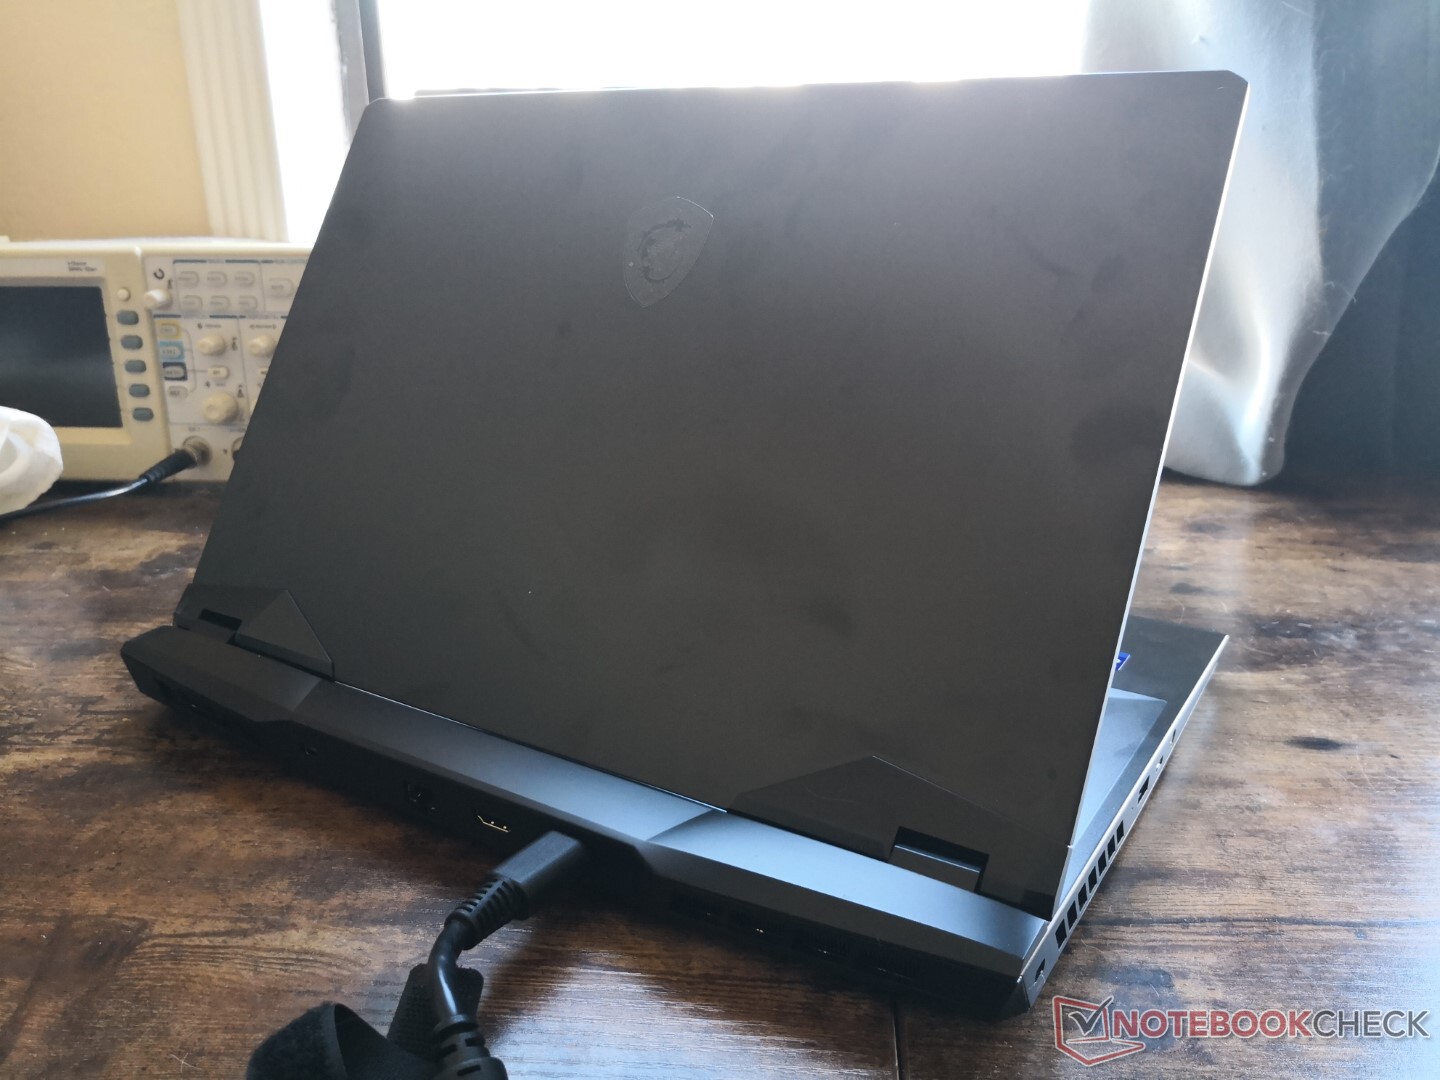
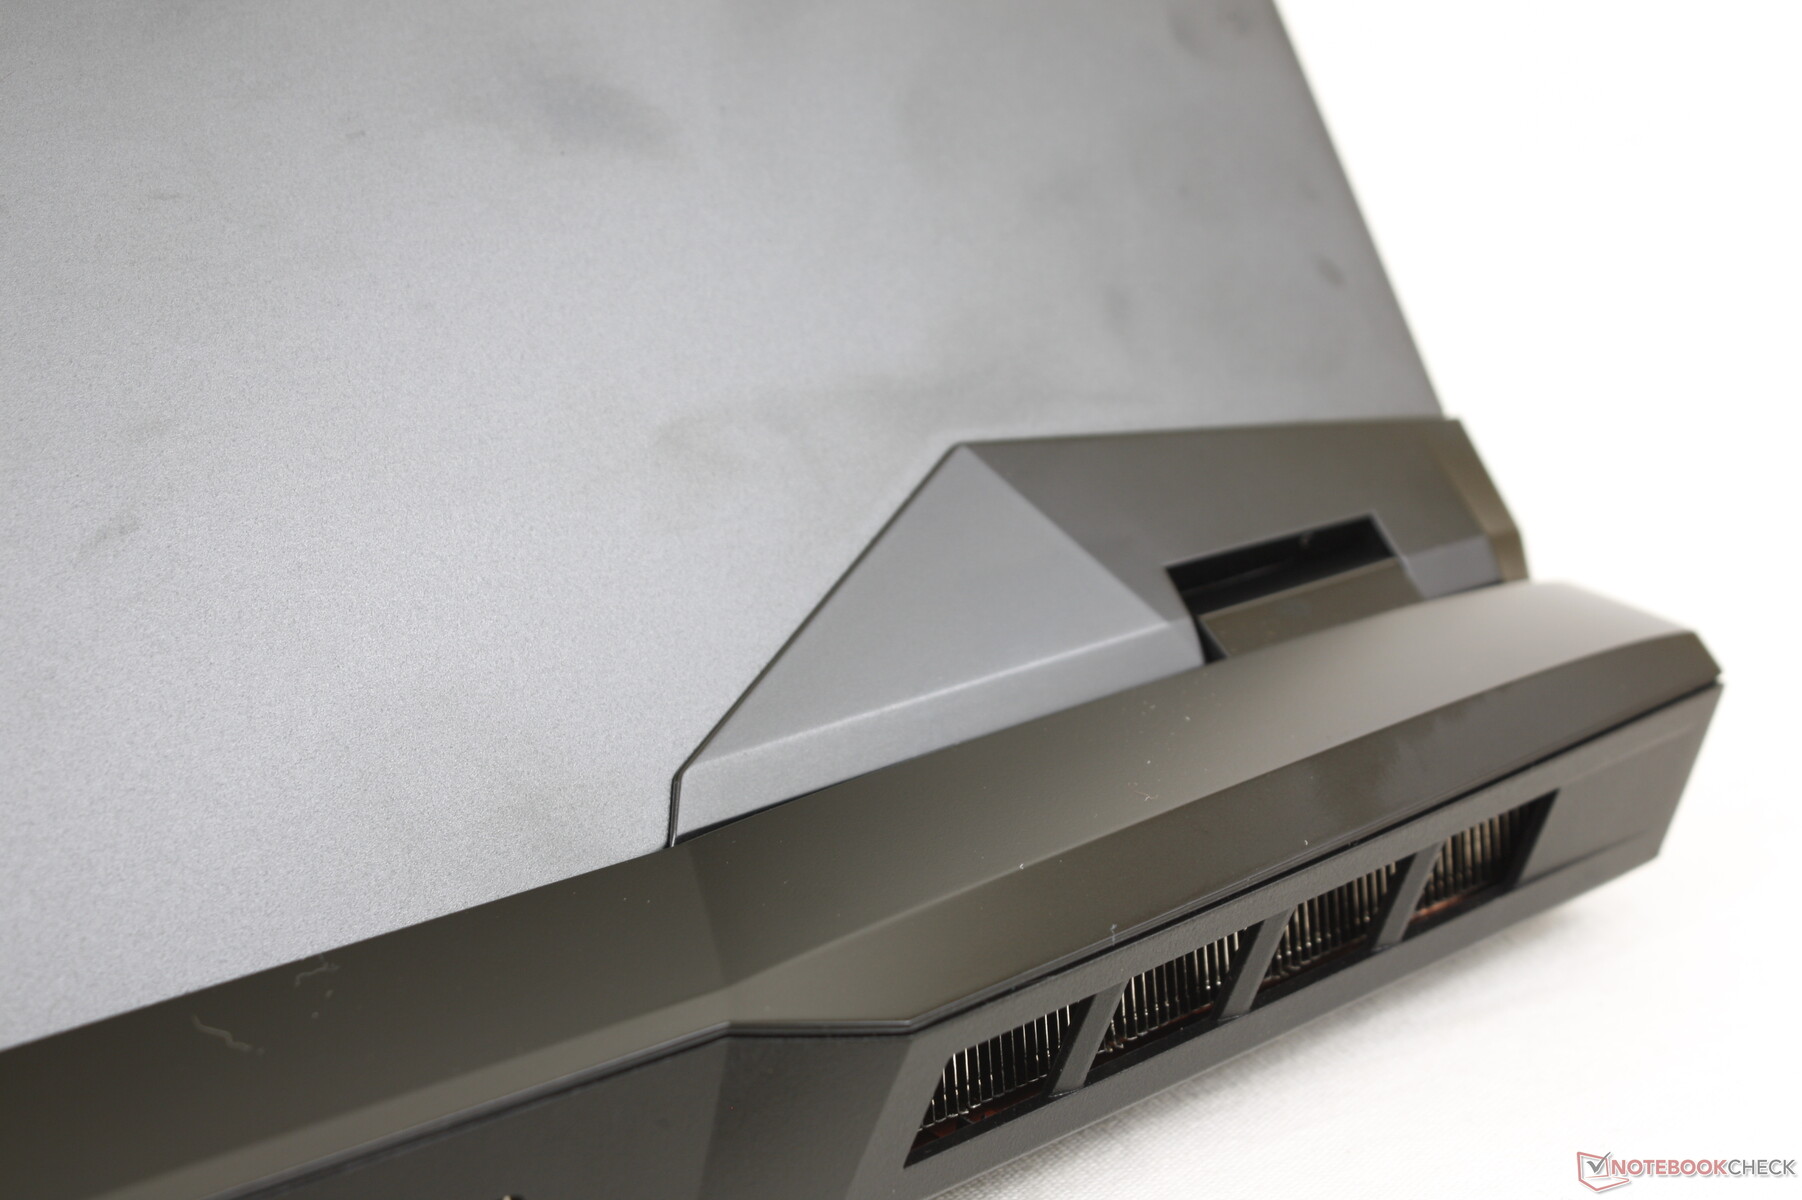
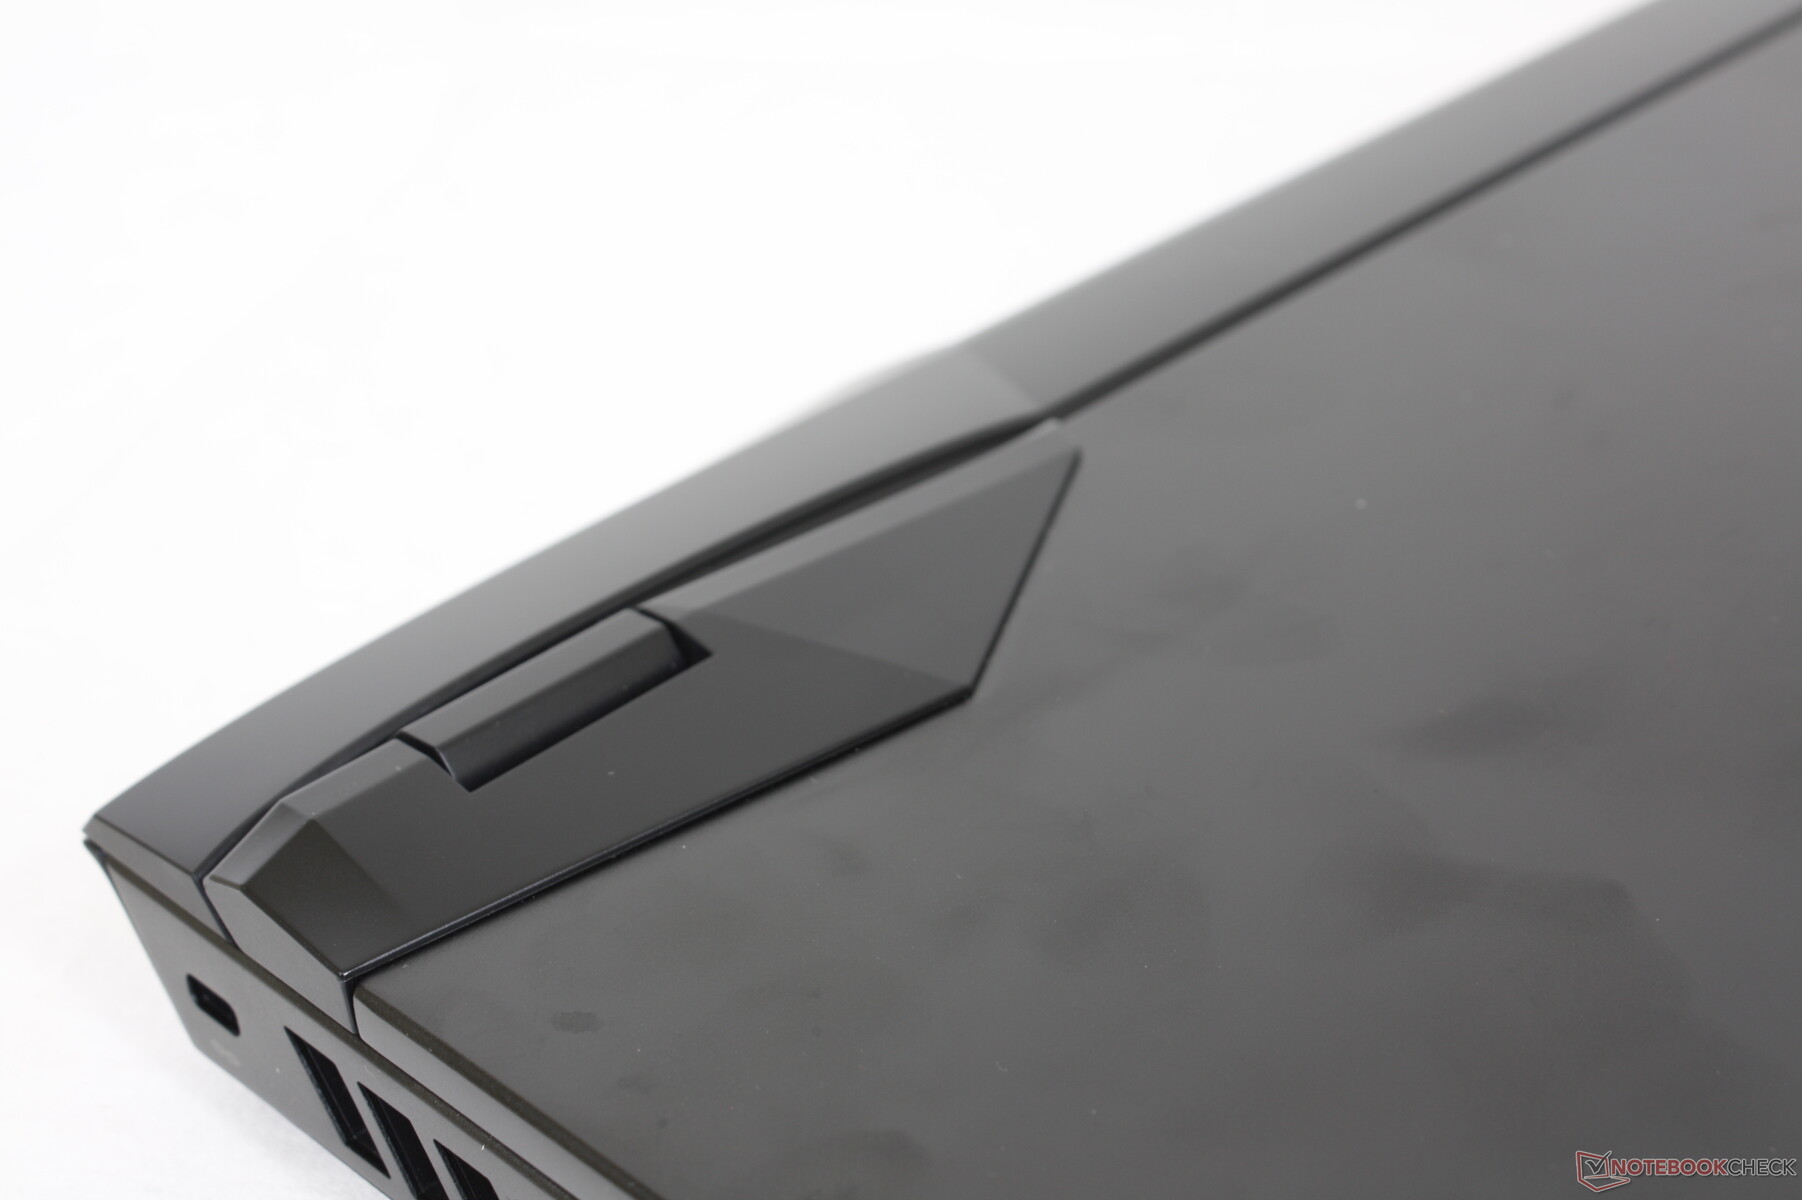
Gehäuse - Wenig Änderungen
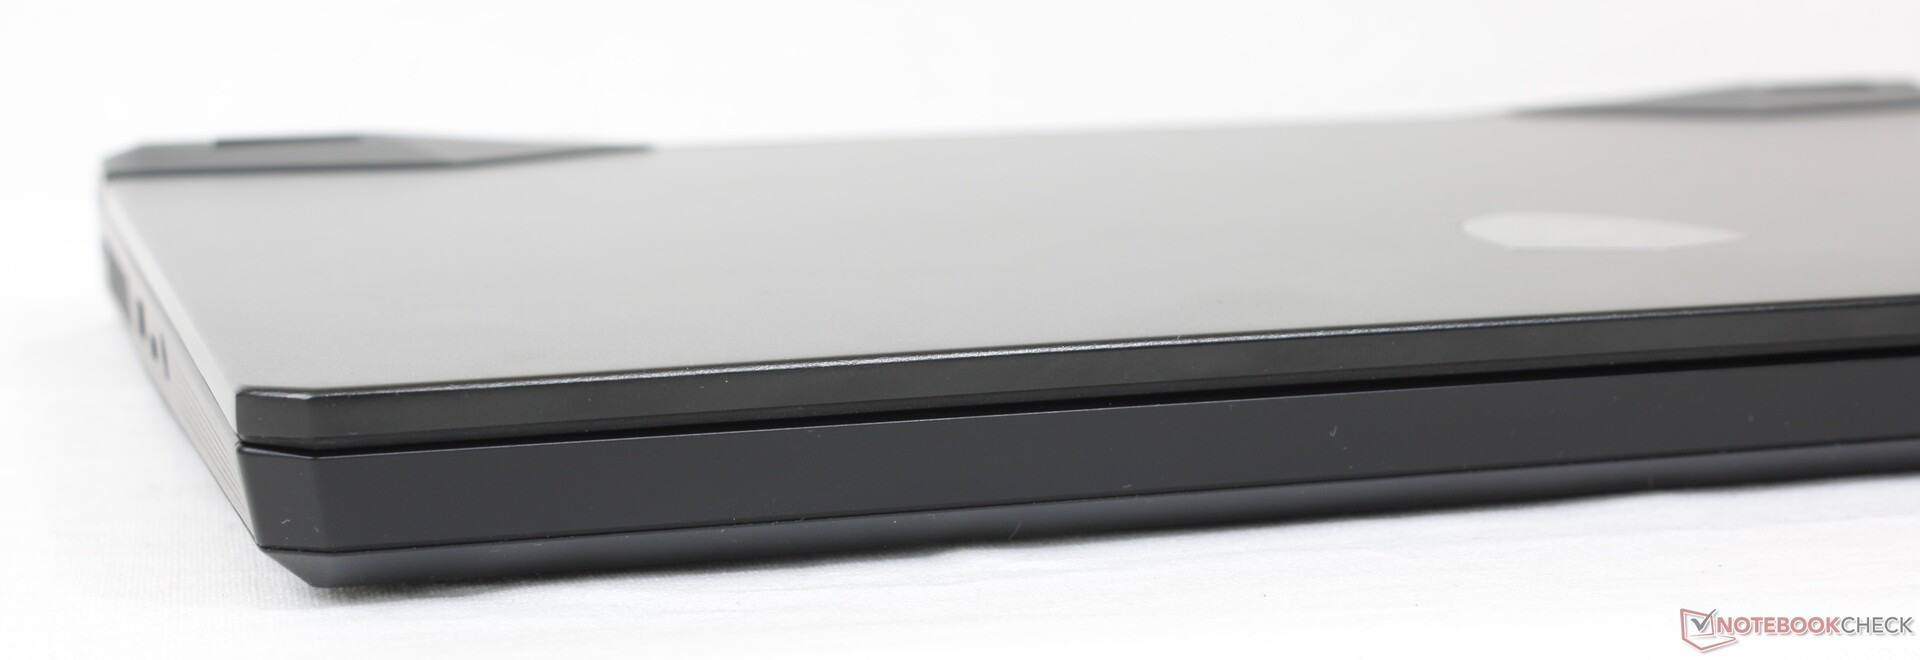
MSI hat dem GP66 gerade erst Anfang letzten Jahres ein Redesign verpasst, sodass es jetzt noch zu früh ist für erneute optische Änderungen. Daher empfehlen wir unseren Test des GP66 mit Intel-Gen10-CPU sowie den Test des GP66 Intel-Gen11-CPU, die meisten Angaben zum Gehäuse treffen auch für unser Gen12-Modell noch zu. Nur bei den Anschlüssen gibt es leichte Änderungen, auf die werden wir im nächsten Kapitel eingehen.
Durch die Absenz wesentlicher Veränderungen am Gehäuse leidet das 2022er Vector GP66 an den gleichen Nachteilen wie das 2021er GP66 Leopard. Beispielsweise kann sich die vordere Kante lockern oder ablösen, was nicht gerade zu einem guten Ersteindruck beiträgt. Ansonsten präsentiert sich das Design als ein Stück weit eleganterer und subtilerer Ableger der größeren GE- oder GT-Serien.
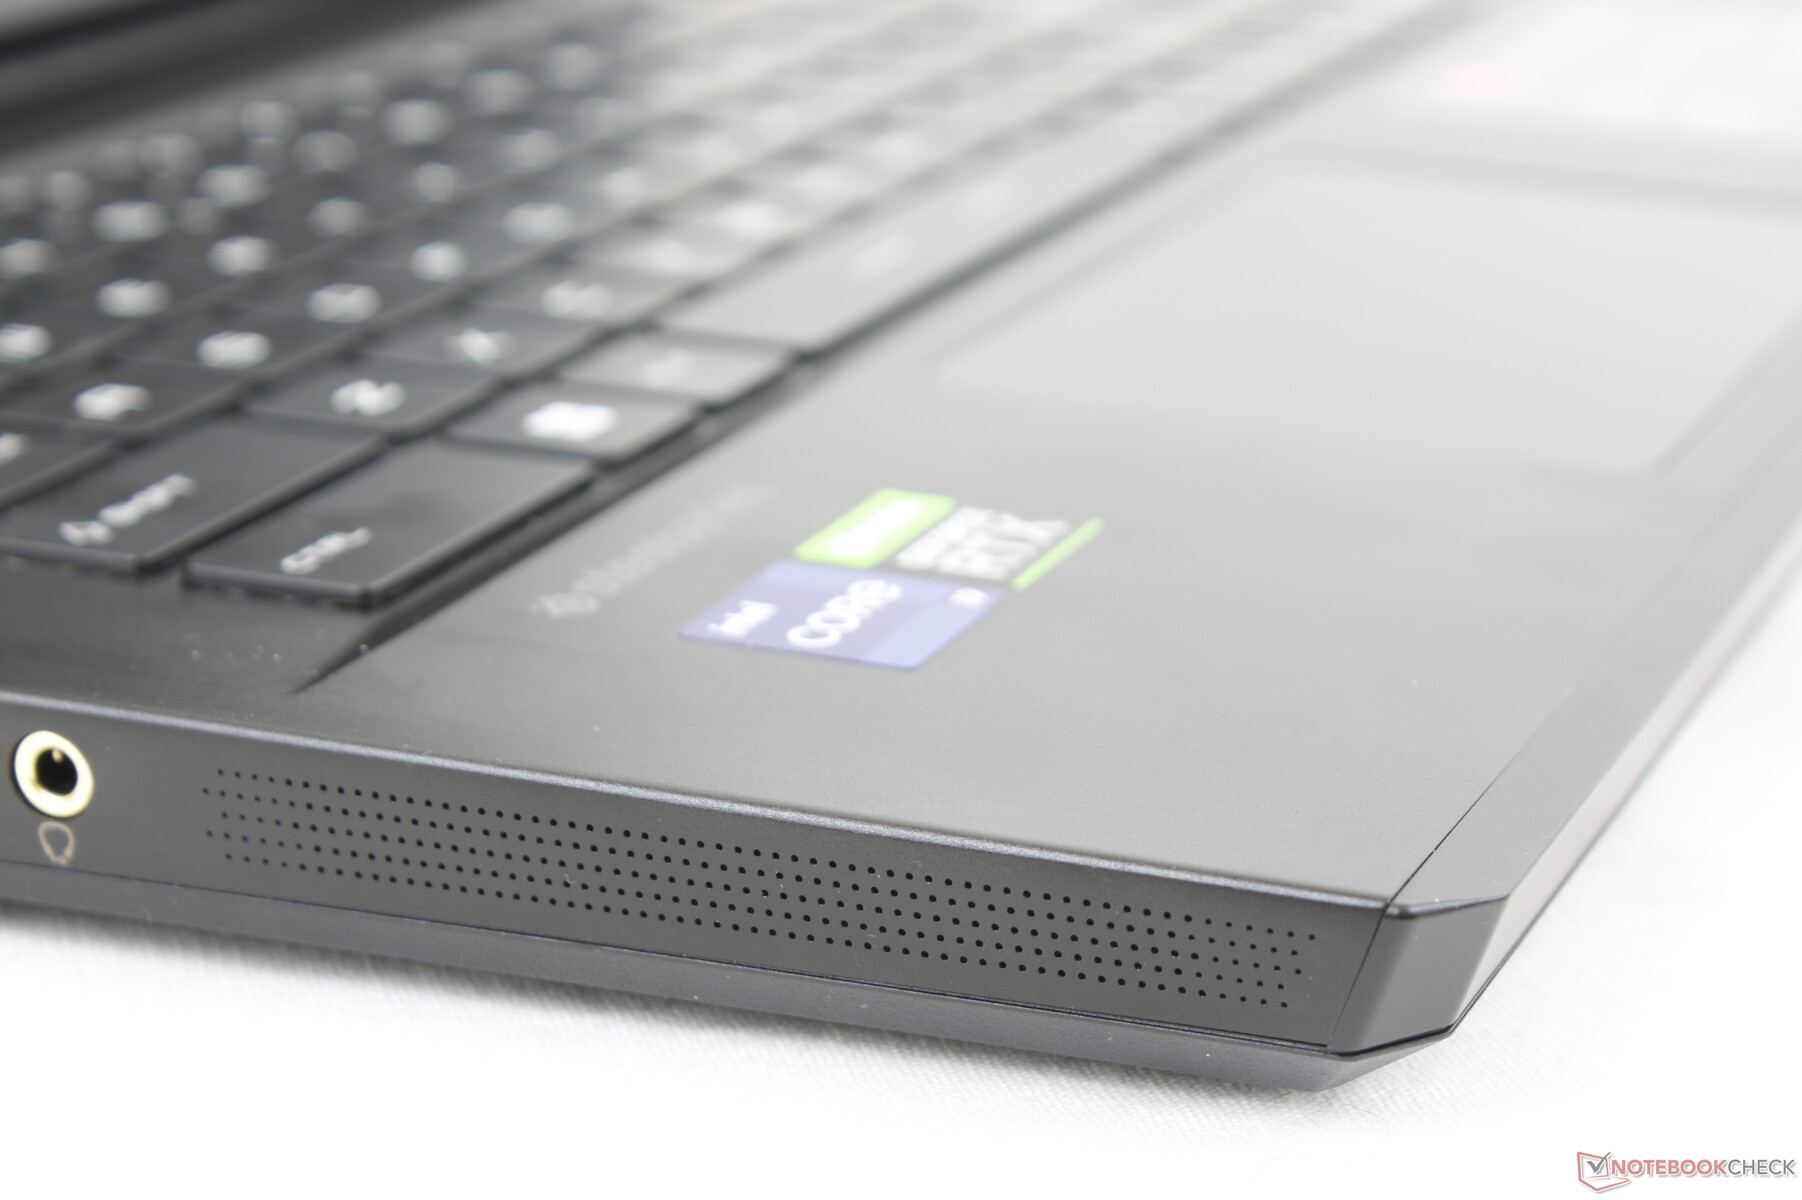
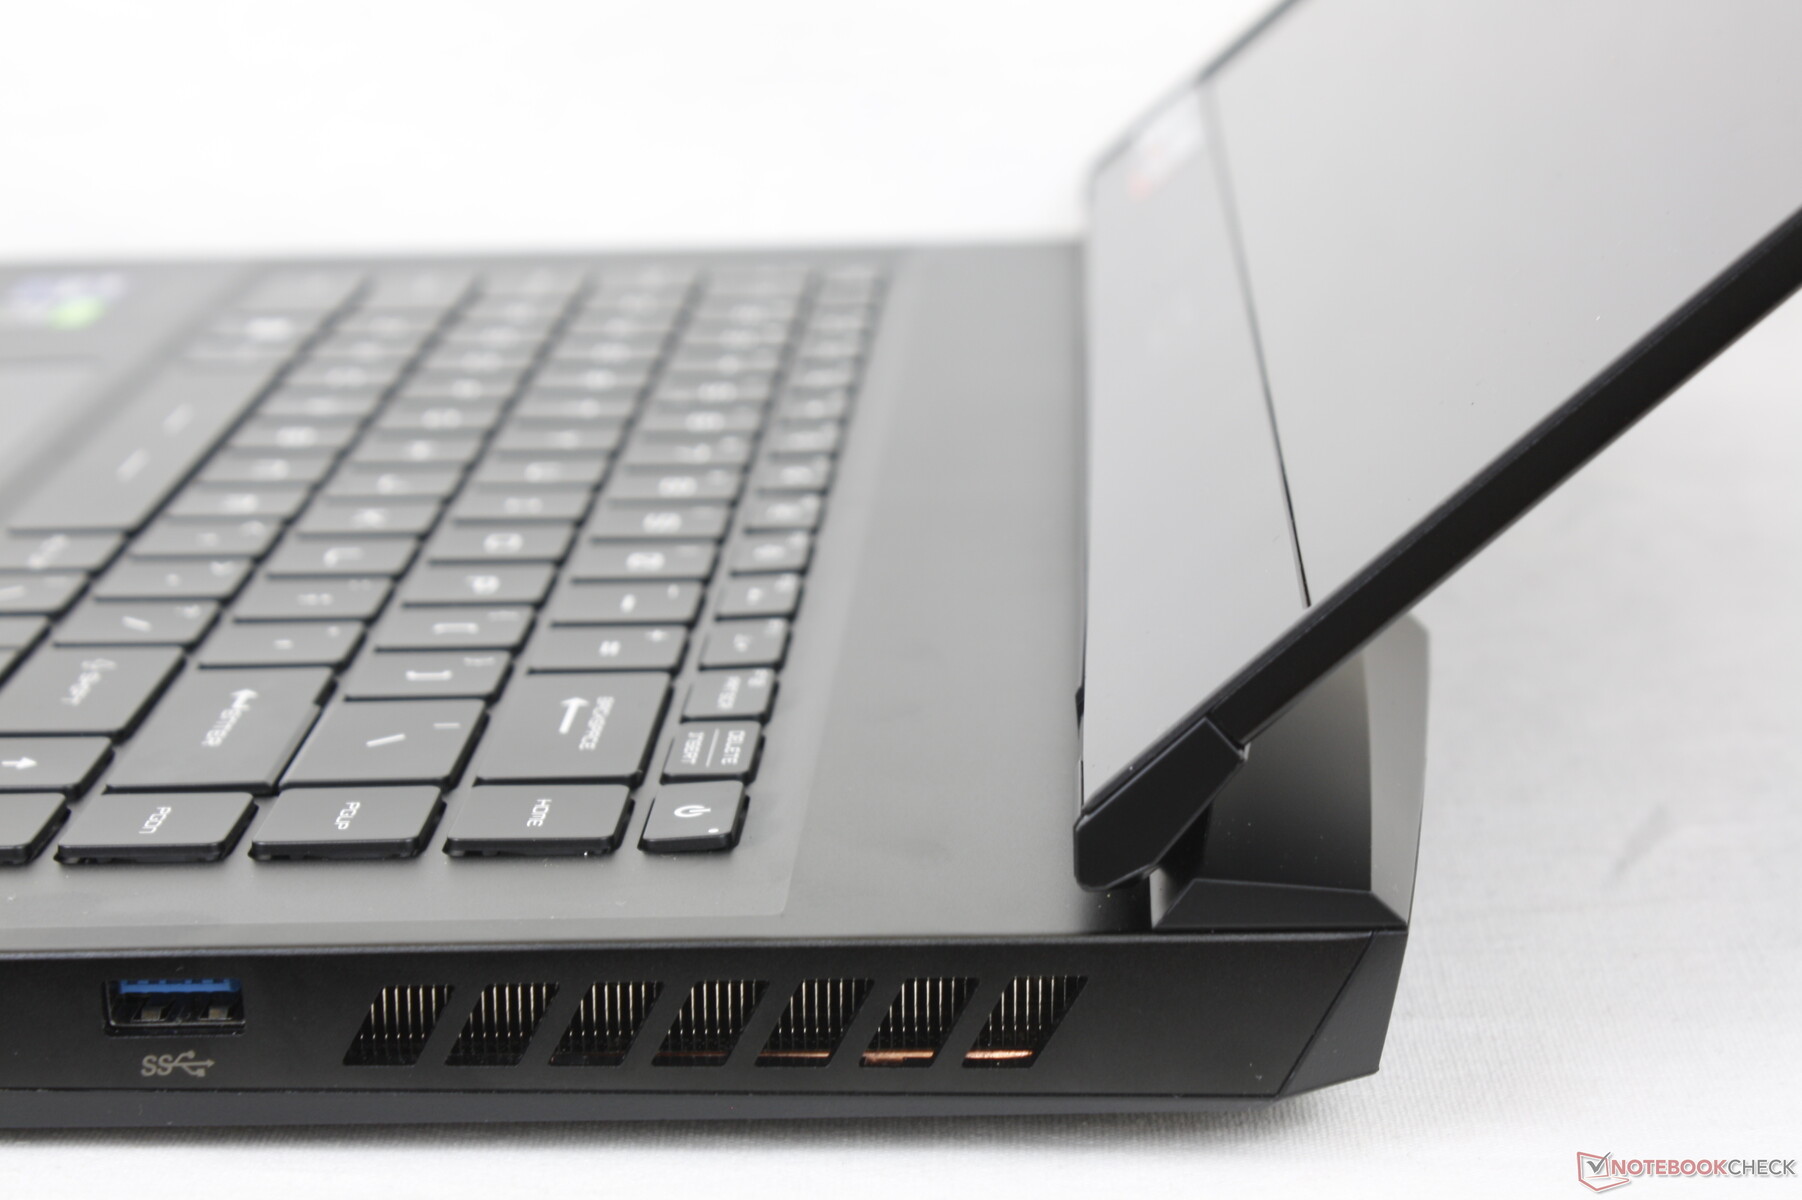
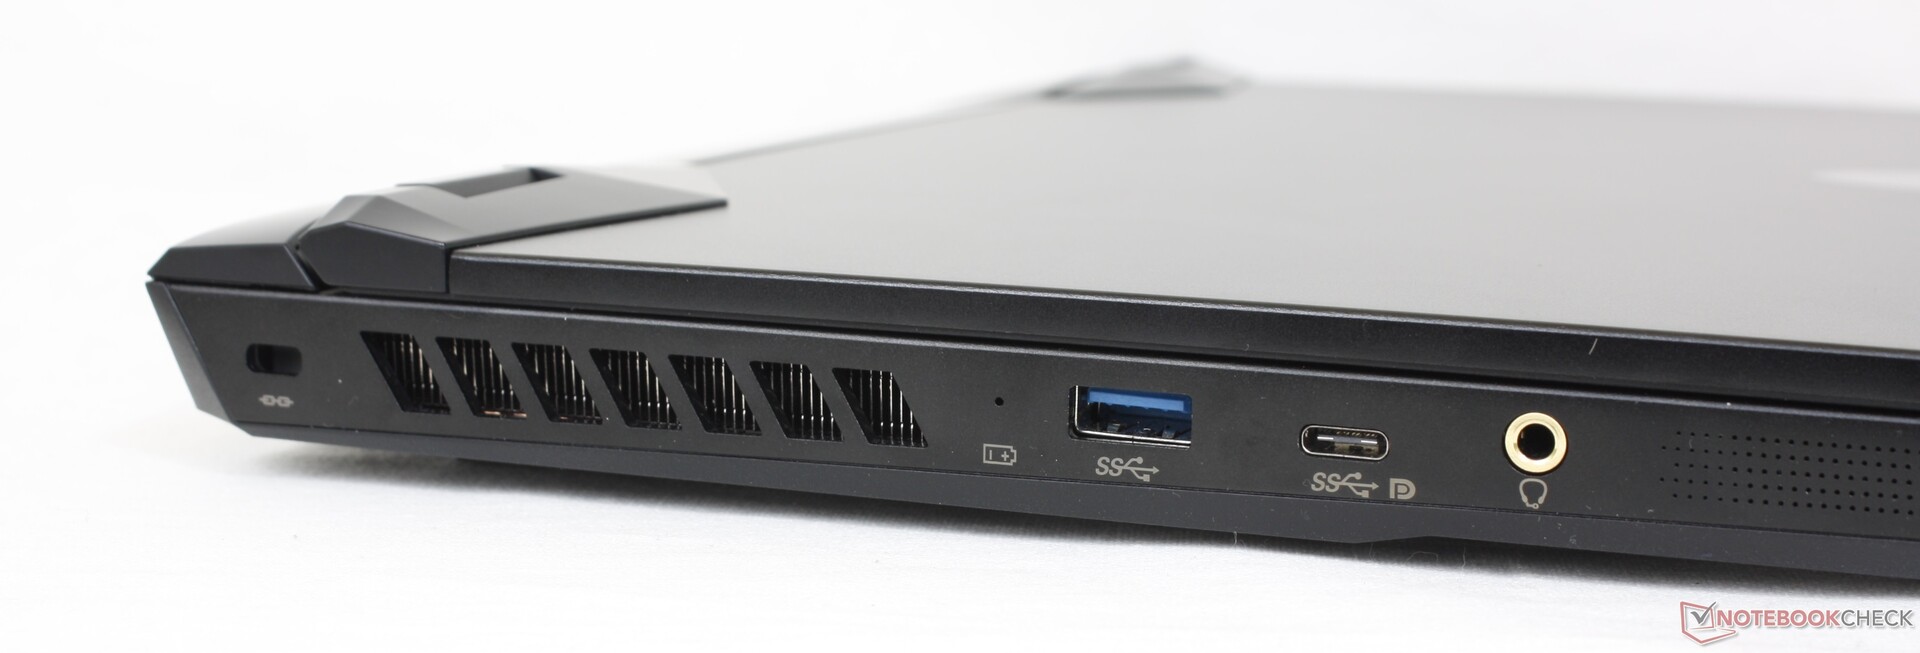
Anschlüsse - mit Displayport, ohne Thunderbolt
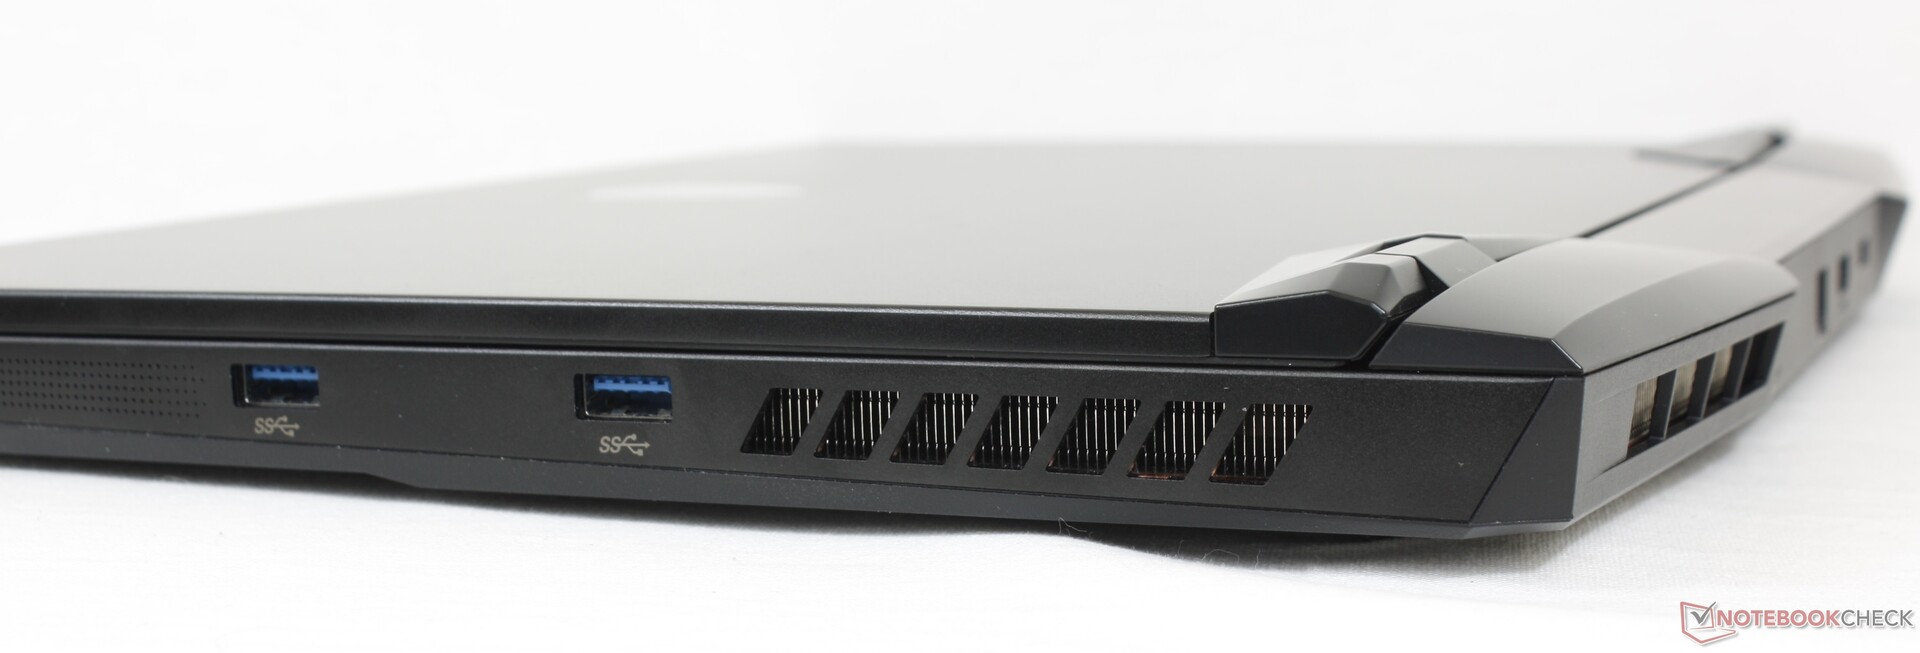
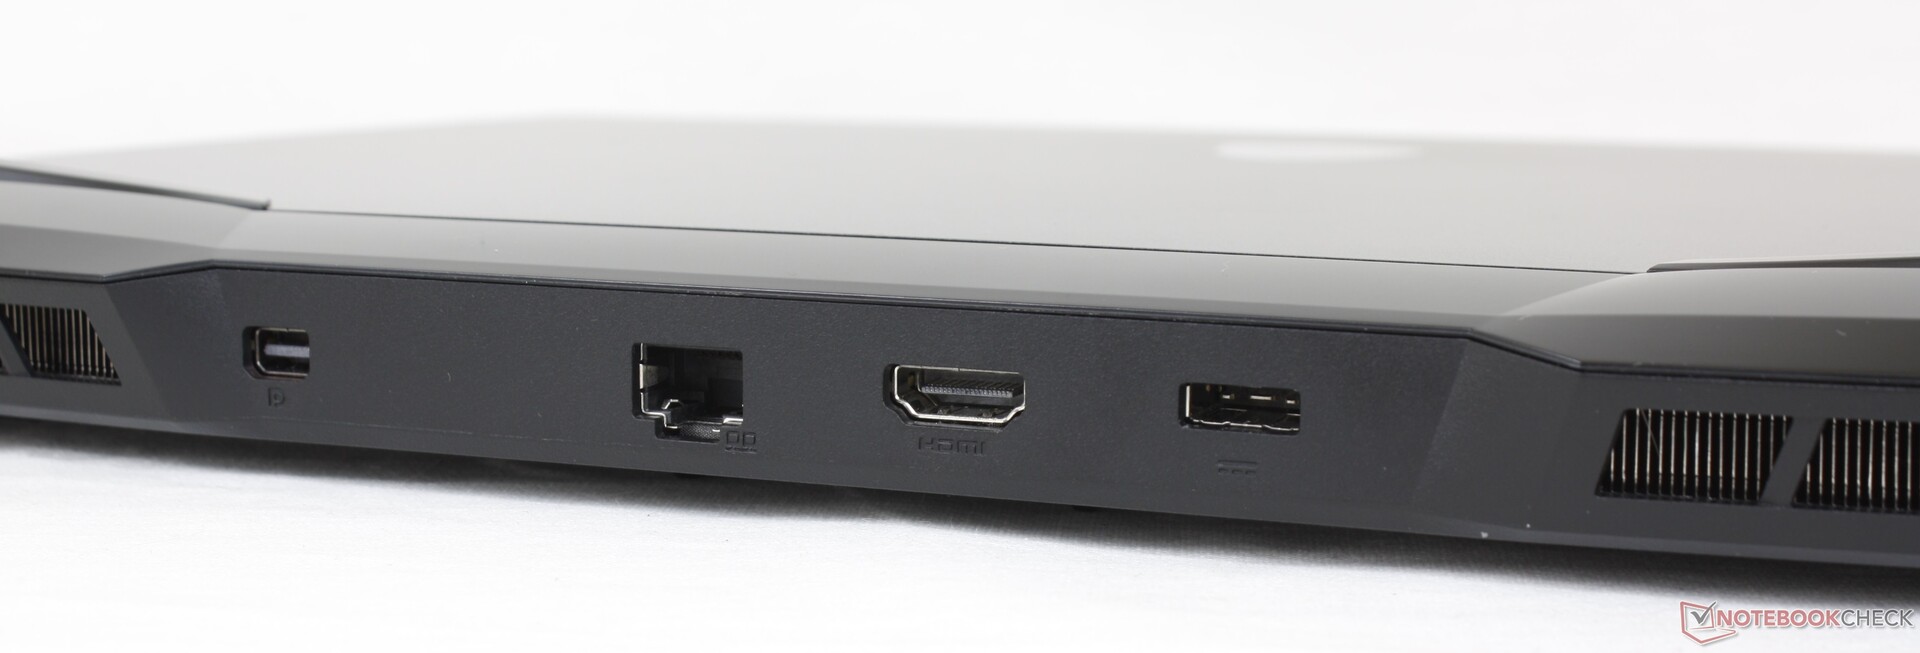
Hier gibt es leichte Unterschiede zum GP66 Leopard. Beispielsweise befindet sich der USB-C-Port beim GP66 Leopard auf der Rückseite, jetzt wandert er auf die linke Seite und ist somit leichter zu erreichen. Außerdem gibt es jetzt einen Mini-DisplayPort mit Unterstützung für Adaptive Sync.
Leider unterstützt der USB-C-Port weiterhin kein Thunderbolt. Dafür muss man schon zur etwas teureren GS-, GE- oder GT-Serie aufrüsten.
Kommunikation
Webcam
Die Kamera löst weiterhin nur mit 720p auf und bleibt ohne Support von IR oder Windows Hello. MSI-Laptops nutzen, anders als die meisten Ultrabooks und Business-Laptops, noch immer elektronische anstelle von physischen Shuttern.


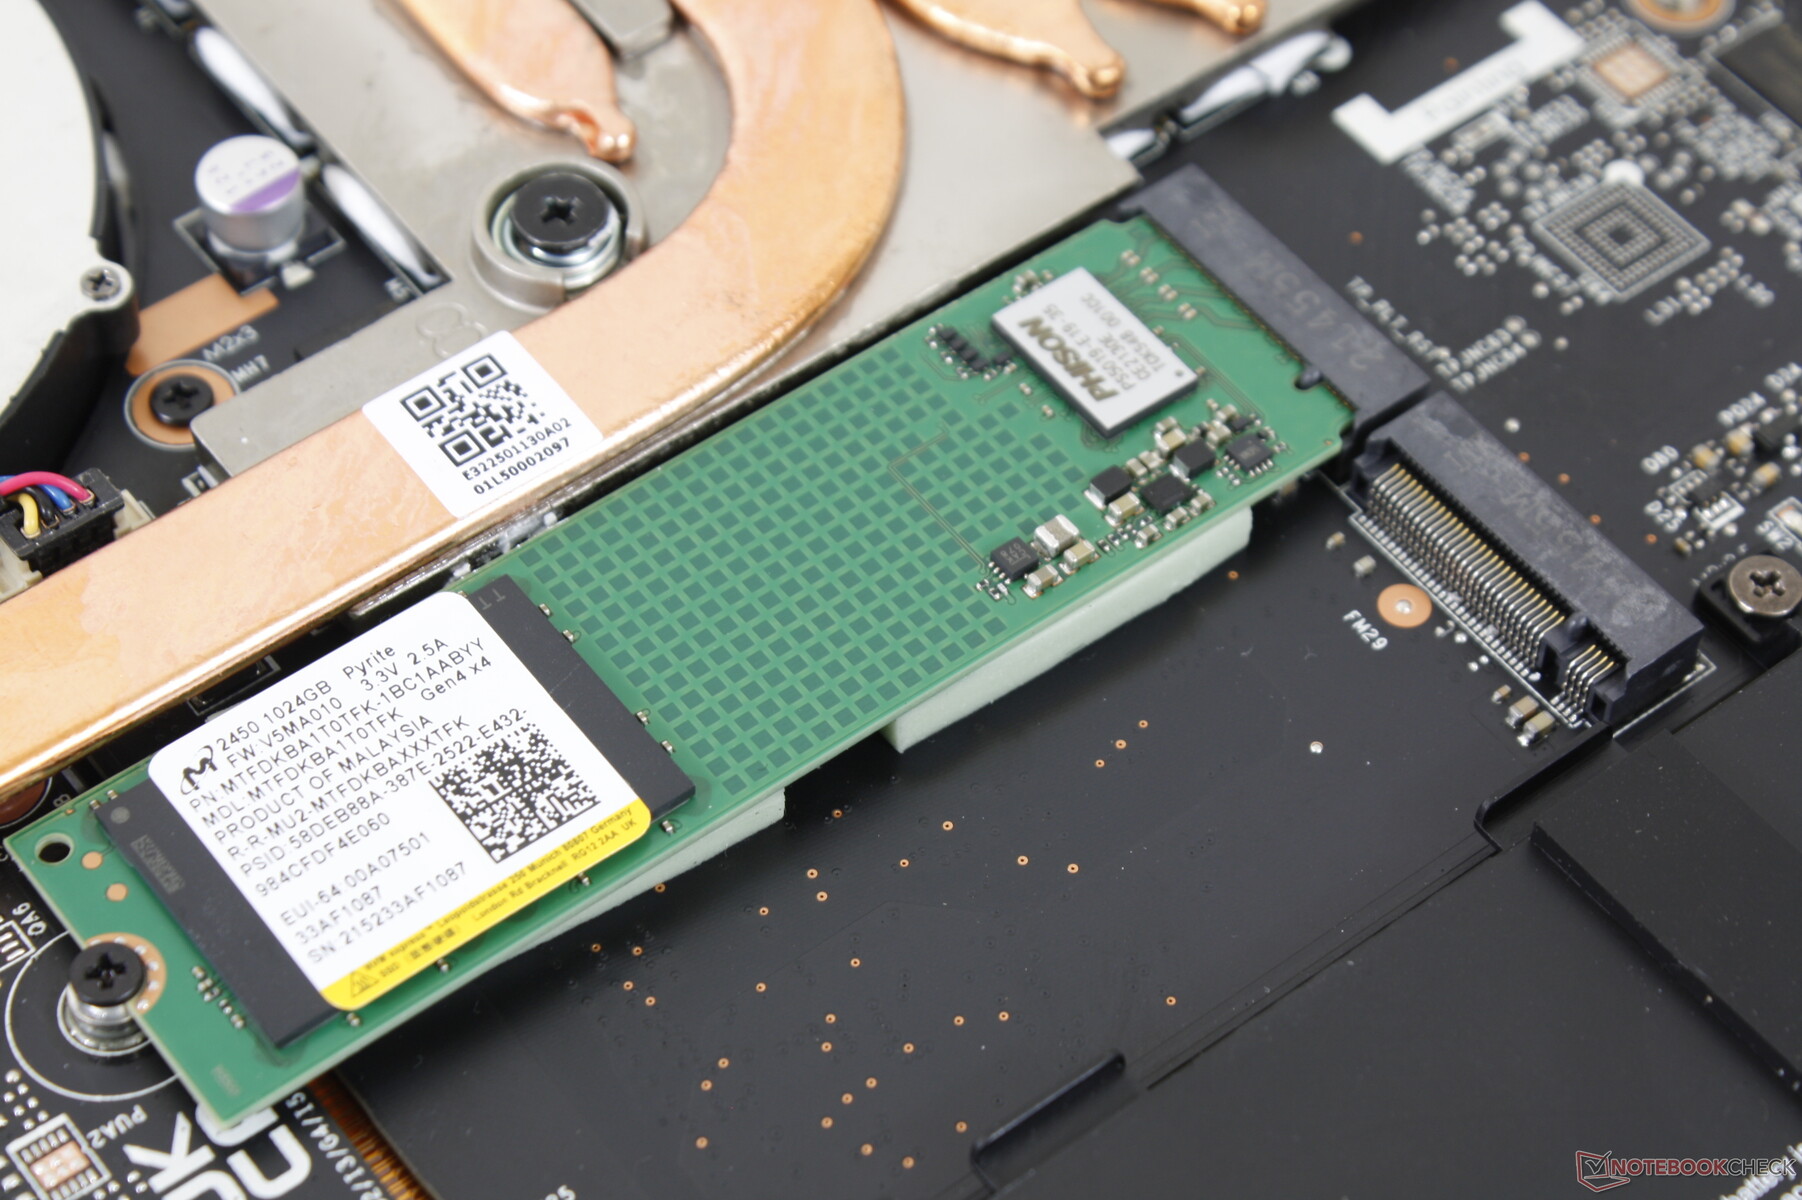
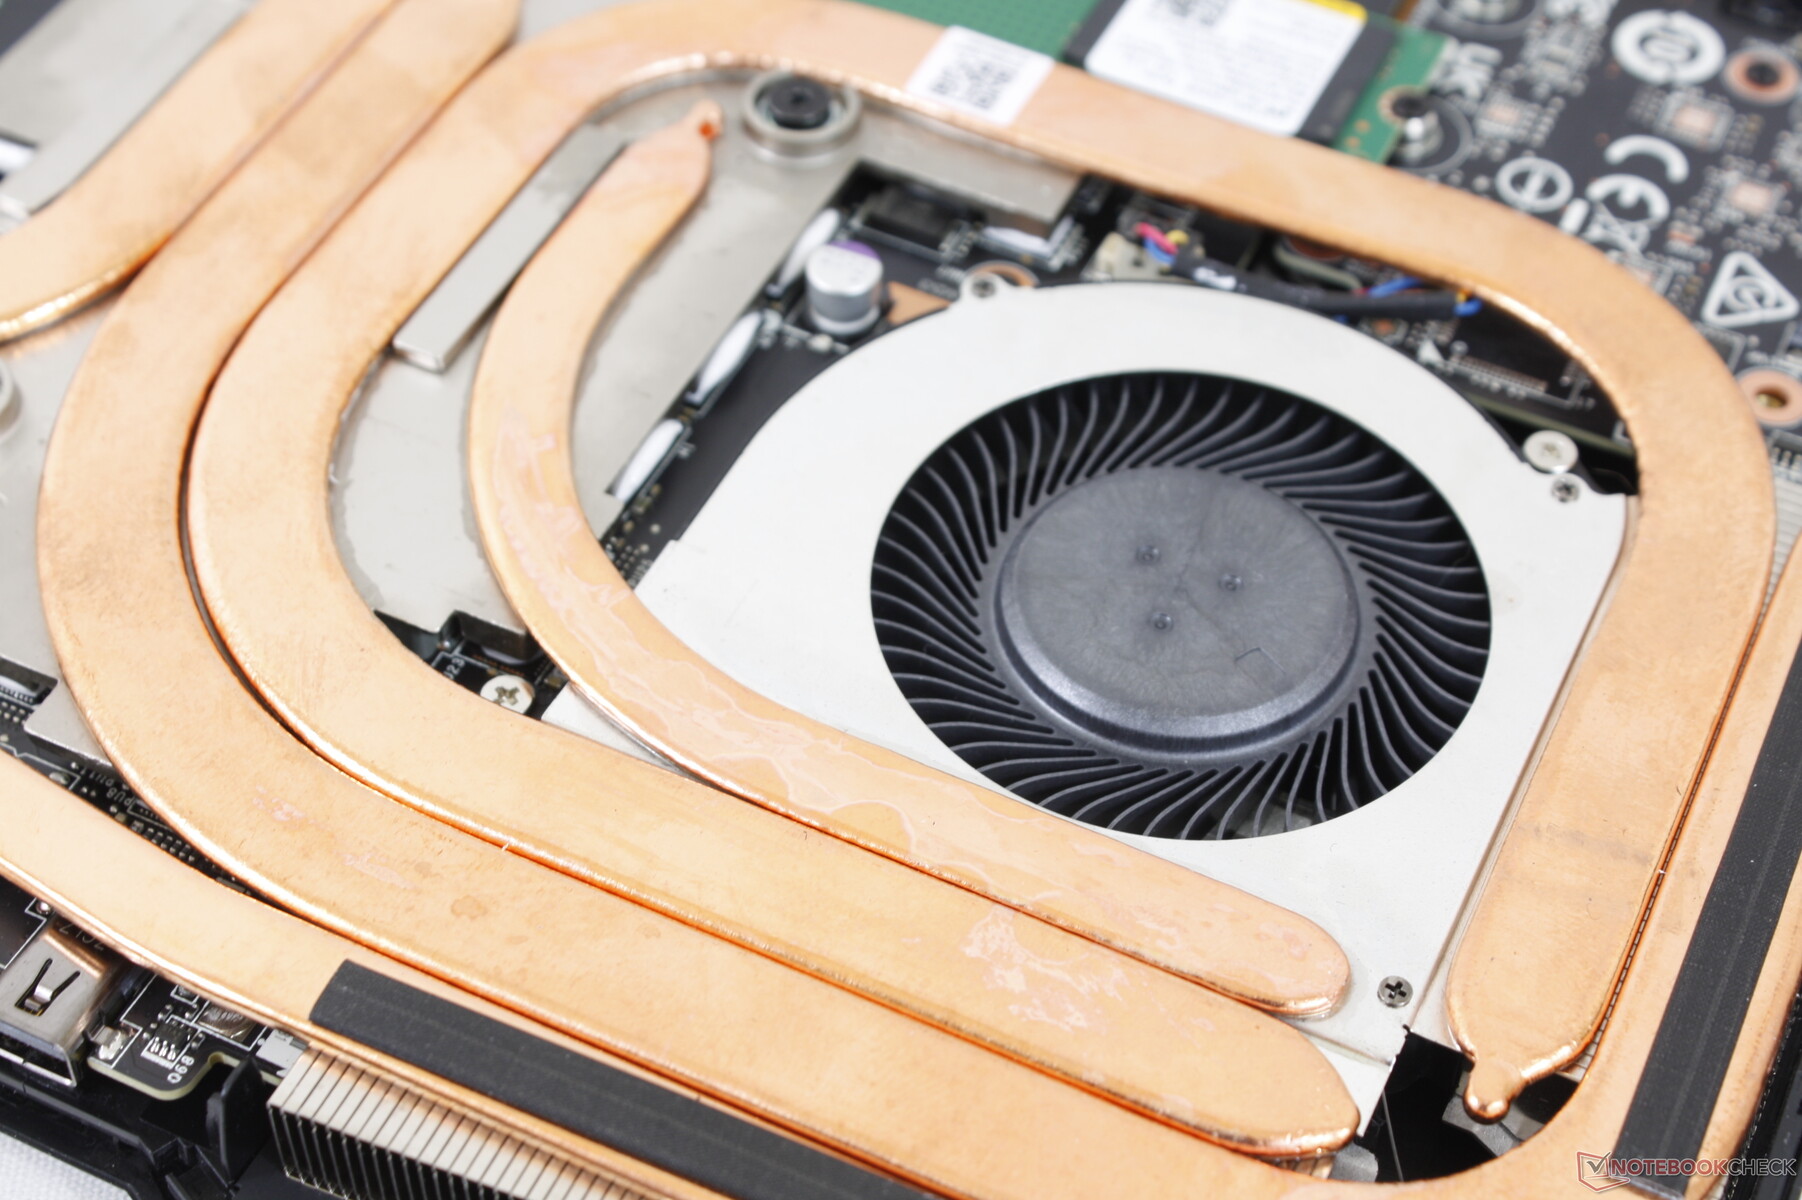
Wartung
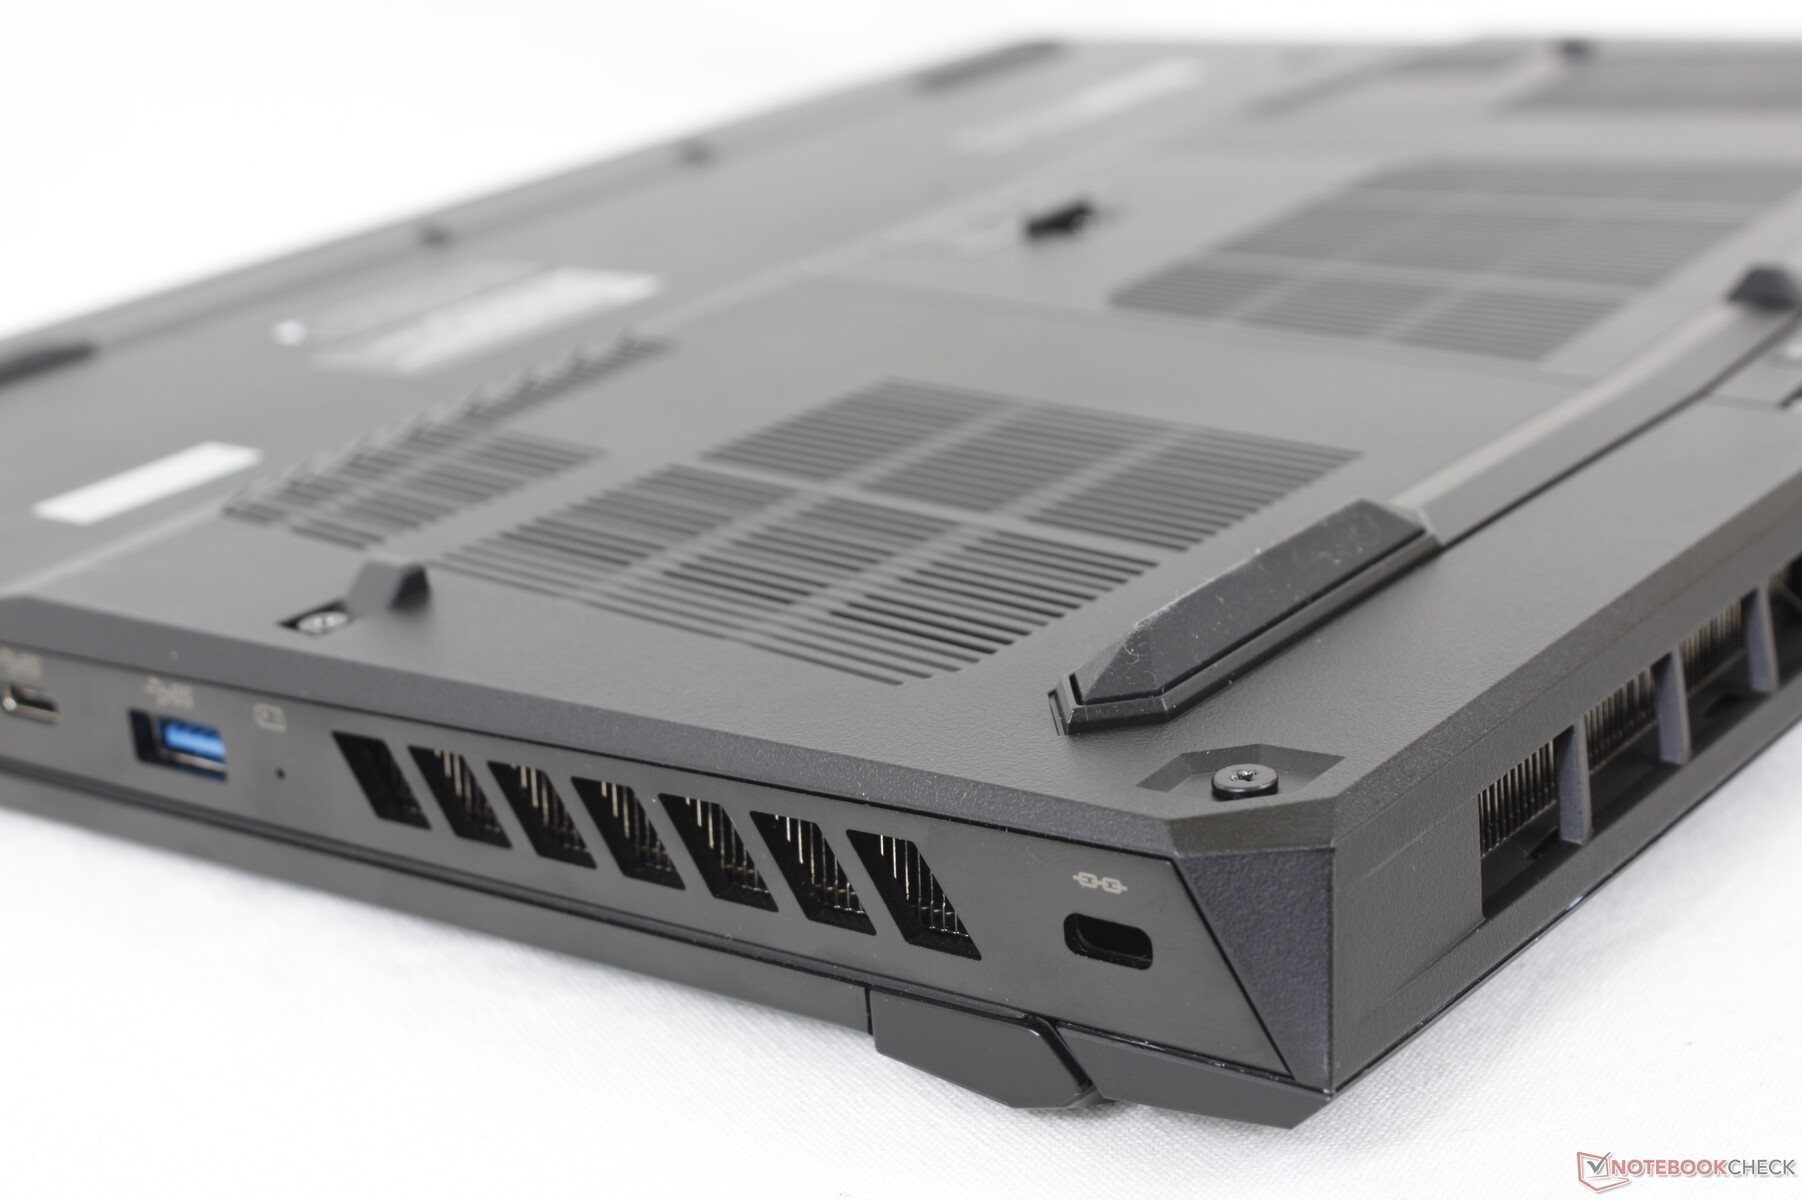
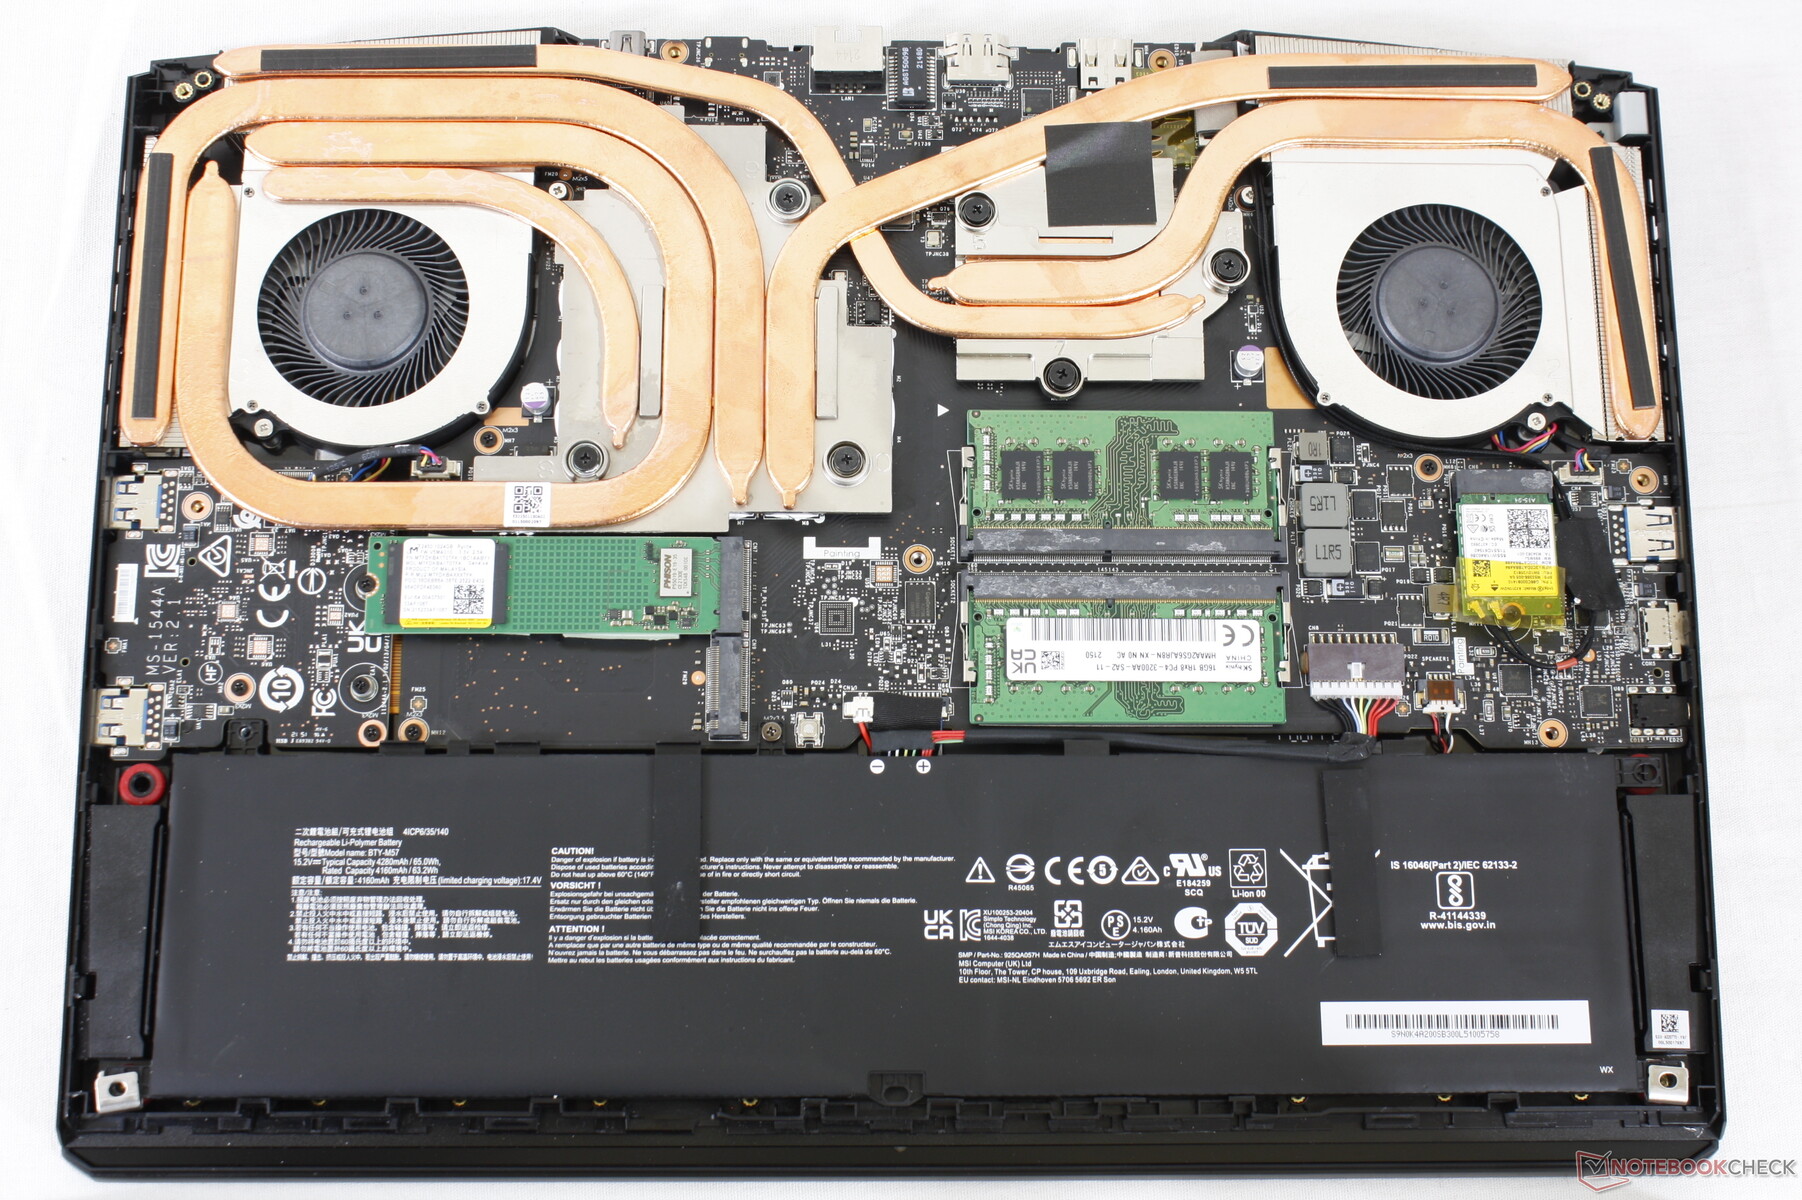
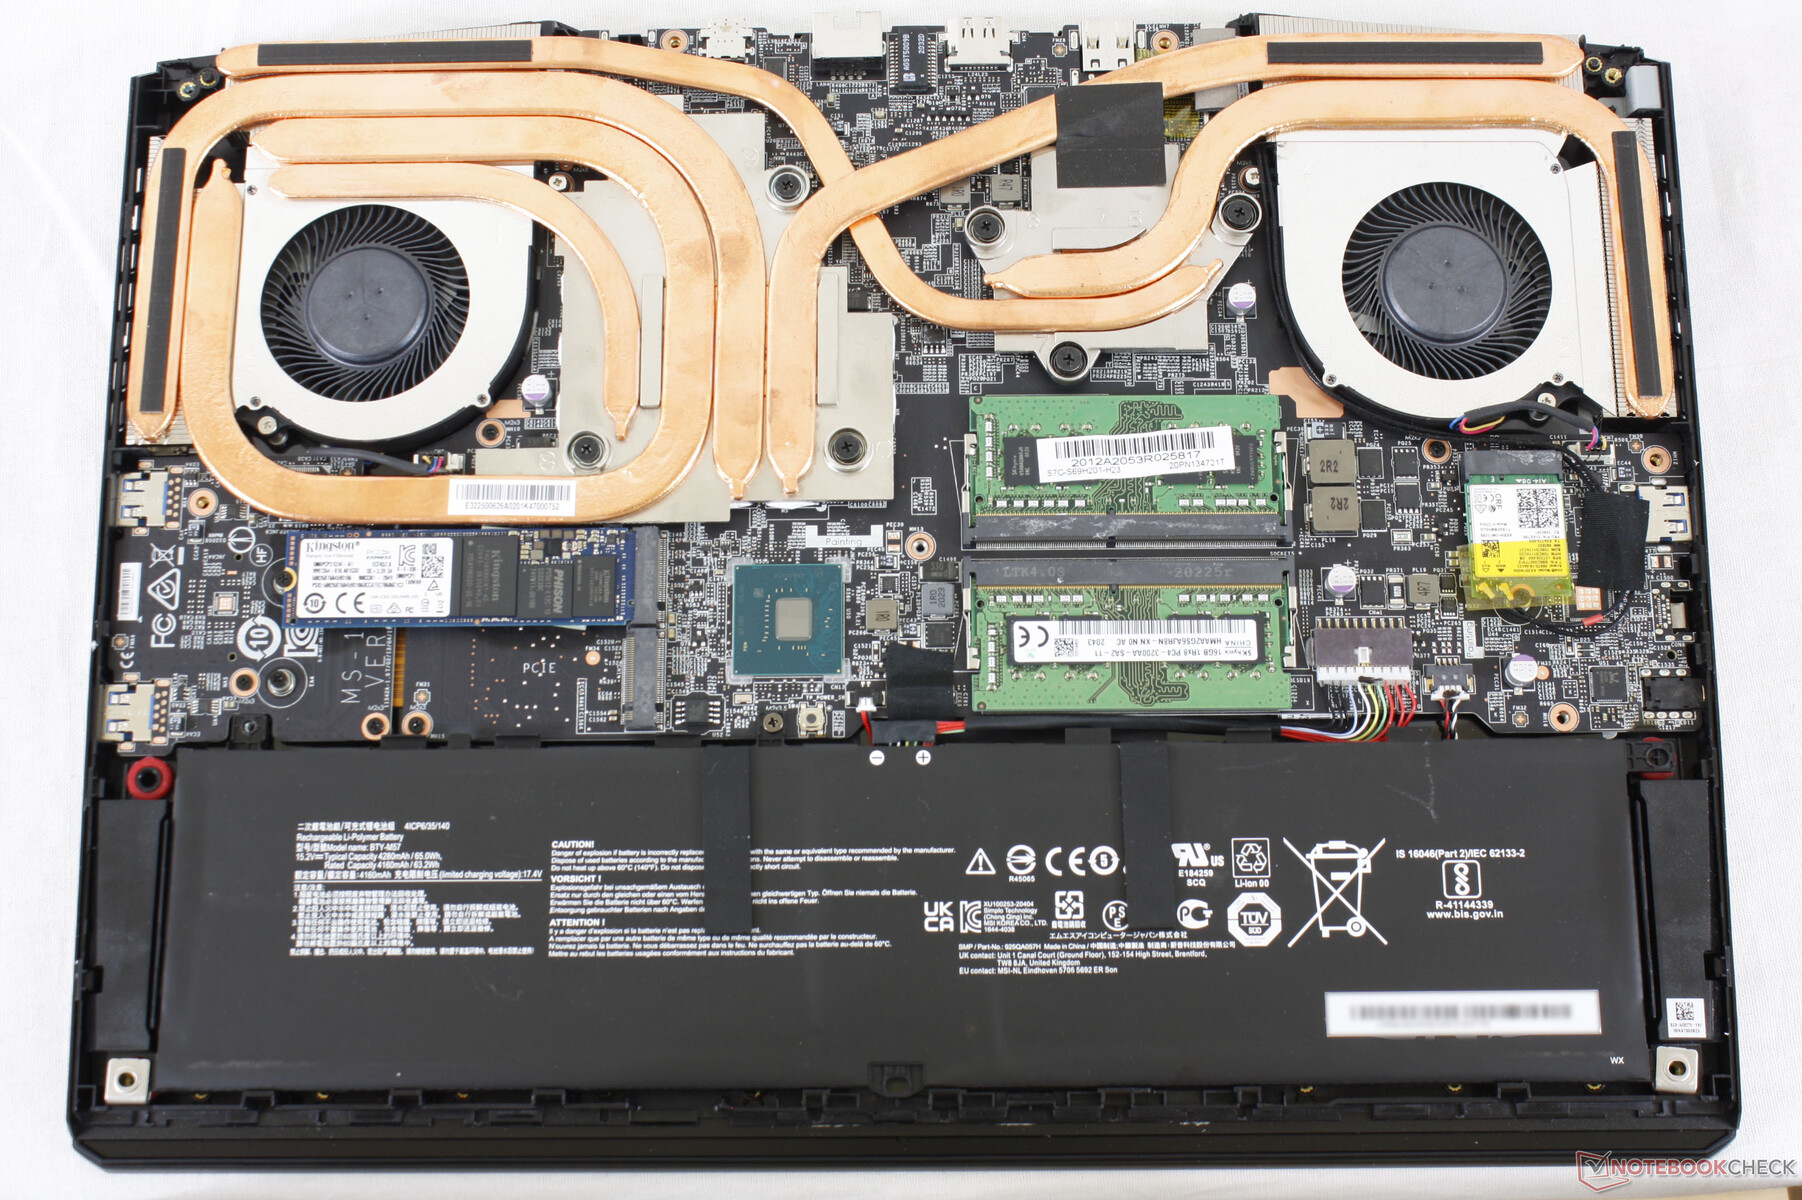
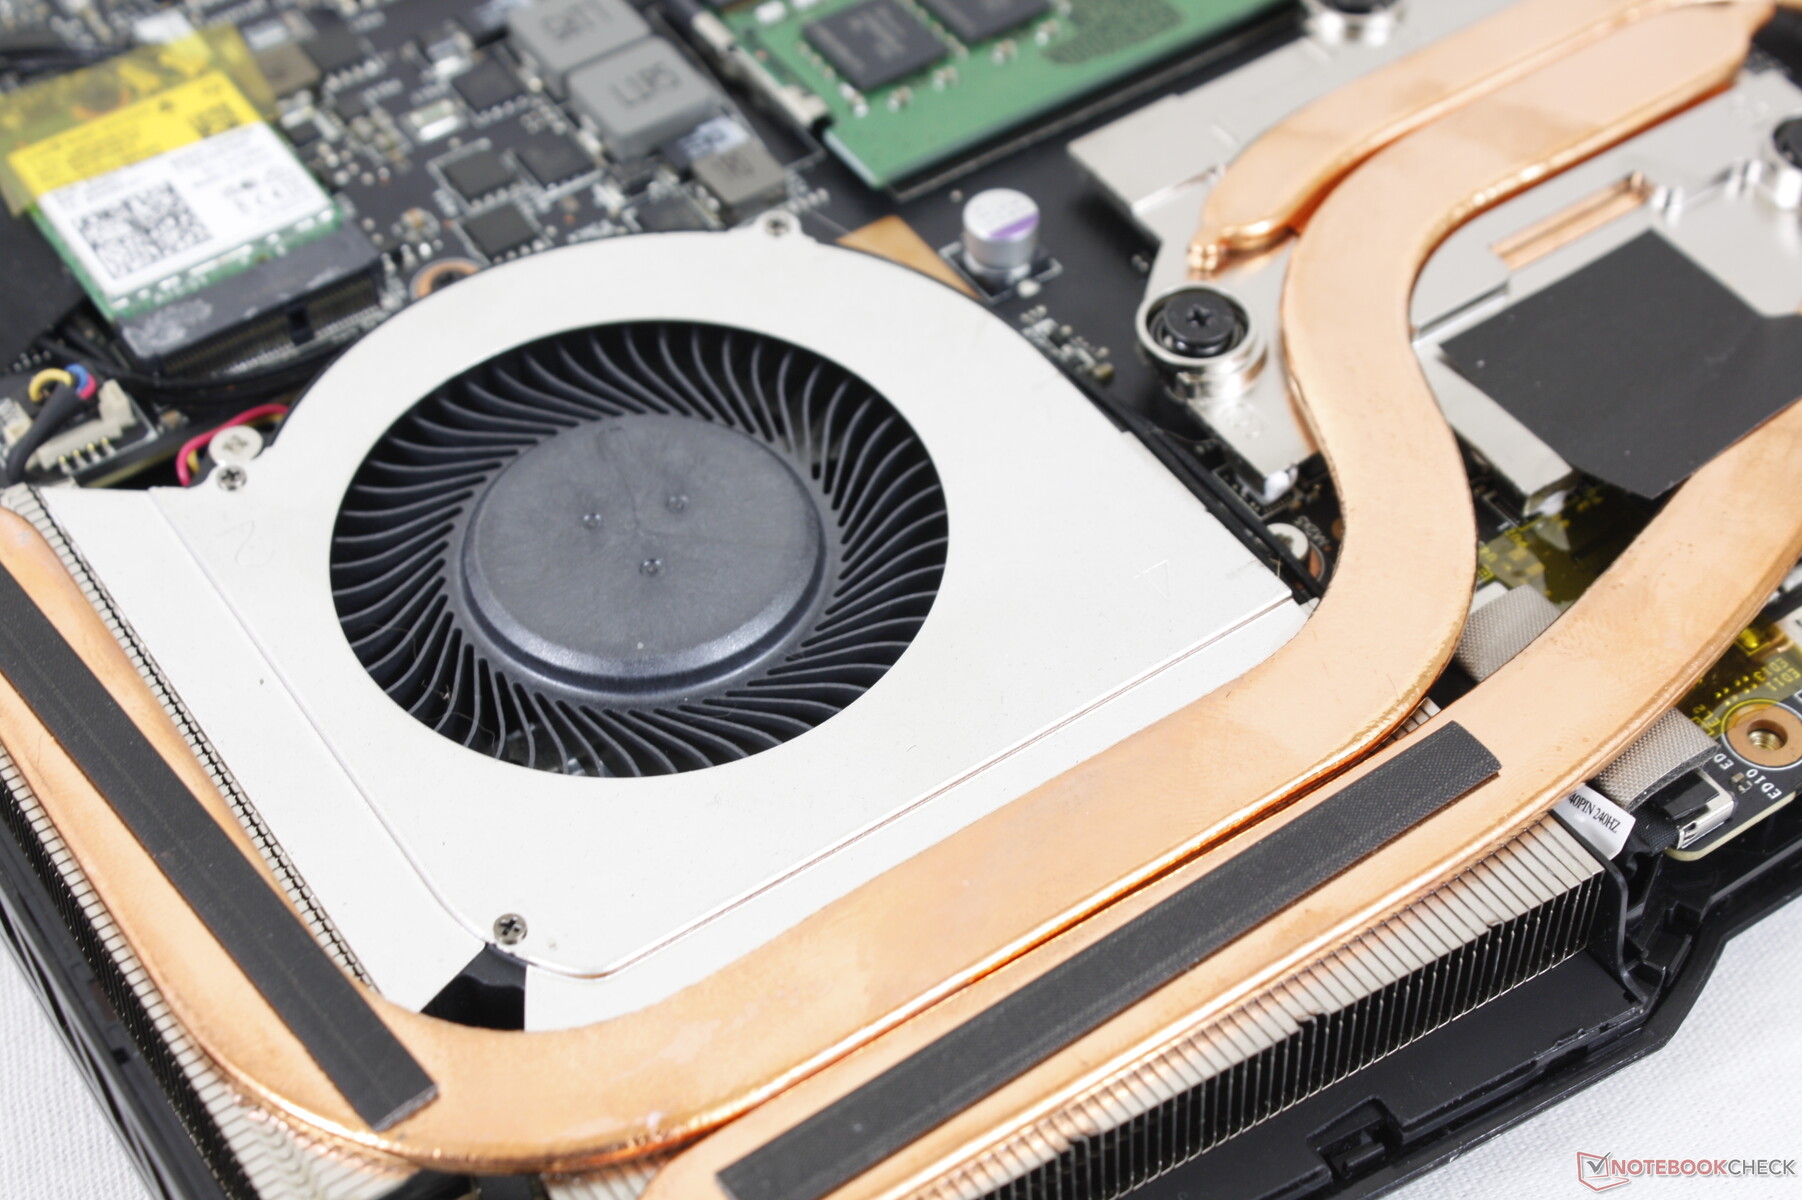
11 Kreuzschrauben sichern die Bodenplatte, versteckte Schrauben gibt es nicht. Allerdings muss ein Werksticker zerstört werden, um das Gerät zu öffnen.
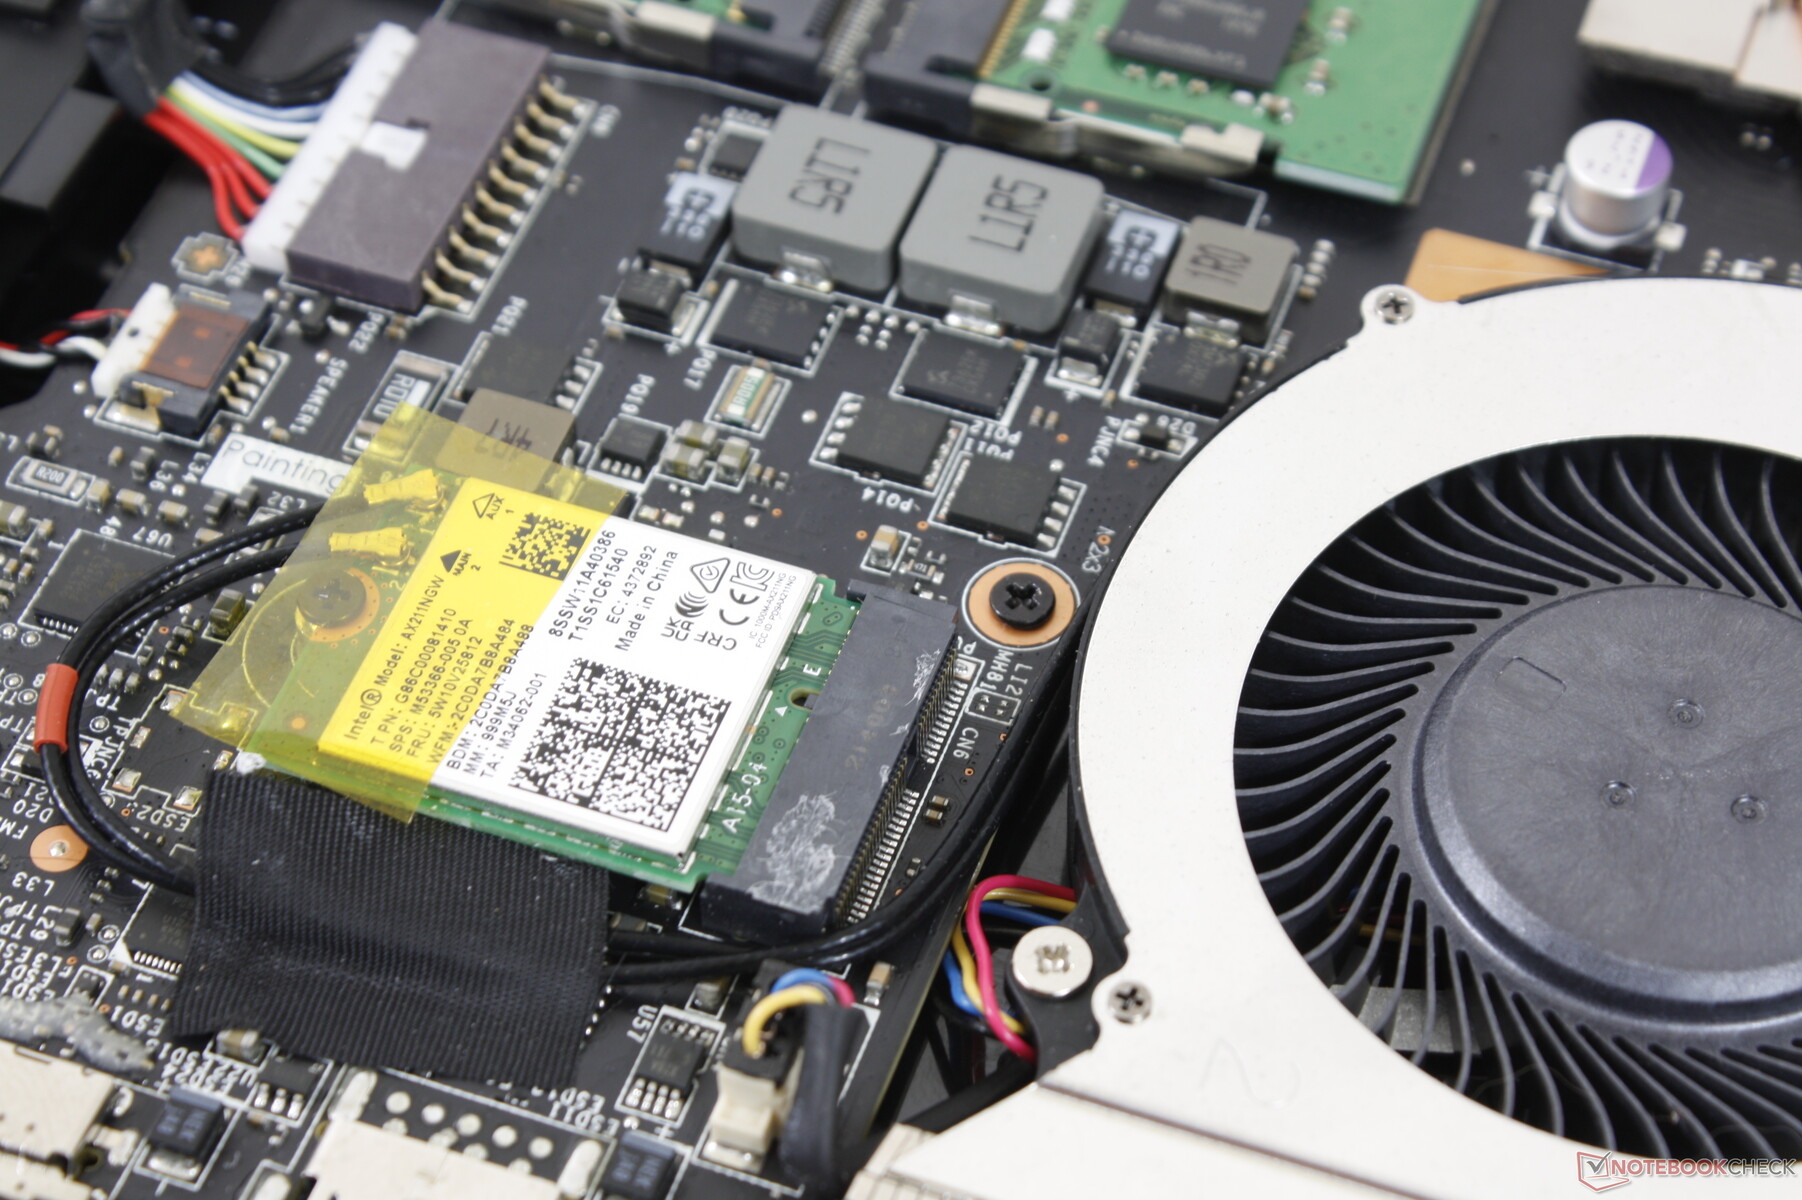
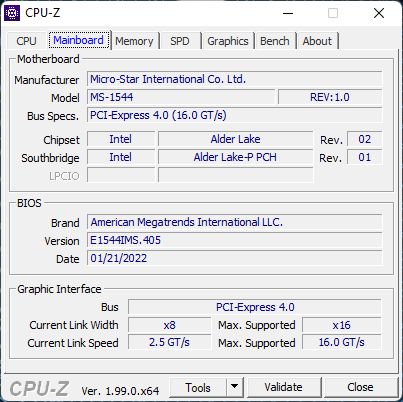
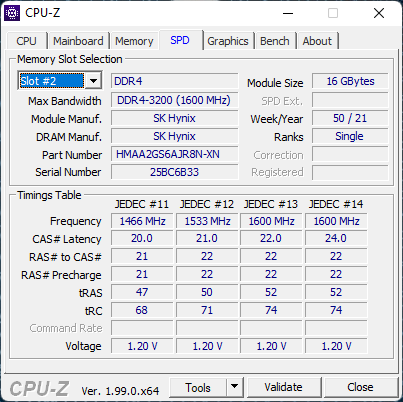
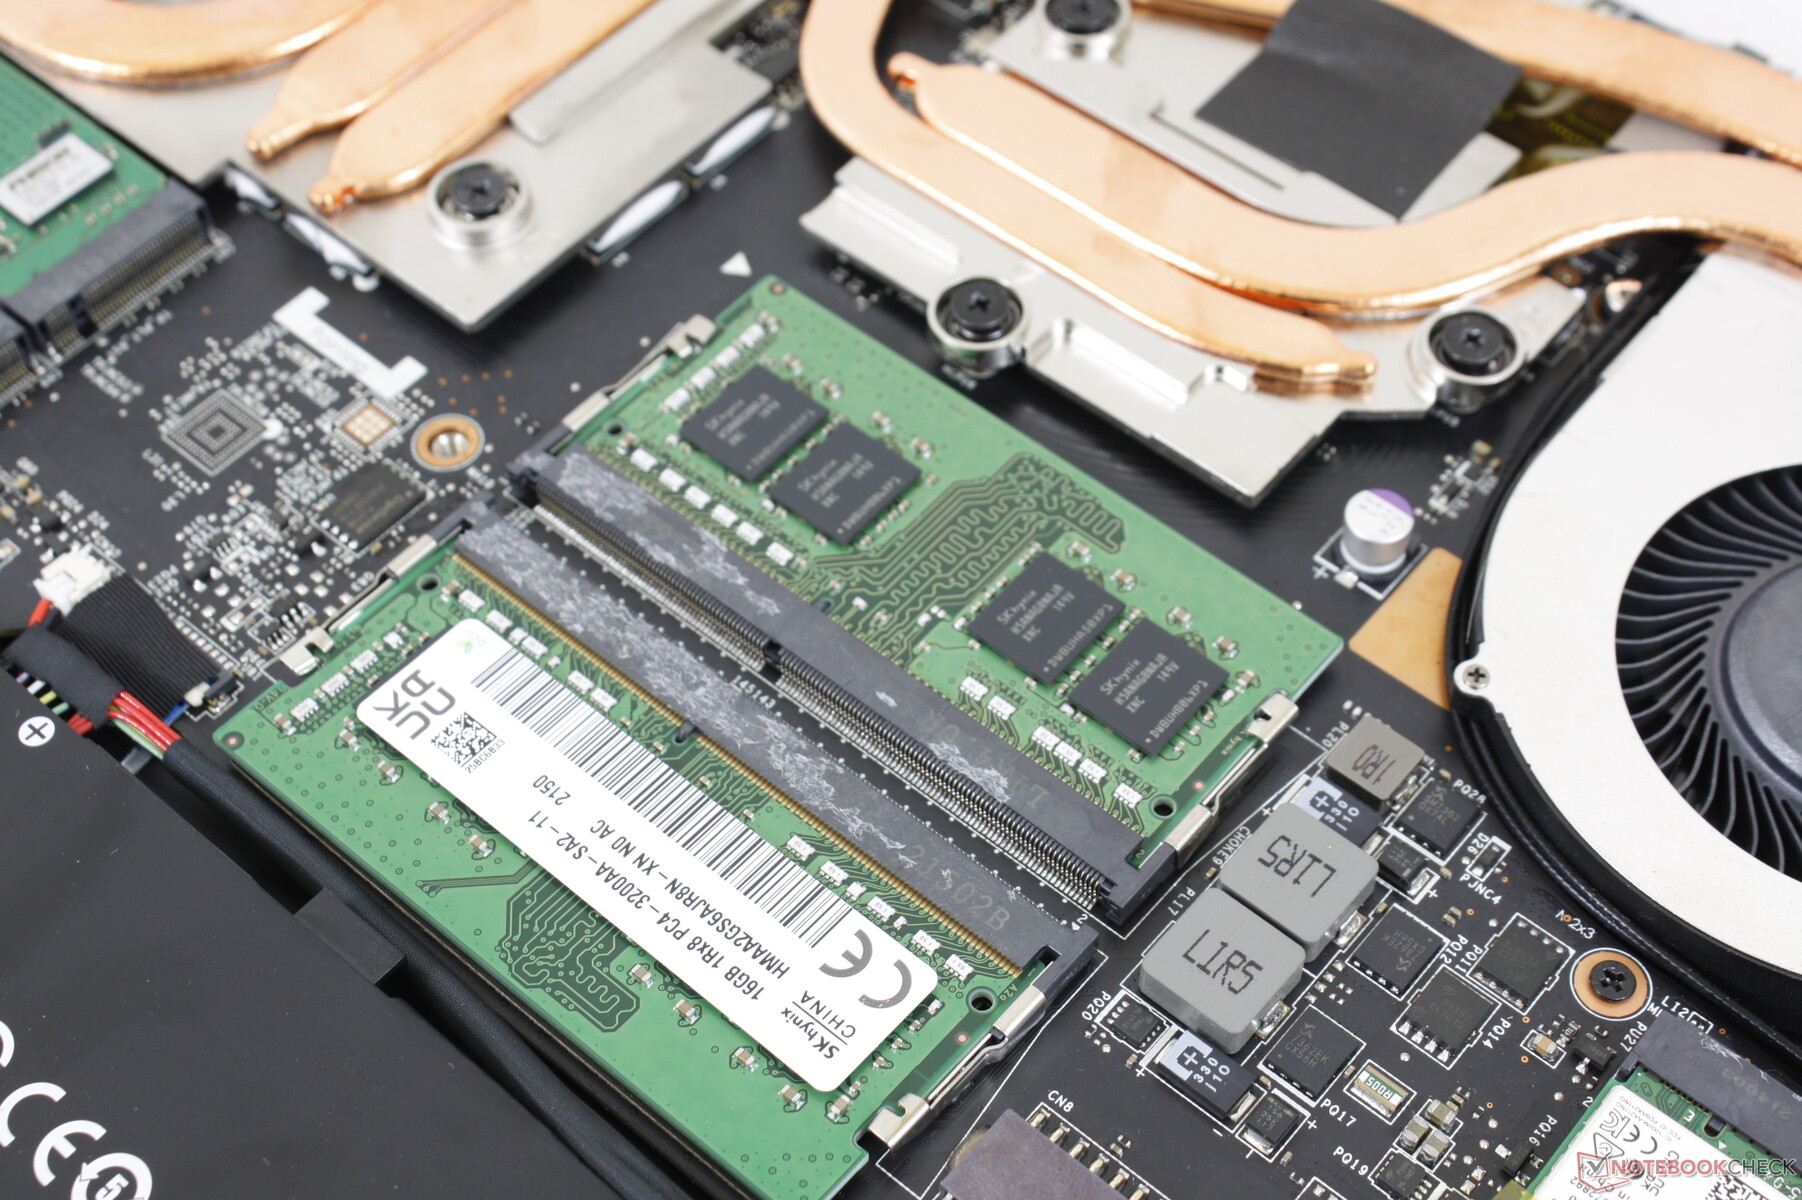
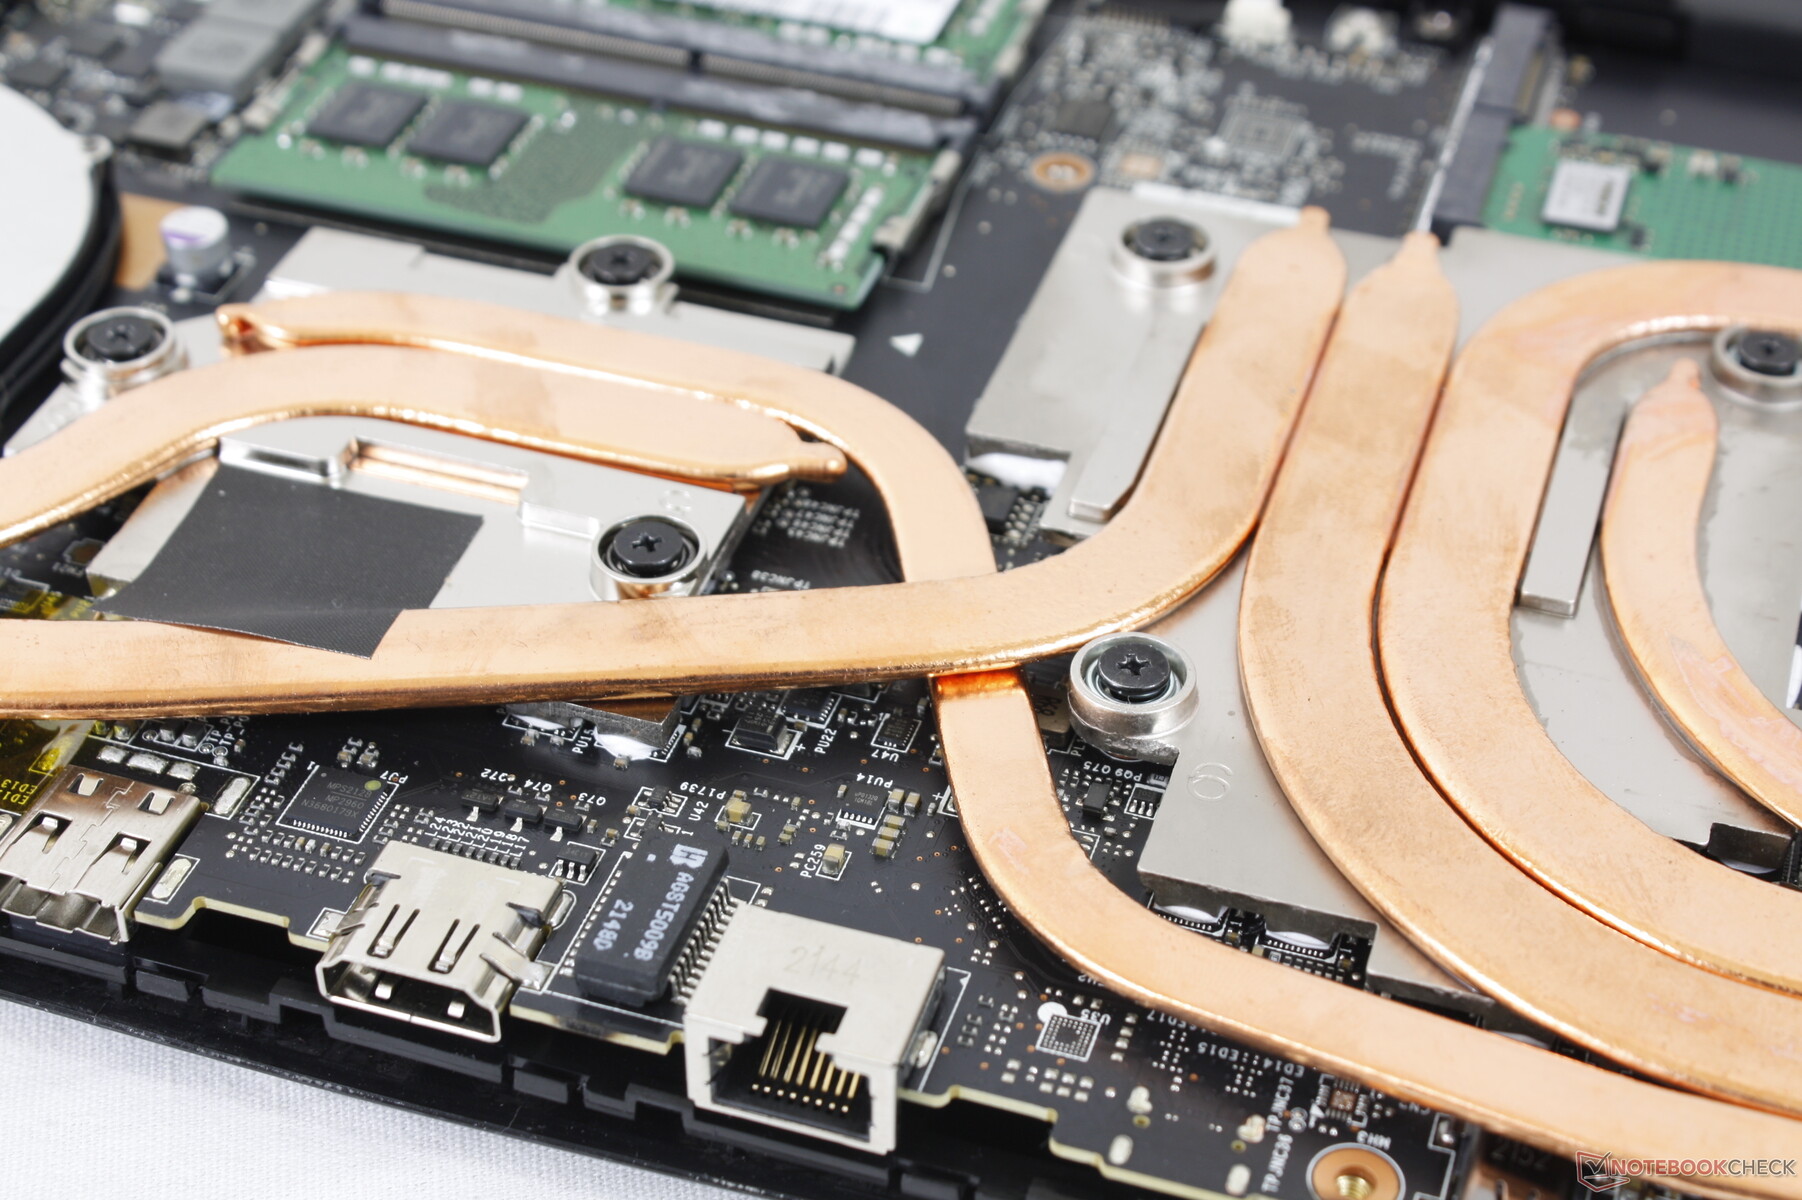
Intern ist das neue Modell quasi identisch zum GP66 Leopard wie die Bilder unten zeigen. Man erhält direkten Zugang zu den beiden SODIMM-Slots und den beiden M.2-2280-PCIe4-x4-Slots. Teurere Laptops wie zum Beispiel das GM7AG8P unterstützen zusätzlich schnelleren DDR5-RAM.
Zubehör und Garantie
Außer einigen Zetteln und dem Netzteil befinden sich keine Extras in der Verpackung. Es greift die limitierte Standard-1-Jahres-Garantie.
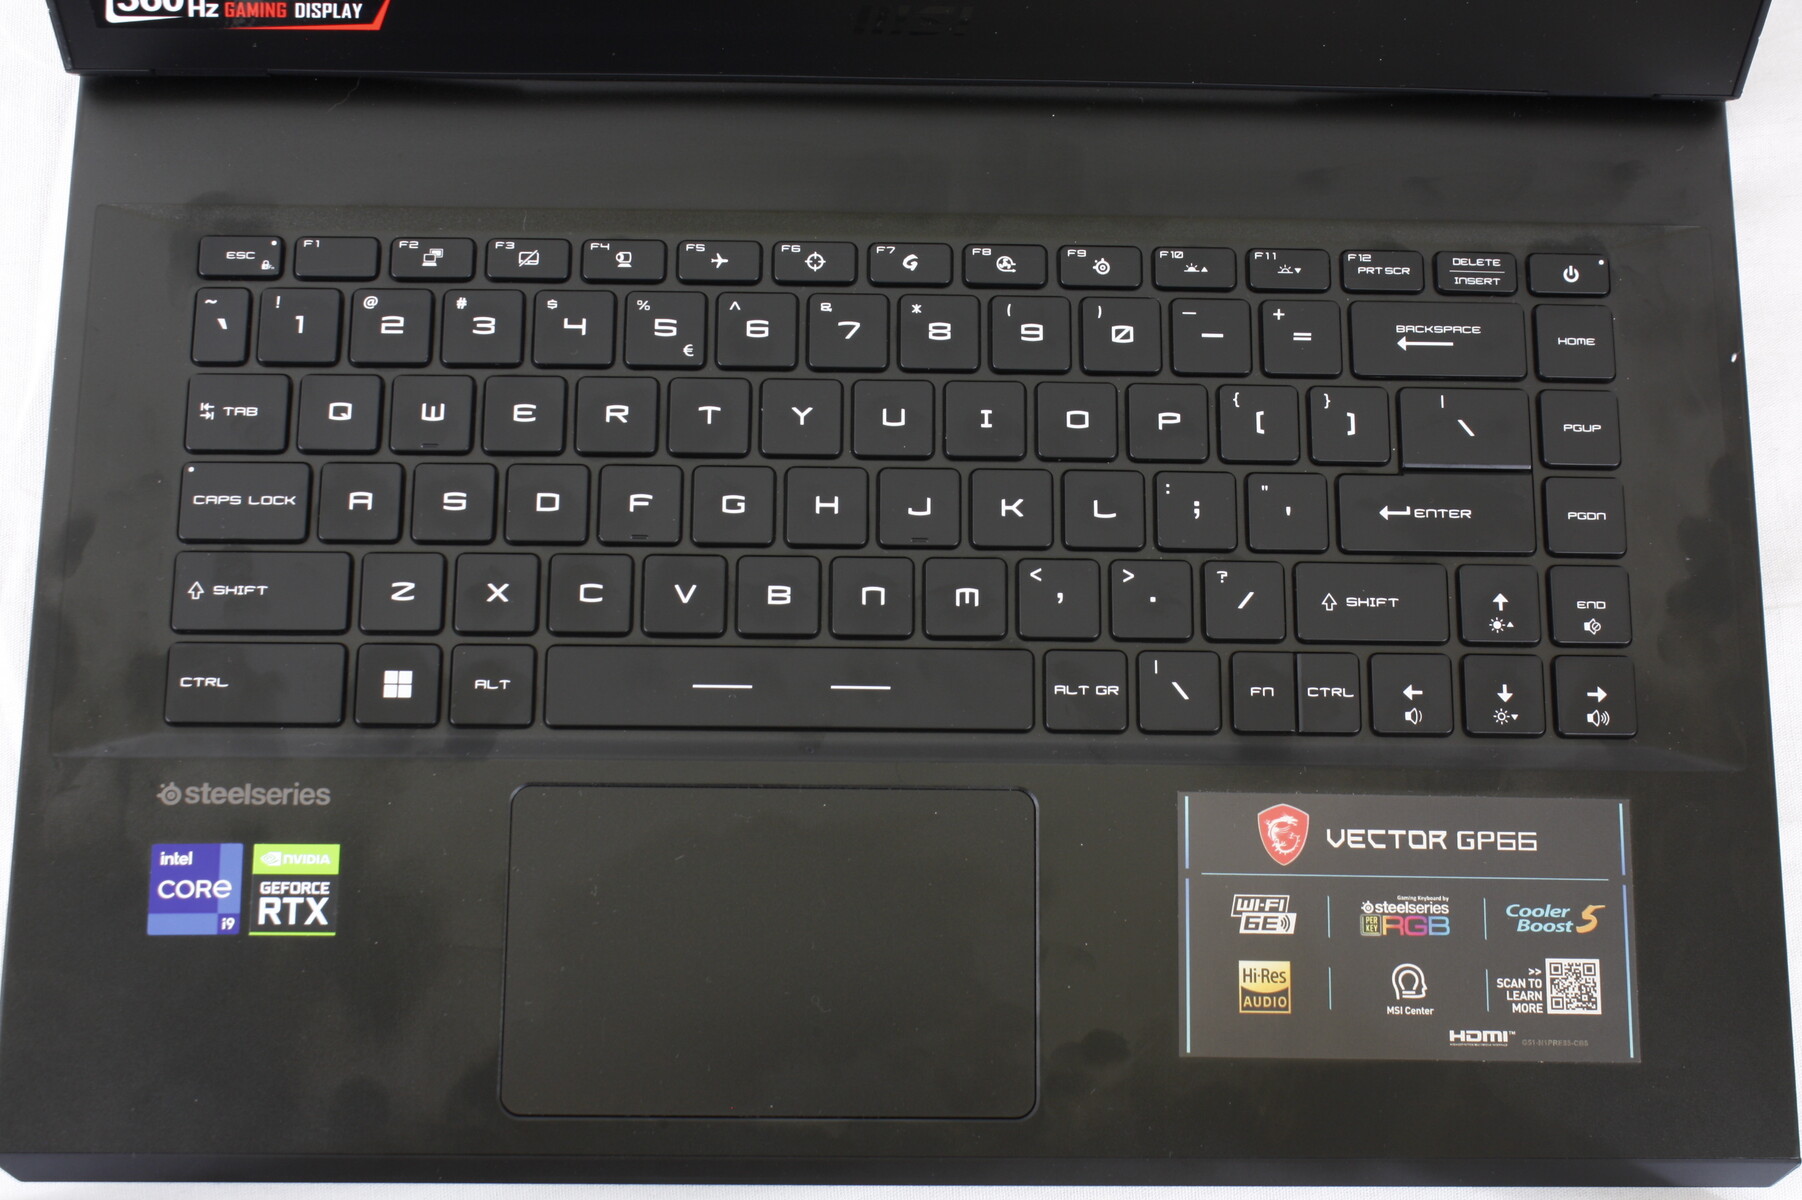
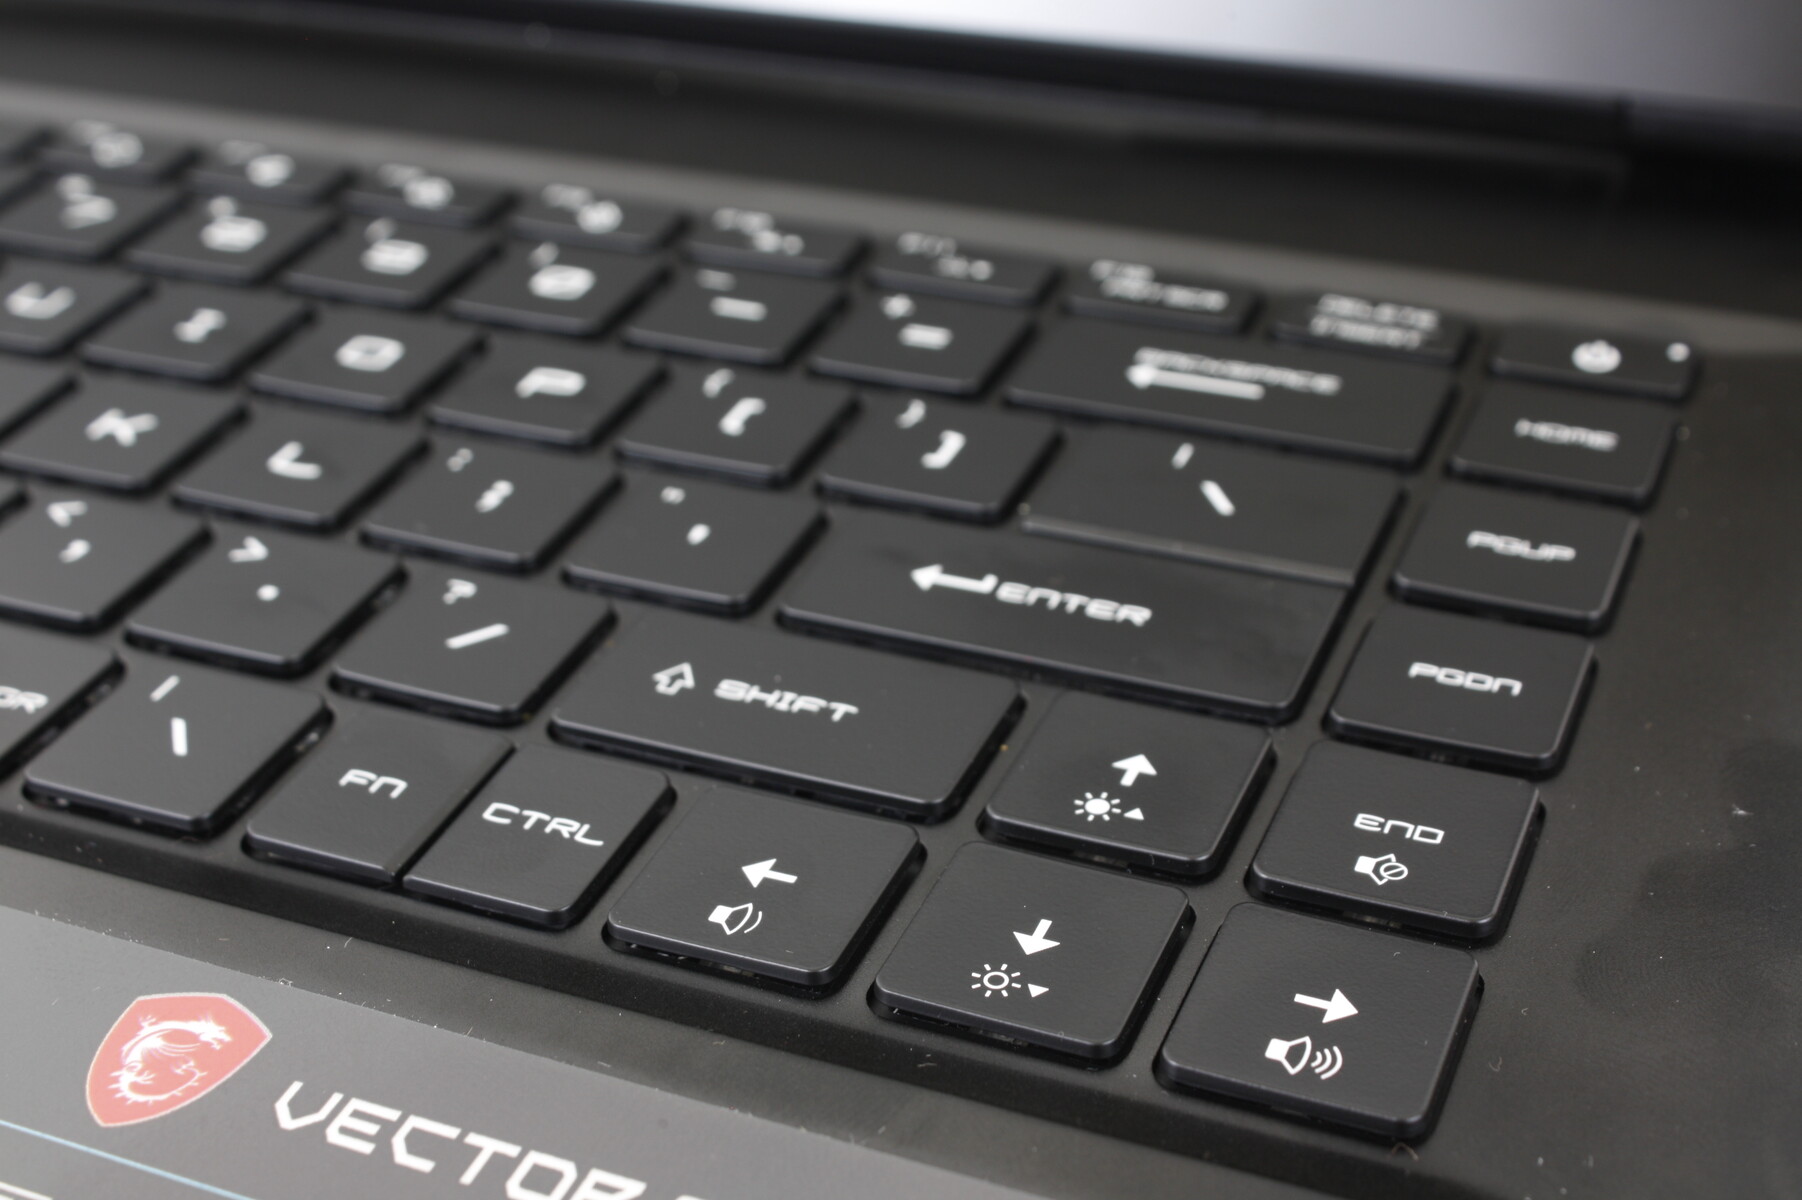
Eingabegeräte - Schwammige Touchpadtasten
Tastatur und Touchpad
Die Tastatur mit RGB-pro-Taste-Beleuchtung sowie das Touchpad (10,5 x 6,5 cm) sind seit dem Original-GP66-Leopard aus dem Jahr 2020 unverändert. Zwar ist die Schreiberfahrung zufriedenstellend wenn auch etwas zu weich, aber die integrierten Tasten des Touchpads sind klar zu schwammig. Das ältere GP65 hatte noch dedizierte Maustasten und damit ein besseres Klickgefühl zu bieten, aber das fiel dem Redesign zum GP66 zum Opfer.


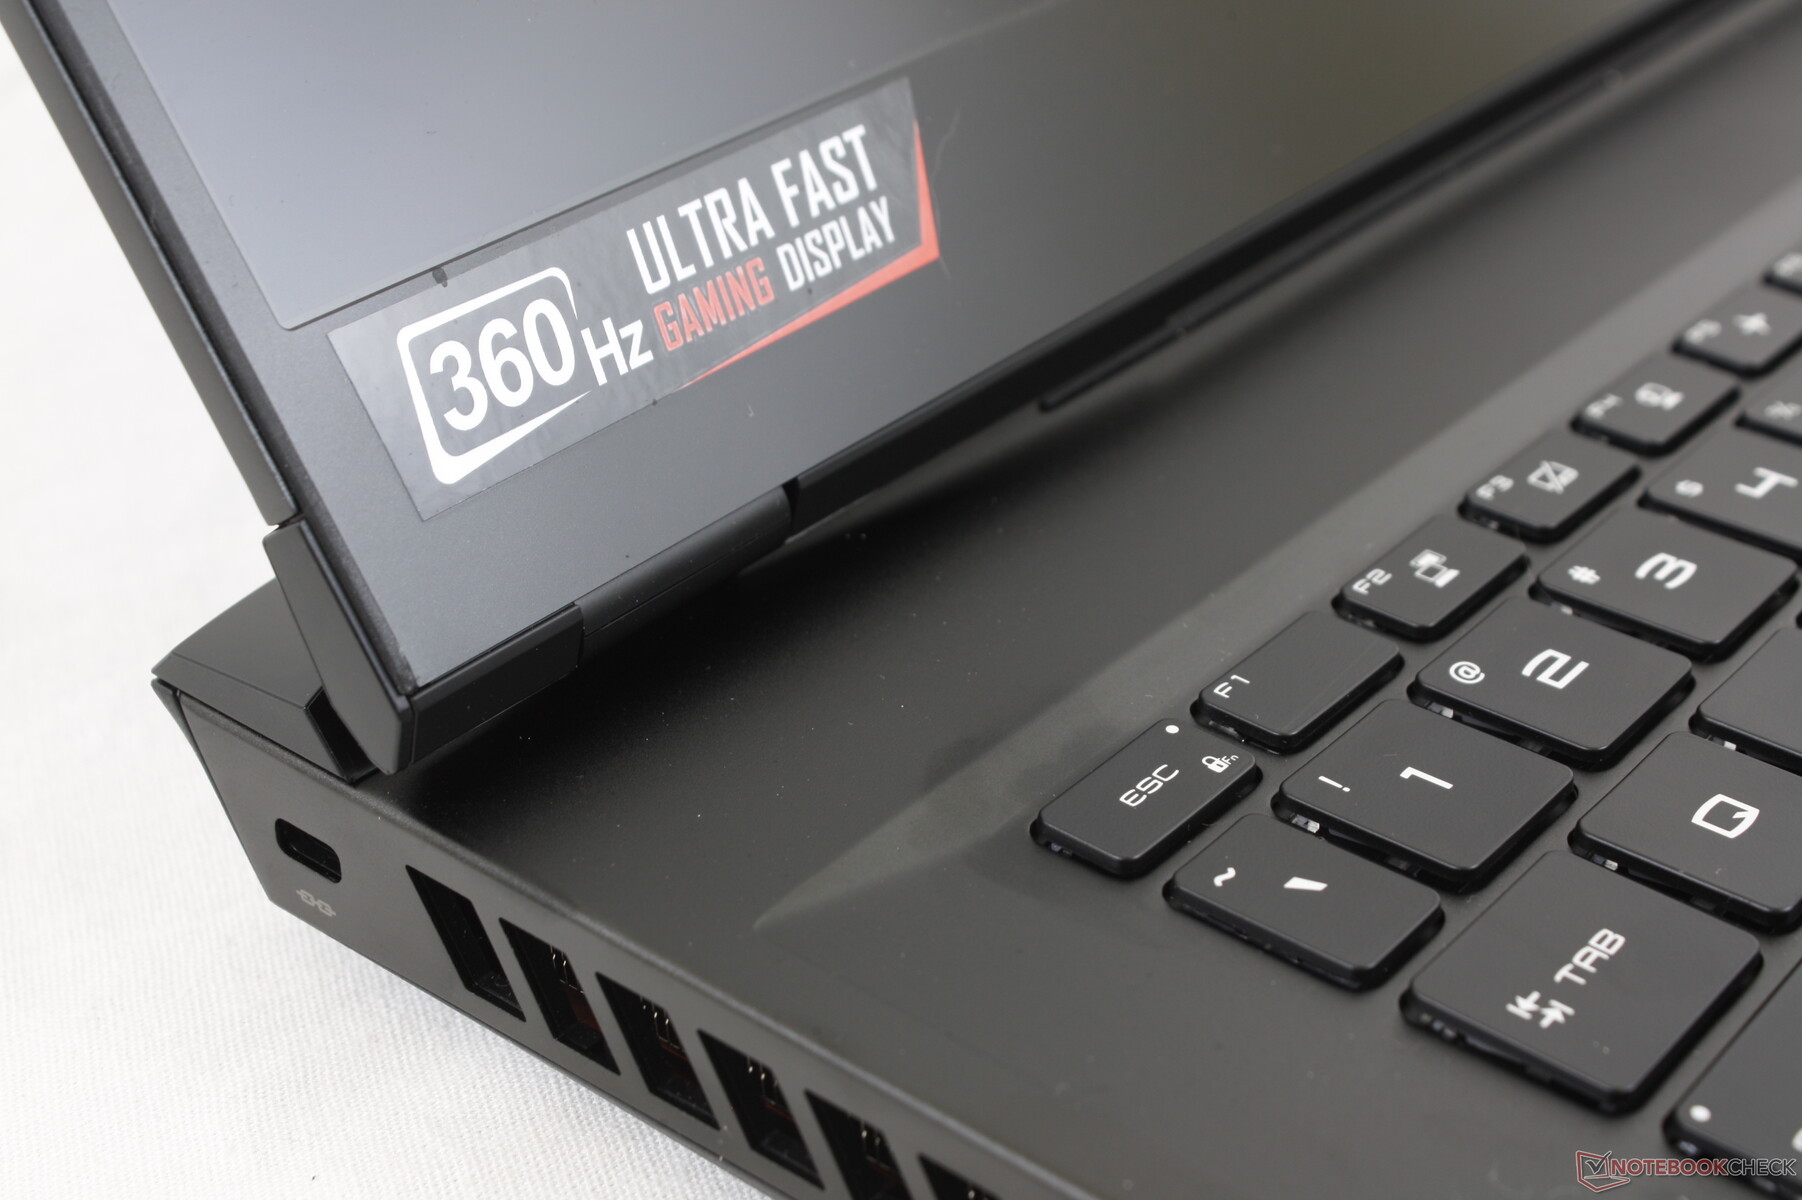
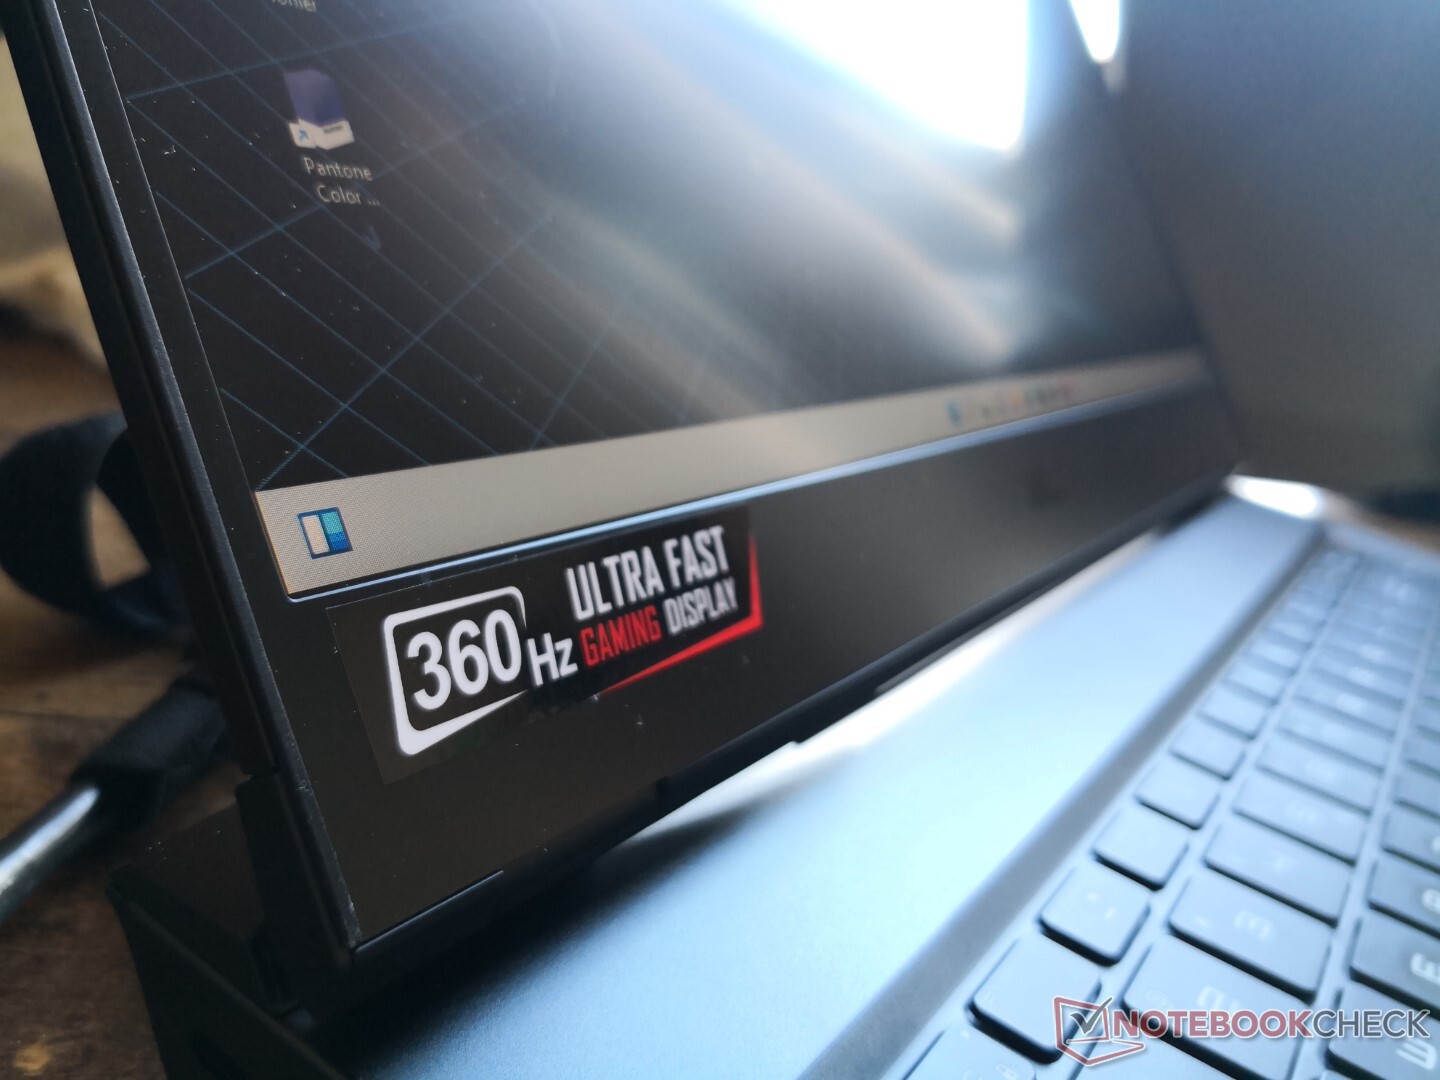
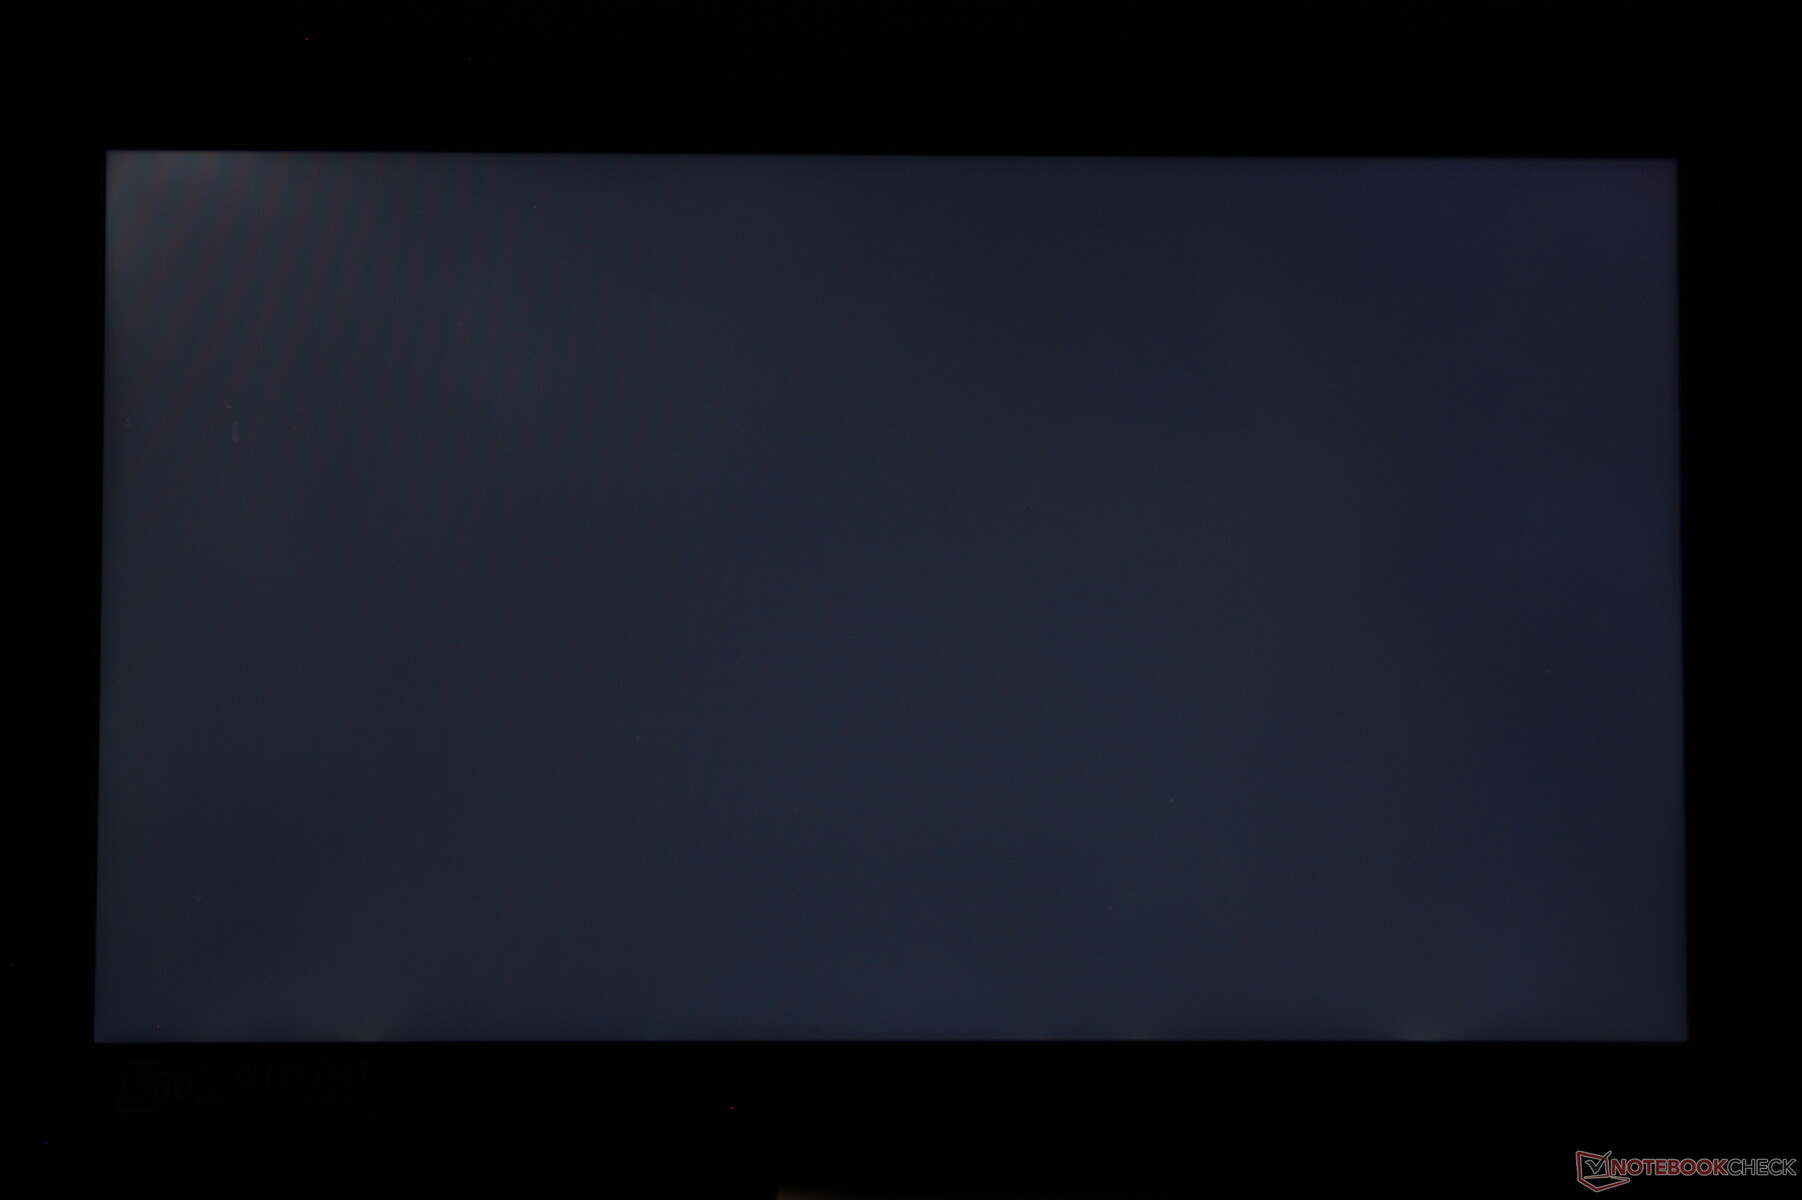
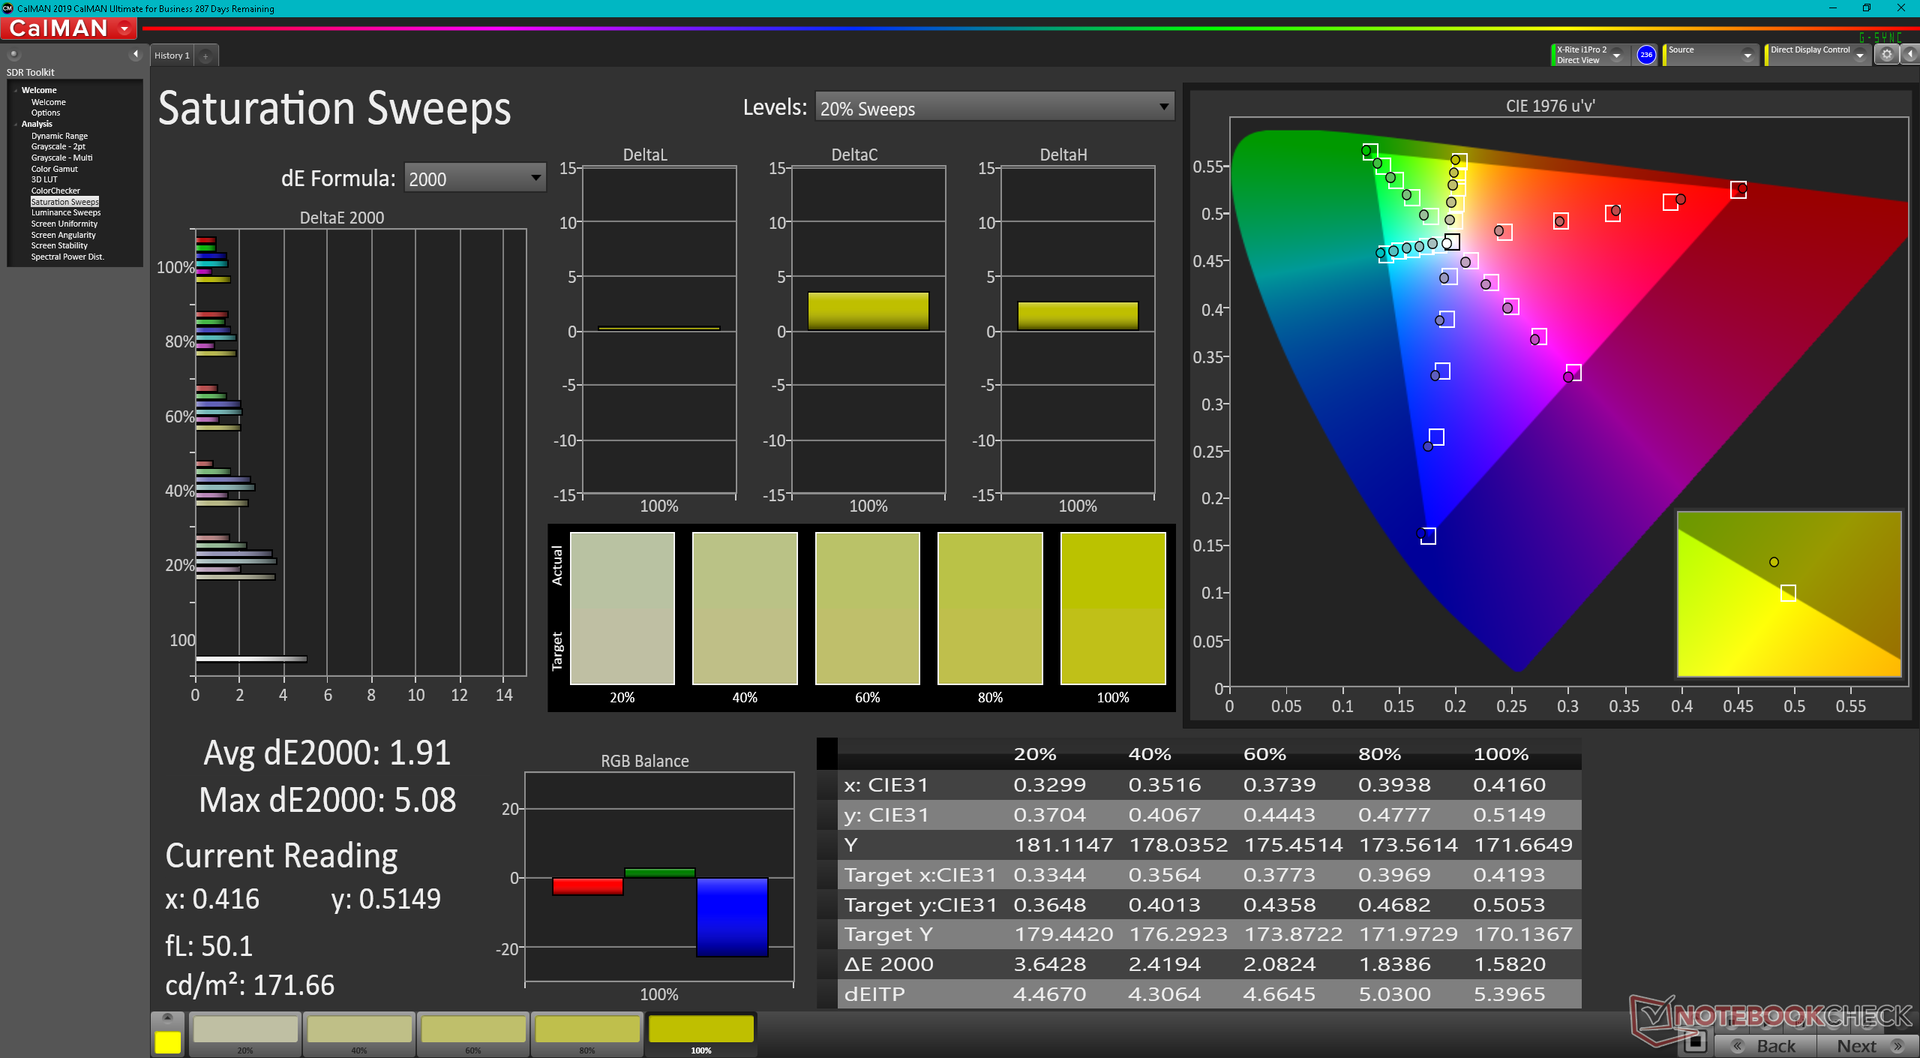
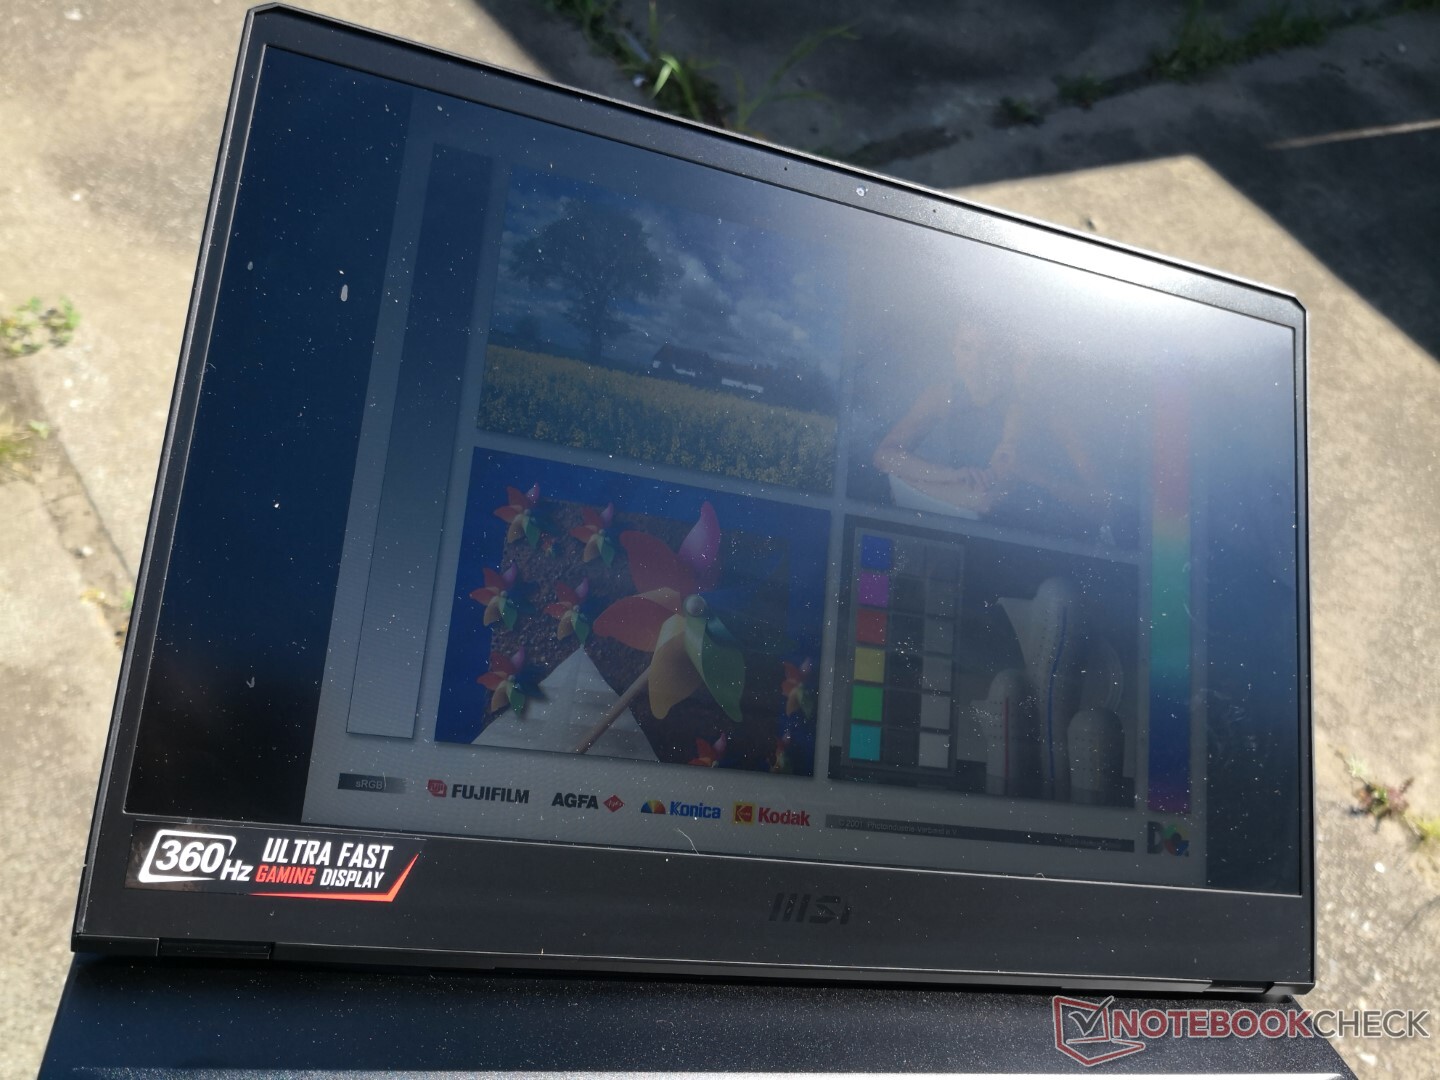
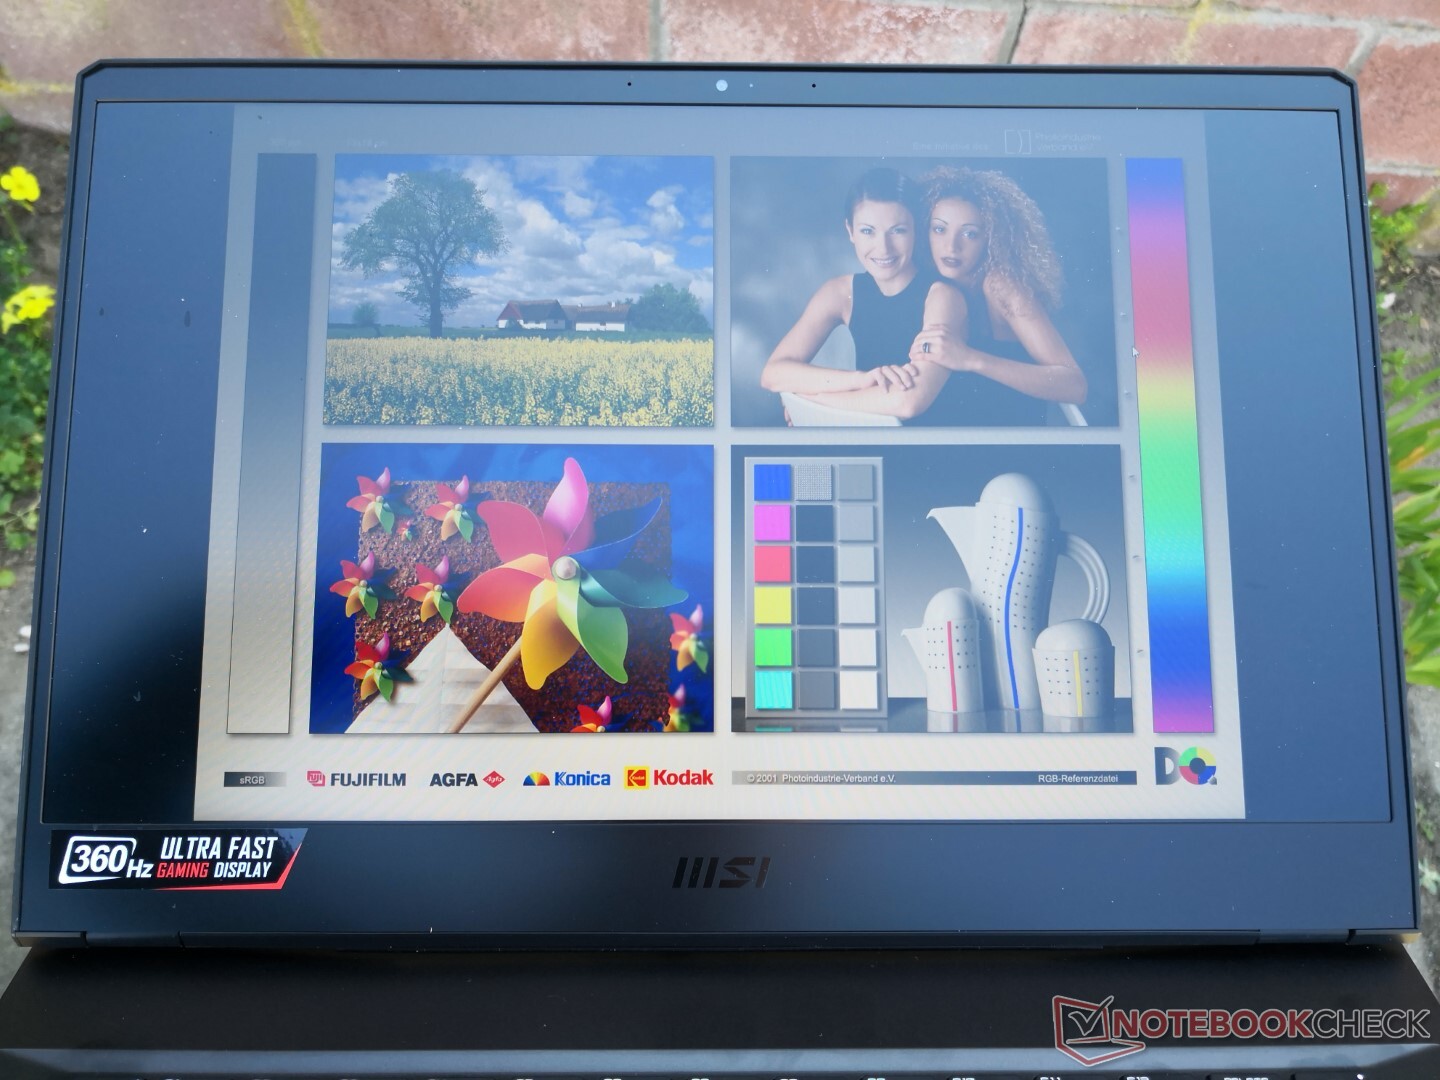
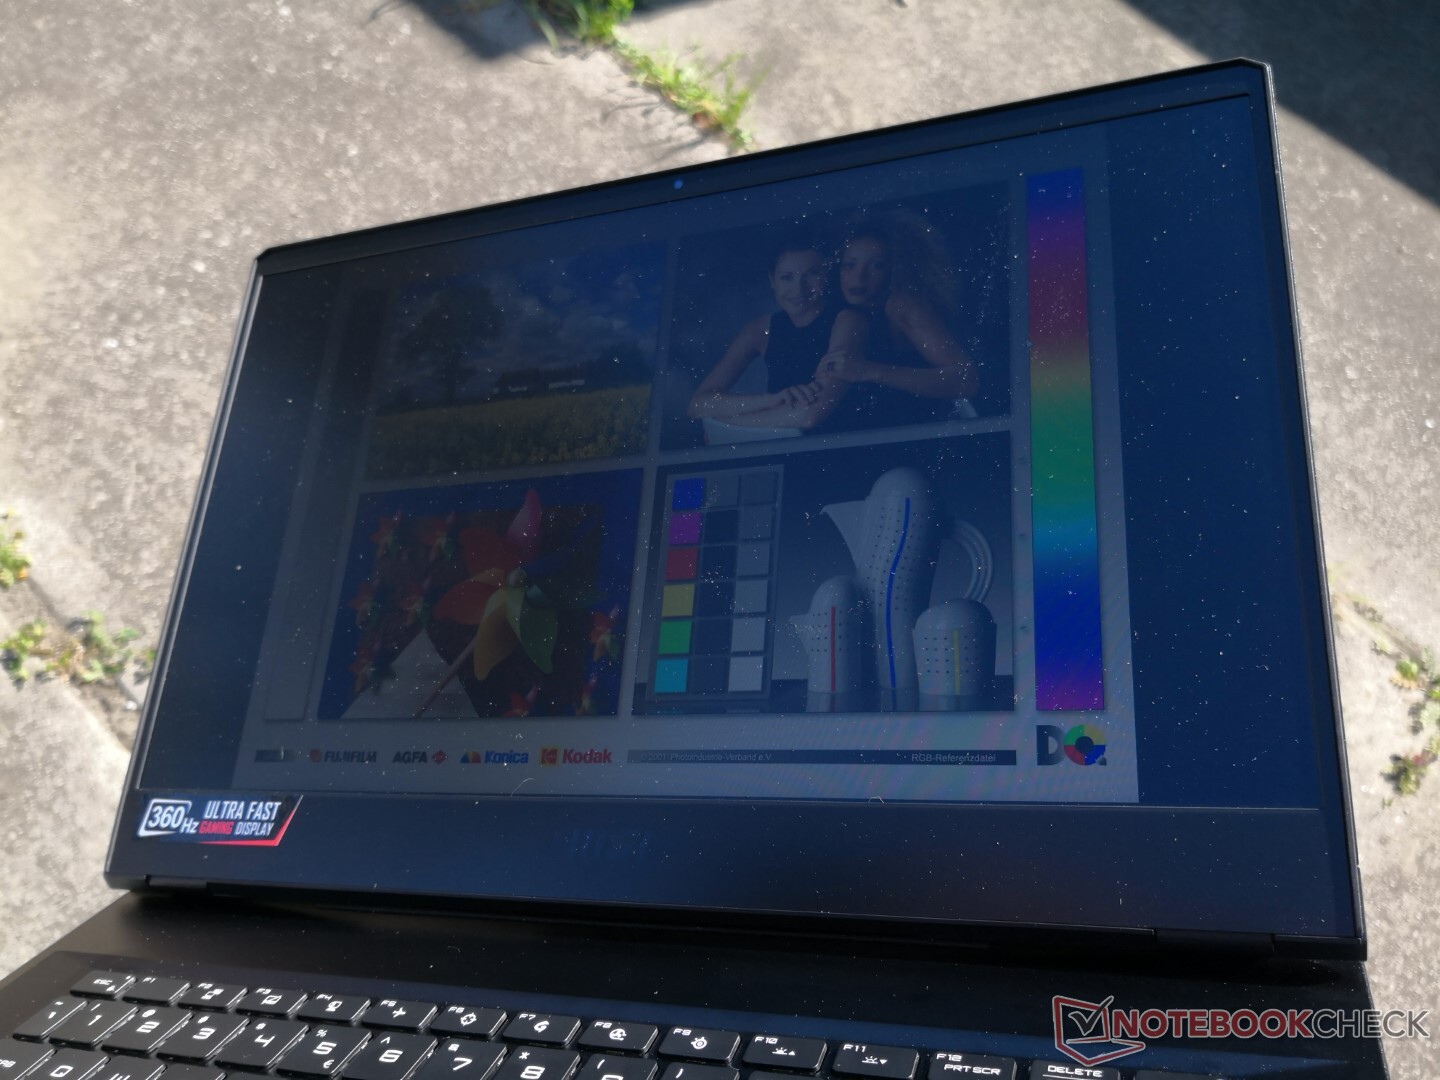
Display - High-End für die Mittelklasse
Im Gegensatz zum 144-Hz-LG-LP156WFG-SPB3-IPS-Panel beim GP66 Leopard ist im GP66 Vector ein uns bislang unbekanntes IPS-Panel namens BOE NE156FHM-NZ3 mit 360 Hz verbaut. Das neue BOE-Panel bietet sowohl eine schnellere Bildwiederholrate als auch schnellere Grau-zu-Grau-Reaktionszeiten und schafft es gleichzeitig die volle sRGB-Abdeckung sowie das gute Kontrastverhältnis des älteren LG-Panels zu bewahren. Die maximale Helligkeit ist geringfügig niedriger, was aber kaum ins Gewicht fällt. Insgesamt würden wir es als High-End-Panel in einem Gaming-Laptop der oberen Mittelklasse bezeichnen.
Als potentieller Käufer sollte man jedoch beachten, dass es das MSI in den preiswerteren Konfigurationen auch mit einem langsameren 144-Hz-Display gibt. Zumindest die Farbwiedergabe dürfte dann deutlich schlechter sein, immerhin werden nur rund 60 Prozent des sRGB-Farbraums abgedeckt. Wenn die Displayqualität beim Kauf eine größere Rolle spielt, sollte man solche Konfigurationen eher meiden.

| |||||||||||||||||||||||||
Ausleuchtung: 85 %
Helligkeit Akku: 353.1 cd/m²
Kontrast: 929:1 (Schwarzwert: 0.38 cd/m²)
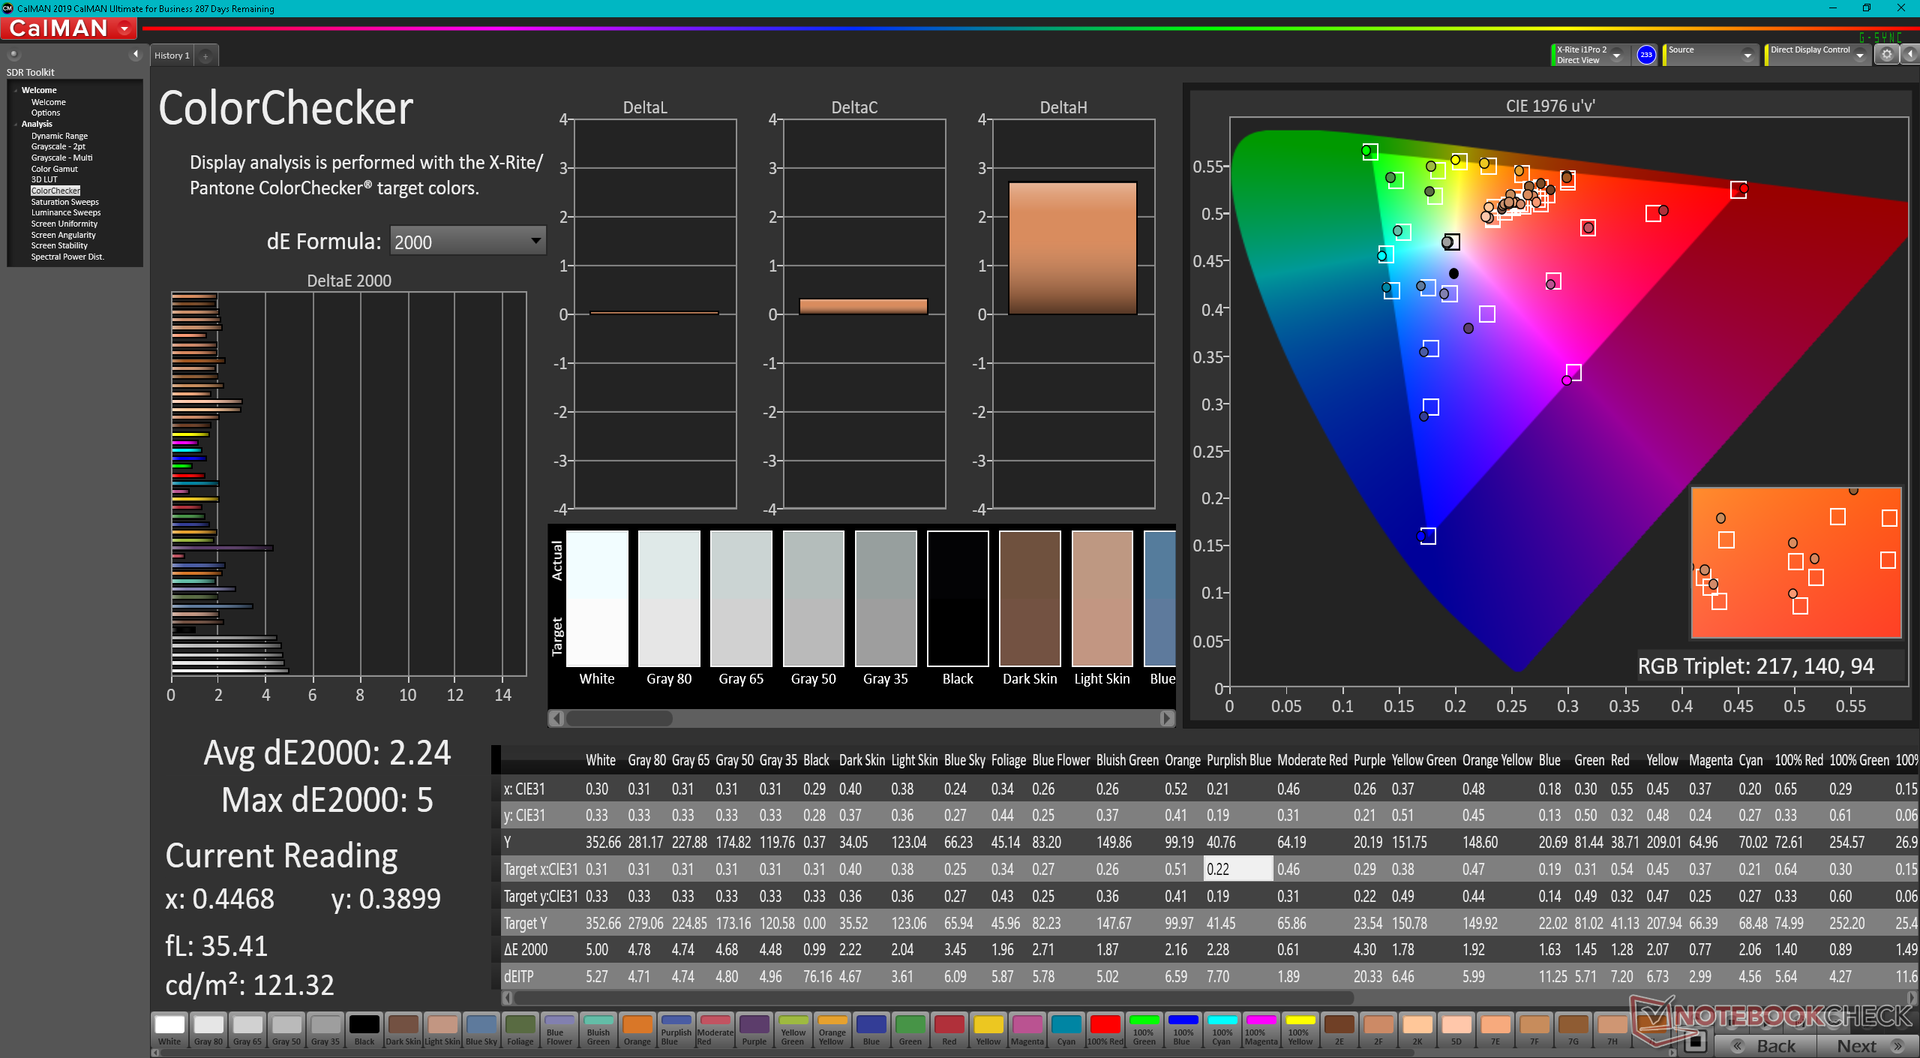
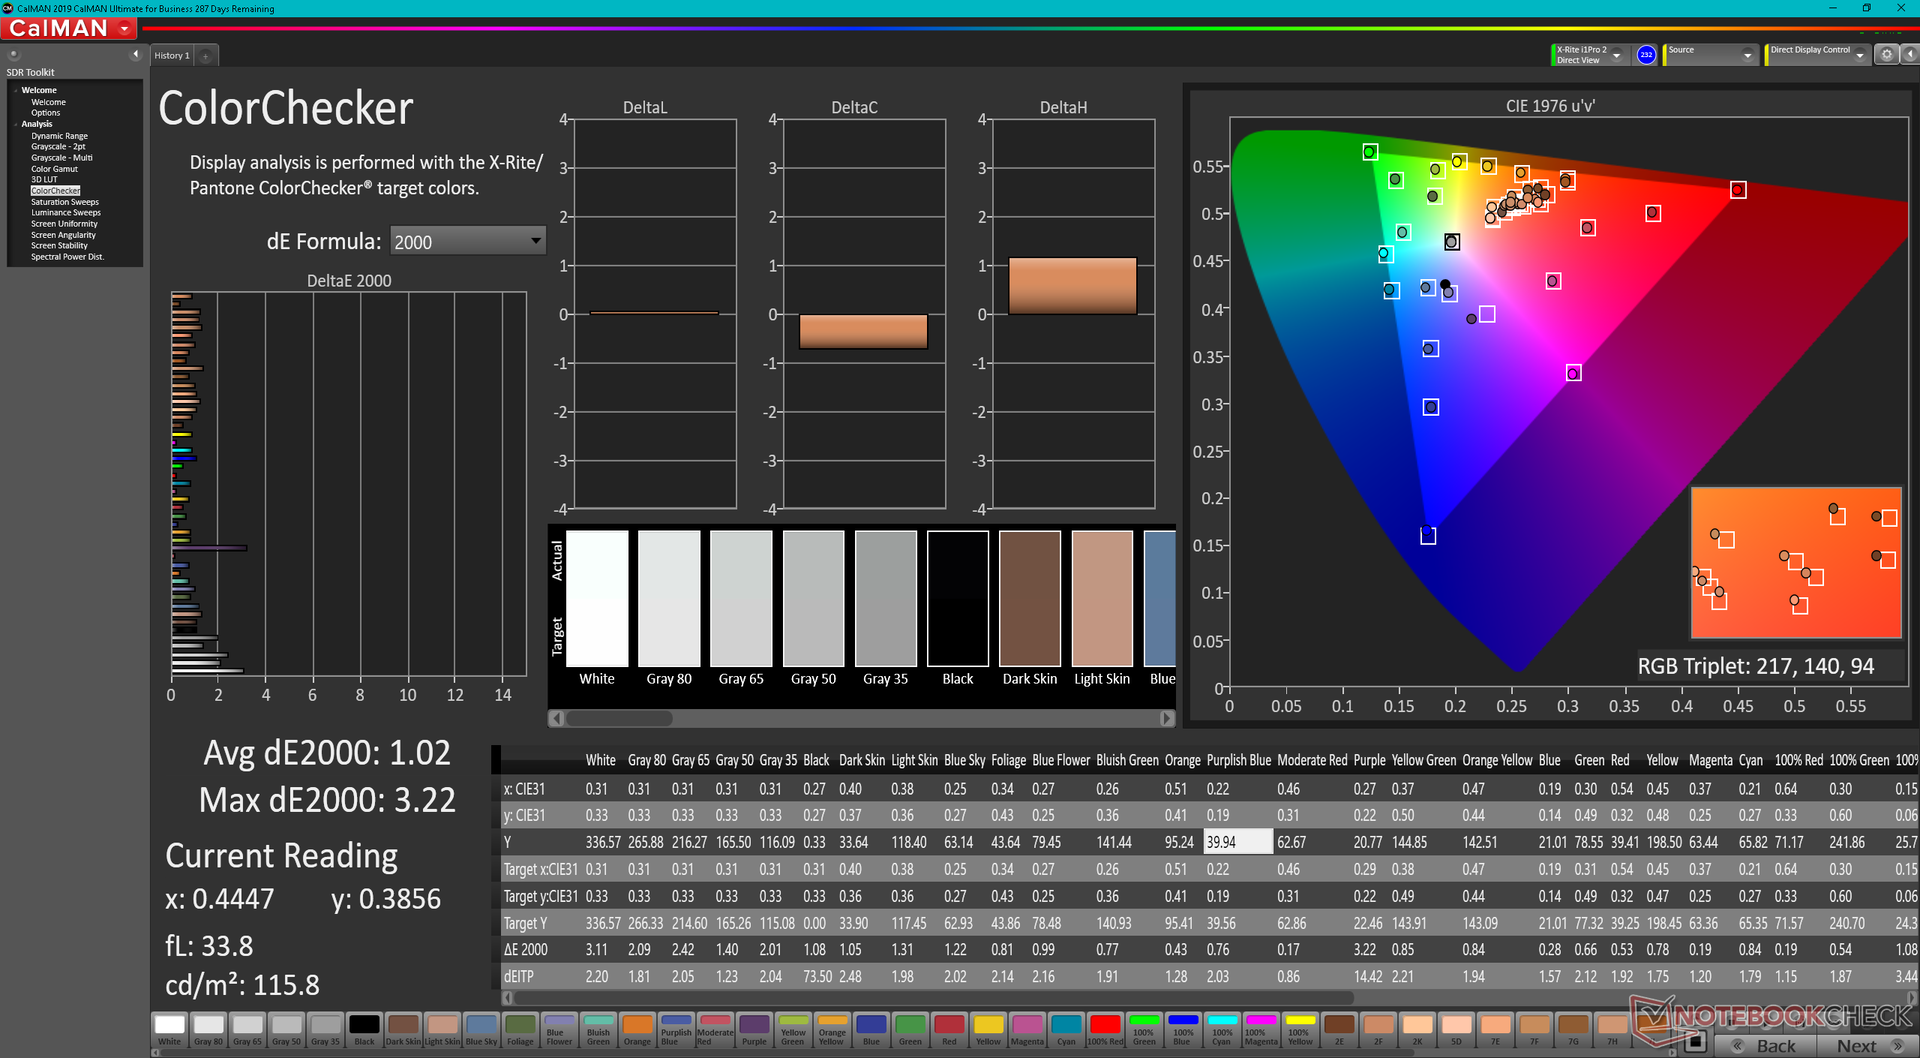
ΔE ColorChecker Calman: 2.24 | ∀{0.5-29.43 Ø4.73}
calibrated: 1.02
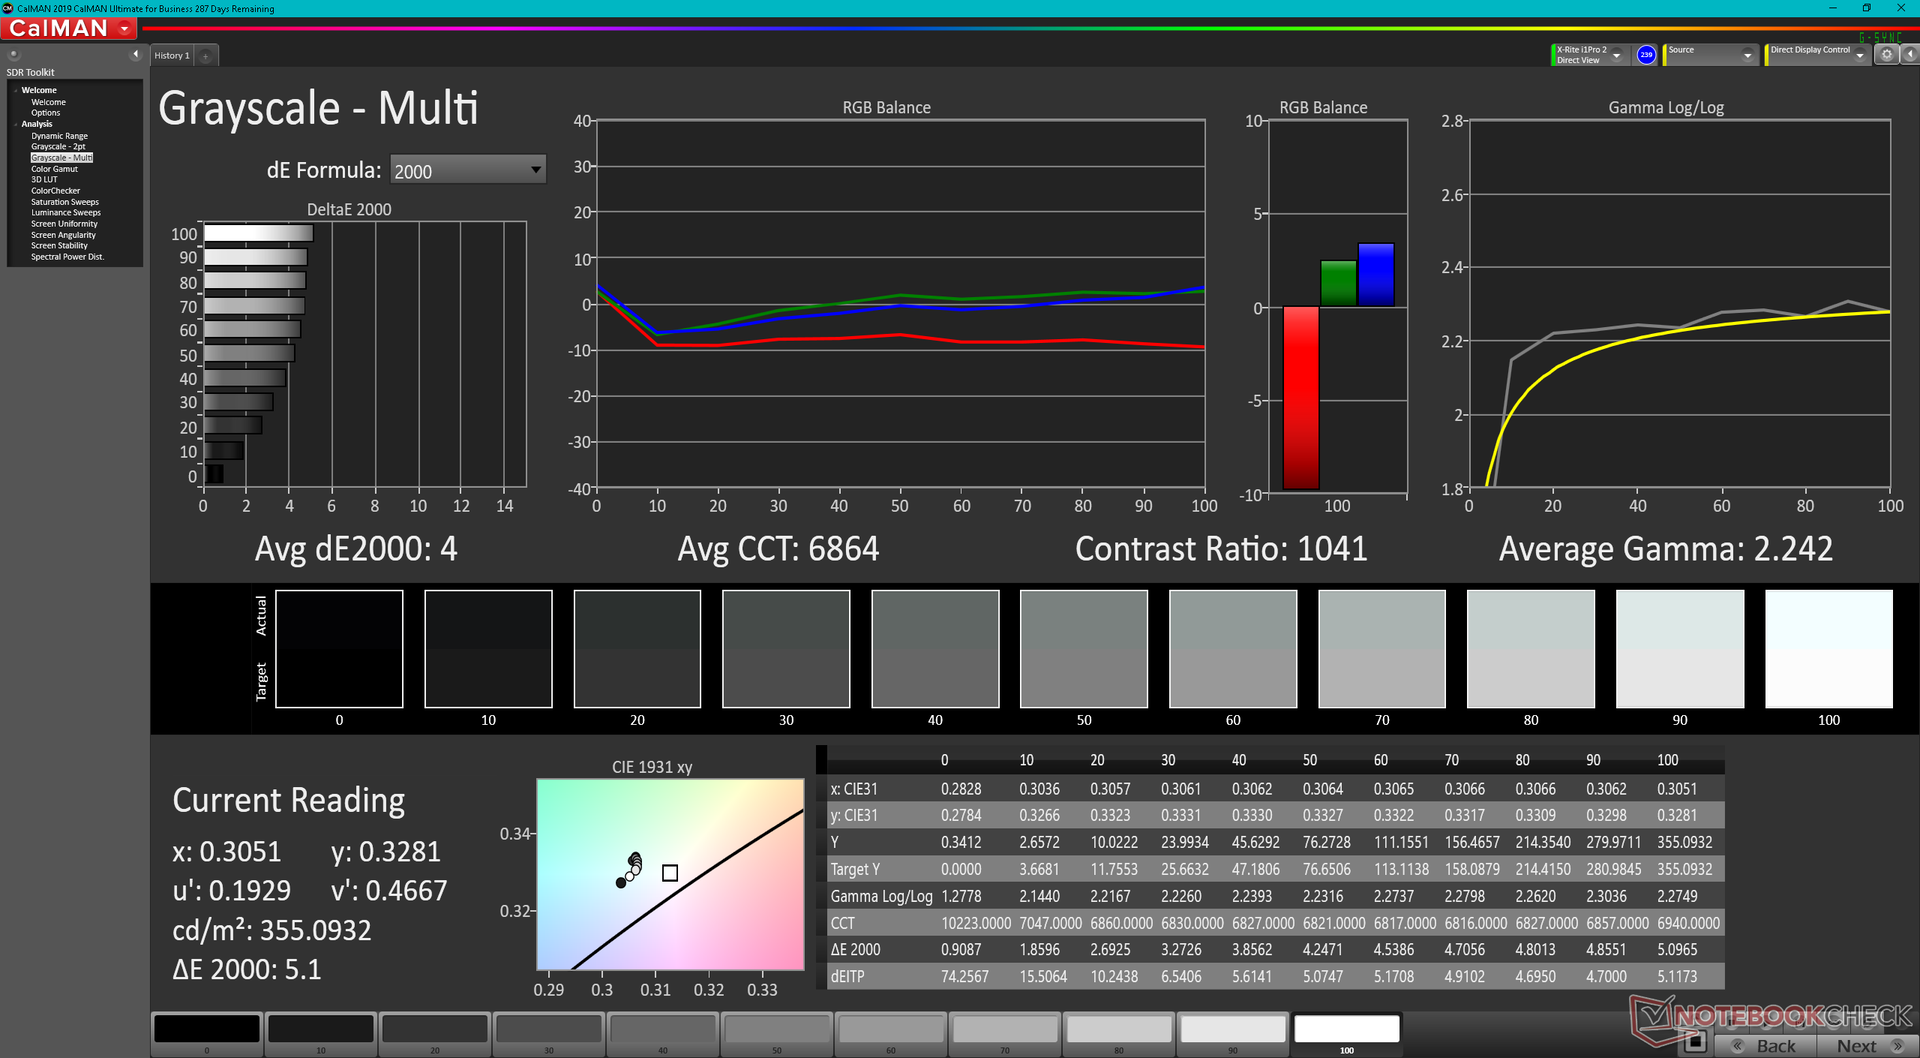
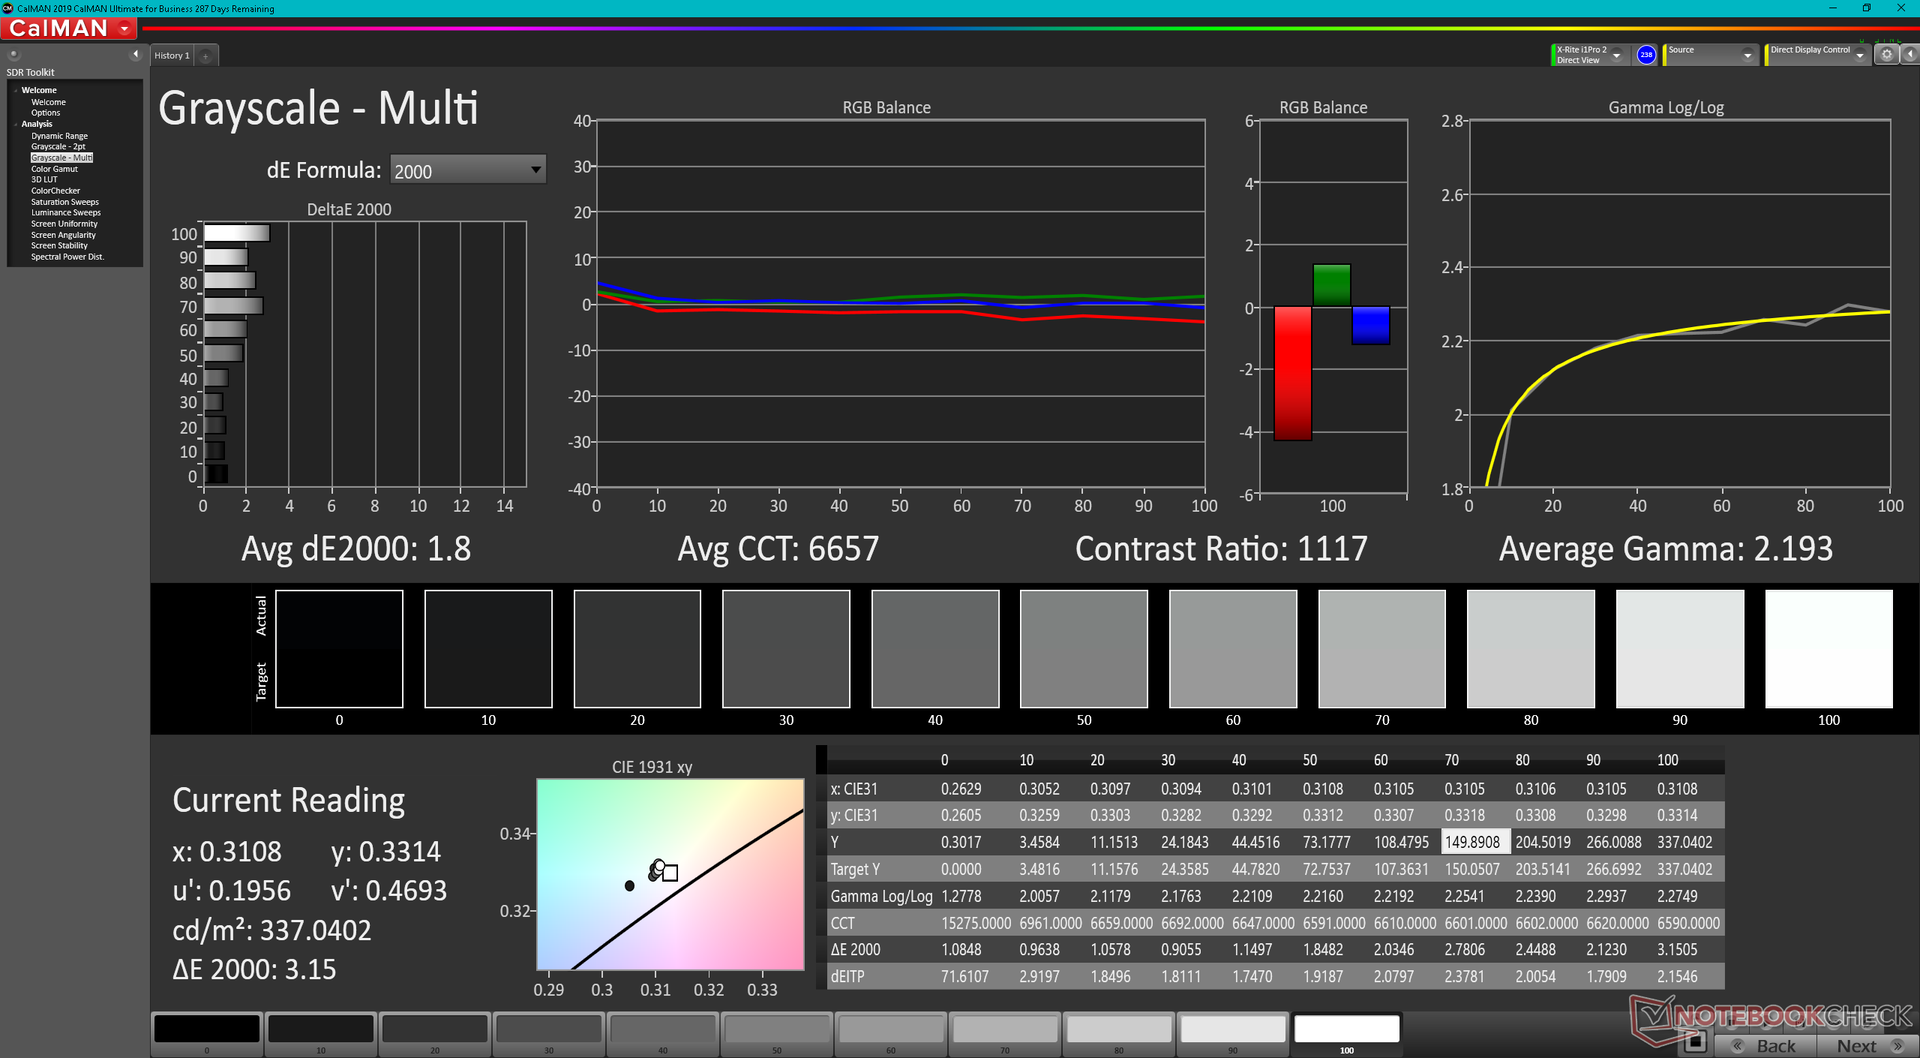
ΔE Greyscale Calman: 4 | ∀{0.09-98 Ø4.97}
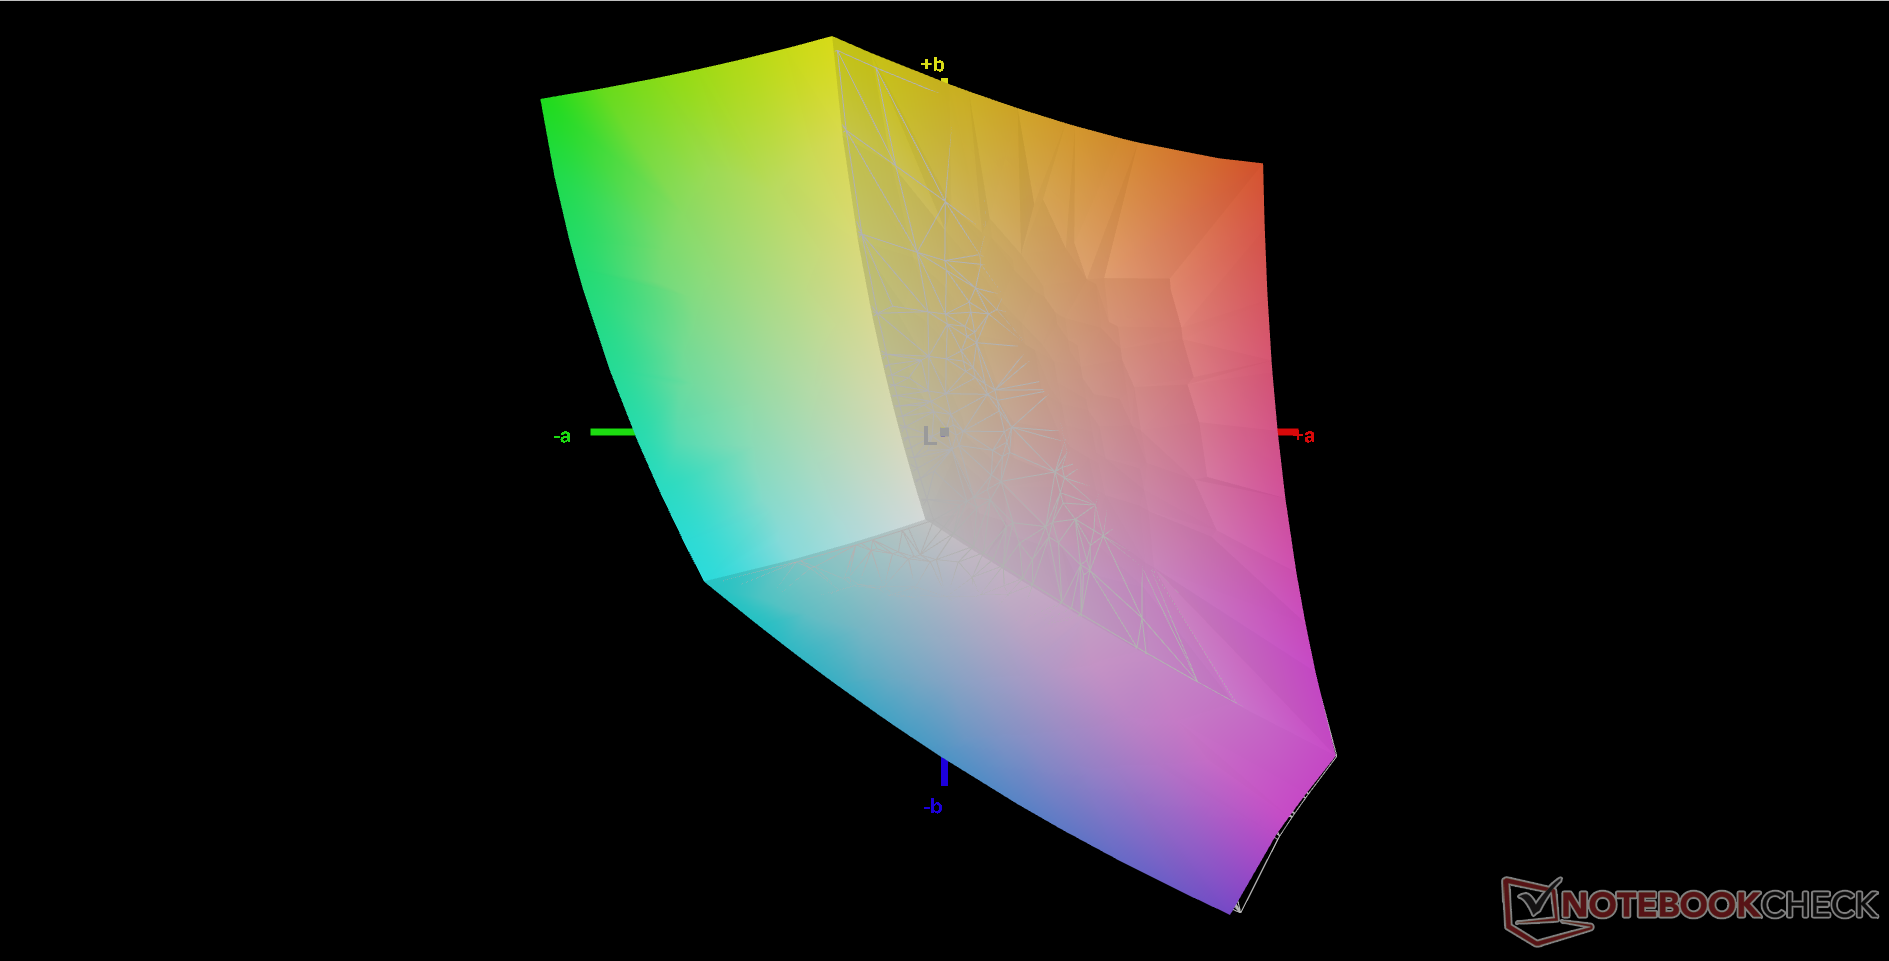
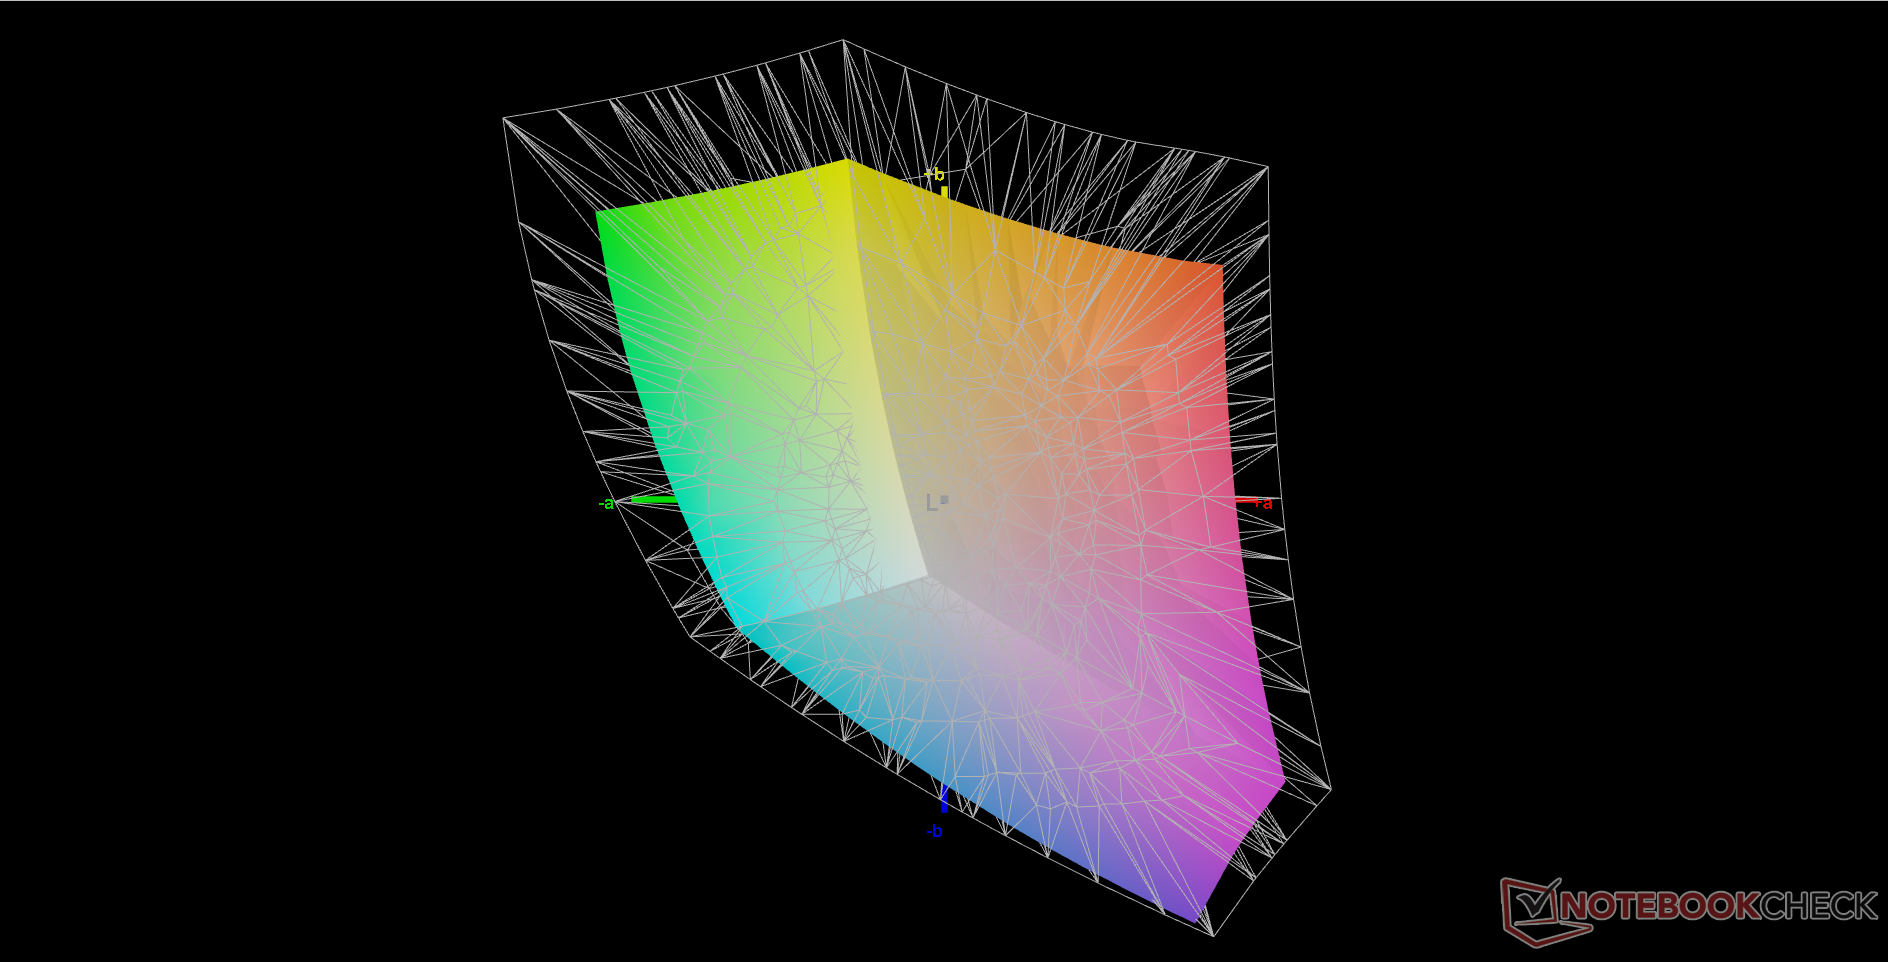
72.1% AdobeRGB 1998 (Argyll 3D)
99.5% sRGB (Argyll 3D)
70.1% Display P3 (Argyll 3D)
Gamma: 2.24
CCT: 6864 K
| MSI Vector GP66 12UGS BOE NE156FHM-NZ3, IPS, 1920x1080, 15.6" | MSI GP66 Leopard 11UH-028 LGD0625 (LP156WFG-SPB3), IPS, 1920x1080, 15.6" | MSI Katana GF66 11UG-220 AU Optronics B156HAN08.0, IPS, 1920x1080, 15.6" | Asus TUF Gaming F15 FX506HM Chi Mei N156HRA-EA1, IPS, 1920x1080, 15.6" | Razer Blade 15 Base Edition 2021, i7-10750H RTX 3060 BOE NV156FHM-N4K, IPS, 1920x1080, 15.6" | Alienware m15 R5 Ryzen Edition B156HAN, IPS, 1920x1080, 15.6" | |
|---|---|---|---|---|---|---|
| Display | -6% | -7% | -39% | -8% | ||
| Display P3 Coverage (%) | 70.1 | 65.2 -7% | 65.4 -7% | 41.9 -40% | 64.3 -8% | |
| sRGB Coverage (%) | 99.5 | 95.8 -4% | 91.3 -8% | 62.9 -37% | 91.8 -8% | |
| AdobeRGB 1998 Coverage (%) | 72.1 | 66 -8% | 66.7 -7% | 43.3 -40% | 65.5 -9% | |
| Response Times | -77% | -23% | -258% | -28% | 22% | |
| Response Time Grey 50% / Grey 80% * (ms) | 5.8 ? | 14 ? -141% | 7.4 ? -28% | 28.4 ? -390% | 8.8 ? -52% | 4 ? 31% |
| Response Time Black / White * (ms) | 9.6 ? | 10.8 ? -13% | 11.2 ? -17% | 21.6 ? -125% | 10 ? -4% | 8.4 ? 12% |
| PWM Frequency (Hz) | 1000 ? | |||||
| Bildschirm | -21% | -30% | -71% | -32% | 2% | |
| Helligkeit Bildmitte (cd/m²) | 353.1 | 390 10% | 307 -13% | 268.3 -24% | 317.2 -10% | 329 -7% |
| Brightness (cd/m²) | 325 | 362 11% | 321 -1% | 257 -21% | 306 -6% | 321 -1% |
| Brightness Distribution (%) | 85 | 87 2% | 83 -2% | 84 -1% | 89 5% | 92 8% |
| Schwarzwert * (cd/m²) | 0.38 | 0.41 -8% | 0.27 29% | 0.34 11% | 0.31 18% | 0.27 29% |
| Kontrast (:1) | 929 | 951 2% | 1137 22% | 789 -15% | 1023 10% | 1219 31% |
| Delta E Colorchecker * | 2.24 | 2.66 -19% | 4.67 -108% | 5.05 -125% | 4.37 -95% | 2.78 -24% |
| Colorchecker dE 2000 max. * | 5 | 7.14 -43% | 7.53 -51% | 15.43 -209% | 6.62 -32% | 4.88 2% |
| Colorchecker dE 2000 calibrated * | 1.02 | 2.56 -151% | 2.41 -136% | 3.21 -215% | 2.67 -162% | 1.63 -60% |
| Delta E Graustufen * | 4 | 3.63 9% | 4.5 -13% | 5.5 -38% | 4.5 -13% | 2.5 37% |
| Gamma | 2.24 98% | 2.57 86% | 2.276 97% | 2.35 94% | 2.4 92% | 2.106 104% |
| CCT | 6864 95% | 6894 94% | 6824 95% | 7392 88% | 7418 88% | 6201 105% |
| Farbraum (Prozent von AdobeRGB 1998) (%) | 59.2 | 76 | ||||
| Color Space (Percent of sRGB) (%) | 91.4 | 99 | ||||
| Durchschnitt gesamt (Programm / Settings) | -35% /
-26% | -20% /
-24% | -123% /
-91% | -23% /
-26% | 12% /
5% |
* ... kleinere Werte sind besser
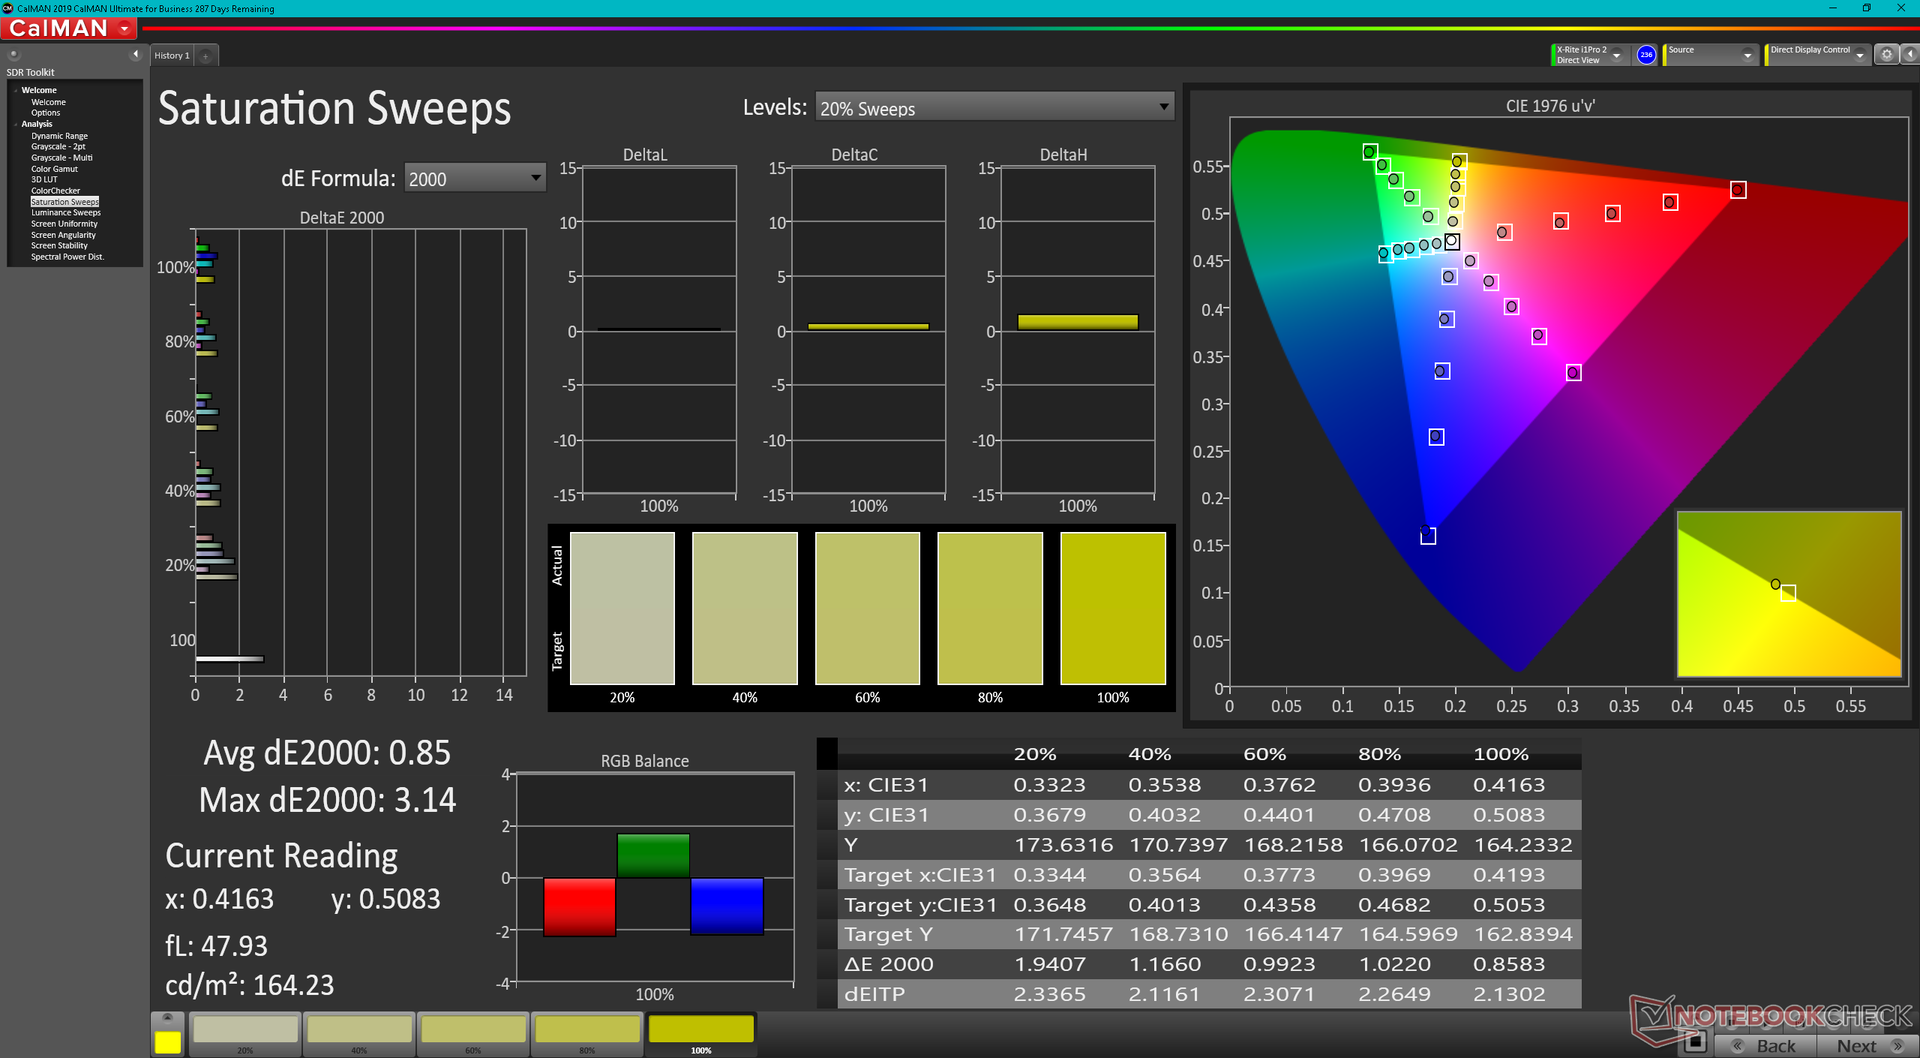
Das Panel deckt sRGB vollständig ab und AdobeRGB immer noch etwas mehr als bei den Panels eines GF66 Katana oder GP66 Leopard. Wir freuen uns hier ein qualitativ hochwertiges Panel vorzufinden, ganz im Gegensatz zum Chi Mei im Asus TUF Gaming F15, welches deutlich weniger Farben darstellen kann.
Ab Werk ist das Display ordentlich eingestellt, nur die Farbtemperatur könnte gerne etwas wärmer ausfallen. Eine manuelle Kalibrierung mit unserem X-Rite-Farbmessgerät nimmt sich dieser Sache an und verbessert die durchschnittlichen Graustufen und Farb-DeltaE-Werte von 4 und 2,24 auf nur noch 1,8 und 1,02.
Reaktionszeiten (Response Times) des Displays
| ↔ Reaktionszeiten Schwarz zu Weiß | ||
|---|---|---|
| 9.6 ms ... steigend ↗ und fallend ↘ kombiniert | ↗ 5.2 ms steigend | 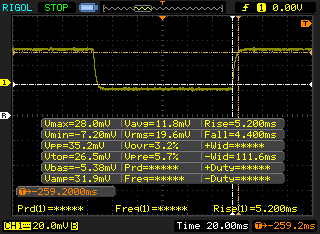 |
| ↘ 4.4 ms fallend | ||
| Die gemessenen Reaktionszeiten sind kurz wodurch sich der Bildschirm auch für Spiele gut eignen sollte. Im Vergleich rangierten die bei uns getesteten Geräte von 0.1 (Minimum) zu 240 (Maximum) ms. » 26 % aller Screens waren schneller als der getestete. Daher sind die gemessenen Reaktionszeiten besser als der Durchschnitt aller vermessenen Geräte (19.9 ms). | ||
| ↔ Reaktionszeiten 50% Grau zu 80% Grau | ||
| 5.8 ms ... steigend ↗ und fallend ↘ kombiniert | ↗ 3.4 ms steigend | 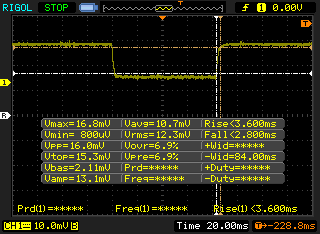 |
| ↘ 2.4 ms fallend | ||
| Die gemessenen Reaktionszeiten sind sehr kurz, wodurch sich der Bildschirm auch für schnelle 3D Spiele eignen sollte. Im Vergleich rangierten die bei uns getesteten Geräte von 0.165 (Minimum) zu 636 (Maximum) ms. » 18 % aller Screens waren schneller als der getestete. Daher sind die gemessenen Reaktionszeiten besser als der Durchschnitt aller vermessenen Geräte (31.1 ms). | ||
Bildschirm-Flackern / PWM (Pulse-Width Modulation)
| Flackern / PWM nicht festgestellt | 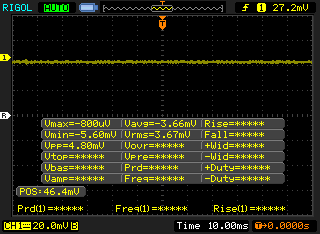 | ||
Im Vergleich: 52 % aller getesteten Geräte nutzten kein PWM um die Helligkeit zu reduzieren. Wenn PWM eingesetzt wurde, dann bei einer Frequenz von durchschnittlich 7791 (Minimum 5, Maximum 343500) Hz. | |||

Leistung - Großer CPU-Schub

Testbedingungen
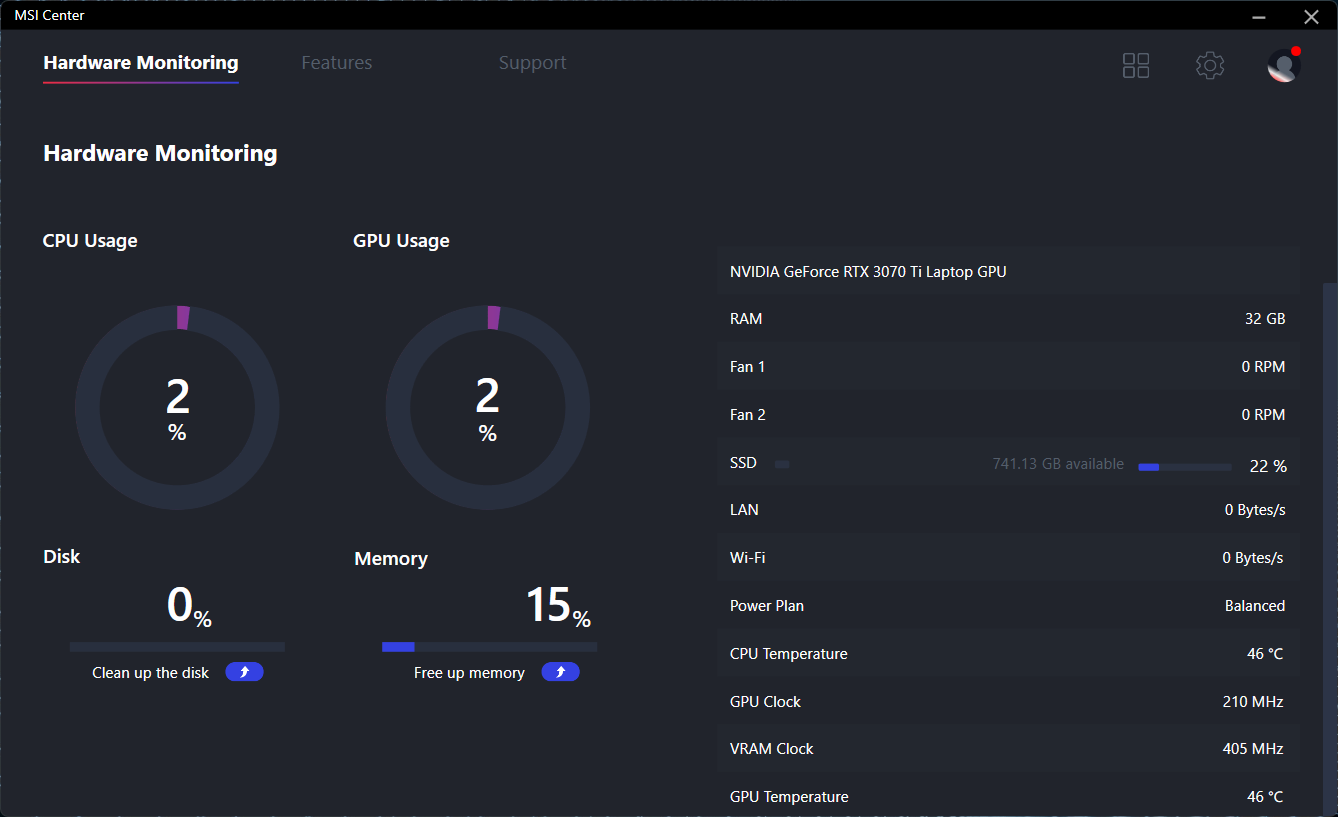
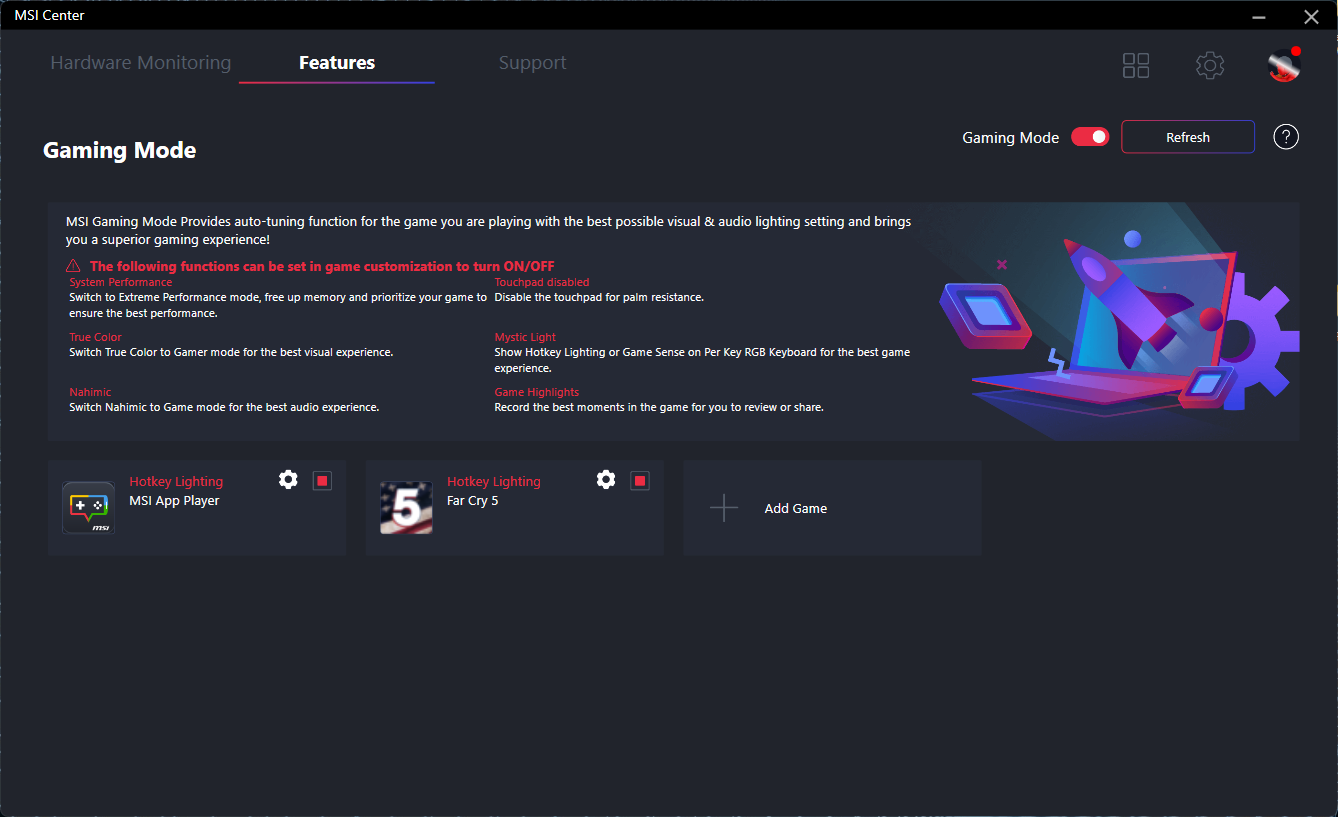
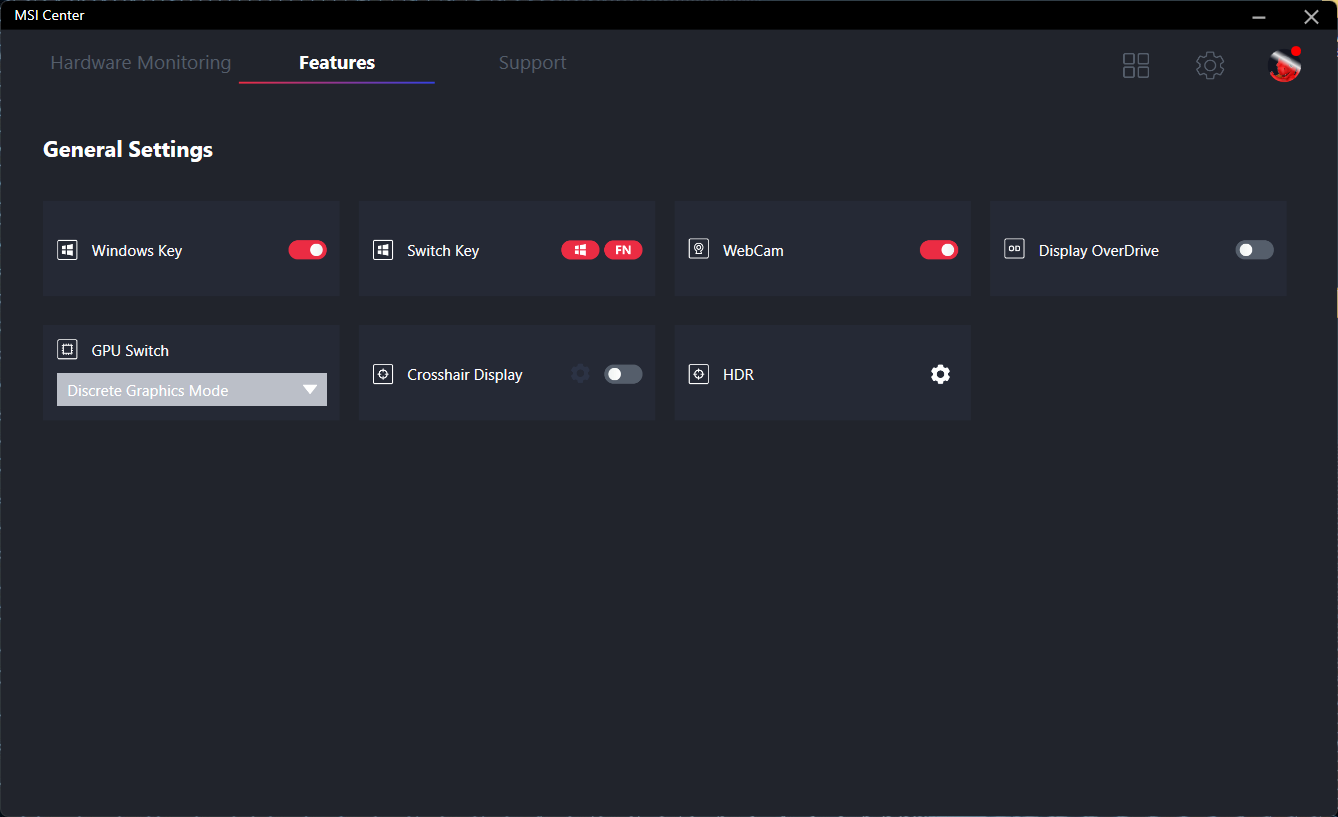
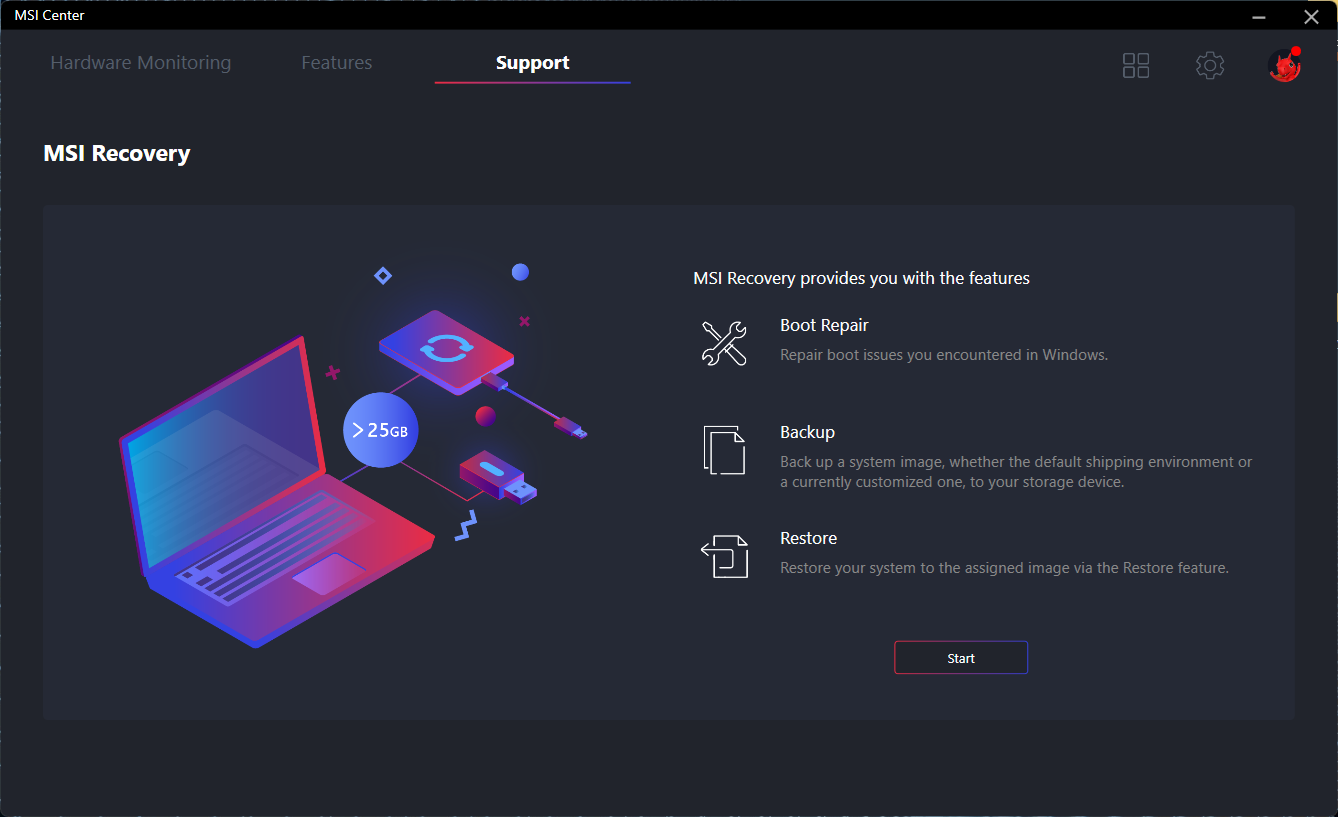
Unser Testmodell lief für die besten Benchmarkergebnisse im Extreme-Performance-Modus, im MSI Center war die dedizierte GPU immer aktiv. Nutzer sollten sich unbedingt mit der MSI-Software vertraut machen, viele wichtige Einstellungen wie MSHybrid, Hardware Monitoring, HDR und andere QoL-Optionen können hier justiert werden. Für die Hintergrundbeleuchtung der Tastatur müssen Nutzer auf die vorinstallierte SteelSeries-GG-Software zurückgreifen.
Ein Wechsel zwischen dem MSHybrid- und dem dGPU-only-Modus erfordert einen Neustart.
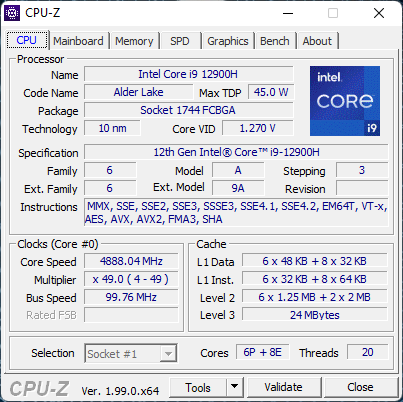
Prozessor
Der Core i9-12900H ist etwa 25 (Single-Thread) bzw. 35 Prozent (Multi-Thread) schneller als der letztjährige Core i7-11800H im GP66 Leopard. Die allgemeine Leistung übertrifft sogar die der stromhungrigeren Desktop-CPU Core i9-11900K. Bislang hielt AMDs Zen-3-H-Serie die Leistungskrone, aber das war vor dem Launch von Intels Alder-Lake-H-Serie.
Weitere Informationen zu Alder Lake kann auf unserer Übersichtsseite zur neuen Plattform nachgelesen werden.
Cinebench R15 Multi Loop
Cinebench R23: Multi Core | Single Core
Cinebench R15: CPU Multi 64Bit | CPU Single 64Bit
Blender: v2.79 BMW27 CPU
7-Zip 18.03: 7z b 4 | 7z b 4 -mmt1
Geekbench 5.5: Multi-Core | Single-Core
HWBOT x265 Benchmark v2.2: 4k Preset
LibreOffice : 20 Documents To PDF
R Benchmark 2.5: Overall mean
| Cinebench R20 / CPU (Multi Core) | |
| Intel Core i9-12900K | |
| MSI Vector GP66 12UGS | |
| MSI MEG Z590 ACE | |
| Durchschnittliche Intel Core i9-12900H (2681 - 7471, n=28) | |
| Eurocom Nightsky ARX315 | |
| MSI GP66 Leopard 11UH-028 | |
| HP ZBook Fury 15 G8 | |
| MSI Alpha 15 B5EEK-008 | |
| MSI Delta 15 A5EFK | |
| Alienware m15 R4 | |
| MSI GE65 Raider 9SF-049US | |
| Razer Blade 15 Advanced Model Early 2021 | |
| Cinebench R20 / CPU (Single Core) | |
| Intel Core i9-12900K | |
| MSI Vector GP66 12UGS | |
| Durchschnittliche Intel Core i9-12900H (624 - 738, n=28) | |
| MSI MEG Z590 ACE | |
| HP ZBook Fury 15 G8 | |
| Eurocom Nightsky ARX315 | |
| MSI GP66 Leopard 11UH-028 | |
| MSI Delta 15 A5EFK | |
| MSI Alpha 15 B5EEK-008 | |
| Alienware m15 R4 | |
| Razer Blade 15 Advanced Model Early 2021 | |
| MSI GE65 Raider 9SF-049US | |
| Cinebench R23 / Multi Core | |
| Intel Core i9-12900K | |
| MSI Vector GP66 12UGS | |
| MSI MEG Z590 ACE | |
| Durchschnittliche Intel Core i9-12900H (7359 - 19648, n=28) | |
| Eurocom Nightsky ARX315 | |
| MSI GP66 Leopard 11UH-028 | |
| HP ZBook Fury 15 G8 | |
| MSI Alpha 15 B5EEK-008 | |
| MSI Delta 15 A5EFK | |
| Razer Blade 15 Advanced Model Early 2021 | |
| Cinebench R23 / Single Core | |
| Intel Core i9-12900K | |
| MSI Vector GP66 12UGS | |
| Durchschnittliche Intel Core i9-12900H (1634 - 1930, n=28) | |
| MSI MEG Z590 ACE | |
| HP ZBook Fury 15 G8 | |
| Eurocom Nightsky ARX315 | |
| MSI GP66 Leopard 11UH-028 | |
| MSI Delta 15 A5EFK | |
| MSI Alpha 15 B5EEK-008 | |
| Razer Blade 15 Advanced Model Early 2021 | |
| Cinebench R15 / CPU Multi 64Bit | |
| Intel Core i9-12900K | |
| Durchschnittliche Intel Core i9-12900H (1395 - 3077, n=28) | |
| MSI Vector GP66 12UGS | |
| MSI MEG Z590 ACE | |
| Eurocom Nightsky ARX315 | |
| MSI Delta 15 A5EFK | |
| MSI GP66 Leopard 11UH-028 | |
| MSI Alpha 15 B5EEK-008 | |
| HP ZBook Fury 15 G8 | |
| MSI GE65 Raider 9SF-049US | |
| Alienware m15 R4 | |
| Razer Blade 15 Advanced Model Early 2021 | |
| Cinebench R15 / CPU Single 64Bit | |
| Intel Core i9-12900K | |
| MSI Vector GP66 12UGS | |
| Durchschnittliche Intel Core i9-12900H (235 - 277, n=29) | |
| MSI MEG Z590 ACE | |
| Eurocom Nightsky ARX315 | |
| HP ZBook Fury 15 G8 | |
| MSI Delta 15 A5EFK | |
| MSI Alpha 15 B5EEK-008 | |
| MSI GP66 Leopard 11UH-028 | |
| Alienware m15 R4 | |
| Razer Blade 15 Advanced Model Early 2021 | |
| MSI GE65 Raider 9SF-049US | |
| Blender / v2.79 BMW27 CPU | |
| Razer Blade 15 Advanced Model Early 2021 | |
| Alienware m15 R4 | |
| HP ZBook Fury 15 G8 | |
| MSI Alpha 15 B5EEK-008 | |
| MSI GP66 Leopard 11UH-028 | |
| MSI Delta 15 A5EFK | |
| Durchschnittliche Intel Core i9-12900H (160 - 451, n=28) | |
| Eurocom Nightsky ARX315 | |
| MSI Vector GP66 12UGS | |
| MSI MEG Z590 ACE | |
| Intel Core i9-12900K | |
| 7-Zip 18.03 / 7z b 4 | |
| Intel Core i9-12900K | |
| Eurocom Nightsky ARX315 | |
| MSI Vector GP66 12UGS | |
| MSI MEG Z590 ACE | |
| Durchschnittliche Intel Core i9-12900H (34684 - 76677, n=28) | |
| MSI Delta 15 A5EFK | |
| MSI Alpha 15 B5EEK-008 | |
| MSI GP66 Leopard 11UH-028 | |
| HP ZBook Fury 15 G8 | |
| Alienware m15 R4 | |
| Razer Blade 15 Advanced Model Early 2021 | |
| 7-Zip 18.03 / 7z b 4 -mmt1 | |
| Intel Core i9-12900K | |
| Eurocom Nightsky ARX315 | |
| MSI MEG Z590 ACE | |
| MSI Vector GP66 12UGS | |
| Durchschnittliche Intel Core i9-12900H (5302 - 6289, n=28) | |
| HP ZBook Fury 15 G8 | |
| MSI Delta 15 A5EFK | |
| MSI GP66 Leopard 11UH-028 | |
| MSI Alpha 15 B5EEK-008 | |
| Alienware m15 R4 | |
| Razer Blade 15 Advanced Model Early 2021 | |
| Geekbench 5.5 / Multi-Core | |
| Intel Core i9-12900K | |
| MSI Vector GP66 12UGS | |
| Durchschnittliche Intel Core i9-12900H (8519 - 14376, n=31) | |
| MSI MEG Z590 ACE | |
| Eurocom Nightsky ARX315 | |
| MSI GP66 Leopard 11UH-028 | |
| MSI Delta 15 A5EFK | |
| MSI Alpha 15 B5EEK-008 | |
| Alienware m15 R4 | |
| Razer Blade 15 Advanced Model Early 2021 | |
| Geekbench 5.5 / Single-Core | |
| Intel Core i9-12900K | |
| MSI Vector GP66 12UGS | |
| Durchschnittliche Intel Core i9-12900H (1631 - 1897, n=31) | |
| MSI MEG Z590 ACE | |
| Eurocom Nightsky ARX315 | |
| MSI GP66 Leopard 11UH-028 | |
| MSI Delta 15 A5EFK | |
| MSI Alpha 15 B5EEK-008 | |
| Alienware m15 R4 | |
| Razer Blade 15 Advanced Model Early 2021 | |
| HWBOT x265 Benchmark v2.2 / 4k Preset | |
| Intel Core i9-12900K | |
| MSI Vector GP66 12UGS | |
| MSI MEG Z590 ACE | |
| Eurocom Nightsky ARX315 | |
| Durchschnittliche Intel Core i9-12900H (8.05 - 22.5, n=28) | |
| MSI Delta 15 A5EFK | |
| MSI GP66 Leopard 11UH-028 | |
| MSI Alpha 15 B5EEK-008 | |
| HP ZBook Fury 15 G8 | |
| Alienware m15 R4 | |
| Razer Blade 15 Advanced Model Early 2021 | |
| LibreOffice / 20 Documents To PDF | |
| MSI Alpha 15 B5EEK-008 | |
| Razer Blade 15 Advanced Model Early 2021 | |
| MSI Delta 15 A5EFK | |
| HP ZBook Fury 15 G8 | |
| Alienware m15 R4 | |
| MSI GP66 Leopard 11UH-028 | |
| Eurocom Nightsky ARX315 | |
| Durchschnittliche Intel Core i9-12900H (36.8 - 59.8, n=28) | |
| MSI MEG Z590 ACE | |
| Intel Core i9-12900K | |
| MSI Vector GP66 12UGS | |
| R Benchmark 2.5 / Overall mean | |
| Razer Blade 15 Advanced Model Early 2021 | |
| Alienware m15 R4 | |
| MSI GP66 Leopard 11UH-028 | |
| HP ZBook Fury 15 G8 | |
| MSI Alpha 15 B5EEK-008 | |
| MSI Delta 15 A5EFK | |
| Eurocom Nightsky ARX315 | |
| MSI MEG Z590 ACE | |
| Durchschnittliche Intel Core i9-12900H (0.4218 - 0.506, n=28) | |
| MSI Vector GP66 12UGS | |
| Intel Core i9-12900K | |
* ... kleinere Werte sind besser
AIDA64: FP32 Ray-Trace | FPU Julia | CPU SHA3 | CPU Queen | FPU SinJulia | FPU Mandel | CPU AES | CPU ZLib | FP64 Ray-Trace | CPU PhotoWorxx
| Performance Rating | |
| MSI GP66 Leopard 11UH-028 | |
| Alienware m15 R5 Ryzen Edition | |
| Durchschnittliche Intel Core i9-12900H | |
| MSI Vector GP66 12UGS | |
| MSI Katana GF66 11UG-220 -9! | |
| Asus TUF Gaming F15 FX506HM -9! | |
| AIDA64 / FP32 Ray-Trace | |
| MSI GP66 Leopard 11UH-028 | |
| Alienware m15 R5 Ryzen Edition | |
| Durchschnittliche Intel Core i9-12900H (4074 - 18289, n=29) | |
| MSI Vector GP66 12UGS | |
| AIDA64 / FPU Julia | |
| Alienware m15 R5 Ryzen Edition | |
| MSI GP66 Leopard 11UH-028 | |
| Durchschnittliche Intel Core i9-12900H (22307 - 93236, n=29) | |
| MSI Vector GP66 12UGS | |
| AIDA64 / CPU SHA3 | |
| MSI GP66 Leopard 11UH-028 | |
| Alienware m15 R5 Ryzen Edition | |
| Durchschnittliche Intel Core i9-12900H (1378 - 4215, n=29) | |
| MSI Vector GP66 12UGS | |
| AIDA64 / CPU Queen | |
| MSI Vector GP66 12UGS | |
| Durchschnittliche Intel Core i9-12900H (78172 - 111241, n=28) | |
| Alienware m15 R5 Ryzen Edition | |
| MSI GP66 Leopard 11UH-028 | |
| AIDA64 / FPU SinJulia | |
| Alienware m15 R5 Ryzen Edition | |
| MSI GP66 Leopard 11UH-028 | |
| MSI Vector GP66 12UGS | |
| Durchschnittliche Intel Core i9-12900H (5709 - 10410, n=29) | |
| AIDA64 / FPU Mandel | |
| Alienware m15 R5 Ryzen Edition | |
| MSI GP66 Leopard 11UH-028 | |
| Durchschnittliche Intel Core i9-12900H (11257 - 45581, n=29) | |
| MSI Vector GP66 12UGS | |
| AIDA64 / CPU AES | |
| MSI GP66 Leopard 11UH-028 | |
| Alienware m15 R5 Ryzen Edition | |
| MSI Vector GP66 12UGS | |
| Durchschnittliche Intel Core i9-12900H (31935 - 151546, n=29) | |
| AIDA64 / CPU ZLib | |
| MSI Vector GP66 12UGS | |
| Durchschnittliche Intel Core i9-12900H (449 - 1193, n=29) | |
| MSI GP66 Leopard 11UH-028 | |
| Alienware m15 R5 Ryzen Edition | |
| Asus TUF Gaming F15 FX506HM | |
| MSI Katana GF66 11UG-220 | |
| AIDA64 / FP64 Ray-Trace | |
| MSI GP66 Leopard 11UH-028 | |
| Alienware m15 R5 Ryzen Edition | |
| Durchschnittliche Intel Core i9-12900H (2235 - 10511, n=29) | |
| MSI Vector GP66 12UGS | |
| AIDA64 / CPU PhotoWorxx | |
| Durchschnittliche Intel Core i9-12900H (20960 - 48269, n=30) | |
| MSI Vector GP66 12UGS | |
| MSI GP66 Leopard 11UH-028 | |
| Alienware m15 R5 Ryzen Edition | |
Systemleistung
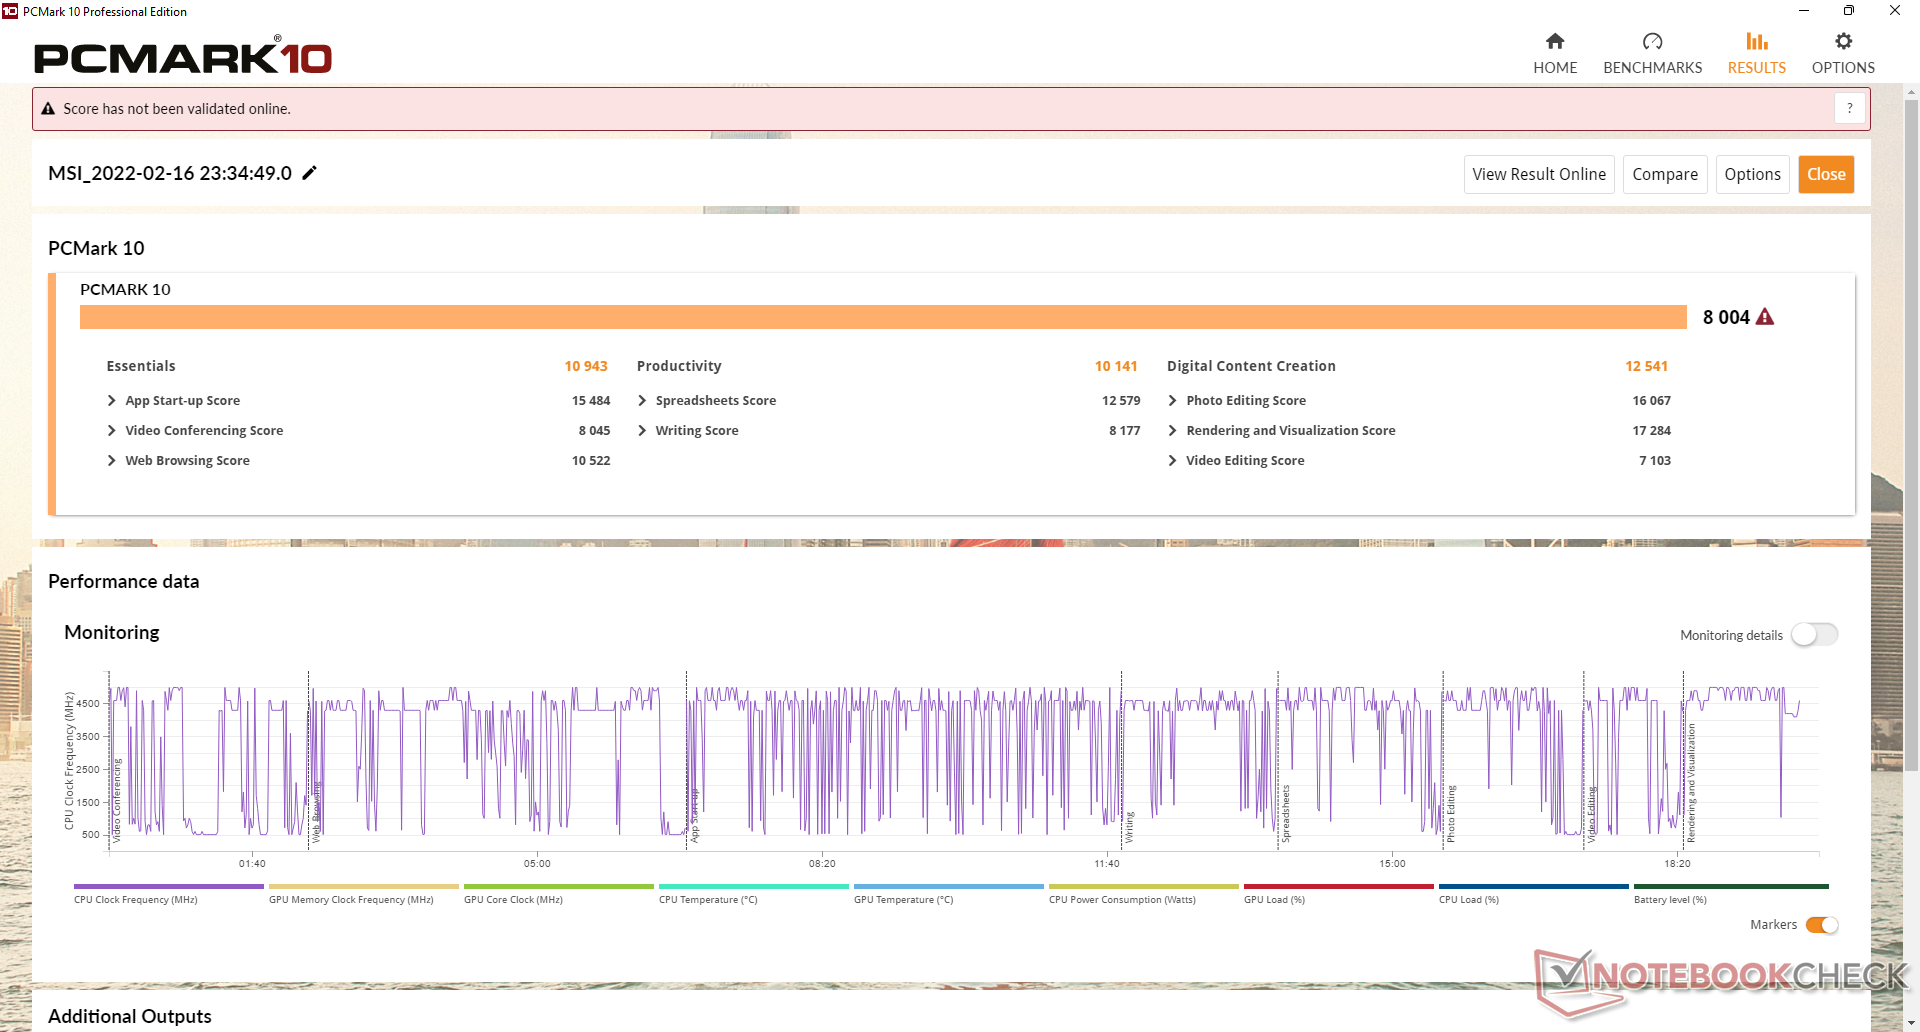
Die PCMark-Scores gehören mit knapp über 8.000 Punkten zu den höchsten aus unserer Datenbank. Das MSI Raider GE76 mit entriegeltem Core i9-12900HK und schnellerer GeForce RTX 3080 Ti kommt quasi auf die gleichen Werte wie unser GP66.
An dieser Stelle müssen wir darauf hinweisen, dass wir Probleme beim Sleep- und Wake-Vorgang hatten. Denn manchmal blieb der Bildschirm einfach schwarz, wenn wir den Sleep-Modus aktiviert oder die Performance-Modi gewechselt haben. Nur ein Neustart (Hard Reset) half dann noch.
| PCMark 10 / Score | |
| MSI Vector GP66 12UGS | |
| Durchschnittliche Intel Core i9-12900H, NVIDIA GeForce RTX 3070 Ti Laptop GPU (7087 - 8072, n=6) | |
| MSI GP66 Leopard 11UH-028 | |
| Asus TUF Gaming F15 FX506HM | |
| MSI Katana GF66 11UG-220 | |
| Alienware m15 R5 Ryzen Edition | |
| Razer Blade 15 Base Edition 2021, i7-10750H RTX 3060 | |
| PCMark 10 / Essentials | |
| MSI Vector GP66 12UGS | |
| Durchschnittliche Intel Core i9-12900H, NVIDIA GeForce RTX 3070 Ti Laptop GPU (10266 - 11663, n=6) | |
| Asus TUF Gaming F15 FX506HM | |
| MSI GP66 Leopard 11UH-028 | |
| Razer Blade 15 Base Edition 2021, i7-10750H RTX 3060 | |
| Alienware m15 R5 Ryzen Edition | |
| MSI Katana GF66 11UG-220 | |
| PCMark 10 / Productivity | |
| Durchschnittliche Intel Core i9-12900H, NVIDIA GeForce RTX 3070 Ti Laptop GPU (9402 - 10742, n=6) | |
| MSI Vector GP66 12UGS | |
| MSI Katana GF66 11UG-220 | |
| Alienware m15 R5 Ryzen Edition | |
| Asus TUF Gaming F15 FX506HM | |
| MSI GP66 Leopard 11UH-028 | |
| Razer Blade 15 Base Edition 2021, i7-10750H RTX 3060 | |
| PCMark 10 / Digital Content Creation | |
| MSI Vector GP66 12UGS | |
| Durchschnittliche Intel Core i9-12900H, NVIDIA GeForce RTX 3070 Ti Laptop GPU (10009 - 12541, n=6) | |
| MSI GP66 Leopard 11UH-028 | |
| MSI Katana GF66 11UG-220 | |
| Asus TUF Gaming F15 FX506HM | |
| Alienware m15 R5 Ryzen Edition | |
| Razer Blade 15 Base Edition 2021, i7-10750H RTX 3060 | |
| PCMark 10 Score | 8004 Punkte | |
Hilfe | ||
| AIDA64 / Memory Copy | |
| Durchschnittliche Intel Core i9-12900H (34438 - 74264, n=29) | |
| MSI Vector GP66 12UGS | |
| MSI GP66 Leopard 11UH-028 | |
| Alienware m15 R5 Ryzen Edition | |
| AIDA64 / Memory Read | |
| Durchschnittliche Intel Core i9-12900H (36365 - 74642, n=29) | |
| MSI GP66 Leopard 11UH-028 | |
| MSI Vector GP66 12UGS | |
| Alienware m15 R5 Ryzen Edition | |
| AIDA64 / Memory Write | |
| Durchschnittliche Intel Core i9-12900H (32276 - 67858, n=29) | |
| MSI Vector GP66 12UGS | |
| MSI GP66 Leopard 11UH-028 | |
| Alienware m15 R5 Ryzen Edition | |
| AIDA64 / Memory Latency | |
| MSI GP66 Leopard 11UH-028 | |
| MSI Vector GP66 12UGS | |
| Durchschnittliche Intel Core i9-12900H (74.7 - 118.1, n=28) | |
| Alienware m15 R5 Ryzen Edition | |
| Asus TUF Gaming F15 FX506HM | |
| MSI Katana GF66 11UG-220 | |
| MSI Katana GF66 11UG-220 | |
* ... kleinere Werte sind besser
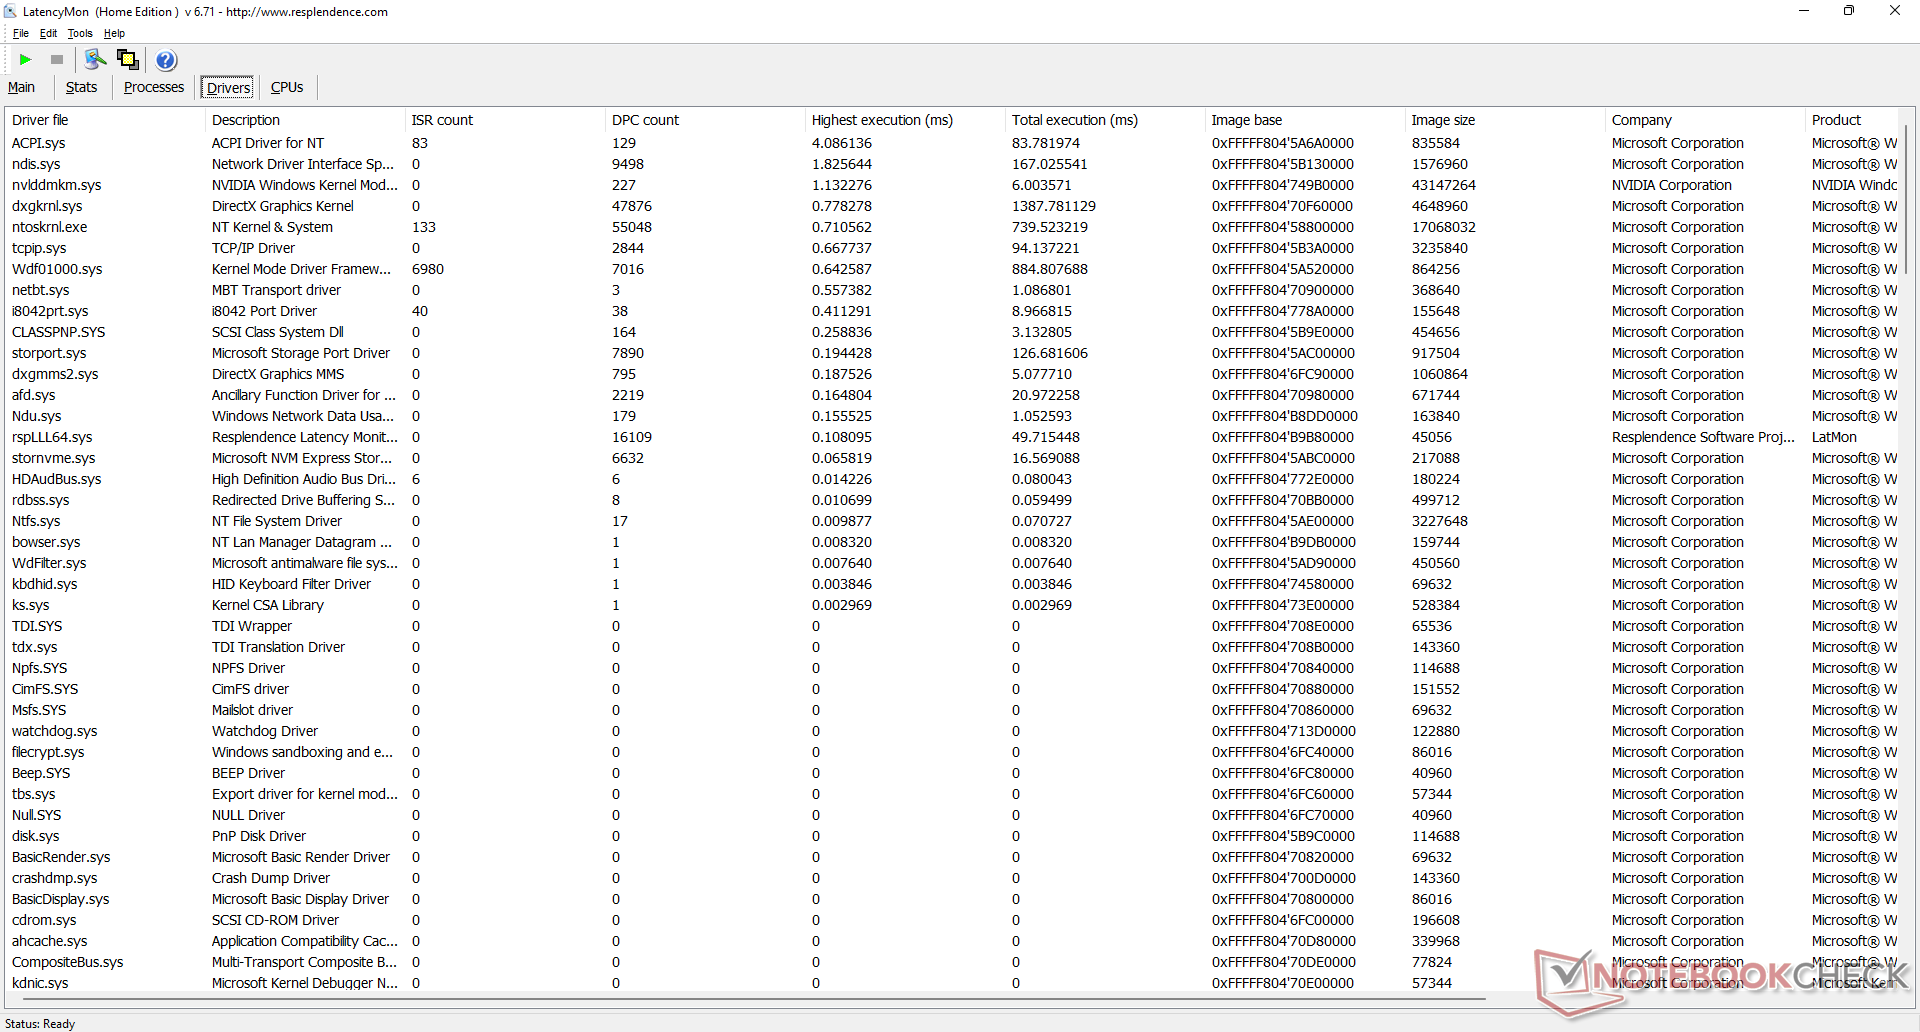
DPC Latency
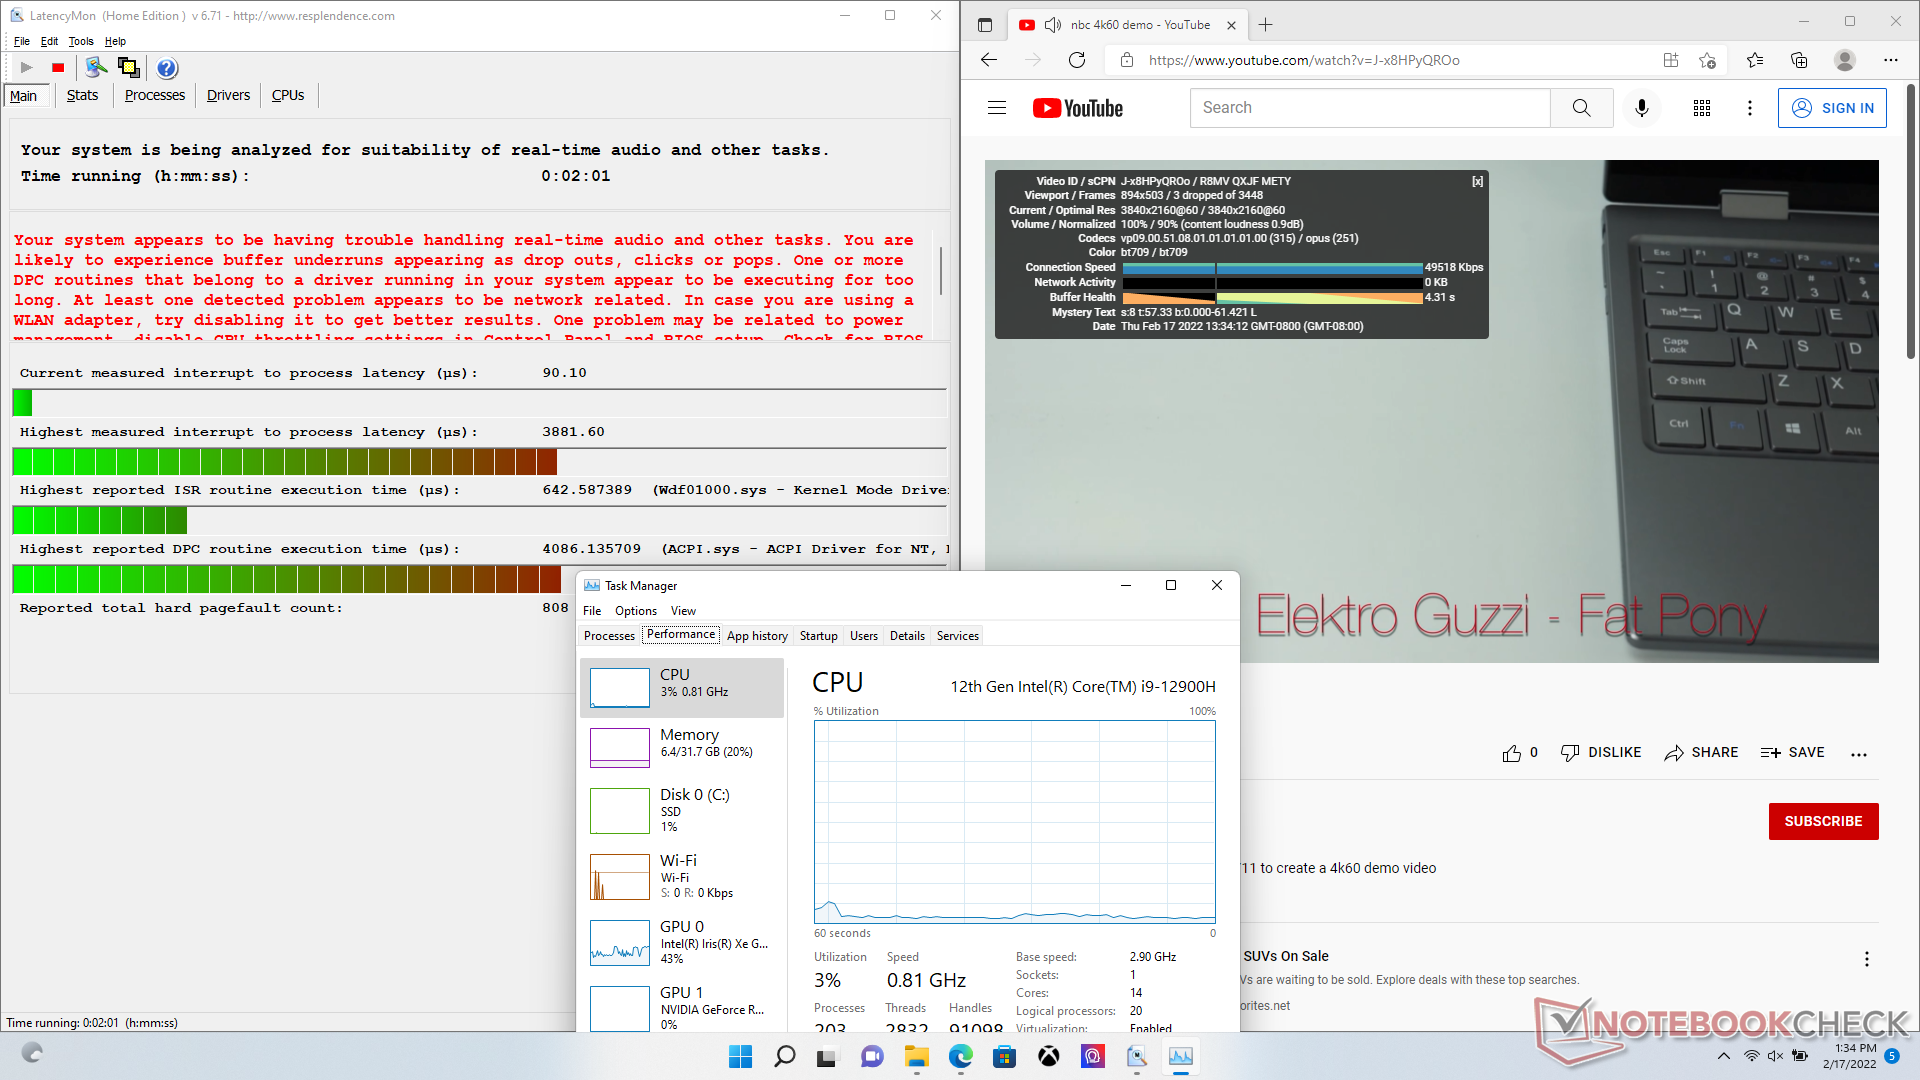
LatencyMon deckt DPC-Probleme beim Öffnen mehrerer Browsertabs auf. Immerhin war die Wiedergabe unseres 4K/60-fps-YouTube-Testviedeos flüssig und lief mit nur 3 Dropped Frames ab.
| DPC Latencies / LatencyMon - interrupt to process latency (max), Web, Youtube, Prime95 | |
| MSI Vector GP66 12UGS | |
| Asus TUF Gaming F15 FX506HM | |
| MSI Katana GF66 11UG-220 | |
| MSI GP66 Leopard 11UH-028 | |
| Razer Blade 15 Base Edition 2021, i7-10750H RTX 3060 | |
| Alienware m15 R5 Ryzen Edition | |
* ... kleinere Werte sind besser
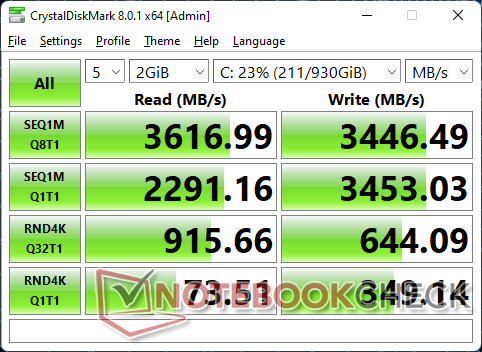
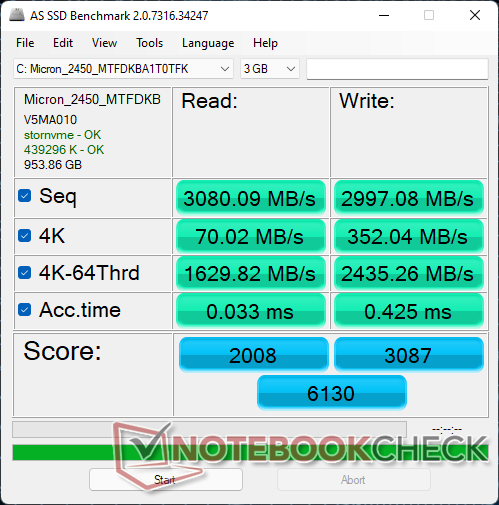
Massenspeicher
Unsere Testkonfiguration ist mit der 1 TB großen Budget-PCIe4-x4-NVMe-SSD Micron 2450 MTFDKBA1T0TFK bestückt. Während viele anderen PCIe4-x4-SSDs auf Transferraten von über 7000 MB/s kommen, verspricht die Micron 2450 nur bis zu 3500 MB/s im Lesen und 3000 MB/s im Schreiben. Somit liegt die Geschwindigkeit eher auf dem Niveau der meisten PCIe3-x4-SSDs. Natürlich steht es den Nutzern frei das Modell gegen eine schnellere PCIe4-x4-SSD wie im GP66 Leopard zu tauschen. Teurere MSI-Modelle wie die GT- oder GS-Serien kommen eher standardmäßig mit schnelleren PCIe4-SSDs von Samsung.
Immerhin hatte das Laufwerk keine Schwierigkeiten seine maximale Leserate von 3.500 MB/s auch für längere Zeit aufrechtzuerhalten.

* ... kleinere Werte sind besser
Disk Throttling: DiskSpd Read Loop, Queue Depth 8
Grafikleistung
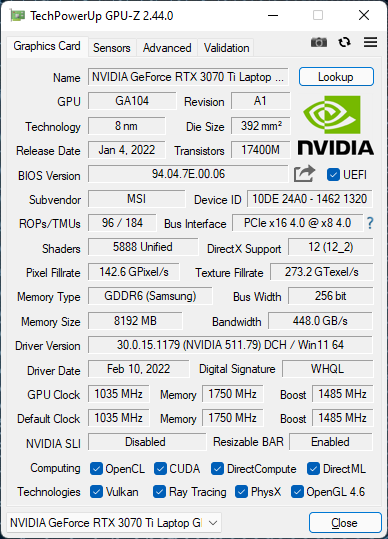
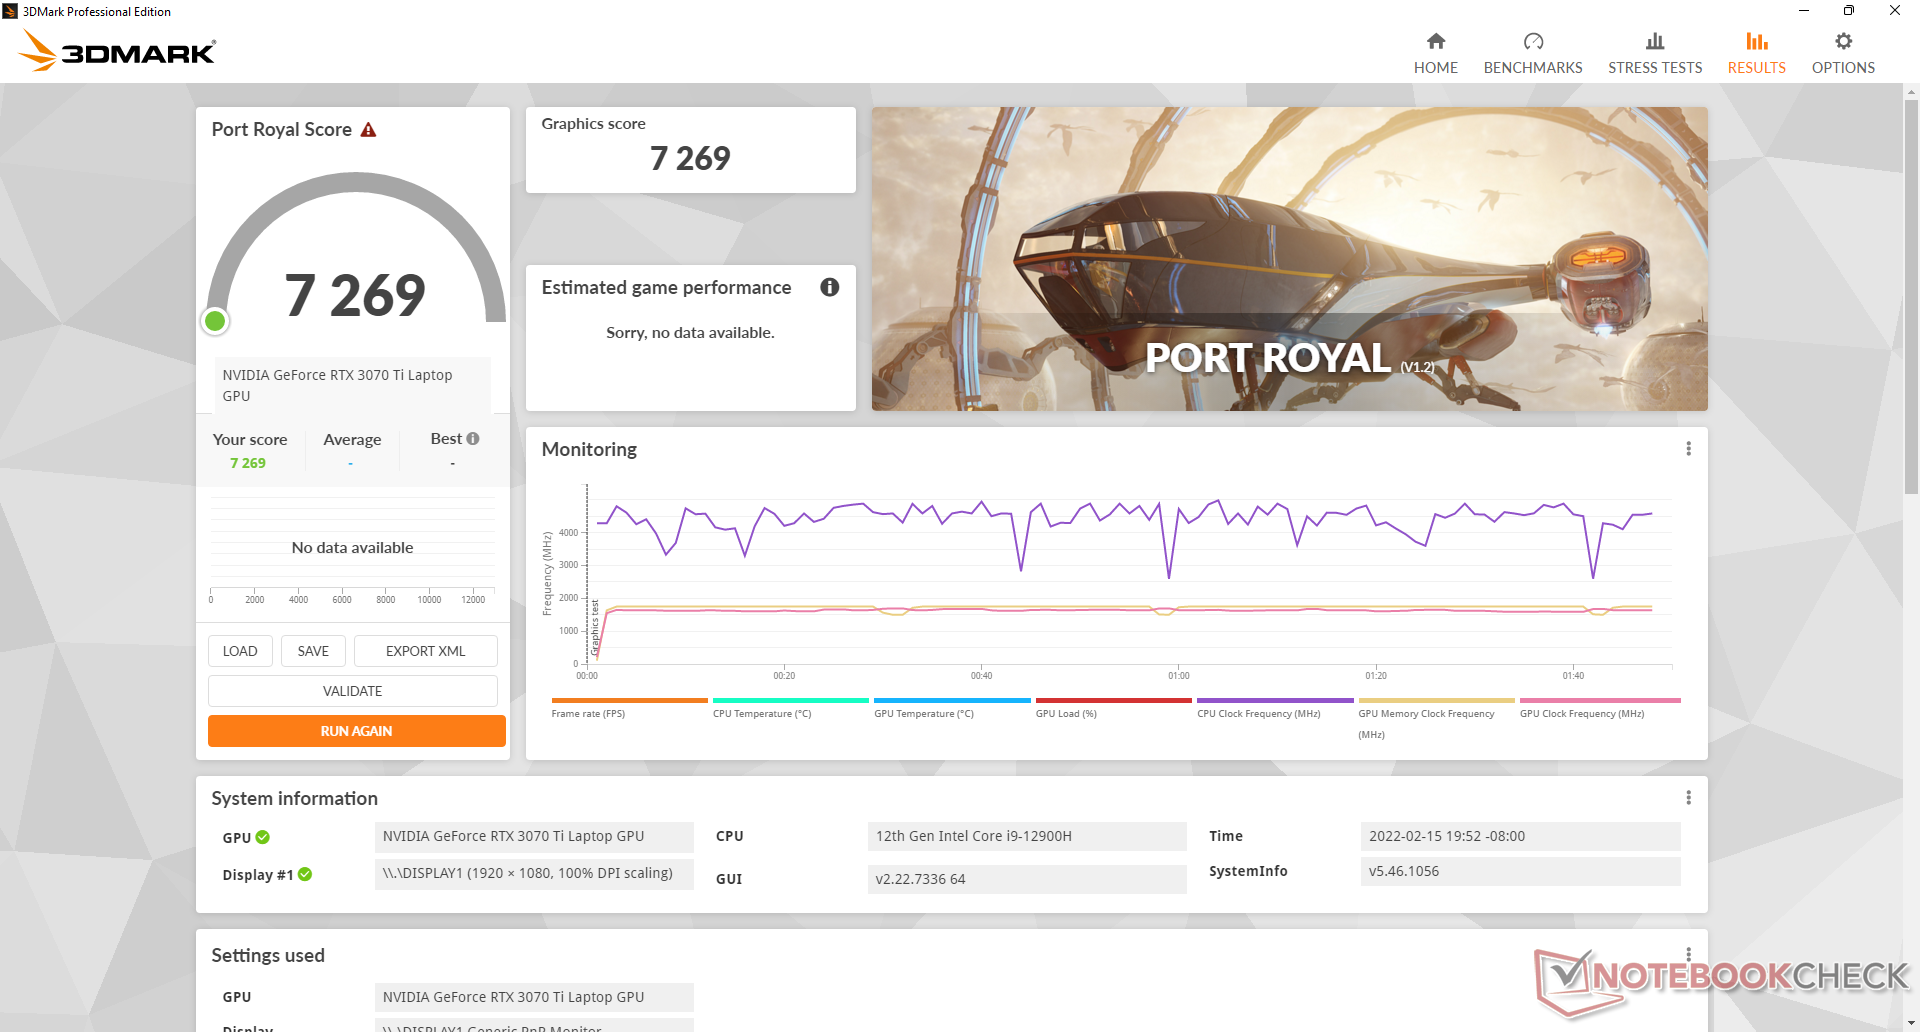
Die Grafikleistung liegt nur etwa 5 bis 10 Prozent unterhalb einer mobilen GeForce RTX 3080 Ti oder ungefähr 15 bis 20 oberhalb einer mobilen GeForce RTX 3070. Die Ergebnisse lassen unsere mobile GeForce RTX 3070 Ti nur etwa 5 bis 15 Prozent hinter einer Desktop-GeForce-RTX-3070 rangieren.
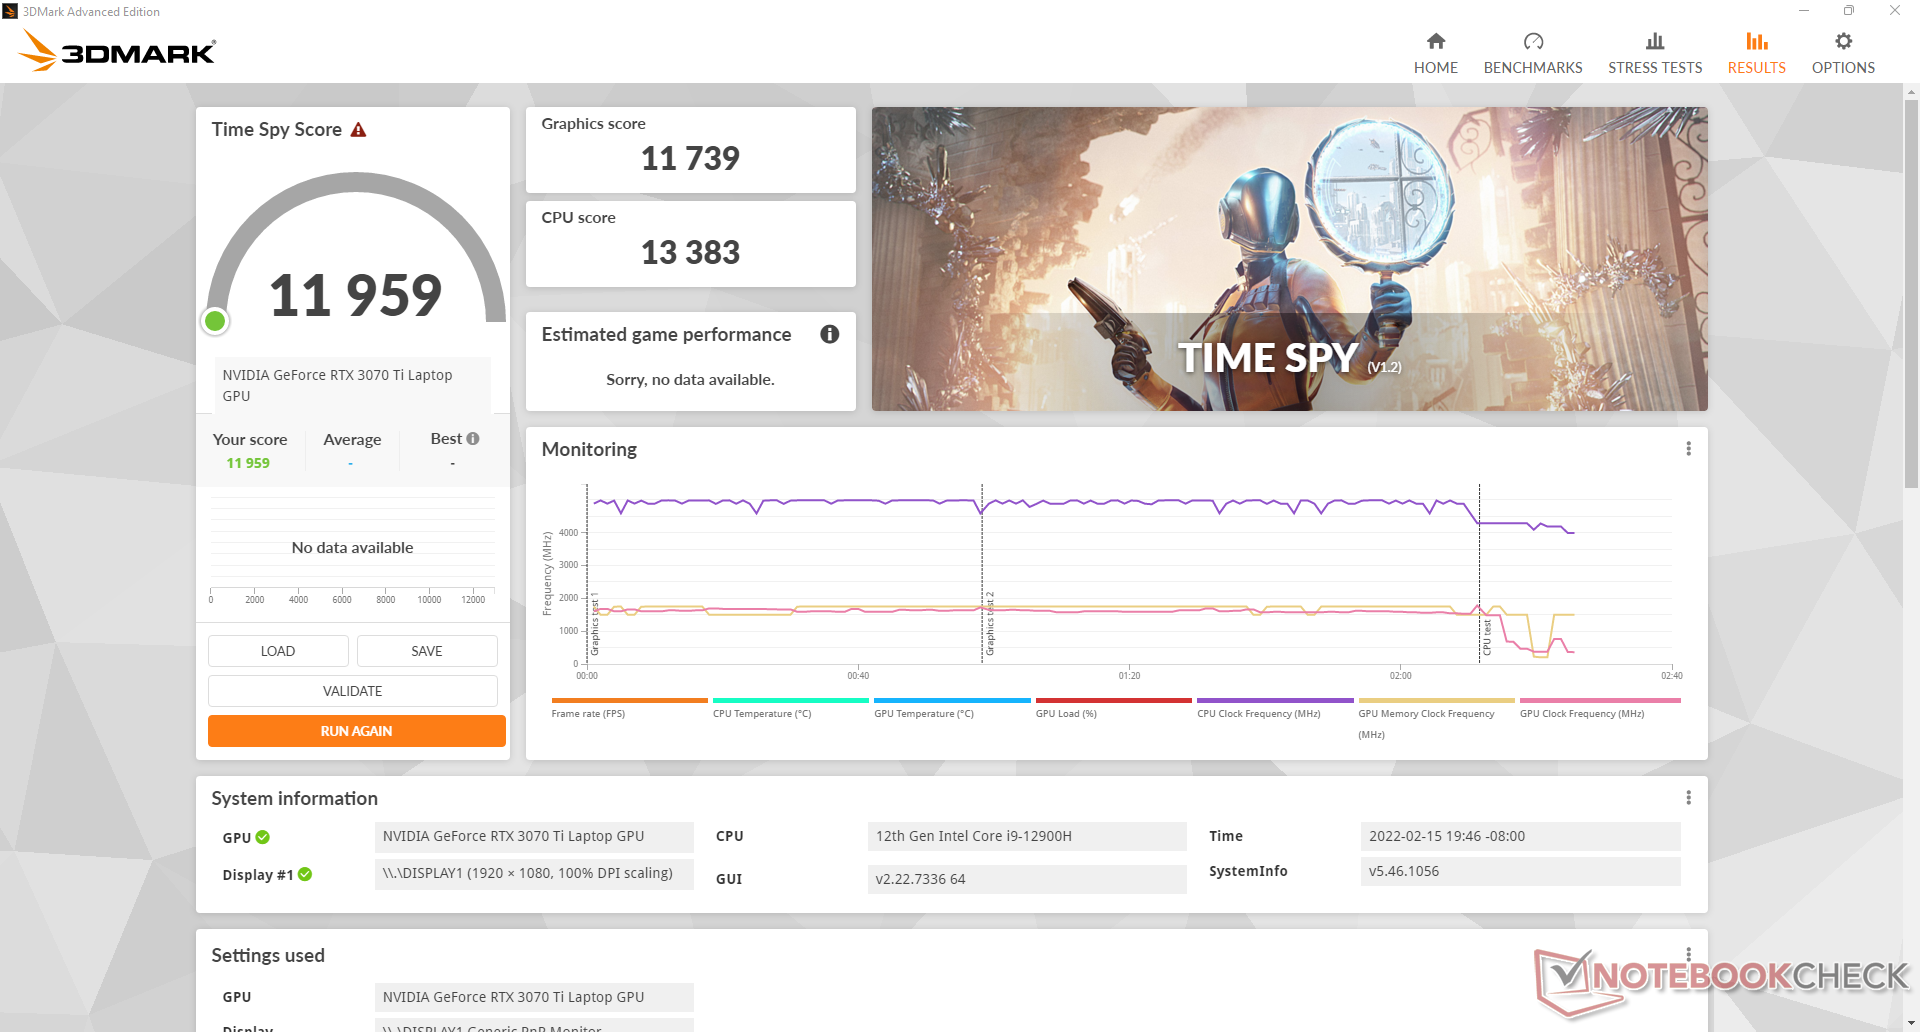
Wählt man den MSHybrid- anstelle des dGPU-Modus beeinflusst das die Leistung unseren Ergebnissen nach nicht. Der Time-Spy-Graphics-Score im MSHybrid-Modus ist quasi der gleiche wie im dGPU-Modus (11.880 vs. 11.739 Punkte).
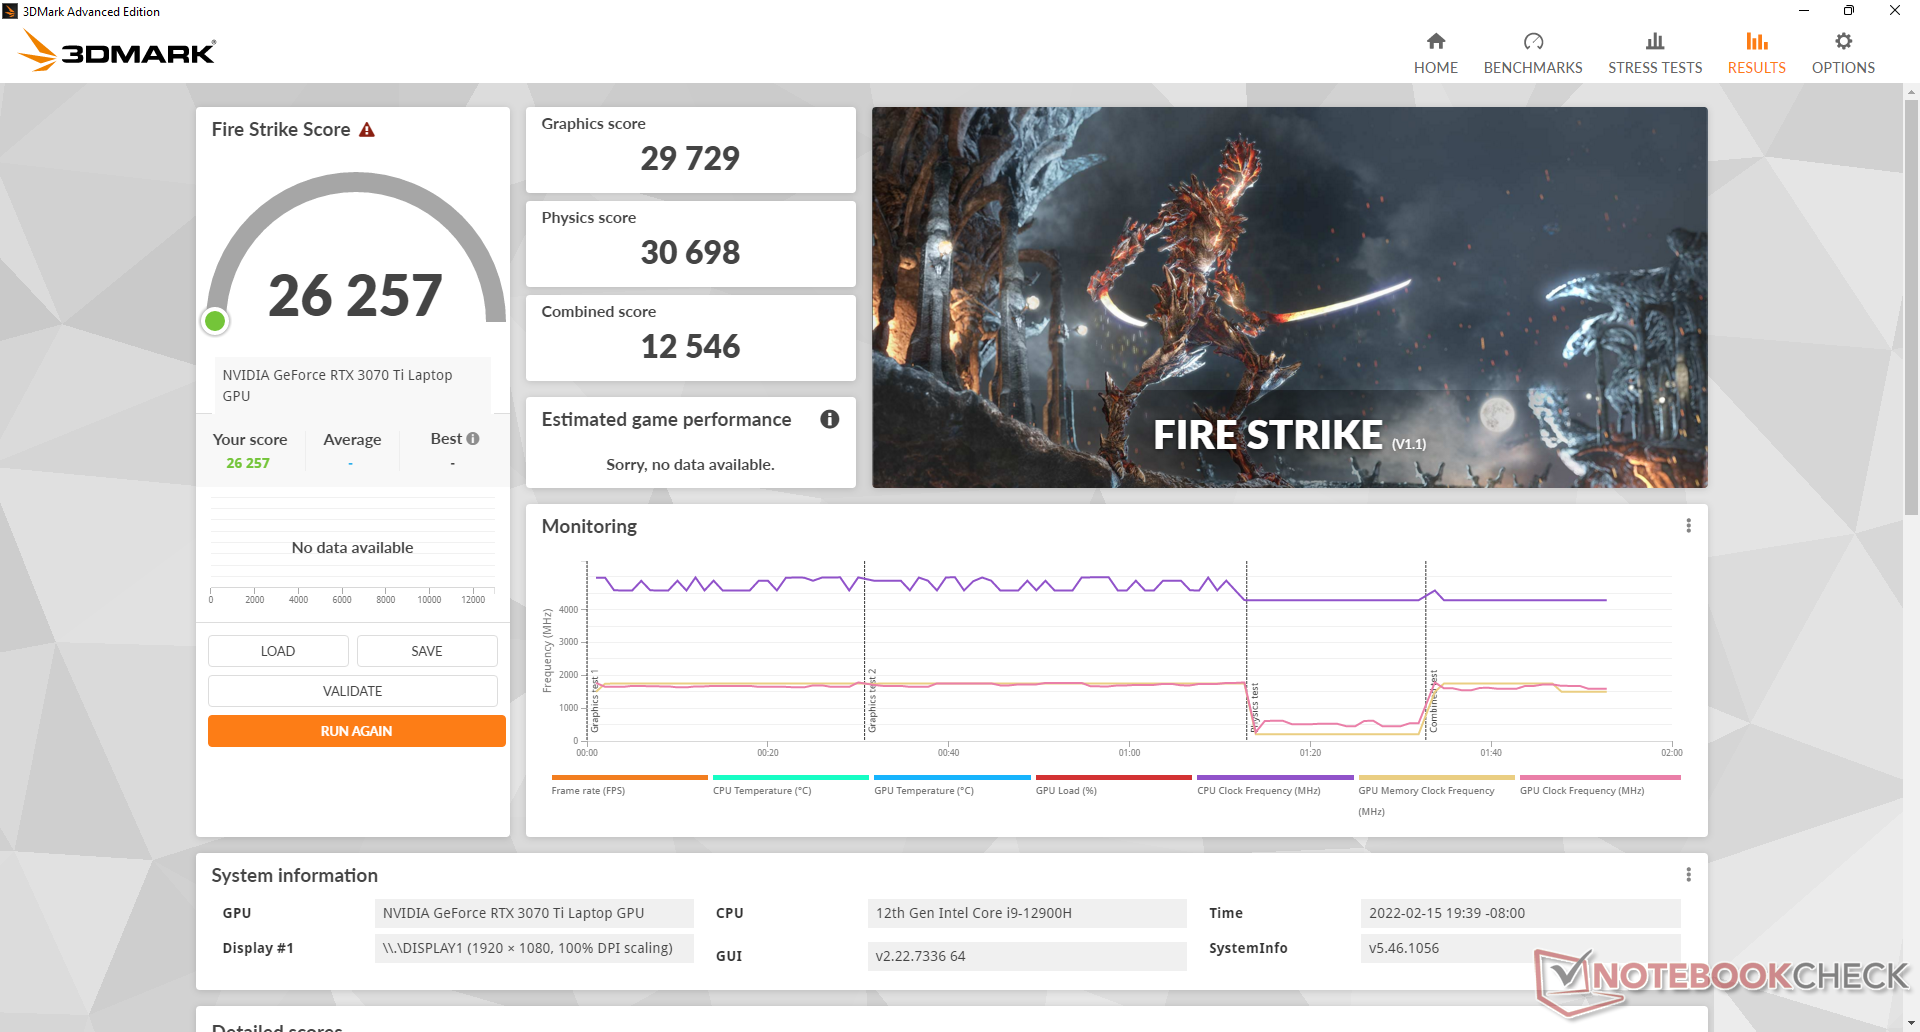
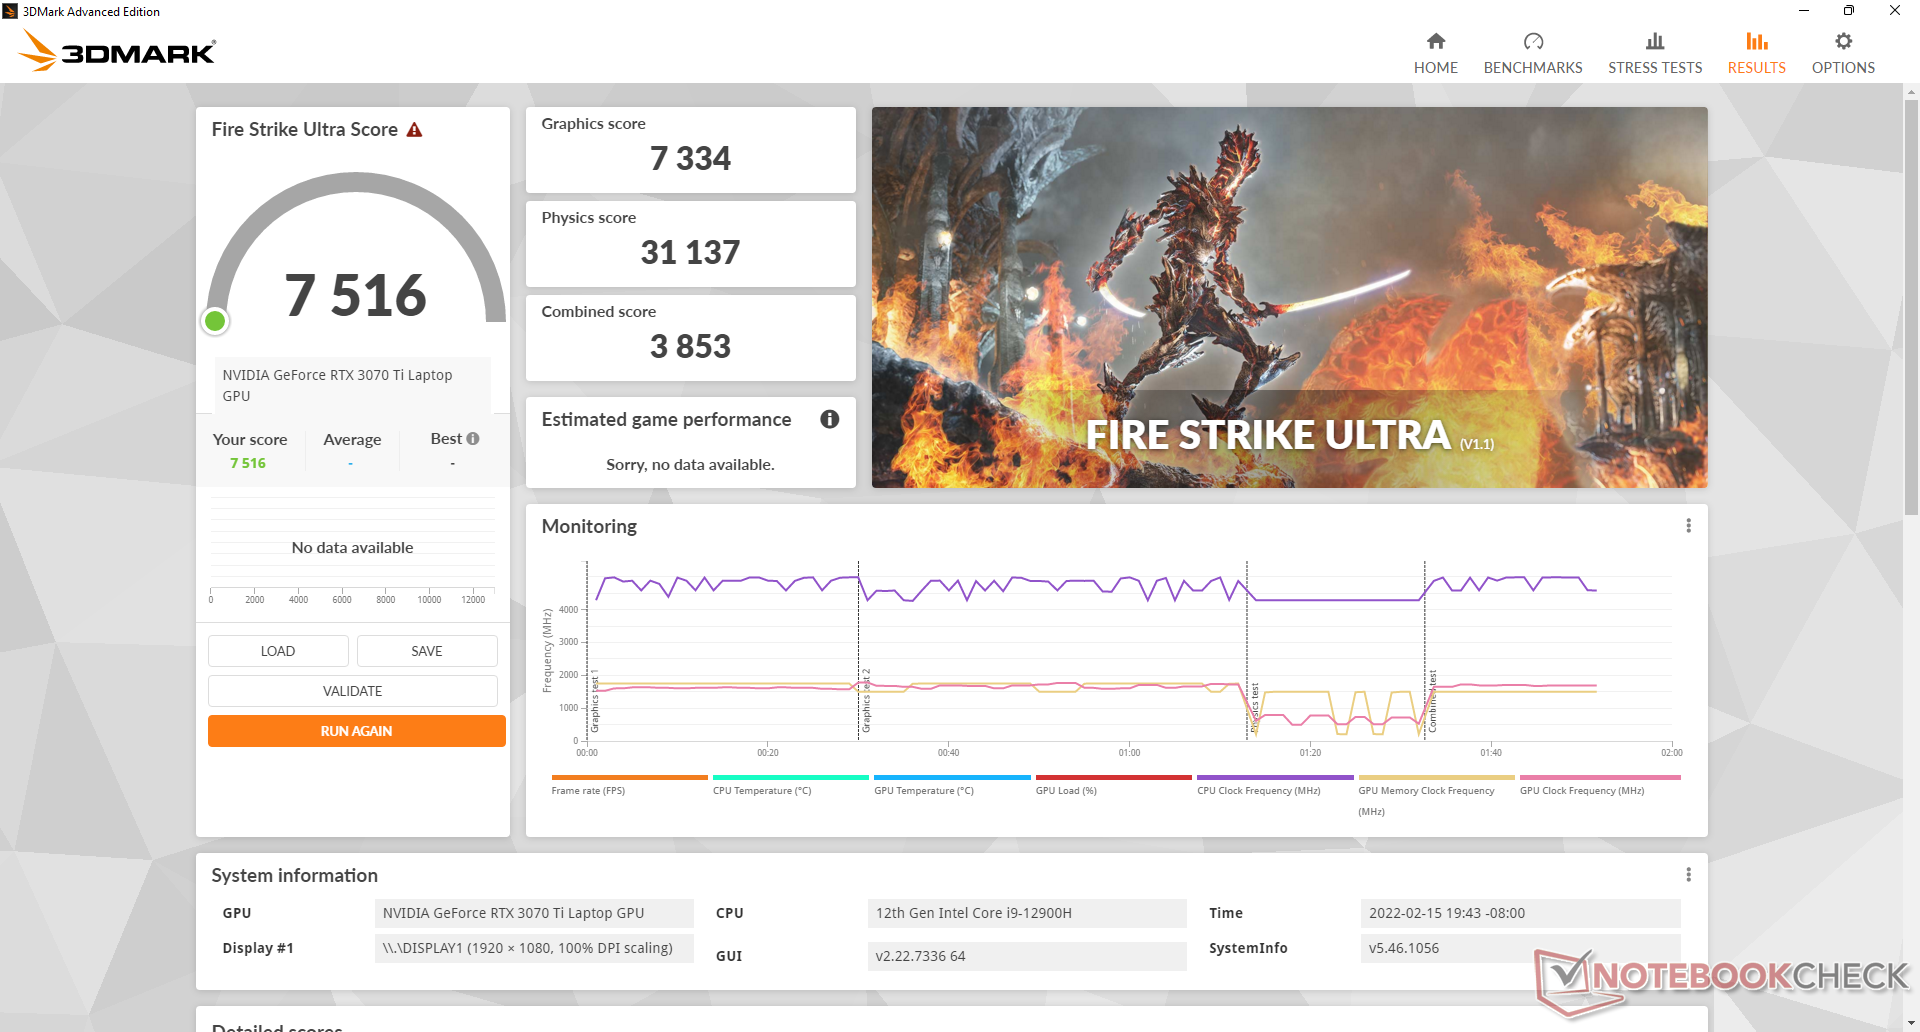
Im Balanced-Modus reduziert sich die Grafikleistung nur um etwa 4 bis 5 Prozent, gleichzeitig ist der Laptop dann deutlich leiser, die CPU und die Oberflächen werden aber spürbar wärmer. Der Fire-Strike-Graphics-Score fällt im Balanced-Modus von 29.729 auf 28.508 Punkte.
Übrigens sind die 3DMark-Scores bis zu 20 Prozent schneller als im MSI GS66 mit der gleichen GeForce RTX 3070 Ti, was an der höheren TGP unseres GP66 liegt (150 W vs. 105 W).
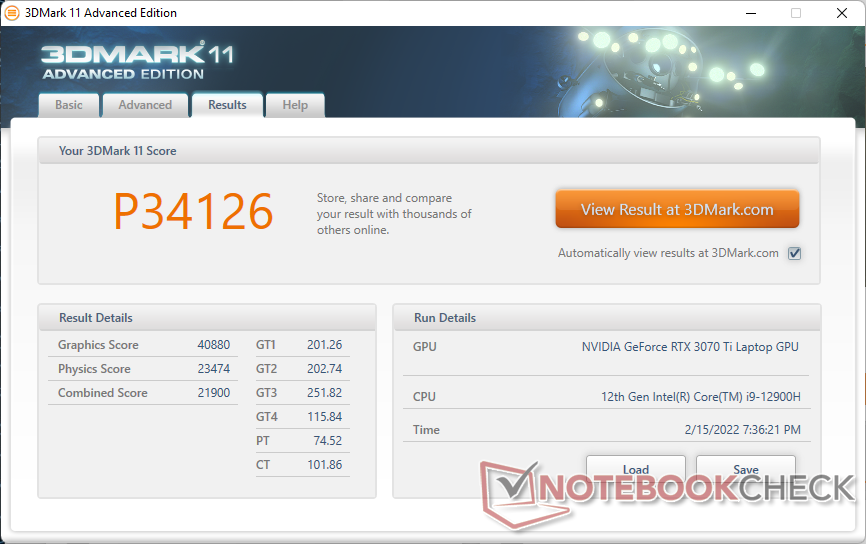
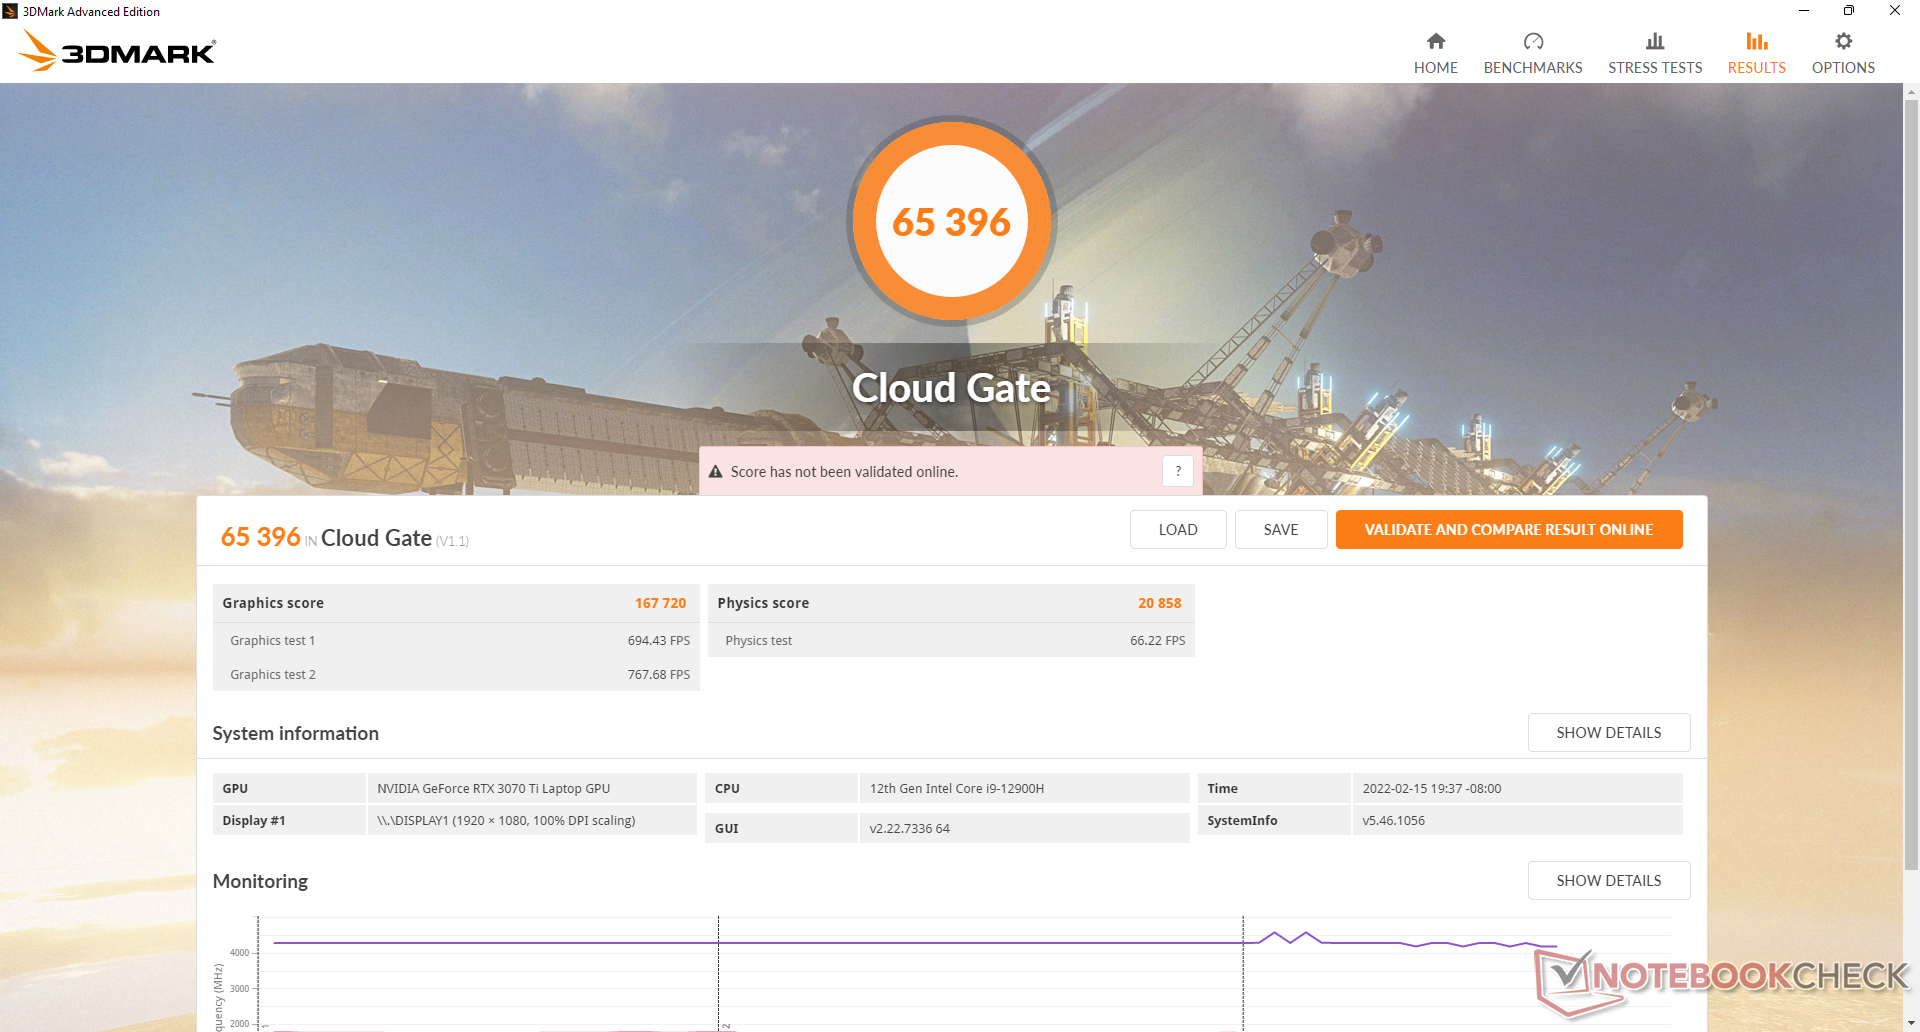
| 3DMark 11 Performance | 34126 Punkte | |
| 3DMark Cloud Gate Standard Score | 65396 Punkte | |
| 3DMark Fire Strike Score | 26257 Punkte | |
| 3DMark Time Spy Score | 11959 Punkte | |
Hilfe | ||
Witcher 3 FPS Chart
| min. | mittel | hoch | max. | |
|---|---|---|---|---|
| GTA V (2015) | 185 | 184 | 179 | 123 |
| The Witcher 3 (2015) | 492.3 | 360 | 223.9 | 114.6 |
| Dota 2 Reborn (2015) | 185 | 169 | 164 | 155 |
| Final Fantasy XV Benchmark (2018) | 207 | 152 | 115 | |
| X-Plane 11.11 (2018) | 161 | 143 | 112 | |
| Far Cry 5 (2018) | 180 | 152 | 145 | 136 |
| Strange Brigade (2018) | 471 | 298 | 244 | 213 |
Emissionen - Leise oder Leistung?
Systemlautstärke
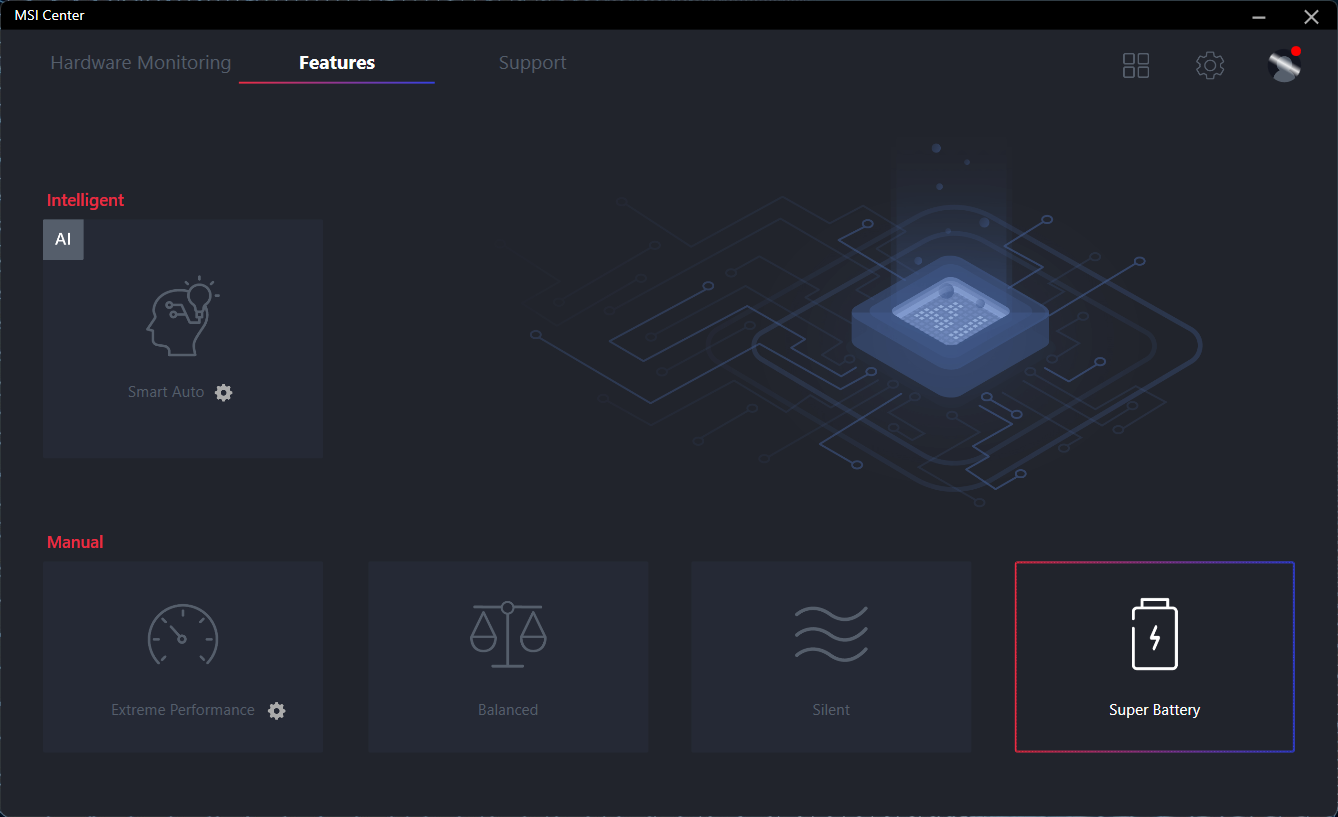
Die Lüfterlautstärke hängt vorwiegend mit den vier Profilen im MSI Center zusammen: Super Battery, Silent, Balanced und Extreme Performance. Aber selbst im Silent-Modus stehen die Lüfter nicht still und säuseln mit 26,8 dB(A) gegen eine Hintergrundlautstärke von 24,7 dB(A) vor sich hin. Das nimmt man im Alltag aber kaum wahr. Daher empfehlen wir diesen Modus beim einfachen Browsen oder Videostreaming, da hier die Lüfter deutlich seltener pulsieren bzw. ihre Drehzahl ändern als in den übrigen Modi.
Gaming im Balanced-Modus resultiert in einer Lüfterlautstärke von knapp unter 40 dB(A). Dem gegenüber steht eine Geräuschentwicklung von 58 dB(A) im Extreme-Performance-Modus. Die Grafikleistung ist in diesem Modus zwar etwas niedriger, aber die Lautstärkereduktion ist signifikant und den geringen Leistungsrückgang wert. Im Extreme-Performance-Modus wird der Laptop lauter als die meisten anderen Gaming-Laptops, die wir bislang getestet haben.
Lautstärkediagramm
| Idle |
| 23.4 / 23.4 / 27.4 dB(A) |
| Last |
| 36 / 58 dB(A) |
 | ||
30 dB leise 40 dB(A) deutlich hörbar 50 dB(A) störend |
||
min: | ||
| MSI Vector GP66 12UGS GeForce RTX 3070 Ti Laptop GPU, i9-12900H | MSI GP66 Leopard 11UH-028 GeForce RTX 3080 Laptop GPU, i7-11800H, Samsung PM9A1 MZVL21T0HCLR | MSI Katana GF66 11UG-220 GeForce RTX 3070 Laptop GPU, i7-11800H, Kingston OM8PDP3512B-AI1 | Asus TUF Gaming F15 FX506HM GeForce RTX 3060 Laptop GPU, i7-11800H, SK Hynix HFM001TD3JX013N | Razer Blade 15 Base Edition 2021, i7-10750H RTX 3060 GeForce RTX 3060 Laptop GPU, i7-10750H, Samsung SSD PM981a MZVLB512HBJQ | Alienware m15 R5 Ryzen Edition GeForce RTX 3060 Laptop GPU, R7 5800H, Toshiba KBG40ZNS512G NVMe | |
|---|---|---|---|---|---|---|
| Geräuschentwicklung | 1% | -19% | 7% | -0% | -5% | |
| aus / Umgebung * (dB) | 22.9 | 23 -0% | 25 -9% | 24.8 -8% | 25.3 -10% | 24 -5% |
| Idle min * (dB) | 23.4 | 23 2% | 34 -45% | 24.6 -5% | 25.4 -9% | 24 -3% |
| Idle avg * (dB) | 23.4 | 23 2% | 35 -50% | 24.9 -6% | 25.4 -9% | 25 -7% |
| Idle max * (dB) | 27.4 | 30.11 -10% | 36 -31% | 24.9 9% | 25.4 7% | 35 -28% |
| Last avg * (dB) | 36 | 41.86 -16% | 48 -33% | 27.1 25% | 42.5 -18% | 44 -22% |
| Witcher 3 ultra * (dB) | 58.2 | 47.79 18% | 46 21% | 46.4 20% | 42 28% | 48 18% |
| Last max * (dB) | 58 | 53 9% | 49 16% | 49 16% | 52.2 10% | 50 14% |
* ... kleinere Werte sind besser
Temperatur
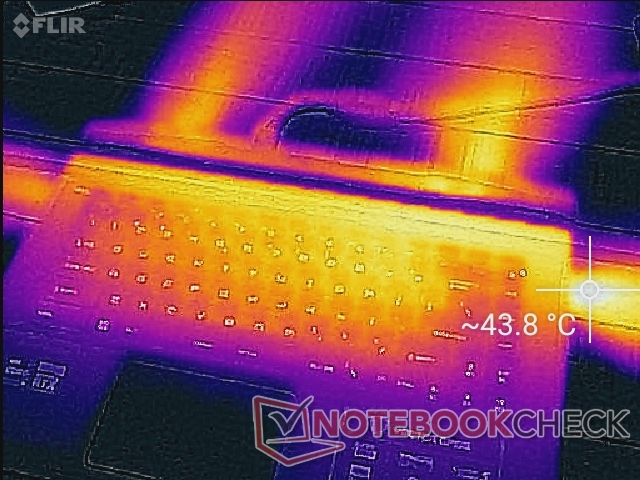
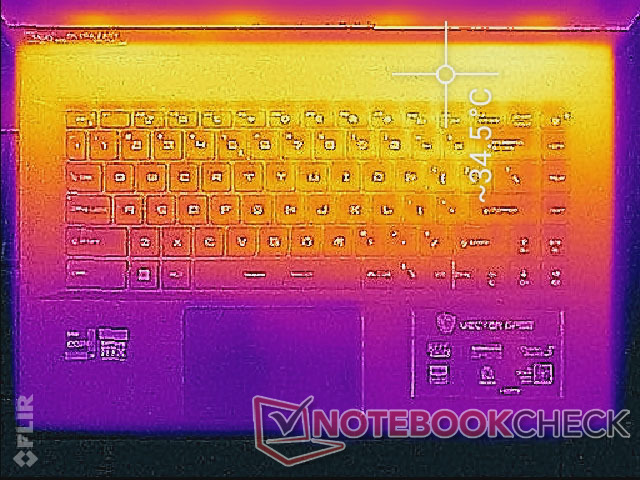
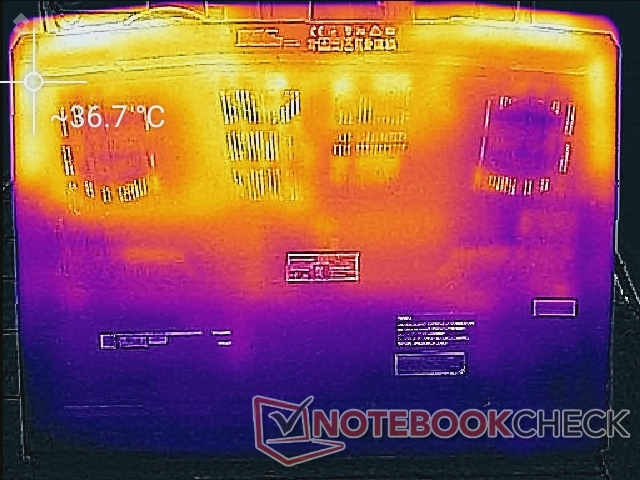
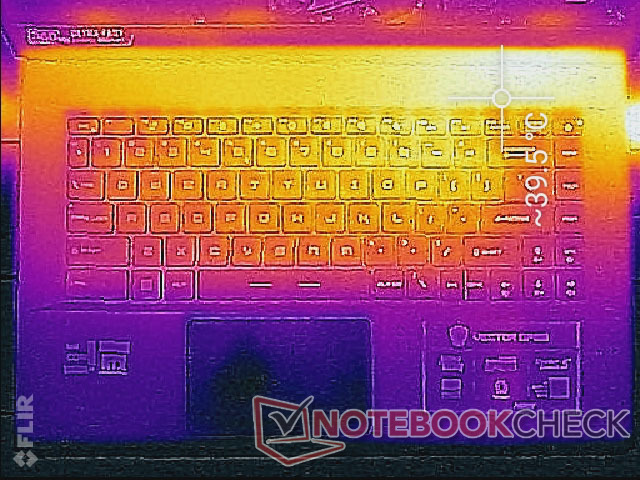
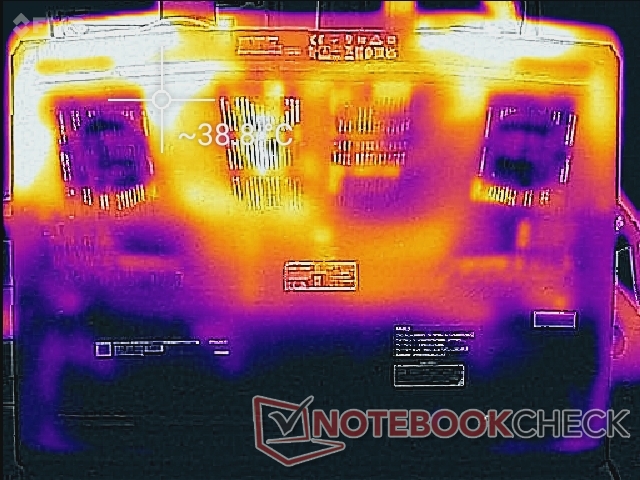
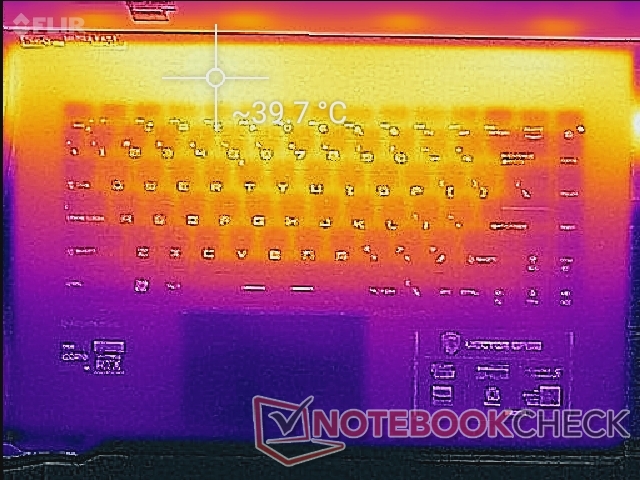
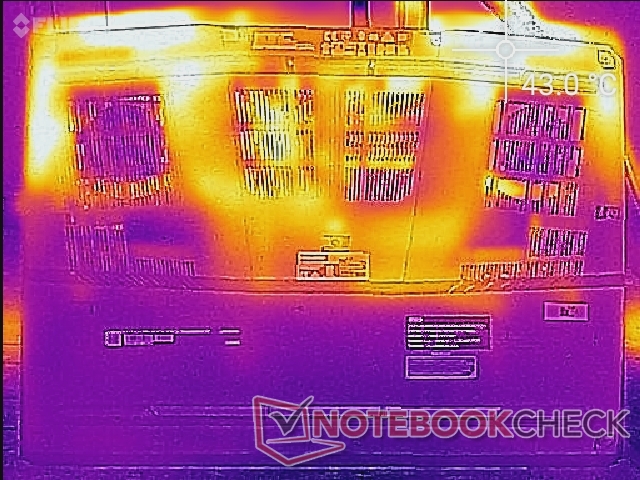
Auch die Oberflächentemperaturen hängen maßgeblich von den Profilen im MSI Center ab. Im Balanced-Modus gibt es Hot Spots von 49 °C, im Extreme-Performance-Modus nur 42 °, da die Lüfter dann deutlich schneller drehen.
Die Hot Spots konzentrieren sich auf die hinteren Bereiche des Laptops, wie unsere Temperaturbilder zeigen. Die Tasten oder Handballenauflagen können warm werden, allerdings nie störend. Das dünnere GS66 oder das Razer Blade 15 haben im Vergleich spürbar wärmere Handballenauflagen und Tastaturen, und zwar mehr als nur ein paar Grad.
(±) Die maximale Temperatur auf der Oberseite ist 40.2 °C. Im Vergleich liegt der Klassendurchschnitt bei 40.4 °C (von 21.2 bis 68.8 °C für die Klasse Gaming).
(±) Auf der Unterseite messen wir eine maximalen Wert von 43.8 °C (im Vergleich zum Durchschnitt von 43.2 °C).
(+) Ohne Last messen wir eine durchschnittliche Temperatur von 29.6 °C auf der Oberseite. Der Klassendurchschnitt erreicht 33.9 °C.
(+) Beim längeren Spielen von The Witcher 3 erhitzt sich das Gerät durchschnittlich auf 30.7 °C. Der Durchschnitt der Klasse ist derzeit 33.9 °C.
(+) Die Handballen und der Touchpad-Bereich sind mit gemessenen 24.8 °C kühler als die typische Hauttemperatur und fühlen sich dadurch kühl an.
(+) Die durchschnittliche Handballen-Temperatur anderer getesteter Geräte war 28.8 °C (+4 °C).
| MSI Vector GP66 12UGS Intel Core i9-12900H, NVIDIA GeForce RTX 3070 Ti Laptop GPU | MSI GP66 Leopard 11UH-028 Intel Core i7-11800H, NVIDIA GeForce RTX 3080 Laptop GPU | MSI Katana GF66 11UG-220 Intel Core i7-11800H, NVIDIA GeForce RTX 3070 Laptop GPU | Asus TUF Gaming F15 FX506HM Intel Core i7-11800H, NVIDIA GeForce RTX 3060 Laptop GPU | Razer Blade 15 Base Edition 2021, i7-10750H RTX 3060 Intel Core i7-10750H, NVIDIA GeForce RTX 3060 Laptop GPU | Alienware m15 R5 Ryzen Edition AMD Ryzen 7 5800H, NVIDIA GeForce RTX 3060 Laptop GPU | |
|---|---|---|---|---|---|---|
| Hitze | -2% | -8% | 8% | -6% | -21% | |
| Last oben max * (°C) | 40.2 | 49 -22% | 56 -39% | 46.4 -15% | 45.2 -12% | 62 -54% |
| Last unten max * (°C) | 43.8 | 47 -7% | 49 -12% | 45.4 -4% | 48 -10% | 61 -39% |
| Idle oben max * (°C) | 34.8 | 31 11% | 36 -3% | 26 25% | 34.4 1% | 36 -3% |
| Idle unten max * (°C) | 37 | 33 11% | 28 24% | 27.4 26% | 37.2 -1% | 33 11% |
* ... kleinere Werte sind besser
Stresstest
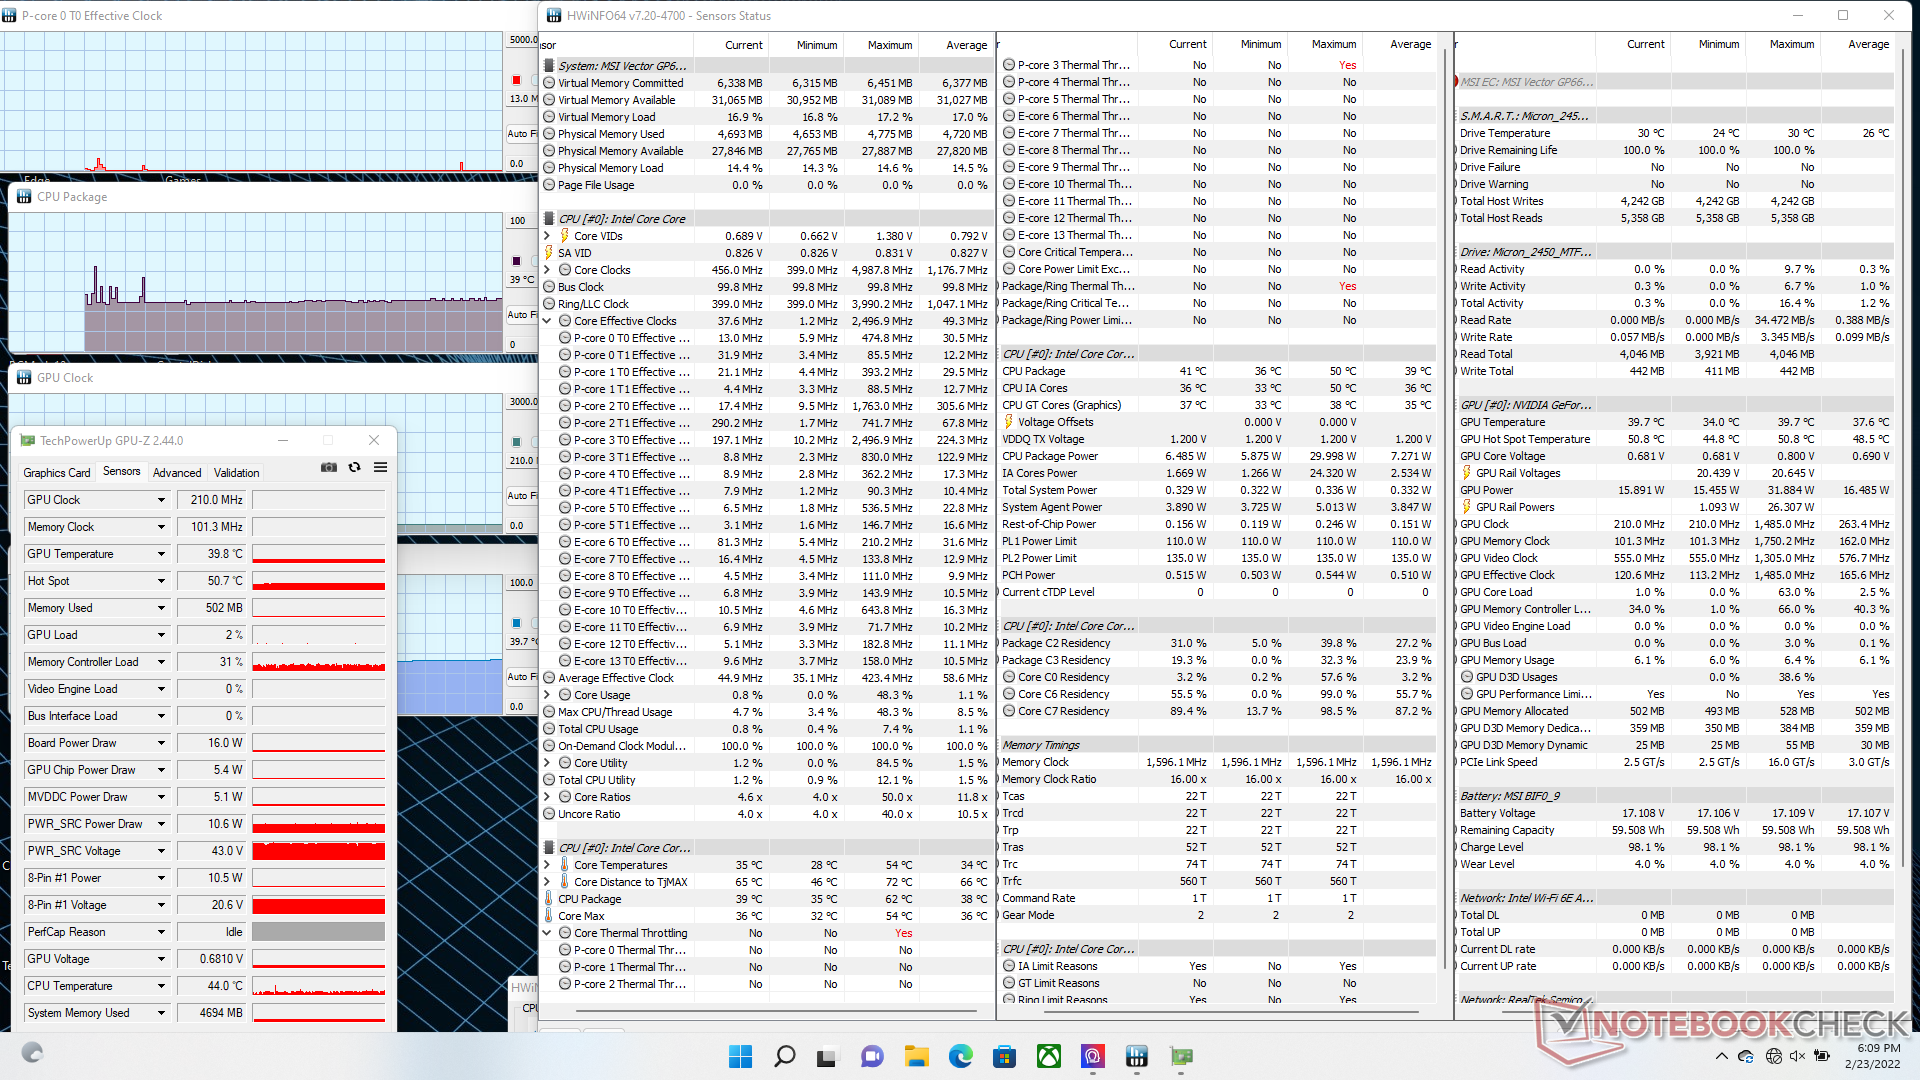
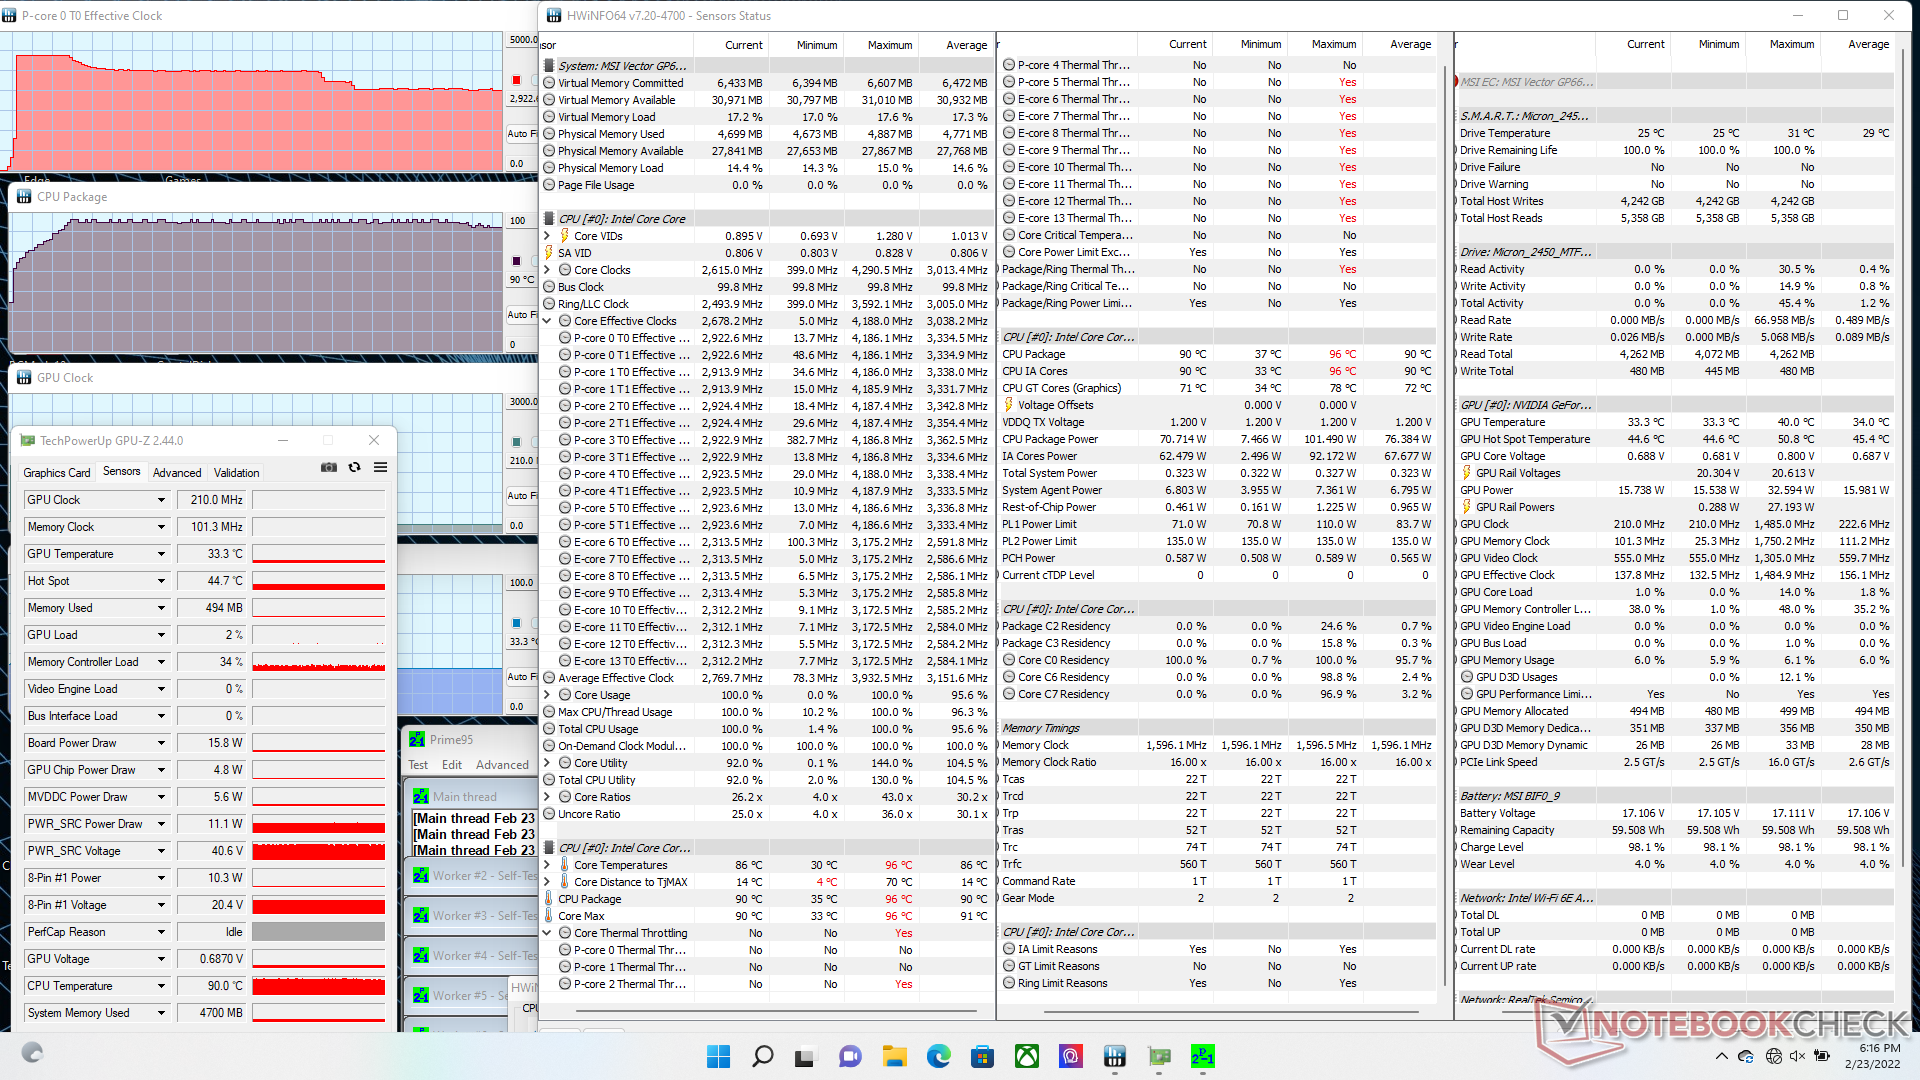
Beim Stressen mit Prime95 im Extreme-Performance-Profil boosten die CPU-Kerne für ein bis zwei Sekunden auf 4,2 GHz hoch und fallen dann schnell auf 3,7 GHz. Nach etwa einer weiteren Minute fallen die Taktraten weiter auf 3 GHz, dabei wird eine Kerntemperatur von 90 °C gehalten. Analog beträgt die CPU Package Power beim Starten von Prime95 zunächst kurz 100 W und stabilisiert sich dann bei 70 W. Der gleiche Core i9-12900H im größeren Uniwill Technology GM7AG8P (Test auf englisch) läuft sowohl schneller (3,2 GHz vs. 3,0 GHz) als auch kühler (80 °C vs. 90 °C) und kommt auf eine höhere, stabile TDP (75 W vs. 70 W) als unser Vector GP66.
CPU- und GPU-Temperaturen stabilisieren sich unter Witcher 3 im Extreme-Performance-Modus bei 71 und 70 °C. Im Balanced-Profil steigen die CPU- und GPU-Temperaturen auf 85 und 78 °C, die GPU-Taktraten sinken zudem leicht (1.650 MHz vs. 1.755 MHz). Dennoch sind die Taktraten deutlich schneller als beim MSI GS66 (1.155 MHz) mit der gleichen GeForce RTX 3070 Ti, allerdings mit niedrigerer TGP (105 W vs. 150 W).
Abseits der Steckdose sinkt die Leistung erheblich. Ein Fire-Strike-Test im Akkumodus ergibt nur noch Physics- und Graphics-Scores von 10.913 und 6.061 Punkten, anstelle der 30.698 und 29.729 Punkte an der Steckdose.
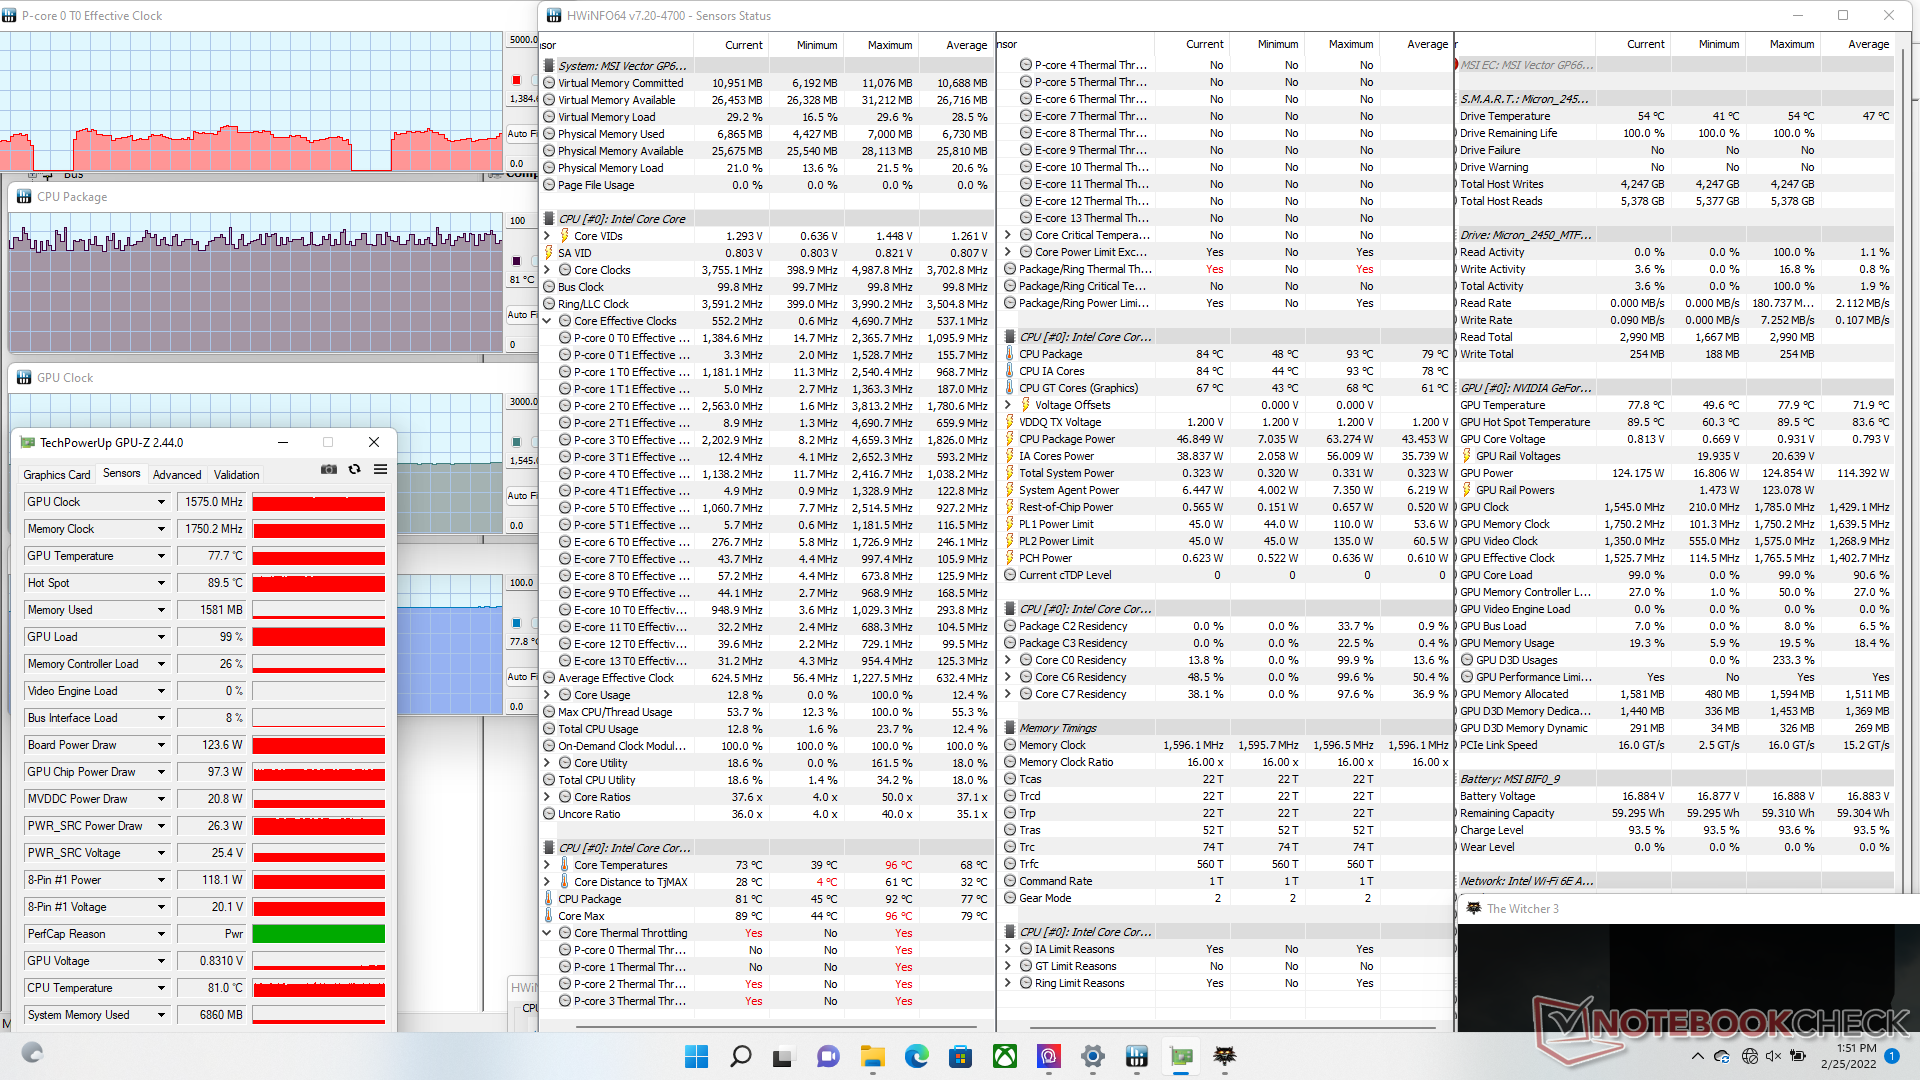
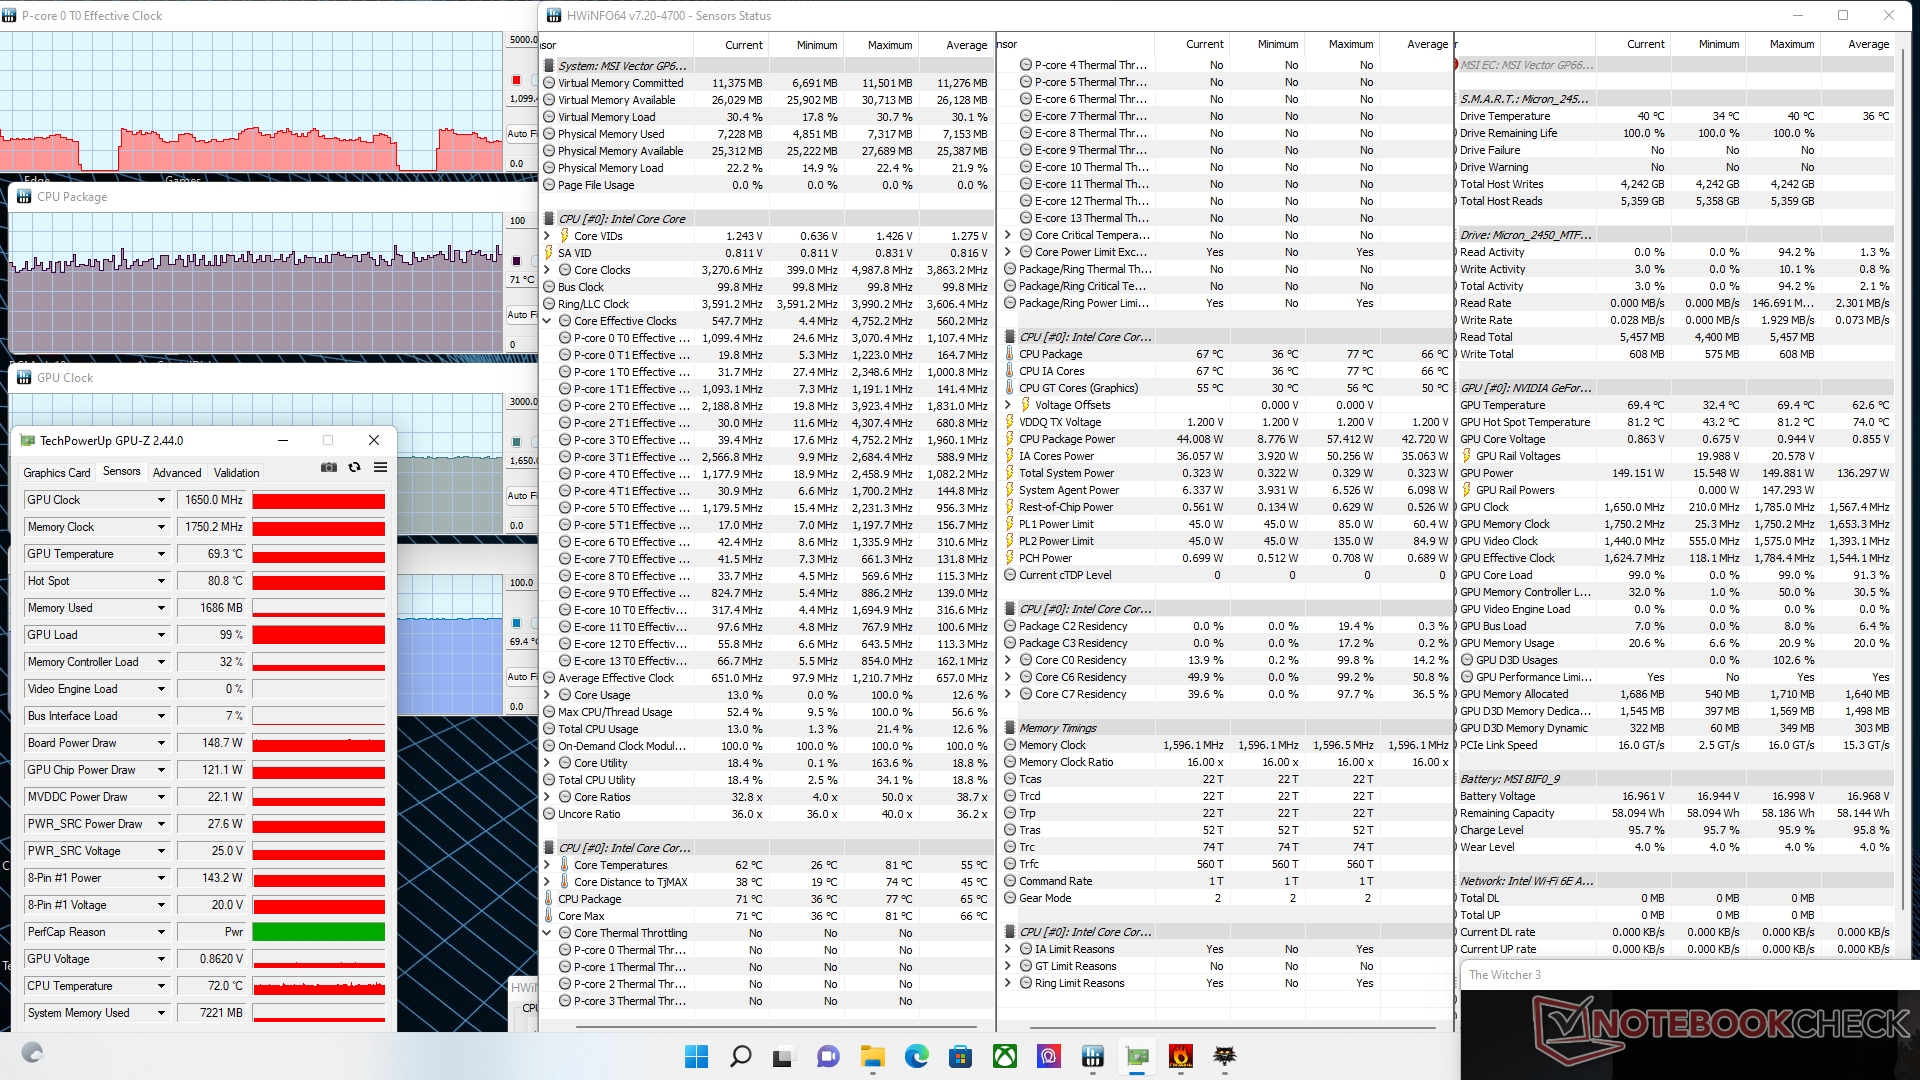
| CPU Clock (GHz) | GPU Clock (MHz) | Average CPU Temperature (°C) | Average GPU Temperature (°C) | |
| System Idle (Balanced mode) | -- | -- | 39 | 40 |
| Prime95 Stress (Extreme Performance mode) | 3.0 | -- | 90 | 33 |
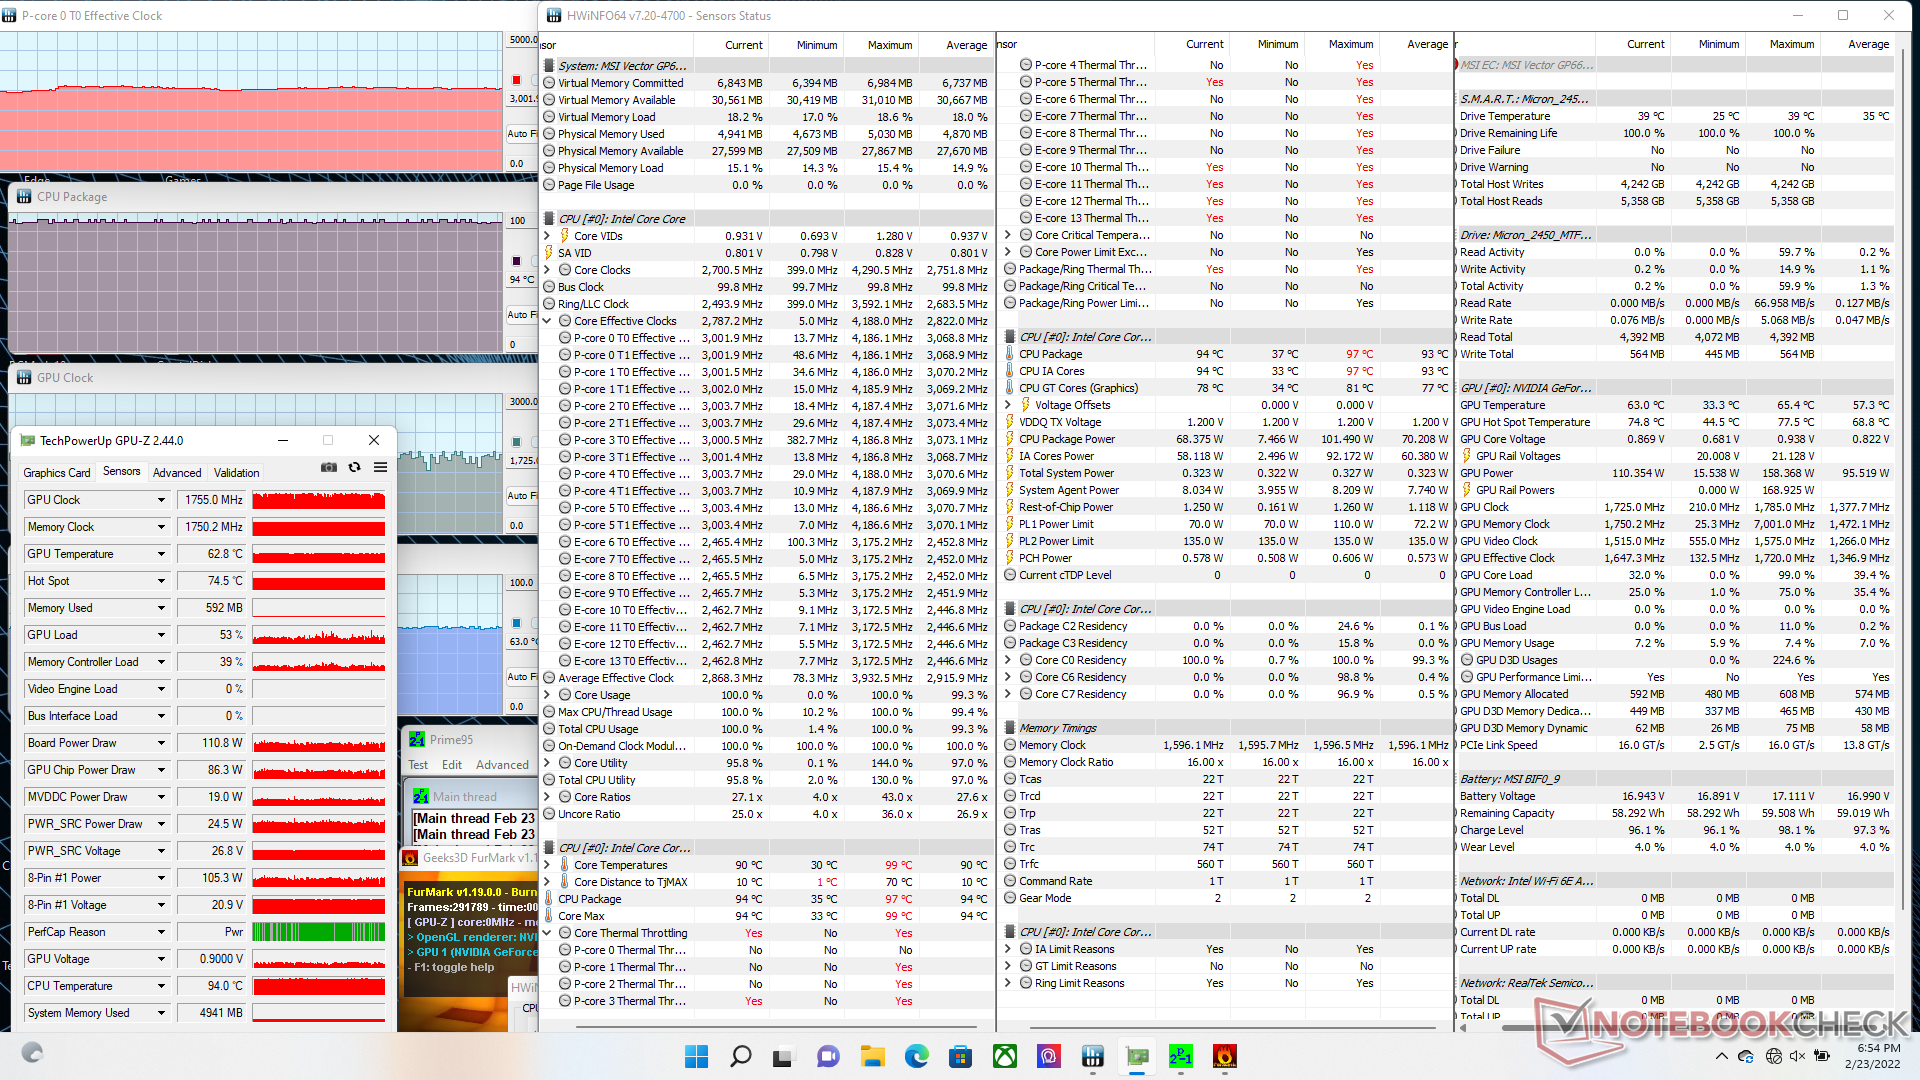
| Prime95 + FurMark Stress (Extreme Performance mode) | 3.0 | 1755 | 94 | 63 |
| Witcher 3 Stress (Extreme Performance mode) | ~1.0 | 1650 | 71 | 70 |
| Witcher 3 Stress (Balanced mode) | ~1.0 | 1515 | 85 | 78 |
Lautsprecher

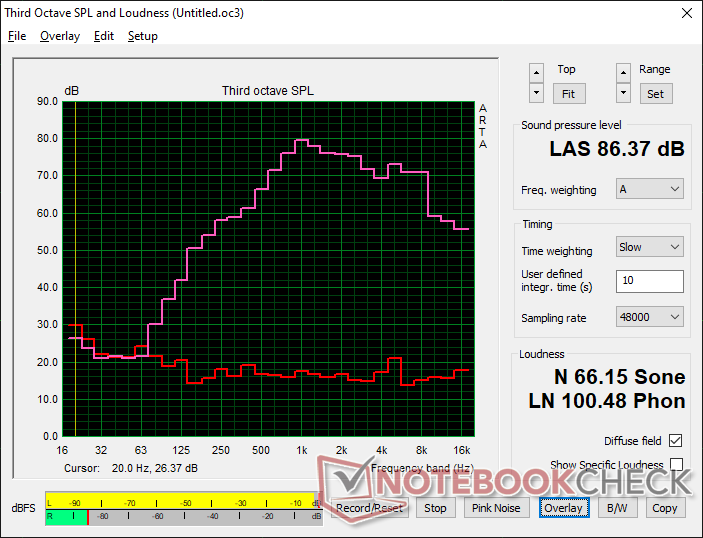
MSI Vector GP66 12UGS Audio Analyse
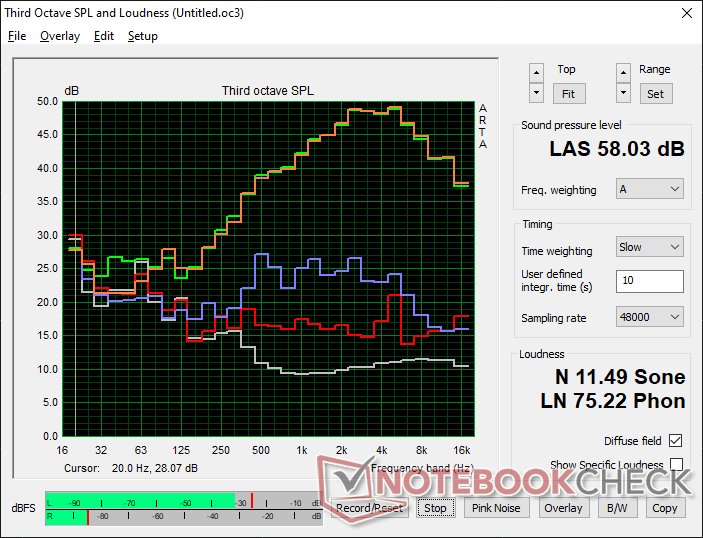
(+) | Die Lautsprecher können relativ laut spielen (86.4 dB)
Bass 100 - 315 Hz
(-) | kaum Bass - 19.2% niedriger als der Median
(±) | durchschnittlich lineare Bass-Wiedergabe (9.1% Delta zum Vorgänger)
Mitteltöne 400 - 2000 Hz
(±) | zu hohe Mitten, vom Median 6.5% abweichend
(+) | lineare Mitten (5.8% Delta zum Vorgänger)
Hochtöne 2 - 16 kHz
(+) | ausgeglichene Hochtöne, vom Median nur 3.7% abweichend
(+) | sehr lineare Hochtöne (6.5% Delta zum Vorgänger)
Gesamt im hörbaren Bereich 100 - 16.000 Hz
(±) | hörbarer Bereich ist durchschnittlich linear (18.1% Abstand zum Median)
Im Vergleich zu allen Geräten derselben Klasse
» 57% aller getesteten Geräte dieser Klasse waren besser, 8% vergleichbar, 35% schlechter
» Das beste Gerät hat einen Delta-Wert von 6%, durchschnittlich ist 18%, das schlechteste Gerät hat 132%
Im Vergleich zu allen Geräten im Test
» 38% aller getesteten Geräte waren besser, 8% vergleichbar, 54% schlechter
» Das beste Gerät hat einen Delta-Wert von 4%, durchschnittlich ist 24%, das schlechteste Gerät hat 134%
Apple MacBook Pro 16 2021 M1 Pro Audio Analyse
(+) | Die Lautsprecher können relativ laut spielen (84.7 dB)
Bass 100 - 315 Hz
(+) | guter Bass - nur 3.8% Abweichung vom Median
(+) | lineare Bass-Wiedergabe (5.2% Delta zum Vorgänger)
Mitteltöne 400 - 2000 Hz
(+) | ausgeglichene Mitten, vom Median nur 1.3% abweichend
(+) | lineare Mitten (2.1% Delta zum Vorgänger)
Hochtöne 2 - 16 kHz
(+) | ausgeglichene Hochtöne, vom Median nur 1.9% abweichend
(+) | sehr lineare Hochtöne (2.7% Delta zum Vorgänger)
Gesamt im hörbaren Bereich 100 - 16.000 Hz
(+) | hörbarer Bereich ist sehr linear (4.6% Abstand zum Median
Im Vergleich zu allen Geräten derselben Klasse
» 0% aller getesteten Geräte dieser Klasse waren besser, 0% vergleichbar, 100% schlechter
» Das beste Gerät hat einen Delta-Wert von 5%, durchschnittlich ist 17%, das schlechteste Gerät hat 45%
Im Vergleich zu allen Geräten im Test
» 0% aller getesteten Geräte waren besser, 0% vergleichbar, 100% schlechter
» Das beste Gerät hat einen Delta-Wert von 4%, durchschnittlich ist 24%, das schlechteste Gerät hat 134%
Energiemanagement - Hoher Verbrauch, verbesserte Laufzeit
Energieverbrauch
Im Gegensatz zum GP66 Leopard vom letzten Jahr muss beim Vector GP66 mit einem generell höheren Verbrauch gerechnet werden. Das liegt an der höheren Bildwiederholrate des Displays (360 Hz vs. 144 Hz), der höheren CPU-TDP (70 W vs. 45 W) sowie der höheren TGP (150 W vs. 140 W). Beim Gaming werden etwa 20 W mehr Strom verbraucht, wodurch der Laptop mehr einfordert als viele 17-Zoll-Gaming-Laptops, die mit einer GeForce RTX 3080 ausgestattet sind. Zwar bekommen die Nutzer im Jahresvergleich eine höhere Leistung, insbesondere was die CPU betrifft, die Leistung-pro-Watt dürfte indes nicht viel besser sein.
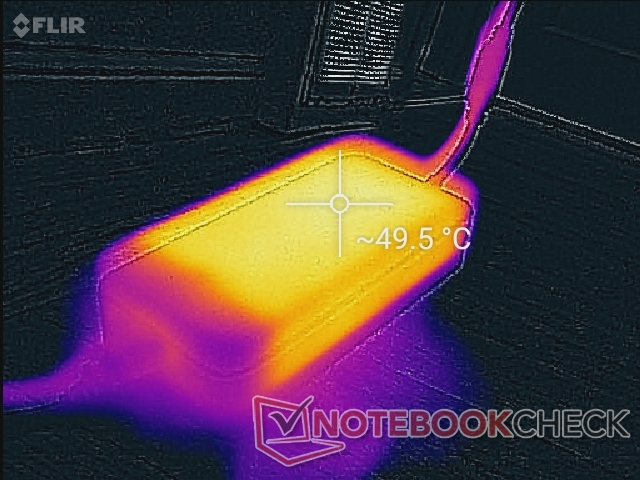
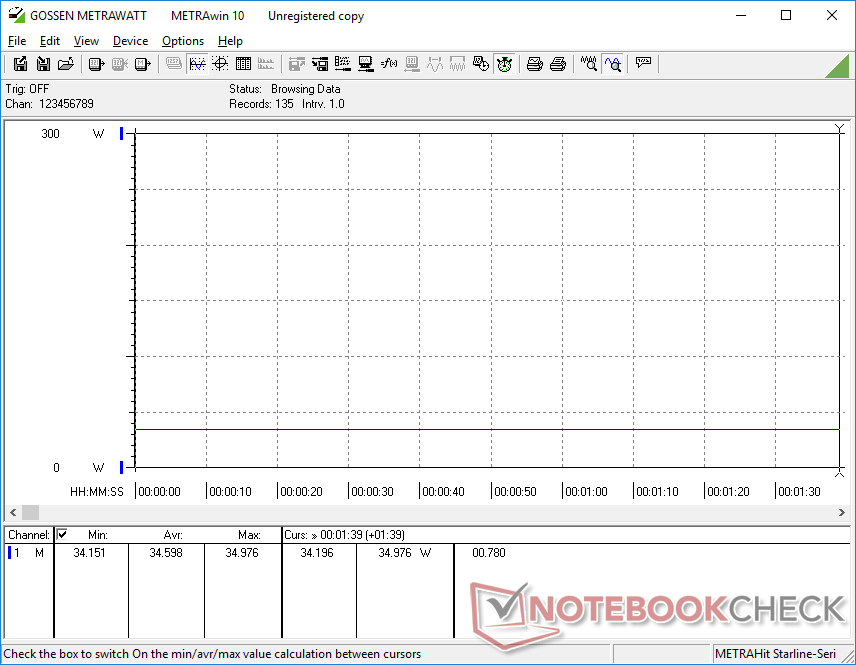
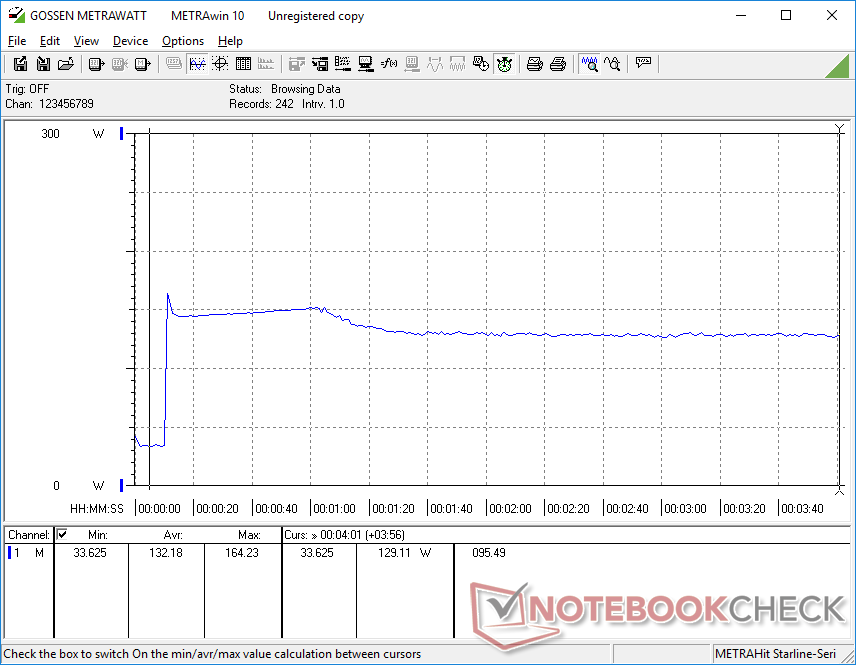
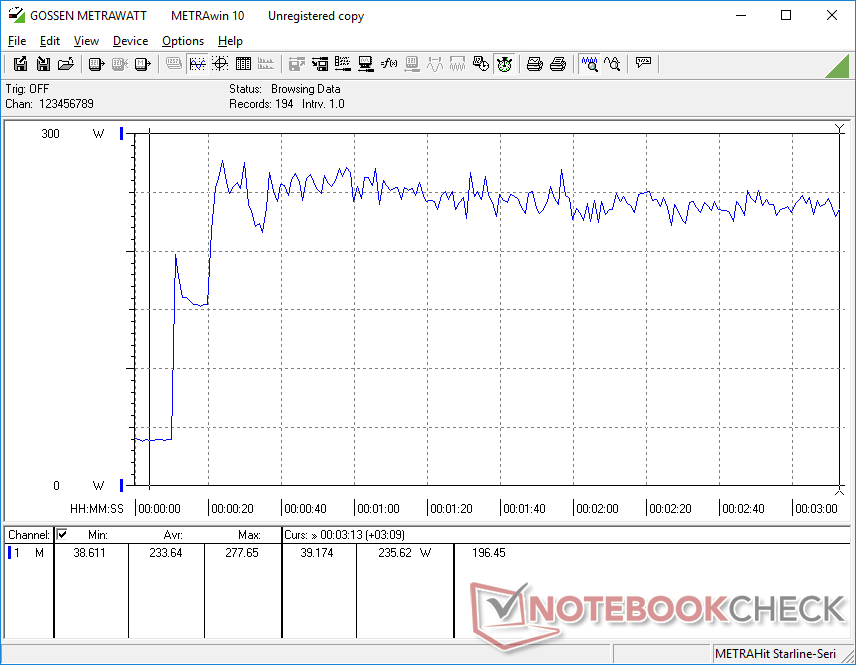
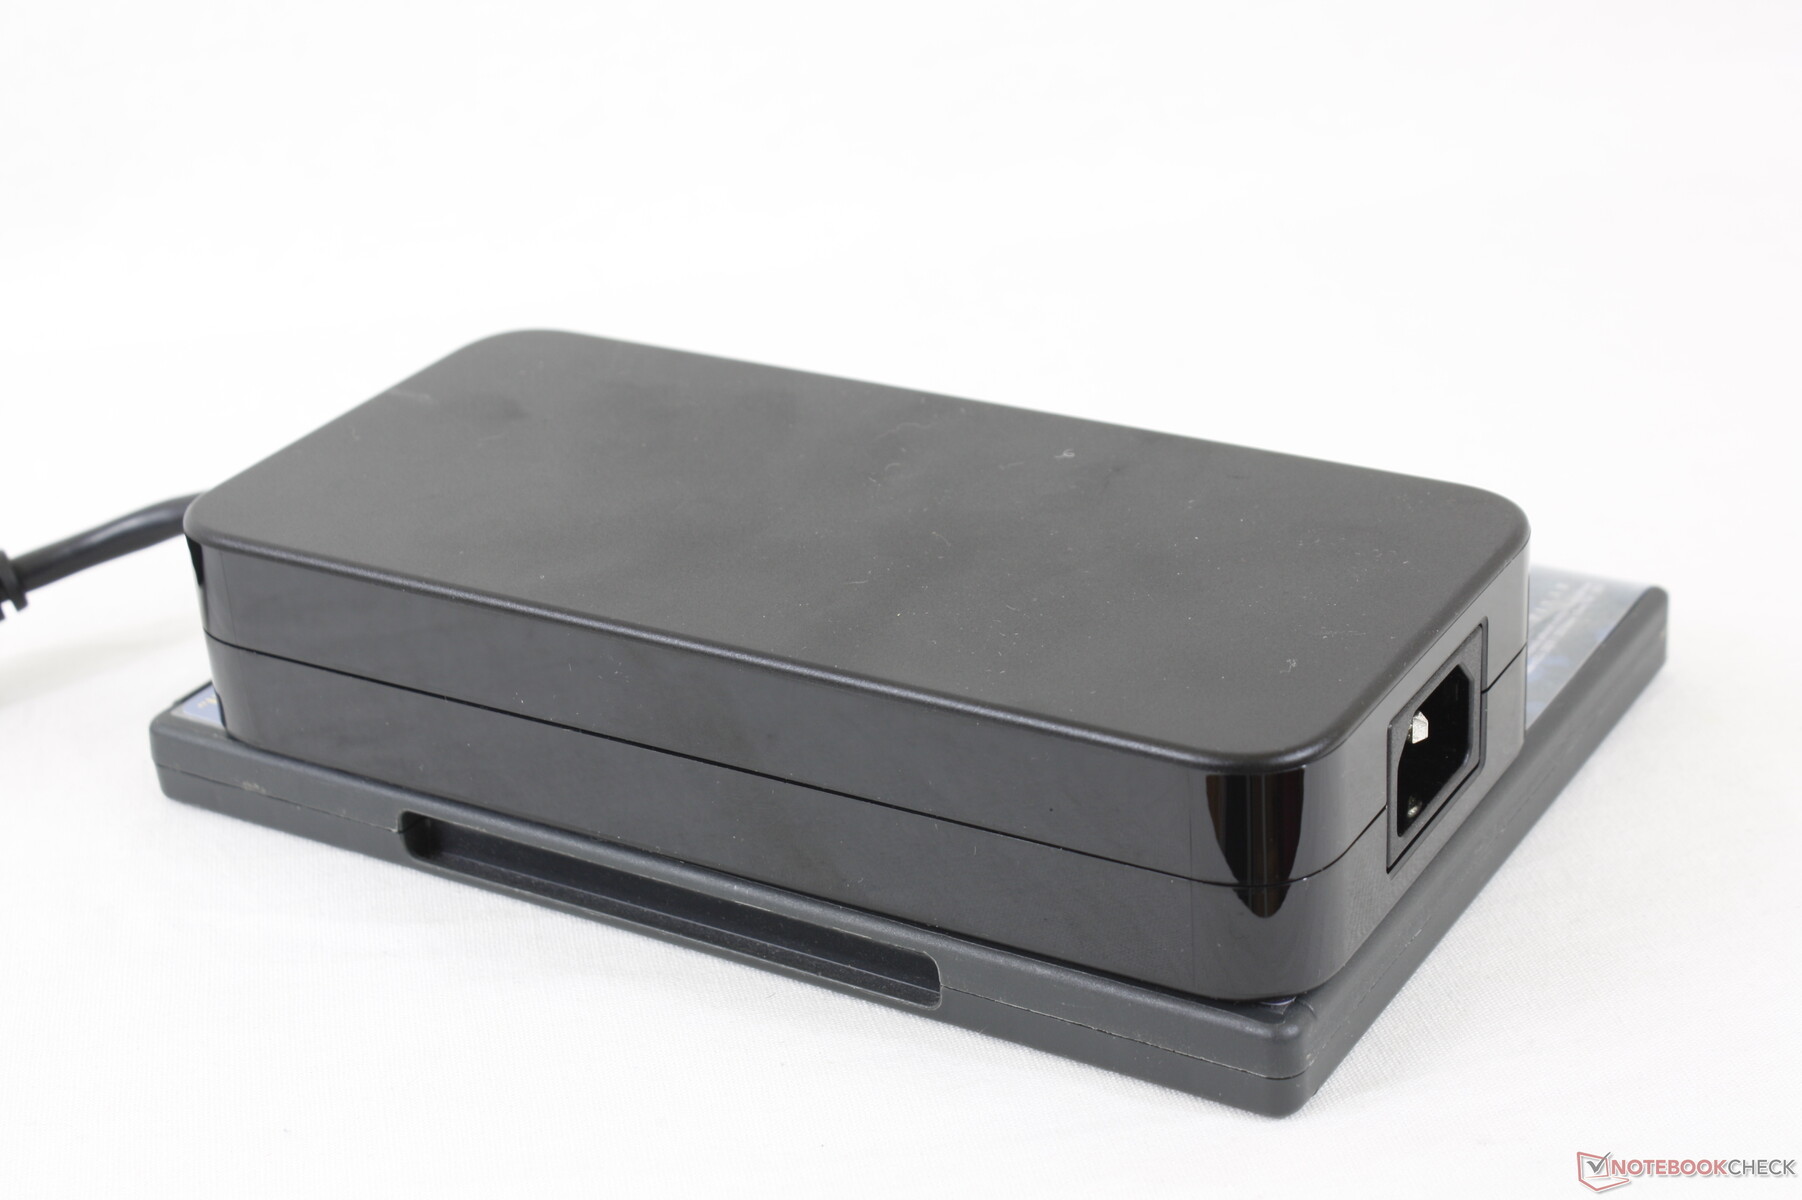
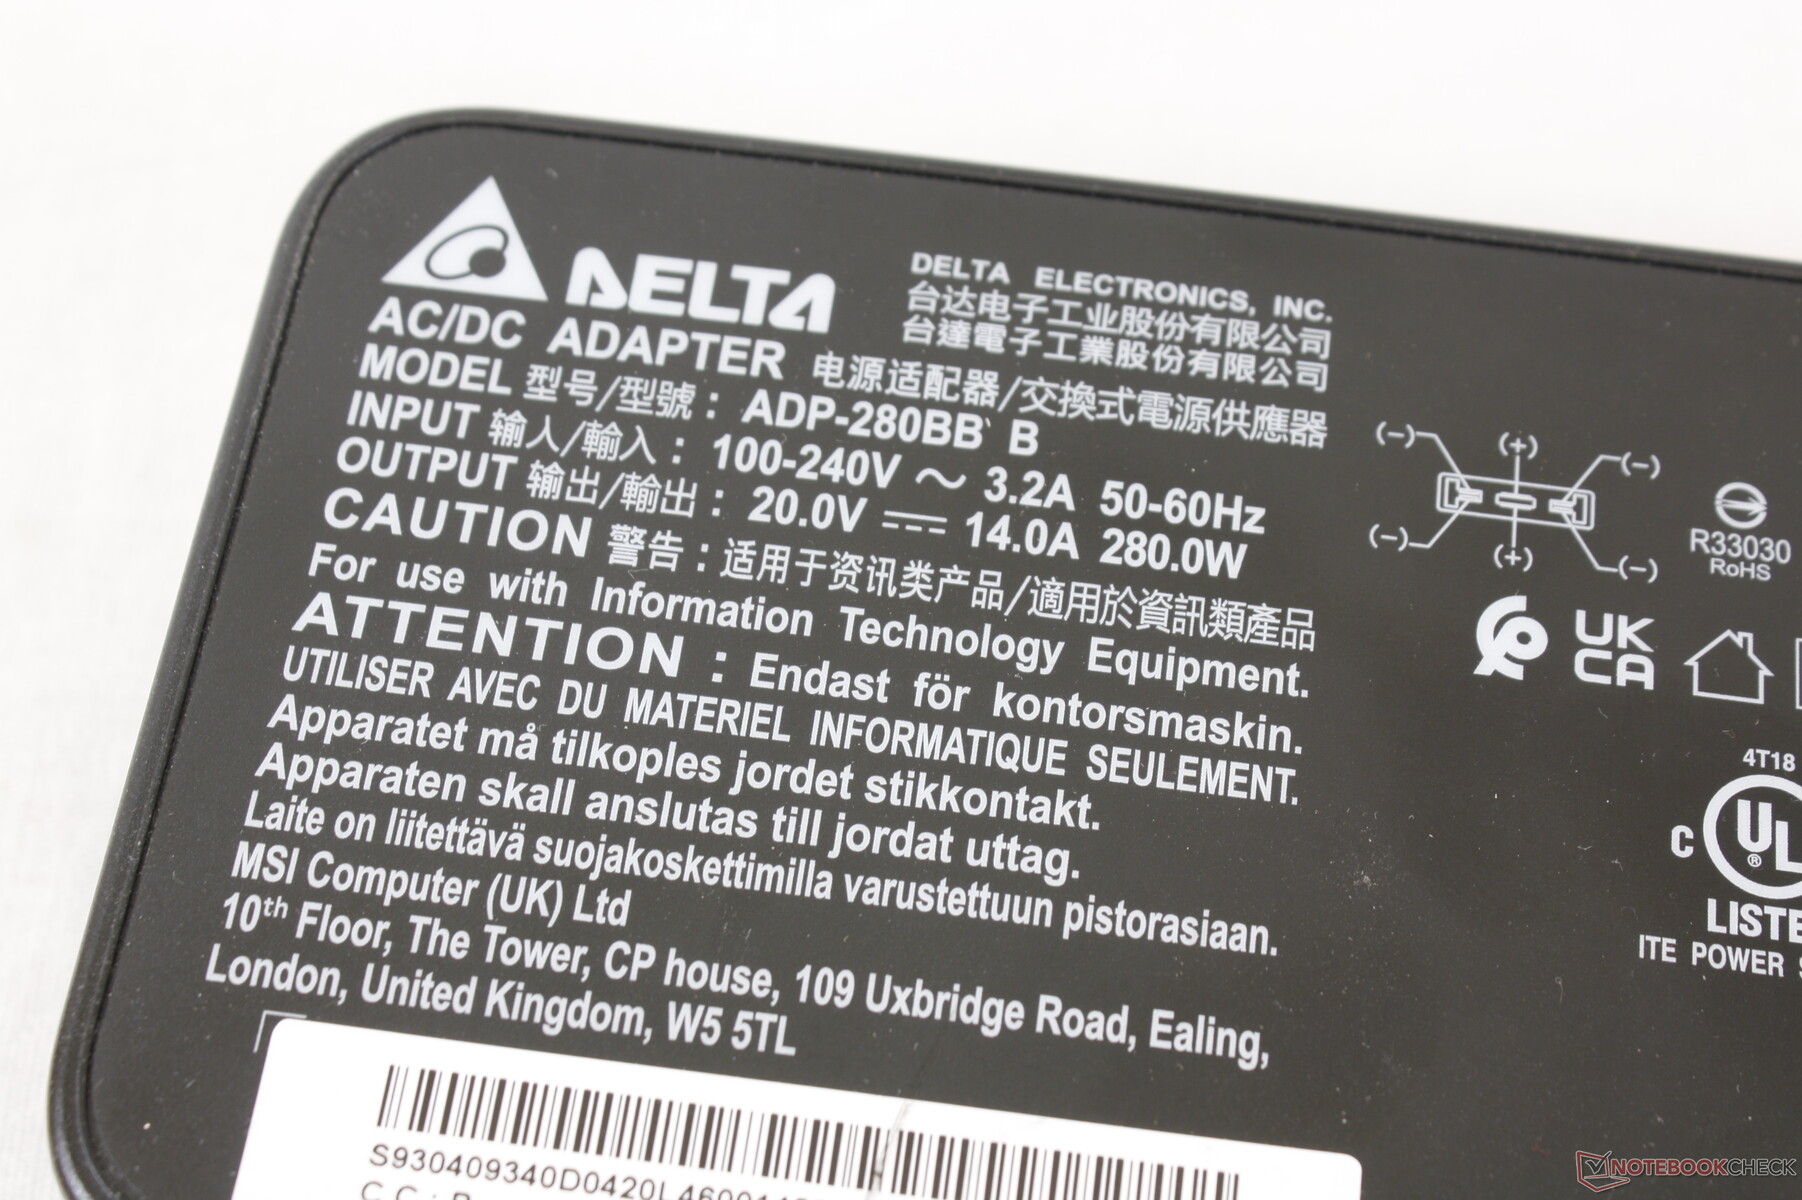
Wir messen einen temporären Maximalverbrauch von 278 W aus dem großen 280-W-Netzteil (~18 x 8,5 x 3,5 cm) wenn Prime95 und FurMark gleichzeitig laufen. Beim Gaming lädt sich der Akku immer noch mit einer ordentlichen Rate auf.
| Aus / Standby | |
| Idle | |
| Last |
|
Legende:
min: | |
| MSI Vector GP66 12UGS i9-12900H, GeForce RTX 3070 Ti Laptop GPU, , IPS, 1920x1080, 15.6" | MSI GP66 Leopard 11UH-028 i7-11800H, GeForce RTX 3080 Laptop GPU, Samsung PM9A1 MZVL21T0HCLR, IPS, 1920x1080, 15.6" | MSI Katana GF66 11UG-220 i7-11800H, GeForce RTX 3070 Laptop GPU, Kingston OM8PDP3512B-AI1, IPS, 1920x1080, 15.6" | Asus TUF Gaming F15 FX506HM i7-11800H, GeForce RTX 3060 Laptop GPU, SK Hynix HFM001TD3JX013N, IPS, 1920x1080, 15.6" | Razer Blade 15 Base Edition 2021, i7-10750H RTX 3060 i7-10750H, GeForce RTX 3060 Laptop GPU, Samsung SSD PM981a MZVLB512HBJQ, IPS, 1920x1080, 15.6" | Alienware m15 R5 Ryzen Edition R7 5800H, GeForce RTX 3060 Laptop GPU, Toshiba KBG40ZNS512G NVMe, IPS, 1920x1080, 15.6" | |
|---|---|---|---|---|---|---|
| Stromverbrauch | 24% | 38% | 36% | 28% | 23% | |
| Idle min * (Watt) | 17.5 | 13 26% | 8 54% | 9.5 46% | 11.7 33% | 11 37% |
| Idle avg * (Watt) | 20.1 | 17 15% | 12 40% | 12.1 40% | 16 20% | 14 30% |
| Idle max * (Watt) | 47.3 | 18 62% | 22 53% | 22.5 52% | 29.3 38% | 25 47% |
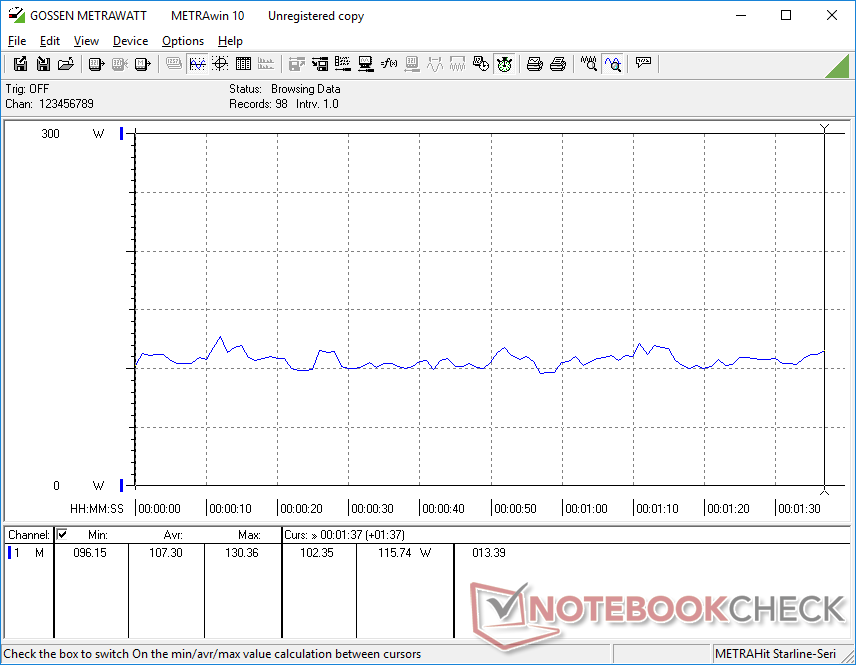
| Last avg * (Watt) | 107.3 | 96 11% | 98 9% | 99.5 7% | 95.6 11% | 123 -15% |
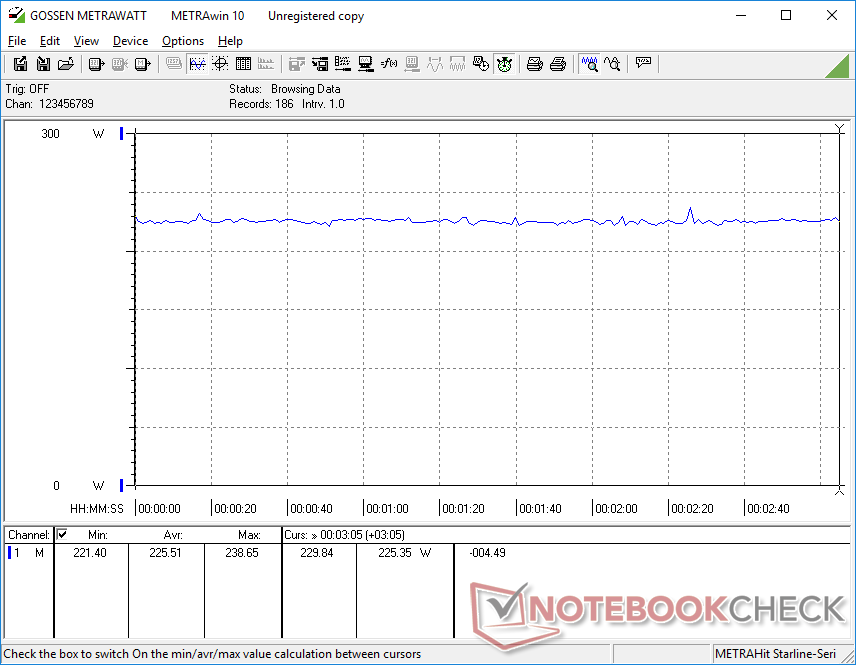
| Witcher 3 ultra * (Watt) | 225 | 207 8% | 152 32% | 157 30% | 141.3 37% | 176 22% |
| Last max * (Watt) | 277.7 | 223 20% | 162 42% | 173.5 38% | 197 29% | 226 19% |
* ... kleinere Werte sind besser
Energieverbrauch in Witcher 3 / Stresstest
Energieverbrauch mit externem Monitor
Akkulaufzeit
Die Akkukapazität hat sich seit letztem Jahr mit 65 Wh nicht verändert. Dennoch messen wir längere WLAN-Laufzeiten um ganze zwei Stunden beim neuen Modell. Wir empfehlen die Einstellung MSHybrid für eine längere Laufzeit.
Eine komplette Aufladung von 0 auf 100 dauert mit dem mitgelieferten Netzteil etwa 2,5 Stunden, die meisten anderen Laptops benötigen nur 2 Stunden dafür. Das Laden via USB-C-Adapter wird, anders als bei vielen Alternativen von Asus bis Razer, leider nicht unterstützt.
| MSI Vector GP66 12UGS i9-12900H, GeForce RTX 3070 Ti Laptop GPU, 65 Wh | MSI GP66 Leopard 11UH-028 i7-11800H, GeForce RTX 3080 Laptop GPU, 65 Wh | MSI Katana GF66 11UG-220 i7-11800H, GeForce RTX 3070 Laptop GPU, 90 Wh | Asus TUF Gaming F15 FX506HM i7-11800H, GeForce RTX 3060 Laptop GPU, 90 Wh | Razer Blade 15 Base Edition 2021, i7-10750H RTX 3060 i7-10750H, GeForce RTX 3060 Laptop GPU, 65 Wh | Alienware m15 R5 Ryzen Edition R7 5800H, GeForce RTX 3060 Laptop GPU, 86 Wh | |
|---|---|---|---|---|---|---|
| Akkulaufzeit | -9% | 9% | 59% | 11% | 22% | |
| Idle (h) | 7.9 | 9.1 15% | 11 39% | 7.8 -1% | 14.7 86% | |
| WLAN (h) | 5.7 | 3.6 -37% | 5.3 -7% | 7.9 39% | 4.8 -16% | 5.1 -11% |
| Last (h) | 1 | 1.2 20% | 1.2 20% | 2 100% | 1.5 50% | 0.9 -10% |
| H.264 (h) | 3.5 | 8.8 | ||||
| Witcher 3 ultra (h) | 0.8 | 1.6 |
Pro
Contra
Fazit - Mobilität und Leistung
Das verbesserte Kühlsystem des GP66 gegenüber dem GP65 erlauben den Einsatz einer stärkeren 150-W-TGP bei der GPU gegenüber den nur 100 W beim Razer Blade 15 oder dem MSI GS66. Anders gesagt, man bekommt hier eine der besten Versionen der mobilen GeForce RTX 3070 Ti in einem 15,6-Zoll-Laptop. Zwar mag das GS66 dünner und mobiler sein, aber dessen GeForce RTX 3070 Ti ist auch spürbar langsamer. Das GP66 ist für eine ausgeglichenere Erfahrung die bessere Wahl.
Der Extreme-Performance-Modus ist nur notwendig wenn man das Maximum aus der GPU herausquetschen möchte. Der Modus ist aber gleichzeitig der lauteste, auch im Vergleich mit anderen Laptops. Gaming im Balanced-Modus limitiert die Lautstärke deutlich und man verliert nur etwa 5 Prozent an Grafikleistung. Daher empfehlen wir diesen Modus allen Gamern, welche nur ungerne Kopfhörer verwenden oder sich sonst an super lauten Gaming-Laptops stören.
Das Vector GP66 schafft mit seiner 150-W-GP einen besseren Spagat zwischen Mobilität und Leistung als die meisten ultradünnen Gaming-Laptops.
Für die Zukunft wünschen wir uns Verbesserungen bei den schwammigen Touchpad-Tasten und eine schnellere PCIe4-x4-SSD. Das Clickpad ist ein Rückschritt zum älteren GP65 und das Fehlen eines Heatspreader für die NVMe-SSD bedeutet, dass die Transferraten bei intensiver Nutzung schnellerer PCIe4-x4-SSDs bald fallen dürften.
Preise und Verfügbarkeit
Das Vector ist bereits in Deutschland erhältlich, allerdings nicht in der von uns getesteten Konfiguration. Die Variante mit Core i7-12700H, 16GB RAM, 1TB SSD und GeForce RTX 3080 kostet rund 2.900 Euro, beispielsweise hier.
MSI Vector GP66 12UGS
- 03.03.2022 v7 (old)
Allen Ngo

