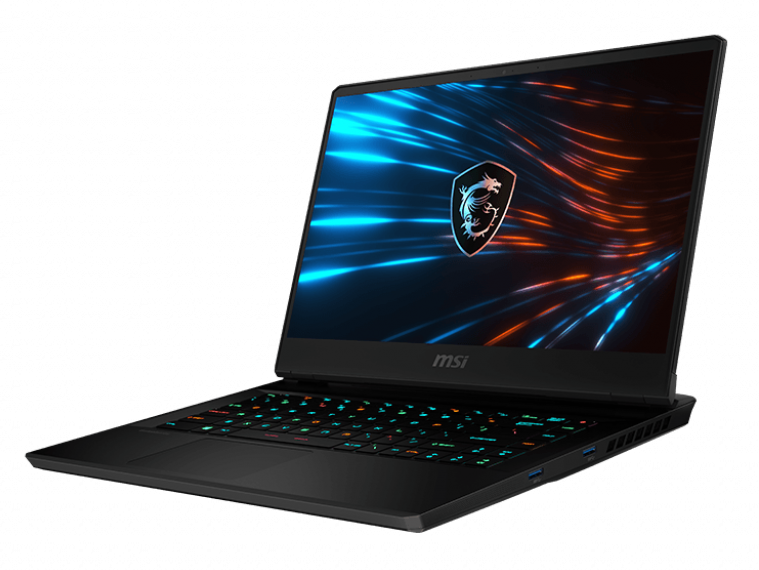
MSI GP66 Leopard 10UG im Laptop-Test: Die Überarbeitung einer ganzen Serie
Quasi parallel zu Nvidias mobiler Ampere-Serie kündigte MSI zu Beginn des Jahres das GP66 an, inklusive brandneuem Design gegenüber dem älteren GP65. Nahezu alles hat sich dabei geändert, von der Tastatur bis hin zum Kühlsystem. Daher repräsentieren die Veränderungen den Start einer neuen Generation an GP-Laptops. Bei der GP-Familie handelt es sich um MSIs Mittelklasse-Gaming-Laptops oberhalb der preiswerteren GL- und GF-Serien, aber unterhalb der teureren GE- und GT-Serien.
Konfigurationen reichen von Intels Gen 10 Core-i7 10870H mit GeForce RTX 3060 bis hoch zum Core i7-10875H mit RTX 3080. Unser Testmodell bildet die goldene Mitte und ist mit einem Core i7-10870H und einer RTX 3070 ausgerüstet. Je nach RAM und Massenspeicher kostet der Laptop um die $2500 USD (ca. 2.600 Euro).
Konkurrenz findet sich in anderen Mittelklasse-Gaming-Laptops mit 15,6-Zoll-Display wie dem Gigabyte Aorus 15P, dem Asus ROG Zephyrus G15, oder dem Lenovo Legion 7.
Mehr MSI-Tests:
potential competitors in comparison
Bew. | Datum | Modell | Gewicht | Dicke | Größe | Auflösung | Preis ab |
|---|---|---|---|---|---|---|---|
| 84.2 % v7 (old) | 04 / 2021 | MSI GP66 Leopard 10UG i7-10870H, GeForce RTX 3070 Laptop GPU | 2.3 kg | 23.4 mm | 15.60" | 1920x1080 | |
| 83.2 % v7 (old) | 06 / 2020 | MSI GP65 10SFK-047US i7-10750H, GeForce RTX 2070 Mobile | 2.3 kg | 27.5 mm | 15.60" | 1920x1080 | |
| 85.4 % v7 (old) | 04 / 2021 | Alienware m15 R4 i9-10980HK, GeForce RTX 3070 Laptop GPU | 2.3 kg | 20 mm | 15.60" | 1920x1080 | |
| 86.1 % v7 (old) | 02 / 2021 | Aorus 15P XC i7-10870H, GeForce RTX 3070 Laptop GPU | 2.2 kg | 27 mm | 15.60" | 1920x1080 | |
| 83.8 % v7 (old) | 01 / 2021 | Asus ROG Zephyrus G15 GA503Q R9 5900HS, GeForce RTX 3080 Laptop GPU | 2 kg | 20 mm | 15.60" | 2560x1440 | |
| 80.4 % v7 (old) | 03 / 2021 | MSI GF65 Thin 10UE i7-10750H, GeForce RTX 3060 Laptop GPU | 1.9 kg | 21.7 mm | 15.60" | 1920x1080 |
Gehäuse
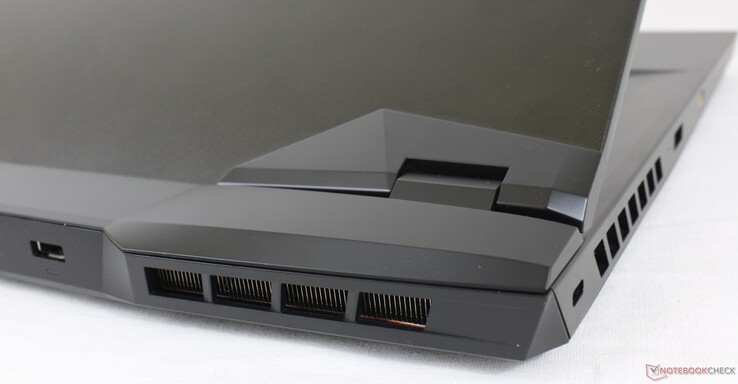
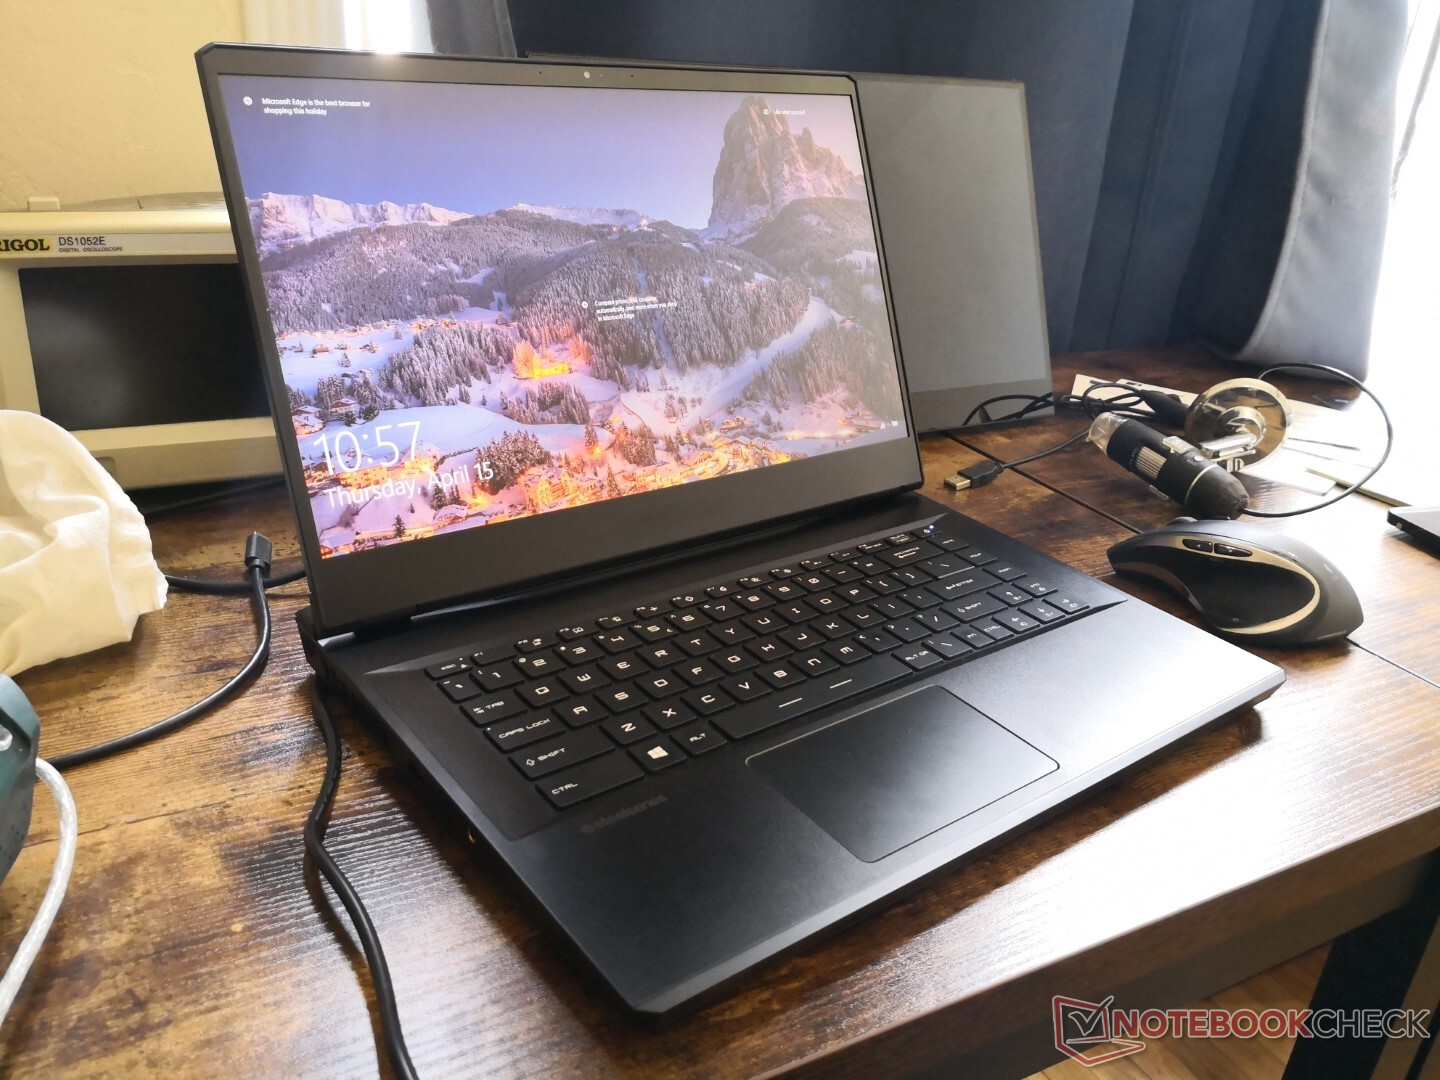
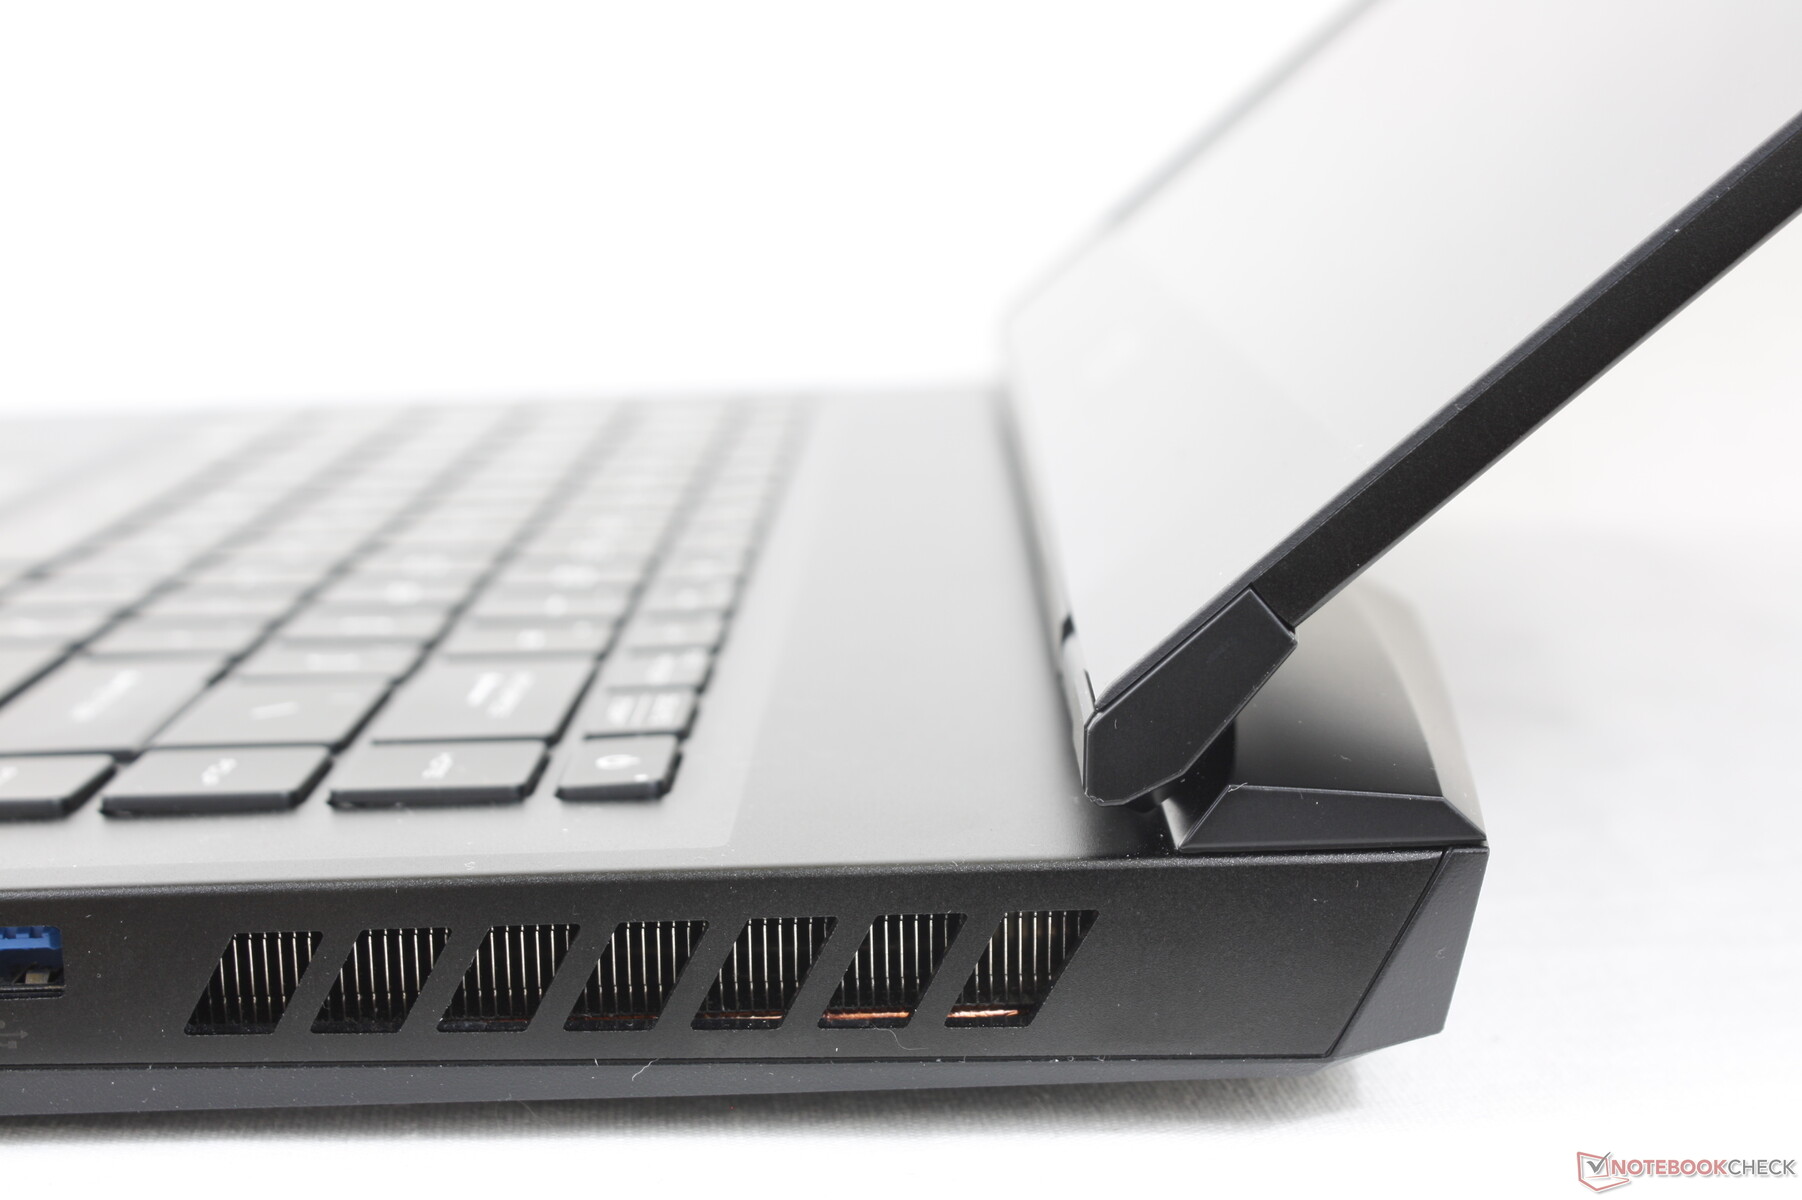
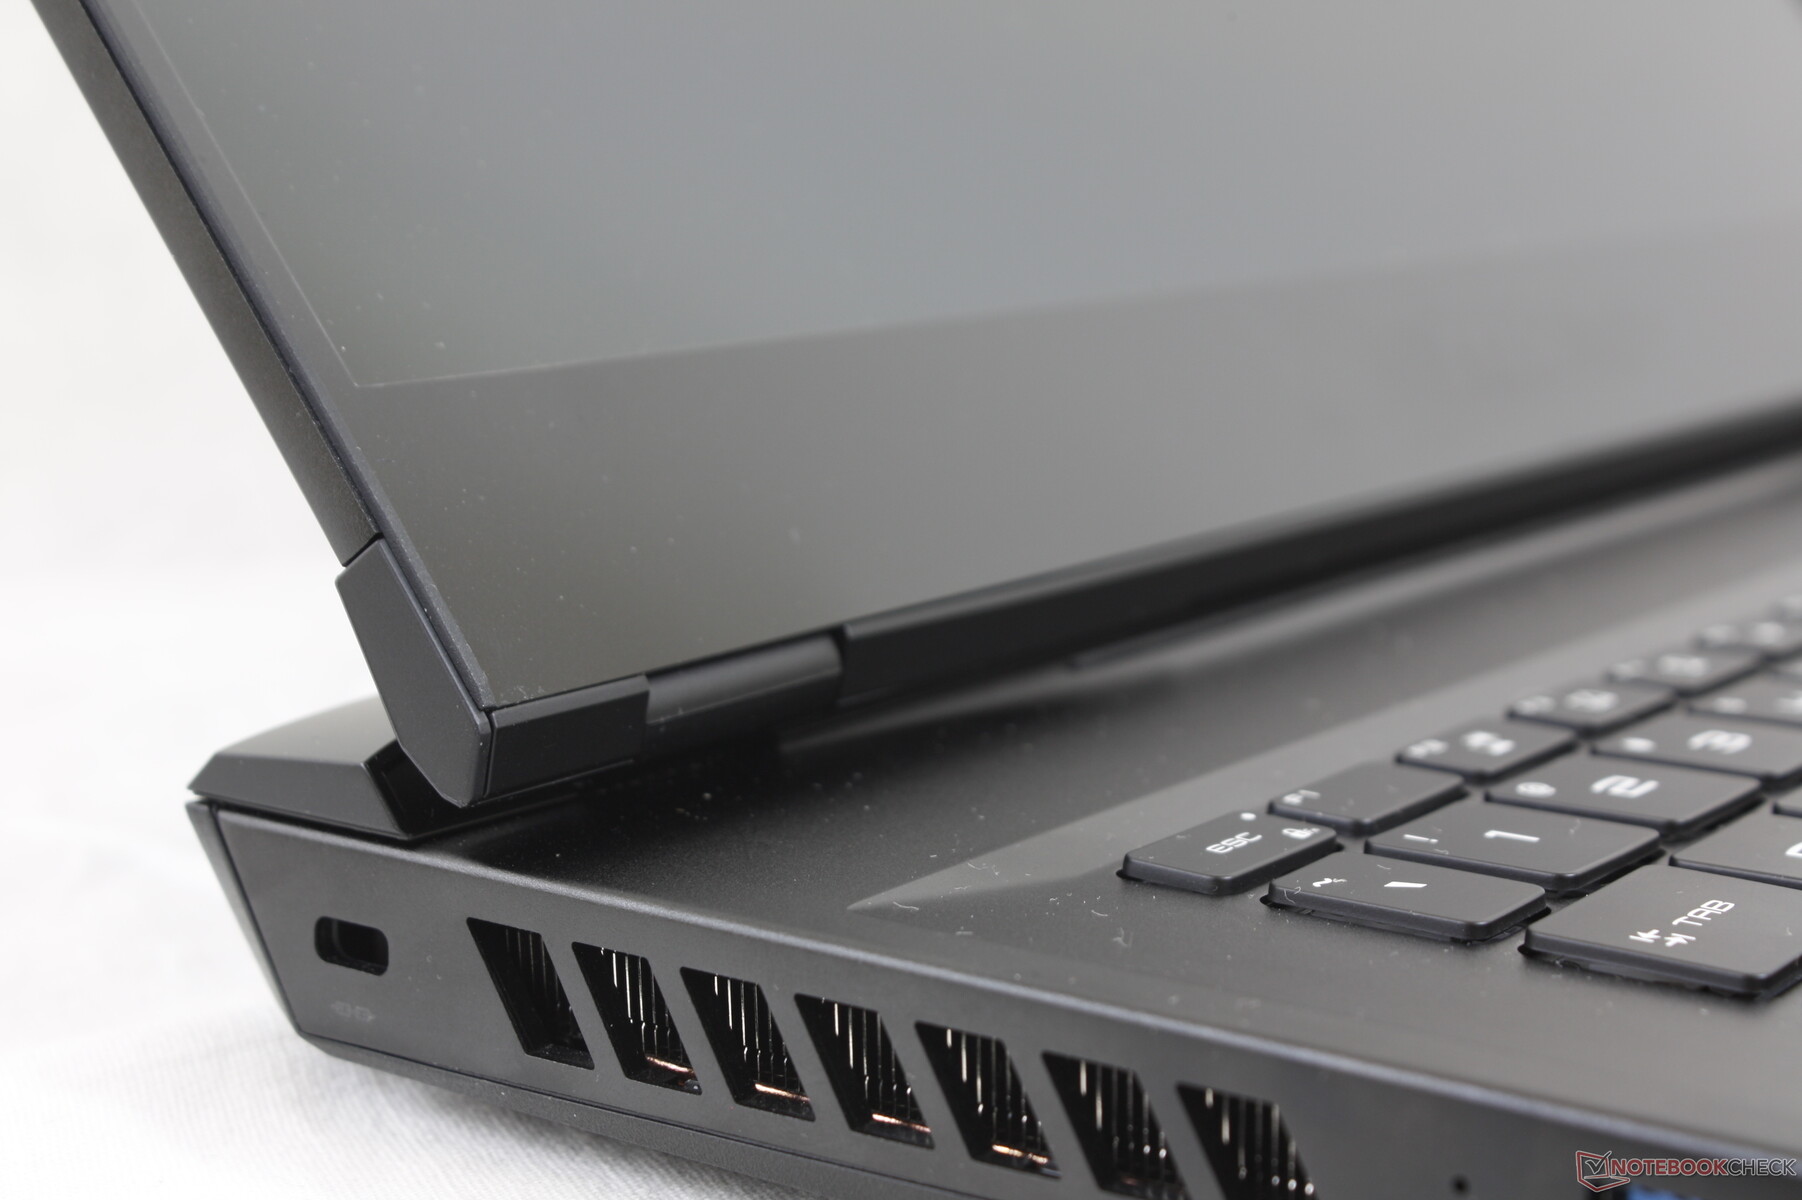
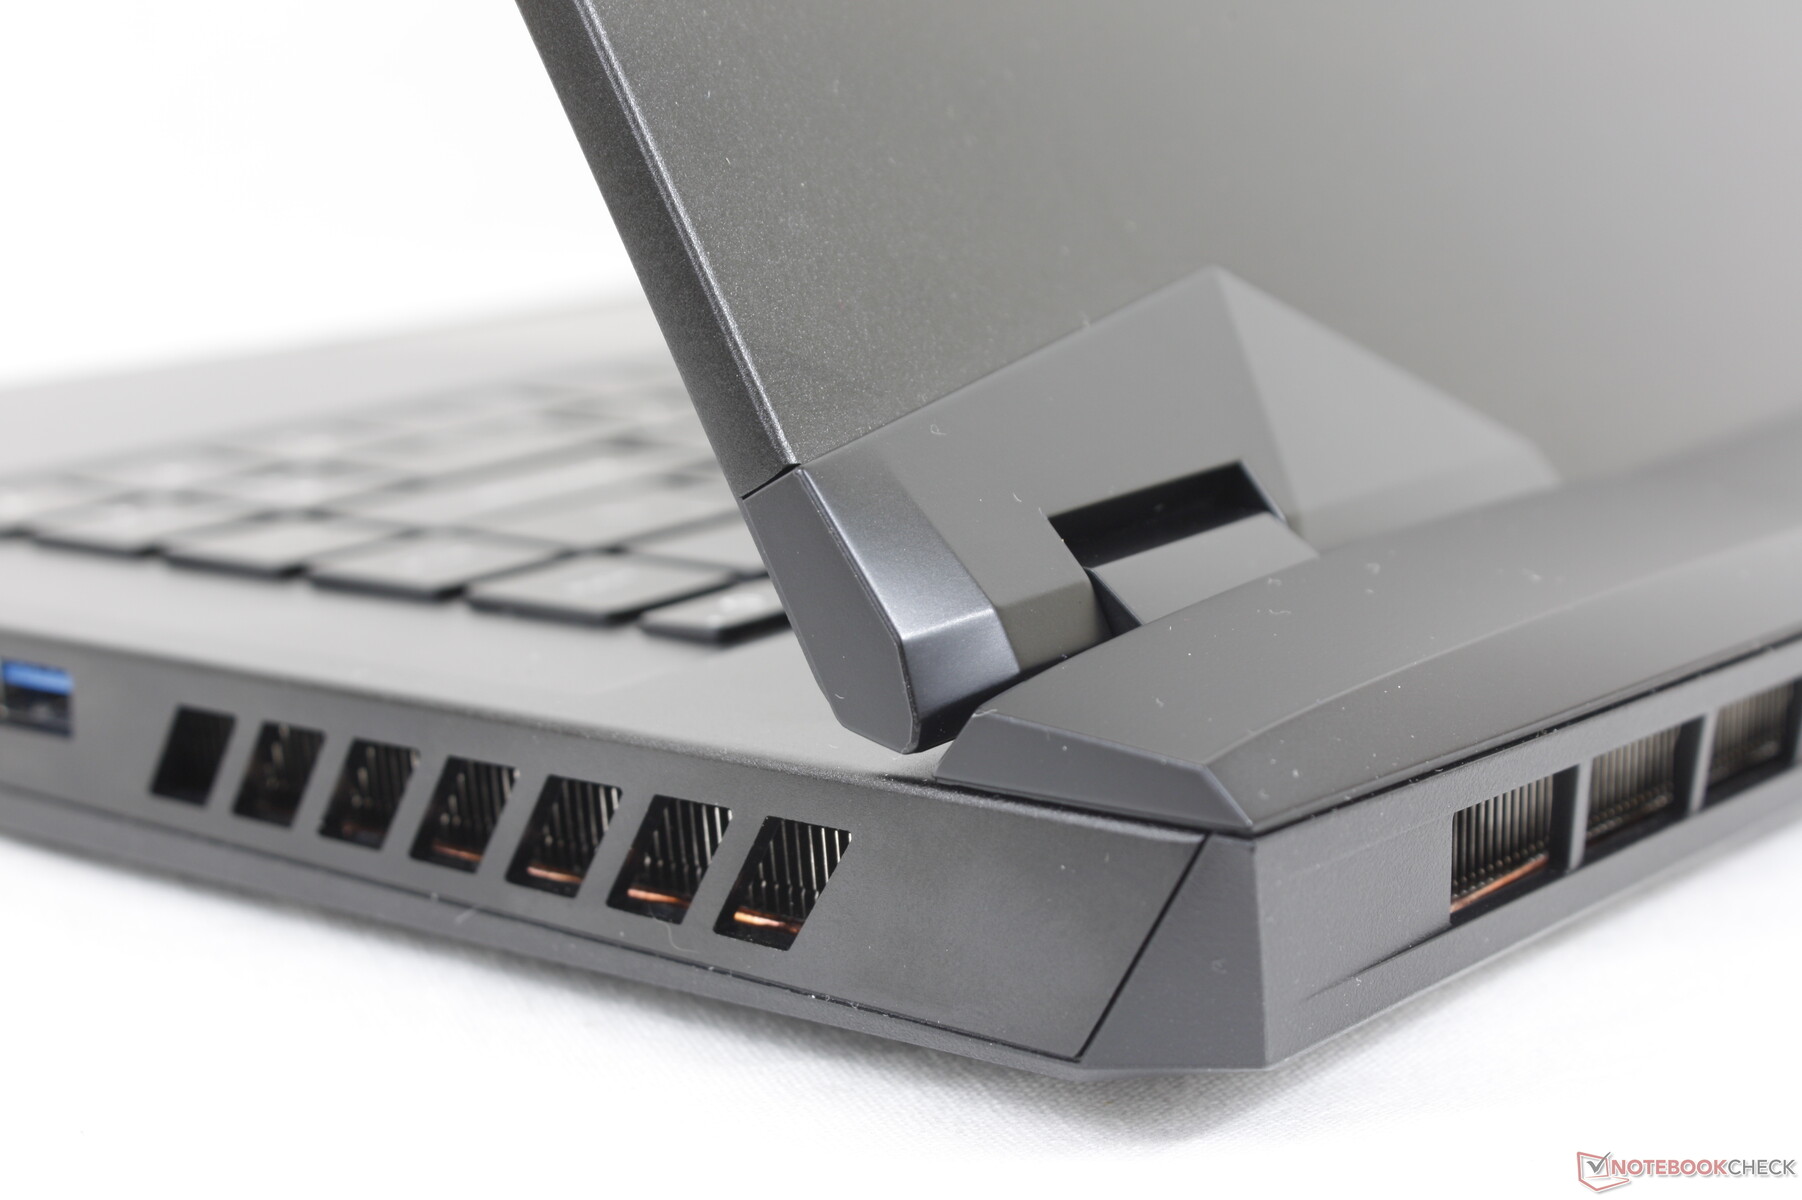
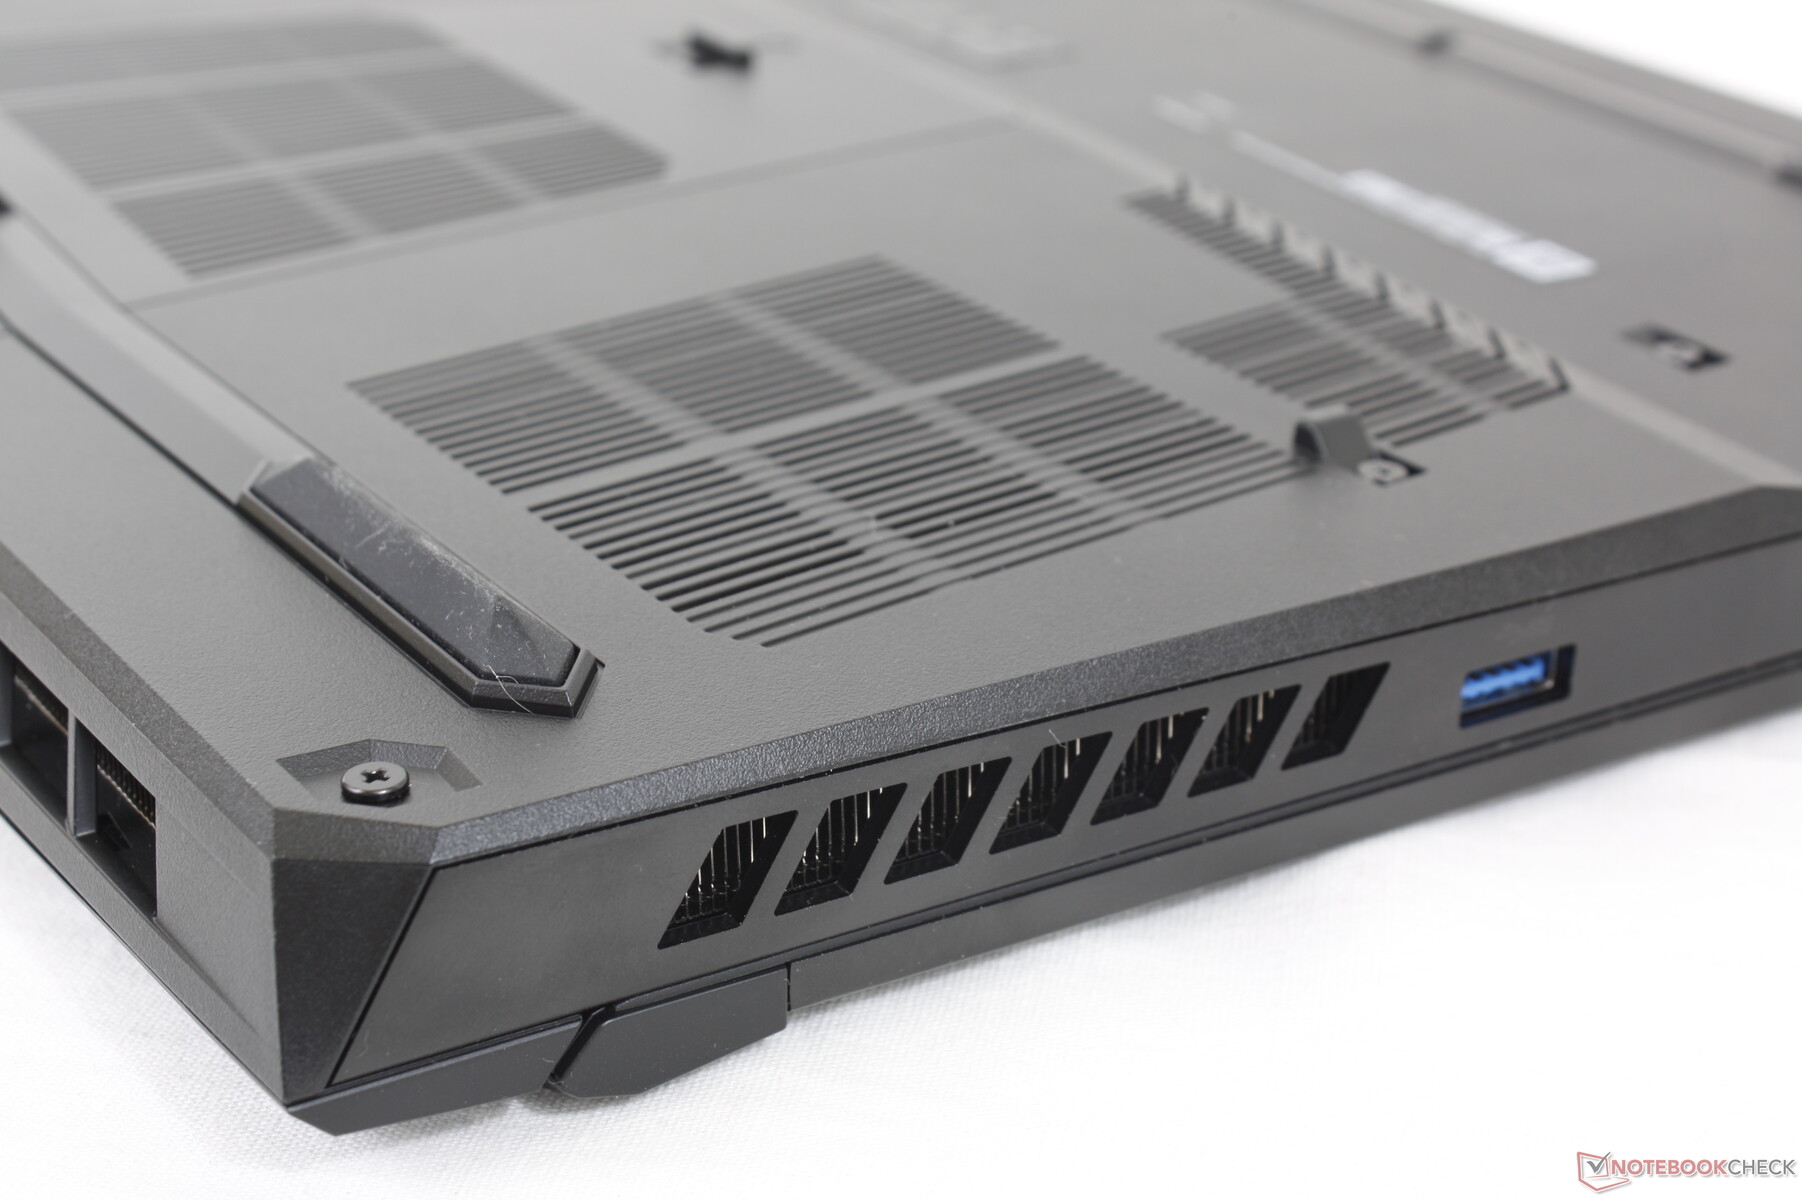
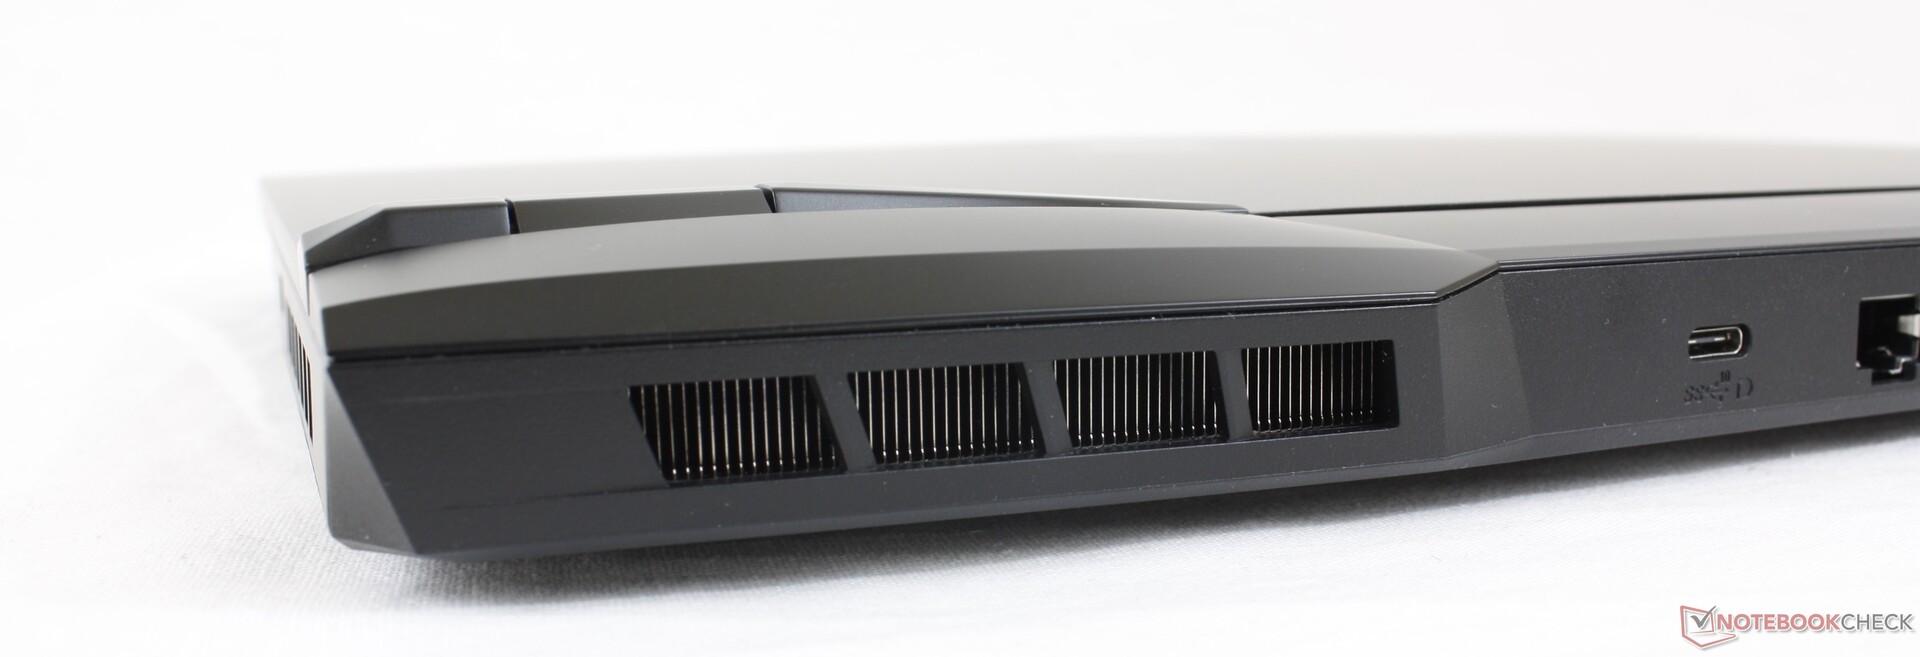
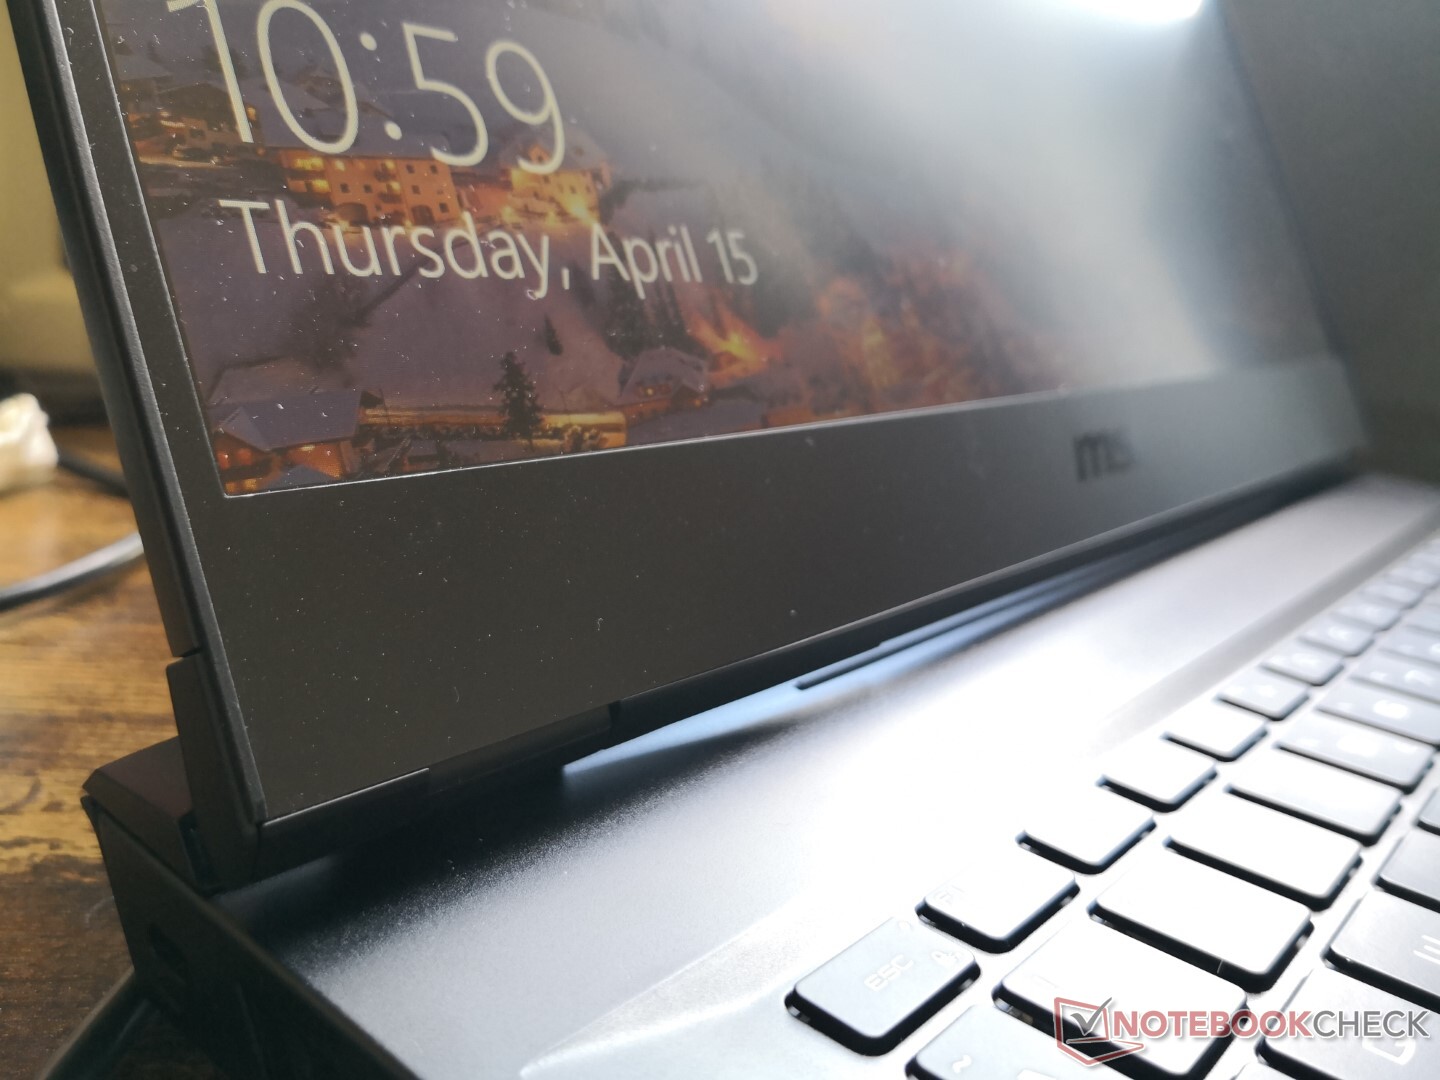
Der größte Unterschied vom GP65 zum GP66 ist die vergrößerte Rückseite, welche das nun stärkere Kühlsystem beherbergt. Das allgemeine Design kann am ehesten als "abgedunkeltes" GE66 bezeichnet werden. Beide Laptops verfügen über die gleiche, glatte Metalloberfläche, aber das GP66 ist ein paar Farbtöne dunkler gehalten. Die RGB-Lichtleiste in der vorderen Kante des GE66 ist im GP66 nicht vertreten, die RGB-Beleuchtung pro Taste hingegen schon.
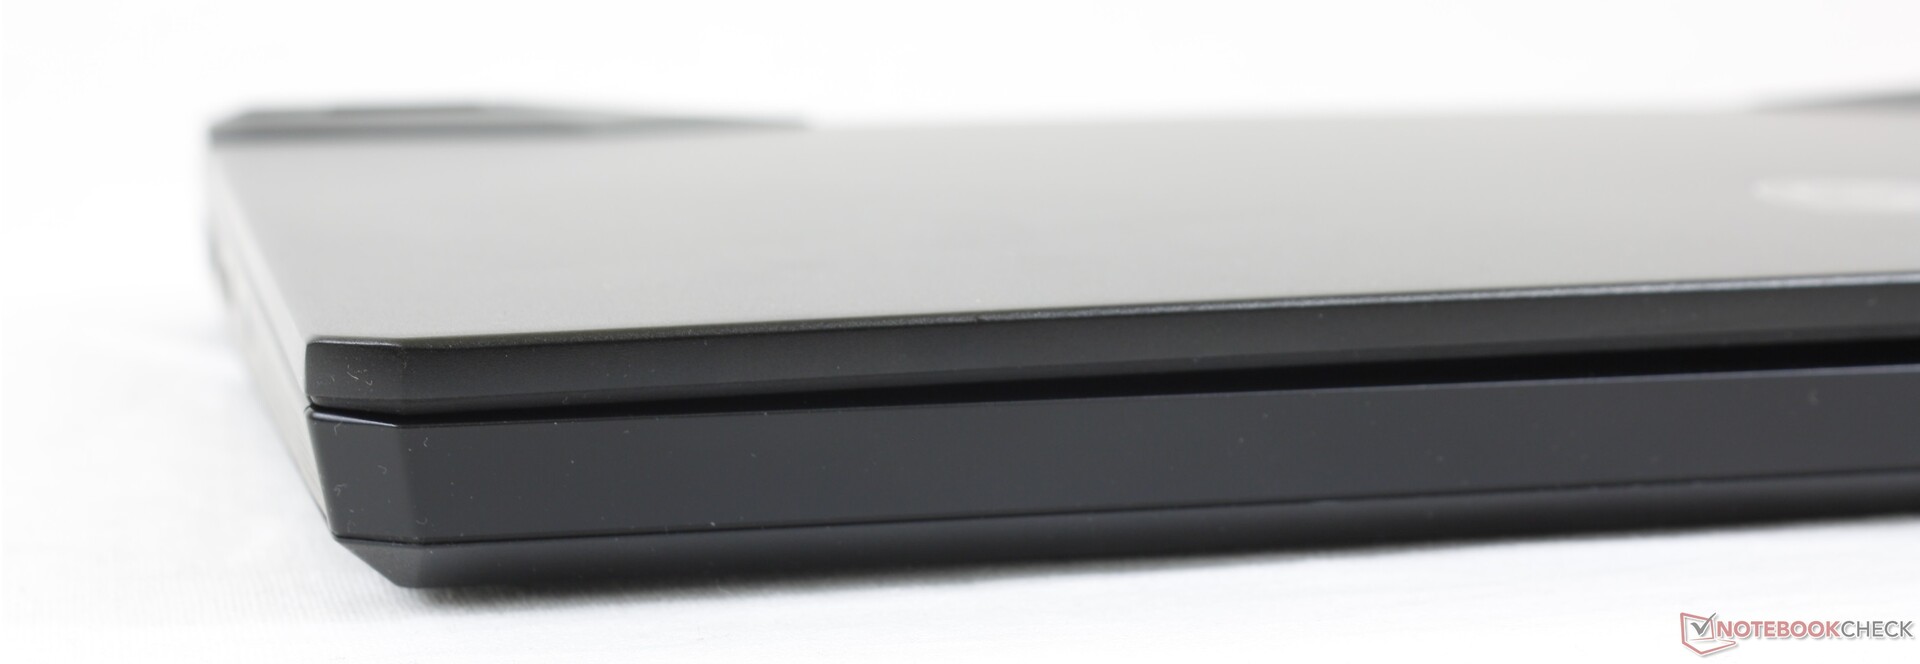
Die Verarbeitungsqualität ist ausgezeichnet, vor allem bezüglich der Basis. Der Tastaturuntergrund lässt sich nur wenig verbiegen und gibt lediglich minimale Knacktöne beim Verwinden der vorderen Ecken von sich. Nur der Displaydeckel hätte etwas stabiler ausfallen können, vor allem die Scharniere, welche beim Einstellen des Öffnungswinkels doch arg nachwippen. Auch die Rückseite des Deckels verwindet sich leichter als z.B. beim Asus ROG Strix G15, sobald man etwas Druck auf die Mitte ausübt.
Das neue Design fällt spürbar tiefer aus als beim alten GP65, vor allem durch die Lüfterausgänge an der Rückseite. Das Gewicht bleibt hingegen mit 2,3 kg nahezu gleich, darüber hinaus ist das Gehäuse um etwa 4 mm dünner. Das konkurrierende Alienware m15 R4 ist nochmal größer, während das Asus Zephyrus G15 GA503Q sowohl leichter als auch kleiner ausfällt.
Anschlüsse
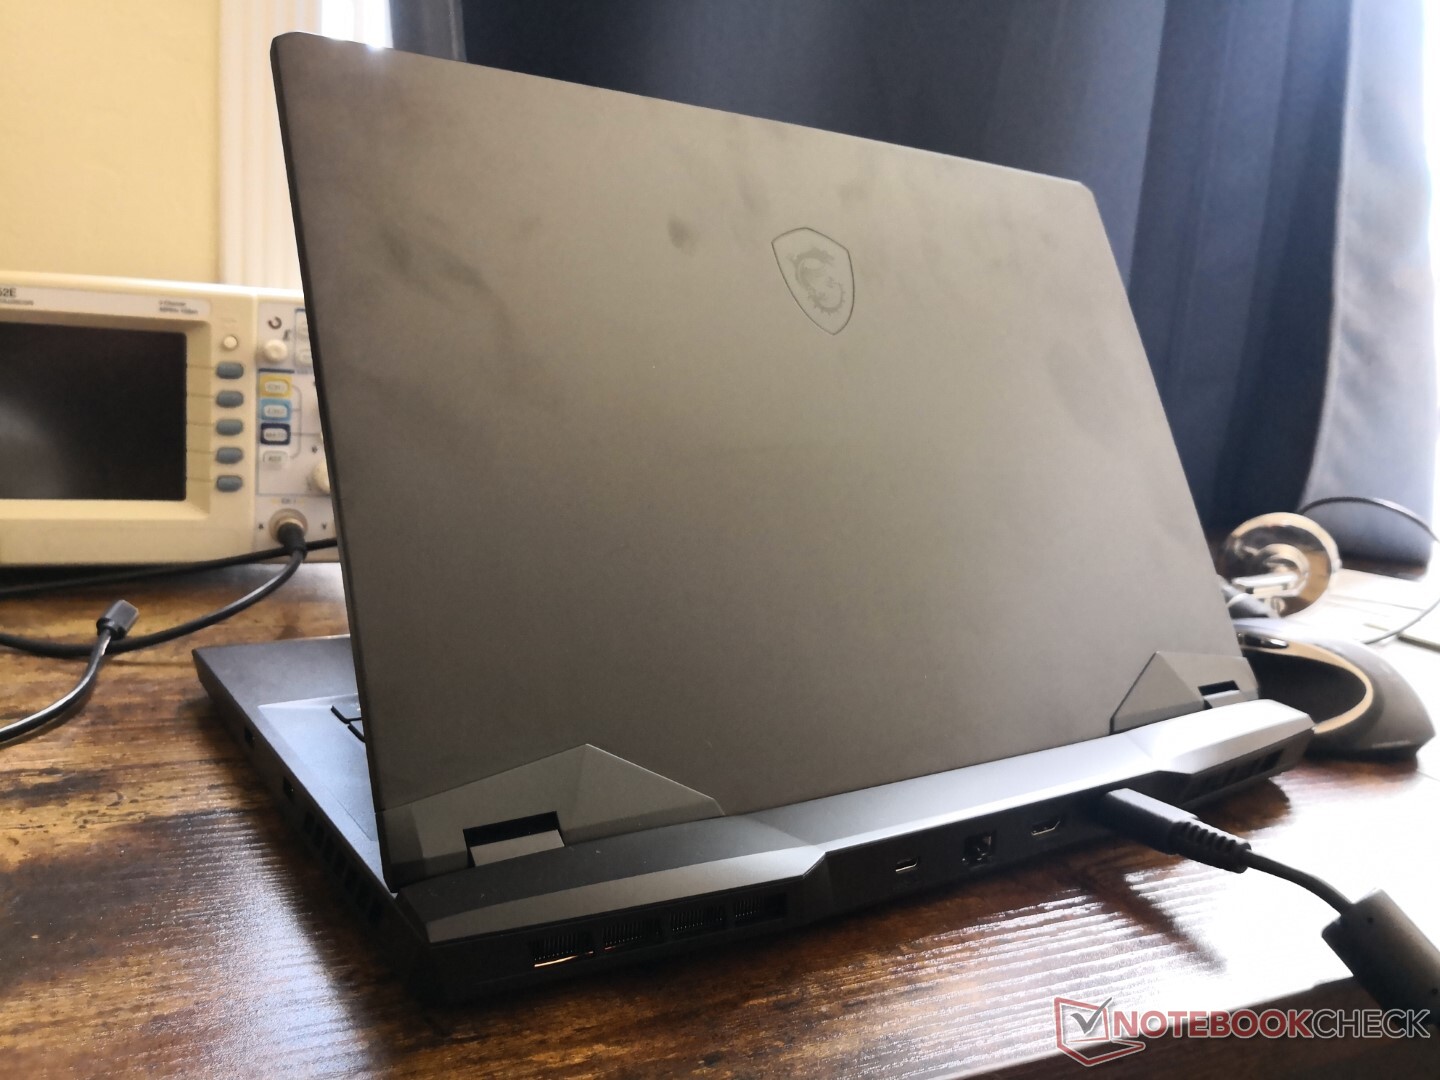
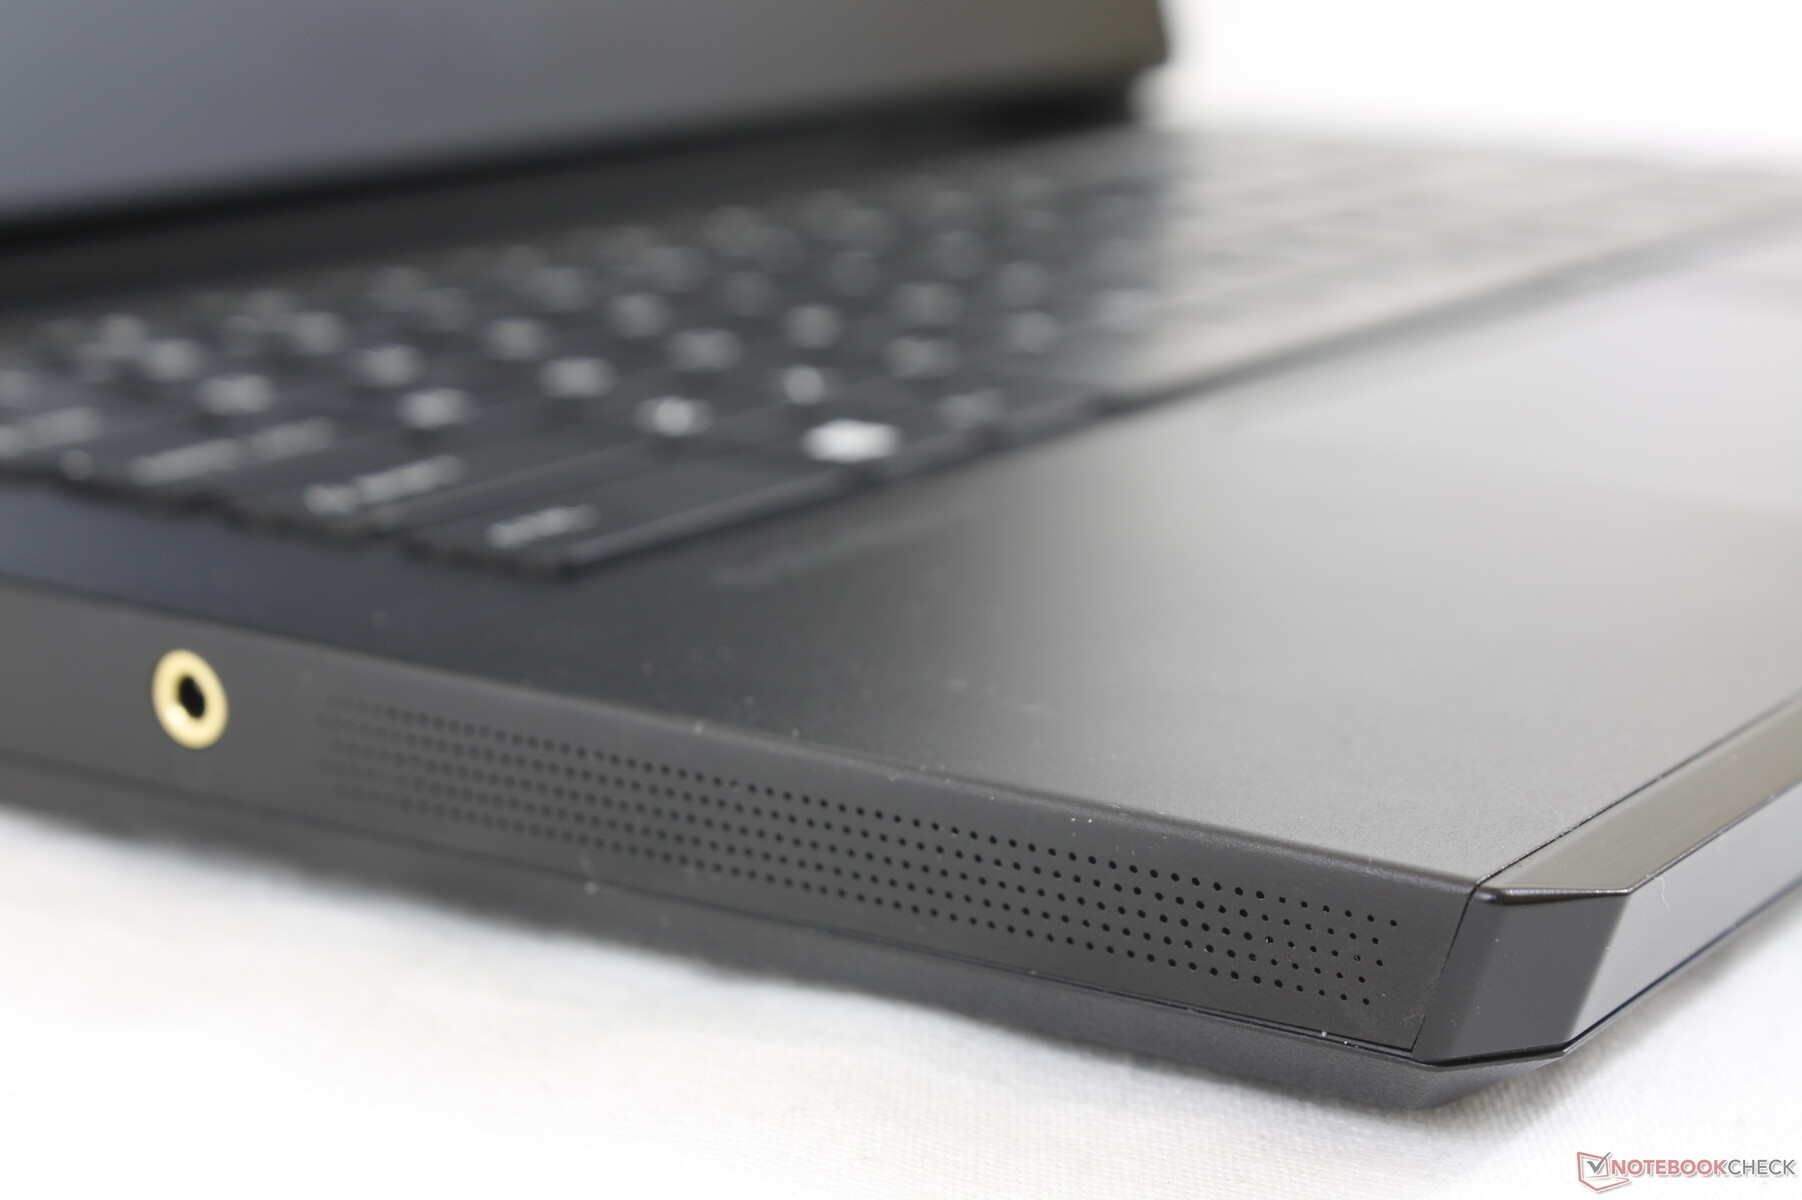
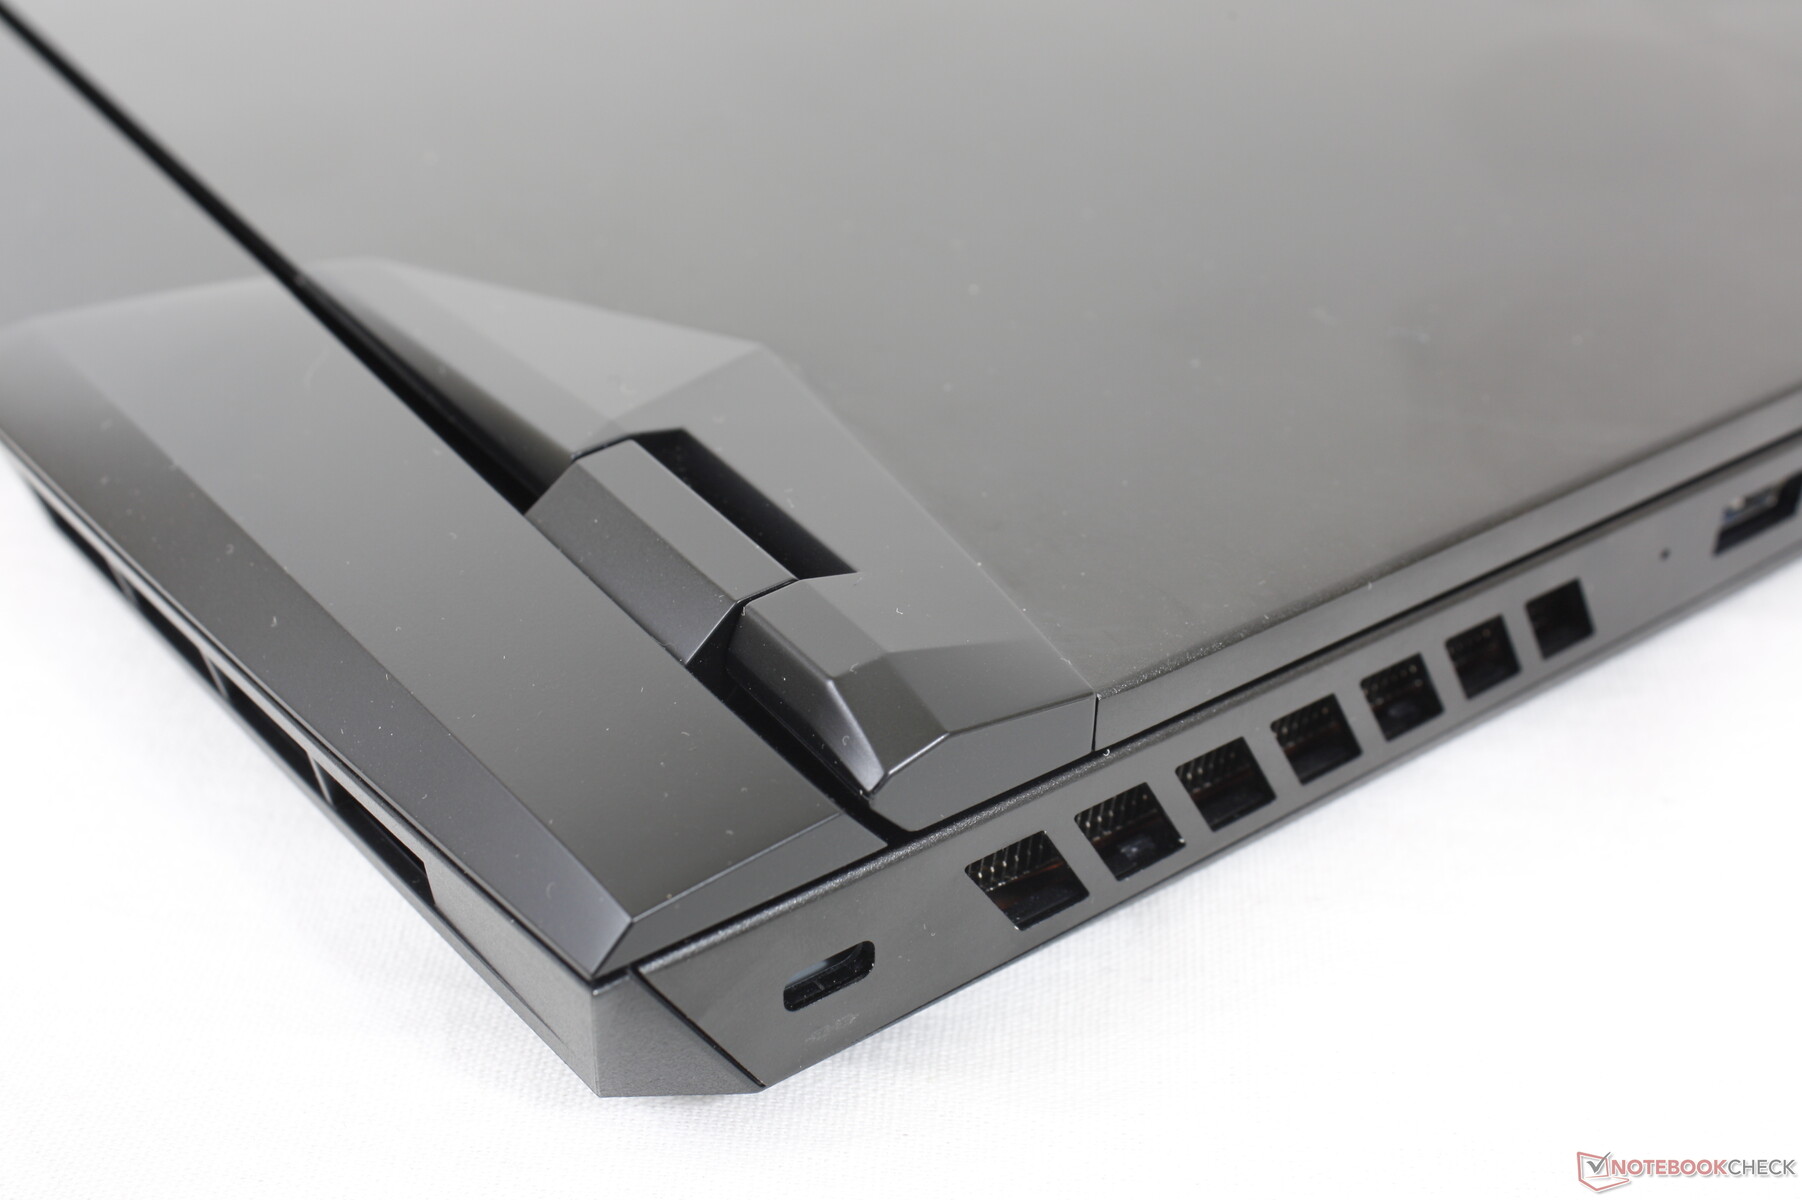
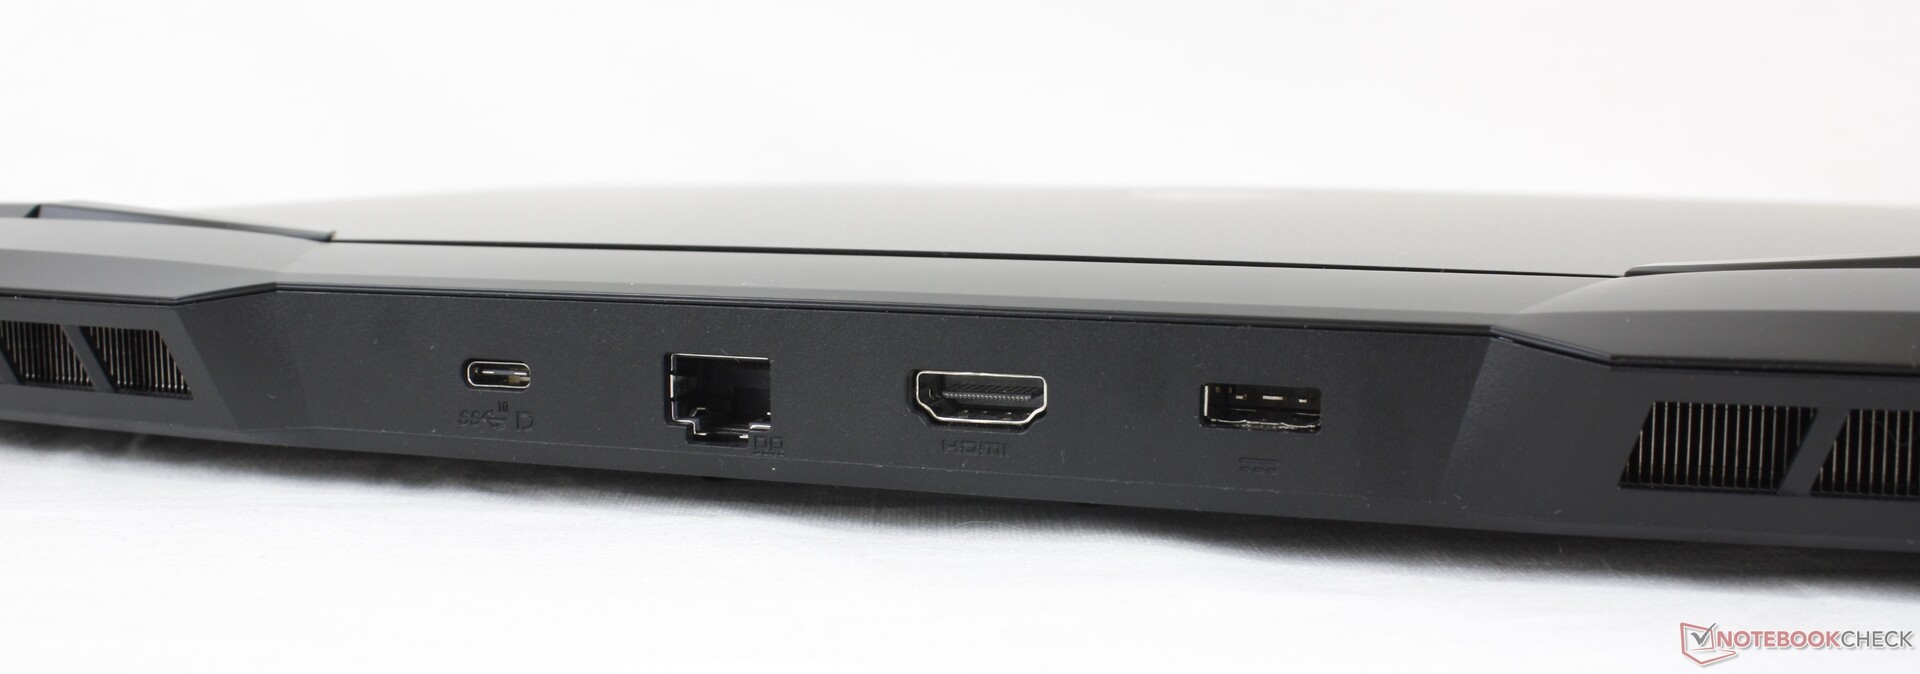
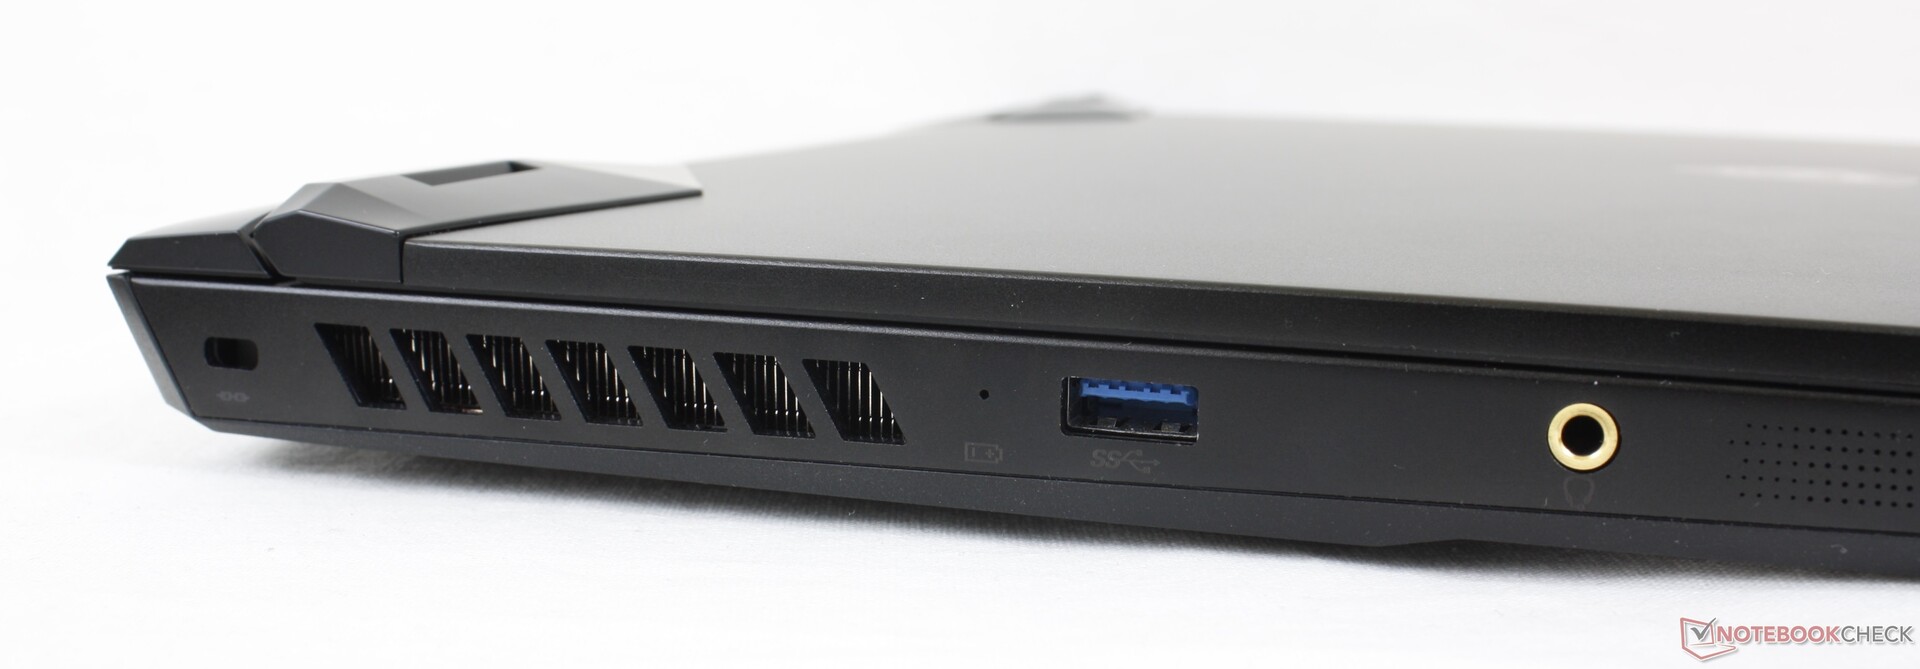
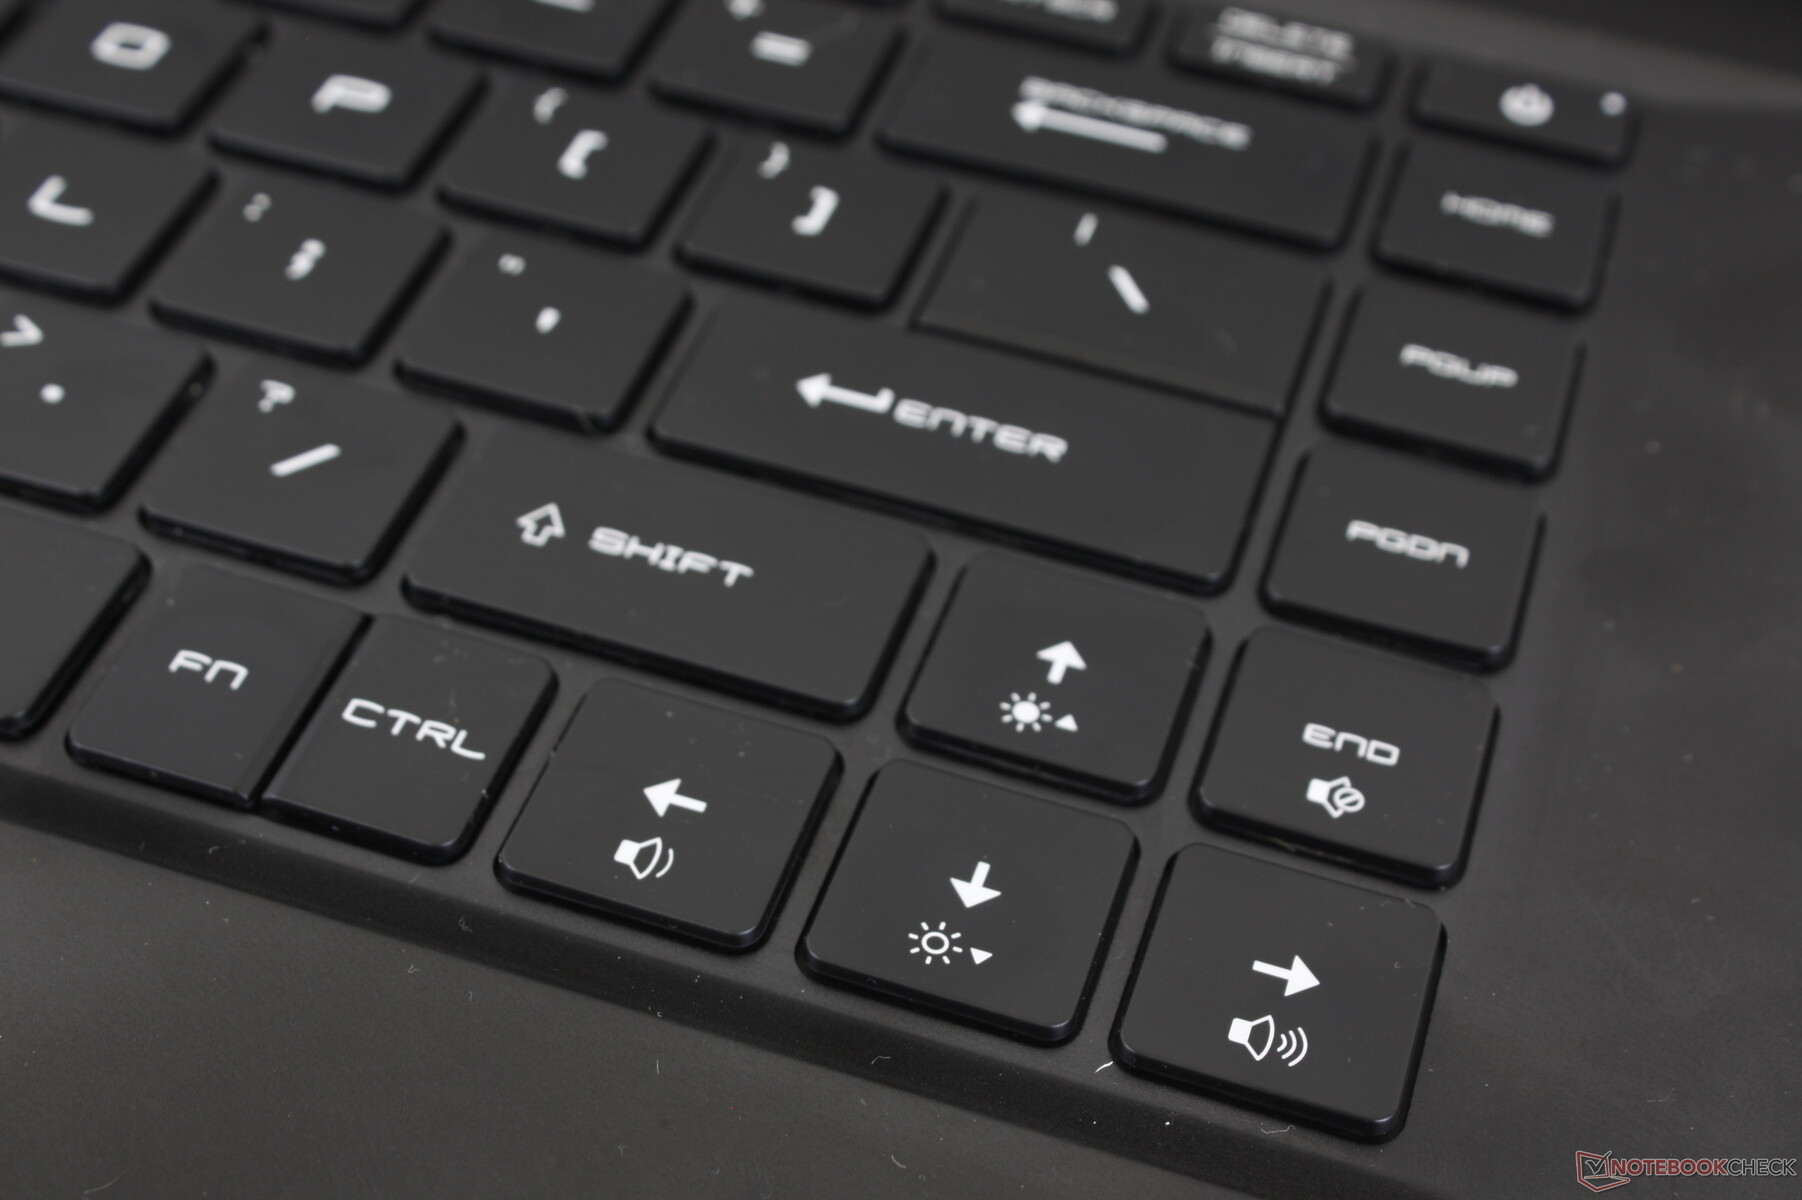
Die Anschlussmöglichkeiten und deren Platzierung haben sich gegenüber dem GP65 stark verändert. Jetzt verteilen sich die Ports gleichmäßiger auf die linke, rechte und die Rückseite, beim GP65 drängten sie sich noch arg eng aneinander. Außerdem sind sowohl der Mikrofoneingang als auch der Mini-DisplayPort zugunsten eines DisplayPort via USB-C gewichen. Der HDMI-Anschluss wurde von 1.4 zu 2.0 aufgewertet, was den Support von 4K/60 fps bedeutet, zudem gibt es einen zusätzlichen USB-A-Port, insgesamt hat man drei davon.
Leider werden Thunderbolt und USB-C-Power-Delivery nicht unterstützt. Dementsprechend können Nutzer das GP66 nicht via USB-C laden, anders als beispielsweise beim Razer Blade 15 oder dem Alienware m15.

Kommunikation
Webcam


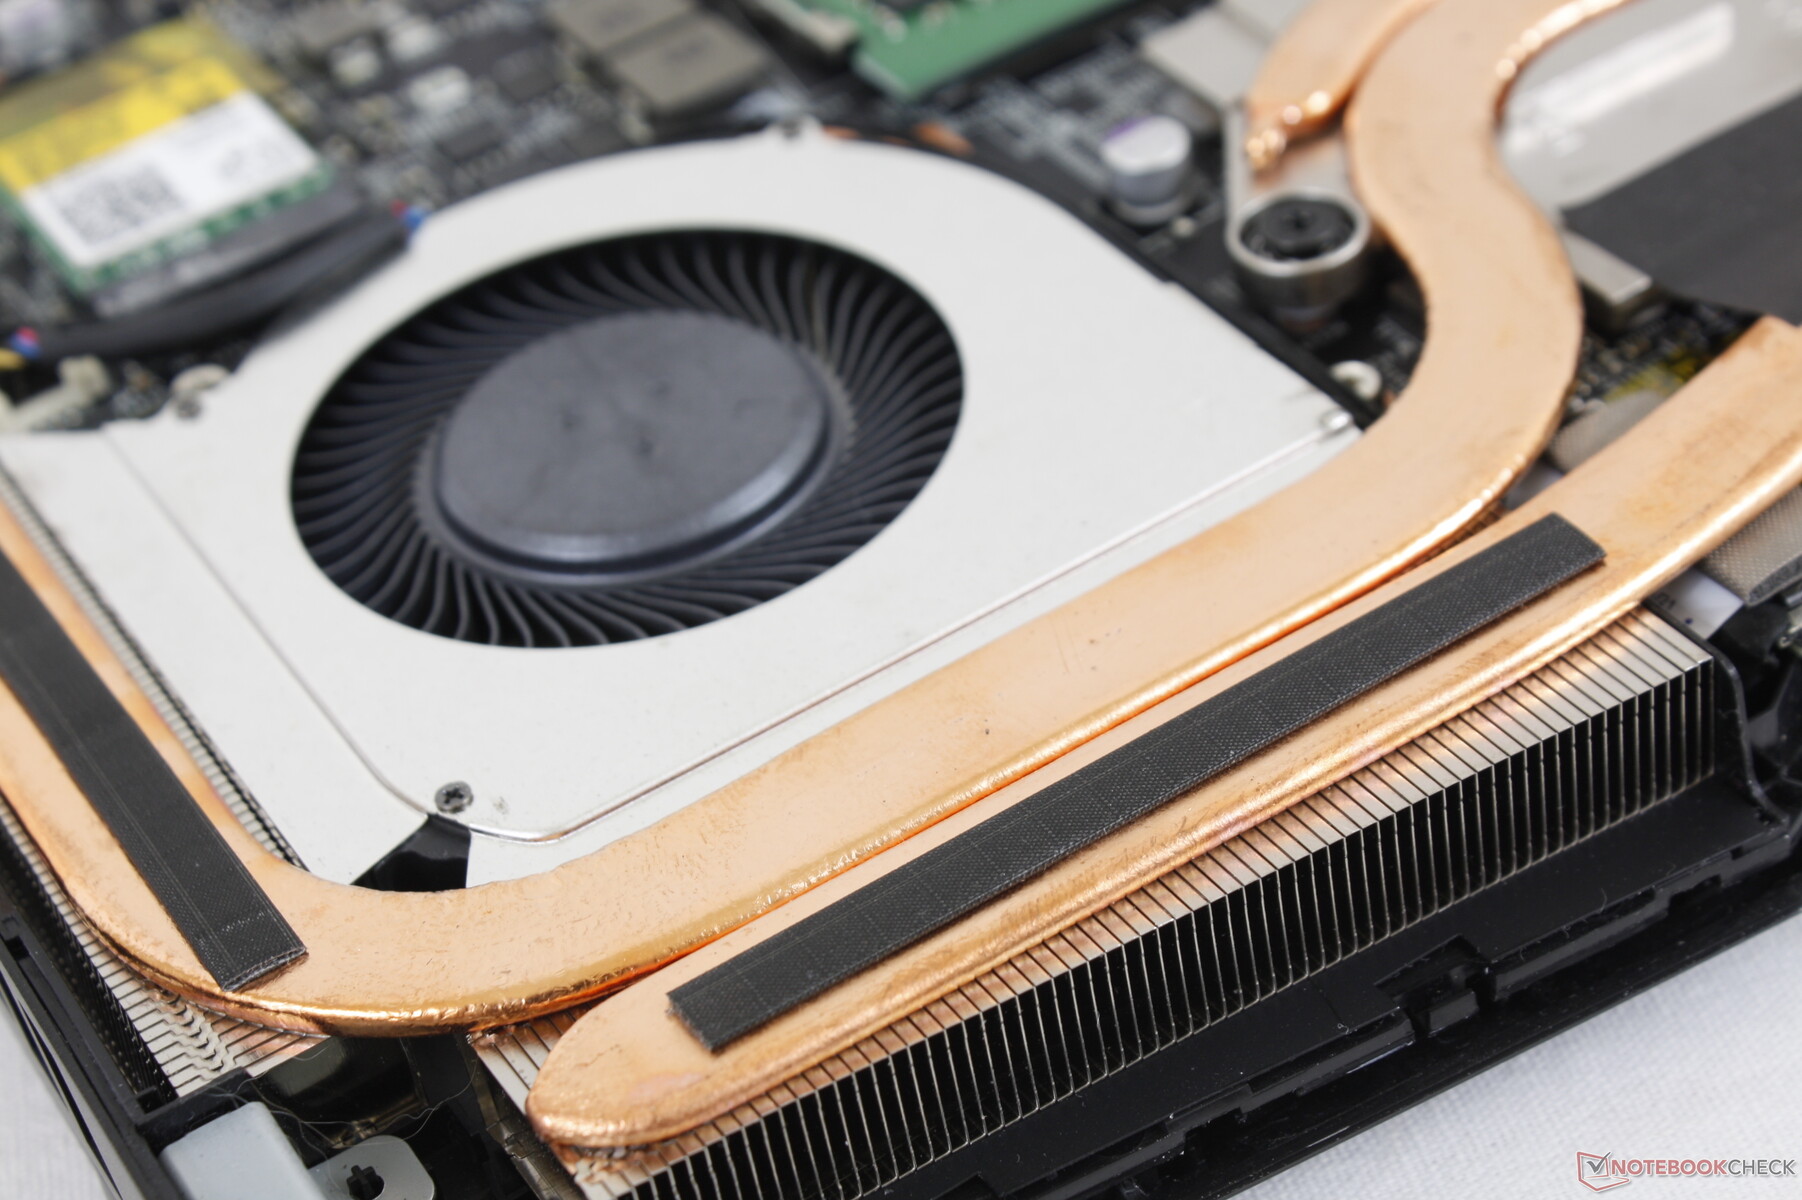
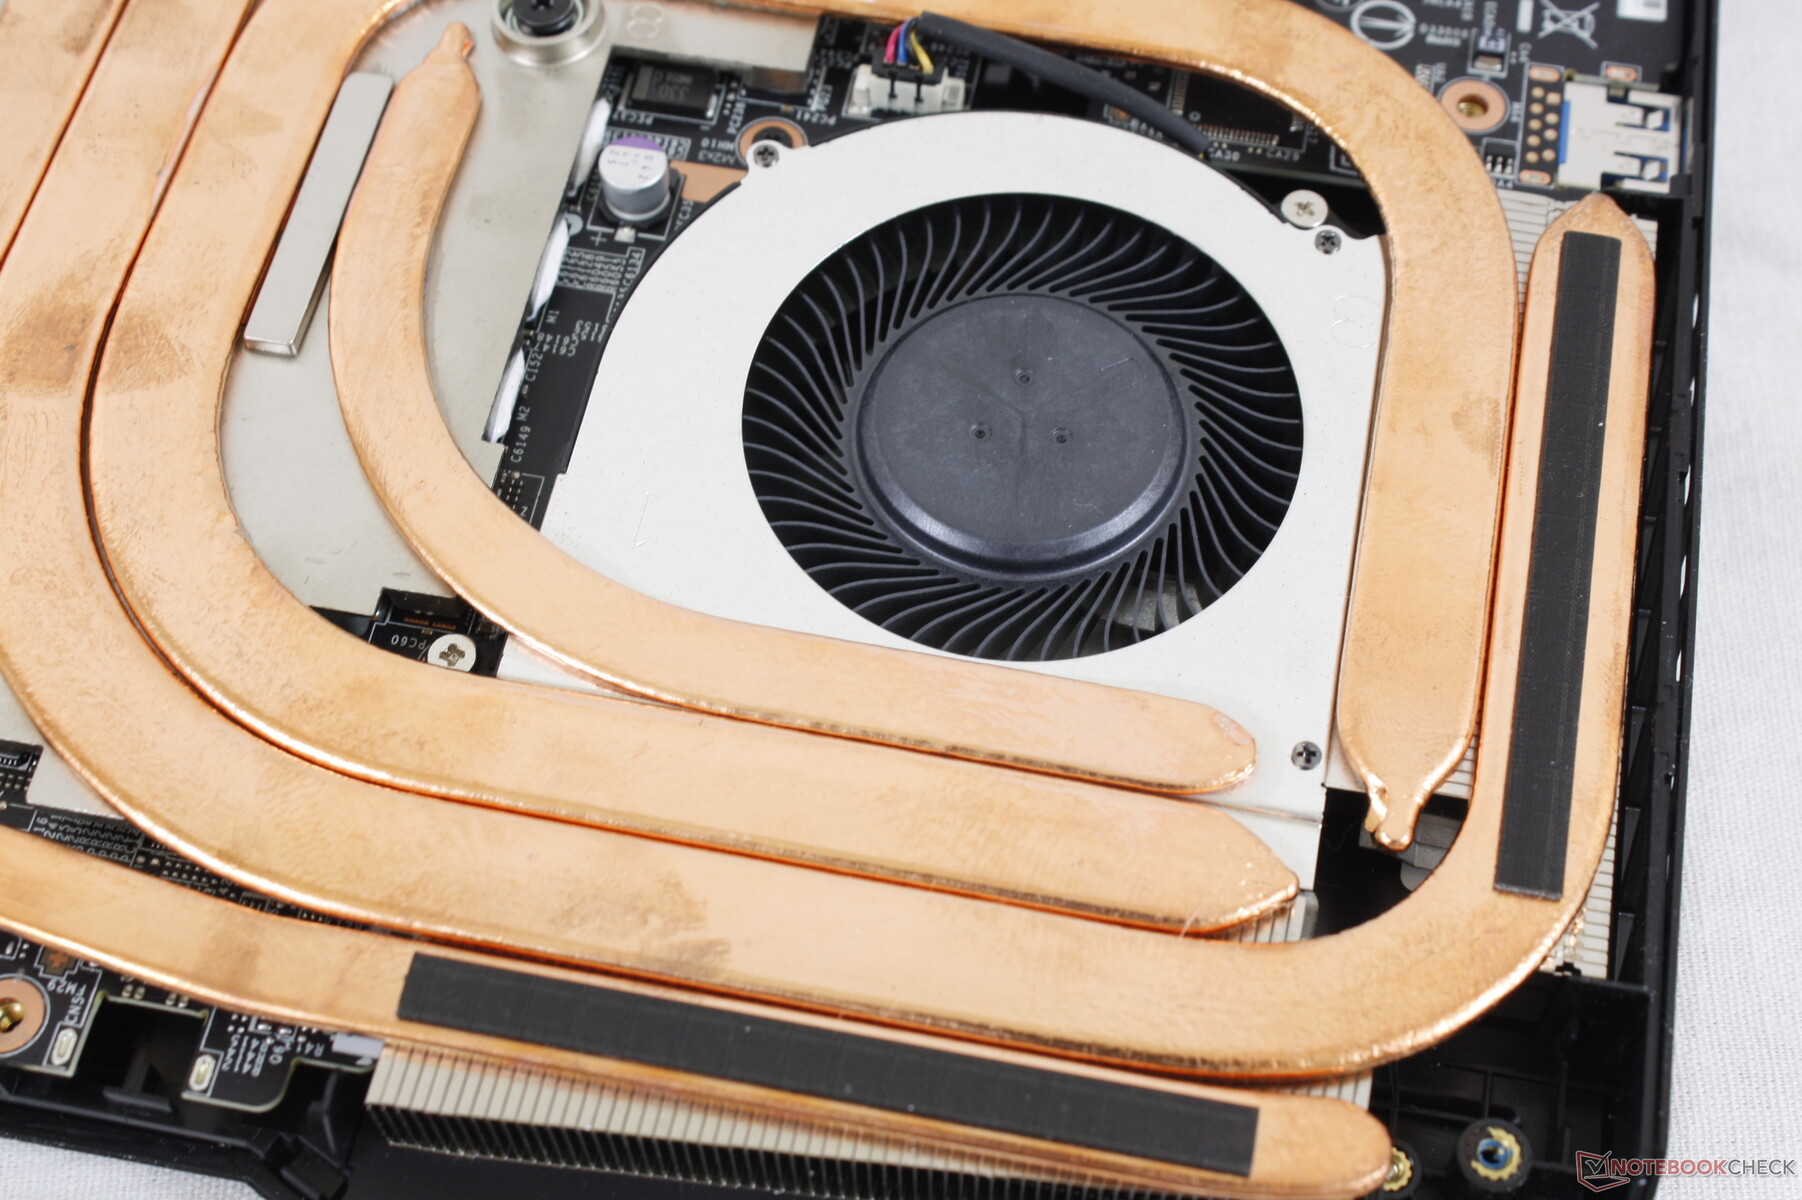
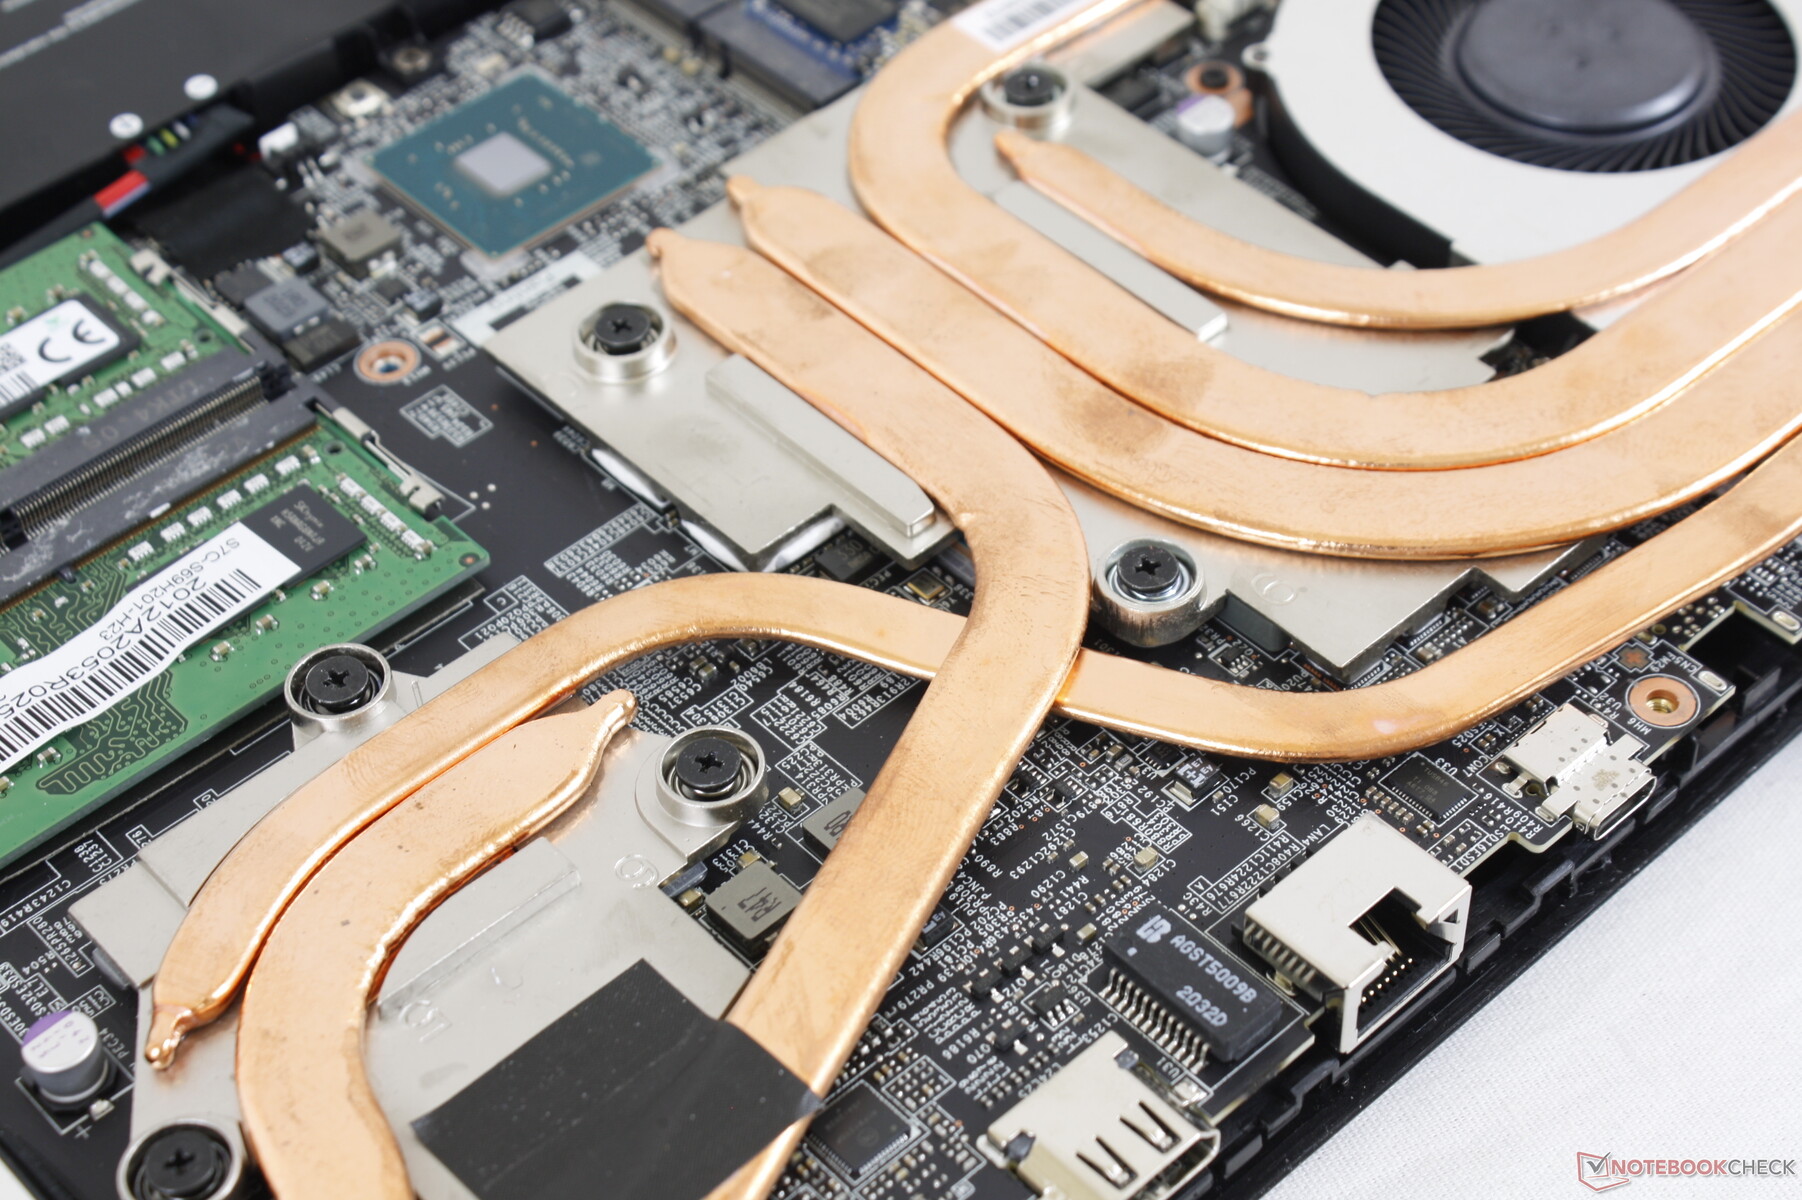
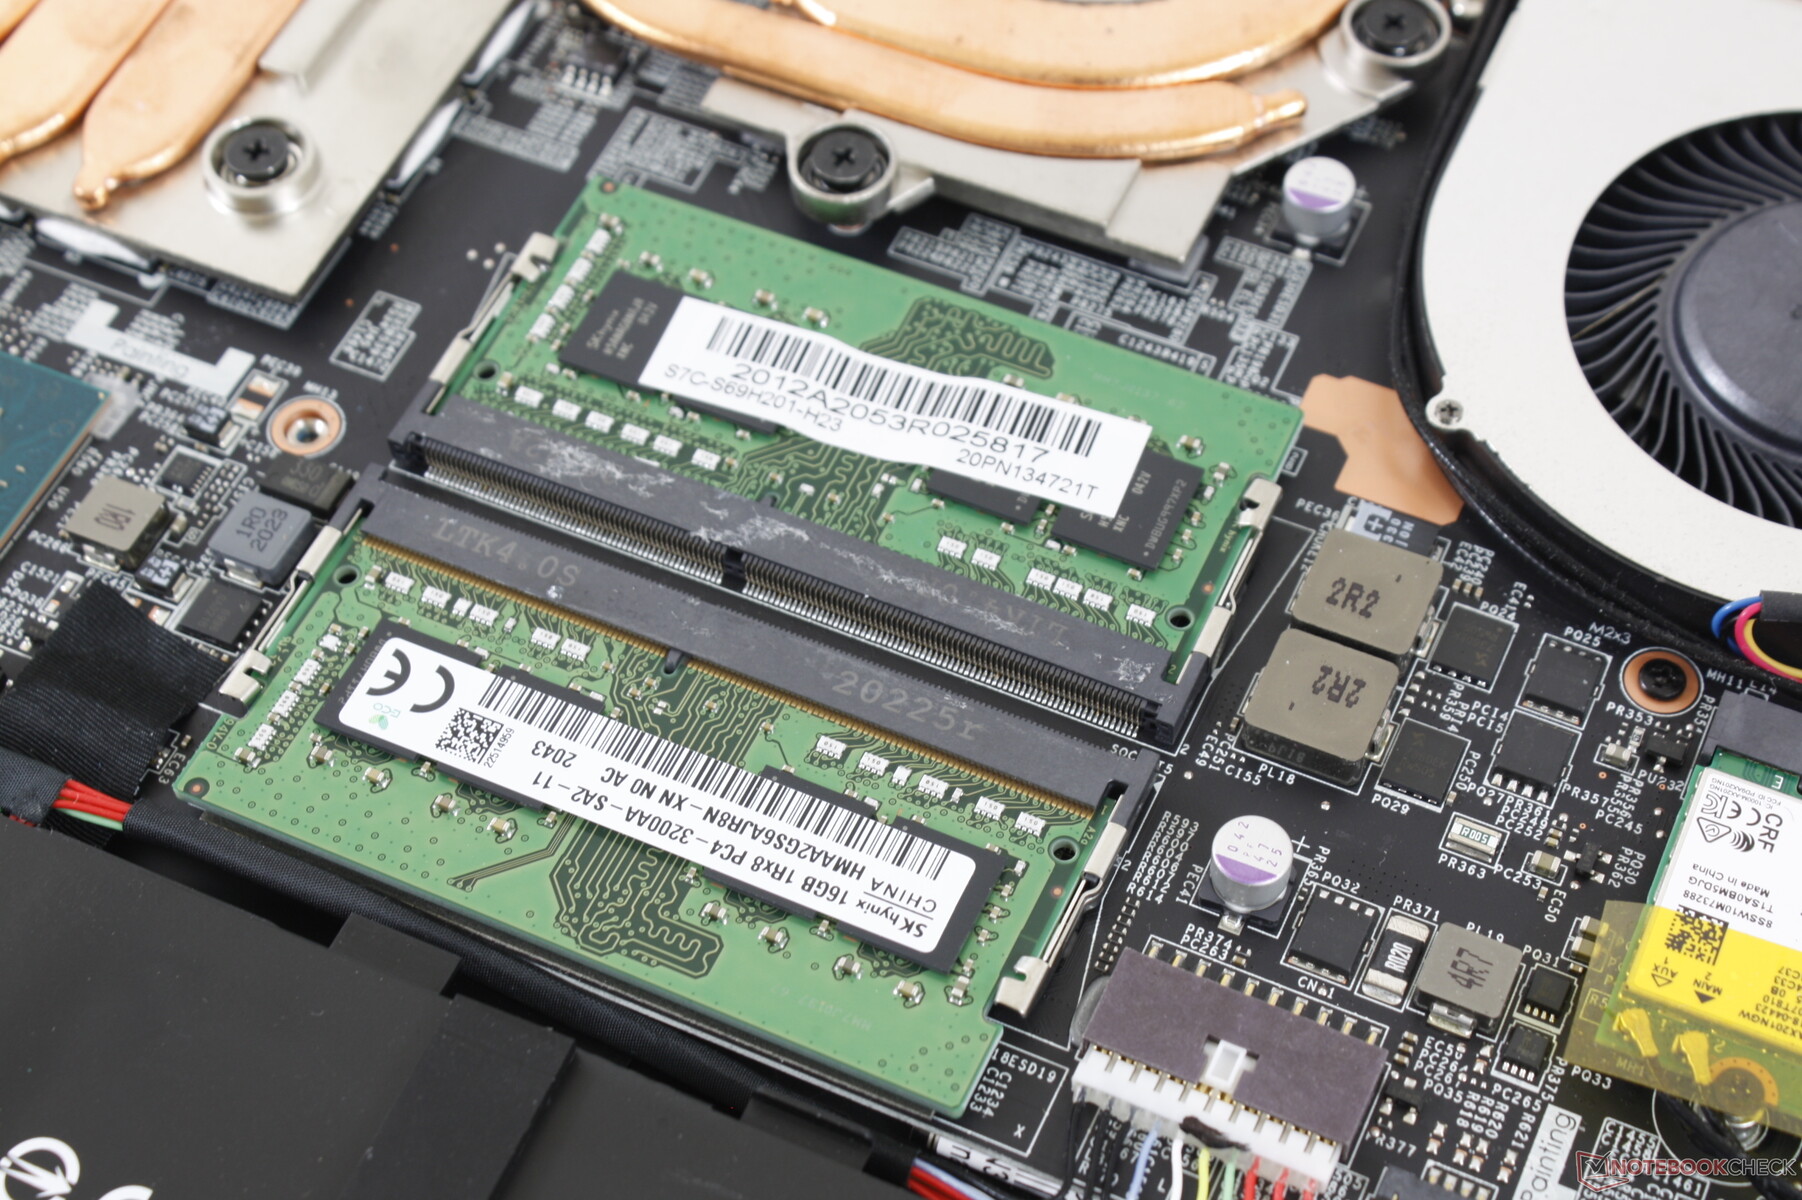
Wartung
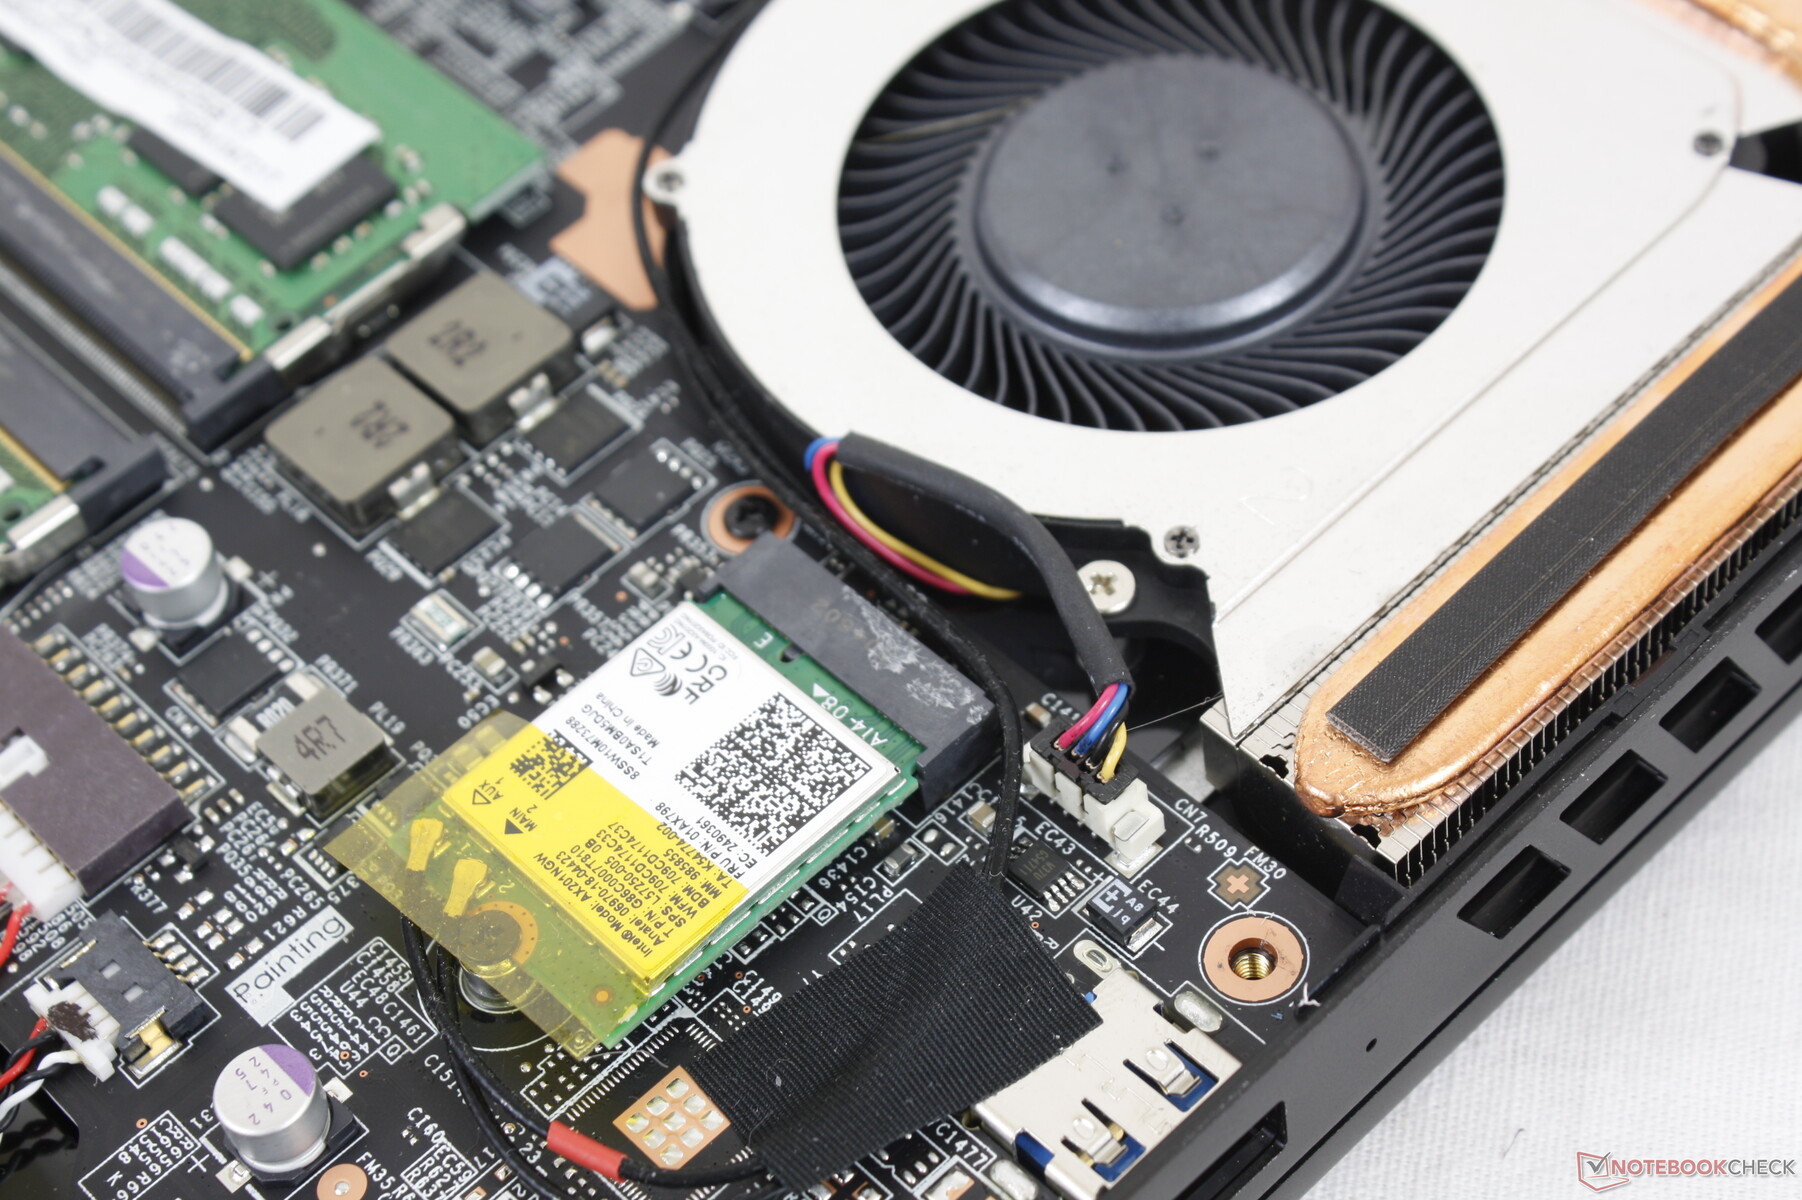
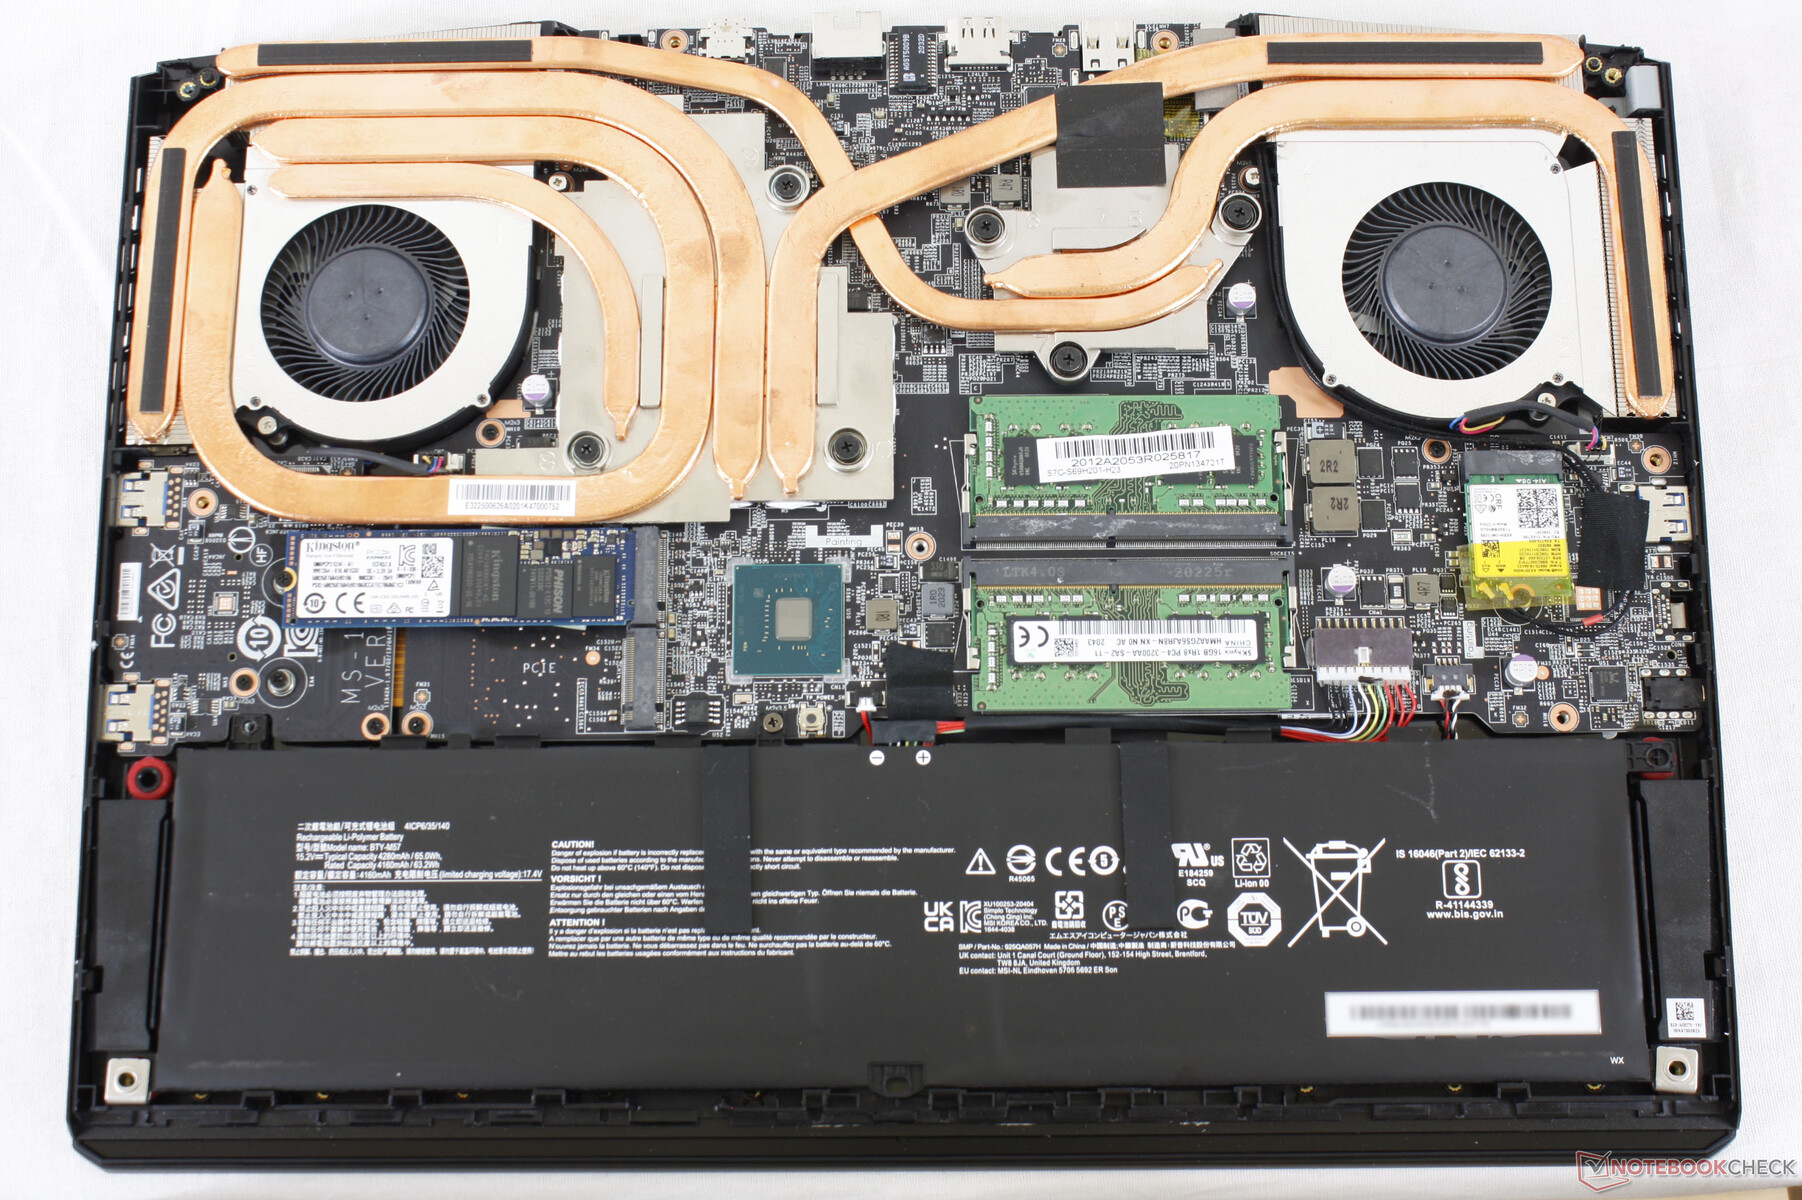
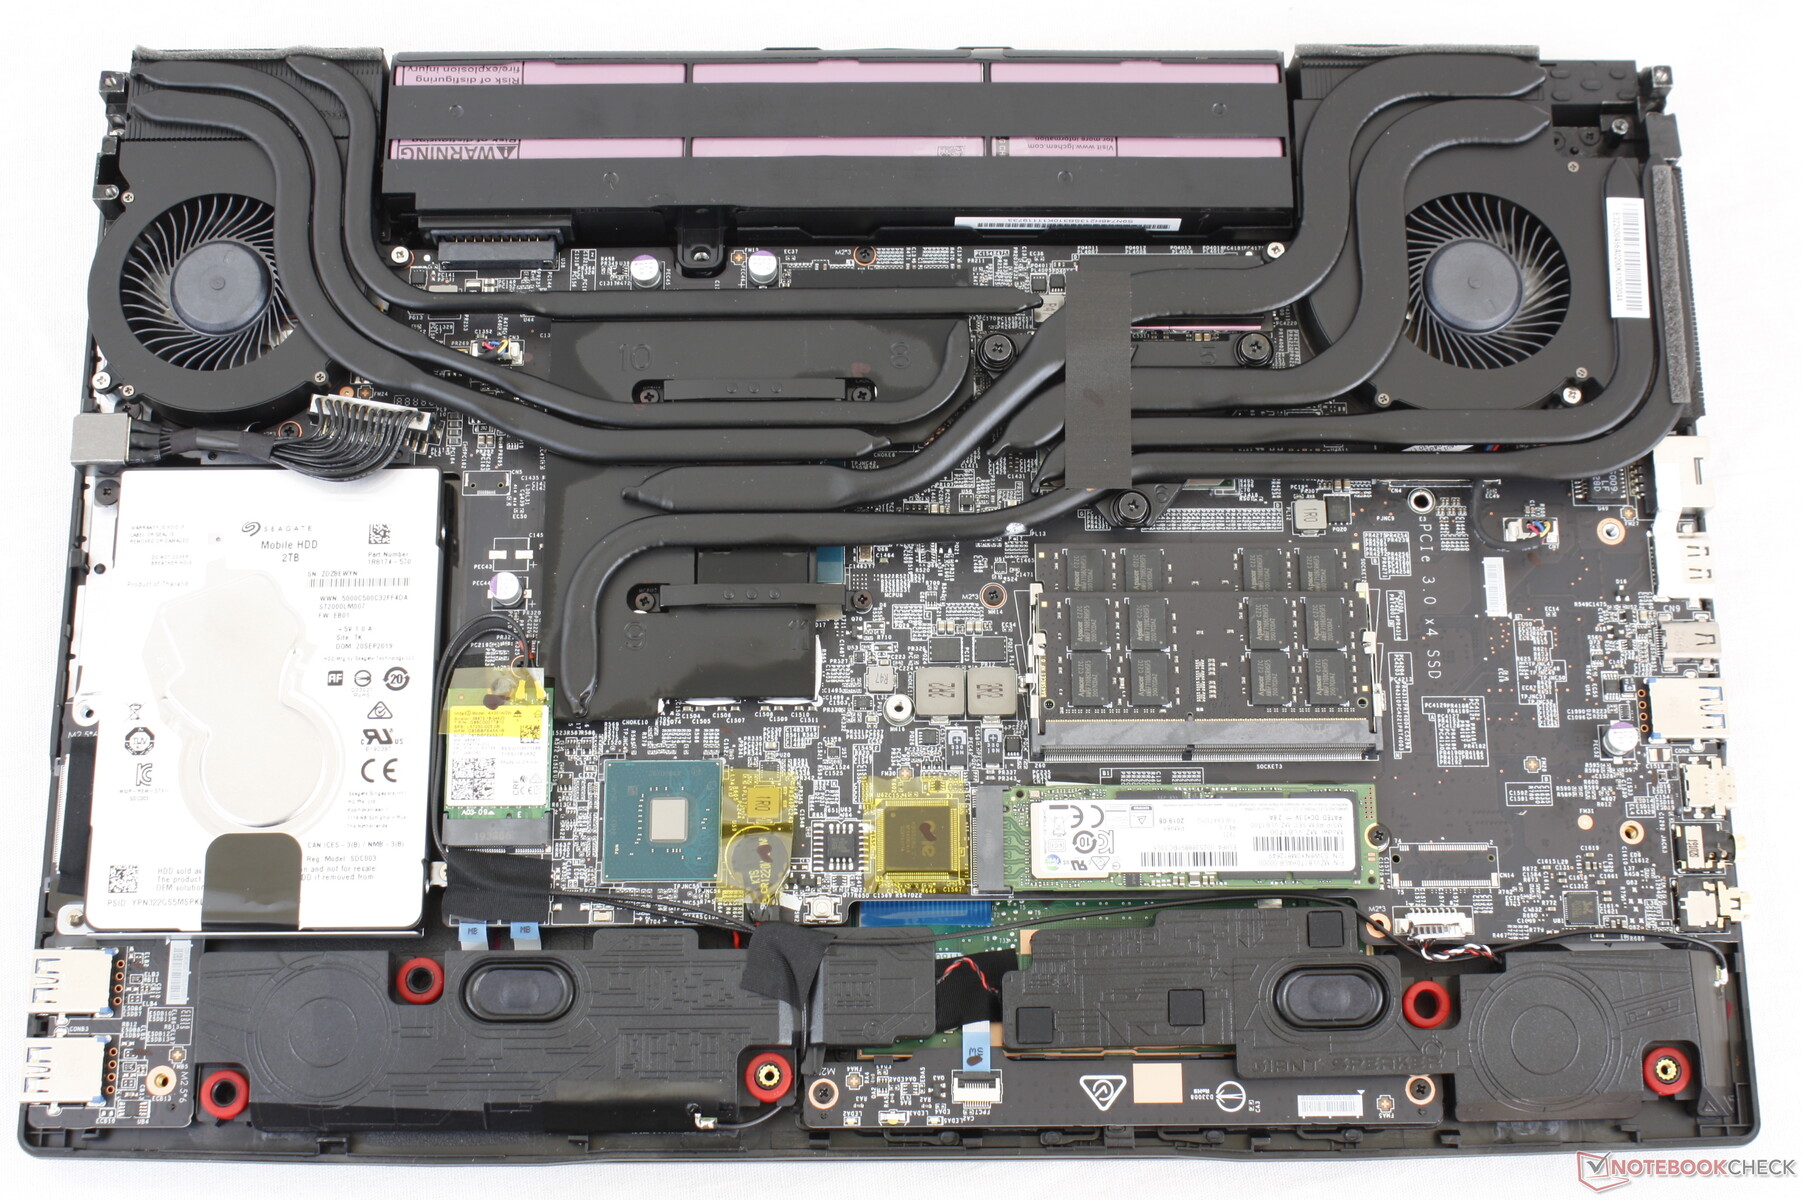
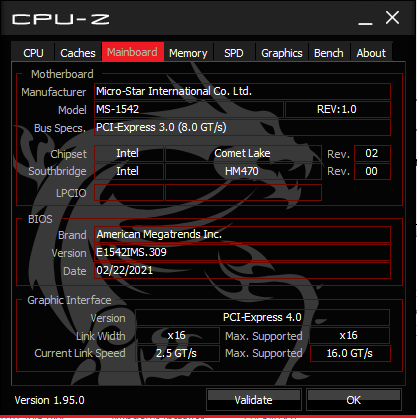
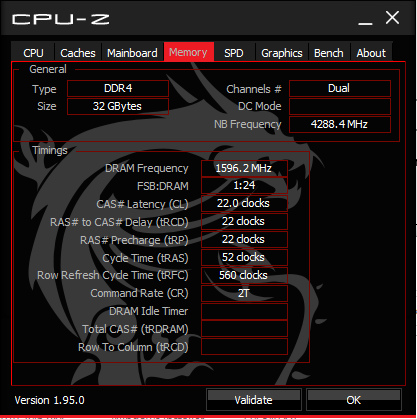
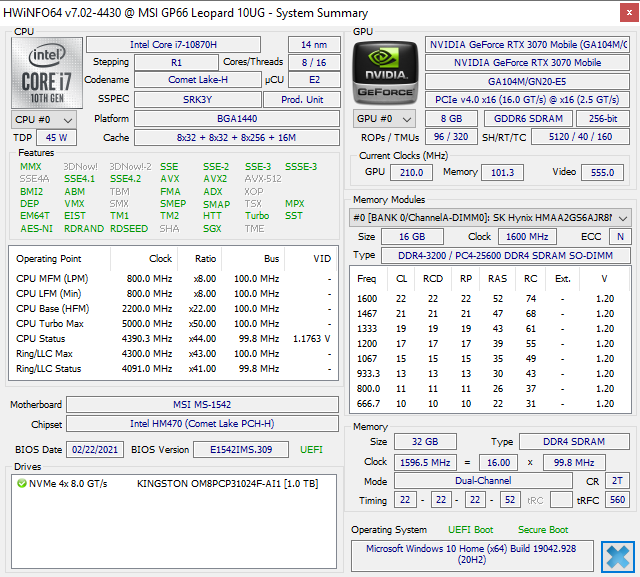
Die Wartung gestaltet sich schwieriger als beim GP65, weil die Bodenplatte an den Kanten und Ecken deutlich fester sitzt. Ein schmales Hebelwerkzeug und vorsichtige Hände sind vonnöten, um die Unterseite sicher abnehmen zu können. Im Inneren haben Nutzer Zugang zu zwei M.2 2280-Slots, zwei SODIMMs, dem Akku sowie dem WLAN-Modul.
Zubehör und Garantie
Neben dem Netzteil und etwas Papierkram liegen keine Extras bei. Das Microfasertuch zur Reinigung bei der GS- und GT-Serie wird hier nicht mitgeliefert.
Im Garantiefall greift nur die standardmäßige, limitierte 1-Jahresgarantie des Herstellers.
Eingabegeräte
Tastatur
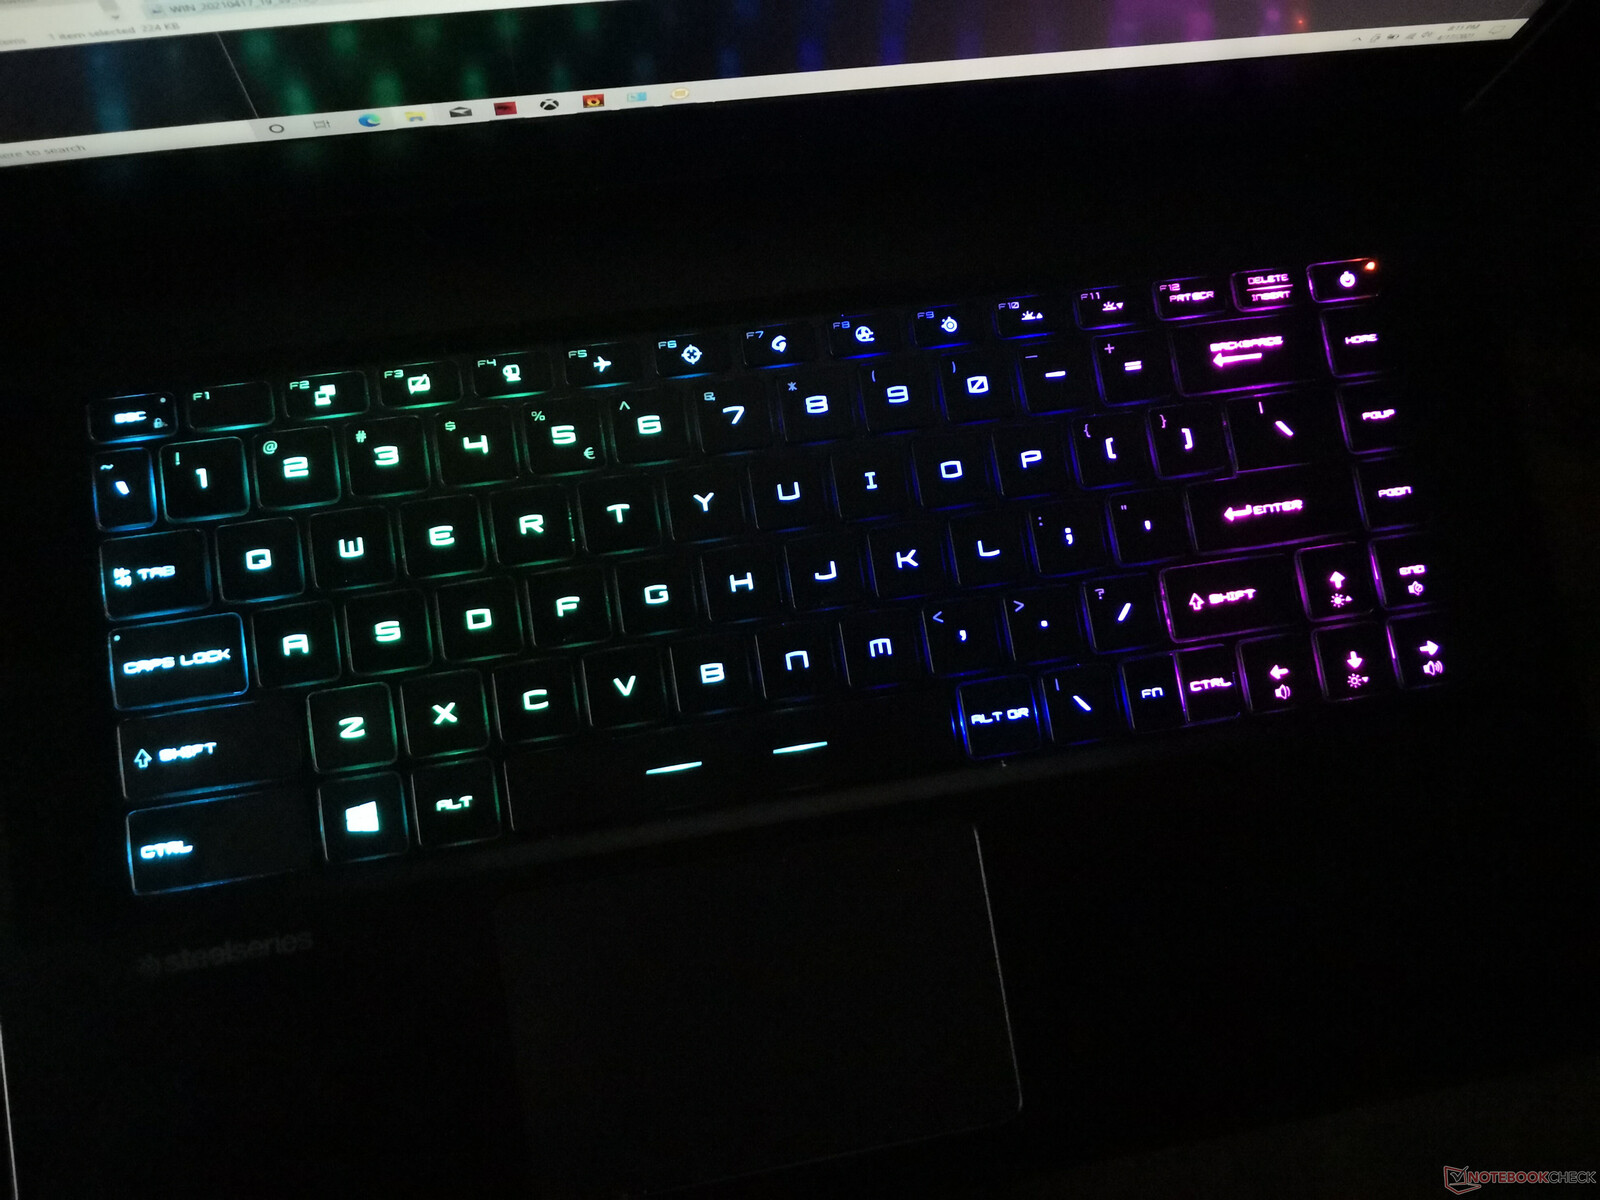
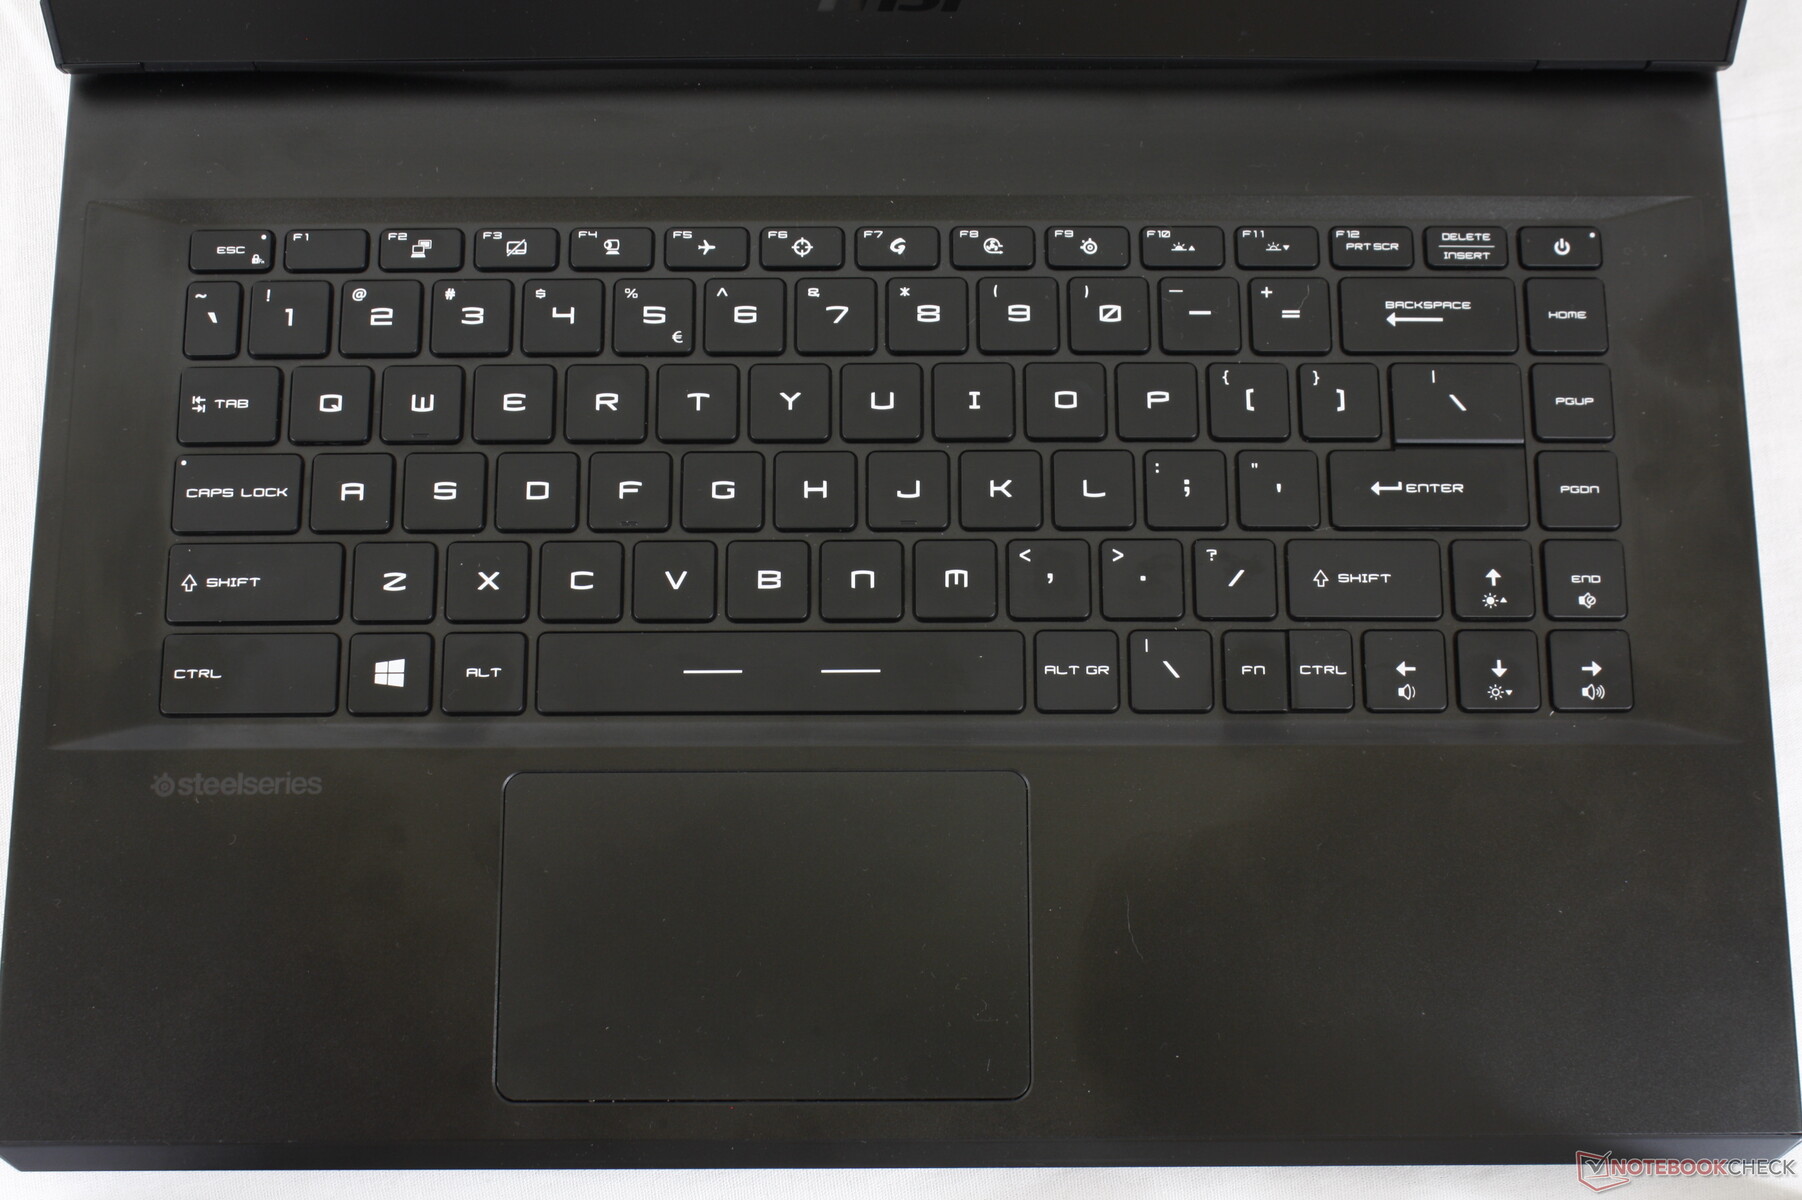
Die Tastatur ist identisch zu der im GE66 und markiert eine Abkehr vom Keyboard des GP65. Beispielsweise ist das NumPad nun Geschichte und der Hub fühlt sich kürzer an, gleichzeitig ist das Feedback knackiger geworden. Das Anschlaggeräusch ist etwas lauter und hochtöniger geworden, vor allem bei der Leer- und Eingabetaste.
RGB-pro-Taste ist wieder mit dabei. Allerdings könnte die Beleuchtung etwas gleichmäßiger sein, die Symbole der Zweitbelegung (i.e., !, @, #, etc.) leuchten merklich schwächer als die Hauptfunktionen (1, 2, 3, etc.).
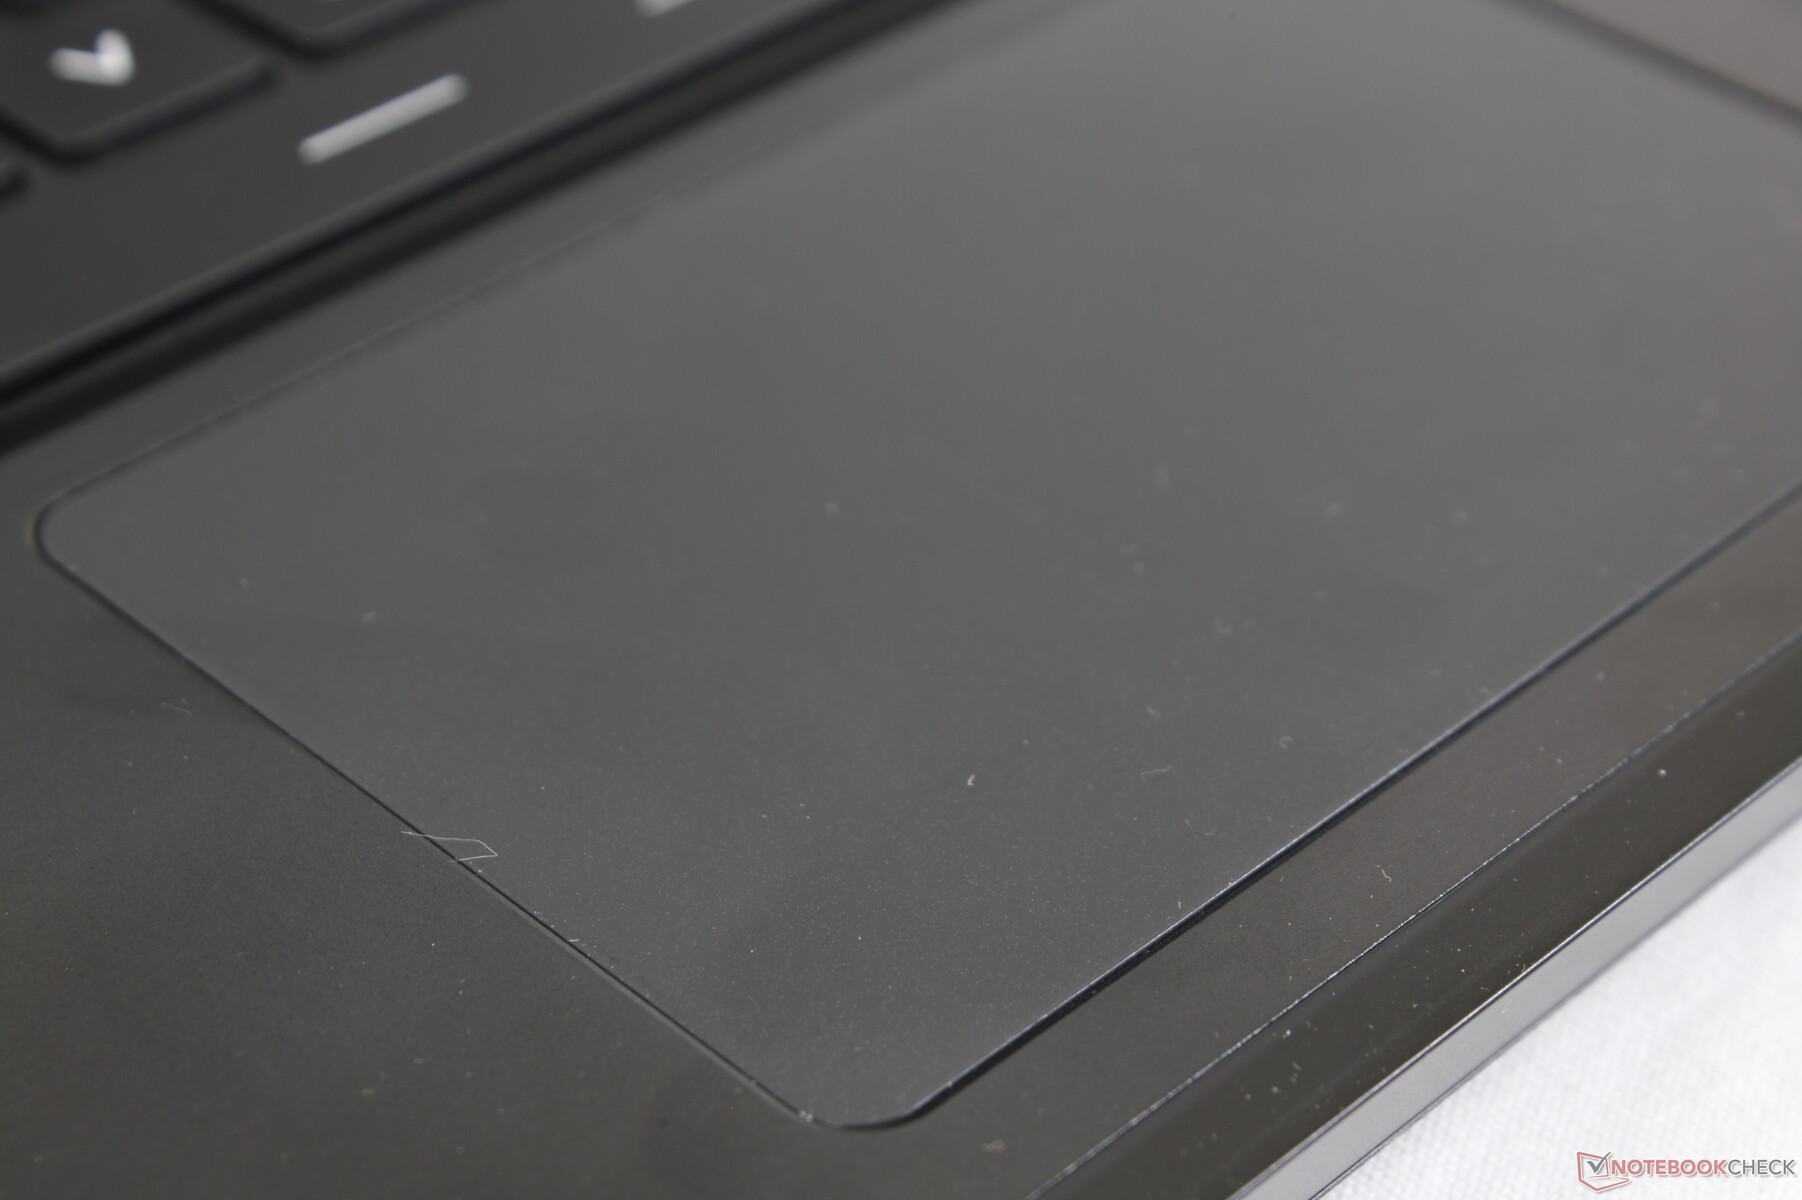
Touchpad
Das Kunststoff-Klickpad fällt recht klein aus (10,5 x 6,5 cm) bietet aber gute Gleiteigenschaften bei mittleren Geschwindigkeiten, bei langsamen Bewegungen kann es etwas stocken. Die integrierten Tasten wirken schwammig und erfordern deutlich mehr Druck als üblich, was schnell zu einem Ermüdungseffekt führen kann, wenn man keine externe Maus zur Hand hat. Zwar ist das Klickpad benutzbar, dennoch wünschen wir uns hier die dedizierten Maustasten und das festere Klickpad aus dem älteren GP65 zurück.

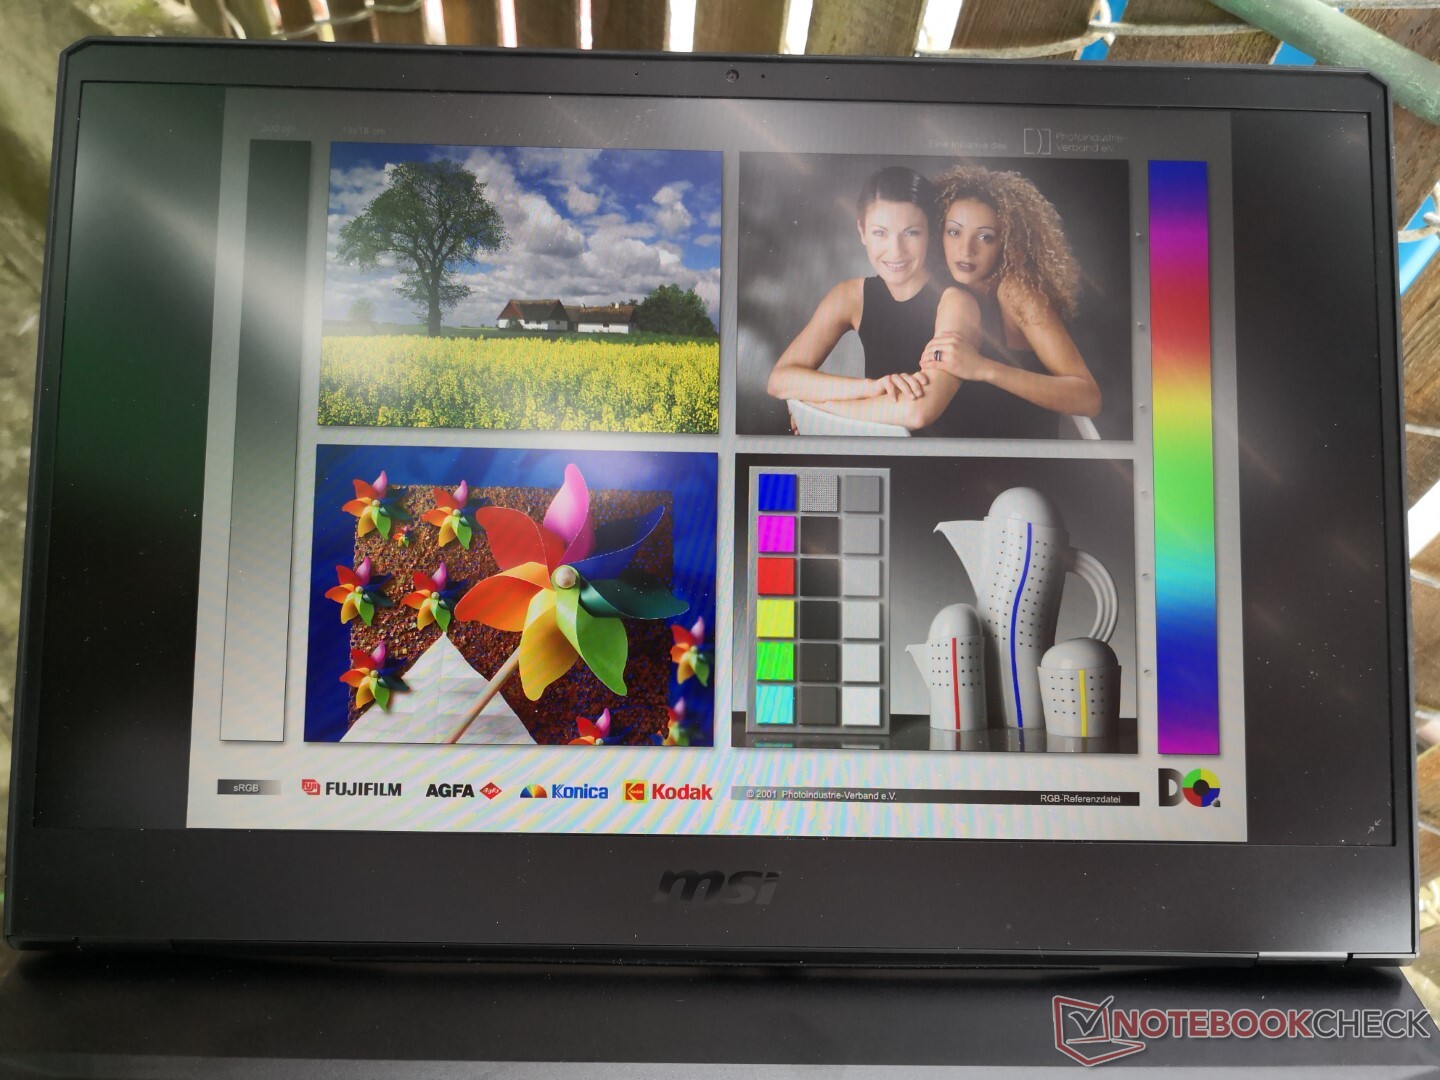
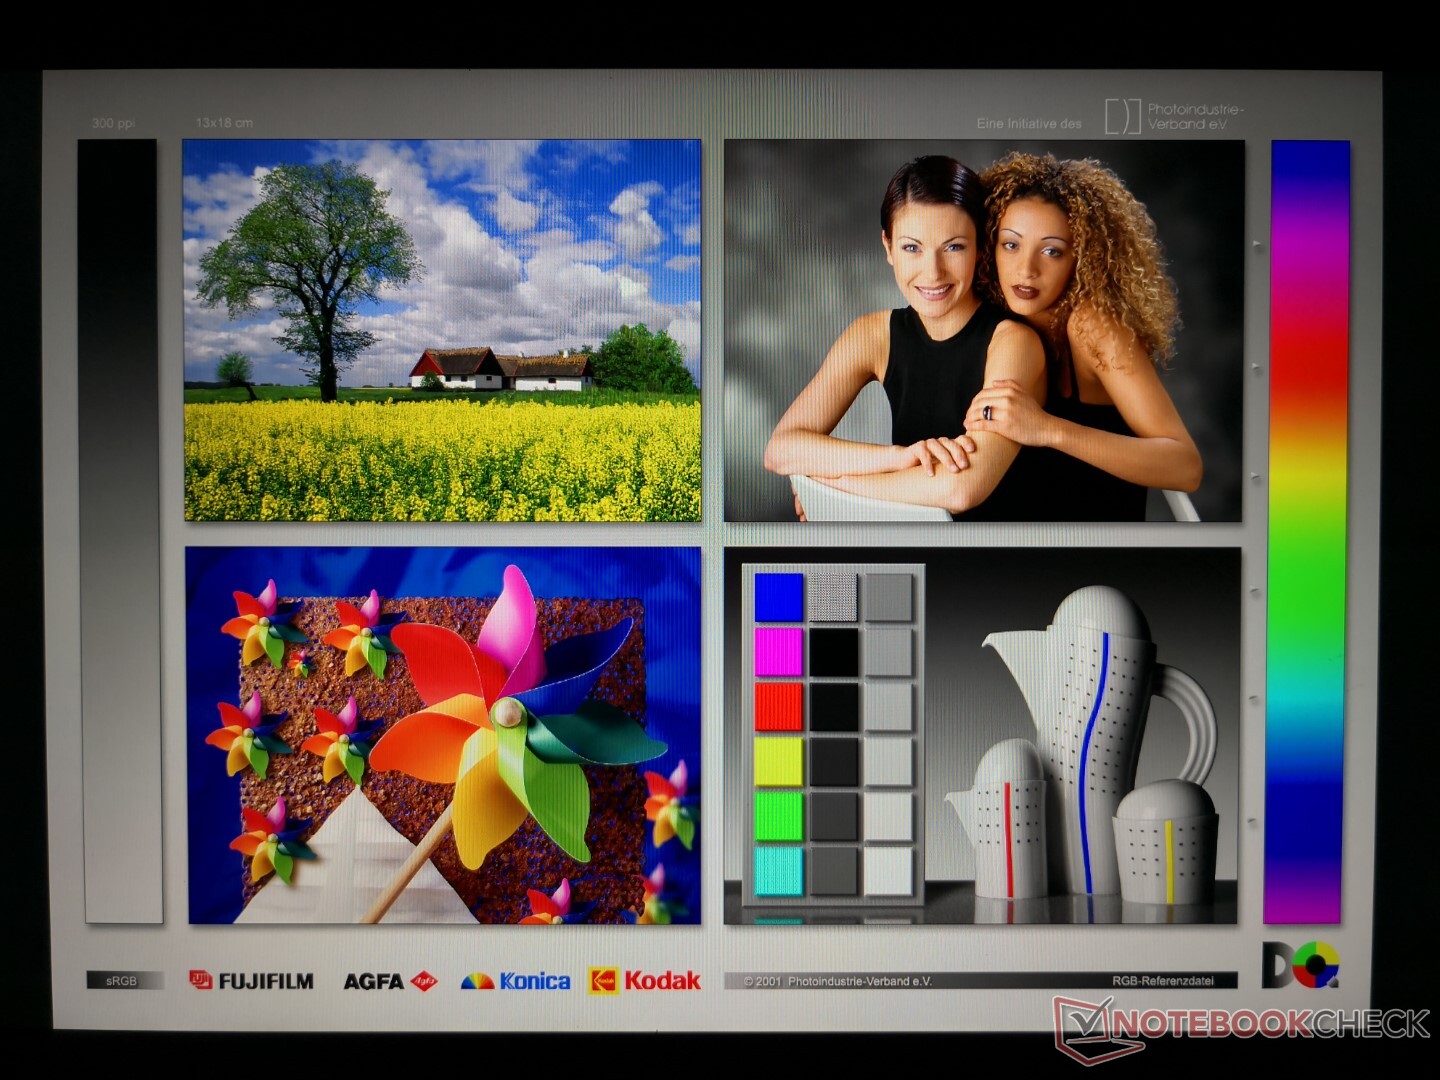
Display
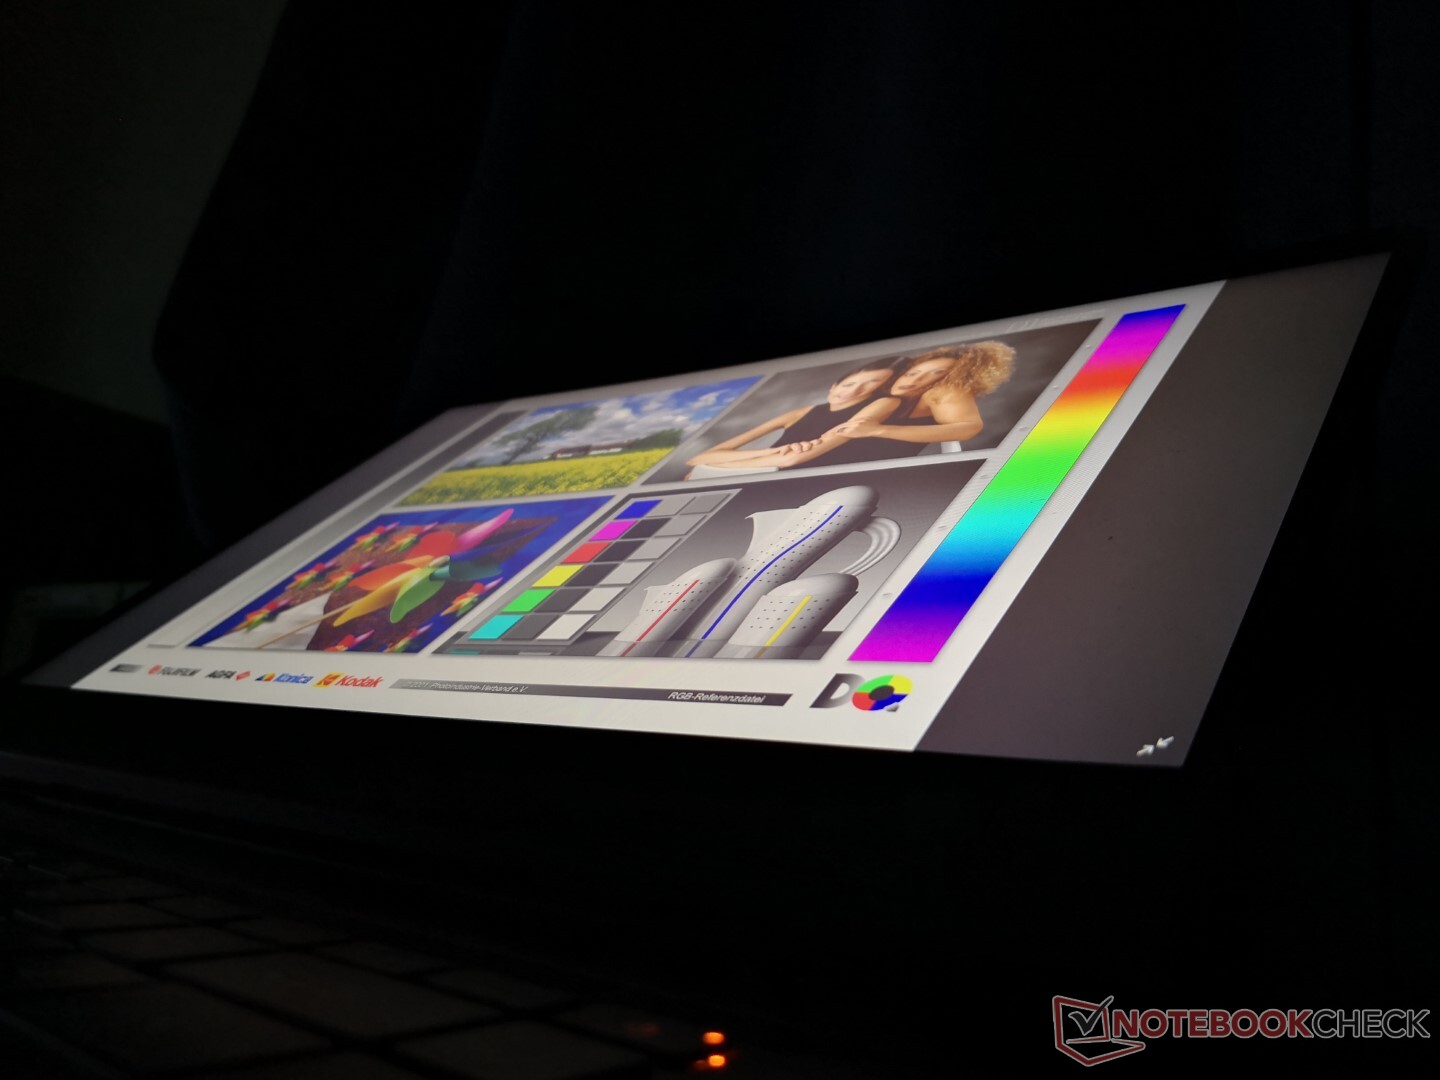
Unsere Testkonfiguration verwendet das gleiche Sharp LQ156M1JW03 mit 240 Hz wie im GE66 10SFS, GS65 Stealth 9SG, Razer Blade 15 und im Aorus 15P XC. Farben, Kontrast und Reaktionszeiten sind somit bei den genannten Laptops sehr ähnlich, was positiv ist, da es sich bei den Nennungen zumeist um High-End-Gaming-Laptops handelt.
Der Hauptunterschied des GP66-Displays zu den zuvor erwähnten Laptops ist, dass es leider deutlich dunkler ist. Die maximale Helligkeit beträgt nur 210 Nits, während die meisten anderen Gaming-Laptops 300 Nits und mehr bieten.
| |||||||||||||||||||||||||
Ausleuchtung: 83 %
Helligkeit Akku: 225.9 cd/m²
Kontrast: 982:1 (Schwarzwert: 0.23 cd/m²)
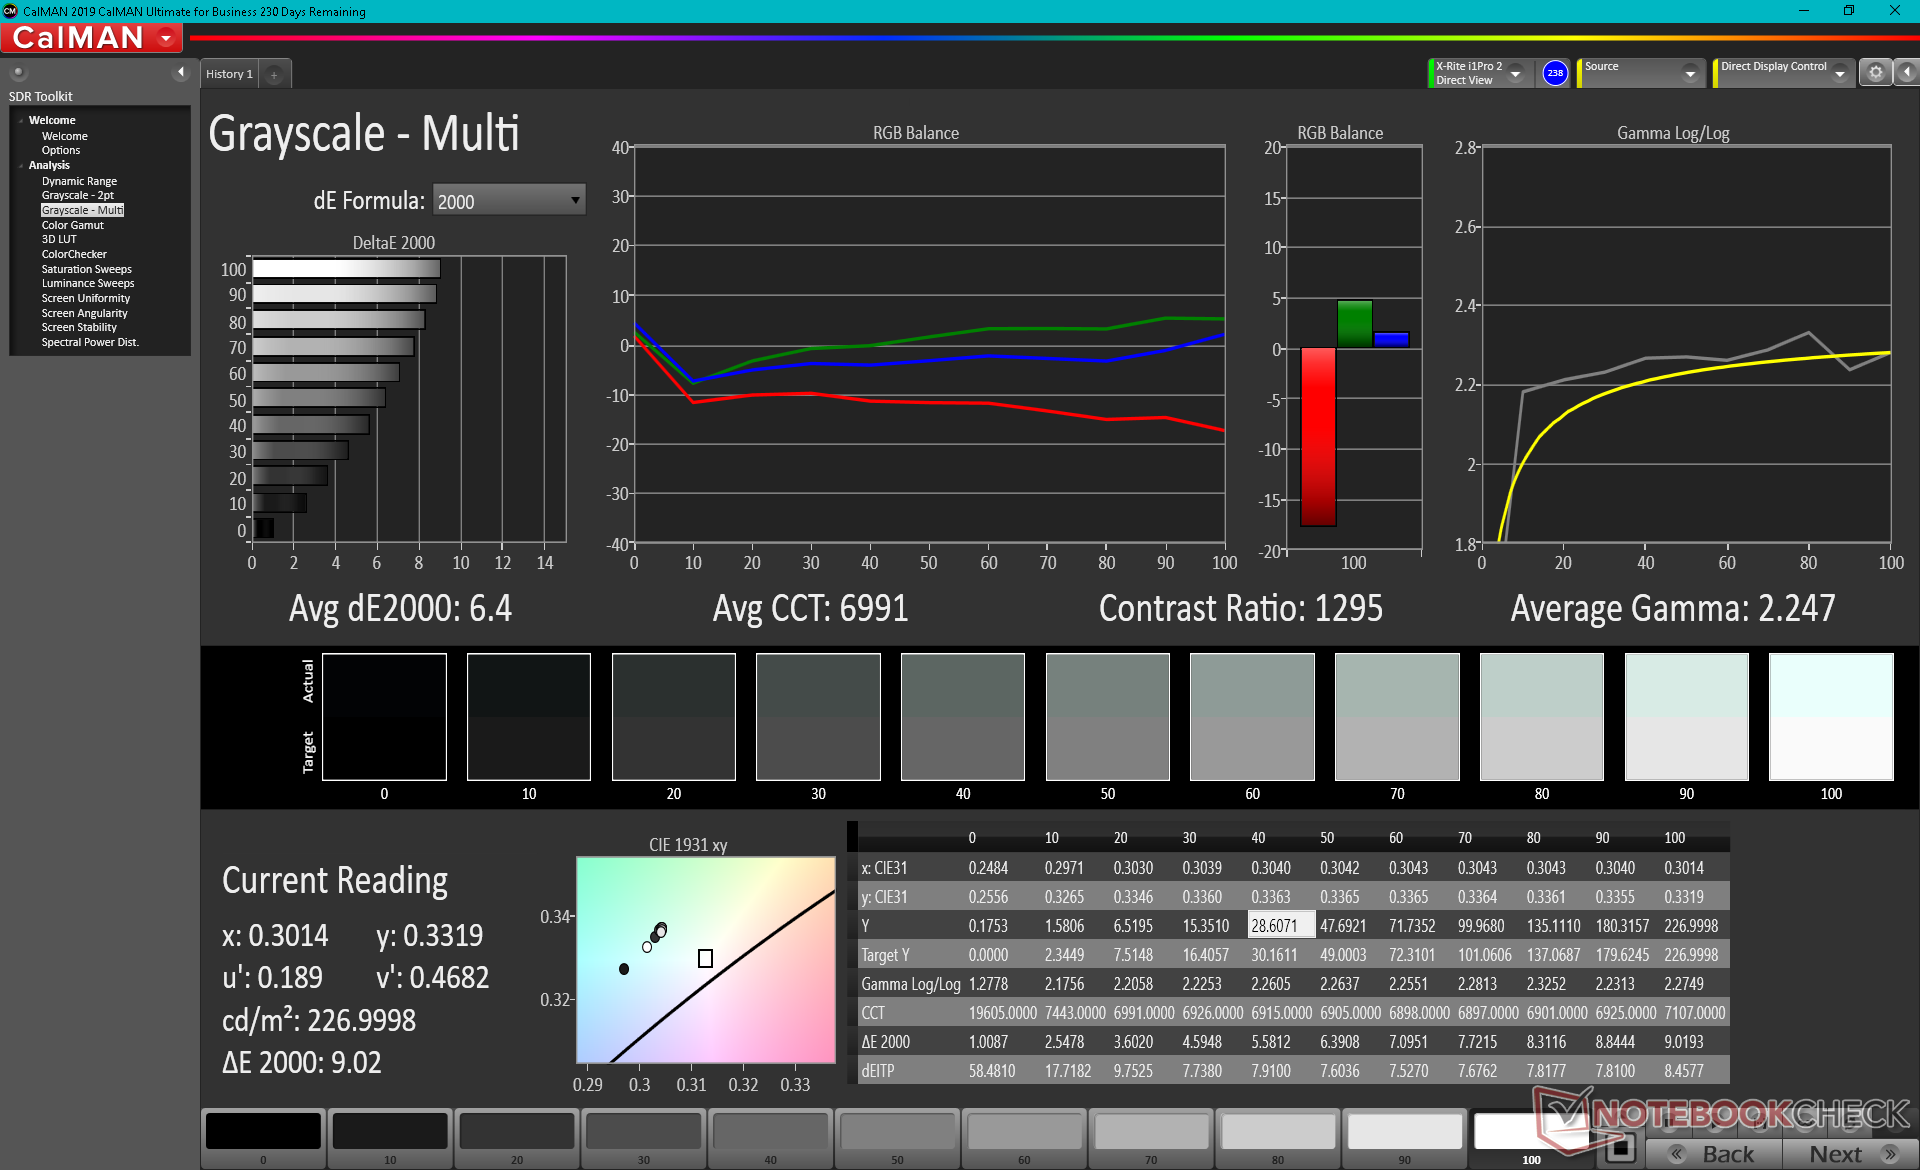
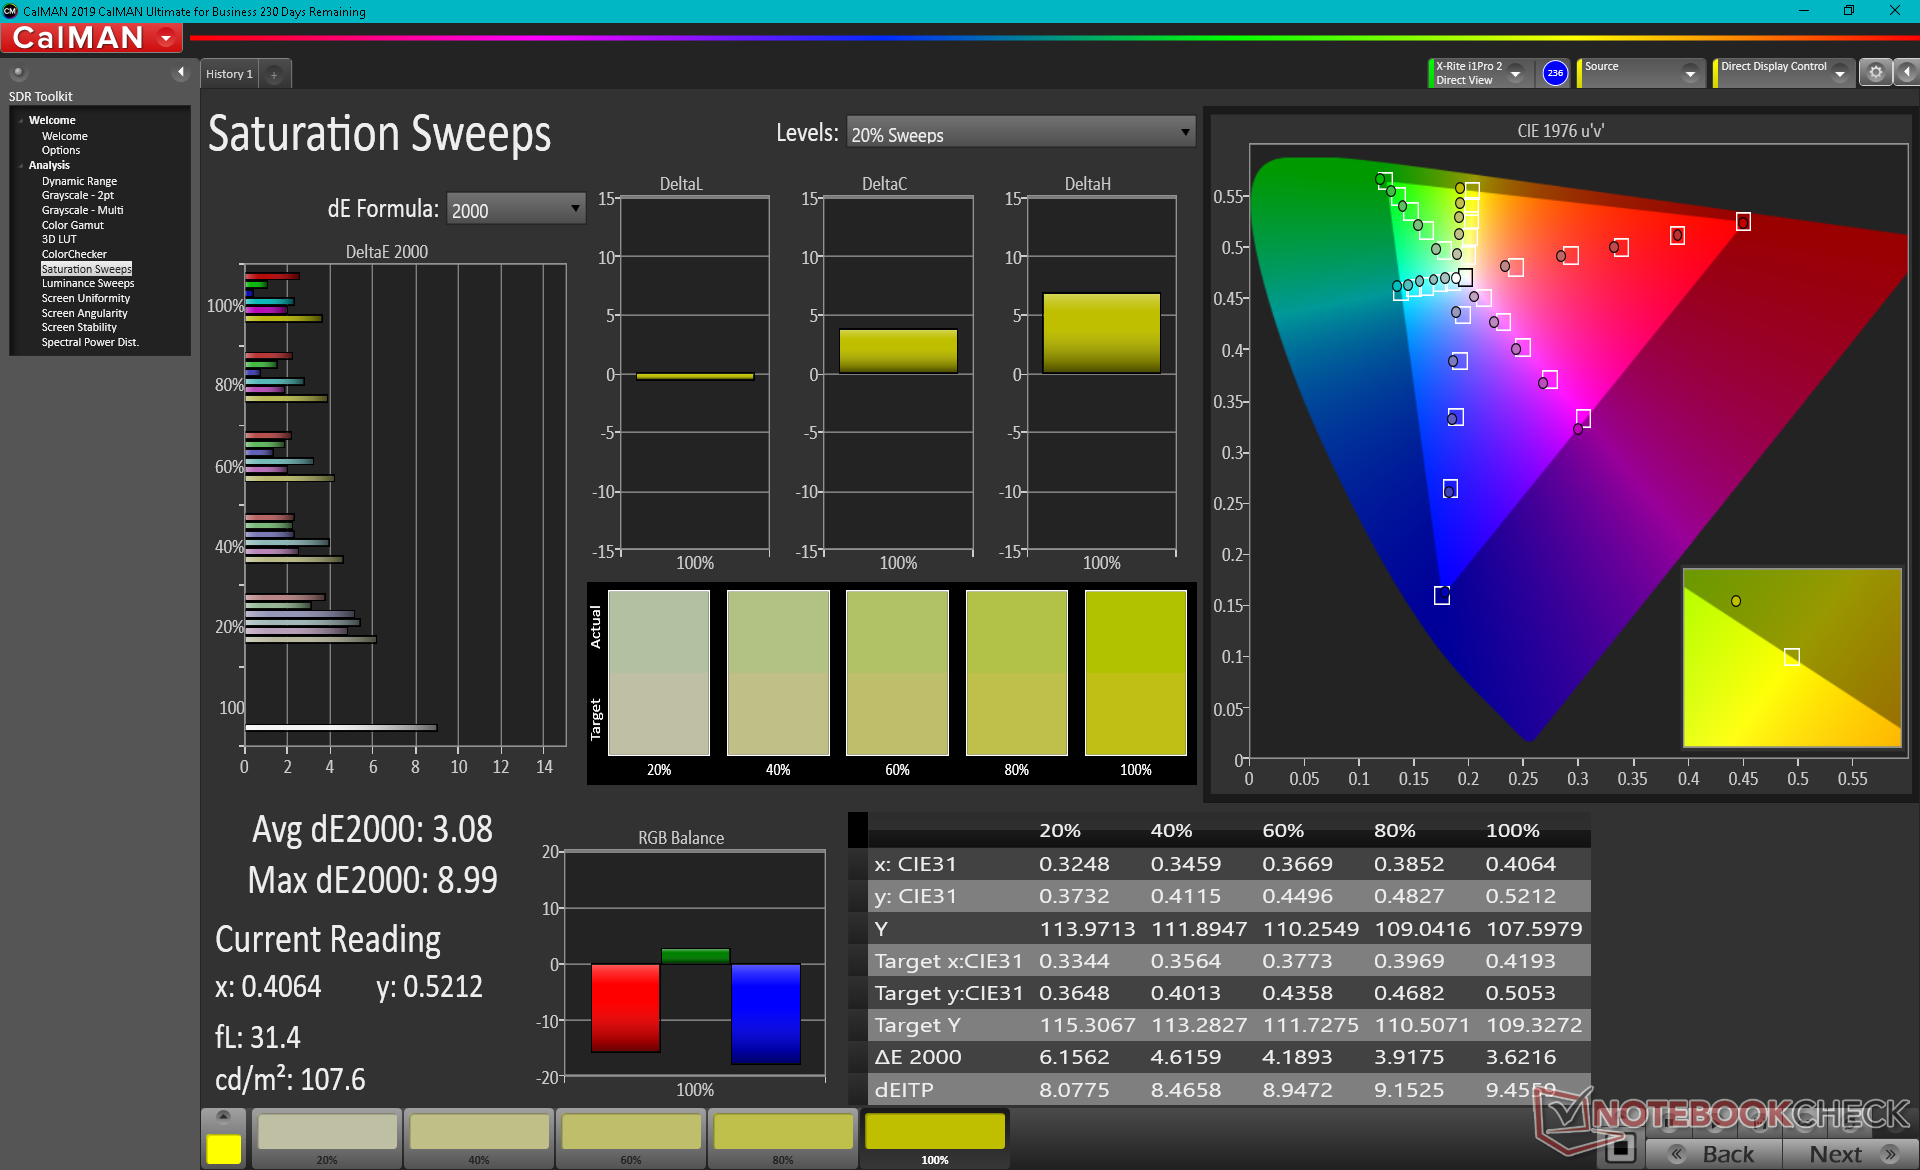
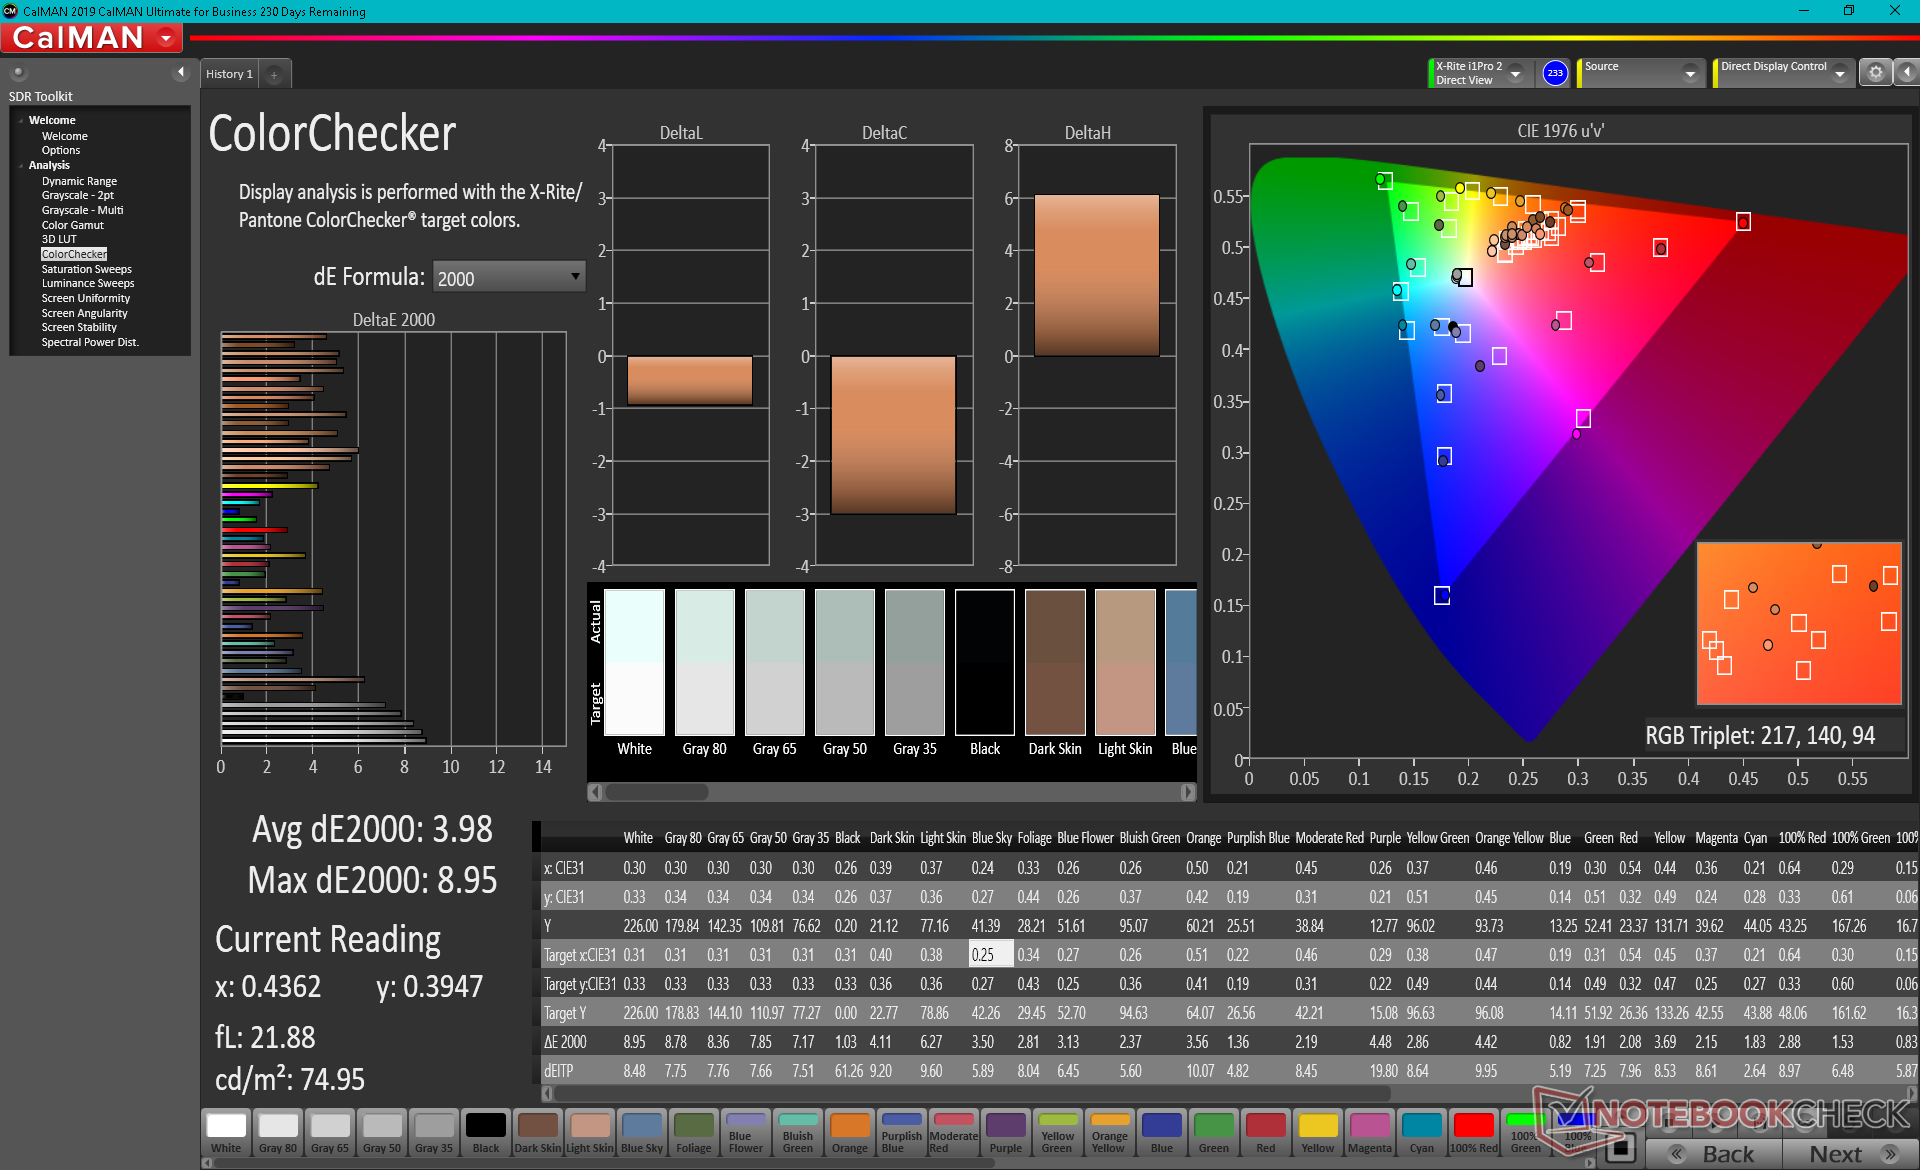
ΔE ColorChecker Calman: 3.98 | ∀{0.5-29.43 Ø4.72}
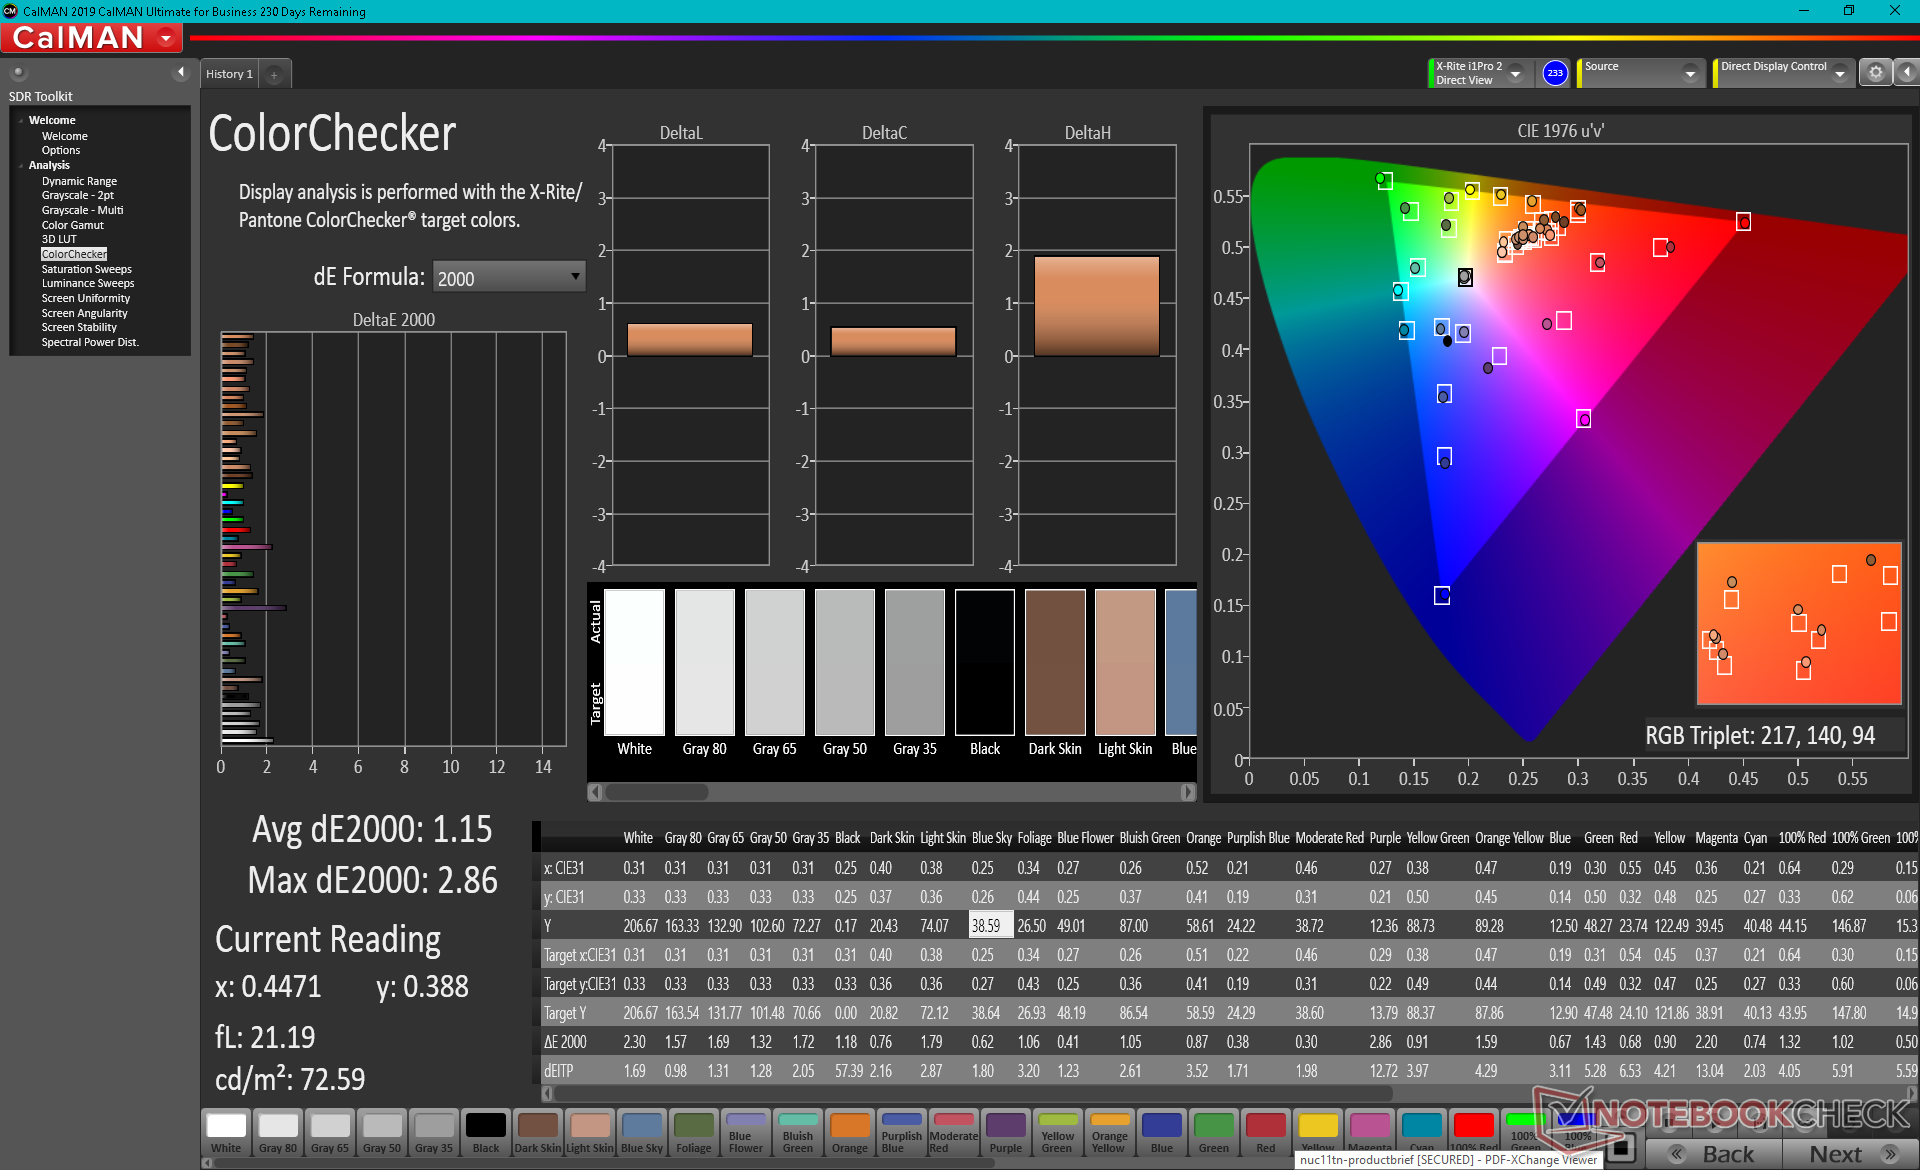
calibrated: 1.15
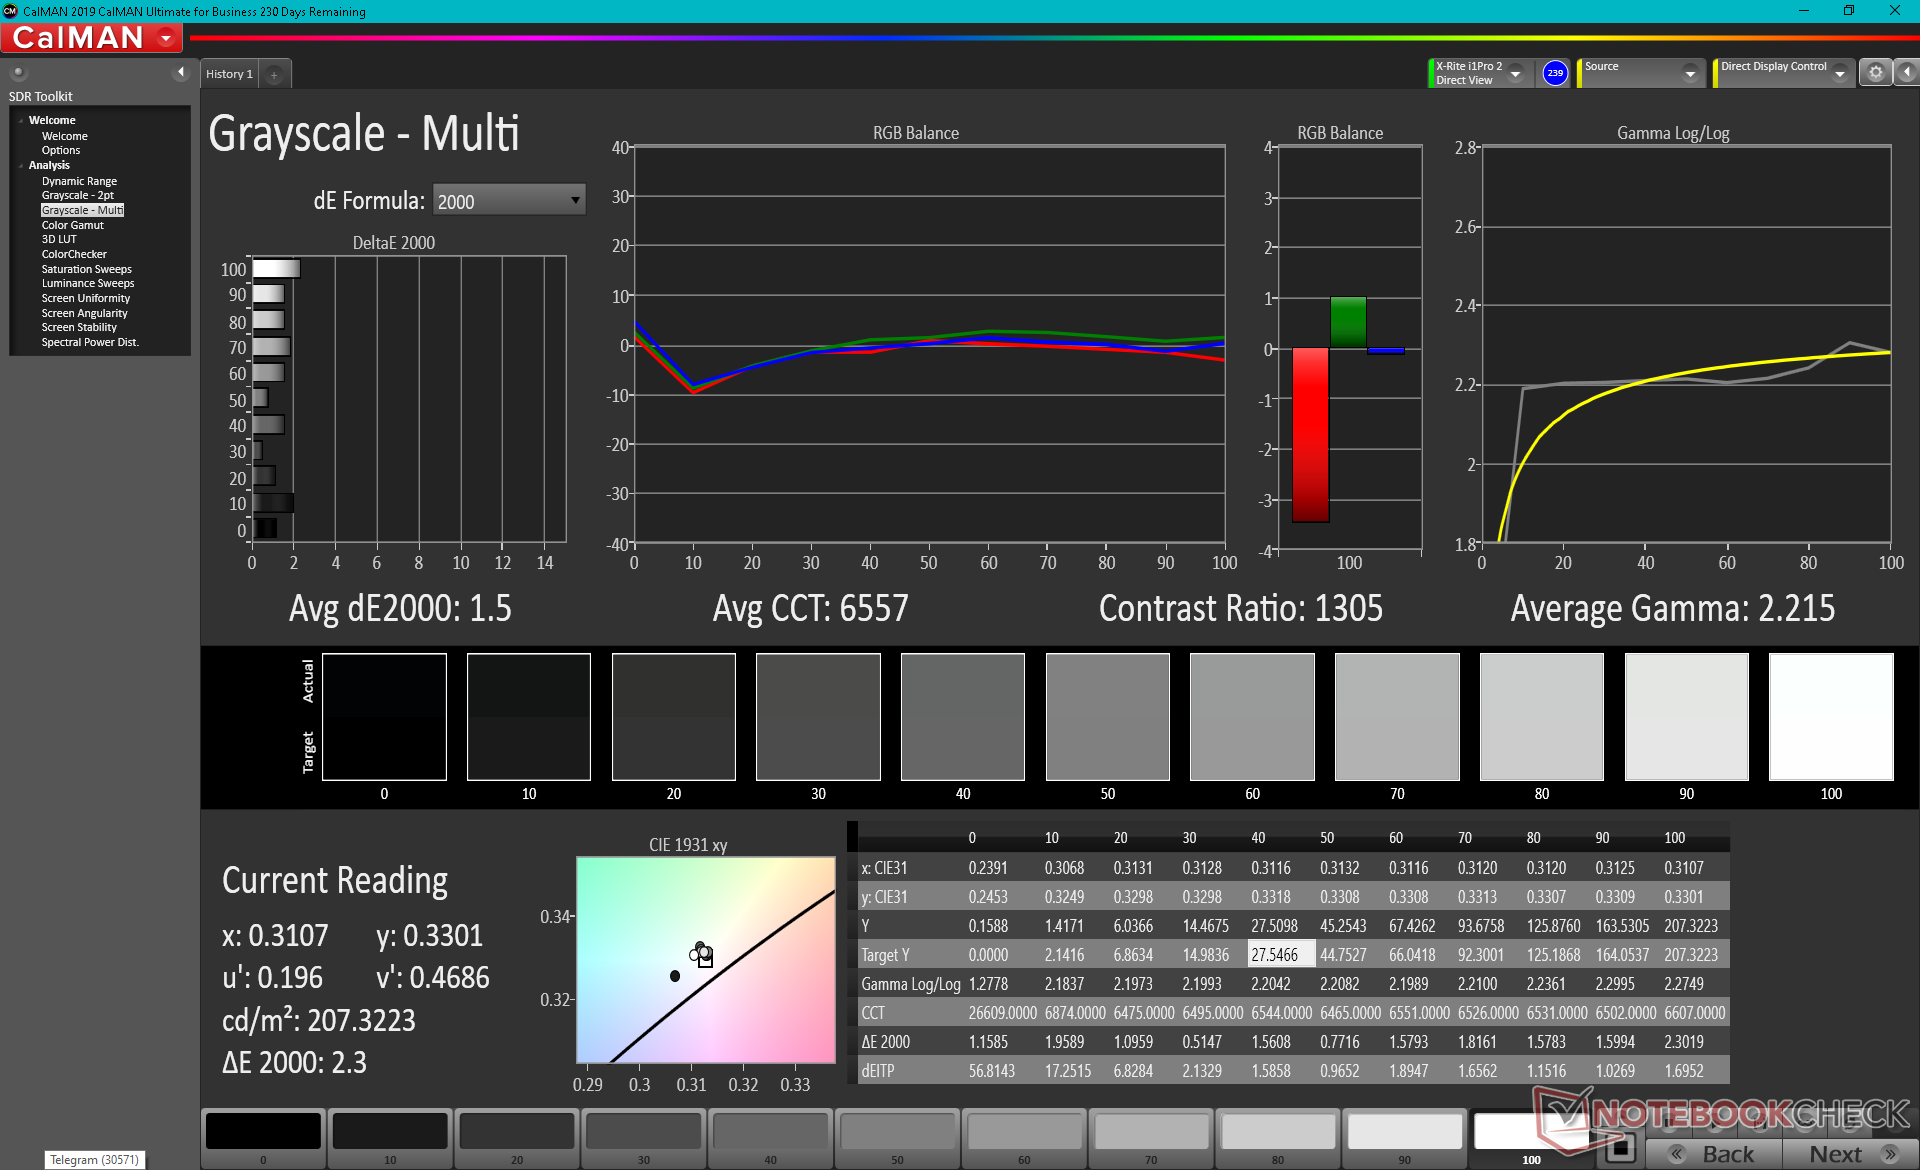
ΔE Greyscale Calman: 6.4 | ∀{0.09-98 Ø4.97}
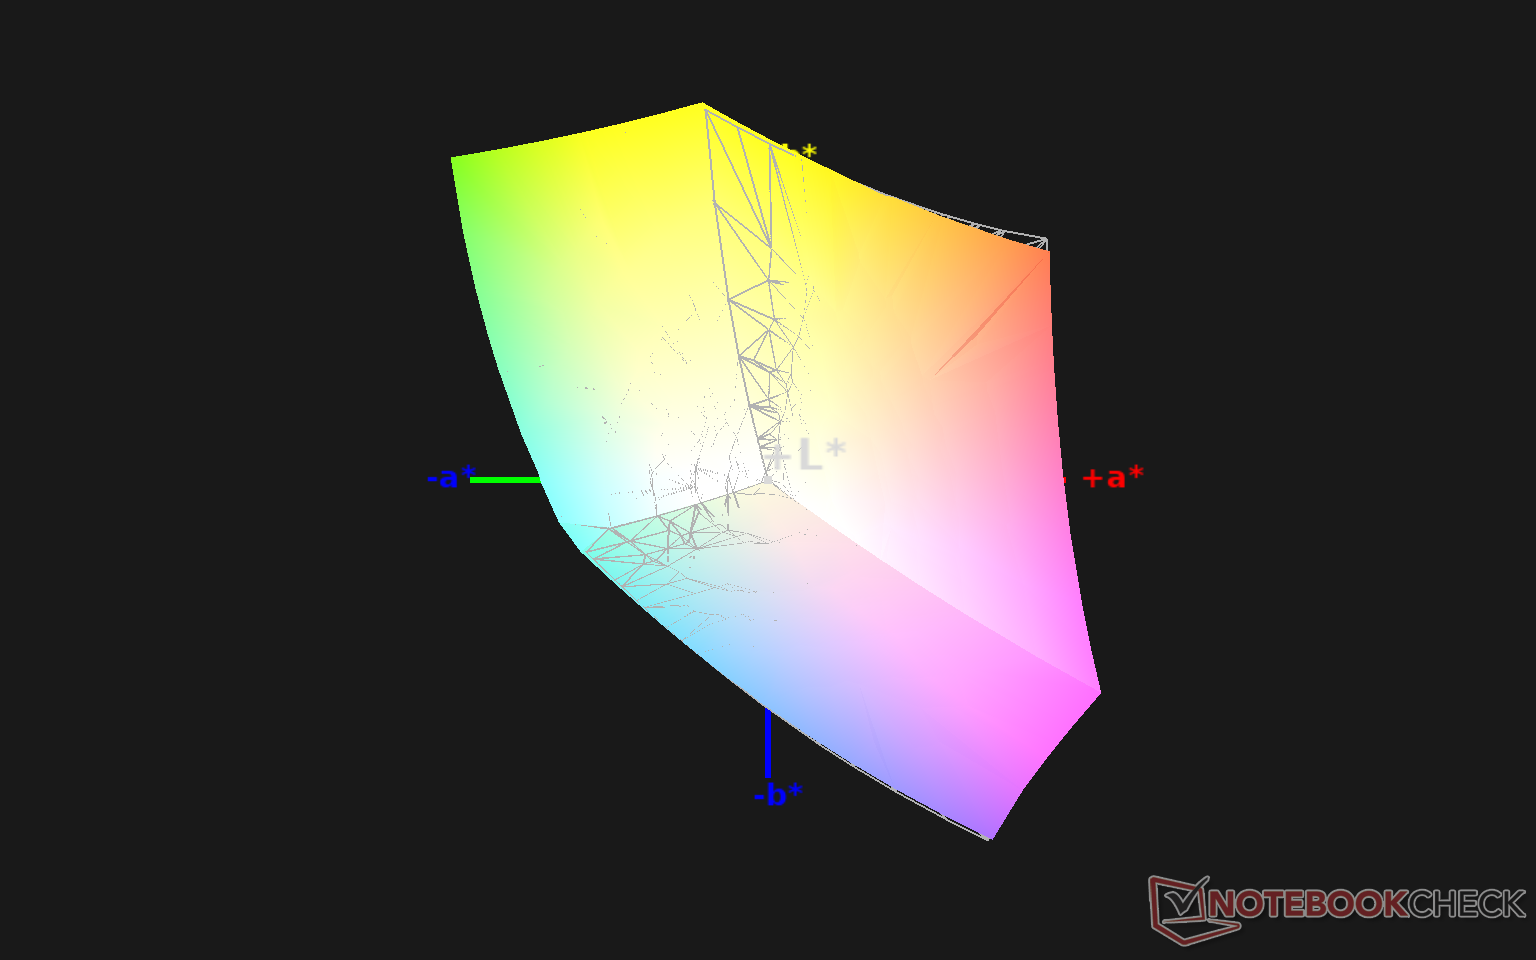
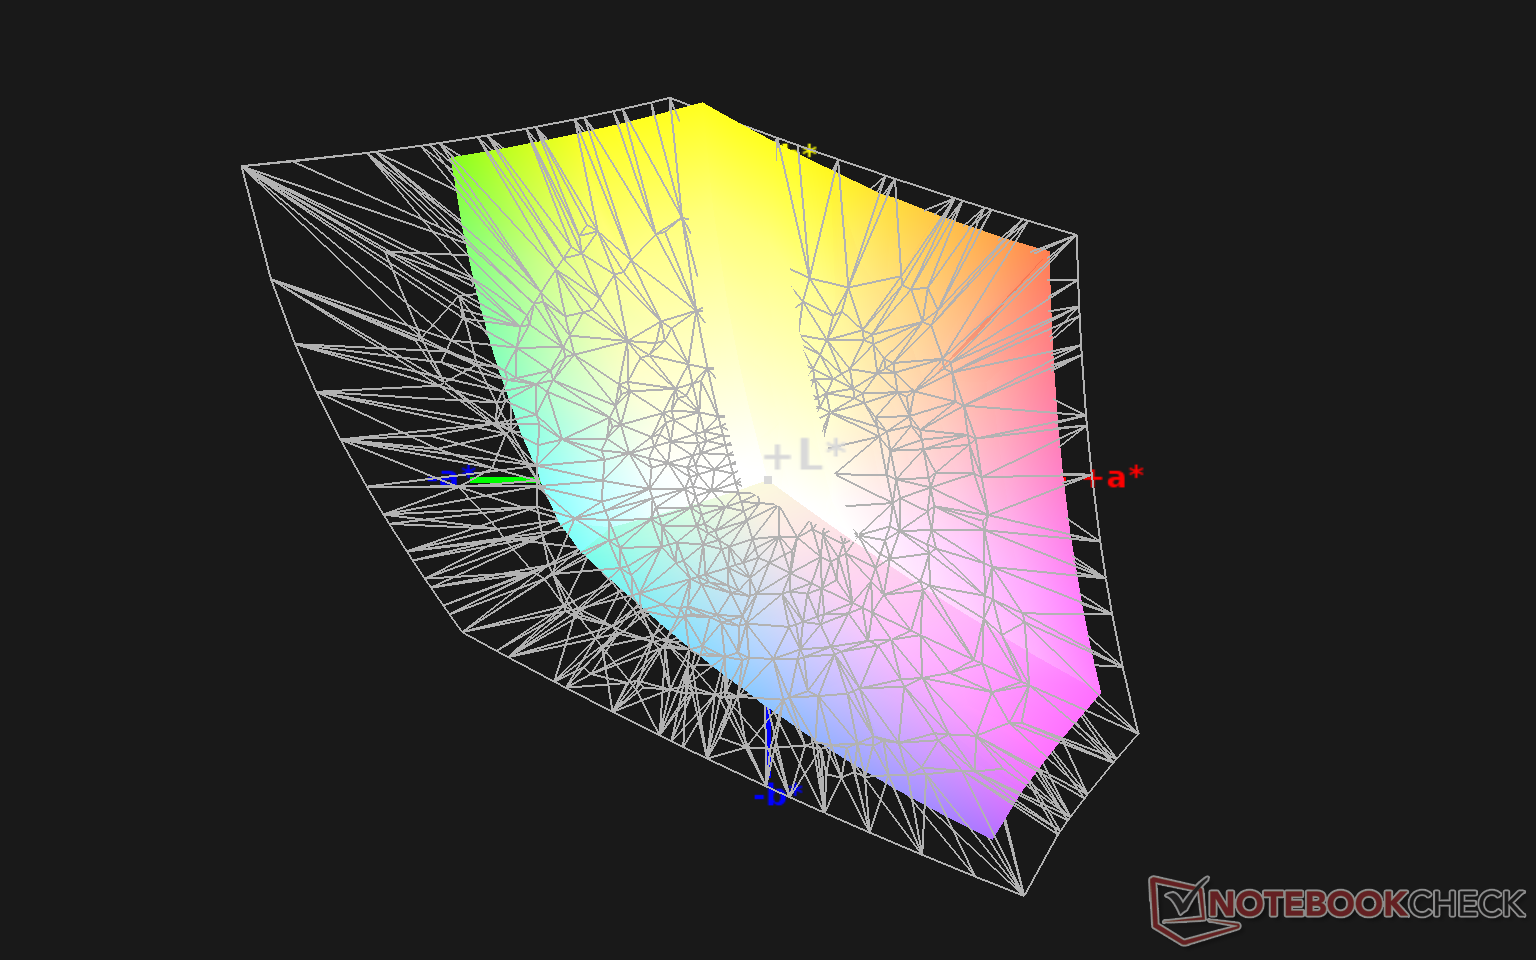
99.3% sRGB (Argyll 1.6.3 3D)
64.5% AdobeRGB 1998 (Argyll 1.6.3 3D)
70.4% AdobeRGB 1998 (Argyll 3D)
99.2% sRGB (Argyll 3D)
68.3% Display P3 (Argyll 3D)
Gamma: 2.25
CCT: 6991 K
| MSI GP66 Leopard 10UG Sharp LQ156M1JW03, IPS, 15.6", 1920x1080 | MSI GP65 10SFK-047US LG Philips LP156WFG-SPB3, IPS, 15.6", 1920x1080 | Alienware m15 R4 LG Philips LGD066E, IPS, 15.6", 1920x1080 | Aorus 15P XC Sharp LQ156M1JW03, IPS, 15.6", 1920x1080 | Asus ROG Zephyrus G15 GA503Q CMN N156KME-GNA (CMN152A), IPS-Level, 15.6", 2560x1440 | MSI GF65 Thin 10UE AU Optronics B156HAN08.4, IPS, 15.6", 1920x1080 | |
|---|---|---|---|---|---|---|
| Display | -7% | 1% | -2% | 22% | -44% | |
| Display P3 Coverage (%) | 68.3 | 63.5 -7% | 69.4 2% | 67.2 -2% | 97.3 42% | 37.65 -45% |
| sRGB Coverage (%) | 99.2 | 94.4 -5% | 99 0% | 98.7 -1% | 99.9 1% | 56.3 -43% |
| AdobeRGB 1998 Coverage (%) | 70.4 | 65.1 -8% | 70.5 0% | 68.6 -3% | 86.2 22% | 38.9 -45% |
| Response Times | -1% | 21% | 9% | 9% | -200% | |
| Response Time Grey 50% / Grey 80% * (ms) | 13.6 ? | 10.4 ? 24% | 7.4 ? 46% | 11.2 ? 18% | 8.8 ? 35% | 36.8 ? -171% |
| Response Time Black / White * (ms) | 9.6 ? | 12 ? -25% | 10 ? -4% | 9.6 ? -0% | 11.2 ? -17% | 31.6 ? -229% |
| PWM Frequency (Hz) | 23580 ? | 24040 ? | ||||
| Bildschirm | -3% | 24% | 27% | 2% | -32% | |
| Helligkeit Bildmitte (cd/m²) | 225.9 | 384.9 70% | 333 47% | 298 32% | 327 45% | 266.5 18% |
| Brightness (cd/m²) | 211 | 358 70% | 303 44% | 278 32% | 309 46% | 262 24% |
| Brightness Distribution (%) | 83 | 87 5% | 86 4% | 88 6% | 89 7% | 91 10% |
| Schwarzwert * (cd/m²) | 0.23 | 0.67 -191% | 0.29 -26% | 0.29 -26% | 0.33 -43% | 0.18 22% |
| Kontrast (:1) | 982 | 574 -42% | 1148 17% | 1028 5% | 991 1% | 1481 51% |
| Delta E Colorchecker * | 3.98 | 2.43 39% | 1.8 55% | 0.96 76% | 4.49 -13% | 5.33 -34% |
| Colorchecker dE 2000 max. * | 8.95 | 4.58 49% | 4.49 50% | 3.22 64% | 8.42 6% | 18.28 -104% |
| Colorchecker dE 2000 calibrated * | 1.15 | 2.03 -77% | 1.13 2% | 0.83 28% | 2.27 -97% | 4.36 -279% |
| Delta E Graustufen * | 6.4 | 2.6 59% | 1.9 70% | 1.3 80% | 4.2 34% | 4.5 30% |
| Gamma | 2.25 98% | 2.2 100% | 2.265 97% | 2.242 98% | 2.173 101% | 2.35 94% |
| CCT | 6991 93% | 6981 93% | 6840 95% | 6519 100% | 7014 93% | 6289 103% |
| Farbraum (Prozent von AdobeRGB 1998) (%) | 64.5 | 59.7 -7% | 71 10% | 69 7% | 86 33% | 35.6 -45% |
| Color Space (Percent of sRGB) (%) | 99.3 | 93.9 -5% | 93 -6% | 91 -8% | 99 0% | 55.8 -44% |
| Durchschnitt gesamt (Programm / Settings) | -4% /
-3% | 15% /
19% | 11% /
19% | 11% /
6% | -92% /
-55% |
* ... kleinere Werte sind besser
Der darstellbare Farbraum deckt sRGB vollständig ab, wie es bei den meisten High-End-Gaming-Laptops üblich ist. Wir sind jedenfalls froh, dass MSI keines der billigen Panda-Panels verwendet, welche deutlich schwächere Farben bieten.
Die Messwerte unseres X-Rite-Farbmessgerätes zeigen ein unkalibriertes Display ab Werk, was nicht nungewöhnlich ist, schließlich handelt es sich beim GP66 nicht um einen Flaggschiff-Gamer mit Pantone-Kalibrierung. Die Farbtemperatur fällt zu kühl aus, worunter die Farbgenauigkeit leidet. Die Farben verbessern sich nach einer manuellen Kalibrierung merklich, die finalen Graustufen- und deltaE-Werte liegen bei nur 1,5 und 1,15. Daher empfehlen wir die Anwendung unseres ICM-Profils weiter oben, um das Beste aus dem Display herauszukitzeln.
Reaktionszeiten (Response Times) des Displays
| ↔ Reaktionszeiten Schwarz zu Weiß | ||
|---|---|---|
| 9.6 ms ... steigend ↗ und fallend ↘ kombiniert | ↗ 5.2 ms steigend | 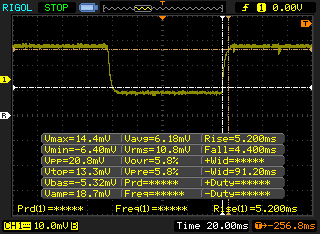 |
| ↘ 4.4 ms fallend | ||
| Die gemessenen Reaktionszeiten sind kurz wodurch sich der Bildschirm auch für Spiele gut eignen sollte. Im Vergleich rangierten die bei uns getesteten Geräte von 0.1 (Minimum) zu 240 (Maximum) ms. » 26 % aller Screens waren schneller als der getestete. Daher sind die gemessenen Reaktionszeiten besser als der Durchschnitt aller vermessenen Geräte (19.8 ms). | ||
| ↔ Reaktionszeiten 50% Grau zu 80% Grau | ||
| 13.6 ms ... steigend ↗ und fallend ↘ kombiniert | ↗ 7.6 ms steigend | 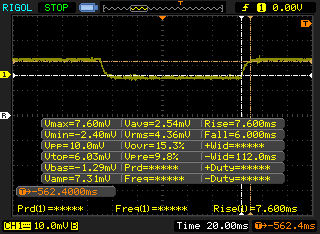 |
| ↘ 6 ms fallend | ||
| Die gemessenen Reaktionszeiten sind gut, für anspruchsvolle Spieler könnten der Bildschirm jedoch zu langsam sein. Im Vergleich rangierten die bei uns getesteten Geräte von 0.165 (Minimum) zu 636 (Maximum) ms. » 27 % aller Screens waren schneller als der getestete. Daher sind die gemessenen Reaktionszeiten besser als der Durchschnitt aller vermessenen Geräte (31 ms). | ||
Bildschirm-Flackern / PWM (Pulse-Width Modulation)
| Flackern / PWM festgestellt | 23580 Hz | ≤ 34 % Helligkeit | 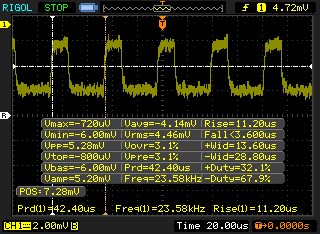 |
Das Display flackert mit 23580 Hz (im schlimmsten Fall, eventuell durch Pulsweitenmodulation PWM) bei einer eingestellten Helligkeit von 34 % und darunter. Darüber sollte es zu keinem Flackern kommen. Die Frequenz von 23580 Hz ist sehr hoch und sollte daher auch bei empfindlichen Personen zu keinen Problemen führen. Im Vergleich: 52 % aller getesteten Geräte nutzten kein PWM um die Helligkeit zu reduzieren. Wenn PWM eingesetzt wurde, dann bei einer Frequenz von durchschnittlich 7778 (Minimum 5, Maximum 343500) Hz. | |||
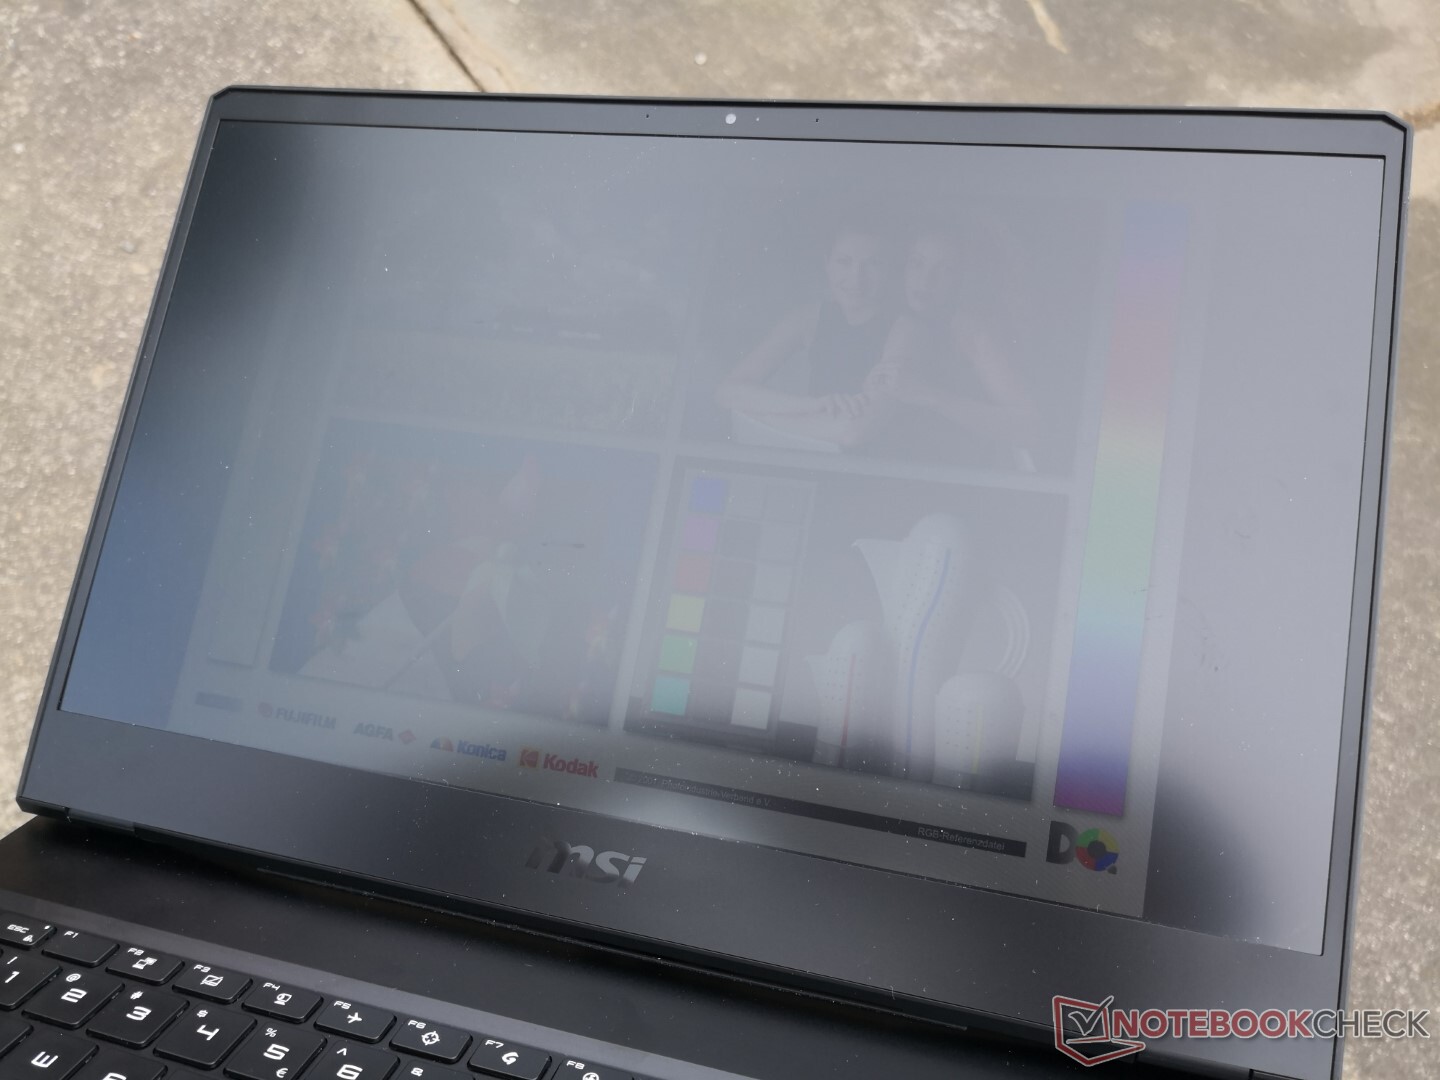
Die Sichtbarkeit im Freien ist durch die mangelhafte Helligkeit dürftig. Auch Spiegelungen sind unter den meisten Bedingungen sichtbar und der Bildschirminhalt wirkt verwaschen.
Leistung
MSI bietet bislang nur die Intel Gen-10-CPUs Comet Lake-H Core i7-10870H und Core i7-10875H für das GP66 an (in Deutschland auch Core i7-10750H, Anm. d. Übersetzers). Allerdings hätte es nur eine dieser beiden Optionen auch getan, immerhin sind die Leistungsunterschiede beider Prozessoren minimal. Nutzer, die auf AMD-Optionen schielen, müssen sich die preiswerteren Bravo- oder Alpha-Serien anschauen.
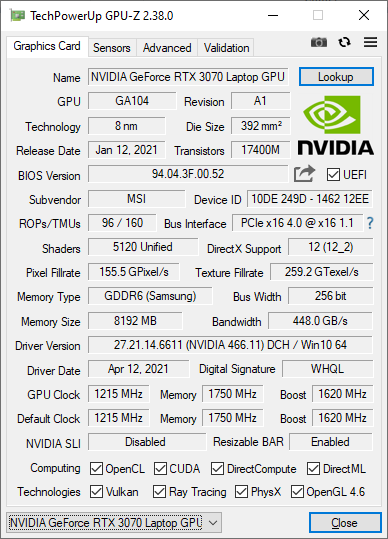
Grafikoptionen rangieren von der GeForce RTX 3060 bis hin zur RTX 3080, jeweils bei 130 W TGP. In der Dragon-Center-Software wird sowohl die manuelle als auch automatische Grafikumschaltung angeboten. Überhaupt sollten sich Nutzer mit dem Dragon Center vertraut machen, alle wesentlichen Funktionen sind hier gebündelt.
Für unsere Benchmarkmessungen stellen wir den Höchstleistungsmodus ein und aktivieren die Nvidia-GPU, um die besten Ergebnisse erzielen zu können.
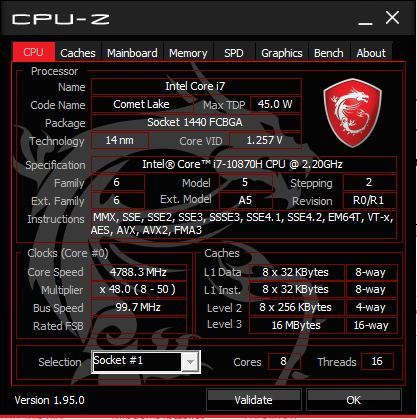
Prozessor
Die CPU-Leistung ist ausgezeichnet bei ordentlicher Turbo-Boost-Konstanz, wie unser CineBench-R15-xT-Loop unten zeigt. Die Leistung ist sogar auf Höhe des deutlich teureren Core i9-10980HK im Alienware m15 R4. Unterschiede zwischen dem Core i7-10875H und dem Core i7-10870H liegen im Bereich weniger Prozentpunkte.
Cinebench R15: CPU Multi 64Bit | CPU Single 64Bit
Blender: v2.79 BMW27 CPU
7-Zip 18.03: 7z b 4 -mmt1 | 7z b 4
Geekbench 5.5: Single-Core | Multi-Core
HWBOT x265 Benchmark v2.2: 4k Preset
LibreOffice : 20 Documents To PDF
R Benchmark 2.5: Overall mean
| Cinebench R20 / CPU (Multi Core) | |
| MSI GT76 Titan DT 10SGS | |
| Asus ROG Zephyrus Duo 15 SE GX551QS | |
| Schenker XMG Core 15 Ampere | |
| Asus Zephyrus G14 GA401IV | |
| Alienware m15 R4 | |
| Asus Zephyrus S15 GX502L | |
| MSI GP66 Leopard 10UG | |
| Durchschnittliche Intel Core i7-10870H (3027 - 4020, n=12) | |
| HP Pavilion Gaming 15-ec1206ng | |
| Schenker XMG Pro 15 | |
| Razer Blade 15 Base Edition 2021, i7-10750H RTX 3060 | |
| Cinebench R20 / CPU (Single Core) | |
| Asus ROG Zephyrus Duo 15 SE GX551QS | |
| Asus Zephyrus G14 GA401IV | |
| MSI GT76 Titan DT 10SGS | |
| Schenker XMG Core 15 Ampere | |
| MSI GP66 Leopard 10UG | |
| Alienware m15 R4 | |
| Durchschnittliche Intel Core i7-10870H (460 - 484, n=12) | |
| Razer Blade 15 Base Edition 2021, i7-10750H RTX 3060 | |
| Asus Zephyrus S15 GX502L | |
| HP Pavilion Gaming 15-ec1206ng | |
| Schenker XMG Pro 15 | |
| Cinebench R15 / CPU Multi 64Bit | |
| MSI GT76 Titan DT 10SGS | |
| Asus ROG Zephyrus Duo 15 SE GX551QS | |
| Schenker XMG Core 15 Ampere | |
| Asus Zephyrus G14 GA401IV | |
| Asus Zephyrus S15 GX502L | |
| MSI GP66 Leopard 10UG | |
| Durchschnittliche Intel Core i7-10870H (1336 - 1740, n=14) | |
| Alienware m15 R4 | |
| HP Pavilion Gaming 15-ec1206ng | |
| Schenker XMG Pro 15 | |
| Razer Blade 15 Base Edition 2021, i7-10750H RTX 3060 | |
| Cinebench R15 / CPU Single 64Bit | |
| Asus ROG Zephyrus Duo 15 SE GX551QS | |
| MSI GT76 Titan DT 10SGS | |
| Alienware m15 R4 | |
| MSI GP66 Leopard 10UG | |
| Durchschnittliche Intel Core i7-10870H (196 - 204, n=11) | |
| Razer Blade 15 Base Edition 2021, i7-10750H RTX 3060 | |
| Asus Zephyrus G14 GA401IV | |
| Asus Zephyrus S15 GX502L | |
| Schenker XMG Core 15 Ampere | |
| HP Pavilion Gaming 15-ec1206ng | |
| Schenker XMG Pro 15 | |
| HWBOT x265 Benchmark v2.2 / 4k Preset | |
| MSI GT76 Titan DT 10SGS | |
| Asus ROG Zephyrus Duo 15 SE GX551QS | |
| Schenker XMG Core 15 Ampere | |
| Asus Zephyrus S15 GX502L | |
| MSI GP66 Leopard 10UG | |
| Alienware m15 R4 | |
| Durchschnittliche Intel Core i7-10870H (10.7 - 13.5, n=12) | |
| Asus Zephyrus G14 GA401IV | |
| HP Pavilion Gaming 15-ec1206ng | |
| Schenker XMG Pro 15 | |
| Razer Blade 15 Base Edition 2021, i7-10750H RTX 3060 | |
| LibreOffice / 20 Documents To PDF | |
| HP Pavilion Gaming 15-ec1206ng | |
| Schenker XMG Core 15 Ampere | |
| Durchschnittliche Intel Core i7-10870H (46 - 64.4, n=12) | |
| Alienware m15 R4 | |
| MSI GP66 Leopard 10UG | |
| Razer Blade 15 Base Edition 2021, i7-10750H RTX 3060 | |
| Asus Zephyrus S15 GX502L | |
| MSI GT76 Titan DT 10SGS | |
| Asus ROG Zephyrus Duo 15 SE GX551QS | |
| R Benchmark 2.5 / Overall mean | |
| Schenker XMG Pro 15 | |
| Razer Blade 15 Base Edition 2021, i7-10750H RTX 3060 | |
| HP Pavilion Gaming 15-ec1206ng | |
| Asus Zephyrus S15 GX502L | |
| Durchschnittliche Intel Core i7-10870H (0.573 - 0.614, n=12) | |
| MSI GP66 Leopard 10UG | |
| Alienware m15 R4 | |
| Schenker XMG Core 15 Ampere | |
| MSI GT76 Titan DT 10SGS | |
| Asus ROG Zephyrus Duo 15 SE GX551QS | |
* ... kleinere Werte sind besser
Systemleistung
Die Ergebnisse im PCMark liegen im Vergleich mit anderen Laptops mit der gleichen CPU und GPU auf Erwartungsniveau. Die Werte sind konsistent höher als beim GP65, mit Ausnahme des Essentials-Benchmarks, vermutlich durch die langsamere NVMe-SSD in unserem Testmodell.
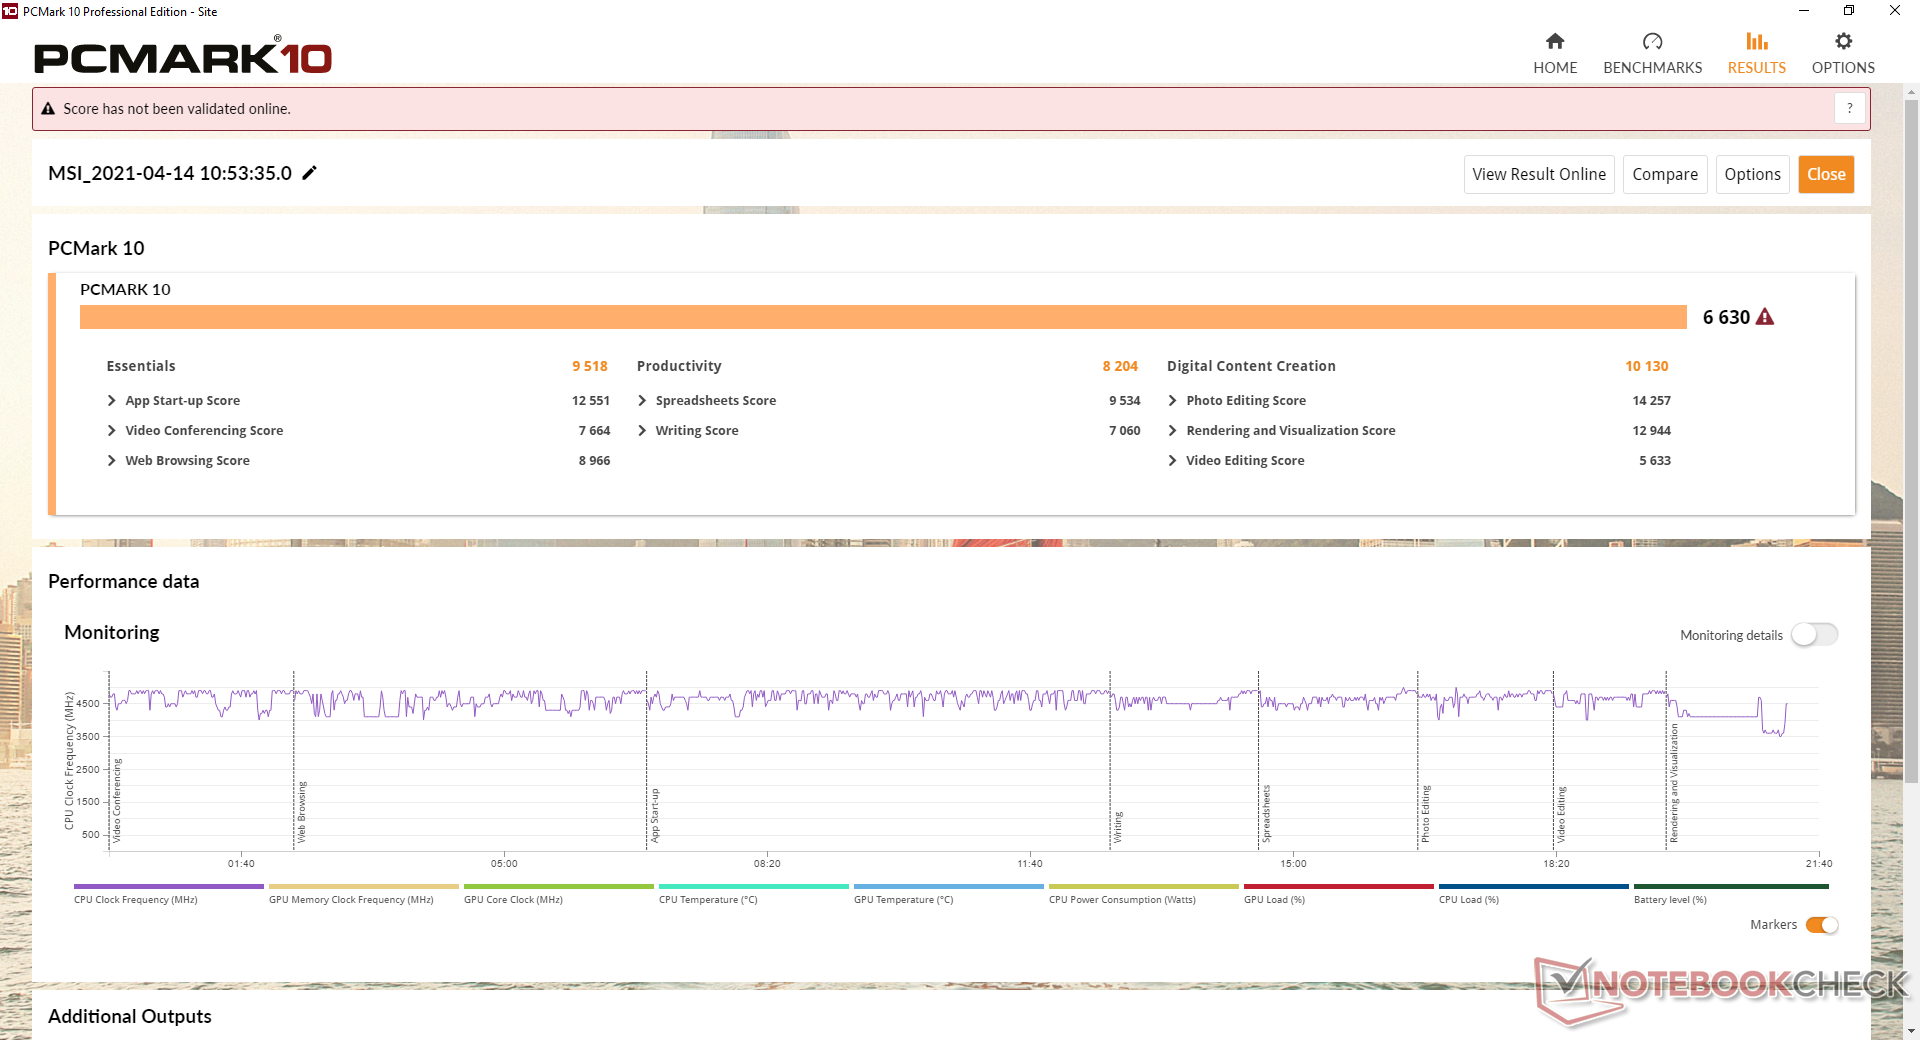
| PCMark 10 Score | 6630 Punkte | |
Hilfe | ||
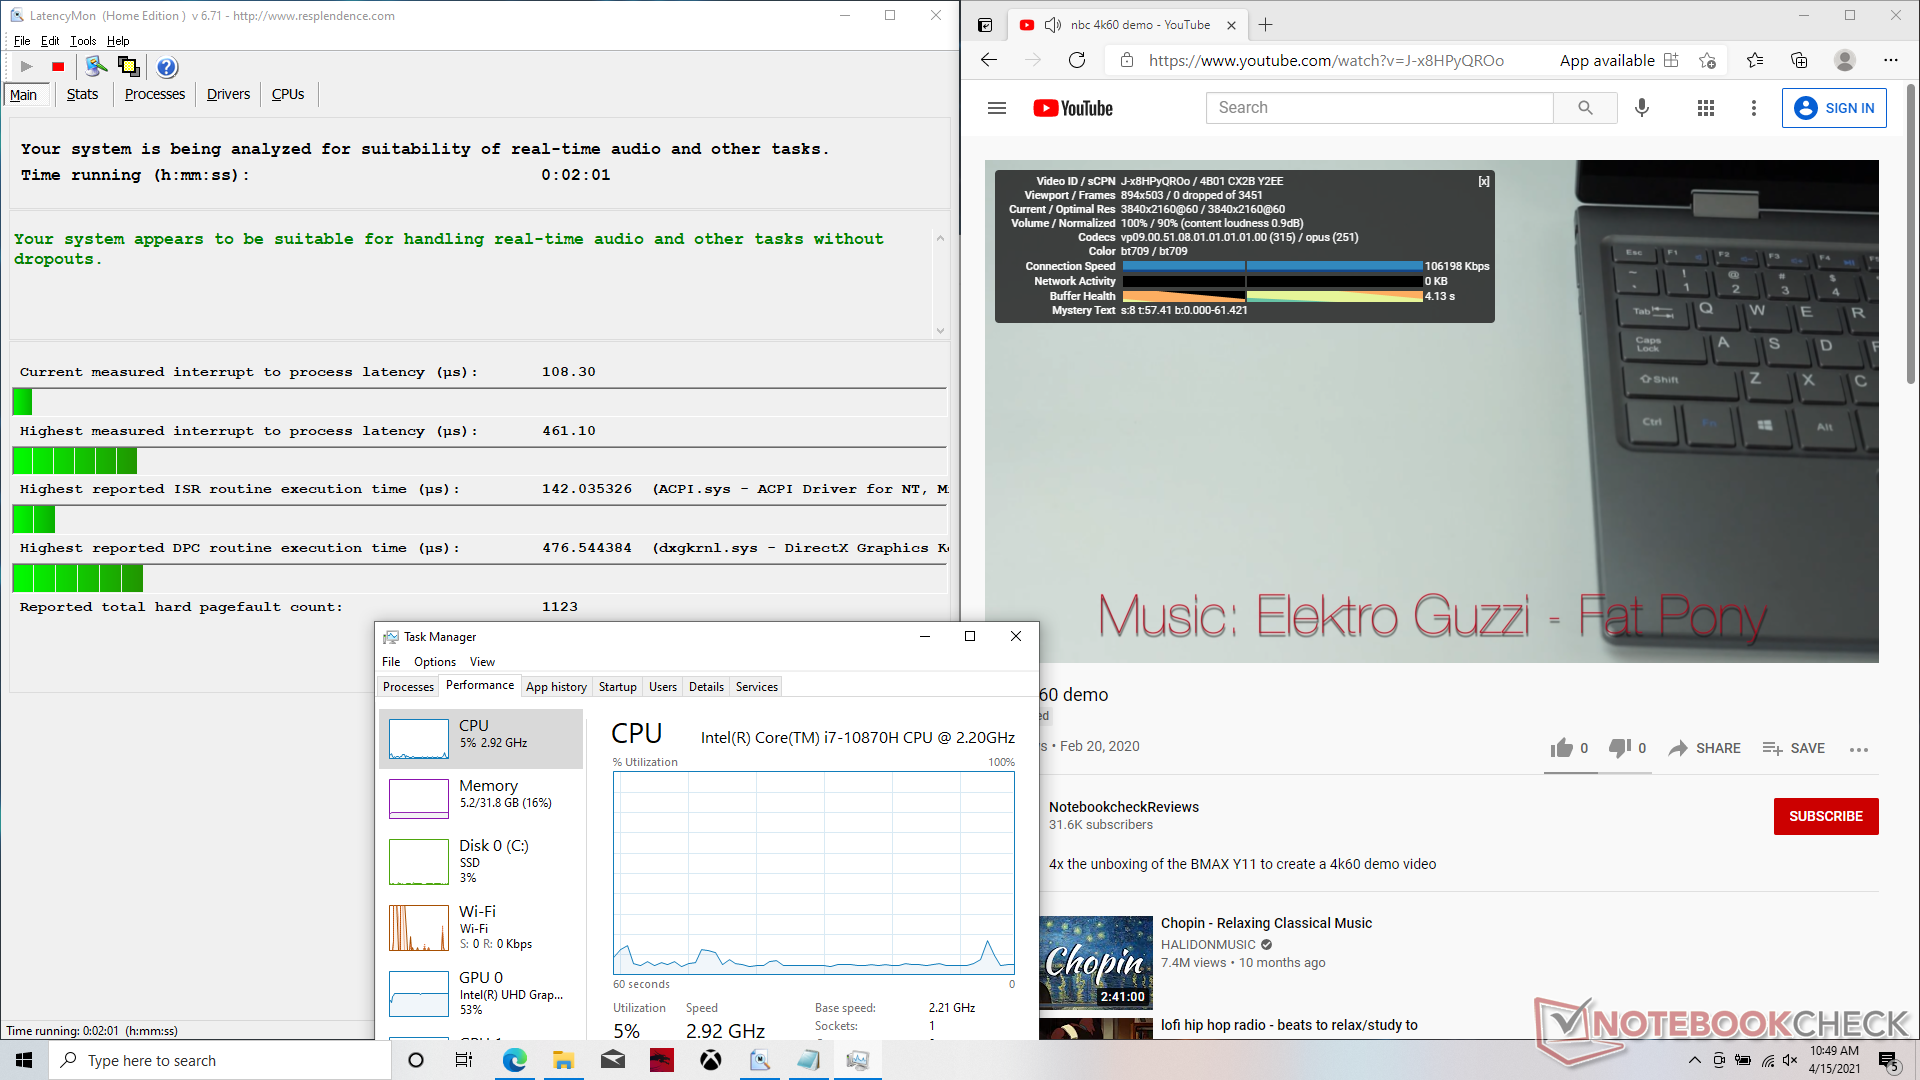
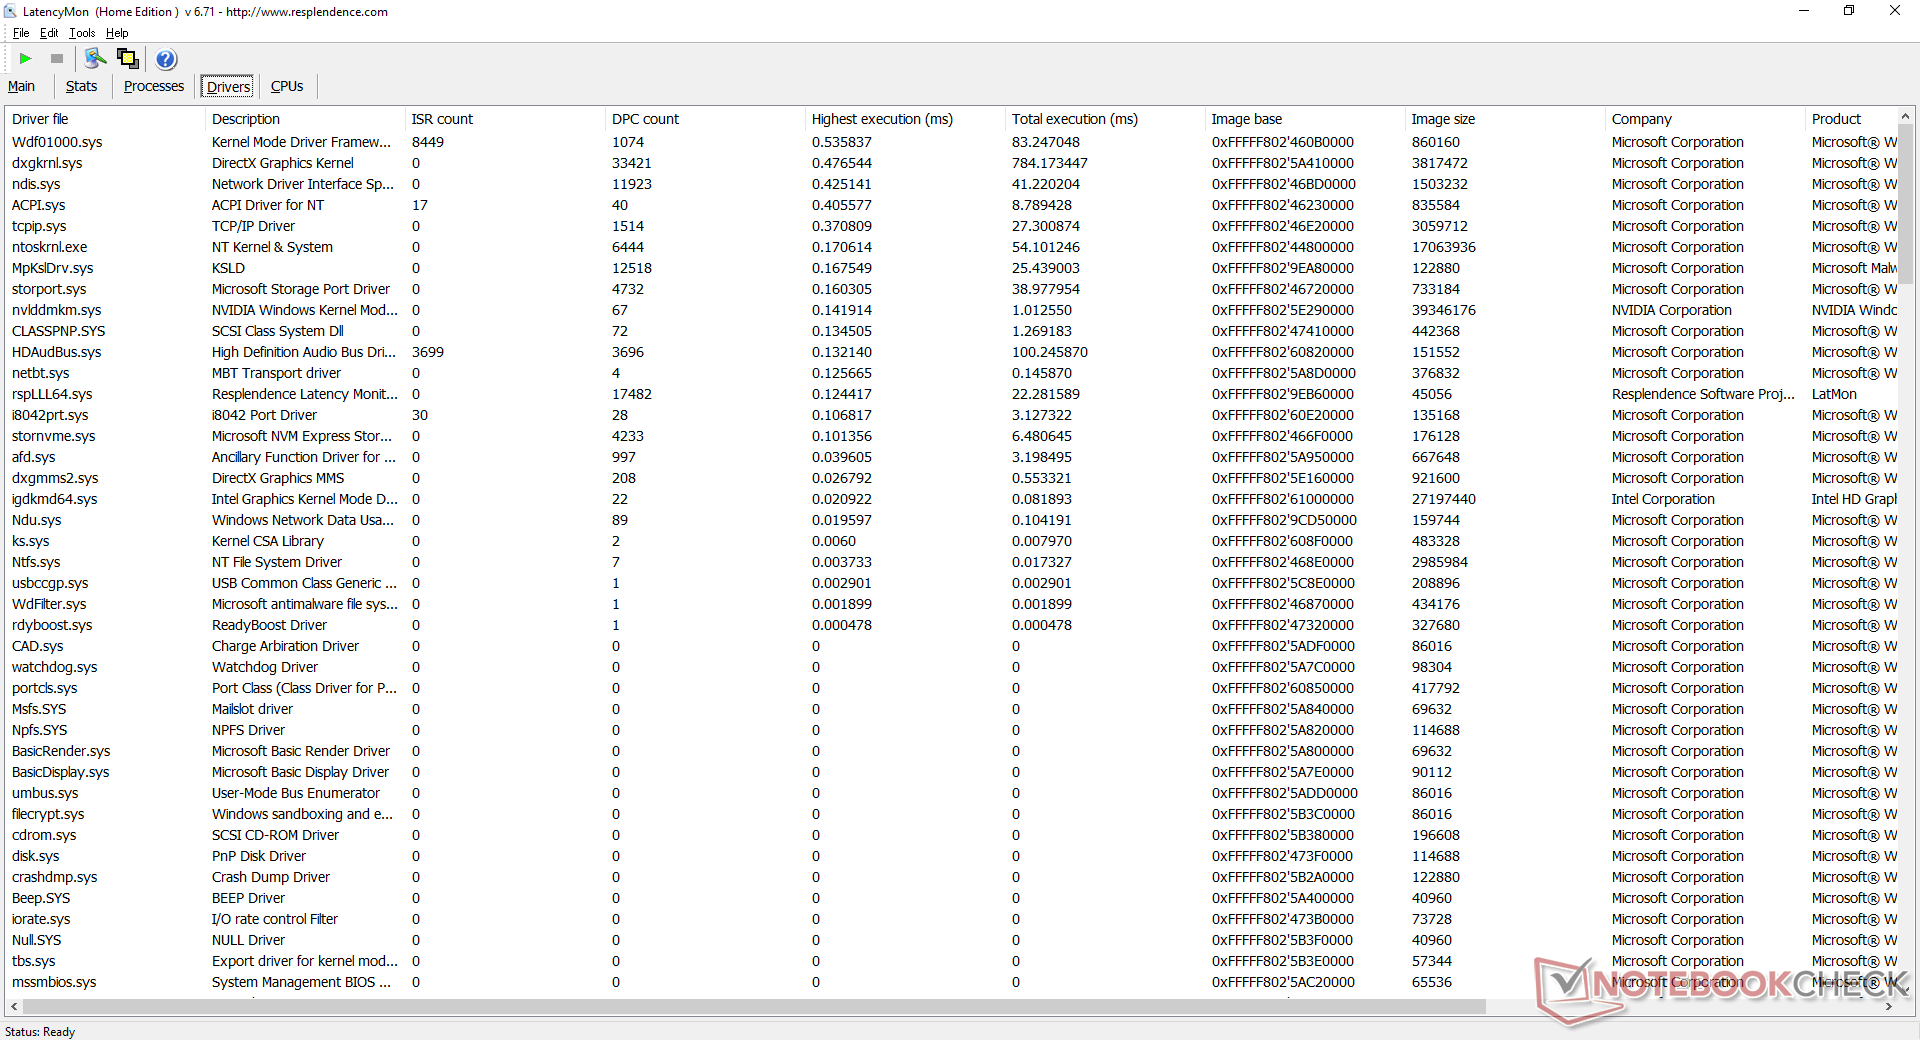
DPC-Latenz
LatencyMon zeigt weder beim Öffnen mehrerer Browsertabs, noch bei der Wiedergabe unseres 4K/60-fps-Videos auf YouTube irgendwelche Latenzprobleme auf. Dropped Frames gab es ebenfalls nicht zu beklagen, so gehört es sich für einen guten Gaming-Laptop.
| DPC Latencies / LatencyMon - interrupt to process latency (max), Web, Youtube, Prime95 | |
| Alienware m15 R4 | |
| Aorus 15P XC | |
| MSI GP65 10SFK-047US | |
| MSI GF65 Thin 10UE | |
| MSI GP66 Leopard 10UG | |
| Asus ROG Zephyrus G15 GA503Q | |
* ... kleinere Werte sind besser
Massenspeicher
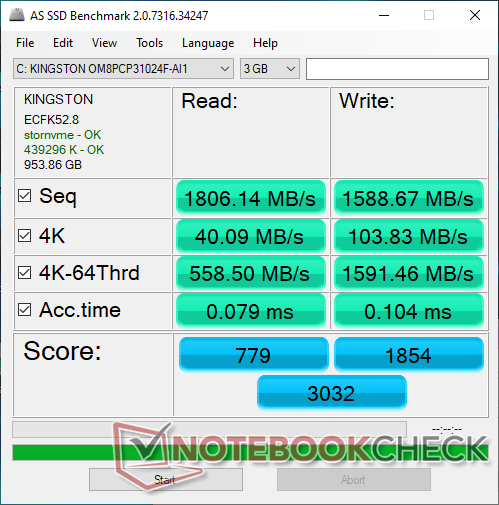
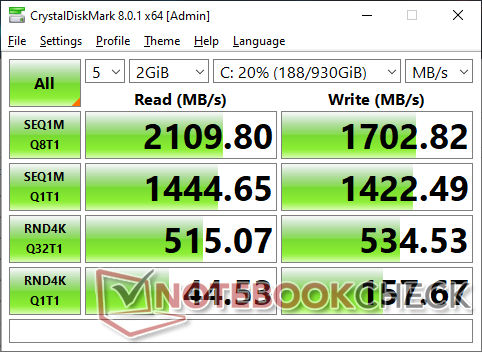
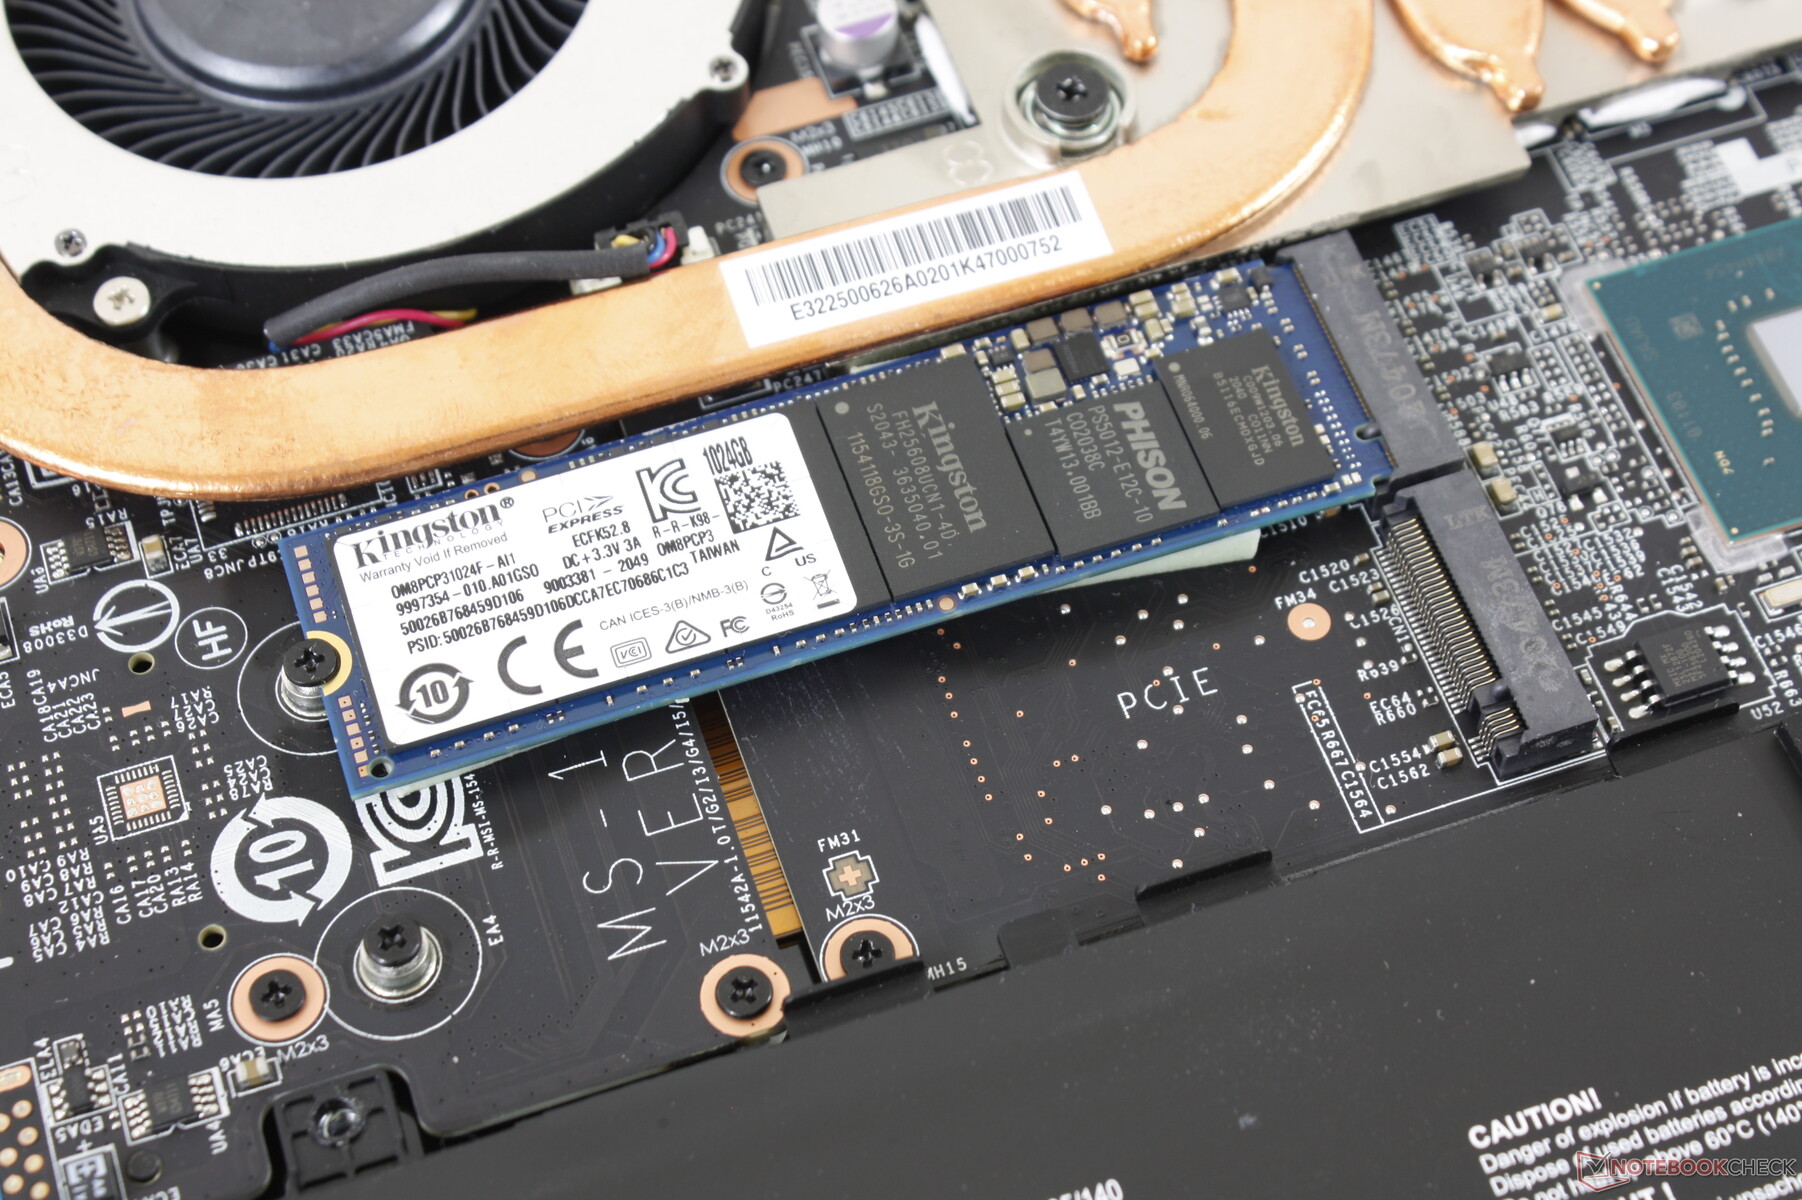
Während das GP65 noch bis zu drei interne Speichermedien einbinden konnte (2x M.2, 1x 2.5 Zoll SATA III), kann das GP66 nur zwei M.2-Laufwerke betreiben. Die 1 TB große Kingston OM8PCP31024F im GP66 zählt zu den Modellen der Mittelklasse und ist langsamer als zum Beispiel die Samsung PM981 oder die Micron 2300.
| MSI GP66 Leopard 10UG Kingston OM8PCP31024F | MSI GP65 10SFK-047US Samsung SSD PM981 MZVLB1T0HALR | Alienware m15 R4 Micron 2300 1TB MTFDHBA1T0TDV | Aorus 15P XC ESR512GTLCG-EAC-4 | Asus ROG Zephyrus G15 GA503Q SK Hynix HFM001TD3JX013N | MSI GF65 Thin 10UE Samsung SSD PM981 MZVLB1T0HALR | |
|---|---|---|---|---|---|---|
| AS SSD | 50% | 38% | 45% | 58% | 50% | |
| Seq Read (MB/s) | 1806 | 2066 14% | 2658 47% | 2694 49% | 2950 63% | 3002 66% |
| Seq Write (MB/s) | 1589 | 2418 52% | 2769 74% | 2327 46% | 1600 1% | 2420 52% |
| 4K Read (MB/s) | 40.09 | 54.2 35% | 46.07 15% | 47.77 19% | 53.6 34% | 48.46 21% |
| 4K Write (MB/s) | 103.8 | 129 24% | 87.2 -16% | 98.8 -5% | 126.8 22% | 114.3 10% |
| 4K-64 Read (MB/s) | 559 | 1865 234% | 1372 145% | 1746 212% | 1429 156% | 1873 235% |
| 4K-64 Write (MB/s) | 1591 | 1878 18% | 1247 -22% | 2267 42% | 2177 37% | 1882 18% |
| Access Time Read * (ms) | 0.079 | 0.042 47% | 0.052 34% | 0.079 -0% | 0.064 19% | 0.045 43% |
| Access Time Write * (ms) | 0.104 | 0.091 12% | 0.098 6% | 0.039 62% | 0.029 72% | 0.101 3% |
| Score Read (Points) | 779 | 2126 173% | 1684 116% | 2063 165% | 1778 128% | 2221 185% |
| Score Write (Points) | 1854 | 2249 21% | 1611 -13% | 2598 40% | 2464 33% | 2238 21% |
| Score Total (Points) | 3032 | 5482 81% | 4166 37% | 5698 88% | 5090 68% | 5565 84% |
| Copy ISO MB/s (MB/s) | 2674 | 2927 9% | 1877 -30% | 2421 -9% | ||
| Copy Program MB/s (MB/s) | 895 | 728 -19% | 555 -38% | 705 -21% | ||
| Copy Game MB/s (MB/s) | 1596 | 1614 1% | 1201 -25% | 1490 -7% | ||
| CrystalDiskMark 5.2 / 6 | 31% | 41% | 28% | 42% | 30% | |
| Write 4K (MB/s) | 153.2 | 145 -5% | 93.7 -39% | 130.2 -15% | 156.4 2% | 157.3 3% |
| Read 4K (MB/s) | 43.98 | 46.84 7% | 48.1 9% | 45.47 3% | 66.7 52% | 46.69 6% |
| Write Seq (MB/s) | 1527 | 2377 56% | 2785 82% | 2269 49% | 2318 52% | 2389 56% |
| Read Seq (MB/s) | 1112 | 2185 96% | 2598 134% | 1643 48% | 2151 93% | 2196 97% |
| Write 4K Q32T1 (MB/s) | 520 | 463.5 -11% | 481.9 -7% | 547 5% | 525 1% | 407.6 -22% |
| Read 4K Q32T1 (MB/s) | 516 | 527 2% | 521 1% | 654 27% | 452.1 -12% | 519 1% |
| Write Seq Q32T1 (MB/s) | 1697 | 2395 41% | 3362 98% | 2512 48% | 3055 80% | 2401 41% |
| Read Seq Q32T1 (MB/s) | 2110 | 3470 64% | 3200 52% | 3382 60% | 3607 71% | 3344 58% |
| Durchschnitt gesamt (Programm / Settings) | 41% /
43% | 40% /
40% | 37% /
39% | 50% /
51% | 40% /
43% |
* ... kleinere Werte sind besser

Disk Throttling: DiskSpd Read Loop, Queue Depth 8
Grafikleistung
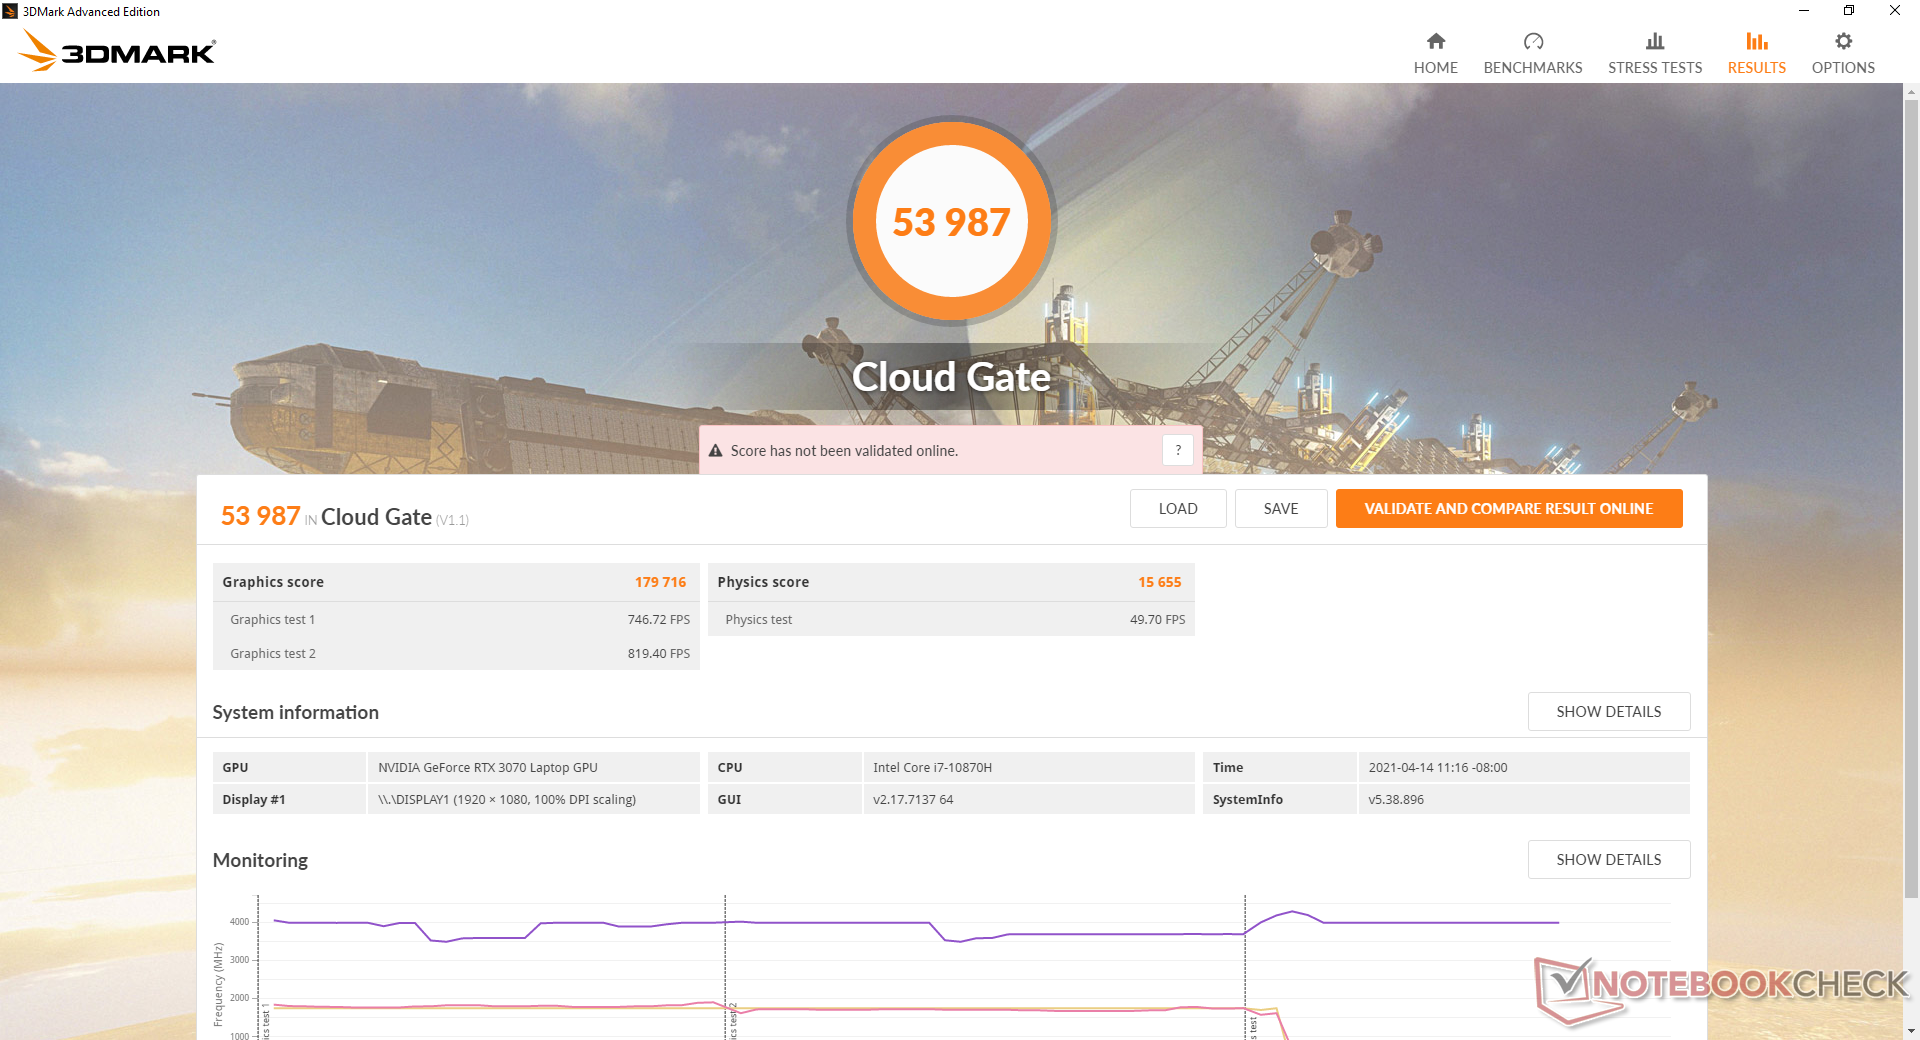
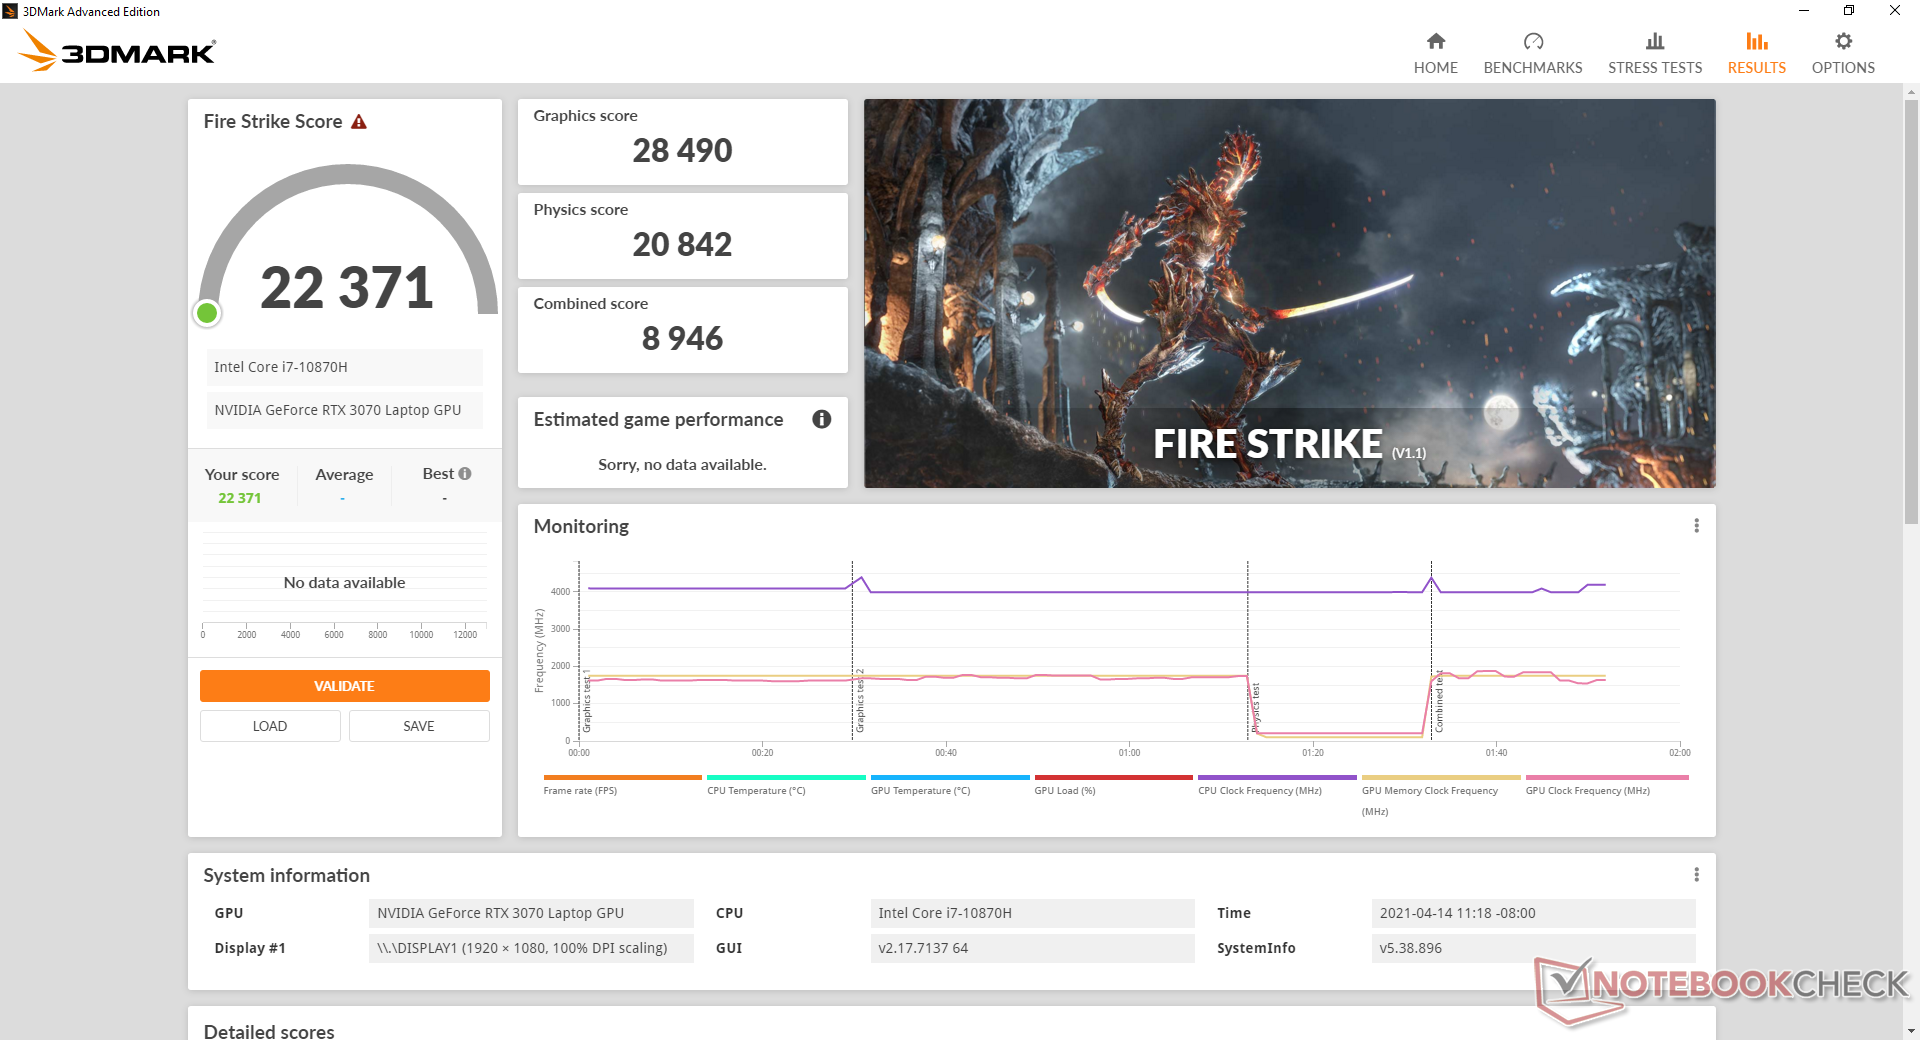
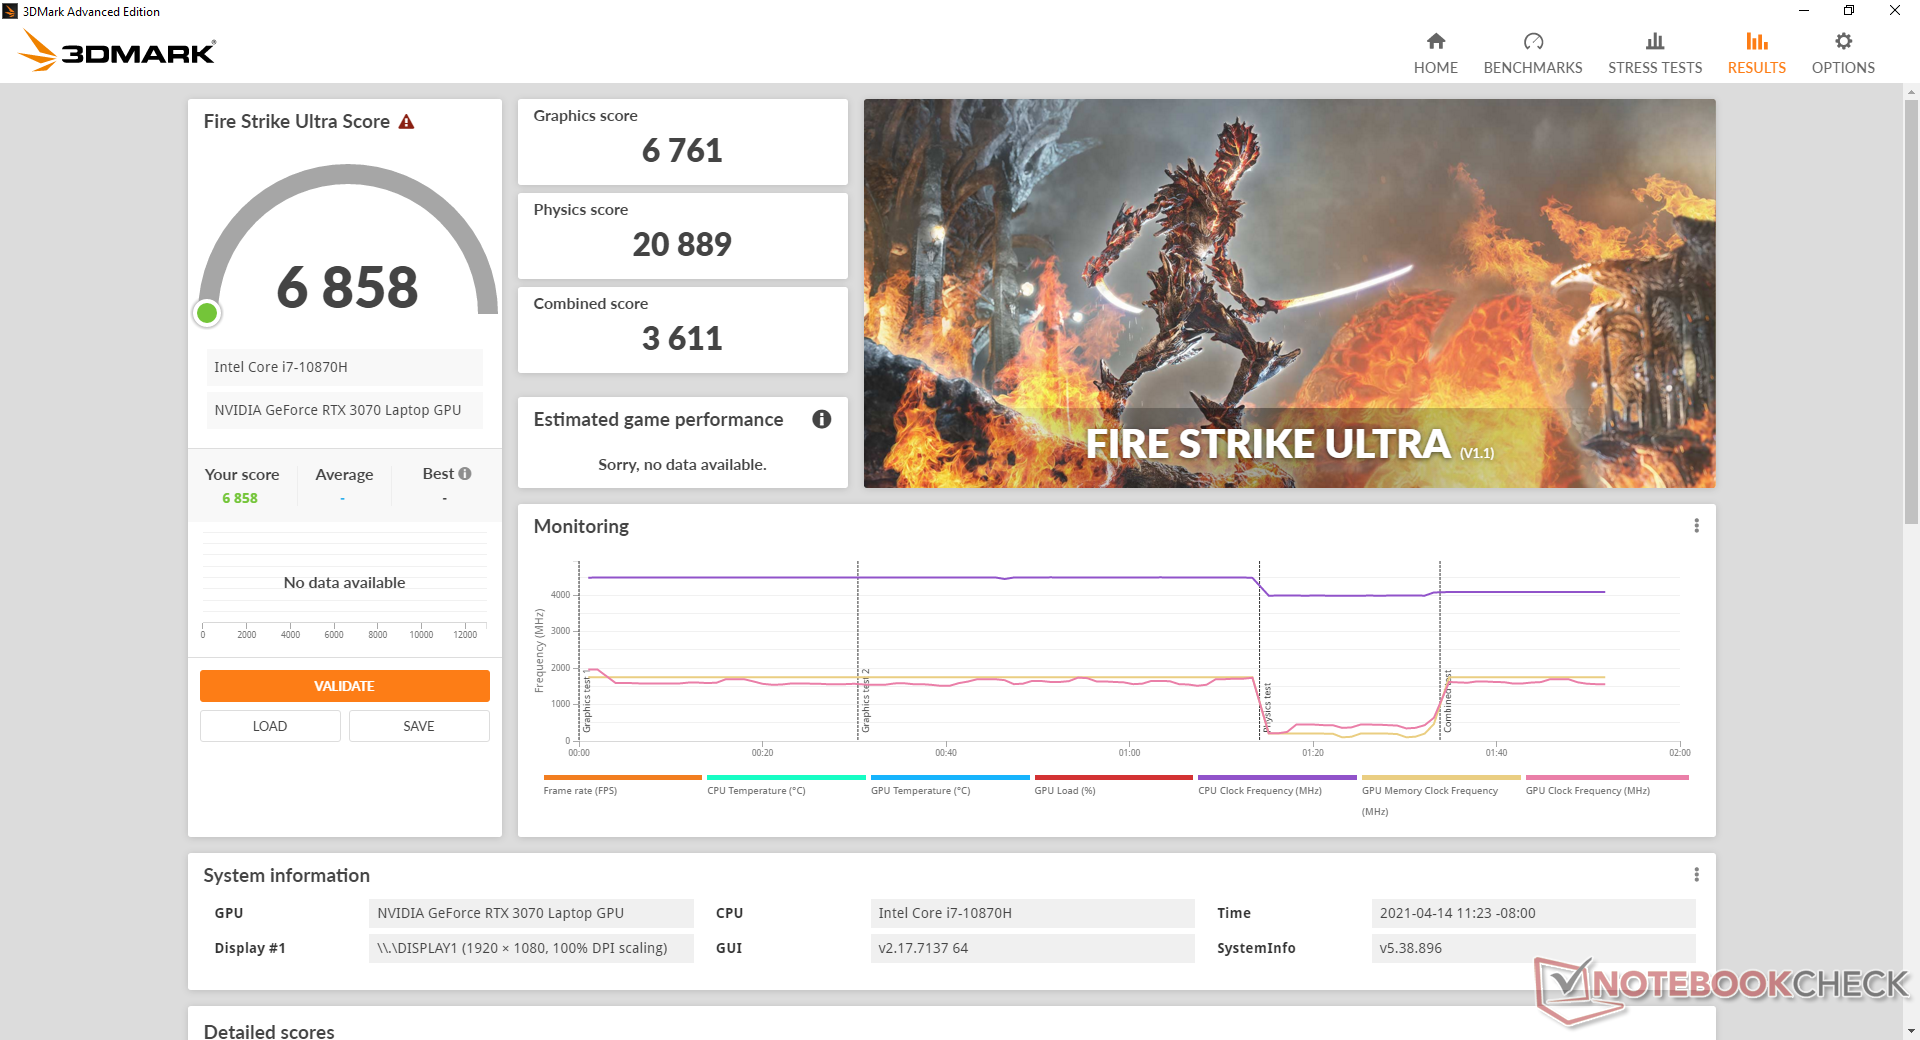
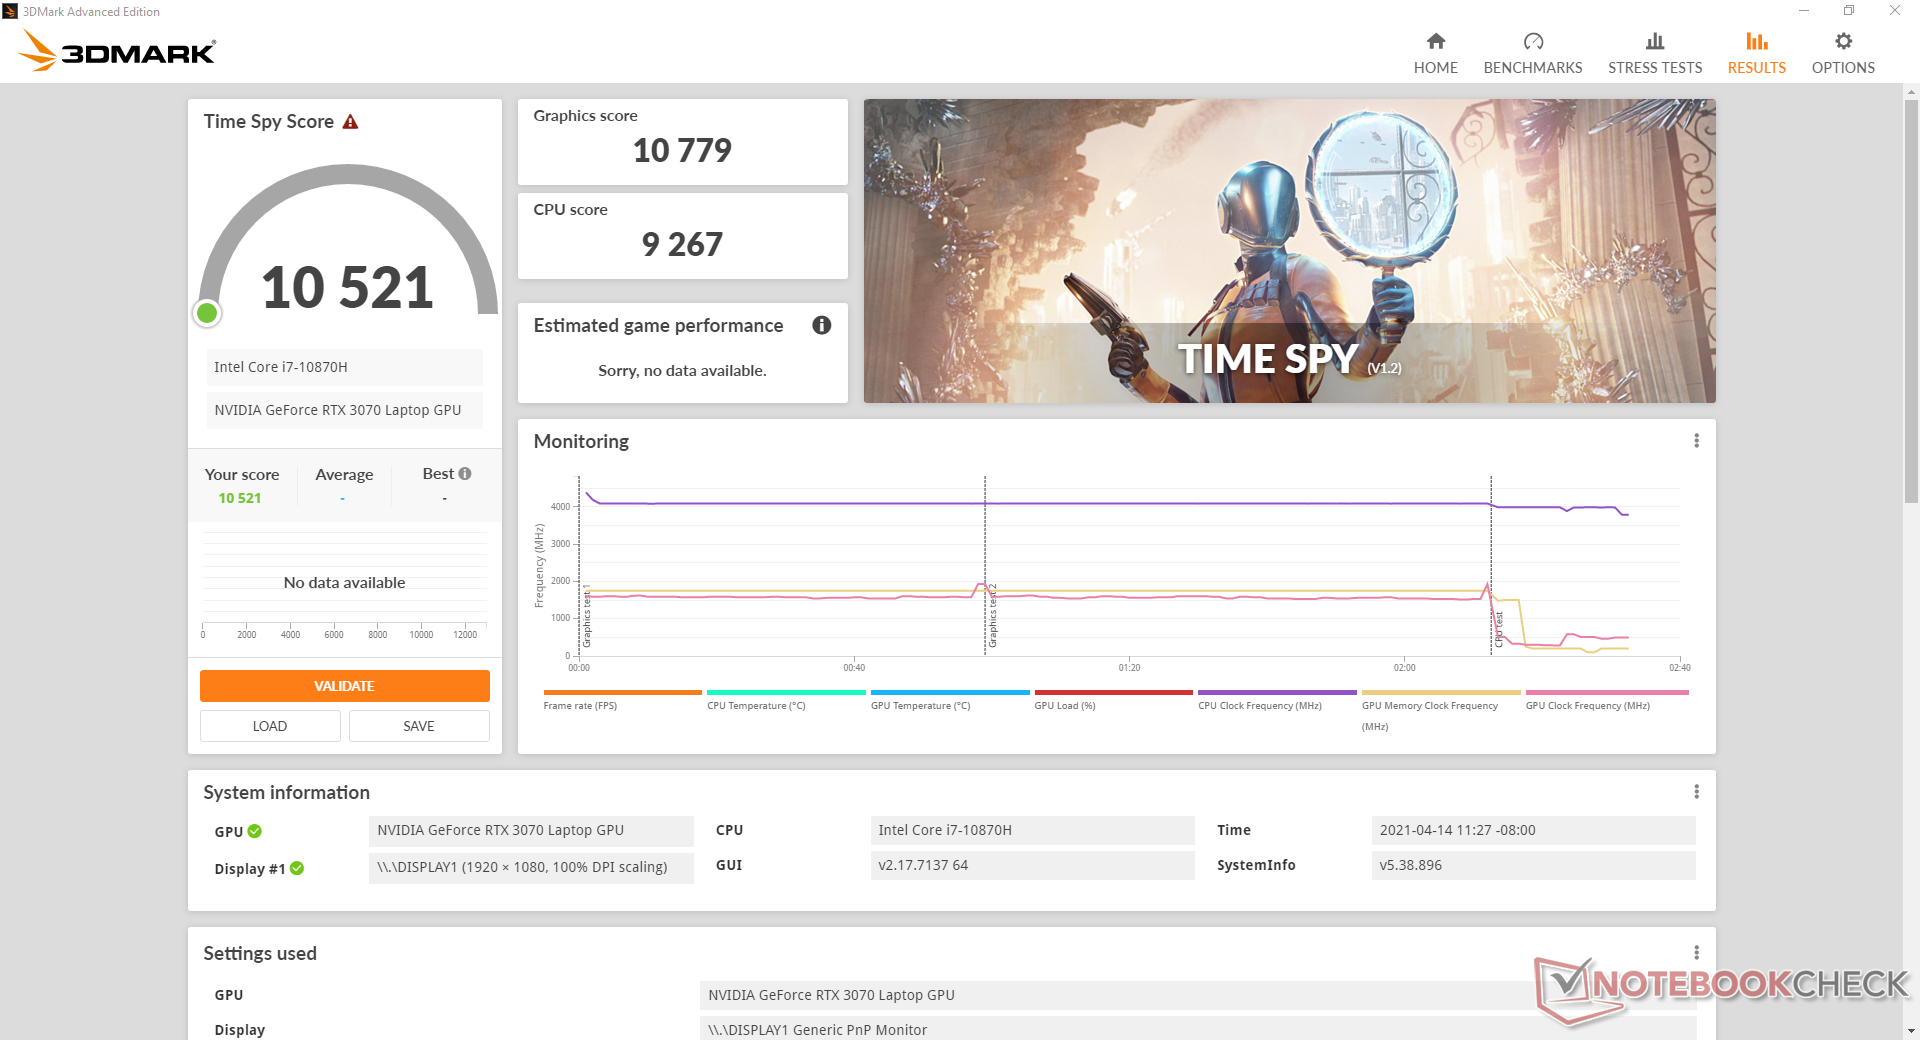
Die pure Grafikleistung ist nur 6 bis 9 Prozent langsamer als die 130-W-GeForce-RTX-3080 im Asus Zephyrus Duo 15 SE, zumindest laut 3DMark-Benchmarks. Nutzer, welche von einem älteren RTX 2070-Laptop aufrüsten, können sich über Steigerungen bis zu 35 oder gar 40 Prozent freuen. Auf der anderen Seite ist ein Desktop-PC mit einer "ordentlichen" GeForce RTX 3070 noch immer rund 20 Prozent schneller als unsere mobile RTX-3070-Version.
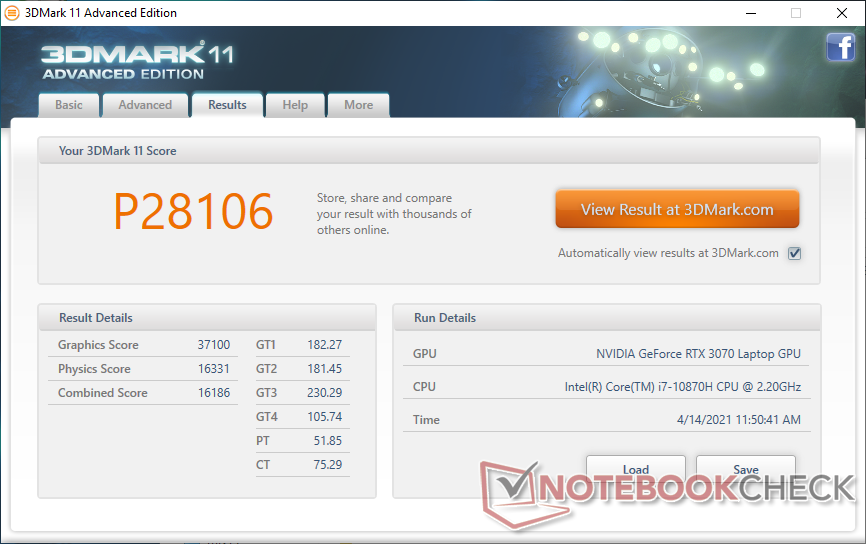
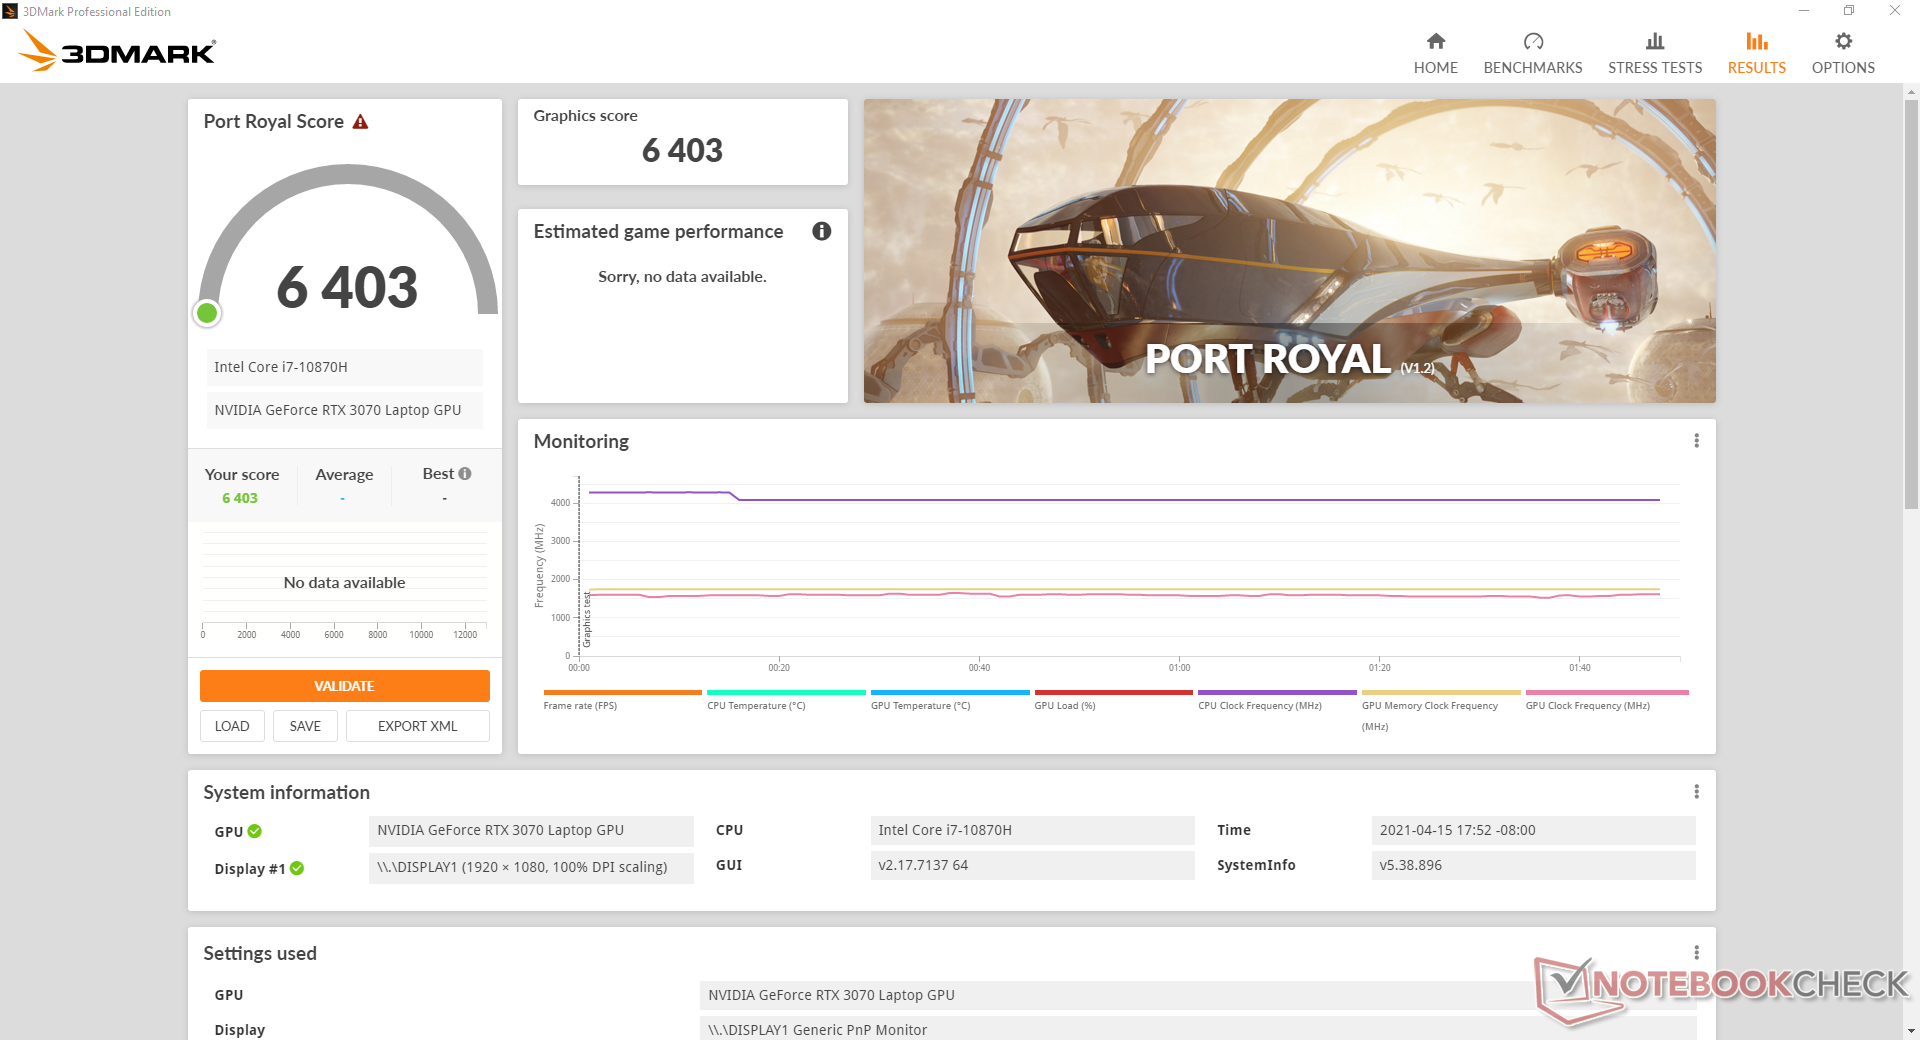
| 3DMark 11 Performance | 28106 Punkte | |
| 3DMark Cloud Gate Standard Score | 53987 Punkte | |
| 3DMark Fire Strike Score | 22371 Punkte | |
| 3DMark Time Spy Score | 10521 Punkte | |
Hilfe | ||
| min. | mittel | hoch | max. | |
|---|---|---|---|---|
| GTA V (2015) | 181 | 166 | 96.6 | |
| The Witcher 3 (2015) | 362.7 | 298.1 | 206.9 | 107.9 |
| Dota 2 Reborn (2015) | 156 | 141 | 141 | 135 |
| Final Fantasy XV Benchmark (2018) | 175 | 142 | 103 | |
| X-Plane 11.11 (2018) | 116 | 104 | 85.7 | |
| Strange Brigade (2018) | 399 | 279 | 225 | 194 |
Emissionen
Systemlautstärke
Befindet sich der Laptop im Leerlauf, dann stehen auch die Lüfter still. Allerdings ändert sich dies schon bei der kleinsten Beanspruchung, sodass der Laptop unter Realbedingungen nie wirklich still ist. Beim Browsen oder Videostreaming messen wir eine Lautstärke von 32,8 dB(A), bei einer Hintergrundlautstärke von 24,7 dB(A). Das ist bereits deutlich wahrnehmbar, aber noch nicht nervend.
Beim Gaming bewegt sich der Pegel um die 48,8 dB(A) herum, ohne störendes Pulsieren oder Ähnliches. Das ist etwas leiser als das alte GP65, aber auf einem Niveau mit den aktuellen Alienware m15 R4, Aorus 15P oder Asus ROG Zephyrus G15, welche jeweils auch über RTX-30-GPUs verfügen.
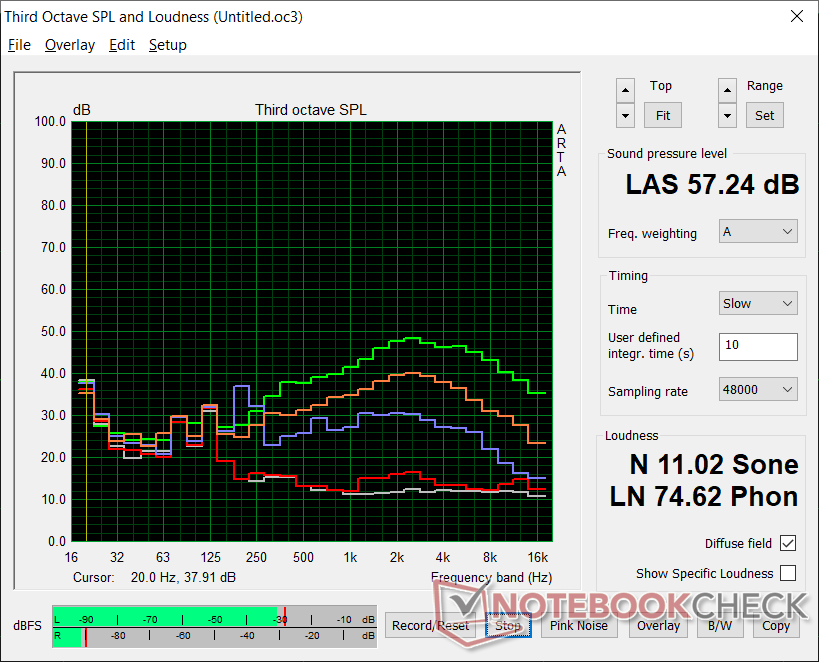
Wird Cooler Boost (bedeutet maximaler Lüftermodus) aktiviert, so geht die Geräuschkulisse augenblicklich auf 57,2 dB(A) hoch und zwar unabhängig von der anliegenden Last. Das bedeutet einen massiven Anstieg der Lautstärke für nicht allzu viel Leistungsgewinn. In unserem Abschnitt zum Stress-Test wird dies im Detail dargestellt.
Unsere Testeinheit produziert ein leichtes Spulenfiepen bei 26,8 dB(A), bei einer Hintergrundlautstärke von 24,7 dB(A).
| MSI GP66 Leopard 10UG GeForce RTX 3070 Laptop GPU, i7-10870H, Kingston OM8PCP31024F | MSI GP65 10SFK-047US GeForce RTX 2070 Mobile, i7-10750H, Samsung SSD PM981 MZVLB1T0HALR | Alienware m15 R4 GeForce RTX 3070 Laptop GPU, i9-10980HK, Micron 2300 1TB MTFDHBA1T0TDV | Aorus 15P XC GeForce RTX 3070 Laptop GPU, i7-10870H, ESR512GTLCG-EAC-4 | Asus ROG Zephyrus G15 GA503Q GeForce RTX 3080 Laptop GPU, R9 5900HS, SK Hynix HFM001TD3JX013N | MSI GF65 Thin 10UE GeForce RTX 3060 Laptop GPU, i7-10750H, Samsung SSD PM981 MZVLB1T0HALR | |
|---|---|---|---|---|---|---|
| Geräuschentwicklung | -15% | -4% | -4% | -4% | -9% | |
| aus / Umgebung * (dB) | 24.7 | 29.3 -19% | 24 3% | 24 3% | 25 -1% | 24.7 -0% |
| Idle min * (dB) | 26.8 | 31.9 -19% | 25 7% | 25 7% | 26 3% | 33.1 -24% |
| Idle avg * (dB) | 26.8 | 31.9 -19% | 26 3% | 29 -8% | 27 -1% | 33.1 -24% |
| Idle max * (dB) | 26.8 | 33.5 -25% | 37 -38% | 34 -27% | 31 -16% | 33.1 -24% |
| Last avg * (dB) | 40.4 | 47 -16% | 48 -19% | 44 -9% | 49 -21% | 42.7 -6% |
| Witcher 3 ultra * (dB) | 48.8 | 53.8 -10% | 47 4% | 49 -0% | 49 -0% | 40.6 17% |
| Last max * (dB) | 57.2 | 56.7 1% | 49 14% | 53 7% | 51 11% | 59.4 -4% |
* ... kleinere Werte sind besser
Lautstärkediagramm
| Idle |
| 26.8 / 26.8 / 26.8 dB(A) |
| Last |
| 40.4 / 57.2 dB(A) |
 | ||
30 dB leise 40 dB(A) deutlich hörbar 50 dB(A) störend |
||
min: | ||
Temperatur
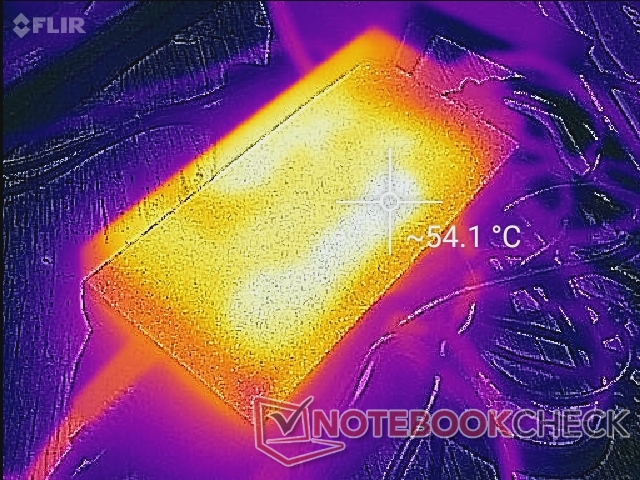
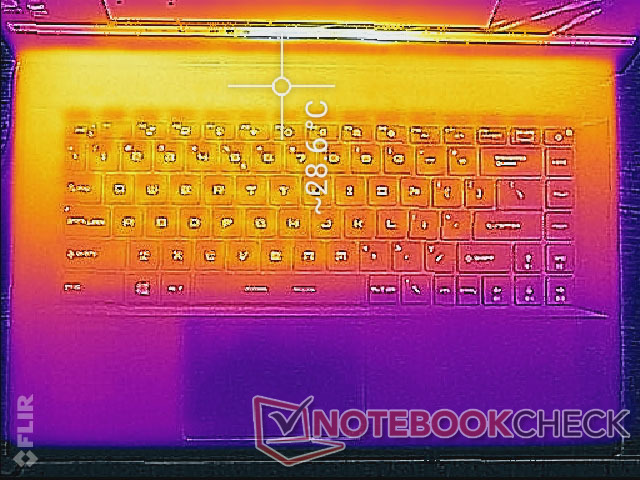
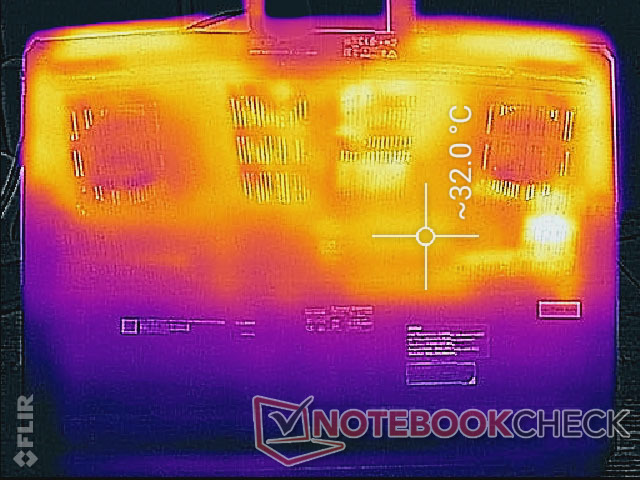
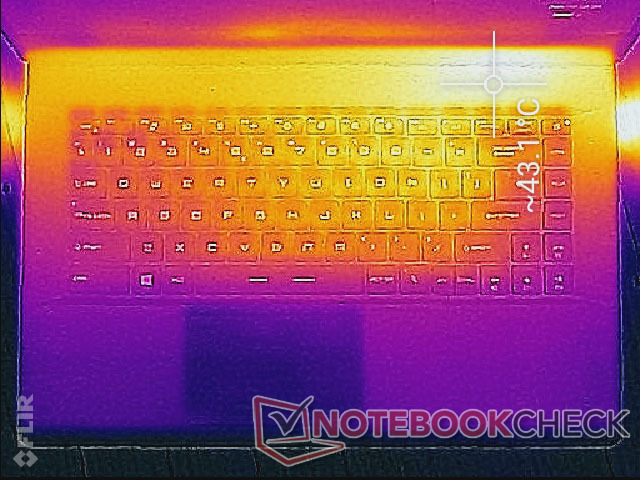
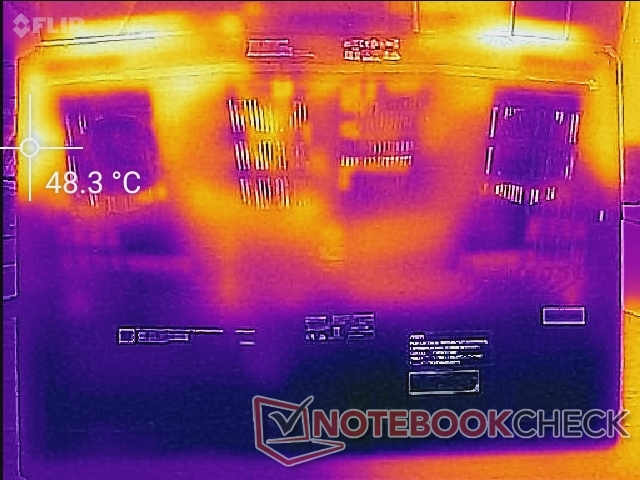
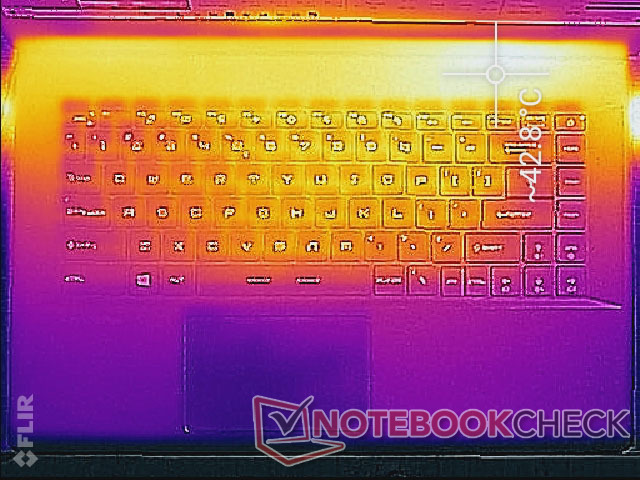
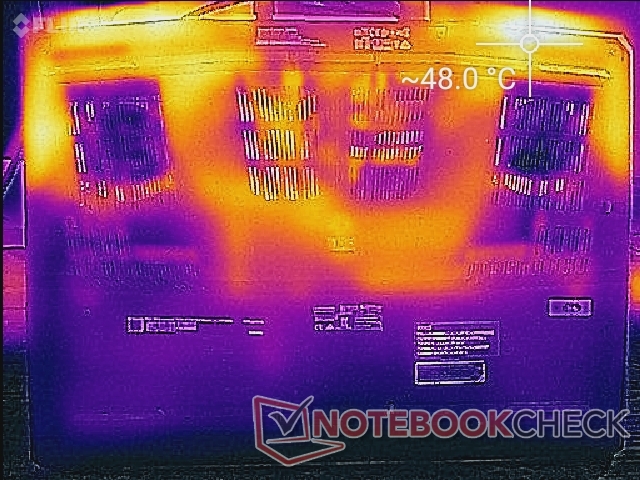
Die Oberflächentemperaturen sind etwas niedriger als beim GP65. Beim Gaming erreichen die Hotspots am GP66 zwischen 43 (oben) und 48 °C (unten), verglichen mit den 46 und 50 °C beim GP65. Zudem liegen die Hotspots nun oberhalb der ersten Tastaturreihe, was für ein angenehmeres Schreiben sorgt, beim GP65 und selbst beim GS66 liegen die Hotspots näher an der Tastaturmitte.
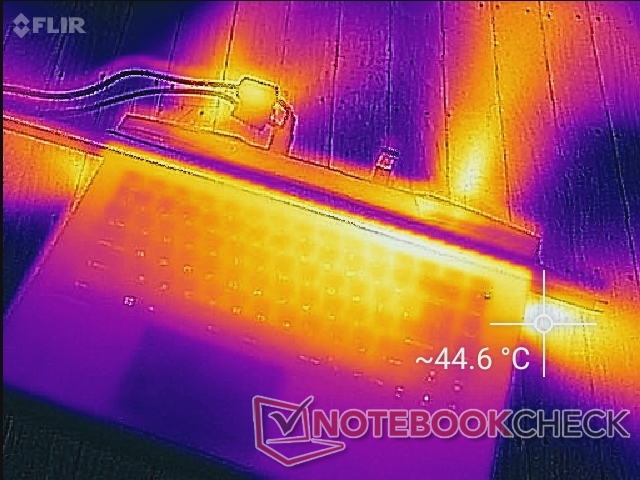
(±) Die maximale Temperatur auf der Oberseite ist 42.8 °C. Im Vergleich liegt der Klassendurchschnitt bei 40.4 °C (von 21.2 bis 68.8 °C für die Klasse Gaming).
(-) Auf der Unterseite messen wir eine maximalen Wert von 50 °C (im Vergleich zum Durchschnitt von 43.2 °C).
(+) Ohne Last messen wir eine durchschnittliche Temperatur von 29.4 °C auf der Oberseite. Der Klassendurchschnitt erreicht 33.9 °C.
(±) Beim längeren Spielen von The Witcher 3 erhitzt sich das Gerät durchschnittlich auf 33.4 °C. Der Durchschnitt der Klasse ist derzeit 33.9 °C.
(+) Die Handballen und der Touchpad-Bereich sind mit gemessenen 25.8 °C kühler als die typische Hauttemperatur und fühlen sich dadurch kühl an.
(+) Die durchschnittliche Handballen-Temperatur anderer getesteter Geräte war 28.8 °C (+3 °C).
Stresstest
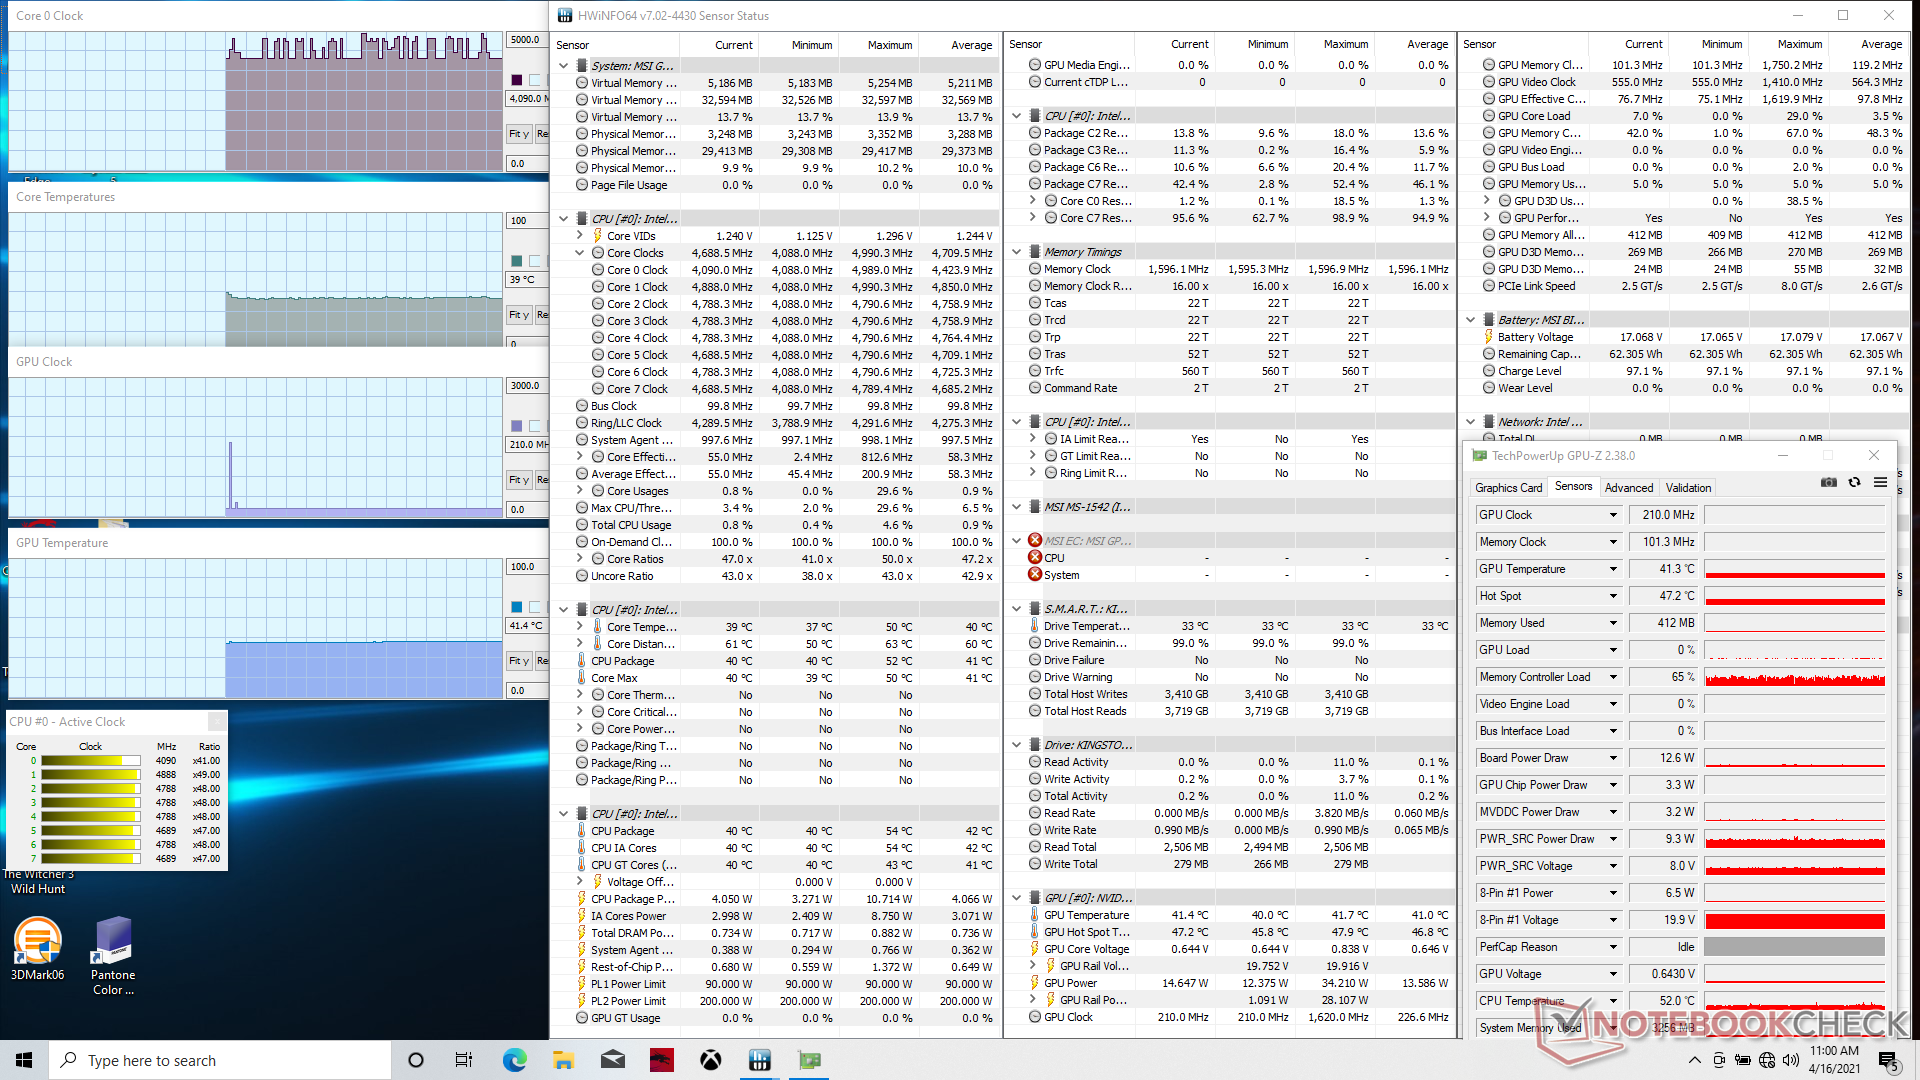
Beim CPU-Stresstest via Prime95 takten die Kerne auf 4 GHz hoch, bis sie etwa 20 Sekunden später Kerntemperaturen von 88 °C erreichen. Danach fallen die Taktraten und stabilisieren sich letztendlich zwischen 3,2 bis 3,4 GHz, um etwas geringere Kerntemperaturen von um die 85 °C zu gewährleisten. Cooler Boost verändert die Taktraten und Kerntemperaturen nur minimal.
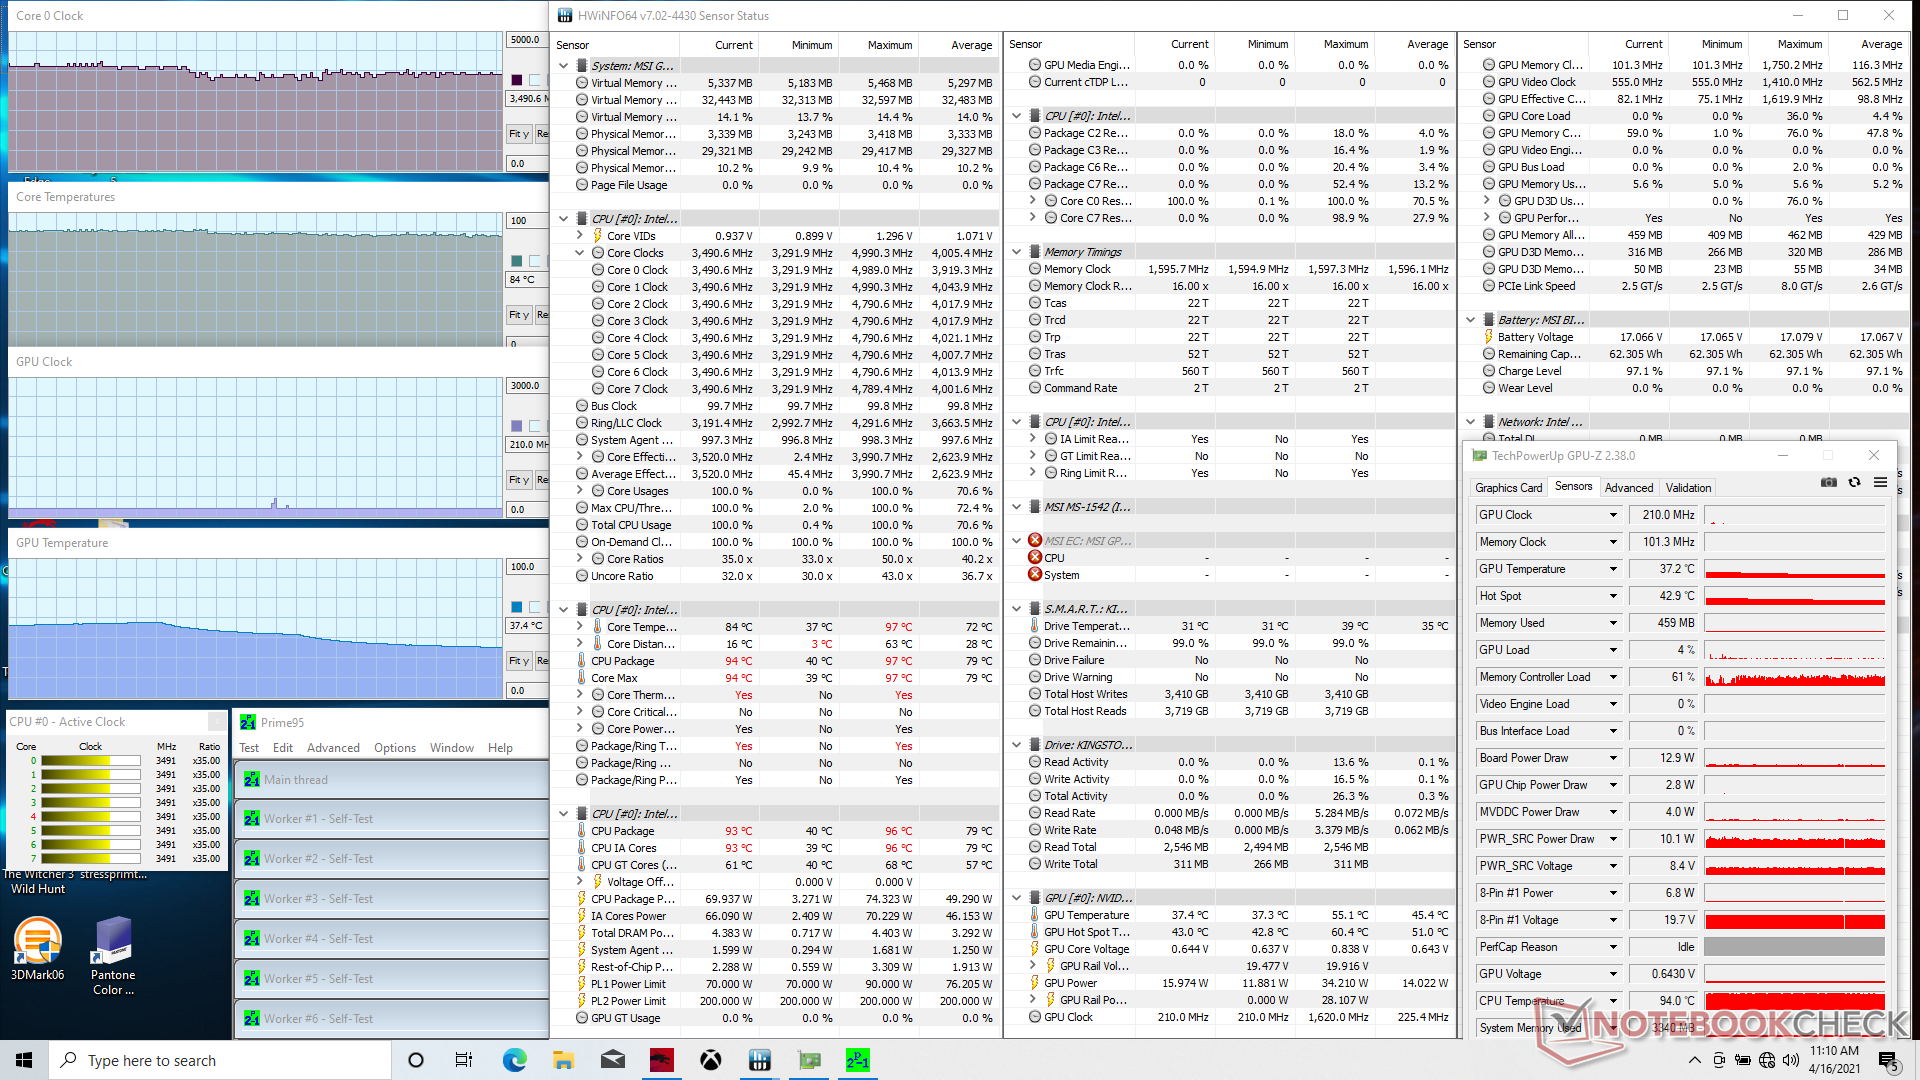
Lassen wir Prime95 und FurMark gleichzeitig laufen, dann stabilisieren sich die CPU und die GPU bei 82 bzw. 70 °C. Aktiviert man den Cooler Boost, dann sinken die Kerntemperaturen jeweils um etwa 8 °C.
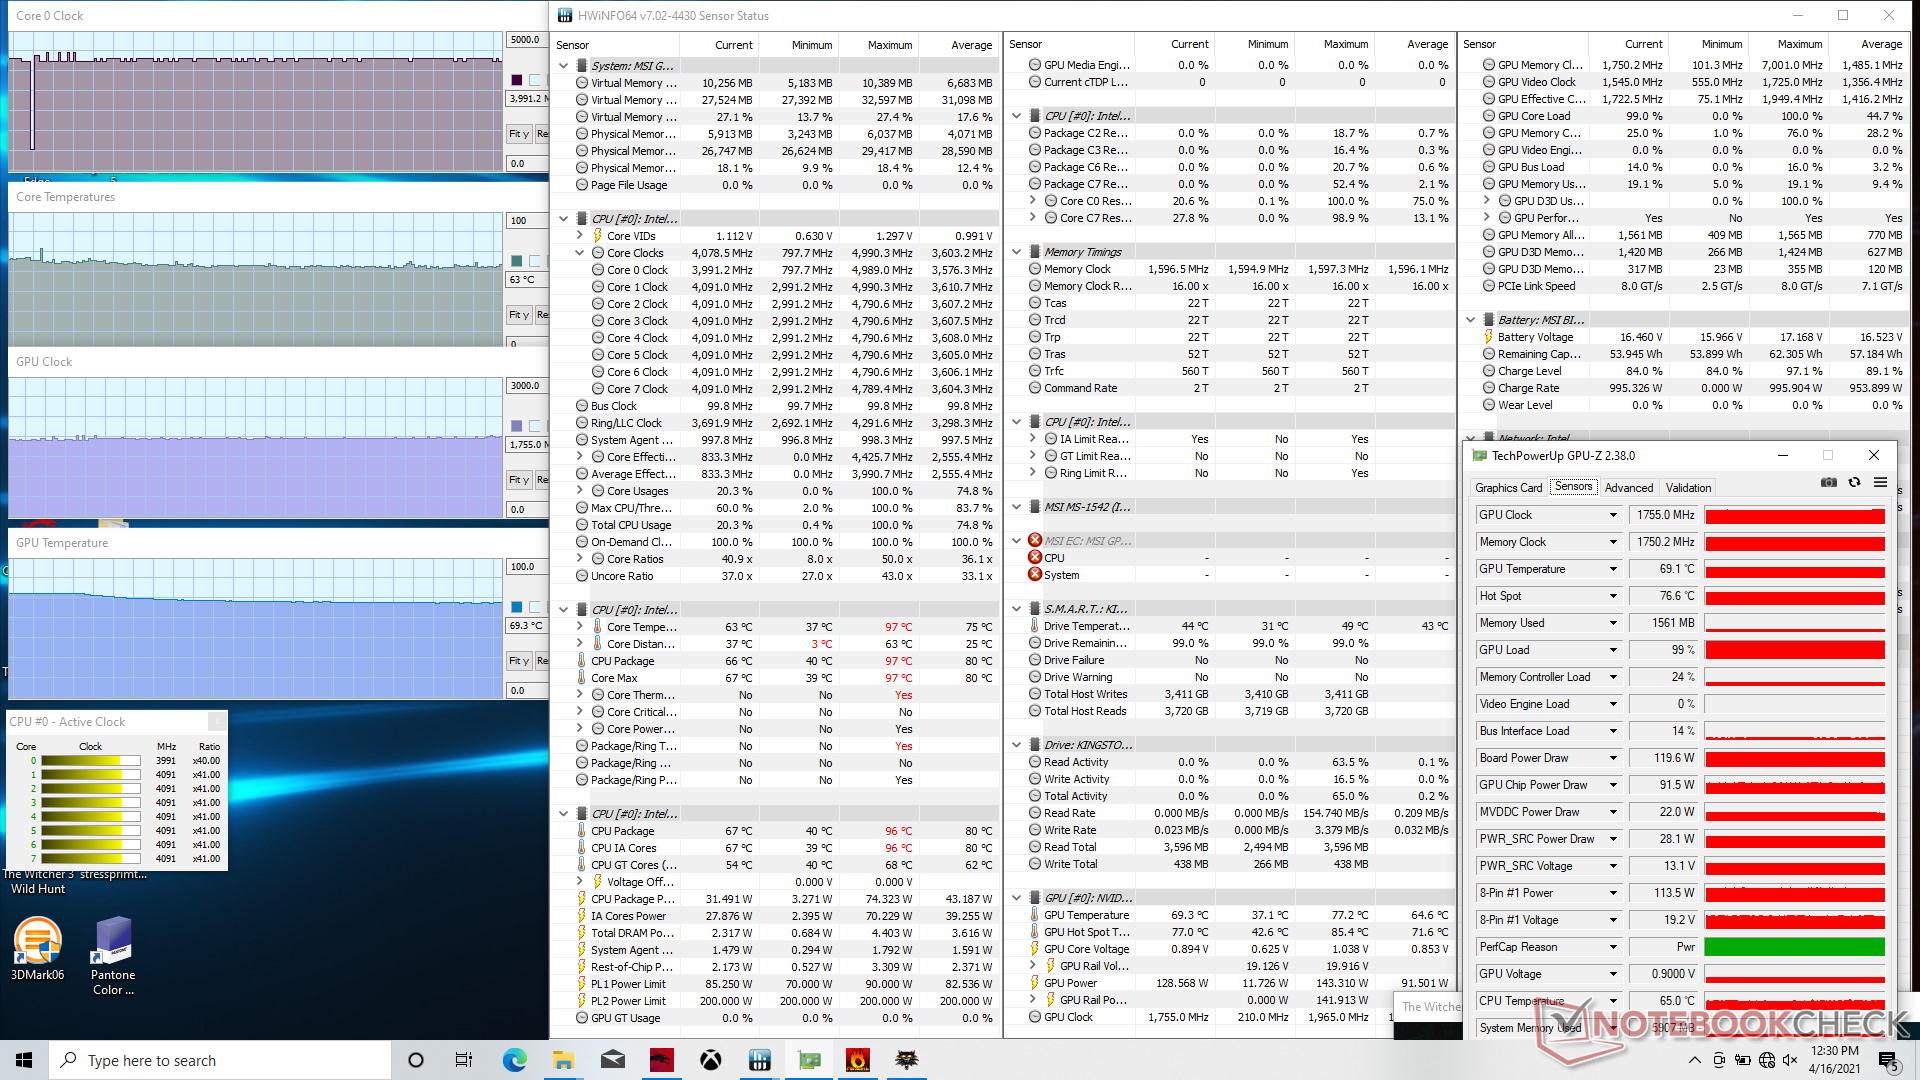
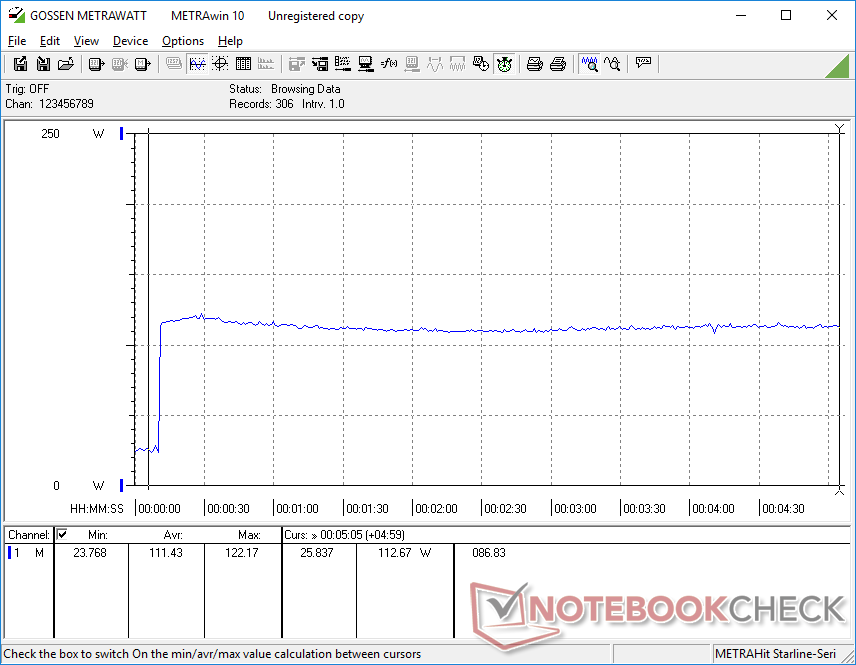
Unter Witcher 3 liegen die stabilen Kerntemperaturen zwischen 67 und 76 °C, mit aktiviertem Cooler Boost zwischen 63 und 69 °C. Die GPU-Taktrate erhöht sich leicht von 1.680 MHz auf 1.755 MHz, außerdem zieht das Board dann 130 statt 120 W aus dem Netzteil, genau wie es der Hersteller auch bewirbt. Im gleichen Test kommt das ältere GP65 auf heißere CPU- und GPU-Temperaturen von 96 und 79 °C.
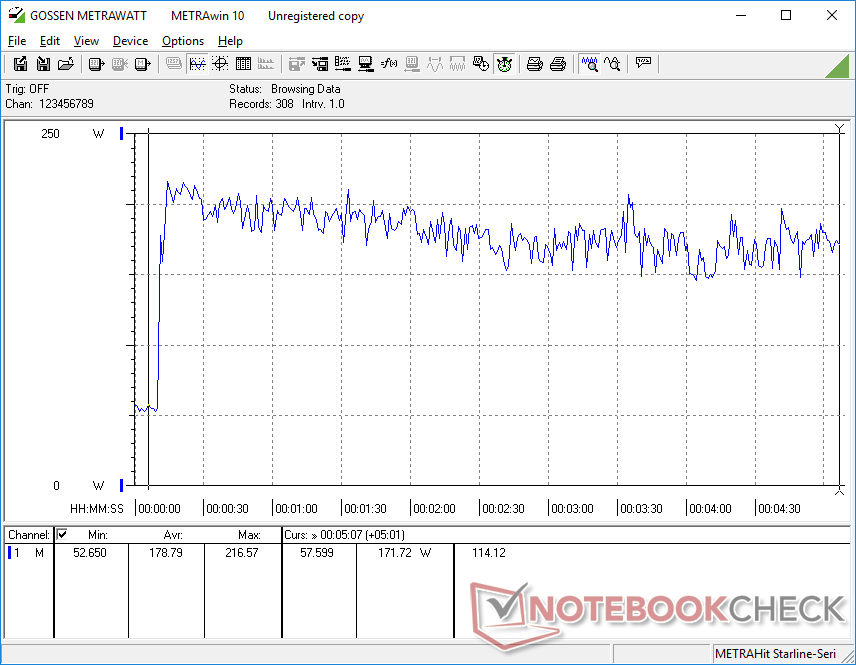
Abseits der Steckdose verliert das GP66 heftig an Leistung. Ein erneuter Fire-Strike-Durchlauf im Akkumodus generiert Physics- und Graphics-Scores von 12.004 und 6.385 Punkten gegenüber den 20.842 und 28.490 Punkten an der Steckdose.


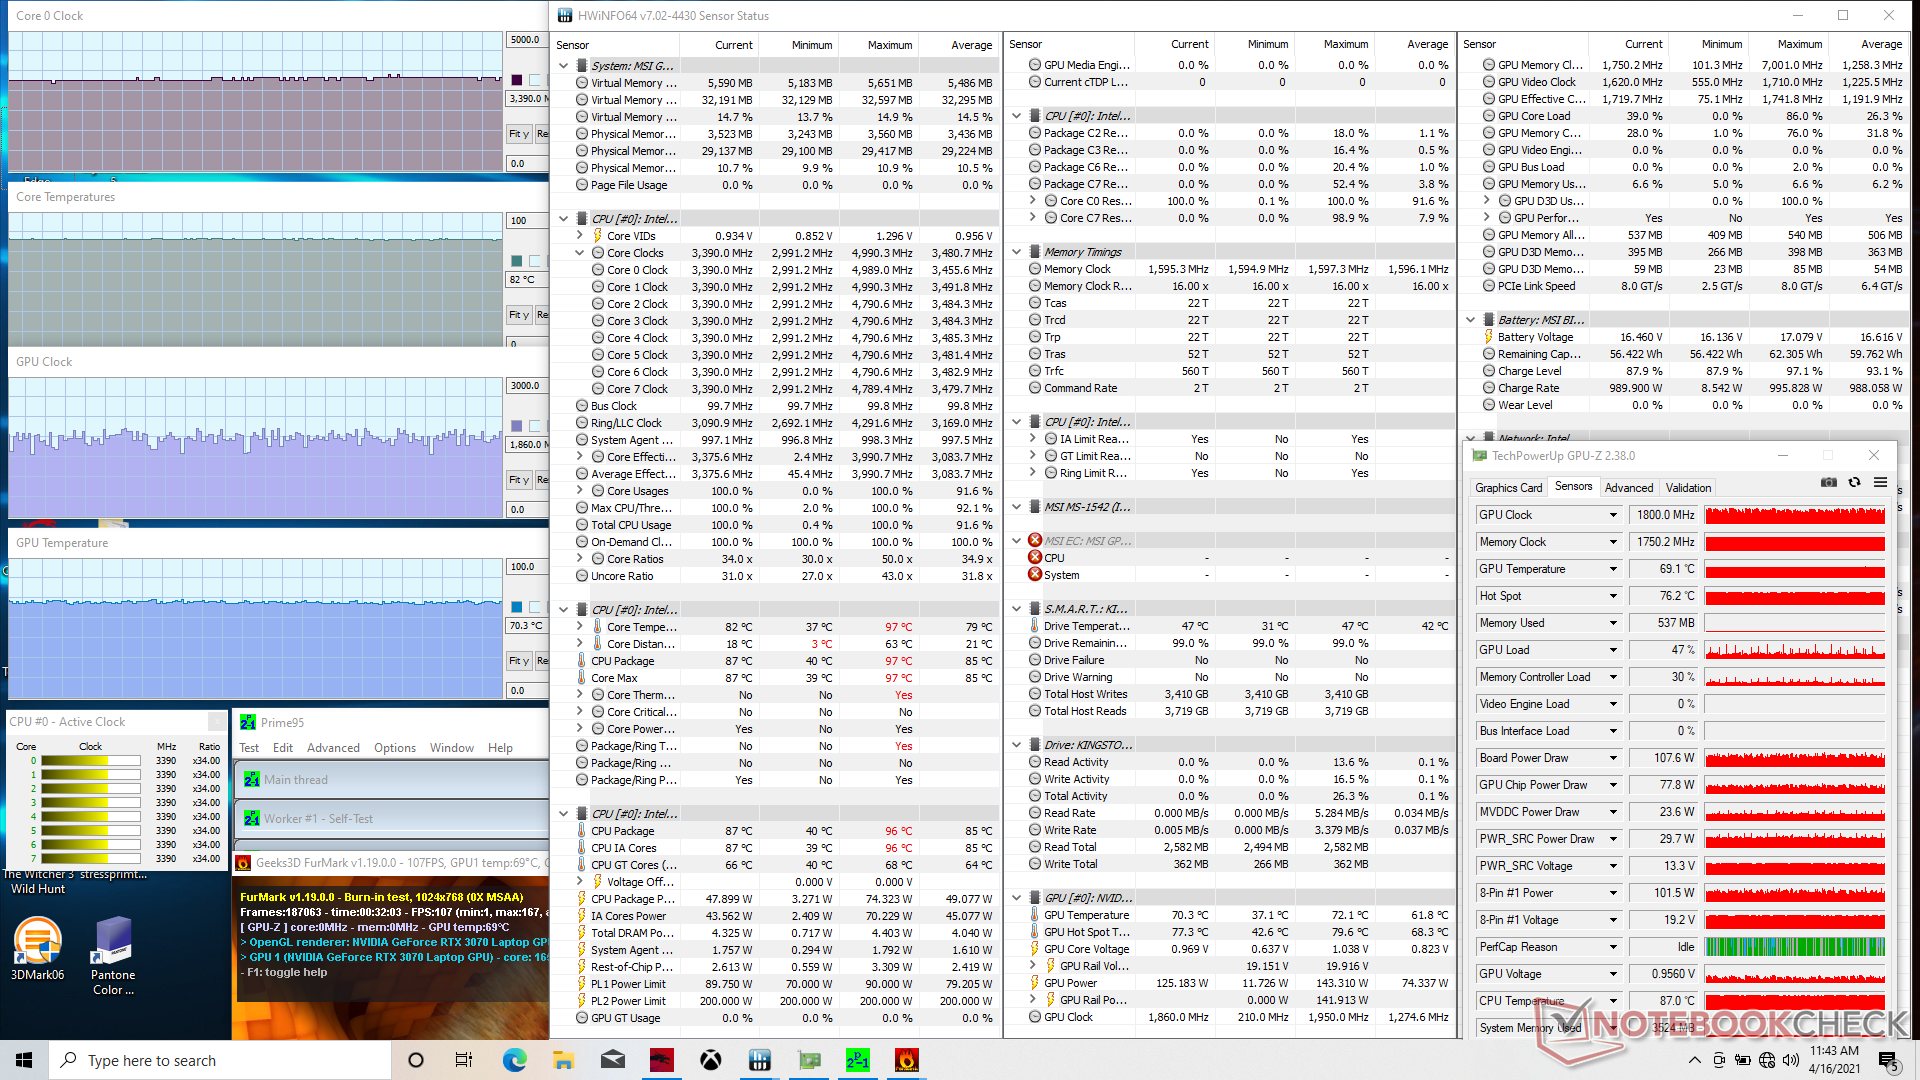
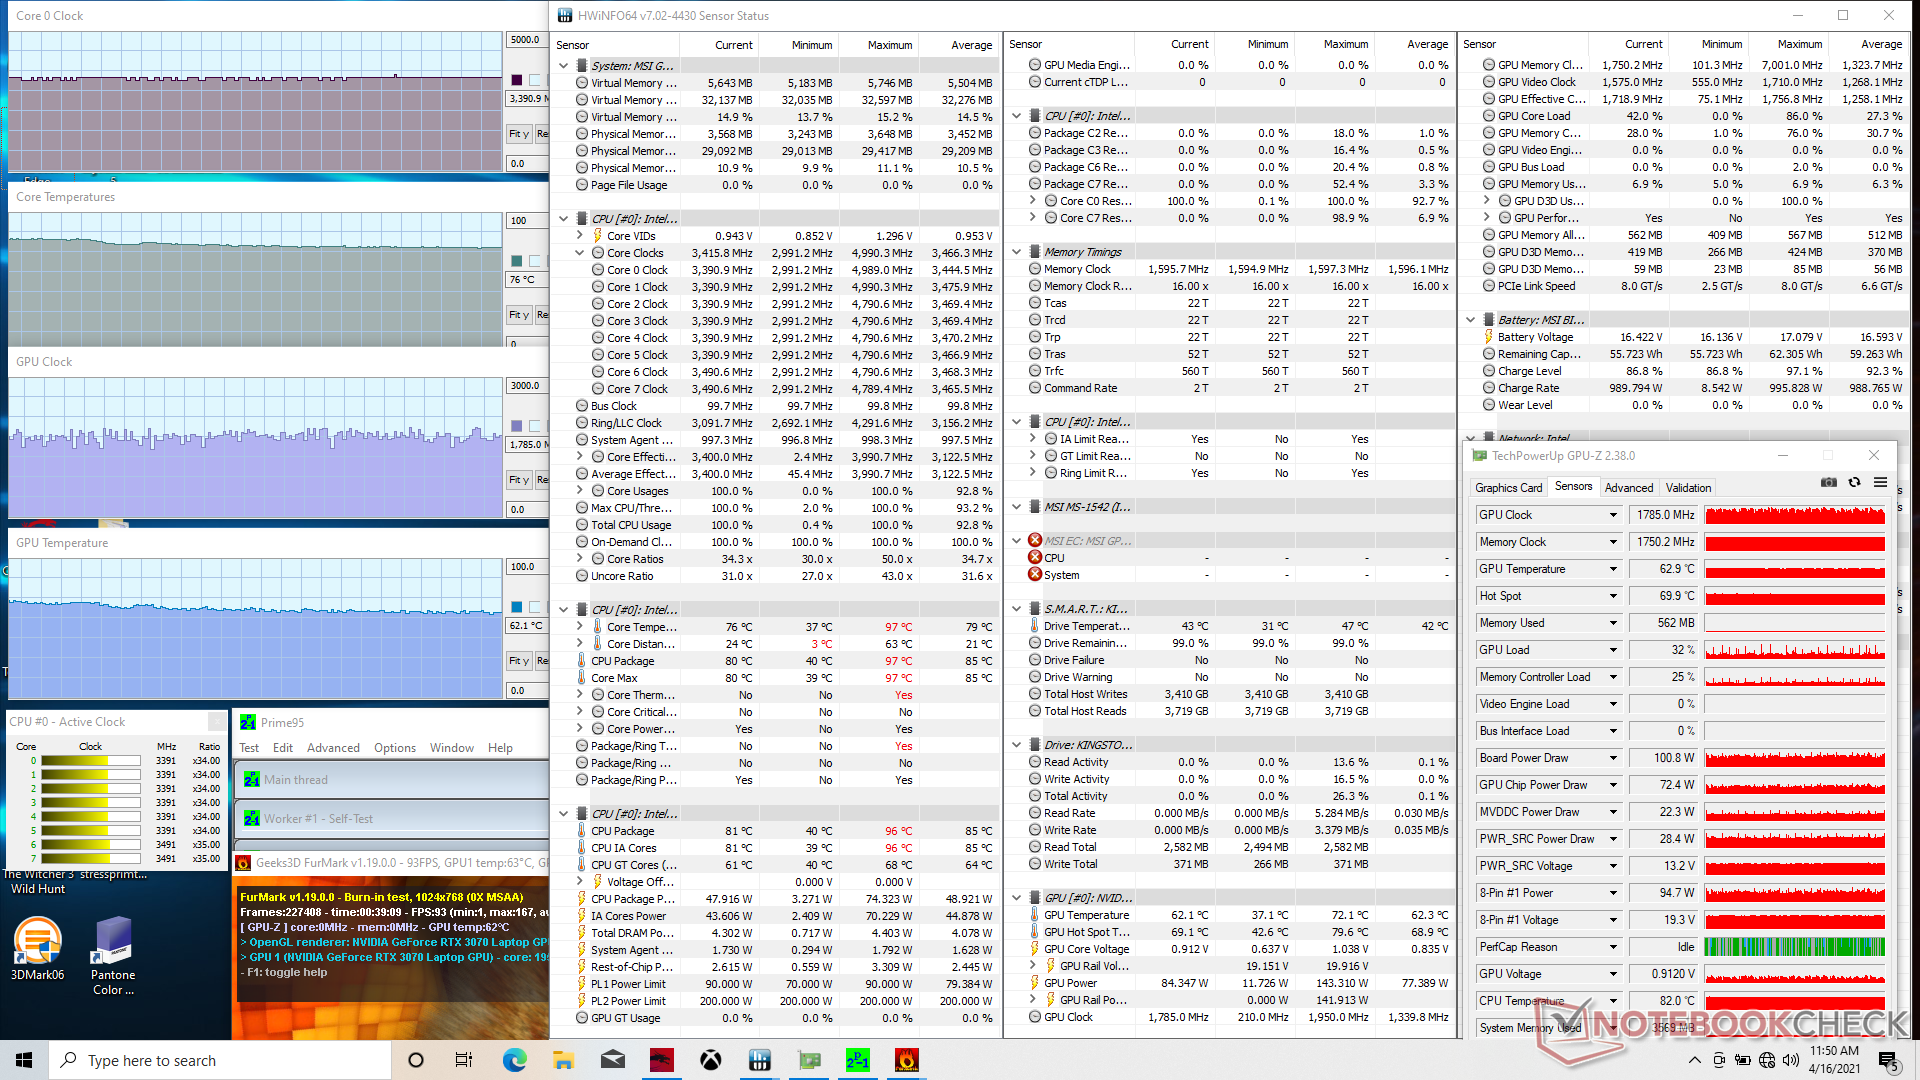
| CPU Clock (GHz) | GPU Clock (MHz) | Average CPU Temperature (°C) | Average GPU Temperature (°C) | |
| System Idle | -- | -- | 39 | 41 |
| Prime95 Stress (Cooler Boost off) | 3.2 - 3.4 | -- | 85 | 47 |
| Prime95 Stress (Cooler Boost on) | 3.3 - 3.5 | -- | 84 | 37 |
| Prime95 + FurMark Stress (Cooler Boost off) | 3.3 - 3.4 | ~1800 | 82 | 70 |
| Prime95 + FurMark Stress (Cooler Boost on) | 3.4 | ~1800 | 76 | 62 |
| Witcher 3 Stress (Cooler Boost off) | 4.0 | 1680 | 67 | 76 |
| Witcher 3 Stress (Cooler Boost on) | 4.0 | 1755 | 63 | 69 |
Lautsprecher


MSI GP66 Leopard 10UG Audio Analyse
(±) | Mittelmäßig laut spielende Lautsprecher (81.3 dB)
Bass 100 - 315 Hz
(-) | kaum Bass - 18.4% niedriger als der Median
(±) | durchschnittlich lineare Bass-Wiedergabe (11% Delta zum Vorgänger)
Mitteltöne 400 - 2000 Hz
(±) | zu hohe Mitten, vom Median 5.1% abweichend
(+) | lineare Mitten (4.6% Delta zum Vorgänger)
Hochtöne 2 - 16 kHz
(±) | zu hohe Hochtöne, vom Median nur 5.9% abweichend
(±) | durchschnittlich lineare Hochtöne (9.2% Delta zum Vorgänger)
Gesamt im hörbaren Bereich 100 - 16.000 Hz
(±) | hörbarer Bereich ist durchschnittlich linear (19.3% Abstand zum Median)
Im Vergleich zu allen Geräten derselben Klasse
» 65% aller getesteten Geräte dieser Klasse waren besser, 8% vergleichbar, 27% schlechter
» Das beste Gerät hat einen Delta-Wert von 6%, durchschnittlich ist 18%, das schlechteste Gerät hat 132%
Im Vergleich zu allen Geräten im Test
» 47% aller getesteten Geräte waren besser, 8% vergleichbar, 46% schlechter
» Das beste Gerät hat einen Delta-Wert von 4%, durchschnittlich ist 24%, das schlechteste Gerät hat 134%
Apple MacBook 12 (Early 2016) 1.1 GHz Audio Analyse
(+) | Die Lautsprecher können relativ laut spielen (83.6 dB)
Bass 100 - 315 Hz
(±) | abgesenkter Bass - 11.3% geringer als der Median
(±) | durchschnittlich lineare Bass-Wiedergabe (14.2% Delta zum Vorgänger)
Mitteltöne 400 - 2000 Hz
(+) | ausgeglichene Mitten, vom Median nur 2.4% abweichend
(+) | lineare Mitten (5.5% Delta zum Vorgänger)
Hochtöne 2 - 16 kHz
(+) | ausgeglichene Hochtöne, vom Median nur 2% abweichend
(+) | sehr lineare Hochtöne (4.5% Delta zum Vorgänger)
Gesamt im hörbaren Bereich 100 - 16.000 Hz
(+) | hörbarer Bereich ist sehr linear (10.2% Abstand zum Median
Im Vergleich zu allen Geräten derselben Klasse
» 7% aller getesteten Geräte dieser Klasse waren besser, 2% vergleichbar, 91% schlechter
» Das beste Gerät hat einen Delta-Wert von 5%, durchschnittlich ist 18%, das schlechteste Gerät hat 53%
Im Vergleich zu allen Geräten im Test
» 5% aller getesteten Geräte waren besser, 1% vergleichbar, 94% schlechter
» Das beste Gerät hat einen Delta-Wert von 4%, durchschnittlich ist 24%, das schlechteste Gerät hat 134%
Energiemanagement
Energieverbrauch
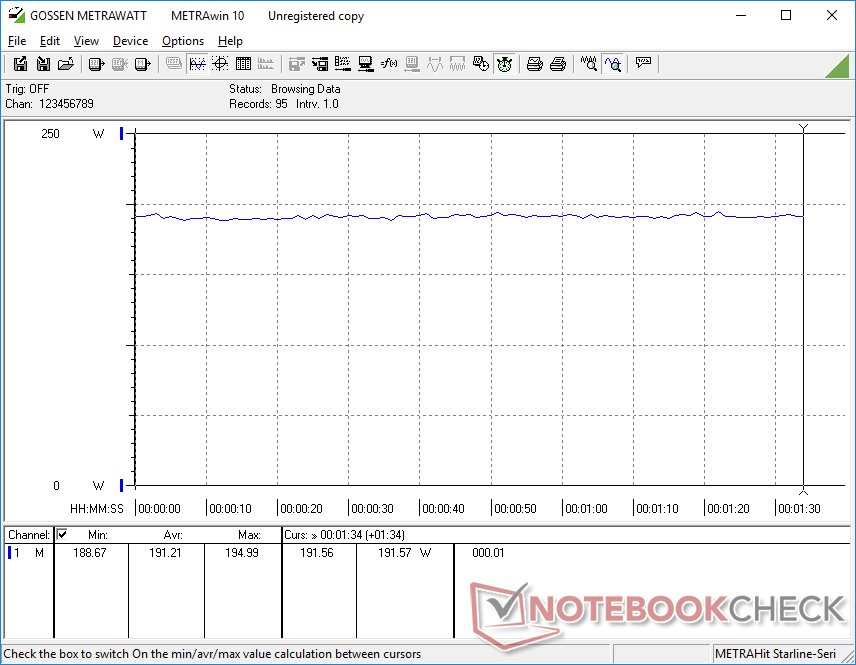
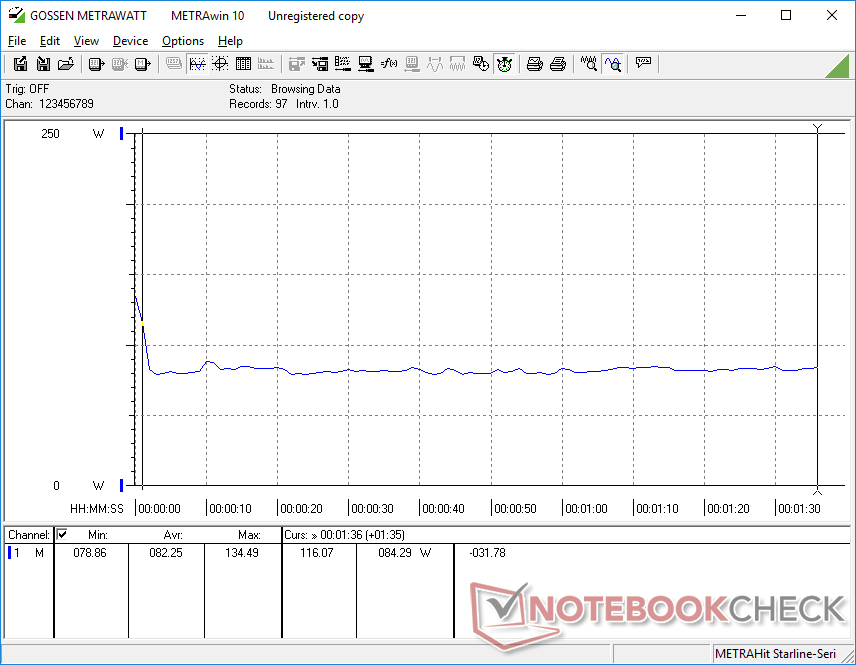
Der allgemeine Stromverbrauch liegt näher am GP65 als wir erwartet haben. Beispielsweise verbraucht der Leerlauf zwischen 13 und 23 W und damit quasi genauso viel wie beim GP65. Witcher 3 genehmigt sich durchschnittlich 191 W und damit nur 3 Prozent mehr als beim GP65, dabei ist die Grafikleistung zwischen 40 und 45 Prozent höher. Der Gen-zu-Gen-Vergleich ist in Sachen Performance-pro-Watt also sehr beeindruckend.
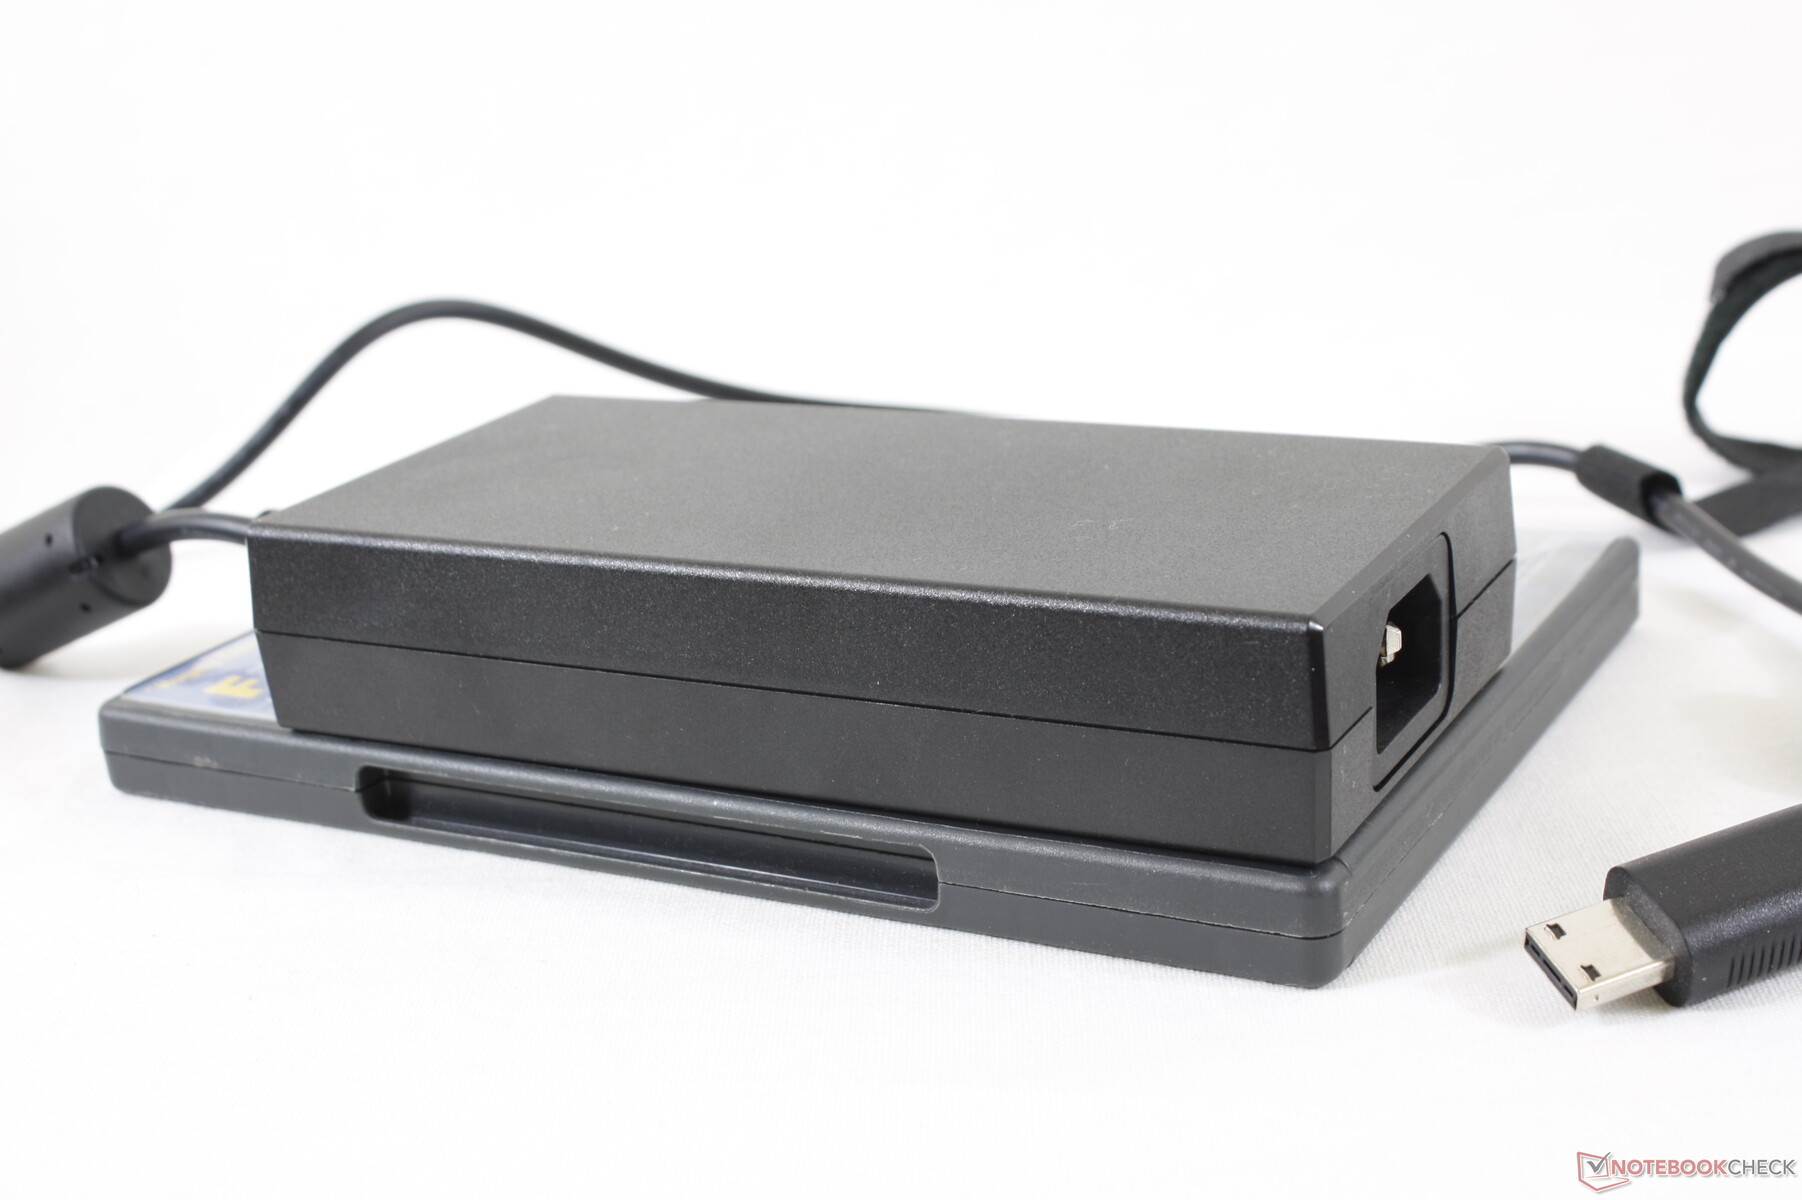
Wir messen einen Maximalverbrauch von 216 W, welchen das mittelgroße Netzteil (~15,3 x 7,3 x 3,0 cm) mit seinen 230 W gut auffangen kann.
| Aus / Standby | |
| Idle | |
| Last |
|
Legende:
min: | |
| MSI GP66 Leopard 10UG i7-10870H, GeForce RTX 3070 Laptop GPU, Kingston OM8PCP31024F, IPS, 1920x1080, 15.6" | MSI GP65 10SFK-047US i7-10750H, GeForce RTX 2070 Mobile, Samsung SSD PM981 MZVLB1T0HALR, IPS, 1920x1080, 15.6" | Alienware m15 R4 i9-10980HK, GeForce RTX 3070 Laptop GPU, Micron 2300 1TB MTFDHBA1T0TDV, IPS, 1920x1080, 15.6" | Aorus 15P XC i7-10870H, GeForce RTX 3070 Laptop GPU, ESR512GTLCG-EAC-4, IPS, 1920x1080, 15.6" | Asus ROG Zephyrus G15 GA503Q R9 5900HS, GeForce RTX 3080 Laptop GPU, SK Hynix HFM001TD3JX013N, IPS-Level, 2560x1440, 15.6" | MSI GF65 Thin 10UE i7-10750H, GeForce RTX 3060 Laptop GPU, Samsung SSD PM981 MZVLB1T0HALR, IPS, 1920x1080, 15.6" | |
|---|---|---|---|---|---|---|
| Stromverbrauch | -2% | -68% | -8% | 21% | 29% | |
| Idle min * (Watt) | 15.3 | 14.2 7% | 35 -129% | 14 8% | 10 35% | 5.4 65% |
| Idle avg * (Watt) | 21.2 | 18.8 11% | 39 -84% | 17 20% | 12 43% | 12.8 40% |
| Idle max * (Watt) | 22.3 | 23.9 -7% | 48 -115% | 33 -48% | 17 24% | 19.5 13% |
| Last avg * (Watt) | 82.3 | 96.9 -18% | 135 -64% | 96 -17% | 108 -31% | 86.6 -5% |
| Witcher 3 ultra * (Watt) | 191.2 | 185 3% | 194 -1% | 179 6% | 123 36% | 115.7 39% |
| Last max * (Watt) | 216.6 | 233.4 -8% | 252 -16% | 256 -18% | 182 16% | 175.2 19% |
* ... kleinere Werte sind besser
Akkulaufzeit
Die Akkukapazität hat sich von 51 Wh im GP65 auf 65 Wh im GP66 erhöht. Die WLAN-Laufzeiten liegen jetzt mit über 5 Stunden fast 1,5 Stunden über denen des GP65.
Allerdings könnte die maximale Laufzeit besser sein. Selbst im Super-Battery-Modus, aktivierter iGPU und einer minimierten Helligkeit hält das System mit 6,5 Stunden nicht wesentlich länger durch als im Wlan-Test.
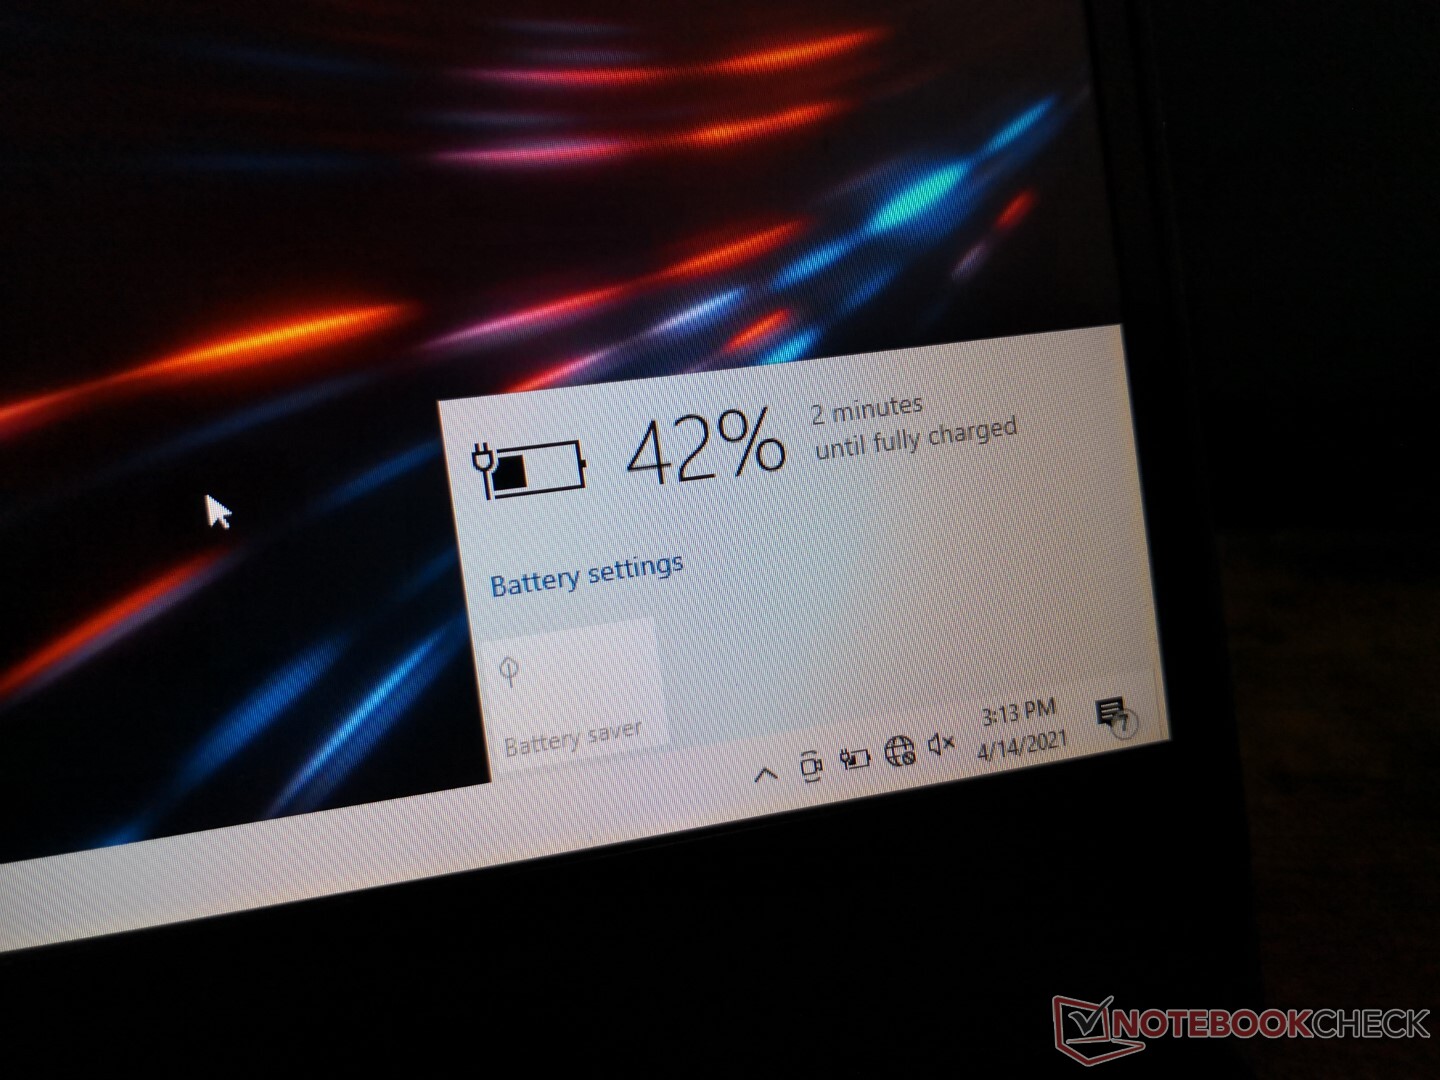
Ein komplettes Aufladen des Akkus ist recht langsam und dauert ganze 4 Stunden. Da die meisten anderen Laptops in 1,5 bis 2 Stunden wieder voll geladen sind, gehen wir von einem Ladebug aus, da auch die geschätzten Ladezeiten gelegentlich nicht korrekt sind.
Beim Gaming wird der Akku noch langsamer oder erst gar nicht geladen. Beispielsweise erhöhte sich die Akkukapazität beim Spielen von Witcher 3 innerhalb einer ganzen Stunde nur von 20 auf 23 Prozent, also nur um 3 Prozent innerhalb im Verlauf einer Stunde.
| MSI GP66 Leopard 10UG i7-10870H, GeForce RTX 3070 Laptop GPU, 65 Wh | MSI GP65 10SFK-047US i7-10750H, GeForce RTX 2070 Mobile, 51 Wh | Alienware m15 R4 i9-10980HK, GeForce RTX 3070 Laptop GPU, 86 Wh | Aorus 15P XC i7-10870H, GeForce RTX 3070 Laptop GPU, 99 Wh | Asus ROG Zephyrus G15 GA503Q R9 5900HS, GeForce RTX 3080 Laptop GPU, 90 Wh | MSI GF65 Thin 10UE i7-10750H, GeForce RTX 3060 Laptop GPU, 51 Wh | |
|---|---|---|---|---|---|---|
| Akkulaufzeit | -27% | -34% | 42% | 72% | 23% | |
| Idle (h) | 6.6 | 3.7 -44% | 9.5 44% | 12.1 83% | 11.1 68% | |
| WLAN (h) | 5.1 | 3.7 -27% | 2.7 -47% | 6.7 31% | 9.4 84% | 4.6 -10% |
| Last (h) | 1 | 0.9 -10% | 1.5 50% | 1.5 50% | 1.1 10% |
Pro
Contra
Fazit
Nach zwei Jahren mit dem GP65 -Design ist das GP66 komplett überarbeitet worden und wurde an vielen Stellen verbessert. Es mag etwas größer geworden sein (in der Tiefe), aber das fühlt sich mit Blick auf den Sprung in der Grafikleistung, den Verbesserungen bei der Lüfterlautstärke, den niedrigeren Temperaturen, dem schnittigeren Design und der längeren Akkulaufzeit gerechtfertigt an. Der allgemeine Eindruck ist beinahe auf dem Level des GE66, welcher eigentlich das "Higher-End"-Modell darstellt.
Das GP66 ragt aus seinem Mittelklassesegment heraus und ist damit beinahe so gut wie viele "Higher-End" -Modelle.
Auf dem Attribut "Mittelklasse" prangt derzeit aber noch ein großes "Aber", denn das GP66 ist derzeit keineswegs so preiswert, wie es die eigene Klassifizierung eigentlich vorschreibt. Die Preise rangieren je nach Konfiguration zwischen $2500 und $3000 USD (2.600 bis 3100 Euro), womit wir dann doch im High-End-Bereich oder gar bei den Enthusiasten wären. Wir hoffen stark, dass dies nur dem allgemeinen Lieferengpass zuzuschreiben ist und sich diese Situation bald ändert, da wir für das GP66 durch seine insgesamt überdurchschnittlichen Werte ein großes Popularitätspotential sehen.
Trotz des aktuellen High-End-Preises handelt es sich noch immer um einen Mittelklasse-Gamer, weshalb Nutzer auch mit einigen Nachteilen leben müssen. Es gibt kein Thunderbolt, keine IR-Kamera, auch keinen SD-Reader und das Display ist dunkler als das der meisten Konkurrenten. Das langsame Aufladen und die inkonsistente Aufladungsrate des Akkus sind definitiv einen Blick seitens des Herstellers wert. Bis dahin sollte man nicht mit einem wesentlichen Aufladen des Akkus beim Gaming rechnen.
Preise und Verfügbarkeit
In Deutschland ist die Situation derzeit etwas anders. Das Modell mit RTX 3070 ist derzeit nur mit dem etwas schwächeren Prozessor i7-10750H erhältlich und auch nur mit 512 GB Hauptspeicher (ca. 1.700 Euro auf Amazon). Die Version mit i7-10870 kommt nur mit einer RTX 3060 daher (ebenfalls 1.700 Euro auf Amazon). Die übrigen Konfigurationen werden wohl erst nach und nach bei uns eintreffen. Auch bei Notebooksbilliger ist das Modell mit RTX 3060 und i7-10750H für etwa 1.737 Euro erhältlich.
MSI GP66 Leopard 10UG
- 18.04.2021 v7 (old)
Allen Ngo
Preisvergleich

