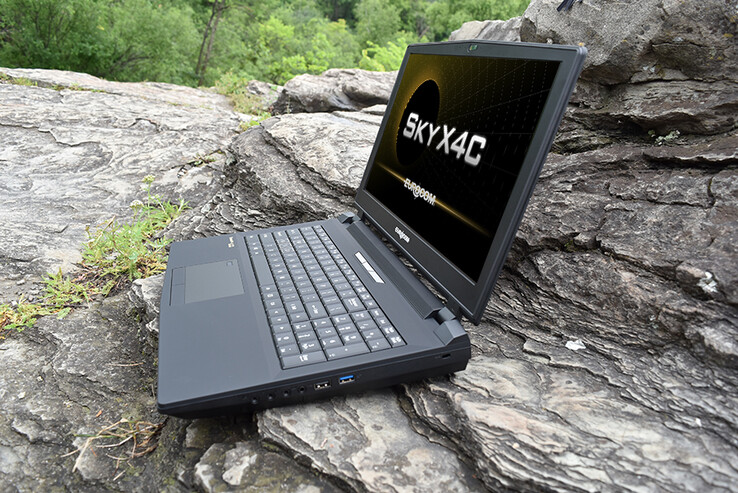
Test Eurocom Sky X4C Core i9-9900KS Laptop: Entsperrter Desktop-Prozessor zum Mitnehmen
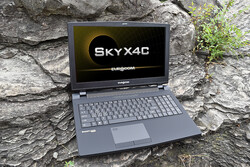
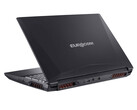
Das Eurocom Sky X4C ist ein leistungsfähiger Laptop mit guten Wartungsmöglichkeiten, der sich an anspruchsvolle Anwender richtet. Im Gegensatz zu anderen Laptops kommen hier aufrüstbare LGA-1151-Desktop-Prozessoren und MXM-Grafikkarten zum Einsatz, die Nutzern zusätzliche Flexibilität bieten.
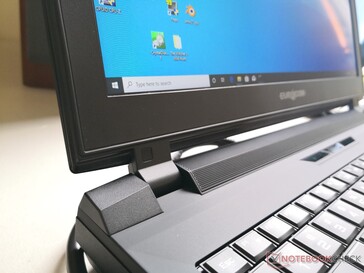
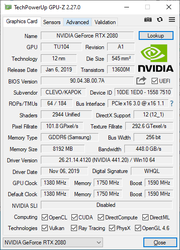
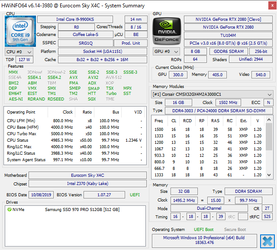
Vor fast zwei Jahren haben wir bereits eine Konfiguration des Sky X4C mit der Coffee-Lake-CPU Core i7-8700K und der Pascal-GPU GeForce GTX 1080 getestet. Unser heutiges Testgerät verfügt mit dem Coffee Lake Core i9-9900KS und der auf der Turing-Architektur basierenden GeForce RTX 2080 über neuere und schnellere Hardware. Wir empfehlen einen Blick auf unseren bestehenden Artikel zum Sky X4C (englischer Test), da alle unserer Anmerkungen zum Chassis und der Ausstattung auch hier gelten.
Weitere Eurocom-Tests:
Bew. | Datum | Modell | Gewicht | Dicke | Größe | Auflösung | Preis ab |
|---|---|---|---|---|---|---|---|
| 84.6 % v7 (old) | 11 / 2019 | Eurocom Sky X4C i9-9900KS i9-9900KS, GeForce RTX 2080 Mobile | 3.6 kg | 38 mm | 15.60" | 1920x1080 | |
| 87.3 % v6 (old) | 07 / 2018 | MSI GT63 Titan 8RG-046 i7-8750H, GeForce GTX 1080 Mobile | 2.9 kg | 40 mm | 15.60" | 1920x1080 | |
| 86.1 % v7 (old) | 05 / 2019 | MSI GE75 9SG i9-9880H, GeForce RTX 2080 Mobile | 2.7 kg | 27.5 mm | 17.30" | 1920x1080 | |
| 88.3 % v6 (old) | 03 / 2019 | Eurocom Sky X7C i9-9900K i9-9900K, GeForce RTX 2080 Mobile | 4.3 kg | 41 mm | 17.30" | 1920x1080 | |
| 85.8 % v7 (old) | 03 / 2019 | Alienware Area-51m i9-9900K RTX 2080 i9-9900K, GeForce RTX 2080 Mobile | 3.9 kg | 42 mm | 17.30" | 1920x1080 |
Gehäuse
Ausstattung
SD-Kartenleser
| SD Card Reader | |
| average JPG Copy Test (av. of 3 runs) | |
| Eurocom Sky X4C i9-9900KS (Toshiba Exceria Pro SDXC 64 GB UHS-II) | |
| Razer Blade Pro 17 4K UHD 120 Hz (Toshiba Exceria Pro SDXC 64 GB UHS-II) | |
| MSI GE63VR 7RF Raider (Toshiba Exceria Pro SDXC 64 GB UHS-II) | |
| MSI Prestige 15 A10SC (Toshiba Exceria Pro M501 UHS-II) | |
| MSI GT63 Titan 8RG-046 (Toshiba Exceria Pro SDXC 64 GB UHS-II) | |
| maximum AS SSD Seq Read Test (1GB) | |
| Eurocom Sky X4C i9-9900KS (Toshiba Exceria Pro SDXC 64 GB UHS-II) | |
| MSI GE63VR 7RF Raider (Toshiba Exceria Pro SDXC 64 GB UHS-II) | |
| Razer Blade Pro 17 4K UHD 120 Hz (Toshiba Exceria Pro SDXC 64 GB UHS-II) | |
| MSI Prestige 15 A10SC (Toshiba Exceria Pro M501 UHS-II) | |
| MSI GT63 Titan 8RG-046 (Toshiba Exceria Pro SDXC 64 GB UHS-II) | |
Kommunikation
Da es sich bei dem WLAN-6-Modul Killer AX1650x im Prinzip um ein Intel AX200/201 handelt, erreichen beide eine ähnliche Übertragungsleistung. Dafür profitiert das AX1650x von zusätzlichen, Killer spezifischen Funktionen und Einstellungen.
Garantie und Zubehör
Im Lieferumfang enthalten sind die üblichen Anleitungen, eine Treiber-CD, außerdem gibt es optionale Adapter, Docks und Netzteile. Es gilt eine einjährige, eingeschränkte Garantie, die mit Optionen auf bis zu drei Jahre erweitert werden kann.
Display
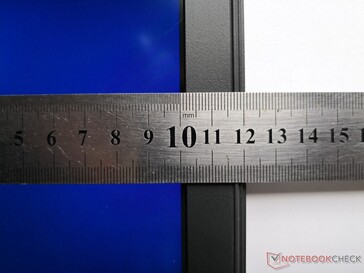
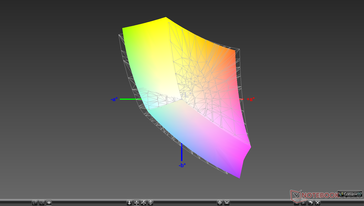
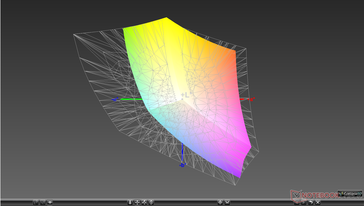
Im Gegensatz zum reflektiven 4K-UHD-60-Hz-Panel des Sky X4C 2018 kommt hier ein mattes FHD-144-Hz-Panel zum Einsatz. Das verbaute AU-Optronics-Panel B156HAN07.0 findet man auch im Schenker XMG Ultra 15 und dem Gigabyte Aorus X5 v8, weshalb Displayeigenschaften wie die schnellen Reaktionszeiten, das gute Kontrastverhältnis und die ordentliche Farbraumabdeckung bei den drei Laptops ähnlich sind. Im Vergleich zur 4K-UHD-Option tritt Ghosting bei der FHD-Option in deutlich geringerem Ausmaß auf.
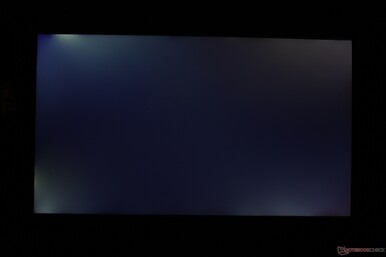
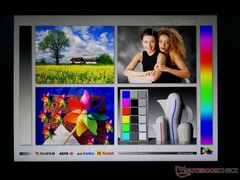
Wie die Bilder unten zeigen, leidet unser Testgerät jedoch unter stark ausgeprägten, ungleichmäßigen Lichthöfen. Wir empfehlen Käufern, dies sofort zu überprüfen, da das Backlight Bleeding während der Videowiedergabe oder in anderen abgedunkelten Anwendungen störend sein kann.
| |||||||||||||||||||||||||
Ausleuchtung: 82 %
Helligkeit Akku: 258.8 cd/m²
Kontrast: 924:1 (Schwarzwert: 0.28 cd/m²)
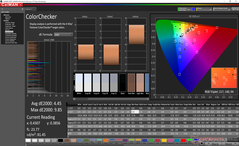
ΔE ColorChecker Calman: 4.45 | ∀{0.5-29.43 Ø4.76}
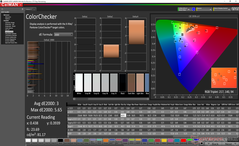
calibrated: 3
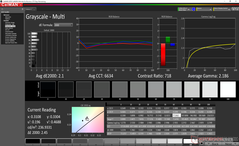
ΔE Greyscale Calman: 5.8 | ∀{0.09-98 Ø5}
90.5% sRGB (Argyll 1.6.3 3D)
58.8% AdobeRGB 1998 (Argyll 1.6.3 3D)
64.7% AdobeRGB 1998 (Argyll 3D)
90.9% sRGB (Argyll 3D)
63.6% Display P3 (Argyll 3D)
Gamma: 2.36
CCT: 7651 K
| Eurocom Sky X4C i9-9900KS AU Optronics B156HAN07.0, IPS, 15.6", 1920x1080 | MSI GE63VR 7RF Raider Chi Mei N156HHE-GA1 (CMN15F4), TN LED, 15.6", 1920x1080 | Asus Strix Scar III G531GW-AZ062T Sharp LQ156M1JW09 (SHP14D3), IPS, 15.6", 1920x1080 | Lenovo Legion Y740-15ICHg BOE NV156FHM-N4J, IPS, 15.6", 1920x1080 | MSI GT63 Titan 8RG-046 N156HHE-GA1, TN, 15.6", 1920x1080 | Eurocom Sky X4C ID: SHP142A, Name: LQ156D1JX01B, IPS, 15.6", 3840x2160 | |
|---|---|---|---|---|---|---|
| Display | 29% | 5% | 4% | 29% | 4% | |
| Display P3 Coverage (%) | 63.6 | 91.3 44% | 66.2 4% | 67.7 6% | 91.3 44% | 65.1 2% |
| sRGB Coverage (%) | 90.9 | 100 10% | 97.1 7% | 91.6 1% | 99.9 10% | 96.5 6% |
| AdobeRGB 1998 Coverage (%) | 64.7 | 86.7 34% | 67.6 4% | 67.1 4% | 85.7 32% | 67.2 4% |
| Response Times | 38% | 14% | -3% | 48% | -154% | |
| Response Time Grey 50% / Grey 80% * (ms) | 16.8 ? | 9.6 ? 43% | 15 ? 11% | 19 ? -13% | 8.4 ? 50% | 33.6 ? -100% |
| Response Time Black / White * (ms) | 10.8 ? | 7.2 ? 33% | 9 ? 17% | 10 ? 7% | 5.8 ? 46% | 33.2 ? -207% |
| PWM Frequency (Hz) | 26000 ? | 250 ? | 25510 ? | 1000 ? | ||
| Bildschirm | 22% | 7% | 44% | 18% | 11% | |
| Helligkeit Bildmitte (cd/m²) | 258.8 | 285 10% | 309 19% | 477 84% | 307.1 19% | 324.7 25% |
| Brightness (cd/m²) | 258 | 273 6% | 284 10% | 431 67% | 276 7% | 318 23% |
| Brightness Distribution (%) | 82 | 84 2% | 88 7% | 84 2% | 80 -2% | 81 -1% |
| Schwarzwert * (cd/m²) | 0.28 | 0.23 18% | 0.42 -50% | 0.175 38% | 0.37 -32% | 0.26 7% |
| Kontrast (:1) | 924 | 1239 34% | 736 -20% | 2726 195% | 830 -10% | 1249 35% |
| Delta E Colorchecker * | 4.45 | 3.52 21% | 3.99 10% | 4.17 6% | 2.53 43% | 4.67 -5% |
| Colorchecker dE 2000 max. * | 9.85 | 5.18 47% | 8.3 16% | 6.97 29% | 4.66 53% | 8.16 17% |
| Colorchecker dE 2000 calibrated * | 3 | 1.12 63% | 2.51 16% | 2.82 6% | ||
| Delta E Graustufen * | 5.8 | 3.41 41% | 5.43 6% | 3.49 40% | 1.7 71% | 5.9 -2% |
| Gamma | 2.36 93% | 2.05 107% | 2.57 86% | 2.5 88% | 2.194 100% | 2.14 103% |
| CCT | 7651 85% | 7077 92% | 7767 84% | 7076 92% | 6893 94% | 7176 91% |
| Farbraum (Prozent von AdobeRGB 1998) (%) | 58.8 | 77 31% | 63 7% | 60 2% | 76 29% | 61.1 4% |
| Color Space (Percent of sRGB) (%) | 90.5 | 100 10% | 97 7% | 91 1% | 100 10% | 96.1 6% |
| Durchschnitt gesamt (Programm / Settings) | 30% /
26% | 9% /
7% | 15% /
30% | 32% /
24% | -46% /
-12% |
* ... kleinere Werte sind besser
Ähnlich wie bei allen anderen derzeit verfügbaren, 15,6 Zoll großen 144-Hz-Panels werden auch hier ungefähr 59 Prozent und 91 des AdobeRGB- bzw. sRGB-Farbraums abgedeckt. Das einzige Panel, das eine hohe Bildwiederholfrequenz und ein deutlich breiteres Farbspektrum bietet, ist das 120-Hz-Panel des neuesten Razer Blade Pro 17.
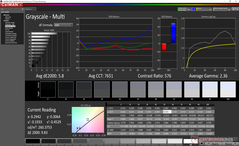
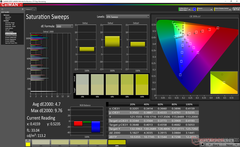
Das Panel ist ab Werk nicht gut kalibriert und die Farbtemperatur viel zu kühl. Die durchschnittlichen Graustufen- und Farb-DeltaE-Werte liegen vor der Kalibrierung bei 5,8 bzw. 4,7 und nach unserer Kalibrierung bei 2,1 bzw. 1,77. Eurocom bietet an, das Laptop vor dem Versand gegen einen Aufpreis vorzukalibrieren.
Reaktionszeiten (Response Times) des Displays
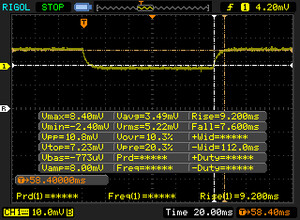
| ↔ Reaktionszeiten Schwarz zu Weiß | ||
|---|---|---|
| 10.8 ms ... steigend ↗ und fallend ↘ kombiniert | ↗ 5.2 ms steigend | |
| ↘ 5.6 ms fallend | ||
| Die gemessenen Reaktionszeiten sind gut, für anspruchsvolle Spieler könnten der Bildschirm jedoch zu langsam sein. Im Vergleich rangierten die bei uns getesteten Geräte von 0.1 (Minimum) zu 240 (Maximum) ms. » 28 % aller Screens waren schneller als der getestete. Daher sind die gemessenen Reaktionszeiten besser als der Durchschnitt aller vermessenen Geräte (20.1 ms). | ||
| ↔ Reaktionszeiten 50% Grau zu 80% Grau | ||
| 16.8 ms ... steigend ↗ und fallend ↘ kombiniert | ↗ 9.2 ms steigend | |
| ↘ 7.6 ms fallend | ||
| Die gemessenen Reaktionszeiten sind gut, für anspruchsvolle Spieler könnten der Bildschirm jedoch zu langsam sein. Im Vergleich rangierten die bei uns getesteten Geräte von 0.165 (Minimum) zu 636 (Maximum) ms. » 30 % aller Screens waren schneller als der getestete. Daher sind die gemessenen Reaktionszeiten besser als der Durchschnitt aller vermessenen Geräte (31.4 ms). | ||
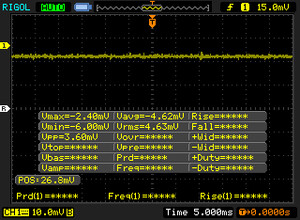
Bildschirm-Flackern / PWM (Pulse-Width Modulation)
| Flackern / PWM nicht festgestellt | |||
Im Vergleich: 53 % aller getesteten Geräte nutzten kein PWM um die Helligkeit zu reduzieren. Wenn PWM eingesetzt wurde, dann bei einer Frequenz von durchschnittlich 8016 (Minimum 5, Maximum 343500) Hz. | |||
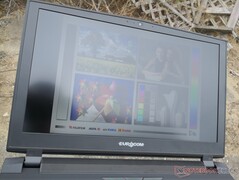
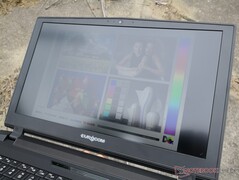
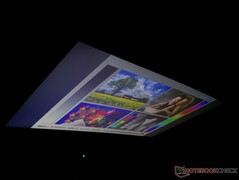
Da dieses FHD-Panel dunkler ist, ist auch die Lesbarkeit im Freien schlechter als bei der 4K-UHD-Option. Solange man das Display nicht von ungewöhnlich steilen Winkeln aus betrachtet, sind die Blickwinkel dennoch ausgezeichnet, andernfalls werden der Kontrast und die Farben leicht verfälscht.
Leistung
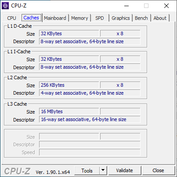
Der Core i9-9900KS (S steht hier für Sonderedition) ist, bis auf wenige Unterschiede, die den Produktseiten entnommen werden können, mit dem Core i9-9900K nahezu identisch. Rein leistungstechnisch ist der Basistakt der Sonderedition mit 4 GHz gegenüber 3,6 GHz beim i9-9900K etwas höher. In der Praxis ist die Leistung der zwei CPUs in Laptops jedoch nahezu identisch, da sie eine ähnlich hohen Turbo-Boost-Taktfrequenz erreichen können.
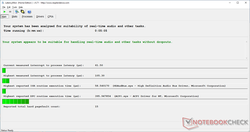
LatencyMon zeigt bei aktivierter und deaktivierter Drahtlosverbindung keine Probleme mit den DPC-Latenzen. G-Sync wird unterstützt, da Optimus hier nicht zum Einsatz kommt.
Prozessor
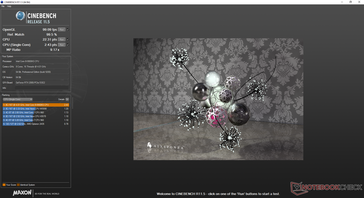
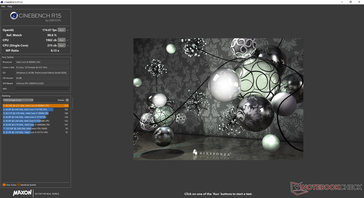
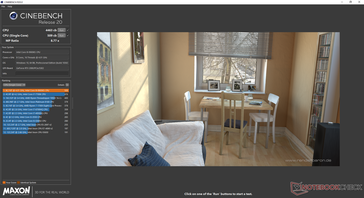
Der Achtkernprozessor Core i9-9900KS bietet eine um ca. 45 Prozent höhere Multi-Thread-Leistung als der Sechskernprozessor Core i7-8700K im älteren Sky X4C oder der Core i9-9980HK im neuesten Apple MacBook Pro 15. Gegenüber dem Core i9-9900K unterscheidet sich die tatsächliche Leistung nur um 1 bis 2 Prozent. Die Leistung wird zwar gut aufrechterhalten, allerdings gibt es auch hier noch Luft nach oben; im Cinebench-R15-Multithread-Schleifentest sinkt das Leistungsniveau im Laufe der Zeit um 8 Prozent. Wie unser Diagramm unten zeigt, gelingt es dem größeren MSI GT76 mit dem "langsameren" Core i9-9900K, länger höhere Taktfrequenzen aufrechtzuerhalten.
| Cinebench R20 | |
| CPU (Single Core) | |
| AMD Radeon RX Vega 64 | |
| Eurocom Sky X4C i9-9900KS | |
| Medion Erazer X15805 | |
| Apple MacBook Pro 15 2019 i9 Vega 20 | |
| MSI Prestige 15 A10SC | |
| MSI GE75 9SG | |
| Schenker Key 16 | |
| Eurocom Nightsky Ti15 | |
| AMD Ryzen 1800X - Asus Crosshair VI Hero | |
| Razer Blade Stealth i7-1065G7 Iris Plus | |
| MSI GL62M 7RD-077 | |
| CPU (Multi Core) | |
| AMD Radeon RX Vega 64 | |
| Eurocom Sky X4C i9-9900KS | |
| MSI GE75 9SG | |
| AMD Ryzen 1800X - Asus Crosshair VI Hero | |
| Apple MacBook Pro 15 2019 i9 Vega 20 | |
| Medion Erazer X15805 | |
| Eurocom Nightsky Ti15 | |
| MSI Prestige 15 A10SC | |
| Schenker Key 16 | |
| MSI GL62M 7RD-077 | |
| Razer Blade Stealth i7-1065G7 Iris Plus | |
| Cinebench R15 | |
| CPU Single 64Bit | |
| Eurocom Sky X4C i9-9900KS | |
| Eurocom Sky X7C i9-9900K | |
| AMD Radeon RX Vega 64 | |
| Alienware Area-51m i9-9900K RTX 2080 | |
| Medion Erazer X15805 | |
| Eurocom Sky X4C | |
| MSI Prestige 15 A10SC | |
| MSI GE75 9SG | |
| Apple MacBook Pro 15 2019 i9 Vega 20 | |
| Schenker Key 16 | |
| Eurocom Nightsky Ti15 | |
| AMD Ryzen 1800X - Asus Crosshair VI Hero | |
| Razer Blade Stealth i7-1065G7 Iris Plus | |
| MSI GL62M 7RD-077 | |
| Asus GL702ZC-GC104T | |
| CPU Multi 64Bit | |
| AMD Radeon RX Vega 64 | |
| Alienware Area-51m i9-9900K RTX 2080 | |
| Eurocom Sky X7C i9-9900K | |
| Eurocom Sky X4C i9-9900KS | |
| MSI GE75 9SG | |
| AMD Ryzen 1800X - Asus Crosshair VI Hero | |
| Asus GL702ZC-GC104T | |
| Eurocom Sky X4C | |
| Apple MacBook Pro 15 2019 i9 Vega 20 | |
| Eurocom Nightsky Ti15 | |
| Medion Erazer X15805 | |
| Schenker Key 16 | |
| MSI Prestige 15 A10SC | |
| MSI GL62M 7RD-077 | |
| Razer Blade Stealth i7-1065G7 Iris Plus | |
| Cinebench R11.5 | |
| CPU Single 64Bit | |
| Eurocom Sky X4C i9-9900KS | |
| AMD Radeon RX Vega 64 | |
| Eurocom Sky X4C | |
| MSI GE75 9SG | |
| Eurocom Nightsky Ti15 | |
| AMD Ryzen 1800X - Asus Crosshair VI Hero | |
| MSI GL62M 7RD-077 | |
| Asus GL702ZC-GC104T | |
| CPU Multi 64Bit | |
| AMD Radeon RX Vega 64 | |
| Eurocom Sky X4C i9-9900KS | |
| MSI GE75 9SG | |
| AMD Ryzen 1800X - Asus Crosshair VI Hero | |
| Asus GL702ZC-GC104T | |
| Eurocom Sky X4C | |
| Eurocom Nightsky Ti15 | |
| MSI GL62M 7RD-077 | |
| Cinebench R10 | |
| Rendering Multiple CPUs 32Bit | |
| Eurocom Sky X4C i9-9900KS | |
| AMD Radeon RX Vega 64 | |
| MSI GE75 9SG | |
| Eurocom Sky X4C | |
| Medion Erazer X15805 | |
| Schenker Key 16 | |
| AMD Ryzen 1800X - Asus Crosshair VI Hero | |
| Asus GL702ZC-GC104T | |
| MSI GL62M 7RD-077 | |
| Rendering Single 32Bit | |
| Eurocom Sky X4C i9-9900KS | |
| Medion Erazer X15805 | |
| Eurocom Sky X4C | |
| MSI GE75 9SG | |
| Schenker Key 16 | |
| AMD Radeon RX Vega 64 | |
| MSI GL62M 7RD-077 | |
| AMD Ryzen 1800X - Asus Crosshair VI Hero | |
| Asus GL702ZC-GC104T | |
| wPrime 2.10 - 1024m | |
| Eurocom Sky X4C | |
| MSI GE75 9SG | |
| AMD Ryzen 1800X - Asus Crosshair VI Hero | |
| Eurocom Sky X4C i9-9900KS | |
| AMD Radeon RX Vega 64 | |
| X264 HD Benchmark 4.0 | |
| Pass 2 | |
| AMD Radeon RX Vega 64 | |
| Eurocom Sky X4C i9-9900KS | |
| MSI GE75 9SG | |
| Asus GL702ZC-GC104T | |
| AMD Ryzen 1800X - Asus Crosshair VI Hero | |
| Pass 1 | |
| Eurocom Sky X4C i9-9900KS | |
| AMD Radeon RX Vega 64 | |
| MSI GE75 9SG | |
| AMD Ryzen 1800X - Asus Crosshair VI Hero | |
| Asus GL702ZC-GC104T | |
| WinRAR - Result | |
| Eurocom Sky X4C i9-9900KS | |
| AMD Radeon RX Vega 64 | |
| MSI GE75 9SG | |
| AMD Ryzen 1800X - Asus Crosshair VI Hero | |
| Asus GL702ZC-GC104T | |
| TrueCrypt | |
| Serpent Mean 100MB | |
| AMD Radeon RX Vega 64 | |
| Eurocom Sky X4C i9-9900KS | |
| Asus GL702ZC-GC104T | |
| Eurocom Sky X4C | |
| MSI GE75 9SG | |
| Twofish Mean 100MB | |
| AMD Radeon RX Vega 64 | |
| Eurocom Sky X4C i9-9900KS | |
| AMD Ryzen 1800X - Asus Crosshair VI Hero | |
| Asus GL702ZC-GC104T | |
| Eurocom Sky X4C | |
| MSI GE75 9SG | |
| AES Mean 100MB | |
| Eurocom Sky X4C i9-9900KS | |
| AMD Radeon RX Vega 64 | |
| AMD Ryzen 1800X - Asus Crosshair VI Hero | |
| MSI GE75 9SG | |
| Eurocom Sky X4C | |
| Asus GL702ZC-GC104T | |
| Geekbench 4.0 | |
| Compute OpenCL Score | |
| Eurocom Sky X4C i9-9900KS | |
| MSI GL62M 7RD-077 | |
| 64 Bit Multi-Core Score | |
| Eurocom Sky X4C i9-9900KS | |
| AMD Ryzen 1800X - Asus Crosshair VI Hero | |
| MSI GL62M 7RD-077 | |
| 64 Bit Single-Core Score | |
| Eurocom Sky X4C i9-9900KS | |
| AMD Ryzen 1800X - Asus Crosshair VI Hero | |
| MSI GL62M 7RD-077 | |
| Blender - v2.79 BMW27 CPU | |
| MSI GE75 9SG | |
| AMD Ryzen 1800X - Asus Crosshair VI Hero | |
| Eurocom Sky X4C i9-9900KS | |
| AMD Radeon RX Vega 64 | |
| 7-Zip 18.03 | |
| 7z b 4 | |
| AMD Radeon RX Vega 64 | |
| Eurocom Sky X4C i9-9900KS | |
| MSI GE75 9SG | |
| 7z b 4 -mmt1 | |
| Eurocom Sky X4C i9-9900KS | |
| AMD Radeon RX Vega 64 | |
| MSI GE75 9SG | |
| HWBOT x265 Benchmark v2.2 - 4k Preset | |
| AMD Radeon RX Vega 64 | |
| Eurocom Sky X4C i9-9900KS | |
| MSI GE75 9SG | |
| MSI GL62M 7RD-077 | |
* ... kleinere Werte sind besser
System Performance
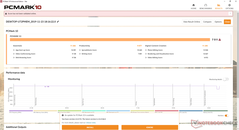
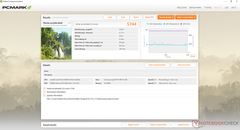
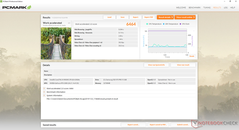
Viele Eurocom Laptops erreichen Spitzenwerte unter den PCMark Punktzahlen in unserer Datenbank, und auch das X4C bildet diesbezüglich keine Ausnahme. Mit 7.511 Punkten vs. 7.151 Punkten beim Sky X7C belegt es zurzeit den ersten Platz in unserem PCMark-10-Benchmark. Software- oder Hardwareprobleme sind bei unserem Testgerät während des Testzeitraums nicht aufgetreten.
| PCMark 8 | |
| Home Score Accelerated v2 | |
| Eurocom Sky X4C i9-9900KS | |
| Eurocom Sky X7C i9-9900K | |
| Alienware Area-51m i9-9900K RTX 2080 | |
| Asus GL702ZC-GC104T | |
| Work Score Accelerated v2 | |
| Eurocom Sky X4C i9-9900KS | |
| Eurocom Sky X7C i9-9900K | |
| Alienware Area-51m i9-9900K RTX 2080 | |
| Asus GL702ZC-GC104T | |
| PCMark 8 Home Score Accelerated v2 | 5744 Punkte | |
| PCMark 8 Work Score Accelerated v2 | 6464 Punkte | |
| PCMark 10 Score | 7511 Punkte | |
Hilfe | ||
Massenspeicher
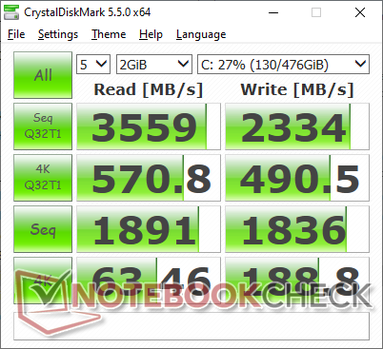
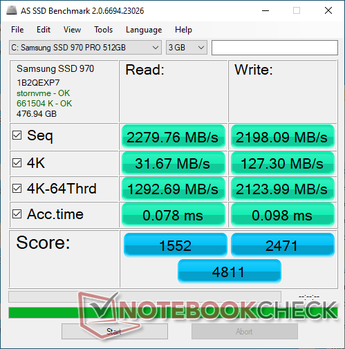
Insgesamt sind vier interne Speicherschächte verfügbar (2x M.2-2280 + 2x 2,5-Zoll-SATA-III). Anders als bei unserem Sky X4C 2018 kommt hier nicht die NVMe-SSD Samsung 960 Pro, sondern die NVMe-SSD Samsung 970 Pro zum Einsatz, die über schnellere Lesegeschwindigkeiten verfügt.
Weitere Benchmark-Vergleiche finden Sie in unserer Festplatten- und SSD-Tabelle.
| Eurocom Sky X4C i9-9900KS Samsung SSD 970 Pro 512GB | MSI GE63VR 7RF Raider Toshiba HG6 THNSNJ256G8NY | Asus Strix Scar III G531GW-AZ062T Intel SSD 660p SSDPEKNW512G8 | Lenovo Legion Y740-15ICHg WDC PC SN520 SDAPMUW-128G | MSI GT63 Titan 8RG-046 CUK Cyclone 500GB M.2 NVMe | Eurocom Sky X4C Samsung SSD 960 Pro 1TB m.2 NVMe | |
|---|---|---|---|---|---|---|
| AS SSD | -64% | -54% | -50% | -8% | 3% | |
| Seq Read (MB/s) | 2280 | 506 -78% | 1163 -49% | 1372 -40% | 2399 5% | 2541 11% |
| Seq Write (MB/s) | 2198 | 447 -80% | 919 -58% | 746 -66% | 1665 -24% | 1989 -10% |
| 4K Read (MB/s) | 31.67 | 19.55 -38% | 48.88 54% | 35.42 12% | 49.17 55% | 44.83 42% |
| 4K Write (MB/s) | 127.3 | 77.3 -39% | 90.1 -29% | 99.9 -22% | 87.7 -31% | 129.6 2% |
| 4K-64 Read (MB/s) | 1293 | 350.3 -73% | 323.8 -75% | 302.1 -77% | 1144 -12% | 1646 27% |
| 4K-64 Write (MB/s) | 2124 | 170.6 -92% | 403.8 -81% | 191.4 -91% | 648 -69% | 1375 -35% |
| Access Time Read * (ms) | 0.078 | 0.168 -115% | 0.24 -208% | 0.132 -69% | 0.05 36% | 0.032 59% |
| Access Time Write * (ms) | 0.098 | 0.045 54% | 0.046 53% | 0.037 62% | 0.042 57% | 0.03 69% |
| Score Read (Points) | 1552 | 420 -73% | 489 -68% | 475 -69% | 1433 -8% | 1945 25% |
| Score Write (Points) | 2471 | 293 -88% | 586 -76% | 366 -85% | 902 -63% | 1703 -31% |
| Score Total (Points) | 4811 | 930 -81% | 1332 -72% | 1065 -78% | 3040 -37% | 4615 -4% |
| Copy ISO MB/s (MB/s) | 3007 | 1269 -58% | 1062 -65% | 1908 -37% | ||
| Copy Program MB/s (MB/s) | 731 | 452.8 -38% | 426 -42% | 467.2 -36% | ||
| Copy Game MB/s (MB/s) | 1756 | 755 -57% | 650 -63% | 1055 -40% |
* ... kleinere Werte sind besser
Grafikkarte
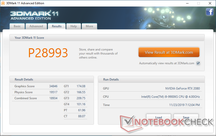
Ab Werk ist die GeForce RTX 2080 in unserem Eurocom Laptop um ca. 6 bis 8 Prozent langsamer als die gleiche GPU im übertakteten Dell Alienware Area-51m. Eine "richtige" Desktop-Variante der RTX 2080 schlägt die GPU in unserem Testgerät um ca. 8 bis 15 Prozent.
Weitere technische Informationen und Benchmark-Vergleiche finden Sie auf unserer Seite zur mobilen GeForce RTX 2080. Mit Nvidias mobilen Super-Grafikkarten für Laptops ist 2020 zu rechnen.
| 3DMark 06 Standard Score | 47829 Punkte | |
| 3DMark 11 Performance | 28993 Punkte | |
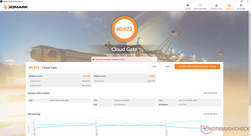
| 3DMark Cloud Gate Standard Score | 60073 Punkte | |
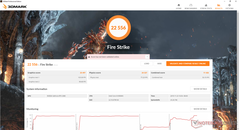
| 3DMark Fire Strike Score | 22556 Punkte | |
| 3DMark Time Spy Score | 10012 Punkte | |
Hilfe | ||
| min. | mittel | hoch | max. | |
|---|---|---|---|---|
| BioShock Infinite (2013) | 528 | 443.5 | 408.6 | 208.2 |
| The Witcher 3 (2015) | 414.3 | 284.2 | 175.9 | 95.5 |
| Shadow of the Tomb Raider (2018) | 178 | 141 | 134 | 124 |
Emissionen
Geräuschemissionen
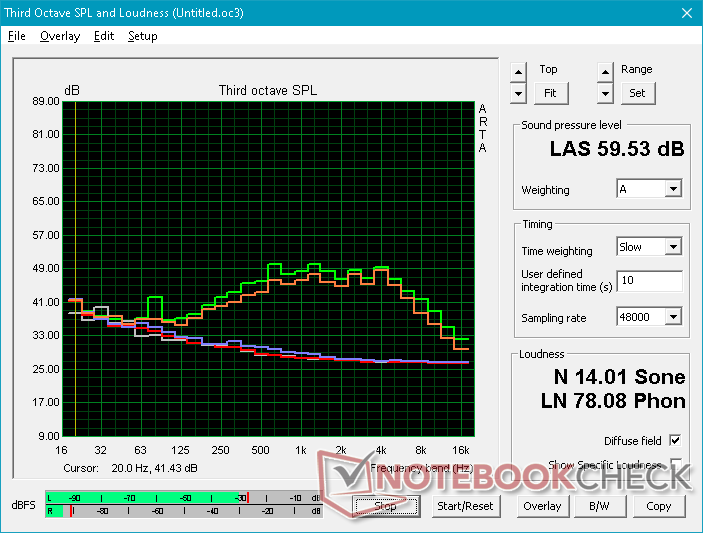
In Anbetracht des 15,6-Zoll-Formfaktors und der leistungsfähigen Komponenten kann man hier nicht wirklich mit leisen Lüftern rechnen. Unter hoher Last, also zum Beispiel in Spielen, ist der Geräuschpegel der Lüfter mit maximal 55 bis 59 dB(A) lauter als bei den meisten Gaming-Laptops und mit dem des MSI GT76 Titan vergleichbar. Unter denselben Bedingungen ist sogar das Alienware Area-51m mit i9-9900K und übertakteter RTX 2080 leiser (51 dB(A)).
Die gute Nachricht ist, dass der Eurocom Laptop in Niederlastsituationen leise und nur in Hochlastsituationen laut ist. Beispielsweise werden beim Erledigen von weniger anspruchsvollen Aufgaben wie Surfen oder Videostreaming nur maximal 31,7 dB(A) erzeugt. Die Lüfter können ab und zu pulsieren, dieses Verhalten ist jedoch weder dauerhaft noch störend. Nur bei sehr hoher Systemlast steigt der Geräuschpegel der Lüfter exponentiell.
Wir konnten bei unserem Testgerät keine elektronischen Geräusche oder Spulenfiepen feststellen.
| Eurocom Sky X4C i9-9900KS GeForce RTX 2080 Mobile, i9-9900KS, Samsung SSD 970 Pro 512GB | Eurocom Sky X7C i9-9900K GeForce RTX 2080 Mobile, i9-9900K, 2x Samsung SSD 970 Pro 512GB (RAID 0) | MSI GT76 Titan DT 9SG GeForce RTX 2080 Mobile, i9-9900K, 2x Samsung PM961 MZVLW256HEHP (RAID 0) | Alienware Area-51m i9-9900K RTX 2080 GeForce RTX 2080 Mobile, i9-9900K, 2x SK Hynix PC400 512GB (RAID 0) | Asus GL702ZC-GC104T Radeon RX 580 (Laptop), R7 1700, SanDisk SD8SN8U256G1002 | Asus Strix Scar III G531GW-AZ062T GeForce RTX 2070 Mobile, i7-9750H, Intel SSD 660p SSDPEKNW512G8 | |
|---|---|---|---|---|---|---|
| Geräuschentwicklung | -2% | -19% | -16% | -17% | -6% | |
| aus / Umgebung * (dB) | 28.1 | 28.9 -3% | 30 -7% | 28.1 -0% | 31 -10% | 30 -7% |
| Idle min * (dB) | 28.5 | 29.7 -4% | 33 -16% | 28.1 1% | 32 -12% | 30.6 -7% |
| Idle avg * (dB) | 28.7 | 29.7 -3% | 34 -18% | 28.6 -0% | 38 -32% | 30.6 -7% |
| Idle max * (dB) | 29.5 | 30 -2% | 44 -49% | 51 -73% | 40 -36% | 37.7 -28% |
| Last avg * (dB) | 31.2 | 36.5 -17% | 47 -51% | 51 -63% | 42 -35% | 36.5 -17% |
| Witcher 3 ultra * (dB) | 55.1 | 49 11% | 53 4% | 51 7% | 54 2% | 52.1 5% |
| Last max * (dB) | 59.3 | 57 4% | 59 1% | 51 14% | 57 4% | 48.1 19% |
* ... kleinere Werte sind besser
Lautstärkediagramm
| Idle |
| 28.5 / 28.7 / 29.5 dB(A) |
| Last |
| 31.2 / 59.3 dB(A) |
 | ||
30 dB leise 40 dB(A) deutlich hörbar 50 dB(A) störend |
||
min: | ||
Temperatur
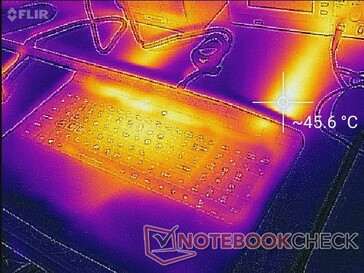
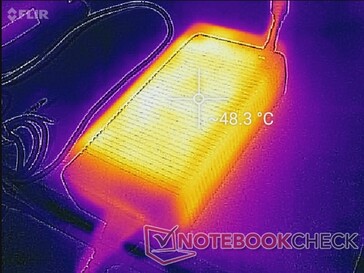
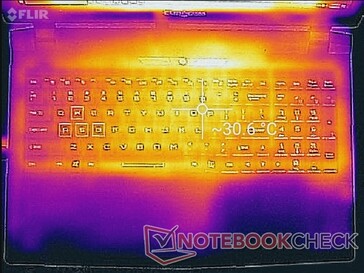
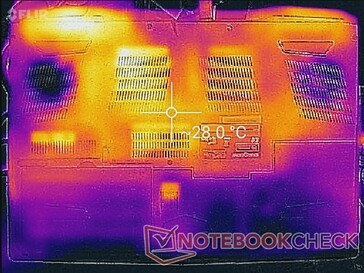
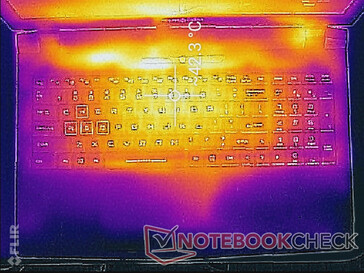
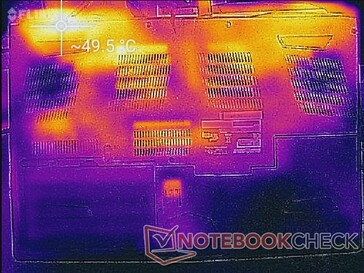
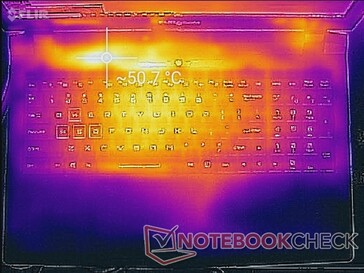
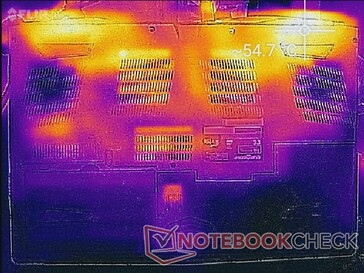
Die Oberflächen werden trotz der verbauten, schnellen Hardware nie unangenehm warm. Die heißesten Stellen erreichen unter hoher Last maximal 51 °C. Glücklicherweise liegen diese Stellen über der ersten Tastenreihe, wodurch Nutzer vermutlich ohnehin nicht mit ihnen in Kontakt kommen. Während die Tastaturmitte bis zu 42 °C warm werden kann, bleiben die Handballenauflagen, die WASD-Tasten, der Ziffernblock und das Touchpad relativ kühl.
(-) Die maximale Temperatur auf der Oberseite ist 51.6 °C. Im Vergleich liegt der Klassendurchschnitt bei 40.4 °C (von 21.2 bis 68.8 °C für die Klasse Gaming).
(-) Auf der Unterseite messen wir eine maximalen Wert von 54.6 °C (im Vergleich zum Durchschnitt von 43.3 °C).
(+) Ohne Last messen wir eine durchschnittliche Temperatur von 27.7 °C auf der Oberseite. Der Klassendurchschnitt erreicht 33.9 °C.
(±) Beim längeren Spielen von The Witcher 3 erhitzt sich das Gerät durchschnittlich auf 33.1 °C. Der Durchschnitt der Klasse ist derzeit 33.9 °C.
(+) Die Handballen und der Touchpad-Bereich sind mit gemessenen 28.8 °C kühler als die typische Hauttemperatur und fühlen sich dadurch kühl an.
(±) Die durchschnittliche Handballen-Temperatur anderer getesteter Geräte war 28.8 °C (0 °C).
Stresstest
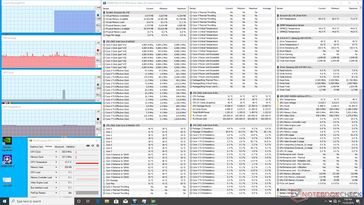
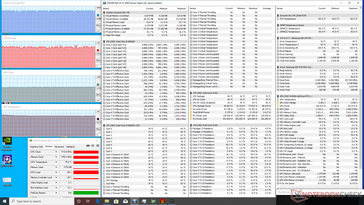
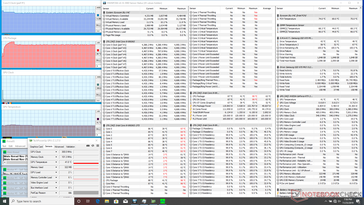
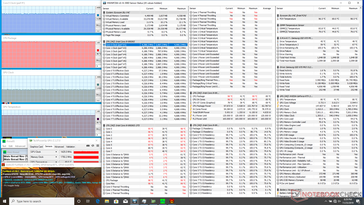
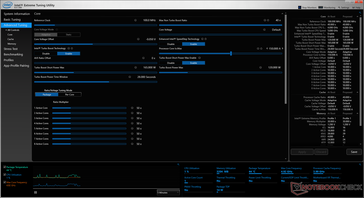
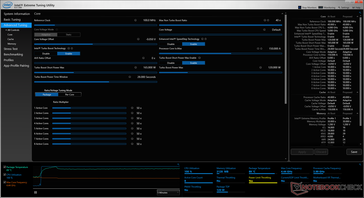
Um es auf potenzielles Drosseln und mögliche Stabilitätsprobleme zu prüfen, setzen wir das System künstlichen Lasten aus. Beim Ausführen von Prime95 beträgt die Taktfrequenz der CPU in den ersten 30 Sekunden 4,7 GHz und die CPU-Temperatur 98 °C. Anschließend fällt die Taktfrequenz auf ca. 4,4 GHz, um die CPU-Temperatur auf etwas kühlere 88 °C zu beschränken. Hier gibt es in Bezug auf die Temperatur zwar Spielraum zum Übertakten, allerdings ist dieser so klein, dass man dem Core i9-9900KS in der Praxis keine bedeutend höhere Leistung entlocken kann.
Erwähnenswert ist auch, dass sich CPU und GPU hier, anders als bei vielen anderen Gaming-Laptops, keine Heatpipes teilen müssen. Während die CPU über 90 °C erreicht, kann die GPU im Leerlauf gleichzeitig bei nur 41 °C verweilen, wodurch unabhängiges Übertakten möglich ist. Da die GPU unter extrem hoher Last durchschnittlich ca. 80 °C warm wird, besitzt sie ein höheres Übertaktungspotenzial als die CPU. Insgesamt kann man im Gaming-Betrieb bei diesem Modell des Sky X4C mit Temperaturen von >80 °C rechnen.
Im Akkumodus ist die Leistung eingeschränkt. Ein Fire-Strike-Durchlauf im Akkumodus liefert Physik- und Grafikpunktzahlen von 13.000 bzw. 13.973 Punkten, während im Netzbetrieb 24.327 bzw. 25.497 Punkte erreicht werden.
| CPU Clock (GHz) | GPU Clock (MHz) | Average CPU Temperature (°C) | Average GPU Temperature (°C) | |
| System Idle | -- | -- | 41 | 41 |
| Prime95 Stress | 4.4 | 88 | -- | 41 |
| Prime95 + FurMark Stress | 4.4 | 1425 | 98 | 80 |
| Witcher 3 Stress | 4.8 - 5.0 | 1710 | ~79 | 78 |
Lautsprecher

Eurocom Sky X4C i9-9900KS Audio Analyse
(±) | Mittelmäßig laut spielende Lautsprecher (77.6 dB)
Bass 100 - 315 Hz
(-) | kaum Bass - 15.7% niedriger als der Median
(±) | durchschnittlich lineare Bass-Wiedergabe (10.3% Delta zum Vorgänger)
Mitteltöne 400 - 2000 Hz
(±) | zu hohe Mitten, vom Median 7.1% abweichend
(±) | Linearität der Mitten ist durchschnittlich (11.6% Delta zum Vorgänger)
Hochtöne 2 - 16 kHz
(+) | ausgeglichene Hochtöne, vom Median nur 3.9% abweichend
(±) | durchschnittlich lineare Hochtöne (10.6% Delta zum Vorgänger)
Gesamt im hörbaren Bereich 100 - 16.000 Hz
(-) | hörbarer Bereich ist nur wenig linear (30.7% Abstand zum Median)
Im Vergleich zu allen Geräten derselben Klasse
» 96% aller getesteten Geräte dieser Klasse waren besser, 2% vergleichbar, 2% schlechter
» Das beste Gerät hat einen Delta-Wert von 6%, durchschnittlich ist 18%, das schlechteste Gerät hat 132%
Im Vergleich zu allen Geräten im Test
» 89% aller getesteten Geräte waren besser, 3% vergleichbar, 9% schlechter
» Das beste Gerät hat einen Delta-Wert von 4%, durchschnittlich ist 24%, das schlechteste Gerät hat 134%
Apple MacBook 12 (Early 2016) 1.1 GHz Audio Analyse
(+) | Die Lautsprecher können relativ laut spielen (83.6 dB)
Bass 100 - 315 Hz
(±) | abgesenkter Bass - 11.3% geringer als der Median
(±) | durchschnittlich lineare Bass-Wiedergabe (14.2% Delta zum Vorgänger)
Mitteltöne 400 - 2000 Hz
(+) | ausgeglichene Mitten, vom Median nur 2.4% abweichend
(+) | lineare Mitten (5.5% Delta zum Vorgänger)
Hochtöne 2 - 16 kHz
(+) | ausgeglichene Hochtöne, vom Median nur 2% abweichend
(+) | sehr lineare Hochtöne (4.5% Delta zum Vorgänger)
Gesamt im hörbaren Bereich 100 - 16.000 Hz
(+) | hörbarer Bereich ist sehr linear (10.2% Abstand zum Median
Im Vergleich zu allen Geräten derselben Klasse
» 7% aller getesteten Geräte dieser Klasse waren besser, 2% vergleichbar, 91% schlechter
» Das beste Gerät hat einen Delta-Wert von 5%, durchschnittlich ist 18%, das schlechteste Gerät hat 53%
Im Vergleich zu allen Geräten im Test
» 4% aller getesteten Geräte waren besser, 1% vergleichbar, 94% schlechter
» Das beste Gerät hat einen Delta-Wert von 4%, durchschnittlich ist 24%, das schlechteste Gerät hat 134%
Energieverwaltung
Energieaufnahme
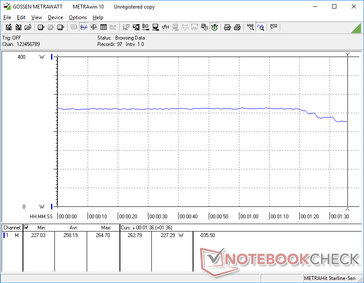
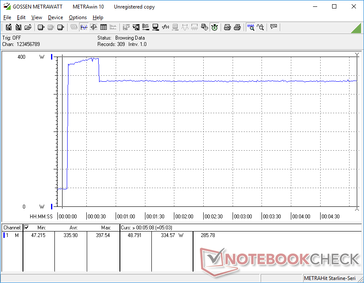
Der leistungsfähigere i9-9900KS und die RTX 2080 haben ihren Preis. Im Vergleich mit dem Sky X4C aus dem letzten Jahr, das mit einem i7-8700K und einer GTX 1080 ausgestattet war, ist der Verbrauch des aktuellen Sky X4C im Gaming-Betrieb um 50 Prozent höher (172 vs. 258 W). Der maximale Verbrauch, der dem großen (~20 x 10 x 4,3 cm) 330-W-Netzteil während der gleichzeitigen Ausführung von Prime95 und FurMark abverlangt wird, liegt bei 398 W. Dieser Spitzenwert fällt schließlich, und der Verbrauch pendelt sich bei 335 W ein, was bedeutet, dass man den Laptop nicht laden kann, während er extrem hohen Lasten ausgesetzt ist.
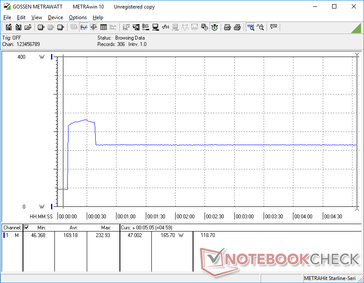
Führt man Prime95 einzeln aus, springt der Verbrauch für ca. 30 Sekunden auf 233 W, fällt dann ab und stabilisiert sich letztendlich bei 166 W. Dieses Verhalten deckt sich mit unseren Beobachtungen im Prime95 Stresstest oben, da die höchsten Taktfrequenzen dort auch nur in den ersten 30 Sekunden aufrechterhalten werden konnten und danach abgefallen sind.
| Aus / Standby | |
| Idle | |
| Last |
|
Legende:
min: | |
| Eurocom Sky X4C i9-9900KS i9-9900KS, GeForce RTX 2080 Mobile, Samsung SSD 970 Pro 512GB, IPS, 1920x1080, 15.6" | Alienware Area-51m i9-9900K RTX 2080 i9-9900K, GeForce RTX 2080 Mobile, 2x SK Hynix PC400 512GB (RAID 0), IPS, 1920x1080, 17.3" | MSI GT63 Titan 8RG-046 i7-8750H, GeForce GTX 1080 Mobile, CUK Cyclone 500GB M.2 NVMe, TN, 1920x1080, 15.6" | Asus GL702ZC-GC104T R7 1700, Radeon RX 580 (Laptop), SanDisk SD8SN8U256G1002, IPS, 1920x1080, 17.3" | MSI GE63VR 7RF Raider i7-7700HQ, GeForce GTX 1070 Mobile, Toshiba HG6 THNSNJ256G8NY, TN LED, 1920x1080, 15.6" | Eurocom Sky X4C i7-8700K, GeForce GTX 1080 Mobile, Samsung SSD 960 Pro 1TB m.2 NVMe, IPS, 3840x2160, 15.6" | |
|---|---|---|---|---|---|---|
| Stromverbrauch | 2% | 25% | -3% | 46% | 18% | |
| Idle min * (Watt) | 33.4 | 23.3 30% | 26.4 21% | 43 -29% | 11 67% | 30.2 10% |
| Idle avg * (Watt) | 40.5 | 33.5 17% | 30 26% | 50 -23% | 16 60% | 34.7 14% |
| Idle max * (Watt) | 44 | 38.4 13% | 30.6 30% | 57 -30% | 21 52% | 37.8 14% |
| Last avg * (Watt) | 121.9 | 114.1 6% | 90.4 26% | 125 -3% | 92 25% | 130.3 -7% |
| Witcher 3 ultra * (Watt) | 258.2 | 339.5 -31% | 255.6 1% | 180 30% | 185 28% | 172.2 33% |
| Last max * (Watt) | 397.6 | 485.1 -22% | 224.4 44% | 240 40% | 224 44% | 217.7 45% |
* ... kleinere Werte sind besser
Akkulaufzeit
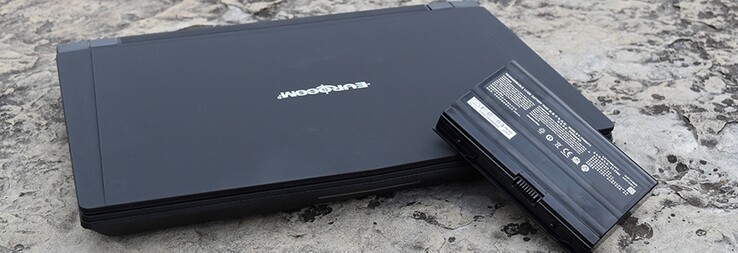
Die Akkulaufzeit mit dem austauschbaren 82-Wh-Akku bleibt ähnlich wie beim Sky X4C 2018. Hier kann man mit gut 2,5 Stunden praxisnaher WLAN-Nutzung rechnen, bevor der Laptop automatisch herunterfährt. Den leeren Akku vollständig aufzuladen, dauert ungefähr 2 Stunden.
Der Laptop kann nicht über USB-C geladen werden.
| Eurocom Sky X4C i9-9900KS i9-9900KS, GeForce RTX 2080 Mobile, 82 Wh | Lenovo Legion Y740-15ICHg i7-9750H, GeForce RTX 2070 Max-Q, 57 Wh | Alienware Area-51m i9-9900K RTX 2080 i9-9900K, GeForce RTX 2080 Mobile, 90 Wh | MSI GT76 Titan DT 9SG i9-9900K, GeForce RTX 2080 Mobile, 90 Wh | Asus Strix Scar III G531GW-AZ062T i7-9750H, GeForce RTX 2070 Mobile, 66 Wh | Eurocom Sky X4C i7-8700K, GeForce GTX 1080 Mobile, 82 Wh | |
|---|---|---|---|---|---|---|
| Akkulaufzeit | 7% | -25% | 79% | 100% | -7% | |
| WLAN (h) | 2.8 | 3 7% | 2.1 -25% | 5 79% | 5.6 100% | 2.6 -7% |
| Idle (h) | 2.6 | 6.8 | 3 | |||
| Last (h) | 1.1 | 0.9 | 1.4 |
Pro
Contra
Fazit
Schon der originale Core i9-9900K hatte nicht besonders viel Spielraum zum Übertakten, daher ist es wohl keine Überraschung, dass sich beim Core i9-9900KS ein ähnliches Bild abzeichnet. Ab Werk pendelt sich der Core i9-9900KS im Sky X4C bei 4,4 GHz und 88 °C ein und überschreitet seinen Basistakt damit nur um 400 MHz. Größere Laptops, die mit dem i9-9900K ausgestattet sind, wie das Alienware Area-51m oder das MSI GT76, erreichen das gleiche oder sogar ein noch höheres Leistungnsniveau als der i9-9900KS in unserem Eurocom Testgerät. Obwohl das drei Jahre alte Clevo Chassis sehr vielseitig ist, bringt die Core-i9-Reihe es sehr nahe an seine Grenzen. Daher ist es für Clevo vermutlich an der Zeit, das Grundgerüst zu erneuern, um das hohe Turbo-Boost-Potenzial von Intels Core-i9-Prozessoren besser nutzen zu können.
Gegenüber dem i7-8700K und dem i9700K aus der letzten Generation sind der i9-9900K und der 9900KS um ca. 35 bzw. 45 Prozent schneller. Hier kann man durch einen Wechsel zu einem Core i9 also dennoch ein Leistungsplus erzielen, allerdings sollte man in Bezug auf das Übertaktungspotenzial im Sky-X4C-Laptop nicht allzu viel erwarten.
Blitzschnell, aber auch extrem warm: Eine Core-i9-9900KS-Konfiguration ist hauptsächlich ein Statussymbol, da der originale Core i9-9900K ein sehr ähnliches Leistungsniveau bietet. Im Eurocom Sky X4C arbeitet der i9-9900KS konstant mit einer Taktfrequenz, die nur 10 Prozent über dem Basistakt liegt, obwohl die CPU in einem richtigen Desktop zu deutlich mehr imstande ist.
Eurocom Sky X4C i9-9900KS
- 28.11.2019 v7 (old)
Allen Ngo


