MSI Summit E13 Flip oder das XPS 13 2-in-1: MSIs Angriff auf die Subnotebook- und Convertibles-Elite
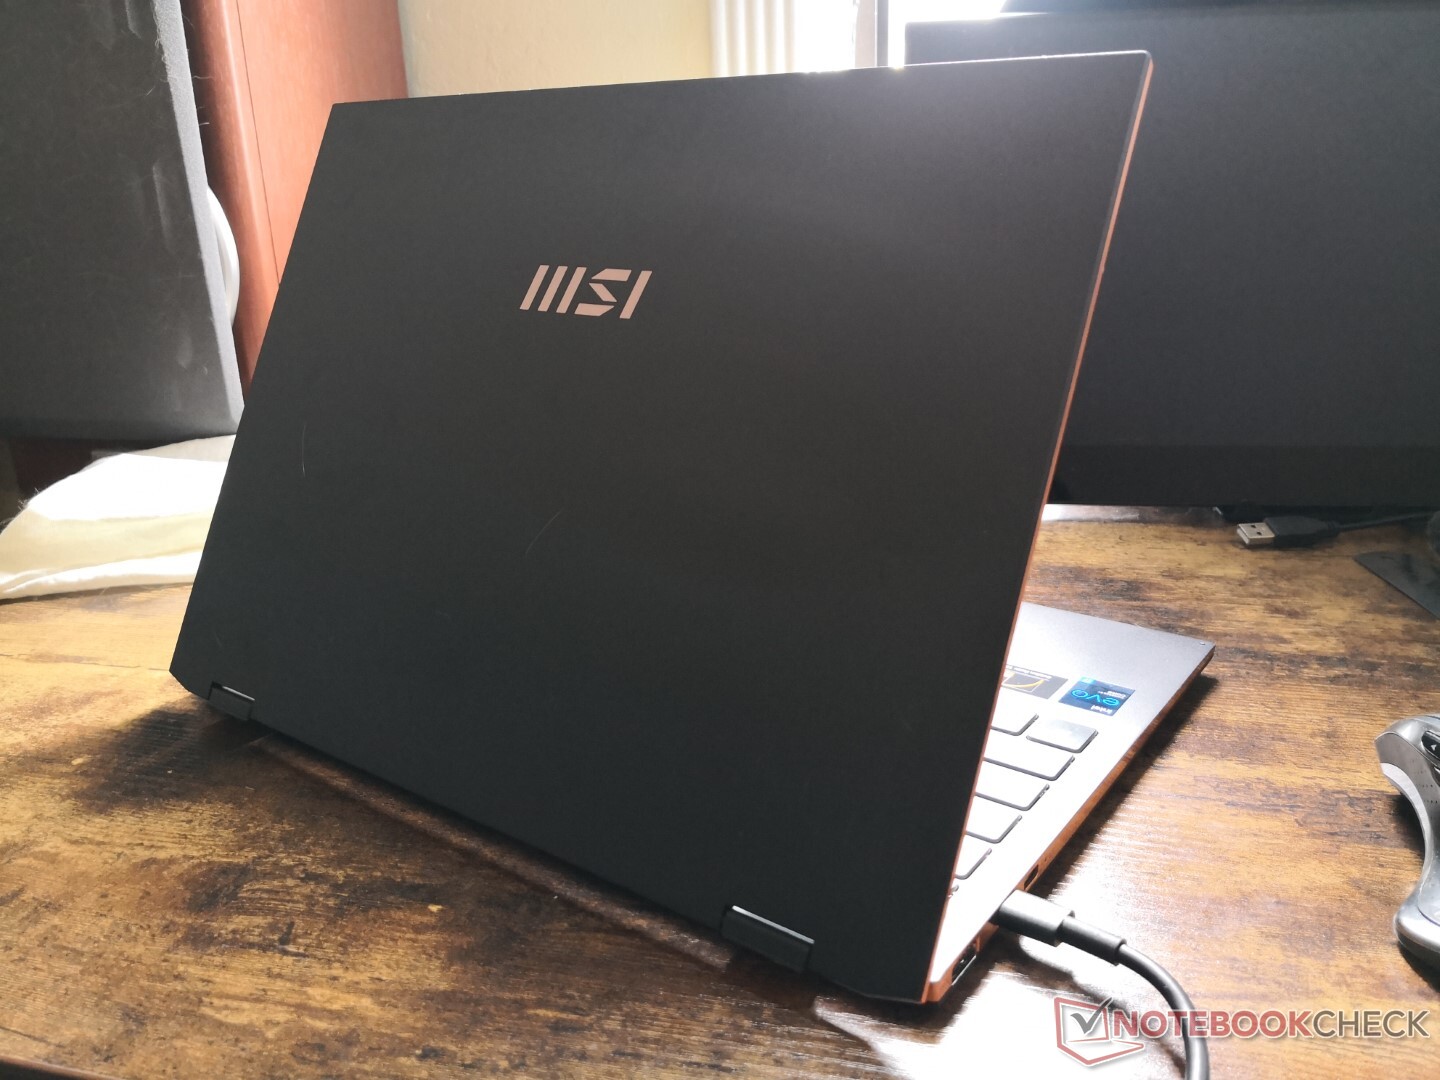
MSI ist mittlerweile kein reiner Gaming-Hersteller mehr. Die aktuelle Summit-Serie ist MSIs direkte Antwort auf beliebte "Prosumer"-Laptops wie das Dell XPS, das HP Spectre, das Asus ZenBook, das Huawei MateBook X Pro oder gar das MacBook Air oder MacBook Pro. Wir haben gerade unseren Test des 13,4 Zoll kleinen Convertibles MSI Summit E13 Flip abgeschlossen und das neue Subnotebook stellt sich bereits jetzt als ernsthafte Alternative zum viel gepriesenen XPS 13 dar.
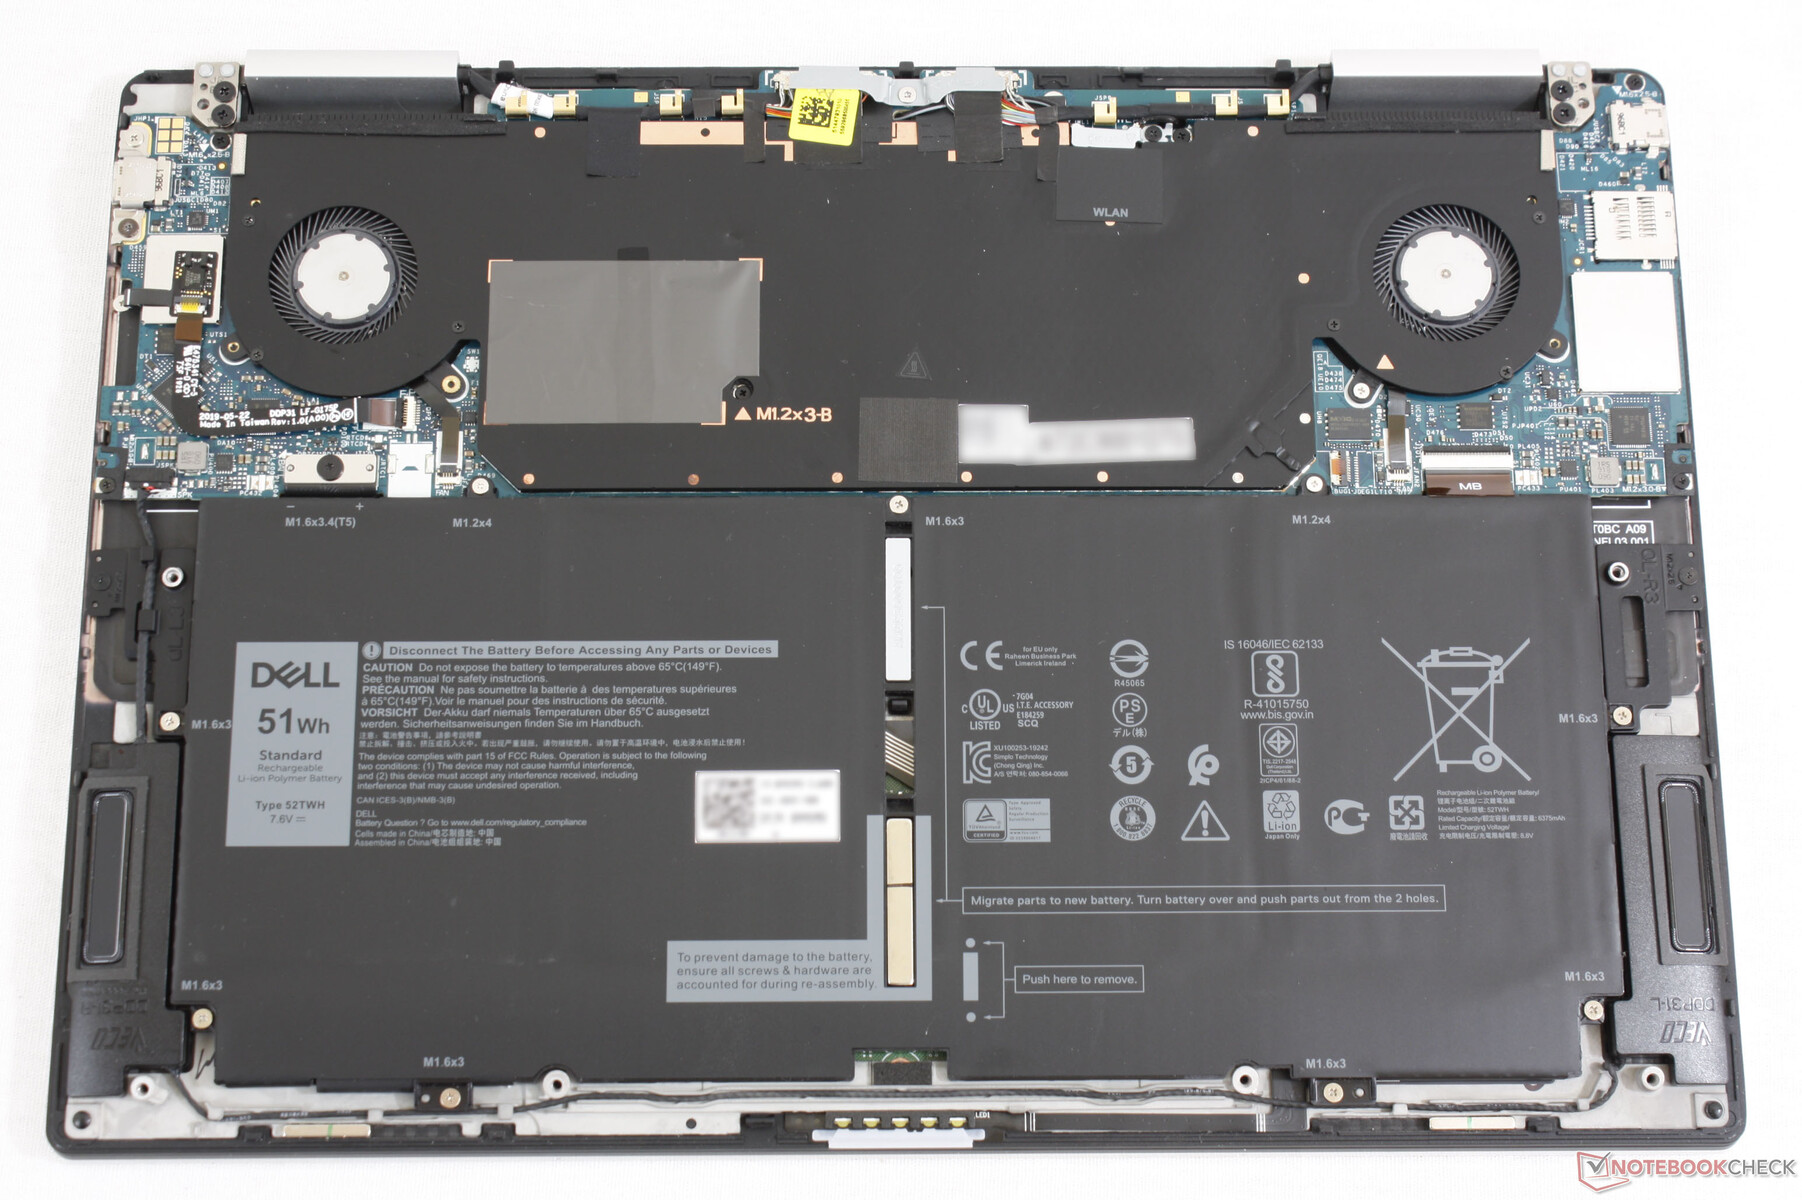
Die folgenden Tabellen und Graphen vergleichen das Summit E13 Flip mit dem letztjährigen XPS 13 7390 2-in-1 und zeigen die Vor- und Nachteile beider Modelle auf. Am liebsten hätten wir stattdessen natürlich mit dem brandneuen Tiger-Lake-XPS-13-9310-2-in-1 verglichen, aber Dell konnte uns noch kein Testmuster zuschicken, sodass wir noch das ältere Ice-Lake-Modell zum Vergleich heranziehen. Ansonsten sind das XPS 13 7390 2-in-1 und das 9310 2-in-1 optisch identisch.
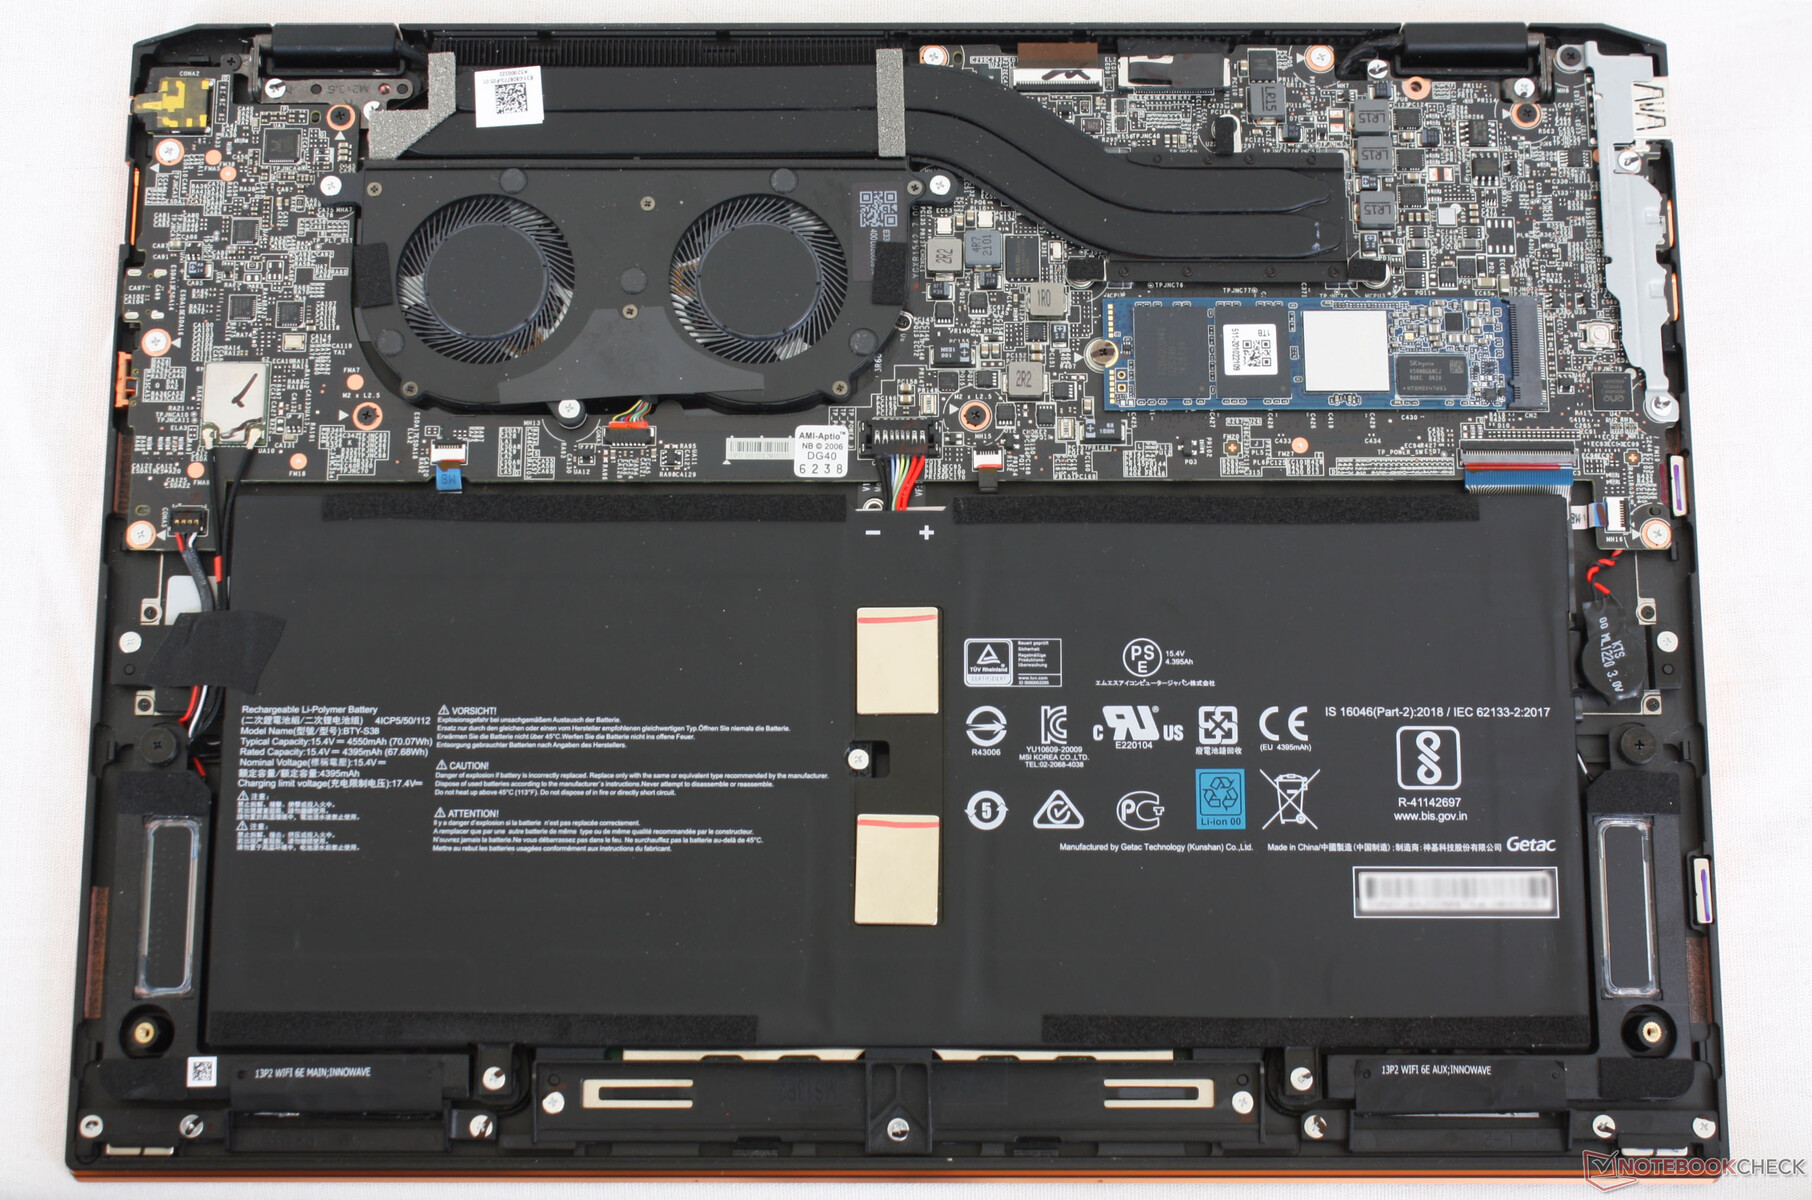
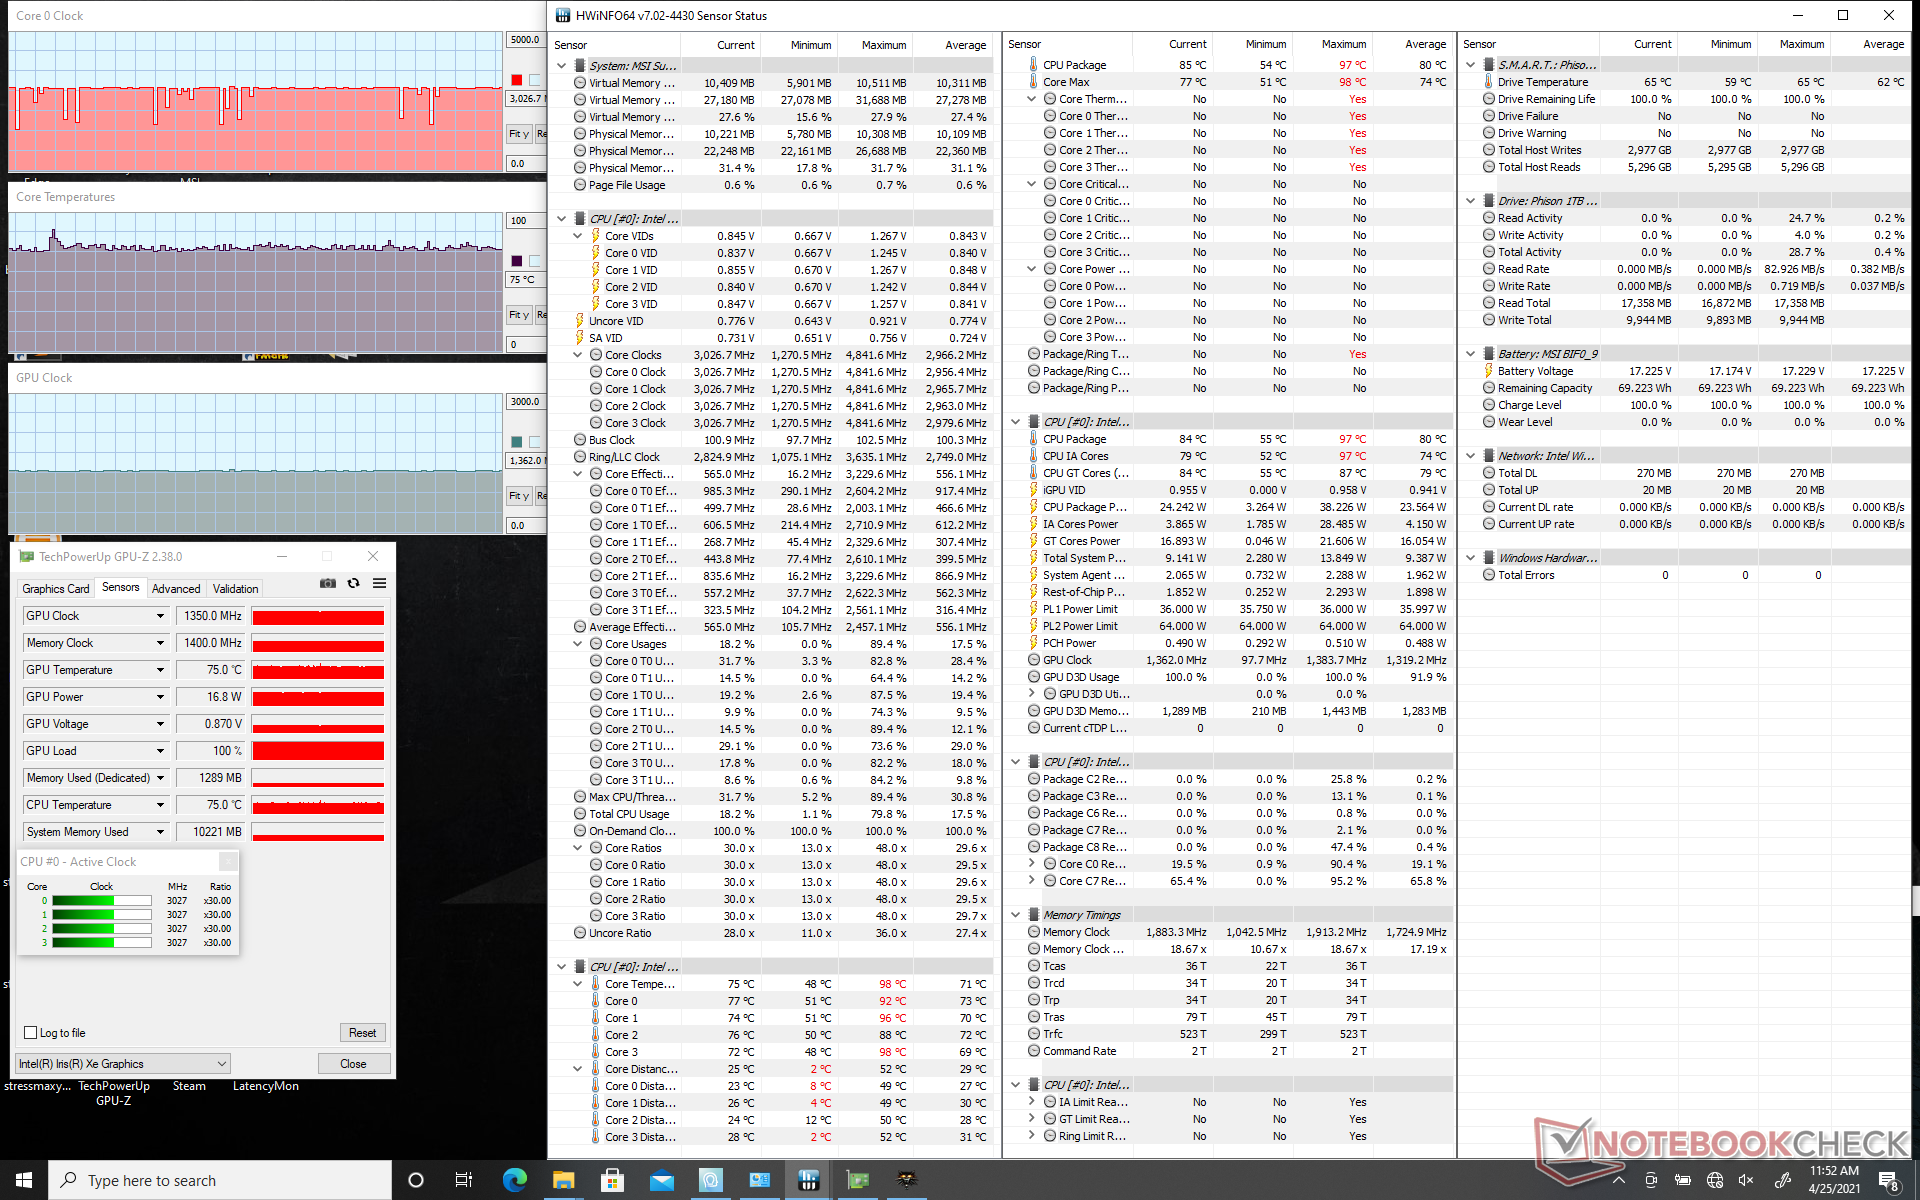
Die größten Vorteile des MSI-Systems bestehen aus seiner flüssigeren 120-Hz-Bildwiederholrate, der höheren und konstanteren Leistung, seinem PCIe-4.0-M.2-Slot und dem größeren Akku, welcher für eine längere Laufzeit sorgt. Besonders die höhere Display-Refreshrate verbessert die PC-Erfahrung, da der Bildschirm dadurch merklich schneller auf Eingaben reagiert, beispielsweise mit dem mitgelieferten Stylus.
Auf der anderen Seite sind die Nachteile des MSI gleichermaßen zu berücksichtigen. Auffällig ist zunächst das etwas höhere Gewicht und die größeren Abmaße als die Dell-Alternative, die hohe Leistung und die längere Akkuausdauer kommen also nicht ohne Abstriche in anderen Bereichen daher. Zudem nehmen wir die Lüfter im Summit stärker wahr als im Dell, da diese ihre RPM deutlich häufiger ändern, wenn größere Lasten anliegen.
Ganz eindeutig können wir daher nicht festhalten welches System besser ist als das andere, da beide ihre Vor- und Nachteile besitzen. Wem ein besseren Display, mehr Anschlussmöglichkeiten, eine längere Akkulaufzeit und eine höhere Leistung wichtiger ist als minimal mehr Gewicht und Größe, der kann vielleicht auch mit der höheren Lautstärke des MSI gut leben und zieht dieses dem Dell vor. Unsere ausführlichen Tests zum MSI Summit E13 Flip und dem Dell XPS 13 7390 2-in-1 hält detailliertere Informationen zu den Vor- und Nachteilen beider Systeme bereit.
MSI Summit E13 Flip Evo | Dell XPS 13 7390 2-in-1 | ||
|---|---|---|---|
CPU/GPU | 11th gen Core i7-1185G7 Iris Xe | 10th gen Core i7-1065G7 Iris Plus G7 | |
Touchscreen | 13.4-inch, 16:10, 1920 x 1200 120 Hz refresh rate | 13.4-inch, 16:10, 1920 x 1200 | |
RAM | 32 GB LPDDR4X 2133 MHz | 16 GB LPDDR4 1866 MHz | |
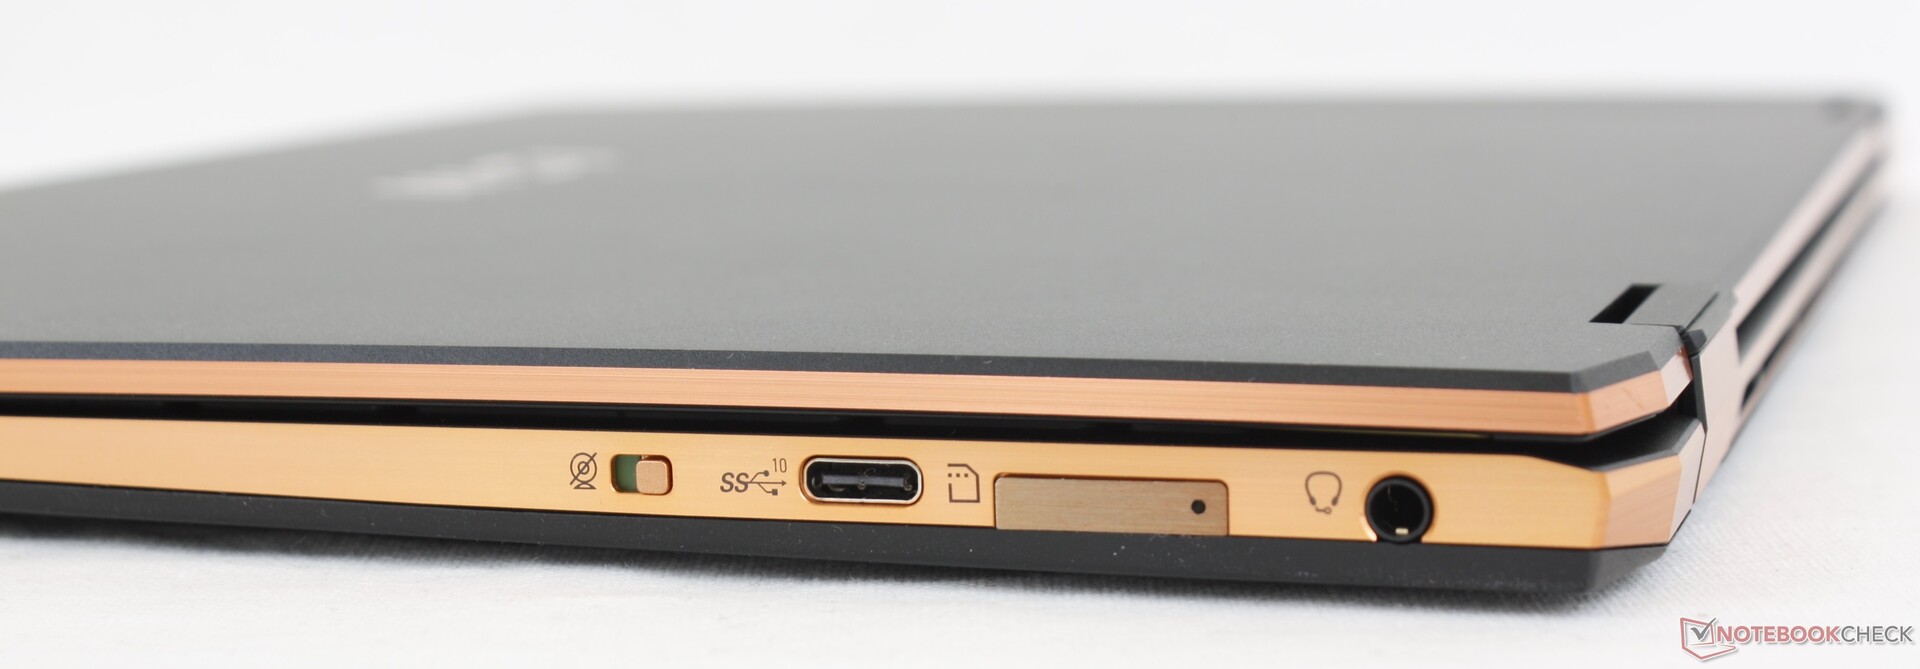
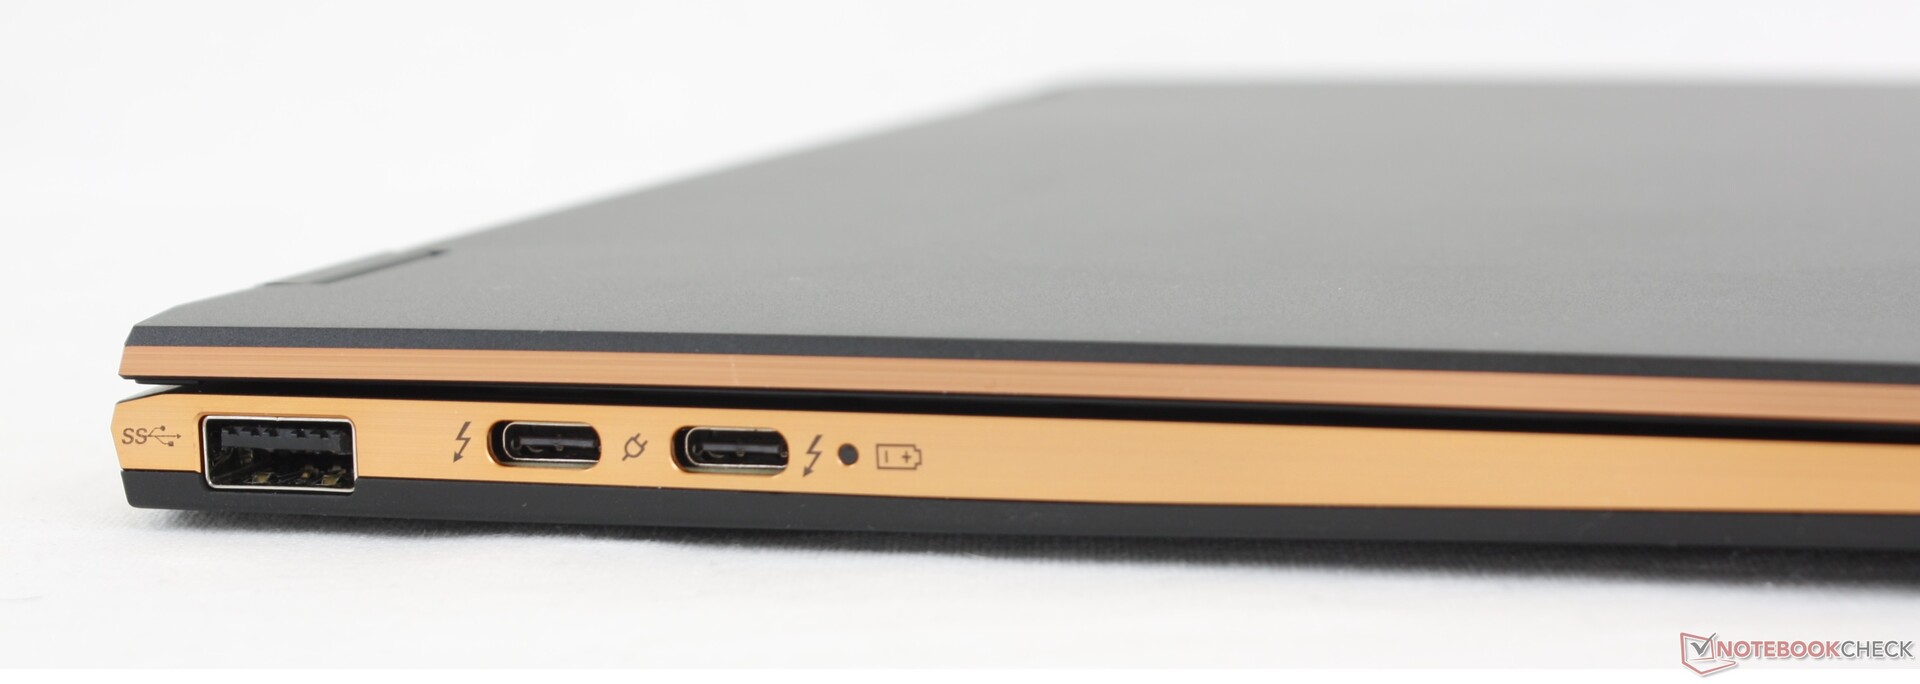
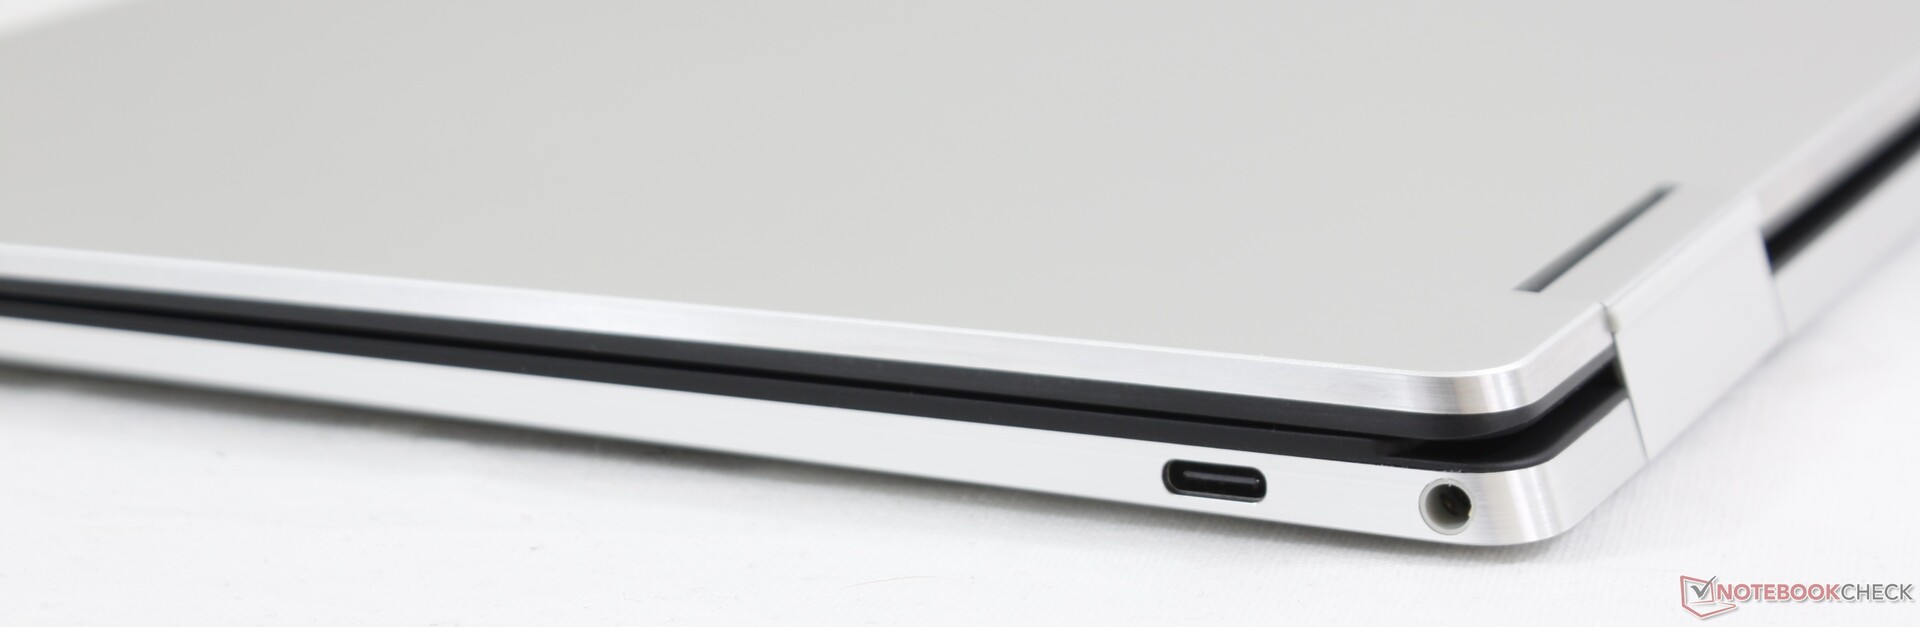
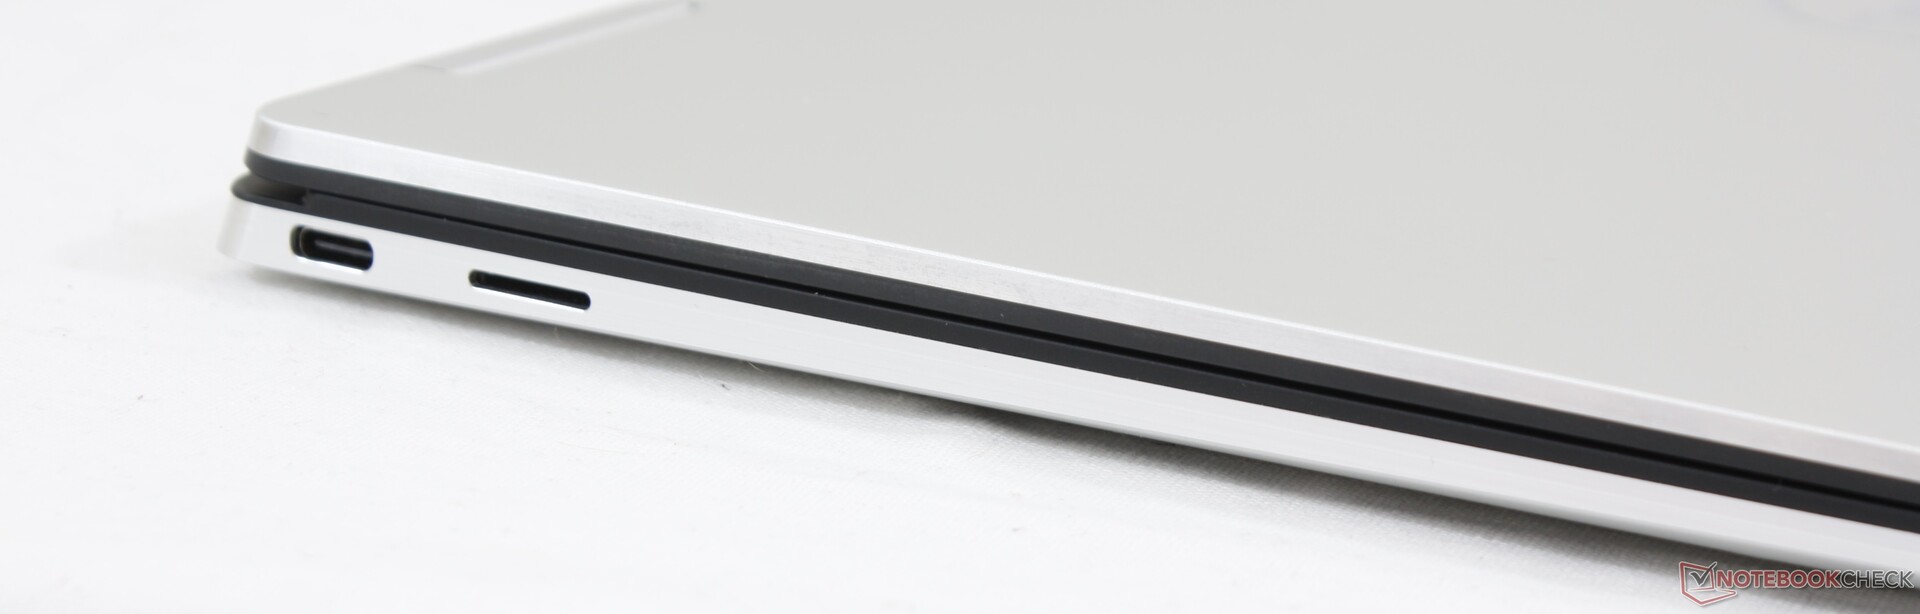
Ports | 3x USB-C (2x Thunderbolt 4 + DisplayPort + Power Delivery) 1x USB-A 1x 3.5 mm combo audio MicroSD reader | 2x USB-C (2x Thunderbolt 3 + DisplayPort + Power Delivery) 1x 3.5 mm combo audio MicroSD reader |
| MSI Summit E13 Flip Evo A11MT Sharp LQ134N1JW53, IPS, 13.4", 1920x1200 | Dell XPS 13 7390 2-in-1 Core i7 Sharp LQ134N1, IPS, 13.4", 1920x1200 | |
|---|---|---|
| Display | 0% | |
| Display P3 Coverage (%) | 69.8 | 69.9 0% |
| sRGB Coverage (%) | 98.8 | 99.2 0% |
| AdobeRGB 1998 Coverage (%) | 70.6 | 71.5 1% |
| Response Times | 30% | |
| Response Time Grey 50% / Grey 80% * (ms) | 64 ? | 47.6 ? 26% |
| Response Time Black / White * (ms) | 44 ? | 29.2 ? 34% |
| PWM Frequency (Hz) | 2500 ? | |
| Bildschirm | -15% | |
| Helligkeit Bildmitte (cd/m²) | 551.3 | 549.8 0% |
| Brightness (cd/m²) | 517 | 520 1% |
| Brightness Distribution (%) | 91 | 86 -5% |
| Schwarzwert * (cd/m²) | 0.37 | 0.39 -5% |
| Kontrast (:1) | 1490 | 1410 -5% |
| Delta E Colorchecker * | 1.45 | 2.12 -46% |
| Colorchecker dE 2000 max. * | 2.86 | 3.66 -28% |
| Colorchecker dE 2000 calibrated * | 1.7 | 1.37 19% |
| Delta E Graustufen * | 1.3 | 2.6 -100% |
| Gamma | 2.14 103% | 2.3 96% |
| CCT | 6580 99% | 6884 94% |
| Farbraum (Prozent von AdobeRGB 1998) (%) | 65 | 65.4 1% |
| Color Space (Percent of sRGB) (%) | 99 | 99.7 1% |
| Durchschnitt gesamt (Programm / Settings) | 5% /
-7% |
* ... kleinere Werte sind besser
Cinebench R23: Multi Core | Single Core
Cinebench R15: CPU Single 64Bit | CPU Multi 64Bit
Blender: v2.79 BMW27 CPU
7-Zip 18.03: 7z b 4 -mmt1 | 7z b 4
Geekbench 5.5: Single-Core | Multi-Core
HWBOT x265 Benchmark v2.2: 4k Preset
LibreOffice : 20 Documents To PDF
R Benchmark 2.5: Overall mean
| Cinebench R20 / CPU (Multi Core) | |
| MSI Summit E13 Flip Evo A11MT | |
| Dell XPS 13 7390 2-in-1 Core i7 | |
| Cinebench R20 / CPU (Single Core) | |
| MSI Summit E13 Flip Evo A11MT | |
| Dell XPS 13 7390 2-in-1 Core i7 | |
| Cinebench R23 / Multi Core | |
| MSI Summit E13 Flip Evo A11MT | |
| Cinebench R23 / Single Core | |
| MSI Summit E13 Flip Evo A11MT | |
| Cinebench R15 / CPU Single 64Bit | |
| MSI Summit E13 Flip Evo A11MT | |
| Dell XPS 13 7390 2-in-1 Core i7 | |
| Cinebench R15 / CPU Multi 64Bit | |
| MSI Summit E13 Flip Evo A11MT | |
| Dell XPS 13 7390 2-in-1 Core i7 | |
| Blender / v2.79 BMW27 CPU | |
| Dell XPS 13 7390 2-in-1 Core i7 | |
| MSI Summit E13 Flip Evo A11MT | |
| 7-Zip 18.03 / 7z b 4 -mmt1 | |
| MSI Summit E13 Flip Evo A11MT | |
| Dell XPS 13 7390 2-in-1 Core i7 | |
| 7-Zip 18.03 / 7z b 4 | |
| MSI Summit E13 Flip Evo A11MT | |
| Dell XPS 13 7390 2-in-1 Core i7 | |
| Geekbench 5.5 / Single-Core | |
| MSI Summit E13 Flip Evo A11MT | |
| Geekbench 5.5 / Multi-Core | |
| MSI Summit E13 Flip Evo A11MT | |
| HWBOT x265 Benchmark v2.2 / 4k Preset | |
| MSI Summit E13 Flip Evo A11MT | |
| Dell XPS 13 7390 2-in-1 Core i7 | |
| LibreOffice / 20 Documents To PDF | |
| MSI Summit E13 Flip Evo A11MT | |
| R Benchmark 2.5 / Overall mean | |
| MSI Summit E13 Flip Evo A11MT | |
* ... kleinere Werte sind besser
| PCMark 10 | |
| Score | |
| MSI Summit E13 Flip Evo A11MT | |
| Dell XPS 13 7390 2-in-1 Core i7 | |
| Essentials | |
| Dell XPS 13 7390 2-in-1 Core i7 | |
| MSI Summit E13 Flip Evo A11MT | |
| Productivity | |
| Dell XPS 13 7390 2-in-1 Core i7 | |
| MSI Summit E13 Flip Evo A11MT | |
| Digital Content Creation | |
| MSI Summit E13 Flip Evo A11MT | |
| Dell XPS 13 7390 2-in-1 Core i7 | |
| 3DMark | |
| 1920x1080 Fire Strike Graphics | |
| MSI Summit E13 Flip Evo A11MT | |
| Dell XPS 13 9310 Core i7 4K | |
| Dell XPS 13 7390 2-in-1 Core i7 | |
| 2560x1440 Time Spy Graphics | |
| MSI Summit E13 Flip Evo A11MT | |
| Dell XPS 13 9310 Core i7 4K | |
| Dell XPS 13 7390 2-in-1 Core i7 | |
| 2560x1440 Time Spy Score | |
| MSI Summit E13 Flip Evo A11MT | |
| Dell XPS 13 9310 Core i7 4K | |
| Dell XPS 13 7390 2-in-1 Core i7 | |
| 3DMark 11 | |
| 1280x720 Performance GPU | |
| MSI Summit E13 Flip Evo A11MT | |
| Dell XPS 13 9310 Core i7 4K | |
| Dell XPS 13 7390 2-in-1 Core i7 | |
| 1280x720 Performance Combined | |
| MSI Summit E13 Flip Evo A11MT | |
| Dell XPS 13 9310 Core i7 4K | |
| Dell XPS 13 7390 2-in-1 Core i7 | |
| MSI Summit E13 Flip Evo A11MT Iris Xe G7 96EUs, i7-1185G7, Phison 1TB SM2801T24GKBB4S-E162 | Dell XPS 13 7390 2-in-1 Core i7 Iris Plus Graphics G7 (Ice Lake 64 EU), i7-1065G7, Toshiba BG4 KBG40ZPZ512G | |
|---|---|---|
| Geräuschentwicklung | -4% | |
| aus / Umgebung * (dB) | 24.5 | 28.1 -15% |
| Idle min * (dB) | 24.7 | 28.1 -14% |
| Idle avg * (dB) | 24.7 | 28.1 -14% |
| Idle max * (dB) | 26.4 | 28.1 -6% |
| Last avg * (dB) | 37.8 | 31.7 16% |
| Witcher 3 ultra * (dB) | 41.4 | 43.4 -5% |
| Last max * (dB) | 48.8 | 43.4 11% |
* ... kleinere Werte sind besser
| MSI Summit E13 Flip Evo A11MT i7-1185G7, Iris Xe G7 96EUs, 70 Wh | Dell XPS 13 7390 2-in-1 Core i7 i7-1065G7, Iris Plus Graphics G7 (Ice Lake 64 EU), 51 Wh | |
|---|---|---|
| Akkulaufzeit | -20% | |
| Idle (h) | 21.1 | |
| WLAN (h) | 11.2 | 9 -20% |
| Last (h) | 1.8 |
Source(s)
Preisvergleich

