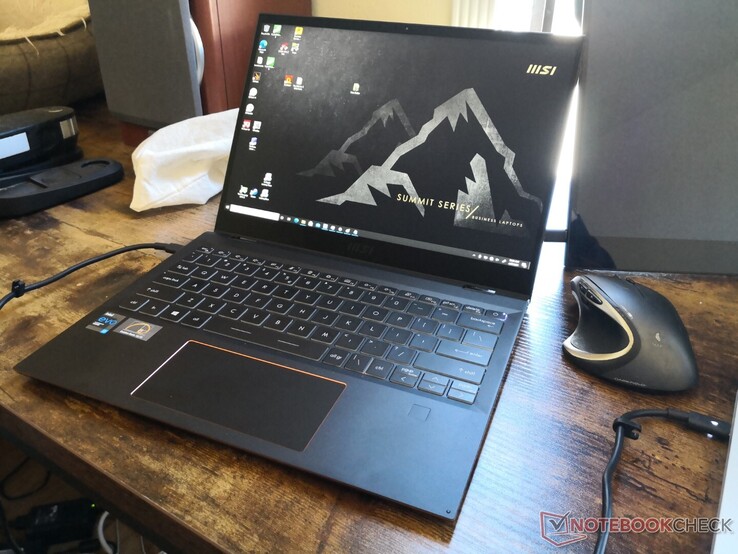
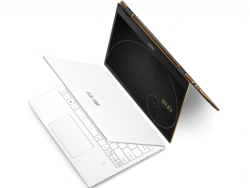
Das Convertible MSI Summit E13 Flip Evo im Test: Ein zeitloses Design
War MSI in der Vergangenheit vor allem für eine ganze Reihe an Gaming-Laptops bekannt, prescht das Unternehmen mittlerweile in immer neue Kategorien vor, beispielsweise mit ihren mobilen Workstations und Ultrabooks mit Core-U-CPUs wie der Modern- und Prestige-Serien. Den neuste Ableger markiert Die High-End-Serie Summit , welche sich an sogenannte "Prosumers" richtet, welche bereit sind für ein luxuriöseres Design und eine bessere User Experience auch mal ein paar Euro mehr auf den Tisch zu legen. MSI hat Ende letzten Jahres eine handvoll neuer Modelle wie das 13,4 Zoll große Summit E13 Flip, die 14 Zoll großen Summit B14 und E14 sowie die 15,6 Zoll großen Summit B15 und E15 angekündigt.
Unser Testmodell ist nun das Convertible Summit E13 Flip welches je nach Speicherausstattung für $1600 bis $1900 USD (~1.322 bis 1.570 Euro) angeboten wird. Mit Ausnahme des Speichers ist die restliche Ausstattung bei allen Konfigurationen festgelegt: Ein Core i7-1185G7 und ein 1200p-IPS-Touchscreen im Seitenverhältnis von 16:10. Konkurrenz findet sich in anderen High-End-Convertibles und-Subnotebooks wie dem Dell XPS 13 9310 2-in-1, dem Lenovo ThinkPad X1 Yoga, dem Asus ZenBook Flip S oder dem HP Spectre x360 13 oder Spectre x360 14.
Weitere MSI-Tests:
Potentielle Konkurrenten im Vergleich
Bew. | Datum | Modell | Gewicht | Dicke | Größe | Auflösung | Preis ab |
|---|---|---|---|---|---|---|---|
| 86.9 % v7 (old) | 04 / 2021 | MSI Summit E13 Flip Evo A11MT i7-1185G7, Iris Xe G7 96EUs | 1.4 kg | 14.9 mm | 13.40" | 1920x1200 | |
| 86.3 % v7 (old) | 10 / 2019 | Dell XPS 13 7390 2-in-1 Core i7 i7-1065G7, Iris Plus Graphics G7 (Ice Lake 64 EU) | 1.3 kg | 13 mm | 13.40" | 1920x1200 | |
| 89.4 % v7 (old) | 12 / 2020 | HP Spectre x360 14t-ea000 i7-1165G7, Iris Xe G7 96EUs | 1.3 kg | 17.2 mm | 13.50" | 1920x1280 | |
| 87.8 % v7 (old) | 03 / 2021 | Huawei MateBook X Pro 2021 i7-1165G7, Iris Xe G7 96EUs | 1.3 kg | 14.6 mm | 13.90" | 3000x2000 | |
| 87.3 % v7 (old) | 04 / 2021 | Lenovo ThinkPad X1 Titanium Yoga G1 20QA001RGE i7-1160G7, Iris Xe G7 96EUs | 1.2 kg | 11.5 mm | 13.50" | 2256x1504 | |
| 84.1 % v7 (old) | 01 / 2021 | Asus Zenbook 14 UX435EG i7-1165G7, GeForce MX450 | 1.3 kg | 16.9 mm | 14.00" | 1920x1080 |
Gehäuse
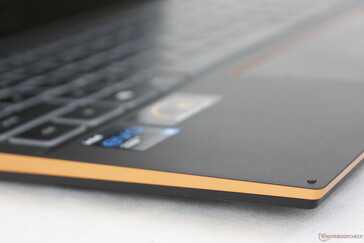
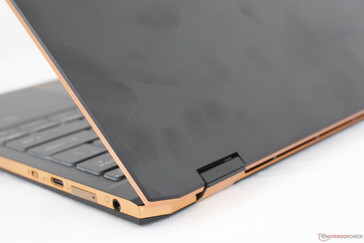
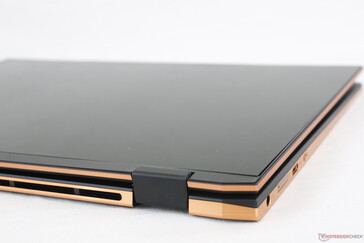
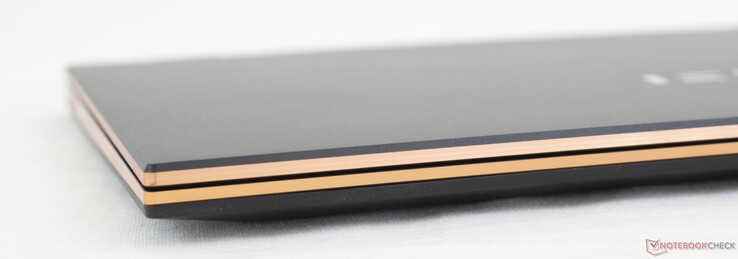
Die aschgrauen Oberflächen mit ihren bronzefarbenen Rändern heben sich visuell von den hellgrauen Modellen der Modern- und Prestige-Serien ab. Tatsächlich erinnert das Design eher an HPs Spectre-Serie. Selbst das stilvolle, kursive MSI-Logo auf der Oberseite und die hinteren, "Diamant-geschnittenen" Ecken ähneln stark den aktuellen Spectre-Laptops. Das soll keineswegs eine Kritik an MSI sein, wir geben hier nur unsere ersten, persönlichen Eindrücke zum Summit-Design wieder.
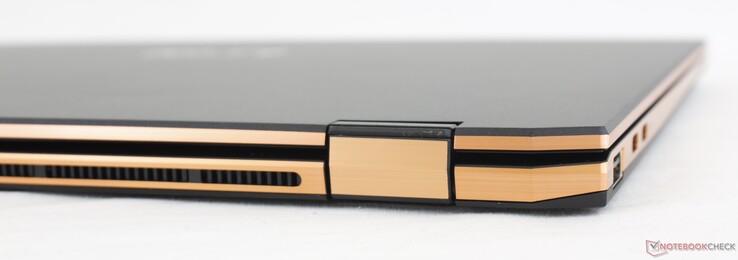
Die Stabilität der Basis überzeugt, sie gibt beim Biegen und Drücken nur wenig nach und auch keine Knarzgeräusche von sich. Der Displaydeckel ist jedoch etwas flexibler als beim Dell XPS 13 oder HP Spectre x360 13 und hinterlässt somit einen etwas schwächeren Eindruck. Die Scharniere ist wohl der Aspekt, welcher uns am Summit E13 Flip am meisten stört, sie greifen schwach, besonders wenn man über einen Winkel von 140 Grad kommt. Außerdem tendiert der Deckel beim Aufklappen und Winkel-einstellen zum Nachwippen.
So gut es auch aussehen mag, das Summit E13 Flip ist keineswegs das kleinste Gerät seiner Kategorie. Das System ist sowohl in Länge als auch breite größer als das XPS 13 2-in-1 oder Spectre x360 14 und das obwohl Letzteres ein etwas größeres 13,5-Zoll-Display bietet. Es ist auch etwa 100 bis 200 g schwerer als das Lenovo X1 Titanium Yoga. Das bedeutet natürlich nicht, dass das MSI weder leicht noch mobil wäre, aber in dieser Hinsicht gibt es dennoch bessere Optionen.
Anschlüsse
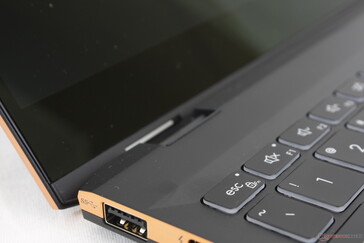
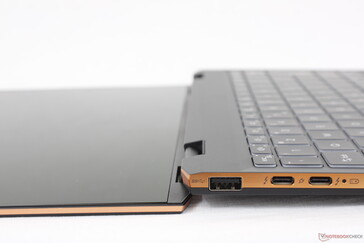
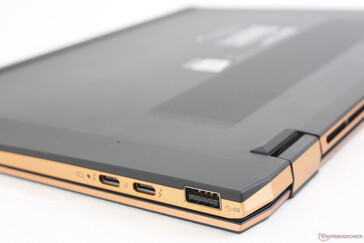
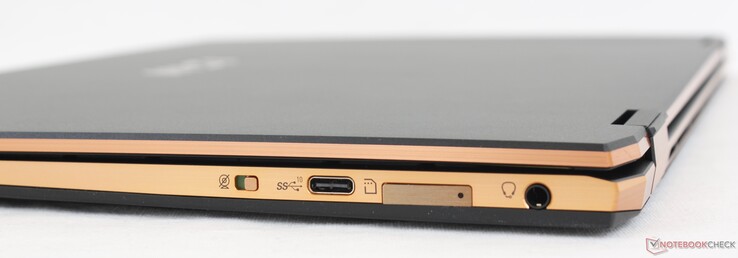
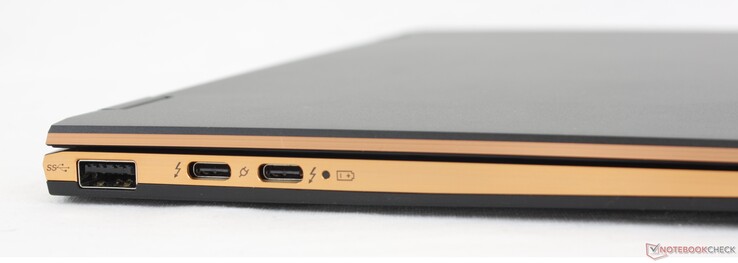
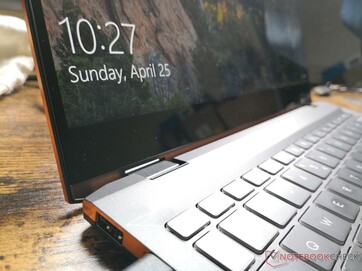
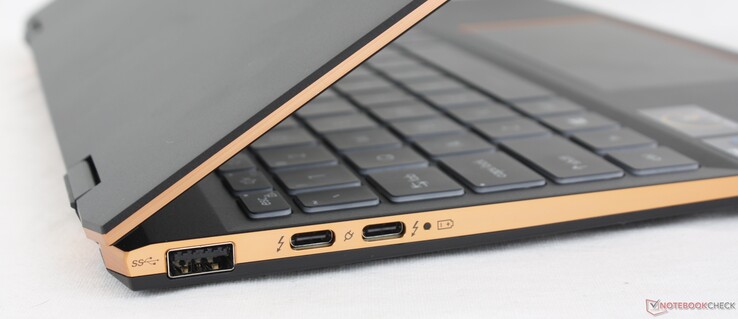
Die Anschlussvielfalt ist angesichts der Kategorie respektabel, es gibt hier mehr Anschlüsse als beim HP Spectre x360 14 oder dem Dell XPS 13 7390 2-in-1. Beachtenswert ist vor allem, dass es gleich drei USB-C-Ports gibt, wodurch das Gerät kompatibel für diverse Adapter ist. Power-Delivery- und DisplayPort-Support gibt es aber nur bei den beiden USB-C-Ports auf der linken Seite, der USB-C-Anschluss rechts unterstützt beides nicht.
Etwas bizarre ist, dass der MSI-Laptop über gleich zwei Webcam-Shutter verfügt: Einen auf der Tastatur und einen an der rechten Seite. Einer hätte es wohl auch getan und die Dinge vereinfacht.
SD-Kartenleser
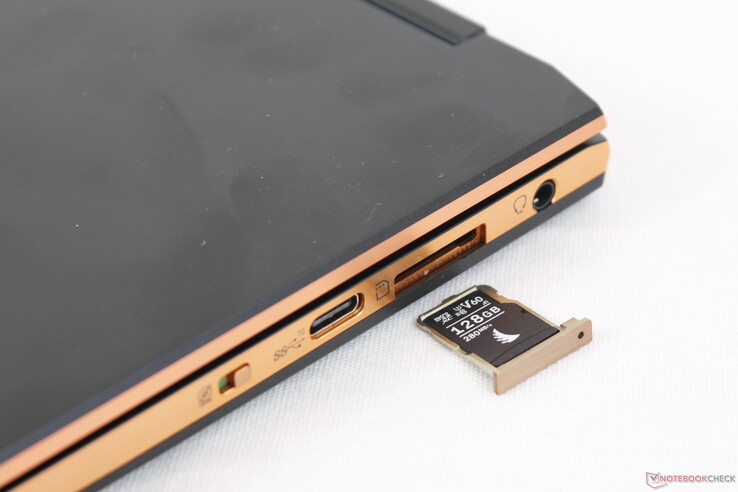
Im Gegensatz zu anderen Laptops braucht man beim Summit eine SIM-Nadel, um den MicroSD-Leser öffnen zu können, was die Sache ziemlich fummelig macht. Die Transferraten sind zudem nur halb so schnell wie beim Spectre x360 14 oder XPS 13.
| SD Card Reader | |
| average JPG Copy Test (av. of 3 runs) | |
| HP Spectre x360 14t-ea000 (Toshiba Exceria Pro M501 microSDXC 32GB) | |
| Dell XPS 13 7390 2-in-1 Core i7 (Toshiba Exceria Pro M501 64 GB UHS-II) | |
| Asus Zenbook 14 UX435EG (Toshiba Exceria Pro M501 microSDXC 64GB) | |
| MSI Summit E13 Flip Evo A11MT (AV PRO microSD 128 GB V60) | |
| maximum AS SSD Seq Read Test (1GB) | |
| HP Spectre x360 14t-ea000 (Toshiba Exceria Pro M501 microSDXC 32GB) | |
| Dell XPS 13 7390 2-in-1 Core i7 (Toshiba Exceria Pro M501 64 GB UHS-II) | |
| Asus Zenbook 14 UX435EG (Toshiba Exceria Pro M501 microSDXC 64GB) | |
| MSI Summit E13 Flip Evo A11MT (AV PRO microSD 128 GB V60) | |
Kommunikation
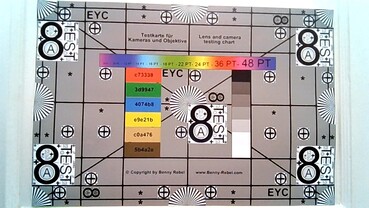
Webcam
Wartung
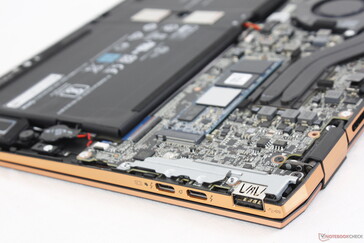
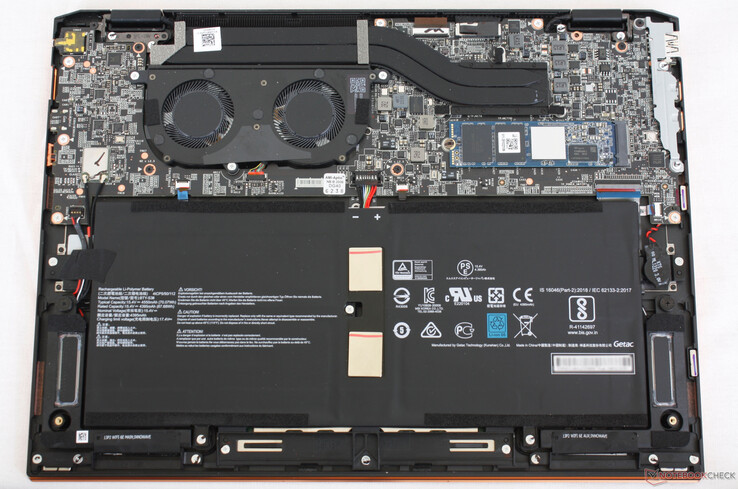
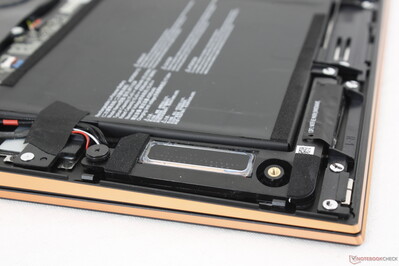
Die Unterseite wird durch nur vier Kreuzschrauben gesichert. Allerdings muss beim Öffnen leider ein Werksaufkleber "gebrochen" werden und die beiden hinteren Schrauben verbergen sich unter den Gummifüßen. Somit ist das Summit E13 Flip etwas schwieriger zu warten als die meisten anderen Laptops von MSI.
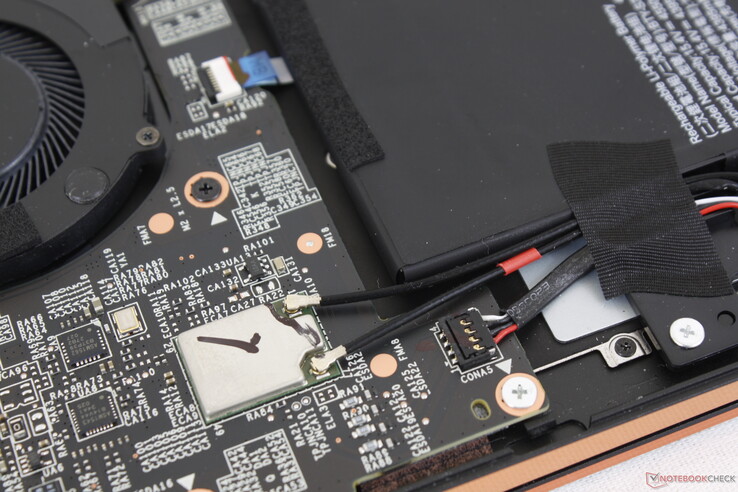
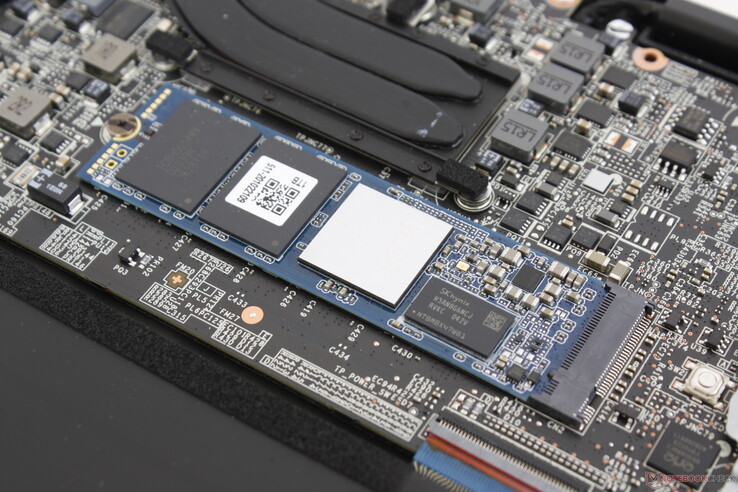
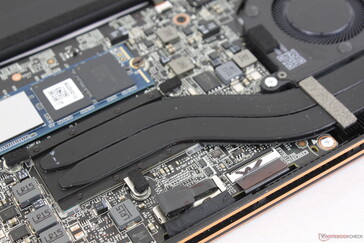
Im Inneren kann nur am M.2-2280-Slot aufgewertet werden, RAM und WLAN sind jeweils fest verlötet.
Zubehör und Garantie
In der Packung befinden sich neben dem üblichen Papierkram noch ein aktiver MSI-Eingabestift sowie eine Schutzhülle, ein Reinigungstuch liegt nicht bei.
Es greift die Standard-1-Jahres-Garantie, zusätzlichen Schutz gibt es, wenn man das Convertible über entsprechende PC-Händler bestellt.
Eingabegeräte
Tastatur
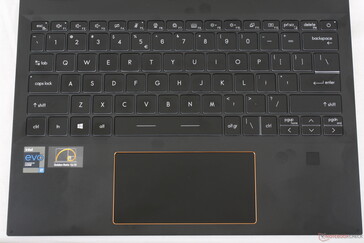
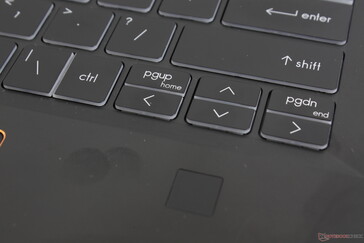
Das Tastanlayout wurde für die Summit-Serie komplett neu gestaltet. Die ehemals vollwertigen Bildauf/ab- sowie Entf-Tasten beim Prestige 14, fallen auf dem Summit E13 Flip nun deutlich kleiner aus. Die Strg-Taste ist zudem neben die "\"-Taste gequetscht, was bei der Benutzung nervt.
Der Hub ist seicht und das Feedback eher von der zarten Sorte, verglichen mit den festeren und tieferen Tasten eines HP Spectre. MSI bietet hier leider keine innovativen Elemente an, die Schreiberfahrung ist vergleichbar mit der auf einem Mittelklasse-Ultrabook wie dem Asus VivoBook.
Touchpad
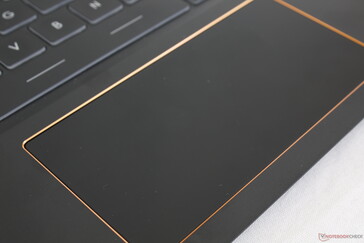
Das breite Clickpad ist etwas größer als das auf dem HP Spectre x360 13 (~12 x 6 cm vs. 11,1 x 5,6 cm). Die Oberfläche ist komplett glatt ohne spürbare Struktur, nur bei sehr langsamen Bewegungen kann es etwas stocken. Die Kontrolle des Cursors fühlt sich etwas direkter an als bei den meisten anderen Subnotebooks, was an der nativen 120-Hz-Bildwiederholrate des Displays liegen dürfte.
Die integrierten Maustasten geben ein moderates Feedback ab und klicken verhältnismäßig leise. Zwar gibt es grundsätzlich nichts an den Maustasten auszusetzen, dennoch hätten wir uns ein festeres und lauteres Feedback für eine zufriedenstellendere Klickerfahrung gewünscht.
Display
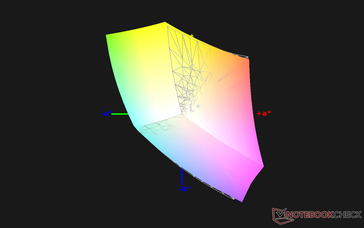
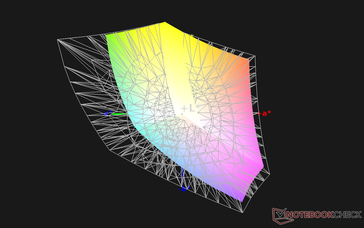
Der Bildschirm ist hell (500 Nits) und bietet gute Kontraste und Farben. Damit macht das Display im Summit dem 13,4-Zoll-Touchscreen im Dell XPS 13 2-in-1 Konkurrenz. Tatsächlich nutzen beide Laptops sehr ähnliche Sharp-Panels (LQ134N1JW53 vs. LQ134N1), was die Ähnlichkeit beider Monitore erklären dürfte.
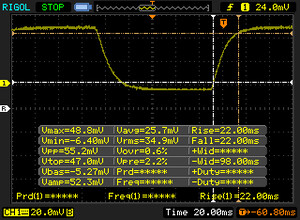
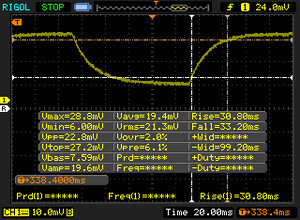
Der entscheidende Unterschied zwischen dem MSI und den meisten anderen Subnotebooks wie dem Dell XPS 13 ist die native 120-Hz-Refreshrate für besonders flüssige Bewegungen. Die Reaktionszeiten (Schwarz-Weiß, Grau-Grau) sind leider deutlich langsamer und sorgen somit für wahrnehmbares Ghosting.
| |||||||||||||||||||||||||
Ausleuchtung: 91 %
Helligkeit Akku: 551.3 cd/m²
Kontrast: 1490:1 (Schwarzwert: 0.37 cd/m²)
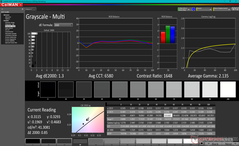
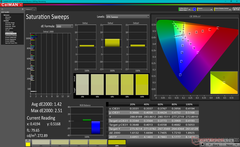
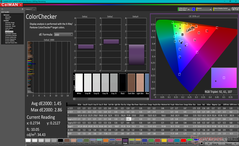
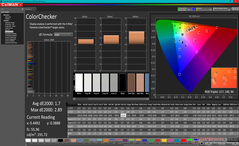
ΔE ColorChecker Calman: 1.45 | ∀{0.5-29.43 Ø4.77}
calibrated: 1.7
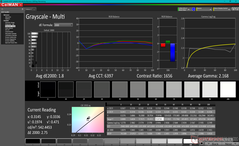
ΔE Greyscale Calman: 1.3 | ∀{0.09-98 Ø5}
99% sRGB (Argyll 1.6.3 3D)
65% AdobeRGB 1998 (Argyll 1.6.3 3D)
70.6% AdobeRGB 1998 (Argyll 3D)
98.8% sRGB (Argyll 3D)
69.8% Display P3 (Argyll 3D)
Gamma: 2.14
CCT: 6580 K
| MSI Summit E13 Flip Evo A11MT Sharp LQ134N1JW53, IPS, 13.4", 1920x1200 | Dell XPS 13 7390 2-in-1 Core i7 Sharp LQ134N1, IPS, 13.4", 1920x1200 | HP Spectre x360 14t-ea000 LG Philips LGD0663, IPS, 13.5", 1920x1280 | Huawei MateBook X Pro 2021 TIANMA XM, IPS, 13.9", 3000x2000 | Lenovo ThinkPad X1 Titanium Yoga G1 20QA001RGE LPM135M467, IPS, 13.5", 2256x1504 | Asus Zenbook 14 UX435EG Au Optronics B140HAN03.2, IPS, 14", 1920x1080 | |
|---|---|---|---|---|---|---|
| Display | 0% | -4% | -6% | -11% | ||
| Display P3 Coverage (%) | 69.8 | 69.9 0% | 65.8 -6% | 64.9 -7% | 60.9 -13% | |
| sRGB Coverage (%) | 98.8 | 99.2 0% | 98.2 -1% | 94.4 -4% | 90.4 -9% | |
| AdobeRGB 1998 Coverage (%) | 70.6 | 71.5 1% | 67.9 -4% | 66.3 -6% | 62.3 -12% | |
| Response Times | 30% | 7% | 41% | 31% | 38% | |
| Response Time Grey 50% / Grey 80% * (ms) | 64 ? | 47.6 ? 26% | 62 ? 3% | 37.6 ? 41% | 53.6 ? 16% | 39 ? 39% |
| Response Time Black / White * (ms) | 44 ? | 29.2 ? 34% | 39.6 ? 10% | 26.4 ? 40% | 24 ? 45% | 28 ? 36% |
| PWM Frequency (Hz) | 2500 ? | |||||
| Bildschirm | -15% | -26% | -4% | -17% | -85% | |
| Helligkeit Bildmitte (cd/m²) | 551.3 | 549.8 0% | 443.5 -20% | 502 -9% | 466 -15% | 323 -41% |
| Brightness (cd/m²) | 517 | 520 1% | 394 -24% | 474 -8% | 454 -12% | 313 -39% |
| Brightness Distribution (%) | 91 | 86 -5% | 78 -14% | 89 -2% | 94 3% | 80 -12% |
| Schwarzwert * (cd/m²) | 0.37 | 0.39 -5% | 0.17 54% | 0.33 11% | 0.23 38% | 0.36 3% |
| Kontrast (:1) | 1490 | 1410 -5% | 2609 75% | 1521 2% | 2026 36% | 897 -40% |
| Delta E Colorchecker * | 1.45 | 2.12 -46% | 2.7 -86% | 1.35 7% | 2.1 -45% | 4.86 -235% |
| Colorchecker dE 2000 max. * | 2.86 | 3.66 -28% | 4.36 -52% | 3.67 -28% | 4.5 -57% | 7.52 -163% |
| Colorchecker dE 2000 calibrated * | 1.7 | 1.37 19% | 2.61 -54% | 1.2 29% | 3.64 -114% | |
| Delta E Graustufen * | 1.3 | 2.6 -100% | 3.4 -162% | 1.7 -31% | 2.7 -108% | 4.83 -272% |
| Gamma | 2.14 103% | 2.3 96% | 2.09 105% | 2.24 98% | 2.08 106% | 2.64 83% |
| CCT | 6580 99% | 6884 94% | 6144 106% | 6440 101% | 6210 105% | 7405 88% |
| Farbraum (Prozent von AdobeRGB 1998) (%) | 65 | 65.4 1% | 62.1 -4% | 61.1 -6% | 61.1 -6% | 57.5 -12% |
| Color Space (Percent of sRGB) (%) | 99 | 99.7 1% | 98.5 -1% | 94.3 -5% | 94.9 -4% | 90.3 -9% |
| Durchschnitt gesamt (Programm / Settings) | 5% /
-7% | -8% /
-18% | 10% /
2% | 7% /
-9% | -19% /
-56% |
* ... kleinere Werte sind besser
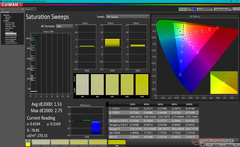
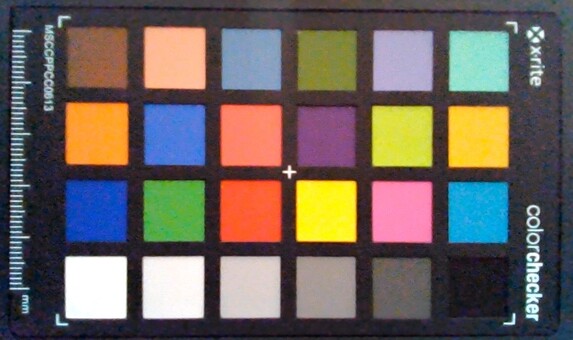
Unser X-Rite-Farbmessgerät zeigt ein gut kalibriertes Display ab Werk an, die durchschnittlichen DeltaE-Graustufen- und ColorChecker-Werte betragen nur 1,3 und 1,4. Eine erneute Kalibrierung durch den Nutzer ist nicht notwendig.
Reaktionszeiten (Response Times) des Displays
| ↔ Reaktionszeiten Schwarz zu Weiß | ||
|---|---|---|
| 44 ms ... steigend ↗ und fallend ↘ kombiniert | ↗ 22 ms steigend | |
| ↘ 22 ms fallend | ||
| Die gemessenen Reaktionszeiten sind langsam und dadurch für viele Spieler wahrscheinlich zu langsam. Im Vergleich rangierten die bei uns getesteten Geräte von 0.1 (Minimum) zu 240 (Maximum) ms. » 98 % aller Screens waren schneller als der getestete. Daher sind die gemessenen Reaktionszeiten schlechter als der Durchschnitt aller vermessenen Geräte (20.1 ms). | ||
| ↔ Reaktionszeiten 50% Grau zu 80% Grau | ||
| 64 ms ... steigend ↗ und fallend ↘ kombiniert | ↗ 30.8 ms steigend | |
| ↘ 33.2 ms fallend | ||
| Die gemessenen Reaktionszeiten sind langsam und dadurch für viele Spieler wahrscheinlich zu langsam. Im Vergleich rangierten die bei uns getesteten Geräte von 0.165 (Minimum) zu 636 (Maximum) ms. » 97 % aller Screens waren schneller als der getestete. Daher sind die gemessenen Reaktionszeiten schlechter als der Durchschnitt aller vermessenen Geräte (31.5 ms). | ||
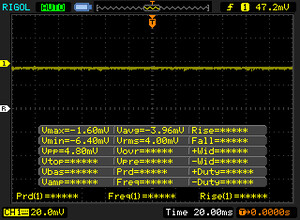
Bildschirm-Flackern / PWM (Pulse-Width Modulation)
| Flackern / PWM nicht festgestellt | |||
Im Vergleich: 53 % aller getesteten Geräte nutzten kein PWM um die Helligkeit zu reduzieren. Wenn PWM eingesetzt wurde, dann bei einer Frequenz von durchschnittlich 8042 (Minimum 5, Maximum 343500) Hz. | |||
Im Freien sind Spiegelungen durch die glänzende Glasoberfläche unvermeidlich und an hellen Tagen sieht der Bildschirminhalt verwaschen aus. Glücklicherweise ist das Display hell genug, um viel von den Spiegelungen abzumildern, zumindest im Schatten. Die Benutzbarkeit im Freien ist mit der des XPS 13 2-in-1 zu vergleichen, beide Modelle verfügen über eine ähnliche Helligkeit und einen ähnlichen Kontrastwert.
Leistung
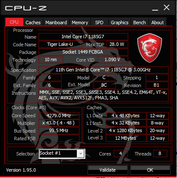
Momentan werden alle SKUs mit einem Core i7-1185G7 (Gen 11) ausgeliefert, andere Optionen gibt es nicht. Interessant wäre zum Beispiel eine Option mit Core i7-1165G7 für alle Nutzer gewesen, die an vPro nicht interessiert sind. Die Leistungsunterschiede zwischen einem Core i7-1165G7 und einem i7-1185G7 sind bestenfalls minimal.
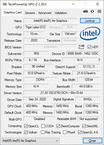
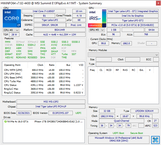
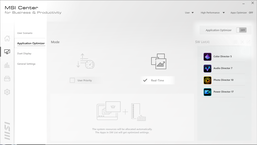
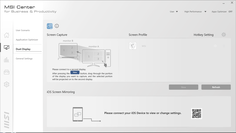
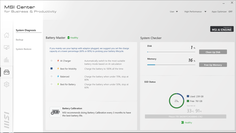
Eine Iris Xe Graphics ist standardmäßig bei allen SKUs integriert, dedizierte Grafiklösungen werden nicht angeboten. Über das MSI Center haben wir den Laptop in den Höchstleistungsmodus versetzt, um in den folgenden Benchmarks die besten Ergebnisse zu erzielen. Wir empfehlen allen Nutzern sich mit dem MSI Center auseinanderzusetzen, alle wesentlichen Systemeinstellungen sind hier zu finden.
Prozessor
Die CPU-Leistung ist ausgezeichnet und der Turbo Boost stabiler als bei vielen anderen Subnotebooks mit der gleichen Tiger-Lake-U-CPU. Beispielsweise liegen das aktuelle Lenovo Yoga 9i 14 und das Huawei MateBook X Pro grob 13 und 25 Prozent hinter dem Summit, wenn man die Leistungsdrosselung auf allen Systemen mit einbezieht. Der konkurrierende Ryzen 7 4700U ist weiterhin der schnellste Prozessor in Multi-Thread-Anwendungen, aber langsamer bei Single-Thread-Lasten.
Cinebench R23: Multi Core | Single Core
Cinebench R15: CPU Single 64Bit | CPU Multi 64Bit
Blender: v2.79 BMW27 CPU
7-Zip 18.03: 7z b 4 -mmt1 | 7z b 4
Geekbench 5.5: Single-Core | Multi-Core
HWBOT x265 Benchmark v2.2: 4k Preset
LibreOffice : 20 Documents To PDF
R Benchmark 2.5: Overall mean
| Cinebench R20 / CPU (Multi Core) | |
| Asus VivoBook Flip 14 TM420IA | |
| MSI Summit E13 Flip Evo A11MT | |
| HP Envy x360 13-ay0010nr | |
| Lenovo ThinkBook 14 G2 ITL 20VD008WGE | |
| Durchschnittliche Intel Core i7-1185G7 (1425 - 2493, n=28) | |
| Lenovo Yoga Slim 7i Carbon 13 ITL | |
| Acer Spin 5 SP513-54N-79EY | |
| Huawei MateBook X Pro 2021 | |
| Asus Zenbook S UX393JA | |
| Samsung Galaxy Book Flex 13.3 | |
| HP EliteBook x360 830 G6 | |
| Cinebench R20 / CPU (Single Core) | |
| MSI Summit E13 Flip Evo A11MT | |
| Durchschnittliche Intel Core i7-1185G7 (489 - 593, n=28) | |
| Lenovo Yoga Slim 7i Carbon 13 ITL | |
| Lenovo ThinkBook 14 G2 ITL 20VD008WGE | |
| Huawei MateBook X Pro 2021 | |
| Asus VivoBook Flip 14 TM420IA | |
| Acer Spin 5 SP513-54N-79EY | |
| Asus Zenbook S UX393JA | |
| HP Envy x360 13-ay0010nr | |
| Samsung Galaxy Book Flex 13.3 | |
| HP EliteBook x360 830 G6 | |
| Cinebench R23 / Multi Core | |
| MSI Summit E13 Flip Evo A11MT | |
| Lenovo ThinkBook 14 G2 ITL 20VD008WGE | |
| Durchschnittliche Intel Core i7-1185G7 (3610 - 6383, n=24) | |
| Huawei MateBook X Pro 2021 | |
| Lenovo Yoga Slim 7i Carbon 13 ITL | |
| Cinebench R23 / Single Core | |
| MSI Summit E13 Flip Evo A11MT | |
| Durchschnittliche Intel Core i7-1185G7 (1251 - 1532, n=24) | |
| Lenovo ThinkBook 14 G2 ITL 20VD008WGE | |
| Lenovo Yoga Slim 7i Carbon 13 ITL | |
| Huawei MateBook X Pro 2021 | |
| Cinebench R15 / CPU Single 64Bit | |
| Lenovo Yoga Slim 7i Carbon 13 ITL | |
| MSI Summit E13 Flip Evo A11MT | |
| Durchschnittliche Intel Core i7-1185G7 (168 - 230, n=27) | |
| Huawei MateBook X Pro 2021 | |
| Lenovo ThinkBook 14 G2 ITL 20VD008WGE | |
| Asus VivoBook Flip 14 TM420IA | |
| Asus Zenbook S UX393JA | |
| Acer Spin 5 SP513-54N-79EY | |
| HP Envy x360 13-ay0010nr | |
| Samsung Galaxy Book Flex 13.3 | |
| HP EliteBook x360 830 G6 | |
| Cinebench R15 / CPU Multi 64Bit | |
| Asus VivoBook Flip 14 TM420IA | |
| Lenovo ThinkBook 14 G2 ITL 20VD008WGE | |
| Durchschnittliche Intel Core i7-1185G7 (617 - 1066, n=32) | |
| MSI Summit E13 Flip Evo A11MT | |
| HP Envy x360 13-ay0010nr | |
| Lenovo Yoga Slim 7i Carbon 13 ITL | |
| Acer Spin 5 SP513-54N-79EY | |
| Huawei MateBook X Pro 2021 | |
| Asus Zenbook S UX393JA | |
| Samsung Galaxy Book Flex 13.3 | |
| HP EliteBook x360 830 G6 | |
| Blender / v2.79 BMW27 CPU | |
| Samsung Galaxy Book Flex 13.3 | |
| Asus Zenbook S UX393JA | |
| Huawei MateBook X Pro 2021 | |
| Acer Spin 5 SP513-54N-79EY | |
| Lenovo Yoga Slim 7i Carbon 13 ITL | |
| HP Envy x360 13-ay0010nr | |
| Durchschnittliche Intel Core i7-1185G7 (478 - 745, n=28) | |
| Lenovo ThinkBook 14 G2 ITL 20VD008WGE | |
| MSI Summit E13 Flip Evo A11MT | |
| Asus VivoBook Flip 14 TM420IA | |
| 7-Zip 18.03 / 7z b 4 -mmt1 | |
| Lenovo Yoga Slim 7i Carbon 13 ITL | |
| MSI Summit E13 Flip Evo A11MT | |
| Huawei MateBook X Pro 2021 | |
| Durchschnittliche Intel Core i7-1185G7 (3678 - 5507, n=27) | |
| Lenovo ThinkBook 14 G2 ITL 20VD008WGE | |
| Asus Zenbook S UX393JA | |
| HP EliteBook x360 830 G6 | |
| Asus VivoBook Flip 14 TM420IA | |
| Acer Spin 5 SP513-54N-79EY | |
| HP Envy x360 13-ay0010nr | |
| Samsung Galaxy Book Flex 13.3 | |
| 7-Zip 18.03 / 7z b 4 | |
| Asus VivoBook Flip 14 TM420IA | |
| MSI Summit E13 Flip Evo A11MT | |
| Lenovo ThinkBook 14 G2 ITL 20VD008WGE | |
| Durchschnittliche Intel Core i7-1185G7 (18812 - 27693, n=27) | |
| HP Envy x360 13-ay0010nr | |
| Huawei MateBook X Pro 2021 | |
| Lenovo Yoga Slim 7i Carbon 13 ITL | |
| Acer Spin 5 SP513-54N-79EY | |
| Asus Zenbook S UX393JA | |
| HP EliteBook x360 830 G6 | |
| Samsung Galaxy Book Flex 13.3 | |
| Geekbench 5.5 / Single-Core | |
| Lenovo Yoga Slim 7i Carbon 13 ITL | |
| Durchschnittliche Intel Core i7-1185G7 (1398 - 1626, n=21) | |
| MSI Summit E13 Flip Evo A11MT | |
| Huawei MateBook X Pro 2021 | |
| Lenovo ThinkBook 14 G2 ITL 20VD008WGE | |
| Asus Zenbook S UX393JA | |
| Samsung Galaxy Book Flex 13.3 | |
| Acer Spin 5 SP513-54N-79EY | |
| Asus VivoBook Flip 14 TM420IA | |
| HP Envy x360 13-ay0010nr | |
| Geekbench 5.5 / Multi-Core | |
| Lenovo Yoga Slim 7i Carbon 13 ITL | |
| MSI Summit E13 Flip Evo A11MT | |
| Durchschnittliche Intel Core i7-1185G7 (4620 - 5944, n=21) | |
| Asus VivoBook Flip 14 TM420IA | |
| Huawei MateBook X Pro 2021 | |
| Lenovo ThinkBook 14 G2 ITL 20VD008WGE | |
| Asus Zenbook S UX393JA | |
| HP Envy x360 13-ay0010nr | |
| Samsung Galaxy Book Flex 13.3 | |
| Acer Spin 5 SP513-54N-79EY | |
| HWBOT x265 Benchmark v2.2 / 4k Preset | |
| Asus VivoBook Flip 14 TM420IA | |
| MSI Summit E13 Flip Evo A11MT | |
| HP Envy x360 13-ay0010nr | |
| Lenovo ThinkBook 14 G2 ITL 20VD008WGE | |
| Durchschnittliche Intel Core i7-1185G7 (5.02 - 8.13, n=27) | |
| Lenovo Yoga Slim 7i Carbon 13 ITL | |
| Huawei MateBook X Pro 2021 | |
| Asus Zenbook S UX393JA | |
| Samsung Galaxy Book Flex 13.3 | |
| LibreOffice / 20 Documents To PDF | |
| HP Envy x360 13-ay0010nr | |
| Samsung Galaxy Book Flex 13.3 | |
| Asus VivoBook Flip 14 TM420IA | |
| Acer Spin 5 SP513-54N-79EY | |
| Lenovo ThinkBook 14 G2 ITL 20VD008WGE | |
| Durchschnittliche Intel Core i7-1185G7 (41.3 - 61.7, n=26) | |
| Lenovo Yoga Slim 7i Carbon 13 ITL | |
| Asus Zenbook S UX393JA | |
| MSI Summit E13 Flip Evo A11MT | |
| Huawei MateBook X Pro 2021 | |
| R Benchmark 2.5 / Overall mean | |
| Samsung Galaxy Book Flex 13.3 | |
| Asus Zenbook S UX393JA | |
| Lenovo ThinkBook 14 G2 ITL 20VD008WGE | |
| HP Envy x360 13-ay0010nr | |
| Asus VivoBook Flip 14 TM420IA | |
| Huawei MateBook X Pro 2021 | |
| MSI Summit E13 Flip Evo A11MT | |
| Durchschnittliche Intel Core i7-1185G7 (0.55 - 0.615, n=27) | |
| Lenovo Yoga Slim 7i Carbon 13 ITL | |
* ... kleinere Werte sind besser
Systemleistung
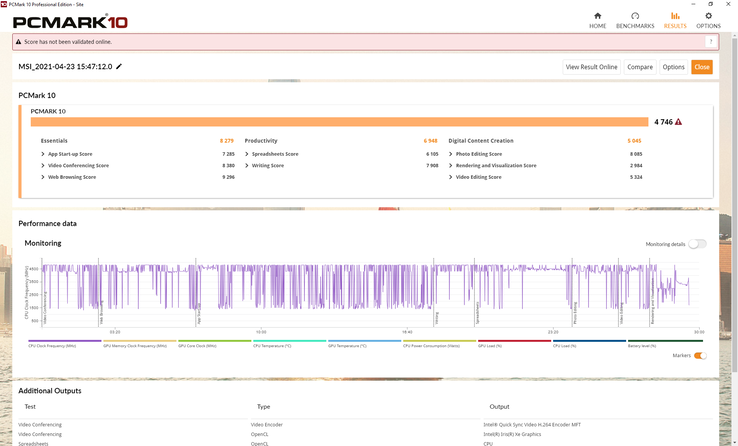
| PCMark 10 Score | 4746 Punkte | |
Hilfe | ||
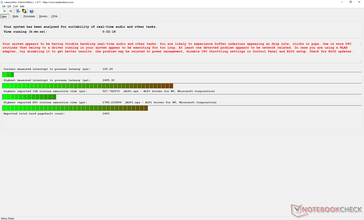
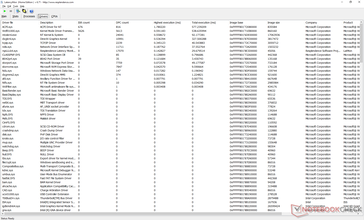
DPC Latency
| DPC Latencies / LatencyMon - interrupt to process latency (max), Web, Youtube, Prime95 | |
| MSI Summit E13 Flip Evo A11MT | |
| HP Spectre x360 14t-ea000 | |
| Lenovo ThinkPad X1 Titanium Yoga G1 20QA001RGE | |
| Huawei MateBook X Pro 2021 | |
| Asus Zenbook 14 UX435EG | |
* ... kleinere Werte sind besser
Massenspeicher
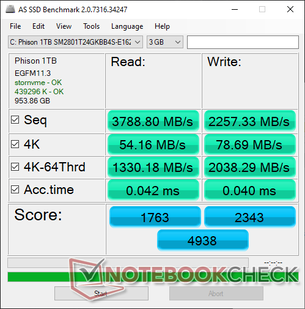
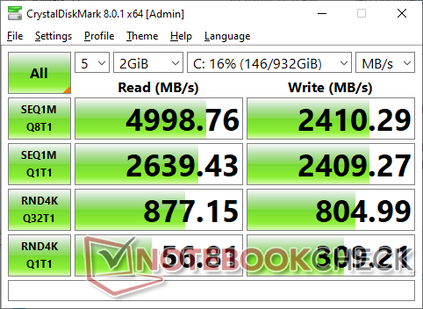
Das Summit E13 Flip ist eines der wenigen Geräte seiner Größe, die einen PCIe-4.0-M.2-Slot anbieten, dieser verspricht eine bestenfalls verdoppelte Geschwindigkeit im Vergleich zu PCIe 3.0. Unsere Testeinheit ist mit der gleichen 1-TB-Phison-PCIe-4.0-NVMe-SSD wie das größere Summit E15 bestückt. Dabei handelt es sich um eine PCIe-4.0-SSD der Mittelklasse, die Transferraten betragen rund 5000 MB/s im Vergleich zu den fast 7000 MB/s der Samsung PM9A1.
Seltsamerweise genehmigt sich die SSD eine Aufwärmzeit im DiskSpd-Loop, bevor sie ihr volles Potential abruft (s. Graph unten). Unsere Messergebnisse unterschieden sich auch nach mehreren Durchgängen von denen des zuvor erwähnten Summit E15.
| MSI Summit E13 Flip Evo A11MT Phison 1TB SM2801T24GKBB4S-E162 | Dell XPS 13 7390 2-in-1 Core i7 Toshiba BG4 KBG40ZPZ512G | HP Spectre x360 14t-ea000 Samsung SSD PM981a MZVLB512HBJQ | Huawei MateBook X Pro 2021 Samsung PM981a MZVLB1T0HBLR | Lenovo ThinkPad X1 Titanium Yoga G1 20QA001RGE Toshiba BG4 KBG40ZNT512G | Asus Zenbook 14 UX435EG Samsung PM981a MZVLB1T0HBLR | |
|---|---|---|---|---|---|---|
| AS SSD | -144% | -16% | 7% | -45% | 10% | |
| Seq Read (MB/s) | 3789 | 1801 -52% | 2188 -42% | 2794 -26% | 1898 -50% | 2861 -24% |
| Seq Write (MB/s) | 2257 | 1125 -50% | 1320 -42% | 2385 6% | 1065 -53% | 2837 26% |
| 4K Read (MB/s) | 54.2 | 39.7 -27% | 53.5 -1% | 60.7 12% | 58 7% | 60.3 11% |
| 4K Write (MB/s) | 78.7 | 67 -15% | 123.7 57% | 180.8 130% | 200.7 155% | 164.2 109% |
| 4K-64 Read (MB/s) | 1330 | 1253 -6% | 1010 -24% | 1768 33% | 580 -56% | 1598 20% |
| 4K-64 Write (MB/s) | 2038 | 209 -90% | 1808 -11% | 1800 -12% | 779 -62% | 1572 -23% |
| Access Time Read * (ms) | 0.042 | 0.069 -64% | 0.055 -31% | 0.037 12% | 0.052 -24% | 0.046 -10% |
| Access Time Write * (ms) | 0.04 | 0.625 -1463% | 0.076 -90% | 0.073 -83% | 0.16 -300% | 0.021 47% |
| Score Read (Points) | 1763 | 1472 -17% | 1282 -27% | 2108 20% | 828 -53% | 1945 10% |
| Score Write (Points) | 2343 | 388 -83% | 2063 -12% | 2219 -5% | 1087 -54% | 2020 -14% |
| Score Total (Points) | 4938 | 2583 -48% | 3970 -20% | 5392 9% | 2316 -53% | 4966 1% |
| Copy ISO MB/s (MB/s) | 2270 | 1293 -43% | 1644 -28% | 2065 -9% | 1659 -27% | 2414 6% |
| Copy Program MB/s (MB/s) | 670 | 560 -16% | 920 37% | 734 10% | 519 -23% | 575 -14% |
| Copy Game MB/s (MB/s) | 1525 | 927 -39% | 1725 13% | 1629 7% | 872 -43% | 1408 -8% |
| CrystalDiskMark 5.2 / 6 | -43% | -28% | -13% | -30% | -5% | |
| Write 4K (MB/s) | 311.1 | 106.7 -66% | 82.2 -74% | 197.5 -37% | 226.6 -27% | 211.8 -32% |
| Read 4K (MB/s) | 56.6 | 49.94 -12% | 45.7 -19% | 52.9 -7% | 62.8 11% | 50.1 -11% |
| Write Seq (MB/s) | 2397 | 1223 -49% | 2000 -17% | 2174 -9% | 1296 -46% | 2938 23% |
| Read Seq (MB/s) | 2277 | 1801 -21% | 2206 -3% | 2156 -5% | 1445 -37% | 2639 16% |
| Write 4K Q32T1 (MB/s) | 803 | 325.3 -59% | 451.2 -44% | 632 -21% | 545 -32% | 656 -18% |
| Read 4K Q32T1 (MB/s) | 849 | 551 -35% | 351 -59% | 694 -18% | 687 -19% | 723 -15% |
| Write Seq Q32T1 (MB/s) | 2410 | 1224 -49% | 2982 24% | 3017 25% | 1483 -38% | 3022 25% |
| Read Seq Q32T1 (MB/s) | 4954 | 2350 -53% | 3529 -29% | 3561 -28% | 2334 -53% | 3561 -28% |
| Durchschnitt gesamt (Programm / Settings) | -94% /
-107% | -22% /
-20% | -3% /
0% | -38% /
-40% | 3% /
4% |
* ... kleinere Werte sind besser
Disk Throttling: DiskSpd Read Loop, Queue Depth 8
Grafikleistung
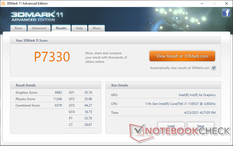
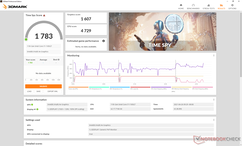
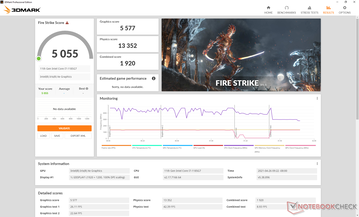
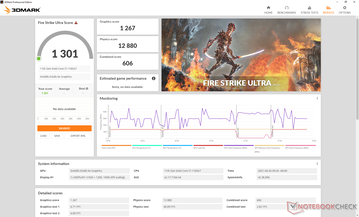
Die reine Grafikleistung ist ausgezeichnet, unsere 3DMark-Ergebnisse fallen mindestens 10 Prozent höher aus als das durchschnittliche Iris-Xe-96-EUs-Modell in unserer Datenbank. Die Vorteile kann das Summit auch auf die Darstellung von aktuellen Games übertragen, hier übertreffen die Frameraten die der meisten anderen Core-i7-Tiger-Lake-U-Laptops. Wir vermuten, dass die 32 GB RAM teilweise hierfür verantwortlich sind, da die üblichen Ultrabooks meist mit der Hälfte ausgestattet sind. Nutzer, die von einer UHD Graphics 620 oder auch von einer Iris Plus G7 aufrüsten, werden große Leistungssprünge wahrnehmen.
Gaming ist zweifelsfrei möglich, allerdings sollten man es vermeiden Spiele mit schnellen Bewegungen wie Overwatch oder Rocket League auf dem internen Bildschirm darzustellen, hier stört heftiges Ghosting den Spaß.
| 3DMark 11 Performance | 7330 Punkte | |
| 3DMark Cloud Gate Standard Score | 20169 Punkte | |
| 3DMark Fire Strike Score | 5055 Punkte | |
| 3DMark Time Spy Score | 1783 Punkte | |
Hilfe | ||
| Strange Brigade | |
| 1280x720 lowest AF:1 | |
| MSI Summit E13 Flip Evo A11MT | |
| Durchschnittliche NVIDIA GeForce MX350 (90.9 - 94.4, n=3) | |
| Durchschnittliche Intel Iris Xe Graphics G7 96EUs (48.5 - 115.1, n=172) | |
| Huawei MateBook X Pro 2021 | |
| Asus Zenbook S UX393JA | |
| 1920x1080 medium AA:medium AF:4 | |
| MSI Summit E13 Flip Evo A11MT | |
| Durchschnittliche Intel Iris Xe Graphics G7 96EUs (18.2 - 51.4, n=170) | |
| Huawei MateBook X Pro 2021 | |
| Durchschnittliche NVIDIA GeForce MX350 (31.7 - 35, n=3) | |
| Asus Zenbook S UX393JA | |
| 1920x1080 high AA:high AF:8 | |
| MSI Summit E13 Flip Evo A11MT | |
| Durchschnittliche Intel Iris Xe Graphics G7 96EUs (15.4 - 39.8, n=169) | |
| Huawei MateBook X Pro 2021 | |
| Durchschnittliche NVIDIA GeForce MX350 (24.6 - 27.2, n=3) | |
| Asus Zenbook S UX393JA | |
| 1920x1080 ultra AA:ultra AF:16 | |
| MSI Summit E13 Flip Evo A11MT | |
| Durchschnittliche Intel Iris Xe Graphics G7 96EUs (13.2 - 31.7, n=167) | |
| Huawei MateBook X Pro 2021 | |
| Durchschnittliche NVIDIA GeForce MX350 (18.8 - 20.1, n=3) | |
| Asus Zenbook S UX393JA | |
| min. | mittel | hoch | max. | |
|---|---|---|---|---|
| GTA V (2015) | 90.6 | 76.1 | 23.7 | 11.2 |
| The Witcher 3 (2015) | 99.9 | 61.8 | 31 | 14.7 |
| Dota 2 Reborn (2015) | 82.6 | 69.6 | 48.5 | 47.2 |
| Final Fantasy XV Benchmark (2018) | 44.7 | 24.1 | 18.2 | |
| X-Plane 11.11 (2018) | 26.7 | 37.7 | 33.1 | |
| Strange Brigade (2018) | 97.4 | 39.1 | 30.8 | 25.1 |
Emissionen
Systemlautstärke
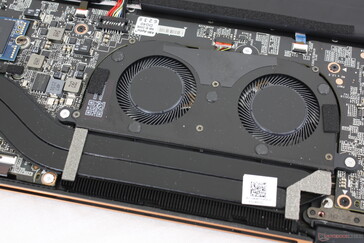
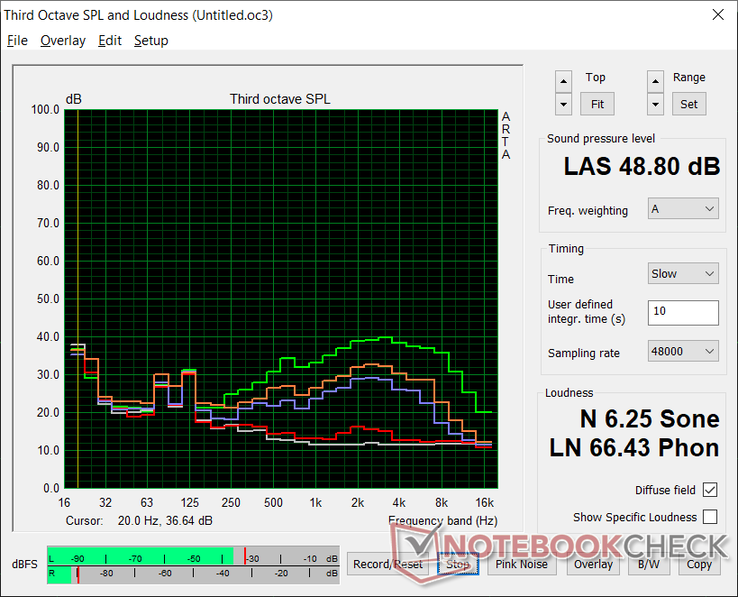
Unter niedrigen Lasten bleibt der Dual-Lüfter still, sodass man geräuschlos surfen oder Videos streamen kann. Im Hochleistungsmodus pulsiert der Lüfter jedoch recht viel und springt auf 26,4 dB(A) oder höher, bei einer Hintergrundlautstärke von 24,5 dB(A). Nutzer sollten das System daher über das MSI Center auf lautlos oder ausbalanciert setzen, wenn eine ruhige Arbeitsumgebung Priorität hat.
Gaming lässt den Lüfter bei 37,8 dB(A) und 41,4 dB(A) laut rotieren, dann ist das Summit so laut wie das Asus ZenBook 14 mit dedizierter GPU GeForce MX450. Aktiviert man dann noch den Cooler Boost dröhnt der Lüfter mit beinahe 49 dB(A) und das Summit wird zum damit das lauteste Convertible mit Core-U-CPU. Glücklicherweise wird der Cooler Boost für kaum eine Software gebraucht.
| MSI Summit E13 Flip Evo A11MT Iris Xe G7 96EUs, i7-1185G7, Phison 1TB SM2801T24GKBB4S-E162 | Dell XPS 13 7390 2-in-1 Core i7 Iris Plus Graphics G7 (Ice Lake 64 EU), i7-1065G7, Toshiba BG4 KBG40ZPZ512G | HP Spectre x360 14t-ea000 Iris Xe G7 96EUs, i7-1165G7, Samsung SSD PM981a MZVLB512HBJQ | Huawei MateBook X Pro 2021 Iris Xe G7 96EUs, i7-1165G7, Samsung PM981a MZVLB1T0HBLR | Lenovo ThinkPad X1 Titanium Yoga G1 20QA001RGE Iris Xe G7 96EUs, i7-1160G7, Toshiba BG4 KBG40ZNT512G | Asus Zenbook 14 UX435EG GeForce MX450, i7-1165G7, Samsung PM981a MZVLB1T0HBLR | |
|---|---|---|---|---|---|---|
| Geräuschentwicklung | -4% | 6% | 9% | 7% | -1% | |
| aus / Umgebung * (dB) | 24.5 | 28.1 -15% | 25.8 -5% | 25.4 -4% | 25.1 -2% | 25.6 -4% |
| Idle min * (dB) | 24.7 | 28.1 -14% | 25.9 -5% | 25.6 -4% | 25.1 -2% | 25.6 -4% |
| Idle avg * (dB) | 24.7 | 28.1 -14% | 25.9 -5% | 25.6 -4% | 25.1 -2% | 25.6 -4% |
| Idle max * (dB) | 26.4 | 28.1 -6% | 25.9 2% | 25.6 3% | 27.1 -3% | 26.3 -0% |
| Last avg * (dB) | 37.8 | 31.7 16% | 26.4 30% | 28.7 24% | 32.7 13% | 41.6 -10% |
| Witcher 3 ultra * (dB) | 41.4 | 43.4 -5% | 36.9 11% | 32 23% | 32.7 21% | 41.6 -0% |
| Last max * (dB) | 48.8 | 43.4 11% | 41.5 15% | 38.2 22% | 35.8 27% | 41.6 15% |
* ... kleinere Werte sind besser
Lautstärkediagramm
| Idle |
| 24.7 / 24.7 / 26.4 dB(A) |
| Last |
| 37.8 / 48.8 dB(A) |
 | ||
30 dB leise 40 dB(A) deutlich hörbar 50 dB(A) störend |
||
min: | ||
Temperatur
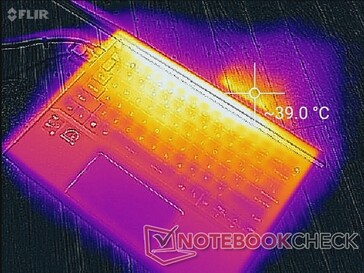
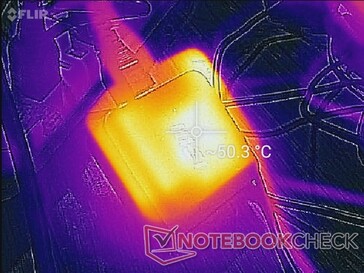
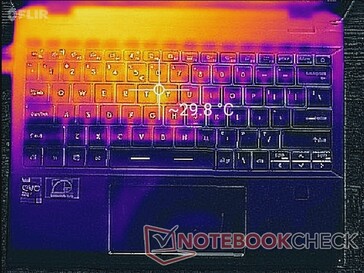
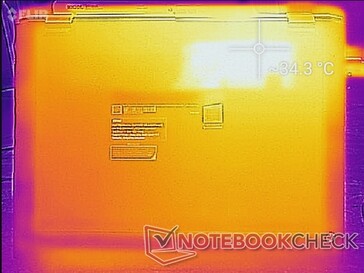
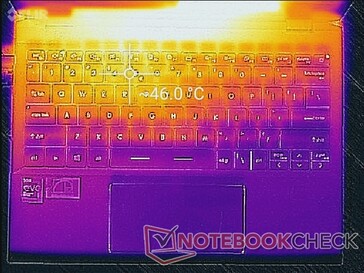
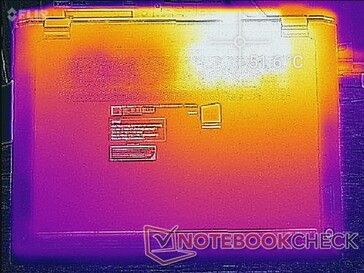
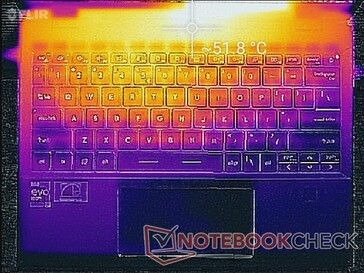
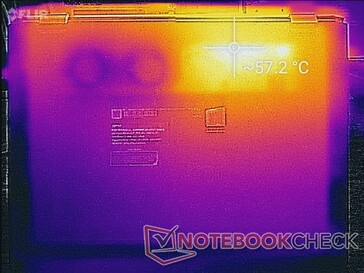
Am wärmsten wird es durch die innere Position des Kühlsystems auf der linken Seite des Laptops. Der Hot Spot auf der Tastatur kann bis zu 46 °C erreichen, auf der Unterseite werden beim Gaming sogar 52 °C erreicht. Das ist zwar noch nicht besonders störend, aber doch deutlich wahrnehmbar und vermutlich Folge der hohen Kerntemperaturen, die wir in der Sektion Stresstest näher beleuchten. Man sollte zudem sicherstellen, dass das recht kleine Lüftergitter an der Unterseite nicht verdeckt wird, insbesondere unter hoher Beanspruchung.
(-) Die maximale Temperatur auf der Oberseite ist 52 °C. Im Vergleich liegt der Klassendurchschnitt bei 35.3 °C (von 19.6 bis 60 °C für die Klasse Convertible).
(-) Auf der Unterseite messen wir eine maximalen Wert von 57.4 °C (im Vergleich zum Durchschnitt von 36.8 °C).
(+) Ohne Last messen wir eine durchschnittliche Temperatur von 27 °C auf der Oberseite. Der Klassendurchschnitt erreicht 30.3 °C.
(±) Beim längeren Spielen von The Witcher 3 erhitzt sich das Gerät durchschnittlich auf 35.7 °C. Der Durchschnitt der Klasse ist derzeit 30.3 °C.
(+) Die Handballen und der Touchpad-Bereich sind mit gemessenen 27.6 °C kühler als die typische Hauttemperatur und fühlen sich dadurch kühl an.
(±) Die durchschnittliche Handballen-Temperatur anderer getesteter Geräte war 27.9 °C (+0.3 °C).
Stresstest
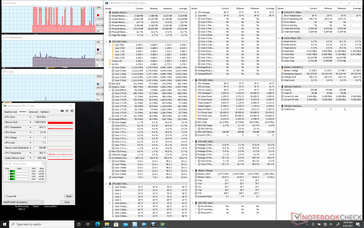
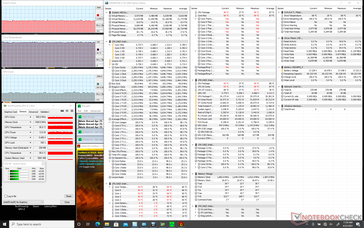
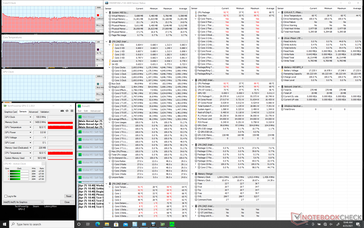
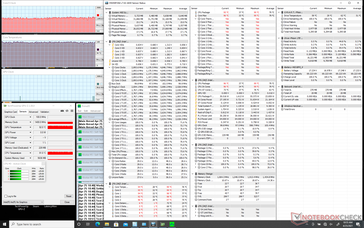
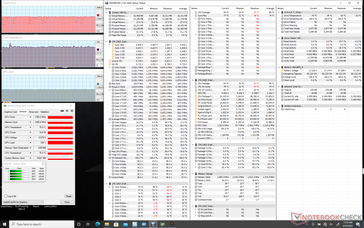
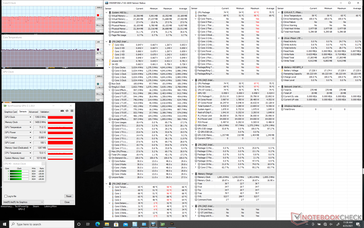
Beim Stress mit Prime95 boosten die CPU-Kerne kurzzeitig auf 3,7 GHz hoch, bis sie eine Kerntemperatur von 95 °C erreichen. Letztlich stabilisieren sich die Taktraten zwischen 2,7 und 2,9 GHz , dabei wird eine Kerntemperatur um die 91 °C gehalten. Damit läuft die CPU im MSI deutlich wärmer als in den meisten anderen Ultrabooks, bei denen sich die Kerntemperatur typischerweise zwischen 70 und 80 °C stabilisiert, beispielsweise im Huawei MateBook X Pro oder dem Asus ZenBook 14.
Ein aktivierter Cooler Boost (sprich: maximaler Lüftermodus) hat kaum Auswirkungen auf die CPU- oder GPU-Leistung. Allerdings kann die Kerntemperatur beim Gaming auf Kosten der Lautstärke bis zu 10 °C kühler dadurch sein.
Im Akkumodus wird vor allem die Grafikleistung beschnitten. Ein erneuter Fire-Strike-Test abseits der Steckdose resultiert in Physics- und Graphics-Scores von 12.682 und 4.701 Punkten, anstelle der 13.352 und 5.577 Punkte am Netz.
| CPU Clock (GHz) | GPU Clock (MHz) | Average CPU Temperature (°C) | |
| System Idle | -- | -- | 32 |
| Prime95 Stress (Cooler Boost off) | 2.7 - 2.9 | -- | 91 |
| Prime95 Stress (Cooler Boost on) | 2.8 - 3.0 | -- | 94 |
| Witcher 3 Stress (Cooler Boost off) | 3.0 | 1350 | 75 |
| Witcher 3 Stress (Cooler Boost on) | 3.0 | 1350 | 65 |
| Prime95 + FurMark Stress (Cooler Boost on) | 2.3 | 900 | 94 |
Lautsprecher
MSI Summit E13 Flip Evo A11MT Audio Analyse
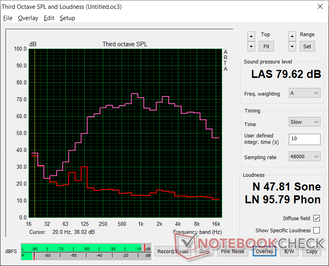
(±) | Mittelmäßig laut spielende Lautsprecher (79.6 dB)
Bass 100 - 315 Hz
(±) | abgesenkter Bass - 7.6% geringer als der Median
(±) | durchschnittlich lineare Bass-Wiedergabe (8.8% Delta zum Vorgänger)
Mitteltöne 400 - 2000 Hz
(+) | ausgeglichene Mitten, vom Median nur 3% abweichend
(+) | lineare Mitten (6.1% Delta zum Vorgänger)
Hochtöne 2 - 16 kHz
(+) | ausgeglichene Hochtöne, vom Median nur 3.7% abweichend
(+) | sehr lineare Hochtöne (5.3% Delta zum Vorgänger)
Gesamt im hörbaren Bereich 100 - 16.000 Hz
(+) | hörbarer Bereich ist sehr linear (12.5% Abstand zum Median
Im Vergleich zu allen Geräten derselben Klasse
» 14% aller getesteten Geräte dieser Klasse waren besser, 3% vergleichbar, 83% schlechter
» Das beste Gerät hat einen Delta-Wert von 6%, durchschnittlich ist 20%, das schlechteste Gerät hat 57%
Im Vergleich zu allen Geräten im Test
» 10% aller getesteten Geräte waren besser, 2% vergleichbar, 87% schlechter
» Das beste Gerät hat einen Delta-Wert von 4%, durchschnittlich ist 24%, das schlechteste Gerät hat 134%
Apple MacBook 12 (Early 2016) 1.1 GHz Audio Analyse
(+) | Die Lautsprecher können relativ laut spielen (83.6 dB)
Bass 100 - 315 Hz
(±) | abgesenkter Bass - 11.3% geringer als der Median
(±) | durchschnittlich lineare Bass-Wiedergabe (14.2% Delta zum Vorgänger)
Mitteltöne 400 - 2000 Hz
(+) | ausgeglichene Mitten, vom Median nur 2.4% abweichend
(+) | lineare Mitten (5.5% Delta zum Vorgänger)
Hochtöne 2 - 16 kHz
(+) | ausgeglichene Hochtöne, vom Median nur 2% abweichend
(+) | sehr lineare Hochtöne (4.5% Delta zum Vorgänger)
Gesamt im hörbaren Bereich 100 - 16.000 Hz
(+) | hörbarer Bereich ist sehr linear (10.2% Abstand zum Median
Im Vergleich zu allen Geräten derselben Klasse
» 7% aller getesteten Geräte dieser Klasse waren besser, 2% vergleichbar, 91% schlechter
» Das beste Gerät hat einen Delta-Wert von 5%, durchschnittlich ist 18%, das schlechteste Gerät hat 53%
Im Vergleich zu allen Geräten im Test
» 4% aller getesteten Geräte waren besser, 1% vergleichbar, 94% schlechter
» Das beste Gerät hat einen Delta-Wert von 4%, durchschnittlich ist 24%, das schlechteste Gerät hat 134%
Energiemanagement
Energieverbrauch
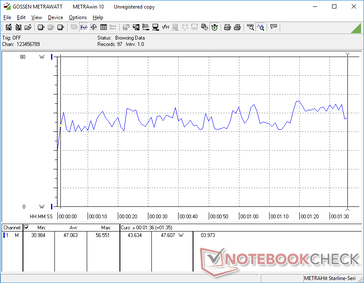
Unser Testsystem verbraucht mehr Strom als das XPS 13, das Spectre x360 14 oder das MateBook X Pro und das obwohl die letzten beiden über die gleiche Gen-11-CPU und Iris-Xe-GPU verfügen. Beispielsweise zieht Witcher 3 beim MSI 52 W aus dem Netzteil, bei den gerade erwähnten Alternativen aber nur 32 und 43 W. Die Ergebnisse kommen nicht ganz überraschend, schließlich hängt das MSI die anderen deutlich in Sachen CPU- und GPU-Leistung ab.
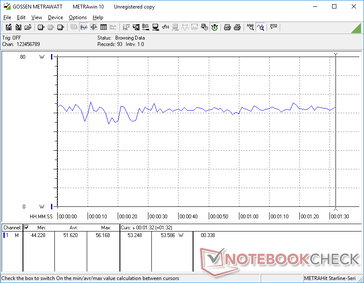
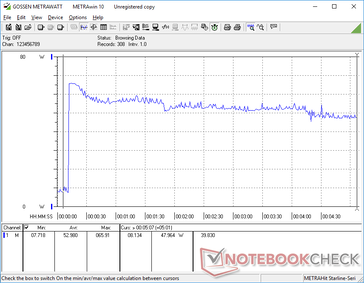
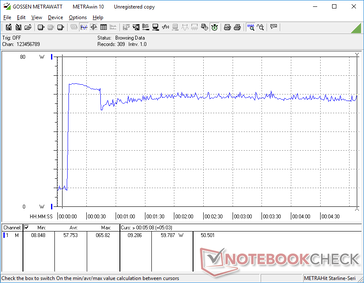
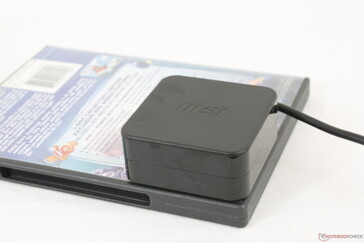
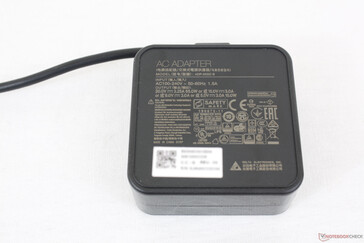
Wir messen einen Maximalverbrauch von 65,9 W am kleinen (~6,5 x 6,5 x 2,8 cm) Netzteil, wenn Prime95 läuft. Dieses Maximum dauert aber nur wenige Sekunden an, wie auch der Graph weiter unten zeigt, länger lässt sich der Turbo Boost nicht aufrecht erhalten.
| Aus / Standby | |
| Idle | |
| Last |
|
Legende:
min: | |
| MSI Summit E13 Flip Evo A11MT i7-1185G7, Iris Xe G7 96EUs, Phison 1TB SM2801T24GKBB4S-E162, IPS, 1920x1200, 13.4" | Dell XPS 13 7390 2-in-1 Core i7 i7-1065G7, Iris Plus Graphics G7 (Ice Lake 64 EU), Toshiba BG4 KBG40ZPZ512G, IPS, 1920x1200, 13.4" | HP Spectre x360 14t-ea000 i7-1165G7, Iris Xe G7 96EUs, Samsung SSD PM981a MZVLB512HBJQ, IPS, 1920x1280, 13.5" | Huawei MateBook X Pro 2021 i7-1165G7, Iris Xe G7 96EUs, Samsung PM981a MZVLB1T0HBLR, IPS, 3000x2000, 13.9" | Lenovo ThinkPad X1 Titanium Yoga G1 20QA001RGE i7-1160G7, Iris Xe G7 96EUs, Toshiba BG4 KBG40ZNT512G, IPS, 2256x1504, 13.5" | Asus Zenbook 14 UX435EG i7-1165G7, GeForce MX450, Samsung PM981a MZVLB1T0HBLR, IPS, 1920x1080, 14" | |
|---|---|---|---|---|---|---|
| Stromverbrauch | 25% | 26% | -4% | 19% | 0% | |
| Idle min * (Watt) | 4.8 | 2.6 46% | 3 37% | 6.7 -40% | 3.9 19% | 3.4 29% |
| Idle avg * (Watt) | 8.4 | 5.3 37% | 5.1 39% | 10 -19% | 7.3 13% | 7.6 10% |
| Idle max * (Watt) | 8.6 | 7 19% | 6.4 26% | 10.3 -20% | 10.3 -20% | 14.2 -65% |
| Last avg * (Watt) | 47.1 | 43.1 8% | 39.6 16% | 35.7 24% | 30.6 35% | 56 -19% |
| Witcher 3 ultra * (Watt) | 51.6 | 43.1 16% | 39.6 23% | 32.7 37% | 25.5 51% | 41 21% |
| Last max * (Watt) | 65.9 | 49 26% | 56.2 15% | 67.6 -3% | 57.1 13% | 50.4 24% |
* ... kleinere Werte sind besser
Akkulaufzeit
Der recht große Akku mit 70 Wh ermöglicht 11,5 Stunden praxisnahe WLAN-Nutzung. Eine komplettes Aufladen dauert mit dem beiliegenden USB-C-Netzteil ca. 1,5 bis 2 Stunden. Zu Beginn stießen wir auf einige Abnormalitäten beim Laden, aber das verschwand mysteriöser weise nach einigen kompletten Ent- und wieder Aufladevorgängen.
| MSI Summit E13 Flip Evo A11MT i7-1185G7, Iris Xe G7 96EUs, 70 Wh | Dell XPS 13 7390 2-in-1 Core i7 i7-1065G7, Iris Plus Graphics G7 (Ice Lake 64 EU), 51 Wh | HP Spectre x360 14t-ea000 i7-1165G7, Iris Xe G7 96EUs, 66 Wh | Huawei MateBook X Pro 2021 i7-1165G7, Iris Xe G7 96EUs, 56 Wh | Lenovo ThinkPad X1 Titanium Yoga G1 20QA001RGE i7-1160G7, Iris Xe G7 96EUs, 44.5 Wh | Asus Zenbook 14 UX435EG i7-1165G7, GeForce MX450, 63 Wh | |
|---|---|---|---|---|---|---|
| Akkulaufzeit | -20% | 37% | 18% | -10% | -23% | |
| Idle (h) | 21.1 | 36.4 73% | 19.5 -8% | 18.5 -12% | ||
| WLAN (h) | 11.2 | 9 -20% | 11.8 5% | 10.5 -6% | 8.4 -25% | 8.5 -24% |
| Last (h) | 1.8 | 2.4 33% | 3 67% | 1.9 6% | 1.2 -33% |
Pro
Contra
Fazit
MSI möchte scheinbar beweisen, dass sie mehr können als nur Gaming-Laptops und das Summit E13 Flip ist ein gutes Beispiel dafür, was der Hersteller alles drauf hat, insbesondere in Sachen Ästhetik und Performance. Bei anderen Subnotebooks oder Convertibles sind TDP sowie Leistung eher unterdurchschnittlich, um dünnere Designs und ein geringeres Gewicht zu ermöglichen. Das Summit hängt die anderen Geräte seiner Gewichtsklasse leistungstechnisch klar ab und sieht dabei trotzdem modern und mobil aus. Wer ein Convertible, welches unter Last nicht signifikant gedrosselt wird, hat mit dem MSI eine der besseren Optionen zur Hand.
Beim Summit E13 Flip steht hinter dem attraktiven Design auch noch eine tolle Leistung. Allerdings gibt es auch noch Raum für Verbesserungen, vor allem bezüglich Display-Ghosting und Stabilität der 360-Grad-Scharniere.
Die Nachteile sind gering, summieren sich aber auch schnell. Beispielsweise könnten die Scharniere fester sein und das Gehäuse fühlt sich weniger stabil an als beim HP Spectre x360 14. Ghosting ist trotz der butterweichen 120-Hz-Refreshrate deutlich sichtbar, während die schmalen Pfeil- und Strg-Tasten sowie der MicroSD-Slot im Smartphone-Stil umständlich nutzbar sind. Das Summit ist auch etwas größer und schwerer als das XPS 13 2-in-1 oder das erwähnte Spectre und leider sind zudem sowohl die Kerntemperaturen als auch die Lüfterlautstärke beim MSI höher. Folglich ist das MSI-System zwar definitiv schneller, aber eben auch nicht ohne die üblichen Nachteile.
Preise und Verfügbarkeit
Während diverse Displayfolien für das Summit E13 bereits auf Amazon gelistet sind, ist es das Gerät selbst bislang noch nicht. Die deutsche MSI-Seite zeigt den Laptop jedoch bereits an. Hier wird lediglich auf die Seite notebook.de weitergeleitet, wo das System für 1.949 Euro versandkostenfrei zu haben ist.
MSI Summit E13 Flip Evo A11MT
- 28.04.2021 v7 (old)
Allen Ngo


