Notebookcheck Logo

MSI Stealth 15M GeForce RTX im Laptop-Test: Schnellere Grafik als das Dell XPS 15, HP Spectre x360 oder Asus ZenBook
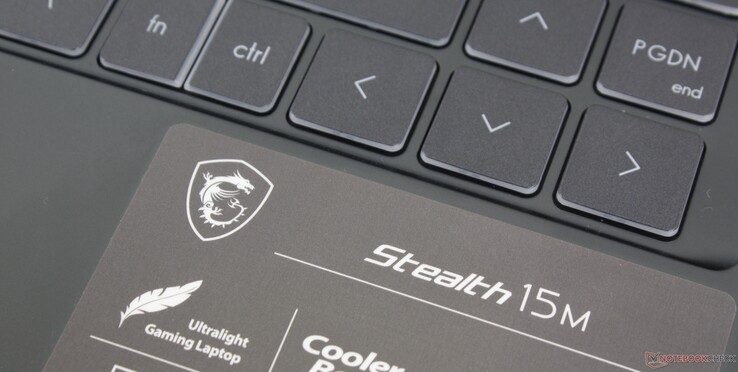
Mix aus GS66 und Prestige 15.

Die reine Leistung des Stealth 15M A11SEK ist schon beeindrucken, vor allem wenn man bedenkt wie leicht es ist und dass darin eine CPU der Core-U-Serie arbeitet. Leider lassen Verarbeitungsmängel und schwache Scharniere einige Wünsche offen.

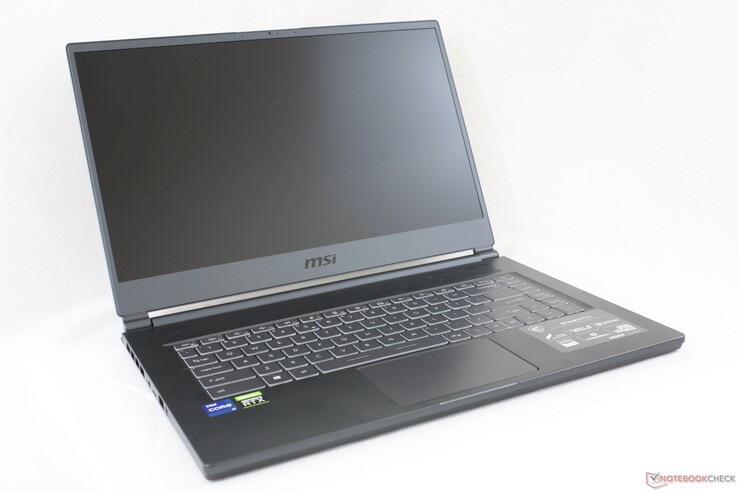
Das 15,6 Zoll große MSI Stealth 15M kann leicht mit dem gleich großen MSI GS66 Stealth verwechselt werden, bei unserer Testeinheit handelt es sich aber um ein komplett anderes Modell, welches eher für Content Creators, Office-Anwender und eine professionelle Nutzung entworfen wurde. Damit fällt es in die gleiche Riege wie die Serien MSI Prestige, Creator, Summit oder Modern, allerdings mit einem wichtigen Unterschied in der Ausstattung.

Das unterscheidende Merkmal im Stealth 15M ist seine schnelle GeForce RTX-2060-Max-Q- oder wahlweise auch RTX-3060-Grafikkarte, kombiniert mit einem Intel-Gen-11-Prozessor der Core-U-Serie. Die überwiegende Anzahl an anderen Laptops aus dieser Kategorie sind auf eine Geforce GTX oder gar MX-Grafik beschränkt und werden meist mit einer CPU der Core-H-Serie ausgeliefert, wie das Dell XPS 15, HP Spectre x360 15 oder auch das Asus ZenBook 15. Das MSI-System dürfte somit eine signifikant stärkere Grafikleistung aufweisen als die meisten seiner Konkurrenten - zumindest auf dem Papier. Sein ärgster Konkurrent dürfte das 2020 HP Envy 15 sein, welches die gleiche RTX 2060 Max-Q verwendet, aber über eine schnellere Core-H-CPU verfügt.

Unsere Konfiguration ist mit einem Tiger Lake Core i7-1185G7 CPU, 32 GB RAM, einer GeForce RTX 2060 Max-Q GPU, einem 60 Hz FHD-Display und einer 1 TB großen NVMe-SSD bestückt und kostet etwa 1.850 Euro. Eine aufgewertete Version soll ab März 2021 mit Core i7-11375H, 144-Hz-Display und GeForce RTX 3060 GPU erscheinen. Alle Optionen verfügen über ein 1080p-Display, 4K-Varianten gibt es nicht. 

Mehr MSI-Tests:

MSI Stealth 15M A11SEK (Stealth 15M Serie)
Prozessor
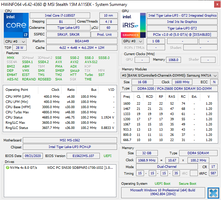
Intel Core i7-1185G7 4 x 3 - 4.8 GHz, 64 W PL2 / Short Burst, 55 W PL1 / Sustained, Tiger Lake-UP3
Grafikkarte
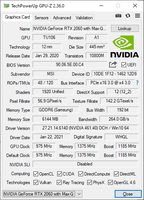
NVIDIA GeForce RTX 2060 Max-Q - 6 GB VRAM, Kerntakt: 1185 MHz, Speichertakt: 1375 MHz, 65 W TDP, GDDR6, 461.40, Optimus
RAM
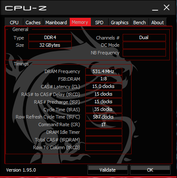
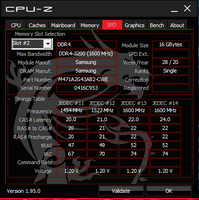
32 GB 
, Samsung DDR-3200, Dual-Channel, 2x SODIMM
Bildschirm
15.60 Zoll 16:9, 1920 x 1080 Pixel 141 PPI, Chi Mei N156HCE-EN1, IPS, CMN15E8 controller, spiegelnd: nein, 60 Hz
Mainboard
Intel Tiger Lake-UP3 PCH-LP
Massenspeicher
WDC PC SN530 SDBPNPZ-1T00, 1024 GB 
Soundkarte
Intel Tiger Lake-U/Y PCH-LP - cAVS (Audio, Voice, Speech)
Anschlüsse
3 USB 3.0 / 3.1 Gen1, 1 USB 3.1 Gen2, 1 Thunderbolt, USB-C Power Delivery (PD), 1 HDMI, 1 DisplayPort, Audio Anschlüsse: 3.5 mm combo, Card Reader: MicroSD reader
Netzwerk
Intel Wi-Fi 6 AX201 (a/b/g/h/n = Wi-Fi 4/ac = Wi-Fi 5/ax = Wi-Fi 6/), Bluetooth 5.1
Abmessungen
Höhe x Breite x Tiefe (in mm): 16.15 x 358.3 x 248
Akku
52 Wh Lithium-Polymer, 3-cell
Betriebssystem
Microsoft Windows 10 Pro 64 Bit
Kamera
Webcam: 720p
Primary Camera: 0.9 MPix
Sonstiges
Lautsprecher: 2x 2 W, Tastatur: Chiclet, Tastatur-Beleuchtung: ja, MSI True Color, MSI Dragon Center, Nahimic Companion, 12 Monate Garantie
Gewicht
1.695 kg, Netzteil: 418 g
Preis
1500 USD
Hinweis: Der Hersteller kann abweichende Bauteile wie Bildschirme, Laufwerke und Speicherriegel mit ähnlichen Spezifikationen unter dem gleichen Modellnamen einsetzen.


Potentielle Konkurrenten im Vergleich

Bew.
Datum
Modell
Gewicht
Dicke
Größe
Auflösung
Preis ab
82.4 %
v7 (old)
02 / 2021
MSI Stealth 15M A11SEK
i7-1185G7, GeForce RTX 2060 Max-Q
1.7 kg16.15 mm15.60"1920x1080
85 %
v7 (old)
01 / 2020
HP Spectre X360 15-5ZV31AV
i7-10510U, GeForce MX250
2.1 kg19.3 mm15.60"3840x2160
90.1 %
v7 (old)
06 / 2020
Dell XPS 15 9500 Core i7 4K UHD
i7-10875H, GeForce GTX 1650 Ti Mobile
2 kg18 mm15.60"3840x2400
86.6 %
v7 (old)
02 / 2021
Lenovo ThinkPad T15p-20TN0006GE
i7-10750H, GeForce GTX 1050 Mobile
2.2 kg22.7 mm15.60"3840x2160
87 %
v7 (old)
12 / 2020
Asus ZenBook UX535-M01440
i7-10750H, GeForce GTX 1650 Ti Max-Q
2 kg20 mm15.60"3840x2160
85.2 %
v7 (old)
11 / 2019
MSI Prestige 15 A10SC
i7-10710U, GeForce GTX 1650 Max-Q
1.7 kg16 mm15.60"3840x2160

Gehäuse

Das Gehäusedesign unterscheidet sich von denen der Serien Modern, Creator und Prestige. Trotzdem nutzt das Stealth 15M ähnliche Metallmaterialien, was zu einem verwandten Look führt. Das bedeutet auch, dass es die gleichen Vor- und Nachteile erbt. Das dünne und schnittige Design ist zweifelsohne attraktiv, dafür sind aber die Basis und vor allem auch der Displaydeckel anfällig für Verbiegungen, verglichen mit einem XPS 15, Envy 15, Spectre x360 15 und den meisten anderen Flaggschiff-Multimedia-Laptops in 15,6 Zoll. Wir haben auch nicht viel Vertrauen in die schwachen Scharniere, die wohl kaum länger als einige wenige Jahre durchhalten dürften.

Das geringe Gewicht ist eines der entscheidenden Charaktermerkmale des Stealth 15M, das Notebook ist annähernd 300 g leichter als viele seiner 15,6-Zoll-Konkurrenten, inklusive des XPS 15. Der Vorteil beim Gewicht ist umso beeindruckender durch den Fakt, dass das MSI auch noch eine deutlich schnellere Grafikkarte bietet als viele der schwereren Alternativen. Hier trifft eine Menge Leistung auf wenig Gewicht.

Durch die etwas dickeren Ränder ist das MSI größer als das XPS 15 oder das Prestige 15.

Die Gehäusestabilität ist angesichts der Leistung und des Preises enttäuschend
Die glatten, matten Oberflächen von oben bis unten neigen zur Abbildung von Fingerabdrücken
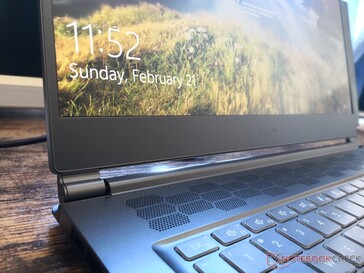
Die kleinen Scharniere sind eher schwach, besonders bei größeren Öffnungswinkeln
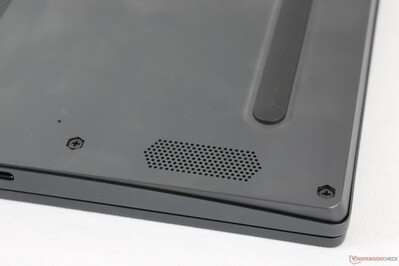
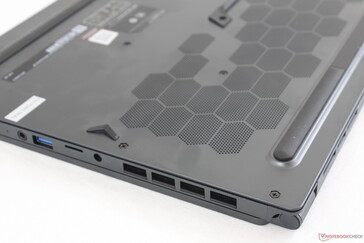
Sechseckige Lüftungsgitter ähneln denen der Dell Alienware-Laptops
Der Deckel kann im Gegensatz zu den meisten anderen Clamshell-Ultrabooks um volle 180 Grad geöffnet werden
Die Gitter am oberen Rand der Tastatur dienen ausschließlich dem Luftstrom, die Lautsprecher sitzen weiter unten
365.5 mm 250 mm 22.7 mm 2.2 kg366 mm 234 mm 16 mm 1.7 kg357 mm 240 mm 20 mm 2 kg358 mm 237 mm 19 mm 2 kg358.3 mm 248 mm 16.15 mm 1.7 kg344.72 mm 230.14 mm 18 mm 2 kg297 mm 210 mm 1 mm 5.7 g

Anschlüsse

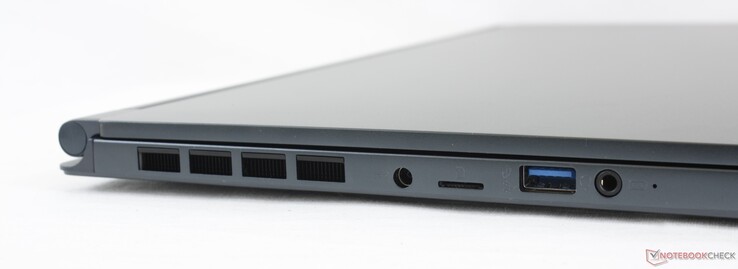
Die Anschlussmöglichkeiten orientieren sich am Prestige 15, allerdings kommt anstelle eines der USB-C-Anschlüsse ein proprietärer Ladeanschluss zum Einsatz. Durch den höheren Energiebedarf einer GeForce RTX 2060 Max-Q gegenüber einer GTX 1650 Max-Q im Prestige-Model konnte MSI wohl nicht komplett auf USB-C-Charging setzen. Die Anschlüsse sitzen zu beiden Seiten recht eng beieinander.

Vorne: Nichts
Vorne: Nichts
Rechts: USB-C mit Thunderbolt 4 (mit DisplayPort und Power Delivery), USB-A 3.2 Gen. 1, HDMI 2.0
Hinten: Nichts
Hinten: Nichts
Links: Strom, MicroSD-Reader, USB-A 3.2 Gen. 1, 3.5 mm Audioklinke

SD-Kartenleser

Der Kartenleser nimmt leider nur MicroSD-Karten auf, lässt diese einrasten und bietet schnelle Transferraten von rund 200 MB/s. Das Verschieben von 1 GB an Bildern von unserer UHS-II-Speicherkarte auf den Desktop dauert etwa 6 Sekunden.

Komplett eingesetzte MicroSD-Karte ragt an den Kanten etwas heraus
SD Card Reader
average JPG Copy Test (av. of 3 runs)
Dell XPS 15 9500 Core i7 4K UHD
  (Toshiba Exceria Pro SDXC 64 GB UHS-II)
198.5 MB/s +6%
MSI Stealth 15M A11SEK
  (Toshiba Exceria Pro M501 microSDXC 32GB)
187.2 MB/s
HP Spectre X360 15-5ZV31AV
  (Toshiba Exceria Pro M501 UHS-II)
154.7 MB/s -17%
MSI Prestige 15 A10SC
  (Toshiba Exceria Pro M501 UHS-II)
149 MB/s -20%
Lenovo ThinkPad T15p-20TN0006GE
  (Toshiba Exceria Pro SDXC 64 GB UHS-II)
88.2 MB/s -53%
Asus ZenBook UX535-M01440
  (Toshiba Exceria Pro M501 microSDXC 64GB)
74.2 MB/s -60%
maximum AS SSD Seq Read Test (1GB)
MSI Stealth 15M A11SEK
  (Toshiba Exceria Pro M501 microSDXC 32GB)
204.5 MB/s
Dell XPS 15 9500 Core i7 4K UHD
  (Toshiba Exceria Pro SDXC 64 GB UHS-II)
197.9 MB/s -3%
MSI Prestige 15 A10SC
  (Toshiba Exceria Pro M501 UHS-II)
192.5 MB/s -6%
HP Spectre X360 15-5ZV31AV
  (Toshiba Exceria Pro M501 UHS-II)
183.5 MB/s -10%
Lenovo ThinkPad T15p-20TN0006GE
  (Toshiba Exceria Pro SDXC 64 GB UHS-II)
160.4 MB/s -22%
Asus ZenBook UX535-M01440
  (Toshiba Exceria Pro M501 microSDXC 64GB)
83.4 MB/s -59%

Kommunikation

Das standardmäßig verbaute Intel-AX201-Modul stellt Wi-Fi 6 und Bluetooth 5.1 bereit. In Verbindung mit unserem Netgear-RAX200-Testrouter gab es keinerlei Probleme, allerdings sind die Übertragungsraten deutlich langsamer als erwartet.

Networking
iperf3 transmit AX12
Lenovo ThinkPad T15p-20TN0006GE
Intel Wi-Fi 6 AX201
1414 (1259min - 1502max) MBit/s +210%
MSI Prestige 15 A10SC
Intel Wi-Fi 6 AX200
1374 (720min - 1484max) MBit/s +201%
Asus ZenBook UX535-M01440
Intel Wi-Fi 6 AX201
1364 (1300min - 1398max) MBit/s +199%
Dell XPS 15 9500 Core i7 4K UHD
Intel Killer Wi-Fi 6 AX1650s
1049 (862min - 1225max) MBit/s +130%
MSI Stealth 15M A11SEK
Intel Wi-Fi 6 AX201
456 (397min - 511max) MBit/s
iperf3 receive AX12
Dell XPS 15 9500 Core i7 4K UHD
Intel Killer Wi-Fi 6 AX1650s
1446 (653min - 1555max) MBit/s +18%
MSI Prestige 15 A10SC
Intel Wi-Fi 6 AX200
1291 (1212min - 1379max) MBit/s +6%
Lenovo ThinkPad T15p-20TN0006GE
Intel Wi-Fi 6 AX201
1277 (1148min - 1363max) MBit/s +5%
MSI Stealth 15M A11SEK
Intel Wi-Fi 6 AX201
1222 (697min - 1392max) MBit/s
Asus ZenBook UX535-M01440
Intel Wi-Fi 6 AX201
922 (832min - 946max) MBit/s -25%
05010015020025030035040045050055060065070075080085090095010001050110011501200125013001350Tooltip
MSI Stealth 15M A11SEK; iperf3 receive AX12; iperf 3.1.3: Ø1198 (697-1392)
MSI Stealth 15M A11SEK; iperf3 transmit AX12; iperf 3.1.3: Ø456 (397-511)

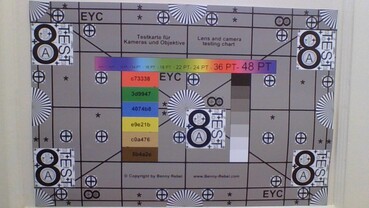
Webcam

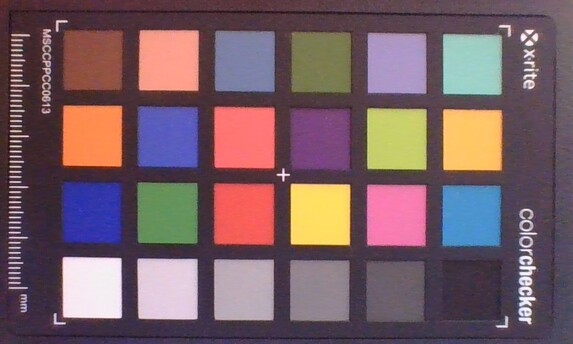
ColorChecker
8.2 ∆E
12 ∆E
8.8 ∆E
10.2 ∆E
9.9 ∆E
9.5 ∆E
10.5 ∆E
4.4 ∆E
14.5 ∆E
7 ∆E
8.2 ∆E
9.1 ∆E
4.2 ∆E
5.2 ∆E
20.3 ∆E
6.4 ∆E
15.9 ∆E
13.3 ∆E
5.7 ∆E
12.8 ∆E
10.9 ∆E
10.9 ∆E
10.4 ∆E
12 ∆E
ColorChecker MSI Stealth 15M A11SEK: 10.02 ∆E min: 4.18 - max: 20.31 ∆E

Wartung

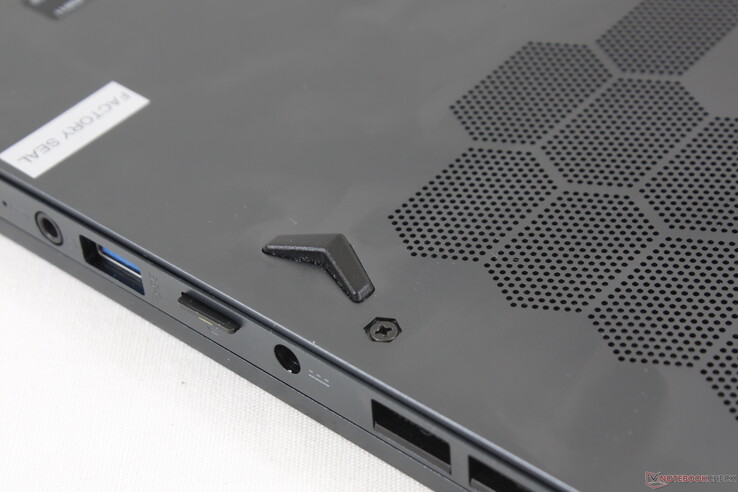
Trotz unserer Kritik (auf englisch) gängelt MSI die Kunden weiterhin mit einem Werksaufkleber auf einer der unteren Schrauben der Bodenplatte. In einem Garantiefall könnten einige Händler die Siegel-Beschädigung als Argument gegen eine Kostenübernahme benutzen.

Zubehör und Garantie

Der Verpackung liegen ein USB-A-to-RJ-45-Adapter, das Netzteil sowie Papierkram bei. Anders als beim GS66 liegt hier kein Samttuch zur Reinigung bei.

Der Hersteller gewährt eine 2-Jahres-Garantie.

Eingabegeräte

Tastatur

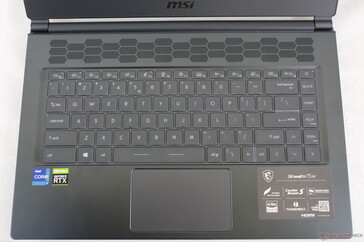
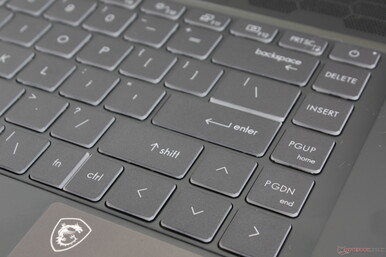
Sowohl Tastenfeedback als auch Layout entsprechen dem Prestige 15, mit Ausnahme der geteilten FN/Strg-Tasten nahe der rechten Unterseite. Folglich gelten unsere Kommentare zum Prestige-Keyboard auch hier, inklusive der Aussagen zu den seichten Tasten gegenüber den festeren Tasten eines HP Spectre oder Lenovo ThinkPad. Nutzer, die das Tippen auf einem Asus ZenBook oder VivoBook gewohnt sind, erwartet beim Stealth 15M eine ähnliche Schreiberfahrung.

Anders als beim MSI Prestige, Modern oder Creator ist die Hintergrundbeleuchtung kompatibel mit RGB-Farben via MSI Mystic Light. Allerdings beschränken sich die Anpassungsmöglichkeiten auf einzelne Zonen statt einzelne Tasten wie bei der GS66-Serie.

Touchpad

Das Clickpad (10,5 x 6,5 cm) ist kleiner als die Pendants im XPS 15 (15,1 x 9 cm) oder HP Spectre x360 15 (12 x 6 cm). Die Kontrolle über den Cursor gelingt flüssig, selbst bei langsamen Bewegungen gibt es kaum Stotterer auf der glatten Oberfläche. Leider sind die integrierten Tasten eher schwammig und die Nutzung über einen längeren Zeitraum eher schwierig. Wer viel herum klickt, sollte auf eine externe Maus setzen.

Ähnliches Layout und Schreibgefühl wie beim Prestige 15
Das Touchpad enttäuscht beim Klicken. Das Feedback ist schwammig und zu laut
Single-Zone RGB-Beleuchtung
Pfeiltasten in voller Größe

Display

Den Bildschirm des Stealth 15M (60 Hz Chi Mei N156HCE-EN1 IPS Panel) kennen wir bereits aus dem Lenovo ThinkPad P52, dem Yoga 720-15IKB, dem Asus ZenBook Pro UX550 und sogar aus MSIs eigenem Modern 15. Dementsprechend teilt er grundlegende Charakteristiken wie den ordentlichen Kontrast und Farbraum, Reaktionszeiten und allgemeine Darstellungsqualität mit diesen Modellen und speziell dem Modern 15.

Ein Nachteil des Displays ist die relativ geringe Helligkeit von nur 279 Nits. Zwar reicht das für die Nutzung in Gebäuden, aber die 15,6-Zoll-Multimedia-Konkurrenz bietet in der Preisklasse oft mehr, wie unsere Vergleichstabelle unten zeigt.

Keine Edge-to-Edge-Glas oder 4K-Option. Immerhin bietet MSI eine Higher-End-Version mit 144 Hz (ebenfalls 1080p) an
Schmale Ränder an drei von vier Seiten
Die Subpixel sind durch die matte Oberfläche leicht körnig
Leichtes, unregelmäßiges Backlight Bleeding entlang der oberen Ecken
262.3
cd/m²
261.4
cd/m²
261.5
cd/m²
249.4
cd/m²
279
cd/m²
256.3
cd/m²
230.2
cd/m²
242.1
cd/m²
229.2
cd/m²
Ausleuchtung des Bildschirms
Chi Mei N156HCE-EN1 getestet mit X-Rite i1Pro 2
Maximal: 279 cd/m² (Nits) Durchschnitt: 252.4 cd/m² Minimum: 6.81 cd/m²
Ausleuchtung: 82 %
Helligkeit Akku: 279 cd/m²
Kontrast: 872:1 (Schwarzwert: 0.32 cd/m²)
ΔE Color 1.72 | 0.5-29.43 Ø4.91, calibrated: 1.39
ΔE Greyscale 2.9 | 0.5-98 Ø5.2
93.2% sRGB (Argyll 1.6.3 3D)
59% AdobeRGB 1998 (Argyll 1.6.3 3D)
64.1% AdobeRGB 1998 (Argyll 2.2.0 3D)
93.4% sRGB (Argyll 2.2.0 3D)
62% Display P3 (Argyll 2.2.0 3D)
Gamma: 2.3
MSI Stealth 15M A11SEK
Chi Mei N156HCE-EN1, IPS, 15.6", 1920x1080
Dell XPS 15 9500 Core i7 4K UHD
Sharp LQ156R1, IPS, 15.6", 3840x2400
Lenovo ThinkPad T15p-20TN0006GE
MNF601EA1-1, IPS LED, 15.6", 3840x2160
Asus ZenBook UX535-M01440
BOE0866, IPS, 15.6", 3840x2160
MSI Prestige 15 A10SC
Sharp LQ156D1JW42, IPS, 15.6", 3840x2160
HP Envy 15-ep0098nr
Samsung SDC4145, AMOLED, 15.6", 3840x2160
Display
36%
33%
9%
29%
35%
Display P3 Coverage
62
89.7
45%
86.8
40%
68.8
11%
82
32%
88.5
43%
sRGB Coverage
93.4
100
7%
99.3
6%
99.5
7%
98.3
5%
100
7%
AdobeRGB 1998 Coverage
64.1
99.8
56%
98.5
54%
70.1
9%
96.2
50%
99.9
56%
Response Times
-4%
27%
31%
-13%
30%
Response Time Grey 50% / Grey 80% *
47.6 ?(25.2, 22.4)
54 ?(26.4, 27.6)
-13%
41.6 ?(19.6, 22)
13%
34 ?(16, 18)
29%
60 ?(29.2, 30.8)
-26%
0.8 ?(0.4, 0.4)
98%
Response Time Black / White *
35.2 ?(22, 13.2)
33.2 ?(19.2, 14)
6%
21.2 ?(8.4, 12.8)
40%
24 ?(13, 11)
32%
41.2 ?(22.8, 18.4)
-17%
2.7 ?(1.3, 1.4)
92%
PWM Frequency
25000 ?(25)
26040 ?(24)
4%
242.7 ?(44)
-99%
Bildschirm
-6%
54%
12%
-5%
-36%
Helligkeit Bildmitte
279
557.9
100%
595
113%
402
44%
464.5
66%
374.3
34%
Brightness
252
541
115%
594
136%
375
49%
451
79%
379
50%
Brightness Distribution
82
91
11%
94
15%
84
2%
92
12%
91
11%
Schwarzwert *
0.32
0.39
-22%
0.32
-0%
0.35
-9%
0.5
-56%
Kontrast
872
1431
64%
1859
113%
1149
32%
929
7%
Delta E Colorchecker *
1.72
4.54
-164%
1.2
30%
2.47
-44%
3.36
-95%
5.47
-218%
Colorchecker dE 2000 max. *
5.62
7.92
-41%
2.5
56%
4.32
23%
7.06
-26%
8.22
-46%
Colorchecker dE 2000 calibrated *
1.39
3.82
-175%
1
28%
2.36
-70%
3.42
-146%
4.61
-232%
Delta E Graustufen *
2.9
3.2
-10%
1.4
52%
2.26
22%
1.3
55%
2.3
21%
Gamma
2.3 96%
1.99 111%
2.1 105%
2.49 88%
2.14 103%
2.09 105%
CCT
6700 97%
6451 101%
6492 100%
6285 103%
6596 99%
6340 103%
Farbraum (Prozent von AdobeRGB 1998)
59
89.5
52%
85.3
45%
99
68%
84.8
44%
87.8
49%
Color Space (Percent of sRGB)
93.2
100
7%
99.2
6%
98.3
5%
100
7%
Durchschnitt gesamt (Programm / Settings)
9% / 2%
38% / 47%
17% / 14%
4% / -0%
10% / -8%

* ... kleinere Werte sind besser

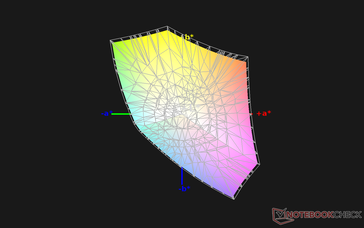
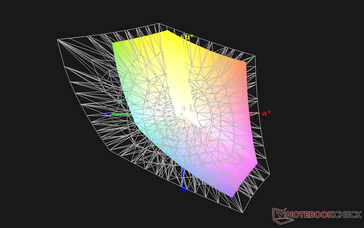
Das Panel deckt sRGB quasi vollständig ab, AdobeRGB noch zu 60 Prozent, was unter den meisten Flaggschiff-Ultrabooks mit 1080p-Displays Standard ist. Laptops mit 4K-Optionen wie MSIs eigenes Prestige 15 bieten noch mehr Farbraumabdeckung hinsichtlich AdobeRGB an.

vs. sRGB
vs. sRGB
vs. AdobeRGB
vs. AdobeRGB

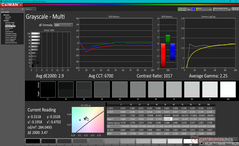
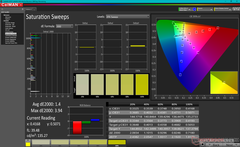
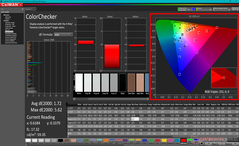
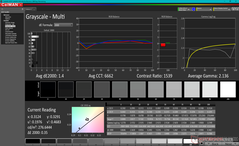
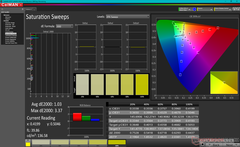
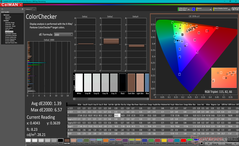
Das System ist werksseitig gut kalibriert und weist Graustufen- und ColorChecker-deltaE-Werte von nur 2,9 und 1,72 auf. Eine manuelle Kalibrierung verbessert die Werte nur noch marginal. Interessanterweise werden Türkis und Grün deutlich weniger akkurat wiedergegeben als alle anderen Farben, auch nach der Kalibrierung.

Graustufen
Graustufen
Sättigung
Sättigung
ColorChecker
ColorChecker
Graustufen nach Kalibrierung
Sättigung nach Kalibrierung
ColorChecker nach Kalibrierung

Reaktionszeiten (Response Times) des Displays

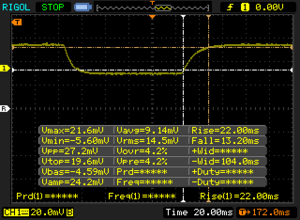
Die Reaktionszeiten (Response Times) beschreiben wie schnell zwischen zwei Farben eines Pixels umgeschaltet werden kann. Langsame Response Times können zu einer verschwommenen Darstellung, Schlieren und Geisterbilder führen. Besonders bei schnellen 3D-Spielen sind kurze Umschaltzeiten wichtig.
       Reaktionszeiten Schwarz zu Weiß
35.2 ms ... steigend ↗ und fallend ↘ kombiniert↗ 22 ms steigend
↘ 13.2 ms fallend
Die gemessenen Reaktionszeiten sind langsam und dadurch für viele Spieler wahrscheinlich zu langsam.
Im Vergleich rangierten die bei uns getesteten Geräte von 0.1 (Minimum) zu 240 (Maximum) ms. » 92 % aller Screens waren schneller als der getestete.
Daher sind die gemessenen Reaktionszeiten schlechter als der Durchschnitt aller vermessenen Geräte (20.9 ms).
       Reaktionszeiten 50% Grau zu 80% Grau
47.6 ms ... steigend ↗ und fallend ↘ kombiniert↗ 25.2 ms steigend
↘ 22.4 ms fallend
Die gemessenen Reaktionszeiten sind langsam und dadurch für viele Spieler wahrscheinlich zu langsam.
Im Vergleich rangierten die bei uns getesteten Geräte von 0.165 (Minimum) zu 636 (Maximum) ms. » 80 % aller Screens waren schneller als der getestete.
Daher sind die gemessenen Reaktionszeiten schlechter als der Durchschnitt aller vermessenen Geräte (32.8 ms).

Bildschirm-Flackern / PWM (Pulse-Width Modulation)

Eine günstige Methode um die Helligkeit eines Bildschirms zu steuern, ist die Beleuchtung periodisch ein- und auszuschalten. Dies nennt sich PWM (Pulsweitenmodulation) Diese Umschaltung sollte mit einer hohen Frequenz stattfinden damit das menschliche Auge kein Flimmern wahrnimmt. Wenn die Frequenz zu niedrig ist, kann dies zu Ermüdungserscheinungen, Augenbrennen, Kopfweh und auch sichtbaren Flackern führen.
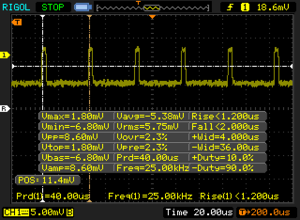
Flackern / PWM festgestellt 25000 Hz ≤ 25 % Helligkeit

Das Display flackert mit 25000 Hz (im schlimmsten Fall, eventuell durch Pulsweitenmodulation PWM) bei einer eingestellten Helligkeit von 25 % und darunter. Darüber sollte es zu keinem Flackern kommen.

Die Frequenz von 25000 Hz ist sehr hoch und sollte daher auch bei empfindlichen Personen zu keinen Problemen führen.

Im Vergleich: 53 % aller getesteten Geräte nutzten kein PWM um die Helligkeit zu reduzieren. Wenn PWM eingesetzt wurde, dann bei einer Frequenz von durchschnittlich 8705 (Minimum 5, Maximum 343500) Hz.

Durch die dürftige Maximalhelligkeit ist die Sichtbarkeit im Freien bestenfalls durchschnittlich. Das ist vor allem deshalb unglücklich, weil das leichte Gehäuse ansonsten gerade dazu einlädt, das Stealth 15M auch unterwegs und im Freien zu verwenden.

Draußen bei Sonne
Draußen bei Sonne
Draußen im Schatten
Draußen im Schatten
Draußen bei Sonne
Draußen bei Sonne
Weite IPS-Blickwinkel. Kontrast geht erst bei extremen Sichtwinkeln verloren

Leistung

Das MSI-System ist insofern einzigartig, als dass Nutzer eine GeForce RTX 2060 Max-Q mit einer Core-U-CPU anstelle der ansonsten häufiger vorkommenden Core-H-CPU kombinieren können. Die aktuellste Konfiguration kommt sogar mit schnelleren Prozessoren wie dem Gen 11 Core i7-11375H sowie einer Nvidia Ampere GeForce RTX 3060 daher, diese lösen somit die älteren Gen-10-CPUs und Turing-GPUs ab.

Für die besten Benchmarkergebnisse stellen wir im MSI Dragon Center den Extreme-Performance-Modus ein.

Prozessor

Von den vielen Laptops mit Core i7-1185G7, die wir bislang getestet haben, ist das Stealth 15M eines der schnellsten mit CineBench-xT-Werten, die 12 bis 16 Prozent über dem Durchschnitt liegen. Die ausgezeichnete Performance geht auch auf die gute Turbo-Boost-Konstanz zurück, wie unser Graph unten zeigt. Beispielsweise läuft das Summit E15 mit der gleichen CPU rund 15 Prozent langsamer als das Stealth 15M, unter Berücksichtigung sämtlicher Leistungsdrosselungen beider Systeme. Die Single-Thread-Leistung ist sogar noch beeindruckender, die entsprechenden CineBench-Ergebnisse übertreffen sogar den Core i7-10875H.

Insgesamt sind die Multi-Thread-Werte 23 bis 27 Prozent schlechter als die des energiehungrigeren Achtkern-Prozessors Core i7-10875H oder Seckskerners Core i7-10750H, welche man in den meisten High-Performance-Laptops findet.

055110165220275330385440495550605660715770825880935990Tooltip
MSI Stealth 15M A11SEK Intel Core i7-1185G7; CPU Multi 64Bit: Ø999 (993.25-1009.51)
SCHENKER Vision 15 Intel Core i7-1165G7; CPU Multi 64Bit: Ø968 (957.88-1027.12)
Asus VivoBook S15 S533EQ-BQ002T Intel Core i7-1165G7; CPU Multi 64Bit: Ø731 (710.18-922.13)
MSI Summit E15 A11SCST Intel Core i7-1185G7; CPU Multi 64Bit: Ø844 (803.58-940.2)
Cinebench R20: CPU (Multi Core) | CPU (Single Core)
Cinebench R15: CPU Multi 64Bit | CPU Single 64Bit
Blender: v2.79 BMW27 CPU
7-Zip 18.03: 7z b 4 -mmt1 | 7z b 4
Geekbench 5.5: Single-Core | Multi-Core
HWBOT x265 Benchmark v2.2: 4k Preset
LibreOffice : 20 Documents To PDF
R Benchmark 2.5: Overall mean
Cinebench R20 / CPU (Multi Core)
Dell XPS 15 9500 Core i7 4K UHD
Intel Core i7-10875H
3250 Points +30%
Lenovo Yoga Slim 7-14ARE
AMD Ryzen 7 4800U
3213 Points +29%
Lenovo ThinkPad P15 Gen1-20ST000DGE
Intel Core i7-10750H
3147 Points +26%
HP ProBook 455 G7-175W8EA
AMD Ryzen 7 4700U
2601 Points +4%
MSI Prestige 15 A10SC
Intel Core i7-10710U
2598 Points +4%
MSI Stealth 15M A11SEK
Intel Core i7-1185G7
2493 Points
Honor MagicBook 15 4500U
AMD Ryzen 5 4500U
2347 Points -6%
Lenovo ThinkPad E15 Gen2-20TD002MGE
Intel Core i7-1165G7
2233 Points -10%
Durchschnittliche Intel Core i7-1185G7
  (1425 - 2493, n=28)
2039 Points -18%
Acer Aspire 5 A515-56-511A
Intel Core i5-1135G7
1597 Points -36%
Lenovo ThinkBook 15
Intel Core i5-10210U
1581 Points -37%
Acer Swift 3 SF314-42-R27B
AMD Ryzen 3 4300U
1432 Points -43%
HP ProBook 450 G7 8WC04UT
Intel Core i7-10510U
1051 Points -58%
Dell Inspiron 15 5000 5502
Intel Core i3-1115G4
961 Points -61%
Cinebench R20 / CPU (Single Core)
MSI Stealth 15M A11SEK
Intel Core i7-1185G7
580 Points
Durchschnittliche Intel Core i7-1185G7
  (489 - 593, n=28)
557 Points -4%
Acer Aspire 5 A515-56-511A
Intel Core i5-1135G7
521 Points -10%
Lenovo ThinkPad E15 Gen2-20TD002MGE
Intel Core i7-1165G7
516 Points -11%
Dell Inspiron 15 5000 5502
Intel Core i3-1115G4
504 Points -13%
Dell XPS 15 9500 Core i7 4K UHD
Intel Core i7-10875H
493 Points -15%
Lenovo ThinkPad P15 Gen1-20ST000DGE
Intel Core i7-10750H
491 Points -15%
Lenovo Yoga Slim 7-14ARE
AMD Ryzen 7 4800U
474 Points -18%
HP ProBook 455 G7-175W8EA
AMD Ryzen 7 4700U
462 Points -20%
MSI Prestige 15 A10SC
Intel Core i7-10710U
460 Points -21%
Honor MagicBook 15 4500U
AMD Ryzen 5 4500U
439 Points -24%
Acer Swift 3 SF314-42-R27B
AMD Ryzen 3 4300U
427 Points -26%
Lenovo ThinkBook 15
Intel Core i5-10210U
418 Points -28%
HP ProBook 450 G7 8WC04UT
Intel Core i7-10510U
396 Points -32%
Cinebench R15 / CPU Multi 64Bit
Lenovo Yoga Slim 7-14ARE
AMD Ryzen 7 4800U
1639 (1505.17min - 1639.01max) Points +62%
Dell XPS 15 9500 Core i7 4K UHD
Intel Core i7-10875H
1391 (1148.9min - 1390.72max) Points +38%
Lenovo ThinkPad P15 Gen1-20ST000DGE
Intel Core i7-10750H
1363 (1278.98min - 1363.42max) Points +35%
MSI Prestige 15 A10SC
Intel Core i7-10710U
1103 Points +9%
HP ProBook 455 G7-175W8EA
AMD Ryzen 7 4700U
1050 Points +4%
MSI Stealth 15M A11SEK
Intel Core i7-1185G7
1010 (993.25min - 1009.51max) Points
Lenovo ThinkPad E15 Gen2-20TD002MGE
Intel Core i7-1165G7
971 (738.23min - 869.87max) Points -4%
Honor MagicBook 15 4500U
AMD Ryzen 5 4500U
934 (873.29min - 934.25max) Points -8%
Durchschnittliche Intel Core i7-1185G7
  (617 - 1066, n=32)
859 Points -15%
Lenovo ThinkBook 15
Intel Core i5-10210U
687 Points -32%
Acer Aspire 5 A515-56-511A
Intel Core i5-1135G7
668 (630.73min - 668.34max) Points -34%
Acer Swift 3 SF314-42-R27B
AMD Ryzen 3 4300U
580 Points -43%
HP ProBook 450 G7 8WC04UT
Intel Core i7-10510U
482 (370.4min - 481.68max) Points -52%
Dell Inspiron 15 5000 5502
Intel Core i3-1115G4
384.7 (375.47min - 384.71max) Points -62%
Cinebench R15 / CPU Single 64Bit
MSI Stealth 15M A11SEK
Intel Core i7-1185G7
223 Points
Lenovo ThinkPad E15 Gen2-20TD002MGE
Intel Core i7-1165G7
221 Points -1%
Durchschnittliche Intel Core i7-1185G7
  (168 - 230, n=27)
215 Points -4%
Lenovo ThinkPad P15 Gen1-20ST000DGE
Intel Core i7-10750H
205 Points -8%
Dell XPS 15 9500 Core i7 4K UHD
Intel Core i7-10875H
204 Points -9%
Acer Aspire 5 A515-56-511A
Intel Core i5-1135G7
198 Points -11%
Dell Inspiron 15 5000 5502
Intel Core i3-1115G4
193.6 Points -13%
MSI Prestige 15 A10SC
Intel Core i7-10710U
191 Points -14%
Lenovo Yoga Slim 7-14ARE
AMD Ryzen 7 4800U
182 Points -18%
HP ProBook 455 G7-175W8EA
AMD Ryzen 7 4700U
181 Points -19%
Honor MagicBook 15 4500U
AMD Ryzen 5 4500U
172 Points -23%
Lenovo ThinkBook 15
Intel Core i5-10210U
165 Points -26%
Acer Swift 3 SF314-42-R27B
AMD Ryzen 3 4300U
165 Points -26%
HP ProBook 450 G7 8WC04UT
Intel Core i7-10510U
113 Points -49%
Blender / v2.79 BMW27 CPU
Dell Inspiron 15 5000 5502
Intel Core i3-1115G4
1188 Seconds * -149%
HP ProBook 450 G7 8WC04UT
Intel Core i7-10510U
1051 Seconds * -120%
Acer Swift 3 SF314-42-R27B
AMD Ryzen 3 4300U
907 Seconds * -90%
Acer Aspire 5 A515-56-511A
Intel Core i5-1135G7
735 Seconds * -54%
Lenovo ThinkBook 15
Intel Core i5-10210U
676 Seconds * -41%
Durchschnittliche Intel Core i7-1185G7
  (478 - 745, n=28)
588 Seconds * -23%
Honor MagicBook 15 4500U
AMD Ryzen 5 4500U
566 Seconds * -18%
HP ProBook 455 G7-175W8EA
AMD Ryzen 7 4700U
537 Seconds * -12%
Lenovo ThinkPad E15 Gen2-20TD002MGE
Intel Core i7-1165G7
530 Seconds * -11%
MSI Stealth 15M A11SEK
Intel Core i7-1185G7
478 Seconds *
Lenovo ThinkPad P15 Gen1-20ST000DGE
Intel Core i7-10750H
359.7 Seconds * +25%
Dell XPS 15 9500 Core i7 4K UHD
Intel Core i7-10875H
353 Seconds * +26%
Lenovo Yoga Slim 7-14ARE
AMD Ryzen 7 4800U
322 Seconds * +33%
7-Zip 18.03 / 7z b 4 -mmt1
MSI Stealth 15M A11SEK
Intel Core i7-1185G7
5412 MIPS
Dell XPS 15 9500 Core i7 4K UHD
Intel Core i7-10875H
5335 MIPS -1%
Lenovo ThinkPad E15 Gen2-20TD002MGE
Intel Core i7-1165G7
5249 MIPS -3%
Lenovo ThinkPad P15 Gen1-20ST000DGE
Intel Core i7-10750H
5243 MIPS -3%
Durchschnittliche Intel Core i7-1185G7
  (3678 - 5507, n=27)
5112 MIPS -6%
Acer Aspire 5 A515-56-511A
Intel Core i5-1135G7
4846 MIPS -10%
Dell Inspiron 15 5000 5502
Intel Core i3-1115G4
4621 MIPS -15%
Lenovo Yoga Slim 7-14ARE
AMD Ryzen 7 4800U
4436 MIPS -18%
Honor MagicBook 15 4500U
AMD Ryzen 5 4500U
4302 MIPS -21%
HP ProBook 455 G7-175W8EA
AMD Ryzen 7 4700U
4208 MIPS -22%
Lenovo ThinkBook 15
Intel Core i5-10210U
4099 MIPS -24%
HP ProBook 450 G7 8WC04UT
Intel Core i7-10510U
4051 MIPS -25%
Acer Swift 3 SF314-42-R27B
AMD Ryzen 3 4300U
4014 MIPS -26%
7-Zip 18.03 / 7z b 4
Lenovo Yoga Slim 7-14ARE
AMD Ryzen 7 4800U
44804 MIPS +62%
Lenovo ThinkPad P15 Gen1-20ST000DGE
Intel Core i7-10750H
36927 MIPS +33%
Dell XPS 15 9500 Core i7 4K UHD
Intel Core i7-10875H
36383 MIPS +31%
MSI Stealth 15M A11SEK
Intel Core i7-1185G7
27693 MIPS
HP ProBook 455 G7-175W8EA
AMD Ryzen 7 4700U
27219 MIPS -2%
Honor MagicBook 15 4500U
AMD Ryzen 5 4500U
25815 MIPS -7%
Lenovo ThinkPad E15 Gen2-20TD002MGE
Intel Core i7-1165G7
24070 MIPS -13%
Durchschnittliche Intel Core i7-1185G7
  (18812 - 27693, n=27)
23288 MIPS -16%
Lenovo ThinkBook 15
Intel Core i5-10210U
20655 MIPS -25%
Acer Aspire 5 A515-56-511A
Intel Core i5-1135G7
19022 MIPS -31%
Acer Swift 3 SF314-42-R27B
AMD Ryzen 3 4300U
15043 MIPS -46%
HP ProBook 450 G7 8WC04UT
Intel Core i7-10510U
12196 MIPS -56%
Dell Inspiron 15 5000 5502
Intel Core i3-1115G4
11122 MIPS -60%
Geekbench 5.5 / Single-Core
MSI Stealth 15M A11SEK
Intel Core i7-1185G7
1575 Points
Lenovo ThinkPad E15 Gen2-20TD002MGE
Intel Core i7-1165G7
1539 Points -2%
Durchschnittliche Intel Core i7-1185G7
  (1398 - 1626, n=21)
1520 Points -3%
Acer Aspire 5 A515-56-511A
Intel Core i5-1135G7
1397 Points -11%
Dell Inspiron 15 5000 5502
Intel Core i3-1115G4
1337 Points -15%
Dell XPS 15 9500 Core i7 4K UHD
Intel Core i7-10875H
1318 Points -16%
Lenovo ThinkPad P15 Gen1-20ST000DGE
Intel Core i7-10750H
1304 Points -17%
HP ProBook 450 G7 8WC04UT
Intel Core i7-10510U
1244 Points -21%
Honor MagicBook 15 4500U
AMD Ryzen 5 4500U
1220 Points -23%
Lenovo Yoga Slim 7-14ARE
AMD Ryzen 7 4800U
1154 Points -27%
Lenovo Yoga Slim 7-14ARE
AMD Ryzen 7 4800U
1150 Points -27%
HP ProBook 455 G7-175W8EA
AMD Ryzen 7 4700U
1109 Points -30%
Acer Swift 3 SF314-42-R27B
AMD Ryzen 3 4300U
1027 Points -35%
Geekbench 5.5 / Multi-Core
Dell XPS 15 9500 Core i7 4K UHD
Intel Core i7-10875H
7799 Points +44%
Lenovo Yoga Slim 7-14ARE
AMD Ryzen 7 4800U
6950 Points +29%
Lenovo Yoga Slim 7-14ARE
AMD Ryzen 7 4800U
5798 Points +7%
Lenovo ThinkPad P15 Gen1-20ST000DGE
Intel Core i7-10750H
6355 Points +18%
Honor MagicBook 15 4500U
AMD Ryzen 5 4500U
6234 Points +15%
Durchschnittliche Intel Core i7-1185G7
  (4620 - 5944, n=21)
5460 Points +1%
MSI Stealth 15M A11SEK
Intel Core i7-1185G7
5404 Points
HP ProBook 455 G7-175W8EA
AMD Ryzen 7 4700U
4853 Points -10%
Lenovo ThinkPad E15 Gen2-20TD002MGE
Intel Core i7-1165G7
4822 Points -11%
Acer Aspire 5 A515-56-511A
Intel Core i5-1135G7
4629 Points -14%
HP ProBook 450 G7 8WC04UT
Intel Core i7-10510U
3663 Points -32%
Acer Swift 3 SF314-42-R27B
AMD Ryzen 3 4300U
3330 Points -38%
Dell Inspiron 15 5000 5502
Intel Core i3-1115G4
2427 Points -55%
HWBOT x265 Benchmark v2.2 / 4k Preset
Lenovo Yoga Slim 7-14ARE
AMD Ryzen 7 4800U
10.77 fps +32%
Lenovo ThinkPad P15 Gen1-20ST000DGE
Intel Core i7-10750H
10.6 fps +30%
Dell XPS 15 9500 Core i7 4K UHD
Intel Core i7-10875H
10.2 fps +25%
MSI Stealth 15M A11SEK
Intel Core i7-1185G7
8.13 fps
Honor MagicBook 15 4500U
AMD Ryzen 5 4500U
7.33 fps -10%
Lenovo ThinkPad E15 Gen2-20TD002MGE
Intel Core i7-1165G7
7.3 fps -10%
HP ProBook 455 G7-175W8EA
AMD Ryzen 7 4700U
6.79 fps -16%
Durchschnittliche Intel Core i7-1185G7
  (5.02 - 8.13, n=27)
6.56 fps -19%
Lenovo ThinkBook 15
Intel Core i5-10210U
5.16 fps -37%
Acer Aspire 5 A515-56-511A
Intel Core i5-1135G7
5.13 fps -37%
Acer Swift 3 SF314-42-R27B
AMD Ryzen 3 4300U
4.37 fps -46%
HP ProBook 450 G7 8WC04UT
Intel Core i7-10510U
3.41 fps -58%
Dell Inspiron 15 5000 5502
Intel Core i3-1115G4
3.25 fps -60%
LibreOffice / 20 Documents To PDF
HP ProBook 455 G7-175W8EA
AMD Ryzen 7 4700U
115.7 s * -130%
HP ProBook 450 G7 8WC04UT
Intel Core i7-10510U
77.8 s * -54%
Honor MagicBook 15 4500U
AMD Ryzen 5 4500U
65.2 s * -29%
Dell Inspiron 15 5000 5502
Intel Core i3-1115G4
62.8 s * -25%
Acer Swift 3 SF314-42-R27B
AMD Ryzen 3 4300U
62.2 s * -23%
Lenovo Yoga Slim 7-14ARE
AMD Ryzen 7 4800U
57.8 s * -15%
Lenovo ThinkPad P15 Gen1-20ST000DGE
Intel Core i7-10750H
54 s * -7%
Dell XPS 15 9500 Core i7 4K UHD
Intel Core i7-10875H
52.6 s * -4%
Durchschnittliche Intel Core i7-1185G7
  (41.3 - 61.7, n=26)
51 s * -1%
MSI Stealth 15M A11SEK
Intel Core i7-1185G7
50.4 s *
Lenovo ThinkPad E15 Gen2-20TD002MGE
Intel Core i7-1165G7
50 s * +1%
Acer Aspire 5 A515-56-511A
Intel Core i5-1135G7
49.7 s * +1%
R Benchmark 2.5 / Overall mean
HP ProBook 450 G7 8WC04UT
Intel Core i7-10510U
0.75 sec * -34%
Acer Swift 3 SF314-42-R27B
AMD Ryzen 3 4300U
0.686 sec * -23%
Dell Inspiron 15 5000 5502
Intel Core i3-1115G4
0.655 sec * -17%
HP ProBook 455 G7-175W8EA
AMD Ryzen 7 4700U
0.651 sec * -16%
Acer Aspire 5 A515-56-511A
Intel Core i5-1135G7
0.629 sec * -12%
Honor MagicBook 15 4500U
AMD Ryzen 5 4500U
0.623 sec * -11%
Lenovo Yoga Slim 7-14ARE
AMD Ryzen 7 4800U
0.613 sec * -9%
Lenovo ThinkPad P15 Gen1-20ST000DGE
Intel Core i7-10750H
0.612 sec * -9%
Lenovo ThinkPad E15 Gen2-20TD002MGE
Intel Core i7-1165G7
0.586 sec * -5%
Durchschnittliche Intel Core i7-1185G7
  (0.55 - 0.615, n=27)
0.586 sec * -5%
Dell XPS 15 9500 Core i7 4K UHD
Intel Core i7-10875H
0.584 sec * -4%
MSI Stealth 15M A11SEK
Intel Core i7-1185G7
0.56 sec *
Cinebench R20: CPU (Multi Core) | CPU (Single Core)
Cinebench R15: CPU Multi 64Bit | CPU Single 64Bit
Blender: v2.79 BMW27 CPU
7-Zip 18.03: 7z b 4 -mmt1 | 7z b 4
Geekbench 5.5: Single-Core | Multi-Core
HWBOT x265 Benchmark v2.2: 4k Preset
LibreOffice : 20 Documents To PDF
R Benchmark 2.5: Overall mean

* ... kleinere Werte sind besser

Cinebench R15 CPU Multi 64Bit
1010 Points
Cinebench R15 OpenGL 64Bit
151 fps
Cinebench R15 Ref. Match 64Bit
99.6 %
Cinebench R15 CPU Single 64Bit
223 Points
Cinebench R20 CPU (Multi Core)
2493 Points
Cinebench R20 CPU (Single Core)
580 Points
Cinebench R23 Single Core
1504 Points
Cinebench R23 Multi Core
6383 Points
Hilfe

Systemleistung

PCMark 10 Standard
PCMark 10 Standard

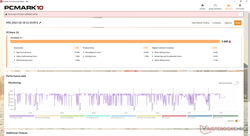
Die Ergebnisse in den PCMark-Benchmarks sind höher als die der meisten Multimedia-Laptops mit Core-H-CPU, vor allem durch die schnellere GeForce RTX und die höhere Leistung-pro-Watt der CPU.

Software-Probleme kamen im Test nicht vor. Nutzer sollten sich mit der Software Dragon Center vertraut machen, hier befinden sich die meisten relevanten Systemeinstellungen.

PCMark 10
Score
MSI Stealth 15M A11SEK
GeForce RTX 2060 Max-Q, i7-1185G7, WDC PC SN530 SDBPNPZ-1T00
5880 Points
HP Envy 15-ep0098nr
GeForce RTX 2060 Max-Q, i7-10750H, Intel Optane Memory H10 with Solid State Storage 32GB + 512GB HBRPEKNX0202A(L/H)
5553 Points -6%
Lenovo ThinkPad T15p-20TN0006GE
GeForce GTX 1050 Mobile, i7-10750H, WDC PC SN730 SDBQNTY-512GB
5130 Points -13%
Dell XPS 15 9500 Core i7 4K UHD
GeForce GTX 1650 Ti Mobile, i7-10875H, SK Hynix PC611 512GB
5125 Points -13%
MSI Prestige 15 A10SC
GeForce GTX 1650 Max-Q, i7-10710U, Samsung SSD PM981 MZVLB1T0HALR
5009 Points -15%
Asus ZenBook UX535-M01440
GeForce GTX 1650 Ti Max-Q, i7-10750H, WDC PC SN730 SDBPNTY-1T00
4887 Points -17%
Essentials
Dell XPS 15 9500 Core i7 4K UHD
GeForce GTX 1650 Ti Mobile, i7-10875H, SK Hynix PC611 512GB
9808 Points +3%
MSI Stealth 15M A11SEK
GeForce RTX 2060 Max-Q, i7-1185G7, WDC PC SN530 SDBPNPZ-1T00
9496 Points
HP Envy 15-ep0098nr
GeForce RTX 2060 Max-Q, i7-10750H, Intel Optane Memory H10 with Solid State Storage 32GB + 512GB HBRPEKNX0202A(L/H)
9359 Points -1%
Lenovo ThinkPad T15p-20TN0006GE
GeForce GTX 1050 Mobile, i7-10750H, WDC PC SN730 SDBQNTY-512GB
9108 Points -4%
MSI Prestige 15 A10SC
GeForce GTX 1650 Max-Q, i7-10710U, Samsung SSD PM981 MZVLB1T0HALR
9048 Points -5%
Asus ZenBook UX535-M01440
GeForce GTX 1650 Ti Max-Q, i7-10750H, WDC PC SN730 SDBPNTY-1T00
8966 Points -6%
Productivity
MSI Stealth 15M A11SEK
GeForce RTX 2060 Max-Q, i7-1185G7, WDC PC SN530 SDBPNPZ-1T00
8921 Points
Dell XPS 15 9500 Core i7 4K UHD
GeForce GTX 1650 Ti Mobile, i7-10875H, SK Hynix PC611 512GB
7994 Points -10%
HP Envy 15-ep0098nr
GeForce RTX 2060 Max-Q, i7-10750H, Intel Optane Memory H10 with Solid State Storage 32GB + 512GB HBRPEKNX0202A(L/H)
7767 Points -13%
Lenovo ThinkPad T15p-20TN0006GE
GeForce GTX 1050 Mobile, i7-10750H, WDC PC SN730 SDBQNTY-512GB
7466 Points -16%
MSI Prestige 15 A10SC
GeForce GTX 1650 Max-Q, i7-10710U, Samsung SSD PM981 MZVLB1T0HALR
6832 Points -23%
Asus ZenBook UX535-M01440
GeForce GTX 1650 Ti Max-Q, i7-10750H, WDC PC SN730 SDBPNTY-1T00
6827 Points -23%
Digital Content Creation
MSI Stealth 15M A11SEK
GeForce RTX 2060 Max-Q, i7-1185G7, WDC PC SN530 SDBPNPZ-1T00
6512 Points
HP Envy 15-ep0098nr
GeForce RTX 2060 Max-Q, i7-10750H, Intel Optane Memory H10 with Solid State Storage 32GB + 512GB HBRPEKNX0202A(L/H)
6395 Points -2%
MSI Prestige 15 A10SC
GeForce GTX 1650 Max-Q, i7-10710U, Samsung SSD PM981 MZVLB1T0HALR
5520 Points -15%
Lenovo ThinkPad T15p-20TN0006GE
GeForce GTX 1050 Mobile, i7-10750H, WDC PC SN730 SDBQNTY-512GB
5391 Points -17%
Asus ZenBook UX535-M01440
GeForce GTX 1650 Ti Max-Q, i7-10750H, WDC PC SN730 SDBPNTY-1T00
5176 Points -21%
Dell XPS 15 9500 Core i7 4K UHD
GeForce GTX 1650 Ti Mobile, i7-10875H, SK Hynix PC611 512GB
4662 Points -28%
PCMark 10 Score
5880 Punkte
Hilfe

DPC-Latenzen

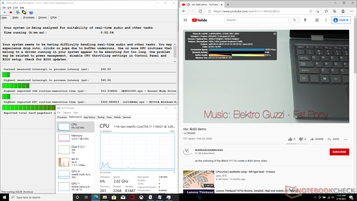
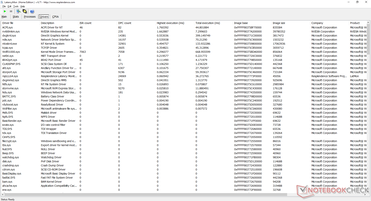
LatencyMon enthüllt Latenzprobleme beim Öffnen mehrerer Browsertabs in Verbindung mit der nvlddmkm.sys. Dagegen funktioniert die Wiedergabe unseres 4K/60fps-YouTube-Videos flüssig und ohne Dropped Frames.

DPC Latencies / LatencyMon - interrupt to process latency (max), Web, Youtube, Prime95
Dell XPS 15 9500 Core i7 4K UHD
GeForce GTX 1650 Ti Mobile, i7-10875H, SK Hynix PC611 512GB
9856 μs * -1705%
Lenovo ThinkPad T15p-20TN0006GE
GeForce GTX 1050 Mobile, i7-10750H, WDC PC SN730 SDBQNTY-512GB
1637 μs * -200%
Asus ZenBook UX535-M01440
GeForce GTX 1650 Ti Max-Q, i7-10750H, WDC PC SN730 SDBPNTY-1T00
773 μs * -42%
MSI Stealth 15M A11SEK
GeForce RTX 2060 Max-Q, i7-1185G7, WDC PC SN530 SDBPNPZ-1T00
546 μs *

* ... kleinere Werte sind besser

Massenspeicher

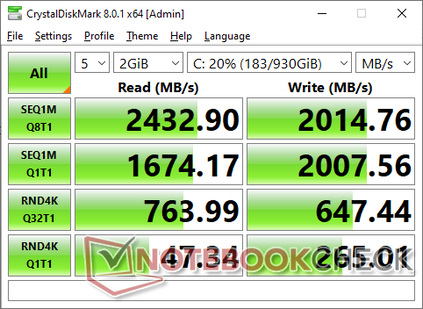
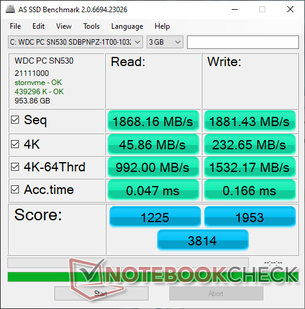
Intern gibt es leider nur einen einzigen M.2 PCIe 3.0 x4 Slot. Darin steckt bei unserer Testeinheit mit der 1 TB großen WD SN530 eine Mittelklasse-NVMe-SSD, die SN750-Serie entspricht eher dem High-End-Anspruch. Die sequentiellen Lese- und Schreibraten sind mit 2.400 MB/s und 2.000 MB/s dennoch recht gut, auch wenn teurere Geräte mehr als 3.000 MB/s erreichen.

CDM 8
CDM 8
AS SSD
AS SSD
MSI Stealth 15M A11SEK
WDC PC SN530 SDBPNPZ-1T00
HP Spectre X360 15-5ZV31AV
Intel SSD 660p 2TB SSDPEKNW020T8
Dell XPS 15 9500 Core i7 4K UHD
SK Hynix PC611 512GB
Asus ZenBook UX535-M01440
WDC PC SN730 SDBPNTY-1T00
MSI Prestige 15 A10SC
Samsung SSD PM981 MZVLB1T0HALR
AS SSD
-26%
-16%
-11%
4%
Seq Read
1868
1220
-35%
2072
11%
1886
1%
1274
-32%
Seq Write
1881
1152
-39%
1486
-21%
1221
-35%
1395
-26%
4K Read
45.86
52.3
14%
47.41
3%
41.16
-10%
50.3
10%
4K Write
232.6
146.6
-37%
117.6
-49%
101.2
-56%
119.8
-48%
4K-64 Read
992
652
-34%
967
-3%
1022
3%
1599
61%
4K-64 Write
1532
847
-45%
715
-53%
1618
6%
1455
-5%
Access Time Read *
0.047
0.077
-64%
0.057
-21%
0.058
-23%
0.044
6%
Access Time Write *
0.166
0.106
36%
0.096
42%
0.037
78%
0.092
45%
Score Read
1225
826
-33%
1222
0%
1252
2%
1777
45%
Score Write
1953
1109
-43%
981
-50%
1841
-6%
1714
-12%
Score Total
3814
2371
-38%
2809
-26%
3706
-3%
4411
16%
Copy ISO MB/s
2320
2070
-11%
1999
-14%
1611
-31%
2830
22%
Copy Program MB/s
681
571
-16%
627
-8%
509
-25%
609
-11%
Copy Game MB/s
1588
1219
-23%
1001
-37%
677
-57%
1424
-10%
CrystalDiskMark 5.2 / 6
-20%
-9%
-10%
-30%
Write 4K
262.6
151.5
-42%
123.3
-53%
110
-58%
150.8
-43%
Read 4K
45.41
59.3
31%
41.85
-8%
43.44
-4%
47.3
4%
Write Seq
2001
1424
-29%
2054
3%
1957
-2%
981
-51%
Read Seq
1659
1609
-3%
1617
-3%
1615
-3%
976
-41%
Write 4K Q32T1
648
393.6
-39%
413
-36%
341.6
-47%
442.7
-32%
Read 4K Q32T1
767
369.4
-52%
377.5
-51%
364.3
-53%
499.7
-35%
Write Seq Q32T1
2002
1946
-3%
2705
35%
3081
54%
1706
-15%
Read Seq Q32T1
2415
1934
-20%
3442
43%
3251
35%
1758
-27%
Durchschnitt gesamt (Programm / Settings)
-23% / -24%
-13% / -13%
-11% / -11%
-13% / -8%

* ... kleinere Werte sind besser

WDC PC SN530 SDBPNPZ-1T00
CDM 5/6 Read Seq Q32T1: 2415 MB/s
CDM 5/6 Write Seq Q32T1: 2002 MB/s
CDM 5/6 Read 4K Q32T1: 767 MB/s
CDM 5/6 Write 4K Q32T1: 648 MB/s
CDM 5 Read Seq: 1659 MB/s
CDM 5 Write Seq: 2001 MB/s
CDM 5/6 Read 4K: 45.41 MB/s
CDM 5/6 Write 4K: 262.6 MB/s

Disk Throttling: DiskSpd Read Loop, Queue Depth 8

No graph data

Grafikleistung

Die Grafikleistung entspricht eher der von vielen Gaming-Laptops und deklassiert nahezu die gesamte Klasse an ultradünnen, 15,6 Zoll großen Multimedia-Laptops. Ein Upgrade auf eine GeForce RTX 3060 dürfte sogar noch mehr Leistungsvorteile bringen, wenn wir im Moment auch noch nicht abschätzen können wie viel, unser Test zur Konfiguration mit der RTX 3060 steht noch aus. 

Unsere Extraseite zur GeForce RTX 2060 Max-Q listet weitere technische Informationen und Benchmarkvergleiche auf.

3DMark 11
3DMark 11
Cloud Gate
Cloud Gate
Time Spy
Time Spy
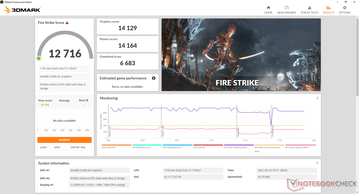
Fire Strike
Fire Strike
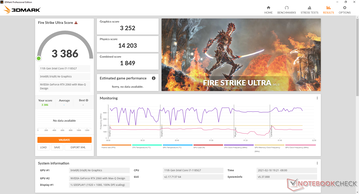
Fire Strike Ultra
Fire Strike Ultra
 
3DMark
1920x1080 Fire Strike Graphics
SCHENKER XMG Core 17 (Early 2021, RTX 3060, 5800H)
NVIDIA GeForce RTX 3060 Laptop GPU, R7 5800H
21931 Points +55%
MSI RTX 2060 Gaming Z 6G
NVIDIA GeForce RTX 2060 (Desktop), R7 2700X
19338 Points +37%
Durchschnittliche NVIDIA GeForce RTX 2060 Max-Q
  (14129 - 15650, n=4)
14900 Points +5%
MSI Stealth 15M A11SEK
NVIDIA GeForce RTX 2060 Max-Q, i7-1185G7
14129 Points
Dell XPS 15 9500 Core i7 4K UHD
NVIDIA GeForce GTX 1650 Ti Mobile, i7-10875H
9930 Points -30%
Lenovo ThinkPad P15 Gen1-20ST000DGE
NVIDIA Quadro T1000 (Laptop), i7-10750H
8757 Points -38%
MSI Summit E15 A11SCST
NVIDIA GeForce GTX 1650 Ti Max-Q, i7-1185G7
8564 Points -39%
MSI Prestige 15 A10SC
NVIDIA GeForce GTX 1650 Max-Q, i7-10710U
7774 Points -45%
Lenovo ThinkPad T15p-20TN0006GE
NVIDIA GeForce GTX 1050 Mobile, i7-10750H
5970 Points -58%
SCHENKER Vision 15
Intel Iris Xe Graphics G7 96EUs, i7-1165G7
5759 Points -59%
Lenovo ThinkPad E15 Gen2-20TD002MGE
NVIDIA GeForce MX450, i7-1165G7
4611 Points -67%
Asus VivoBook S15 S533EQ-BQ002T
NVIDIA GeForce MX350, i7-1165G7
4364 Points -69%
Lenovo Yoga Slim 7-14ARE
AMD Radeon RX Vega 8 (Ryzen 4000/5000), R7 4800U
3938 Points -72%
HP Spectre X360 15-5ZV31AV
NVIDIA GeForce MX250, i7-10510U
3530 Points -75%
Acer Aspire 5 A515-56-511A
Intel Iris Xe Graphics G7 80EUs, i5-1135G7
3263 Points -77%
Acer Swift 3 SF314-42-R27B
AMD Radeon RX Vega 5, R3 4300U
2438 Points -83%
HP ProBook 455 G7-175W8EA
AMD Radeon RX Vega 7, R7 4700U
2425 Points -83%
Dell Inspiron 15 5000 5502
Intel UHD Graphics Xe G4 48EUs, i3-1115G4
2250 Points -84%
Lenovo ThinkBook 15
Intel UHD Graphics 620, i5-10210U
1309 Points -91%
Apple MacBook 12 (Early 2016) 1.1 GHz
Intel HD Graphics 515, 6Y30
735 Points -95%
2560x1440 Time Spy Graphics
SCHENKER XMG Core 17 (Early 2021, RTX 3060, 5800H)
NVIDIA GeForce RTX 3060 Laptop GPU, R7 5800H
8706 Points +60%
MSI RTX 2060 Gaming Z 6G
NVIDIA GeForce RTX 2060 (Desktop), R7 2700X
7732 Points +42%
Durchschnittliche NVIDIA GeForce RTX 2060 Max-Q
  (5357 - 5914, n=4)
5637 Points +4%
MSI Stealth 15M A11SEK
NVIDIA GeForce RTX 2060 Max-Q, i7-1185G7
5427 Points
Dell XPS 15 9500 Core i7 4K UHD
NVIDIA GeForce GTX 1650 Ti Mobile, i7-10875H
3601 Points -34%
Lenovo ThinkPad P15 Gen1-20ST000DGE
NVIDIA Quadro T1000 (Laptop), i7-10750H
3273 Points -40%
MSI Summit E15 A11SCST
NVIDIA GeForce GTX 1650 Ti Max-Q, i7-1185G7
3151 Points -42%
MSI Prestige 15 A10SC
NVIDIA GeForce GTX 1650 Max-Q, i7-10710U
3028 Points -44%
Lenovo ThinkPad E15 Gen2-20TD002MGE
NVIDIA GeForce MX450, i7-1165G7
1975 Points -64%
Lenovo ThinkPad T15p-20TN0006GE
NVIDIA GeForce GTX 1050 Mobile, i7-10750H
1871 Points -66%
SCHENKER Vision 15
Intel Iris Xe Graphics G7 96EUs, i7-1165G7
1611 Points -70%
Asus VivoBook S15 S533EQ-BQ002T
NVIDIA GeForce MX350, i7-1165G7
1338 Points -75%
Lenovo Yoga Slim 7-14ARE
AMD Radeon RX Vega 8 (Ryzen 4000/5000), R7 4800U
1173 Points -78%
HP Spectre X360 15-5ZV31AV
NVIDIA GeForce MX250, i7-10510U
1098 Points -80%
Acer Aspire 5 A515-56-511A
Intel Iris Xe Graphics G7 80EUs, i5-1135G7
1079 Points -80%
HP ProBook 455 G7-175W8EA
AMD Radeon RX Vega 7, R7 4700U
742 Points -86%
Acer Swift 3 SF314-42-R27B
AMD Radeon RX Vega 5, R3 4300U
733 Points -86%
Dell Inspiron 15 5000 5502
Intel UHD Graphics Xe G4 48EUs, i3-1115G4
723 Points -87%
Lenovo ThinkBook 15
Intel UHD Graphics 620, i5-10210U
421 Points -92%
2560x1440 Time Spy Score
SCHENKER XMG Core 17 (Early 2021, RTX 3060, 5800H)
NVIDIA GeForce RTX 3060 Laptop GPU, R7 5800H
8776 Points +63%
MSI RTX 2060 Gaming Z 6G
NVIDIA GeForce RTX 2060 (Desktop), R7 2700X
7878 Points +46%
Durchschnittliche NVIDIA GeForce RTX 2060 Max-Q
  (5390 - 6171, n=4)
5813 Points +8%
MSI Stealth 15M A11SEK
NVIDIA GeForce RTX 2060 Max-Q, i7-1185G7
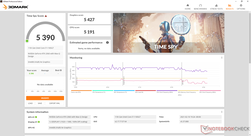
5390 Points
Dell XPS 15 9500 Core i7 4K UHD
NVIDIA GeForce GTX 1650 Ti Mobile, i7-10875H
3774 Points -30%
Lenovo ThinkPad P15 Gen1-20ST000DGE
NVIDIA Quadro T1000 (Laptop), i7-10750H
3565 Points -34%
MSI Summit E15 A11SCST
NVIDIA GeForce GTX 1650 Ti Max-Q, i7-1185G7
3330 Points -38%
MSI Prestige 15 A10SC
NVIDIA GeForce GTX 1650 Max-Q, i7-10710U
3282 Points -39%
Lenovo ThinkPad E15 Gen2-20TD002MGE
NVIDIA GeForce MX450, i7-1165G7
2164 Points -60%
Lenovo ThinkPad T15p-20TN0006GE
NVIDIA GeForce GTX 1050 Mobile, i7-10750H
2074 Points -62%
SCHENKER Vision 15
Intel Iris Xe Graphics G7 96EUs, i7-1165G7
1804 Points -67%
Asus VivoBook S15 S533EQ-BQ002T
NVIDIA GeForce MX350, i7-1165G7
1485 Points -72%
Lenovo Yoga Slim 7-14ARE
AMD Radeon RX Vega 8 (Ryzen 4000/5000), R7 4800U
1338 Points -75%
HP Spectre X360 15-5ZV31AV
NVIDIA GeForce MX250, i7-10510U
1218 Points -77%
Acer Aspire 5 A515-56-511A
Intel Iris Xe Graphics G7 80EUs, i5-1135G7
1202 Points -78%
HP ProBook 455 G7-175W8EA
AMD Radeon RX Vega 7, R7 4700U
848 Points -84%
Acer Swift 3 SF314-42-R27B
AMD Radeon RX Vega 5, R3 4300U
825 Points -85%
Dell Inspiron 15 5000 5502
Intel UHD Graphics Xe G4 48EUs, i3-1115G4
804 Points -85%
Lenovo ThinkBook 15
Intel UHD Graphics 620, i5-10210U
484 Points -91%
3DMark 11
1280x720 Performance GPU
MSI RTX 2060 Gaming Z 6G
NVIDIA GeForce RTX 2060 (Desktop), R7 2700X
26413 Points +39%
Durchschnittliche NVIDIA GeForce RTX 2060 Max-Q
  (18863 - 21105, n=4)
19881 Points +5%
MSI Stealth 15M A11SEK
NVIDIA GeForce RTX 2060 Max-Q, i7-1185G7
18985 Points
Dell XPS 15 9500 Core i7 4K UHD
NVIDIA GeForce GTX 1650 Ti Mobile, i7-10875H
12865 Points -32%
MSI Summit E15 A11SCST
NVIDIA GeForce GTX 1650 Ti Max-Q, i7-1185G7
11904 Points -37%
MSI Prestige 15 A10SC
NVIDIA GeForce GTX 1650 Max-Q, i7-10710U
11542 Points -39%
Lenovo ThinkPad P15 Gen1-20ST000DGE
NVIDIA Quadro T1000 (Laptop), i7-10750H
11377 Points -40%
Lenovo ThinkPad E15 Gen2-20TD002MGE
NVIDIA GeForce MX450, i7-1165G7
8296 Points -56%
Lenovo ThinkPad T15p-20TN0006GE
NVIDIA GeForce GTX 1050 Mobile, i7-10750H
7420 Points -61%
SCHENKER Vision 15
Intel Iris Xe Graphics G7 96EUs, i7-1165G7
6971 Points -63%
Asus VivoBook S15 S533EQ-BQ002T
NVIDIA GeForce MX350, i7-1165G7
6332 Points -67%
Lenovo Yoga Slim 7-14ARE
AMD Radeon RX Vega 8 (Ryzen 4000/5000), R7 4800U
6085 Points -68%
Acer Aspire 5 A515-56-511A
Intel Iris Xe Graphics G7 80EUs, i5-1135G7
5192 Points -73%
HP Spectre X360 15-5ZV31AV
NVIDIA GeForce MX250, i7-10510U
4659 Points -75%
Honor MagicBook 15 4500U
AMD Radeon RX Vega 6 (Ryzen 4000/5000), R5 4500U
4173 Points -78%
HP ProBook 455 G7-175W8EA
AMD Radeon RX Vega 7, R7 4700U
4019 Points -79%
Acer Swift 3 SF314-42-R27B
AMD Radeon RX Vega 5, R3 4300U
3535 Points -81%
Dell Inspiron 15 5000 5502
Intel UHD Graphics Xe G4 48EUs, i3-1115G4
3510 Points -82%
Lenovo ThinkBook 15
Intel UHD Graphics 620, i5-10210U
1914 Points -90%
Apple MacBook 12 (Early 2016) 1.1 GHz
Intel HD Graphics 515, 6Y30
1186 Points -94%
1280x720 Performance Combined
MSI RTX 2060 Gaming Z 6G
NVIDIA GeForce RTX 2060 (Desktop), R7 2700X
13742 Points +14%
Durchschnittliche NVIDIA GeForce RTX 2060 Max-Q
  (12071 - 15054, n=4)
13423 Points +11%
Dell XPS 15 9500 Core i7 4K UHD
NVIDIA GeForce GTX 1650 Ti Mobile, i7-10875H
13027 Points +8%
MSI Stealth 15M A11SEK
NVIDIA GeForce RTX 2060 Max-Q, i7-1185G7
12071 Points
Lenovo ThinkPad P15 Gen1-20ST000DGE
NVIDIA Quadro T1000 (Laptop), i7-10750H
11572 Points -4%
MSI Summit E15 A11SCST
NVIDIA GeForce GTX 1650 Ti Max-Q, i7-1185G7
10524 Points -13%
MSI Prestige 15 A10SC
NVIDIA GeForce GTX 1650 Max-Q, i7-10710U
10350 Points -14%
Lenovo ThinkPad T15p-20TN0006GE
NVIDIA GeForce GTX 1050 Mobile, i7-10750H
7411 Points -39%
SCHENKER Vision 15
Intel Iris Xe Graphics G7 96EUs, i7-1165G7
6970 Points -42%
Lenovo ThinkPad E15 Gen2-20TD002MGE
NVIDIA GeForce MX450, i7-1165G7
5815 Points -52%
Asus VivoBook S15 S533EQ-BQ002T
NVIDIA GeForce MX350, i7-1165G7
5246 Points -57%
Lenovo Yoga Slim 7-14ARE
AMD Radeon RX Vega 8 (Ryzen 4000/5000), R7 4800U
4323 Points -64%
HP Spectre X360 15-5ZV31AV
NVIDIA GeForce MX250, i7-10510U
4247 Points -65%
Acer Aspire 5 A515-56-511A
Intel Iris Xe Graphics G7 80EUs, i5-1135G7
3857 Points -68%
Honor MagicBook 15 4500U
AMD Radeon RX Vega 6 (Ryzen 4000/5000), R5 4500U
3405 Points -72%
Acer Swift 3 SF314-42-R27B
AMD Radeon RX Vega 5, R3 4300U
3288 Points -73%
HP ProBook 455 G7-175W8EA
AMD Radeon RX Vega 7, R7 4700U
2567 Points -79%
Dell Inspiron 15 5000 5502
Intel UHD Graphics Xe G4 48EUs, i3-1115G4
2377 Points -80%
Lenovo ThinkBook 15
Intel UHD Graphics 620, i5-10210U
1910 Points -84%
Apple MacBook 12 (Early 2016) 1.1 GHz
Intel HD Graphics 515, 6Y30
1014 Points -92%
3DMark 11 Performance
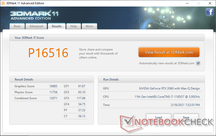
16516 Punkte
3DMark Cloud Gate Standard Score
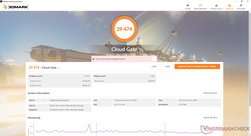
29474 Punkte
3DMark Fire Strike Score
12716 Punkte
3DMark Time Spy Score
5390 Punkte
Hilfe
Final Fantasy XV Benchmark
1280x720 Lite Quality
MSI RTX 2060 Gaming Z 6G
AMD Ryzen 7 2700X, NVIDIA GeForce RTX 2060 (Desktop)
151.9 (95min - 175max) fps +21%
HP Envy 15-ep0098nr
Intel Core i7-10750H, NVIDIA GeForce RTX 2060 Max-Q
139 fps +10%
Durchschnittliche NVIDIA GeForce RTX 2060 Max-Q
  (126 - 141, n=3)
135.3 fps +7%
MSI Stealth 15M A11SEK
Intel Core i7-1185G7, NVIDIA GeForce RTX 2060 Max-Q
126 fps
Lenovo ThinkPad E15 Gen2-20TD002MGE
Intel Core i7-1165G7, NVIDIA GeForce MX450
51.5 fps -59%
Lenovo Yoga Slim 7-14ARE
AMD Ryzen 7 4800U, AMD Radeon RX Vega 8 (Ryzen 4000/5000)
37.5 fps -70%
Acer Aspire 5 A515-56-511A
Intel Core i5-1135G7, Intel Iris Xe Graphics G7 80EUs
25.6 fps -80%
Honor MagicBook 15 4500U
AMD Ryzen 5 4500U, AMD Radeon RX Vega 6 (Ryzen 4000/5000)
25.38 fps -80%
Dell Inspiron 15 5000 5502
Intel Core i3-1115G4, Intel UHD Graphics Xe G4 48EUs
19.2 fps -85%
1920x1080 Standard Quality
MSI RTX 2060 Gaming Z 6G
AMD Ryzen 7 2700X, NVIDIA GeForce RTX 2060 (Desktop)
99.6 (73min - 132max) fps +34%
HP Envy 15-ep0098nr
Intel Core i7-10750H, NVIDIA GeForce RTX 2060 Max-Q
79 fps +7%
Durchschnittliche NVIDIA GeForce RTX 2060 Max-Q
  (74.1 - 82.7, n=3)
78.6 fps +6%
MSI Stealth 15M A11SEK
Intel Core i7-1185G7, NVIDIA GeForce RTX 2060 Max-Q
74.1 fps
Lenovo ThinkPad E15 Gen2-20TD002MGE
Intel Core i7-1165G7, NVIDIA GeForce MX450
26 fps -65%
Lenovo Yoga Slim 7-14ARE
AMD Ryzen 7 4800U, AMD Radeon RX Vega 8 (Ryzen 4000/5000)
18.8 fps -75%
Honor MagicBook 15 4500U
AMD Ryzen 5 4500U, AMD Radeon RX Vega 6 (Ryzen 4000/5000)
12.23 fps -83%
Dell Inspiron 15 5000 5502
Intel Core i3-1115G4, Intel UHD Graphics Xe G4 48EUs
11.5 fps -84%
1920x1080 High Quality
MSI RTX 2060 Gaming Z 6G
AMD Ryzen 7 2700X, NVIDIA GeForce RTX 2060 (Desktop)
72.6 (31min - 114max) fps +30%
HP Envy 15-ep0098nr
Intel Core i7-10750H, NVIDIA GeForce RTX 2060 Max-Q
61.3 fps +10%
Durchschnittliche NVIDIA GeForce RTX 2060 Max-Q
  (55.7 - 62.4, n=3)
59.8 fps +7%
MSI Stealth 15M A11SEK
Intel Core i7-1185G7, NVIDIA GeForce RTX 2060 Max-Q
55.7 fps
Lenovo ThinkPad E15 Gen2-20TD002MGE
Intel Core i7-1165G7, NVIDIA GeForce MX450
15 fps -73%
Lenovo Yoga Slim 7-14ARE
AMD Ryzen 7 4800U, AMD Radeon RX Vega 8 (Ryzen 4000/5000)
12 fps -78%
Dell Inspiron 15 5000 5502
Intel Core i3-1115G4, Intel UHD Graphics Xe G4 48EUs
7.99 fps -86%
GTA V
1920x1080 Lowest Settings possible
MSI Stealth 15M A11SEK
Intel Core i7-1185G7, NVIDIA GeForce RTX 2060 Max-Q
163 (4.25min, 100P1 - 309max) fps
Durchschnittliche NVIDIA GeForce RTX 2060 Max-Q
  ()
163 fps 0%
Lenovo Yoga Slim 7-14ARE
AMD Ryzen 7 4800U, AMD Radeon RX Vega 8 (Ryzen 4000/5000)
69.1 (4.94min, 50P1 - 109max) fps -58%
Acer Swift 3 SF314-42-R27B
AMD Ryzen 3 4300U, AMD Radeon RX Vega 5
50 fps -69%
1366x768 Normal/Off AF:4x
MSI RTX 2060 Gaming Z 6G
AMD Ryzen 7 2700X, NVIDIA GeForce RTX 2060 (Desktop)
166.4 fps +1%
MSI Stealth 15M A11SEK
Intel Core i7-1185G7, NVIDIA GeForce RTX 2060 Max-Q
164 (4.67min, 100P1 - 315max) fps
Durchschnittliche NVIDIA GeForce RTX 2060 Max-Q
  ()
164 fps 0%
Acer Swift 3 SF314-42-R27B
AMD Ryzen 3 4300U, AMD Radeon RX Vega 5
70.7 fps -57%
1920x1080 Highest Settings possible AA:4xMSAA + FX AF:16x
MSI RTX 2060 Gaming Z 6G
AMD Ryzen 7 2700X, NVIDIA GeForce RTX 2060 (Desktop)
100.5 fps +47%
MSI Stealth 15M A11SEK
Intel Core i7-1185G7, NVIDIA GeForce RTX 2060 Max-Q
68.2 (9.85min, 43.5P1 - 131max) fps
Durchschnittliche NVIDIA GeForce RTX 2060 Max-Q
  ()
68.2 fps 0%
Lenovo Yoga Slim 7-14ARE
AMD Ryzen 7 4800U, AMD Radeon RX Vega 8 (Ryzen 4000/5000)
12.1 (1.902min, 8.4P1 - 63.6max) fps -82%
Acer Swift 3 SF314-42-R27B
AMD Ryzen 3 4300U, AMD Radeon RX Vega 5
7.7 fps -89%
The Witcher 3
1024x768 Low Graphics & Postprocessing
HP Envy 15-ep0098nr
Intel Core i7-10750H, NVIDIA GeForce RTX 2060 Max-Q
310.8 (287min - 329max) fps +32%
MSI RTX 2060 Gaming Z 6G
AMD Ryzen 7 2700X, NVIDIA GeForce RTX 2060 (Desktop)
286.7 (265min - 336max) fps +22%
Durchschnittliche NVIDIA GeForce RTX 2060 Max-Q
  (232 - 311, n=4)
266 fps +13%
MSI Stealth 15M A11SEK
Intel Core i7-1185G7, NVIDIA GeForce RTX 2060 Max-Q
235.1 (211min - 258max) fps
Dell XPS 15 9500 Core i7 4K UHD
Intel Core i7-10875H, NVIDIA GeForce GTX 1650 Ti Mobile
209.9 (199min - 226max) fps -11%
Lenovo ThinkPad P15 Gen1-20ST000DGE
Intel Core i7-10750H, NVIDIA Quadro T1000 (Laptop)
189 (160min - 211max) fps -20%
Asus ZenBook UX535-M01440
Intel Core i7-10750H, NVIDIA GeForce GTX 1650 Ti Max-Q
167.9 fps -29%
MSI Prestige 15 A10SC
Intel Core i7-10710U, NVIDIA GeForce GTX 1650 Max-Q
155.4 fps -34%
MSI Summit E15 A11SCST
Intel Core i7-1185G7, NVIDIA GeForce GTX 1650 Ti Max-Q
153.2 (138min - 171max) fps -35%
Lenovo ThinkPad T15p-20TN0006GE
Intel Core i7-10750H, NVIDIA GeForce GTX 1050 Mobile
118 (31min - 135max) fps -50%
SCHENKER Vision 15
Intel Core i7-1165G7, Intel Iris Xe Graphics G7 96EUs
97.8 fps -58%
Asus VivoBook S15 S533EQ-BQ002T
Intel Core i7-1165G7, NVIDIA GeForce MX350
79.6 fps -66%
Lenovo Yoga Slim 7-14ARE
AMD Ryzen 7 4800U, AMD Radeon RX Vega 8 (Ryzen 4000/5000)
70.8 fps -70%
HP ProBook 450 G7 8WC04UT
Intel Core i7-10510U, NVIDIA GeForce MX250
66.7 (60min - 75max) fps -72%
Honor MagicBook 15 4500U
AMD Ryzen 5 4500U, AMD Radeon RX Vega 6 (Ryzen 4000/5000)
47.82 fps -80%
Dell Inspiron 15 5000 5502
Intel Core i3-1115G4, Intel UHD Graphics Xe G4 48EUs
46.2 (41min - 52max) fps -80%
Acer Swift 3 SF314-42-R27B
AMD Ryzen 3 4300U, AMD Radeon RX Vega 5
44.5 fps -81%
Apple MacBook 12 (Early 2016) 1.1 GHz
Intel Core m3-6Y30, Intel HD Graphics 515
7.4 fps -97%
1366x768 Medium Graphics & Postprocessing
HP Envy 15-ep0098nr
Intel Core i7-10750H, NVIDIA GeForce RTX 2060 Max-Q
209.6 (199min - 218max) fps +50%
MSI RTX 2060 Gaming Z 6G
AMD Ryzen 7 2700X, NVIDIA GeForce RTX 2060 (Desktop)
204.5 (163min - 231max) fps +46%
Durchschnittliche NVIDIA GeForce RTX 2060 Max-Q
  (139.9 - 210, n=4)
175 fps +25%
MSI Stealth 15M A11SEK
Intel Core i7-1185G7, NVIDIA GeForce RTX 2060 Max-Q
139.9 (134min - 151max) fps
Lenovo ThinkPad P15 Gen1-20ST000DGE
Intel Core i7-10750H, NVIDIA Quadro T1000 (Laptop)
114 (96min - 128max) fps -19%
Dell XPS 15 9500 Core i7 4K UHD
Intel Core i7-10875H, NVIDIA GeForce GTX 1650 Ti Mobile
100.8 (73min - 114max) fps -28%
Asus ZenBook UX535-M01440
Intel Core i7-10750H, NVIDIA GeForce GTX 1650 Ti Max-Q
100.3 fps -28%
MSI Prestige 15 A10SC
Intel Core i7-10710U, NVIDIA GeForce GTX 1650 Max-Q
94.1 fps -33%
MSI Summit E15 A11SCST
Intel Core i7-1185G7, NVIDIA GeForce GTX 1650 Ti Max-Q
92 (79min - 102max) fps -34%
Lenovo ThinkPad T15p-20TN0006GE
Intel Core i7-10750H, NVIDIA GeForce GTX 1050 Mobile
70 (60min - 79max) fps -50%
SCHENKER Vision 15
Intel Core i7-1165G7, Intel Iris Xe Graphics G7 96EUs
63.1 fps -55%
Asus VivoBook S15 S533EQ-BQ002T
Intel Core i7-1165G7, NVIDIA GeForce MX350
46.9 fps -66%
HP Spectre X360 15-5ZV31AV
Intel Core i7-10510U, NVIDIA GeForce MX250
38.7 fps -72%
HP ProBook 450 G7 8WC04UT
Intel Core i7-10510U, NVIDIA GeForce MX250
34.7 (30min - 37max) fps -75%
Lenovo ThinkPad E15 Gen2-20TD002MGE
Intel Core i7-1165G7, NVIDIA GeForce MX450
34 fps -76%
Acer Swift 3 SF314-42-R27B
AMD Ryzen 3 4300U, AMD Radeon RX Vega 5
28.4 fps -80%
Dell Inspiron 15 5000 5502
Intel Core i3-1115G4, Intel UHD Graphics Xe G4 48EUs
27.8 (2min - 33max) fps -80%
1920x1080 High Graphics & Postprocessing (Nvidia HairWorks Off)
MSI RTX 2060 Gaming Z 6G
AMD Ryzen 7 2700X, NVIDIA GeForce RTX 2060 (Desktop)
135.7 (113min - 150max) fps +53%
HP Envy 15-ep0098nr
Intel Core i7-10750H, NVIDIA GeForce RTX 2060 Max-Q
119 (110min - 132max) fps +34%
Durchschnittliche NVIDIA GeForce RTX 2060 Max-Q
  (88.9 - 119, n=4)
104.4 fps +17%
MSI Stealth 15M A11SEK
Intel Core i7-1185G7, NVIDIA GeForce RTX 2060 Max-Q
88.9 (85min - 99max) fps
Dell XPS 15 9500 Core i7 4K UHD
Intel Core i7-10875H, NVIDIA GeForce GTX 1650 Ti Mobile
65.6 (60min - 69max) fps -26%
Lenovo ThinkPad P15 Gen1-20ST000DGE
Intel Core i7-10750H, NVIDIA Quadro T1000 (Laptop)
62.9 (51min - 70max) fps -29%
Asus ZenBook UX535-M01440
Intel Core i7-10750H, NVIDIA GeForce GTX 1650 Ti Max-Q
55 fps -38%
MSI Summit E15 A11SCST
Intel Core i7-1185G7, NVIDIA GeForce GTX 1650 Ti Max-Q
54.9 (49min - 60max) fps -38%
MSI Prestige 15 A10SC
Intel Core i7-10710U, NVIDIA GeForce GTX 1650 Max-Q
54.8 fps -38%
Lenovo ThinkPad T15p-20TN0006GE
Intel Core i7-10750H, NVIDIA GeForce GTX 1050 Mobile
39.2 (29min - 44max) fps -56%
SCHENKER Vision 15
Intel Core i7-1165G7, Intel Iris Xe Graphics G7 96EUs
35.4 (34min, 34P1 - 37max) fps -60%
Asus VivoBook S15 S533EQ-BQ002T
Intel Core i7-1165G7, NVIDIA GeForce MX350
27 fps -70%
Lenovo Yoga Slim 7-14ARE
AMD Ryzen 7 4800U, AMD Radeon RX Vega 8 (Ryzen 4000/5000)
23.1 fps -74%
HP Spectre X360 15-5ZV31AV
Intel Core i7-10510U, NVIDIA GeForce MX250
21.9 fps -75%
HP ProBook 450 G7 8WC04UT
Intel Core i7-10510U, NVIDIA GeForce MX250
21 (18min - 24max) fps -76%
Lenovo ThinkPad E15 Gen2-20TD002MGE
Intel Core i7-1165G7, NVIDIA GeForce MX450
21 fps -76%
Dell Inspiron 15 5000 5502
Intel Core i3-1115G4, Intel UHD Graphics Xe G4 48EUs
14.7 (11min - 17max) fps -83%
Acer Swift 3 SF314-42-R27B
AMD Ryzen 3 4300U, AMD Radeon RX Vega 5
14.1 fps -84%
1920x1080 Ultra Graphics & Postprocessing (HBAO+)
MSI RTX 2060 Gaming Z 6G
AMD Ryzen 7 2700X, NVIDIA GeForce RTX 2060 (Desktop)
72.7 (61min - 82max) fps +42%
HP Envy 15-ep0098nr
Intel Core i7-10750H, NVIDIA GeForce RTX 2060 Max-Q
62.9 (58min - 67max) fps +23%
Durchschnittliche NVIDIA GeForce RTX 2060 Max-Q
  (51.2 - 62.9, n=4)
57.2 fps +12%
MSI Stealth 15M A11SEK
Intel Core i7-1185G7, NVIDIA GeForce RTX 2060 Max-Q
51.2 (49min - 54max) fps
Dell XPS 15 9500 Core i7 4K UHD
Intel Core i7-10875H, NVIDIA GeForce GTX 1650 Ti Mobile
38.1 (34min - 43max) fps -26%
Lenovo ThinkPad P15 Gen1-20ST000DGE
Intel Core i7-10750H, NVIDIA Quadro T1000 (Laptop)
35 (28min - 41max) fps -32%
MSI Summit E15 A11SCST
Intel Core i7-1185G7, NVIDIA GeForce GTX 1650 Ti Max-Q
32.5 (27min - 37max) fps -37%
MSI Prestige 15 A10SC
Intel Core i7-10710U, NVIDIA GeForce GTX 1650 Max-Q
30.8 fps -40%
Asus ZenBook UX535-M01440
Intel Core i7-10750H, NVIDIA GeForce GTX 1650 Ti Max-Q
30.7 fps -40%
Lenovo ThinkPad T15p-20TN0006GE
Intel Core i7-10750H, NVIDIA GeForce GTX 1050 Mobile
22.1 (17min - 27max) fps -57%
Asus VivoBook S15 S533EQ-BQ002T
Intel Core i7-1165G7, NVIDIA GeForce MX350
15.6 fps -70%
SCHENKER Vision 15
Intel Core i7-1165G7, Intel Iris Xe Graphics G7 96EUs
15.5 fps -70%
Lenovo Yoga Slim 7-14ARE
AMD Ryzen 7 4800U, AMD Radeon RX Vega 8 (Ryzen 4000/5000)
14.9 fps -71%
HP Spectre X360 15-5ZV31AV
Intel Core i7-10510U, NVIDIA GeForce MX250
12.2 fps -76%
HP ProBook 450 G7 8WC04UT
Intel Core i7-10510U, NVIDIA GeForce MX250
11.2 (8min - 14max) fps -78%
Acer Swift 3 SF314-42-R27B
AMD Ryzen 3 4300U, AMD Radeon RX Vega 5
8.9 fps -83%
Dell Inspiron 15 5000 5502
Intel Core i3-1115G4, Intel UHD Graphics Xe G4 48EUs
7.7 (6min - 9max) fps -85%
Dota 2 Reborn
1280x720 min (0/3) fastest
Lenovo ThinkPad P15 Gen1-20ST000DGE
Intel Core i7-10750H, NVIDIA Quadro T1000 (Laptop)
151 (132.5min) fps +5%
Dell XPS 15 9500 Core i7 4K UHD
Intel Core i7-10875H, NVIDIA GeForce GTX 1650 Ti Mobile
150 (131.2min) fps +4%
Asus ZenBook UX535-M01440
Intel Core i7-10750H, NVIDIA GeForce GTX 1650 Ti Max-Q
144 (95.5min) fps 0%
MSI Stealth 15M A11SEK
Intel Core i7-1185G7, NVIDIA GeForce RTX 2060 Max-Q
144 (127.9min) fps
HP Envy 15-ep0098nr
Intel Core i7-10750H, NVIDIA GeForce RTX 2060 Max-Q
141 (123.6min) fps -2%
Durchschnittliche NVIDIA GeForce RTX 2060 Max-Q
  (120.8 - 152, n=4)
139.5 fps -3%
Asus VivoBook S15 S533EQ-BQ002T
Intel Core i7-1165G7, NVIDIA GeForce MX350
138 (123.8min) fps -4%
MSI Summit E15 A11SCST
Intel Core i7-1185G7, NVIDIA GeForce GTX 1650 Ti Max-Q
137 (121.6min) fps -5%
Lenovo ThinkPad E15 Gen2-20TD002MGE
Intel Core i7-1165G7, NVIDIA GeForce MX450
137 (121.9min) fps -5%
Lenovo ThinkPad T15p-20TN0006GE
Intel Core i7-10750H, NVIDIA GeForce GTX 1050 Mobile
124 (109.9min) fps -14%
HP ProBook 450 G7 8WC04UT
Intel Core i7-10510U, NVIDIA GeForce MX250
110 (96.5min) fps -24%
Lenovo Yoga Slim 7-14ARE
AMD Ryzen 7 4800U, AMD Radeon RX Vega 8 (Ryzen 4000/5000)
97.1 (87.3min) fps -33%
Acer Swift 3 SF314-42-R27B
AMD Ryzen 3 4300U, AMD Radeon RX Vega 5
93.3 (76.1min) fps -35%
Honor MagicBook 15 4500U
AMD Ryzen 5 4500U, AMD Radeon RX Vega 6 (Ryzen 4000/5000)
90.4 (81.3min) fps -37%
Lenovo ThinkBook 15
Intel Core i5-10210U, Intel UHD Graphics 620
84.6 (75min) fps -41%
HP ProBook 455 G7-175W8EA
AMD Ryzen 7 4700U, AMD Radeon RX Vega 7
84.2 (74.1min) fps -42%
SCHENKER Vision 15
Intel Core i7-1165G7, Intel Iris Xe Graphics G7 96EUs
76.5 (30.8min) fps -47%
Acer Aspire 5 A515-56-511A
Intel Core i5-1135G7, Intel Iris Xe Graphics G7 80EUs
74.1 (47.1min) fps -49%
Dell Inspiron 15 5000 5502
Intel Core i3-1115G4, Intel UHD Graphics Xe G4 48EUs
73 (59.1min) fps -49%
1920x1080 high (2/3)
Dell XPS 15 9500 Core i7 4K UHD
Intel Core i7-10875H, NVIDIA GeForce GTX 1650 Ti Mobile
130 (113.7min) fps +9%
Lenovo ThinkPad P15 Gen1-20ST000DGE
Intel Core i7-10750H, NVIDIA Quadro T1000 (Laptop)
123 (107.8min) fps +3%
HP Envy 15-ep0098nr
Intel Core i7-10750H, NVIDIA GeForce RTX 2060 Max-Q
120 (102.4min) fps +1%
Durchschnittliche NVIDIA GeForce RTX 2060 Max-Q
  (107.8 - 131, n=4)
119.5 fps 0%
MSI Stealth 15M A11SEK
Intel Core i7-1185G7, NVIDIA GeForce RTX 2060 Max-Q
119 (103.7min) fps
Asus ZenBook UX535-M01440
Intel Core i7-10750H, NVIDIA GeForce GTX 1650 Ti Max-Q
112 (98.1min) fps -6%
MSI Summit E15 A11SCST
Intel Core i7-1185G7, NVIDIA GeForce GTX 1650 Ti Max-Q
111 (96.1min) fps -7%
Lenovo ThinkPad T15p-20TN0006GE
Intel Core i7-10750H, NVIDIA GeForce GTX 1050 Mobile
103 (90min) fps -13%
Lenovo ThinkPad E15 Gen2-20TD002MGE
Intel Core i7-1165G7, NVIDIA GeForce MX450
88.6 (78.4min) fps -26%
Asus VivoBook S15 S533EQ-BQ002T
Intel Core i7-1165G7, NVIDIA GeForce MX350
84.1 (73.9min) fps -29%
HP ProBook 450 G7 8WC04UT
Intel Core i7-10510U, NVIDIA GeForce MX250
68 (58.8min) fps -43%
Lenovo Yoga Slim 7-14ARE
AMD Ryzen 7 4800U, AMD Radeon RX Vega 8 (Ryzen 4000/5000)
56 (50.6min) fps -53%
SCHENKER Vision 15
Intel Core i7-1165G7, Intel Iris Xe Graphics G7 96EUs
53.6 (35.6min) fps -55%
Honor MagicBook 15 4500U
AMD Ryzen 5 4500U, AMD Radeon RX Vega 6 (Ryzen 4000/5000)
42 (38.5min) fps -65%
Acer Swift 3 SF314-42-R27B
AMD Ryzen 3 4300U, AMD Radeon RX Vega 5
41.4 (37.7min) fps -65%
HP ProBook 455 G7-175W8EA
AMD Ryzen 7 4700U, AMD Radeon RX Vega 7
35.5 (30.6min) fps -70%
Acer Aspire 5 A515-56-511A
Intel Core i5-1135G7, Intel Iris Xe Graphics G7 80EUs
32.4 (23.8min) fps -73%
Dell Inspiron 15 5000 5502
Intel Core i3-1115G4, Intel UHD Graphics Xe G4 48EUs
22 (15.5min) fps -82%
Lenovo ThinkBook 15
Intel Core i5-10210U, Intel UHD Graphics 620
21.9 (20.4min) fps -82%
1920x1080 ultra (3/3) best looking
Dell XPS 15 9500 Core i7 4K UHD
Intel Core i7-10875H, NVIDIA GeForce GTX 1650 Ti Mobile
120 (104.7min) fps +3%
MSI Stealth 15M A11SEK
Intel Core i7-1185G7, NVIDIA GeForce RTX 2060 Max-Q
116 (101.7min) fps
Lenovo ThinkPad P15 Gen1-20ST000DGE
Intel Core i7-10750H, NVIDIA Quadro T1000 (Laptop)
115 (99.6min) fps -1%
Durchschnittliche NVIDIA GeForce RTX 2060 Max-Q
  (103.8 - 123, n=4)
114.2 fps -2%
HP Envy 15-ep0098nr
Intel Core i7-10750H, NVIDIA GeForce RTX 2060 Max-Q
114 (98.7min) fps -2%
MSI Summit E15 A11SCST
Intel Core i7-1185G7, NVIDIA GeForce GTX 1650 Ti Max-Q
107 (92.3min) fps -8%
Asus ZenBook UX535-M01440
Intel Core i7-10750H, NVIDIA GeForce GTX 1650 Ti Max-Q
106 (93min) fps -9%
Lenovo ThinkPad T15p-20TN0006GE
Intel Core i7-10750H, NVIDIA GeForce GTX 1050 Mobile
96.9 (85.5min) fps -16%
Lenovo ThinkPad E15 Gen2-20TD002MGE
Intel Core i7-1165G7, NVIDIA GeForce MX450
81.6 (72.2min) fps -30%
Asus VivoBook S15 S533EQ-BQ002T
Intel Core i7-1165G7, NVIDIA GeForce MX350
76.3 (64.5min) fps -34%
HP ProBook 450 G7 8WC04UT
Intel Core i7-10510U, NVIDIA GeForce MX250
60.7 (51.4min) fps -48%
Lenovo Yoga Slim 7-14ARE
AMD Ryzen 7 4800U, AMD Radeon RX Vega 8 (Ryzen 4000/5000)
52.5 (47.3min) fps -55%
SCHENKER Vision 15
Intel Core i7-1165G7, Intel Iris Xe Graphics G7 96EUs
49.7 (33.4min) fps -57%
Honor MagicBook 15 4500U
AMD Ryzen 5 4500U, AMD Radeon RX Vega 6 (Ryzen 4000/5000)
39.5 (36.2min) fps -66%
Acer Swift 3 SF314-42-R27B
AMD Ryzen 3 4300U, AMD Radeon RX Vega 5
39.1 (36min) fps -66%
HP ProBook 455 G7-175W8EA
AMD Ryzen 7 4700U, AMD Radeon RX Vega 7
33.5 (29.6min) fps -71%
Acer Aspire 5 A515-56-511A
Intel Core i5-1135G7, Intel Iris Xe Graphics G7 80EUs
30.9 (22.8min) fps -73%
Dell Inspiron 15 5000 5502
Intel Core i3-1115G4, Intel UHD Graphics Xe G4 48EUs
20 (14.5min) fps -83%
Lenovo ThinkBook 15
Intel Core i5-10210U, Intel UHD Graphics 620
19.6 (18.2min) fps -83%
X-Plane 11.11
1280x720 low (fps_test=1)
Dell XPS 15 9500 Core i7 4K UHD
Intel Core i7-10875H, NVIDIA GeForce GTX 1650 Ti Mobile
109 fps +7%
Lenovo ThinkPad P15 Gen1-20ST000DGE
Intel Core i7-10750H, NVIDIA Quadro T1000 (Laptop)
108 fps +6%
HP Envy 15-ep0098nr
Intel Core i7-10750H, NVIDIA GeForce RTX 2060 Max-Q
103 fps +1%
Durchschnittliche NVIDIA GeForce RTX 2060 Max-Q
  (94.9 - 111, n=4)
102.7 fps +1%
MSI Stealth 15M A11SEK
Intel Core i7-1185G7, NVIDIA GeForce RTX 2060 Max-Q
102 fps
Lenovo ThinkPad T15p-20TN0006GE
Intel Core i7-10750H, NVIDIA GeForce GTX 1050 Mobile
94.9 fps -7%
MSI Summit E15 A11SCST
Intel Core i7-1185G7, NVIDIA GeForce GTX 1650 Ti Max-Q
91.2 fps -11%
Asus ZenBook UX535-M01440
Intel Core i7-10750H, NVIDIA GeForce GTX 1650 Ti Max-Q
86.6 fps -15%
Lenovo ThinkPad E15 Gen2-20TD002MGE
Intel Core i7-1165G7, NVIDIA GeForce MX450
86.5 fps -15%
Asus VivoBook S15 S533EQ-BQ002T
Intel Core i7-1165G7, NVIDIA GeForce MX350
74.5 fps -27%
SCHENKER Vision 15
Intel Core i7-1165G7, Intel Iris Xe Graphics G7 96EUs
46.4 fps -55%
Acer Aspire 5 A515-56-511A
Intel Core i5-1135G7, Intel Iris Xe Graphics G7 80EUs
46.1 fps -55%
HP ProBook 450 G7 8WC04UT
Intel Core i7-10510U, NVIDIA GeForce MX250
44.3 fps -57%
Lenovo Yoga Slim 7-14ARE
AMD Ryzen 7 4800U, AMD Radeon RX Vega 8 (Ryzen 4000/5000)
42.7 fps -58%
Honor MagicBook 15 4500U
AMD Ryzen 5 4500U, AMD Radeon RX Vega 6 (Ryzen 4000/5000)
38.3 fps -62%
Dell Inspiron 15 5000 5502
Intel Core i3-1115G4, Intel UHD Graphics Xe G4 48EUs
33.7 fps -67%
Acer Swift 3 SF314-42-R27B
AMD Ryzen 3 4300U, AMD Radeon RX Vega 5
31.5 fps -69%
HP ProBook 455 G7-175W8EA
AMD Ryzen 7 4700U, AMD Radeon RX Vega 7
30.9 fps -70%
Lenovo ThinkBook 15
Intel Core i5-10210U, Intel UHD Graphics 620
11.5 fps -89%
1920x1080 med (fps_test=2)
Lenovo ThinkPad P15 Gen1-20ST000DGE
Intel Core i7-10750H, NVIDIA Quadro T1000 (Laptop)
96 fps +7%
HP Envy 15-ep0098nr
Intel Core i7-10750H, NVIDIA GeForce RTX 2060 Max-Q
90.7 fps +1%
Durchschnittliche NVIDIA GeForce RTX 2060 Max-Q
  (81.9 - 97.8, n=4)
90.1 fps 0%
MSI Stealth 15M A11SEK
Intel Core i7-1185G7, NVIDIA GeForce RTX 2060 Max-Q
90 fps
Asus ZenBook UX535-M01440
Intel Core i7-10750H, NVIDIA GeForce GTX 1650 Ti Max-Q
79.4 fps -12%
MSI Summit E15 A11SCST
Intel Core i7-1185G7, NVIDIA GeForce GTX 1650 Ti Max-Q
79.2 fps -12%
Dell XPS 15 9500 Core i7 4K UHD
Intel Core i7-10875H, NVIDIA GeForce GTX 1650 Ti Mobile
78.2 fps -13%
Lenovo ThinkPad T15p-20TN0006GE
Intel Core i7-10750H, NVIDIA GeForce GTX 1050 Mobile
77.8 fps -14%
Lenovo ThinkPad E15 Gen2-20TD002MGE
Intel Core i7-1165G7, NVIDIA GeForce MX450
73.5 fps -18%
Asus VivoBook S15 S533EQ-BQ002T
Intel Core i7-1165G7, NVIDIA GeForce MX350
52 fps -42%
SCHENKER Vision 15
Intel Core i7-1165G7, Intel Iris Xe Graphics G7 96EUs
39.3 fps -56%
HP ProBook 450 G7 8WC04UT
Intel Core i7-10510U, NVIDIA GeForce MX250
38.7 fps -57%
Lenovo Yoga Slim 7-14ARE
AMD Ryzen 7 4800U, AMD Radeon RX Vega 8 (Ryzen 4000/5000)
34.5 fps -62%
Acer Aspire 5 A515-56-511A
Intel Core i5-1135G7, Intel Iris Xe Graphics G7 80EUs
33 fps -63%
Honor MagicBook 15 4500U
AMD Ryzen 5 4500U, AMD Radeon RX Vega 6 (Ryzen 4000/5000)
28.9 fps -68%
Acer Swift 3 SF314-42-R27B
AMD Ryzen 3 4300U, AMD Radeon RX Vega 5
24.9 fps -72%
HP ProBook 455 G7-175W8EA
AMD Ryzen 7 4700U, AMD Radeon RX Vega 7
24.4 fps -73%
Dell Inspiron 15 5000 5502
Intel Core i3-1115G4, Intel UHD Graphics Xe G4 48EUs
24.2 fps -73%
Lenovo ThinkBook 15
Intel Core i5-10210U, Intel UHD Graphics 620
13.4 fps -85%
1920x1080 high (fps_test=3)
Lenovo ThinkPad P15 Gen1-20ST000DGE
Intel Core i7-10750H, NVIDIA Quadro T1000 (Laptop)
80.1 fps +6%
HP Envy 15-ep0098nr
Intel Core i7-10750H, NVIDIA GeForce RTX 2060 Max-Q
77.4 fps +2%
MSI Stealth 15M A11SEK
Intel Core i7-1185G7, NVIDIA GeForce RTX 2060 Max-Q
75.6 fps
Durchschnittliche NVIDIA GeForce RTX 2060 Max-Q
  (69.7 - 79.8, n=4)
75.6 fps 0%
Asus ZenBook UX535-M01440
Intel Core i7-10750H, NVIDIA GeForce GTX 1650 Ti Max-Q
67.5 fps -11%
MSI Summit E15 A11SCST
Intel Core i7-1185G7, NVIDIA GeForce GTX 1650 Ti Max-Q
66.7 fps -12%
Lenovo ThinkPad T15p-20TN0006GE
Intel Core i7-10750H, NVIDIA GeForce GTX 1050 Mobile
66.7 fps -12%
Dell XPS 15 9500 Core i7 4K UHD
Intel Core i7-10875H, NVIDIA GeForce GTX 1650 Ti Mobile
63.3 fps -16%
Lenovo ThinkPad E15 Gen2-20TD002MGE
Intel Core i7-1165G7, NVIDIA GeForce MX450
62.8 fps -17%
Asus VivoBook S15 S533EQ-BQ002T
Intel Core i7-1165G7, NVIDIA GeForce MX350
36.5 fps -52%
HP ProBook 450 G7 8WC04UT
Intel Core i7-10510U, NVIDIA GeForce MX250
35.5 fps -53%
SCHENKER Vision 15
Intel Core i7-1165G7, Intel Iris Xe Graphics G7 96EUs
34.4 fps -54%
Acer Aspire 5 A515-56-511A
Intel Core i5-1135G7, Intel Iris Xe Graphics G7 80EUs
30.6 fps -60%
Lenovo Yoga Slim 7-14ARE
AMD Ryzen 7 4800U, AMD Radeon RX Vega 8 (Ryzen 4000/5000)
30.5 fps -60%
Honor MagicBook 15 4500U
AMD Ryzen 5 4500U, AMD Radeon RX Vega 6 (Ryzen 4000/5000)
26.2 fps -65%
Acer Swift 3 SF314-42-R27B
AMD Ryzen 3 4300U, AMD Radeon RX Vega 5
22.4 fps -70%
Dell Inspiron 15 5000 5502
Intel Core i3-1115G4, Intel UHD Graphics Xe G4 48EUs
22.3 fps -71%
HP ProBook 455 G7-175W8EA
AMD Ryzen 7 4700U, AMD Radeon RX Vega 7
21.9 fps -71%
Lenovo ThinkBook 15
Intel Core i5-10210U, Intel UHD Graphics 620
12.4 fps -84%
Strange Brigade
1280x720 lowest AF:1
MSI Stealth 15M A11SEK
Intel Core i7-1185G7, NVIDIA GeForce RTX 2060 Max-Q
276 (67.5min, 216P1 - 474max) fps
Durchschnittliche NVIDIA GeForce RTX 2060 Max-Q
  ()
276 fps 0%
Lenovo Yoga Slim 7-14ARE
AMD Ryzen 7 4800U, AMD Radeon RX Vega 8 (Ryzen 4000/5000)
79.7 (49.2min, 68.9P1 - 151max) fps -71%
1920x1080 medium AA:medium AF:4
MSI Stealth 15M A11SEK
Intel Core i7-1185G7, NVIDIA GeForce RTX 2060 Max-Q
130 (45.5min, 106P1 - 249max) fps
Durchschnittliche NVIDIA GeForce RTX 2060 Max-Q
  ()
130 fps 0%
Lenovo Yoga Slim 7-14ARE
AMD Ryzen 7 4800U, AMD Radeon RX Vega 8 (Ryzen 4000/5000)
32.5 (25.4min, 28.5P1 - 41.2max) fps -75%
1920x1080 high AA:high AF:8
MSI Stealth 15M A11SEK
Intel Core i7-1185G7, NVIDIA GeForce RTX 2060 Max-Q
106 (59.6min, 80.8P1 - 194max) fps
Durchschnittliche NVIDIA GeForce RTX 2060 Max-Q
  ()
106 fps 0%
Lenovo Yoga Slim 7-14ARE
AMD Ryzen 7 4800U, AMD Radeon RX Vega 8 (Ryzen 4000/5000)
27.4 (17.2min, 21.5P1 - 44.5max) fps -74%
1920x1080 ultra AA:ultra AF:16
MSI Stealth 15M A11SEK
Intel Core i7-1185G7, NVIDIA GeForce RTX 2060 Max-Q
93.1 (26.4min, 73.6P1 - 189max) fps
Durchschnittliche NVIDIA GeForce RTX 2060 Max-Q
  ()
93.1 fps 0%
Lenovo Yoga Slim 7-14ARE
AMD Ryzen 7 4800U, AMD Radeon RX Vega 8 (Ryzen 4000/5000)
23.4 (16.2min, 17.6P1 - 46.7max) fps -75%