Test Dell Latitude 13 7320 Detachable: Das bessere Microsoft Surface Pro 7
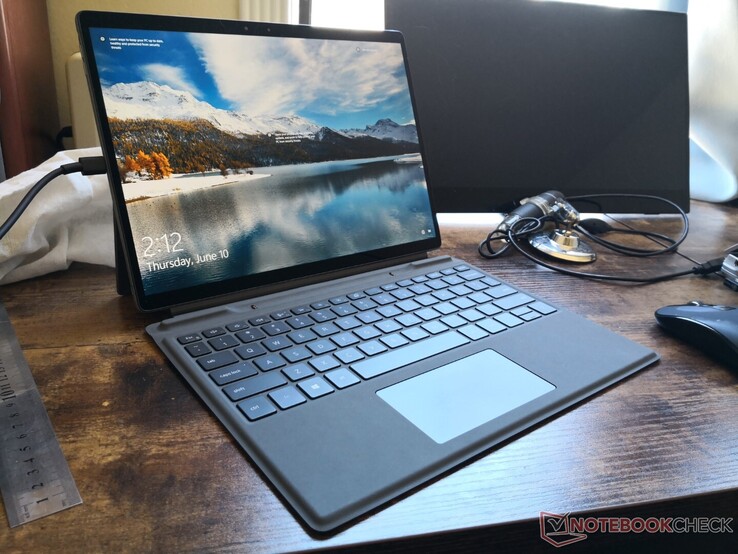
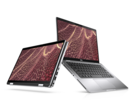
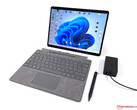
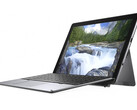
Erstmals auf der CES 2021 präsentiert stellt das Dell Latitude 7320 Detachable eines von insgesamt drei hochwertigen Mitgliedern der 7320-Serie dar. Neben dem Detachable gibt es noch das Latitude 7320 Convertible sowie das Latitude 7320 Clamshell. Zusammen bilden die drei die Nachfolger des noch auf Ice Lake basierenden Latitude 7310 und setzen auf ein nagelneues Gehäuse sowie Intels Tiger-Lake-U-Prozessoren der 11. Generation.
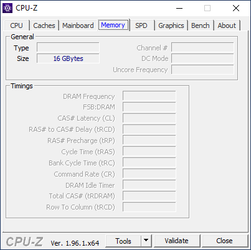
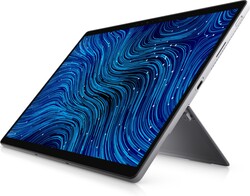
Aktuelle Preise des Detachable beginnen bei etwa 1700 Euro für ein Modell mit Core i5-1140G7, 16 GB RAM und 256 GB NVMe-SSD. Höherwertig ausgestattete Varianten sind ebenso erhältlich wie ein Konfigurator auf Dells Webseite, der eine individuelle Anpassung ermöglicht. Allen Modellen gemeinsam ist der 13-Zoll-Touchscreen im 3:2-Format mit einer Auflösung von 1920 x 1280.
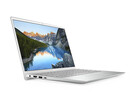
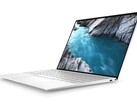
Direkte Konkurrenten sind hochwerte Windows-Tablets und Detachables wie zum Beispiel das Microsoft Surface Pro oder das Lenovo ThinkPad X12.
Weitere Dell-Tests:
Potenzielle Konkurrenten im Vergleich
Bew. | Datum | Modell | Gewicht | Dicke | Größe | Auflösung | Preis ab |
|---|---|---|---|---|---|---|---|
| 87.7 % v7 (old) | 06 / 2021 | Dell Latitude 13 7320 Detachable, i7-1180G7 i7-1180G7, Iris Xe G7 96EUs | 782 g | 8.44 mm | 13.00" | 1920x1280 | |
| 88.5 % v7 (old) | 03 / 2021 | Microsoft Surface Pro 7 Plus i5-1135G7, Iris Xe G7 80EUs | 796 g | 8.5 mm | 12.30" | 2736x1824 | |
| 88.5 % v7 (old) | 04 / 2021 | Lenovo ThinkPad X12 20UVS03G00 i7-1160G7, Iris Xe G7 96EUs | 1.1 kg | 14.5 mm | 12.30" | 1920x1280 | |
| 86.3 % v7 (old) | 10 / 2019 | Dell XPS 13 7390 2-in-1 Core i7 i7-1065G7, Iris Plus Graphics G7 (Ice Lake 64 EU) | 1.3 kg | 13 mm | 13.40" | 1920x1200 | |
| 87.1 % v7 (old) | 11 / 2020 | Lenovo Yoga Duet 7 13IML05-82AS000WGE i5-10210U, UHD Graphics 620 | 1.2 kg | 9.2 mm | 13.00" | 2160x1350 |
Gehäuse – Schmalere Ränder als beim Surface Pro 7
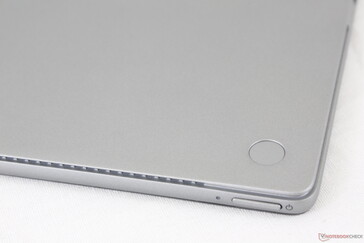
Dells Latitude-Serie ist in der Regel besser gebaut als ein typisches Inspiron oder Vostro und gleichzeitig unscheinbarer als ein XPS, um sich noch besser und nahtloser in professionelle Umgebungen einzufügen. Anders als viele seiner Latitude-Geschwister ist das 7320 nicht nach MIL-STD 810G zertifiziert. Die Rückseite aus Metall und die mit Gorilla Glass beschichtete Front fühlen sich nichtsdestotrotz sehr hochwertig an und verwinden sich nur minimal.
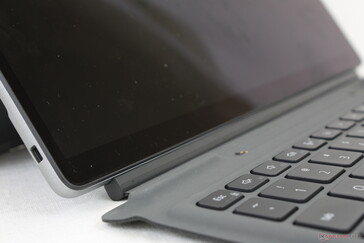
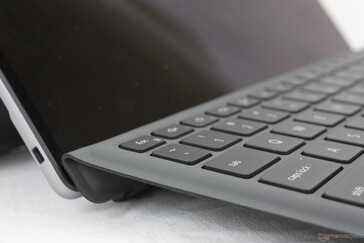
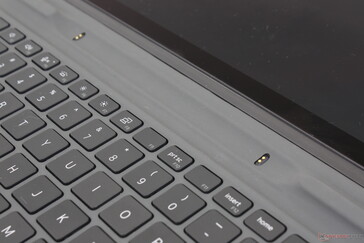
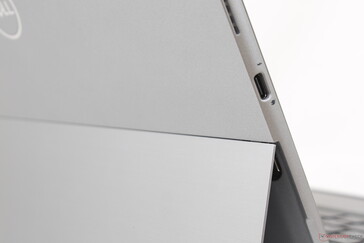
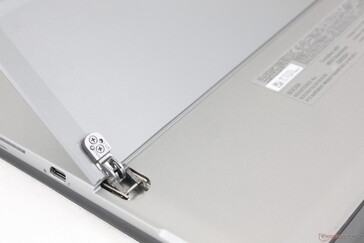
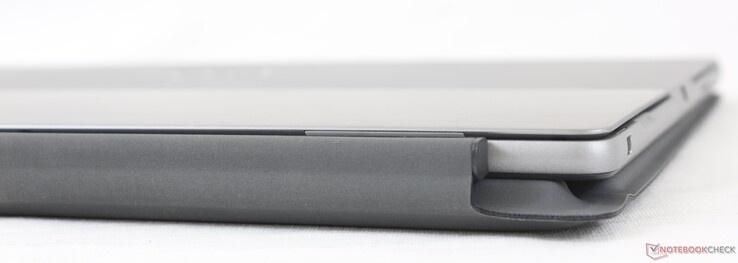
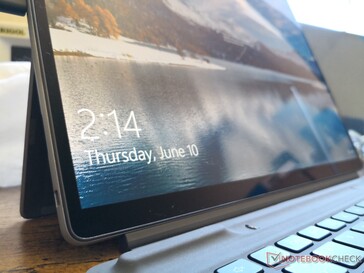
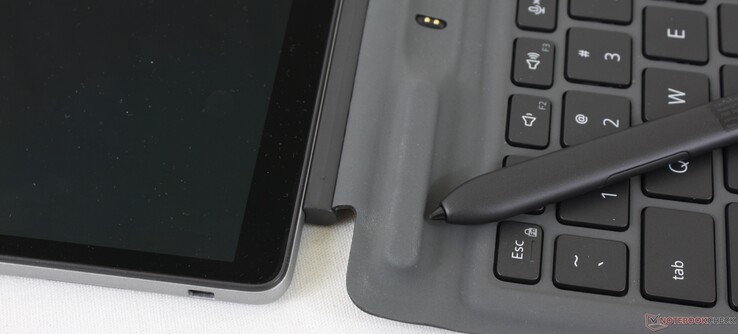
Trotzdem gibt es ein paar Kleinigkeiten, die wir gerne verbessern würden. Zum einen wäre da der dünne Ständer aus Metall, der sich lose anfühlt und beim Anpassen des Winkels nachwippt. Die Tastatur-Base gibt ebenfalls stärker nach als uns lieb wäre, was sich negativ auf das Tippgefühl auswirkt.
In puncto Gewicht und Abmessungen liegt das Latitude 7320 sehr nah am 12.3-zölligen Surface Pro 7. Mit anderen Worten: Dell hat es fertiggebracht, einen größeren 13-Zoll-Touchscreen zu verbauen ohne das Gehäuse vergrößern zu müssen. Dadurch lässt es die dicken Ränder des Microsoft Surface noch älter aussehen. Wir sind uns sicher, dass Microsoft hier in naher Zukunft nachbessern und zukünftige Surface-Pro-Modelle mit dünneren Bildschirmrändern ausstatten wird.
| Latitude 7320 Detachable | Dimensionen (mm) | Gewicht (g) |
| Tablet | 288,4 x 207,9 x 8,44 | 782 |
| Tastatur-Dock | 284,2 x 215,6 x 5,1 | 342 |
| Tablet mit Tastatur-Dock | 288,4 x 215,6 x 13,54 | 1124 |
Konnektivität – Thunderbolt 4 für alle
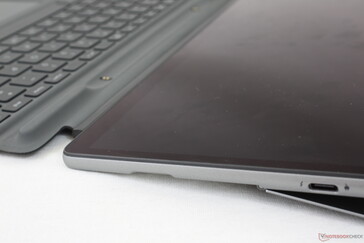
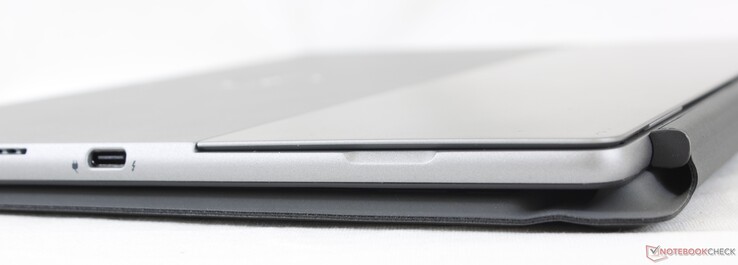
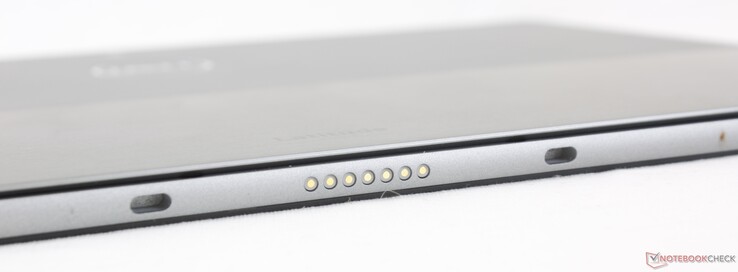
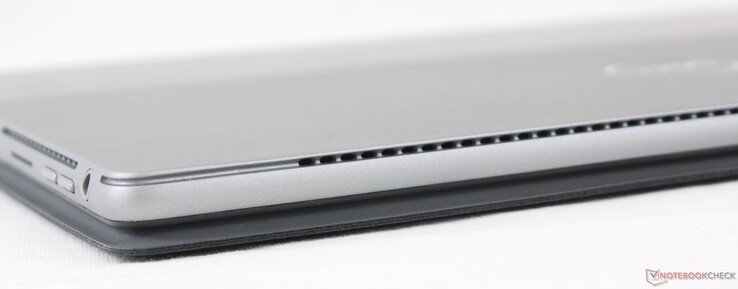
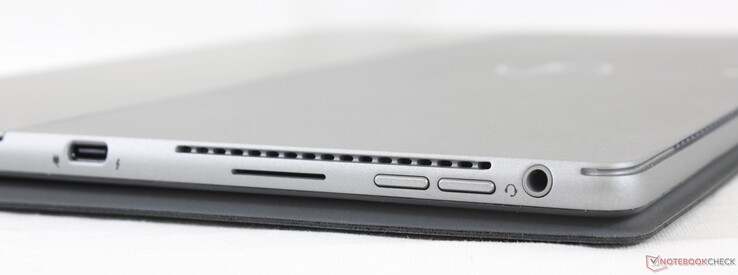
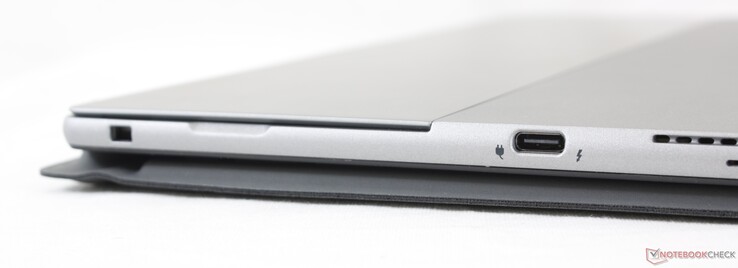
Die Anschlüsse sind auf zwei USB-C-Ports mit Ladefunktion und Thunderbolt 4 sowie eine 3,5-mm-Klinkenbuchse beschränkt. Optional sind auch ein SmartCard-Leser sowie ein uSIM-Schacht möglich. Der Einsatz von Dongles oder eines kompatiblen Thunderbolt-Docks für den stationären Einsatz ist damit also unumgänglich.
Es gibt weder USB-A-Ports noch einen SD-Kartenleser.
Kommunikation
Intels AX201 unterstützt von Haus aus Wi-Fi 6 mitsamt Bluetooth 5.1. Wer viel und häufig unterwegs ist wird sich über das optionale 4G-LTE-Modem Snapdragon X20 mit eSIM-Support freuen.
Webcam
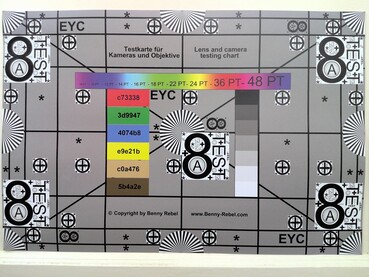
Die zum Benutzer hin ausgerichtete 5-MP-Webcam sowie die rückseitige 8-MP-Kamera bieten eine deutlich höhere Qualität als typische Laptop-Webcams. Videoaufnahmen sind leider auf 1080p bei 30 FPS beschränkt. 60 FPS wird von keiner der beiden Kameras unterstützt.
Sicherheit
Die meisten Latitude-Features wie vPro, Fingerabdruckleser, Infrarot- und Annäherungssensor, um automatisch aufzuwachen und wieder einzuschlafen, sind auch beim Latitude 7320 verfügbar. Ein mechanischer Verschluss für die Webcam fehlt dagegen, obwohl dieser bei den meisten neueren Laptops mittlerweile verbaut wird.
Zubehör und Garantie
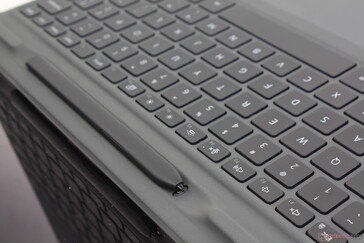
Bei in Deutschland verkauften Latitude-7320-Modellen sind sowohl die abnehmbare Folio-Tastatur (M20NCC) als auch der Active Stylus (PN7320A) enthalten. Wir hätten uns zusätzlich auch noch einen USB-C-auf-USB-A-Adapter oder ein Mikrofasertuch gewünscht.
Wie bei allen anderen Latitude-7000-Serie-Geräten kommt auch das Latitude 7320 standardmäßig mit Dells 3-jähriger Basisgarantie.
Eingabegeräte – Nicht so gut wie bei einem Laptop
Tastatur
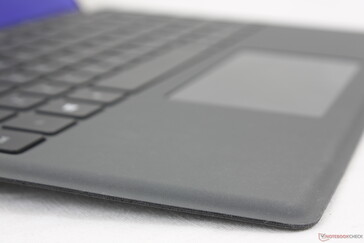
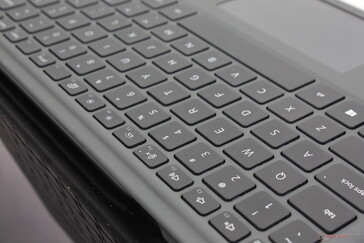
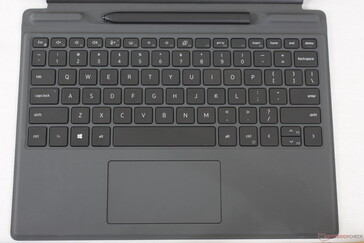
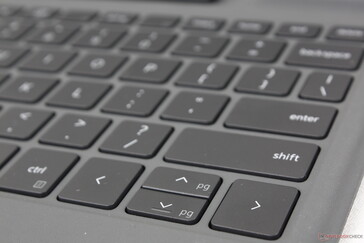
Das Tippgefühl auf Tablets mit abnehmbaren Tastaturen war schon immer unterdurchschnittlich oder bestenfalls durchschnittlich. Das Tastaturdeck ist in der Regel sehr dünn und somit anfälliger für Verwinden und Nachgeben unter Druck als dies bei einem normalen Laptop der Fall ist. Folglich sind Feedback und Tastenhub eher weich und kurz. Die Tastatur des Dell Latitude 7320 Detachable passt hier voll ins Schema und ist somit weder schlechter noch besser als die Folio-Tastatur des Surface Pro. Für kurze Nachrichten und E-Mails mag das noch ausreichen, wer aber viel tippt wird mit dem Latitude 7320 Clamshell oder Convertible besser bedient sein.
Touchpad
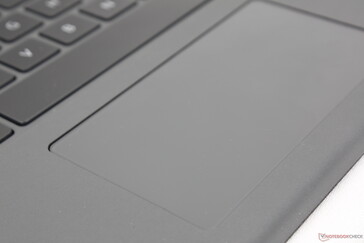
Das Precision-Clickpad ist verglichen mit dem XPS 13 relativ klein (10 x 5,5 cm vs. 11,2 x 6,5 cm). Die Oberfläche ist komplett glatt und bietet somit bei langsamen Bewegungen nur einen minimalen Widerstand. Normale Kontrolle des Cursors und Multi-Touch-Gesten funktionierten trotz eingeschränkter Fläche einwandfrei.
Die integrierten Tasten sind flach und etwas schwammig. Die Geräuschentwicklung ist somit zwar gering, wir hätten uns aber trotzdem ein etwas ausgeprägteres und definierteres Feedback gewünscht.
Display – groß und hell
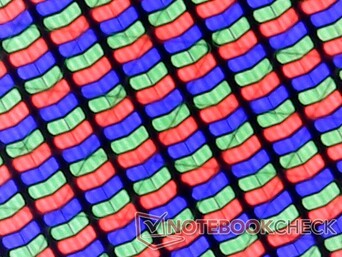
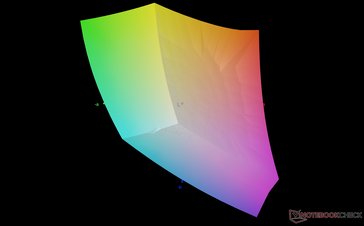
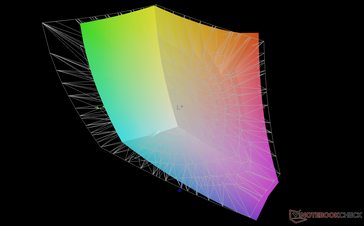
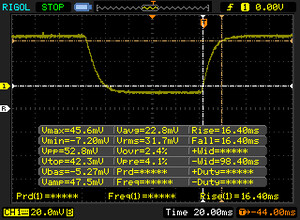
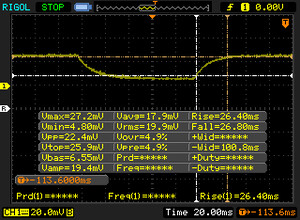
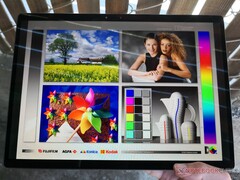
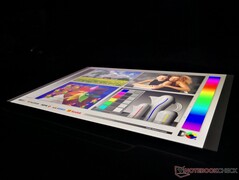
Das 3:2-IPS-Panel vom Typ Sharp LQ130N1 taucht zum ersten Mal in unserer Datenbank auf. Es entspricht in seinen Eigenschaften, wie der sRGB-Abdeckung, 500+ Nits Helligkeit und seinem hohem 1500:1 Kontrastverhältnis recht genau dem 16:10-Panel Sharp LQ134N1, wie es zum Beispiel im XPS 13 7390 2-in-1 verbaut wird. Schwarz-zu-Weiß und Grau-zu-Grau Reaktionszeiten sind langsam, was zu sichtbarem Ghosting führt. Glücklicherweise stellt dies beim Surfen im Netz oder der Wiedergabe von Videos kein allzu großes Problem dar.
ComfortView Plus zur Reduzierung des Blauanteils für eine verringerte Ermüdung der Augen ist analog zu aktuellen XPS-Laptops ebenfalls verfügbar. Das Feature funktioniert gänzlich ohne Einfluss auf die Farbdarstellung.
| |||||||||||||||||||||||||
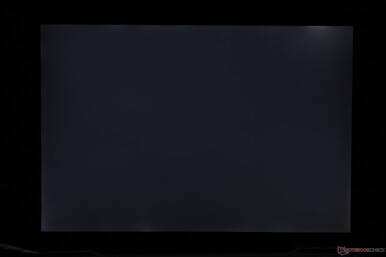
Ausleuchtung: 93 %
Helligkeit Akku: 521.8 cd/m²
Kontrast: 1491:1 (Schwarzwert: 0.35 cd/m²)
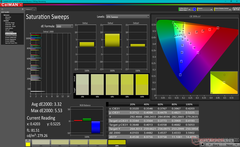
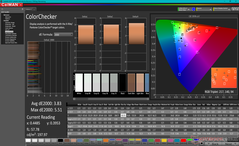
ΔE ColorChecker Calman: 3.83 | ∀{0.5-29.43 Ø4.78}
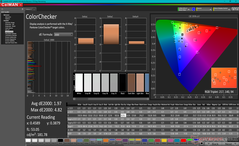
calibrated: 1.97
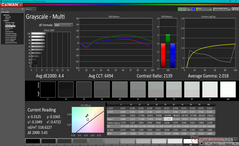
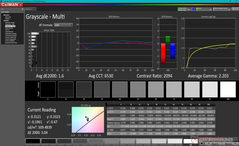
ΔE Greyscale Calman: 4.4 | ∀{0.09-98 Ø5}
78.4% AdobeRGB 1998 (Argyll 3D)
100% sRGB (Argyll 3D)
79.5% Display P3 (Argyll 3D)
Gamma: 2.02
CCT: 6494 K
| Dell Latitude 13 7320 Detachable, i7-1180G7 Sharp LQ130N1, IPS, 13", 1920x1280 | Microsoft Surface Pro 7 Plus LG Philips LP123WQ332684, IPS, 12.3", 2736x1824 | Lenovo ThinkPad X12 20UVS03G00 N123NCA-GS1, a-Si IPS LED, 12.3", 1920x1280 | Dell XPS 13 7390 2-in-1 Core i7 Sharp LQ134N1, IPS, 13.4", 1920x1200 | Lenovo Yoga Duet 7 13IML05-82AS000WGE CSOT T3 LEN8290, IPS, 13", 2160x1350 | |
|---|---|---|---|---|---|
| Display | -10% | -10% | -7% | -8% | |
| Display P3 Coverage (%) | 79.5 | 66.9 -16% | 67 -16% | 69.9 -12% | 68.9 -13% |
| sRGB Coverage (%) | 100 | 96.7 -3% | 99.2 -1% | 99.2 -1% | 98.2 -2% |
| AdobeRGB 1998 Coverage (%) | 78.4 | 69.1 -12% | 68.8 -12% | 71.5 -9% | 71.1 -9% |
| Response Times | 2% | -15% | 11% | 6% | |
| Response Time Grey 50% / Grey 80% * (ms) | 53.2 ? | 50.8 ? 5% | 63.2 ? -19% | 47.6 ? 11% | 58 ? -9% |
| Response Time Black / White * (ms) | 32.8 ? | 33.6 ? -2% | 36 ? -10% | 29.2 ? 11% | 26 ? 21% |
| PWM Frequency (Hz) | 2451 ? | 199.2 ? | 2500 ? | ||
| Bildschirm | 16% | 32% | 15% | -10% | |
| Helligkeit Bildmitte (cd/m²) | 521.8 | 408 -22% | 419 -20% | 549.8 5% | 450 -14% |
| Brightness (cd/m²) | 504 | 425 -16% | 406 -19% | 520 3% | 411 -18% |
| Brightness Distribution (%) | 93 | 85 -9% | 94 1% | 86 -8% | 83 -11% |
| Schwarzwert * (cd/m²) | 0.35 | 0.34 3% | 0.23 34% | 0.39 -11% | 0.22 37% |
| Kontrast (:1) | 1491 | 1200 -20% | 1822 22% | 1410 -5% | 2045 37% |
| Delta E Colorchecker * | 3.83 | 1.5 61% | 1.1 71% | 2.12 45% | 4.15 -8% |
| Colorchecker dE 2000 max. * | 5.51 | 2.5 55% | 2.2 60% | 3.66 34% | 11.49 -109% |
| Colorchecker dE 2000 calibrated * | 1.97 | 1.4 29% | 0.5 75% | 1.37 30% | 1.09 45% |
| Delta E Graustufen * | 4.4 | 1.6 64% | 1.5 66% | 2.6 41% | 6.66 -51% |
| Gamma | 2.02 109% | 2.05 107% | 2.06 107% | 2.3 96% | 2.42 91% |
| CCT | 6494 100% | 6432 101% | 6524 100% | 6884 94% | 6043 108% |
| Farbraum (Prozent von AdobeRGB 1998) (%) | 63.7 | 62.8 | 65.4 | 65 | |
| Color Space (Percent of sRGB) (%) | 96.8 | 99.2 | 99.7 | 98 | |
| Durchschnitt gesamt (Programm / Settings) | 3% /
8% | 2% /
17% | 6% /
10% | -4% /
-7% |
* ... kleinere Werte sind besser
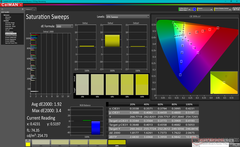
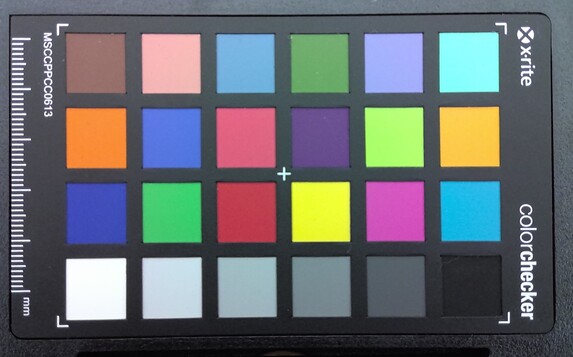
Die Farben sind ab Werk bereits recht ordentlich, könnten aber angesichts der vollständigen sRGB-Abdeckung des Panels noch etwas genauer sein. Nach einer manuellen Kalibrierung konnten wir sowohl bei Graustufen (Delta-E von 4,4 auf 1,6) als auch Farben (Delta-E von 3,83 auf 1,97) und Gamma (2,2) Verbesserungen erzielen.
Reaktionszeiten (Response Times) des Displays
| ↔ Reaktionszeiten Schwarz zu Weiß | ||
|---|---|---|
| 32.8 ms ... steigend ↗ und fallend ↘ kombiniert | ↗ 16.4 ms steigend | |
| ↘ 16.4 ms fallend | ||
| Die gemessenen Reaktionszeiten sind langsam und dadurch für viele Spieler wahrscheinlich zu langsam. Im Vergleich rangierten die bei uns getesteten Geräte von 0.1 (Minimum) zu 240 (Maximum) ms. » 88 % aller Screens waren schneller als der getestete. Daher sind die gemessenen Reaktionszeiten schlechter als der Durchschnitt aller vermessenen Geräte (20.2 ms). | ||
| ↔ Reaktionszeiten 50% Grau zu 80% Grau | ||
| 53.2 ms ... steigend ↗ und fallend ↘ kombiniert | ↗ 26.4 ms steigend | |
| ↘ 26.8 ms fallend | ||
| Die gemessenen Reaktionszeiten sind langsam und dadurch für viele Spieler wahrscheinlich zu langsam. Im Vergleich rangierten die bei uns getesteten Geräte von 0.165 (Minimum) zu 636 (Maximum) ms. » 90 % aller Screens waren schneller als der getestete. Daher sind die gemessenen Reaktionszeiten schlechter als der Durchschnitt aller vermessenen Geräte (31.6 ms). | ||
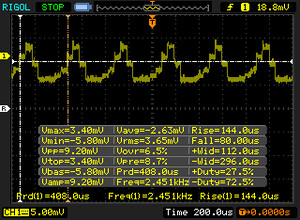
Bildschirm-Flackern / PWM (Pulse-Width Modulation)
| Flackern / PWM festgestellt | 2451 Hz | ≤ 42 % Helligkeit | |
Das Display flackert mit 2451 Hz (im schlimmsten Fall, eventuell durch Pulsweitenmodulation PWM) bei einer eingestellten Helligkeit von 42 % und darunter. Darüber sollte es zu keinem Flackern kommen. Die Frequenz von 2451 Hz ist sehr hoch und sollte daher auch bei empfindlichen Personen zu keinen Problemen führen. Im Vergleich: 53 % aller getesteten Geräte nutzten kein PWM um die Helligkeit zu reduzieren. Wenn PWM eingesetzt wurde, dann bei einer Frequenz von durchschnittlich 8121 (Minimum 5, Maximum 343500) Hz. | |||
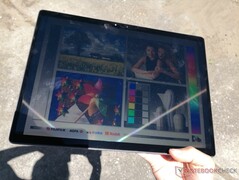
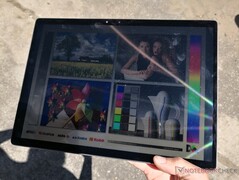
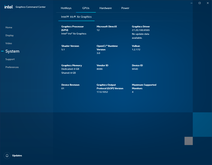
Im Außeneinsatz schlägt sich das Gerät ordentlich, solange man sich im Schatten aufhält. Wie von einem hochreflexiven Touchscreen zu erwarten ist sind Reflexionen nie gänzlich zu vermeiden. Auch sollte man im Hinterkopf behalten, dass die maximale Helligkeit im Auslieferungszustand zunächst von 521,8 auf 438,9 Nits abgesenkt wird, da Intels Display-Power-Saving-Feature standardmäßig aktiviert ist. Es lässt sich im Graphics Command Center jedoch bequem deaktivieren. Um das Maximum aus dem Display herauszuholen braucht man auf alle Fälle die maximale Helligkeit.
Performance – Tiger-Lake-U-Prozessor der 11. Generation
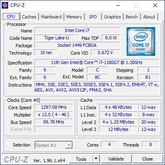
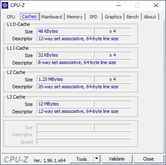
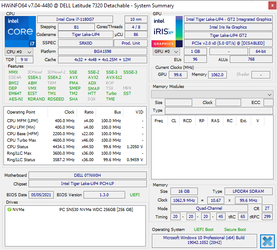
In Deutschland kann das Latitude 7320 derzeit mit Core i5-1140G7 oder Core i7-1180G7 konfiguriert werden. CPUs der Tiger-Lake-Generation, deren Modellnummer auf Null enden (also Core ix-xxx0) sind deutlich niedriger getaktet als solche, deren Modellnummer auf 5 enden. Der Core i7-1180G7 unseres Testgeräts läuft beispielsweise nur mit 2,2 GHz verglichen mit den 3 GHz des Core i7-1165G7. Wir vermuten, dass die geringe Größe des Latitude 7320 Detachable Dell davon abgehalten hat schnellere Core i7-1165G7 oder i7-1185G7-CPUs einzusetzen.
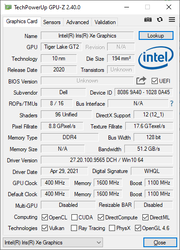
Alle Modelle kommen standardmäßig mit Intel-Iris-Xe-GPU. In einigen Ländern wird das Latitude 7320 Detachable auch mit Core-i3-CPU angeboten, dem diese GPU fehlt. Wir raten daher hierauf zu verzichten, zumal diese Modelle zu allem Überfluss mit nur 4 GB nicht aufrüstbarem RAM ausgestattet sind.
Unser Testgerät wurde vor dem Ausführen der Benchmarks via Dell Power Manager in den sogenannten Ultra-Performance-Mode gesetzt, um das bestmögliche Ergebnis zu erzielen. Wir raten allen sich mit den Einstellmöglichkeiten der vorinstallierten Dell-Anwendungen vertraut zu machen. So ermöglicht zum Beispiel der Dell Optimizer die Deaktivierung des Annäherungssensors, um das automatische Schlafen legen zu verhindern.
Prozessor – Core i7-1180G7 ist ganz anders als der Core i7-1185G7
In Bezug auf rohe Multi-Thread-Rechenleistung liegt unser Testgerät um fast 40 % hinter dem durchschnittlichen Core i7-1185G7, was auf bereits erwähnte reduzierte Taktraten zurückzuführen ist. Die Performance liegt somit eher zwischen Core i5-1035G1 und Core i5-1135G7 wie sie im Surface Go oder Surface Pro 7 Plus zu finden sind. Die Single-Thread-Performance ist dagegen einwandfrei und gleichauf mit anderen Tiger-Lake-U-CPUs.
Das Latutide 7320 Detachable profitiert wie die meisten anderen Tablets auch kaum vom Turbo Boost der CPU. Im CineBench R15 xT ist die Ergebniskurve ziemlich flach und ohne nennenswerten Einfluss des Turbo Boosts zu Beginn des Benchmarks.
Cinebench R23: Multi Core | Single Core
Cinebench R15: CPU Multi 64Bit | CPU Single 64Bit
Blender: v2.79 BMW27 CPU
7-Zip 18.03: 7z b 4 -mmt1 | 7z b 4
Geekbench 5.5: Single-Core | Multi-Core
HWBOT x265 Benchmark v2.2: 4k Preset
LibreOffice : 20 Documents To PDF
R Benchmark 2.5: Overall mean
| Cinebench R20 / CPU (Multi Core) | |
| Lenovo IdeaPad Flex 5 14ALC05 82HU002YUS | |
| Lenovo IdeaPad Flex 5 14ALC05-82HU006NGE | |
| Asus VivoBook Flip 14 TM420IA | |
| HP Envy x360 13-ay0010nr | |
| Lenovo ThinkPad X12 20UVS03G00 | |
| Durchschnittliche Intel Core i7-1185G7 (1425 - 2493, n=28) | |
| Dell XPS 13 7390 2-in-1 Core i7 | |
| Microsoft Surface Pro 7 Plus | |
| Dell Latitude 13 7320 Detachable, i7-1180G7 | |
| Durchschnittliche Intel Core i7-1180G7 (n=1) | |
| Microsoft Surface Laptop Go Core i5 | |
| HP Envy 13-aq0003ng | |
| Dell XPS 13 7390 2-in-1 Core i3 | |
| Lenovo Yoga Duet 7 13IML05-82AS000WGE | |
| Cinebench R20 / CPU (Single Core) | |
| Durchschnittliche Intel Core i7-1185G7 (489 - 593, n=28) | |
| Microsoft Surface Pro 7 Plus | |
| Lenovo ThinkPad X12 20UVS03G00 | |
| Lenovo IdeaPad Flex 5 14ALC05 82HU002YUS | |
| Dell Latitude 13 7320 Detachable, i7-1180G7 | |
| Durchschnittliche Intel Core i7-1180G7 (n=1) | |
| Dell XPS 13 7390 2-in-1 Core i7 | |
| Asus VivoBook Flip 14 TM420IA | |
| Lenovo IdeaPad Flex 5 14ALC05-82HU006NGE | |
| HP Envy x360 13-ay0010nr | |
| Microsoft Surface Laptop Go Core i5 | |
| Dell XPS 13 7390 2-in-1 Core i3 | |
| HP Envy 13-aq0003ng | |
| Lenovo Yoga Duet 7 13IML05-82AS000WGE | |
| Cinebench R23 / Multi Core | |
| Lenovo IdeaPad Flex 5 14ALC05 82HU002YUS | |
| Lenovo IdeaPad Flex 5 14ALC05-82HU006NGE | |
| Durchschnittliche Intel Core i7-1185G7 (3610 - 6383, n=24) | |
| Microsoft Surface Pro 7 Plus | |
| Dell Latitude 13 7320 Detachable, i7-1180G7 | |
| Durchschnittliche Intel Core i7-1180G7 (n=1) | |
| Lenovo ThinkPad X12 20UVS03G00 | |
| Cinebench R23 / Single Core | |
| Durchschnittliche Intel Core i7-1185G7 (1251 - 1532, n=24) | |
| Microsoft Surface Pro 7 Plus | |
| Dell Latitude 13 7320 Detachable, i7-1180G7 | |
| Durchschnittliche Intel Core i7-1180G7 (n=1) | |
| Lenovo IdeaPad Flex 5 14ALC05 82HU002YUS | |
| Lenovo IdeaPad Flex 5 14ALC05-82HU006NGE | |
| Lenovo ThinkPad X12 20UVS03G00 | |
| Cinebench R15 / CPU Multi 64Bit | |
| Lenovo IdeaPad Flex 5 14ALC05 82HU002YUS | |
| Lenovo IdeaPad Flex 5 14ALC05-82HU006NGE | |
| Asus VivoBook Flip 14 TM420IA | |
| Lenovo ThinkPad X12 20UVS03G00 | |
| Durchschnittliche Intel Core i7-1185G7 (617 - 1066, n=32) | |
| HP Envy x360 13-ay0010nr | |
| Dell XPS 13 7390 2-in-1 Core i7 | |
| Microsoft Surface Pro 7 Plus | |
| Lenovo Yoga Duet 7 13IML05-82AS000WGE | |
| Dell Latitude 13 7320 Detachable, i7-1180G7 | |
| Durchschnittliche Intel Core i7-1180G7 (n=1) | |
| Microsoft Surface Laptop Go Core i5 | |
| HP Envy 13-aq0003ng | |
| Dell XPS 13 7390 2-in-1 Core i3 | |
| Cinebench R15 / CPU Single 64Bit | |
| Durchschnittliche Intel Core i7-1185G7 (168 - 230, n=27) | |
| Lenovo IdeaPad Flex 5 14ALC05 82HU002YUS | |
| Microsoft Surface Pro 7 Plus | |
| Dell Latitude 13 7320 Detachable, i7-1180G7 | |
| Durchschnittliche Intel Core i7-1180G7 (n=1) | |
| Asus VivoBook Flip 14 TM420IA | |
| Lenovo IdeaPad Flex 5 14ALC05-82HU006NGE | |
| Dell XPS 13 7390 2-in-1 Core i7 | |
| HP Envy x360 13-ay0010nr | |
| HP Envy 13-aq0003ng | |
| Lenovo ThinkPad X12 20UVS03G00 | |
| Lenovo Yoga Duet 7 13IML05-82AS000WGE | |
| Microsoft Surface Laptop Go Core i5 | |
| Dell XPS 13 7390 2-in-1 Core i3 | |
| Blender / v2.79 BMW27 CPU | |
| Lenovo Yoga Duet 7 13IML05-82AS000WGE | |
| Dell XPS 13 7390 2-in-1 Core i3 | |
| Lenovo ThinkPad X12 20UVS03G00 | |
| Microsoft Surface Laptop Go Core i5 | |
| Dell Latitude 13 7320 Detachable, i7-1180G7 | |
| Durchschnittliche Intel Core i7-1180G7 (n=1) | |
| Microsoft Surface Pro 7 Plus | |
| Dell XPS 13 7390 2-in-1 Core i7 | |
| HP Envy x360 13-ay0010nr | |
| Durchschnittliche Intel Core i7-1185G7 (478 - 745, n=28) | |
| Asus VivoBook Flip 14 TM420IA | |
| Lenovo IdeaPad Flex 5 14ALC05-82HU006NGE | |
| Lenovo IdeaPad Flex 5 14ALC05 82HU002YUS | |
| 7-Zip 18.03 / 7z b 4 -mmt1 | |
| Durchschnittliche Intel Core i7-1185G7 (3678 - 5507, n=27) | |
| Dell Latitude 13 7320 Detachable, i7-1180G7 | |
| Durchschnittliche Intel Core i7-1180G7 (n=1) | |
| Lenovo IdeaPad Flex 5 14ALC05 82HU002YUS | |
| Dell XPS 13 7390 2-in-1 Core i7 | |
| Asus VivoBook Flip 14 TM420IA | |
| Microsoft Surface Pro 7 Plus | |
| Lenovo IdeaPad Flex 5 14ALC05-82HU006NGE | |
| HP Envy x360 13-ay0010nr | |
| Microsoft Surface Laptop Go Core i5 | |
| Dell XPS 13 7390 2-in-1 Core i3 | |
| Lenovo Yoga Duet 7 13IML05-82AS000WGE | |
| 7-Zip 18.03 / 7z b 4 | |
| Lenovo IdeaPad Flex 5 14ALC05 82HU002YUS | |
| Lenovo IdeaPad Flex 5 14ALC05-82HU006NGE | |
| Asus VivoBook Flip 14 TM420IA | |
| Durchschnittliche Intel Core i7-1185G7 (18812 - 27693, n=27) | |
| HP Envy x360 13-ay0010nr | |
| Microsoft Surface Pro 7 Plus | |
| Dell XPS 13 7390 2-in-1 Core i7 | |
| Dell Latitude 13 7320 Detachable, i7-1180G7 | |
| Durchschnittliche Intel Core i7-1180G7 (n=1) | |
| Lenovo ThinkPad X12 20UVS03G00 | |
| Microsoft Surface Laptop Go Core i5 | |
| Lenovo Yoga Duet 7 13IML05-82AS000WGE | |
| Dell XPS 13 7390 2-in-1 Core i3 | |
| Geekbench 5.5 / Single-Core | |
| Dell Latitude 13 7320 Detachable, i7-1180G7 | |
| Durchschnittliche Intel Core i7-1180G7 (n=1) | |
| Durchschnittliche Intel Core i7-1185G7 (1398 - 1626, n=21) | |
| Lenovo ThinkPad X12 20UVS03G00 | |
| Microsoft Surface Pro 7 Plus | |
| Lenovo IdeaPad Flex 5 14ALC05 82HU002YUS | |
| Asus VivoBook Flip 14 TM420IA | |
| Microsoft Surface Laptop Go Core i5 | |
| Lenovo IdeaPad Flex 5 14ALC05-82HU006NGE | |
| HP Envy x360 13-ay0010nr | |
| Lenovo Yoga Duet 7 13IML05-82AS000WGE | |
| Geekbench 5.5 / Multi-Core | |
| Lenovo IdeaPad Flex 5 14ALC05 82HU002YUS | |
| Lenovo IdeaPad Flex 5 14ALC05-82HU006NGE | |
| Durchschnittliche Intel Core i7-1185G7 (4620 - 5944, n=21) | |
| Asus VivoBook Flip 14 TM420IA | |
| Dell Latitude 13 7320 Detachable, i7-1180G7 | |
| Durchschnittliche Intel Core i7-1180G7 (n=1) | |
| Microsoft Surface Pro 7 Plus | |
| Lenovo ThinkPad X12 20UVS03G00 | |
| HP Envy x360 13-ay0010nr | |
| Microsoft Surface Laptop Go Core i5 | |
| Lenovo Yoga Duet 7 13IML05-82AS000WGE | |
| HWBOT x265 Benchmark v2.2 / 4k Preset | |
| Lenovo IdeaPad Flex 5 14ALC05 82HU002YUS | |
| Lenovo IdeaPad Flex 5 14ALC05-82HU006NGE | |
| Asus VivoBook Flip 14 TM420IA | |
| HP Envy x360 13-ay0010nr | |
| Durchschnittliche Intel Core i7-1185G7 (5.02 - 8.13, n=27) | |
| Dell XPS 13 7390 2-in-1 Core i7 | |
| Microsoft Surface Pro 7 Plus | |
| Dell Latitude 13 7320 Detachable, i7-1180G7 | |
| Durchschnittliche Intel Core i7-1180G7 (n=1) | |
| Microsoft Surface Laptop Go Core i5 | |
| Lenovo ThinkPad X12 20UVS03G00 | |
| Dell XPS 13 7390 2-in-1 Core i3 | |
| Lenovo Yoga Duet 7 13IML05-82AS000WGE | |
| LibreOffice / 20 Documents To PDF | |
| Lenovo Yoga Duet 7 13IML05-82AS000WGE | |
| Lenovo IdeaPad Flex 5 14ALC05-82HU006NGE | |
| Microsoft Surface Laptop Go Core i5 | |
| HP Envy x360 13-ay0010nr | |
| Lenovo ThinkPad X12 20UVS03G00 | |
| Lenovo IdeaPad Flex 5 14ALC05 82HU002YUS | |
| Microsoft Surface Pro 7 Plus | |
| Asus VivoBook Flip 14 TM420IA | |
| Durchschnittliche Intel Core i7-1185G7 (41.3 - 61.7, n=26) | |
| Dell Latitude 13 7320 Detachable, i7-1180G7 | |
| Durchschnittliche Intel Core i7-1180G7 (n=1) | |
| R Benchmark 2.5 / Overall mean | |
| Lenovo Yoga Duet 7 13IML05-82AS000WGE | |
| Lenovo ThinkPad X12 20UVS03G00 | |
| Microsoft Surface Laptop Go Core i5 | |
| Microsoft Surface Pro 7 Plus | |
| Dell Latitude 13 7320 Detachable, i7-1180G7 | |
| Durchschnittliche Intel Core i7-1180G7 (n=1) | |
| Lenovo IdeaPad Flex 5 14ALC05-82HU006NGE | |
| HP Envy x360 13-ay0010nr | |
| Asus VivoBook Flip 14 TM420IA | |
| Lenovo IdeaPad Flex 5 14ALC05 82HU002YUS | |
| Durchschnittliche Intel Core i7-1185G7 (0.55 - 0.615, n=27) | |
Cinebench R23: Multi Core | Single Core
Cinebench R15: CPU Multi 64Bit | CPU Single 64Bit
Blender: v2.79 BMW27 CPU
7-Zip 18.03: 7z b 4 -mmt1 | 7z b 4
Geekbench 5.5: Single-Core | Multi-Core
HWBOT x265 Benchmark v2.2: 4k Preset
LibreOffice : 20 Documents To PDF
R Benchmark 2.5: Overall mean
* ... kleinere Werte sind besser
System Performance
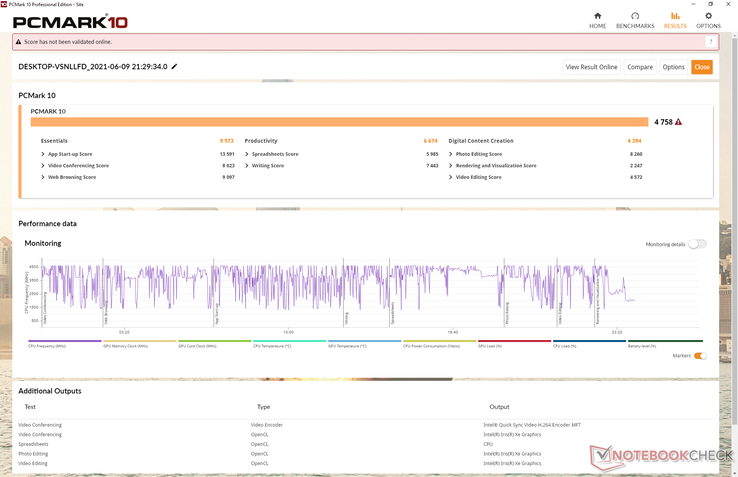
| PCMark 10 Score | 4758 Punkte | |
Hilfe | ||
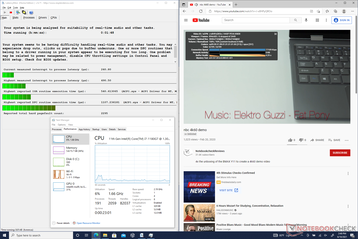
DPC-Latenzen
| DPC Latencies / LatencyMon - interrupt to process latency (max), Web, Youtube, Prime95 | |
| Lenovo Yoga Duet 7 13IML05-82AS000WGE | |
| Dell Latitude 13 7320 Detachable, i7-1180G7 | |
| Lenovo ThinkPad X12 20UVS03G00 | |
| Microsoft Surface Pro 7 Plus | |
* ... kleinere Werte sind besser
Massenspeicher
Zur Verfügung stehen selbst-verschlüsselnde (SED) NVMe-PCIe-SSDs zwischen 128 GB und 1 TB. Dell setzt hierbei auf das kürzere M.2-2230-Format anstelle des weiter verbreiteten M.2-2280-Formfaktors, um Gewicht und Platz zu sparen. Eine Aufrüstung ist damit zwar also möglich, jedoch nicht so komfortabel durchführbar wie bei traditionellen Laptops. Unser Testgerät war mit einer 256 GB großen Western Digital SN530-SSD ausgestattet und erreichte damit sequenzielle Lese- und Schreibraten von jeweils 2.500 und 1.000 MB/s.
| Dell Latitude 13 7320 Detachable, i7-1180G7 WDC PC SN530 SDBPMPZ-265G | Microsoft Surface Pro 7 Plus Samsung PM991 MZ9LQ256HBJQ | Lenovo ThinkPad X12 20UVS03G00 Toshiba BG4 KBG40ZNT512G | Dell XPS 13 7390 2-in-1 Core i7 Toshiba BG4 KBG40ZPZ512G | Lenovo Yoga Duet 7 13IML05-82AS000WGE Lenovo UMIS RPJTJ256MEE1OWX | |
|---|---|---|---|---|---|
| AS SSD | 104% | 20% | 76% | 66% | |
| Seq Read (MB/s) | 1918 | 1725 -10% | 1760 -8% | 1801 -6% | 1629 -15% |
| Seq Write (MB/s) | 357.6 | 931 160% | 761 113% | 1125 215% | 694 94% |
| 4K Read (MB/s) | 38.97 | 50.1 29% | 47.68 22% | 39.7 2% | 47.87 23% |
| 4K Write (MB/s) | 195.5 | 136.9 -30% | 176 -10% | 67 -66% | 107 -45% |
| 4K-64 Read (MB/s) | 390.9 | 870 123% | 581 49% | 1253 221% | 411 5% |
| 4K-64 Write (MB/s) | 103.9 | 762 633% | 118.5 14% | 209 101% | 377 263% |
| Access Time Read * (ms) | 0.122 | 0.279 -129% | 0.155 -27% | 0.069 43% | 0.068 44% |
| Access Time Write * (ms) | 0.189 | 0.028 85% | 0.188 1% | 0.625 -231% | 0.035 81% |
| Score Read (Points) | 622 | 1093 76% | 805 29% | 1472 137% | 614 -1% |
| Score Write (Points) | 335 | 992 196% | 371 11% | 388 16% | 550 64% |
| Score Total (Points) | 1209 | 2616 116% | 1551 28% | 2583 114% | 1441 19% |
| Copy ISO MB/s (MB/s) | 858 | 1174 37% | 1293 51% | 1074 25% | |
| Copy Program MB/s (MB/s) | 239.9 | 262.8 10% | 560 133% | 532 122% | |
| Copy Game MB/s (MB/s) | 214.3 | 562 162% | 927 333% | 730 241% | |
| CrystalDiskMark 5.2 / 6 | 0% | -28% | 10% | 7% | |
| Write 4K (MB/s) | 177.5 | 165.3 -7% | 72.8 -59% | 106.7 -40% | 118 -34% |
| Read 4K (MB/s) | 47.45 | 42.95 -9% | 26.35 -44% | 49.94 5% | 53 12% |
| Write Seq (MB/s) | 971 | 955 -2% | 823 -15% | 1223 26% | 1208 24% |
| Read Seq (MB/s) | 1544 | 867 -44% | 1169 -24% | 1801 17% | 1625 5% |
| Write 4K Q32T1 (MB/s) | 295.3 | 423.5 43% | 112.6 -62% | 325.3 10% | 431 46% |
| Read 4K Q32T1 (MB/s) | 394.1 | 479.2 22% | 327.2 -17% | 551 40% | 356 -10% |
| Write Seq Q32T1 (MB/s) | 977 | 1060 8% | 1039 6% | 1224 25% | 1278 31% |
| Read Seq Q32T1 (MB/s) | 2482 | 2251 -9% | 2176 -12% | 2350 -5% | 1949 -21% |
| Durchschnitt gesamt (Programm / Settings) | 52% /
66% | -4% /
-0% | 43% /
52% | 37% /
44% |
* ... kleinere Werte sind besser
Disk Throttling: DiskSpd Read Loop, Queue Depth 8
GPU-Performance – Iris Xe macht den Unterschied
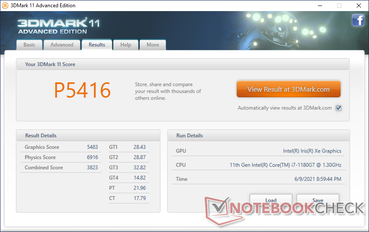
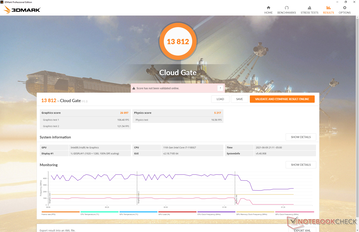
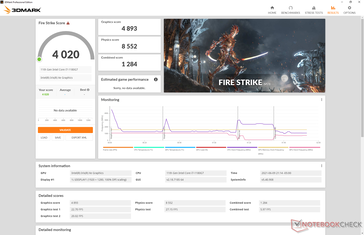
Die Grafikleistung ist dank Iris Xe exzellent und das Latitude 7320 Detachable hinkt der durchschnittlichen Iris Xe 96 EUs unserer Datenbank nur minimal hinterher. Angesichts der langsameren Core-i7-1180G7-CPU ist dies jedoch kaum verwunderlich. Wer von älteren Intel-CPUs kommt wird gegenüber der UHD Graphics oder selbst der Iris Plus des letzten Jahres einen deutlichen Performancesprung erleben. Eine GeForce MX wäre zum Spielen natürlich noch schneller und vor allem konsistenter, widerspricht jedoch dem Fokus des Latitude.
Wer vorhat schnelle Spiele wie Rocket League oder Fortnite zu spielen, dem raten wir zu einem externen Monitor. Das interne Display leidet aufgrund der hohen Reaktionszeiten unter sichtbarem Ghosting, was das Spielerlebnis negativ beeinflusst.
| 3DMark 11 Performance | 5416 Punkte | |
| 3DMark Cloud Gate Standard Score | 13812 Punkte | |
| 3DMark Fire Strike Score | 4020 Punkte | |
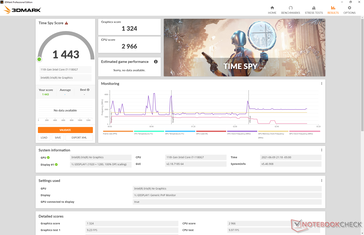
| 3DMark Time Spy Score | 1443 Punkte | |
Hilfe | ||
| min. | mittel | hoch | max. | |
|---|---|---|---|---|
| GTA V (2015) | 64.1 | 58.2 | 21 | 9.75 |
| The Witcher 3 (2015) | 80.3 | 53.3 | 30.1 | 13.8 |
| Dota 2 Reborn (2015) | 76.9 | 50.9 | 36.8 | 35.1 |
| Final Fantasy XV Benchmark (2018) | 32.3 | 18.2 | 13.5 | |
| X-Plane 11.11 (2018) | 20.6 | 27.7 | 25.5 |
Emissionen
Geräuschemissionen
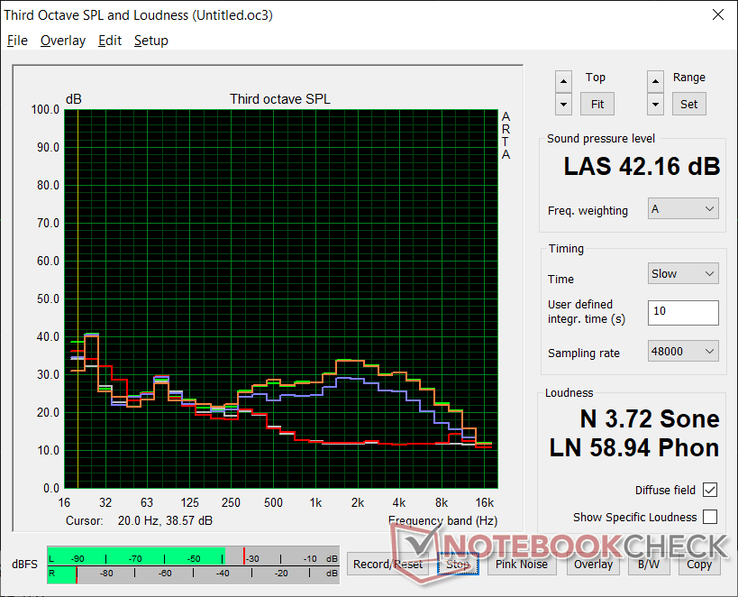
Die Geräuschemissionen sind gegenüber den meisten anderen Windows-Tablets höher, besonders wenn man die Grafikfähigkeiten des Latitude 7320 Detachable ausnutzt. Nur 90 Sekunden 3DMark 06 reichten bereits aus, um den Lüfter auf fast 38 dB(A) zu befördern. Bei Spielen wie Witcher 3 steigt der Pegel gar auf noch lautere 42 dB(A). Diese Geräuschentwicklung ist eher typisch für ein Ultrabook denn ein Tablet, jedoch angesichts der kräftige Core-i7-Tiger-Lake-U-GPU keine Überraschung.
Der Geräuschpegel (und somit auch die Performance) können mittels Dell Power Manager justiert werden. Die meisten Anwender dürften für einfache Anwendungen, wie dem Surfen im Netz oder Streamen von Videos, mit Optimized oder Quiet Mode am besten beraten sein.
Im Gegensatz dazu bleibt das Surface Pro 7 mit Core i3 oder Core i5 komplett lautlos, nur das Core-i7-Modell hat einen Lüfter verbaut. Beim Dell Latitude 7320 Detachable steckt dagegen in jedem Modell ein Lüfter.
| Dell Latitude 13 7320 Detachable, i7-1180G7 Iris Xe G7 96EUs, i7-1180G7, WDC PC SN530 SDBPMPZ-265G | Microsoft Surface Pro 7 Plus Iris Xe G7 80EUs, i5-1135G7, Samsung PM991 MZ9LQ256HBJQ | Lenovo ThinkPad X12 20UVS03G00 Iris Xe G7 96EUs, i7-1160G7, Toshiba BG4 KBG40ZNT512G | Dell XPS 13 7390 2-in-1 Core i7 Iris Plus Graphics G7 (Ice Lake 64 EU), i7-1065G7, Toshiba BG4 KBG40ZPZ512G | Lenovo Yoga Duet 7 13IML05-82AS000WGE UHD Graphics 620, i5-10210U, Lenovo UMIS RPJTJ256MEE1OWX | |
|---|---|---|---|---|---|
| Geräuschentwicklung | 6% | -5% | 9% | ||
| aus / Umgebung * (dB) | 25.3 | 25.1 1% | 28.1 -11% | 25.4 -0% | |
| Idle min * (dB) | 25.4 | 25.1 1% | 28.1 -11% | 25.4 -0% | |
| Idle avg * (dB) | 25.4 | 25.1 1% | 28.1 -11% | 25.4 -0% | |
| Idle max * (dB) | 25.4 | 26 -2% | 28.1 -11% | 25.4 -0% | |
| Last avg * (dB) | 37.7 | 34.6 8% | 31.7 16% | 30 20% | |
| Witcher 3 ultra * (dB) | 42 | 34.6 18% | 43.4 -3% | ||
| Last max * (dB) | 42.1 | 37 12% | 43.4 -3% | 27.5 35% |
* ... kleinere Werte sind besser
Lautstärkediagramm
| Idle |
| 25.4 / 25.4 / 25.4 dB(A) |
| Last |
| 37.7 / 42.1 dB(A) |
 | ||
30 dB leise 40 dB(A) deutlich hörbar 50 dB(A) störend |
||
min: | ||
Temperaturen
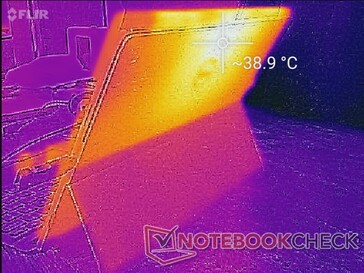
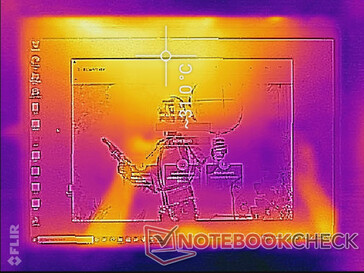
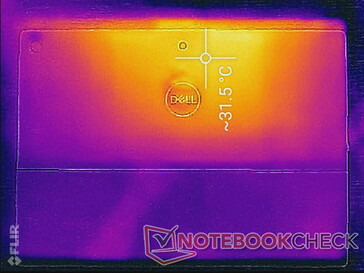
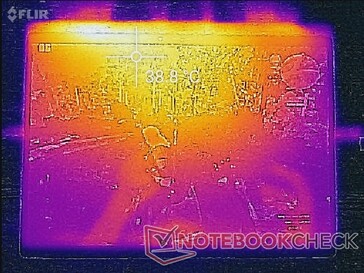
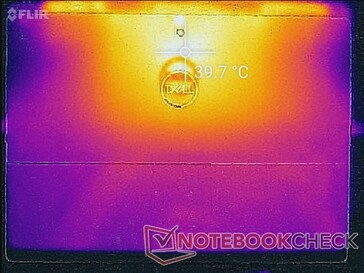
Die Oberflächentemperaturen sind größtenteils gleichmäßig verteilt mit einem einzelnen Hotspot oben in der Mitte. Bei hoher Auslastung, wie zum Beispiel Gaming, kann sich dieser auf bis zu 40 °C erwärmen. Surface Pro 7 und Yoga Duet 7. erreichen hier bis zu 44 oder gar 45 °C.
(+) Die maximale Temperatur auf der Oberseite ist 38.8 °C. Im Vergleich liegt der Klassendurchschnitt bei 35.4 °C (von 19.6 bis 60 °C für die Klasse Convertible).
(±) Auf der Unterseite messen wir eine maximalen Wert von 40 °C (im Vergleich zum Durchschnitt von 36.8 °C).
(+) Ohne Last messen wir eine durchschnittliche Temperatur von 29.6 °C auf der Oberseite. Der Klassendurchschnitt erreicht 30.3 °C.
(+) Die Handballen und der Touchpad-Bereich sind mit gemessenen 29.4 °C kühler als die typische Hauttemperatur und fühlen sich dadurch kühl an.
(±) Die durchschnittliche Handballen-Temperatur anderer getesteter Geräte war 27.9 °C (-1.5 °C).
Stresstest
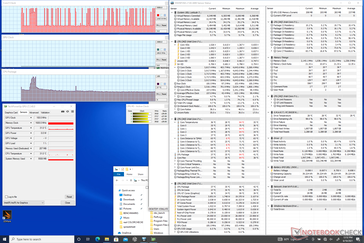
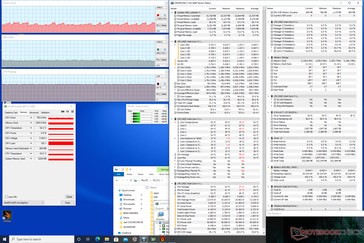
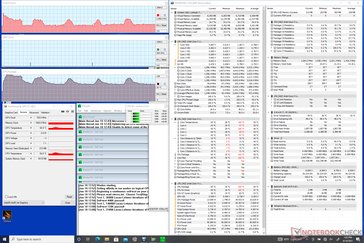
Bei der Ausführung von Prime95, um maximale CPU-Last zu erzeugen, stieg die Taktfrequenz dank Turbo Boost für ein bis zwei Sekunden auf bis zu 3,7 GHz. Nach wenigen Sekunden waren bereits 100 °C erreicht und die Taktrate sank auf nur mehr 2,1 GHz. Nach ein paar weiteren Minuten fingen Taktrate und Temperatur an periodisch zwischen 1,1 bis 2,5 GHz und 65 bis 87 °C hin- und her zu schwanken.
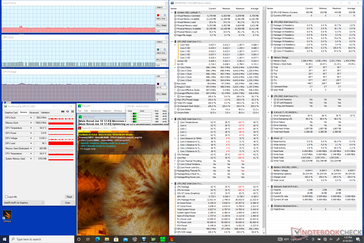
Bei der typischen durch Spiele erzeugten Auslastung stabilisierte sich die CPU-Temperatur bei etwa 64 °C und somit deutlich unterhalb des langsameren noch von Ice Lake angetriebenen Latitude 7390 2-in-1.
Auf Akku wird die Grafikleistung gedrosselt. 3DMark-11-Physics- und Graphics-Ergebnissen von jeweils 8.192 und 3.850 Punkten auf Akku stehen 6.916 und 5.483 Punkte ansteckt am Strom gegenüber.
| CPU-Takt (GHz) | GPU-Takt (MHz) | Durchschnittliche CPU-Temperatur (°C)Leerlauf | -- | -- | 37 | |
| Prime95 | 1,1 - 2,5 | -- | 65 - 87 | |||
| Prime95 + FurMark | 0,9 | 100 - 500 | 63 | |||
| Witcher 3 | 1,4 - 1,9 | 698 | 64 |
Lautsprecher
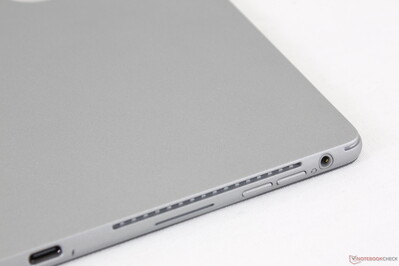
Die Qualität der Lautsprecher ist besser als erwartet. Während Tablets meistens über eher dünn und blechern klingende Lautsprecher verfügen, liegen die des Latitude Detachable deutlich näher an der Lautsprecherqualität eines Ultrabooks.
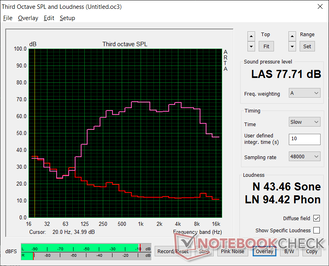
Dell Latitude 13 7320 Detachable, i7-1180G7 Audio Analyse
(±) | Mittelmäßig laut spielende Lautsprecher (77.7 dB)
Bass 100 - 315 Hz
(±) | abgesenkter Bass - 11.6% geringer als der Median
(±) | durchschnittlich lineare Bass-Wiedergabe (11.7% Delta zum Vorgänger)
Mitteltöne 400 - 2000 Hz
(+) | ausgeglichene Mitten, vom Median nur 2.7% abweichend
(+) | lineare Mitten (4% Delta zum Vorgänger)
Hochtöne 2 - 16 kHz
(+) | ausgeglichene Hochtöne, vom Median nur 3.2% abweichend
(+) | sehr lineare Hochtöne (5.2% Delta zum Vorgänger)
Gesamt im hörbaren Bereich 100 - 16.000 Hz
(+) | hörbarer Bereich ist sehr linear (14% Abstand zum Median
Im Vergleich zu allen Geräten derselben Klasse
» 20% aller getesteten Geräte dieser Klasse waren besser, 4% vergleichbar, 77% schlechter
» Das beste Gerät hat einen Delta-Wert von 6%, durchschnittlich ist 20%, das schlechteste Gerät hat 57%
Im Vergleich zu allen Geräten im Test
» 15% aller getesteten Geräte waren besser, 4% vergleichbar, 81% schlechter
» Das beste Gerät hat einen Delta-Wert von 4%, durchschnittlich ist 24%, das schlechteste Gerät hat 134%
Apple MacBook 12 (Early 2016) 1.1 GHz Audio Analyse
(+) | Die Lautsprecher können relativ laut spielen (83.6 dB)
Bass 100 - 315 Hz
(±) | abgesenkter Bass - 11.3% geringer als der Median
(±) | durchschnittlich lineare Bass-Wiedergabe (14.2% Delta zum Vorgänger)
Mitteltöne 400 - 2000 Hz
(+) | ausgeglichene Mitten, vom Median nur 2.4% abweichend
(+) | lineare Mitten (5.5% Delta zum Vorgänger)
Hochtöne 2 - 16 kHz
(+) | ausgeglichene Hochtöne, vom Median nur 2% abweichend
(+) | sehr lineare Hochtöne (4.5% Delta zum Vorgänger)
Gesamt im hörbaren Bereich 100 - 16.000 Hz
(+) | hörbarer Bereich ist sehr linear (10.2% Abstand zum Median
Im Vergleich zu allen Geräten derselben Klasse
» 7% aller getesteten Geräte dieser Klasse waren besser, 2% vergleichbar, 91% schlechter
» Das beste Gerät hat einen Delta-Wert von 5%, durchschnittlich ist 18%, das schlechteste Gerät hat 53%
Im Vergleich zu allen Geräten im Test
» 4% aller getesteten Geräte waren besser, 1% vergleichbar, 94% schlechter
» Das beste Gerät hat einen Delta-Wert von 4%, durchschnittlich ist 24%, das schlechteste Gerät hat 134%
Energieverwaltung – Hohe Effizienz dank Intel
Energiebedarf
Bei ruhendem Desktop lag der Energiebedarf abhängig von der Displayhelligkeit bei zwischen 2 und 6 W und damit unterhalb dem der meisten anderen Windows-Tablets. Das Surface Pro 7 benötigt beispielsweise trotz seines kleineren 12,3-Zoll-Bildschirms nahezu doppelt so viel Energie.
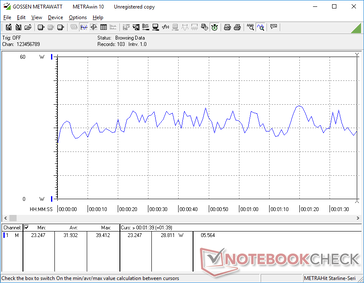
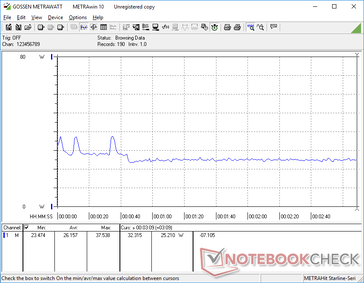
Bei hoher Last, wie sie zum Beispiel durch Games erzeugt wird, benötigt das Latitude Detachable zwischen 26 und 32 W verglichen mit 43 W beim Latitude 7390 2-in-1. Die Tatsache, dass das Latitude 7320 Detachable bei rund 30 % niedrigerem Energiebedarf trotzdem zwischen 50 und 60 % mehr Grafikleistung liefert ist beeindruckend.
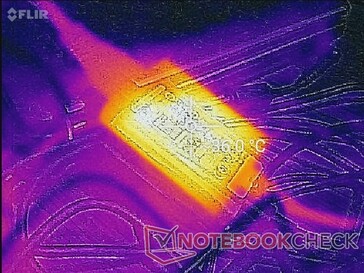
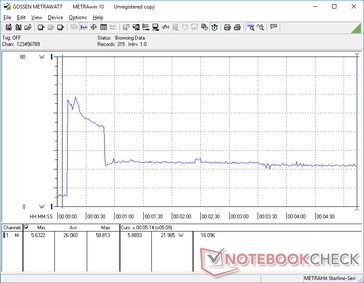
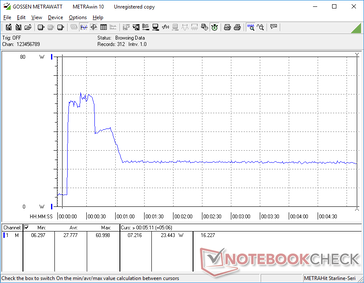
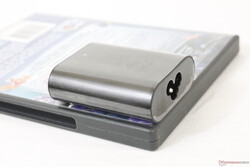
In der Spitze konnten wir einen Energiebedarf von 61 W messen, der durch das kleine (ca. 6,5 x 5,5 x 2,2 cm) 60-W-Netzteil gezogen wird. Dieser trat während der ersten paar Sekunden maximaler CPU-Last auf und sank anschließend wieder deutlich ab, was an den im Abschnitt Stresstest beschriebenen thermischen Einschränkungen liegt.
| Aus / Standby | |
| Idle | |
| Last |
|
Legende:
min: | |
| Dell Latitude 13 7320 Detachable, i7-1180G7 i7-1180G7, Iris Xe G7 96EUs, WDC PC SN530 SDBPMPZ-265G, IPS, 1920x1280, 13" | Microsoft Surface Pro 7 Plus i5-1135G7, Iris Xe G7 80EUs, Samsung PM991 MZ9LQ256HBJQ, IPS, 2736x1824, 12.3" | Lenovo ThinkPad X12 20UVS03G00 i7-1160G7, Iris Xe G7 96EUs, Toshiba BG4 KBG40ZNT512G, a-Si IPS LED, 1920x1280, 12.3" | Dell XPS 13 7390 2-in-1 Core i7 i7-1065G7, Iris Plus Graphics G7 (Ice Lake 64 EU), Toshiba BG4 KBG40ZPZ512G, IPS, 1920x1200, 13.4" | Lenovo Yoga Duet 7 13IML05-82AS000WGE i5-10210U, UHD Graphics 620, Lenovo UMIS RPJTJ256MEE1OWX, IPS, 2160x1350, 13" | |
|---|---|---|---|---|---|
| Stromverbrauch | -63% | -22% | -19% | 2% | |
| Idle min * (Watt) | 2.5 | 5.5 -120% | 4 -60% | 2.6 -4% | 3.1 -24% |
| Idle avg * (Watt) | 4.8 | 9.1 -90% | 5.9 -23% | 5.3 -10% | 5.7 -19% |
| Idle max * (Watt) | 6 | 10.8 -80% | 8.3 -38% | 7 -17% | 8.7 -45% |
| Last avg * (Watt) | 31.9 | 39.2 -23% | 30.1 6% | 43.1 -35% | 20.5 36% |
| Witcher 3 ultra * (Watt) | 26.2 | 30.8 -18% | 43.1 -65% | ||
| Last max * (Watt) | 61 | 62.5 -2% | 59 3% | 49 20% | 22.6 63% |
* ... kleinere Werte sind besser
Akkulaufzeit – kleiner Akku, lange Laufzeit
Die Akkulaufzeit ist länger als bei den meisten anderen Windows-Tablets obwohl der Akku mit nur 40 Wh vergleichsweise klein ausfällt. In der Praxis konnten wir knapp über 11 Stunden bei unserem WLAN-Test messen, was rund 3 Stunden länger ist als beim Surface Pro 7 Plus.
Das Aufladen von 0 auf 100 % dauert mit rund zwei Stunden etwa eine halbe Stunde länger als bei den meisten Ultrabooks.
| Dell Latitude 13 7320 Detachable, i7-1180G7 i7-1180G7, Iris Xe G7 96EUs, 40 Wh | Microsoft Surface Pro 7 Plus i5-1135G7, Iris Xe G7 80EUs, 48.9 Wh | Lenovo ThinkPad X12 20UVS03G00 i7-1160G7, Iris Xe G7 96EUs, 42 Wh | Dell XPS 13 7390 2-in-1 Core i7 i7-1065G7, Iris Plus Graphics G7 (Ice Lake 64 EU), 51 Wh | Lenovo Yoga Duet 7 13IML05-82AS000WGE i5-10210U, UHD Graphics 620, 39 Wh | |
|---|---|---|---|---|---|
| Akkulaufzeit | 12% | -15% | -18% | -24% | |
| Idle (h) | 17.7 | 13.6 -23% | 12.8 -28% | ||
| WLAN (h) | 11 | 8.1 -26% | 8.2 -25% | 9 -18% | 8.7 -21% |
| Last (h) | 2.1 | 3.9 86% | 2 -5% | 1.6 -24% |
Pro
Contra
Fazit – minimalistisches Design, maximale Produktivität
Wer auf der Suche nach einem Windows-Tablet ist und sich nicht mit einem Microsoft Surface Pro begnügen will sollte einen Blick auf das Dell Latitude 7320 Detachable werfen. Dessen Highlight ist zweifelsohne der bei nahezu identischen Abmessungen größere und hellere 13-Zoll-Bildschirm (12,3 Zoll beim Surface Pro). Dells Tablet bietet eine höhere Energieeffizient und längere Akkulaufzeit und ist somit besser geeignet für dein Einsatz unterwegs. Anwender mit festem Arbeitsplatz werden von den zwei Thunderbolt-4-Ports profitieren, die deutlich mehr Dockingmöglichkeiten bieten als der sonst bei Windows-Tablets übliche einzelne USB-C-Port.
Zweifelsohne eines der besten Windows-Detachables von Dell die wir je gesehen haben. Die schmalen Bildschirmränder, der helle 500-Nits-Touchscreen und die zwei Thunderbolt-4-Anschlüsse setzen das Latitude 13 7320 Detachable von anderen Windows-Tablets ab.
Potenzielle Käufer sollten unbedingt das vergleichsweise hohe Lüftergeräusch bei hoher Last im Hinterkopf behalten, ebenso wie Tatsache, dass die rohe CPU-Leistung des Core i7-1180G7 nur knapp unter der eines Core i5-1135G7 liegt. Außerdem raten wir allen dazu gleich nach dem Kauf die Festigkeit des Metallständers zu prüfen, um sicherzustellen, dass er nicht locker ist. Das Latitude 13 7320 Detachable ist zwar deutlich teurer als das Surface Pro 7, es bietet aber interne und externe Qualitäten, die den Aufpreis wieder wettmachen.
Preis und Verfügbarkeit
Derzeit ist das Dell Latitude 7320 in Deutschland ausschließlich über Dells eigenen Webstore verfügbar. Neben drei vorkonfigurierten Modellen steht ein Konfigurator zur Verfügung.
Dell Latitude 13 7320 Detachable, i7-1180G7
- 13.06.2021 v7 (old)
Allen Ngo


