Dell Latitude 7330 Rugged Extreme Test: Eines der besten 13-Zoll-Rugged-Notebooks
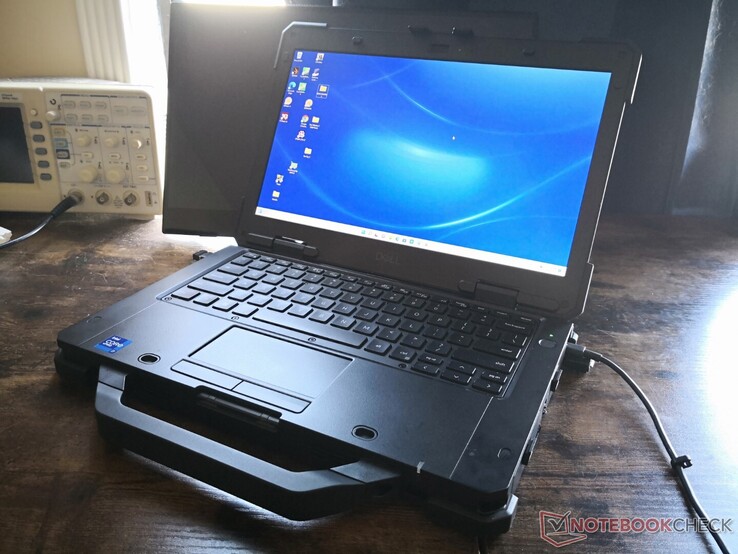
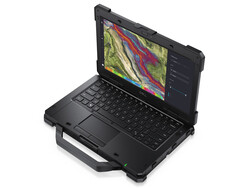
Das Latitude 7330 Rugged Extreme ist eines der wenigen - wenn nicht sogar das einzige - 13,3-Zoll-Rugged-Clamshell-Notebook von Dell. Es lehnt sich stark an die bestehenden 14-Zoll- und 15-Zoll-Rugged-Modelle von Latitude an, allerdings in einem kleineren und kompakteren 13-Zoll-Formfaktor.
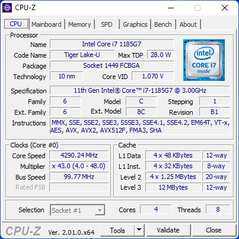
Wie die meisten anderen robusten Laptops ist auch das Latitude 7330 Rugged Extreme in einer Vielzahl von Konfigurationen erhältlich, die auf der Produktseite beschrieben werden. Unser spezielles Gerät ist mit der Core-i7-1185G7-vPro-CPU, 16-GB-LPDDR4x-4266-RAM und 512-GB-Samsung-PM9A1-NVMe-SSD ausgestattet und kostet etwa 5.300 USD. Alle SKUs kommen mit Intel-U-Series-CPUs der 11. Generation und dem gleichen 1400-nit-1080p-IPS-Panel.
Zu den direkten Konkurrenten gehören andere 13,3-Zoll-Rugged-Laptops wie das Getac B360 oder 14-Zoll-Alternativen wie das Durabook S14I oder Panasonic Toughbook FZ-55 MK2.
Mehr Dell Bewertungen:
Mögliche Konkurrenten im Vergleich
Bew. | Datum | Modell | Gewicht | Dicke | Größe | Auflösung | Preis ab |
|---|---|---|---|---|---|---|---|
v (old) | 05 / 2022 | Dell Latitude 7330 Rugged Extreme i7-1185G7, Iris Xe G7 96EUs | 2.7 kg | 36.5 mm | 13.30" | 1920x1080 | |
| 84.3 % v6 (old) | 04 / 2019 | Dell Latitude 7424 Rugged Extreme i7-8650U, Radeon RX 540 | 3.5 kg | 59.3 mm | 14.00" | 1920x1080 | |
| 89.2 % v6 (old) | 03 / 2019 | Dell Latitude 5420 Rugged-P85G i7-8650U, Radeon RX 540 | 2.8 kg | 32.9 mm | 14.00" | 1920x1080 | |
| 82.4 % v7 (old) | 12 / 2021 | Acer Enduro Urban N3 EUN314 i7-1165G7, Iris Xe G7 96EUs | 1.8 kg | 21.95 mm | 14.00" | 1920x1080 | |
| 83.9 % v7 (old) | 09 / 2021 | Panasonic Toughbook FZ-55 MK2 i7-1185G7, Iris Xe G7 96EUs | 2.3 kg | 33 mm | 14.00" | 1920x1080 | |
v (old) | 09 / 2021 | Durabook S14I i7-1165G7, Iris Xe G7 96EUs | 3 kg | 38.1 mm | 14.00" | 1920x1080 |
Gehäuse
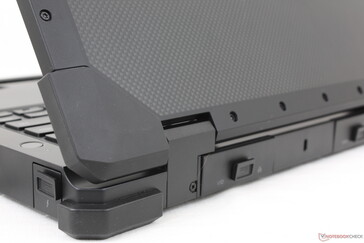
In Bezug auf Größe und Gewicht ist das Dell Modell deutlich kleiner als das 14-Zoll Getac B360 oder das Panasonic Toughbook FZ-55 MK2, und dennoch ist es schwerer als diese beiden Modelle. Die schiere Dichte des Latitude 7330 Rugged Extreme sollte nicht unterschätzt werden.
Anschlussausstattung
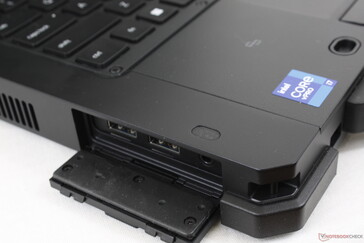
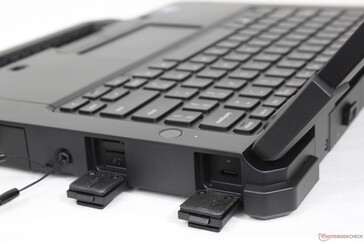
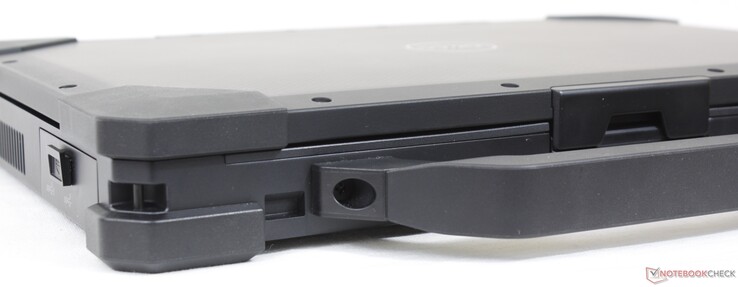
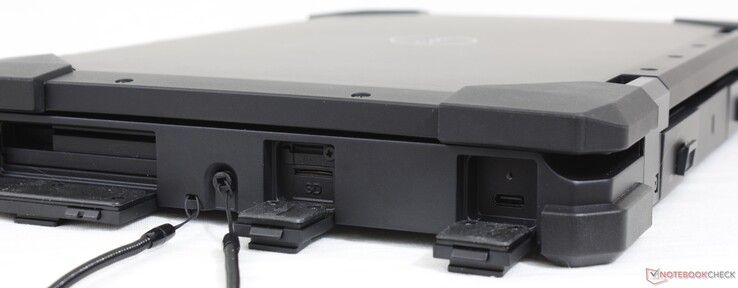
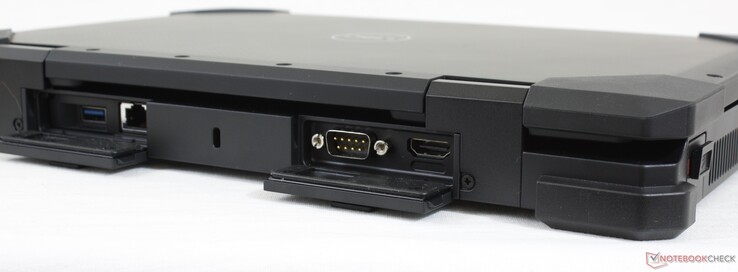
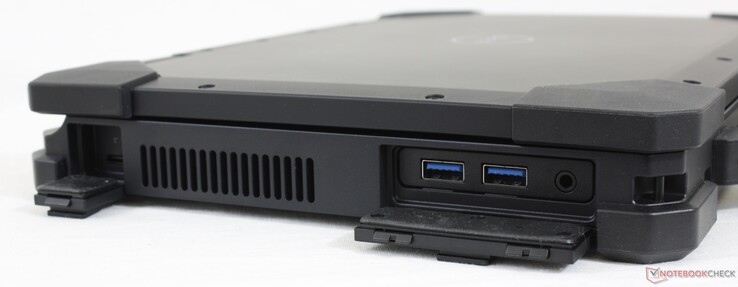
Die Anschlussmöglichkeiten sind zahlreich und viele sind optional, einschließlich der SmartCard- und ExpressCard Reader. Im Gegensatz zum Getac B360 gibt es jedoch keinen VGA-Anschluss, keinen DVD-Leser und keine Ablagefläche.
SD-Kartenleser
Die Übertragungsraten des integrierten federbelasteten MicroSD-Lesegeräts sind deutlich schneller als bei den meisten anderen robusten Geräten. Beachten Sie, dass die MicroSD-Karte verkehrt herum in das Gerät eingelegt werden muss.
Der Zugriff auf das Lesegerät kann vor allem für Benutzer mit größeren Händen schwierig sein, da es hinter einer dicken Abdeckung entlang der rechten Kante versenkt ist.
| SD Card Reader | |
| average JPG Copy Test (av. of 3 runs) | |
| Dell Latitude 5420 Rugged-P85G (Toshiba Exceria Pro SDXC 64 GB UHS-II) | |
| Dell Latitude 7424 Rugged Extreme (Toshiba Exceria Pro SDXC 64 GB UHS-II) | |
| Dell Latitude 7330 Rugged Extreme (AV Pro V60) | |
| Fujitsu LifeBook U7310 (Toshiba Exceria Pro SDXC 64 GB UHS-II) | |
| Lenovo ThinkPad P15s Gen1-20T4000JGE (Toshiba Exceria Pro M501 64 GB UHS-II) | |
| Panasonic Toughbook FZ-55 MK2 (AV Pro V60) | |
| Acer Enduro Urban N3 EUN314 (AV Pro V60) | |
| Durabook S14I (Angelbird 128GB AV Pro UHS-II) | |
| maximum AS SSD Seq Read Test (1GB) | |
| Dell Latitude 5420 Rugged-P85G (Toshiba Exceria Pro SDXC 64 GB UHS-II) | |
| Dell Latitude 7424 Rugged Extreme (Toshiba Exceria Pro SDXC 64 GB UHS-II) | |
| Dell Latitude 7330 Rugged Extreme (AV Pro V60) | |
| Panasonic Toughbook FZ-55 MK2 (AV Pro V60) | |
| Fujitsu LifeBook U7310 (Toshiba Exceria Pro SDXC 64 GB UHS-II) | |
| Lenovo ThinkPad P15s Gen1-20T4000JGE (Toshiba Exceria Pro M501 64 GB UHS-II) | |
| Durabook S14I (Angelbird 128GB AV Pro UHS-II) | |
| Acer Enduro Urban N3 EUN314 (AV Pro V60) | |
Kommunikation
Der Intel AX210 ist optional für Wi-Fi-6-Anschlüsse. Benutzer können auch mit dem Qualcomm SDX55 oder Snapdragon X20 für WAN-Anschlüsse konfigurieren.
Webcam
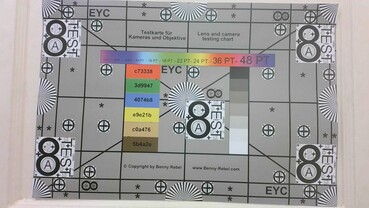
Anstelle des üblichen 1-MP-Sensors ist eine 2,1-MP-Webcam mit manuellem Privacy Shutter vorhanden. Windows Hello wird ebenfalls unterstützt.
Wartung
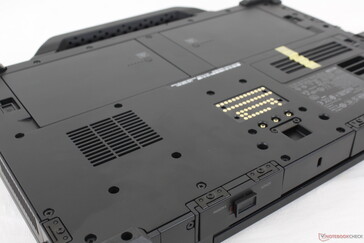
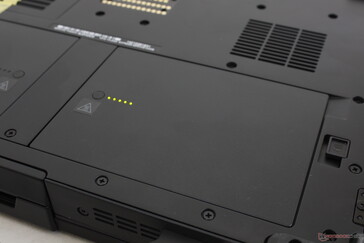
Die Bodenplatte ist relativ einfach zu entfernen, sofern man die Geduld hat, die mehr als zwei Dutzend Kreuzschlitzschrauben zu lösen. In den meisten Fällen gibt es dafür wenig Grund, da der Arbeitsspeicher verlötet ist und der einzelne Speicherschacht bereits über eine kleine Klappe zugänglich ist.
Zubehör und Garantie
Optionales Zubehör ist erhältlich, um die proprietären Andockstifte an der Unterseite des Geräts zu nutzen. Eine dreijährige beschränkte Herstellergarantie wird standardmäßig mitgeliefert.
Eingabegeräte
Tastatur
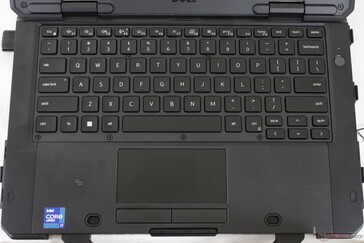
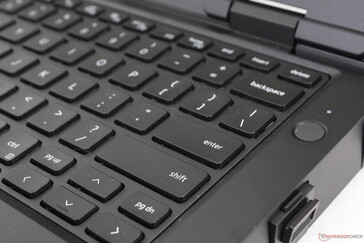
Im Vergleich zur Tastatur der Getac-B360-Serie ist die Tastatur des Dell etwas weicher und leiser, aber nicht unbedingt weniger komfortabel zu tippen. Je nach Nutzungsszenario werden die Nutzer vielleicht lieber leisere Tasten haben. Wir bevorzugen jedoch die rote Hintergrundbeleuchtung des B360, da sie etwas augenfreundlicher ist als die weiße Hintergrundbeleuchtung des Dell.
Touchpad
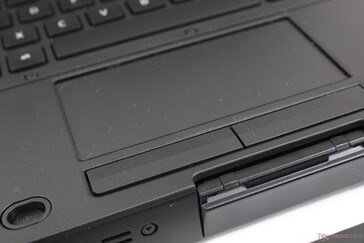
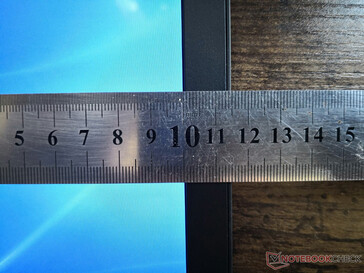
Das Trackpad ist mit 10 x 5 cm im Vergleich zu 9,3 x 5,3 cm beim Getac B360 vernünftig dimensioniert. Obwohl der Zug flüssig ist, ist die Cursor-Steuerung sprunghaft, da das Trackpad auch Eingaben mit dem Handschuh erkennt. Wir empfehlen, fester auf die Oberfläche des Trackpads zu drücken, um das Springen zu verringern.
Display
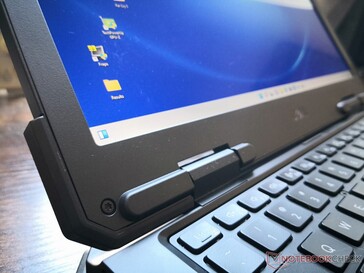
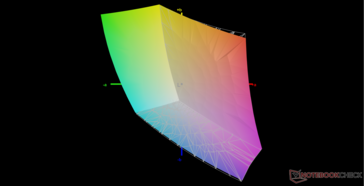
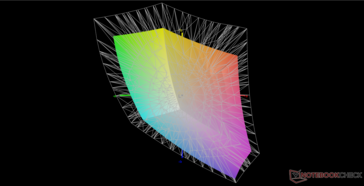
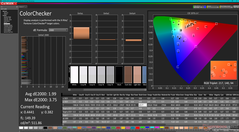
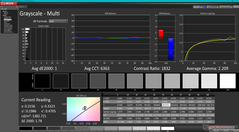
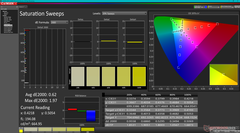
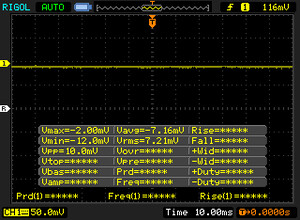
Das Latitude 7330 Rugged Extreme verwendet das gleiche 1080p-Sharp-LQ133M1-IPS-Panel, das auch im jahrealten 2016 XPS 13 9350 oder Latitude 13 7370 Verwendung findet. Auch wenn das nach etwas Schlechtem klingt, ist dieses spezielle Panel besser als das durchschnittliche Panel der meisten anderen robusten Laptops. Das Panasonic Toughbook FZ-55 MK2, das Durabook S14I oder das Getac B360 verwenden beispielsweise Panels mit einem deutlich geringeren Farbumfang und damit deutlich flacheren Farben. Dies ist eines der wenigen robusten Modelle, die ein 1400-Nit-Display, einen tiefen Kontrast von über 1.500:1 und eine vollständige sRGB-Abdeckung in einem bieten. Wir schätzen auch das Fehlen von PWM, wie es bei vielen anderen robusten Geräten der Fall ist.
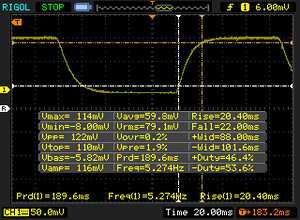
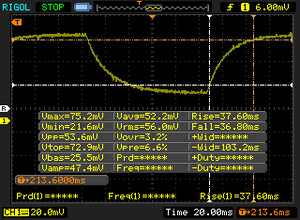
Der größte Nachteil dieses Panels ist die sehr langsame Schwarz-Weiß- und Grau-Grau-Reaktionszeit, sodass Ghosting sehr auffällig ist. Bei langsameren Anwendungen wie Browsern oder Bildbearbeitungsprogrammen ist dies zum Glück kein Problem.
| |||||||||||||||||||||||||
Ausleuchtung: 84 %
Helligkeit Akku: 1414.1 cd/m²
Kontrast: 1704:1 (Schwarzwert: 0.83 cd/m²)
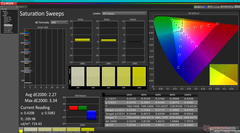
ΔE ColorChecker Calman: 1.99 | ∀{0.5-29.43 Ø4.77}
calibrated: 0.72
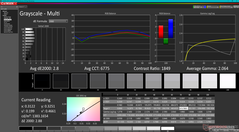
ΔE Greyscale Calman: 2.8 | ∀{0.09-98 Ø5}
69% AdobeRGB 1998 (Argyll 3D)
98.2% sRGB (Argyll 3D)
67.1% Display P3 (Argyll 3D)
Gamma: 2.06
CCT: 6775 K
| Dell Latitude 7330 Rugged Extreme Sharp LQ133M1, IPS, 1920x1080, 13.3" | Dell Latitude 7424 Rugged Extreme AU Optronics AUO523D, IPS, 1920x1080, 14" | Dell Latitude 5420 Rugged-P85G AU Optronics AUO523D, IPS, 1920x1080, 14" | Acer Enduro Urban N3 EUN314 XR140EA6T, IPS, 1920x1080, 14" | Panasonic Toughbook FZ-55 MK2 InfoVision M140NWF5 R3, IPS, 1920x1080, 14" | Durabook S14I KD140N0730A01, TN, 1920x1080, 14" | |
|---|---|---|---|---|---|---|
| Display | -2% | -7% | -5% | -48% | -34% | |
| Display P3 Coverage (%) | 67.1 | 65.3 -3% | 62.5 -7% | 63.5 -5% | 34.8 -48% | 43.55 -35% |
| sRGB Coverage (%) | 98.2 | 96.9 -1% | 92.4 -6% | 91.9 -6% | 52.2 -47% | 65.4 -33% |
| AdobeRGB 1998 Coverage (%) | 69 | 67.3 -2% | 64.2 -7% | 65.5 -5% | 36 -48% | 45 -35% |
| Response Times | 11% | 15% | 21% | 46% | 66% | |
| Response Time Grey 50% / Grey 80% * (ms) | 74.4 ? | 62.8 ? 16% | 68 ? 9% | 56 ? 25% | 28.4 ? 62% | 30.4 ? 59% |
| Response Time Black / White * (ms) | 42.4 ? | 40 ? 6% | 33.6 ? 21% | 35.2 ? 17% | 30 ? 29% | 11.8 ? 72% |
| PWM Frequency (Hz) | 763 | 735 ? | 1000 ? | 685 ? | 304.9 ? | |
| Bildschirm | -71% | -75% | -97% | -99% | -232% | |
| Helligkeit Bildmitte (cd/m²) | 1414.1 | 844 -40% | 1111.7 -21% | 487.8 -66% | 1061.1 -25% | 1180.7 -17% |
| Brightness (cd/m²) | 1282 | 793 -38% | 1026 -20% | 464 -64% | 997 -22% | 1102 -14% |
| Brightness Distribution (%) | 84 | 88 5% | 80 -5% | 89 6% | 76 -10% | 89 6% |
| Schwarzwert * (cd/m²) | 0.83 | 0.54 35% | 0.81 2% | 0.48 42% | 0.7 16% | 1.91 -130% |
| Kontrast (:1) | 1704 | 1563 -8% | 1372 -19% | 1016 -40% | 1516 -11% | 618 -64% |
| Delta E Colorchecker * | 1.99 | 4.8 -141% | 3.83 -92% | 6.51 -227% | 4.64 -133% | 13.45 -576% |
| Colorchecker dE 2000 max. * | 3.75 | 11.88 -217% | 7.85 -109% | 11.36 -203% | 20.92 -458% | 22.52 -501% |
| Colorchecker dE 2000 calibrated * | 0.72 | 1.15 -60% | 2.98 -314% | 1.77 -146% | 2.52 -250% | 3.19 -343% |
| Delta E Graustufen * | 2.8 | 7.6 -171% | 5.6 -100% | 7.8 -179% | 2.8 -0% | 15.4 -450% |
| Gamma | 2.06 107% | 2.334 94% | 2.306 95% | 2.28 96% | 2.08 106% | 1.97 112% |
| CCT | 6775 96% | 6546 99% | 7676 85% | 8102 80% | 6364 102% | 21134 31% |
| Farbraum (Prozent von AdobeRGB 1998) (%) | 62 | 59 | 41.6 | |||
| Color Space (Percent of sRGB) (%) | 97 | 93 | 65.5 | |||
| Durchschnitt gesamt (Programm / Settings) | -21% /
-44% | -22% /
-48% | -27% /
-61% | -34% /
-68% | -67% /
-147% |
* ... kleinere Werte sind besser
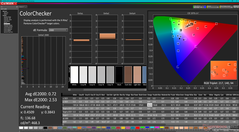
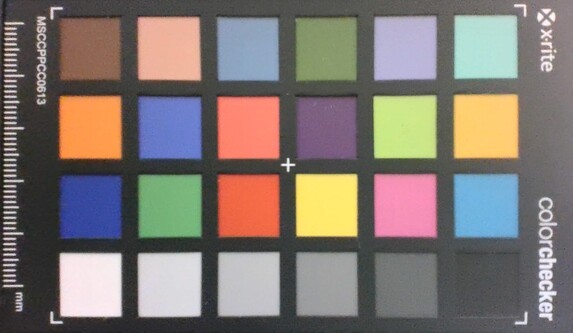
Das Panel ist bereits gut kalibriert ab Werk, und daher ist eine Kalibrierung durch den Endbenutzer nicht so notwendig. Eine Kalibrierung des Bildschirms würde die durchschnittlichen Graustufen- und Farb-DeltaE-Werte sogar noch weiter von 2,8 und 1,99 auf nur 1,0 bzw. 0,72 senken.
Reaktionszeiten (Response Times) des Displays
| ↔ Reaktionszeiten Schwarz zu Weiß | ||
|---|---|---|
| 42.4 ms ... steigend ↗ und fallend ↘ kombiniert | ↗ 20.4 ms steigend | |
| ↘ 22 ms fallend | ||
| Die gemessenen Reaktionszeiten sind langsam und dadurch für viele Spieler wahrscheinlich zu langsam. Im Vergleich rangierten die bei uns getesteten Geräte von 0.1 (Minimum) zu 240 (Maximum) ms. » 98 % aller Screens waren schneller als der getestete. Daher sind die gemessenen Reaktionszeiten schlechter als der Durchschnitt aller vermessenen Geräte (20.2 ms). | ||
| ↔ Reaktionszeiten 50% Grau zu 80% Grau | ||
| 74.4 ms ... steigend ↗ und fallend ↘ kombiniert | ↗ 37.6 ms steigend | |
| ↘ 36.8 ms fallend | ||
| Die gemessenen Reaktionszeiten sind langsam und dadurch für viele Spieler wahrscheinlich zu langsam. Im Vergleich rangierten die bei uns getesteten Geräte von 0.165 (Minimum) zu 636 (Maximum) ms. » 99 % aller Screens waren schneller als der getestete. Daher sind die gemessenen Reaktionszeiten schlechter als der Durchschnitt aller vermessenen Geräte (31.6 ms). | ||
Bildschirm-Flackern / PWM (Pulse-Width Modulation)
| Flackern / PWM nicht festgestellt | |||
Im Vergleich: 53 % aller getesteten Geräte nutzten kein PWM um die Helligkeit zu reduzieren. Wenn PWM eingesetzt wurde, dann bei einer Frequenz von durchschnittlich 8080 (Minimum 5, Maximum 343500) Hz. | |||
Leistung
Testbedingungen
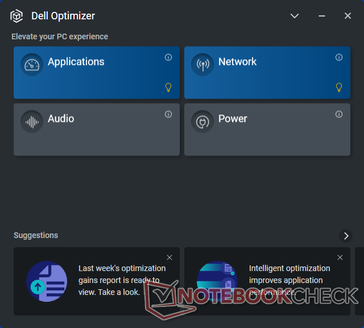
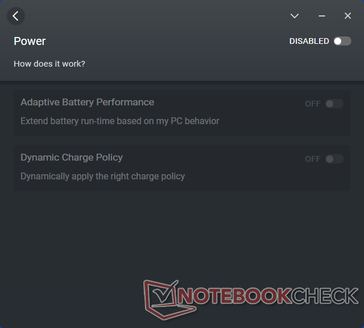
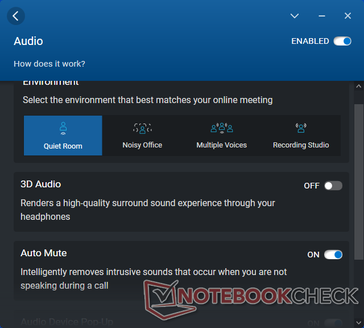
Unser Gerät wurde über Windows und den Dell Power Manager auf den Modus Performance bzw. Ultra Performance eingestellt, bevor wir die folgenden Benchmarks durchgeführt haben. Wir empfehlen den Benutzern dringend, sich mit den vorinstallierten Anwendungen Power Manager und Optimizer vertraut zu machen, da einige Funktionen des Notebooks nur über diese Software umgeschaltet werden können.
Prozessor
Die CPU-Rohleistung ist hervorragend und liegt nur wenige Prozentpunkte über dem durchschnittlichen Core i7-1185G7 in unserer Datenbank. Die Leistungsstabilität ist ebenfalls gut, da die Ergebnisse nicht über die Zeit abfallen, wenn CineBench R15 xT in einer Schleife läuft
Beachten Sie, dass der Core i7-1185G7 eine ähnliche Leistung erbringt wie der günstigere Core i7-1165G7. Wenn vPro unwichtig ist, dann kann der Core i7-1165G7 im Wesentlichen die gleiche Erfahrung bieten.
Cinebench R15 Multi Loop
Cinebench R20: CPU (Multi Core) | CPU (Single Core)
Cinebench R23: Multi Core | Single Core
Blender: v2.79 BMW27 CPU
7-Zip 18.03: 7z b 4 | 7z b 4 -mmt1
Geekbench 5.5: Multi-Core | Single-Core
HWBOT x265 Benchmark v2.2: 4k Preset
LibreOffice : 20 Documents To PDF
R Benchmark 2.5: Overall mean
| Cinebench R15 / CPU Multi 64Bit | |
| Durchschnittliche Intel Core i7-1185G7 (617 - 1066, n=32) | |
| Acer Enduro Urban N3 EUN314 | |
| Dell Latitude 7330 Rugged Extreme | |
| Panasonic Toughbook FZ-55 MK2 | |
| Lenovo ThinkPad P15s Gen1-20T4000JGE | |
| Getac B360 | |
| Durabook S14I | |
| Fujitsu LifeBook U7310 | |
| Dell Latitude 7424 Rugged Extreme | |
| Dell Latitude 5420 Rugged-P85G | |
| Cinebench R15 / CPU Single 64Bit | |
| Dell Latitude 7330 Rugged Extreme | |
| Panasonic Toughbook FZ-55 MK2 | |
| Durchschnittliche Intel Core i7-1185G7 (168 - 230, n=27) | |
| Acer Enduro Urban N3 EUN314 | |
| Durabook S14I | |
| Lenovo ThinkPad P15s Gen1-20T4000JGE | |
| Getac B360 | |
| Fujitsu LifeBook U7310 | |
| Dell Latitude 5420 Rugged-P85G | |
| Dell Latitude 7424 Rugged Extreme | |
| Cinebench R20 / CPU (Multi Core) | |
| Dell Latitude 7330 Rugged Extreme | |
| Panasonic Toughbook FZ-55 MK2 | |
| Durchschnittliche Intel Core i7-1185G7 (1425 - 2493, n=28) | |
| Acer Enduro Urban N3 EUN314 | |
| Lenovo ThinkPad P15s Gen1-20T4000JGE | |
| Getac B360 | |
| Durabook S14I | |
| Fujitsu LifeBook U7310 | |
| Cinebench R20 / CPU (Single Core) | |
| Dell Latitude 7330 Rugged Extreme | |
| Durchschnittliche Intel Core i7-1185G7 (489 - 593, n=28) | |
| Acer Enduro Urban N3 EUN314 | |
| Panasonic Toughbook FZ-55 MK2 | |
| Durabook S14I | |
| Lenovo ThinkPad P15s Gen1-20T4000JGE | |
| Getac B360 | |
| Fujitsu LifeBook U7310 | |
| Cinebench R23 / Multi Core | |
| Dell Latitude 7330 Rugged Extreme | |
| Durchschnittliche Intel Core i7-1185G7 (3610 - 6383, n=24) | |
| Panasonic Toughbook FZ-55 MK2 | |
| Acer Enduro Urban N3 EUN314 | |
| Getac B360 | |
| Durabook S14I | |
| Cinebench R23 / Single Core | |
| Dell Latitude 7330 Rugged Extreme | |
| Durchschnittliche Intel Core i7-1185G7 (1251 - 1532, n=24) | |
| Panasonic Toughbook FZ-55 MK2 | |
| Acer Enduro Urban N3 EUN314 | |
| Durabook S14I | |
| Getac B360 | |
| Blender / v2.79 BMW27 CPU | |
| Fujitsu LifeBook U7310 | |
| Durabook S14I | |
| Lenovo ThinkPad P15s Gen1-20T4000JGE | |
| Getac B360 | |
| Durchschnittliche Intel Core i7-1185G7 (478 - 745, n=28) | |
| Panasonic Toughbook FZ-55 MK2 | |
| Acer Enduro Urban N3 EUN314 | |
| Dell Latitude 7330 Rugged Extreme | |
| 7-Zip 18.03 / 7z b 4 | |
| Acer Enduro Urban N3 EUN314 | |
| Dell Latitude 7330 Rugged Extreme | |
| Panasonic Toughbook FZ-55 MK2 | |
| Durchschnittliche Intel Core i7-1185G7 (18812 - 27693, n=27) | |
| Getac B360 | |
| Lenovo ThinkPad P15s Gen1-20T4000JGE | |
| Durabook S14I | |
| Fujitsu LifeBook U7310 | |
| 7-Zip 18.03 / 7z b 4 -mmt1 | |
| Dell Latitude 7330 Rugged Extreme | |
| Acer Enduro Urban N3 EUN314 | |
| Panasonic Toughbook FZ-55 MK2 | |
| Durabook S14I | |
| Durchschnittliche Intel Core i7-1185G7 (3678 - 5507, n=27) | |
| Lenovo ThinkPad P15s Gen1-20T4000JGE | |
| Getac B360 | |
| Fujitsu LifeBook U7310 | |
| Geekbench 5.5 / Multi-Core | |
| Dell Latitude 7330 Rugged Extreme | |
| Durchschnittliche Intel Core i7-1185G7 (4620 - 5944, n=21) | |
| Acer Enduro Urban N3 EUN314 | |
| Getac B360 | |
| Lenovo ThinkPad P15s Gen1-20T4000JGE | |
| Durabook S14I | |
| Fujitsu LifeBook U7310 | |
| Geekbench 5.5 / Single-Core | |
| Dell Latitude 7330 Rugged Extreme | |
| Acer Enduro Urban N3 EUN314 | |
| Durchschnittliche Intel Core i7-1185G7 (1398 - 1626, n=21) | |
| Durabook S14I | |
| Getac B360 | |
| Lenovo ThinkPad P15s Gen1-20T4000JGE | |
| Fujitsu LifeBook U7310 | |
| HWBOT x265 Benchmark v2.2 / 4k Preset | |
| Dell Latitude 7330 Rugged Extreme | |
| Panasonic Toughbook FZ-55 MK2 | |
| Acer Enduro Urban N3 EUN314 | |
| Durchschnittliche Intel Core i7-1185G7 (5.02 - 8.13, n=27) | |
| Getac B360 | |
| Lenovo ThinkPad P15s Gen1-20T4000JGE | |
| Durabook S14I | |
| Fujitsu LifeBook U7310 | |
| LibreOffice / 20 Documents To PDF | |
| Lenovo ThinkPad P15s Gen1-20T4000JGE | |
| Acer Enduro Urban N3 EUN314 | |
| Fujitsu LifeBook U7310 | |
| Durchschnittliche Intel Core i7-1185G7 (41.3 - 61.7, n=26) | |
| Dell Latitude 7330 Rugged Extreme | |
| Panasonic Toughbook FZ-55 MK2 | |
| Durabook S14I | |
| R Benchmark 2.5 / Overall mean | |
| Fujitsu LifeBook U7310 | |
| Getac B360 | |
| Lenovo ThinkPad P15s Gen1-20T4000JGE | |
| Durabook S14I | |
| Durchschnittliche Intel Core i7-1185G7 (0.55 - 0.615, n=27) | |
| Acer Enduro Urban N3 EUN314 | |
| Panasonic Toughbook FZ-55 MK2 | |
| Dell Latitude 7330 Rugged Extreme | |
* ... kleinere Werte sind besser
AIDA64: FP32 Ray-Trace | FPU Julia | CPU SHA3 | CPU Queen | FPU SinJulia | FPU Mandel | CPU AES | CPU ZLib | FP64 Ray-Trace | CPU PhotoWorxx
| Performance Rating | |
| Dell Latitude 7330 Rugged Extreme | |
| Acer Enduro Urban N3 EUN314 | |
| Durchschnittliche Intel Core i7-1185G7 | |
| Panasonic Toughbook FZ-55 MK2 | |
| Durabook S14I | |
| AIDA64 / FP32 Ray-Trace | |
| Dell Latitude 7330 Rugged Extreme | |
| Acer Enduro Urban N3 EUN314 | |
| Durchschnittliche Intel Core i7-1185G7 (5621 - 7453, n=20) | |
| Panasonic Toughbook FZ-55 MK2 | |
| Durabook S14I | |
| AIDA64 / FPU Julia | |
| Dell Latitude 7330 Rugged Extreme | |
| Acer Enduro Urban N3 EUN314 | |
| Panasonic Toughbook FZ-55 MK2 | |
| Durchschnittliche Intel Core i7-1185G7 (23248 - 32614, n=20) | |
| Durabook S14I | |
| AIDA64 / CPU SHA3 | |
| Dell Latitude 7330 Rugged Extreme | |
| Acer Enduro Urban N3 EUN314 | |
| Durchschnittliche Intel Core i7-1185G7 (1530 - 2209, n=20) | |
| Panasonic Toughbook FZ-55 MK2 | |
| Durabook S14I | |
| AIDA64 / CPU Queen | |
| Dell Latitude 7330 Rugged Extreme | |
| Acer Enduro Urban N3 EUN314 | |
| Durabook S14I | |
| Panasonic Toughbook FZ-55 MK2 | |
| Durchschnittliche Intel Core i7-1185G7 (44677 - 52815, n=20) | |
| AIDA64 / FPU SinJulia | |
| Dell Latitude 7330 Rugged Extreme | |
| Acer Enduro Urban N3 EUN314 | |
| Panasonic Toughbook FZ-55 MK2 | |
| Durchschnittliche Intel Core i7-1185G7 (3870 - 5027, n=20) | |
| Durabook S14I | |
| AIDA64 / FPU Mandel | |
| Dell Latitude 7330 Rugged Extreme | |
| Acer Enduro Urban N3 EUN314 | |
| Panasonic Toughbook FZ-55 MK2 | |
| Durchschnittliche Intel Core i7-1185G7 (14584 - 19594, n=20) | |
| Durabook S14I | |
| AIDA64 / CPU AES | |
| Dell Latitude 7330 Rugged Extreme | |
| Acer Enduro Urban N3 EUN314 | |
| Durabook S14I | |
| Durchschnittliche Intel Core i7-1185G7 (33002 - 76826, n=20) | |
| Panasonic Toughbook FZ-55 MK2 | |
| AIDA64 / CPU ZLib | |
| Dell Latitude 7330 Rugged Extreme | |
| Acer Enduro Urban N3 EUN314 | |
| Durchschnittliche Intel Core i7-1185G7 (258 - 412, n=22) | |
| Panasonic Toughbook FZ-55 MK2 | |
| Durabook S14I | |
| AIDA64 / FP64 Ray-Trace | |
| Dell Latitude 7330 Rugged Extreme | |
| Acer Enduro Urban N3 EUN314 | |
| Panasonic Toughbook FZ-55 MK2 | |
| Durchschnittliche Intel Core i7-1185G7 (2821 - 4094, n=20) | |
| Durabook S14I | |
| AIDA64 / CPU PhotoWorxx | |
| Dell Latitude 7330 Rugged Extreme | |
| Durchschnittliche Intel Core i7-1185G7 (22349 - 43701, n=20) | |
| Acer Enduro Urban N3 EUN314 | |
| Panasonic Toughbook FZ-55 MK2 | |
| Durabook S14I | |
System Performance
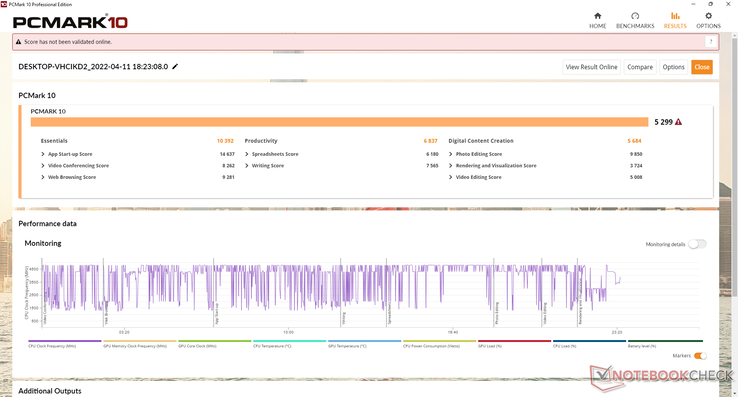
| PCMark 10 / Score | |
| Dell Latitude 7330 Rugged Extreme | |
| Panasonic Toughbook FZ-55 MK2 | |
| Durabook S14I | |
| Acer Enduro Urban N3 EUN314 | |
| Dell Latitude 7424 Rugged Extreme | |
| Dell Latitude 5420 Rugged-P85G | |
| PCMark 10 / Essentials | |
| Dell Latitude 7330 Rugged Extreme | |
| Panasonic Toughbook FZ-55 MK2 | |
| Durabook S14I | |
| Acer Enduro Urban N3 EUN314 | |
| Dell Latitude 7424 Rugged Extreme | |
| Dell Latitude 5420 Rugged-P85G | |
| PCMark 10 / Productivity | |
| Dell Latitude 7424 Rugged Extreme | |
| Dell Latitude 5420 Rugged-P85G | |
| Durabook S14I | |
| Dell Latitude 7330 Rugged Extreme | |
| Panasonic Toughbook FZ-55 MK2 | |
| Acer Enduro Urban N3 EUN314 | |
| PCMark 10 Score | 5299 Punkte | |
Hilfe | ||
| AIDA64 / Memory Copy | |
| Dell Latitude 7330 Rugged Extreme | |
| Durchschnittliche Intel Core i7-1185G7 (36515 - 68450, n=20) | |
| Acer Enduro Urban N3 EUN314 | |
| Panasonic Toughbook FZ-55 MK2 | |
| Durabook S14I | |
| AIDA64 / Memory Read | |
| Dell Latitude 7330 Rugged Extreme | |
| Durchschnittliche Intel Core i7-1185G7 (38394 - 64291, n=20) | |
| Acer Enduro Urban N3 EUN314 | |
| Panasonic Toughbook FZ-55 MK2 | |
| Durabook S14I | |
| AIDA64 / Memory Write | |
| Dell Latitude 7330 Rugged Extreme | |
| Durchschnittliche Intel Core i7-1185G7 (37684 - 66873, n=20) | |
| Acer Enduro Urban N3 EUN314 | |
| Panasonic Toughbook FZ-55 MK2 | |
| Durabook S14I | |
| AIDA64 / Memory Latency | |
| Dell Latitude 7330 Rugged Extreme | |
| Durchschnittliche Intel Core i7-1185G7 (78.3 - 117, n=22) | |
| Acer Enduro Urban N3 EUN314 | |
| Panasonic Toughbook FZ-55 MK2 | |
| Durabook S14I | |
* ... kleinere Werte sind besser
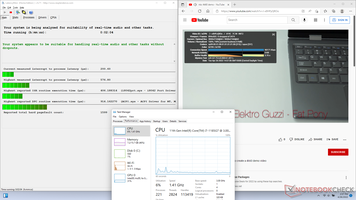
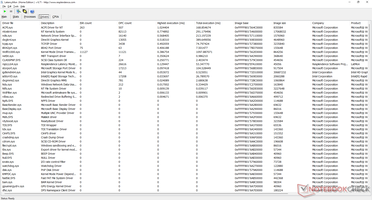
DPC-Latenzzeit
| DPC Latencies / LatencyMon - interrupt to process latency (max), Web, Youtube, Prime95 | |
| Acer Enduro Urban N3 EUN314 | |
| Panasonic Toughbook FZ-55 MK2 | |
| Durabook S14I | |
| Dell Latitude 7330 Rugged Extreme | |
* ... kleinere Werte sind besser
Speichergeräte
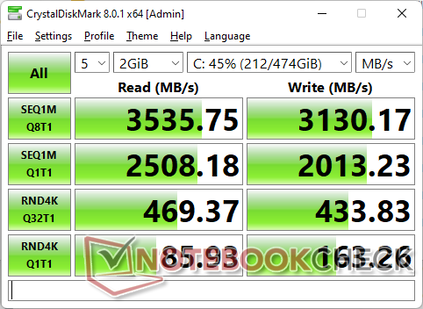
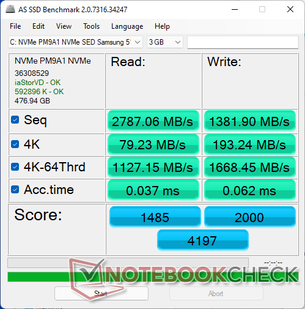
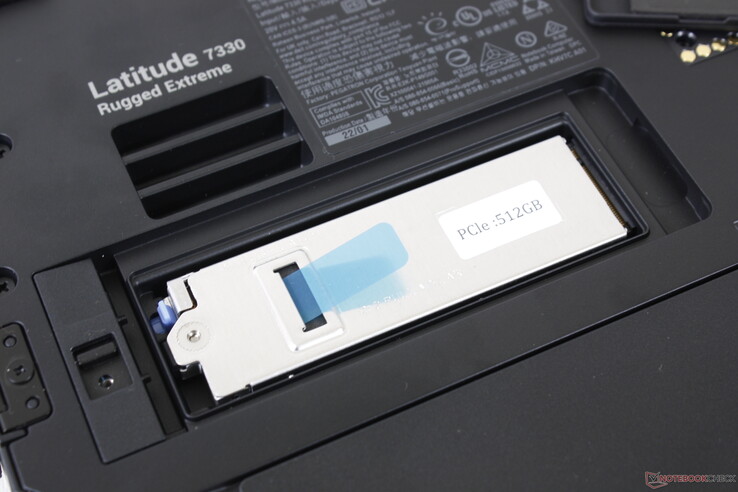
Das System unterstützt nur ein internes M.2-2280-Laufwerk, während die mehreren Laufwerke des Getac B360 schnell und ohne Werkzeug ausgetauscht werden können. Unser spezielles Testgerät wurde mit einer Samsung PM9A1 SED NVMe SSD ausgeliefert, aber es sind auch nicht-selbstverschlüsselnde Optionen verfügbar. Die Performance ist ausgezeichnet, ohne Leistungsdrosselung, auch wenn die reinen Übertragungsraten nicht so schnell sind wie bei einem Standard-Consumer-Laufwerk ohne SED.
| Drive Performance Rating - Percent | |
| Dell Latitude 7330 Rugged Extreme | |
| Acer Enduro Urban N3 EUN314 | |
| Durabook S14I | |
| Dell Latitude 5420 Rugged-P85G -8! | |
| Dell Latitude 7424 Rugged Extreme -8! | |
| Panasonic Toughbook FZ-55 MK2 | |
* ... kleinere Werte sind besser
Disk Throttling: DiskSpd Read Loop, Queue Depth 8
GPU Performance
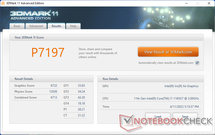
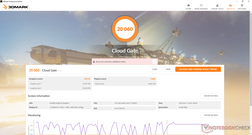
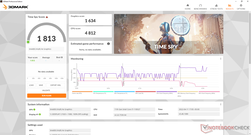
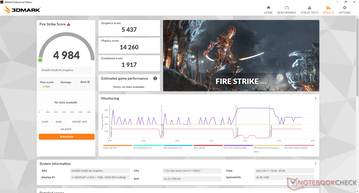
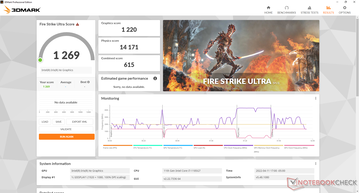
Die Grafikleistung ist hervorragend und etwa zehn bis 15 Prozent schneller als die eines durchschnittlichen Notebooks in unserer Datenbank, das mit dem gleichen integrierten Iris Xe 96 EUs Grafikprozessor ausgestattet ist. Die Performance ist sogar durchweg schneller als bei einigen älteren diskreten Grafikprozessoren wie der Radeon RX 540.
| 3DMark 11 Performance | 7197 Punkte | |
| 3DMark Cloud Gate Standard Score | 20060 Punkte | |
| 3DMark Fire Strike Score | 4984 Punkte | |
| 3DMark Time Spy Score | 1813 Punkte | |
Hilfe | ||
Witcher 3 FPS Chart
| min. | mittel | hoch | max. | |
|---|---|---|---|---|
| The Witcher 3 (2015) | 99.3 | 65.3 | 34.3 | 15.8 |
| Dota 2 Reborn (2015) | 115.6 | 108.5 | 65 | 57.3 |
| Final Fantasy XV Benchmark (2018) | 46.8 | 26.2 | 26.2 | |
| X-Plane 11.11 (2018) | 27.5 | 25.3 | 22 |
Emissionen
Geräuschemissionen
Die Lüftergeräusche sind leise, da das Modell die gleiche U-Serien-CPU verwendet, die auch in viel dünneren Consumer-Notebooks wie dem Dell XPS 13 zu finden ist. Im Prime95-Betrieb konnten wir maximal 36 dB(A) messen. Damit ist es leiser als viele andere robuste Alternativen.
Lautstärkediagramm
| Idle |
| 23.1 / 23.1 / 23.1 dB(A) |
| Last |
| 28 / 36.2 dB(A) |
 | ||
30 dB leise 40 dB(A) deutlich hörbar 50 dB(A) störend |
||
min: | ||
| Dell Latitude 7330 Rugged Extreme Iris Xe G7 96EUs, i7-1185G7 | Dell Latitude 7424 Rugged Extreme Radeon RX 540, i7-8650U, SK Hynix PC401 512GB M.2 (HFS512GD9TNG) | Dell Latitude 5420 Rugged-P85G Radeon RX 540, i7-8650U, SK hynix PC401 NVMe 500 GB | Acer Enduro Urban N3 EUN314 Iris Xe G7 96EUs, i7-1165G7, Samsung PM991 MZVLQ1T0HALB | Panasonic Toughbook FZ-55 MK2 Iris Xe G7 96EUs, i7-1185G7, Toshiba KIOXIA KBG4AZNV512G M.2 2280 OPAL | Durabook S14I Iris Xe G7 96EUs, i7-1165G7, UDinfo M2P M2P80DE512GBAEP | |
|---|---|---|---|---|---|---|
| Geräuschentwicklung | -21% | -18% | -5% | -4% | -17% | |
| aus / Umgebung * (dB) | 22.9 | 28.6 -25% | 28.3 -24% | 23.8 -4% | 23.8 -4% | 25.2 -10% |
| Idle min * (dB) | 23.1 | 28.6 -24% | 28.3 -23% | 24.1 -4% | 24 -4% | 25.2 -9% |
| Idle avg * (dB) | 23.1 | 28.6 -24% | 28.3 -23% | 24.1 -4% | 24 -4% | 25.2 -9% |
| Idle max * (dB) | 23.1 | 28.6 -24% | 28.3 -23% | 24.1 -4% | 24 -4% | 34.5 -49% |
| Last avg * (dB) | 28 | 32.9 -18% | 29.9 -7% | 27.9 -0% | 26.7 5% | 34.5 -23% |
| Witcher 3 ultra * (dB) | 31.2 | 35.7 -14% | ||||
| Last max * (dB) | 36.2 | 39 -8% | 38 -5% | 38.6 -7% | 41.7 -15% | 36.2 -0% |
* ... kleinere Werte sind besser
Temperatur
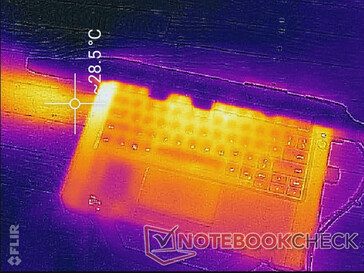
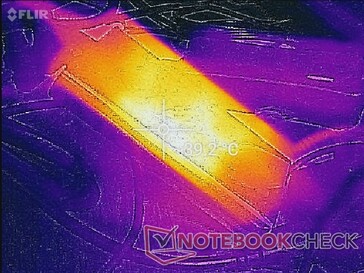
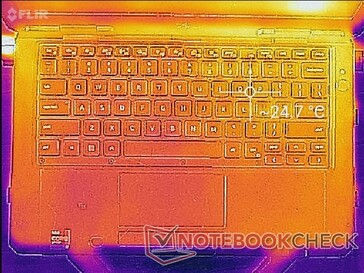
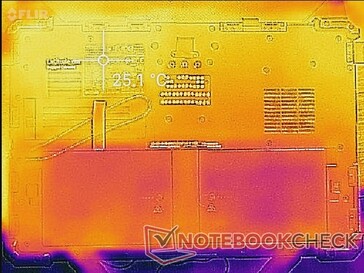
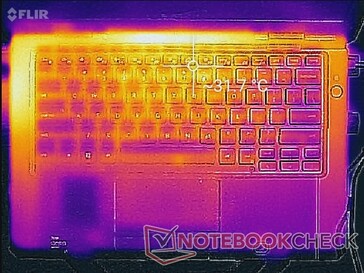
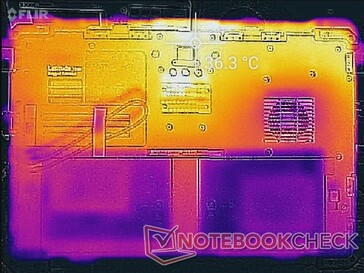
Die Oberflächentemperaturen sind nie unangenehm warm, da das Gehäuse für eine CPU der ULV-U-Serie größer als üblich ist. Wir konnten auf der Ober- und Unterseite nur 31 bzw. 36 °C messen, verglichen mit 37 bzw. 46 °C beim Acer Enduro Urban N3.
(+) Die maximale Temperatur auf der Oberseite ist 34.6 °C. Im Vergleich liegt der Klassendurchschnitt bei 36.9 °C (von 24.7 bis 57 °C für die Klasse ).
(+) Auf der Unterseite messen wir eine maximalen Wert von 36.6 °C (im Vergleich zum Durchschnitt von 38.5 °C).
(+) Ohne Last messen wir eine durchschnittliche Temperatur von 24.3 °C auf der Oberseite. Der Klassendurchschnitt erreicht 31.9 °C.
(+) Die Handballen und der Touchpad-Bereich sind mit gemessenen 26 °C kühler als die typische Hauttemperatur und fühlen sich dadurch kühl an.
(+) Die durchschnittliche Handballen-Temperatur anderer getesteter Geräte war 29.6 °C (+3.6 °C).
| Dell Latitude 7330 Rugged Extreme Intel Core i7-1185G7, Intel Iris Xe Graphics G7 96EUs | Dell Latitude 7424 Rugged Extreme Intel Core i7-8650U, AMD Radeon RX 540 | Dell Latitude 5420 Rugged-P85G Intel Core i7-8650U, AMD Radeon RX 540 | Acer Enduro Urban N3 EUN314 Intel Core i7-1165G7, Intel Iris Xe Graphics G7 96EUs | Panasonic Toughbook FZ-55 MK2 Intel Core i7-1185G7, Intel Iris Xe Graphics G7 96EUs | Durabook S14I Intel Core i7-1165G7, Intel Iris Xe Graphics G7 96EUs | |
|---|---|---|---|---|---|---|
| Hitze | -21% | -23% | -15% | -20% | -19% | |
| Last oben max * (°C) | 34.6 | 41.6 -20% | 42.2 -22% | 37.8 -9% | 36.2 -5% | 36.4 -5% |
| Last unten max * (°C) | 36.6 | 47.6 -30% | 42 -15% | 45.8 -25% | 42.2 -15% | 38.6 -5% |
| Idle oben max * (°C) | 24.8 | 28.6 -15% | 31.6 -27% | 26.4 -6% | 31 -25% | 32.6 -31% |
| Idle unten max * (°C) | 25.2 | 30.2 -20% | 31.8 -26% | 30.2 -20% | 34 -35% | 33.8 -34% |
* ... kleinere Werte sind besser
Stresstest
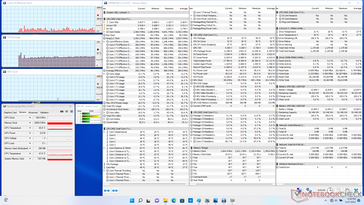
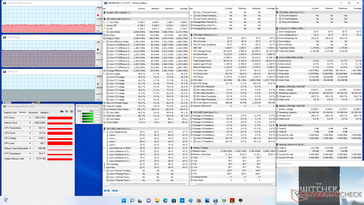
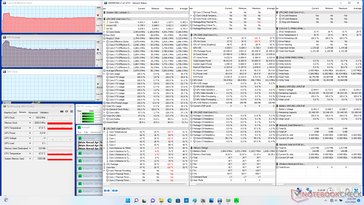
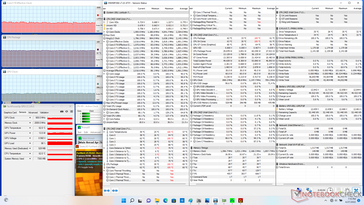
Unter Prime95 Stress wird die CPU für einige Sekunden auf 3,7 GHz hochgetaktet, und das bei einer Kerntemperatur von 100 °C. Danach sinkt die Taktrate schnell und stabilisiert sich bei 2,8 GHz, um eine kühlere Kerntemperatur von 68 °C aufrechtzuerhalten. Der gleiche Test auf dem Panasonic Toughbook FZ-55 MK2 führt zu ähnlichen CPU-Taktraten, aber einer wärmeren Kerntemperatur von 81 °C.
Im Akkubetrieb ist die Leistung leider begrenzt. Ein 3DMark-11-Test im Akkubetrieb liefert Physics- und Grafics Werte von 8.010 bzw. 3.501 Punkten, verglichen mit 12.036 und 6.722 Punkten im Netzbetrieb.
| CPU-Takt (GHz) | GPU-Takt (MHz) | Durchschnittliche CPU-Temperatur (°C) | |
| System Leerlauf | -- | -- | 40 |
| Prime95 Stress | 2.8 | -- | 68 |
| Prime95 + FurMark Stress | ~2.0 | 900 | 62 |
| Witcher 3 Stress | ~1.7 | 1350 | 62 |
Lautsprecher
Dell Latitude 7330 Rugged Extreme Audio Analyse
(+) | Die Lautsprecher können relativ laut spielen (84.8 dB)
Bass 100 - 315 Hz
(-) | kaum Bass - 24.8% niedriger als der Median
(±) | durchschnittlich lineare Bass-Wiedergabe (8.8% Delta zum Vorgänger)
Mitteltöne 400 - 2000 Hz
(+) | ausgeglichene Mitten, vom Median nur 4.6% abweichend
(+) | lineare Mitten (5.1% Delta zum Vorgänger)
Hochtöne 2 - 16 kHz
(+) | ausgeglichene Hochtöne, vom Median nur 3.2% abweichend
(+) | sehr lineare Hochtöne (2.7% Delta zum Vorgänger)
Gesamt im hörbaren Bereich 100 - 16.000 Hz
(±) | hörbarer Bereich ist durchschnittlich linear (16.5% Abstand zum Median)
Im Vergleich zu allen Geräten derselben Klasse
» 27% aller getesteten Geräte dieser Klasse waren besser, 6% vergleichbar, 67% schlechter
» Das beste Gerät hat einen Delta-Wert von 4%, durchschnittlich ist 24%, das schlechteste Gerät hat 134%
Im Vergleich zu allen Geräten im Test
» 27% aller getesteten Geräte waren besser, 6% vergleichbar, 67% schlechter
» Das beste Gerät hat einen Delta-Wert von 4%, durchschnittlich ist 24%, das schlechteste Gerät hat 134%
Apple MacBook Pro 16 2021 M1 Pro Audio Analyse
(+) | Die Lautsprecher können relativ laut spielen (84.7 dB)
Bass 100 - 315 Hz
(+) | guter Bass - nur 3.8% Abweichung vom Median
(+) | lineare Bass-Wiedergabe (5.2% Delta zum Vorgänger)
Mitteltöne 400 - 2000 Hz
(+) | ausgeglichene Mitten, vom Median nur 1.3% abweichend
(+) | lineare Mitten (2.1% Delta zum Vorgänger)
Hochtöne 2 - 16 kHz
(+) | ausgeglichene Hochtöne, vom Median nur 1.9% abweichend
(+) | sehr lineare Hochtöne (2.7% Delta zum Vorgänger)
Gesamt im hörbaren Bereich 100 - 16.000 Hz
(+) | hörbarer Bereich ist sehr linear (4.6% Abstand zum Median
Im Vergleich zu allen Geräten derselben Klasse
» 0% aller getesteten Geräte dieser Klasse waren besser, 0% vergleichbar, 100% schlechter
» Das beste Gerät hat einen Delta-Wert von 5%, durchschnittlich ist 17%, das schlechteste Gerät hat 45%
Im Vergleich zu allen Geräten im Test
» 0% aller getesteten Geräte waren besser, 0% vergleichbar, 100% schlechter
» Das beste Gerät hat einen Delta-Wert von 4%, durchschnittlich ist 24%, das schlechteste Gerät hat 134%
Energieverwaltung
Stromverbrauch
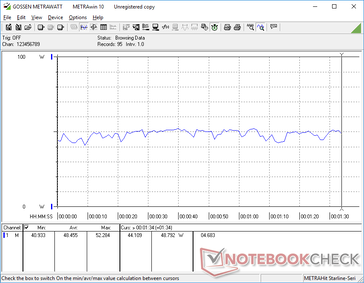
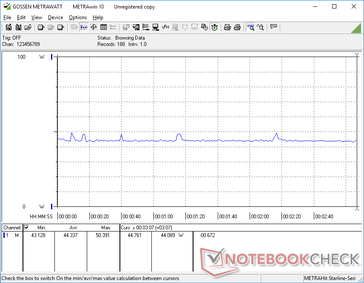
Der Leerlauf auf dem Desktop verbraucht etwa 4 W bei niedrigster Helligkeitseinstellung oder bis zu 12 W, wenn die Helligkeit auf Maximum eingestellt ist. Bei höherer Last, z. B. bei Spielen, werden etwa 45 W benötigt, was nur geringfügig höher ist als bei den meisten anderen Laptops, die mit der gleichen Intel-U-Series-CPU der 11. Generation arbeiten. Beachten Sie, dass der Stromverbrauch deutlich niedriger ist als beim älteren Dell Latitude 7424 Rugged Extreme mit der Radeon-RX-540-GPU, obwohl unser Latitude 7330 Rugged Extreme eine bis zu 40 % schnellere Grafikleistung bietet.
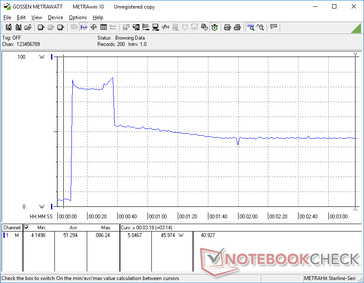
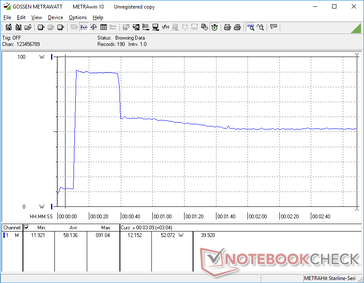
Wir können eine maximale Leistungsaufnahme von 91 W aus dem kleinen bis mittelgroßen (~13 x 6,5 x 2,3 cm) 90-W-USB-C-Netzteil aufzeichnen, wenn wir Prime95+FurMark gleichzeitig ausführen. Dieser Wert ist nur vorübergehend, wie unsere Screenshots unten zeigen, wahrscheinlich aufgrund von thermischen Einschränkungen.
| Aus / Standby | |
| Idle | |
| Last |
|
Legende:
min: | |
| Dell Latitude 7330 Rugged Extreme i7-1185G7, Iris Xe G7 96EUs, , IPS, 1920x1080, 13.3" | Dell Latitude 7424 Rugged Extreme i7-8650U, Radeon RX 540, SK Hynix PC401 512GB M.2 (HFS512GD9TNG), IPS, 1920x1080, 14" | Dell Latitude 5420 Rugged-P85G i7-8650U, Radeon RX 540, SK hynix PC401 NVMe 500 GB, IPS, 1920x1080, 14" | Acer Enduro Urban N3 EUN314 i7-1165G7, Iris Xe G7 96EUs, Samsung PM991 MZVLQ1T0HALB, IPS, 1920x1080, 14" | Panasonic Toughbook FZ-55 MK2 i7-1185G7, Iris Xe G7 96EUs, Toshiba KIOXIA KBG4AZNV512G M.2 2280 OPAL, IPS, 1920x1080, 14" | Durabook S14I i7-1165G7, Iris Xe G7 96EUs, UDinfo M2P M2P80DE512GBAEP, TN, 1920x1080, 14" | |
|---|---|---|---|---|---|---|
| Stromverbrauch | -38% | -25% | 27% | 6% | -22% | |
| Idle min * (Watt) | 4.1 | 6.5 -59% | 4.8 -17% | 3.8 7% | 3.5 15% | 6.8 -66% |
| Idle avg * (Watt) | 11.7 | 15.1 -29% | 13.6 -16% | 8 32% | 10.4 11% | 16.4 -40% |
| Idle max * (Watt) | 11.8 | 16.1 -36% | 13.8 -17% | 8.7 26% | 10.5 11% | 16.9 -43% |
| Last avg * (Watt) | 48.5 | 70.5 -45% | 67.8 -40% | 34.6 29% | 45.4 6% | 39.2 19% |
| Witcher 3 ultra * (Watt) | 44.3 | 68.1 -54% | 69.1 -56% | 35.4 20% | 43 3% | |
| Last max * (Watt) | 91 | 95.2 -5% | 93.5 -3% | 45.4 50% | 99.3 -9% | 73.1 20% |
* ... kleinere Werte sind besser
Energieverbrauch Witcher 3 / Stresstest
Power Consumption external Monitor
Akkulaufzeit
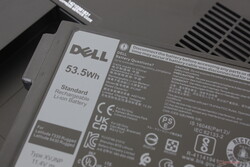
Mit beiden 53,5-Wh-Akkus ist eine reale WLAN-Laufzeit von fast 18 Stunden bei einer Display-Helligkeit von 150 Nits zu erwarten. Um Gewicht zu sparen, kann auch nur ein Akkupack verwendet werden. Das Aufladen vom leeren auf den vollen Akku dauert mit über 3 Stunden jedoch relativ lange, verglichen mit der Hälfte der Zeit bei den meisten Ultrabooks für Endverbraucher.
| Dell Latitude 7330 Rugged Extreme i7-1185G7, Iris Xe G7 96EUs, 107 Wh | Dell Latitude 7424 Rugged Extreme i7-8650U, Radeon RX 540, 102 Wh | Dell Latitude 5420 Rugged-P85G i7-8650U, Radeon RX 540, 102 Wh | Acer Enduro Urban N3 EUN314 i7-1165G7, Iris Xe G7 96EUs, 50.3 Wh | Panasonic Toughbook FZ-55 MK2 i7-1185G7, Iris Xe G7 96EUs, 71 Wh | Durabook S14I i7-1165G7, Iris Xe G7 96EUs, 50 Wh | |
|---|---|---|---|---|---|---|
| Akkulaufzeit | -35% | -10% | -64% | -24% | -69% | |
| WLAN (h) | 18 | 11.7 -35% | 16.2 -10% | 6.4 -64% | 13.6 -24% | 5.5 -69% |
| Last (h) | 2.7 | 3.2 | ||||
| Idle (h) | 31.4 |
Pro
Contra
Fazit
Das Latitude 7330 Rugged Extreme dient als Standard dafür, wie andere robuste Laptops sein sollten: Die CPU-Leistung ist hoch und ungedrosselt, die Laufzeiten sind sehr lang, das USB-C-Netzteil ist universell, der SD-Kartenleser ist extrem schnell, und die Lüftergeräusche sind fast immer leise. Vor allem die integrierte GPU hat ältere diskrete GPUs wie die Radeon RX 540 überflüssig gemacht.
Ein bemerkenswertes Merkmal des Modells ist sein hochwertiger IPS-Touchscreen. Es ist ungewöhnlich, ein robustes Notebook mit voller sRGB-Abdeckung, fast ohne Körnigkeitsprobleme, relativ tiefem Kontrast, ohne PWM und gut kalibrierten Farben zu finden ab Werk. Selbst wenn die Farbgenauigkeit keine Priorität ist, werden die Benutzer wahrscheinlich trotzdem zu schätzen wissen, wie gut das Display im Vergleich zur Konkurrenz aussieht.
Die Nachteile sind meist gering: Der MicroSD-Steckplatz ist schwer zu erreichen, Ghosting und die Hintergrundbeleuchtung der Tastatur ist nur weiß und bietet keine anderen Farboptionen. Das Modell ist auch schwerer als viele andere 14-Zoll-Rugged-Notebooks, daher sollten Nutzer nicht erwarten, dass das Latitude 7330 Rugged Extreme leichter ist, nur weil es einen kleineren Formfaktor hat. Wir hätten für eine höhere Vielseitigkeit gerne mehr Zubehör, das man wie beim Getac B360 im laufenden Betrieb auswechseln kann.
Preis und Verfügbarkeit
Dell liefert derzeit das Modell Latitude 7330 Rugged Extreme in allen Konfigurationen zu einem Startpreis von 4.033 Euro aus.


