Dell Latitude 15 9520 vs. 9510: Neu ist nicht immer besser
Das Latitude 9520 2-in-1 tauscht die Intel-CPU der 10. Generation des Latitude 9510 2-in-1 gegen neuere Optionen der 11. Generation aus, während das Gehäuse identisch bleibt. Wir empfehlen daher, unseren bestehenden Test zum Latitude 9510 2-in-1 zu lesen, um mehr über Gehäuse, Tastatur und andere physische Merkmale zu erfahren. Diese Test wird sich auf die Unterschiede zwischen den beiden Modellen konzentrieren, einschließlich dessen, was die Nutzer in Bezug auf die Leistung erwarten können.
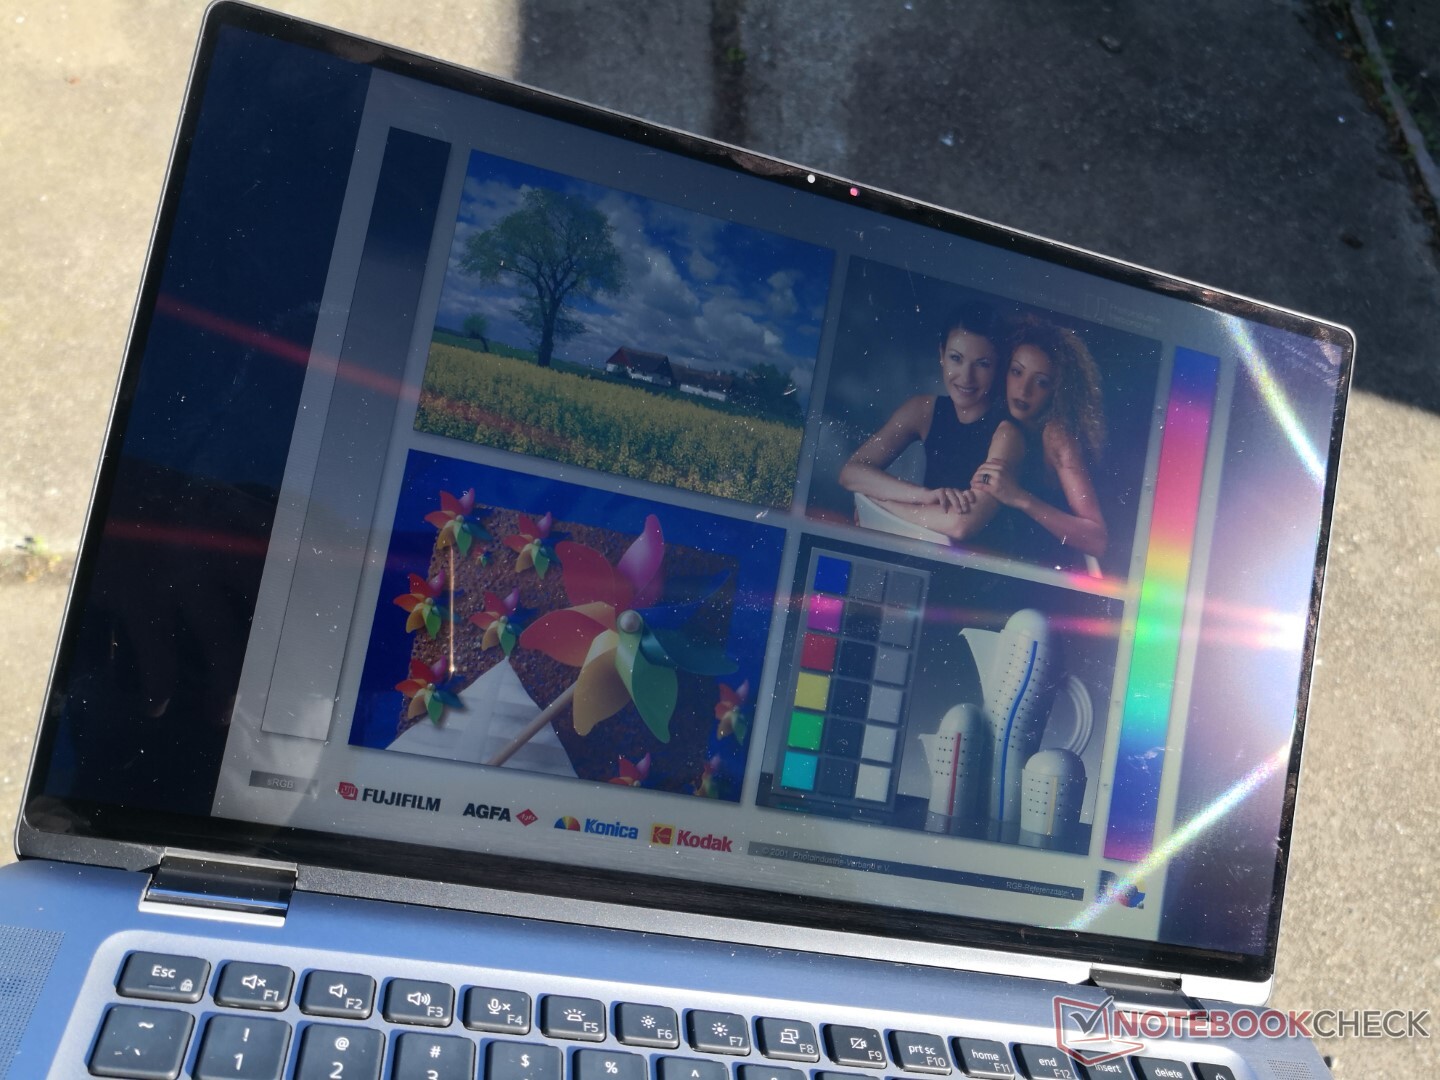
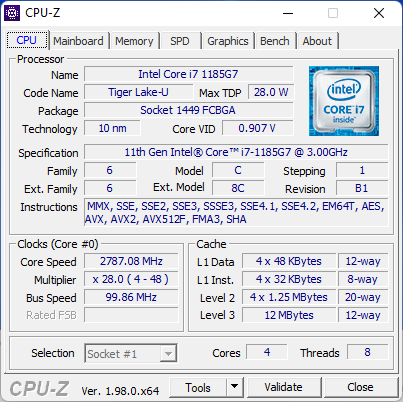
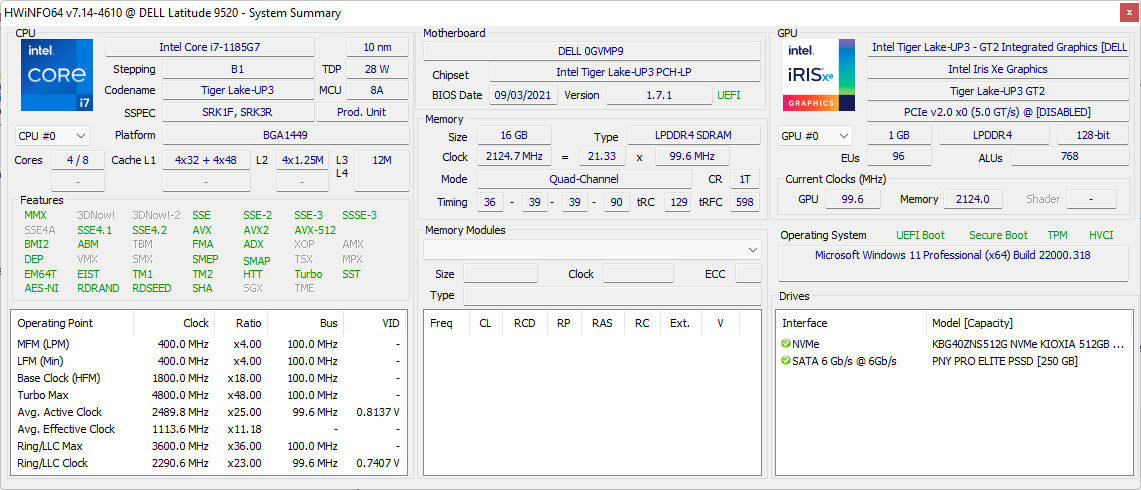
Bei unserem Testgerät handelt es sich um eine High-End-Konfiguration mit der vPro-fähigen Core i7-1185G7-CPU, Iris Xe 96 EUs-GPU, 16 GB RAM und 512 GB NVMe-SSD für ca. 2.300 Euro. Kleinere SKUs mit der Core i5-1145G7-CPU und der Hälfte der Speicherkapazität sind günstiger erhältlich. Beachten Sie, dass alle 2-in-1-SKUs mit dem gleichen 15-Zoll-FHD-Panel mit Näherungssensor und elektronischem Verschluss ausgestattet sind. Alternativ können Nutzer auch das Latitude 9520 Clamshell kaufen, wenn das 2-in-1-Gehäuse nicht erwünscht ist.
Das Latitude 9520 2-in-1 konkurriert mit anderen High-End-Business-Convertibles wie dem MSI Summit E13 Flip, dem Microsoft Surface Book, HPs EliteBook x360 1040 G7 oder dem Lenovo ThinkPad x13 Yoga.
Mehr Dell-Bewertungen:
Mögliche Konkurrenten im Vergleich
Bew. | Datum | Modell | Gewicht | Dicke | Größe | Auflösung | Preis ab |
|---|---|---|---|---|---|---|---|
| 89.2 % v7 (old) | 11 / 2021 | Dell Latitude 15 9520 2-in-1 i7-1185G7, Iris Xe G7 96EUs | 1.7 kg | 13.99 mm | 15.00" | 1920x1080 | |
| 88.6 % v7 (old) | 07 / 2020 | Dell Latitude 9510 2-in-1 i7-10810U, UHD Graphics 620 | 1.7 kg | 13.99 mm | 15.00" | 1920x1080 | |
| 86.1 % v7 (old) | 08 / 2021 | HP EliteBook 850 G8 3C7Z8EA i7-1165G7, Iris Xe G7 96EUs | 1.8 kg | 19 mm | 15.60" | 1920x1080 | |
| 85.1 % v7 (old) | 07 / 2021 | Lenovo ThinkPad L15 G2 AMD R5 5600U, Vega 7 | 1.9 kg | 21 mm | 15.60" | 1920x1080 | |
| 81.2 % v7 (old) | 12 / 2021 | MSI Summit B15 A11M i7-1165G7, Iris Xe G7 96EUs | 1.5 kg | 16.9 mm | 15.60" | 1920x1080 | |
| 84.9 % v7 (old) | 04 / 2021 | Microsoft Surface Laptop 4 15 AMD TFF_00028 R7 4980U, Vega 8 | 1.6 kg | 14.7 mm | 15.00" | 2496x1664 |
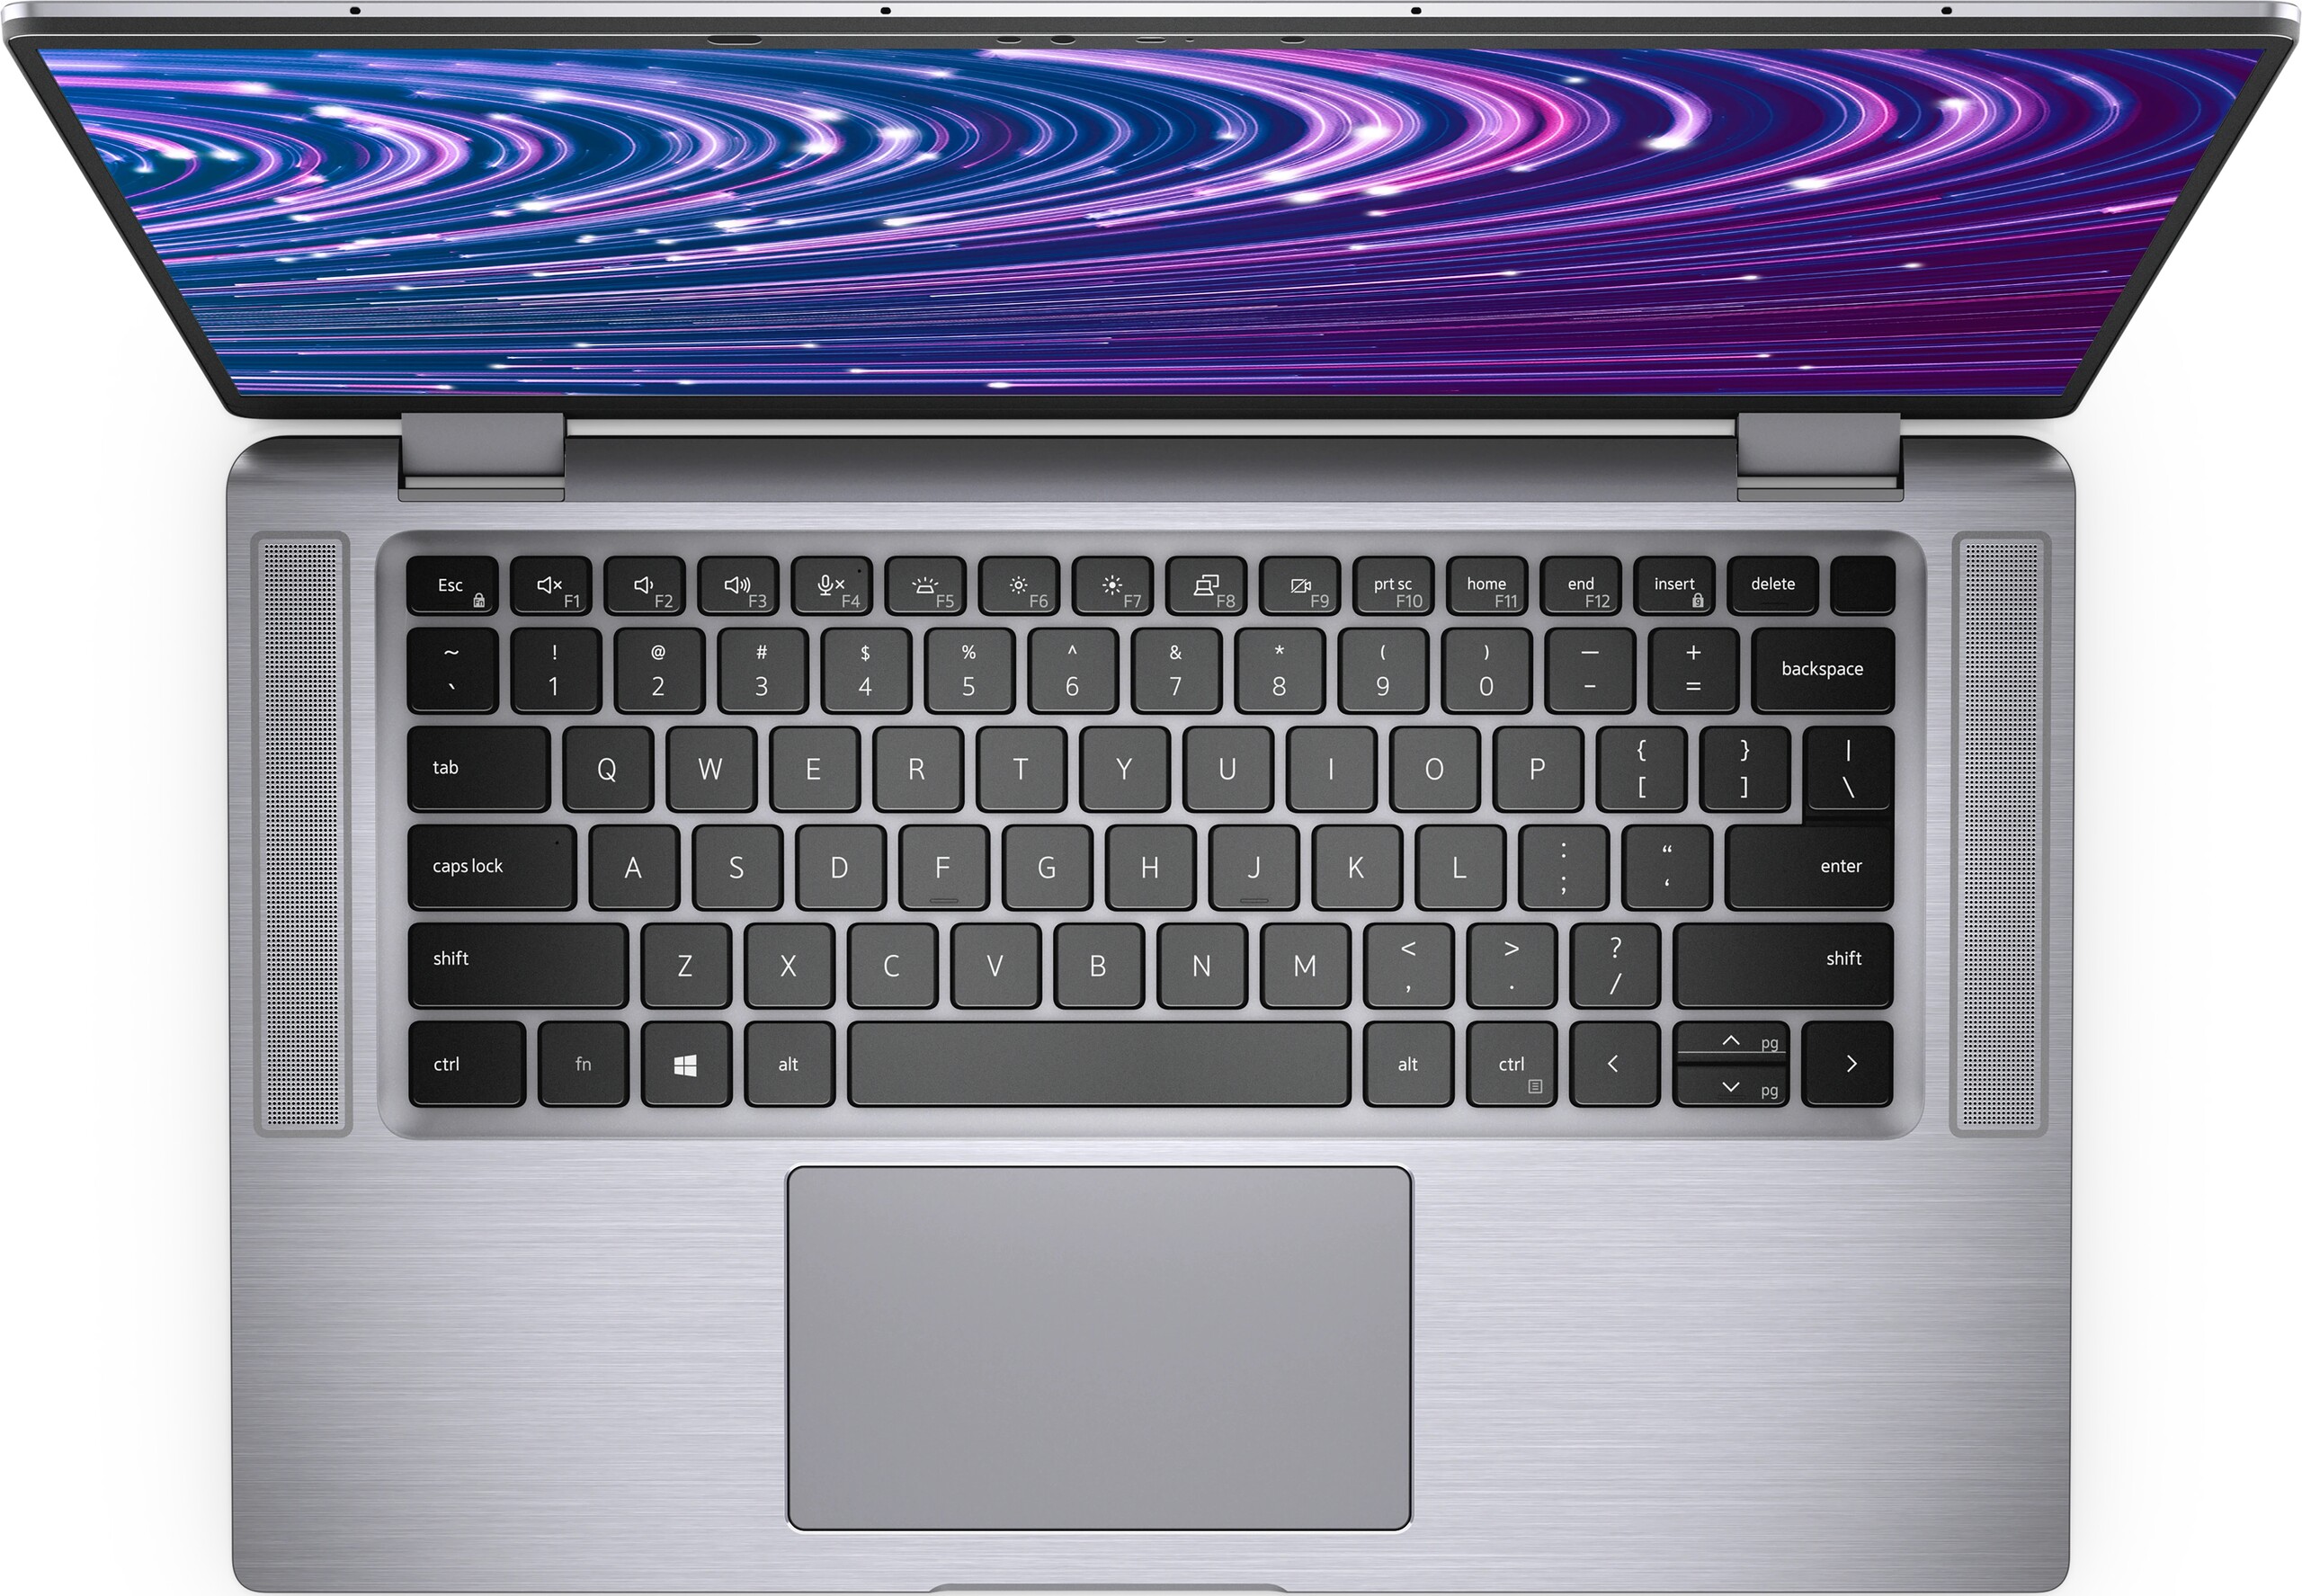
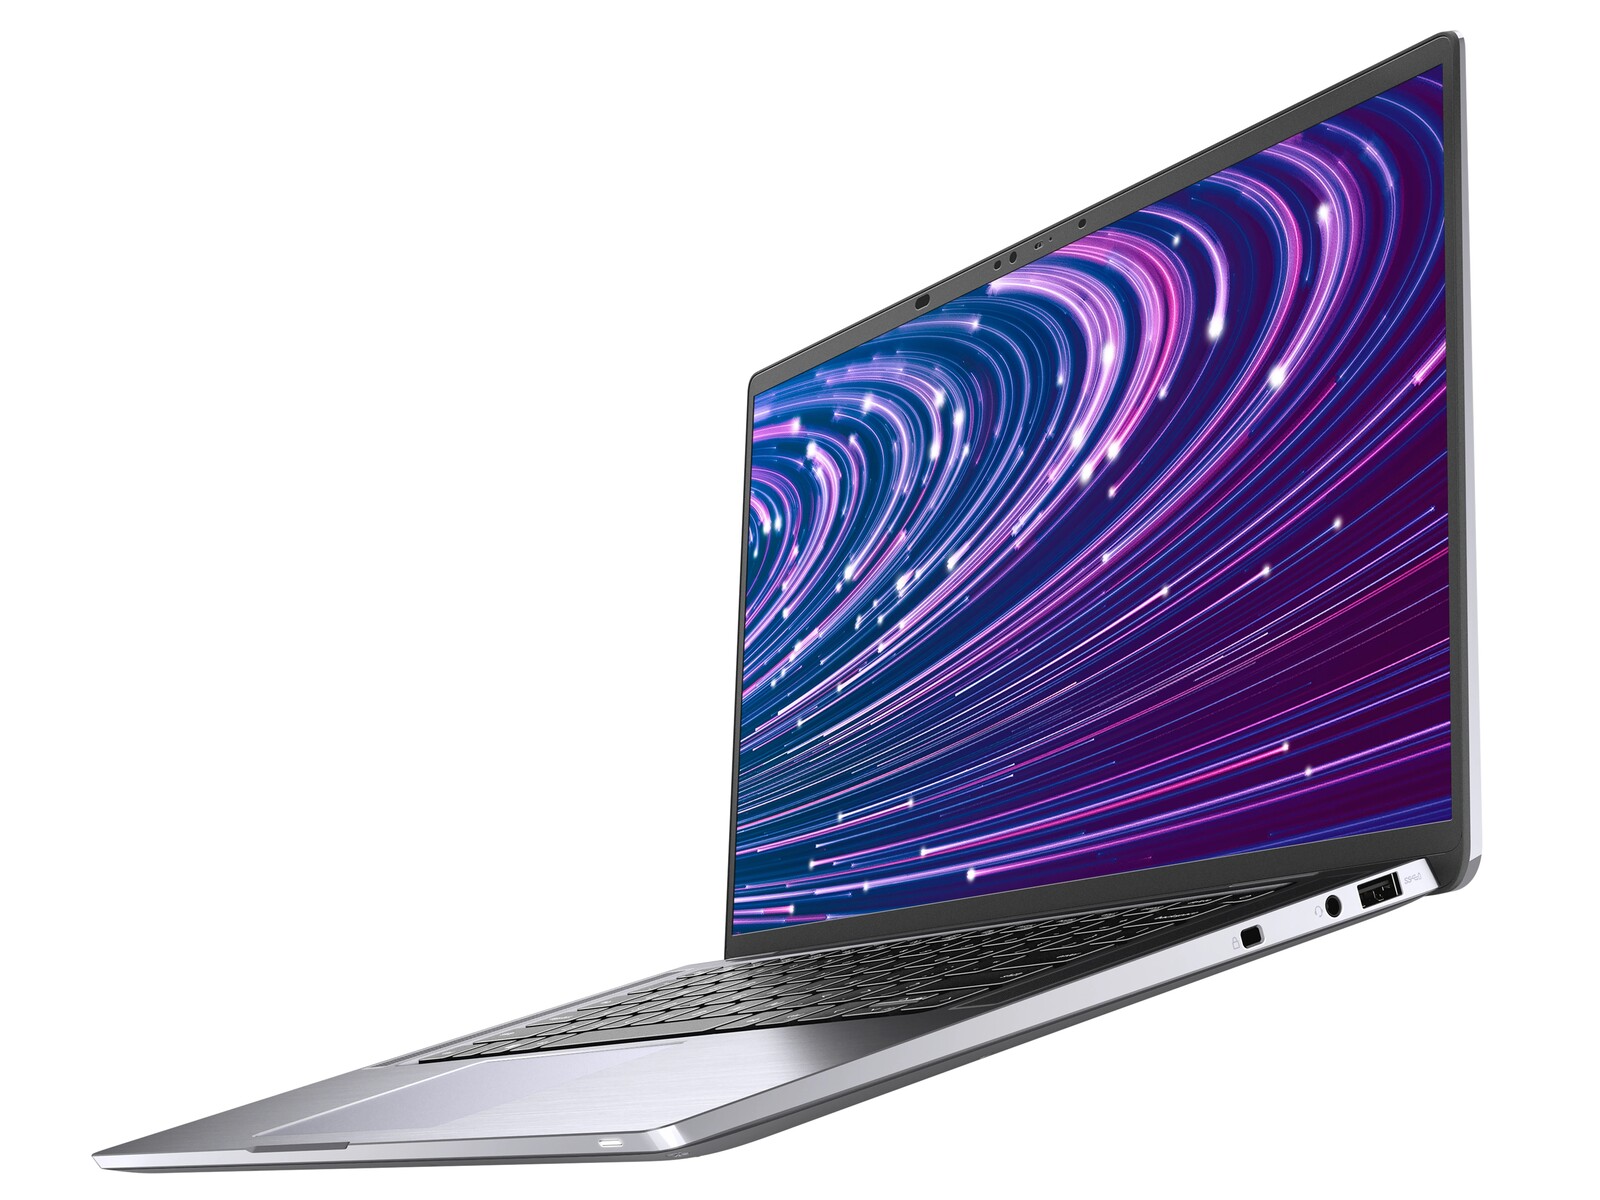
Gehäuse
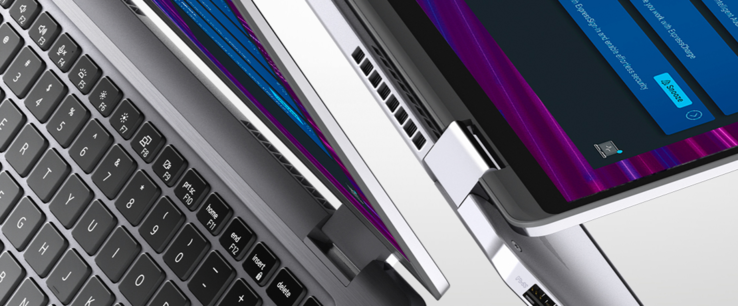
Obwohl das Gehäuse identisch mit dem Vorjahresmodell ist, fühlen sich die Scharniere unseres Latitude 9520 2-in-1 Testgeräts bei Winkeln zwischen 60 und 90 Grad "schwächer" an. Idealerweise sollte die Scharniersteifigkeit in allen Winkeln gleichmäßig sein. Wir empfehlen, die Scharniere nach dem Kauf auf etwaige Anomalien zu überprüfen.

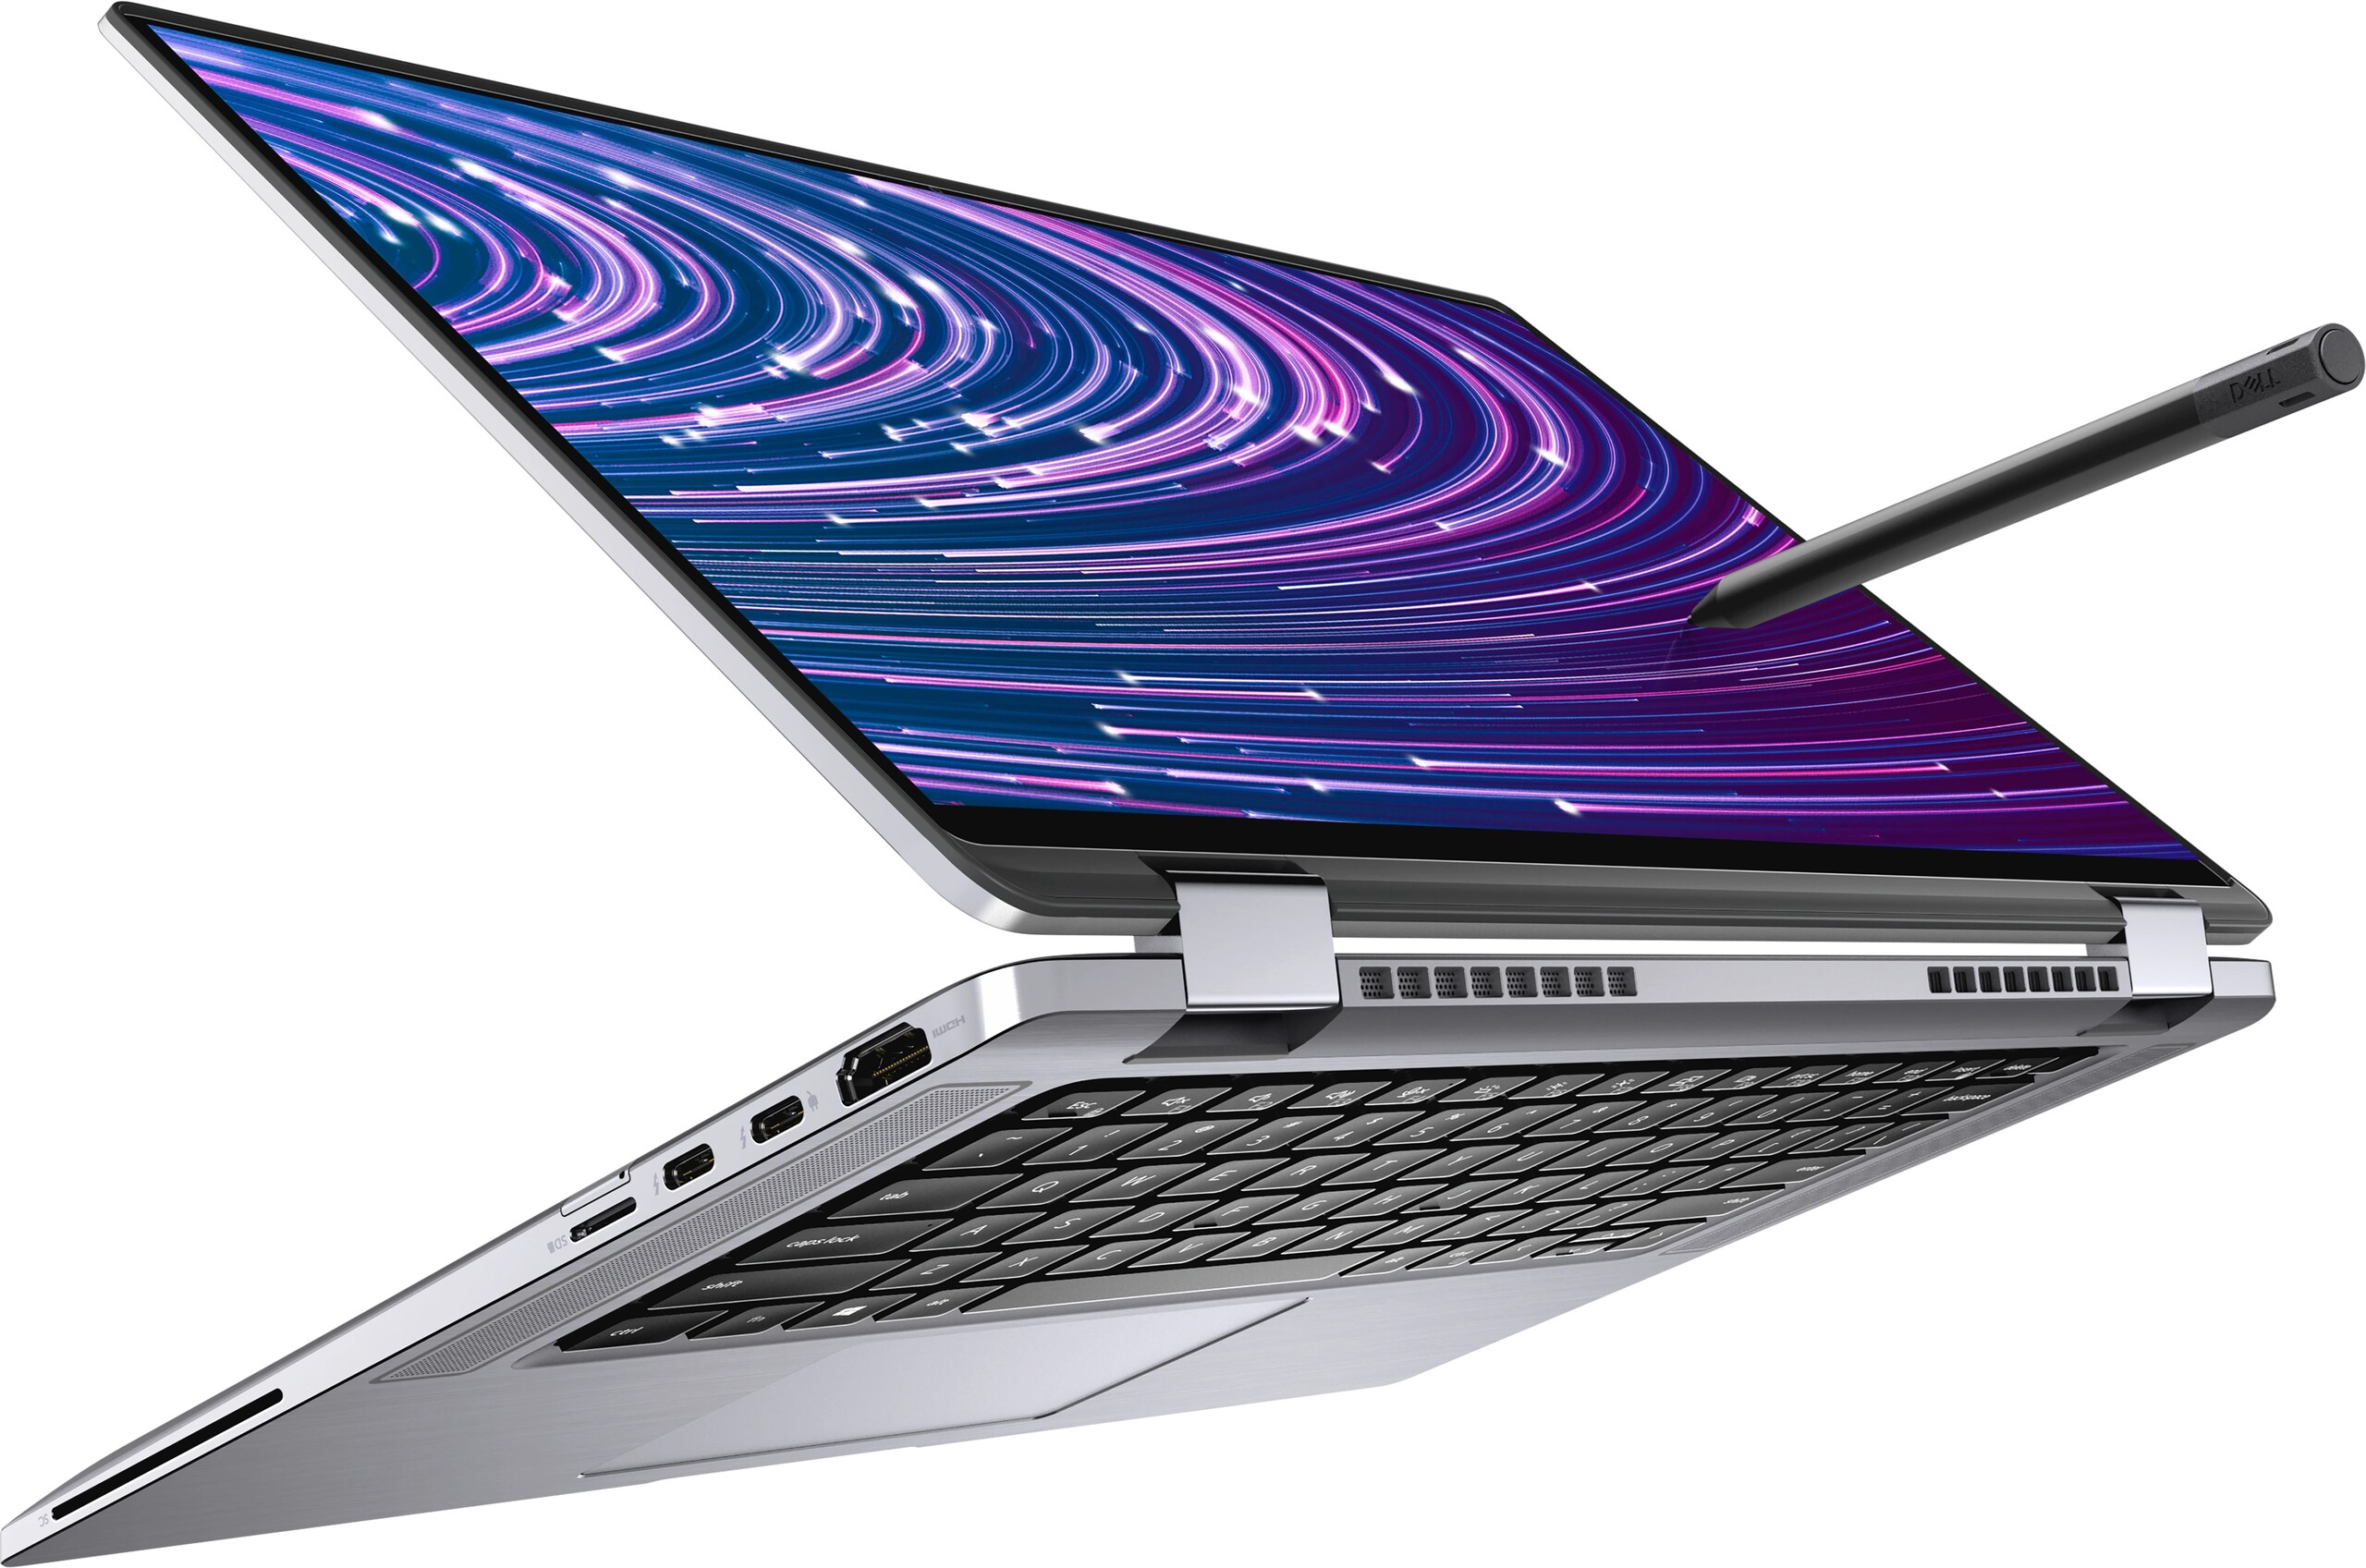
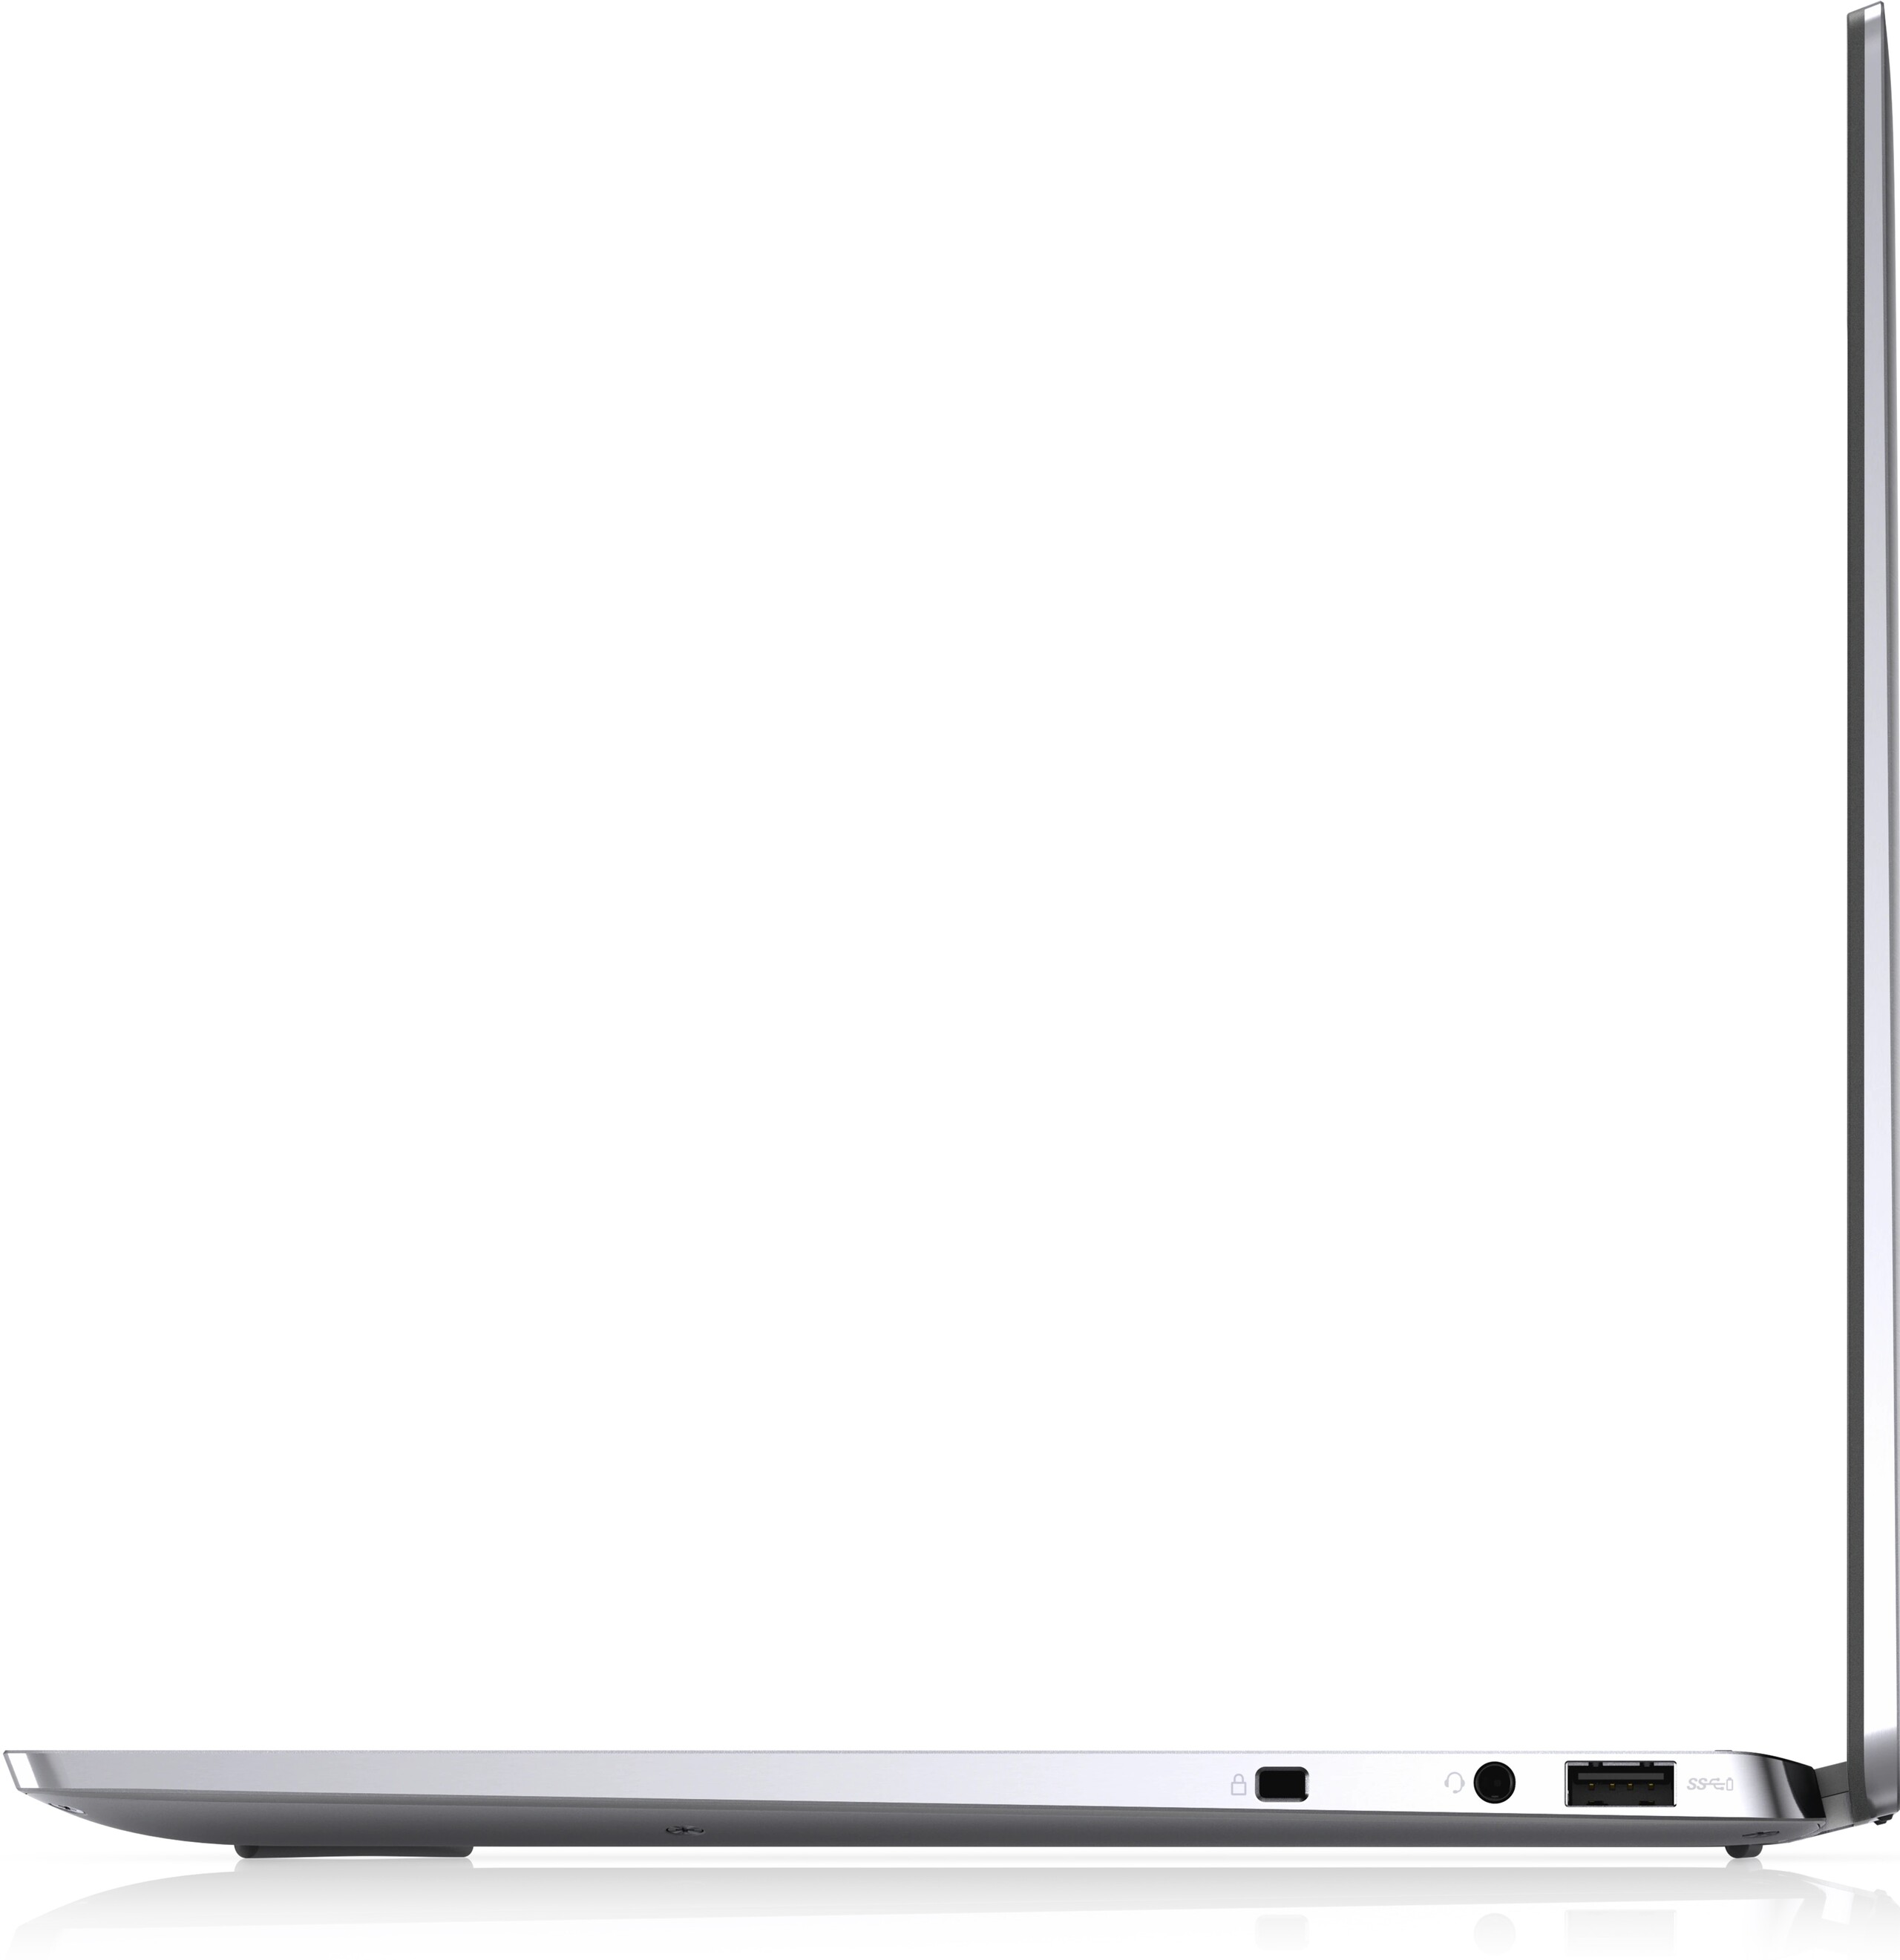
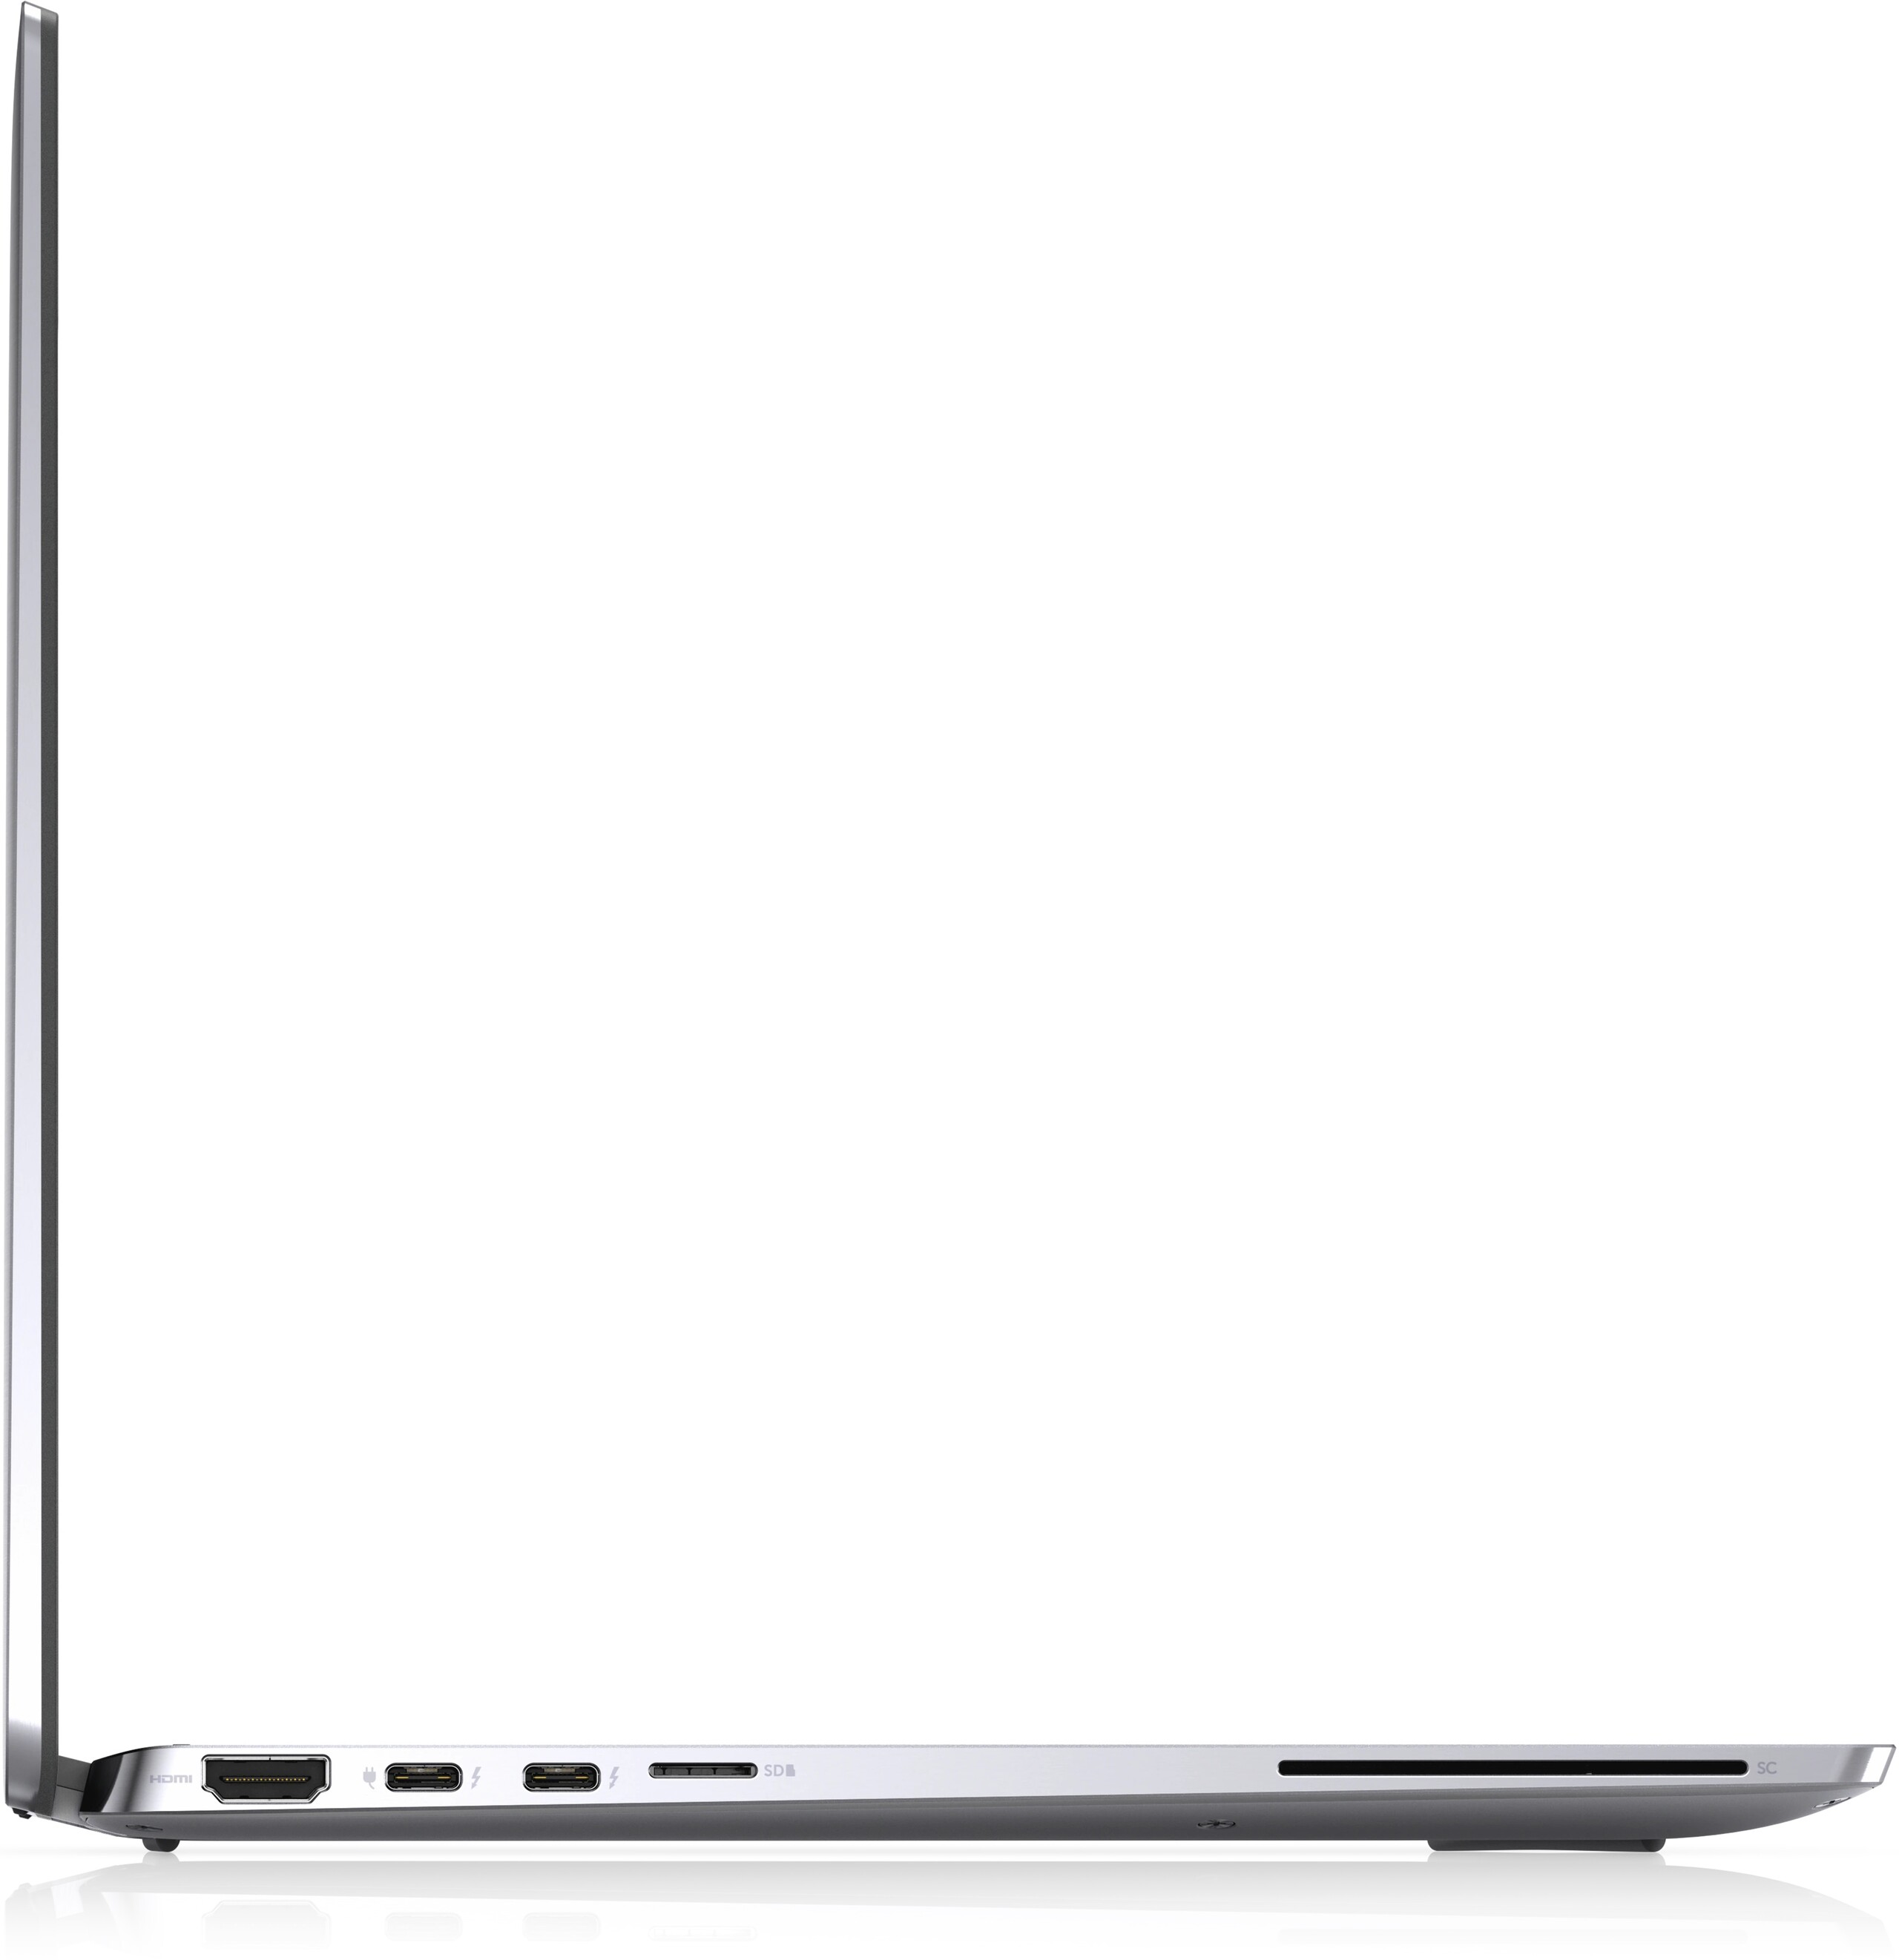
Anschlussausstattung
Der Thunderbolt 3 Port auf dem Latitude 9510 wurde auf Thunderbolt 4 auf unserem Latitude 9520 aufgerüstet. Für die meisten Benutzer wird das Upgrade jedoch im Wesentlichen keine Bedeutung haben, es sei denn, Sie planen die Verwendung externer GPUs. Alle anderen Ports sind ansonsten identisch zwischen den beiden Modellen.
SD-Kartenleser
| SD Card Reader | |
| average JPG Copy Test (av. of 3 runs) | |
| Dell Latitude 9510 2-in-1 (Toshiba Exceria Pro M501 64 GB UHS-II) | |
| Dell Latitude 15 9520 2-in-1 (AV Pro V60) | |
| MSI Summit B15 A11M (AV PRO microSD 128 GB V60) | |
| Lenovo ThinkPad L15 G2 AMD (AV Pro V60) | |
| maximum AS SSD Seq Read Test (1GB) | |
| MSI Summit B15 A11M (AV PRO microSD 128 GB V60) | |
| Dell Latitude 9510 2-in-1 (Toshiba Exceria Pro M501 64 GB UHS-II) | |
| Dell Latitude 15 9520 2-in-1 (AV Pro V60) | |
| Lenovo ThinkPad L15 G2 AMD (AV Pro V60) | |
Kommunikation
Webcam


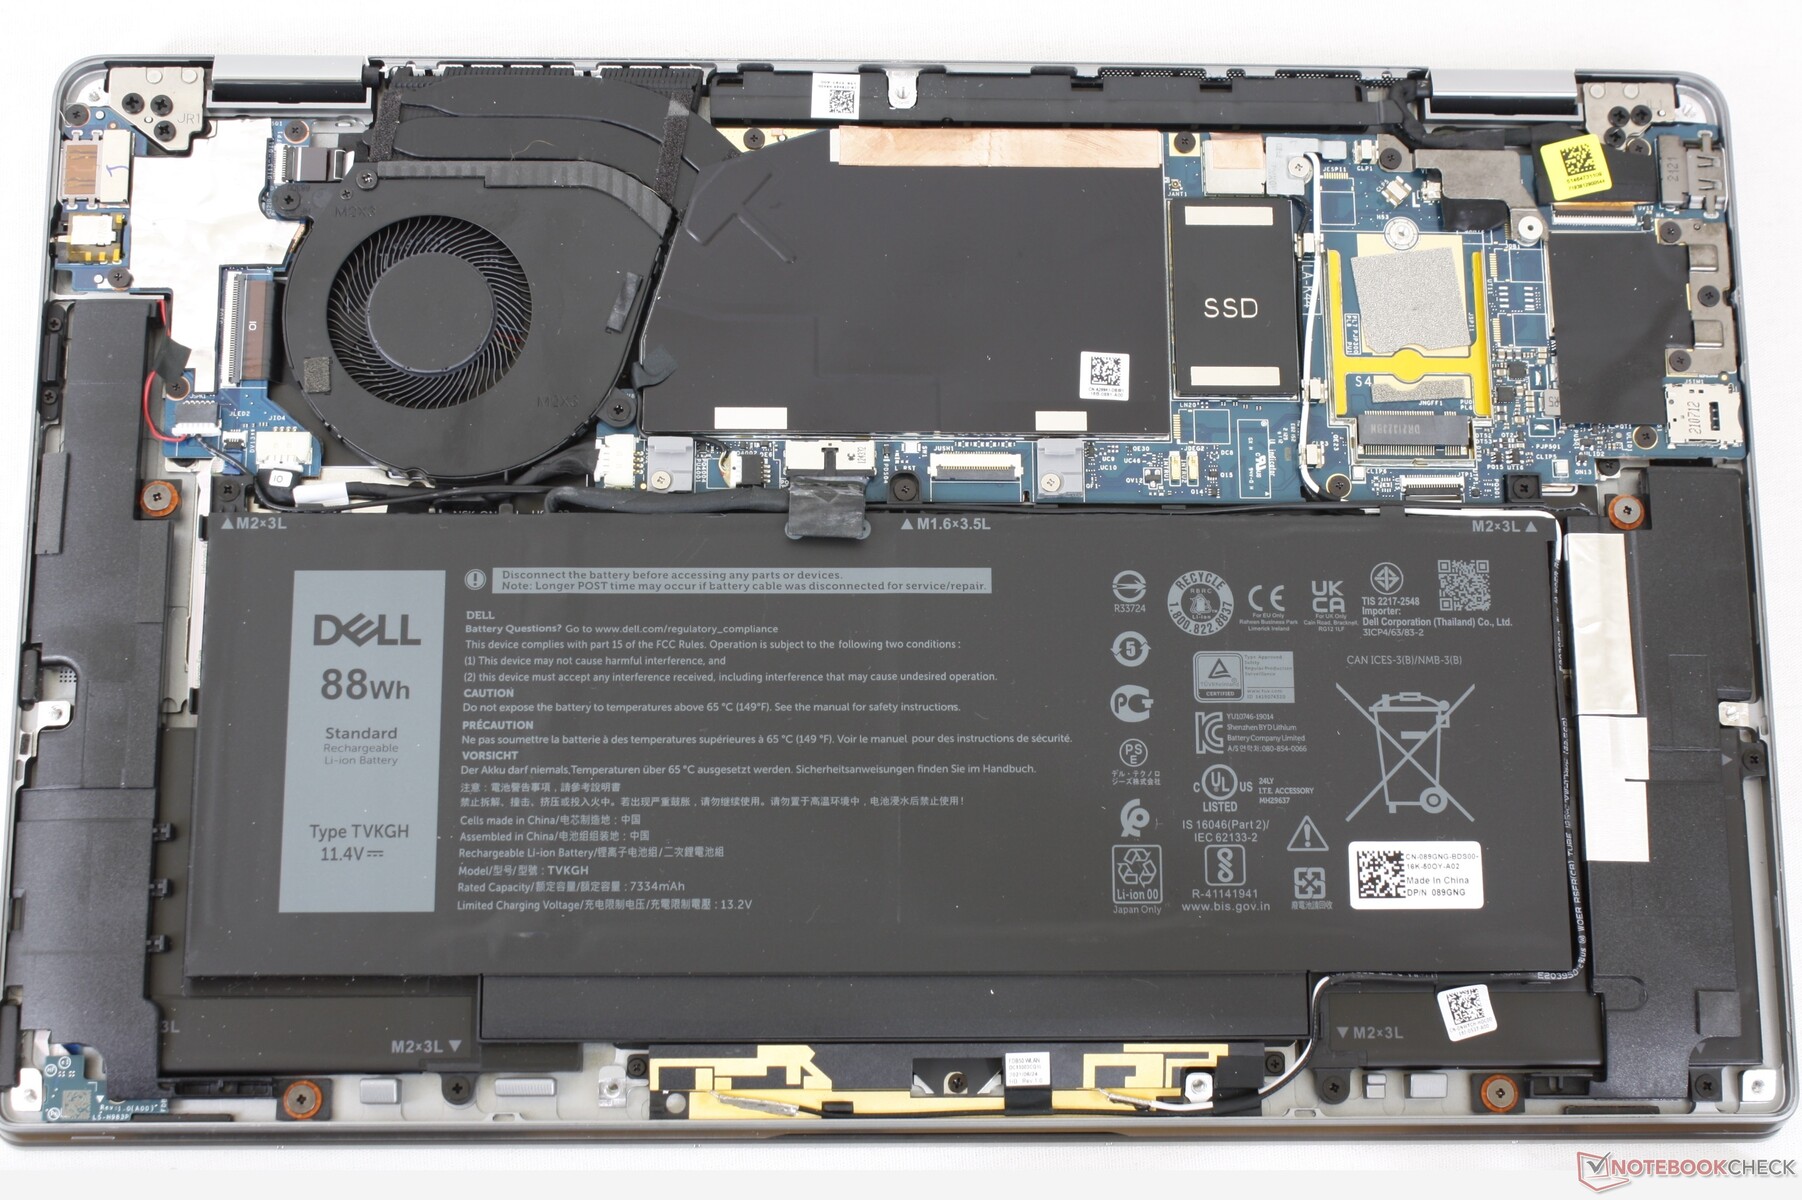
Wartung
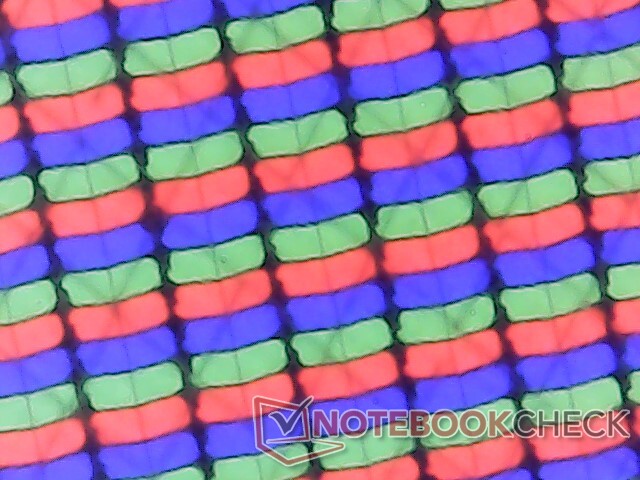
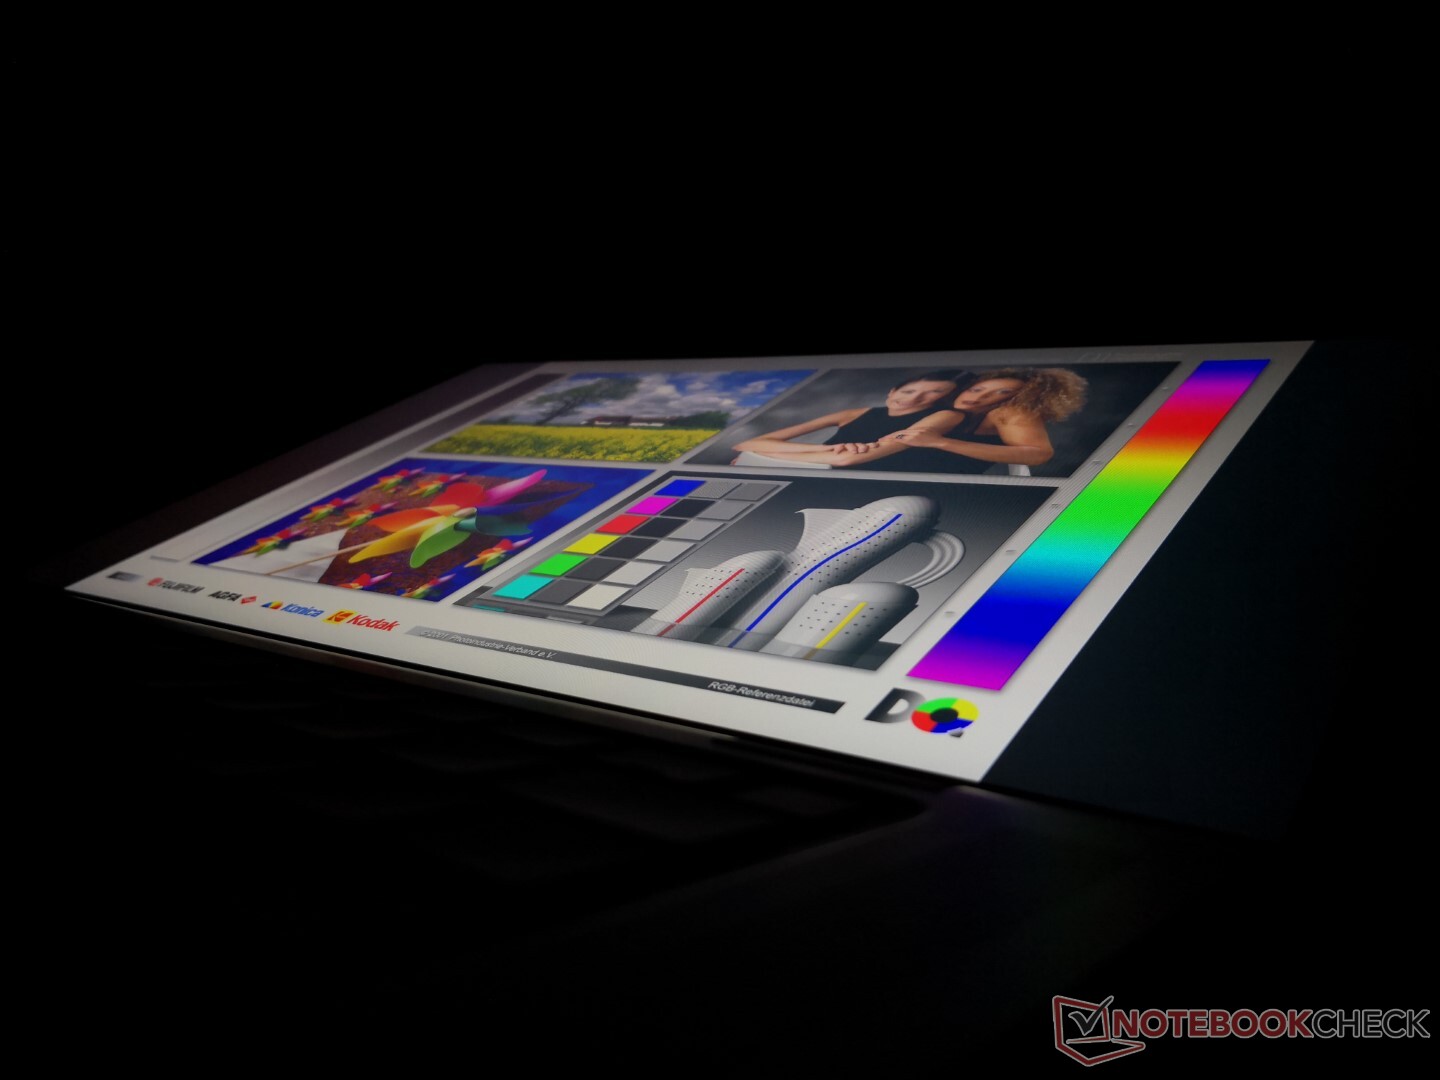
Display
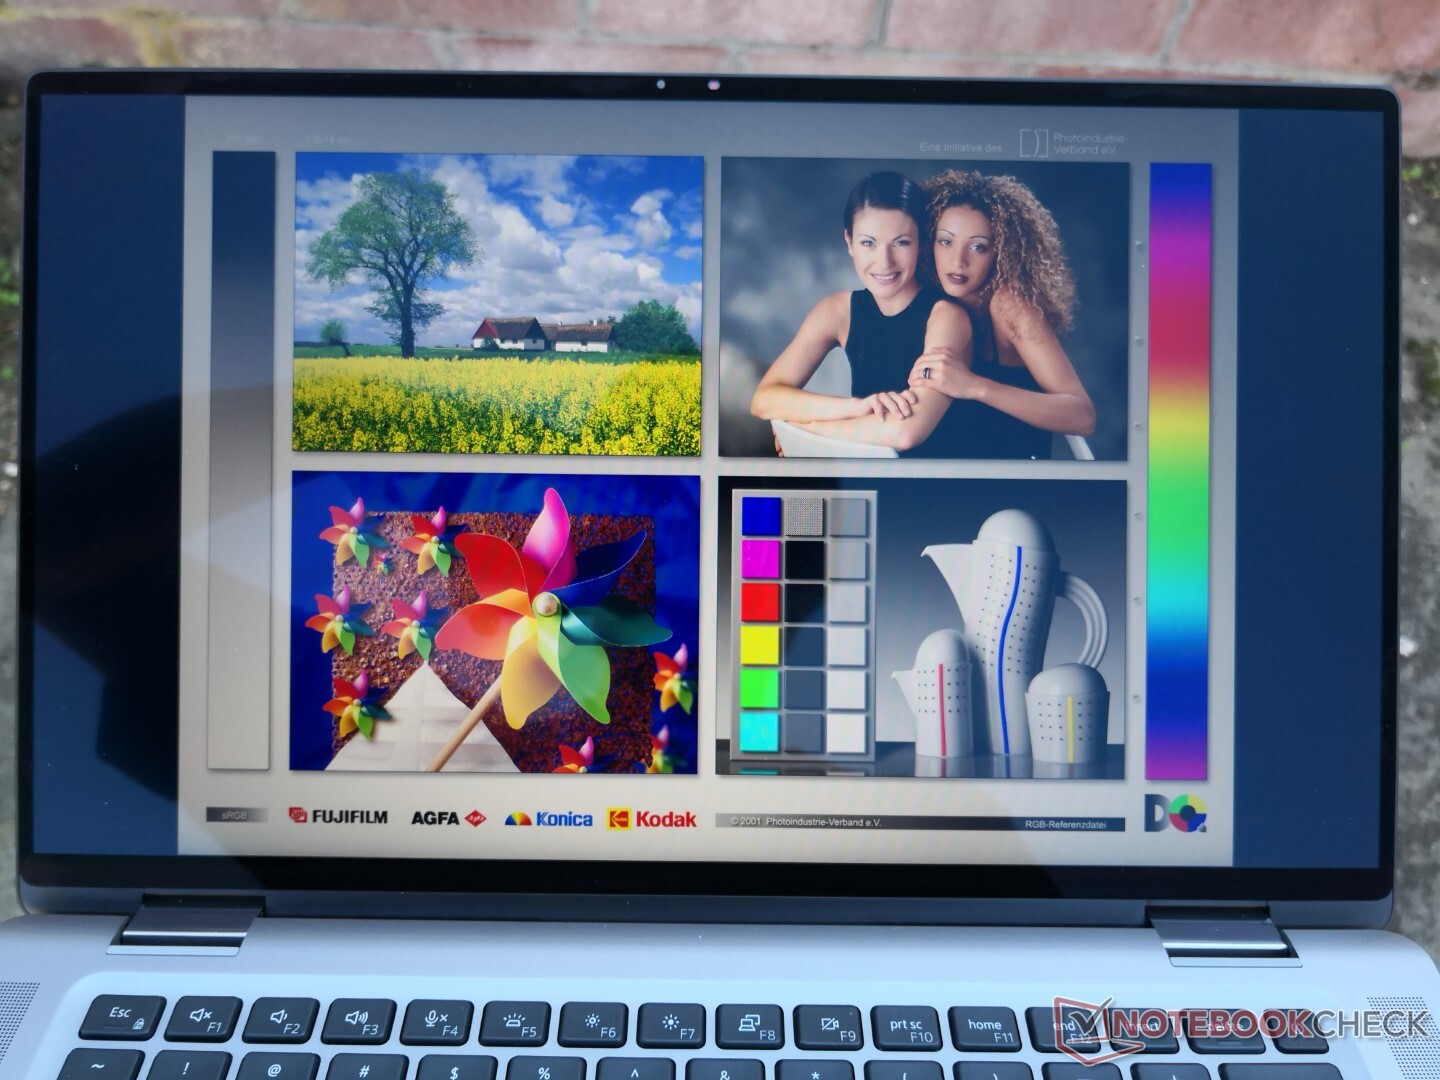
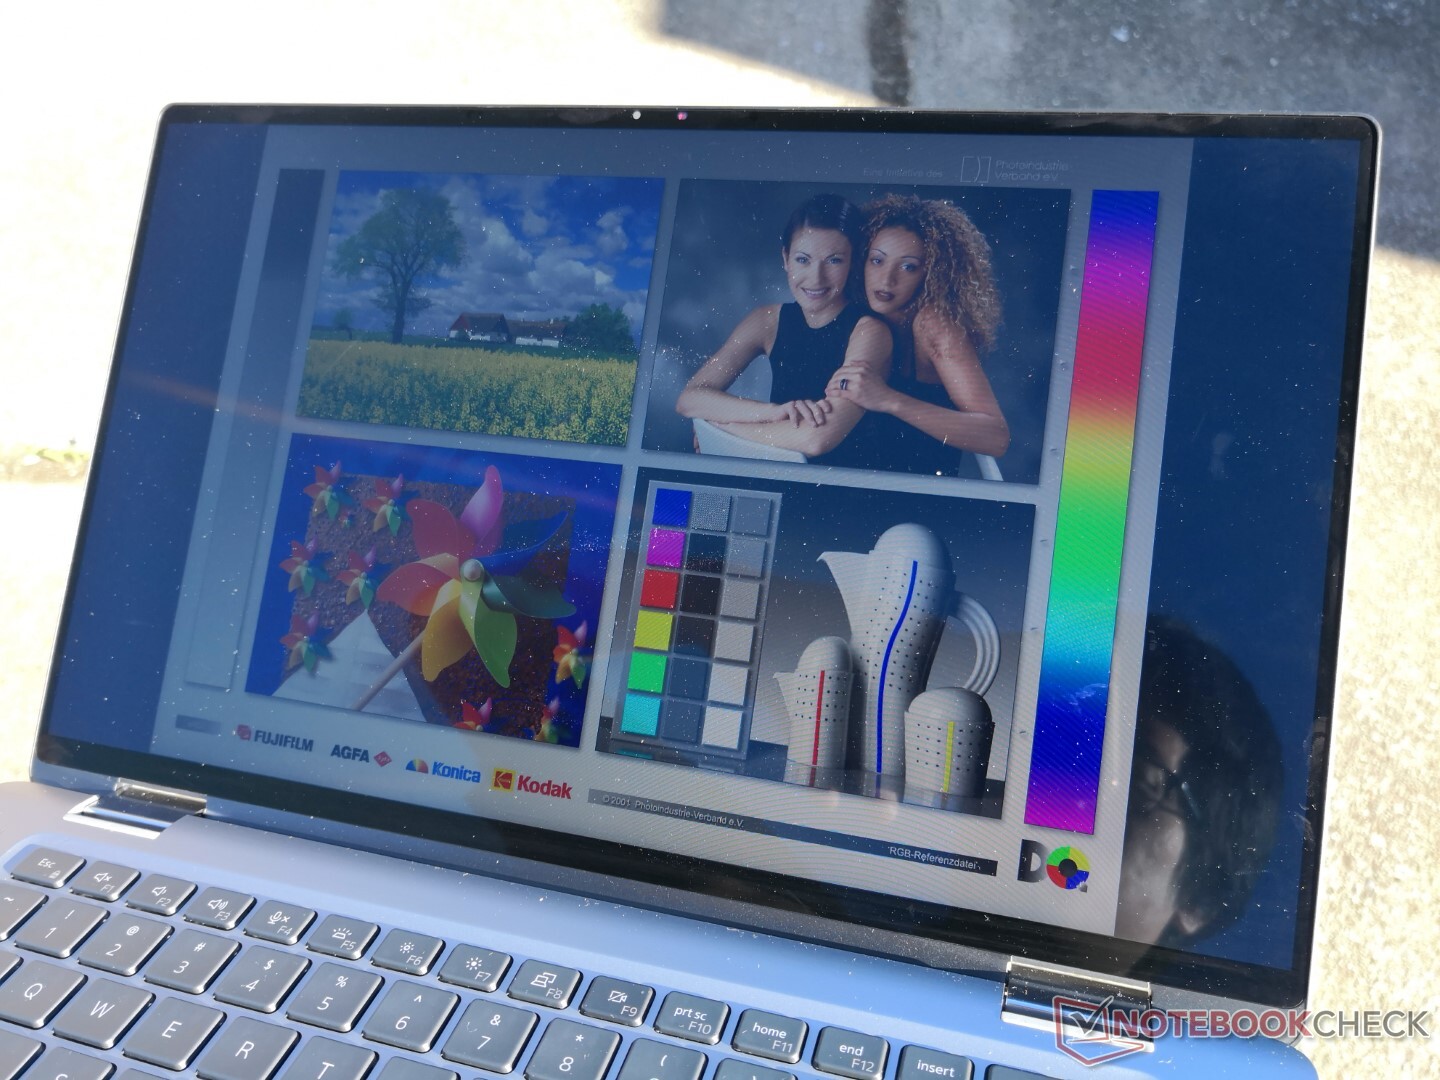
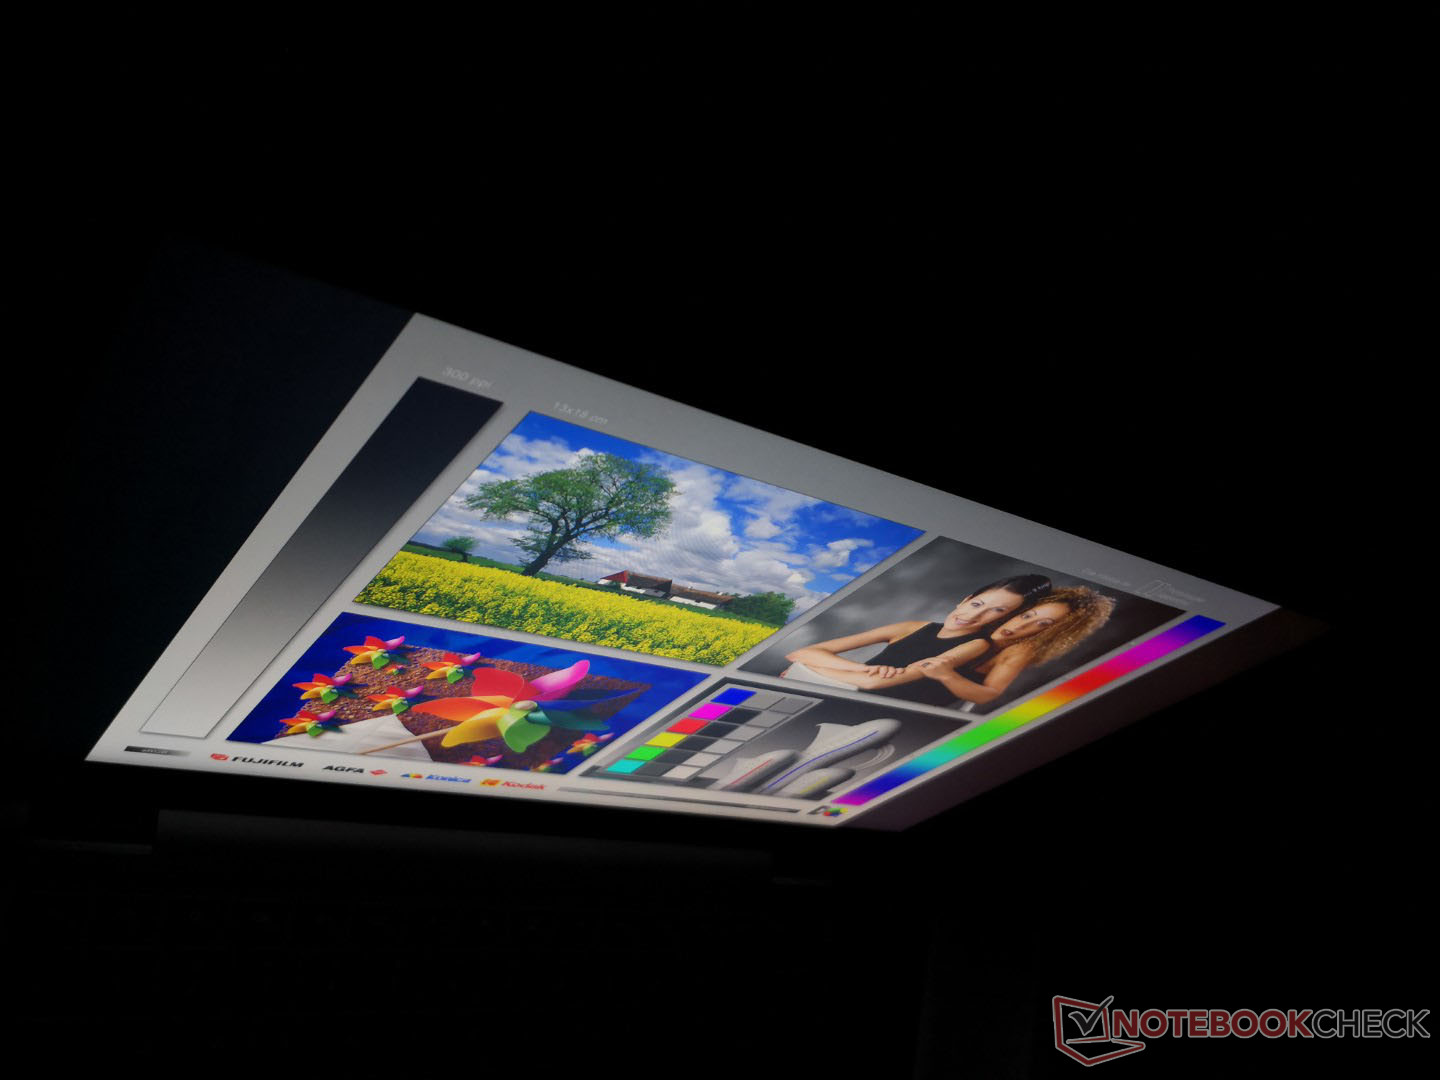
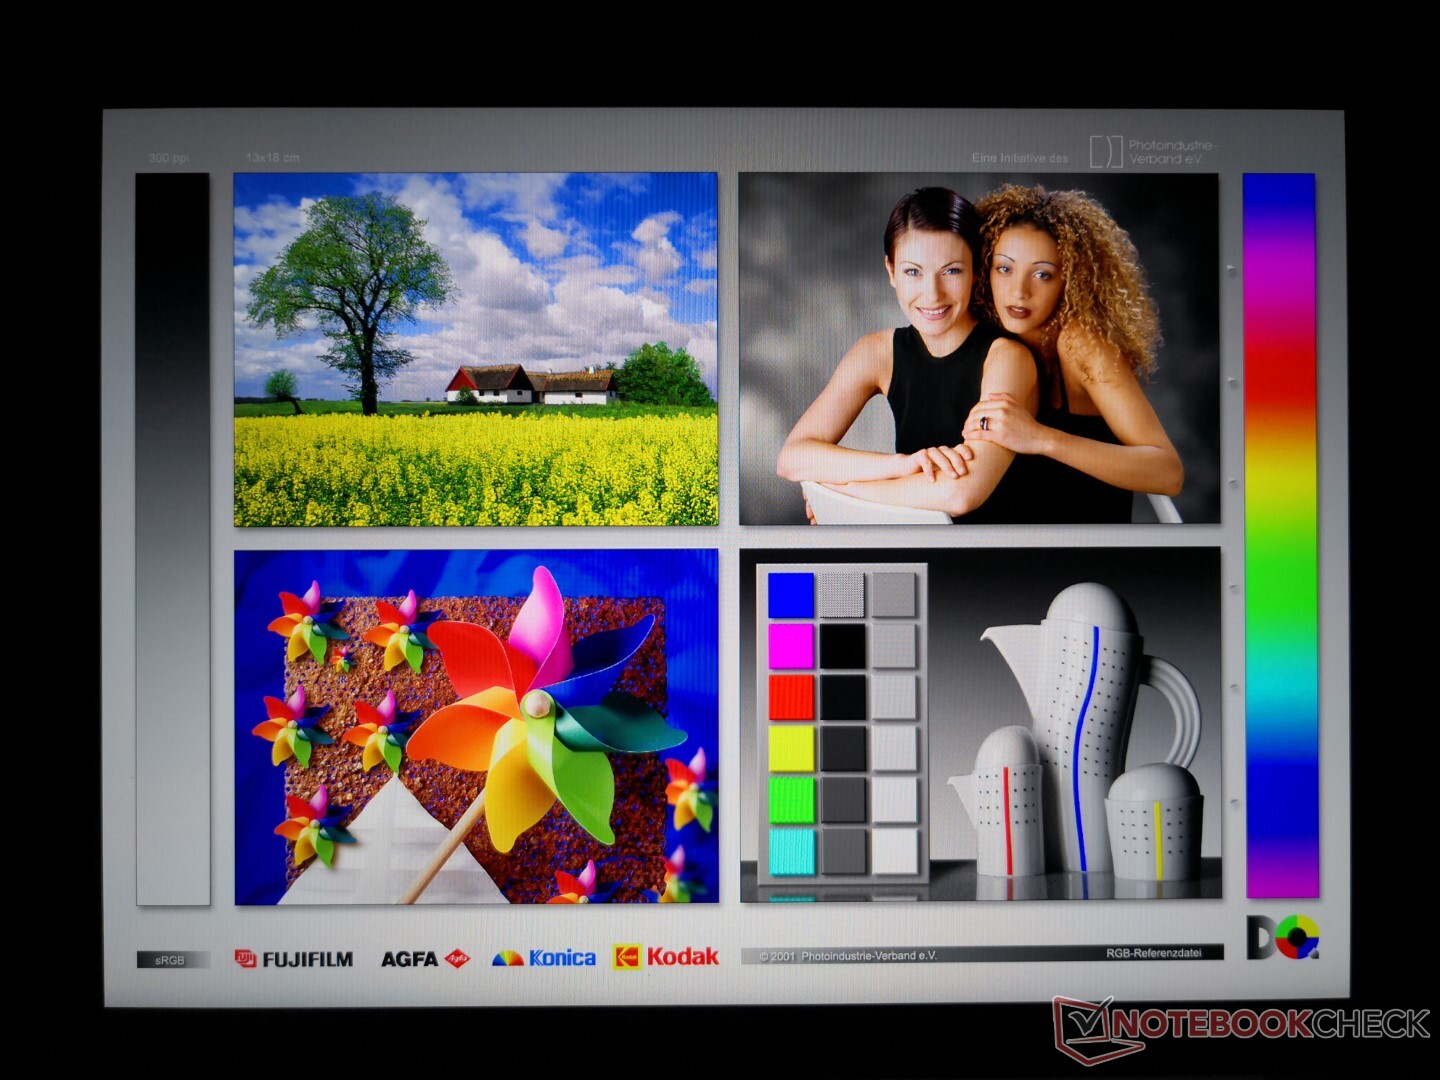
Dell verwendet sowohl beim Latitude 9510 2-in-1 als auch beim 9520 2-in-1 das gleiche AU Optronics B150HAN IPS-Panel für ein ähnliches visuelles Erlebnis. Leider gibt es keine neuen Panel-Optionen für das 9520 2-in-1. 4K- oder OLED-Optionen wären für zukünftige Latitude 2-in-1-Revisionen wünschenswert.
| |||||||||||||||||||||||||
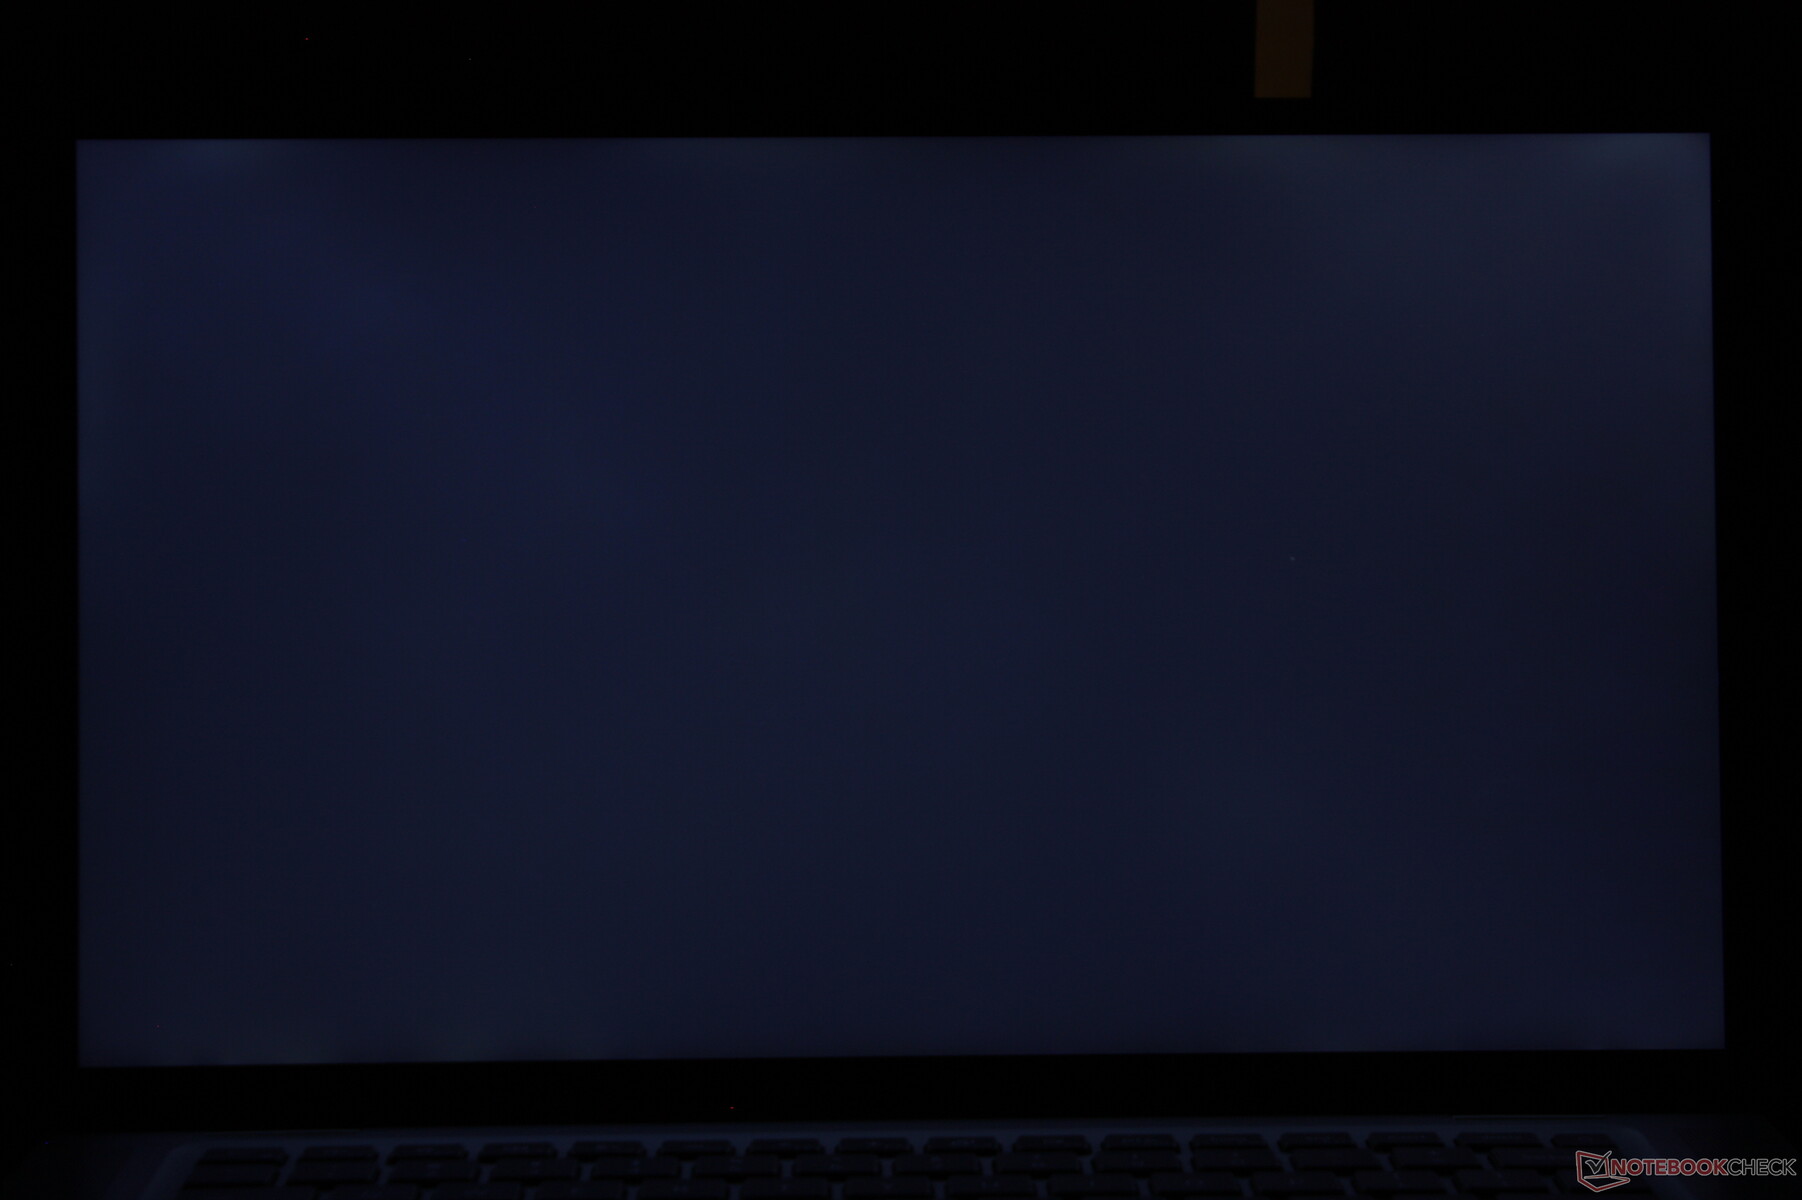
Ausleuchtung: 84 %
Helligkeit Akku: 403.6 cd/m²
Kontrast: 1835:1 (Schwarzwert: 0.22 cd/m²)
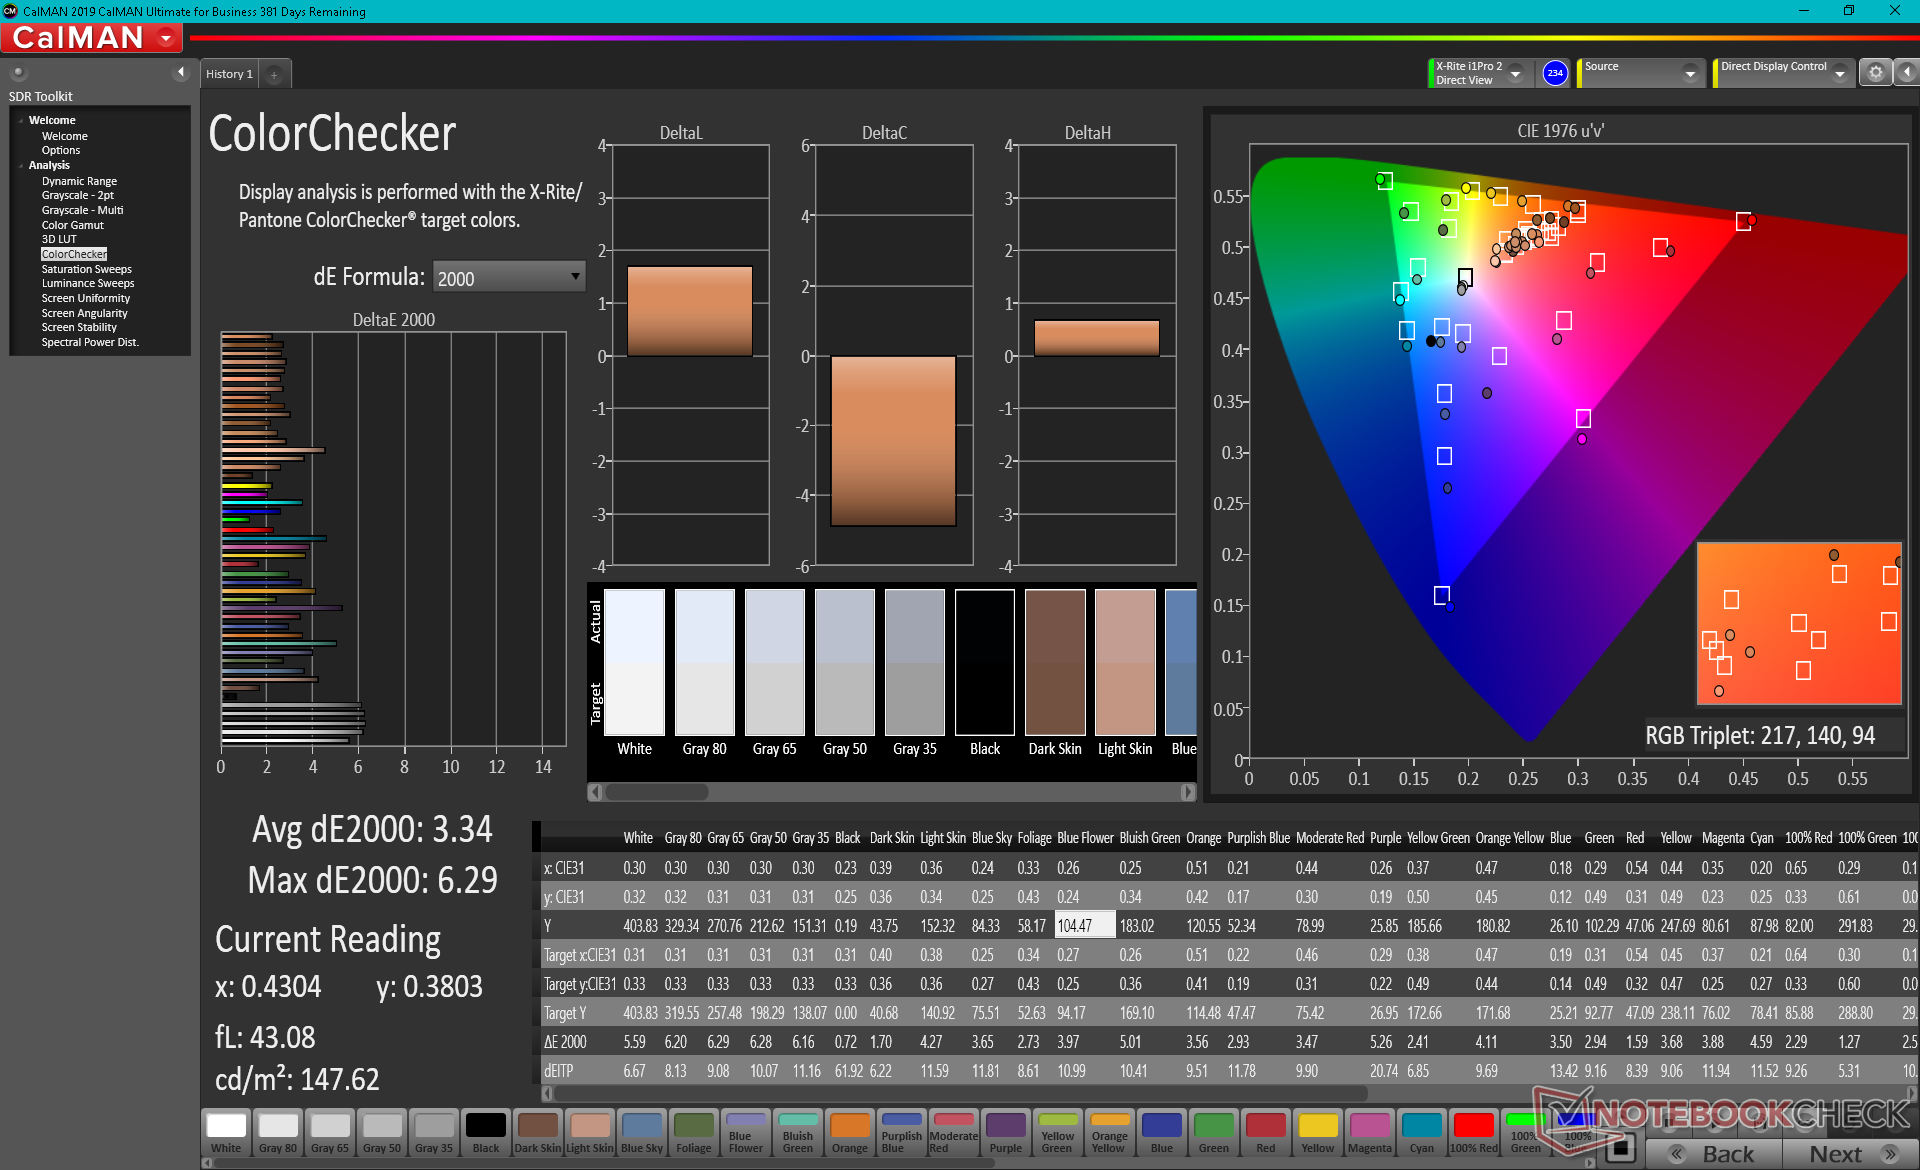
ΔE ColorChecker Calman: 3.34 | ∀{0.5-29.43 Ø4.72}
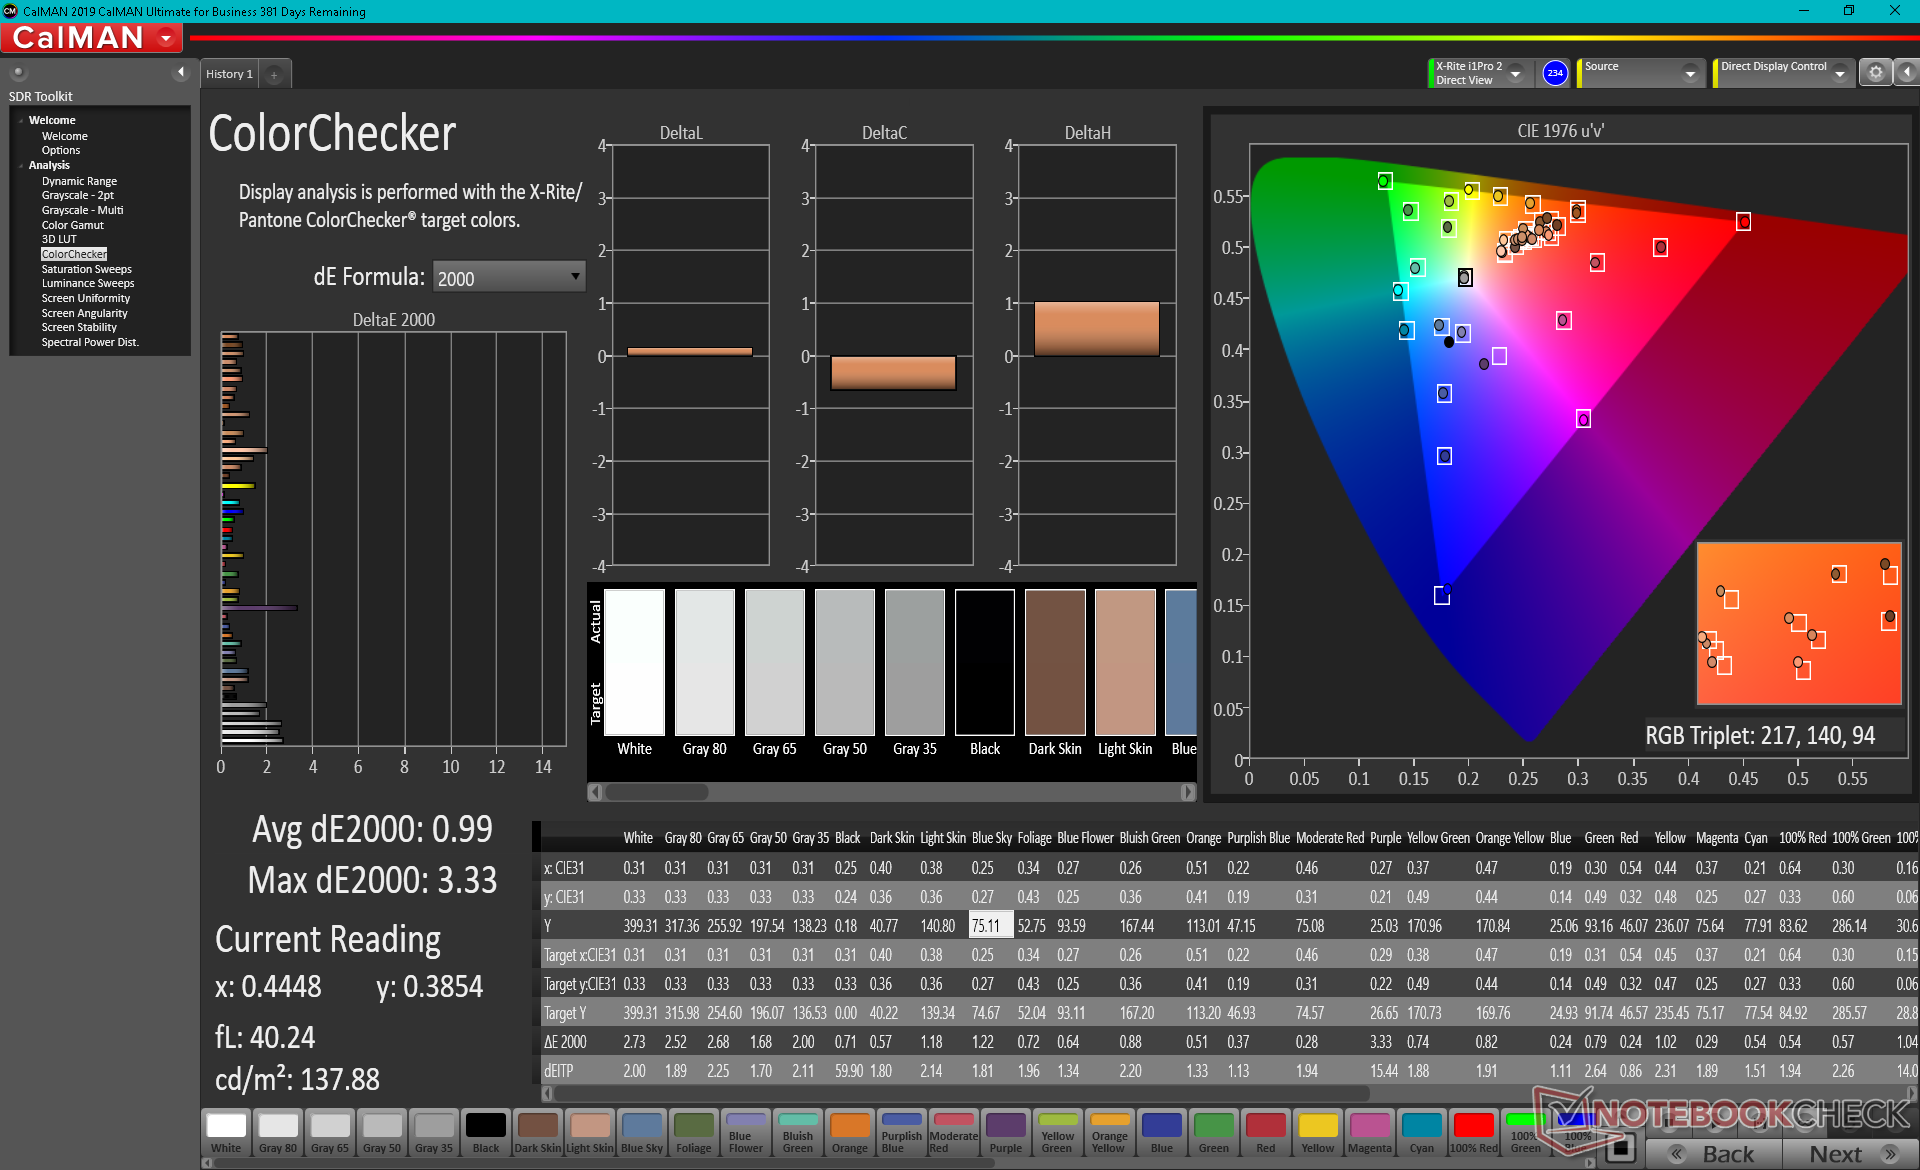
calibrated: 0.99
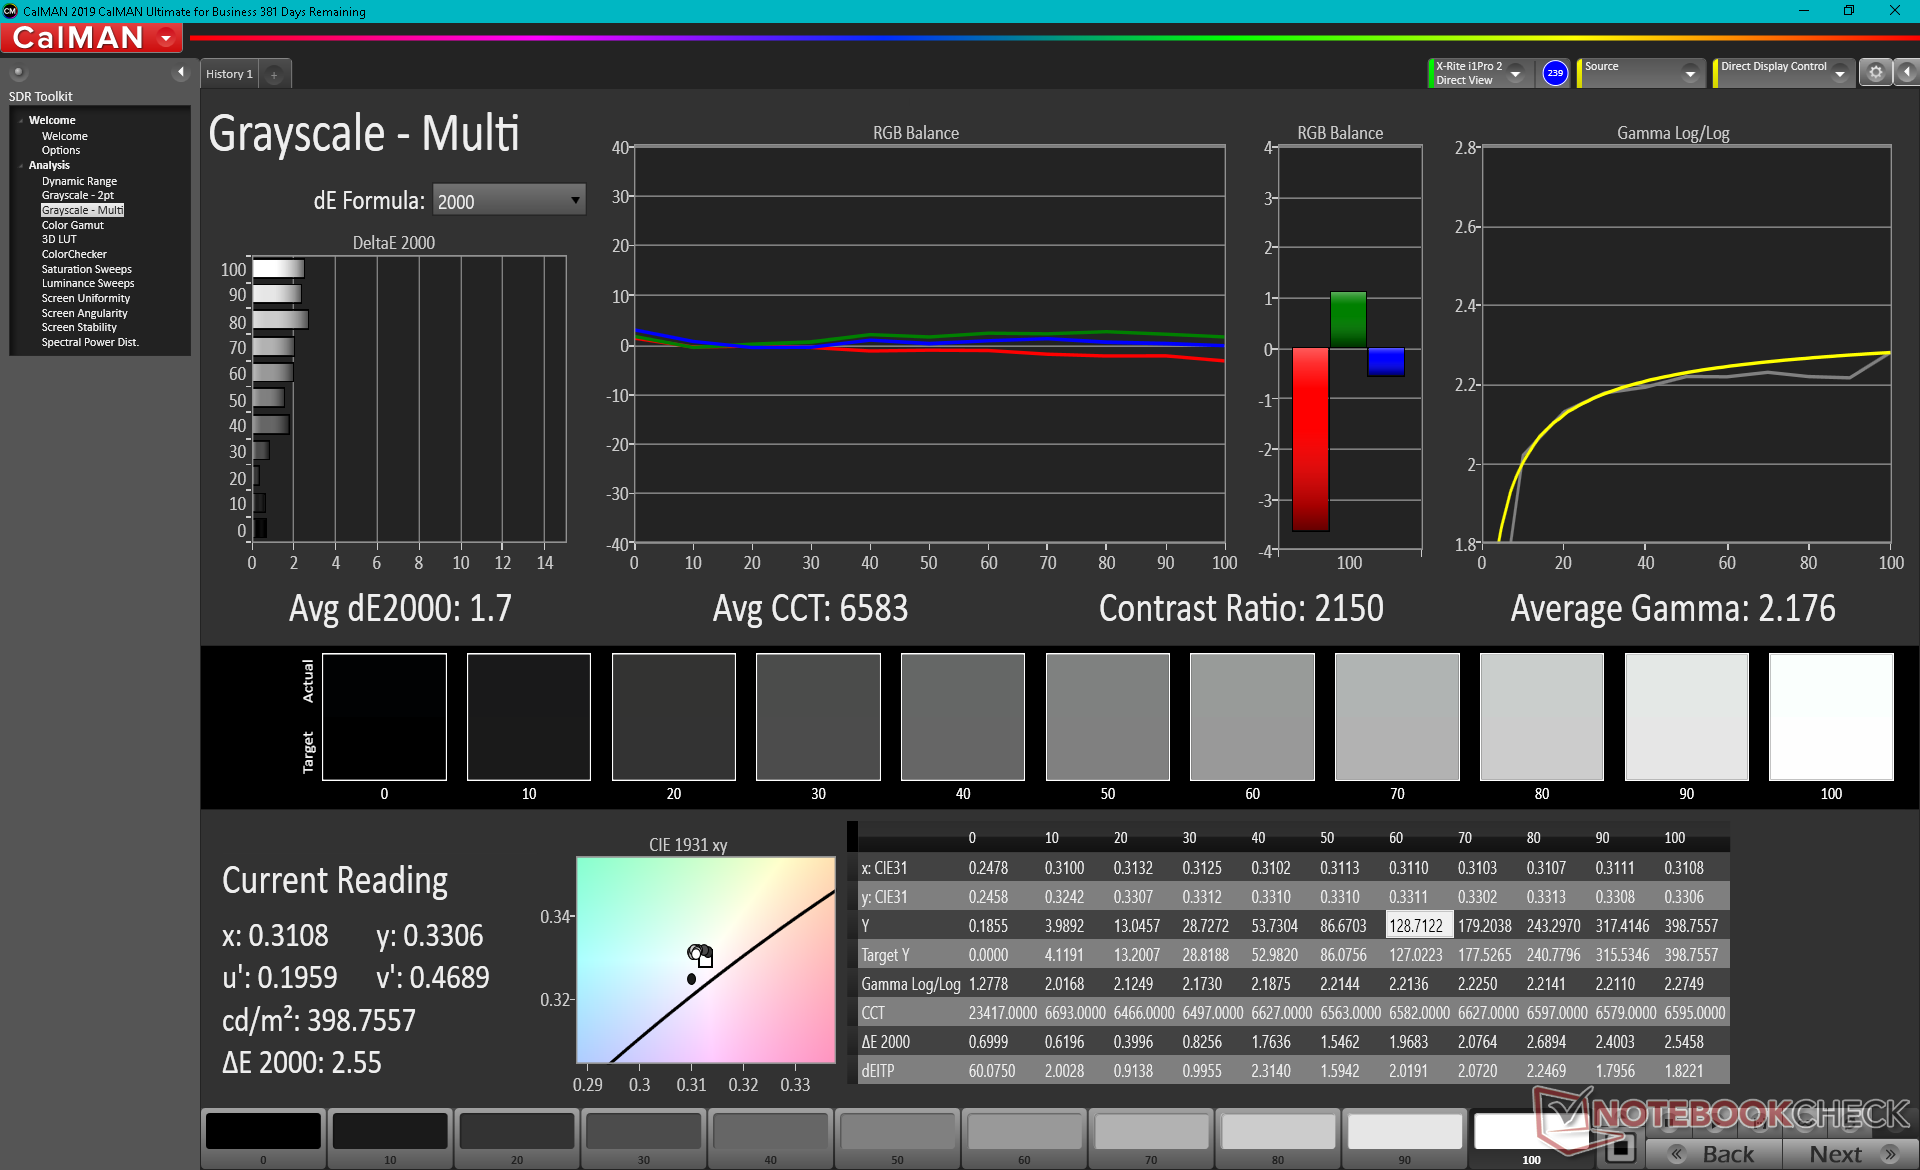
ΔE Greyscale Calman: 5.2 | ∀{0.09-98 Ø4.97}
70.4% AdobeRGB 1998 (Argyll 3D)
98.7% sRGB (Argyll 3D)
69.9% Display P3 (Argyll 3D)
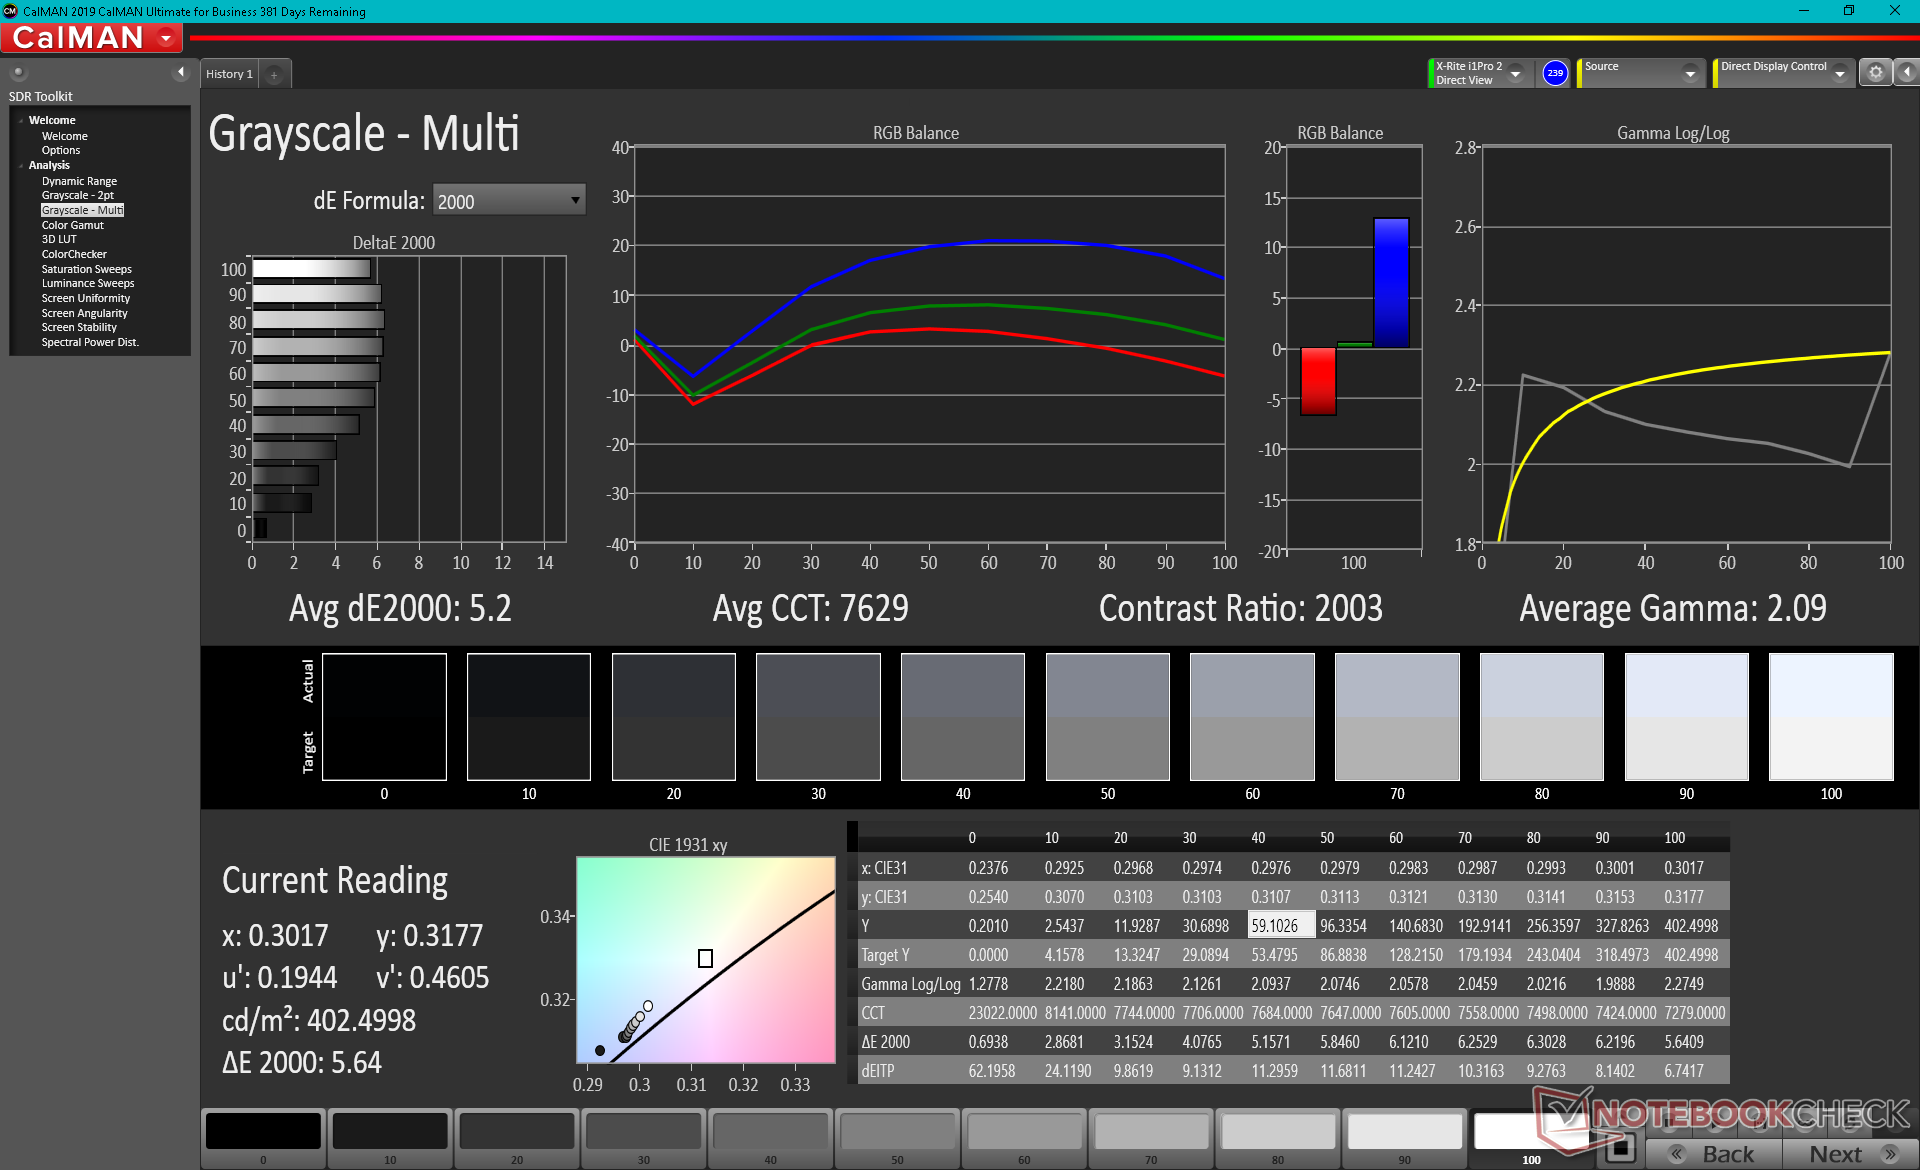
Gamma: 2.09
CCT: 7629 K
| Dell Latitude 15 9520 2-in-1 AU Optronics B150HAN, IPS, 1920x1080, 15" | Dell Latitude 9510 2-in-1 AU Optronics B150HAN, IPS, 1920x1080, 15" | HP EliteBook 850 G8 3C7Z8EA InfoVision X156NVF8 R1, I, 1920x1080, 15.6" | Lenovo ThinkPad L15 G2 AMD N156HCA-EAB, IPS LED, 1920x1080, 15.6" | MSI Summit B15 A11M Chi Mei N156HCE-EN1, IPS, 1920x1080, 15.6" | Microsoft Surface Laptop 4 15 AMD TFF_00028 SHP14B4, IPS, 2496x1664, 15" | |
|---|---|---|---|---|---|---|
| Display | 1% | -6% | -35% | -7% | -4% | |
| Display P3 Coverage (%) | 69.9 | 71.2 2% | 43.8 -37% | 65.7 -6% | 65.2 -7% | |
| sRGB Coverage (%) | 98.7 | 99.3 1% | 95 -4% | 65.7 -33% | 90.6 -8% | 97.7 -1% |
| AdobeRGB 1998 Coverage (%) | 70.4 | 71.3 1% | 65 -8% | 45.3 -36% | 66 -6% | 67.3 -4% |
| Response Times | -27% | -19% | -6% | -11% | -32% | |
| Response Time Grey 50% / Grey 80% * (ms) | 39.2 ? | 52.8 ? -35% | 47 ? -20% | 40 -2% | 40.4 ? -3% | 58.4 ? -49% |
| Response Time Black / White * (ms) | 27.2 ? | 32 ? -18% | 32 ? -18% | 30 -10% | 32.4 ? -19% | 31.2 ? -15% |
| PWM Frequency (Hz) | 312 ? | 25510 ? | 21550 ? | |||
| Bildschirm | -27% | 7% | -49% | -71% | 6% | |
| Helligkeit Bildmitte (cd/m²) | 403.6 | 426.7 6% | 802 99% | 298 -26% | 341.3 -15% | 405 0% |
| Brightness (cd/m²) | 368 | 394 7% | 702 91% | 276 -25% | 310 -16% | 379 3% |
| Brightness Distribution (%) | 84 | 87 4% | 77 -8% | 86 2% | 81 -4% | 79 -6% |
| Schwarzwert * (cd/m²) | 0.22 | 0.3 -36% | 0.245 -11% | 0.26 -18% | 0.45 -105% | 0.26 -18% |
| Kontrast (:1) | 1835 | 1422 -23% | 3273 78% | 1146 -38% | 758 -59% | 1558 -15% |
| Delta E Colorchecker * | 3.34 | 4.28 -28% | 6.22 -86% | 3.7 -11% | 6.17 -85% | 2.6 22% |
| Colorchecker dE 2000 max. * | 6.29 | 10.43 -66% | 9.92 -58% | 15 -138% | 11.75 -87% | 6.6 -5% |
| Colorchecker dE 2000 calibrated * | 0.99 | 1.46 -47% | 3.5 -254% | 3.3 -233% | 0.9 9% | |
| Delta E Graustufen * | 5.2 | 8.1 -56% | 7.69 -48% | 1.7 67% | 7.1 -37% | 1.9 63% |
| Gamma | 2.09 105% | 2.26 97% | 2.75 80% | 2.21 100% | 2.2 100% | 2.11 104% |
| CCT | 7629 85% | 7993 81% | 6135 106% | 6588 99% | 6842 95% | 6825 95% |
| Farbraum (Prozent von AdobeRGB 1998) (%) | 65.2 | 65 | 58.7 | 62 | ||
| Color Space (Percent of sRGB) (%) | 99.2 | 95 | 90.1 | 97.7 | ||
| Durchschnitt gesamt (Programm / Settings) | -18% /
-21% | -6% /
1% | -30% /
-40% | -30% /
-49% | -10% /
-2% |
* ... kleinere Werte sind besser
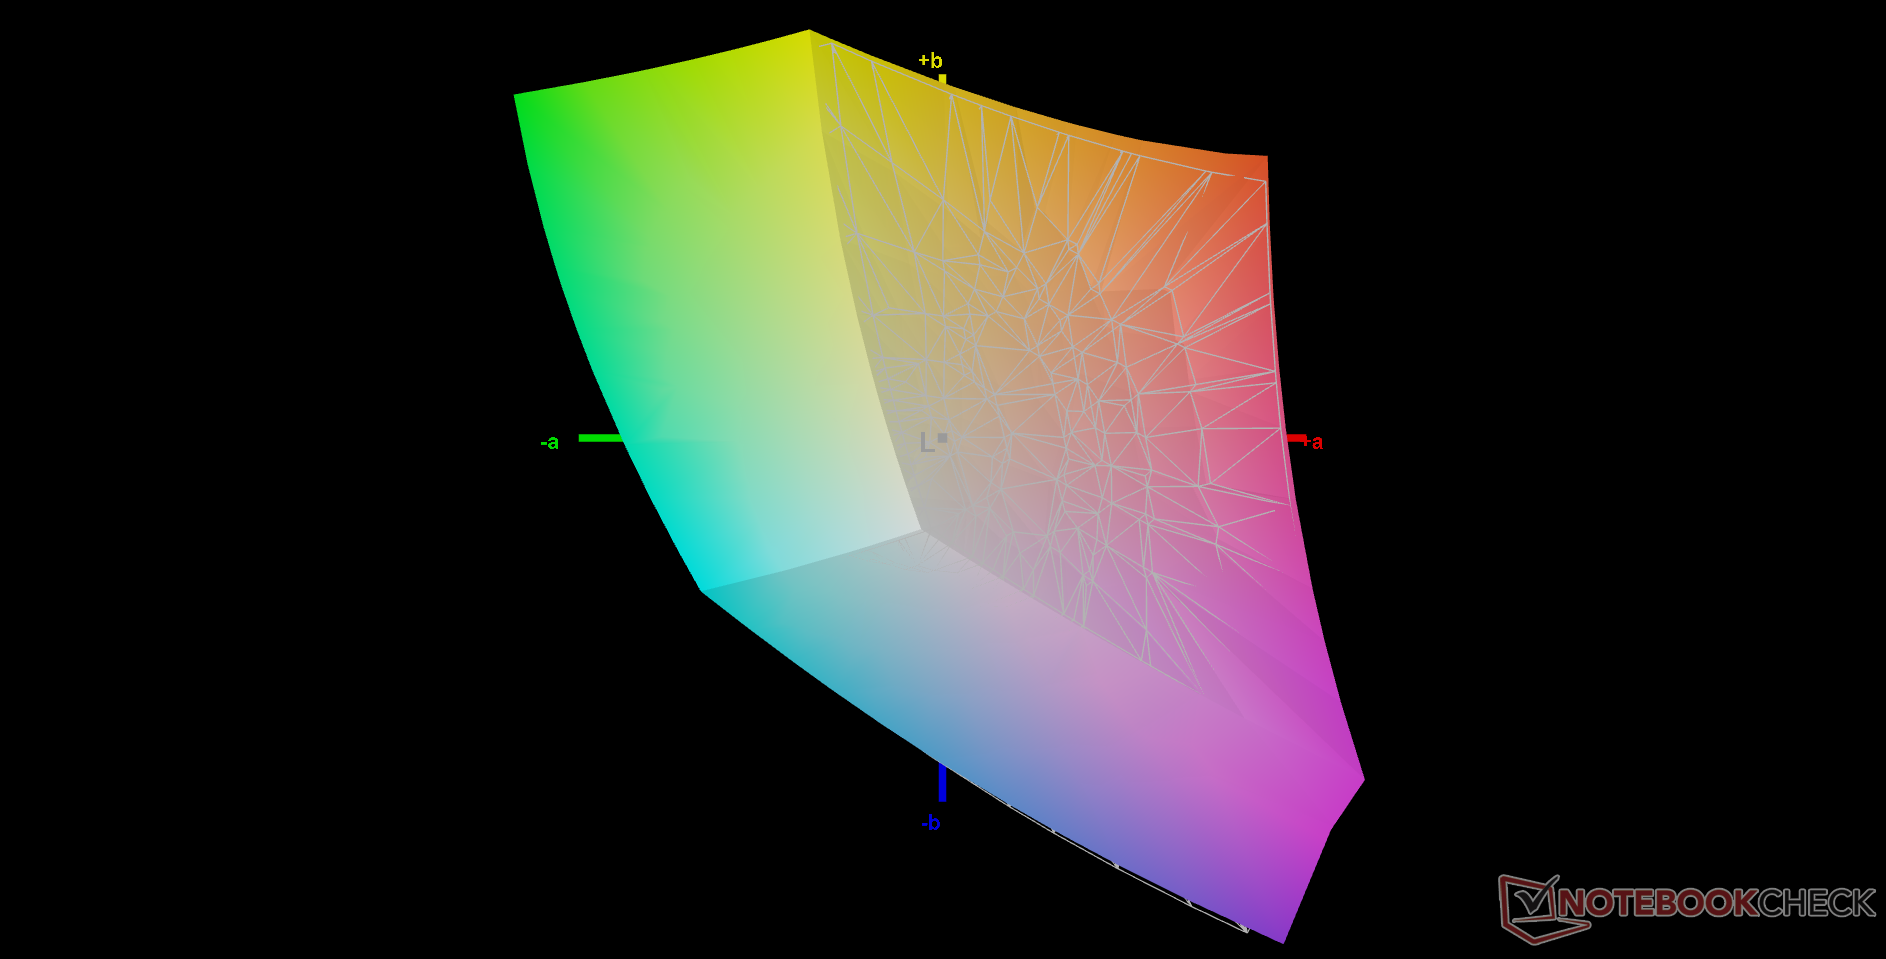
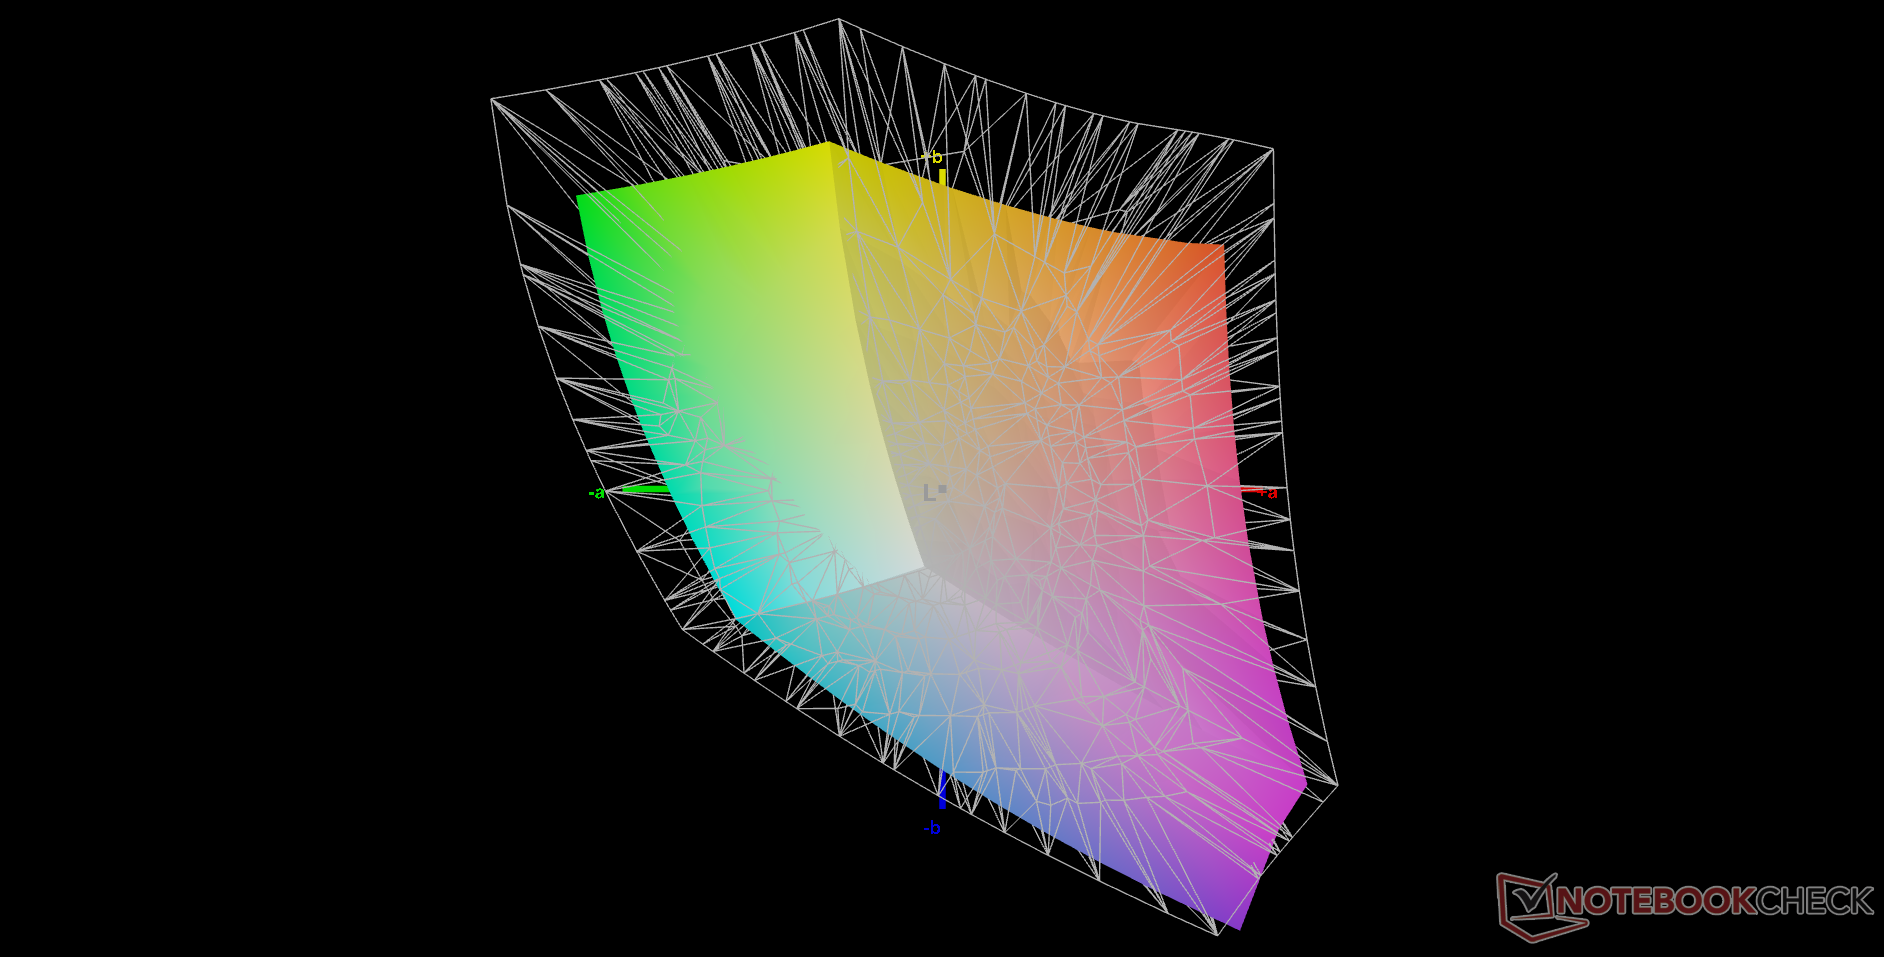
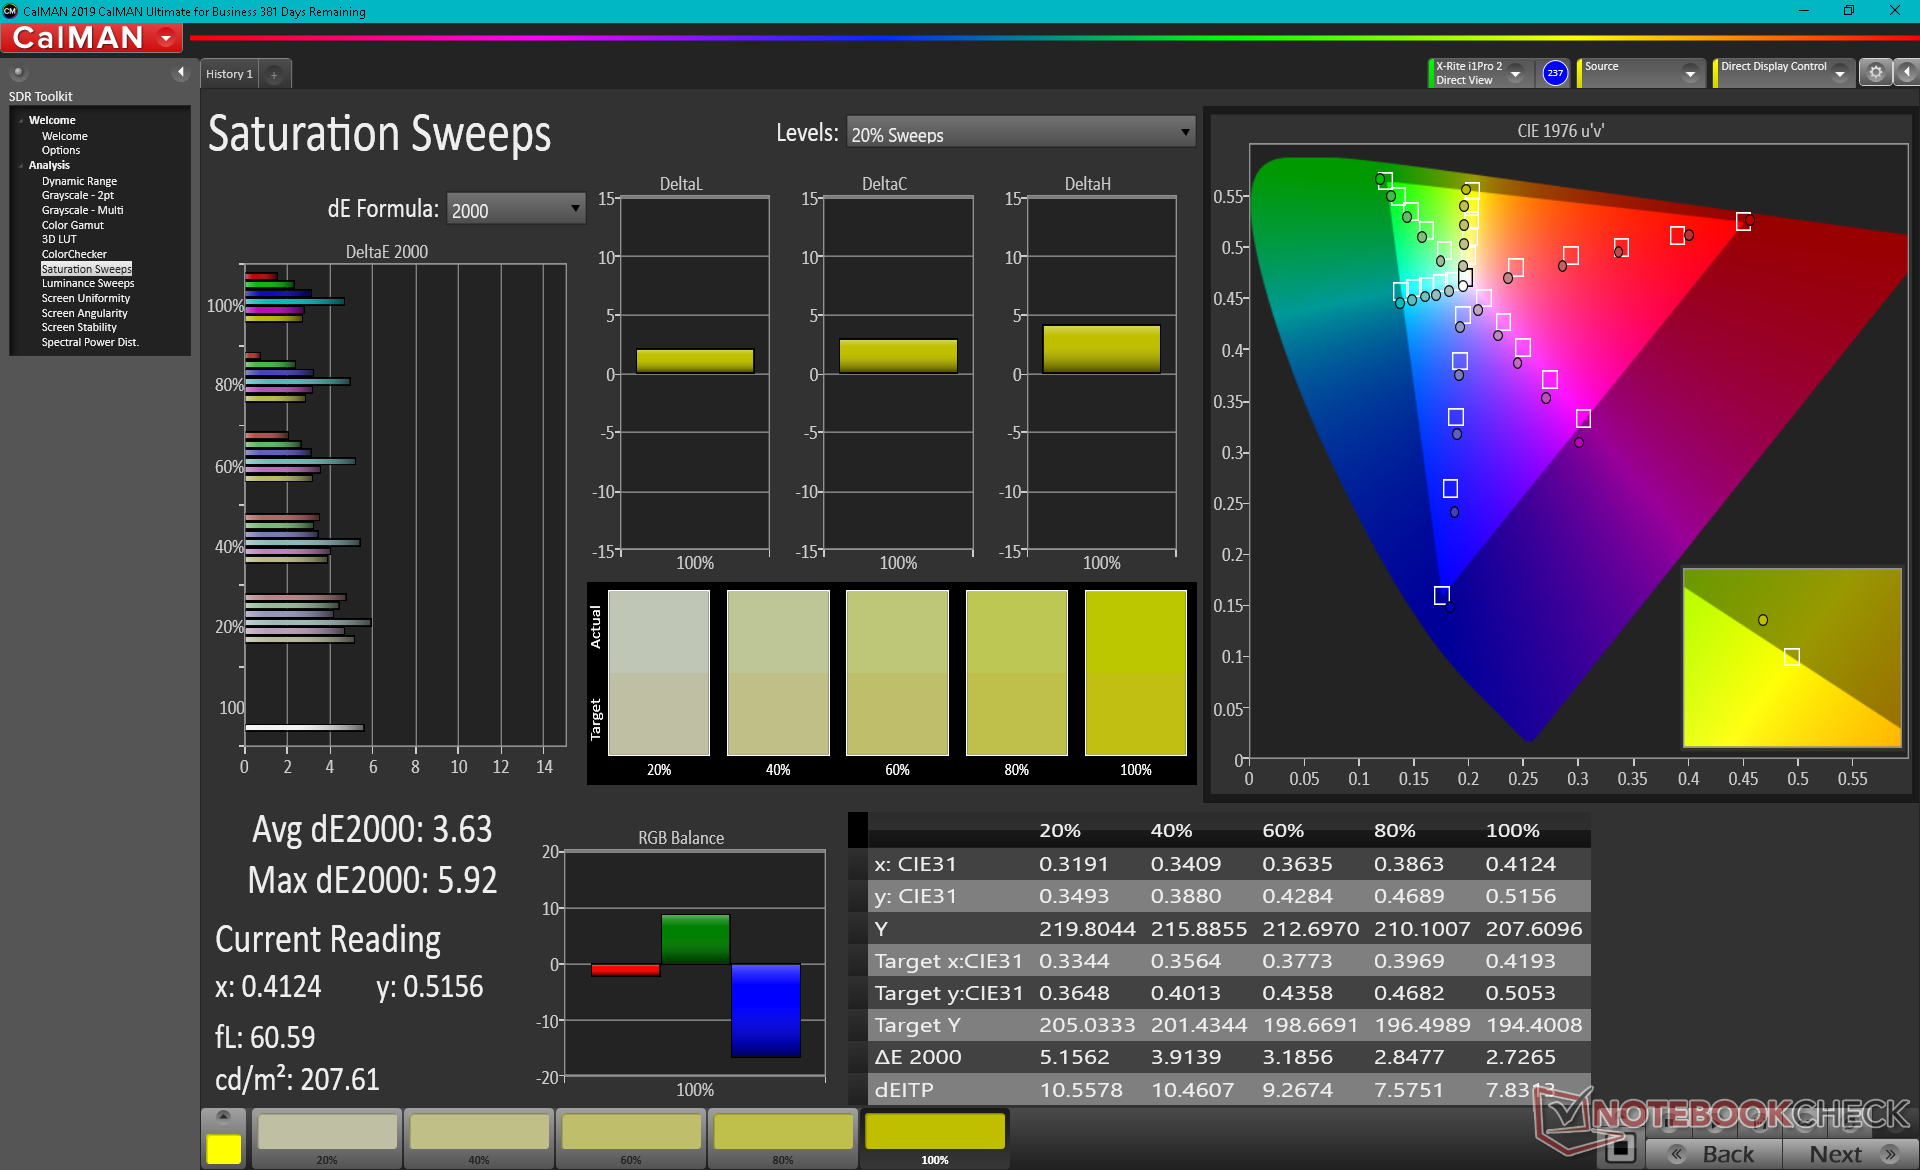
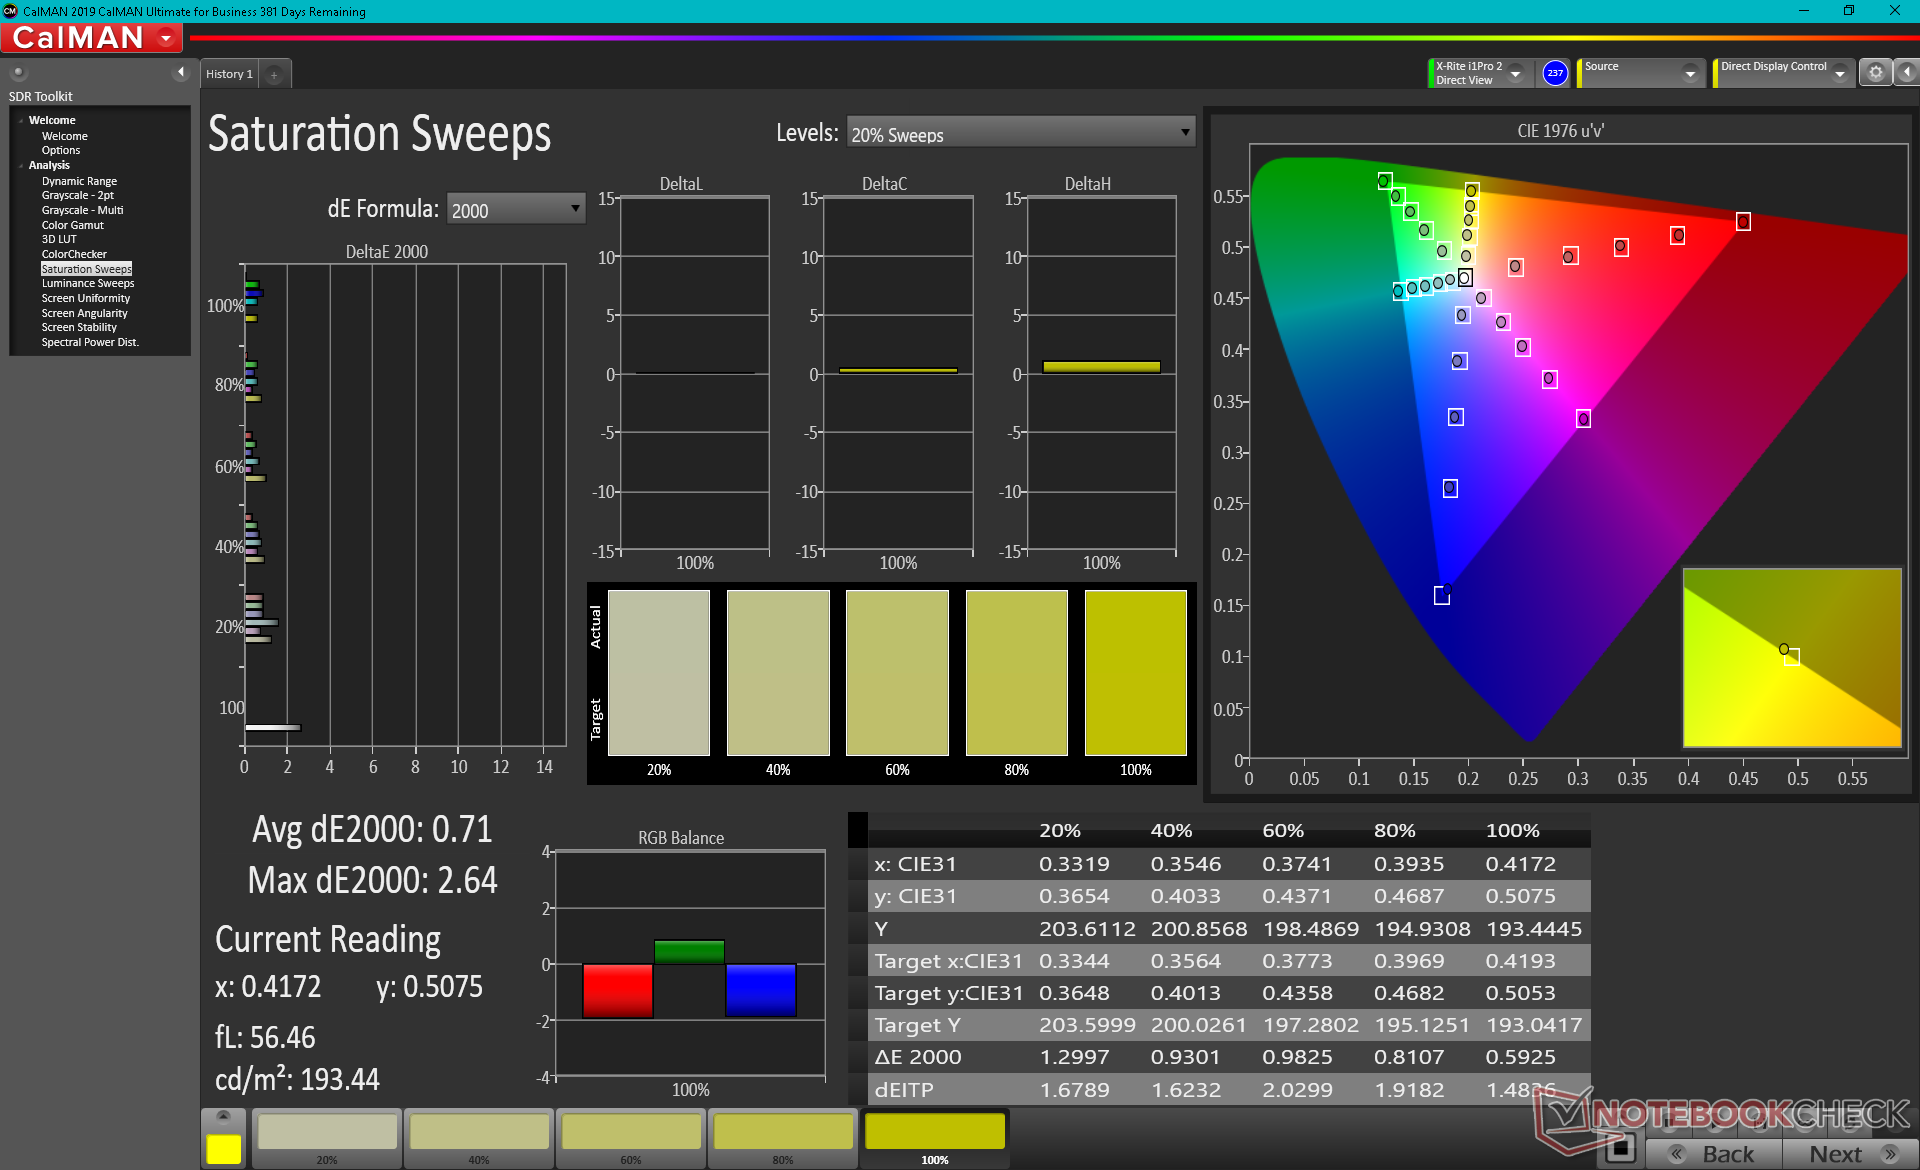
Das Display ist anständig kalibriert mit durchschnittlichen Graustufen- und Farb-DeltaE-Werten von nur 5,2 bzw. 3,34. Eine eigenmächtige Kalibrierung kann diese Werte auf deutlich unter <2 reduzieren, wie unsere CalMAN-Screenshots unten zeigen.
Reaktionszeiten (Response Times) des Displays
| ↔ Reaktionszeiten Schwarz zu Weiß | ||
|---|---|---|
| 27.2 ms ... steigend ↗ und fallend ↘ kombiniert | ↗ 14 ms steigend | 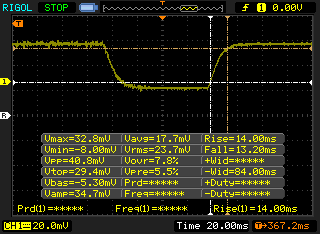 |
| ↘ 13.2 ms fallend | ||
| Die gemessenen Reaktionszeiten sind mittelmäßig und dadurch für Spieler eventuell zu langsam. Im Vergleich rangierten die bei uns getesteten Geräte von 0.1 (Minimum) zu 240 (Maximum) ms. » 69 % aller Screens waren schneller als der getestete. Daher sind die gemessenen Reaktionszeiten schlechter als der Durchschnitt aller vermessenen Geräte (19.8 ms). | ||
| ↔ Reaktionszeiten 50% Grau zu 80% Grau | ||
| 39.2 ms ... steigend ↗ und fallend ↘ kombiniert | ↗ 19.2 ms steigend | 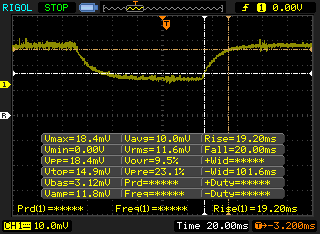 |
| ↘ 20 ms fallend | ||
| Die gemessenen Reaktionszeiten sind langsam und dadurch für viele Spieler wahrscheinlich zu langsam. Im Vergleich rangierten die bei uns getesteten Geräte von 0.165 (Minimum) zu 636 (Maximum) ms. » 60 % aller Screens waren schneller als der getestete. Daher sind die gemessenen Reaktionszeiten schlechter als der Durchschnitt aller vermessenen Geräte (31 ms). | ||
Bildschirm-Flackern / PWM (Pulse-Width Modulation)
| Flackern / PWM nicht festgestellt | 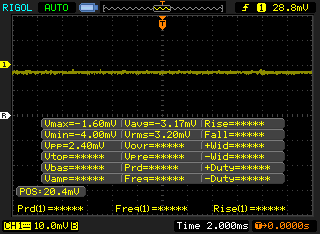 | ||
Im Vergleich: 52 % aller getesteten Geräte nutzten kein PWM um die Helligkeit zu reduzieren. Wenn PWM eingesetzt wurde, dann bei einer Frequenz von durchschnittlich 7765 (Minimum 5, Maximum 343500) Hz. | |||
Performance
Testbedingungen
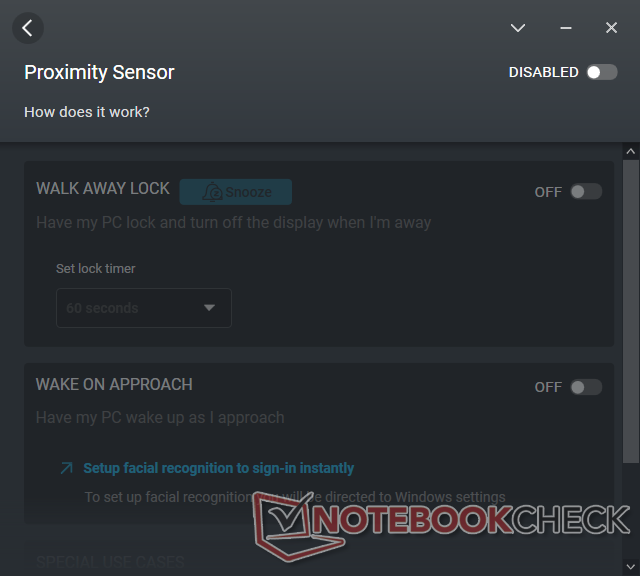
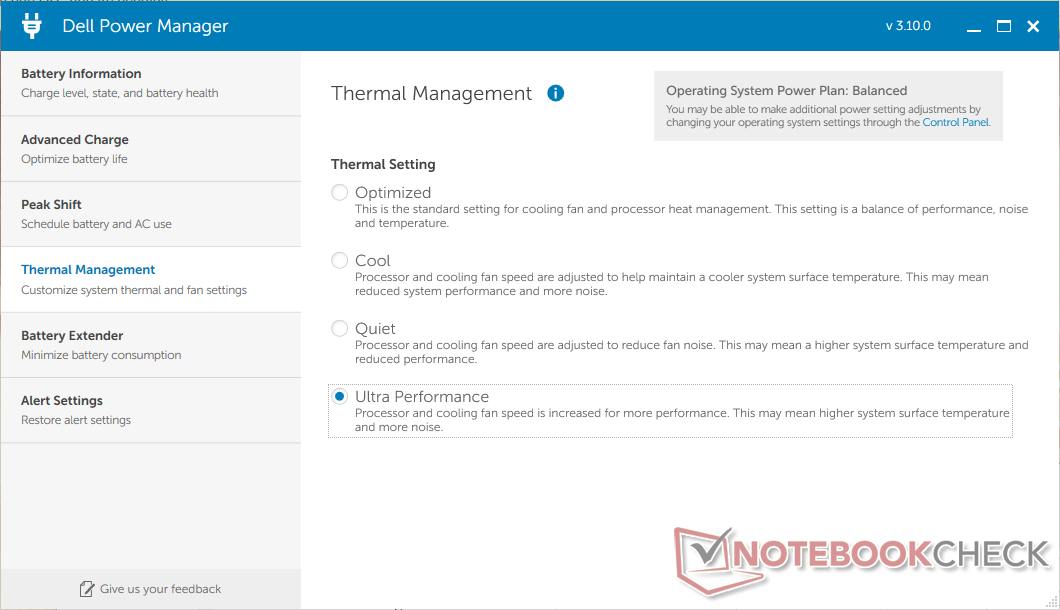
Unser System war auf den Windows-Modus "Best Performance" und mit dem Dell Power Manager auf "Ultra Performance " eingestellt, bevor wir die folgenden Benchmarks durchführten, um die höchstmöglichen Ergebnisse zu erzielen. User sollten sich auch mit der vorinstallierten Dell Optimizer Software vertraut machen, die zusätzliche Einstellungen für Audio, Netzwerk und den Näherungssensor für die freihändige Anmeldung enthält.

Prozessor
Die Multi-Thread-CPU-Leistung ist eine gemischte Sache, da der Core i7-1185G7 zwei Kerne weniger hat als der letztjährige Core i7-10810U, was einer Verschlechterung von etwa 25 bis 35 Prozent entspricht. Das Delta ist größer als erwartet, da der i7-1185G7 in unserem Latitude 9520 2-in-1 mindestens 15 bis 20 Prozent langsamer ist als die meisten anderen Laptops mit der exakt gleichen CPU. Die Core i7-1185G7 CPU im MSI Stealth 15M kann zum Beispiel eine bis zu 50 % schnellere Multi-Thread-Leistung als unser Dell bieten.
Die Single-Thread-Leistung ist glücklicherweise dort, wo sie im Vergleich zum durchschnittlichen Core i7-1185G7 sein sollte. Hier können Nutzer eine rund 30 Prozent schnellere Leistung als beim Core i7-10810U erwarten.
Cinebench R15 Multi Loop
Cinebench R23: Multi Core | Single Core
Cinebench R20: CPU (Multi Core) | CPU (Single Core)
Cinebench R15: CPU Multi 64Bit | CPU Single 64Bit
Blender: v2.79 BMW27 CPU
7-Zip 18.03: 7z b 4 | 7z b 4 -mmt1
Geekbench 5.5: Multi-Core | Single-Core
HWBOT x265 Benchmark v2.2: 4k Preset
LibreOffice : 20 Documents To PDF
R Benchmark 2.5: Overall mean
| CPU Performance Rating | |
| HP Pavilion Aero 13 be0097nr -2! | |
| Lenovo ThinkPad E15 G3-20YG003UGE | |
| Microsoft Surface Laptop 4 15 AMD TFF_00028 | |
| Lenovo ThinkPad L15 G2 AMD | |
| MSI Prestige 15 A10SC -10! | |
| Durchschnittliche Intel Core i7-1185G7 | |
| HP EliteBook 850 G8 3C7Z8EA | |
| Asus ZenBook 15 UX534FT-DB77 -10! | |
| Dell Latitude 15 9520 2-in-1 -2! | |
| Asus ExpertBook B1 B1500CEAE, i5-1135G7 | |
| Samsung Galaxy Book Flex 15-NP950 -2! | |
| Dell Latitude 9510 2-in-1 -2! | |
| LG Gram 15Z90N -3! | |
| Cinebench R23 / Multi Core | |
| Microsoft Surface Laptop 4 15 AMD TFF_00028 | |
| Lenovo ThinkPad E15 G3-20YG003UGE | |
| HP Pavilion Aero 13 be0097nr | |
| Lenovo ThinkPad L15 G2 AMD | |
| Durchschnittliche Intel Core i7-1185G7 (3610 - 6383, n=24) | |
| HP EliteBook 850 G8 3C7Z8EA | |
| Dell Latitude 15 9520 2-in-1 | |
| Asus ExpertBook B1 B1500CEAE, i5-1135G7 | |
| Cinebench R23 / Single Core | |
| HP EliteBook 850 G8 3C7Z8EA | |
| Durchschnittliche Intel Core i7-1185G7 (1251 - 1532, n=24) | |
| HP Pavilion Aero 13 be0097nr | |
| Dell Latitude 15 9520 2-in-1 | |
| Lenovo ThinkPad L15 G2 AMD | |
| Microsoft Surface Laptop 4 15 AMD TFF_00028 | |
| Lenovo ThinkPad E15 G3-20YG003UGE | |
| Asus ExpertBook B1 B1500CEAE, i5-1135G7 | |
| Geekbench 5.5 / Multi-Core | |
| Microsoft Surface Laptop 4 15 AMD TFF_00028 | |
| Lenovo ThinkPad E15 G3-20YG003UGE | |
| HP EliteBook 850 G8 3C7Z8EA | |
| Durchschnittliche Intel Core i7-1185G7 (4620 - 5944, n=21) | |
| Lenovo ThinkPad L15 G2 AMD | |
| Samsung Galaxy Book Flex 15-NP950 | |
| Asus ExpertBook B1 B1500CEAE, i5-1135G7 | |
| Dell Latitude 9510 2-in-1 | |
| LG Gram 15Z90N | |
| Geekbench 5.5 / Single-Core | |
| HP EliteBook 850 G8 3C7Z8EA | |
| Durchschnittliche Intel Core i7-1185G7 (1398 - 1626, n=21) | |
| Lenovo ThinkPad L15 G2 AMD | |
| Asus ExpertBook B1 B1500CEAE, i5-1135G7 | |
| Samsung Galaxy Book Flex 15-NP950 | |
| Dell Latitude 9510 2-in-1 | |
| Lenovo ThinkPad E15 G3-20YG003UGE | |
| LG Gram 15Z90N | |
| Microsoft Surface Laptop 4 15 AMD TFF_00028 | |
| HWBOT x265 Benchmark v2.2 / 4k Preset | |
| HP Pavilion Aero 13 be0097nr | |
| Lenovo ThinkPad E15 G3-20YG003UGE | |
| Microsoft Surface Laptop 4 15 AMD TFF_00028 | |
| Lenovo ThinkPad L15 G2 AMD | |
| Durchschnittliche Intel Core i7-1185G7 (5.02 - 8.13, n=27) | |
| Samsung Galaxy Book Flex 15-NP950 | |
| HP EliteBook 850 G8 3C7Z8EA | |
| Dell Latitude 15 9520 2-in-1 | |
| Asus ExpertBook B1 B1500CEAE, i5-1135G7 | |
| Dell Latitude 9510 2-in-1 | |
Cinebench R23: Multi Core | Single Core
Cinebench R20: CPU (Multi Core) | CPU (Single Core)
Cinebench R15: CPU Multi 64Bit | CPU Single 64Bit
Blender: v2.79 BMW27 CPU
7-Zip 18.03: 7z b 4 | 7z b 4 -mmt1
Geekbench 5.5: Multi-Core | Single-Core
HWBOT x265 Benchmark v2.2: 4k Preset
LibreOffice : 20 Documents To PDF
R Benchmark 2.5: Overall mean
* ... kleinere Werte sind besser
AIDA64: FP32 Ray-Trace | FPU Julia | CPU SHA3 | CPU Queen | FPU SinJulia | FPU Mandel | CPU AES | CPU ZLib | FP64 Ray-Trace | CPU PhotoWorxx
| Performance Rating | |
| Microsoft Surface Laptop 4 15 AMD TFF_00028 | |
| Lenovo ThinkPad L15 G2 AMD | |
| MSI Summit B15 A11M | |
| Durchschnittliche Intel Core i7-1185G7 | |
| HP EliteBook 850 G8 3C7Z8EA | |
| Dell Latitude 15 9520 2-in-1 | |
| Dell Latitude 9510 2-in-1 | |
| AIDA64 / FP32 Ray-Trace | |
| Microsoft Surface Laptop 4 15 AMD TFF_00028 | |
| Lenovo ThinkPad L15 G2 AMD | |
| MSI Summit B15 A11M | |
| Durchschnittliche Intel Core i7-1185G7 (5621 - 7453, n=20) | |
| HP EliteBook 850 G8 3C7Z8EA | |
| Dell Latitude 15 9520 2-in-1 | |
| Dell Latitude 9510 2-in-1 | |
| AIDA64 / FPU Julia | |
| Microsoft Surface Laptop 4 15 AMD TFF_00028 | |
| Lenovo ThinkPad L15 G2 AMD | |
| Dell Latitude 9510 2-in-1 | |
| MSI Summit B15 A11M | |
| Durchschnittliche Intel Core i7-1185G7 (23248 - 32614, n=20) | |
| HP EliteBook 850 G8 3C7Z8EA | |
| Dell Latitude 15 9520 2-in-1 | |
| AIDA64 / CPU SHA3 | |
| Microsoft Surface Laptop 4 15 AMD TFF_00028 | |
| MSI Summit B15 A11M | |
| Lenovo ThinkPad L15 G2 AMD | |
| Durchschnittliche Intel Core i7-1185G7 (1530 - 2209, n=20) | |
| HP EliteBook 850 G8 3C7Z8EA | |
| Dell Latitude 15 9520 2-in-1 | |
| Dell Latitude 9510 2-in-1 | |
| AIDA64 / CPU Queen | |
| Microsoft Surface Laptop 4 15 AMD TFF_00028 | |
| Lenovo ThinkPad L15 G2 AMD | |
| Dell Latitude 9510 2-in-1 | |
| HP EliteBook 850 G8 3C7Z8EA | |
| Durchschnittliche Intel Core i7-1185G7 (44677 - 52815, n=20) | |
| Dell Latitude 15 9520 2-in-1 | |
| MSI Summit B15 A11M | |
| AIDA64 / FPU SinJulia | |
| Microsoft Surface Laptop 4 15 AMD TFF_00028 | |
| Lenovo ThinkPad L15 G2 AMD | |
| Dell Latitude 9510 2-in-1 | |
| MSI Summit B15 A11M | |
| Durchschnittliche Intel Core i7-1185G7 (3870 - 5027, n=20) | |
| HP EliteBook 850 G8 3C7Z8EA | |
| Dell Latitude 15 9520 2-in-1 | |
| AIDA64 / FPU Mandel | |
| Microsoft Surface Laptop 4 15 AMD TFF_00028 | |
| Lenovo ThinkPad L15 G2 AMD | |
| MSI Summit B15 A11M | |
| Durchschnittliche Intel Core i7-1185G7 (14584 - 19594, n=20) | |
| HP EliteBook 850 G8 3C7Z8EA | |
| Dell Latitude 15 9520 2-in-1 | |
| Dell Latitude 9510 2-in-1 | |
| AIDA64 / CPU AES | |
| Lenovo ThinkPad L15 G2 AMD | |
| HP EliteBook 850 G8 3C7Z8EA | |
| Durchschnittliche Intel Core i7-1185G7 (33002 - 76826, n=20) | |
| MSI Summit B15 A11M | |
| Microsoft Surface Laptop 4 15 AMD TFF_00028 | |
| Dell Latitude 15 9520 2-in-1 | |
| Dell Latitude 9510 2-in-1 | |
| AIDA64 / CPU ZLib | |
| Microsoft Surface Laptop 4 15 AMD TFF_00028 | |
| Lenovo ThinkPad L15 G2 AMD | |
| Dell Latitude 9510 2-in-1 | |
| MSI Summit B15 A11M | |
| HP EliteBook 850 G8 3C7Z8EA | |
| Durchschnittliche Intel Core i7-1185G7 (258 - 412, n=22) | |
| Dell Latitude 15 9520 2-in-1 | |
| AIDA64 / FP64 Ray-Trace | |
| Microsoft Surface Laptop 4 15 AMD TFF_00028 | |
| Lenovo ThinkPad L15 G2 AMD | |
| MSI Summit B15 A11M | |
| Durchschnittliche Intel Core i7-1185G7 (2821 - 4094, n=20) | |
| HP EliteBook 850 G8 3C7Z8EA | |
| Dell Latitude 15 9520 2-in-1 | |
| Dell Latitude 9510 2-in-1 | |
| AIDA64 / CPU PhotoWorxx | |
| Dell Latitude 15 9520 2-in-1 | |
| Durchschnittliche Intel Core i7-1185G7 (22349 - 43701, n=20) | |
| MSI Summit B15 A11M | |
| HP EliteBook 850 G8 3C7Z8EA | |
| Microsoft Surface Laptop 4 15 AMD TFF_00028 | |
| Dell Latitude 9510 2-in-1 | |
| Lenovo ThinkPad L15 G2 AMD | |
System Performance
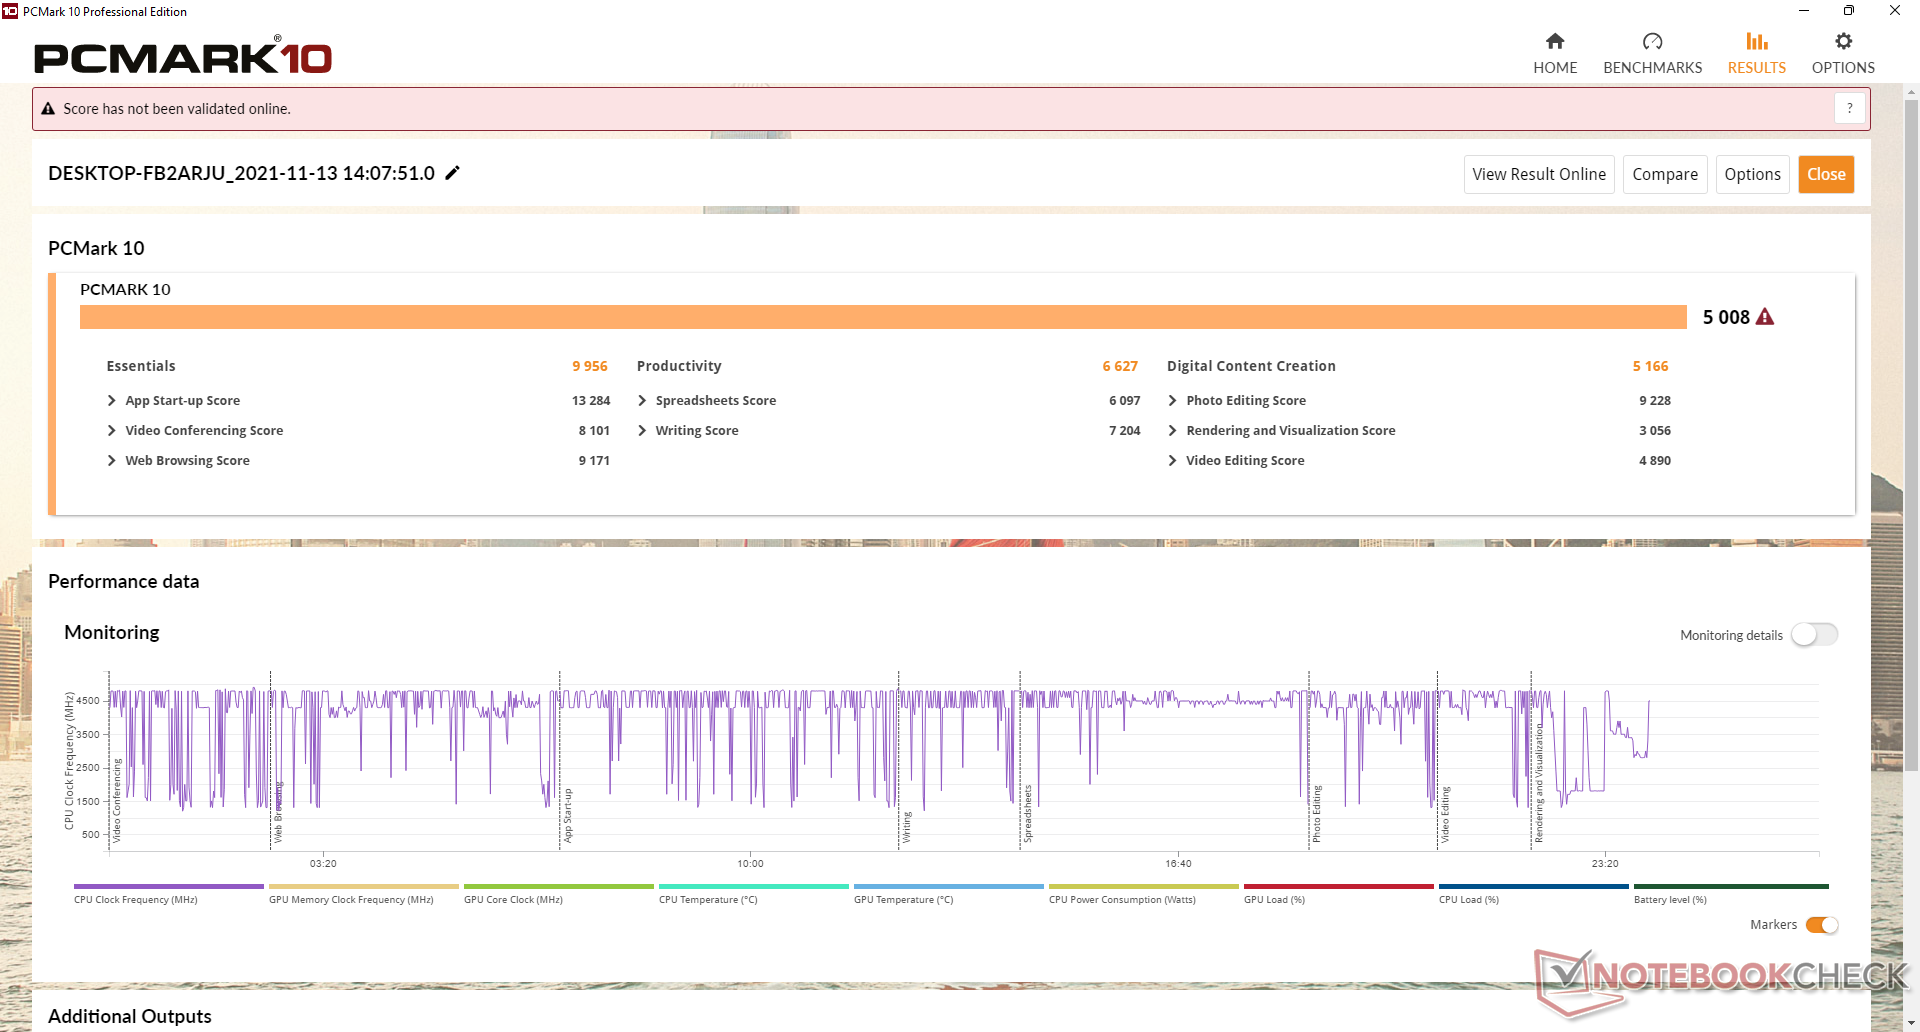
Die Ergebnisse des PCMark 10 sind im Allgemeinen höher als die des Latitude 9510 2-in-1, vor allem bei der Erstellung digitaler Inhalte, wo die Grafik am wichtigsten ist. Das ältere Modell hat einen höheren Produktivitätswert, was wahrscheinlich auf die bessere Multi-Thread-Leistung zurückzuführen ist.
| PCMark 10 / Score | |
| Lenovo ThinkPad L15 G2 AMD | |
| Microsoft Surface Laptop 4 15 AMD TFF_00028 | |
| Dell Latitude 15 9520 2-in-1 | |
| Durchschnittliche Intel Core i7-1185G7, Intel Iris Xe Graphics G7 96EUs (4746 - 5561, n=20) | |
| HP EliteBook 850 G8 3C7Z8EA | |
| MSI Summit B15 A11M | |
| Dell Latitude 9510 2-in-1 | |
| PCMark 10 / Essentials | |
| Lenovo ThinkPad L15 G2 AMD | |
| Dell Latitude 15 9520 2-in-1 | |
| Durchschnittliche Intel Core i7-1185G7, Intel Iris Xe Graphics G7 96EUs (8279 - 10664, n=20) | |
| Dell Latitude 9510 2-in-1 | |
| MSI Summit B15 A11M | |
| HP EliteBook 850 G8 3C7Z8EA | |
| Microsoft Surface Laptop 4 15 AMD TFF_00028 | |
| PCMark 10 / Productivity | |
| Lenovo ThinkPad L15 G2 AMD | |
| Microsoft Surface Laptop 4 15 AMD TFF_00028 | |
| Dell Latitude 9510 2-in-1 | |
| HP EliteBook 850 G8 3C7Z8EA | |
| Durchschnittliche Intel Core i7-1185G7, Intel Iris Xe Graphics G7 96EUs (5799 - 8770, n=20) | |
| Dell Latitude 15 9520 2-in-1 | |
| MSI Summit B15 A11M | |
| PCMark 10 / Digital Content Creation | |
| Microsoft Surface Laptop 4 15 AMD TFF_00028 | |
| Dell Latitude 15 9520 2-in-1 | |
| Durchschnittliche Intel Core i7-1185G7, Intel Iris Xe Graphics G7 96EUs (4424 - 5684, n=20) | |
| HP EliteBook 850 G8 3C7Z8EA | |
| Lenovo ThinkPad L15 G2 AMD | |
| MSI Summit B15 A11M | |
| Dell Latitude 9510 2-in-1 | |
| PCMark 10 Score | 5008 Punkte | |
Hilfe | ||
| AIDA64 / Memory Copy | |
| Dell Latitude 15 9520 2-in-1 | |
| Durchschnittliche Intel Core i7-1185G7 (36515 - 68450, n=20) | |
| HP EliteBook 850 G8 3C7Z8EA | |
| Microsoft Surface Laptop 4 15 AMD TFF_00028 | |
| MSI Summit B15 A11M | |
| Dell Latitude 9510 2-in-1 | |
| Lenovo ThinkPad L15 G2 AMD | |
| AIDA64 / Memory Read | |
| Dell Latitude 15 9520 2-in-1 | |
| Durchschnittliche Intel Core i7-1185G7 (38394 - 64291, n=20) | |
| HP EliteBook 850 G8 3C7Z8EA | |
| Microsoft Surface Laptop 4 15 AMD TFF_00028 | |
| MSI Summit B15 A11M | |
| Dell Latitude 9510 2-in-1 | |
| Lenovo ThinkPad L15 G2 AMD | |
| AIDA64 / Memory Write | |
| Dell Latitude 15 9520 2-in-1 | |
| Durchschnittliche Intel Core i7-1185G7 (37684 - 66873, n=20) | |
| HP EliteBook 850 G8 3C7Z8EA | |
| MSI Summit B15 A11M | |
| Microsoft Surface Laptop 4 15 AMD TFF_00028 | |
| Dell Latitude 9510 2-in-1 | |
| Lenovo ThinkPad L15 G2 AMD | |
| AIDA64 / Memory Latency | |
| Microsoft Surface Laptop 4 15 AMD TFF_00028 | |
| Dell Latitude 15 9520 2-in-1 | |
| Dell Latitude 9510 2-in-1 | |
| Lenovo ThinkPad L15 G2 AMD | |
| Durchschnittliche Intel Core i7-1185G7 (78.3 - 117, n=22) | |
| MSI Summit B15 A11M | |
| HP EliteBook 850 G8 3C7Z8EA | |
* ... kleinere Werte sind besser
DPC-Latenzzeit
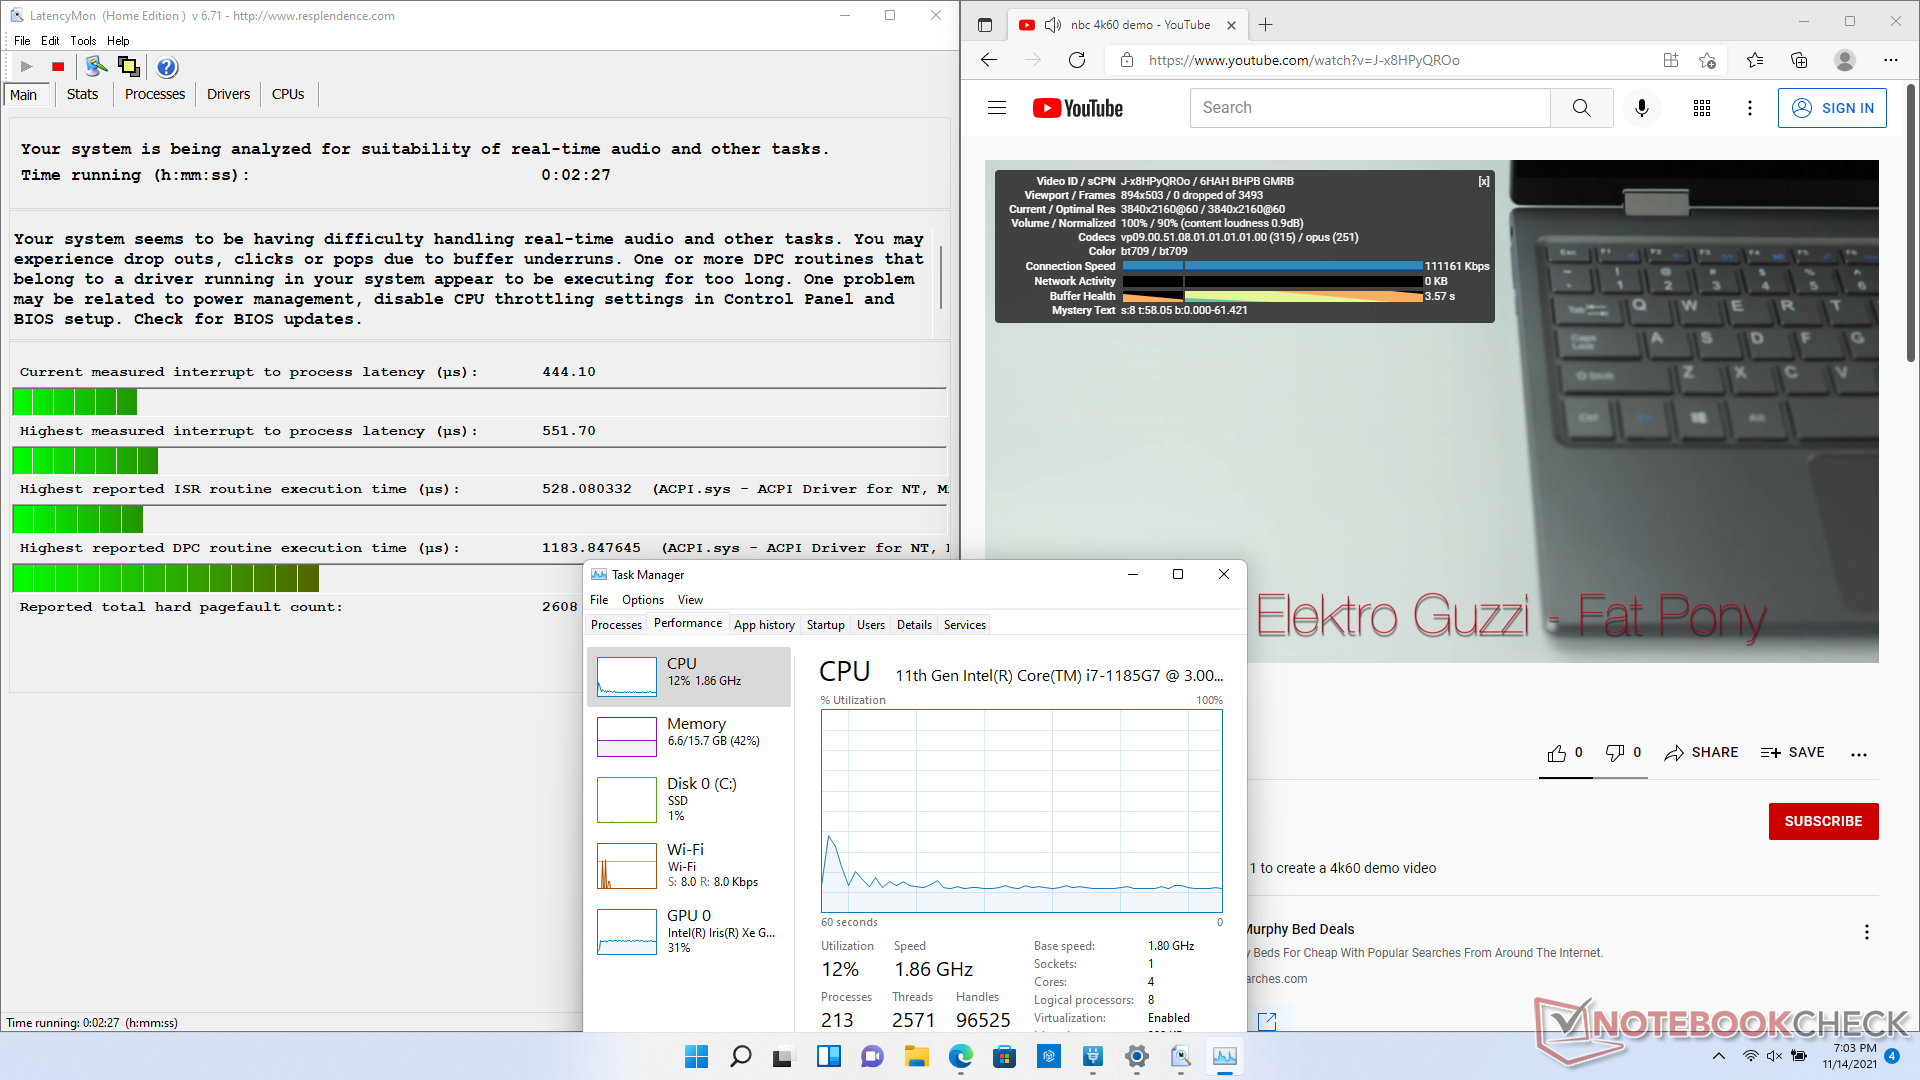
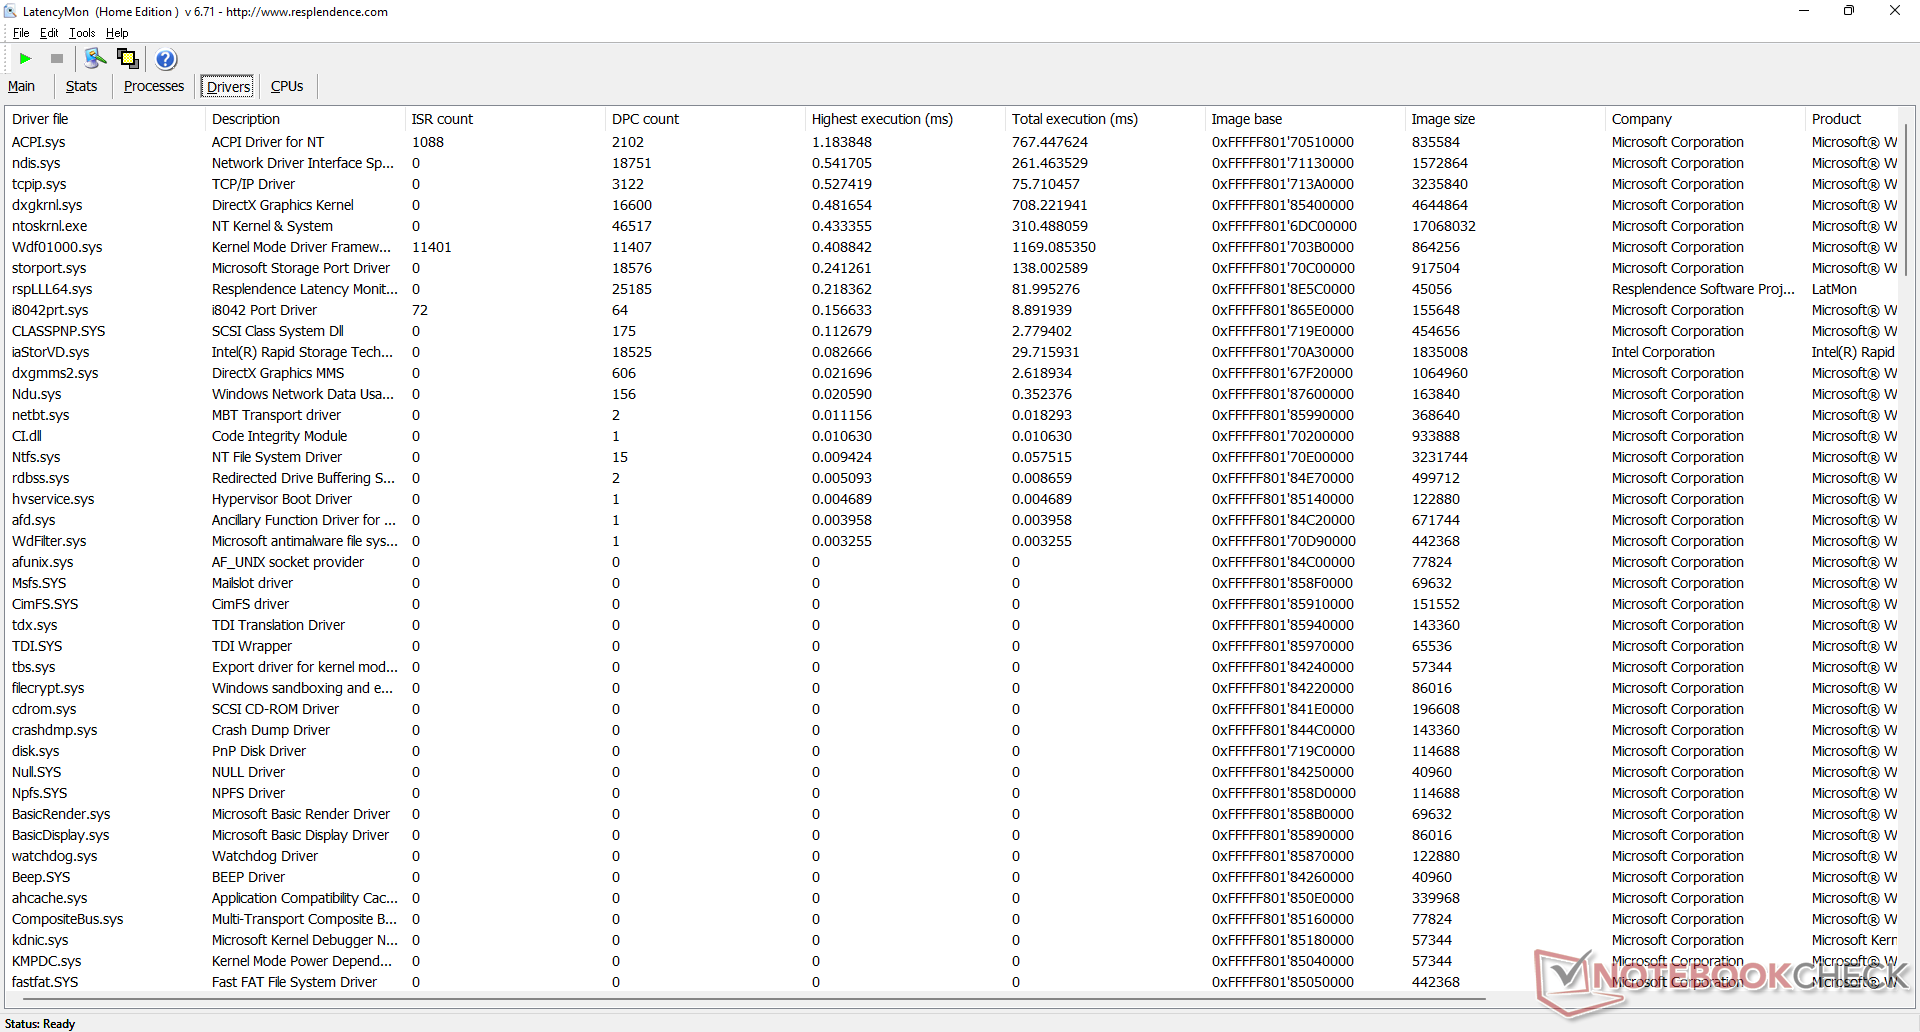
LatencyMon zeigt kleinere DPC-Latenzprobleme im Zusammenhang mit ACPI.sys, wenn mehrere Browsertabs unserer Homepage geöffnet werden. Nichtsdestotrotz ist es immer noch eine Verbesserung im Vergleich zu dem, was wir beim letztjährigen Modell beobachtet haben.
Die 4K-Videowiedergabe bei 60 FPS bleibt perfekt, ohne Bildaussetzer und mit einer effizienteren GPU-Auslastung als beim UHD Graphics 620.
| DPC Latencies / LatencyMon - interrupt to process latency (max), Web, Youtube, Prime95 | |
| Dell Latitude 9510 2-in-1 | |
| Lenovo ThinkPad L15 G2 AMD | |
| HP EliteBook 850 G8 3C7Z8EA | |
| MSI Summit B15 A11M | |
| Microsoft Surface Laptop 4 15 AMD TFF_00028 | |
| Dell Latitude 15 9520 2-in-1 | |
* ... kleinere Werte sind besser
Speichergeräte
Unser Testgerät verwendet die gleiche PCIe3 x4 Toshiba KBG40ZNS512G NVMe M.2 2230 SSD, wie sie im Latitude 9510 2-in-1 zu finden ist. Dell bietet derzeit keine PCIe4-Optionen an, obwohl der Intel-Chipsatz theoretisch in der Lage sein sollte, solche SSDs zu unterstützen. Das Fehlen eines Wärmespreizers bedeutet jedoch, dass PCIe4-SSDs wahrscheinlich ohnehin nach kurzer Zeit gedrosselt werden würden.

* ... kleinere Werte sind besser
Disk Throttling: DiskSpd Read Loop, Queue Depth 8
GPU Performance
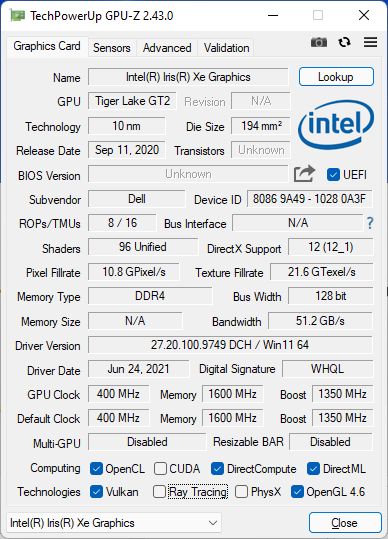
Die 3DMark-Ergebnisse zeigen, dass die Iris Xe 96 EUs in unserem Latitude 9520 2-in-1 im Vergleich zu anderen Iris Xe-Notebooks in unserer Datenbank gut abschneiden. Der Teufel steckt jedoch im Detail, denn die reale Spieleleistung ist aufgrund der ungewöhnlich stark schwankenden Bildwiederholraten schlecht. Zum Beispiel sprangen die Frameraten ständig zwischen 40 FPS und 90 FPS, wenn wir Witcher 3 mit den niedrigsten Einstellungen im Leerlauf spielten, während das MSI Summit B15 mit Iris Xe viel stabiler lief, ohne dass es zu den starken FPS-Einbrüchen kam. Obwohl unser Latitude 9520 2-in-1 Iris Xe zweifelsohne schneller ist als die UHD Graphics 620 des letztjährigen Latitude 9510 2-in-1, hätte die Leistung mit der Zeit definitiv stabiler sein können.
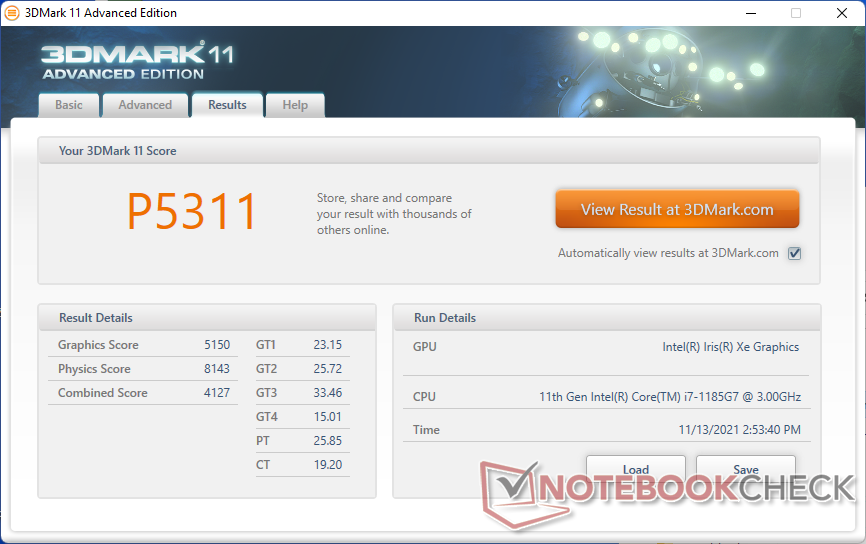
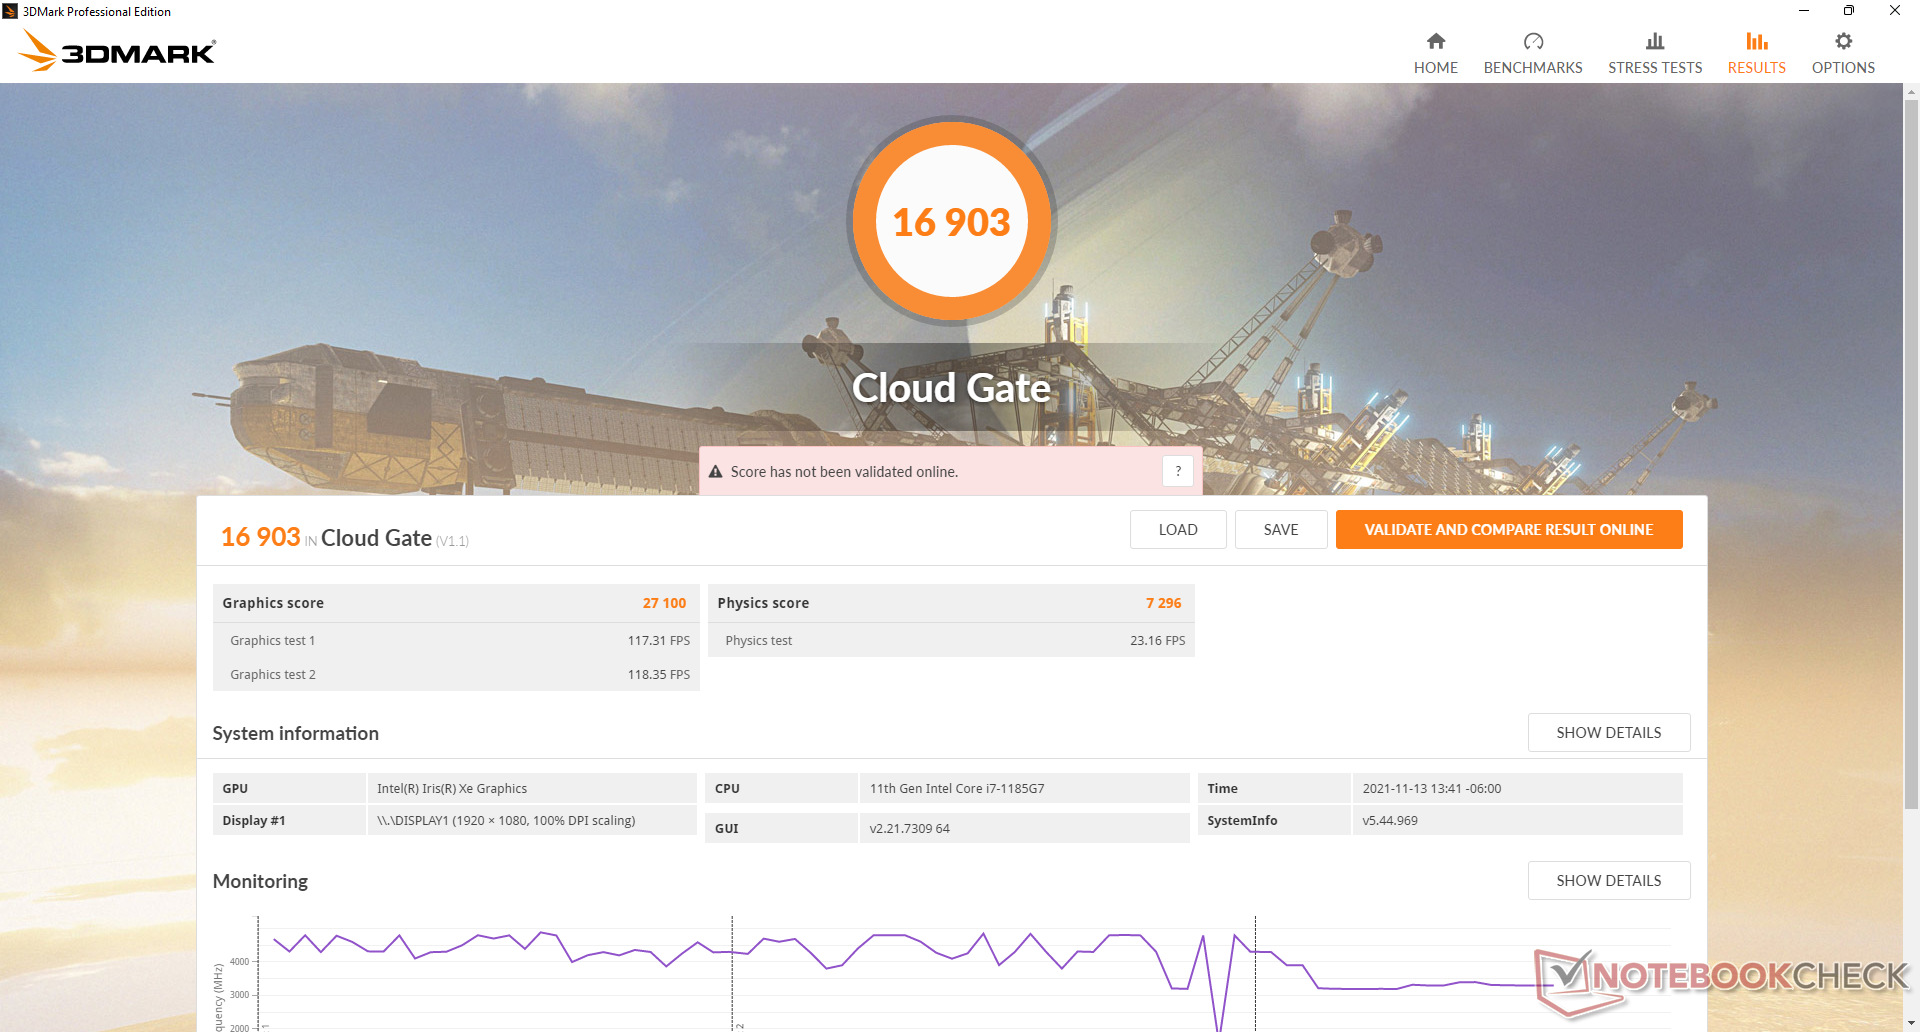
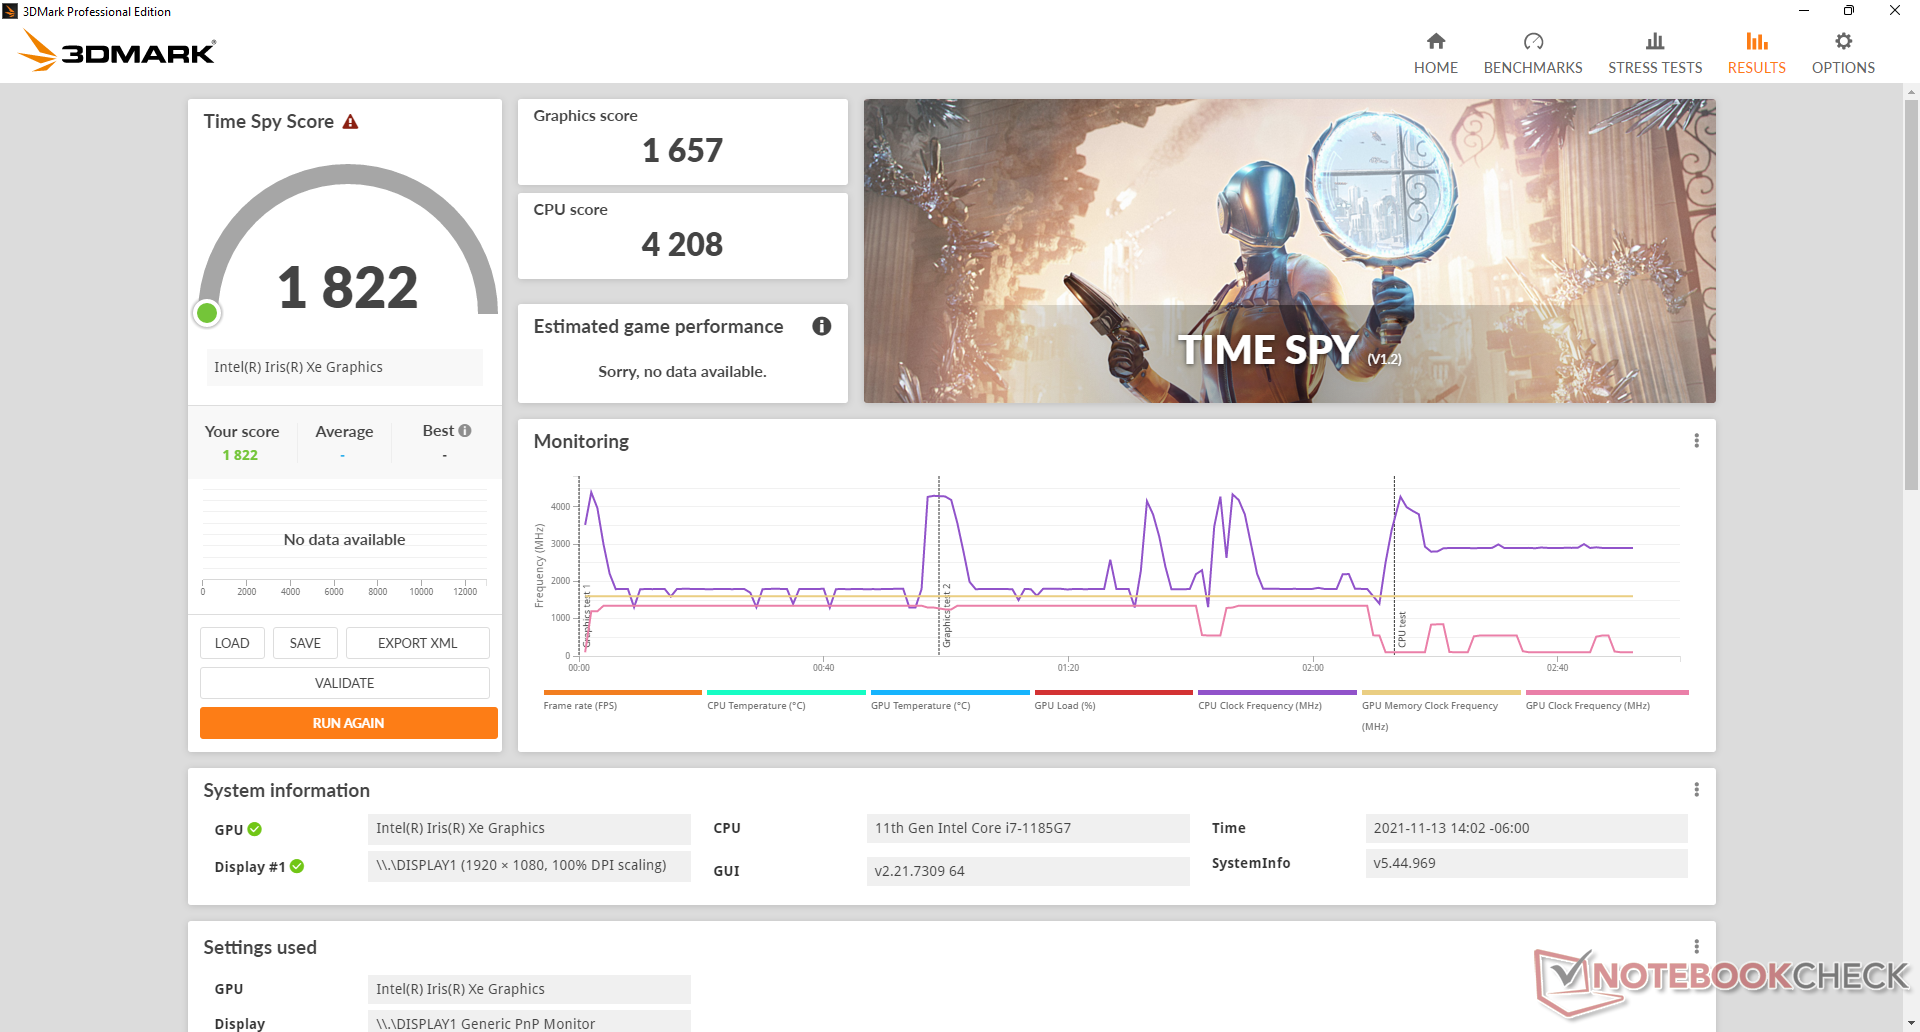
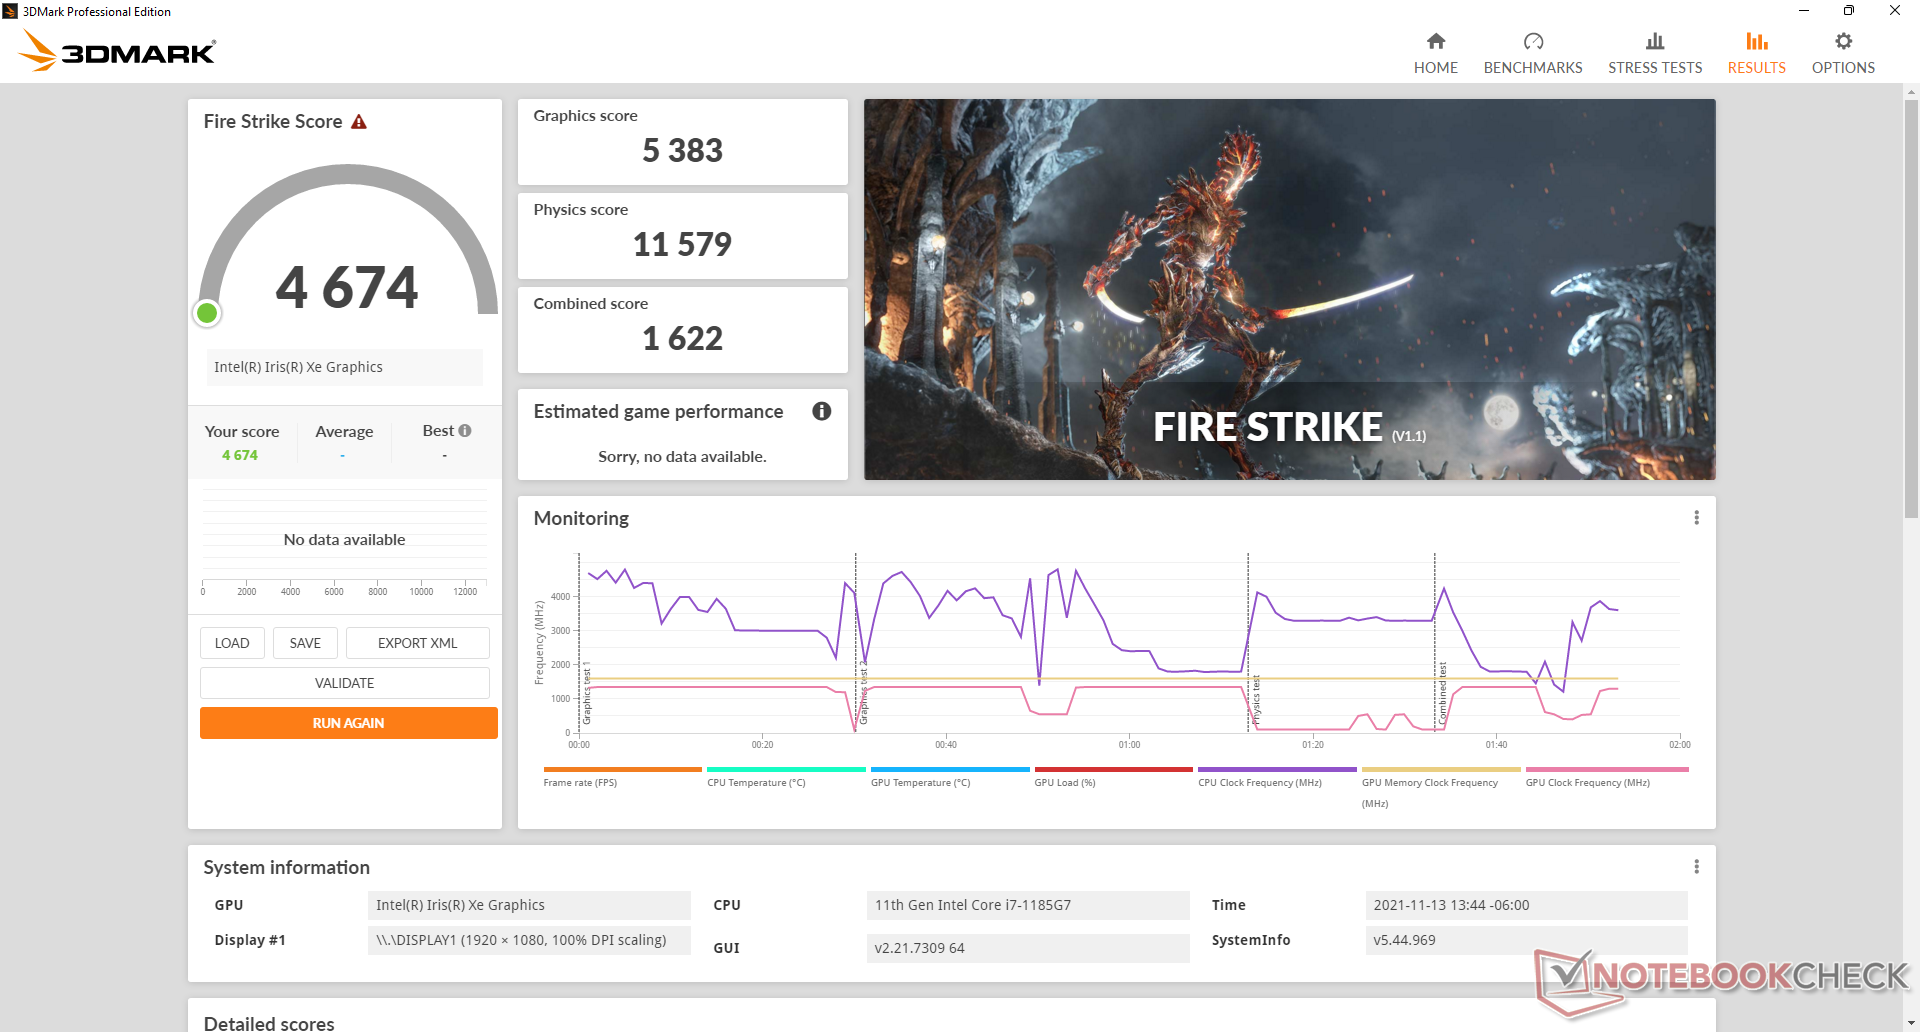
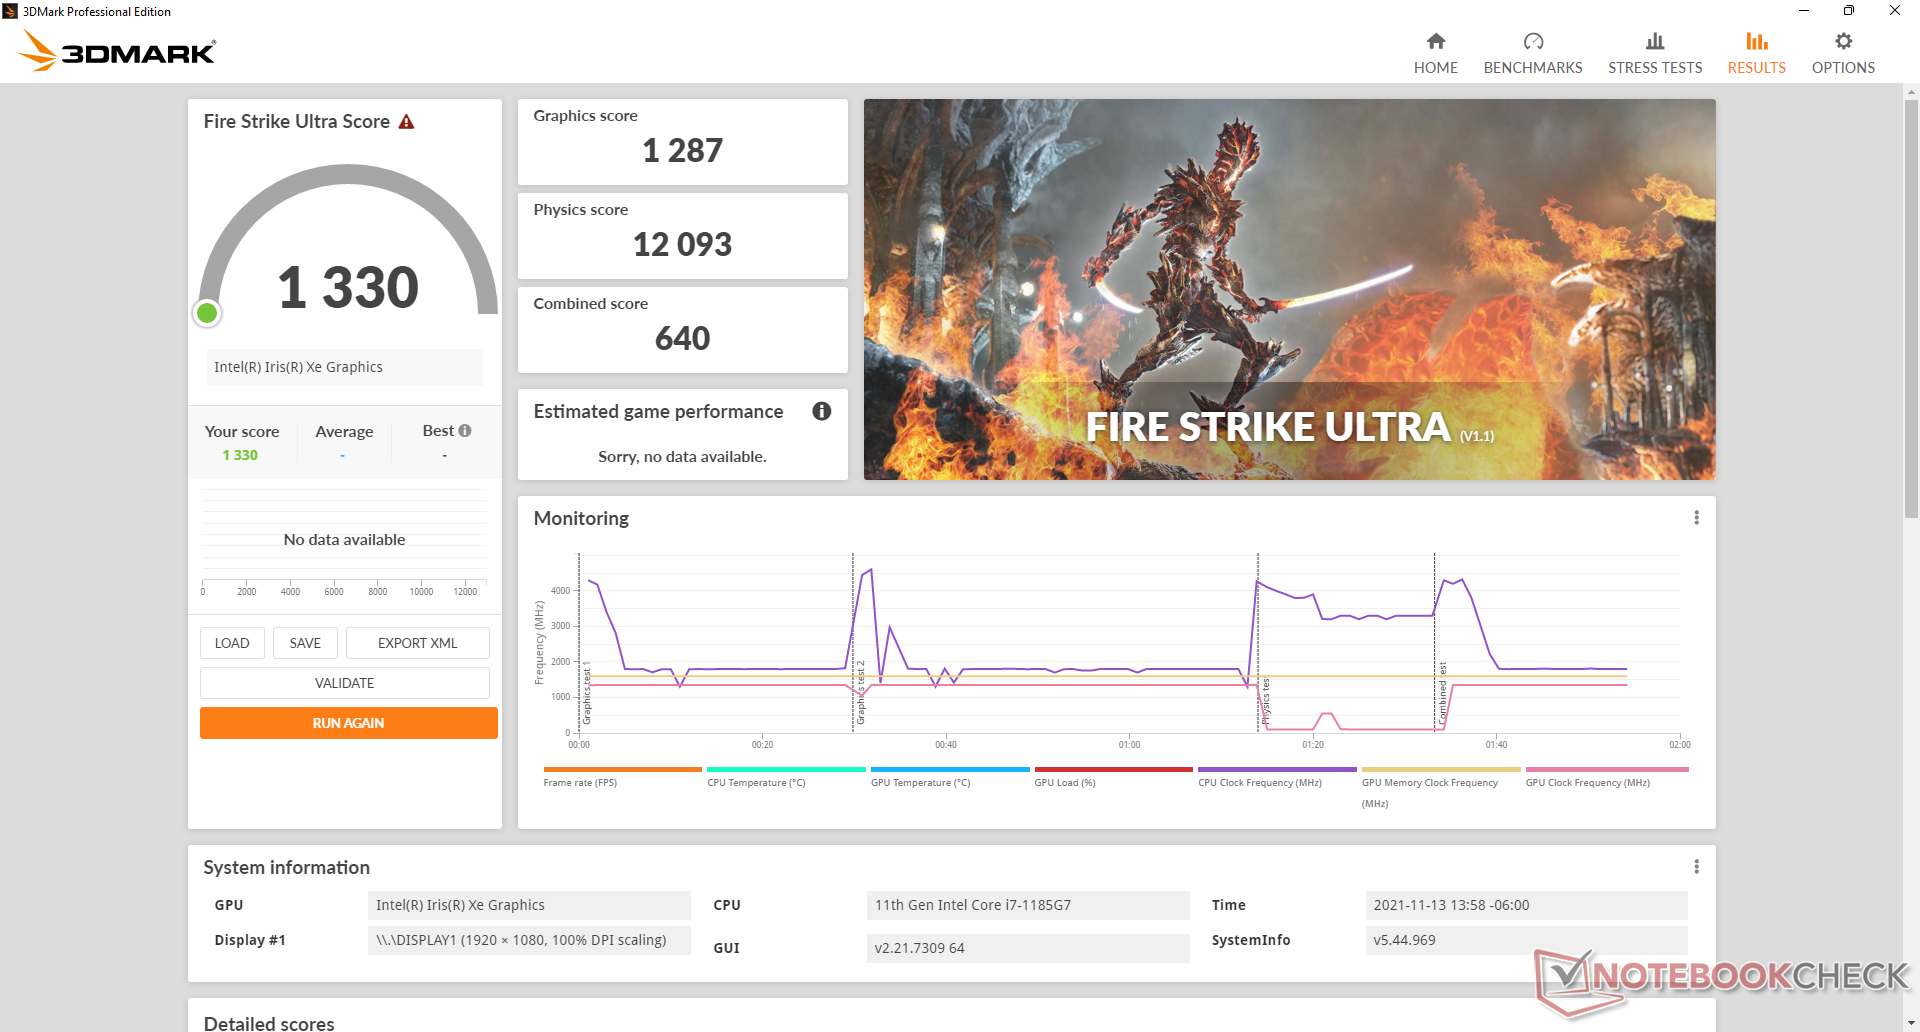
| 3DMark 11 Performance | 5311 Punkte | |
| 3DMark Cloud Gate Standard Score | 16903 Punkte | |
| 3DMark Fire Strike Score | 4674 Punkte | |
| 3DMark Time Spy Score | 1822 Punkte | |
Hilfe | ||
Witcher 3 FPS Chart
| min. | mittel | hoch | max. | |
|---|---|---|---|---|
| GTA V (2015) | 81 | 70.5 | 27.2 | 10.6 |
| The Witcher 3 (2015) | 86.8 | 59.4 | 33.5 | 14.3 |
| Dota 2 Reborn (2015) | 103 | 61.7 | 39.8 | 39.8 |
| Final Fantasy XV Benchmark (2018) | 35 | 20 | 14.6 | |
| X-Plane 11.11 (2018) | 36 | 34.4 | 27.5 | |
| Strange Brigade (2018) | 82.8 | 32.7 | 26.3 | 23.2 |
Emissionen
System-Rauschen
Der interne Lüfter ist mit 24,1 dN(A) im Leerlauf oder beim Surfen im Internet im Modus "Ausbalanciert" oder "Optimiert" oder niedriger leise. Gelegentlich kann er auf 25,8 dB(A) ansteigen, was aber in den meisten Umgebungen nicht wahrnehmbar ist. Das maximale Lüftergeräusch von knapp unter 40 dB(A) kann erreicht werden, wenn höhere Lasten wie Spiele laufen.
Das Lüftergeräusch pulsiert häufiger, wenn der Modus "High Performance" beim Surfen oder Videostreaming eingestellt ist. Stellen Sie also sicher, dass Sie das Leistungsprofil entsprechend einstellen, wenn Sie sich über das Lüftergeräusch Gedanken machen.
Lautstärkediagramm
| Idle |
| 24.1 / 24.1 / 25.8 dB(A) |
| Last |
| 34.2 / 39.6 dB(A) |
 | ||
30 dB leise 40 dB(A) deutlich hörbar 50 dB(A) störend |
||
min: | ||
| Dell Latitude 15 9520 2-in-1 Iris Xe G7 96EUs, i7-1185G7, Toshiba KBG40ZNS512G NVMe | Dell Latitude 9510 2-in-1 UHD Graphics 620, i7-10810U, Toshiba KBG40ZNS512G NVMe | HP EliteBook 850 G8 3C7Z8EA Iris Xe G7 96EUs, i7-1165G7, Samsung PM981a MZVLB1T0HBLR | Lenovo ThinkPad L15 G2 AMD Vega 7, R5 5600U, SK Hynix HFS512 GDE9X081N | MSI Summit B15 A11M Iris Xe G7 96EUs, i7-1165G7, Kingston OM8PCP31024F | Microsoft Surface Laptop 4 15 AMD TFF_00028 Vega 8, R7 4980U, SK Hynix BC511 HFM512GDJTNI | |
|---|---|---|---|---|---|---|
| Geräuschentwicklung | -7% | 0% | 6% | -1% | -2% | |
| aus / Umgebung * (dB) | 24 | 27.2 -13% | 26 -8% | 24.22 -1% | 25.2 -5% | 24.2 -1% |
| Idle min * (dB) | 24.1 | 27.2 -13% | 26 -8% | 24.22 -0% | 26.4 -10% | 24.2 -0% |
| Idle avg * (dB) | 24.1 | 27.2 -13% | 26 -8% | 24.22 -0% | 26.4 -10% | 24.2 -0% |
| Idle max * (dB) | 25.8 | 27.2 -5% | 26.2 -2% | 24.22 6% | 26.4 -2% | 24.2 6% |
| Last avg * (dB) | 34.2 | 33.4 2% | 29.5 14% | 25.84 24% | 26.8 22% | 39.9 -17% |
| Witcher 3 ultra * (dB) | 39.6 | 28 29% | 39.9 -1% | |||
| Last max * (dB) | 39.6 | 39.5 -0% | 34 14% | 36.02 9% | 52.6 -33% | 39.9 -1% |
* ... kleinere Werte sind besser
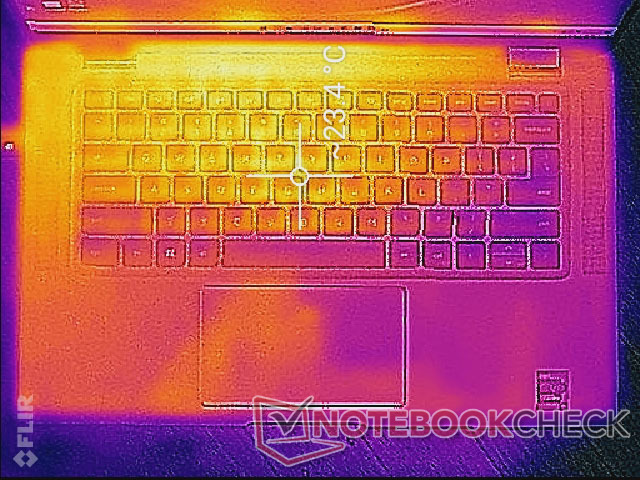
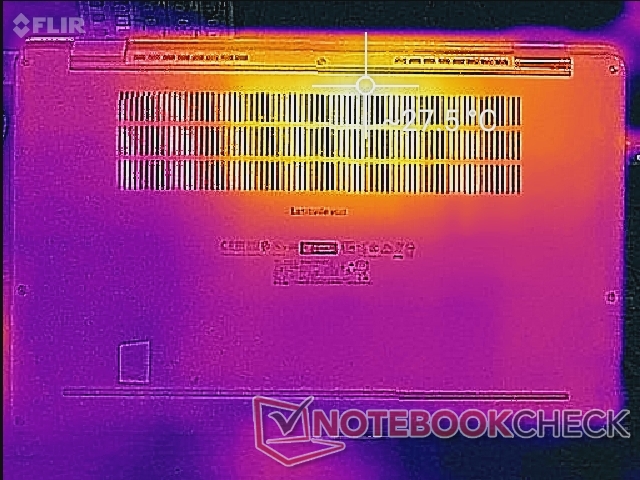
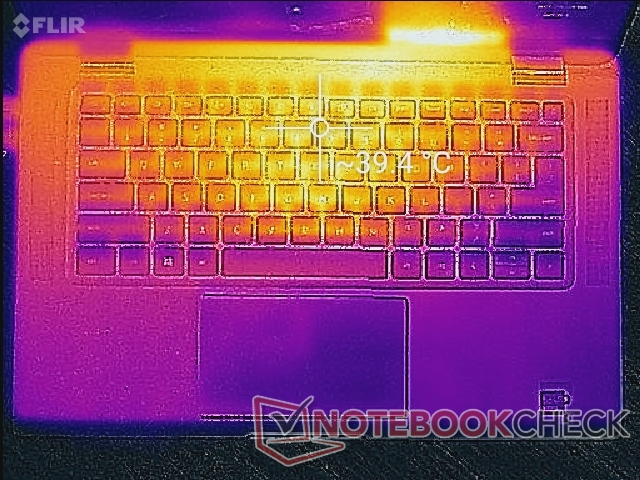
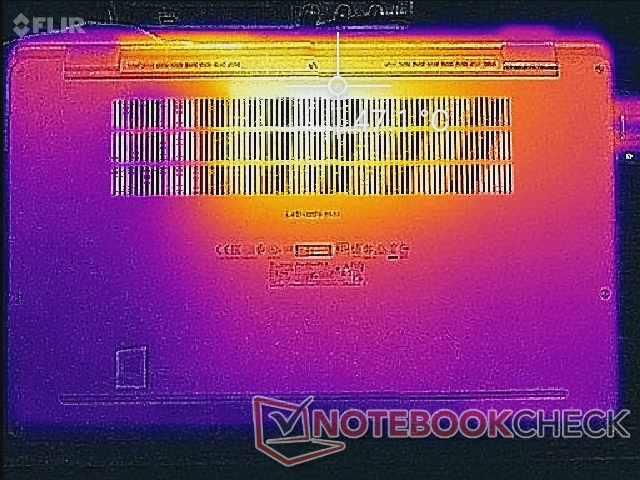
Temperatur
Die Oberflächentemperaturen sind bei geringer bis mittlerer Last ähnlich wie die beim Latitude 9510 2-in-1. Bei höherer Last, wie z. B. Spielen, kann der untere Hotspot des Latitude 9520 2-in-1 jedoch ein paar Grad wärmer sein als bei das ältere Modell.
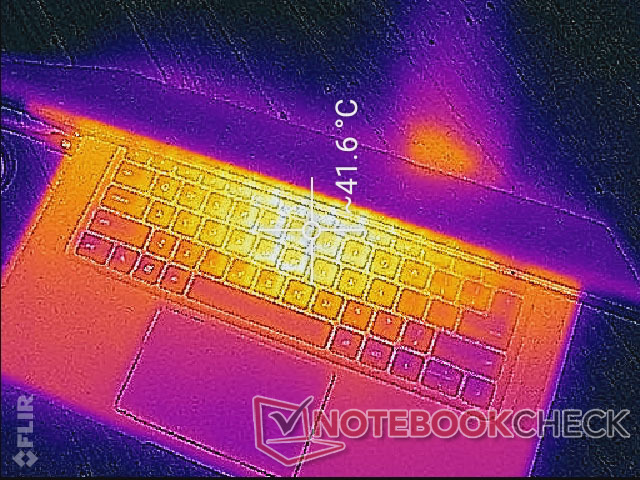
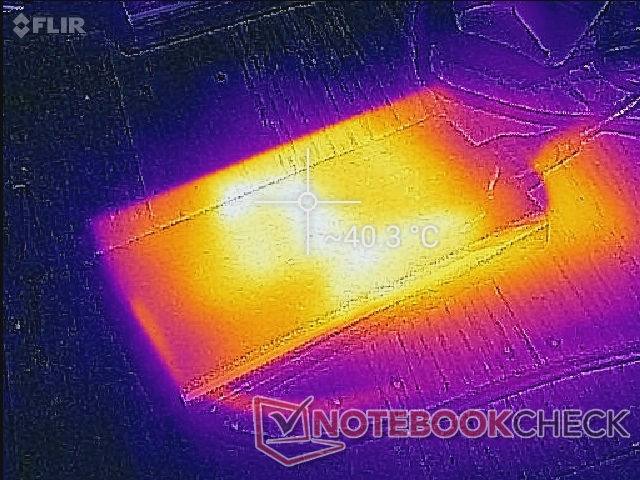
(±) Die maximale Temperatur auf der Oberseite ist 40 °C. Im Vergleich liegt der Klassendurchschnitt bei 34.3 °C (von 21.2 bis 62.5 °C für die Klasse Office).
(-) Auf der Unterseite messen wir eine maximalen Wert von 47.2 °C (im Vergleich zum Durchschnitt von 36.8 °C).
(+) Ohne Last messen wir eine durchschnittliche Temperatur von 22.5 °C auf der Oberseite. Der Klassendurchschnitt erreicht 29.5 °C.
(+) Die Handballen und der Touchpad-Bereich sind mit gemessenen 28.6 °C kühler als die typische Hauttemperatur und fühlen sich dadurch kühl an.
(±) Die durchschnittliche Handballen-Temperatur anderer getesteter Geräte war 27.5 °C (-1.1 °C).
| Dell Latitude 15 9520 2-in-1 Intel Core i7-1185G7, Intel Iris Xe Graphics G7 96EUs | Dell Latitude 9510 2-in-1 Intel Core i7-10810U, Intel UHD Graphics 620 | HP EliteBook 850 G8 3C7Z8EA Intel Core i7-1165G7, Intel Iris Xe Graphics G7 96EUs | Lenovo ThinkPad L15 G2 AMD AMD Ryzen 5 5600U, AMD Radeon RX Vega 7 | MSI Summit B15 A11M Intel Core i7-1165G7, Intel Iris Xe Graphics G7 96EUs | Microsoft Surface Laptop 4 15 AMD TFF_00028 AMD Ryzen 7 4980U, AMD Radeon RX Vega 8 (Ryzen 4000/5000) | |
|---|---|---|---|---|---|---|
| Hitze | -9% | -3% | -8% | -8% | 4% | |
| Last oben max * (°C) | 40 | 42.8 -7% | 37.9 5% | 42.8 -7% | 42.8 -7% | 41.8 -5% |
| Last unten max * (°C) | 47.2 | 41.8 11% | 39 17% | 46 3% | 52.2 -11% | 44.8 5% |
| Idle oben max * (°C) | 23.4 | 29.2 -25% | 31 -32% | 26.9 -15% | 26 -11% | 23 2% |
| Idle unten max * (°C) | 27.4 | 31 -13% | 27.8 -1% | 31.1 -14% | 28.2 -3% | 23.6 14% |
* ... kleinere Werte sind besser
Stresstest
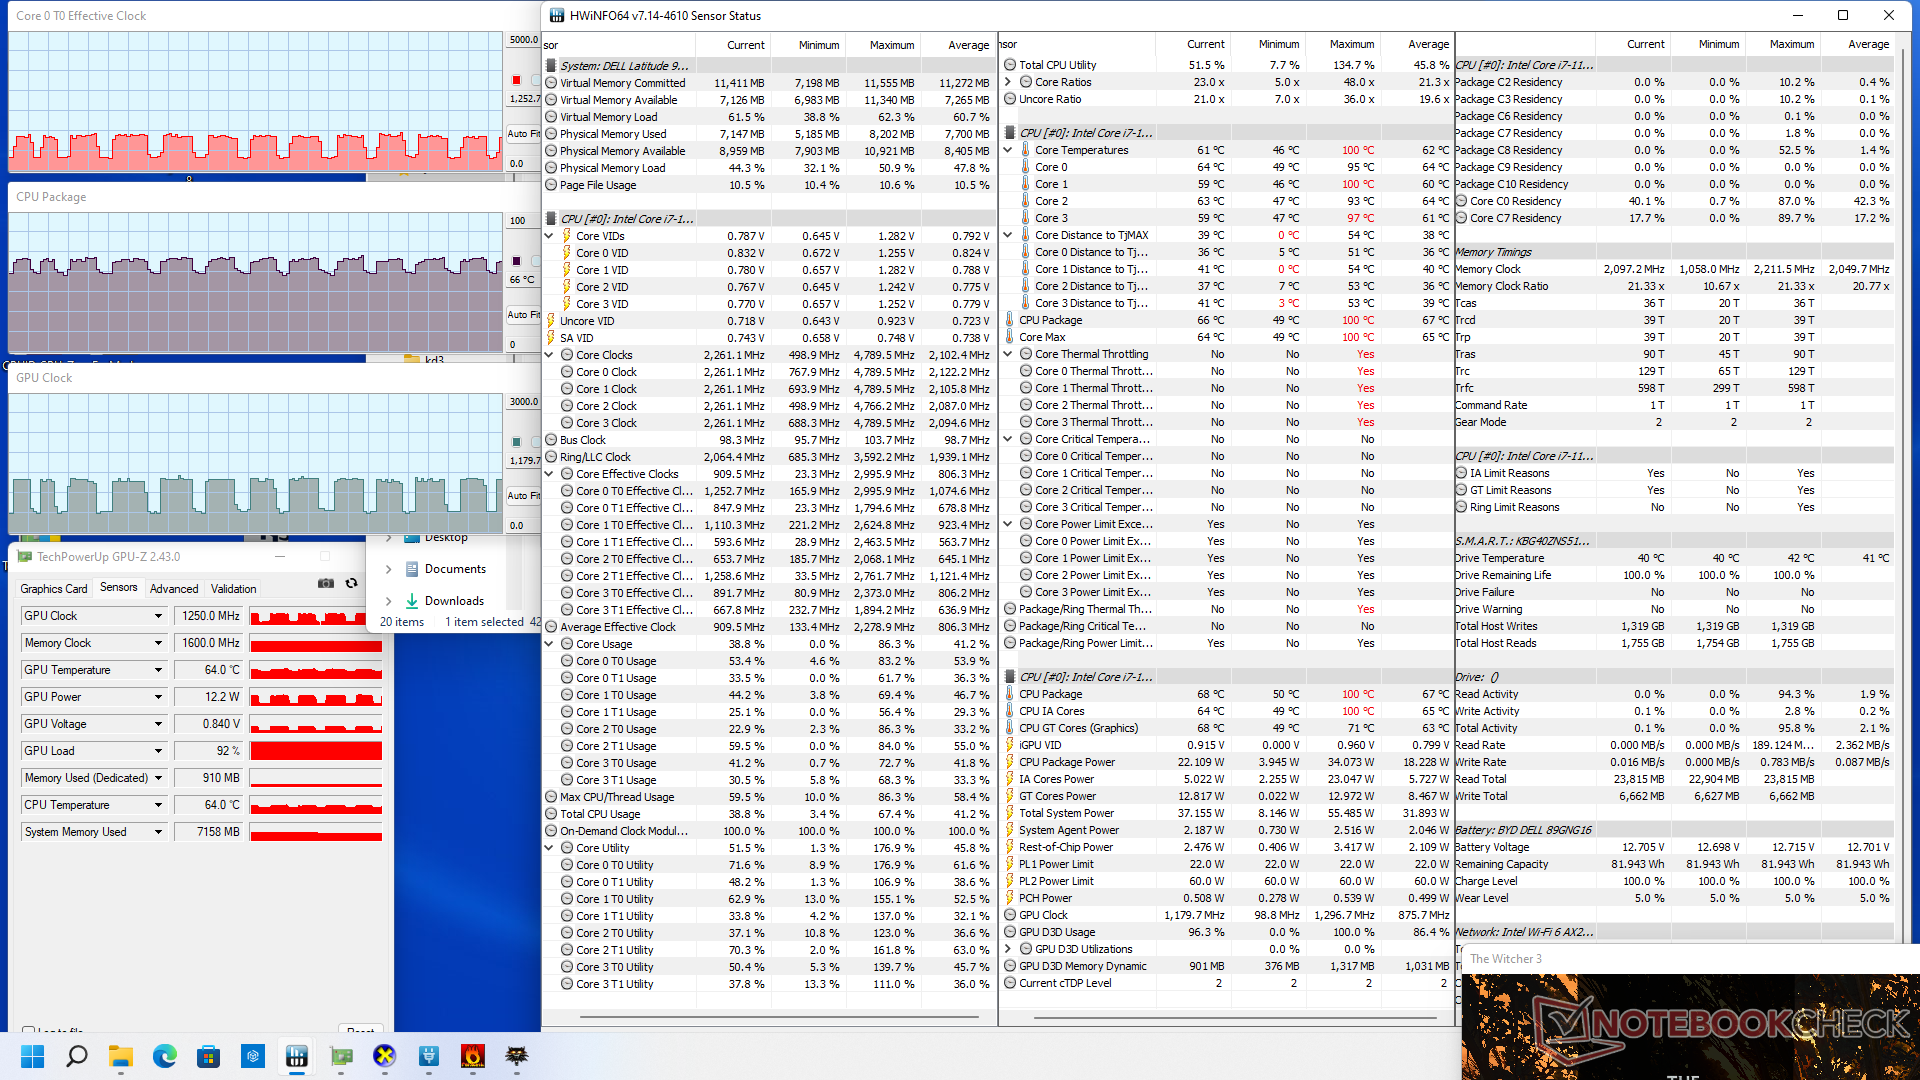
Die schwankende Leistung im Witcher 3 wie oben erwähnt, kann auf die unsteten Taktraten zurückgeführt werden, wenn CPU und GPU gleichzeitig belastet werden. Die GPU-Taktraten schwanken zwischen 500 MHz und 1200 MHz, wenn das Spiel läuft, während die meisten anderen Iris-Xe-Laptops bei festen Taktraten stabil bleiben und so eine gleichmäßigere Leistung bieten. Das MSI Summit B15 zum Beispiel hat unter den gleichen Spielbedingungen wie unser Dell eine konstante GPU-Taktrate von 1300 MHz. Dieses unerwünschte GPU-Verhalten macht das Latitude 9520 2-in-1 zu einer vergleichsweise schlechteren Wahl für grafikintensive Aufgaben.
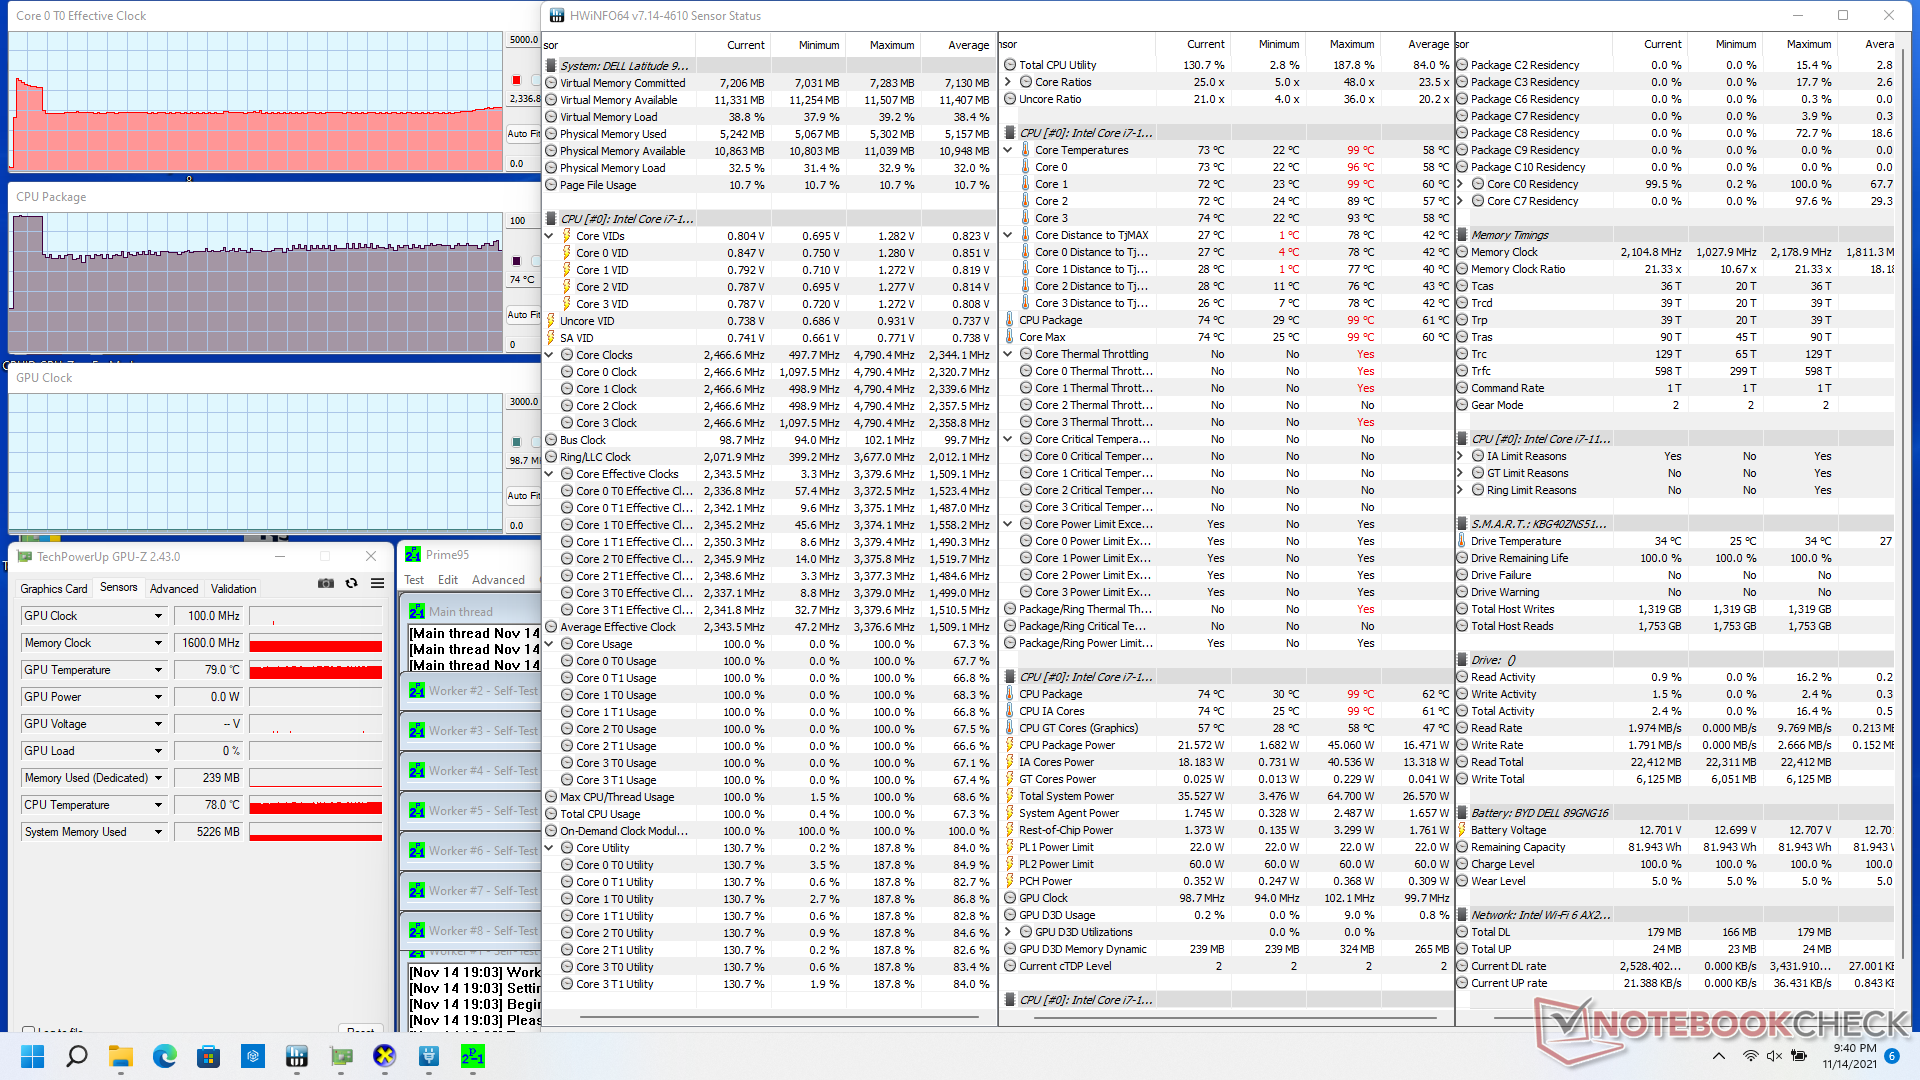
Wenn nur die CPU über Prime95 belastet wird, steigen die Taktraten nur für die ersten paar Sekunden auf 3,2 GHz bei einer Kerntemperatur von 98 °C. Danach sinken die Taktraten in den niedrigen 2-GHz-Bereich, um eine kühlere Kerntemperatur von etwa 75 °C aufrechtzuerhalten. Die Multi-Thread-Langzeit-PL1- und Kurzzeit-PL2-Leistungsgrenzen liegen bei 22 W bzw. 45 W, wenn sich das System im Modus "High Performance" befindet.
Der Akkubetrieb schränkt die Leistung nicht ein, da die 3DMark-11-Ergebnisse im Netz- und im Akkubetrieb nahezu identisch sind.
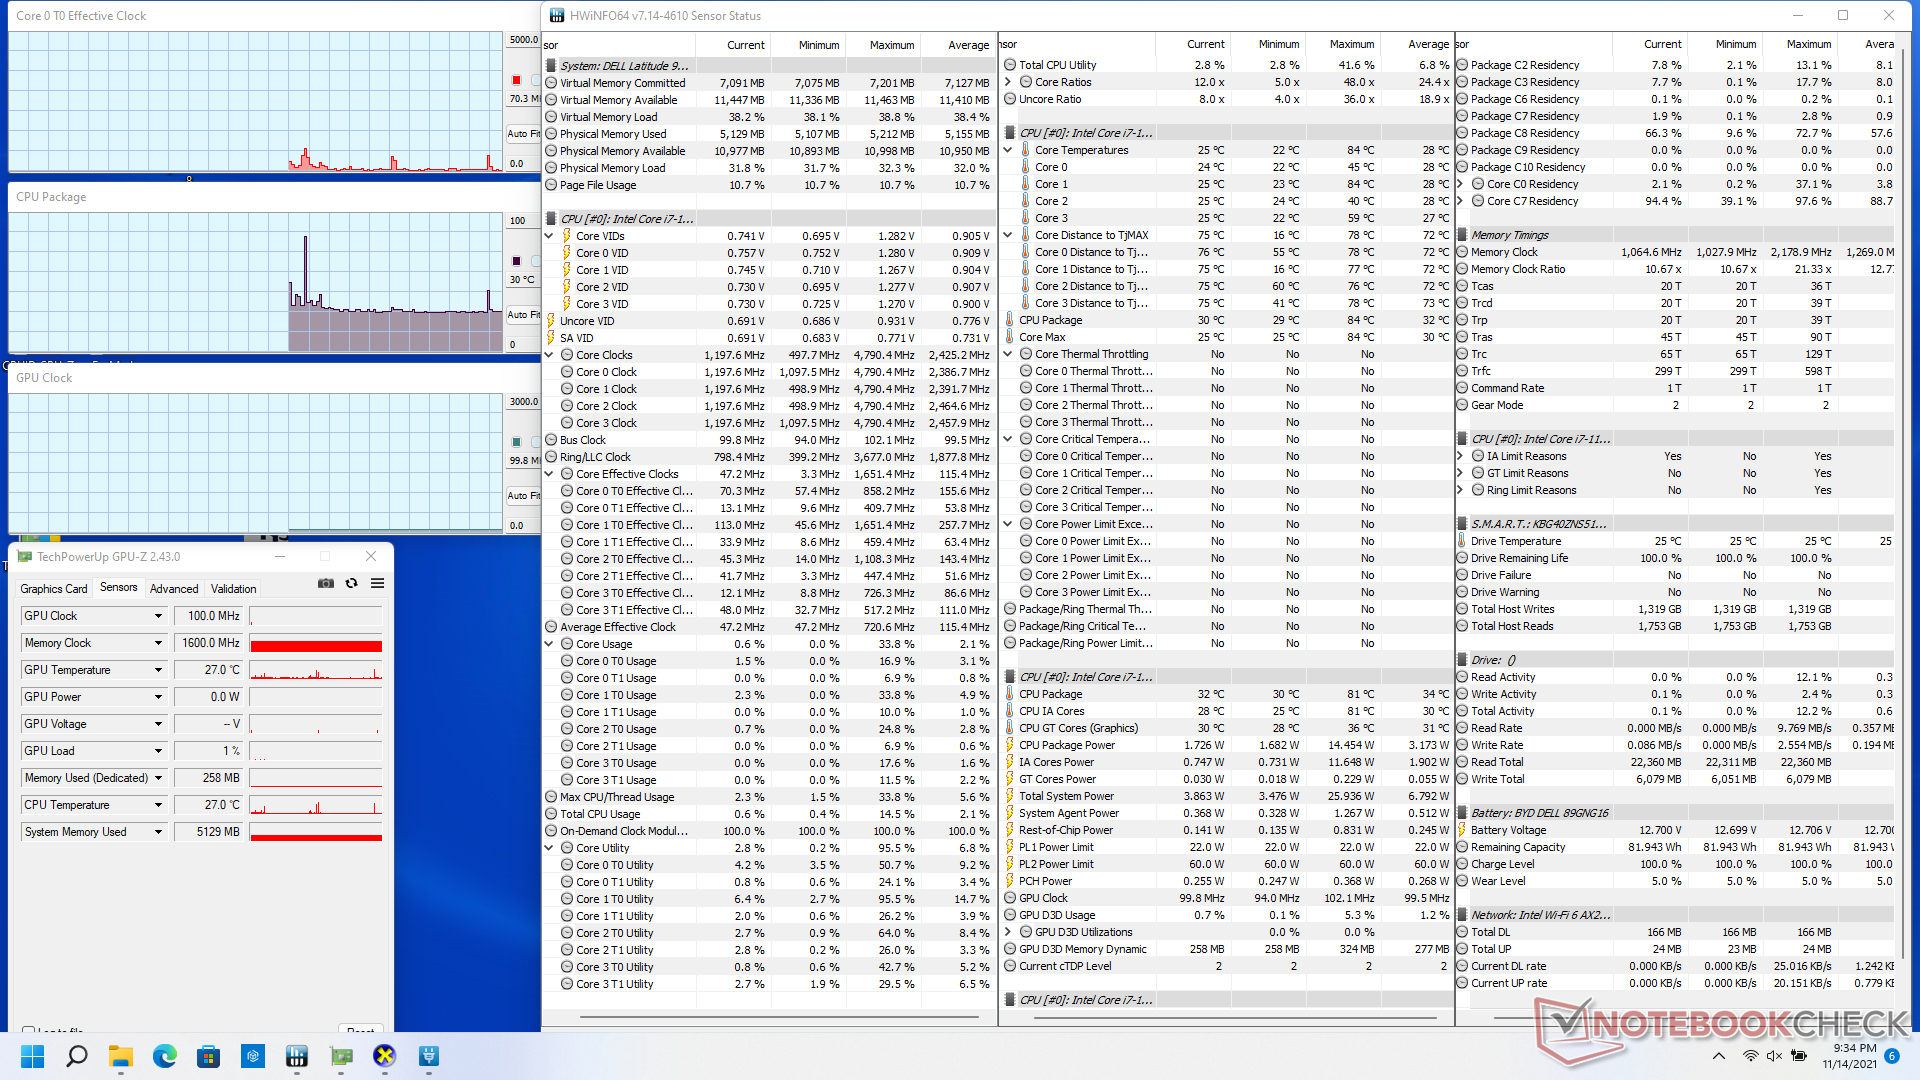
| CPU-Takt (GHz) | GPU-Takt (MHz) | DurchschnittlicheCPU-Temperatur (°C) | |
| System Leerlauf | -- | -- | 30 |
| Prime95 Stress | 2.2 | -- | 75 |
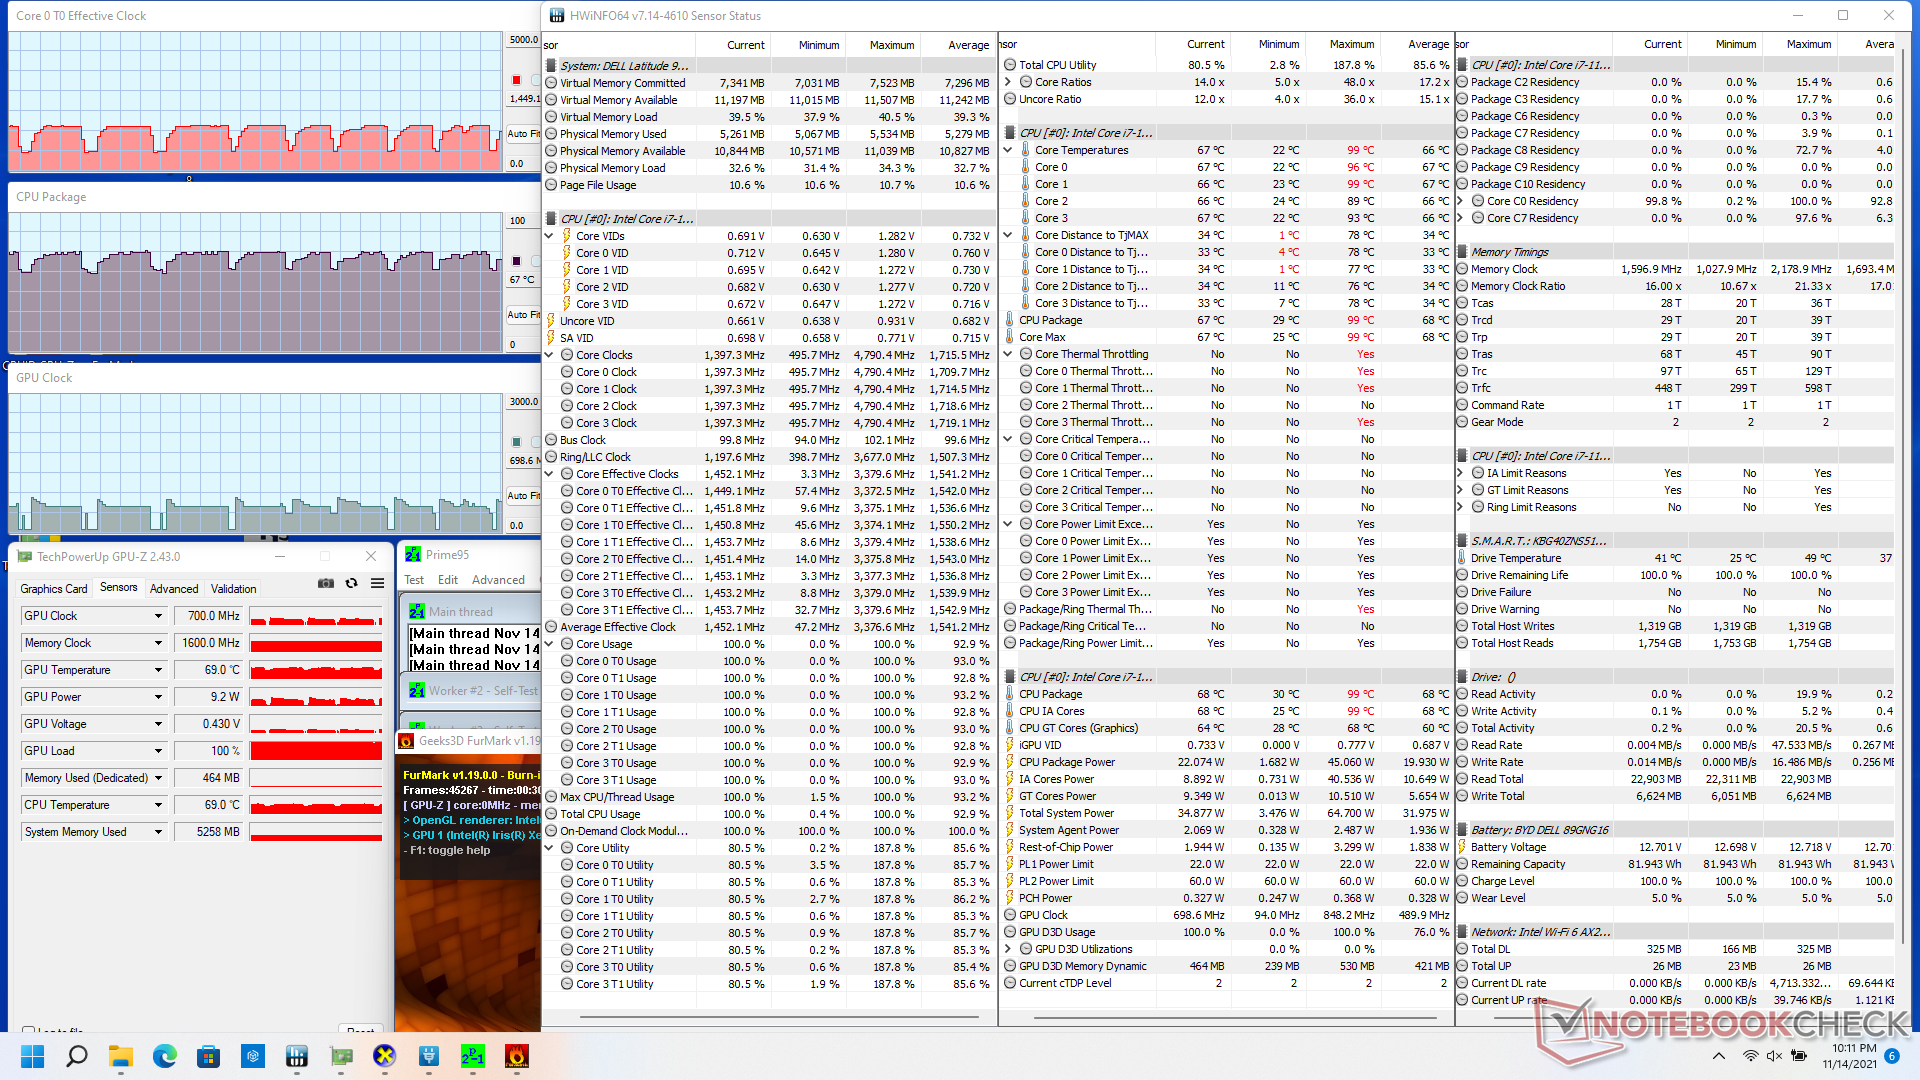
| Prime95 + FurMark Stress | 0.6 - 1.7 | 100 - 800 | 58 - 73 |
| Witcher 3 Stress | 0.5 - 1.3 | 500 - 1200 | 57 - 66 |
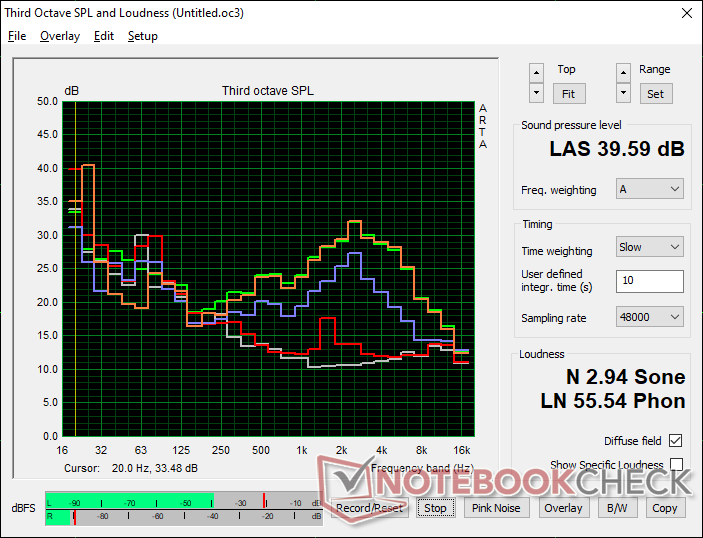
Lautsprecher
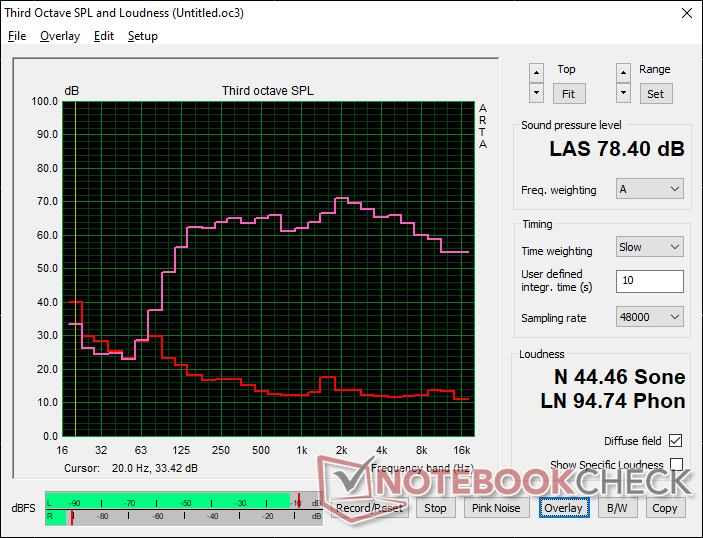
Dell Latitude 15 9520 2-in-1 Audio Analyse
(±) | Mittelmäßig laut spielende Lautsprecher (78.4 dB)
Bass 100 - 315 Hz
(+) | guter Bass - nur 4.4% Abweichung vom Median
(±) | durchschnittlich lineare Bass-Wiedergabe (9.4% Delta zum Vorgänger)
Mitteltöne 400 - 2000 Hz
(+) | ausgeglichene Mitten, vom Median nur 2.3% abweichend
(+) | lineare Mitten (4.5% Delta zum Vorgänger)
Hochtöne 2 - 16 kHz
(+) | ausgeglichene Hochtöne, vom Median nur 3.3% abweichend
(+) | sehr lineare Hochtöne (3.9% Delta zum Vorgänger)
Gesamt im hörbaren Bereich 100 - 16.000 Hz
(+) | hörbarer Bereich ist sehr linear (9.5% Abstand zum Median
Im Vergleich zu allen Geräten derselben Klasse
» 1% aller getesteten Geräte dieser Klasse waren besser, 0% vergleichbar, 99% schlechter
» Das beste Gerät hat einen Delta-Wert von 7%, durchschnittlich ist 21%, das schlechteste Gerät hat 53%
Im Vergleich zu allen Geräten im Test
» 4% aller getesteten Geräte waren besser, 1% vergleichbar, 95% schlechter
» Das beste Gerät hat einen Delta-Wert von 4%, durchschnittlich ist 24%, das schlechteste Gerät hat 134%
Apple MacBook 12 (Early 2016) 1.1 GHz Audio Analyse
(+) | Die Lautsprecher können relativ laut spielen (83.6 dB)
Bass 100 - 315 Hz
(±) | abgesenkter Bass - 11.3% geringer als der Median
(±) | durchschnittlich lineare Bass-Wiedergabe (14.2% Delta zum Vorgänger)
Mitteltöne 400 - 2000 Hz
(+) | ausgeglichene Mitten, vom Median nur 2.4% abweichend
(+) | lineare Mitten (5.5% Delta zum Vorgänger)
Hochtöne 2 - 16 kHz
(+) | ausgeglichene Hochtöne, vom Median nur 2% abweichend
(+) | sehr lineare Hochtöne (4.5% Delta zum Vorgänger)
Gesamt im hörbaren Bereich 100 - 16.000 Hz
(+) | hörbarer Bereich ist sehr linear (10.2% Abstand zum Median
Im Vergleich zu allen Geräten derselben Klasse
» 7% aller getesteten Geräte dieser Klasse waren besser, 2% vergleichbar, 91% schlechter
» Das beste Gerät hat einen Delta-Wert von 5%, durchschnittlich ist 18%, das schlechteste Gerät hat 53%
Im Vergleich zu allen Geräten im Test
» 5% aller getesteten Geräte waren besser, 1% vergleichbar, 94% schlechter
» Das beste Gerät hat einen Delta-Wert von 4%, durchschnittlich ist 24%, das schlechteste Gerät hat 134%
Energieverwaltung
Stromverbrauch
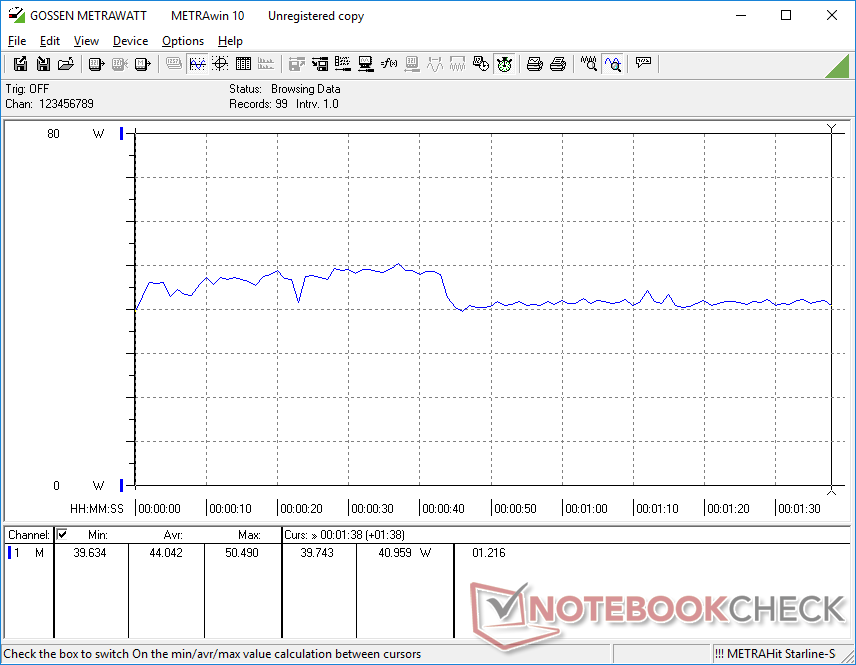
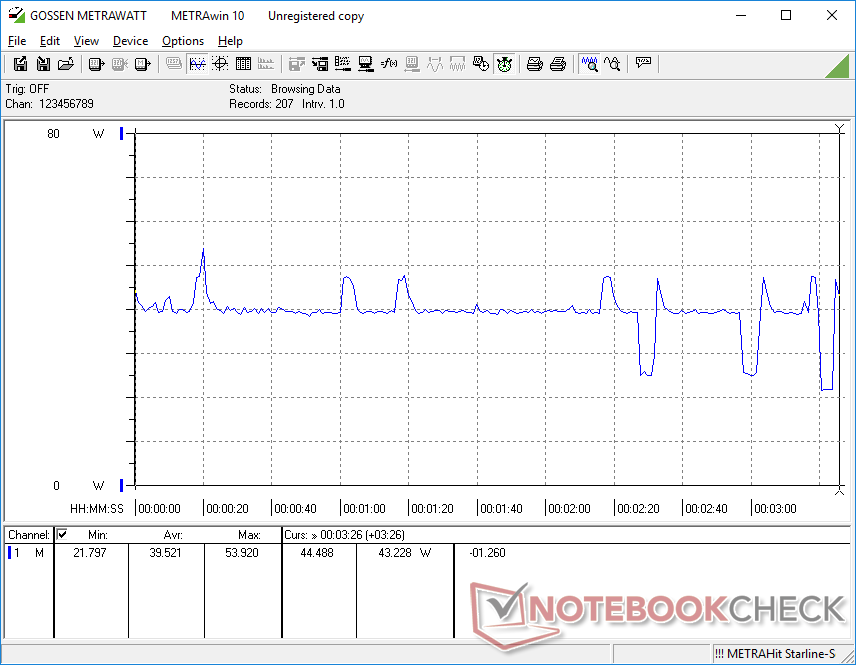
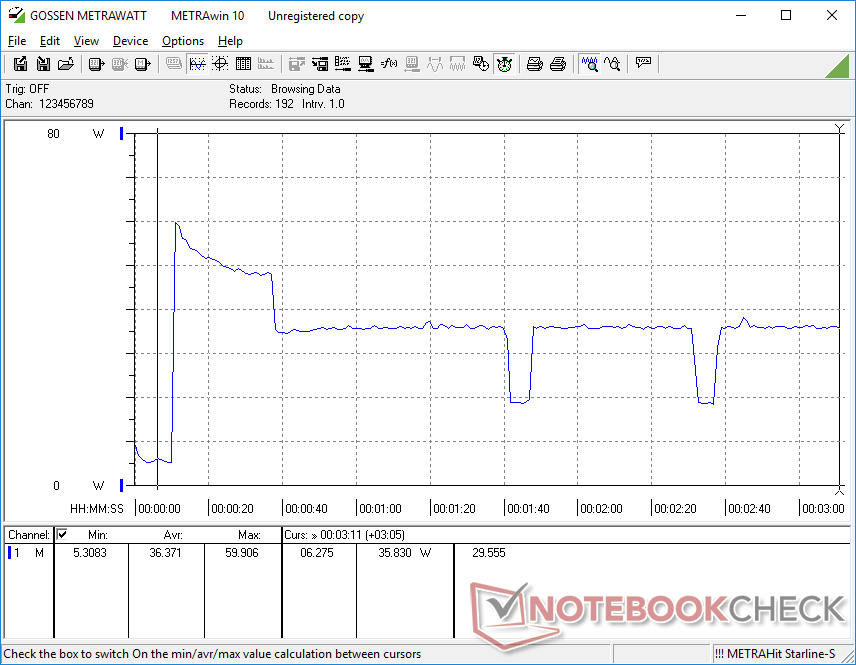
Die Ausführung des 3DMark 06 verbraucht auf unserem Latitude 9520 2-in-1 nur 44 W im Vergleich zu 46 W auf dem Latitude 9510 2-in-1, obwohl die Grafikleistung des neueren Modells deutlich höher ist. Somit erhalten die Besitzer eine durchschnittlich dreifache Steigerung der GPU-Leistung bei gleichem Stromverbrauch.
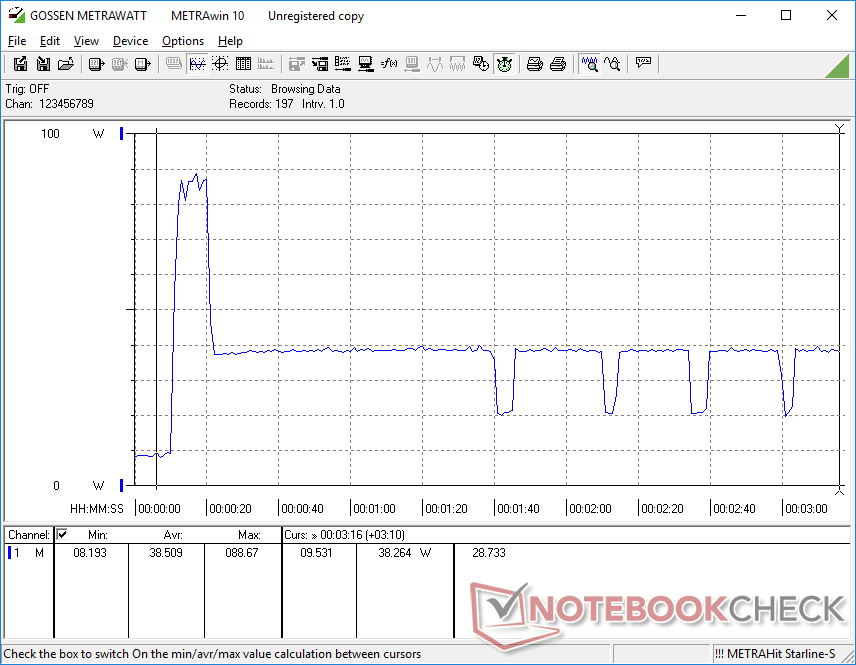
Leider spiegelt sich die oben erwähnte schwankende GPU-Leistung auch in den schwankenden Stromverbrauchswerten wider, wie unsere Grafiken unten zeigen. Bei der Ausführung von Witcher 3 unter Spielelast schwankt der Verbrauch zwischen 21 und 40 Watt, während er beim HP EliteBook 850 G8, das mit einer ähnlichen Core i7-1165G7 CPU ausgestattet ist, konstant bei 34 Watt liegt.
Mit dem kleinen (~13 x 6,6 x 2,3 cm) 90-Watt-Netzteil konnten wir eine maximale Leistungsaufnahme von 88,7 W messen. Das System ist aufgrund von thermischen Einschränkungen nicht in der Lage, diesen Wert länger als nur ein paar Sekunden zu halten.
| Aus / Standby | |
| Idle | |
| Last |
|
Legende:
min: | |
| Dell Latitude 15 9520 2-in-1 i7-1185G7, Iris Xe G7 96EUs, Toshiba KBG40ZNS512G NVMe, IPS, 1920x1080, 15" | Dell Latitude 9510 2-in-1 i7-10810U, UHD Graphics 620, Toshiba KBG40ZNS512G NVMe, IPS, 1920x1080, 15" | HP EliteBook 850 G8 3C7Z8EA i7-1165G7, Iris Xe G7 96EUs, Samsung PM981a MZVLB1T0HBLR, I, 1920x1080, 15.6" | Lenovo ThinkPad L15 G2 AMD R5 5600U, Vega 7, SK Hynix HFS512 GDE9X081N, IPS LED, 1920x1080, 15.6" | MSI Summit B15 A11M i7-1165G7, Iris Xe G7 96EUs, Kingston OM8PCP31024F, IPS, 1920x1080, 15.6" | Microsoft Surface Laptop 4 15 AMD TFF_00028 R7 4980U, Vega 8, SK Hynix BC511 HFM512GDJTNI, IPS, 2496x1664, 15" | |
|---|---|---|---|---|---|---|
| Stromverbrauch | 8% | -27% | -14% | -15% | -14% | |
| Idle min * (Watt) | 2.6 | 2.1 19% | 5.8 -123% | 4.57 -76% | 4.2 -62% | 3.6 -38% |
| Idle avg * (Watt) | 5 | 4.6 8% | 8.4 -68% | 8.2 -64% | 7.7 -54% | 6.5 -30% |
| Idle max * (Watt) | 7.1 | 5.3 25% | 9.9 -39% | 9.3 -31% | 8.4 -18% | 8.9 -25% |
| Last avg * (Watt) | 44 | 45.8 -4% | 33 25% | 31.9 27% | 37.8 14% | 46.5 -6% |
| Witcher 3 ultra * (Watt) | 39.5 | 34.3 13% | 34.5 13% | 36.6 7% | 43.4 -10% | |
| Last max * (Watt) | 88.7 | 96.3 -9% | 60 32% | 47.4 47% | 67.5 24% | 64.9 27% |
* ... kleinere Werte sind besser
Power Consumption Witcher 3 / Stresstest
Akkulaufzeit
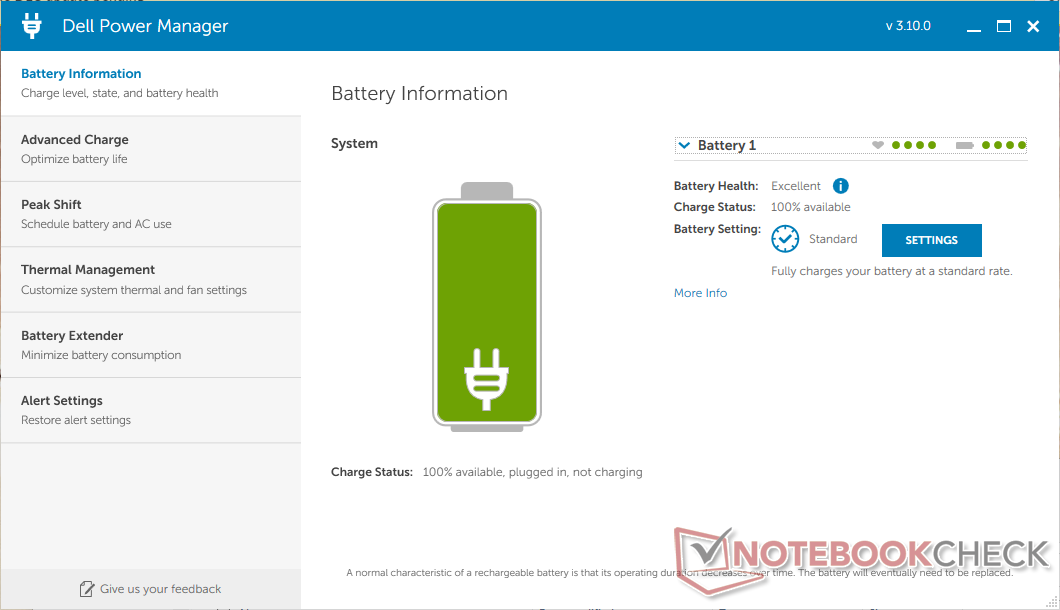
Die Laufzeit ist trotz des identischen 88-Wh-Akkus ein paar Stunden kürzer als beim letztjährigen Modell. Trotzdem sind 14+ Stunden reale WLAN-Nutzung immer noch nicht zu verachten und liegen weit über dem Durchschnitt für diese Größenklasse.
Dell bietet SKUs mit kleineren 46-Wh-Akkus für Benutzer an, die lieber Akkulaufzeit zugunsten eines leichteren Geräts opfern.
| Dell Latitude 15 9520 2-in-1 i7-1185G7, Iris Xe G7 96EUs, 88 Wh | Dell Latitude 9510 2-in-1 i7-10810U, UHD Graphics 620, 88 Wh | HP EliteBook 850 G8 3C7Z8EA i7-1165G7, Iris Xe G7 96EUs, 56 Wh | Lenovo ThinkPad L15 G2 AMD R5 5600U, Vega 7, 45 Wh | MSI Summit B15 A11M i7-1165G7, Iris Xe G7 96EUs, 52 Wh | Microsoft Surface Laptop 4 15 AMD TFF_00028 R7 4980U, Vega 8, 47.4 Wh | |
|---|---|---|---|---|---|---|
| Akkulaufzeit | 26% | -43% | -47% | -55% | -30% | |
| WLAN (h) | 14.8 | 18.7 26% | 8.5 -43% | 7.8 -47% | 6.6 -55% | 10.4 -30% |
| Idle (h) | 59 | 18.4 | ||||
| Last (h) | 4 | 2.3 | 1 | 2.5 | ||
| H.264 (h) | 6.6 | 14.8 |
Pro
Contra
Fazit
Der Latitude 9520 2-in-1 bietet deutliche Leistungsvorteile gegenüber dem Latitude 9510 2-in-1, zumindest auf dem Papier. Der ältere UHD Graphics 620 ist überflüssig geworden, seit Iris Xe immer häufiger eingesetzt wird. In der Praxis gibt es jedoch einige Vorbehalte, die potenzielle Käufer nicht ignorieren sollten.
Erstens läuft die Iris-Xe-GPU im neuen Latitude mit zyklischen Taktraten, was zu zyklischen Bildraten bei Spielen oder zu einer unsteten Leistung bei GPU-intensiven Aufgaben führt. Die Bildwiederholraten können so stark schwanken, dass einige Anwendungen, bei denen eine konstante Bildwiederholrate wichtig ist, fast unspielbar werden. Wir empfehlen, einen Blick auf andere Tiger-Lake-U-Laptops, wie das MSI Summit E13 Flip oder das HP EliteBook 840 Aero G8 zu werfen, wenn eine konstantere und zuverlässigere GPU-Leistung erwünscht ist.
Das Hauptargument für das Latitude 9520 2-in-1 gegenüber dem 9510 2-in-1 ist die deutlich schnellere integrierte Grafikleistung. Dass sie jedoch ungewöhnlich unstet ist, könnte aber manch Interessenten abschrecken.
Zweitens ist die Multi-Thread-CPU-Leistung unserer Core-i7-1185G7-CPU im Vergleich zum älteren Core i7-10810U des Latitude 9510 2-in-1 langsamer. Obwohl dieser Nachteil nicht nur bei Dell-PCs auftritt, ist der i7-1185G7 im Latitude 9520 2-in-1 langsamer als in vielen anderen Laptops mit dem gleichen Prozessor. Somit wird das Multi-Thread-Leistungsdefizit auf dem Dell noch verstärkt.
Die Gründe, sich für das Latitude 9520 2-in-1 gegenüber dem 9510 2-in-1 zu entscheiden, sind geringer, als uns lieb ist, zumal das neuere Modell nichts Neues in Bezug auf Displayqualität, Webcamqualität oder Akkulaufzeit bietet. Hoffentlich kann die ungleichmäßige GPU-Leistung mit einem zukünftigen Update behoben werden.
Preis und Verfügbarkeit
Bei unserem Testgerät handelte es sich um die High-End-Konfiguration mit der vPro-fähigen Core i7-1185G7-CPU, Iris Xe 96 EUs-GPU, 16 GB RAM und 512 GB NVMe-SSD. Es für ca. 2.300 Euro bei diversen Anbietern erhältlich.
Dell Latitude 15 9520 2-in-1
- 22.11.2021 v7 (old)
Allen Ngo
Preisvergleich

