Dell Precision 5560 Workstation im Test: Boost dank Quadro RTX A2000
Das Dell Precision 5560 ist ein Refresh des Precision 5550 aus dem Vorjahr. Beide Modelle basieren auf dem neuen XPS-15-9500/9510-Gehäuse, wodurch alle Modelle über ein 16:10-Panel und die gleichen physischen Eigenschaften verfügen. Wir empfehlen Ihnen daher, einen Blick auf unsere Testberichte des Precision 5550, XPS 15 9500 und XPS 15 9510 zu werfen, da unserer Aussagen zu diesen Geräten auch für das Precision 5560 gelten.
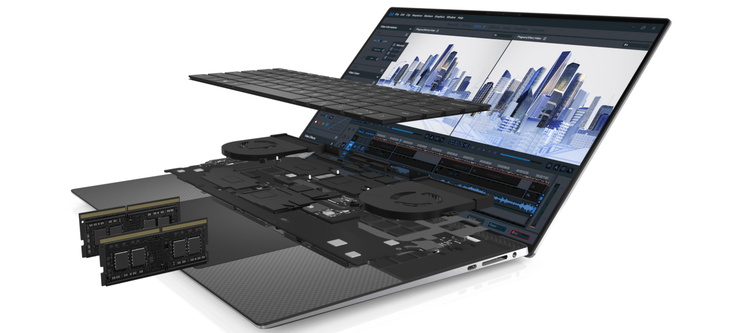
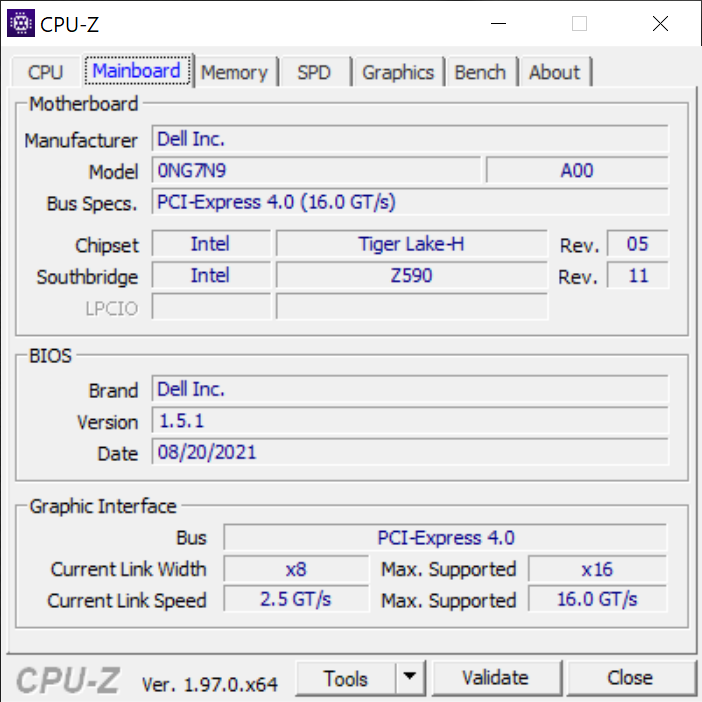
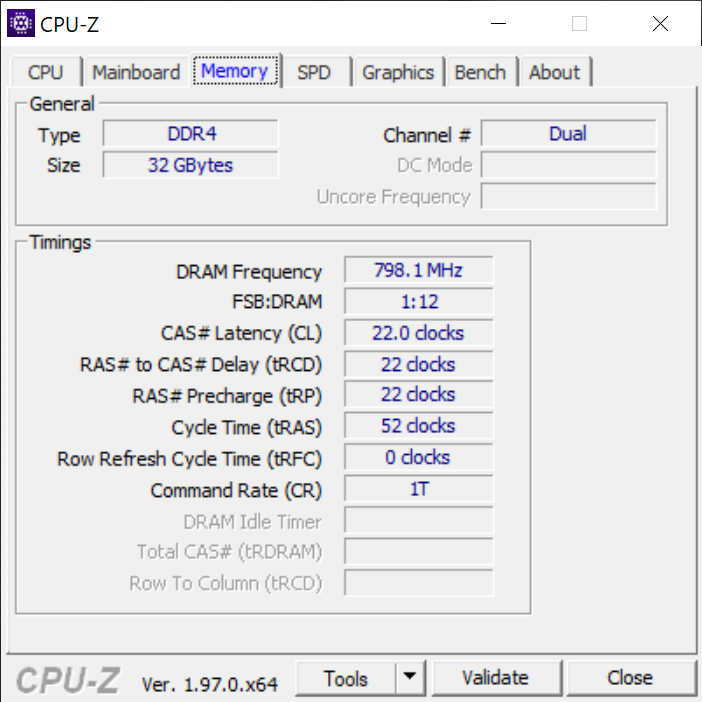
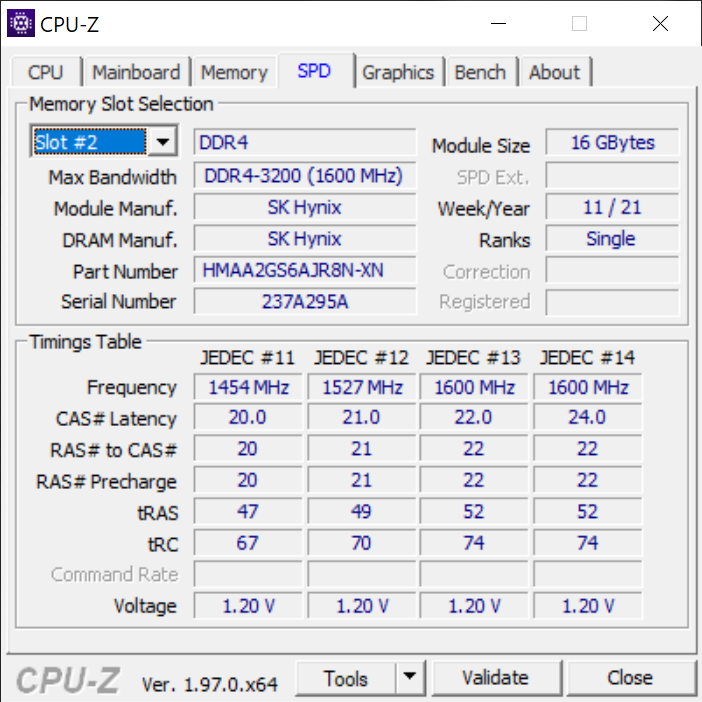
Im Gegensatz zum Precision 5550 ist das Precision 5560 mit Tiger-Lake-H-CPUs der 11. Generation und Nvidia Ampere GPUs ausgestattet und ersetzt damit die älteren Comet-Lake-H-CPUs und Turing-GPUs. Die Konfigurationen reichen von der Core i5-11500H mit Quadro T1200 GPU, 1.200p-Display und 8 GB RAM für 2.400 EUR bis hin zu einer Version mit i9-11950H oder Xeon W-11955M vPro und Quadro RTX A2000 GPU, 2.400p-Touchscreen und einem 64-GB ECC-RAM-Modul für 4.000 EUR. Unser Testmodell ist eine Mittelklasse-Konfiguration, die für rund 3.000 EUR erhältlich ist.
Zu den Mitstreitern gehören andere 15,6-Zoll Ultra-Thin-Workstations wie das HP ZBook Studio 15 G8, das Asus ProArt StudioBook Pro 15, das Lenovo ThinkPad P15 Gen 2, das MSI WS66 oder das Razer Blade 15 Studio Edition.
Weitere Dell-Testberichte:
Potenzielle Mitstreiter im Vergleich
Bew. | Datum | Modell | Gewicht | Dicke | Größe | Auflösung | Preis ab |
|---|---|---|---|---|---|---|---|
| 88.3 % v7 (old) | 10 / 2021 | Dell Precision 5000 5560 i7-11850H, RTX A2000 Laptop GPU | 2 kg | 18 mm | 15.60" | 3840x2400 | |
| 87.2 % v7 (old) | 09 / 2021 | Lenovo ThinkPad P15 G2-20YQ001JGE i7-11800H, RTX A3000 Laptop GPU | 2.9 kg | 31.5 mm | 15.60" | 1920x1080 | |
| 87.8 % v7 (old) | 09 / 2021 | HP ZBook Studio 15 G8 i9-11950H, GeForce RTX 3070 Laptop GPU | 1.9 kg | 18 mm | 15.60" | 3840x2160 | |
| 83.1 % v7 (old) | 11 / 2020 | Asus ProArt StudioBook Pro 15 W500G5T i7-9750H, Quadro RTX 5000 Max-Q | 2 kg | 18.9 mm | 15.60" | 3840x2160 | |
| 87.8 % v7 (old) | 08 / 2020 | Dell Precision 7550 W-10885M, Quadro RTX 5000 Max-Q | 2.8 kg | 27.36 mm | 15.60" | 3840x2160 | |
| 86.3 % v7 (old) | 08 / 2020 | Dell Precision 5550 P91F i7-10875H, Quadro T2000 Max-Q | 2 kg | 18 mm | 15.60" | 3840x2400 | |
| 87 % v7 (old) | 08 / 2020 | Razer Blade 15 Studio Edition 2020 i7-10875H, Quadro RTX 5000 Max-Q | 2.2 kg | 13.98 mm | 15.60" | 3840x2160 |
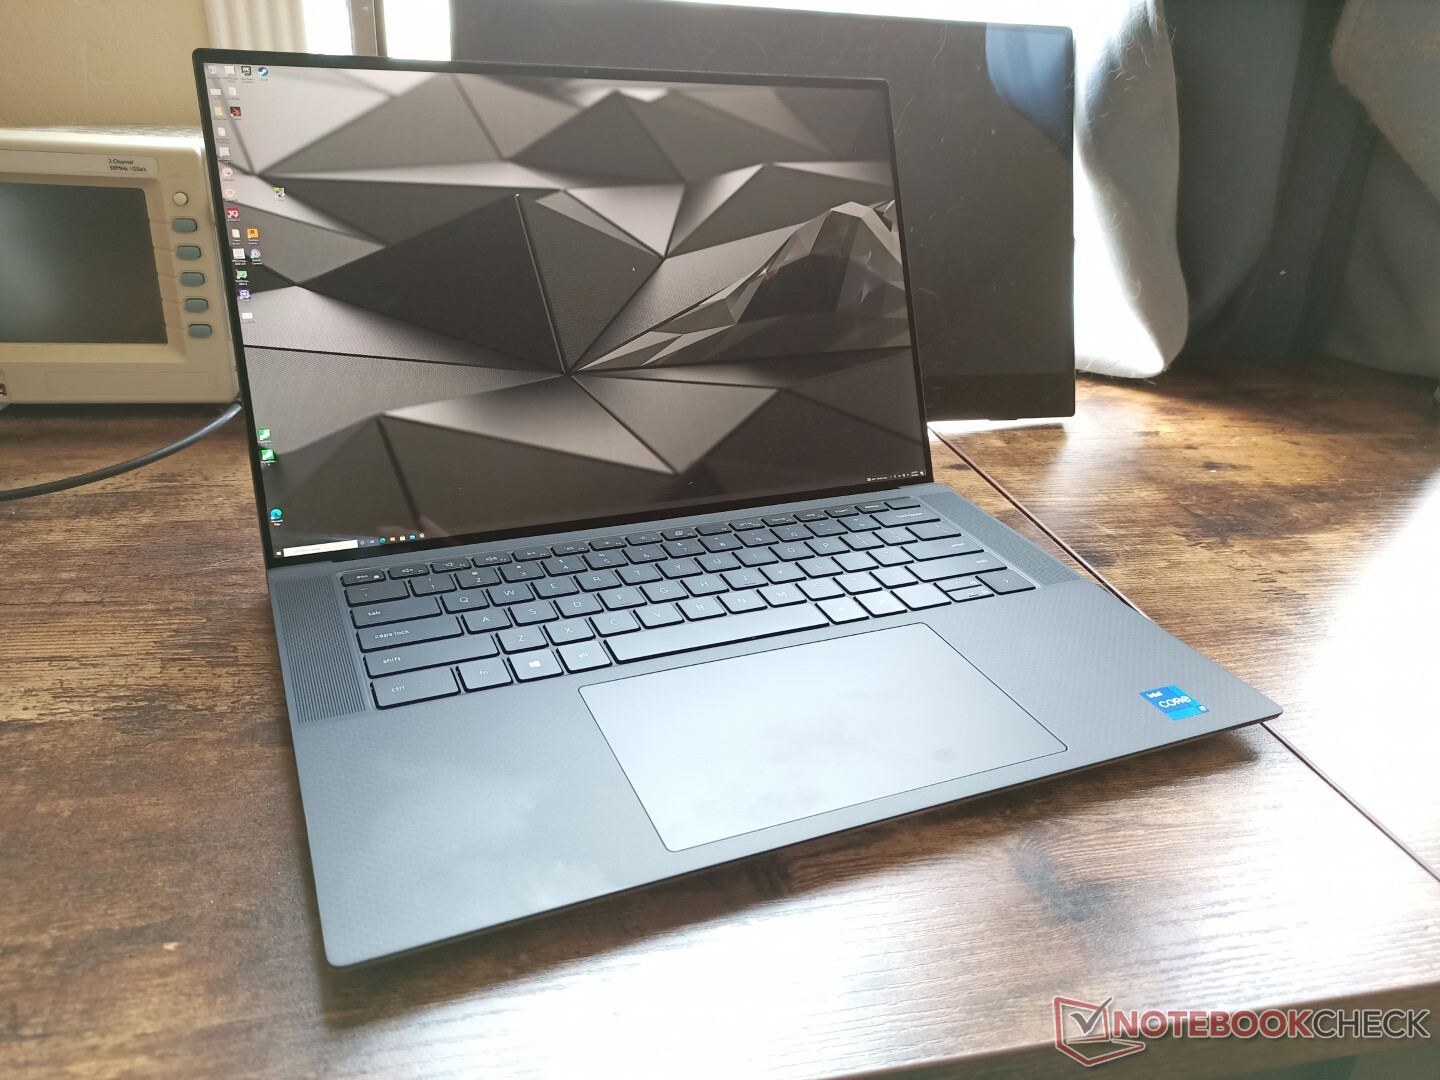
Gehäuse — Professionelles XPS
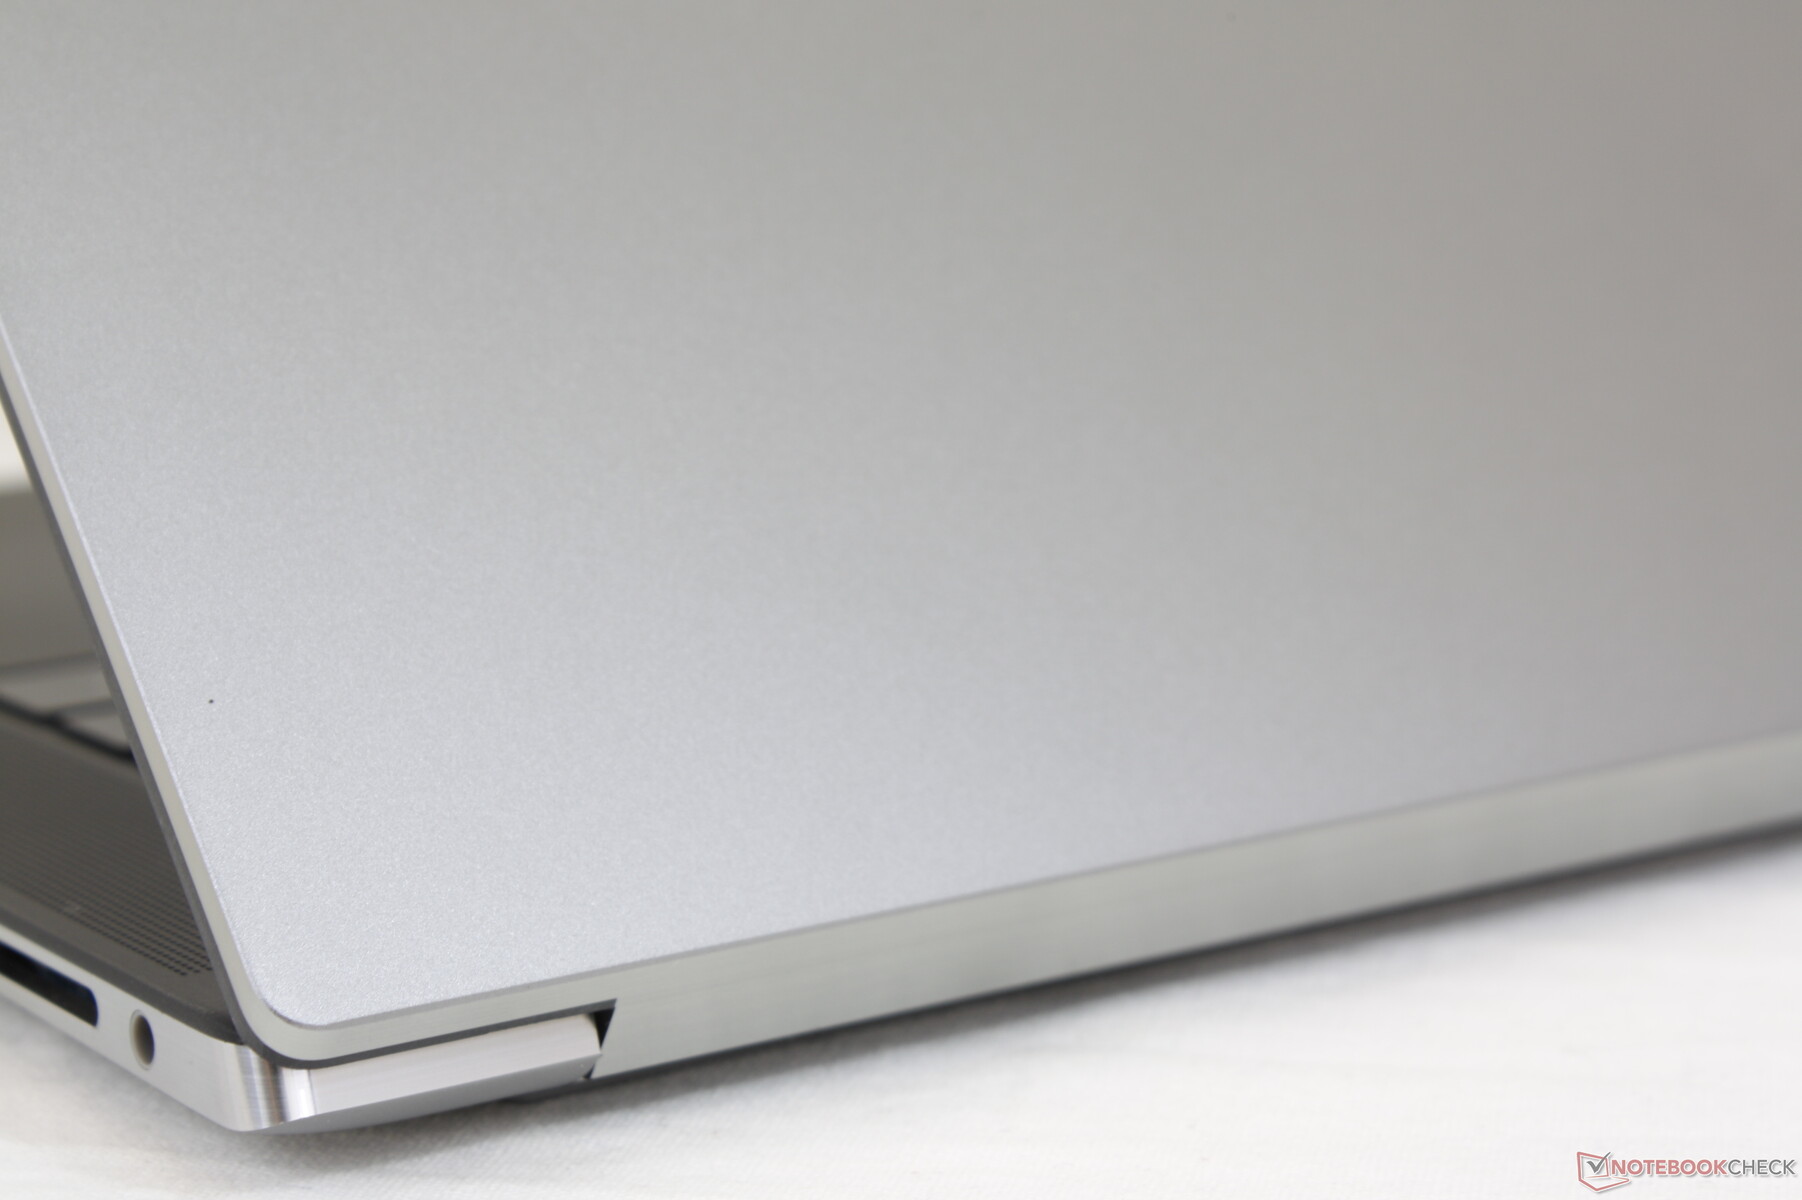
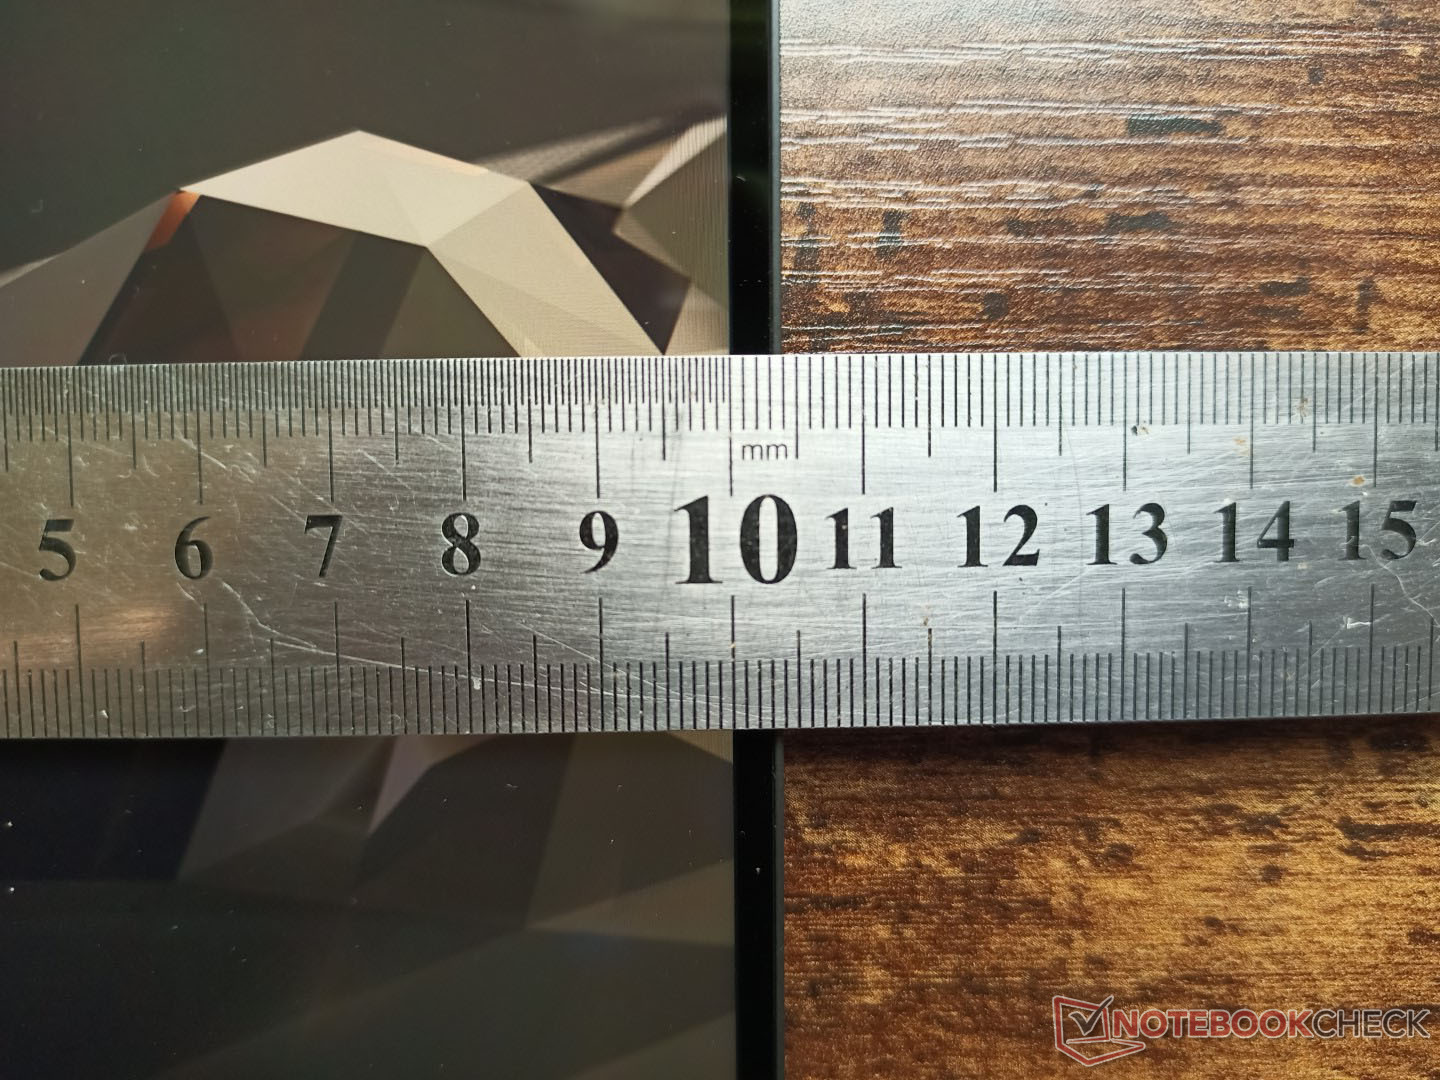
Gehäuse und Größe des Dell Precision 5560 sind mit 18 x 433,72 x 230,14 mm mit dem XPS 15 9500 oder 9510 ident. Laut Dell-Produktseite ist das Precision 5560 allerdings mit 11,64 mm an der dicksten Stelle deutlich dünner. Das ist nicht richtig. Wir vermuten, dass Dell begonnen hat, die Dicke anders zu messen, was für Kunden recht irreführend ist. Beim XPS 13 7390 2-in-1 und XPS 13 9310 2-in-1 ist es ähnlich.
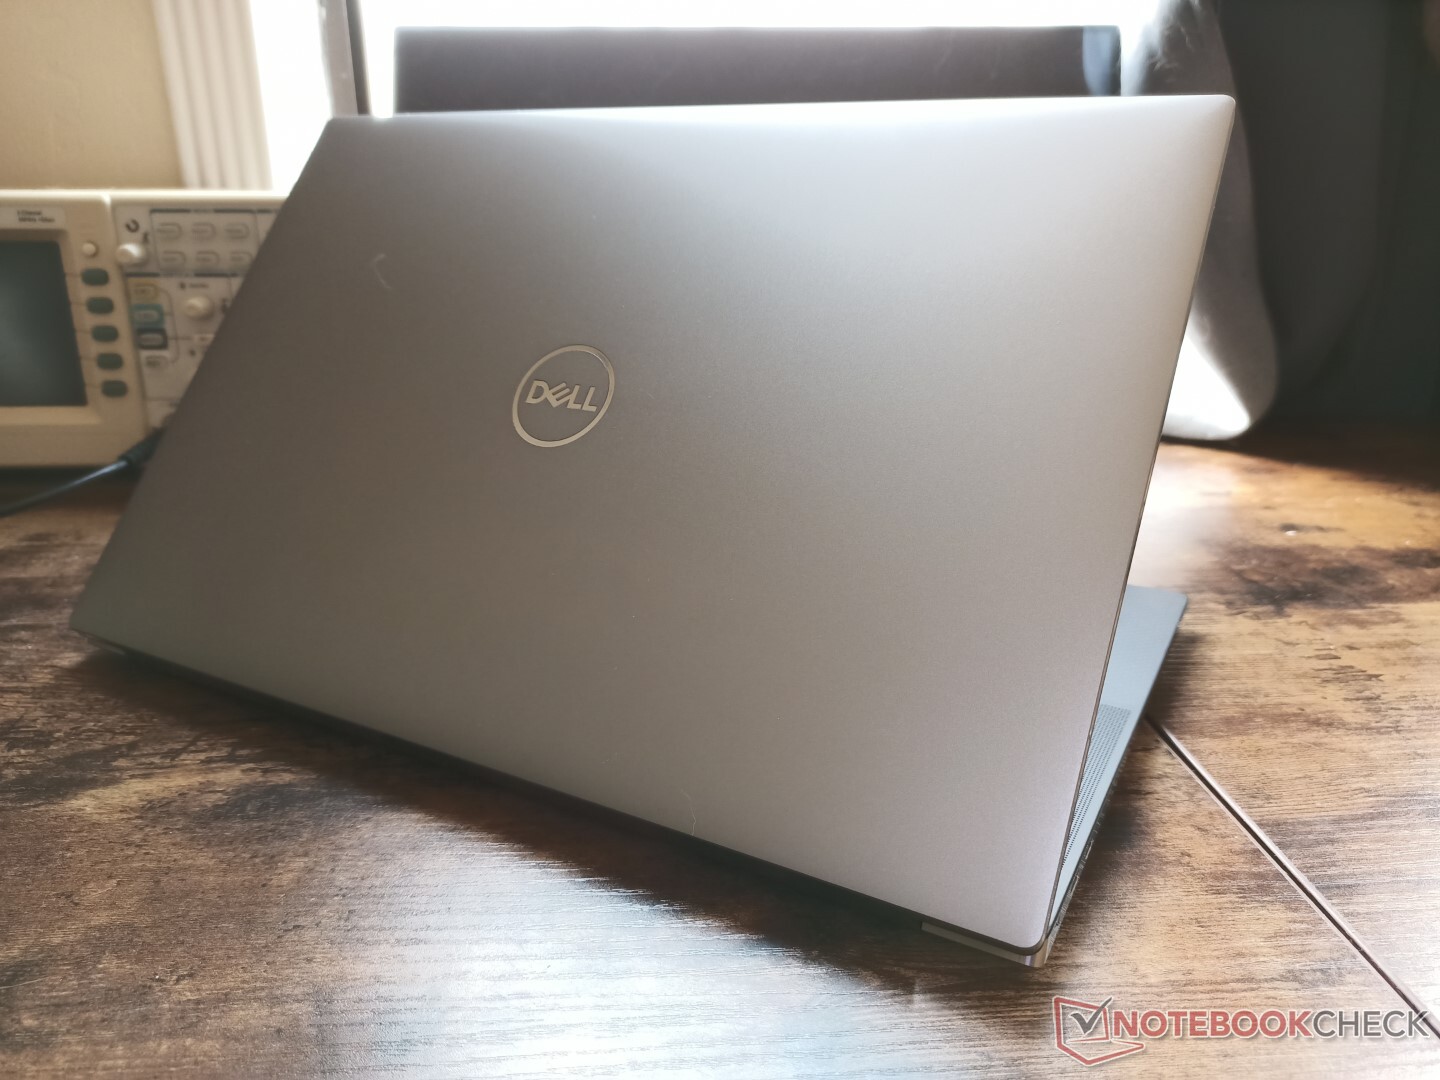
Wie immer besteht der Deckel aus einer Magnesiumlegierung mit einem dunkleren Grauton als das normale XPS 15, um die Precision-55x0-Reihe von der XPS-15-Reihe zu unterscheiden.
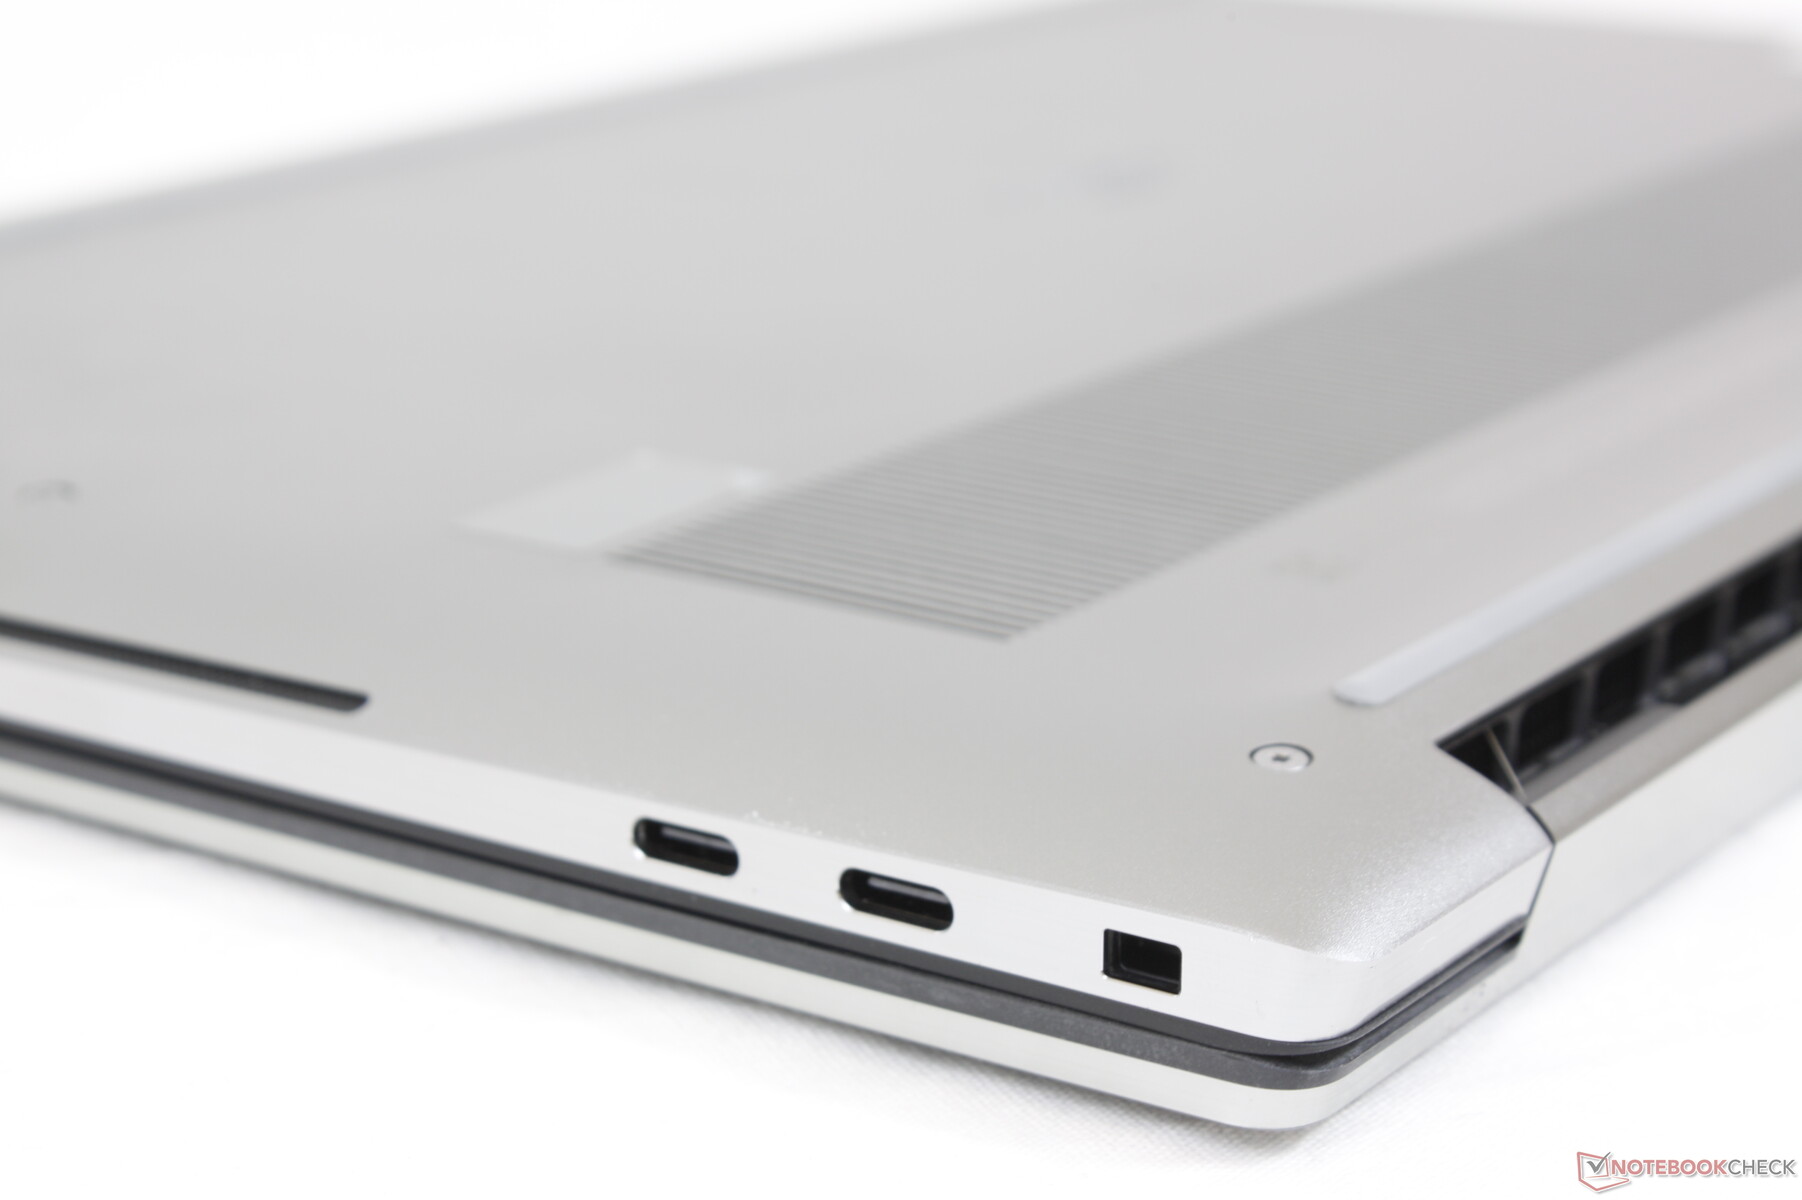
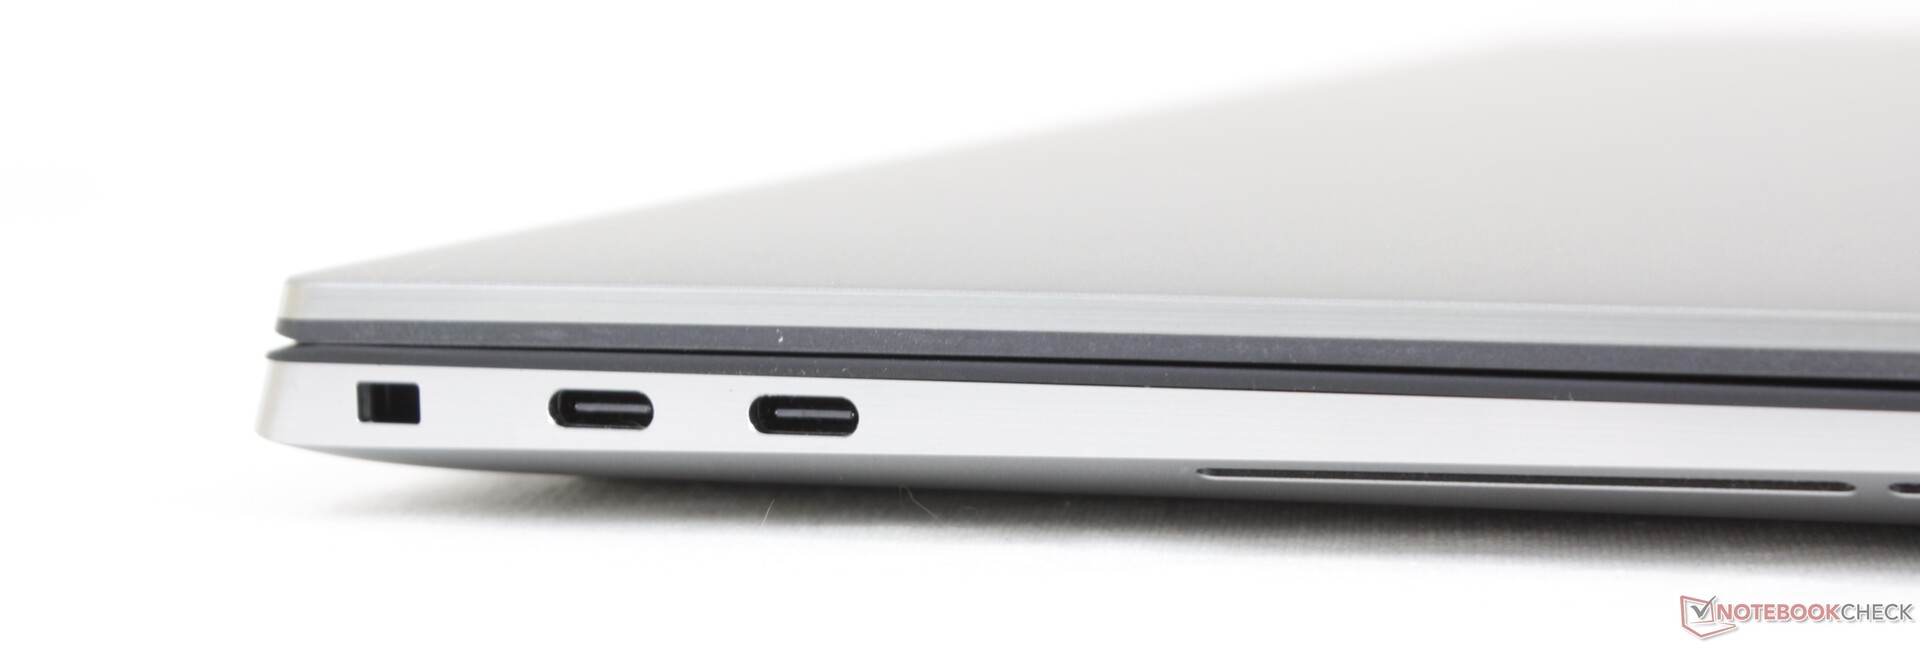
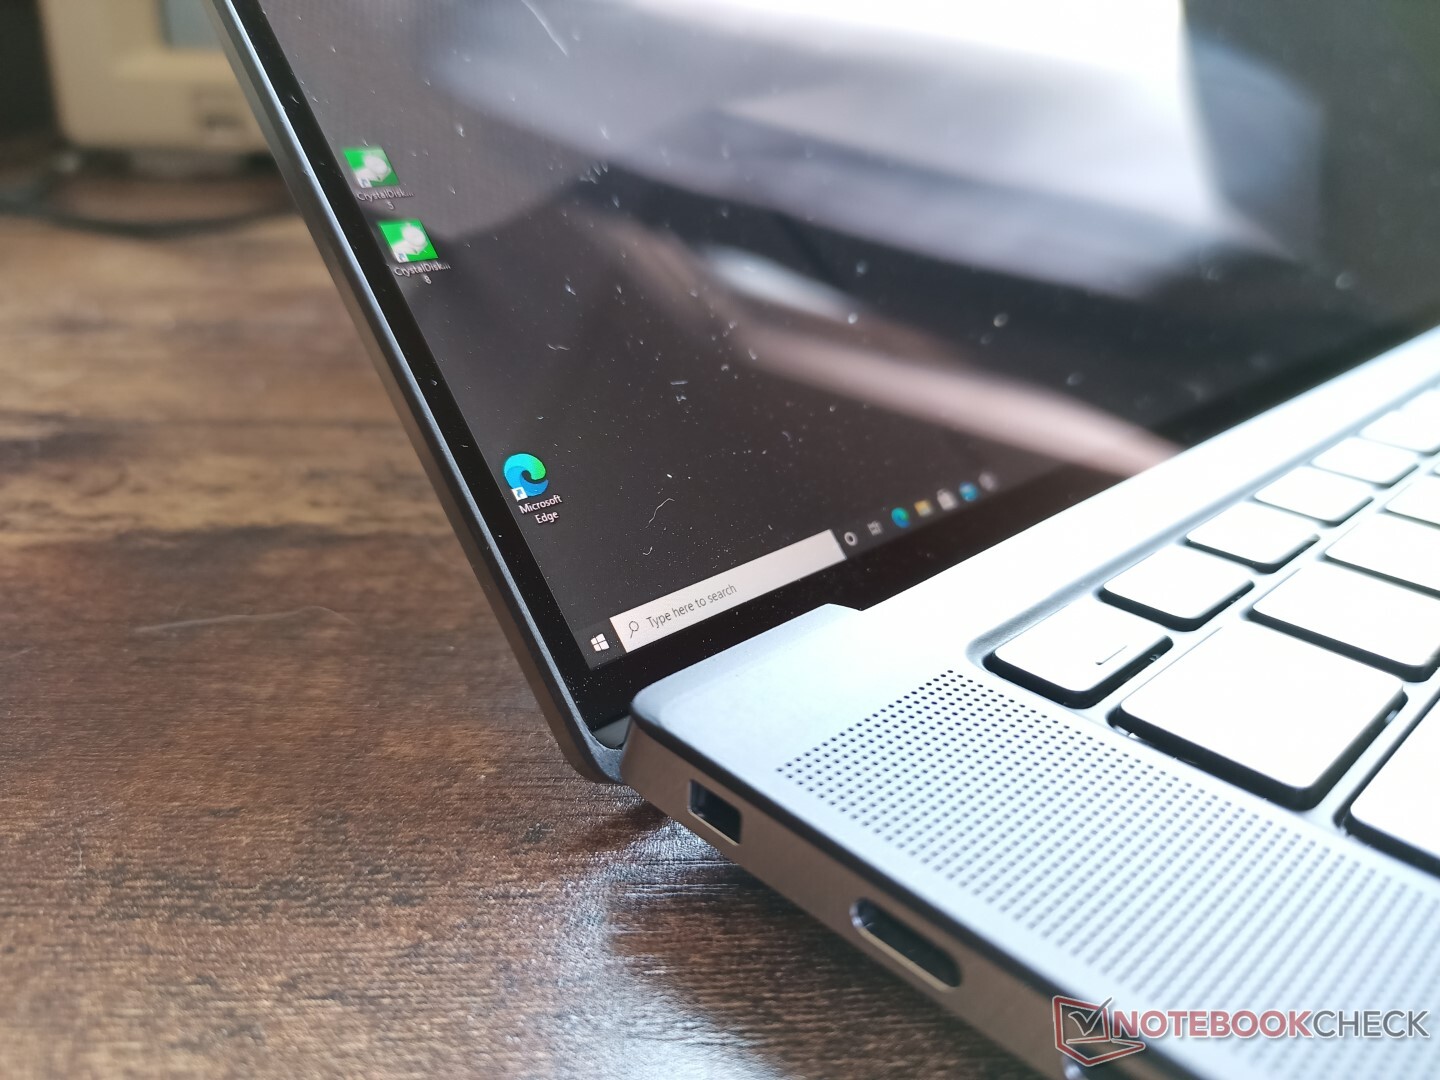
Ausstattung — Thunderbolt 4 ist zur Stelle
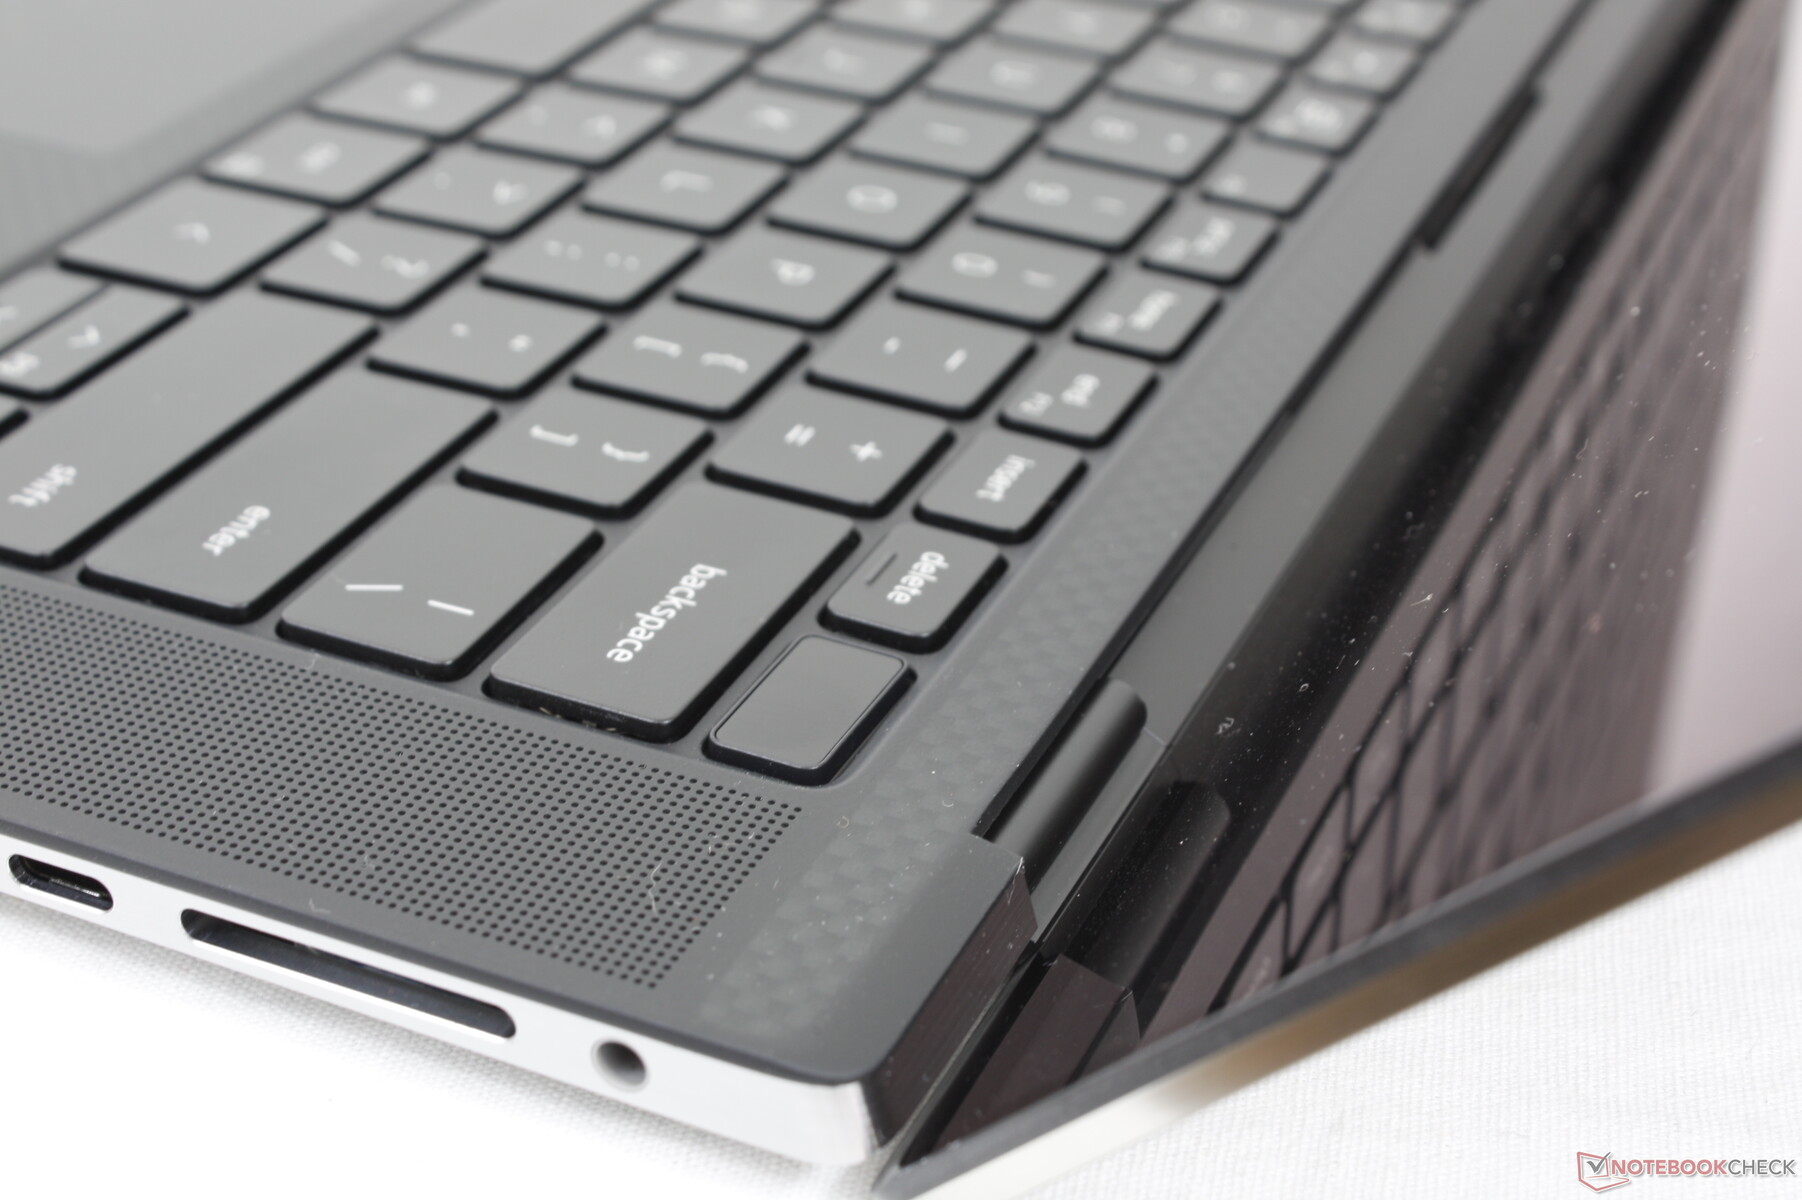
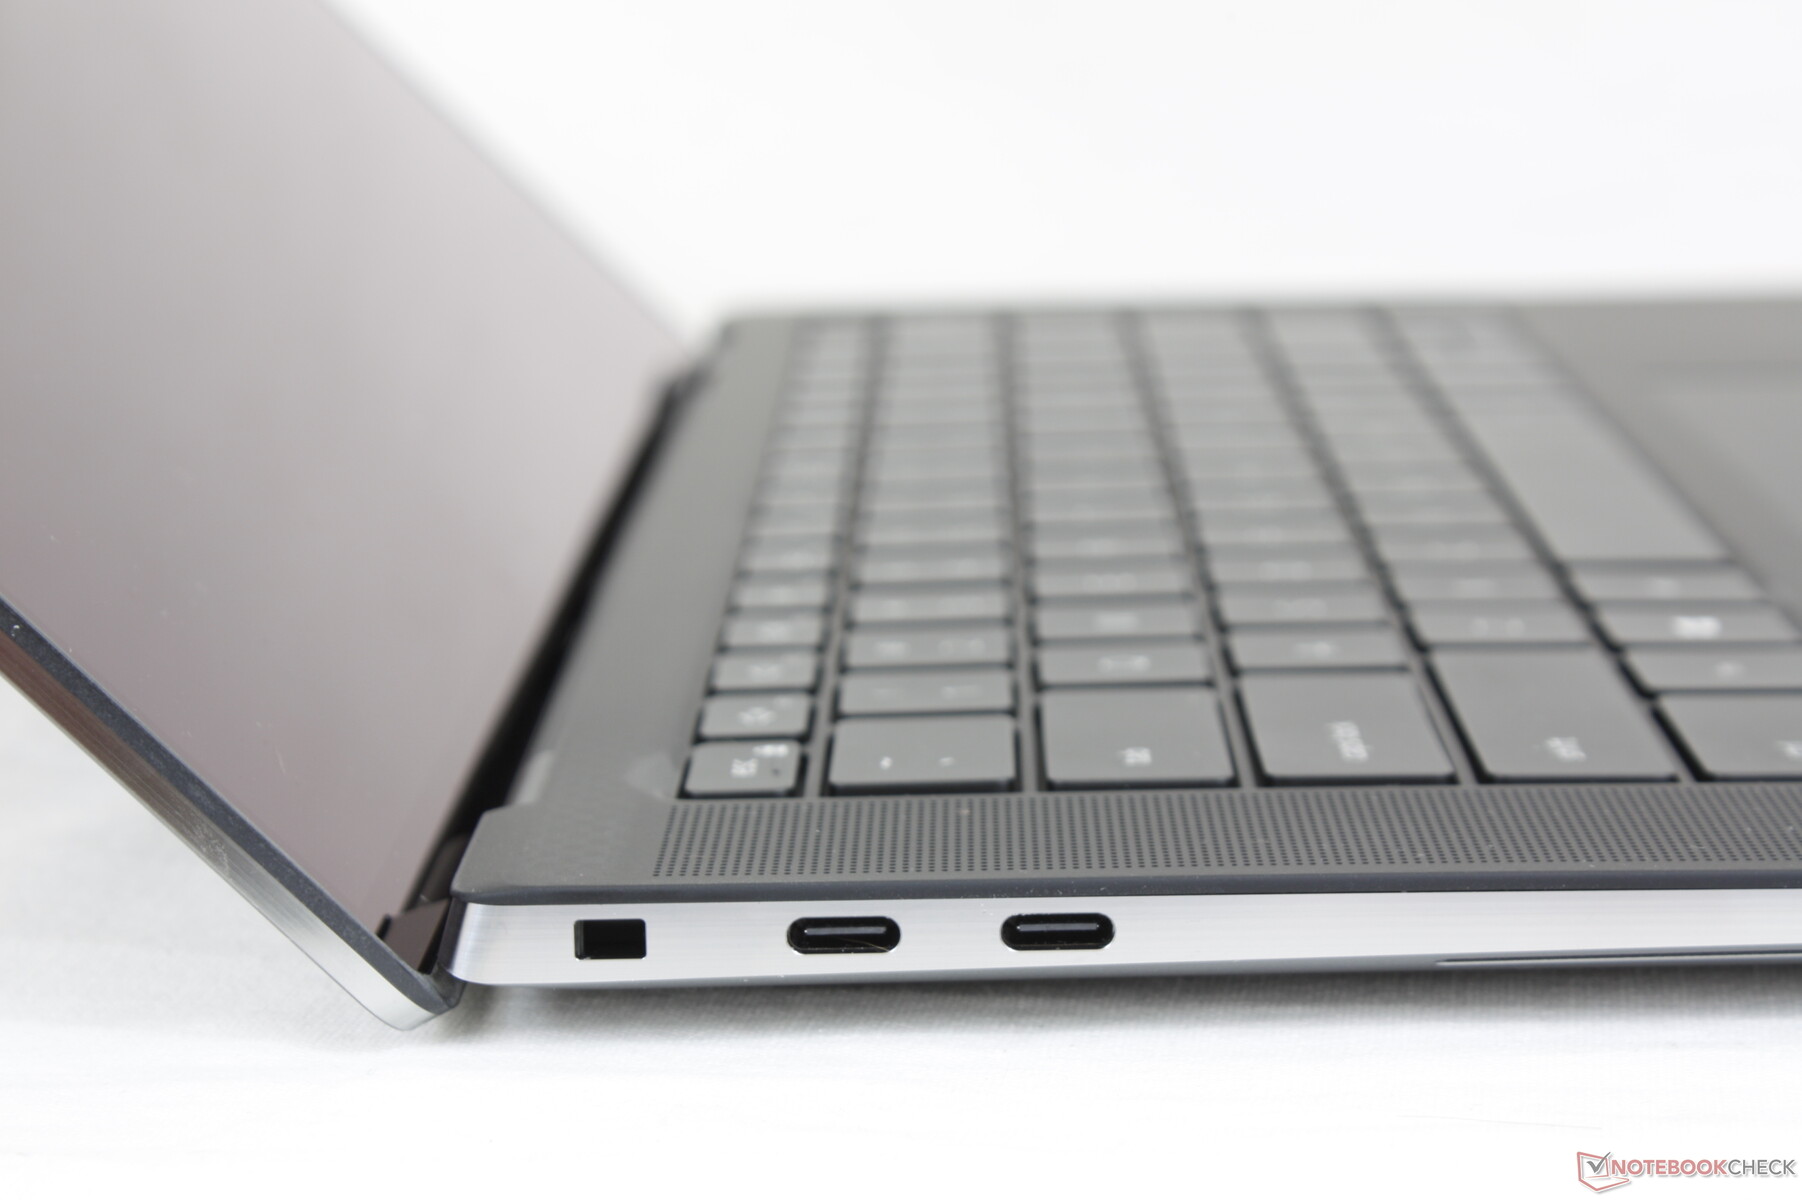
Das Gerät ist ausschließlich mit USB-C-Anschlüssen ausgestattet, Nutzer müssen also immer die passenden Adapter bei sich haben. Alle drei USB-C-Ports unterstützten sowohl DisplayPort als auch Power Delivery, doch nur die beiden Ports auf der linken Seite unterstützten Thunderbolt. Allerdings wurden diese beiden Anschlüsse von Thunderbolt 3 im Precision 5550 jetzt auf Thunderbolt 4 aufgewertet.
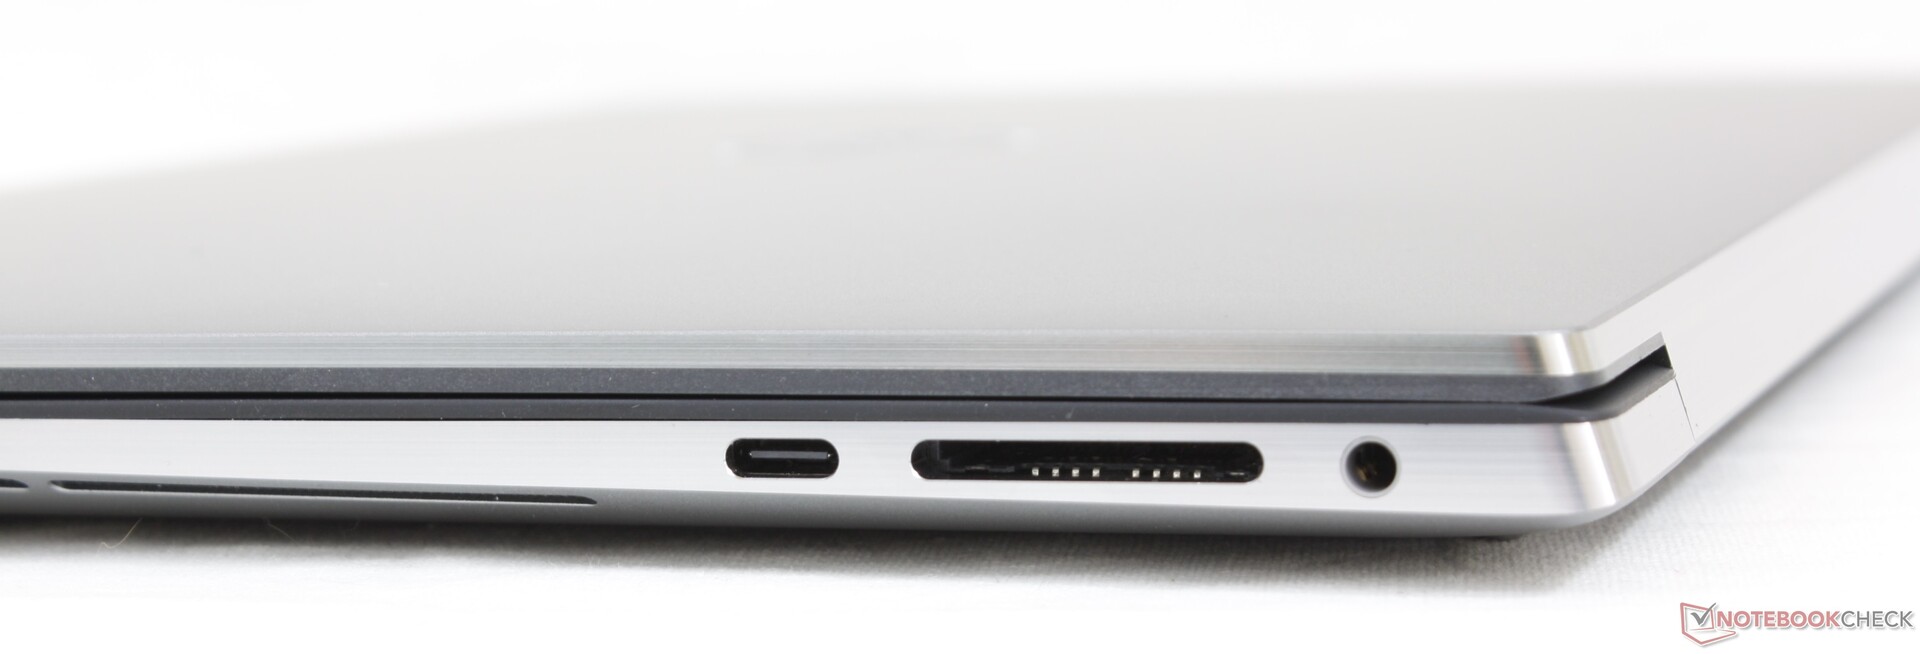
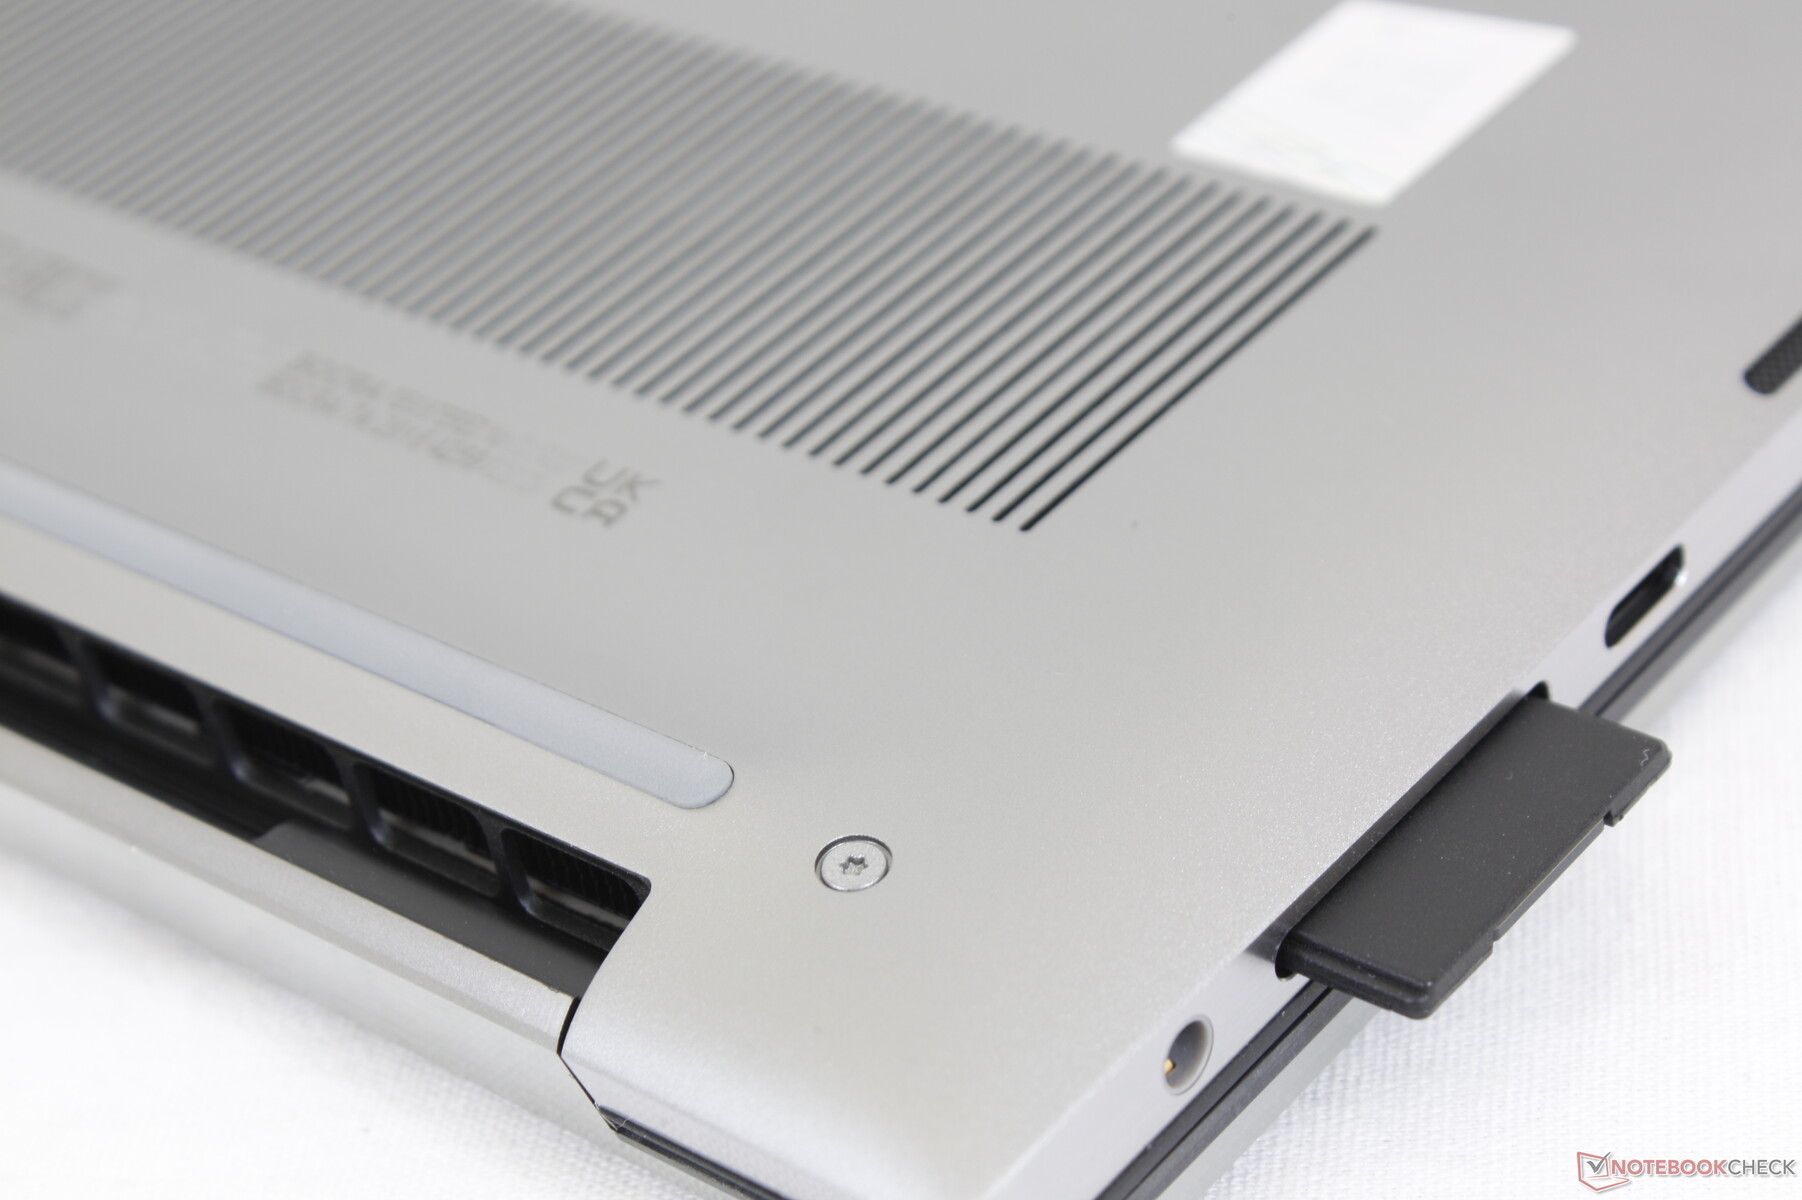
SDCardreader
Die Übertragungsrate ist sehr schnell und erreicht mit unserer UHS-II-Referenzkarte fast 200 MB/s. Der Kartenleser ist nicht federbelastet, was bedeutet, dass die SD-Karte etwas aus dem Gerät hervorsteht.
| SD Card Reader | |
| average JPG Copy Test (av. of 3 runs) | |
| Lenovo ThinkPad P15 G2-20YQ001JGE (AV Pro V60) | |
| Dell Precision 5000 5560 (AV Pro V60) | |
| Dell Precision 5550 P91F (Toshiba Exceria Pro SDXC 64 GB UHS-II) | |
| Dell Precision 7550 (Toshiba Exceria Pro SDXC 64 GB UHS-II) | |
| Razer Blade 15 Studio Edition 2020 (Toshiba Exceria Pro SDXC 64 GB UHS-II) | |
| HP ZBook Studio 15 G8 (AV Pro V60) | |
| maximum AS SSD Seq Read Test (1GB) | |
| Lenovo ThinkPad P15 G2-20YQ001JGE (AV Pro V60) | |
| Dell Precision 5000 5560 (AV Pro V60) | |
| Dell Precision 5550 P91F (Toshiba Exceria Pro SDXC 64 GB UHS-II) | |
| Dell Precision 7550 (Toshiba Exceria Pro SDXC 64 GB UHS-II) | |
| HP ZBook Studio 15 G8 (AV Pro V60) | |
Kommunikation
Webcam — Immer noch kein Webcam-Shutter


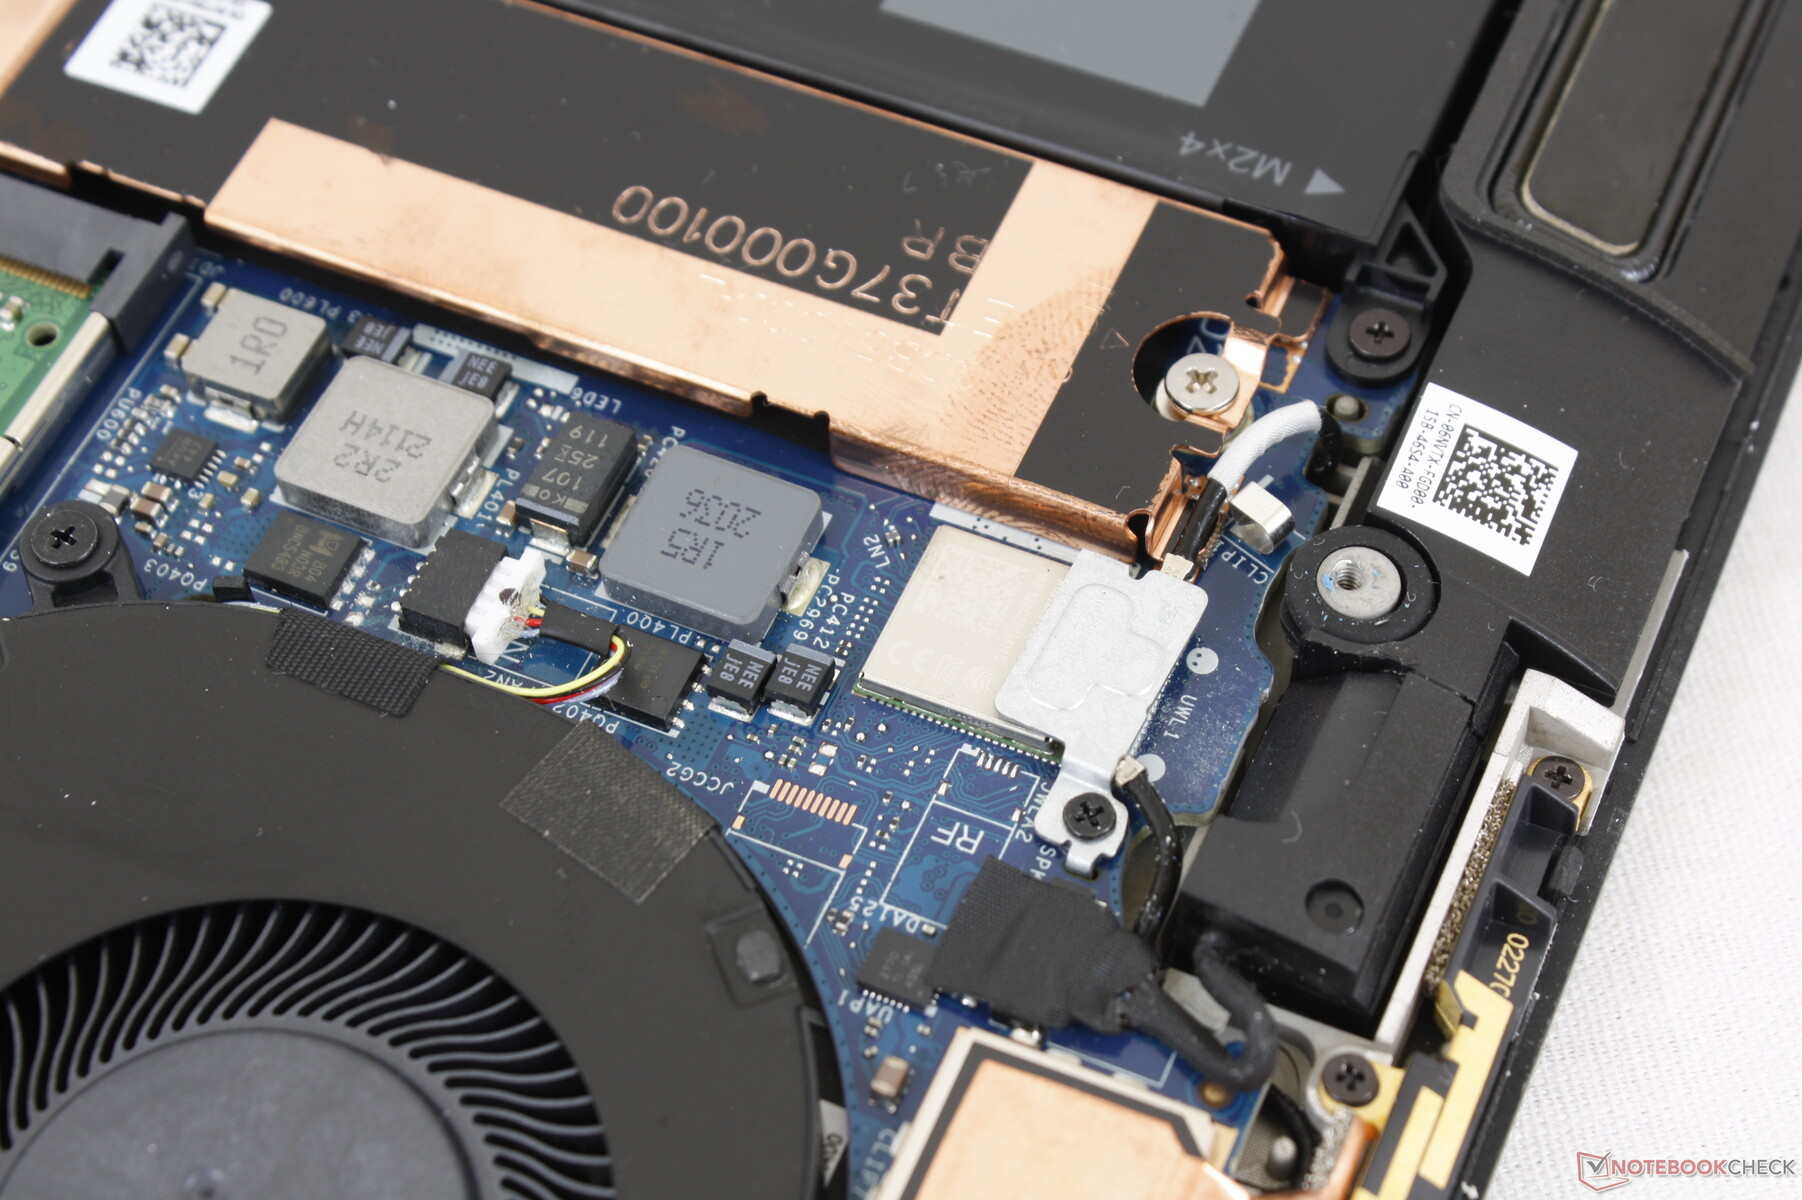
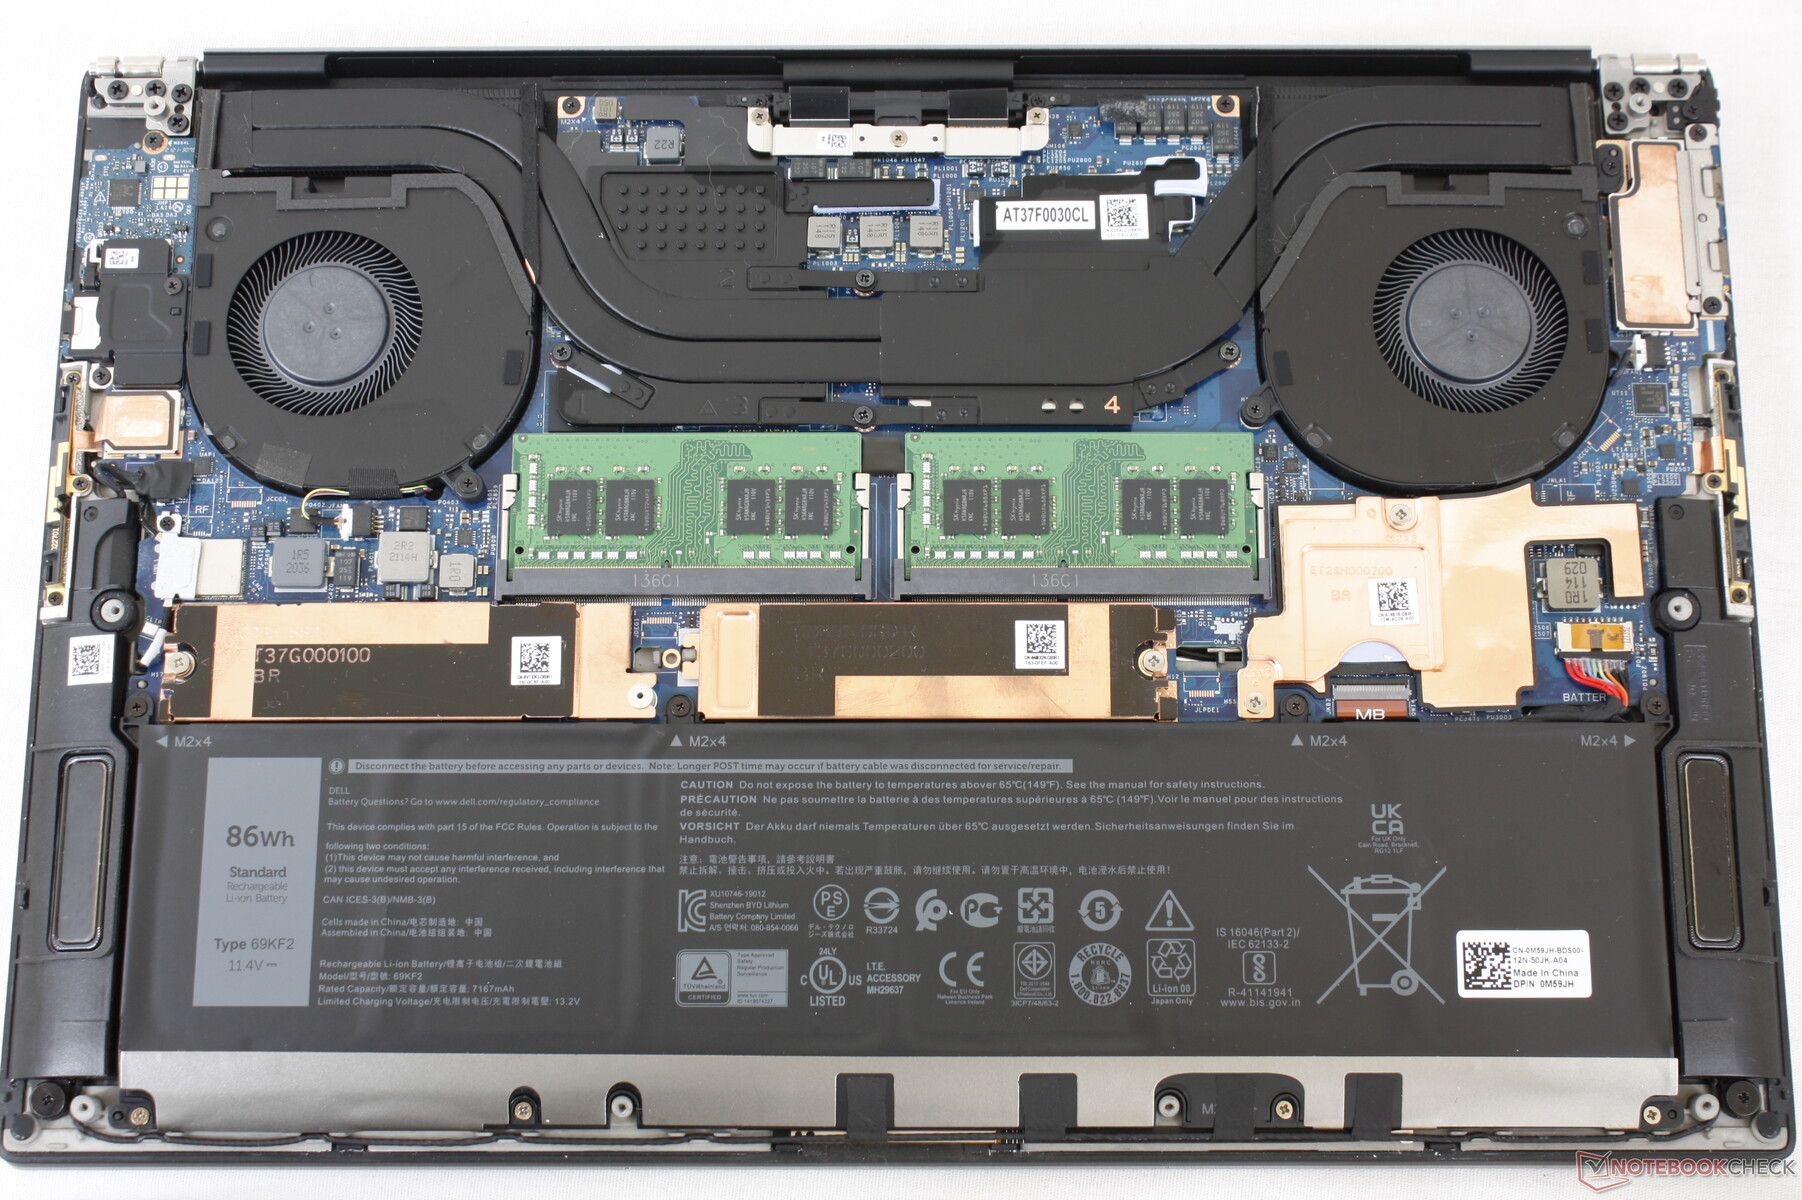
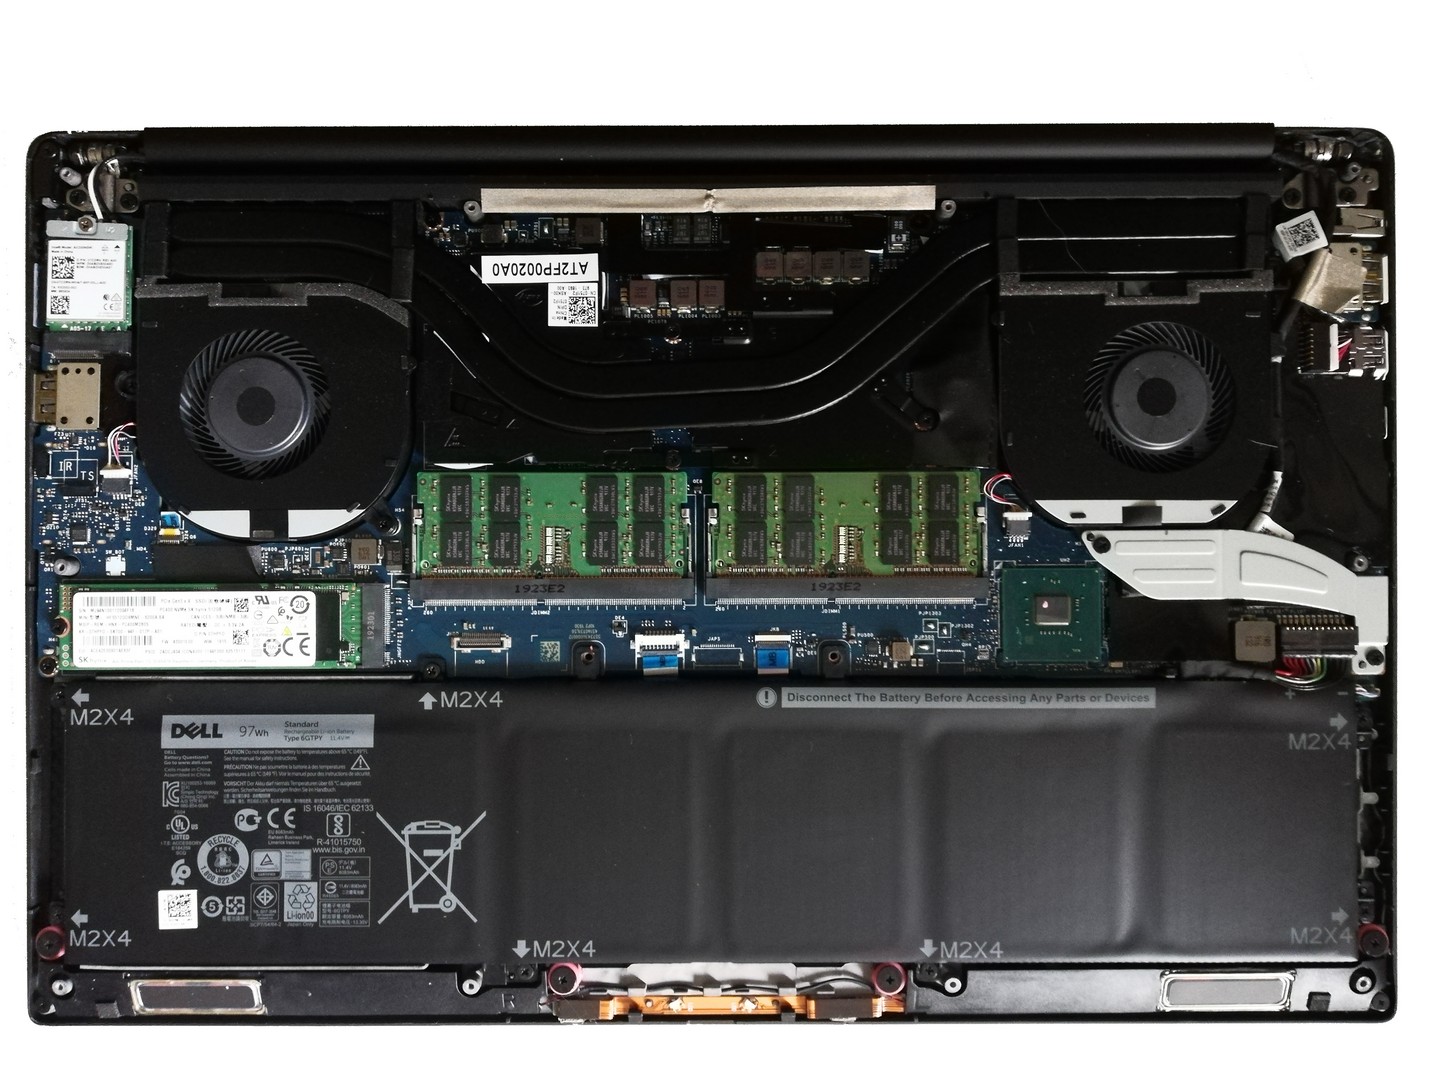
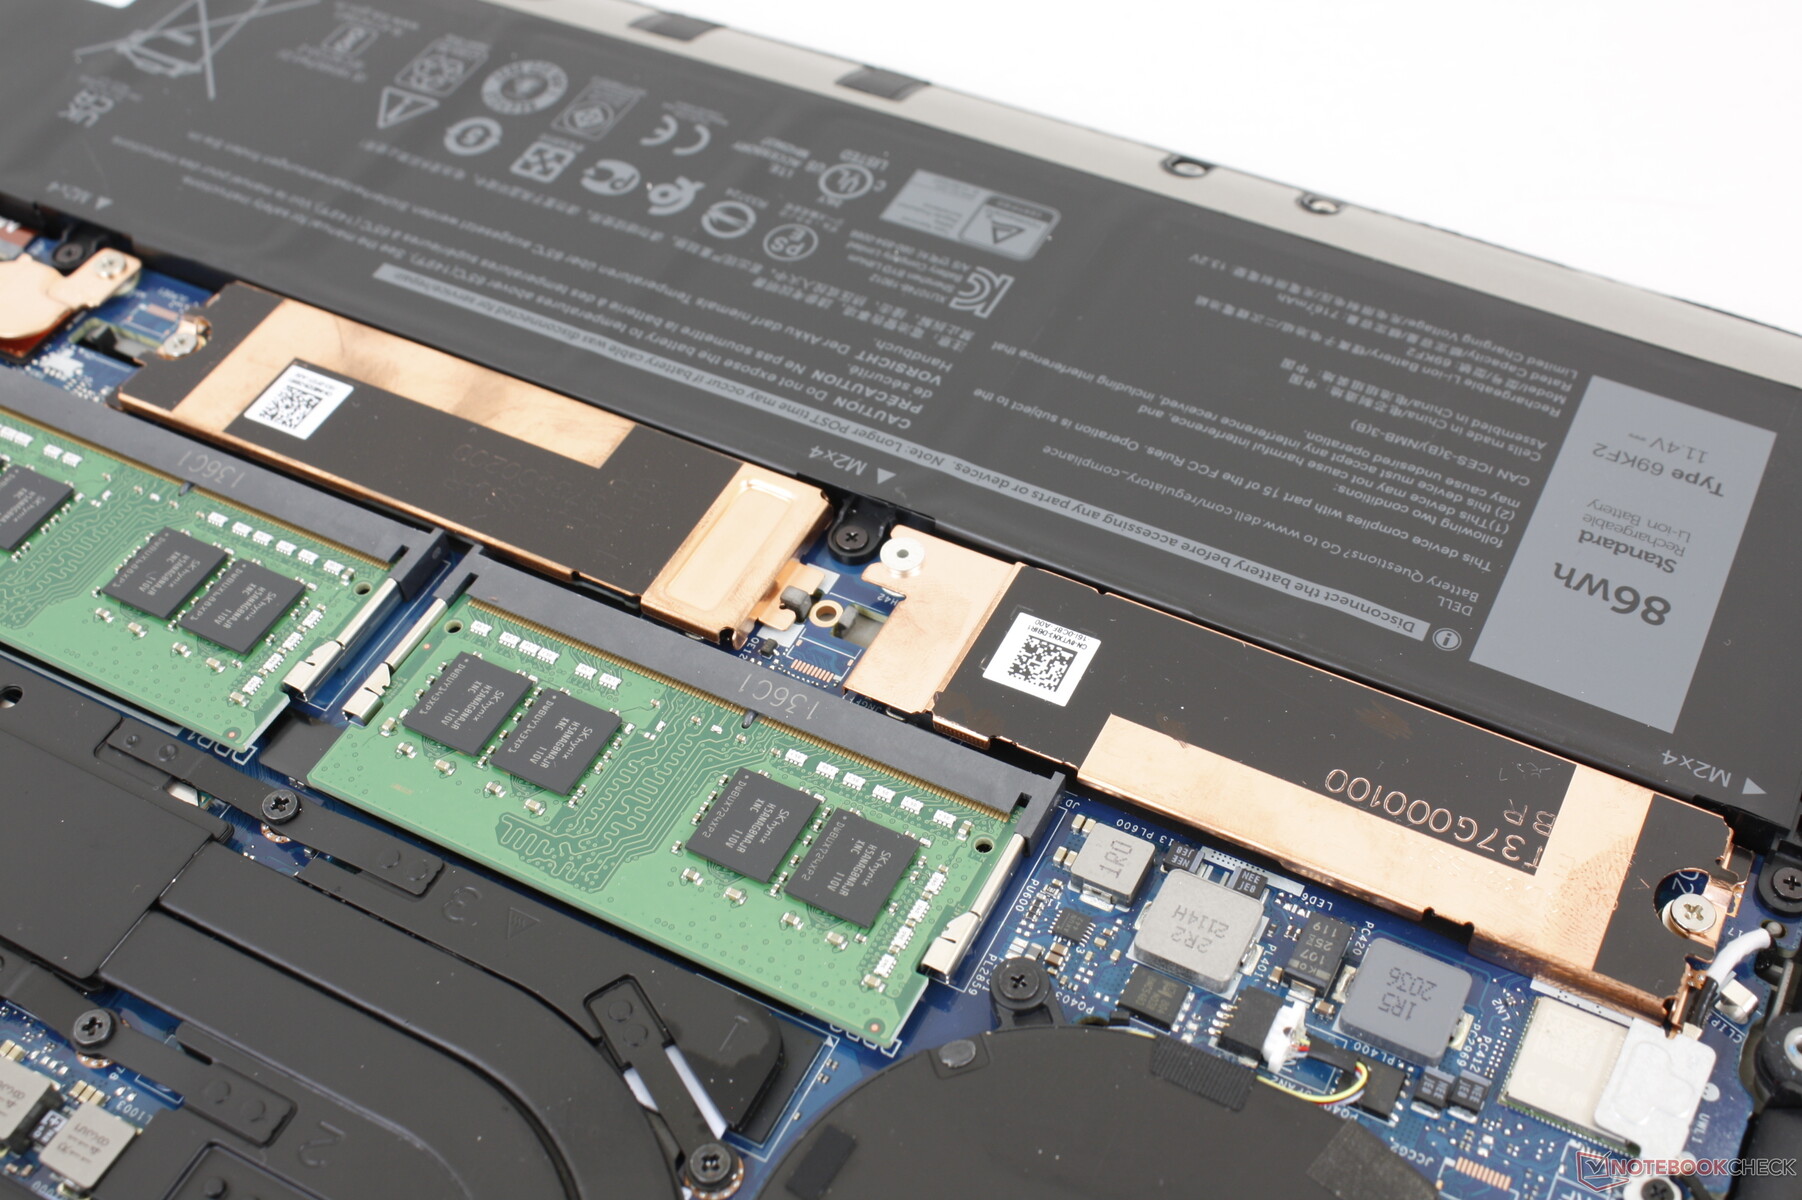
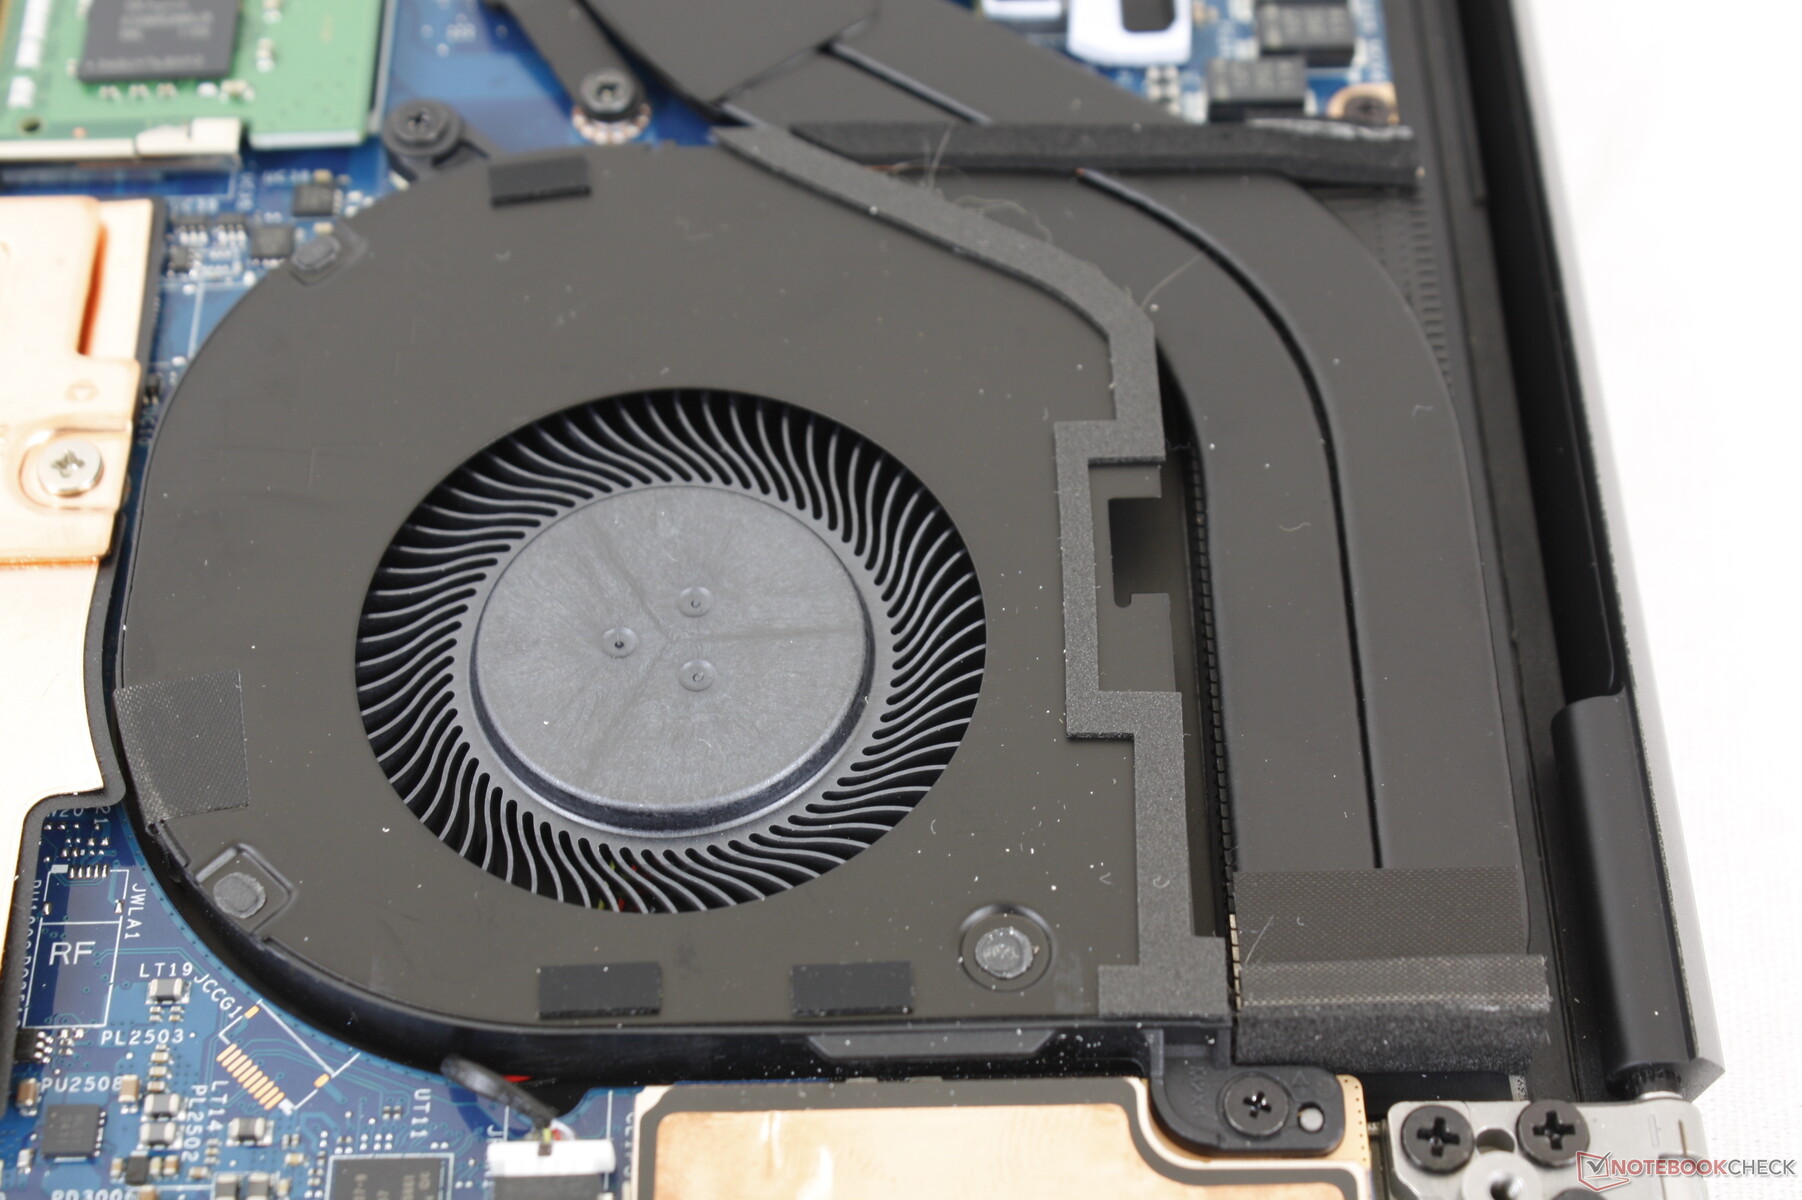
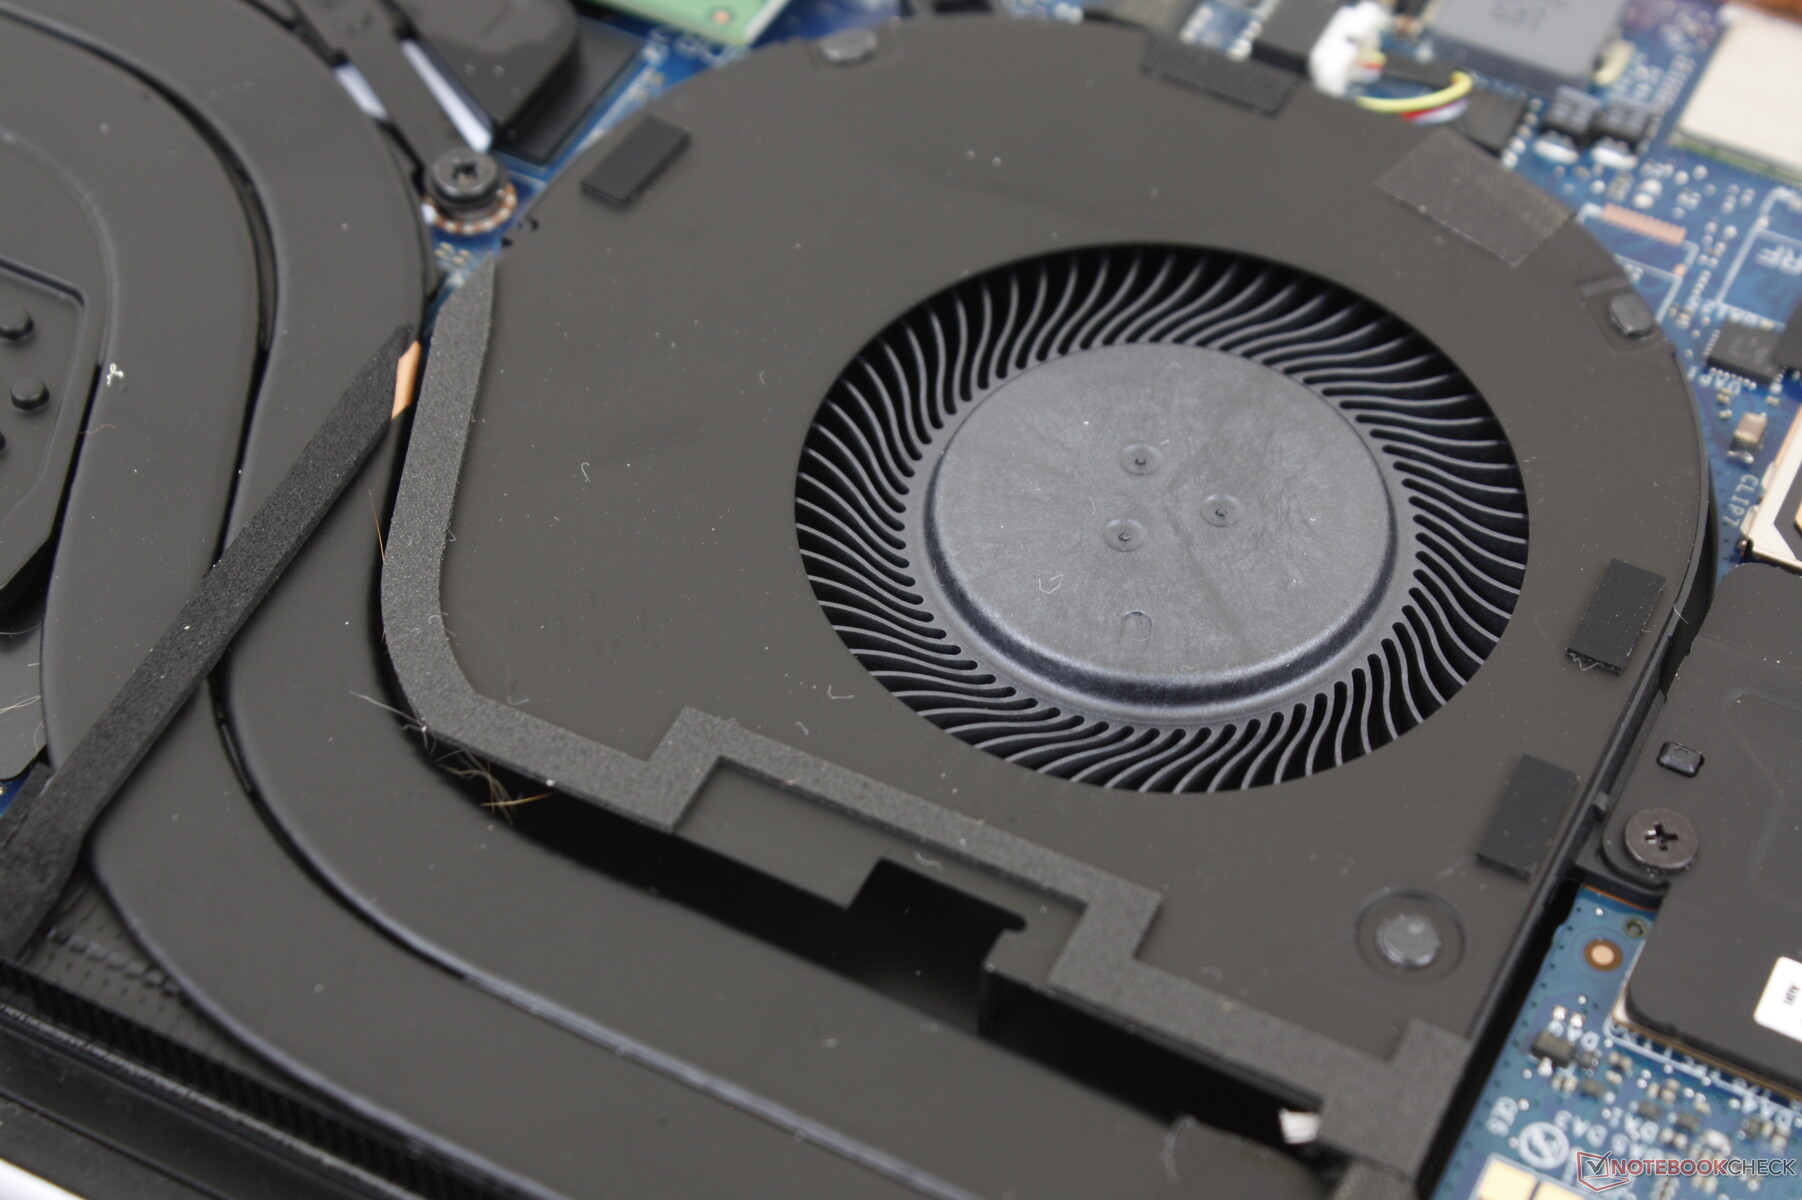
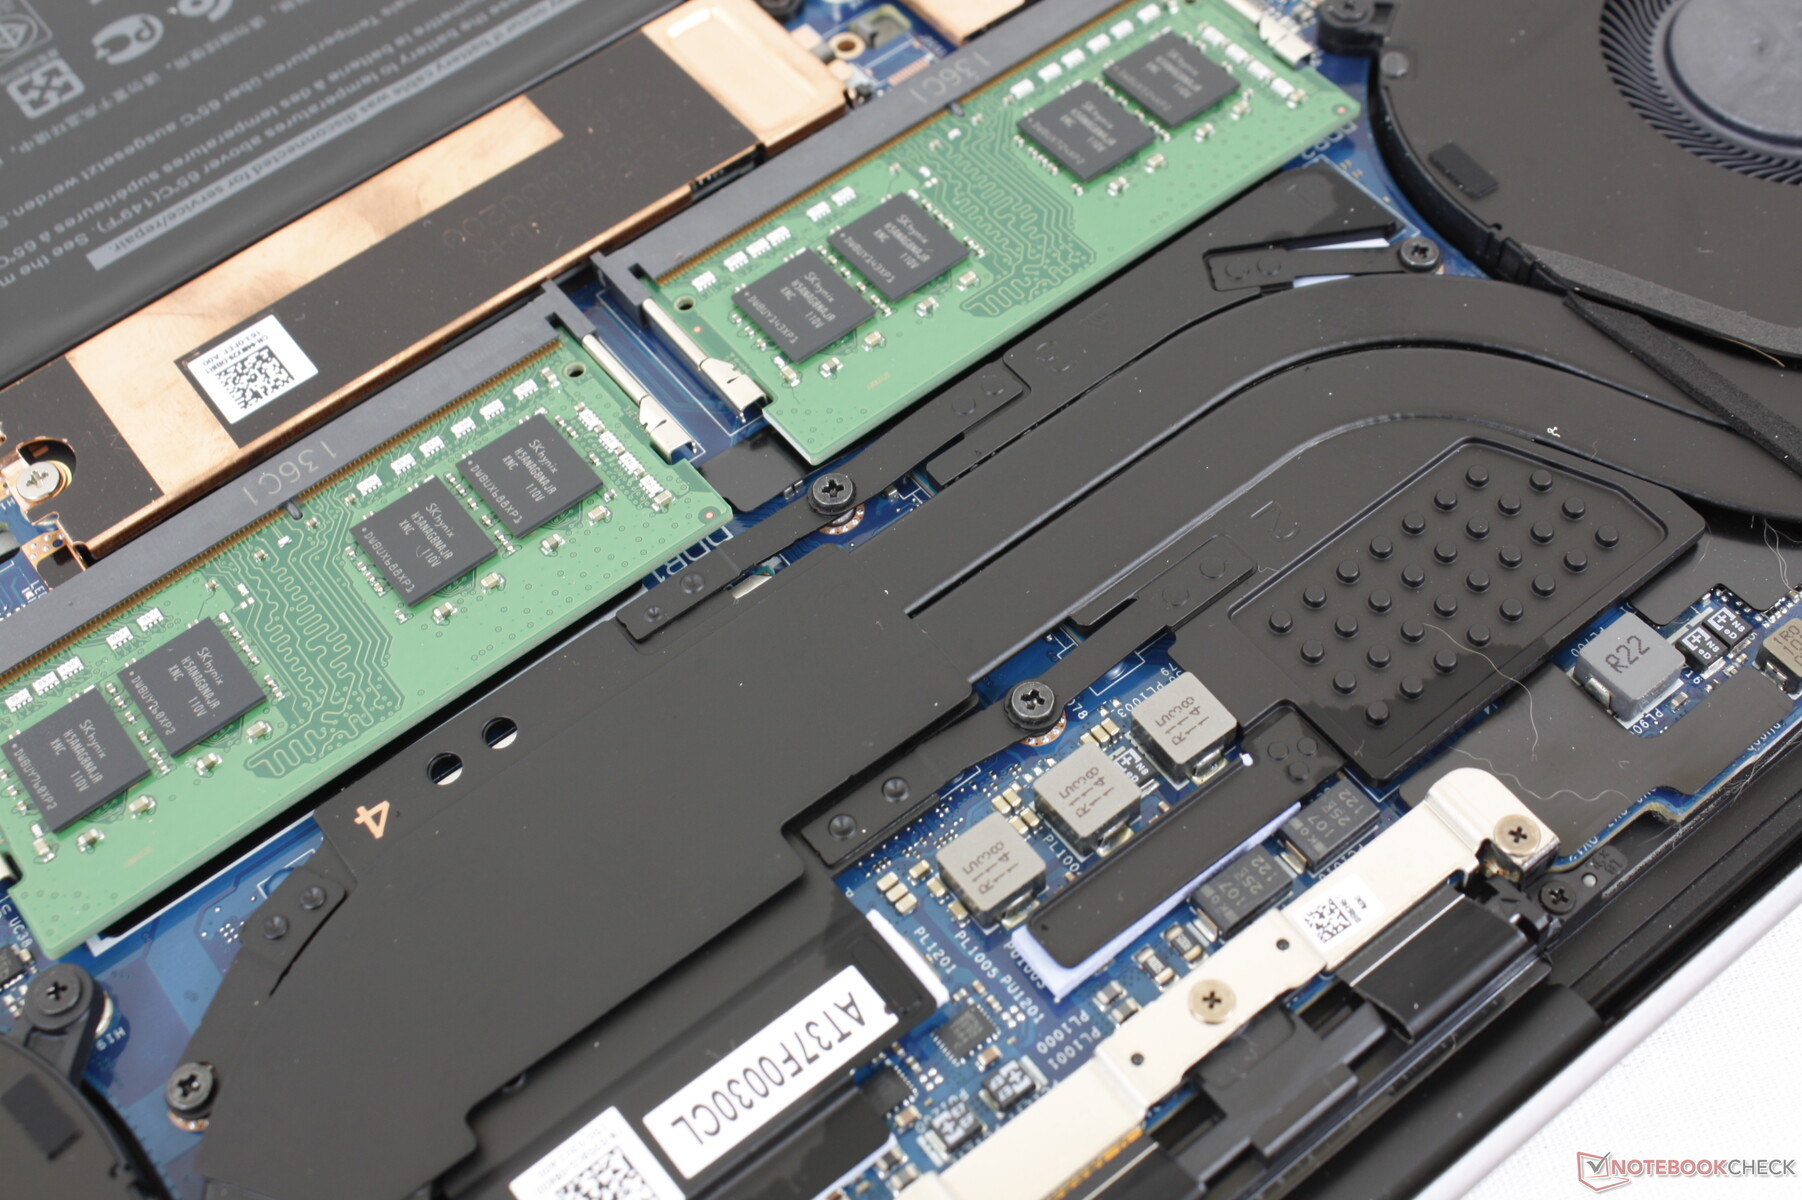
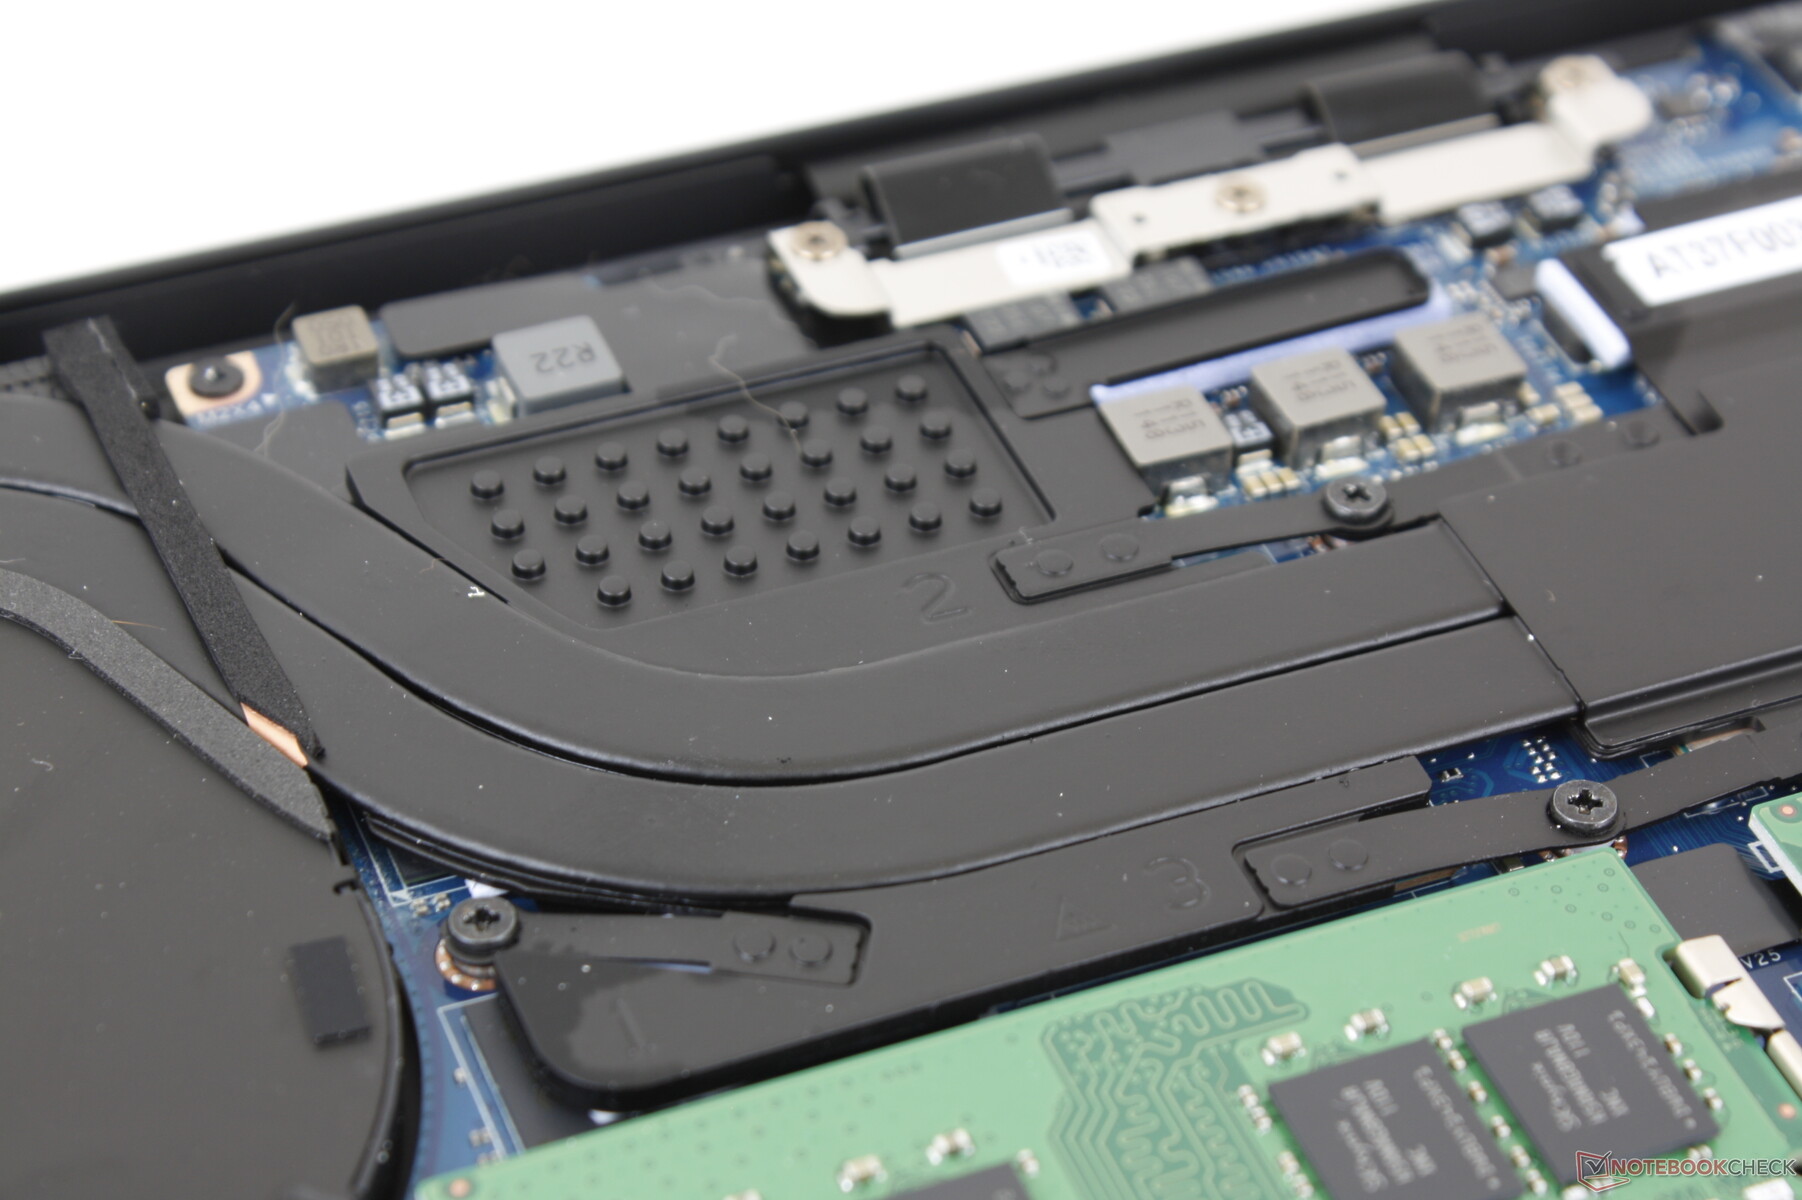
Wartung
Die Bodenplatte lässt sich nicht so leicht entfernen wie beim alten Precision 5540. Abgesehen davon ist das innere Layout mit dem des Precision 5550 ident.
Zubehör und Garantie
Das Gerät wird wie das XPS 15 mit einem nützlichen USB-C-auf-USB-A- und HDMI-Adapter geliefert.
Leider läuft die Basisgarantie nur ein Jahr. Viele andere mobile Workstations bieten hingegen zwei oder sogar drei Jahre Garantie. Für eine längere Garantie bei Dell müssten Nutzer in ein Gerät der Precision-7000-Serie investieren.
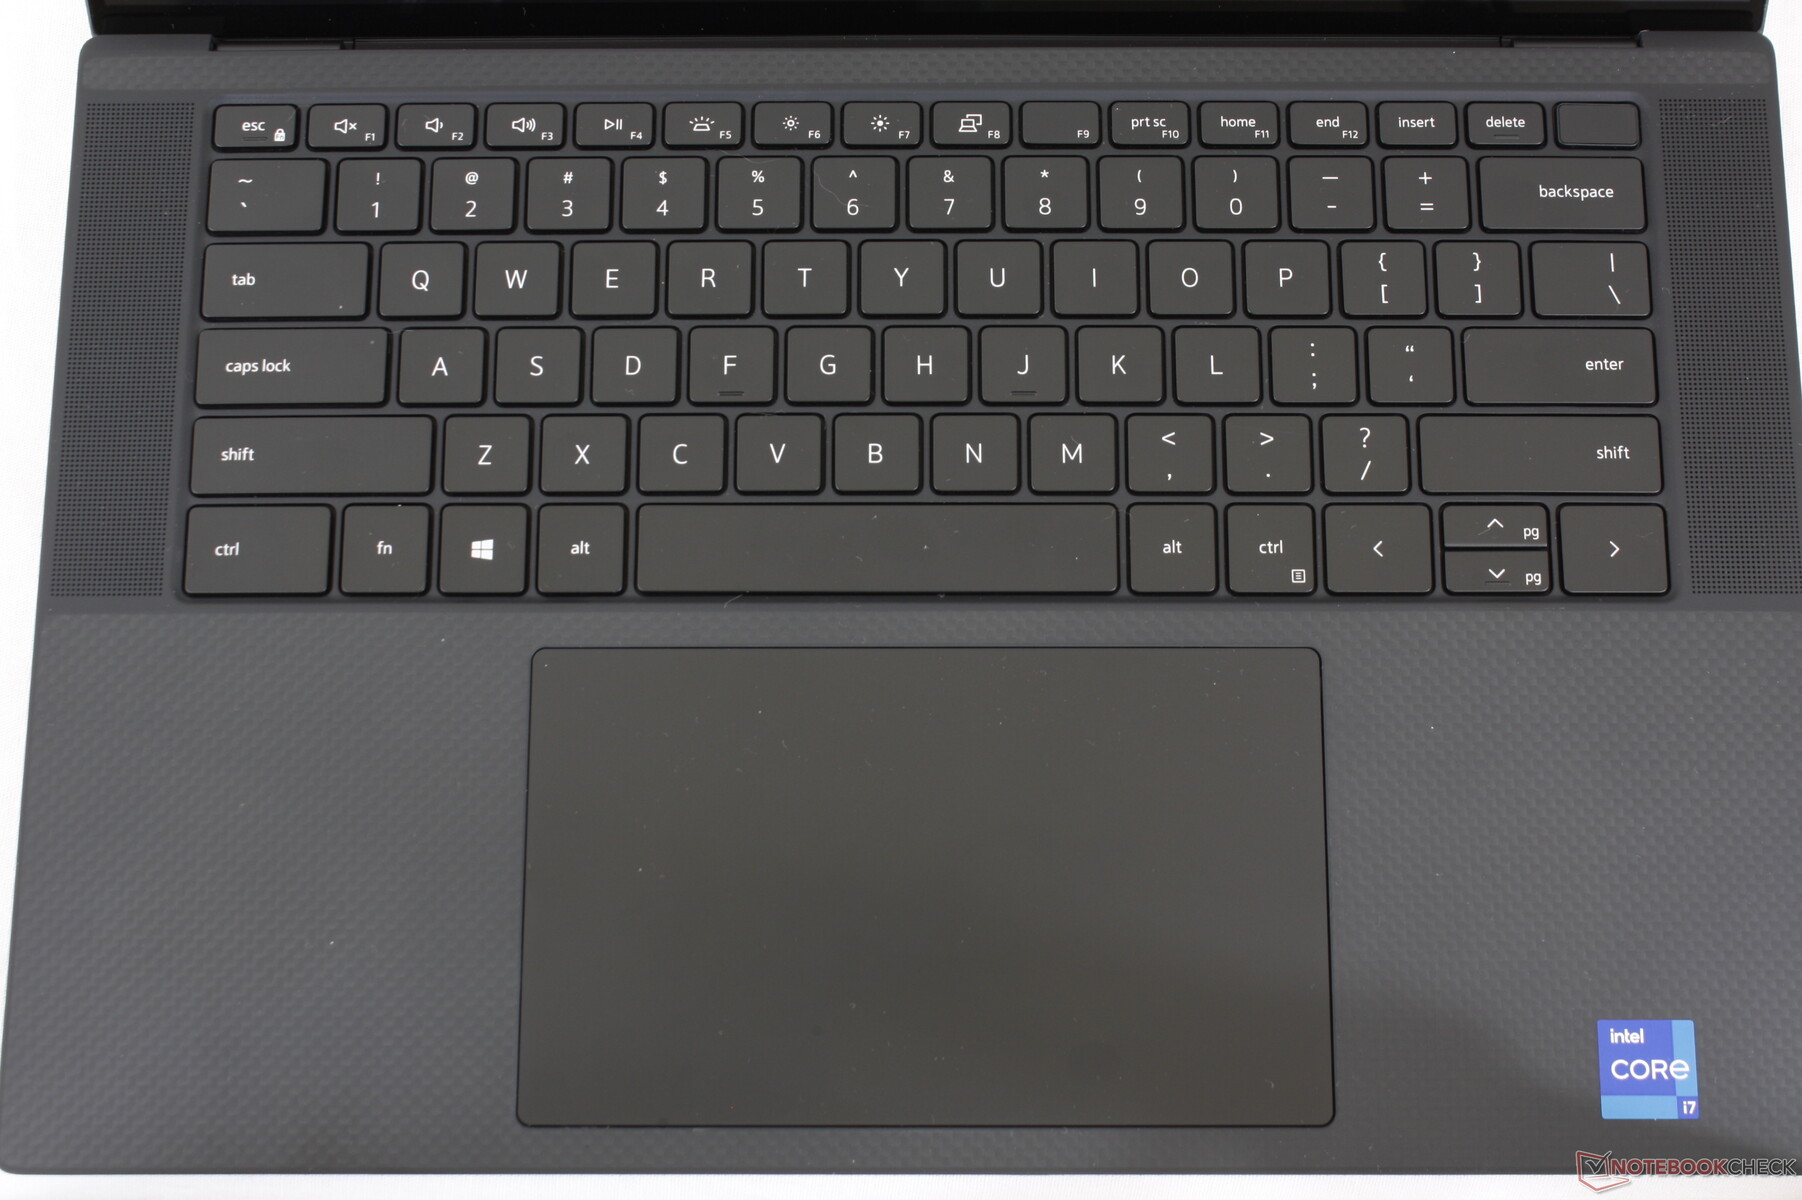
Eingabegeräte

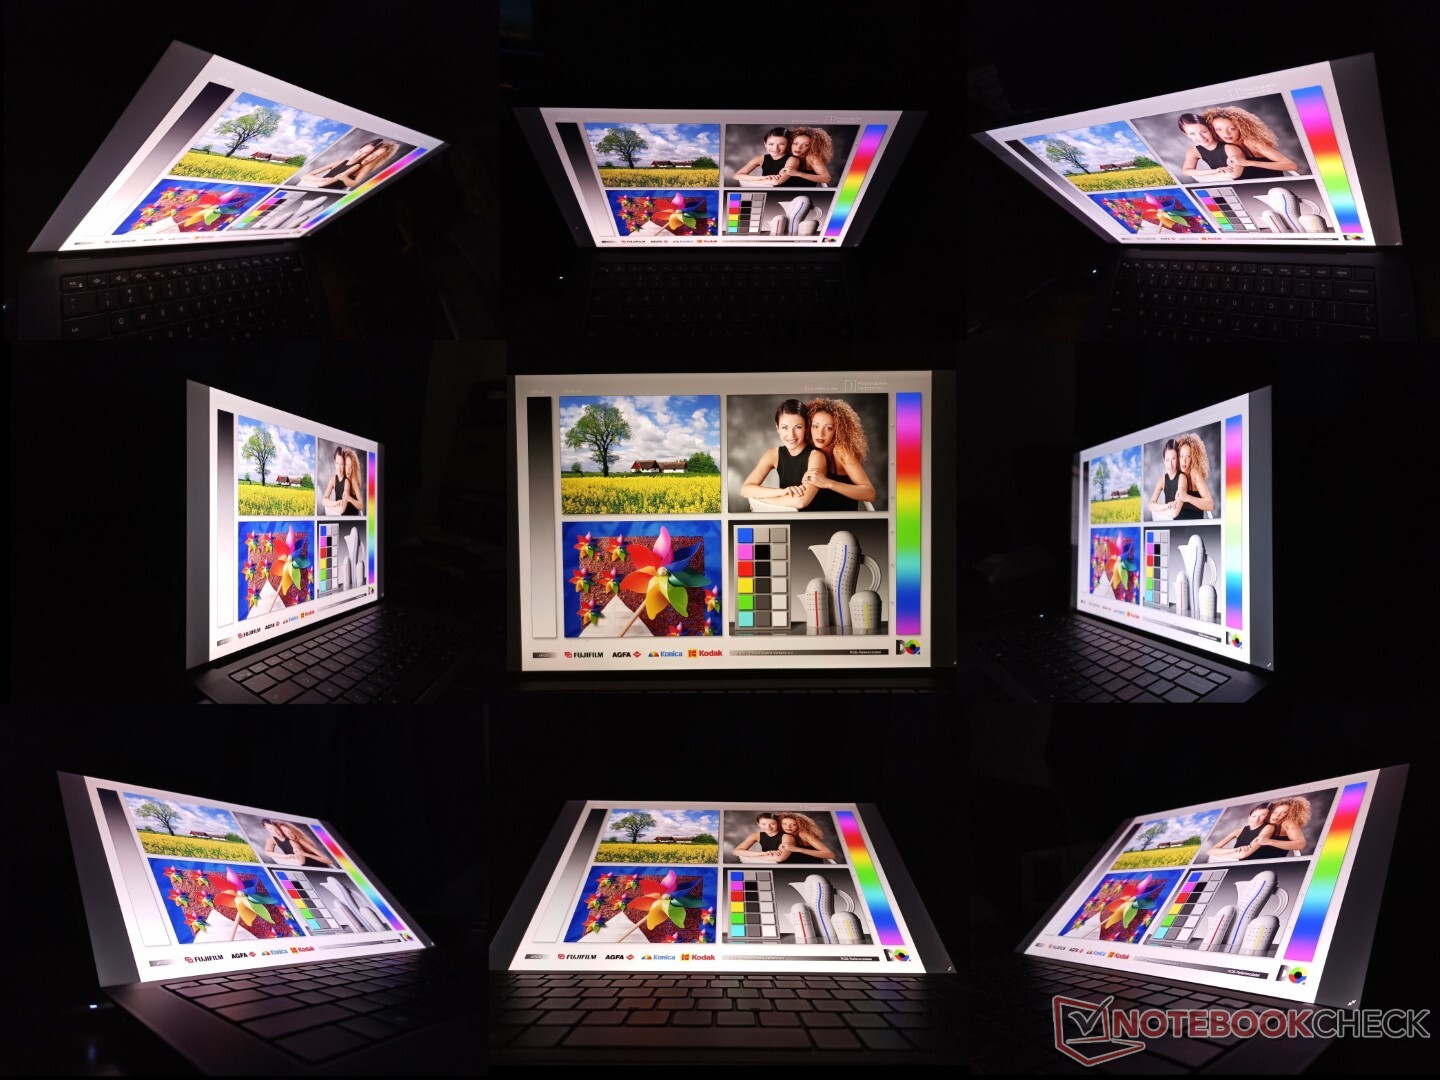
Display
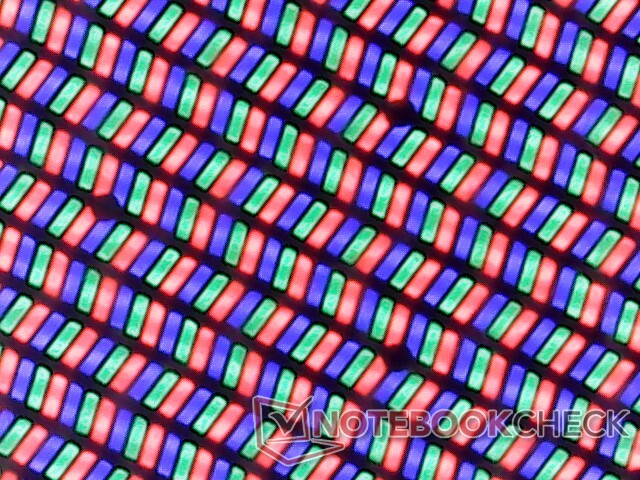
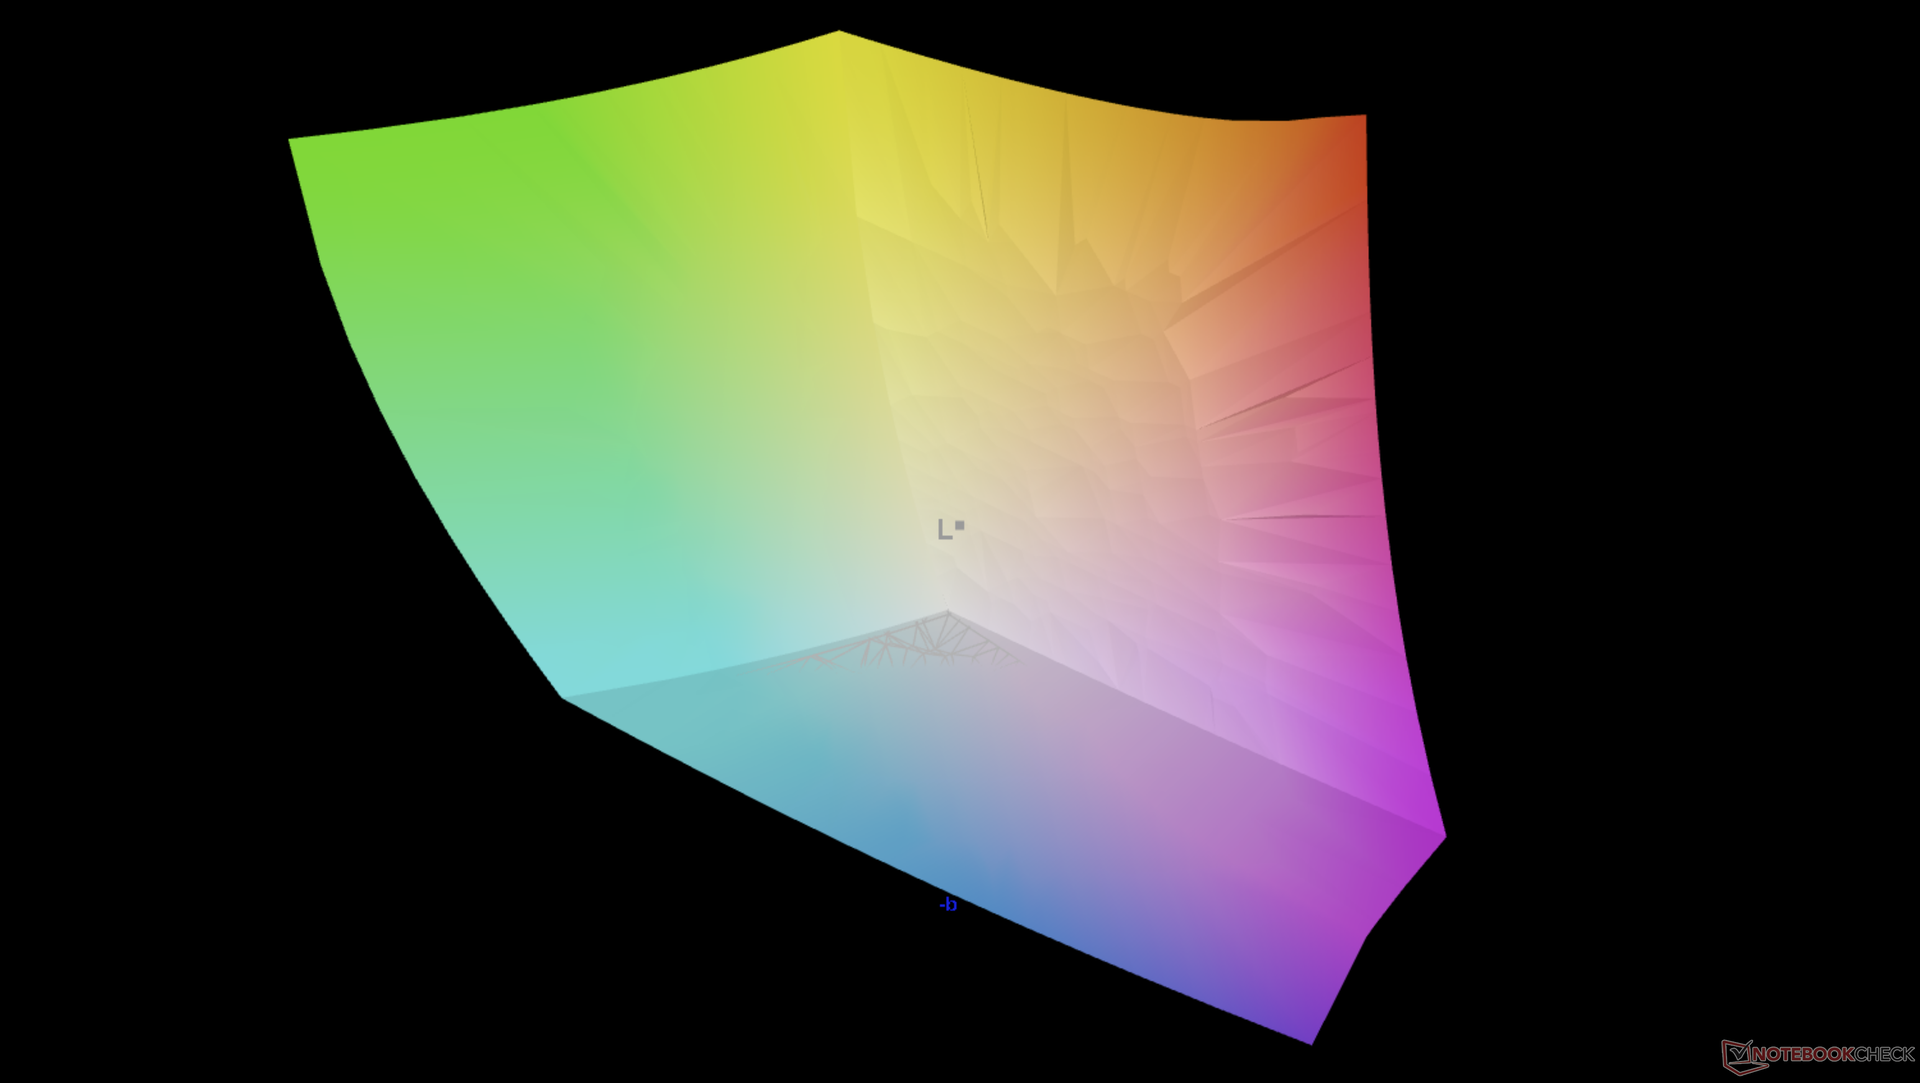
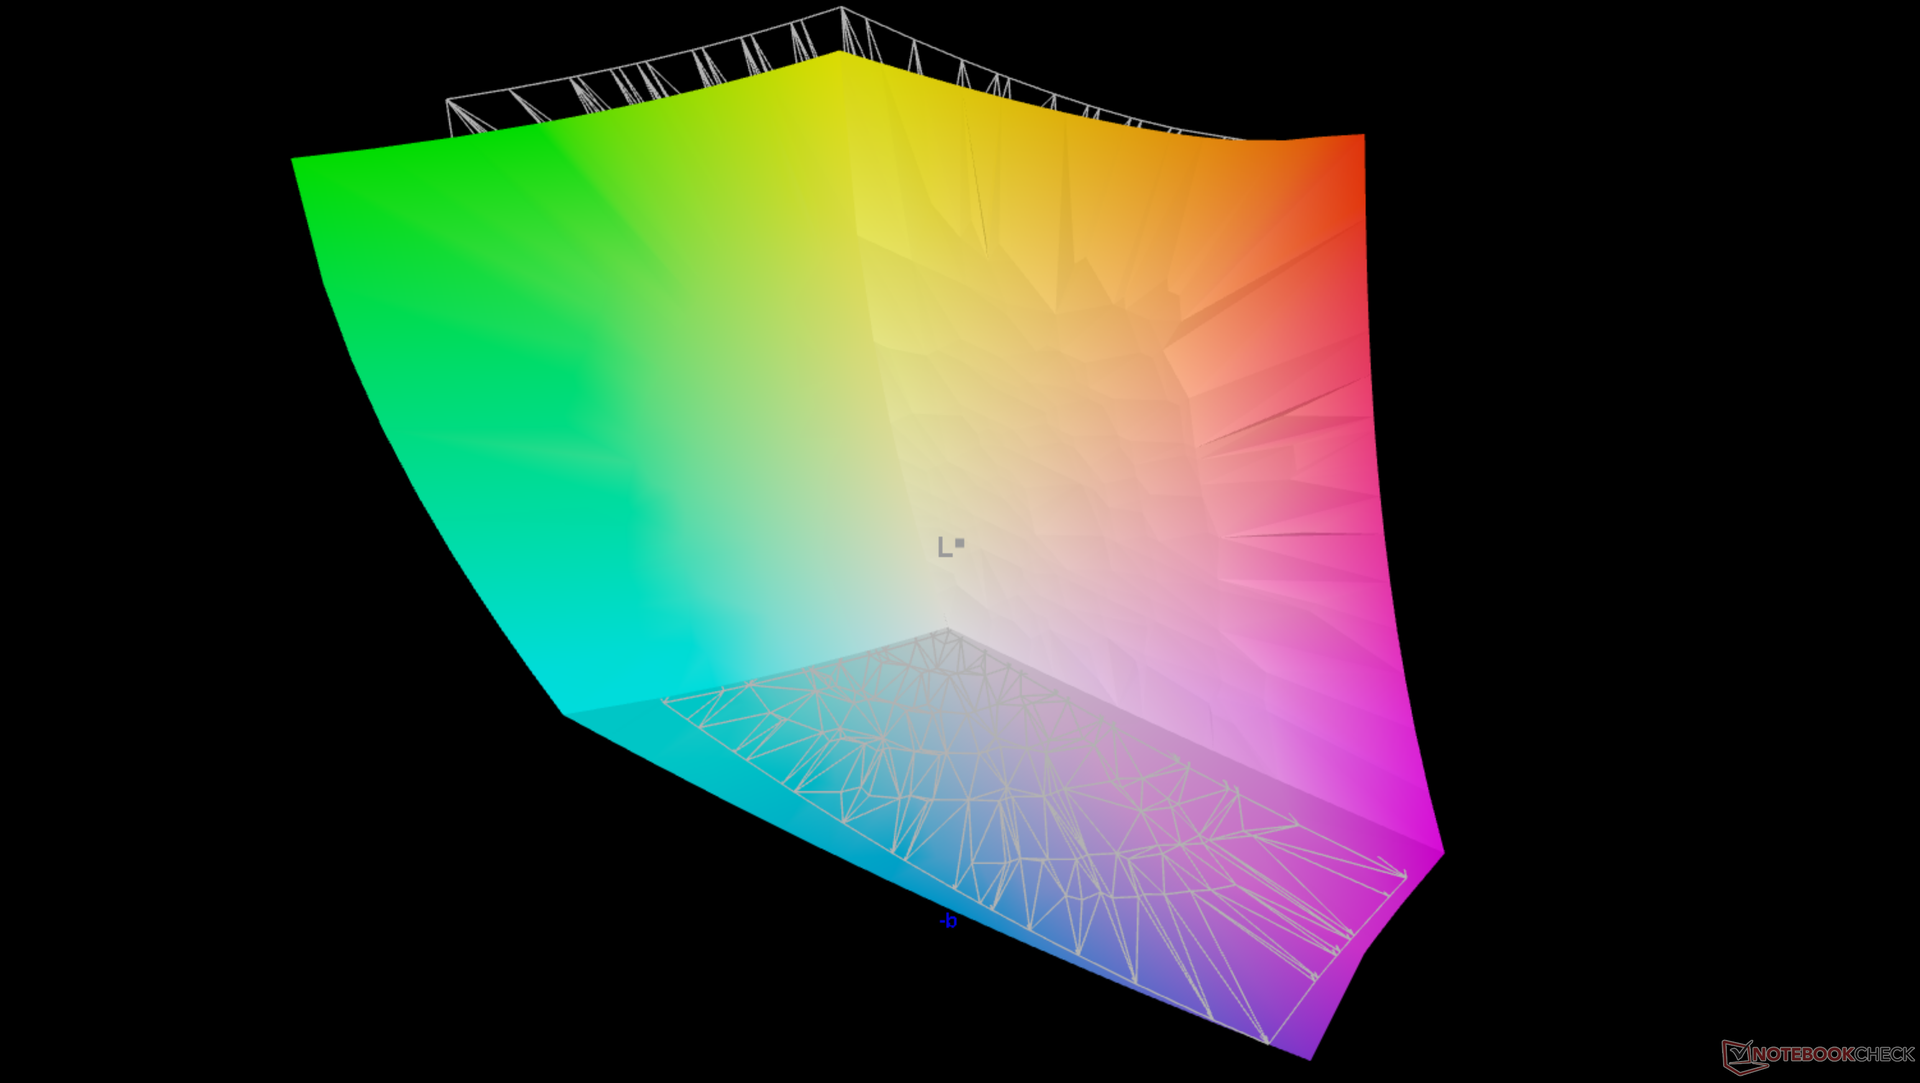
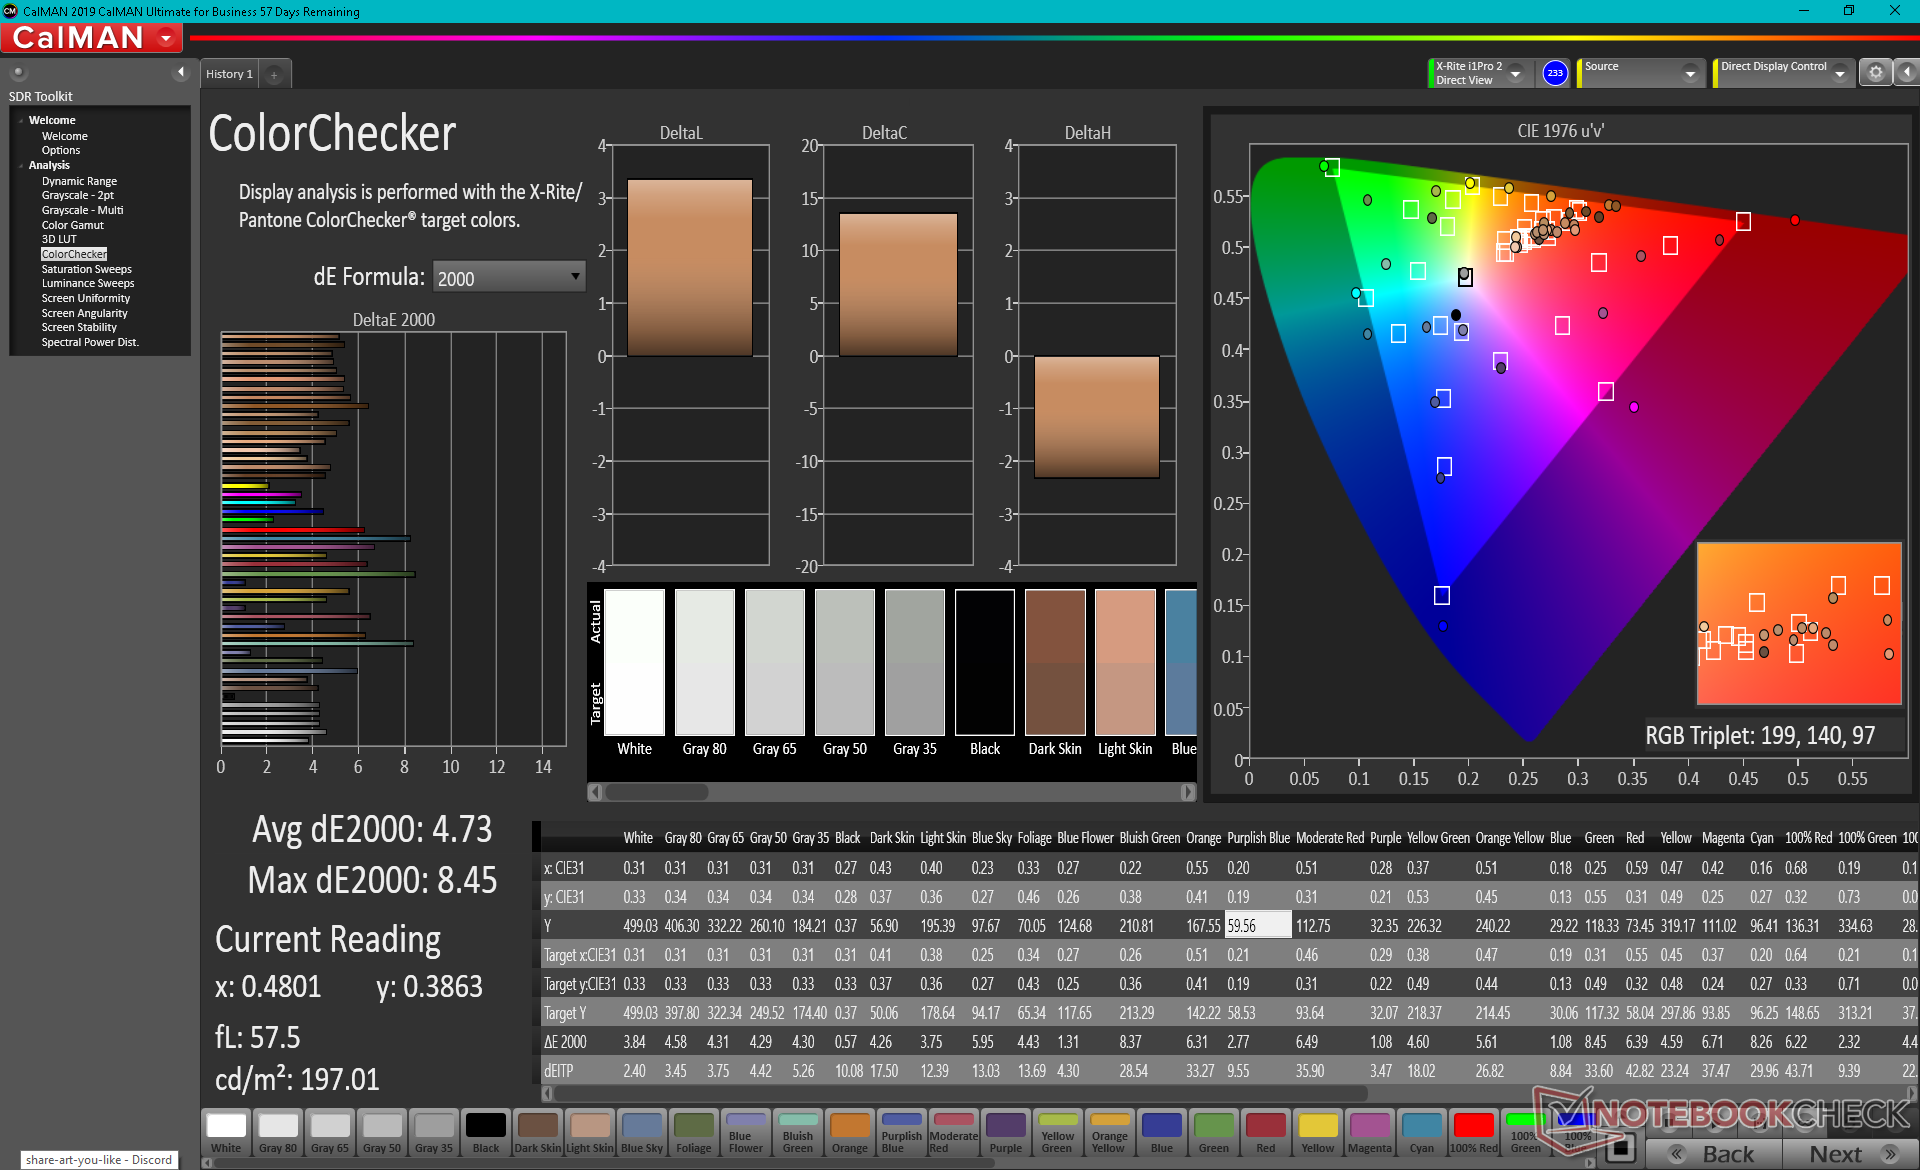
Auch das Precision 5560 ist mit dem gleichen IPS-Touchscreen von Sharp (LQ156R1) ausgestattet, das in allen 16:10-XPS-15- und Precision-5550/5560-4K-Konfigurationen zu finden ist. Das ist gut, es handelt sich um ein qualitativ hochwertiges Panel mit voller Abdeckung des AdobeRGB-Farbraums, einem hohen Kontrastverhältnis von über 1.000:1 und einer guten Hintergrundbeleuchtung von über 500 cd/m². Das Display ähnelt somit dem der neuesten XPS-15- und Precision 55x0-Modelle. Manche Konfigurationen können, wie auch beim XPS 15, mit einem etwas preiswerteren matten 1.200p-Display ohne Touchscreen ausgestattet werden. Überraschenderweise ist das Precision 5560 nicht mit OLED erhältlich.
Die langsamen Schwarz-Weiß- und Grau-Grau-Reaktionszeiten sind weiterhin die größte Schwachstelle des Panels und bedeuten, dass es zu deutlichem Ghosting kommen kann - insbesondere im Vergleich zu OLED. Für die meisten Anwendungen im Bereich CAD sollte das aber nicht weiter ein Problem sein.
| |||||||||||||||||||||||||
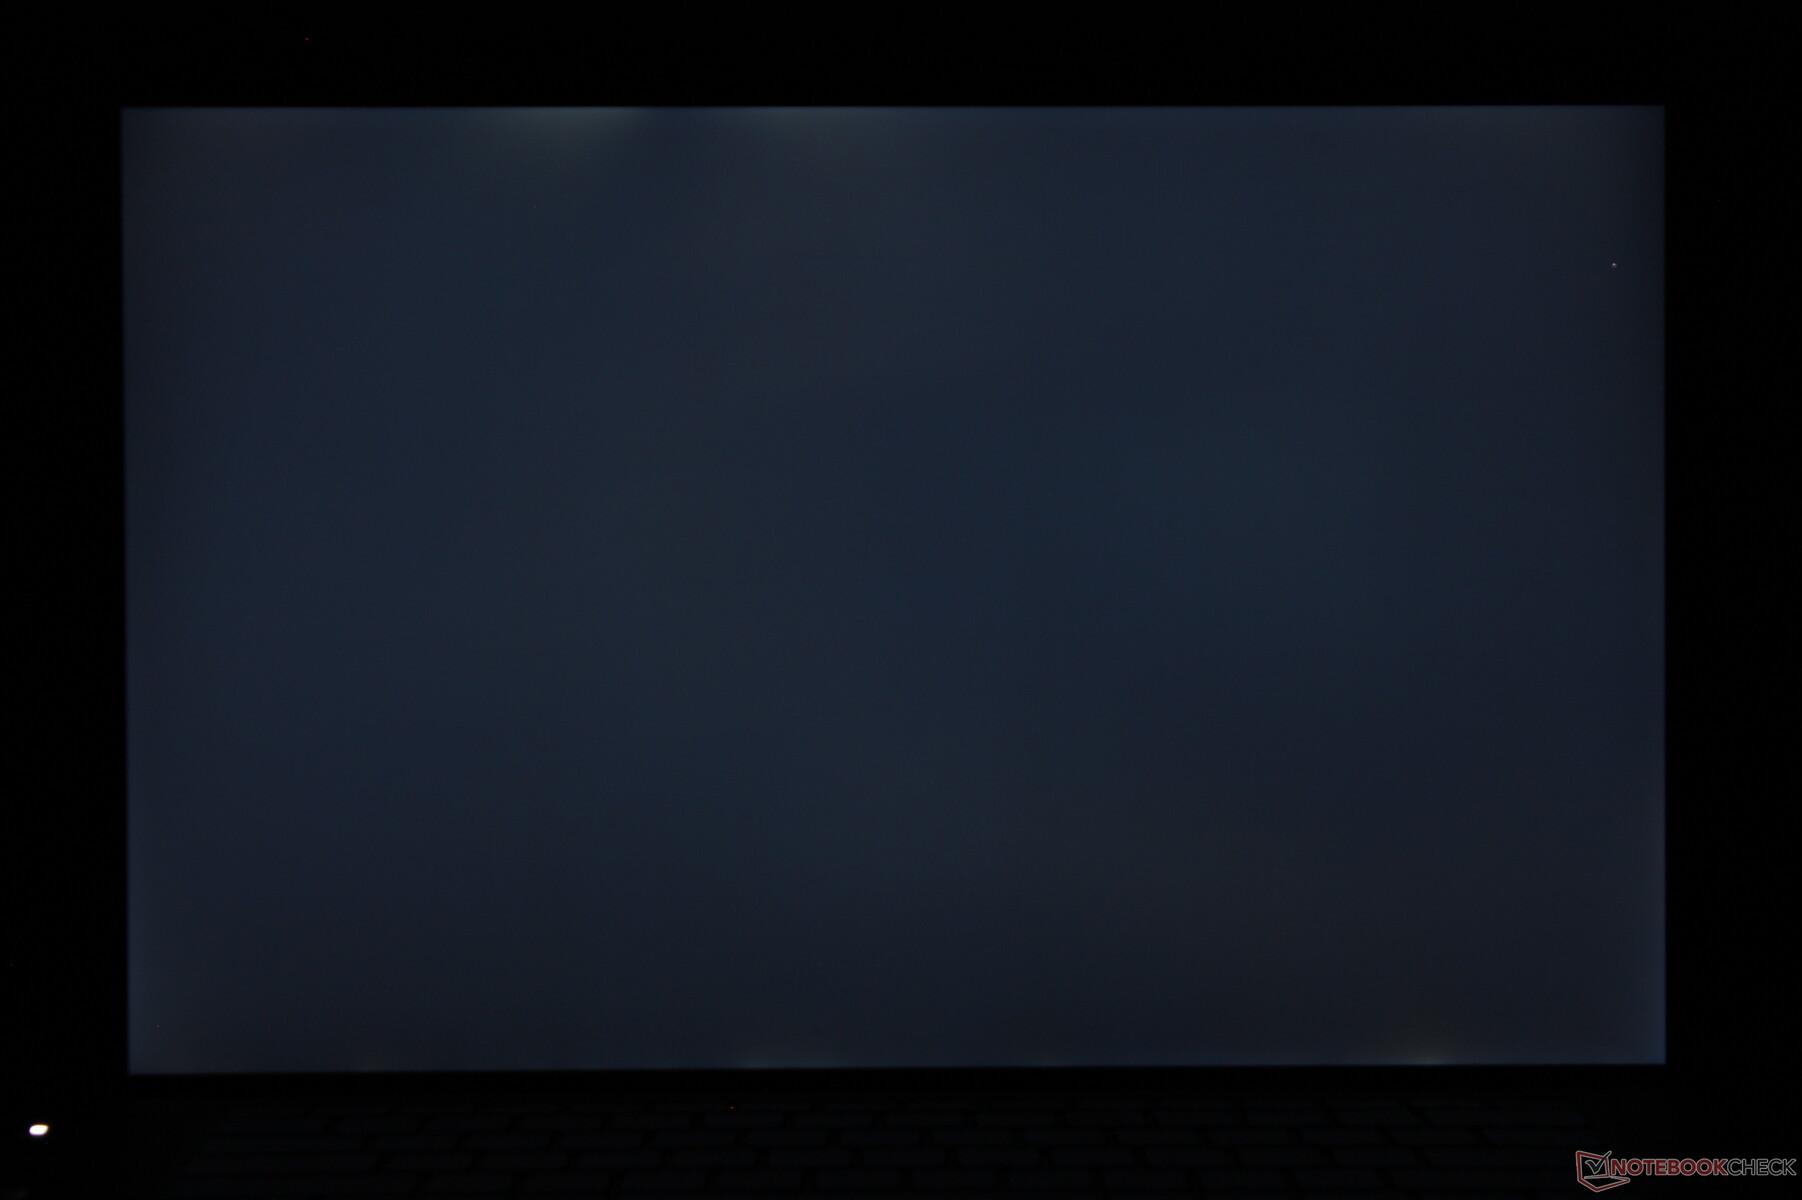
Ausleuchtung: 83 %
Helligkeit Akku: 501.5 cd/m²
Kontrast: 1140:1 (Schwarzwert: 0.44 cd/m²)
ΔE ColorChecker Calman: 4.73 | ∀{0.5-29.43 Ø4.73}
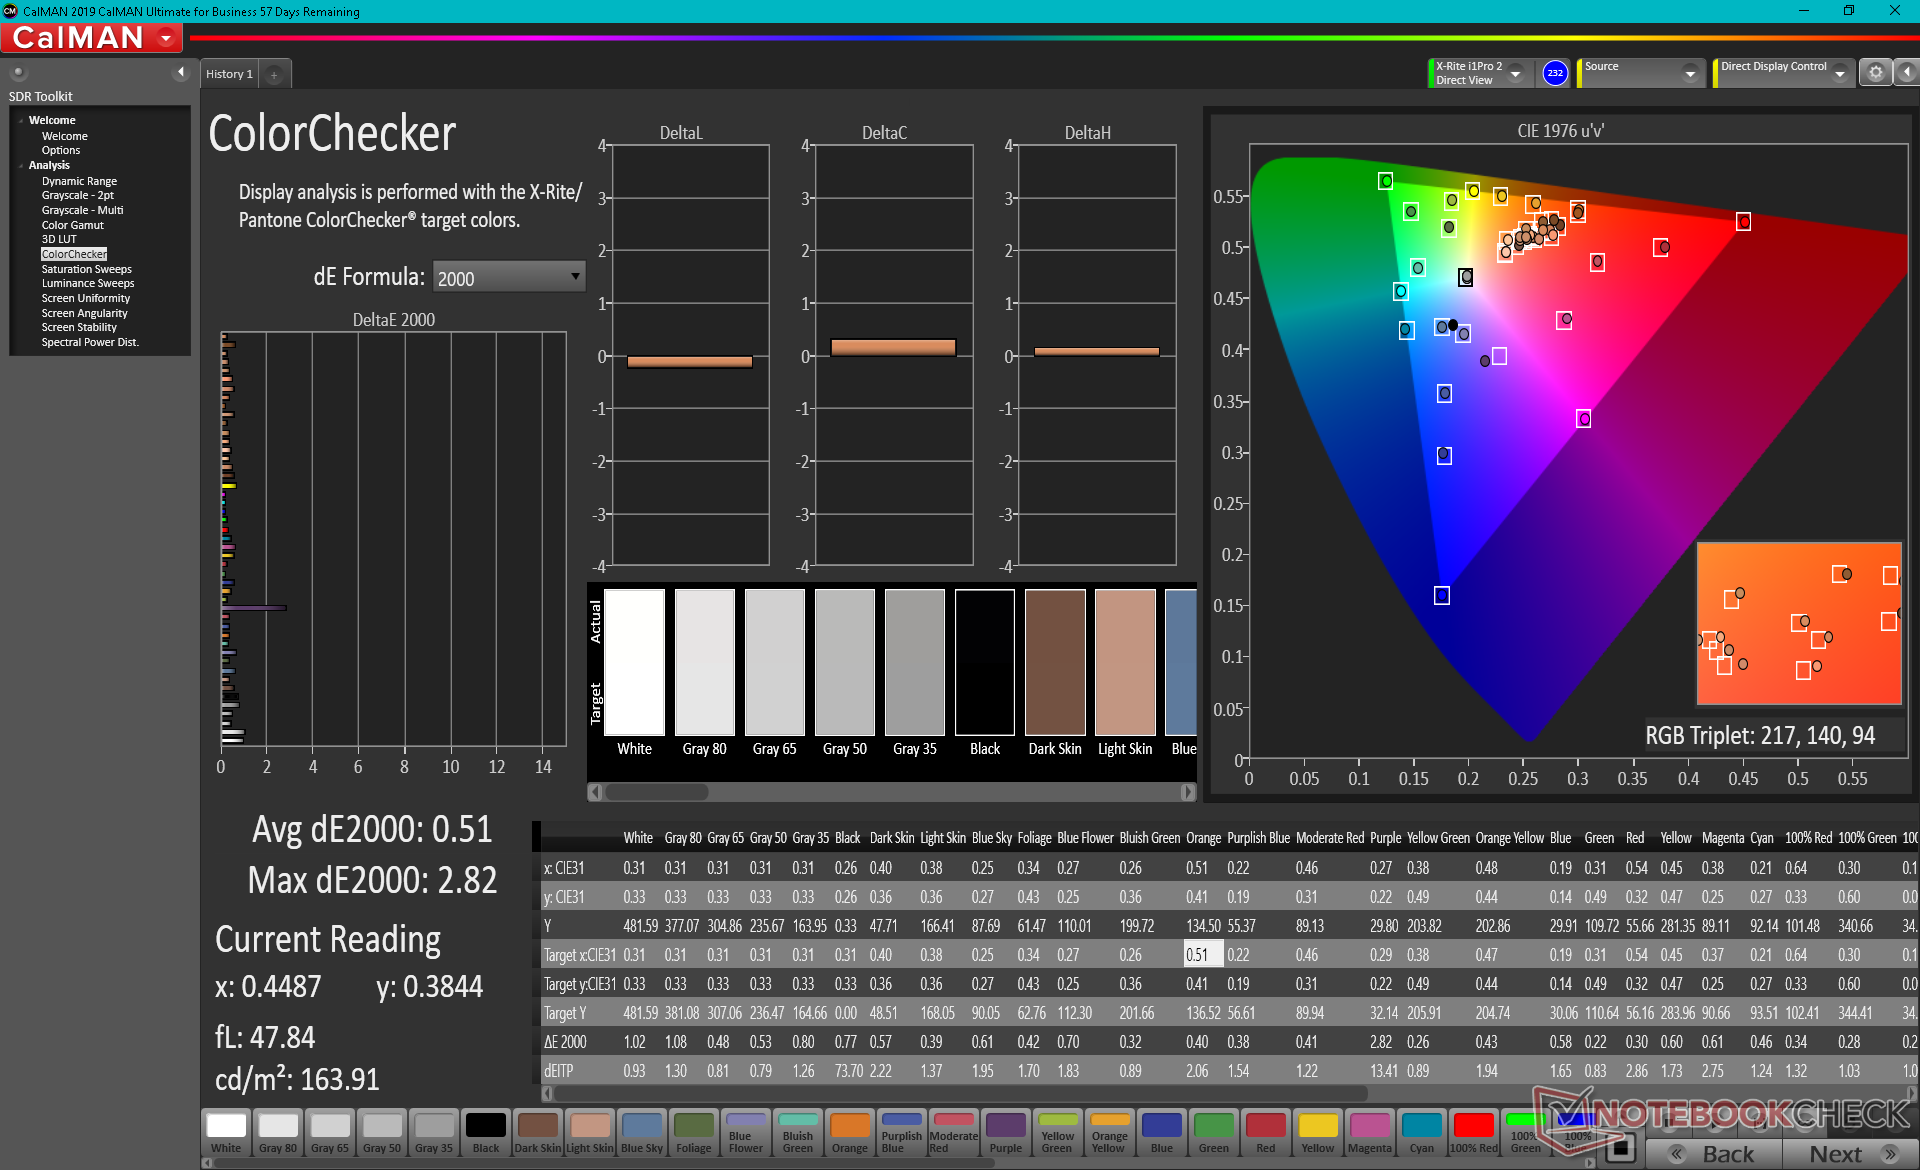
calibrated: 0.51
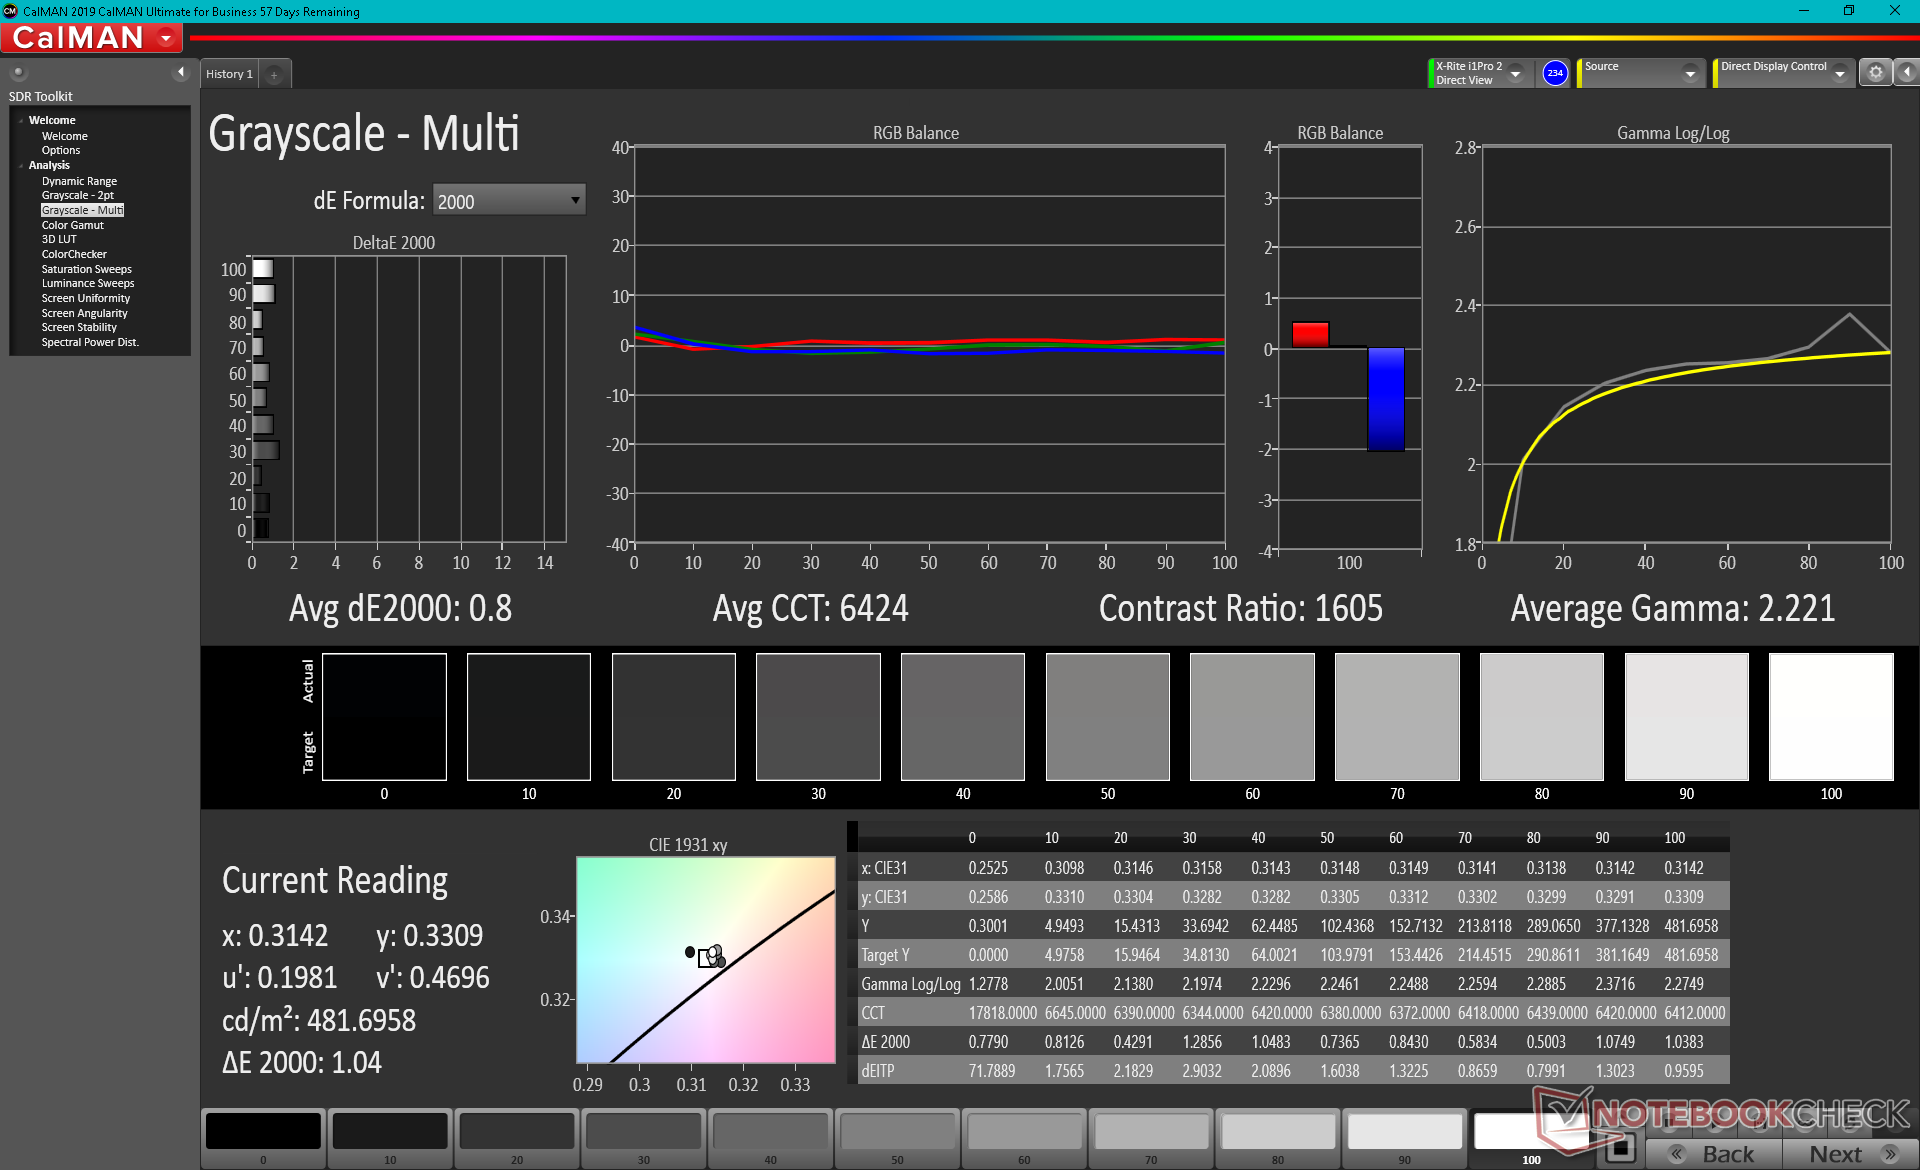
ΔE Greyscale Calman: 3.6 | ∀{0.09-98 Ø4.97}
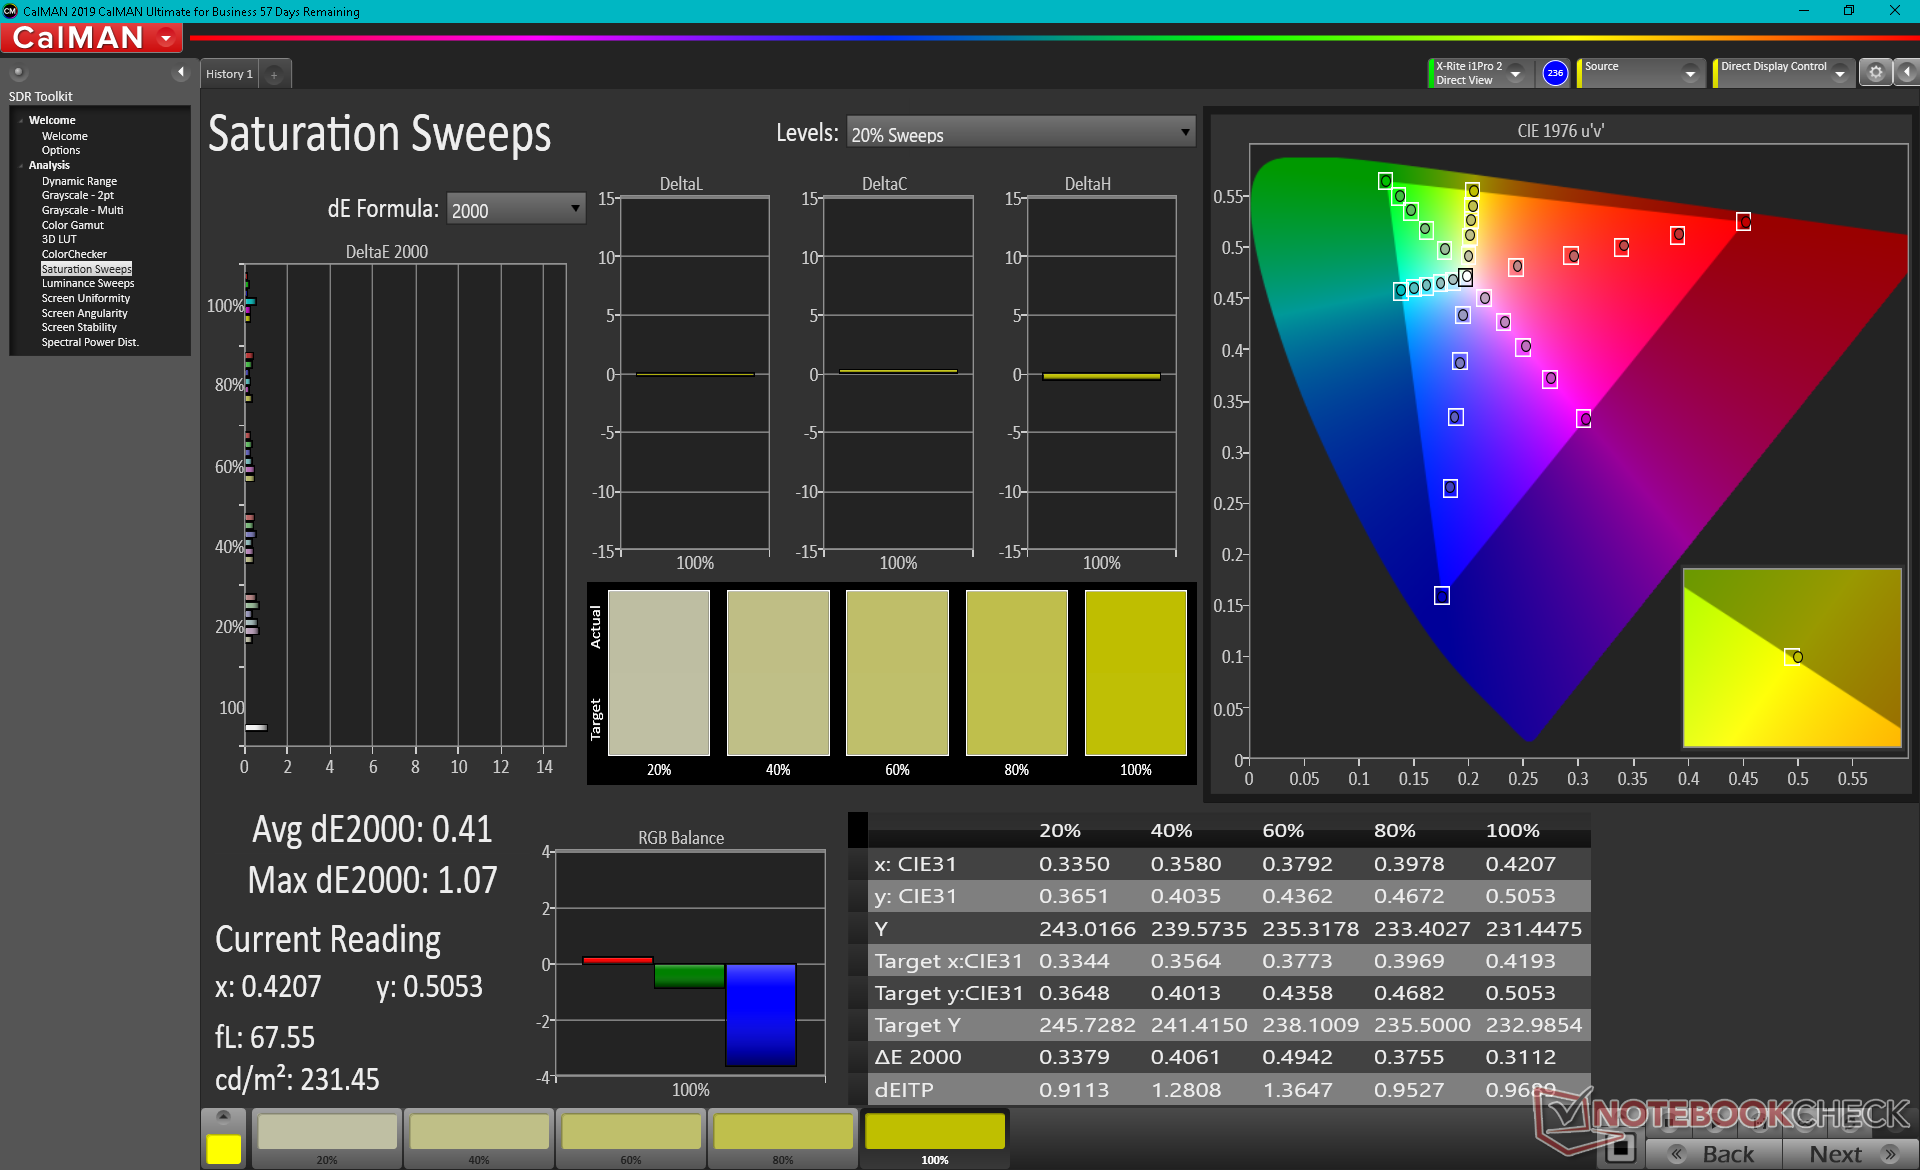
100% AdobeRGB 1998 (Argyll 3D)
100% sRGB (Argyll 3D)
94.9% Display P3 (Argyll 3D)
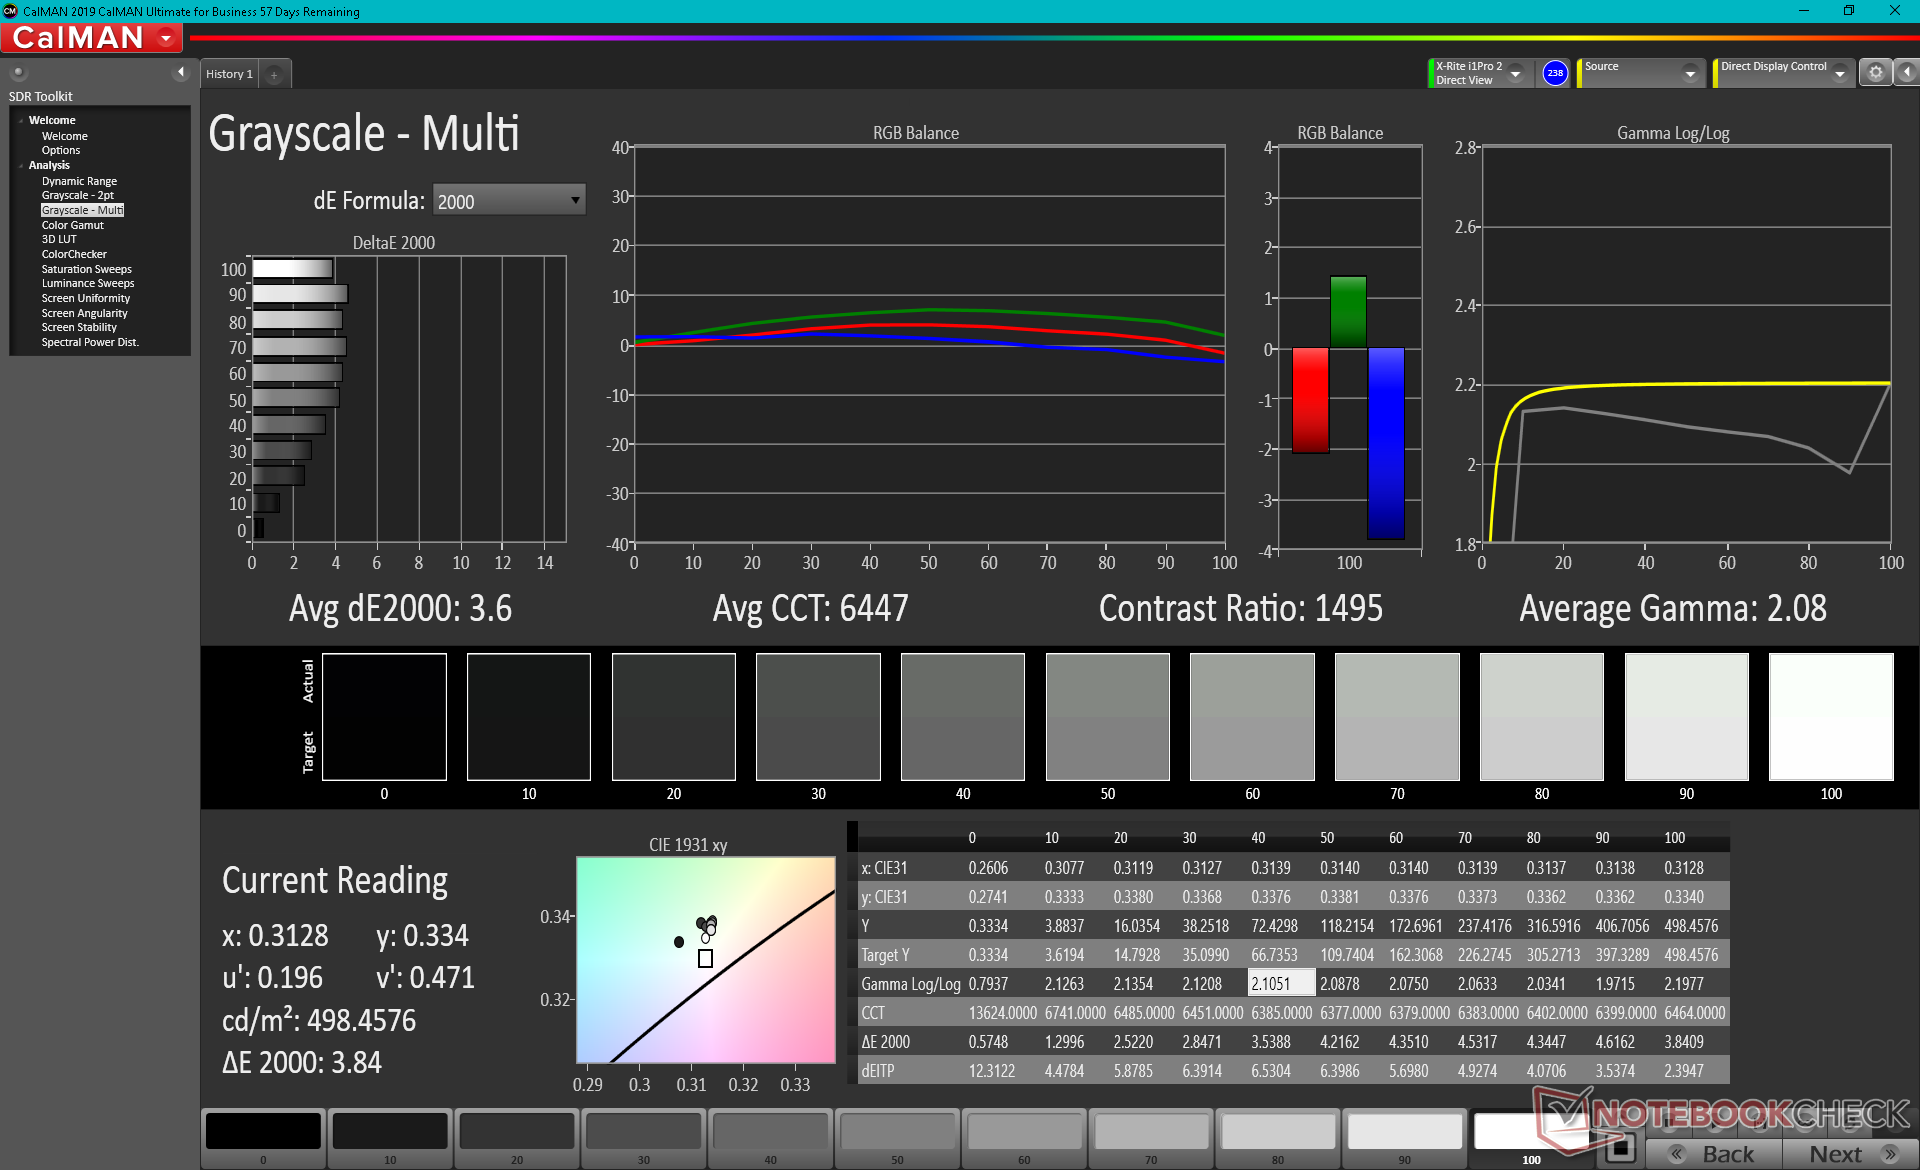
Gamma: 2.08
CCT: 6447 K
| Dell Precision 5000 5560 Sharp LQ156R1, IPS, 15.6", 3840x2400 | Lenovo ThinkPad P15 G2-20YQ001JGE N156HCE_GN1, IPS, 15.6", 1920x1080 | HP ZBook Studio 15 G8 SDC4145, OLED, 15.6", 3840x2160 | Asus ProArt StudioBook Pro 15 W500G5T AU Optronics B156ZAN03.1, IPS, 15.6", 3840x2160 | Dell Precision 7550 AU Optronics B156ZAN, IPS, 15.6", 3840x2160 | Dell Precision 5550 P91F Sharp LQ156R1, IPS, 15.6", 3840x2400 | Razer Blade 15 Studio Edition 2020 Samsung SDCA029, OLED, 15.6", 3840x2160 | |
|---|---|---|---|---|---|---|---|
| Display | -19% | 0% | -7% | -5% | -2% | 1% | |
| Display P3 Coverage (%) | 94.9 | 68.6 -28% | 99.9 5% | 82.1 -13% | 82.1 -13% | 89.9 -5% | 99.9 5% |
| sRGB Coverage (%) | 100 | 99.8 0% | 100 0% | 97.6 -2% | 99.6 0% | 100 0% | 100 0% |
| AdobeRGB 1998 Coverage (%) | 100 | 70.6 -29% | 95.3 -5% | 95 -5% | 96.8 -3% | 99.9 0% | 97.3 -3% |
| Response Times | 34% | 94% | -19% | -10% | -5% | 90% | |
| Response Time Grey 50% / Grey 80% * (ms) | 47.2 ? | 37.6 ? 20% | 2.4 ? 95% | 58 ? -23% | 51.2 ? -8% | 46 ? 3% | 4 ? 92% |
| Response Time Black / White * (ms) | 30.4 ? | 16 ? 47% | 2.4 ? 92% | 35 ? -15% | 34 ? -12% | 34 ? -12% | 4 ? 87% |
| PWM Frequency (Hz) | 26040 ? | 240.4 ? | |||||
| Bildschirm | 9% | -73% | 10% | -68% | -79% | 140% | |
| Helligkeit Bildmitte (cd/m²) | 501.5 | 498 -1% | 379.6 -24% | 344 -31% | 473.5 -6% | 469.8 -6% | 380 -24% |
| Brightness (cd/m²) | 467 | 490 5% | 380 -19% | 335 -28% | 461 -1% | 464 -1% | 388 -17% |
| Brightness Distribution (%) | 83 | 95 14% | 95 14% | 93 12% | 90 8% | 85 2% | 93 12% |
| Schwarzwert * (cd/m²) | 0.44 | 0.39 11% | 0.37 16% | 0.55 -25% | 0.42 5% | 0.018 96% | |
| Kontrast (:1) | 1140 | 1277 12% | 930 -18% | 861 -24% | 1119 -2% | 21111 1752% | |
| Delta E Colorchecker * | 4.73 | 2.1 56% | 5.15 -9% | 1.76 63% | 4.8 -1% | 5.16 -9% | 5.47 -16% |
| Colorchecker dE 2000 max. * | 8.45 | 5.6 34% | 7.79 8% | 4.31 49% | 8.73 -3% | 9.33 -10% | 8.19 3% |
| Colorchecker dE 2000 calibrated * | 0.51 | 0.8 -57% | 3.1 -508% | 3.08 -504% | 3.75 -635% | 3.04 -496% | |
| Delta E Graustufen * | 3.6 | 3.4 6% | 2.6 28% | 3.12 13% | 5.6 -56% | 5.5 -53% | 5.3 -47% |
| Gamma | 2.08 106% | 2.32 95% | 1.99 111% | 2.2 100% | 2.34 94% | 2 110% | 2.15 102% |
| CCT | 6447 101% | 7162 91% | 6166 105% | 6563 99% | 7549 86% | 6198 105% | 6128 106% |
| Farbraum (Prozent von AdobeRGB 1998) (%) | 85 | 86.4 | 89.2 | 86 | |||
| Color Space (Percent of sRGB) (%) | 98 | 99.7 | 100 | 100 | |||
| Durchschnitt gesamt (Programm / Settings) | 8% /
6% | 7% /
-27% | -5% /
1% | -28% /
-46% | -29% /
-52% | 77% /
103% |
* ... kleinere Werte sind besser
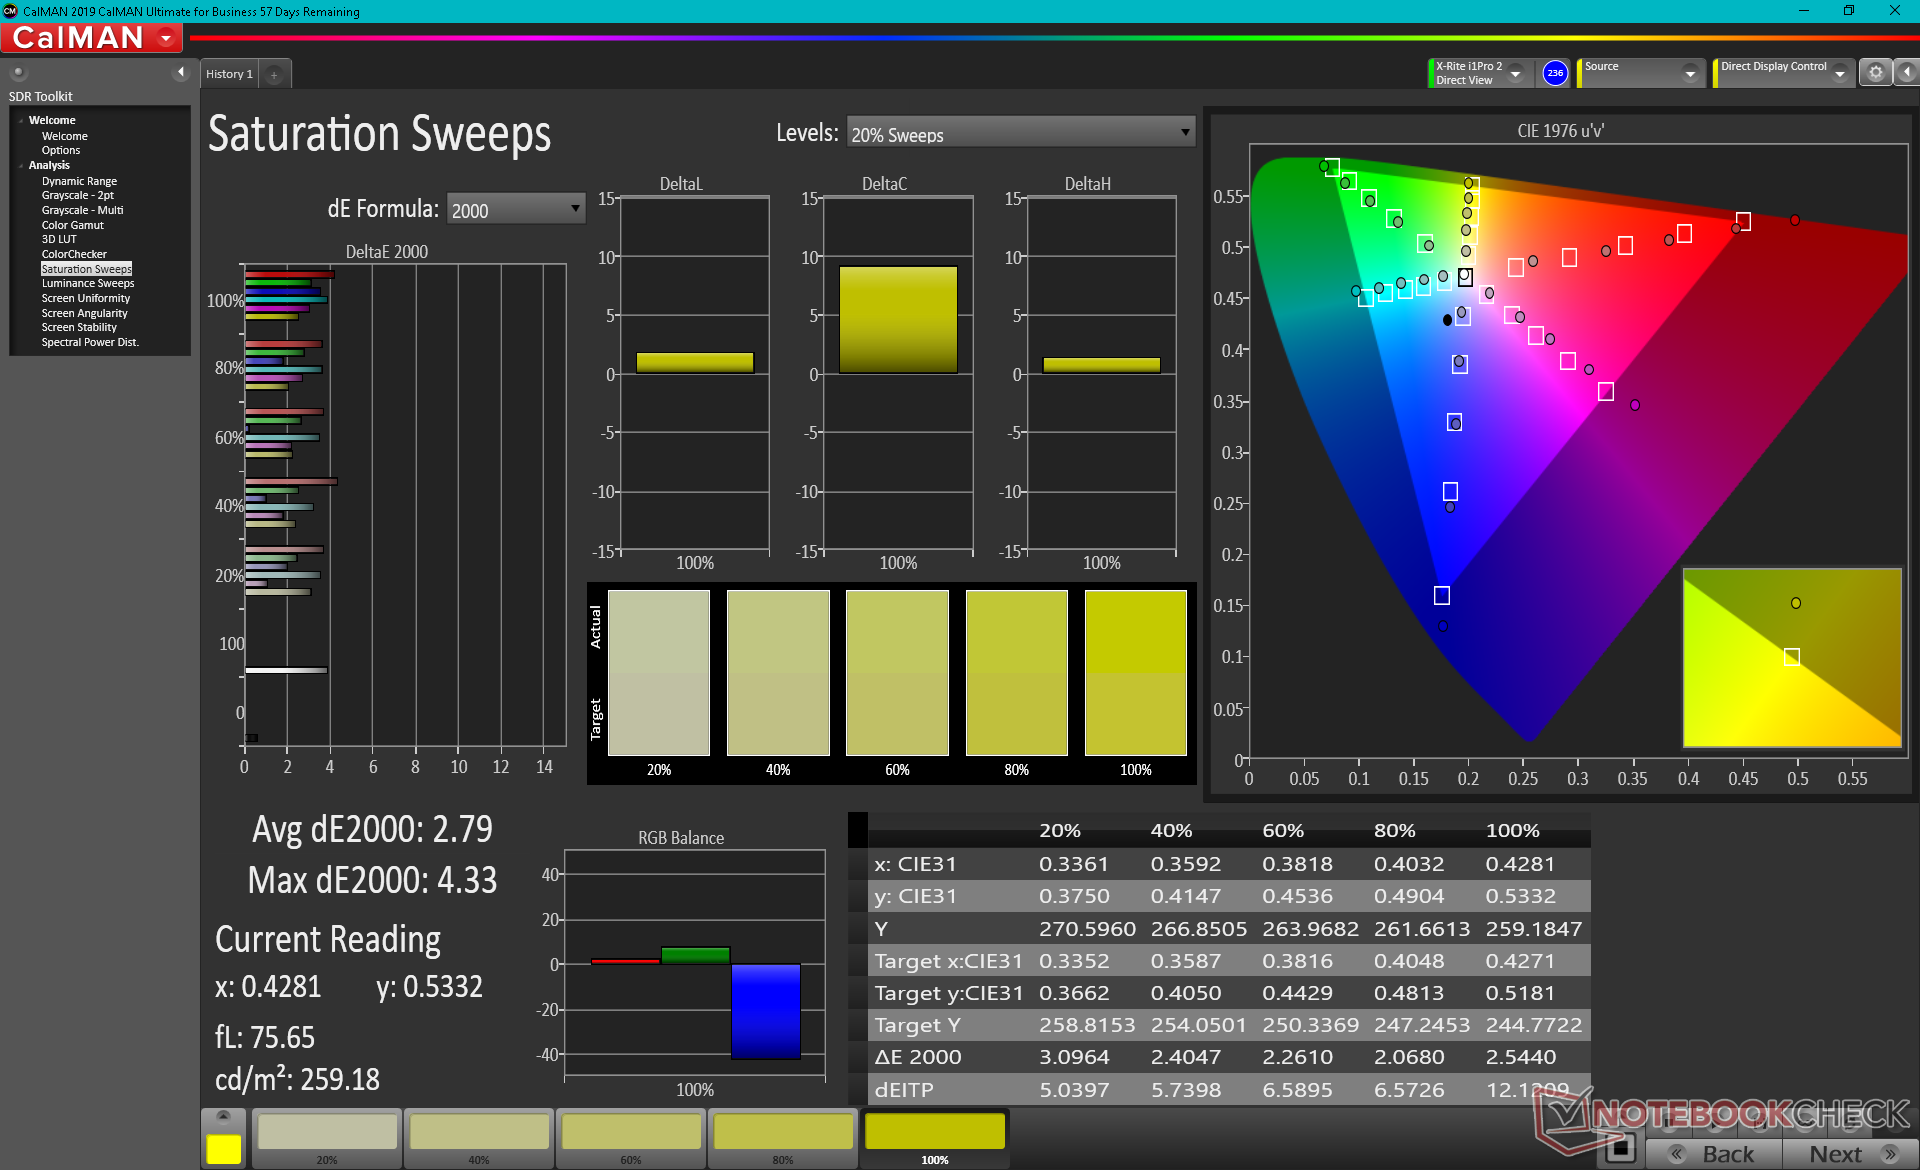
Die Farben hätten im Lieferzustand besser kalibriert sein können. Hier lag der durchschnittliche Graustufen- und Farb-DeltaE-Wert bei immerhin akzeptablen 3,6 bzw. 4,73. Nach unserer eigenen Kalibrierung mit dem X-Rite Farbspektrometer konnten wir beide Werte jedoch auf unter Eins bringen.
Reaktionszeiten (Response Times) des Displays
| ↔ Reaktionszeiten Schwarz zu Weiß | ||
|---|---|---|
| 30.4 ms ... steigend ↗ und fallend ↘ kombiniert | ↗ 16.4 ms steigend | 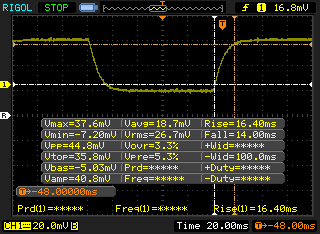 |
| ↘ 14 ms fallend | ||
| Die gemessenen Reaktionszeiten sind langsam und dadurch für viele Spieler wahrscheinlich zu langsam. Im Vergleich rangierten die bei uns getesteten Geräte von 0.1 (Minimum) zu 240 (Maximum) ms. » 82 % aller Screens waren schneller als der getestete. Daher sind die gemessenen Reaktionszeiten schlechter als der Durchschnitt aller vermessenen Geräte (19.9 ms). | ||
| ↔ Reaktionszeiten 50% Grau zu 80% Grau | ||
| 47.2 ms ... steigend ↗ und fallend ↘ kombiniert | ↗ 25.2 ms steigend | 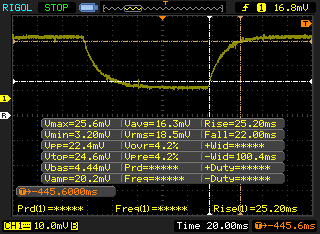 |
| ↘ 22 ms fallend | ||
| Die gemessenen Reaktionszeiten sind langsam und dadurch für viele Spieler wahrscheinlich zu langsam. Im Vergleich rangierten die bei uns getesteten Geräte von 0.165 (Minimum) zu 636 (Maximum) ms. » 82 % aller Screens waren schneller als der getestete. Daher sind die gemessenen Reaktionszeiten schlechter als der Durchschnitt aller vermessenen Geräte (31.1 ms). | ||
Bildschirm-Flackern / PWM (Pulse-Width Modulation)
| Flackern / PWM nicht festgestellt | 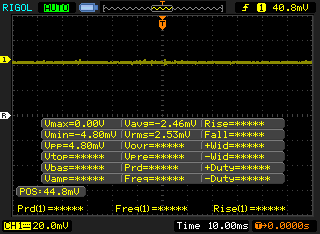 | ||
Im Vergleich: 52 % aller getesteten Geräte nutzten kein PWM um die Helligkeit zu reduzieren. Wenn PWM eingesetzt wurde, dann bei einer Frequenz von durchschnittlich 7784 (Minimum 5, Maximum 343500) Hz. | |||
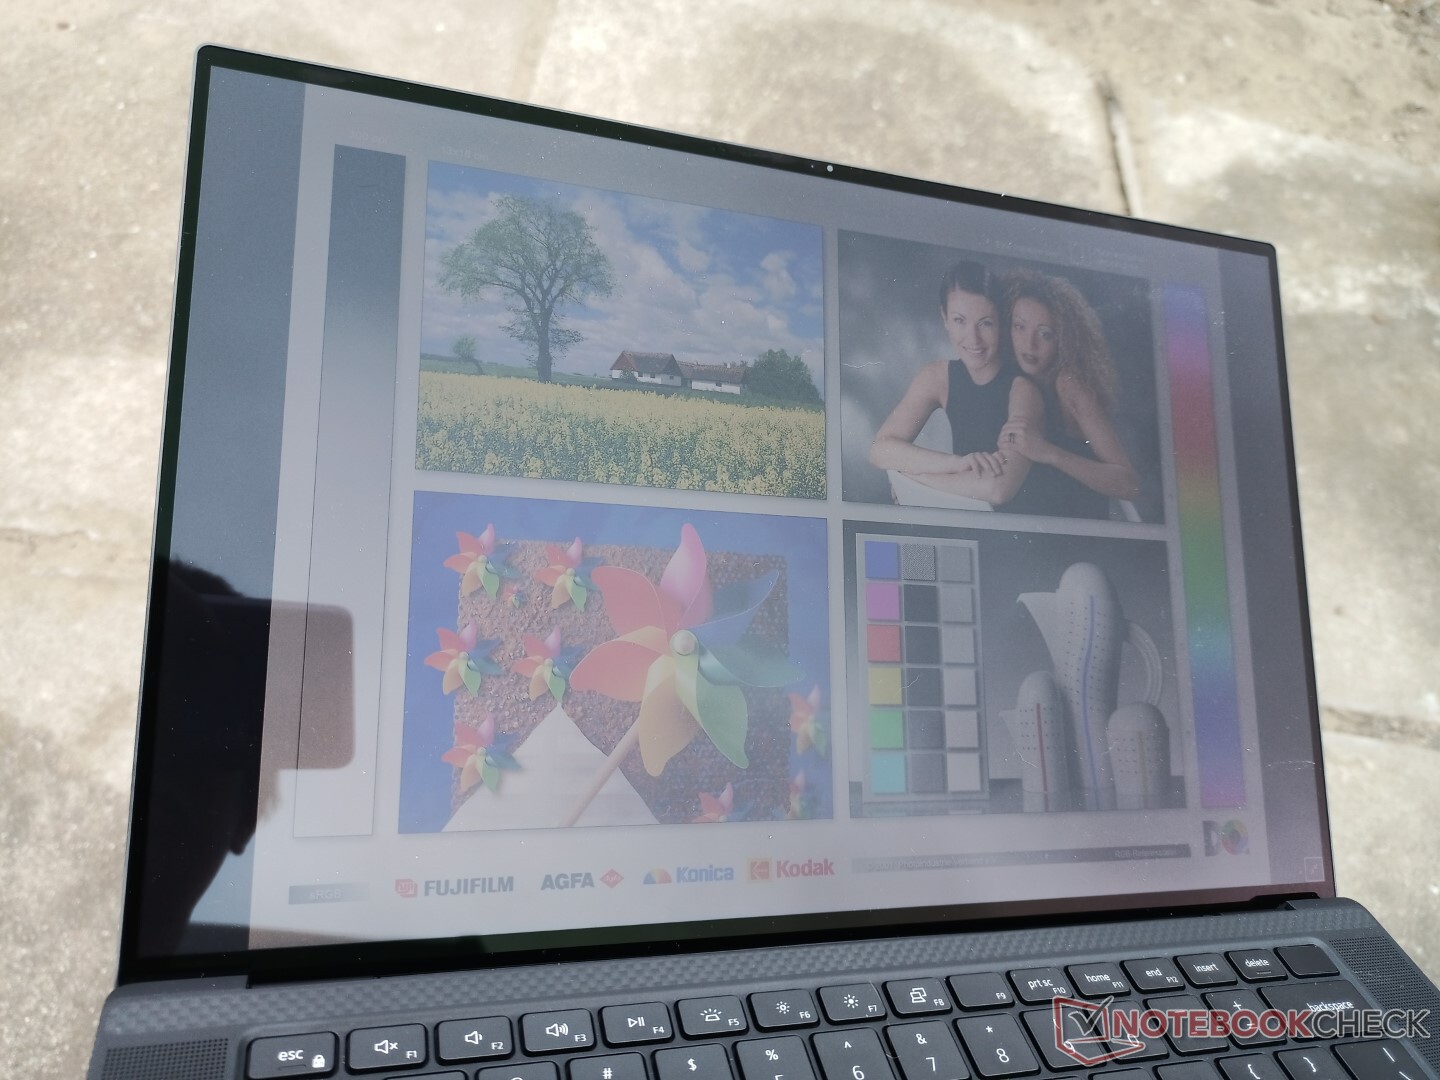
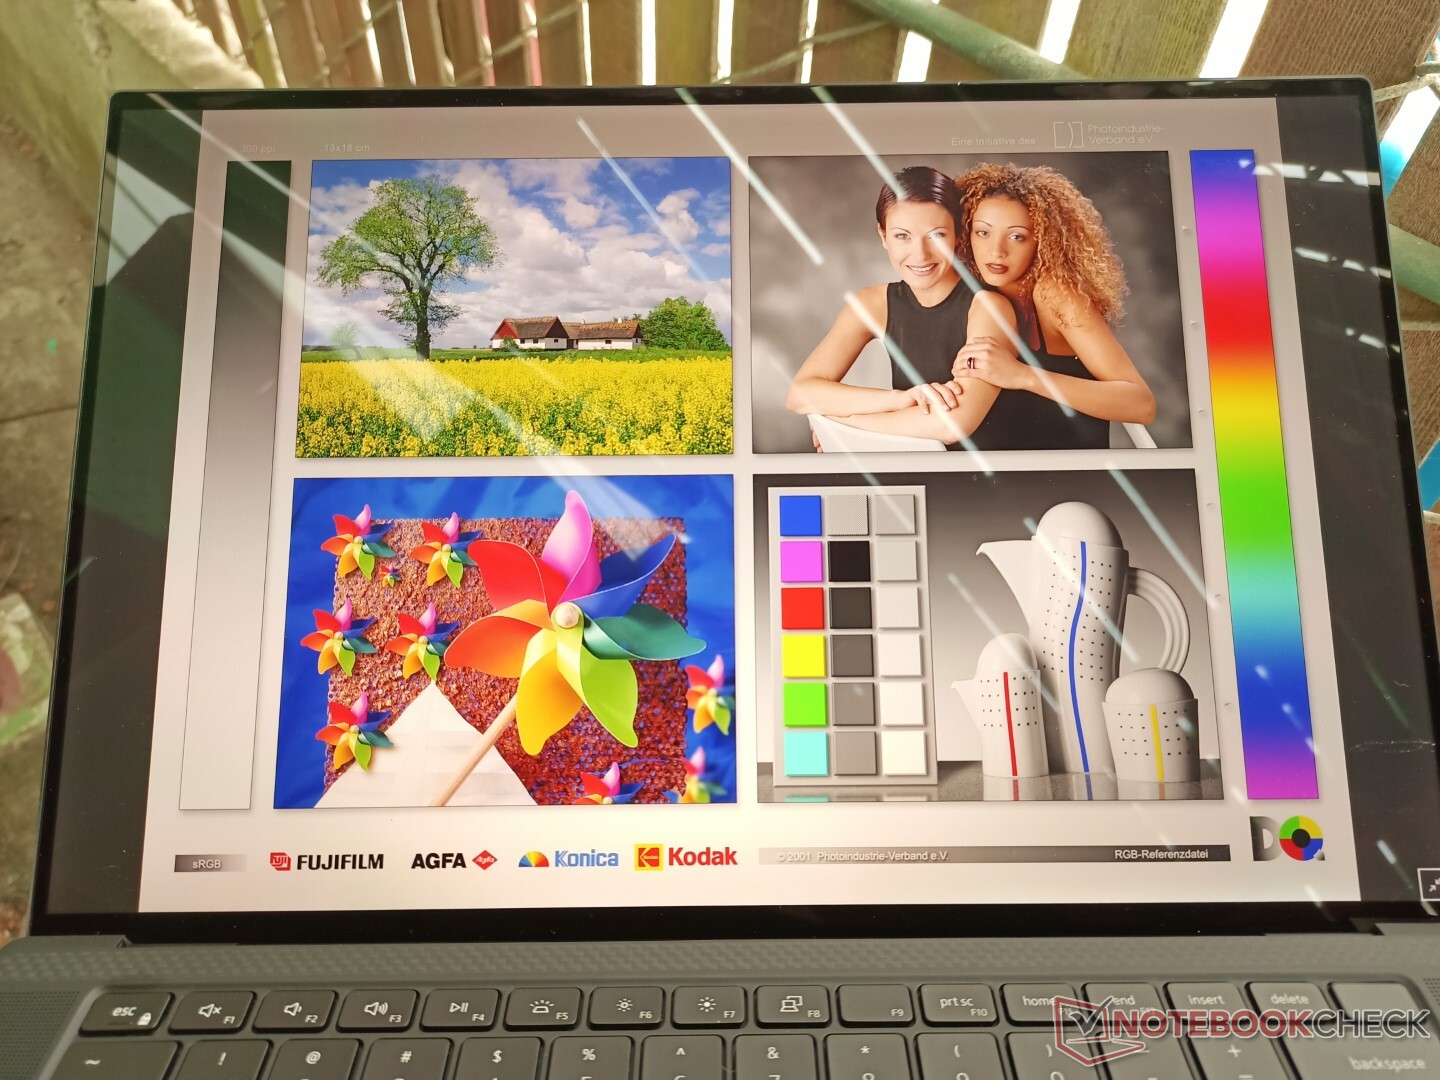
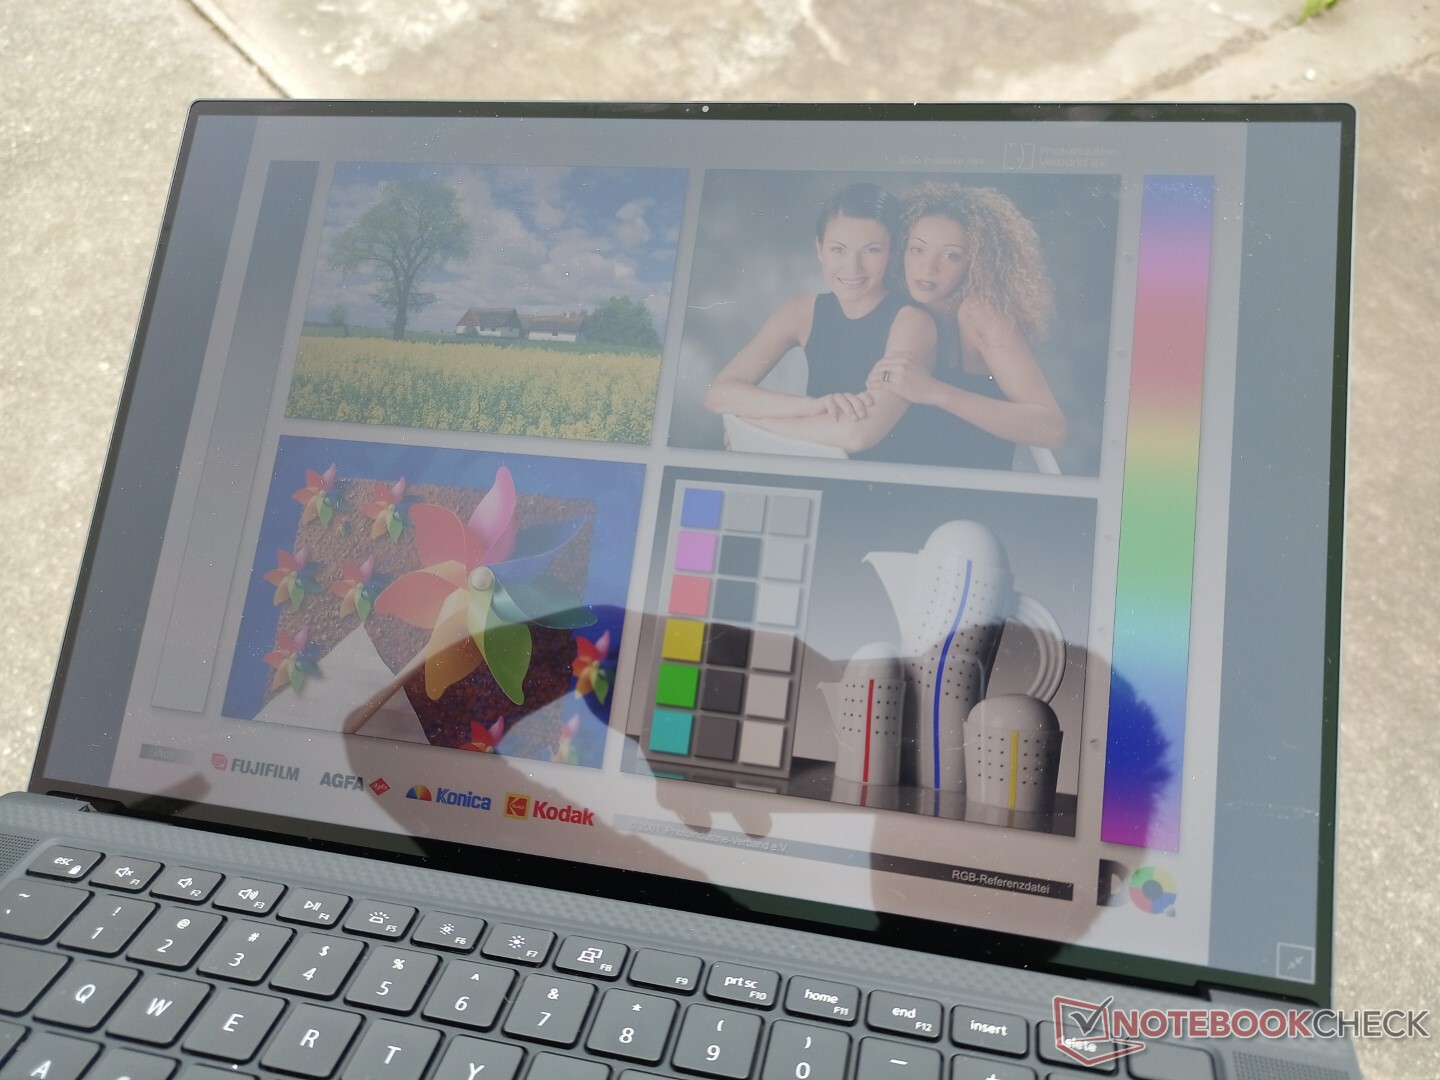
Die Sichtbarkeit im Freien ist aufgrund der helleren Hintergrundbeleuchtung auf unserem Precision 5560 besser als auf dem Razer Blade 15 Studio oder Asus ProArt. Allerdings lässt sich bei einem solchen Display etwas Glänzen kaum vermeiden. Als Alternative mit weniger Spiegelungen könnten Nutzer das matte 1.200p-Display wählen.
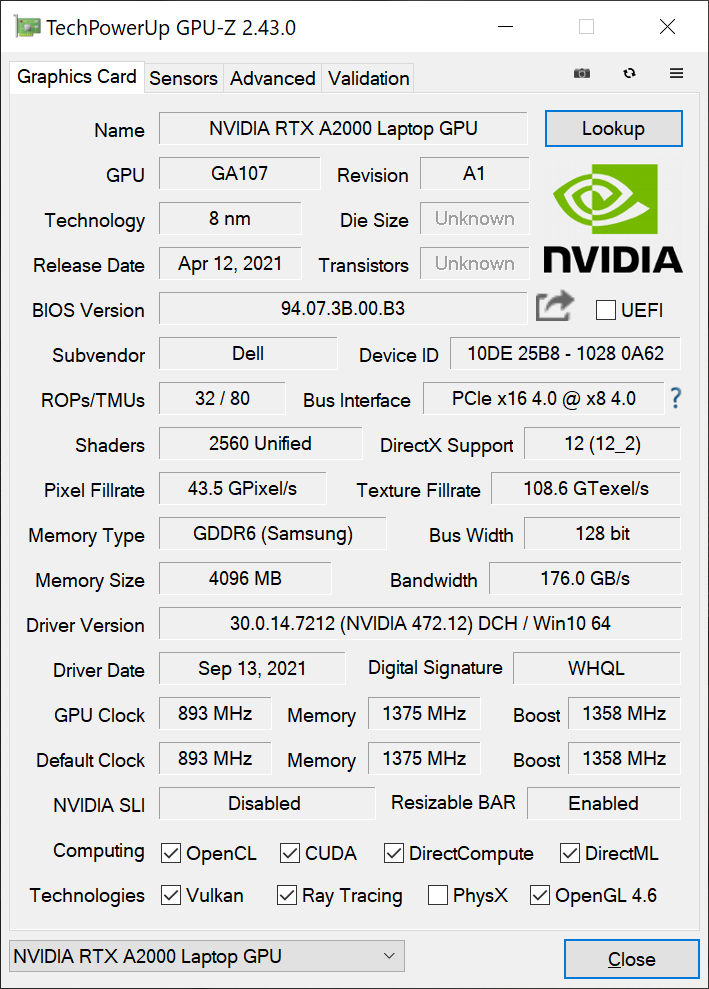
Leistung — Quadro RTX Graphics mit 45 W TGP
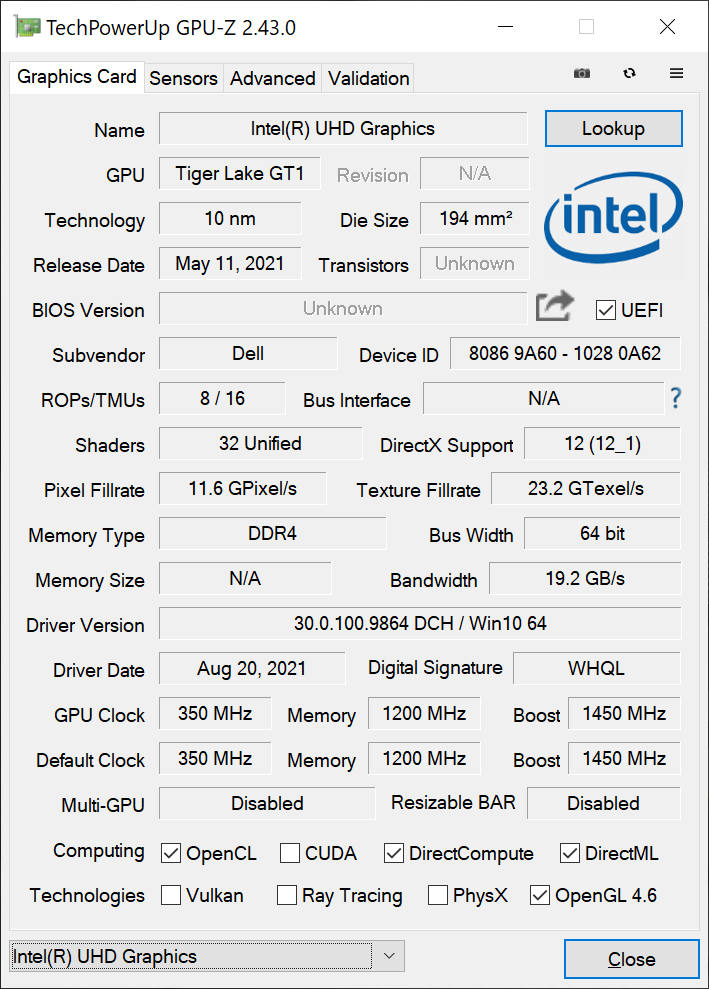
Dell bietet für fast alle Konfigurationen das Precision 5560 sowohl Tiger-Lake-H-Optionen mit vPro (i7-11850H, i9-11950H, Xeon W-11955M) als auch ohne vPro (i5-11500H, i7-11800H) und Nvidia Quadro GPUs (NVIDIA T1200, RTX A2000). Diese GPUs, vPro CPUs und die damit verbundenen optionalen ECC-RAM-Module unterscheiden das Precision 5560 von der eher an Verbraucher gerichteten XPS-15-Reihe.
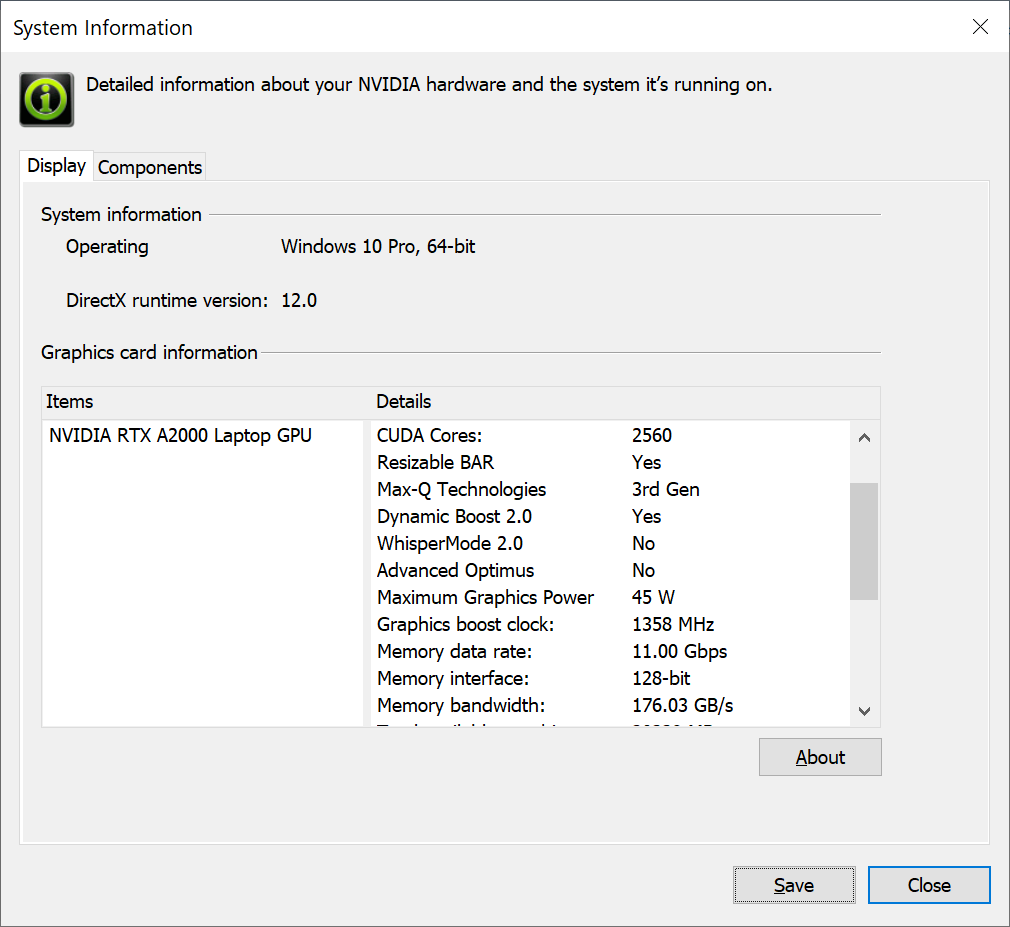
Die Quadro RTX A2000 in unserem Testgerät unterstützt Resizable Bar und Dynamic Boost 2.0, aber nicht Advanced Optimus oder WhisperMode 2.0. Mit einer TGP von nur 45 W handelt es sich hierbei eigentlich um eine Max-Q-GPU, auch wenn sie nicht mehr so genannt wird. Die TGP der älteren Quadro T2000 Max-Q im Precision 5550 wird auf etwa 40 W geschätzt.
Vor der Durchführung der Benchmarks wurde in der Software Dell Power Manager der Ultra-Performance-Modus eingestellt, um die bestmöglichen Ergebnisse zu erreichen.
Prozessor
Insgesamt ist die Multi-Thread-Leistung ungefähr 15 Prozent langsamer als beim Core i7-11800H. Das ist auf die integrierte vPro-Unterstützung zurückzuführen. Ein Upgrade auf den Core i9-11950H sollte die Multi-Thread-Leistung unseren Erfahrungen mit dem HP ZBook Studio 15 G8 zufolge um bis zu 20 Prozent erhöhen. Die Single-Thread-Leistung bleibt allerdings nahezu ident.
Unser Testgerät konnte die Leistung im CineBnch R15 xT langfristig sehr gut halten (siehe unten).
Cinebench R15 Multi Loop
Cinebench R23: Multi Core | Single Core
Cinebench R15: CPU Multi 64Bit | CPU Single 64Bit
Blender: v2.79 BMW27 CPU
7-Zip 18.03: 7z b 4 -mmt1 | 7z b 4
Geekbench 5.5: Single-Core | Multi-Core
HWBOT x265 Benchmark v2.2: 4k Preset
LibreOffice : 20 Documents To PDF
R Benchmark 2.5: Overall mean
| Cinebench R23 / Multi Core | |
| Lenovo Legion 5 15ACH-82JU00C6GE-FL | |
| HP ZBook Studio 15 G8 | |
| Lenovo ThinkPad P15 G2-20YQ001JGE | |
| Durchschnittliche Intel Core i7-11850H (9779 - 11935, n=2) | |
| HP ZBook Studio G7 | |
| Dell Precision 5000 5560 | |
| Lenovo ThinkPad P15 Gen1-20ST000DGE | |
| Lenovo ThinkPad P15s Gen2-20W6000GGE | |
| Cinebench R23 / Single Core | |
| HP ZBook Studio 15 G8 | |
| Durchschnittliche Intel Core i7-11850H (1513 - 1552, n=2) | |
| Dell Precision 5000 5560 | |
| Lenovo ThinkPad P15 G2-20YQ001JGE | |
| Lenovo ThinkPad P15s Gen2-20W6000GGE | |
| Lenovo Legion 5 15ACH-82JU00C6GE-FL | |
| HP ZBook Studio G7 | |
| Lenovo ThinkPad P15 Gen1-20ST000DGE | |
Cinebench R23: Multi Core | Single Core
Cinebench R15: CPU Multi 64Bit | CPU Single 64Bit
Blender: v2.79 BMW27 CPU
7-Zip 18.03: 7z b 4 -mmt1 | 7z b 4
Geekbench 5.5: Single-Core | Multi-Core
HWBOT x265 Benchmark v2.2: 4k Preset
LibreOffice : 20 Documents To PDF
R Benchmark 2.5: Overall mean
* ... kleinere Werte sind besser
Systemleistung
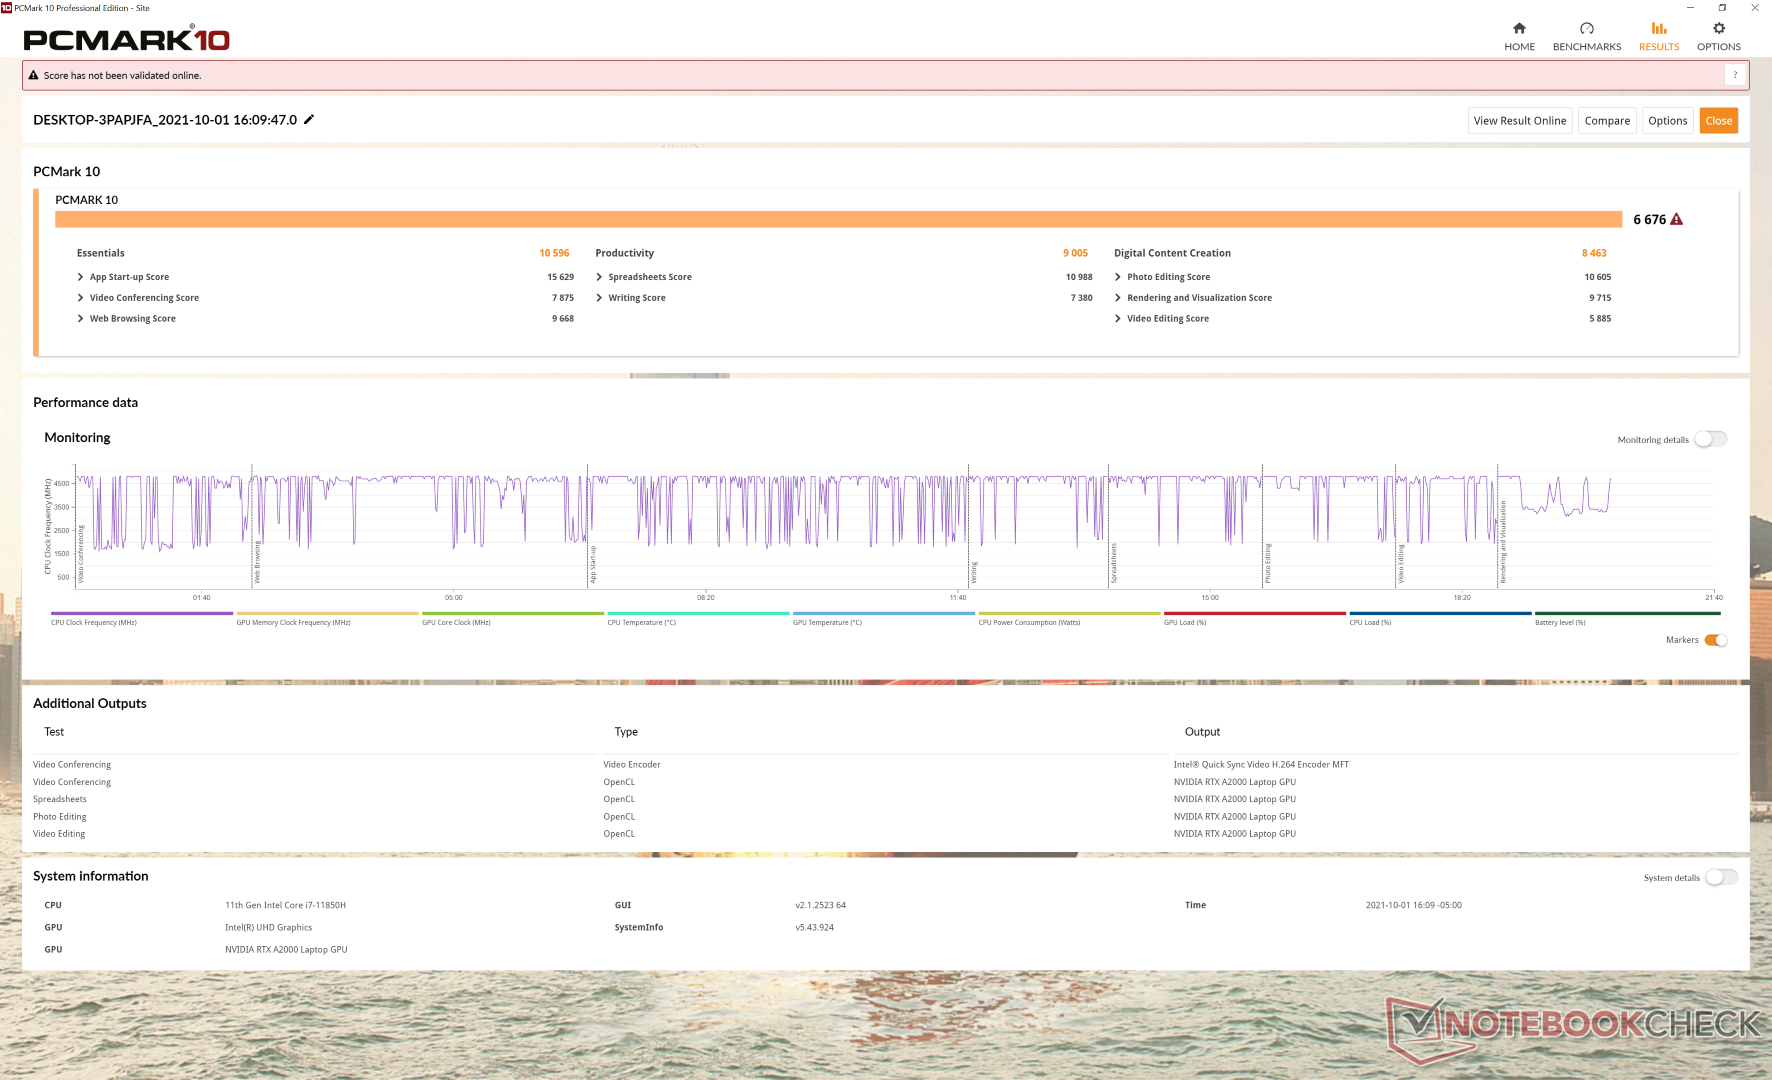
Die PCMark-Ergebnisse sind hier durchgehend höher als die des Precision 5550, insbesondere was die GPU-lastige Benchmark Digital Content Creation angeht. Hier hat die RTX A2000 einen deutlichen Vorteil gegenüber der Quadro T2000 Max-Q.
| PCMark 10 / Score | |
| HP ZBook Studio 15 G8 | |
| Dell Precision 5000 5560 | |
| Durchschnittliche Intel Core i7-11850H, NVIDIA RTX A2000 Laptop GPU (n=1) | |
| Lenovo ThinkPad P15 G2-20YQ001JGE | |
| Dell Precision 7550 | |
| Dell Precision 5550 P91F | |
| Razer Blade 15 Studio Edition 2020 | |
| Asus ProArt StudioBook Pro 15 W500G5T | |
| PCMark 10 / Essentials | |
| Dell Precision 5000 5560 | |
| Durchschnittliche Intel Core i7-11850H, NVIDIA RTX A2000 Laptop GPU (n=1) | |
| Lenovo ThinkPad P15 G2-20YQ001JGE | |
| HP ZBook Studio 15 G8 | |
| Dell Precision 5550 P91F | |
| Dell Precision 7550 | |
| Razer Blade 15 Studio Edition 2020 | |
| Asus ProArt StudioBook Pro 15 W500G5T | |
| PCMark 10 / Productivity | |
| Dell Precision 5000 5560 | |
| Durchschnittliche Intel Core i7-11850H, NVIDIA RTX A2000 Laptop GPU (n=1) | |
| HP ZBook Studio 15 G8 | |
| Lenovo ThinkPad P15 G2-20YQ001JGE | |
| Razer Blade 15 Studio Edition 2020 | |
| Dell Precision 7550 | |
| Dell Precision 5550 P91F | |
| Asus ProArt StudioBook Pro 15 W500G5T | |
| PCMark 10 / Digital Content Creation | |
| HP ZBook Studio 15 G8 | |
| Lenovo ThinkPad P15 G2-20YQ001JGE | |
| Dell Precision 5000 5560 | |
| Durchschnittliche Intel Core i7-11850H, NVIDIA RTX A2000 Laptop GPU (n=1) | |
| Dell Precision 7550 | |
| Dell Precision 5550 P91F | |
| Asus ProArt StudioBook Pro 15 W500G5T | |
| Razer Blade 15 Studio Edition 2020 | |
| PCMark 10 Score | 6676 Punkte | |
Hilfe | ||
DPC-Latenzen
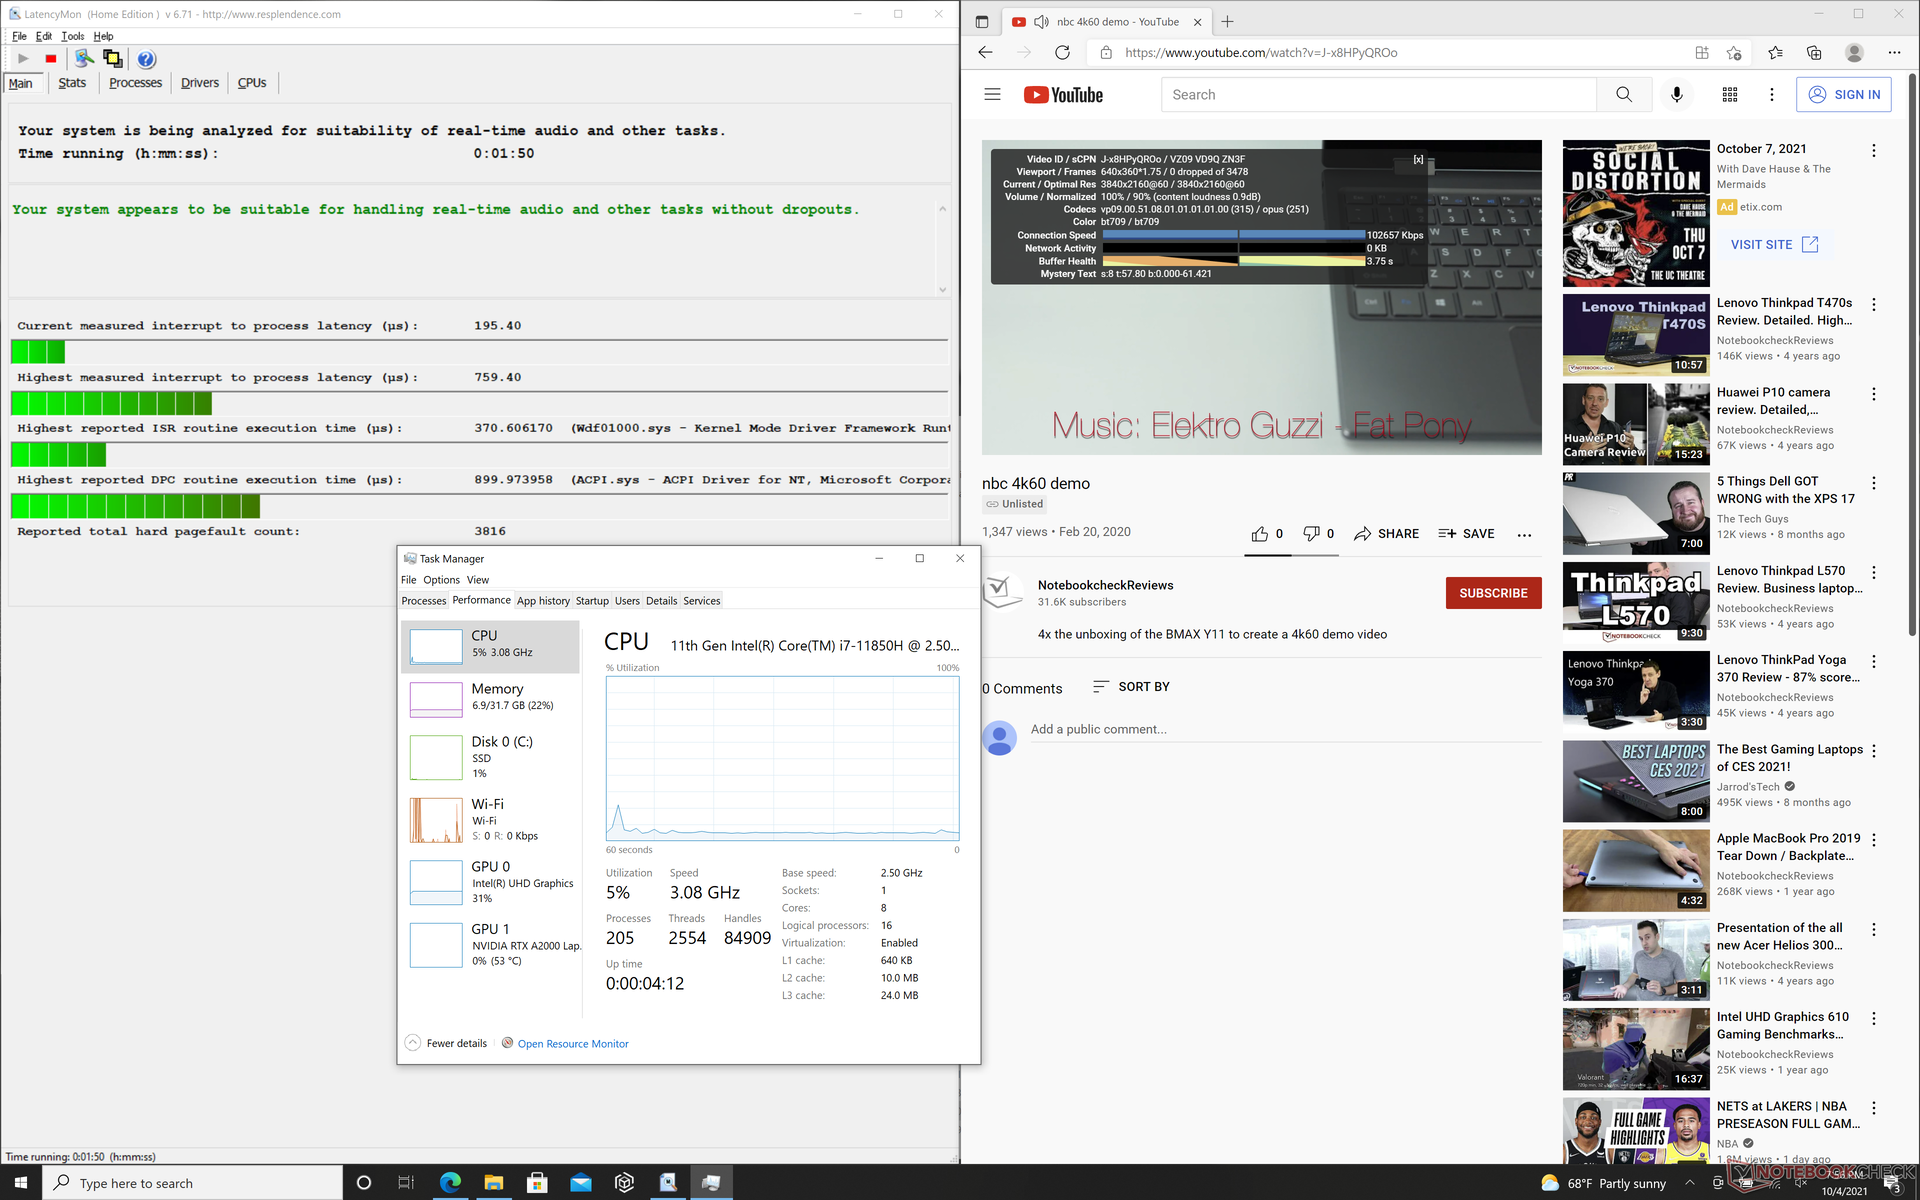
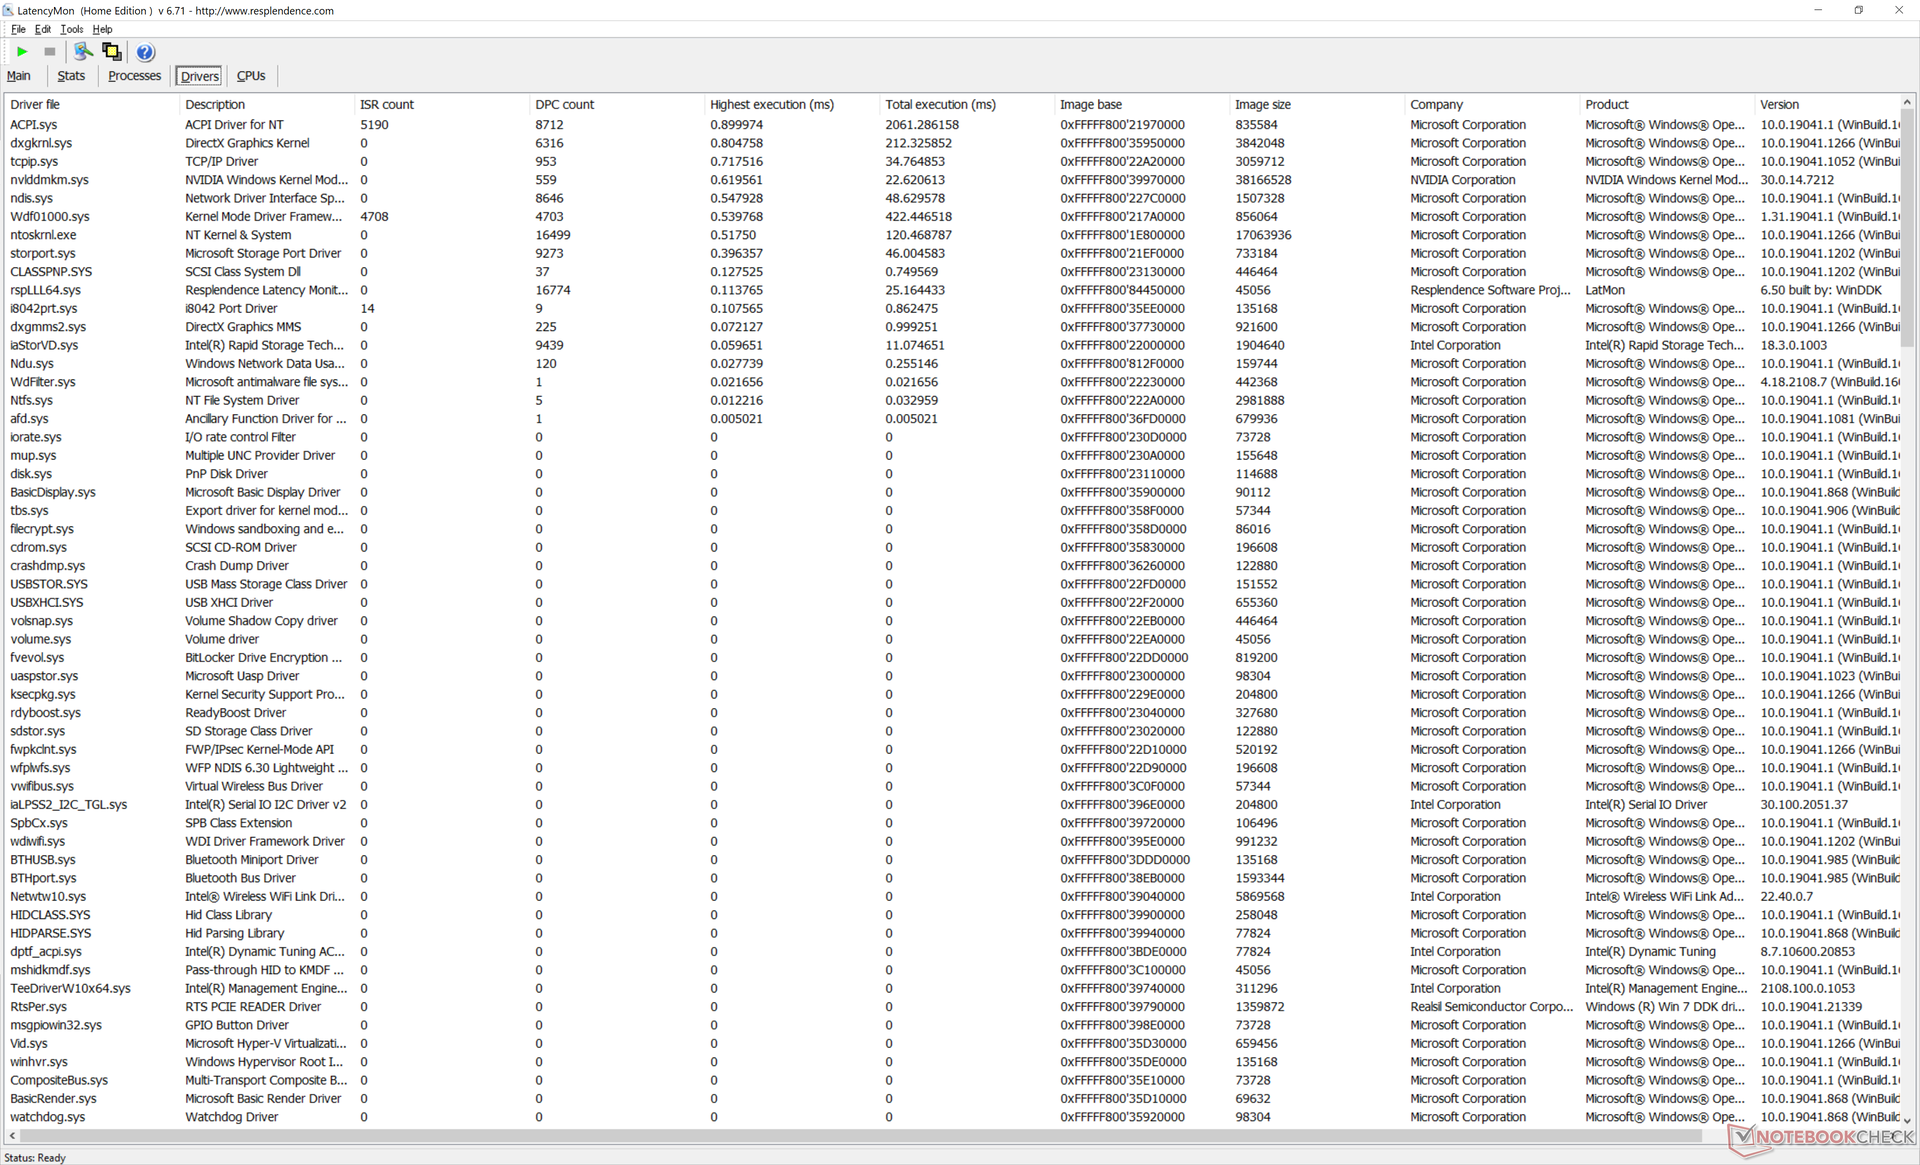
Der LatencyMon zeigt bei mehreren geöffneten Tabs im Browser und unter Prime95 keine Probleme mit DPC-Latenzen. Auch das Abspielen von 4K-Video mit 60 FPS verläuft sehr gleichmäßig und ohne verlorene Frames. Von einer Workstation würde man sich das aber auch nicht anders erwarten.
| DPC Latencies / LatencyMon - interrupt to process latency (max), Web, Youtube, Prime95 | |
| Dell Precision 7550 | |
| Lenovo ThinkPad P15 G2-20YQ001JGE | |
| Asus ProArt StudioBook Pro 15 W500G5T | |
| HP ZBook Studio 15 G8 | |
| Dell Precision 5000 5560 | |
| Razer Blade 15 Studio Edition 2020 | |
| Dell Precision 5550 P91F | |
* ... kleinere Werte sind besser
Massenspeicher
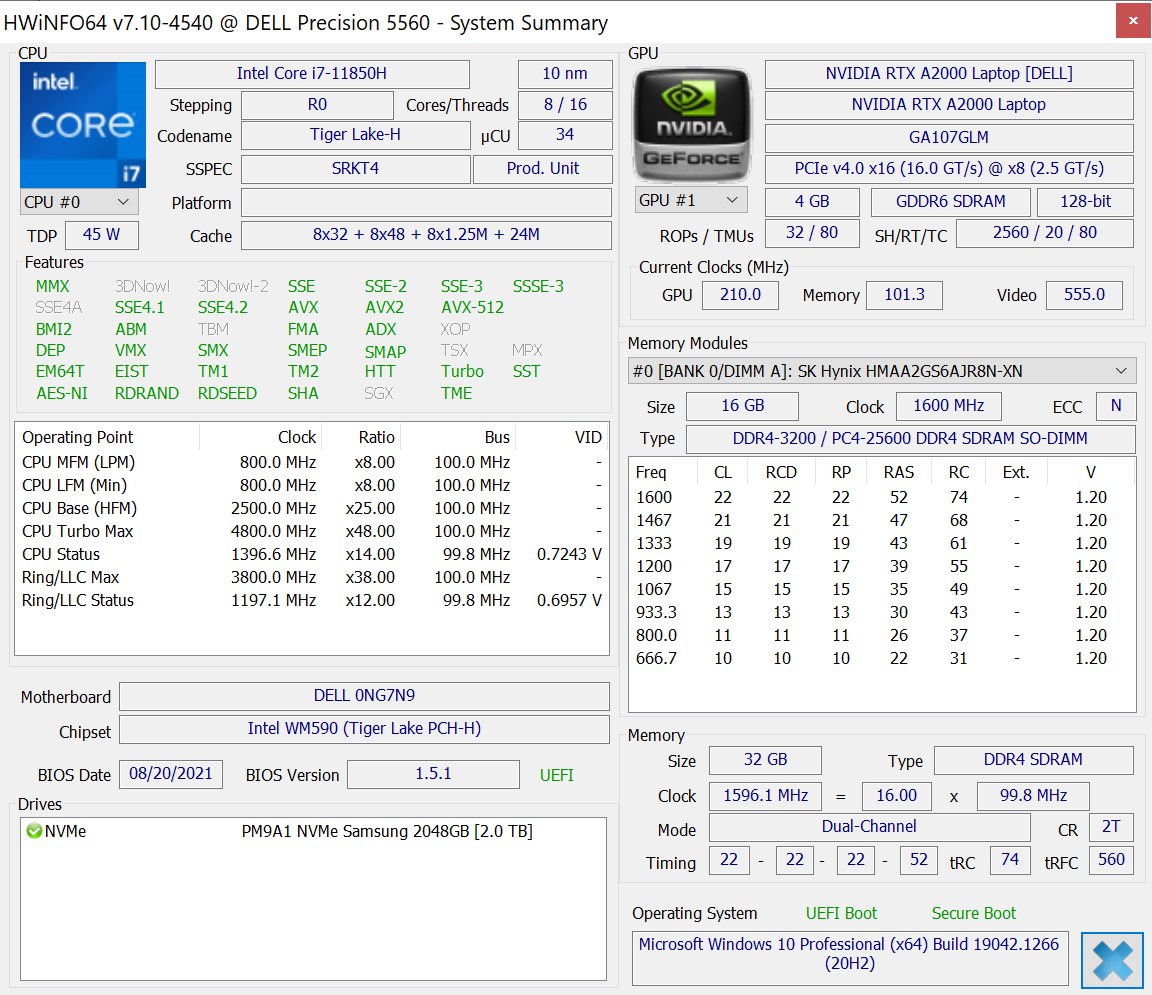
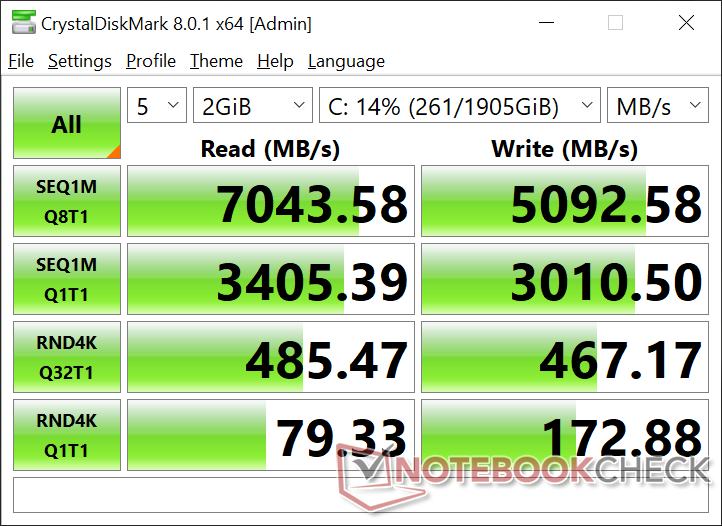
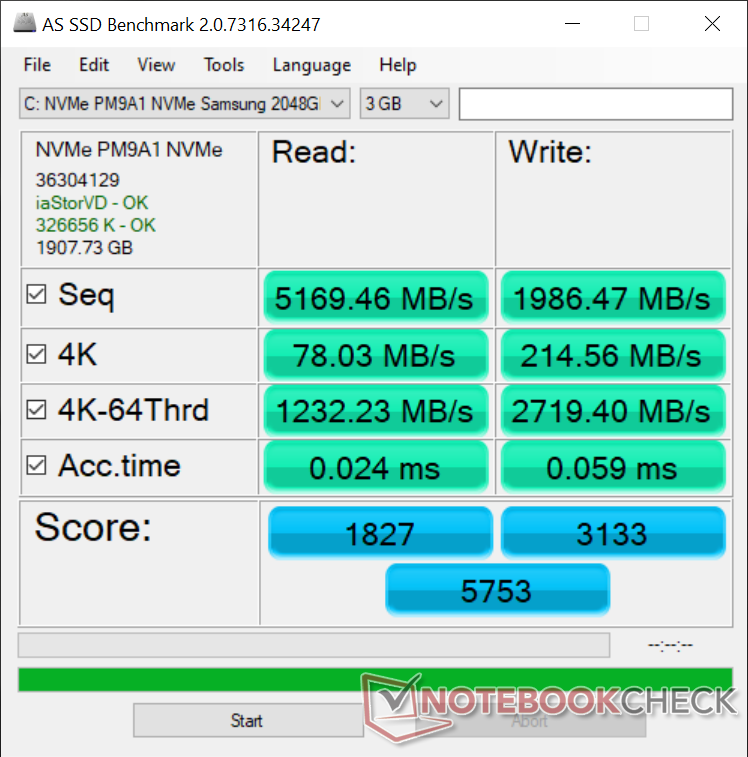
Dell hat uns bestätigt, dass beide M.2-Speicherplätze PCIe4-x4-SSDs unterstützen. Das Precision 5550 bot hingegen nur PCIe3. Selbst das Alienware x17 R1 unterstützt nur eine PCIe4-x4-SSD, obwohl auch dieses Gerät mit zwei M.2-Slots ausgestattet ist. Unser Testmodell ist mit einer Samsung PM9A1 ausgestattet – einer der schnellsten an Verbraucher gerichteten PCIe4-SSDs auf dem Markt. Wir konnten daher selbstverständlich einen deutlichen Leistungsvorteil gegenüber der SK Hynix PC601A im Vorjahresmodell messen.
| Dell Precision 5000 5560 Samsung PM9A1 MZVL22T0HBLB | Lenovo ThinkPad P15 G2-20YQ001JGE Kioxia XG7 KXG7AZNV512G | HP ZBook Studio 15 G8 Samsung PM981a MZVLB2T0HALB | Asus ProArt StudioBook Pro 15 W500G5T Samsung SSD PM981 MZVLB1T0HALR | Dell Precision 7550 SK Hynix PC601A NVMe 1TB | Dell Precision 5550 P91F SK Hynix PC601A NVMe 1TB | Razer Blade 15 Studio Edition 2020 Samsung PM981a MZVLB1T0HBLR | |
|---|---|---|---|---|---|---|---|
| AS SSD | -8% | -16% | -16% | -42% | -142% | -33% | |
| Seq Read (MB/s) | 5169 | 5105 -1% | 2953 -43% | 2702 -48% | 2028 -61% | 2039 -61% | 1982 -62% |
| Seq Write (MB/s) | 1986 | 1815 -9% | 1691 -15% | 2348 18% | 1193 -40% | 1376 -31% | 2252 13% |
| 4K Read (MB/s) | 78 | 47.46 -39% | 43.98 -44% | 37.59 -52% | 42.31 -46% | 44.11 -43% | 47.13 -40% |
| 4K Write (MB/s) | 214.6 | 137.3 -36% | 105.4 -51% | 107.1 -50% | 105.5 -51% | 113.3 -47% | 88.2 -59% |
| 4K-64 Read (MB/s) | 1232 | 2112 71% | 1065 -14% | 1491 21% | 1128 -8% | 1094 -11% | 1481 20% |
| 4K-64 Write (MB/s) | 2719 | 1702 -37% | 1957 -28% | 1794 -34% | 1537 -43% | 1630 -40% | 1842 -32% |
| Access Time Read * (ms) | 0.024 | 0.065 -171% | 0.04 -67% | 0.046 -92% | 0.069 -188% | 0.059 -146% | 0.087 -262% |
| Access Time Write * (ms) | 0.059 | 0.03 49% | 0.105 -78% | 0.034 42% | 0.106 -80% | 0.99 -1578% | 0.04 32% |
| Score Read (Points) | 1827 | 2670 46% | 1404 -23% | 1798 -2% | 1373 -25% | 1342 -27% | 1726 -6% |
| Score Write (Points) | 3133 | 2021 -35% | 2232 -29% | 2136 -32% | 1762 -44% | 1881 -40% | 2155 -31% |
| Score Total (Points) | 5753 | 5885 2% | 4297 -25% | 4835 -16% | 3801 -34% | 3883 -33% | 4781 -17% |
| Copy ISO MB/s (MB/s) | 3201 | 2054 -36% | 2474 -23% | 2302 -28% | 1768 -45% | 2489 -22% | 1982 -38% |
| Copy Program MB/s (MB/s) | 415.8 | 714 72% | 1074 158% | 564 36% | 627 51% | 682 64% | 501 20% |
| Copy Game MB/s (MB/s) | 1212 | 1431 18% | 1929 59% | 1336 10% | 1477 22% | 1515 25% | 1140 -6% |
| CrystalDiskMark 5.2 / 6 | -9% | -29% | 38% | -35% | -36% | -26% | |
| Write 4K (MB/s) | 172.4 | 141.1 -18% | 110.5 -36% | 1107 542% | 121 -30% | 122.6 -29% | 132.9 -23% |
| Read 4K (MB/s) | 78.8 | 58.8 -25% | 51.8 -34% | 43.38 -45% | 42.16 -46% | 42.4 -46% | 46.73 -41% |
| Write Seq (MB/s) | 2991 | 3320 11% | 2071 -31% | 2387 -20% | 2150 -28% | 2167 -28% | 2214 -26% |
| Read Seq (MB/s) | 3351 | 2994 -11% | 2505 -25% | 2431 -27% | 1755 -48% | 1747 -48% | 2018 -40% |
| Write 4K Q32T1 (MB/s) | 459.2 | 626 36% | 429.8 -6% | 340.7 -26% | 395.3 -14% | 388.8 -15% | 478.9 4% |
| Read 4K Q32T1 (MB/s) | 484.3 | 401.8 -17% | 418.3 -14% | 397.8 -18% | 381.8 -21% | 367.3 -24% | 540 12% |
| Write Seq Q32T1 (MB/s) | 4761 | 3742 -21% | 3060 -36% | 2390 -50% | 2730 -43% | 2629 -45% | 2975 -38% |
| Read Seq Q32T1 (MB/s) | 7071 | 5097 -28% | 3539 -50% | 3502 -50% | 3468 -51% | 3460 -51% | 3195 -55% |
| Durchschnitt gesamt (Programm / Settings) | -9% /
-8% | -23% /
-21% | 11% /
4% | -39% /
-40% | -89% /
-103% | -30% /
-31% |
* ... kleinere Werte sind besser

Dauerleistung Lesen: DiskSpd Read Loop, Queue Depth 8
Grafikkarte
Die reine Grafikleistung der Quadro RTX A2000 positioniert die Grafikkarte zwischen der GeForce GTX 1650 Ti und der GTX 1660 Ti bzw. etwa 10 Prozent unterhalb der älteren Quadro RTX 3000 Max-Q. Die Leistungssteigerung ist im Vergleich zur Quadro T2000 Max-Q im Precision 5550 mit 40 bis 50 Prozent deutlich beeindruckender. Ein Upgrade auf die Quadro RTX A3000, die im Precision 5560 nicht einmal erhältlich ist, kann eine weitere Leistungssteigerung um 30 bis 40 Prozent gegenüber der Quadro RTX A2000 bringen.
Interessanterweise sind die SpecViewPerf-Ergebnisse unserer RTX A2000 und der Quadro RTX 3000 Max-Q der letzten Generation trotz der höheren Energieaufnahme der älteren Turing-GPU deutlich ähnlicher als erwartet. Das deutet auf eine bessere Optimierung unserer Ampere-GPU auf für Workstations typische Lasten.
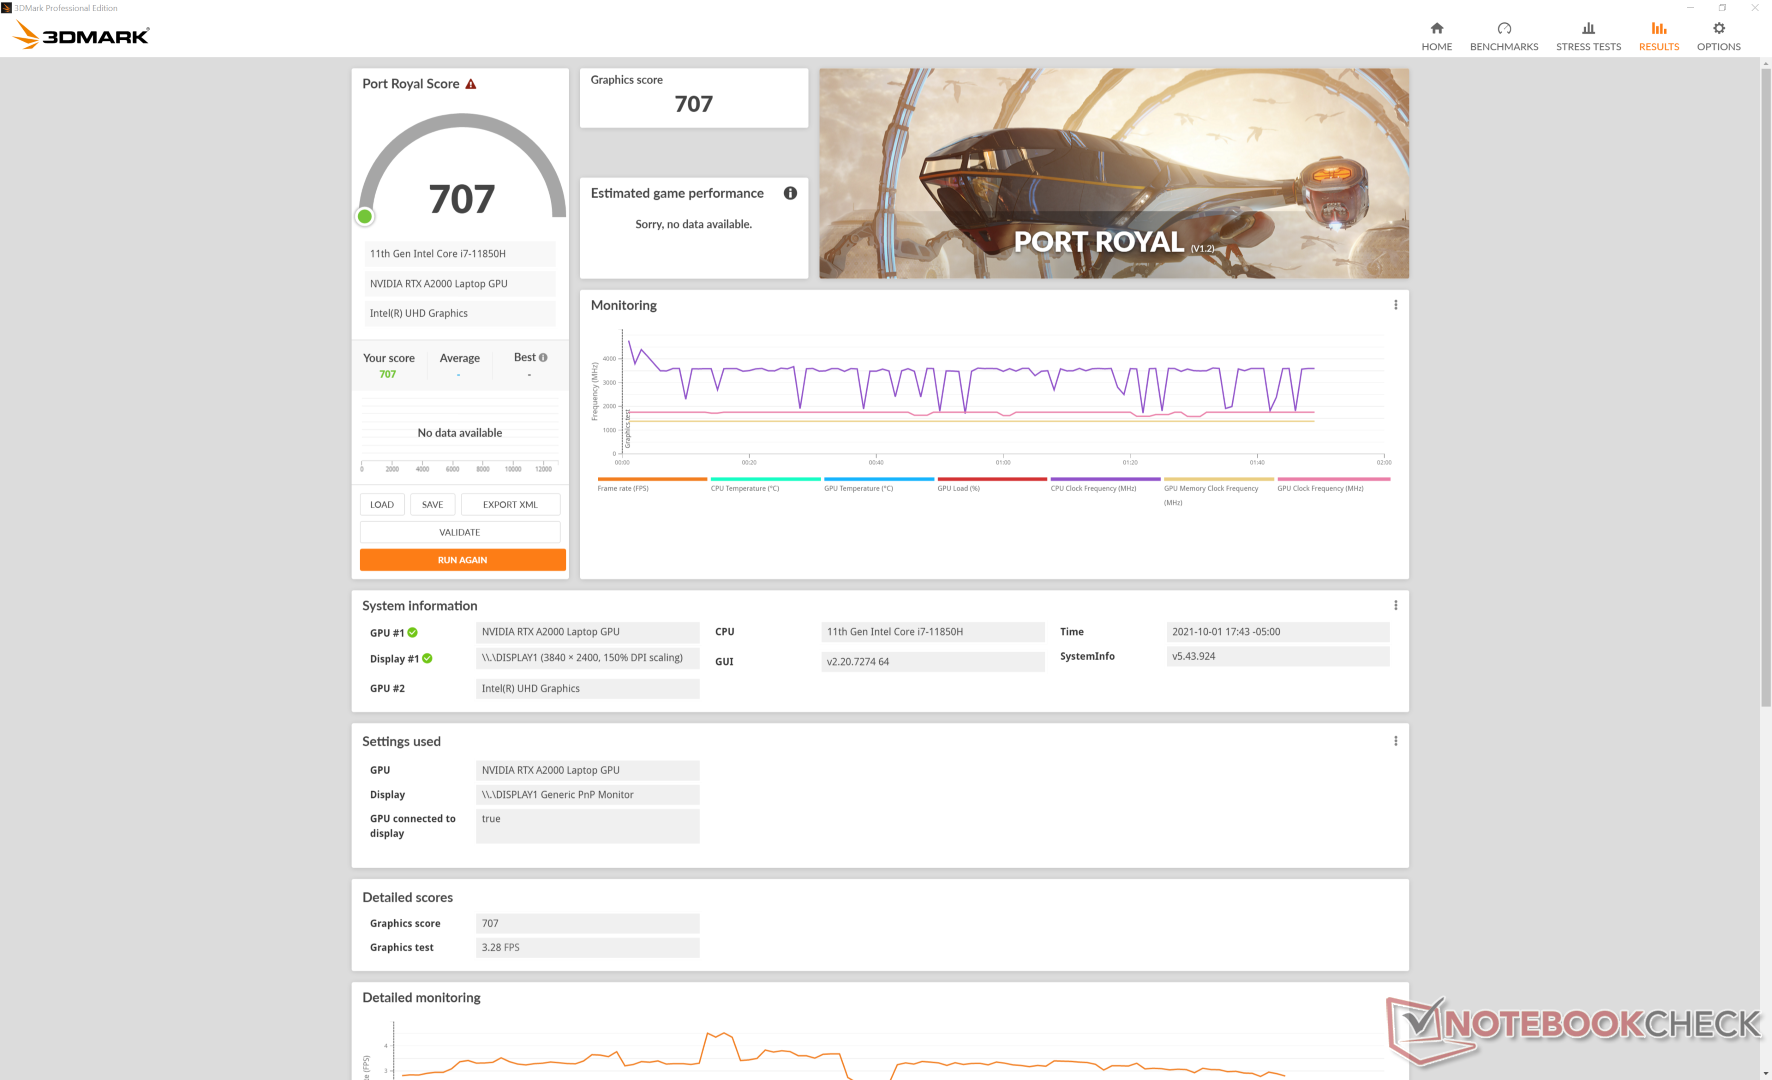
Beim Gamen können Nutzer eine um 20 bis 30 Prozent langsamere Leistung erwarten als von der GTX 1660, da Quadro-GPUs nicht fürs Gamen ausgelegt sind. Strange Brigade hängte sich zum Beispiel immer wieder ein oder zwei Minuten nach Start des Benchmarks auf.
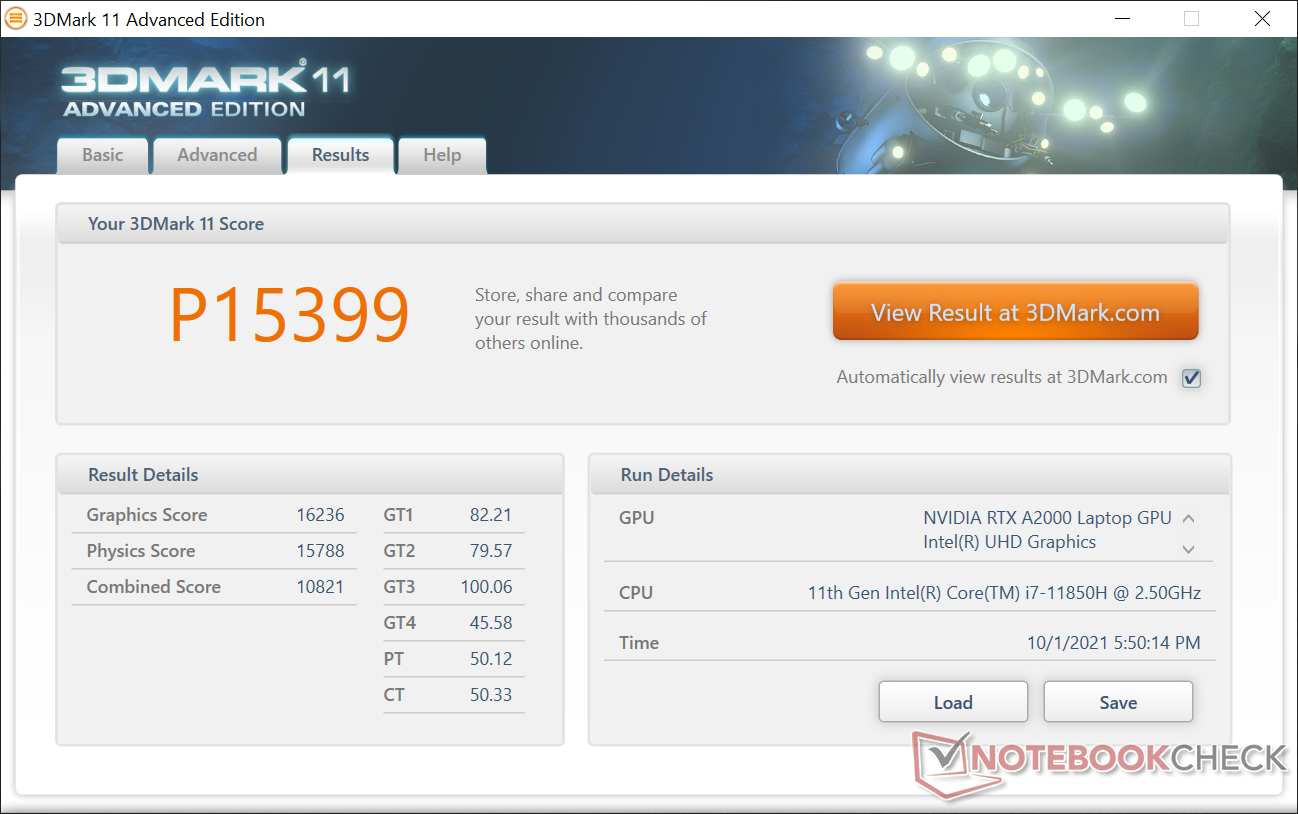
| 3DMark 11 Performance | 15399 Punkte | |
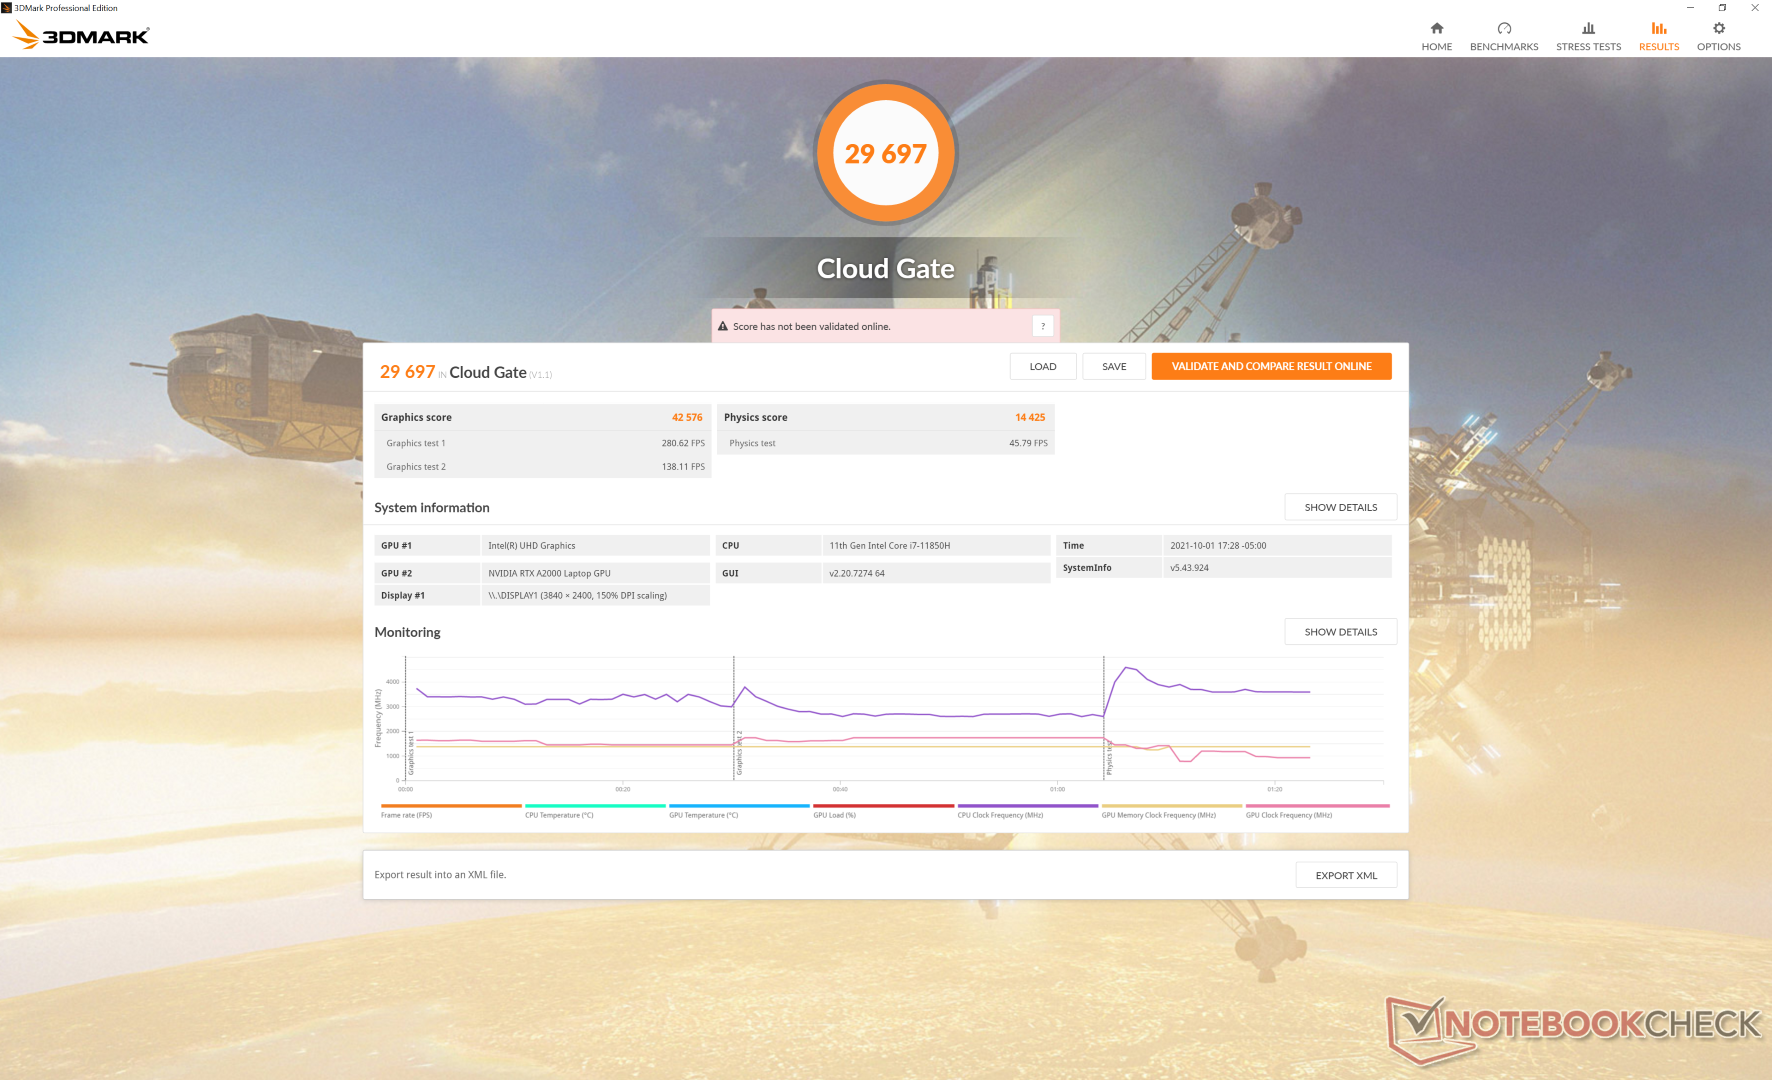
| 3DMark Cloud Gate Standard Score | 29697 Punkte | |
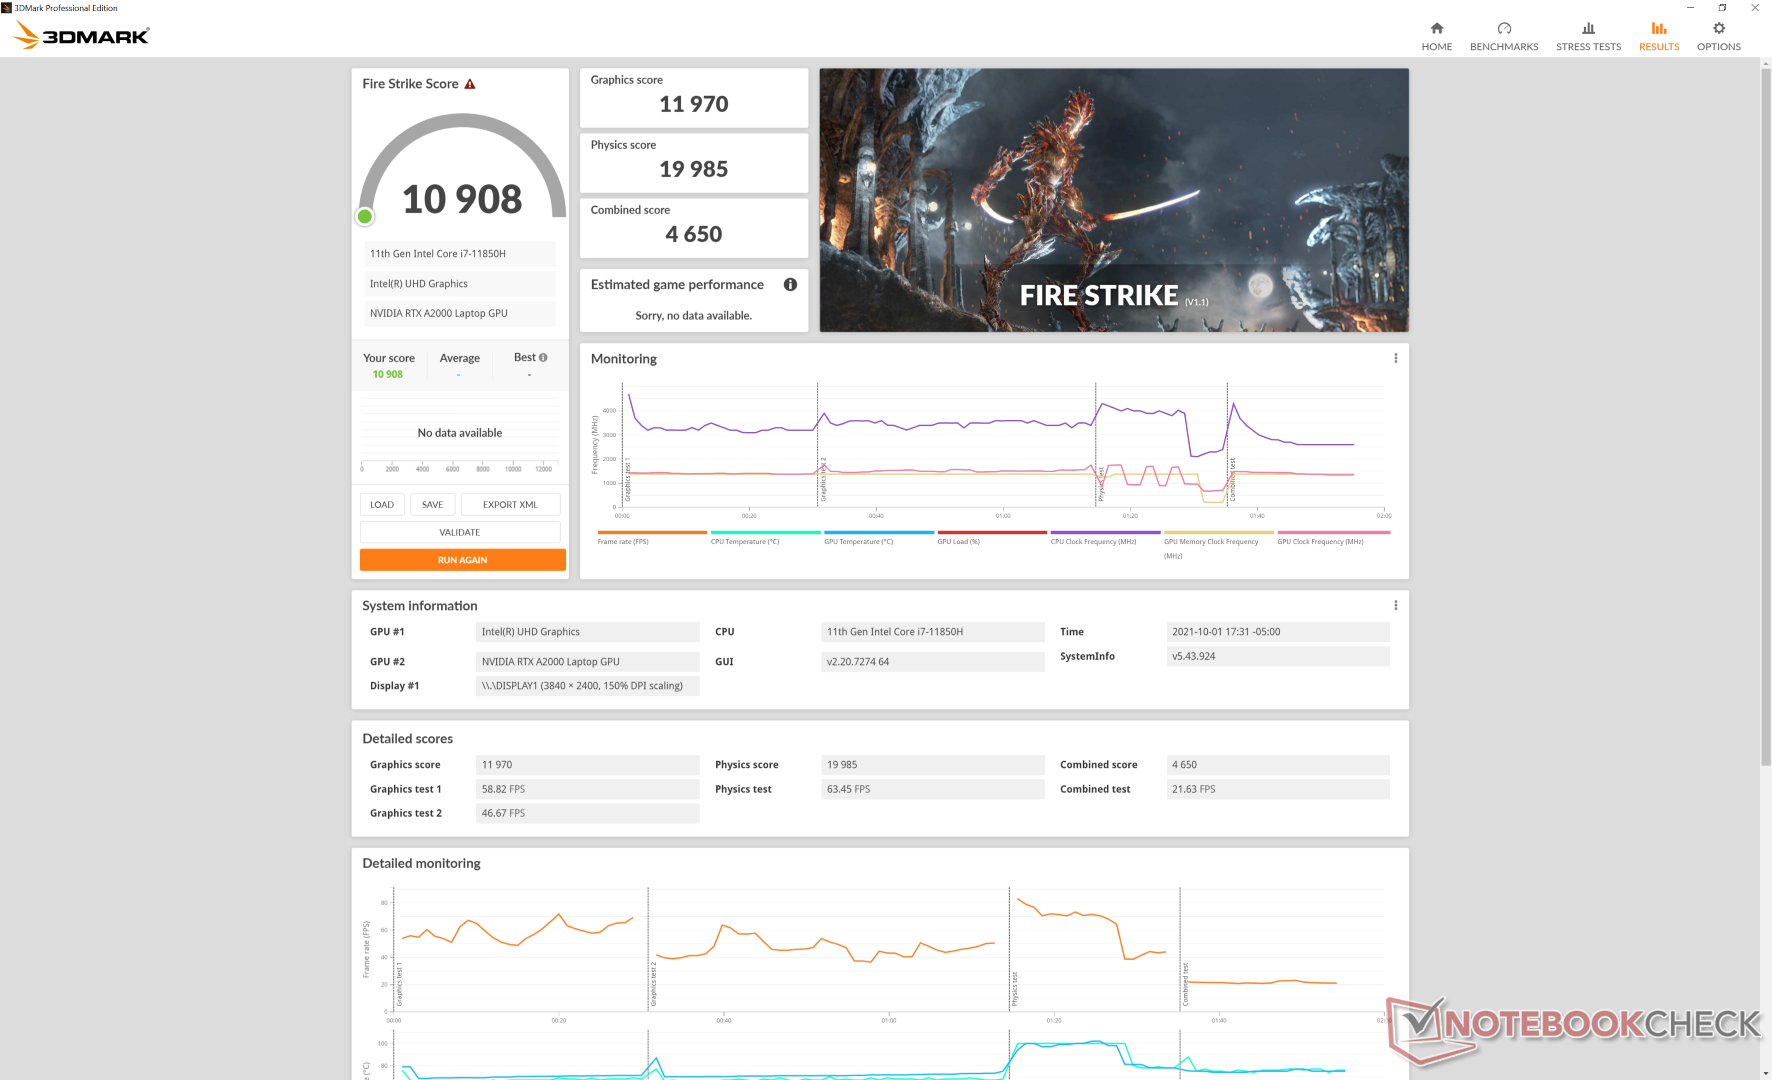
| 3DMark Fire Strike Score | 10908 Punkte | |
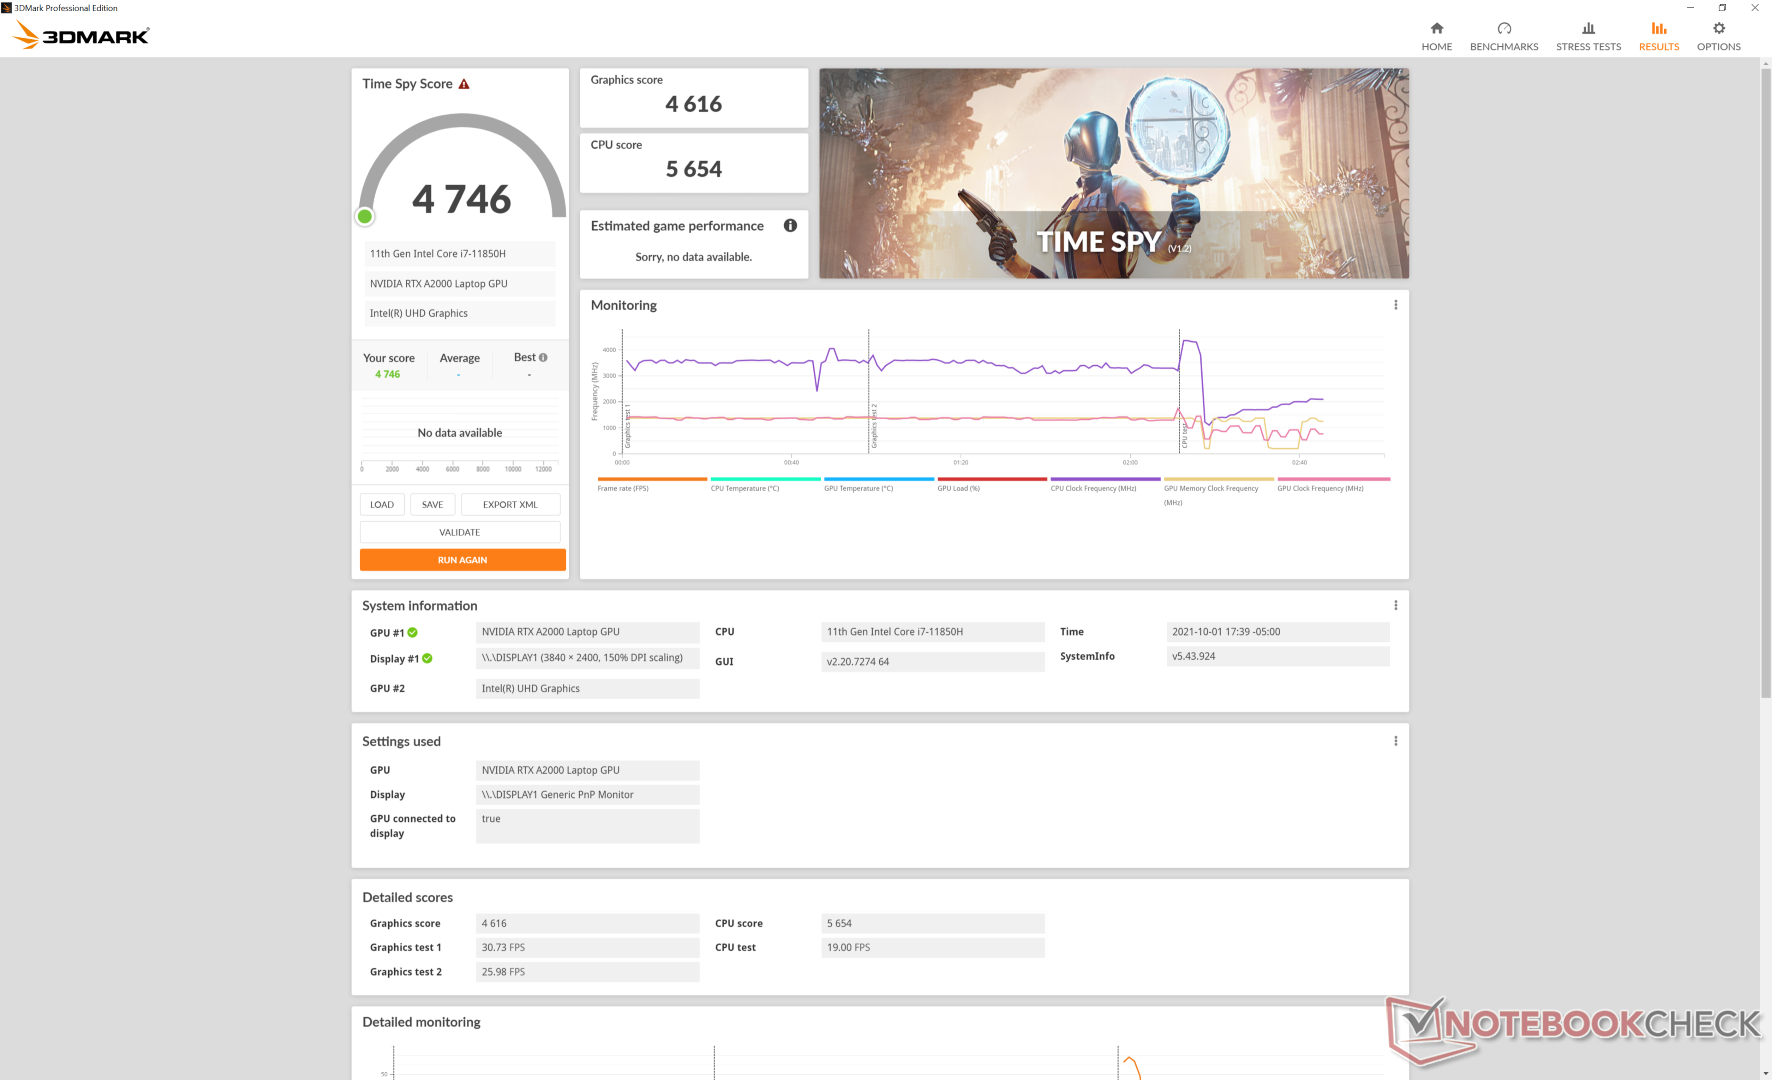
| 3DMark Time Spy Score | 4746 Punkte | |
Hilfe | ||
Witcher 3 FPS Chart
| min. | mittel | hoch | max. | QHD | 4K | |
|---|---|---|---|---|---|---|
| GTA V (2015) | 179 | 170 | 112 | 57.8 | 42.9 | |
| The Witcher 3 (2015) | 259.8 | 151.9 | 92.4 | 50 | 33.1 | |
| Dota 2 Reborn (2015) | 173 | 155 | 130 | 119 | 62.9 | |
| Final Fantasy XV Benchmark (2018) | 86.9 | 63.2 | 46.6 | 34.4 | 19.3 | |
| X-Plane 11.11 (2018) | 112 | 89.2 | 75.1 | 45.3 | ||
| Far Cry 5 (2018) | 120 | 82 | 77 | 69 | 49 | |
| Strange Brigade (2018) | 251 | 60.4 | ||||
| Shadow of the Tomb Raider (2018) | 107 | 62 | 58 | 55 | 40 | 17 |
| Far Cry New Dawn (2019) | 106 | 72 | 71 | 59 | 49 | |
| Metro Exodus (2019) | 110.4 | 55.1 | 42.3 | 34.9 | 27 | |
| Borderlands 3 (2019) | 115.5 | 60.7 | 46.2 | 36 | ||
| Gears Tactics (2020) | 104.3 | 113.7 | 77.5 | 53.4 | 37.3 | |
| Horizon Zero Dawn (2020) | 81 | 60 | 55 | 49 | 41 | |
| Watch Dogs Legion (2020) | 86 | 62 | 51 | 29 | 20 | |
| Dirt 5 (2020) | 86.3 | 68 | 54.6 | 41.9 | 34 | |
| Assassin´s Creed Valhalla (2020) | 80 | 55 | 39 | 32 | 27 | |
| Immortals Fenyx Rising (2020) | 107 | 80 | 72 | 64 | 53 | |
| Hitman 3 (2021) | 166.6 | 83.4 | 78.6 | 73.9 | 48.4 | |
| F1 2021 (2021) | 114 | 120 | 104 | 37 | 24 |
Emissionen
Geräuschemissionen
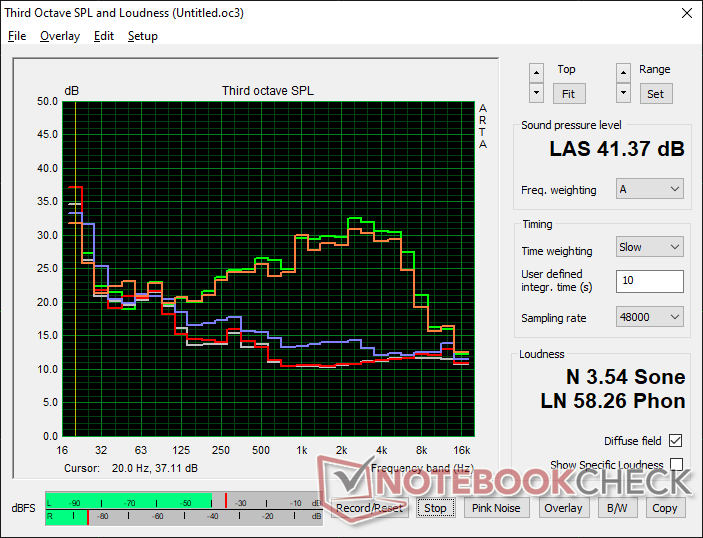
Interessanterweise ist das Lüftergeräusch deutlich leiser als beim Precision 5550. Während es beim Vorgänger bis zu 50 dB(A) erreichte, wurde beim Precision 5560 im gleichen Szenario nur ein Maximum von 41,4 dB(A) gemessen. Dieses niedrigere Lüftergeräusch ist zwar angenehm und führt dazu, dass das Gerät eines der leiseren mobilen Workstations auf dem Markt ist, allerdings nur auf Kosten der Kerntemperaturen. Im Abschnitt zum Stresstest ergibt sich zwischen den beiden Laptops unter Prime95 ein CPU-Temperaturunterschied von 16 °C.
| Dell Precision 5000 5560 RTX A2000 Laptop GPU, i7-11850H, Samsung PM9A1 MZVL22T0HBLB | Lenovo ThinkPad P15 G2-20YQ001JGE RTX A3000 Laptop GPU, i7-11800H, Kioxia XG7 KXG7AZNV512G | HP ZBook Studio 15 G8 GeForce RTX 3070 Laptop GPU, i9-11950H, Samsung PM981a MZVLB2T0HALB | Asus ProArt StudioBook Pro 15 W500G5T Quadro RTX 5000 Max-Q, i7-9750H, Samsung SSD PM981 MZVLB1T0HALR | Dell Precision 7550 Quadro RTX 5000 Max-Q, W-10885M, SK Hynix PC601A NVMe 1TB | Dell Precision 5550 P91F Quadro T2000 Max-Q, i7-10875H, SK Hynix PC601A NVMe 1TB | Razer Blade 15 Studio Edition 2020 Quadro RTX 5000 Max-Q, i7-10875H, Samsung PM981a MZVLB1T0HBLR | |
|---|---|---|---|---|---|---|---|
| Geräuschentwicklung | -25% | -18% | -26% | -27% | -17% | -28% | |
| aus / Umgebung * (dB) | 23.4 | 24.3 -4% | 23.5 -0% | 25.2 -8% | 25.8 -10% | 26.2 -12% | 30.1 -29% |
| Idle min * (dB) | 23.6 | 24.3 -3% | 25.3 -7% | 27.9 -18% | 25.8 -9% | 26.2 -11% | 30.1 -28% |
| Idle avg * (dB) | 23.6 | 24.3 -3% | 25.3 -7% | 27.9 -18% | 25.8 -9% | 26.2 -11% | 30.1 -28% |
| Idle max * (dB) | 23.6 | 28.6 -21% | 25.3 -7% | 27.9 -18% | 25.9 -10% | 26.2 -11% | 30.1 -28% |
| Last avg * (dB) | 25.8 | 47.5 -84% | 41.2 -60% | 47 -82% | 51.2 -98% | 39.2 -52% | 42.3 -64% |
| Witcher 3 ultra * (dB) | 40.1 | 49.4 -23% | 51.9 -29% | 39 3% | 48.2 -20% | ||
| Last max * (dB) | 41.4 | 54.9 -33% | 49.4 -19% | 46.9 -13% | 51.9 -25% | 50.6 -22% | 42.1 -2% |
* ... kleinere Werte sind besser
Lautstärkediagramm
| Idle |
| 23.6 / 23.6 / 23.6 dB(A) |
| Last |
| 25.8 / 41.4 dB(A) |
 | ||
30 dB leise 40 dB(A) deutlich hörbar 50 dB(A) störend |
||
min: | ||
Temperatur
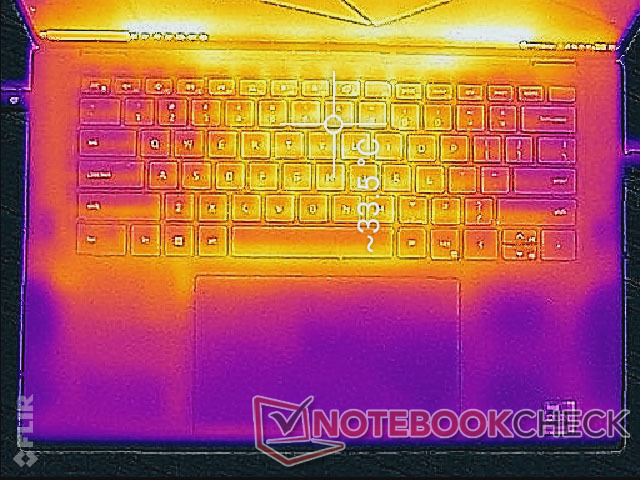
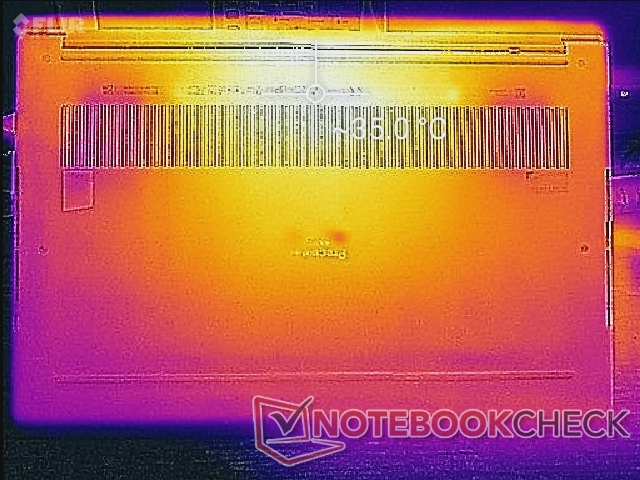
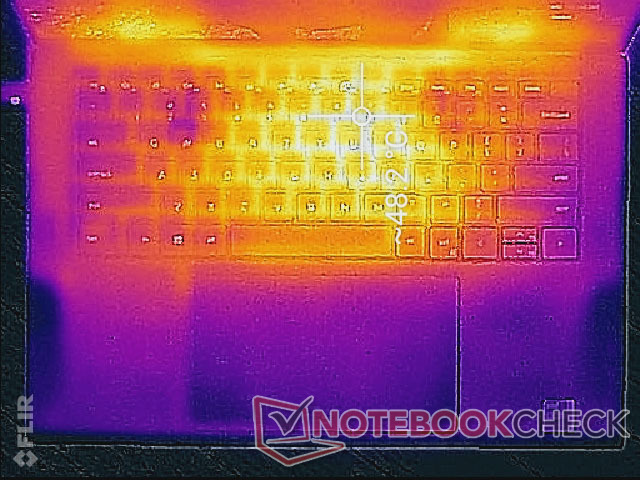
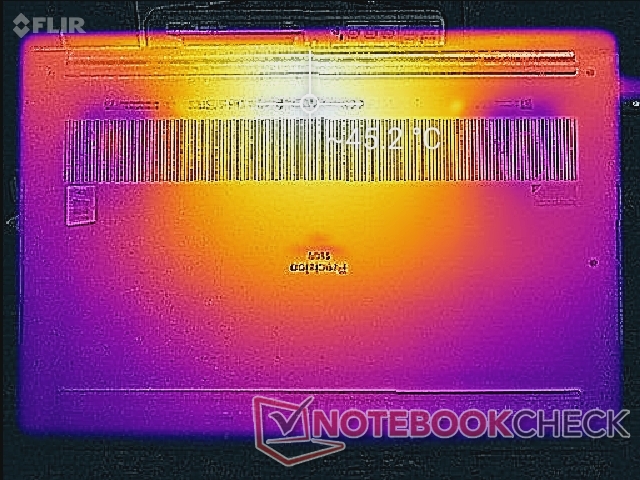
Die Oberflächentemperatur unter Last ähnelt der auf dem Precision 5550. Die Hotspots erreichen 49 °C (oben) bzw. 45 °C (unten). Die Temperatur verteilt sich aufgrund des symmetrischen Kühlsystems relativ gleichmäßig. Die Mitte der Tastatur ist deutlich wärmer als die Handballenablage und der äußere Rand. Das ThinkPad P15 Gen 2 ist eine stärkere mobile Workstation als unser Precision 5560, was allerdings auch zu deutlich wärmeren Hotspots von über 63 °C führt.
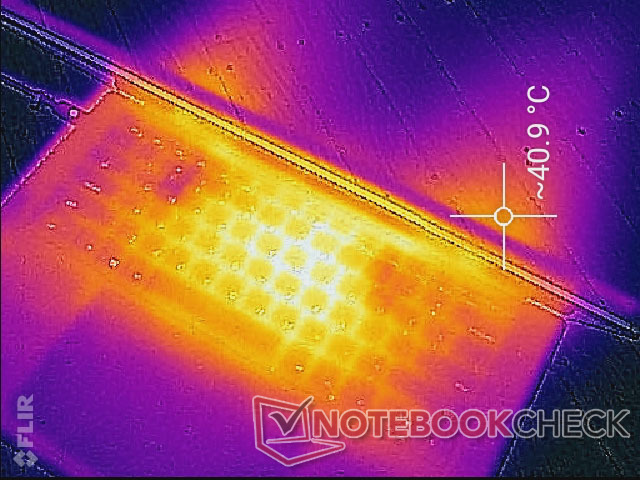
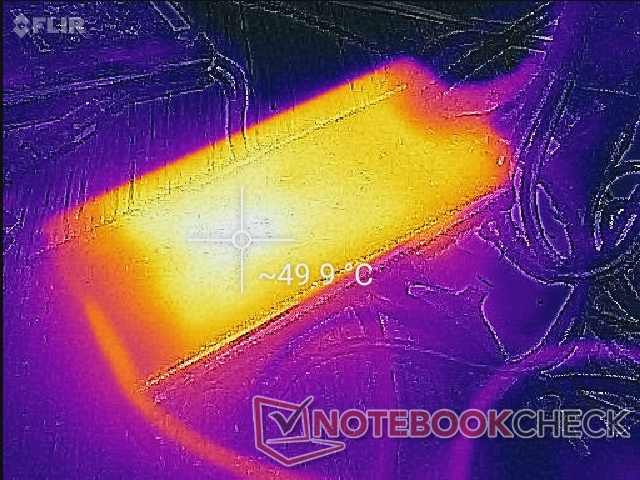
(-) Die maximale Temperatur auf der Oberseite ist 48.2 °C. Im Vergleich liegt der Klassendurchschnitt bei 38.2 °C (von 22.2 bis 69.8 °C für die Klasse Workstation).
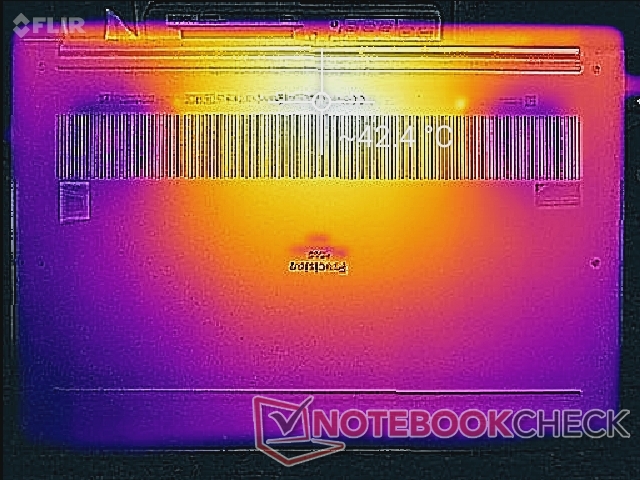
(±) Auf der Unterseite messen wir eine maximalen Wert von 42.6 °C (im Vergleich zum Durchschnitt von 41.1 °C).
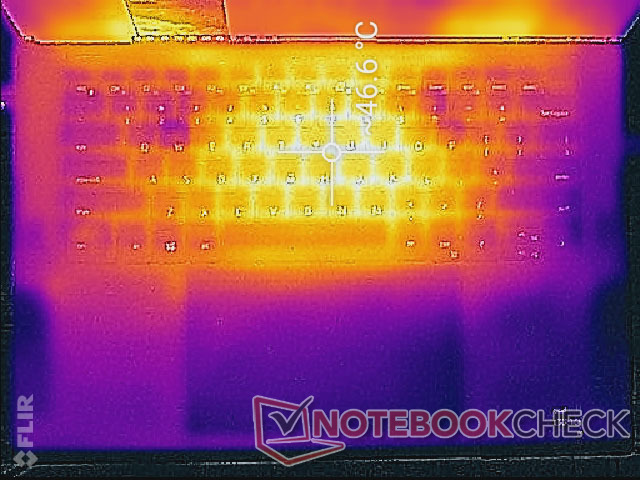
(+) Ohne Last messen wir eine durchschnittliche Temperatur von 30.6 °C auf der Oberseite. Der Klassendurchschnitt erreicht 32 °C.
(±) Beim längeren Spielen von The Witcher 3 erhitzt sich das Gerät durchschnittlich auf 35.4 °C. Der Durchschnitt der Klasse ist derzeit 32 °C.
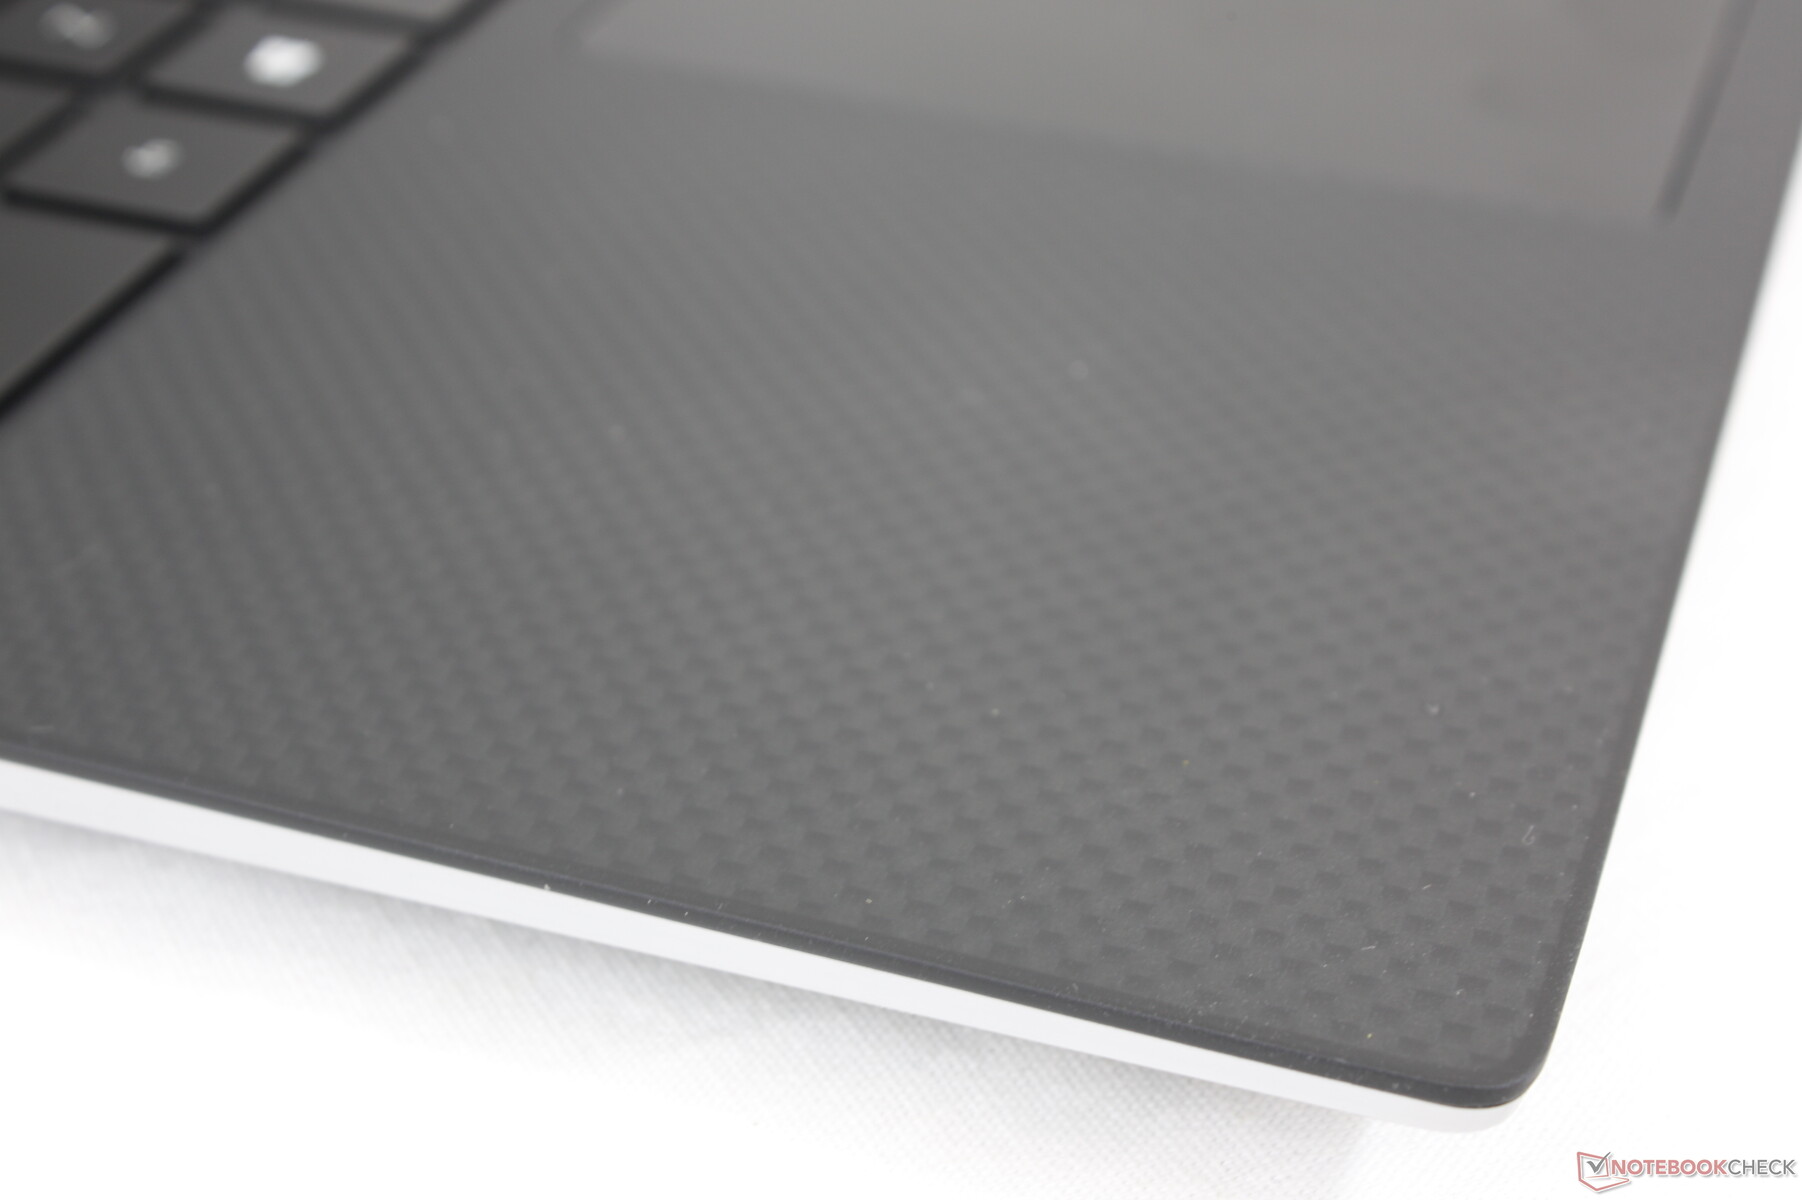
(+) Die Handballen und der Touchpad-Bereich sind mit gemessenen 30.8 °C kühler als die typische Hauttemperatur und fühlen sich dadurch kühl an.
(-) Die durchschnittliche Handballen-Temperatur anderer getesteter Geräte war 27.8 °C (-3 °C).
Stresstest
Unter Prime95 taktet die CPU zu Beginn ein paar Sekunden lang auf 3,8 GHz, bis sie eine Kerntemperatur von 100 °C erreicht. Danach fällt die Taktrate für etwa eine Minute auf 2,8 bis 3,0 GHz und später weiter auf 2,5 bis 2,8 GHz ab. Die Kerntemperatur stabilisiert sich schlussendlich bei rund 90 °C im Vergleich zu 98 °C im HP ZBook Studio 15 G8 und nur 74 °C im Precision 5550.
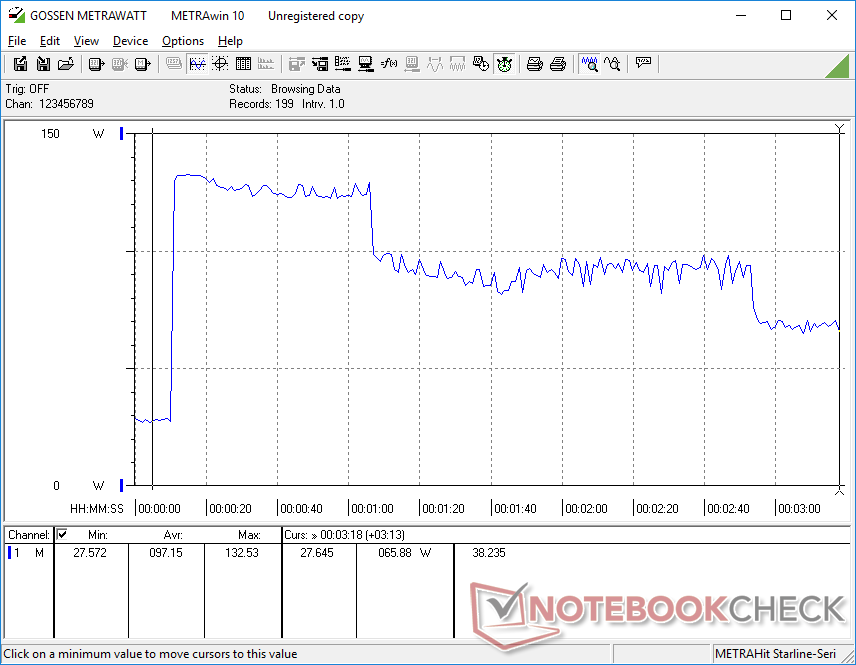
Witcher 3 wird im Stresstest eingesetzt, um das Verhalten des Geräts unter einer realistischen hohen Last zu untersuchen. Hier stabilisieren sich die CPU und GPU bei 69 °C bzw. 75 °C, während sie sich im Precision 5550 auf 66 °C bzw. 67 °C einpendeln. Die Echtzeit-Energieaufnahme der GPU ist mit 45 W stabil, beim Precision 5550 waren es noch 40 W. Das könnte auch erklären, warum die GPU-Temperatur im aktuellen Modell etwas höher ist.
Der Akkubetrieb hat einen negativen Einfluss auf die Leistung. Hie ergibt der 3DMark 11 Physics- bzw. Graphics-Ergebnisse von 14.330 bzw. 12.191 Punkten, während das Gerät im Netzbetrieb 15.788 bzw. 16.236 Punkte erreicht.
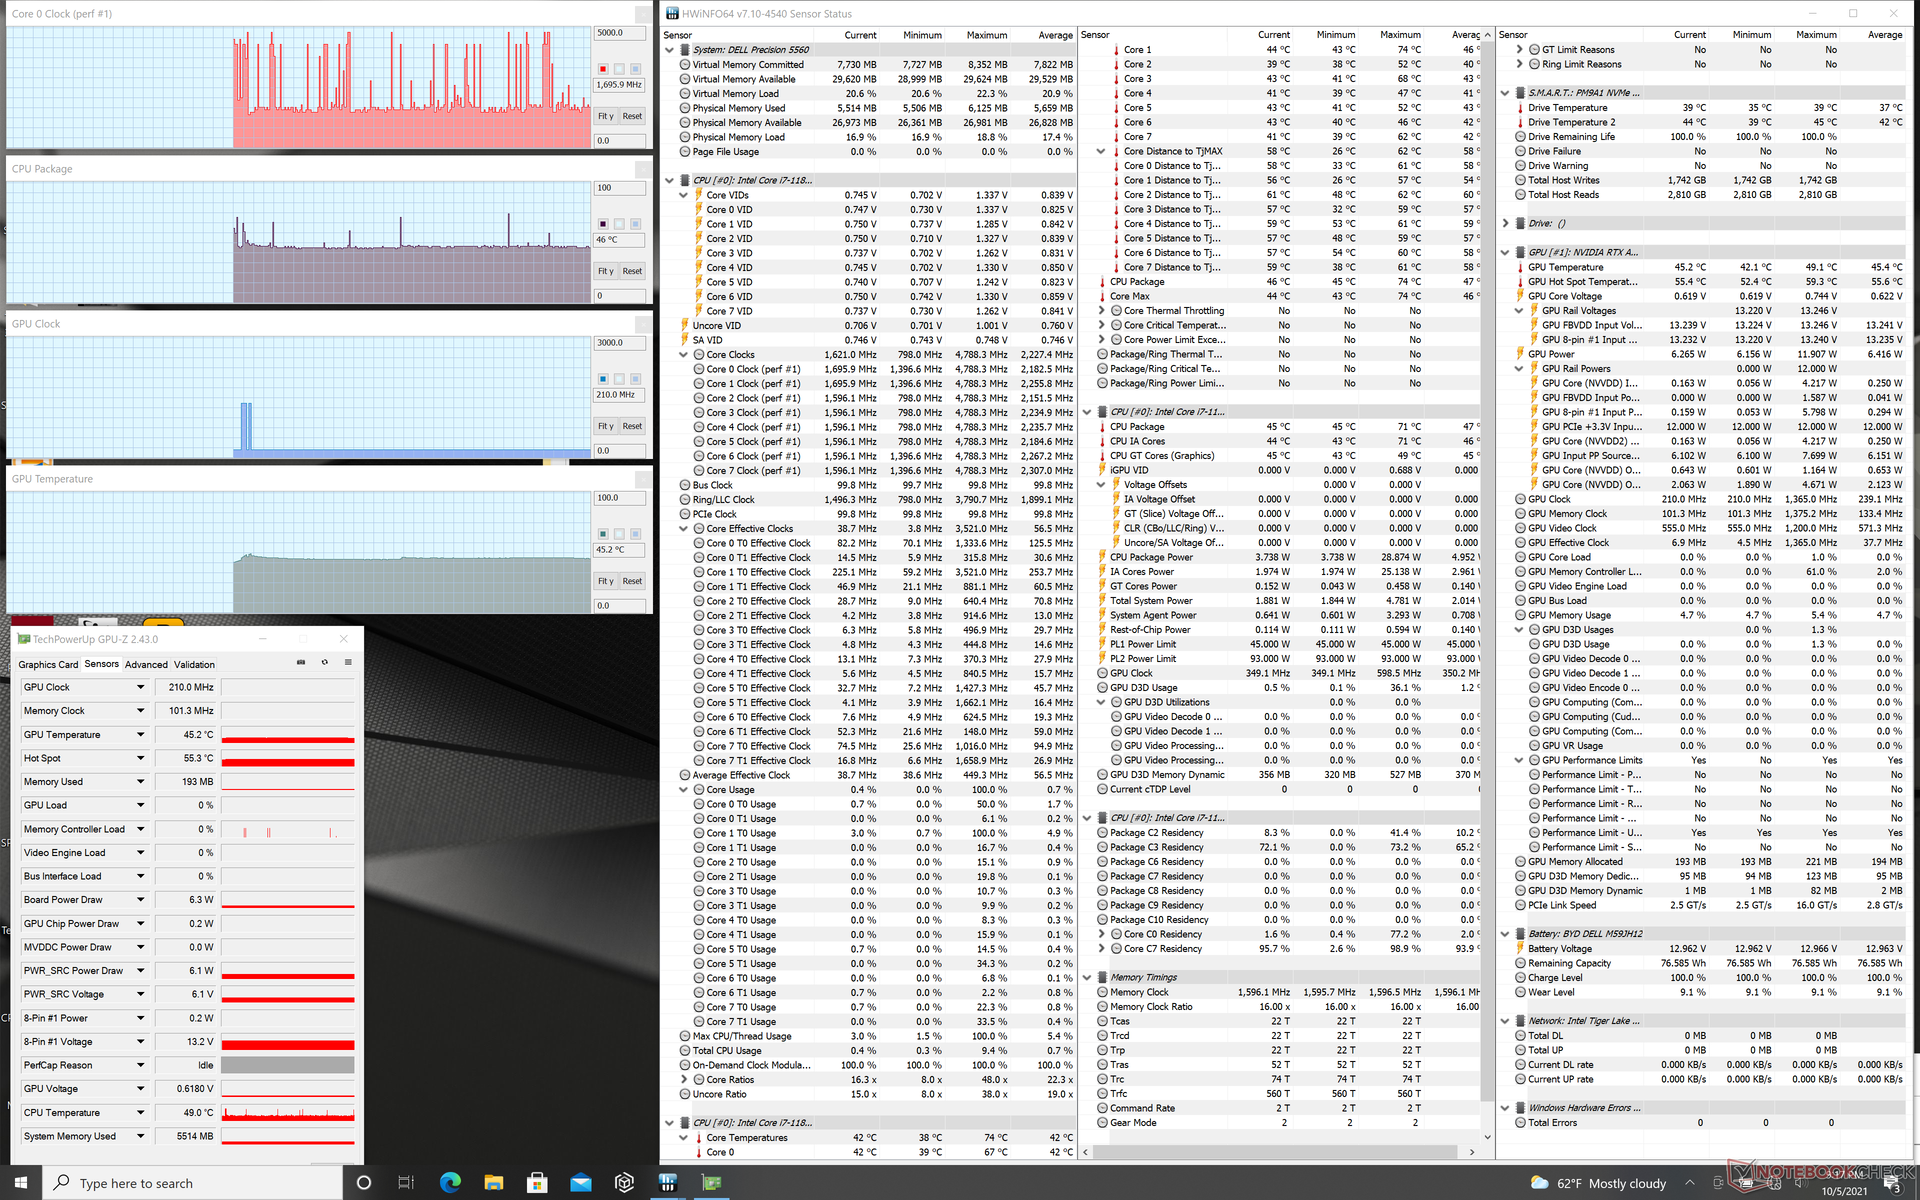
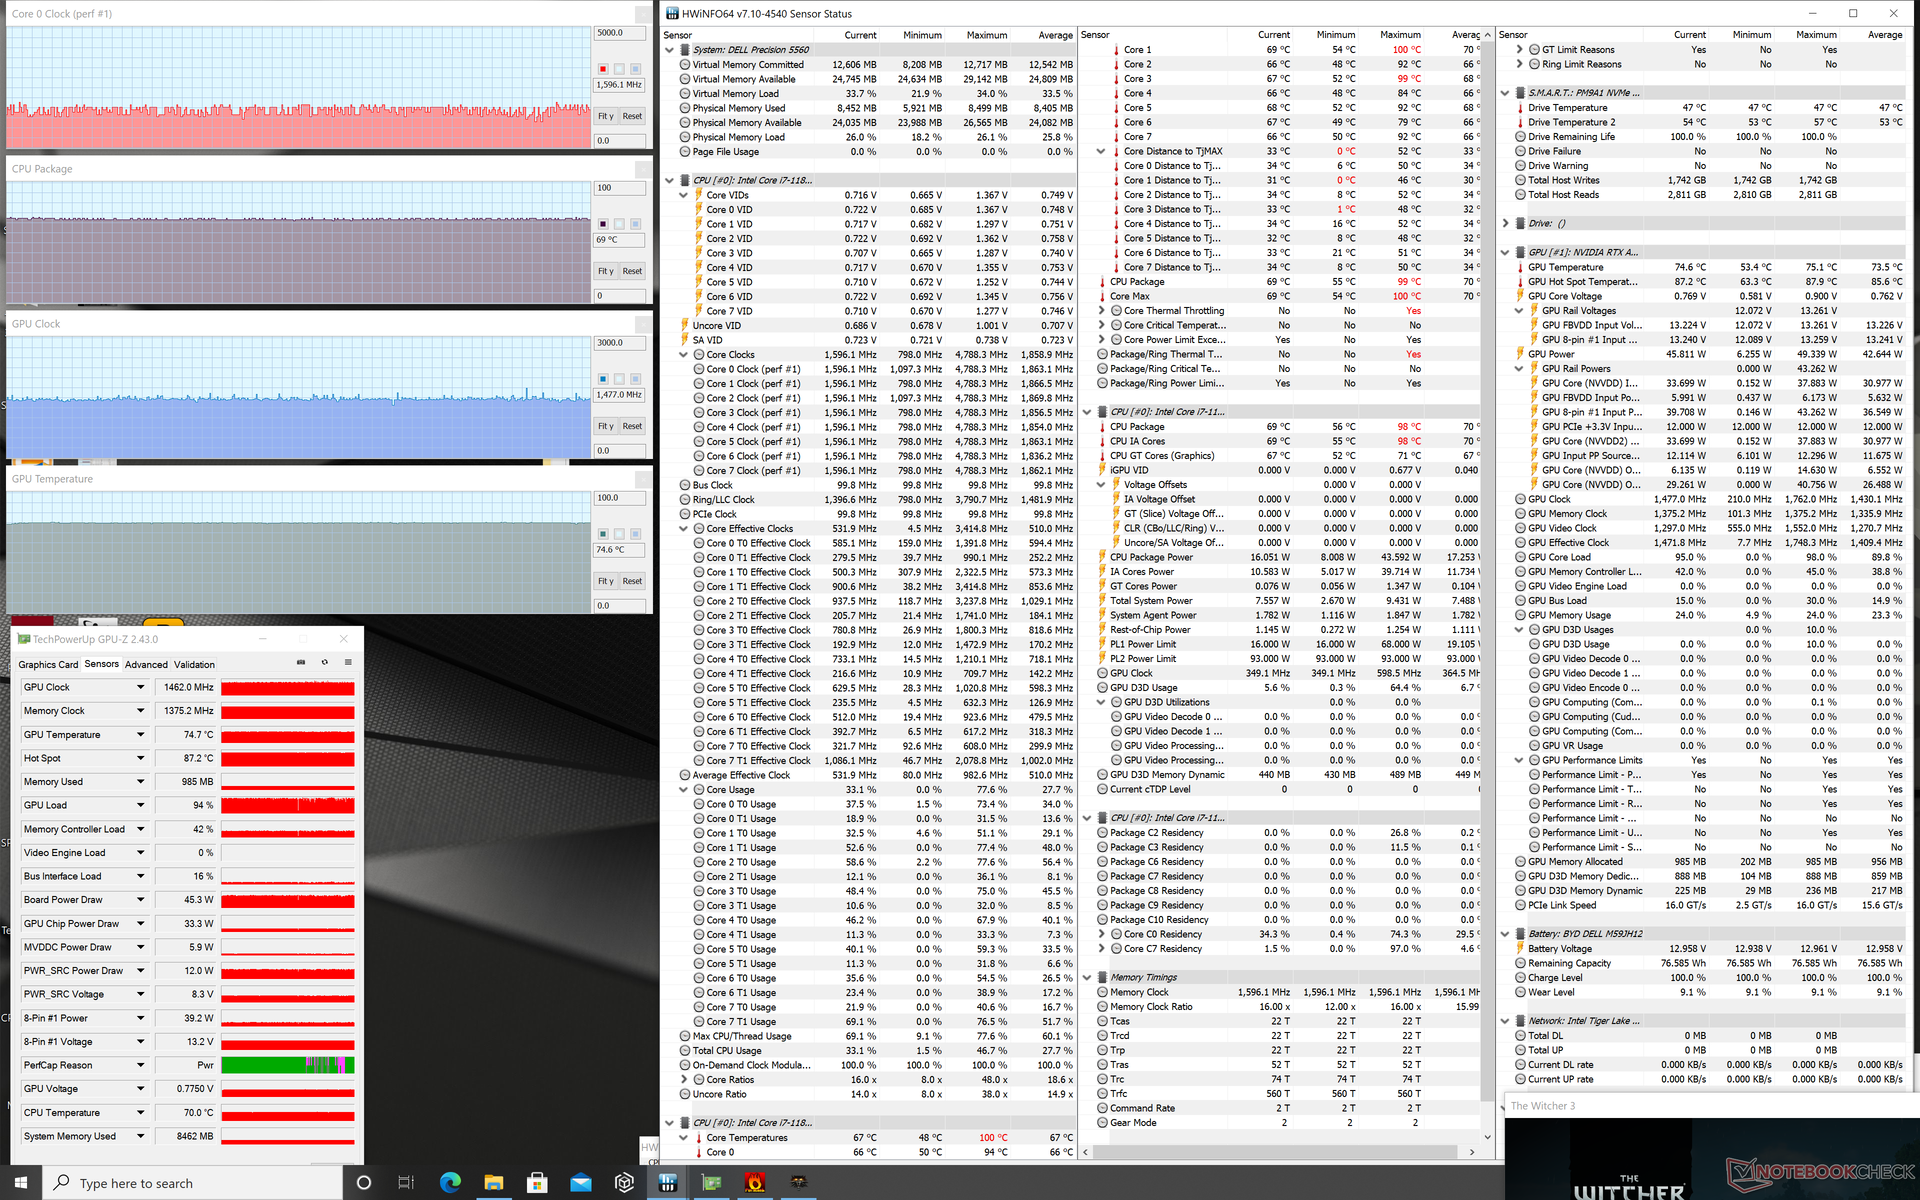
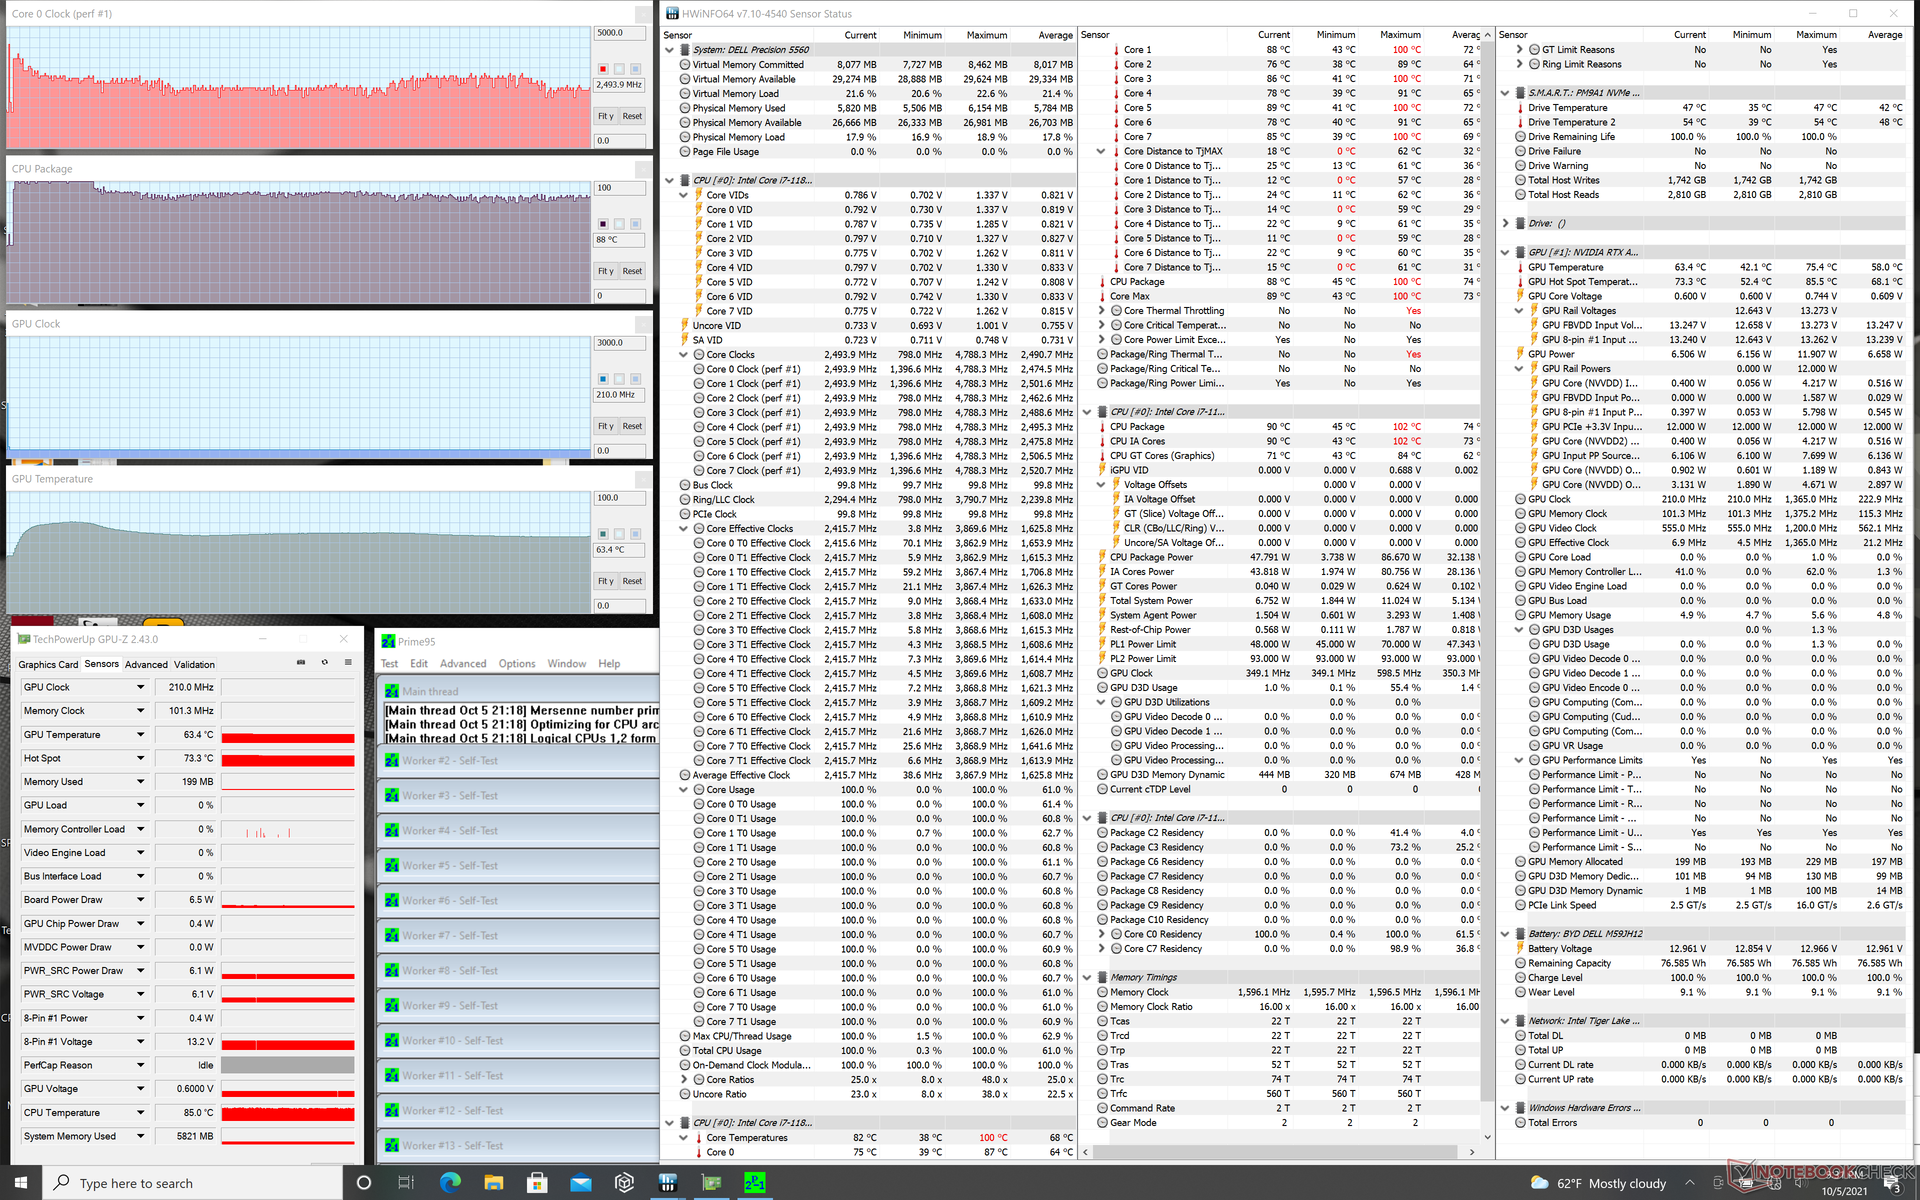
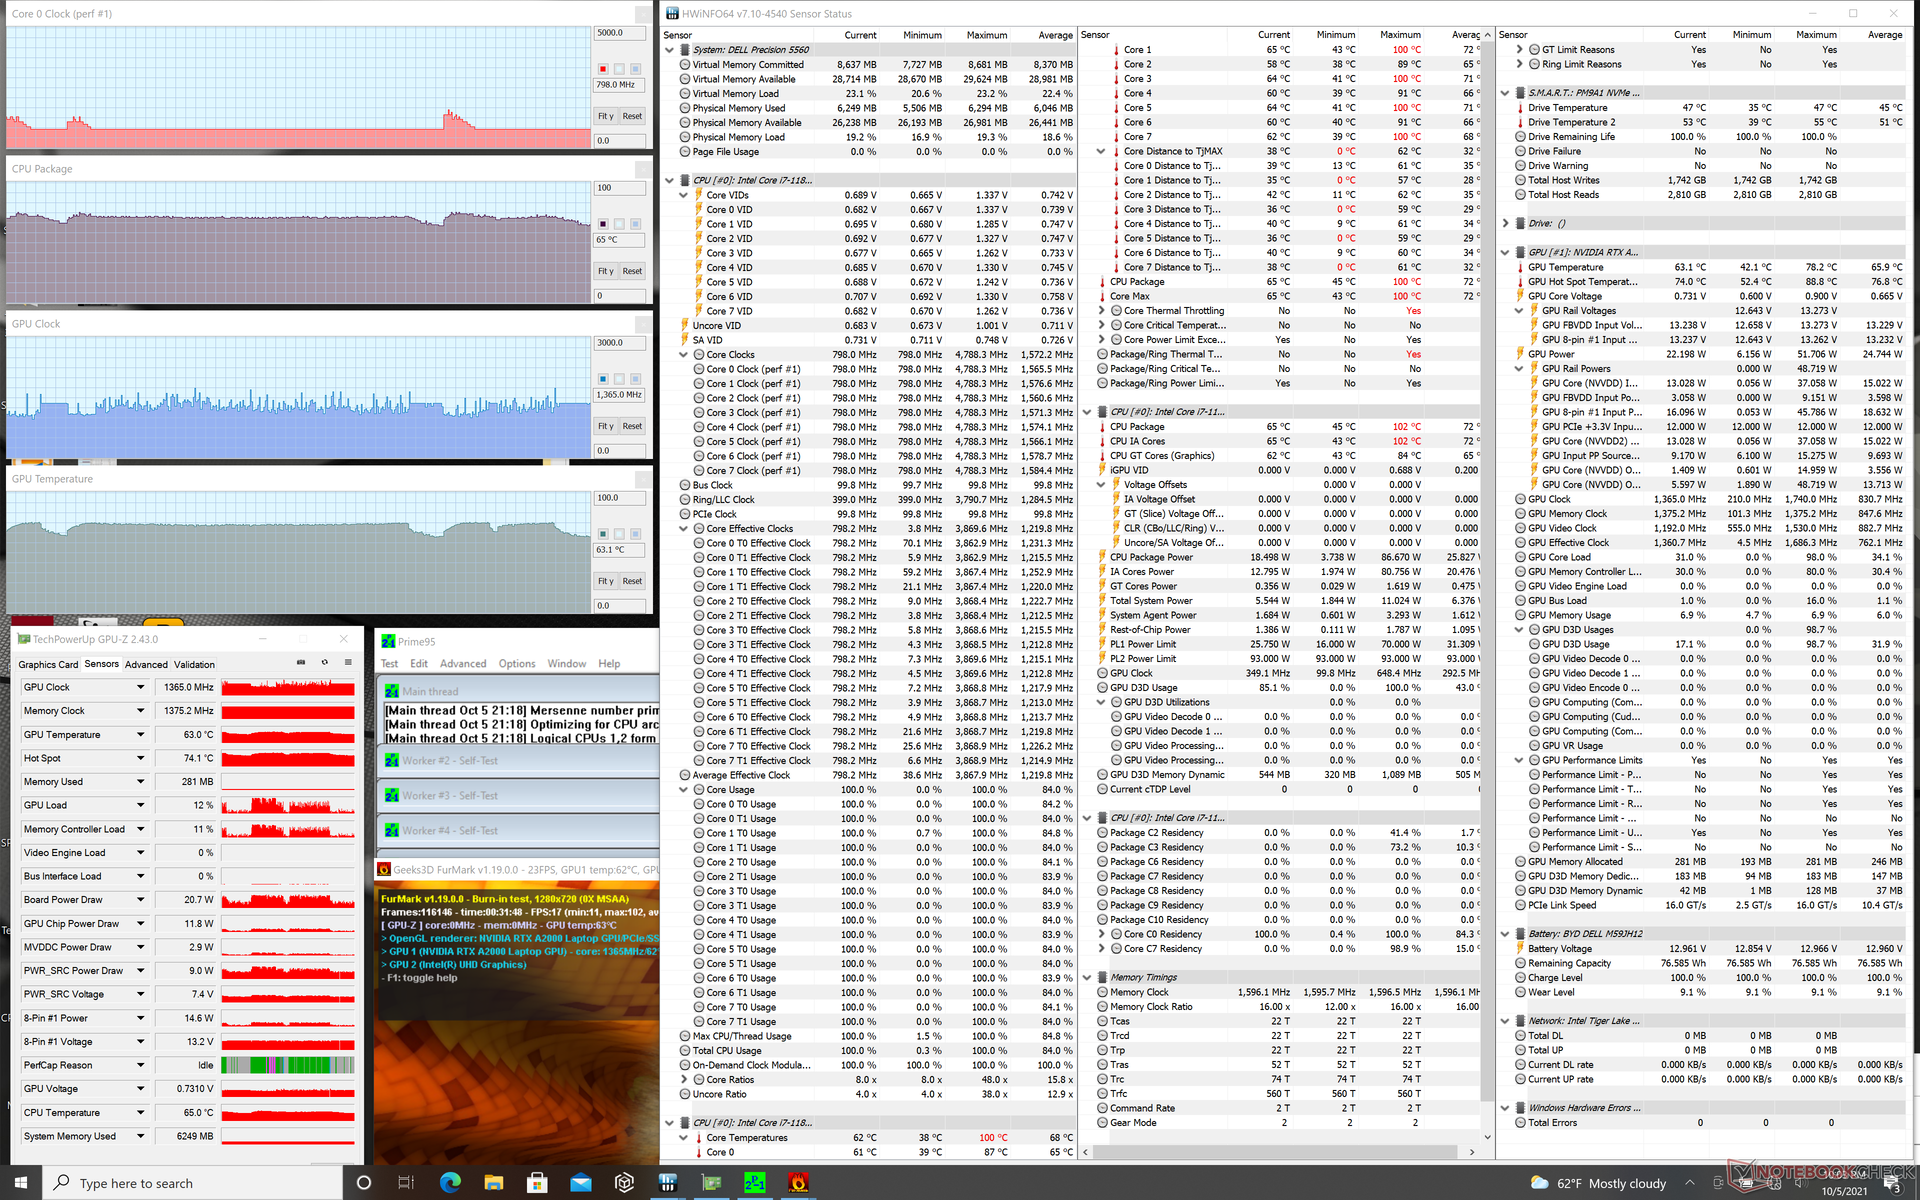
| CPU Clock (GHz) | GPU Clock (MHz) | Average CPU Temperature (°C) | Average GPU Temperature (°C) | |
| System Idle | -- | -- | 46 | 45 |
| Prime95 Stress | 2.5 - 2.8 | -- | ~90 | 63 |
| Prime95 + FurMark Stress | 0.8 - 1.4 | 1000 - 1400 | 64 - 75 | 63 - 75 |
| Witcher 3 Stress | ~1.6 | 1462 | 69 | 75 |
Lautsprecher

Dell Precision 5000 5560 Audio Analyse
(±) | Mittelmäßig laut spielende Lautsprecher (75.2 dB)
Bass 100 - 315 Hz
(±) | abgesenkter Bass - 9.8% geringer als der Median
(±) | durchschnittlich lineare Bass-Wiedergabe (8.8% Delta zum Vorgänger)
Mitteltöne 400 - 2000 Hz
(±) | zu hohe Mitten, vom Median 5.7% abweichend
(+) | lineare Mitten (3.7% Delta zum Vorgänger)
Hochtöne 2 - 16 kHz
(+) | ausgeglichene Hochtöne, vom Median nur 2.7% abweichend
(+) | sehr lineare Hochtöne (6.4% Delta zum Vorgänger)
Gesamt im hörbaren Bereich 100 - 16.000 Hz
(+) | hörbarer Bereich ist sehr linear (14.8% Abstand zum Median
Im Vergleich zu allen Geräten derselben Klasse
» 33% aller getesteten Geräte dieser Klasse waren besser, 6% vergleichbar, 61% schlechter
» Das beste Gerät hat einen Delta-Wert von 7%, durchschnittlich ist 17%, das schlechteste Gerät hat 35%
Im Vergleich zu allen Geräten im Test
» 20% aller getesteten Geräte waren besser, 4% vergleichbar, 76% schlechter
» Das beste Gerät hat einen Delta-Wert von 4%, durchschnittlich ist 24%, das schlechteste Gerät hat 134%
Apple MacBook 12 (Early 2016) 1.1 GHz Audio Analyse
(+) | Die Lautsprecher können relativ laut spielen (83.6 dB)
Bass 100 - 315 Hz
(±) | abgesenkter Bass - 11.3% geringer als der Median
(±) | durchschnittlich lineare Bass-Wiedergabe (14.2% Delta zum Vorgänger)
Mitteltöne 400 - 2000 Hz
(+) | ausgeglichene Mitten, vom Median nur 2.4% abweichend
(+) | lineare Mitten (5.5% Delta zum Vorgänger)
Hochtöne 2 - 16 kHz
(+) | ausgeglichene Hochtöne, vom Median nur 2% abweichend
(+) | sehr lineare Hochtöne (4.5% Delta zum Vorgänger)
Gesamt im hörbaren Bereich 100 - 16.000 Hz
(+) | hörbarer Bereich ist sehr linear (10.2% Abstand zum Median
Im Vergleich zu allen Geräten derselben Klasse
» 7% aller getesteten Geräte dieser Klasse waren besser, 2% vergleichbar, 91% schlechter
» Das beste Gerät hat einen Delta-Wert von 5%, durchschnittlich ist 18%, das schlechteste Gerät hat 53%
Im Vergleich zu allen Geräten im Test
» 5% aller getesteten Geräte waren besser, 1% vergleichbar, 94% schlechter
» Das beste Gerät hat einen Delta-Wert von 4%, durchschnittlich ist 24%, das schlechteste Gerät hat 134%
Energieverwaltung
Energieaufnahme
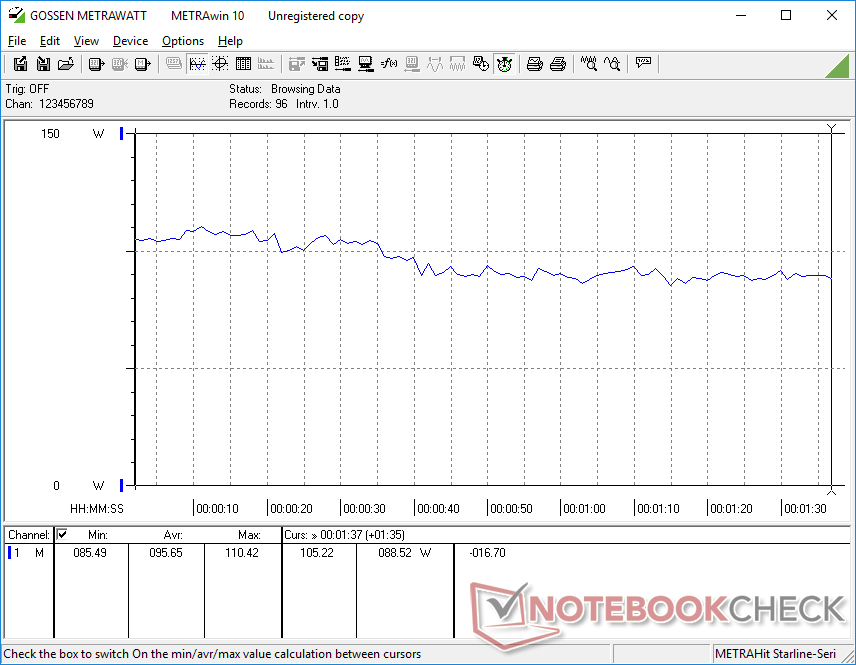
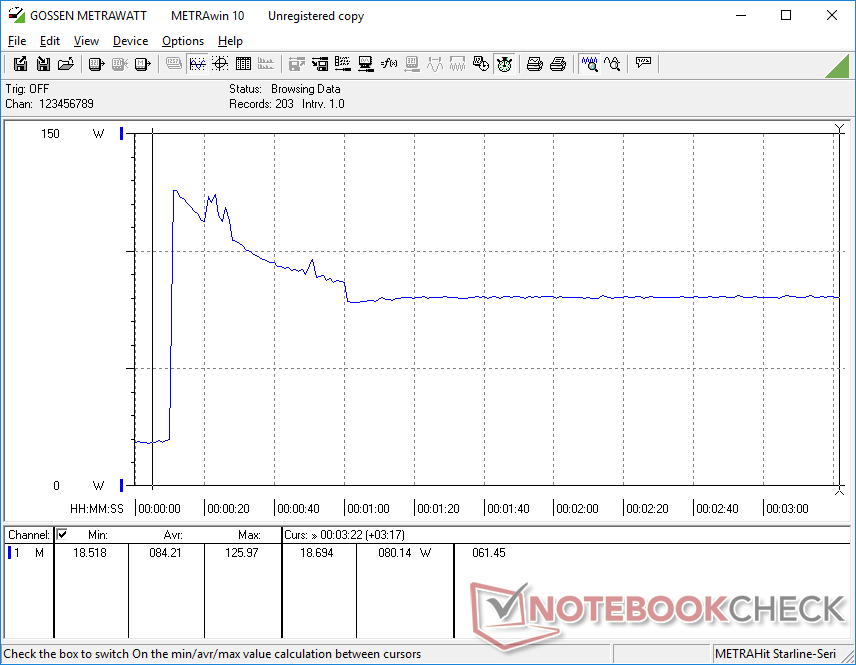
Die Energieaufnahme ist gemischt. Unter geringer Last nimmt unser Testgerät mehr Energie auf als das Precision 5550 (6 bis 24 W statt 5 bis 19 W). Das erklärt wohl die kürzere Akkulaufzeit, auf die wir im nächsten Abschnitt eingehen werden. Unter hoher Last (z. B. beim Gamen) unterscheidet sich die Energieaufnahme unseres Testmodells allerdings nicht besonders vom Precision 5550, obwohl unsere CPU bzw. GPU bis zu 15 bzw. 50 Prozent schneller ist als der Core i7-10875H und die Quadro T2000 Max-Q im Vorgänger. Das Verhältnis von Leistung zu Watt ist unter anspruchsvollen Anwendungen somit besser als im Vorjahr.
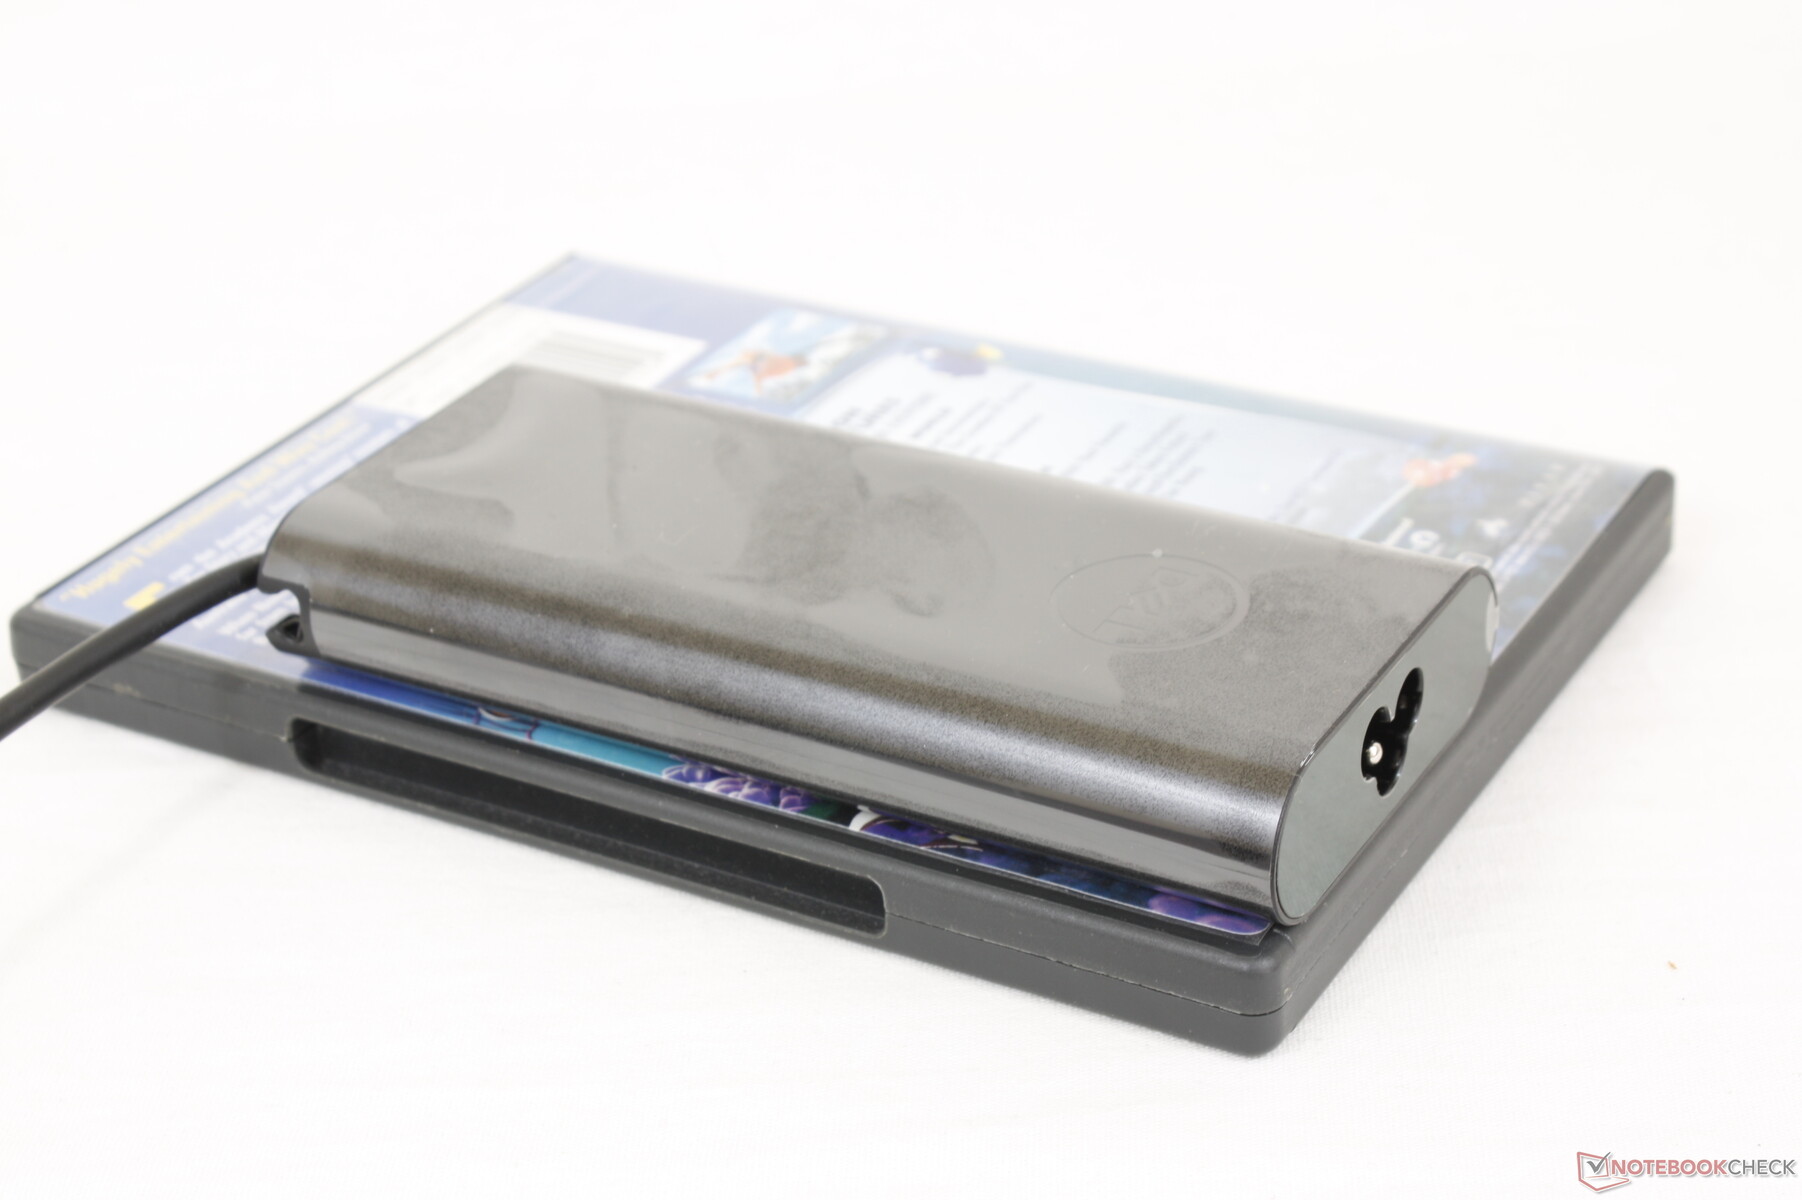
Unser Testmodell hatte kurzfristig eine maximale Energieaufnahme von 133 W. Das kleine USB-C-Netzteil (~14,3 x 6,5 x 2,2 cm) ist daher mit 130 W ausreichend. Aufgrund der Temperaturentwicklung sinkt die Energieaufnahme im Laufe der Zeit (siehe unten). Der Akku wird auch unter hoher Last im Netzbetrieb nicht entleert. Das war bei manchen früheren Precision-5750-Modellen anders.

| Aus / Standby | |
| Idle | |
| Last |
|
Legende:
min: | |
| Dell Precision 5000 5560 i7-11850H, RTX A2000 Laptop GPU, Samsung PM9A1 MZVL22T0HBLB, IPS, 3840x2400, 15.6" | Lenovo ThinkPad P15 G2-20YQ001JGE i7-11800H, RTX A3000 Laptop GPU, Kioxia XG7 KXG7AZNV512G, IPS, 1920x1080, 15.6" | HP ZBook Studio 15 G8 i9-11950H, GeForce RTX 3070 Laptop GPU, Samsung PM981a MZVLB2T0HALB, OLED, 3840x2160, 15.6" | Asus ProArt StudioBook Pro 15 W500G5T i7-9750H, Quadro RTX 5000 Max-Q, Samsung SSD PM981 MZVLB1T0HALR, IPS, 3840x2160, 15.6" | Dell Precision 7550 W-10885M, Quadro RTX 5000 Max-Q, SK Hynix PC601A NVMe 1TB, IPS, 3840x2160, 15.6" | Dell Precision 5550 P91F i7-10875H, Quadro T2000 Max-Q, SK Hynix PC601A NVMe 1TB, IPS, 3840x2400, 15.6" | Razer Blade 15 Studio Edition 2020 i7-10875H, Quadro RTX 5000 Max-Q, Samsung PM981a MZVLB1T0HBLR, OLED, 3840x2160, 15.6" | |
|---|---|---|---|---|---|---|---|
| Stromverbrauch | -11% | -43% | -30% | -38% | 7% | -44% | |
| Idle min * (Watt) | 6.2 | 6.3 -2% | 11 -77% | 11.6 -87% | 8.2 -32% | 5.6 10% | 13.4 -116% |
| Idle avg * (Watt) | 13.9 | 10.7 23% | 18.8 -35% | 19 -37% | 16.8 -21% | 11.2 19% | 18 -29% |
| Idle max * (Watt) | 23.8 | 11.6 51% | 31.7 -33% | 20.6 13% | 24.4 -3% | 18.4 23% | 26.1 -10% |
| Last avg * (Watt) | 95.7 | 99.3 -4% | 105.2 -10% | 102 -7% | 131 -37% | 114 -19% | 115 -20% |
| Witcher 3 ultra * (Watt) | 87 | 154 -77% | 148 -70% | 156.6 -80% | 76.7 12% | 145 -67% | |
| Last max * (Watt) | 132.6 | 210 -58% | 171.8 -30% | 178 -34% | 201.8 -52% | 134.2 -1% | 165 -24% |
* ... kleinere Werte sind besser
Energieaufnahme Witcher 3 / Stresstest
Akkulaufzeit
Die Laufzeit ist grundsätzlich kürzer als die des Precision 5550 aus dem Vorjahr. Bei realistischer WLAN-Nutzung hält der Akku nun nur 6,5 Stunden, während er im Vorgängermodell 9 Stunden durchmachte – obwohl beide Geräte im Energieprofil "Ausgeglichen" waren und Optimus aktiviert war.
Das vollständige Aufladen des Akkus dauert 2 Stunden. Es ist toll, dass das Gerät durch alle drei USB-C-Anschlüsse aufgeladen werden kann. Bei manchen Laptops unterstützt nur ein einziger USB-C-Port Power Delivery. Das Dell-Netzteil kann auch für das Aufladen der neuen XPS-Laptops verwendet werden.
| Dell Precision 5000 5560 i7-11850H, RTX A2000 Laptop GPU, 86 Wh | Lenovo ThinkPad P15 G2-20YQ001JGE i7-11800H, RTX A3000 Laptop GPU, 94 Wh | HP ZBook Studio 15 G8 i9-11950H, GeForce RTX 3070 Laptop GPU, 83 Wh | Asus ProArt StudioBook Pro 15 W500G5T i7-9750H, Quadro RTX 5000 Max-Q, 76 Wh | Dell Precision 7550 W-10885M, Quadro RTX 5000 Max-Q, 95 Wh | Dell Precision 5550 P91F i7-10875H, Quadro T2000 Max-Q, 86 Wh | Razer Blade 15 Studio Edition 2020 i7-10875H, Quadro RTX 5000 Max-Q, 80 Wh | |
|---|---|---|---|---|---|---|---|
| Akkulaufzeit | 15% | 2% | -25% | -3% | 36% | -9% | |
| Idle (h) | 12 | 12.9 8% | 11.1 -7% | 22.6 88% | 8.8 -27% | ||
| WLAN (h) | 6.3 | 9.9 57% | 6.2 -2% | 4.7 -25% | 8.9 41% | 9 43% | 5.7 -10% |
| Last (h) | 1.8 | 1.3 -28% | 1.8 0% | 1 -44% | 1.4 -22% | 2 11% |
Pro
Contra
Fazit — Gleiches Aussehen, deutlich schnellere Grafikleistung
Warum sollte man das Precision 5560 kaufen, wenn es aussieht wie das Precision 5550? Der Hauptgrund wäre wohl die Steigerung der GPU-Leistung. Die Quadro RTX A2000 von Nvidia, die nächste Generation nach der Quadro T2000 Max-Q, bietet eine um bis zu 50 Prozent schnellere GPU-Leistung, ohne dabei die Energieaufnahme, Akkulaufzeit, das Gewicht, die Oberflächentemperatur oder selbst das Lüftergeräusch stark negativ zu beeinflussen. Dank dem deutlich besseren Verhältnis von Leistung zu Watt haben wir hier ein System, das schneller ist, als man es von seinem ultradünnen Profil erwarten würde. Auch die CPU-Leistung wird gestärkt, wenngleich der Vorteil hier deutlich kleiner ist.
Deutliche Steigerung der GPU-Leistung gegenüber dem Precision 5550. Wenn Sie kein Interesse an der Quadro RTX A2000 haben, werden Sie möglicherweise die äußerlich idente Vorgängerversion bevorzugen.
Unser Testgerät des Precision 5560 erreicht aus unerklärlichen Gründen nicht das gleiche maximale Lüftergeräusch wie das 5550. Möglicherweise hat der Hersteller hier bewusst ein Limit gesetzt, um die Geräuschemissionen einzuschränken. Leider hat dies einen Einfluss auf die Kerntemperaturen.
Nutzer, die von der Leistungssteigerung der GPU profitieren, können das Precision 5560 guten Gewissens dem 5550 vorziehen. Ansonsten bietet das Precision 5550 was die physischen Merkmale und das Display betrifft die gleiche Benutzererfahrung. Mitstreiter wie das MSI WS66, Razer Blade 15 Studio und Lenovo ThinkPad P15 G2 sind etwas dicker, sind allerdings mit noch schnelleren GPUs ab Quadro RTX A3000 ausgestattet, die in der Precision-5000-Reihe nicht erhältlich sind.
Preis und Verfügbarkeit
Unsere Testkonfiguration mit Core i7 und Quadro RTX A2000 sowie andere Konfigurationsmodelle sind aktuell bei Notebooksbilliger und direkt auf der Herstellerwebsite Dell.com erhältlich.
Dell Precision 5000 5560
- 06.10.2021 v7 (old)
Allen Ngo
Preisvergleich

