Dell Precision 5470 im Workstation-Test: Debut der Profi-GPU Nvidia RTX A1000
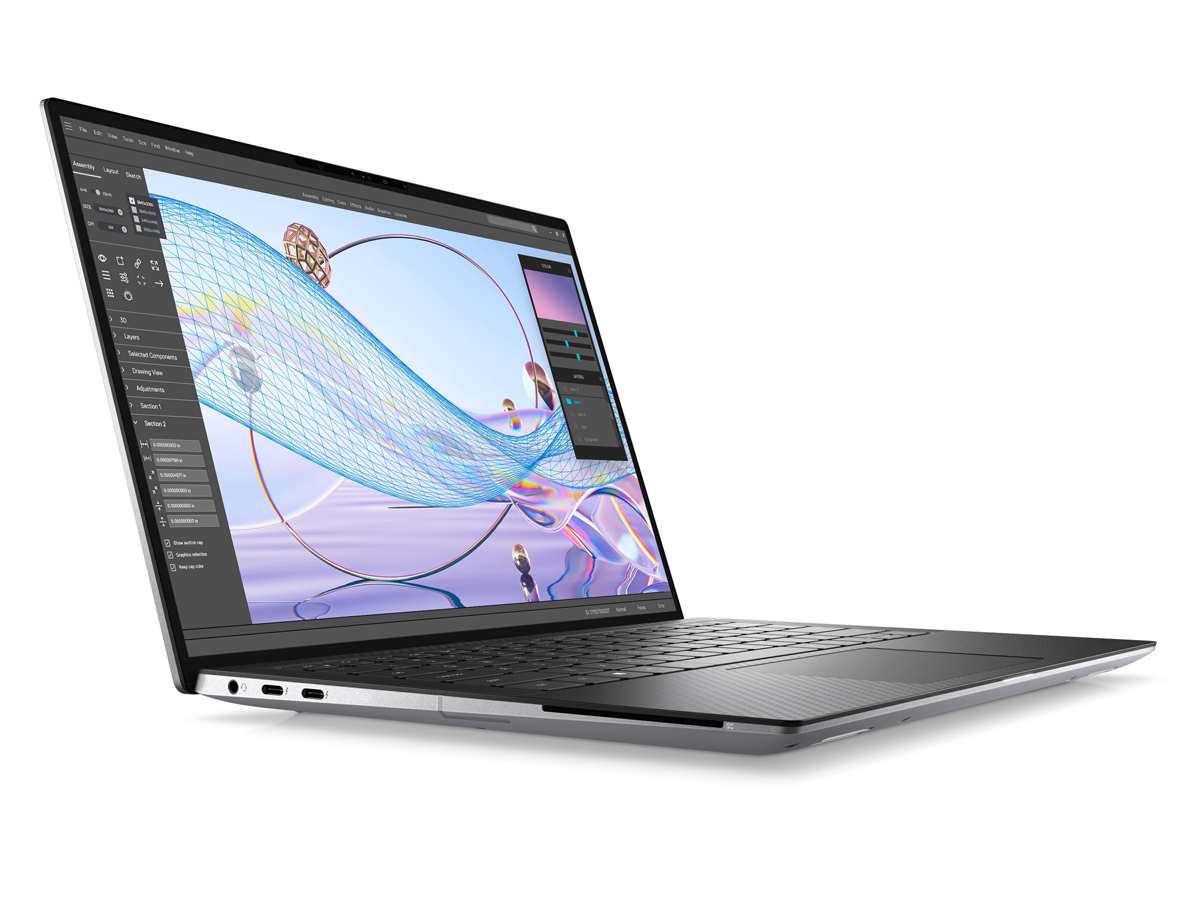
Das Precision 5470 ist Dells bislang kleinste, mobile Workstation. Ähnlich wie das vom XPS 17 inspirierte Precision 5750 und das an das XPS 15 angelehnte Precision 5560, geht das 14 Zoll kleine Precision 5470 auf das XPS 13 9300/9310 zurück, zumindest wenn man sich das Design anschaut. Wer bereits ein XPS in den Händen gehalten hat, wird schnell diverse Ähnlichkeiten zum Precision 5470 entdecken.
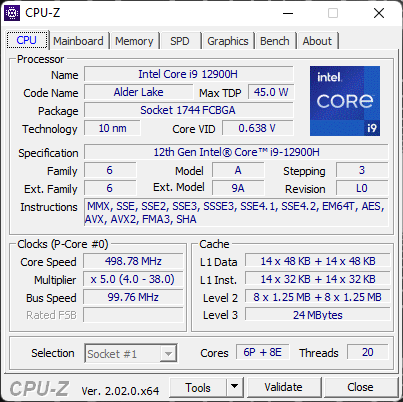
Als zwei Herausstellungsmerkmale im Precision 5470 erweisen sich einerseits die Core-H-CPU (Gen12) sowie die optionale Nvidia RTX A1000, welche zusammen für jede Menge Rechenpower in dem kleinen 14-Zoll-Gehäuse sorgen. Unsere Testkonfiguration ist mit einem Core i9-12900H, einer RTX A1000 und einem spiegelnden 1600p-Touchscreen ausgestattet und kostet etwa 3.550 Euro (übrigens "nur" $3000 USD). Andere Konfigurationen rangieren vom i5-12500H bis hin zum i7-12800H, setzen lediglich auf die integrierte Iris-Xe-Grafik oder ein mattes 1200p-Display, was den Preis jeweils senkt.
Konkurrenz findet sich in anderen mobilen High-End-Workstations mit 14 Zoll wie das HP ZBook Firefly 14 oder das Lenovo ThinkPad P14s. Generell sind starke Workstations in 14 Zoll bislang eher rar, sodass wir das Precision 5470 auch mit ein paar größeren Modellen wie dem ThinkPad P15 G2 oder Dells eigenem Precision 5560 vergleichen.
Weitere Dell-Tests:
Potentielle Konkurrenten im Vergleich
Bew. | Datum | Modell | Gewicht | Dicke | Größe | Auflösung | Preis ab |
|---|---|---|---|---|---|---|---|
| 87.6 % v7 (old) | 09 / 2022 | Dell Precision 5000 5470 i9-12900H, RTX A1000 Laptop GPU | 1.6 kg | 18.95 mm | 14.00" | 2560x1600 | |
| 86.2 % v7 (old) | 06 / 2022 | Lenovo ThinkPad P15v G2 21A9000XGE i7-11800H, T1200 Laptop GPU | 2.3 kg | 22.7 mm | 15.60" | 1920x1080 | |
| 88.3 % v7 (old) | 10 / 2021 | Dell Precision 5000 5560 i7-11850H, RTX A2000 Laptop GPU | 2 kg | 18 mm | 15.60" | 3840x2400 | |
| 85.2 % v7 (old) | 09 / 2021 | Lenovo ThinkPad P14s G2 AMD R7 PRO 5850U, Vega 8 | 1.5 kg | 17.9 mm | 14.00" | 3840x2160 | |
| 85.2 % v7 (old) | 04 / 2021 | HP ZBook Firefly 14 G8 2C9Q2EA i7-1165G7, T500 Laptop GPU | 1.4 kg | 17.9 mm | 14.00" | 1920x1080 | |
| 82.4 % v7 (old) | 01 / 2021 | HP ZBook Firefly 14 G7 i7-10610U, Quadro P520 | 1.4 kg | 17.9 mm | 14.00" | 1920x1080 |
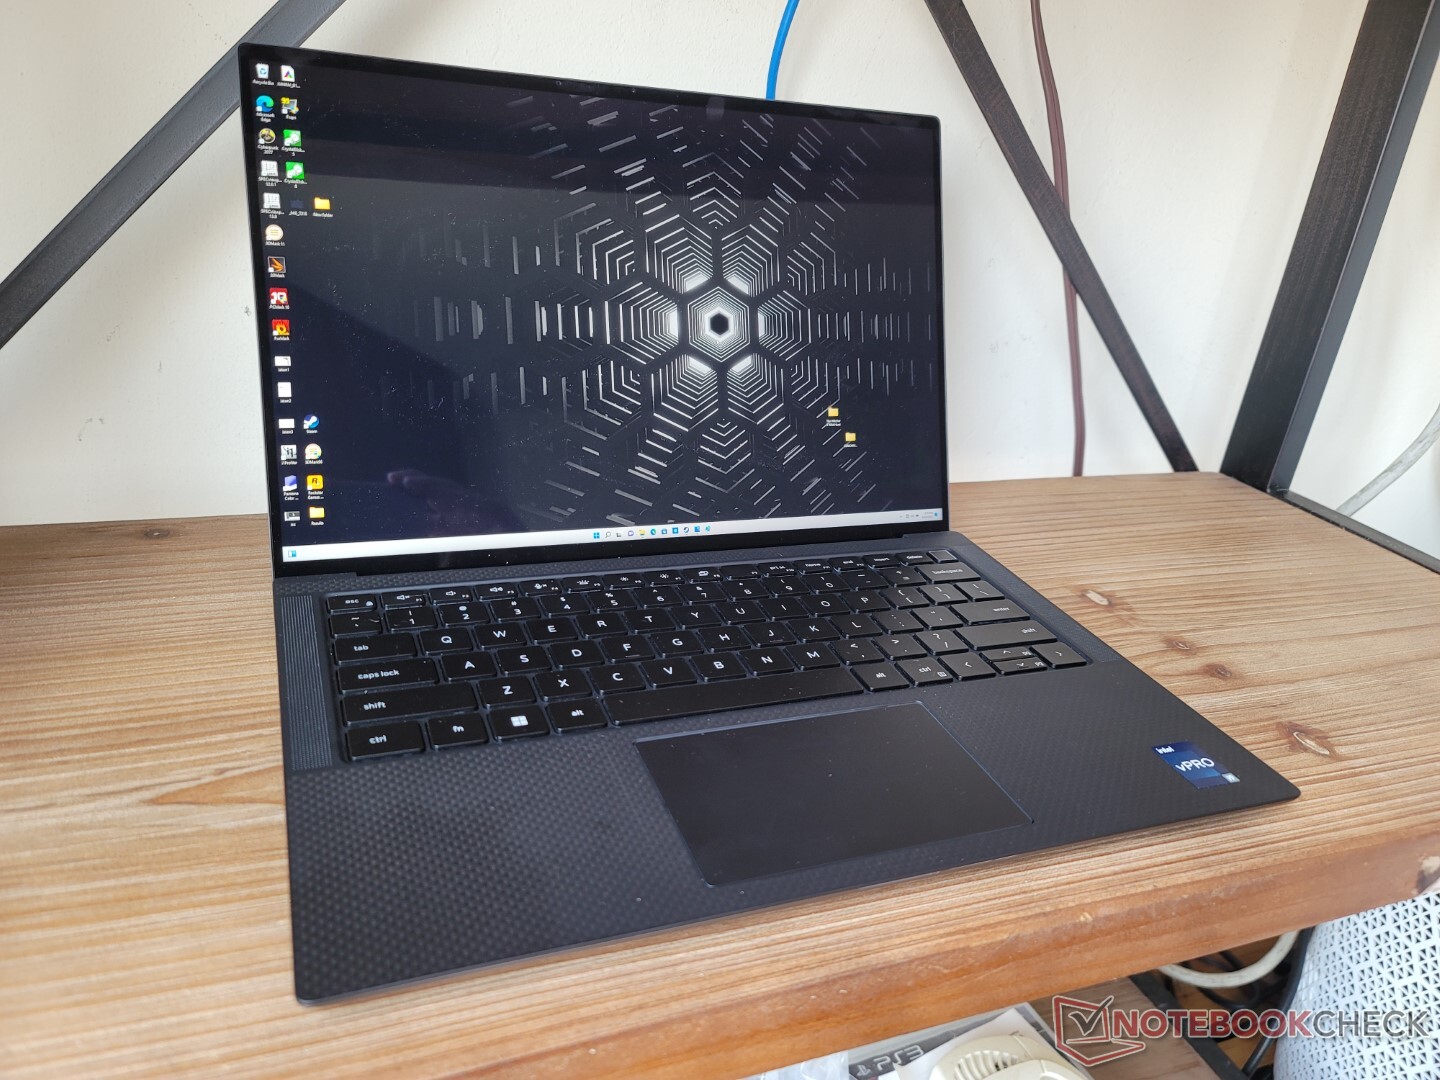
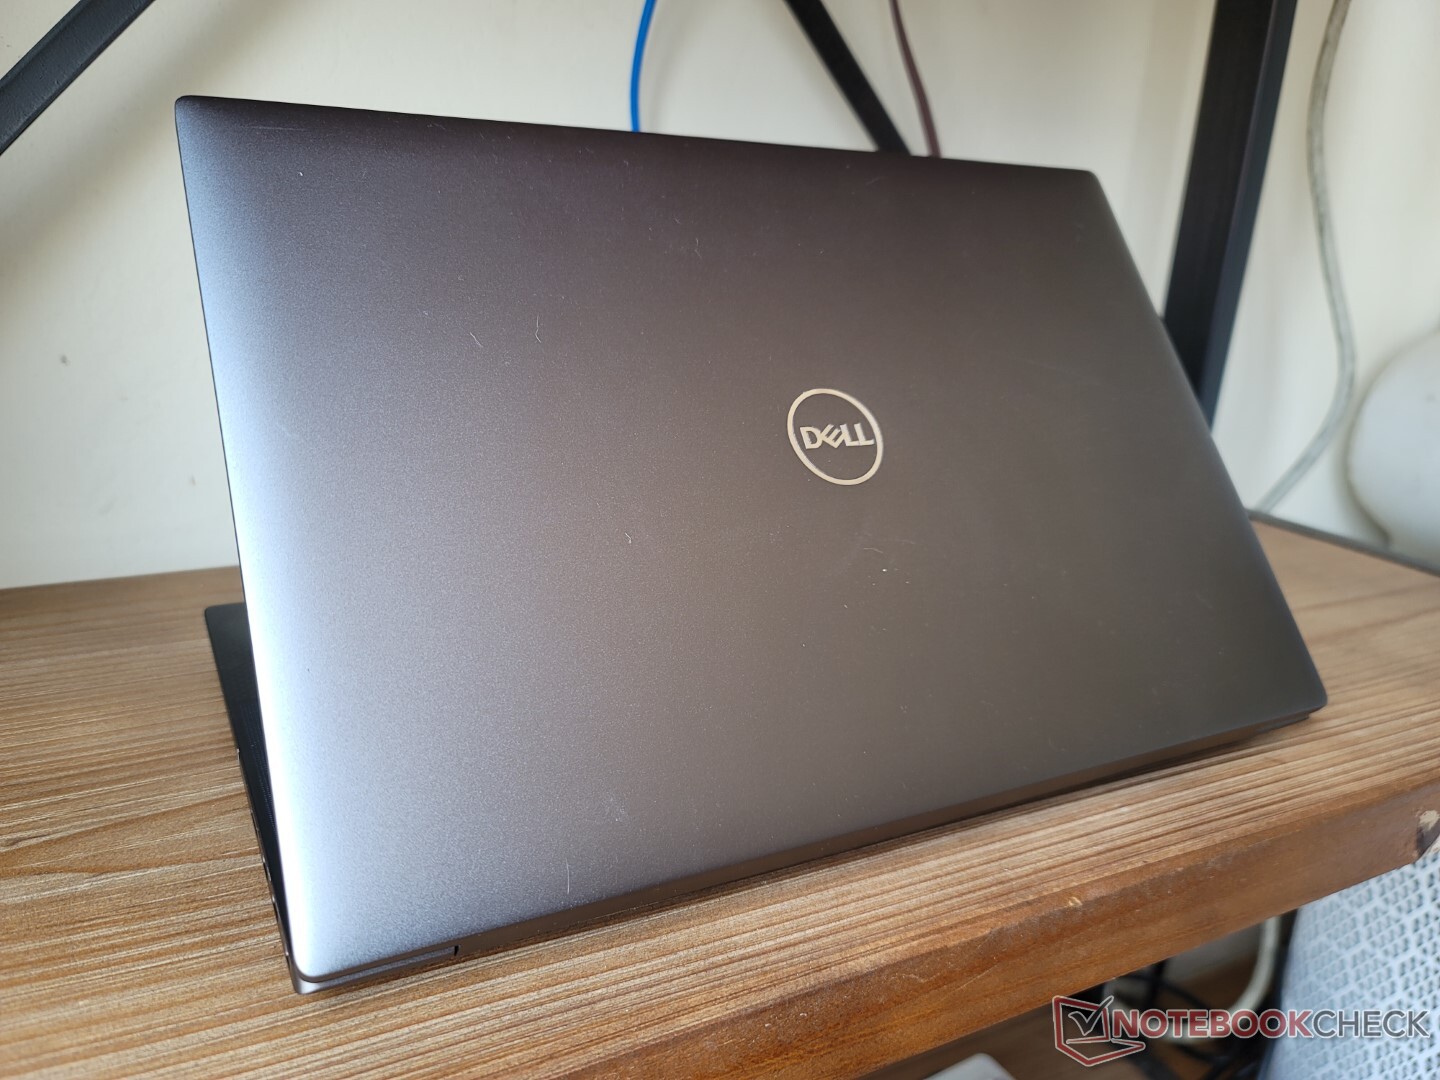
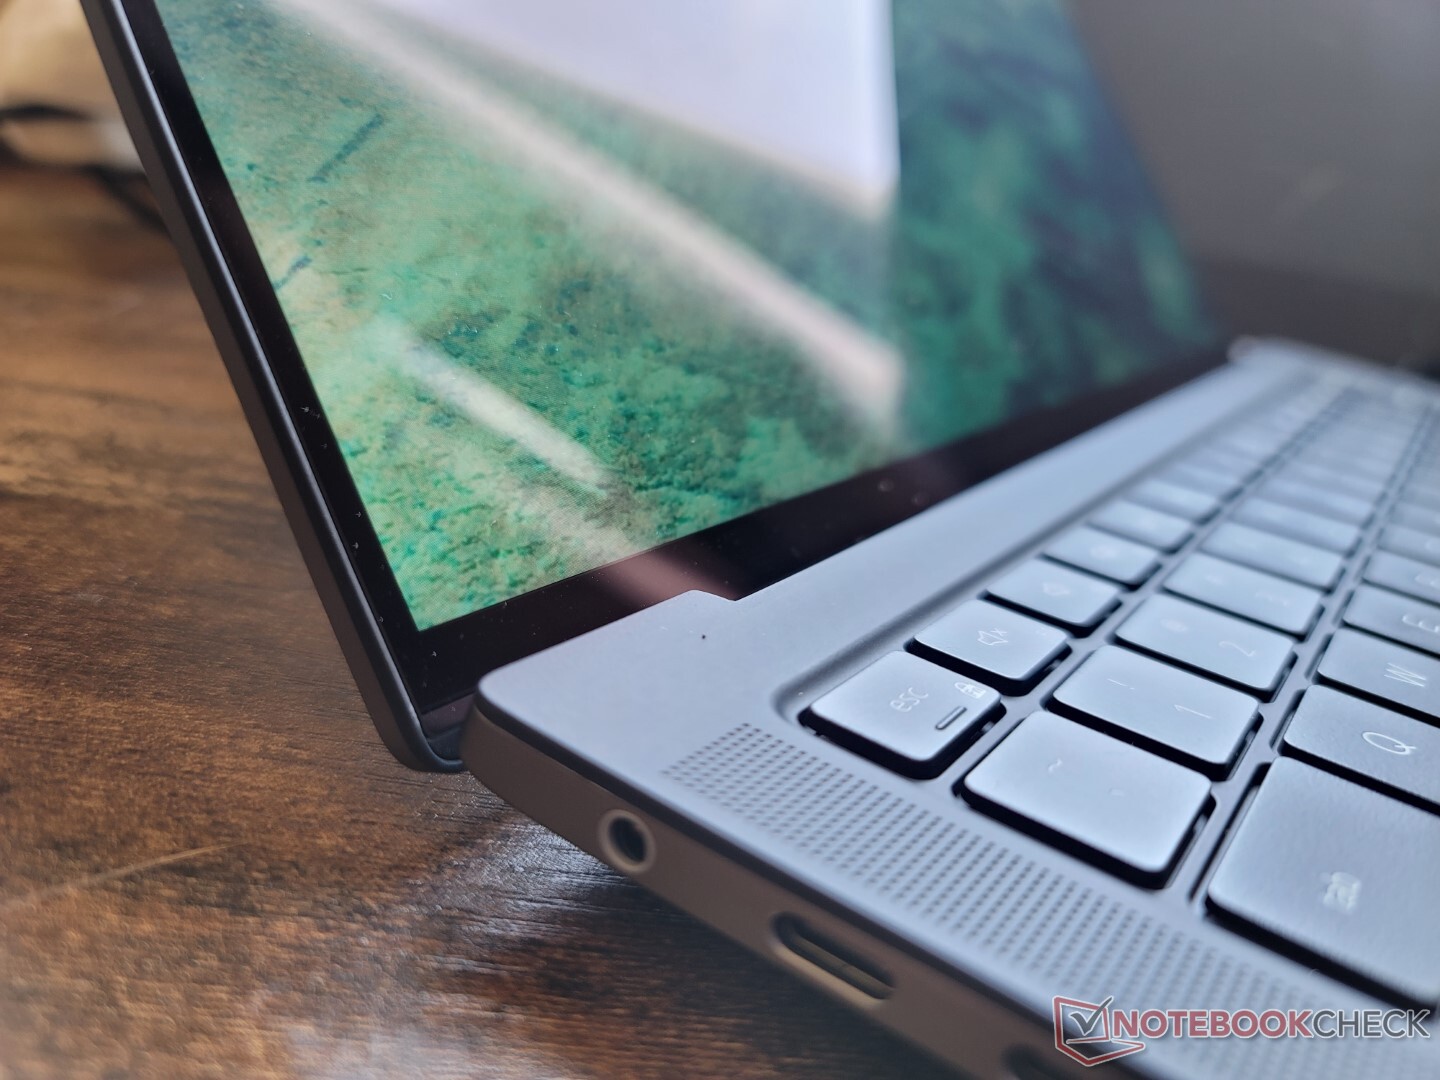
Gehäuse — Vom Gefühl und Aussehen her ein XPS
Zum Zeitpunkt dieses Tests gibt es kein XPS 14, aber das Precision 5470 kann quasi als Vorbote dessen angesehen werden. Optisch bewegt es sich zwischen einem klassischen 13-Zoll-XPS-13 und dem 15-Zoll großen XPS 15, verwendet es doch die gleiche graue Magnesiumhülle und Carbonfaseroberflächen, welche mittlerweile zum Standard in XPS-Modellen geworden sind.
Die Gehäusequalität ist ausgezeichnet, es gibt nur minimale Knarz- und Knackgeräusche bei unseren Verwindungsversuchen. Es fühlt sich definitiv stabiler und professioneller an als das neue XPS-13-9320-Design. Allerdings hätten die Scharniere noch etwas fester sein können, um eine höhere Langlebigkeit zu garantieren.
Das 14 Zoll große Precision 5470 ist spürbar größer und schwerer als das 13 Zoll kleine XPS 13 9300. Es ist sogar etwas dicker als das XPS 15, während sich auch das Gewicht eher hin zum XPS 15 orientiert anstatt zum XPS 13. Für eine Workstation ist der Laptop aber dennoch sehr kompakt, insbesondere was die Abmessungen betrifft, hier haben ein HP Firefly 14 G8 oder ein ThinkPad P14s klar das Nachsehen und sind größer.
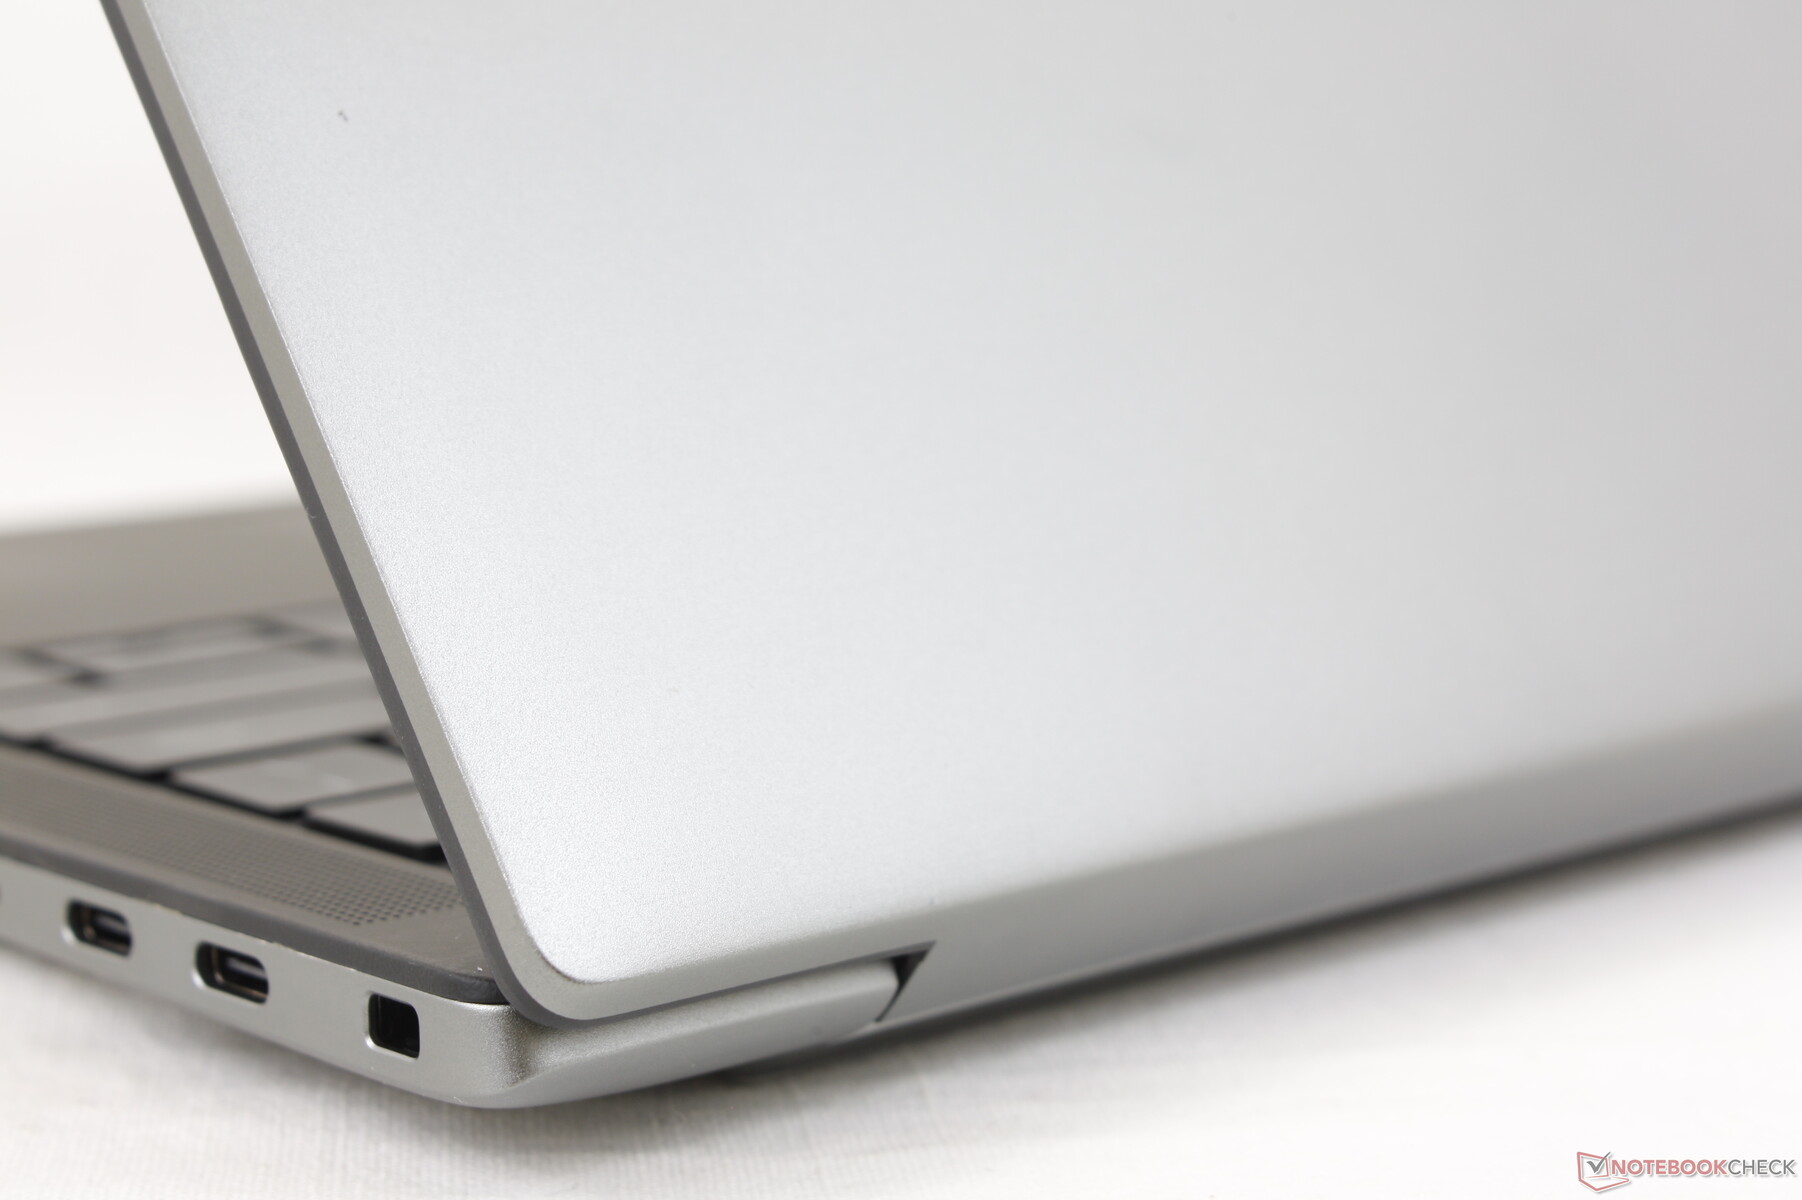
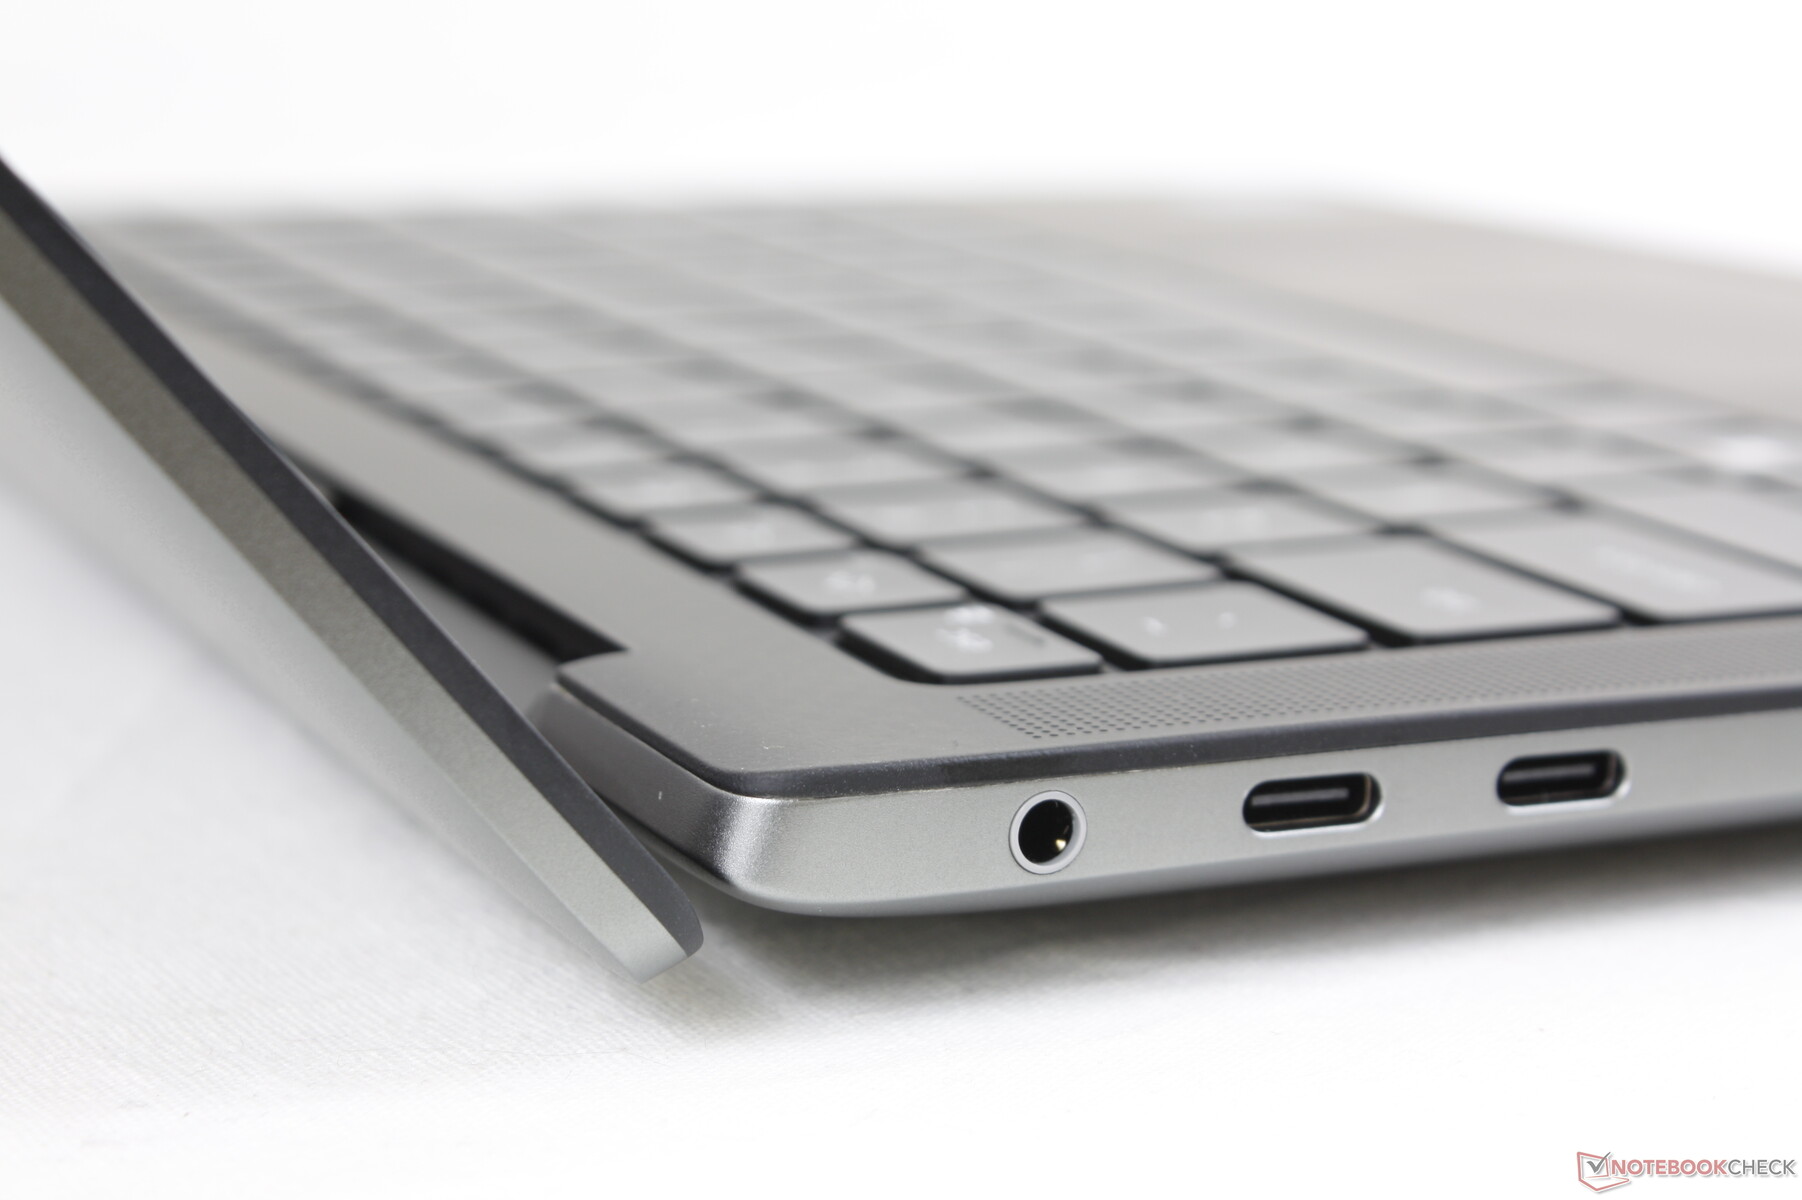
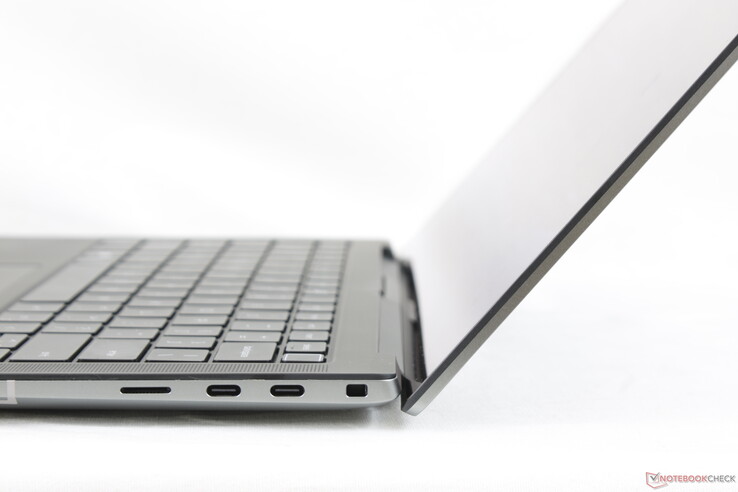
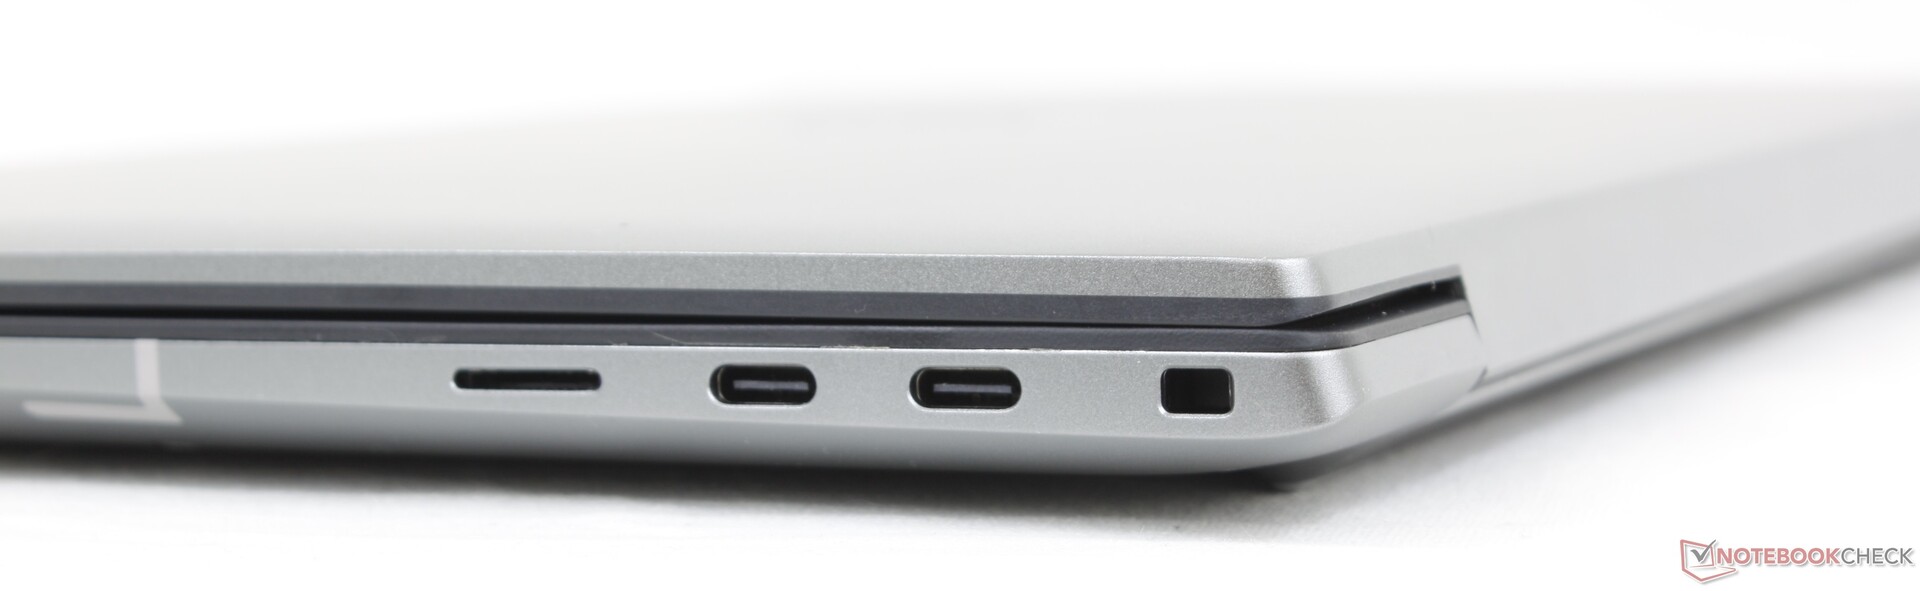
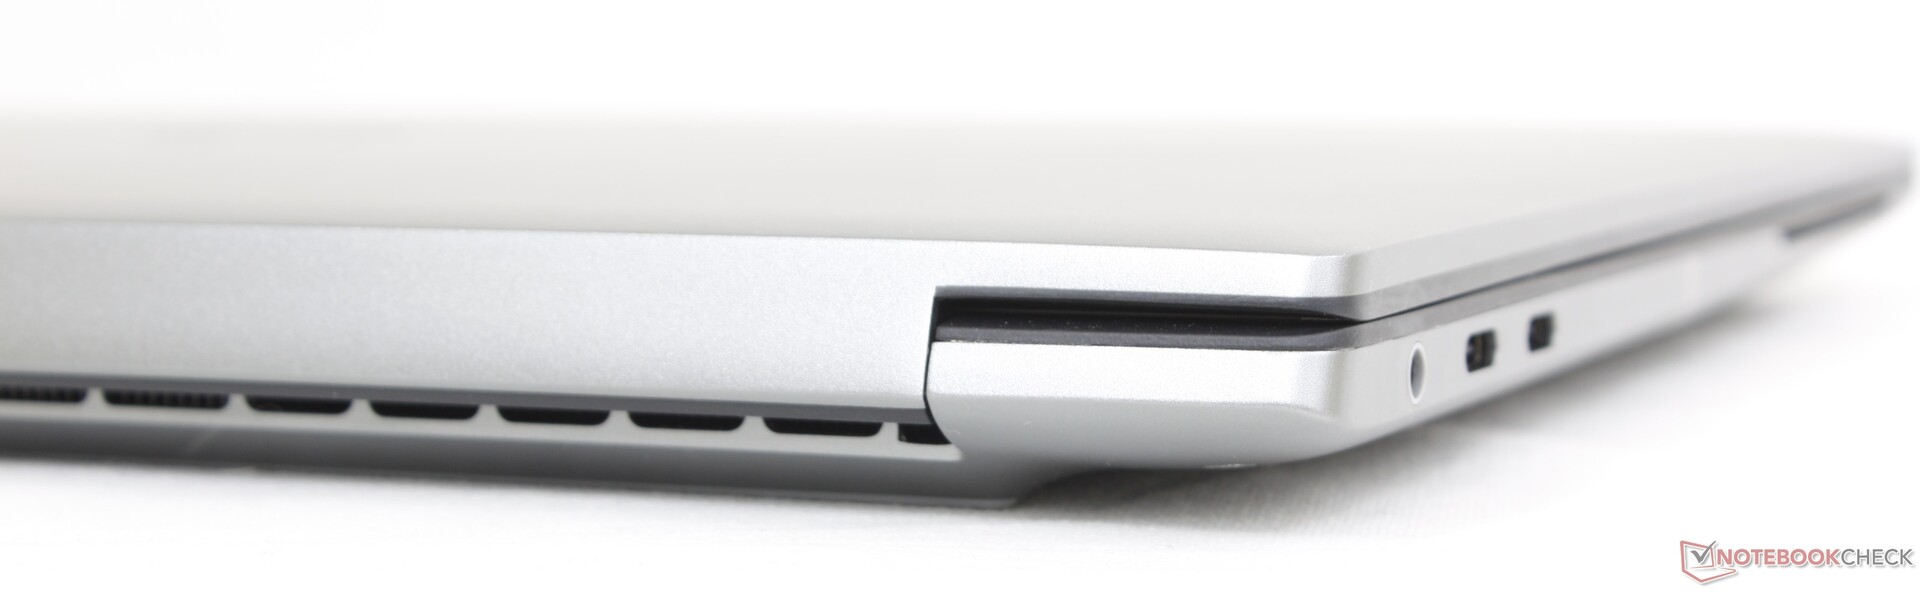
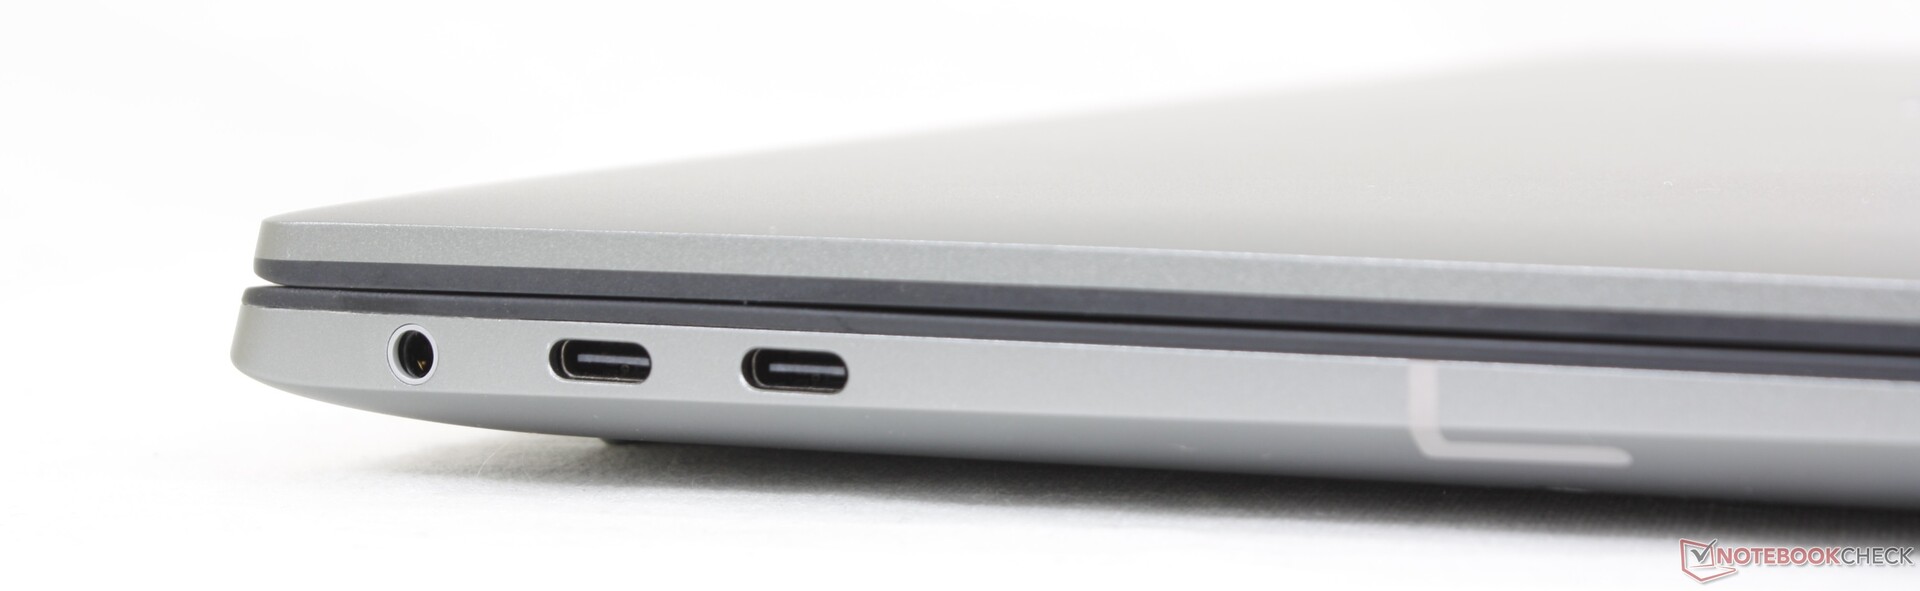
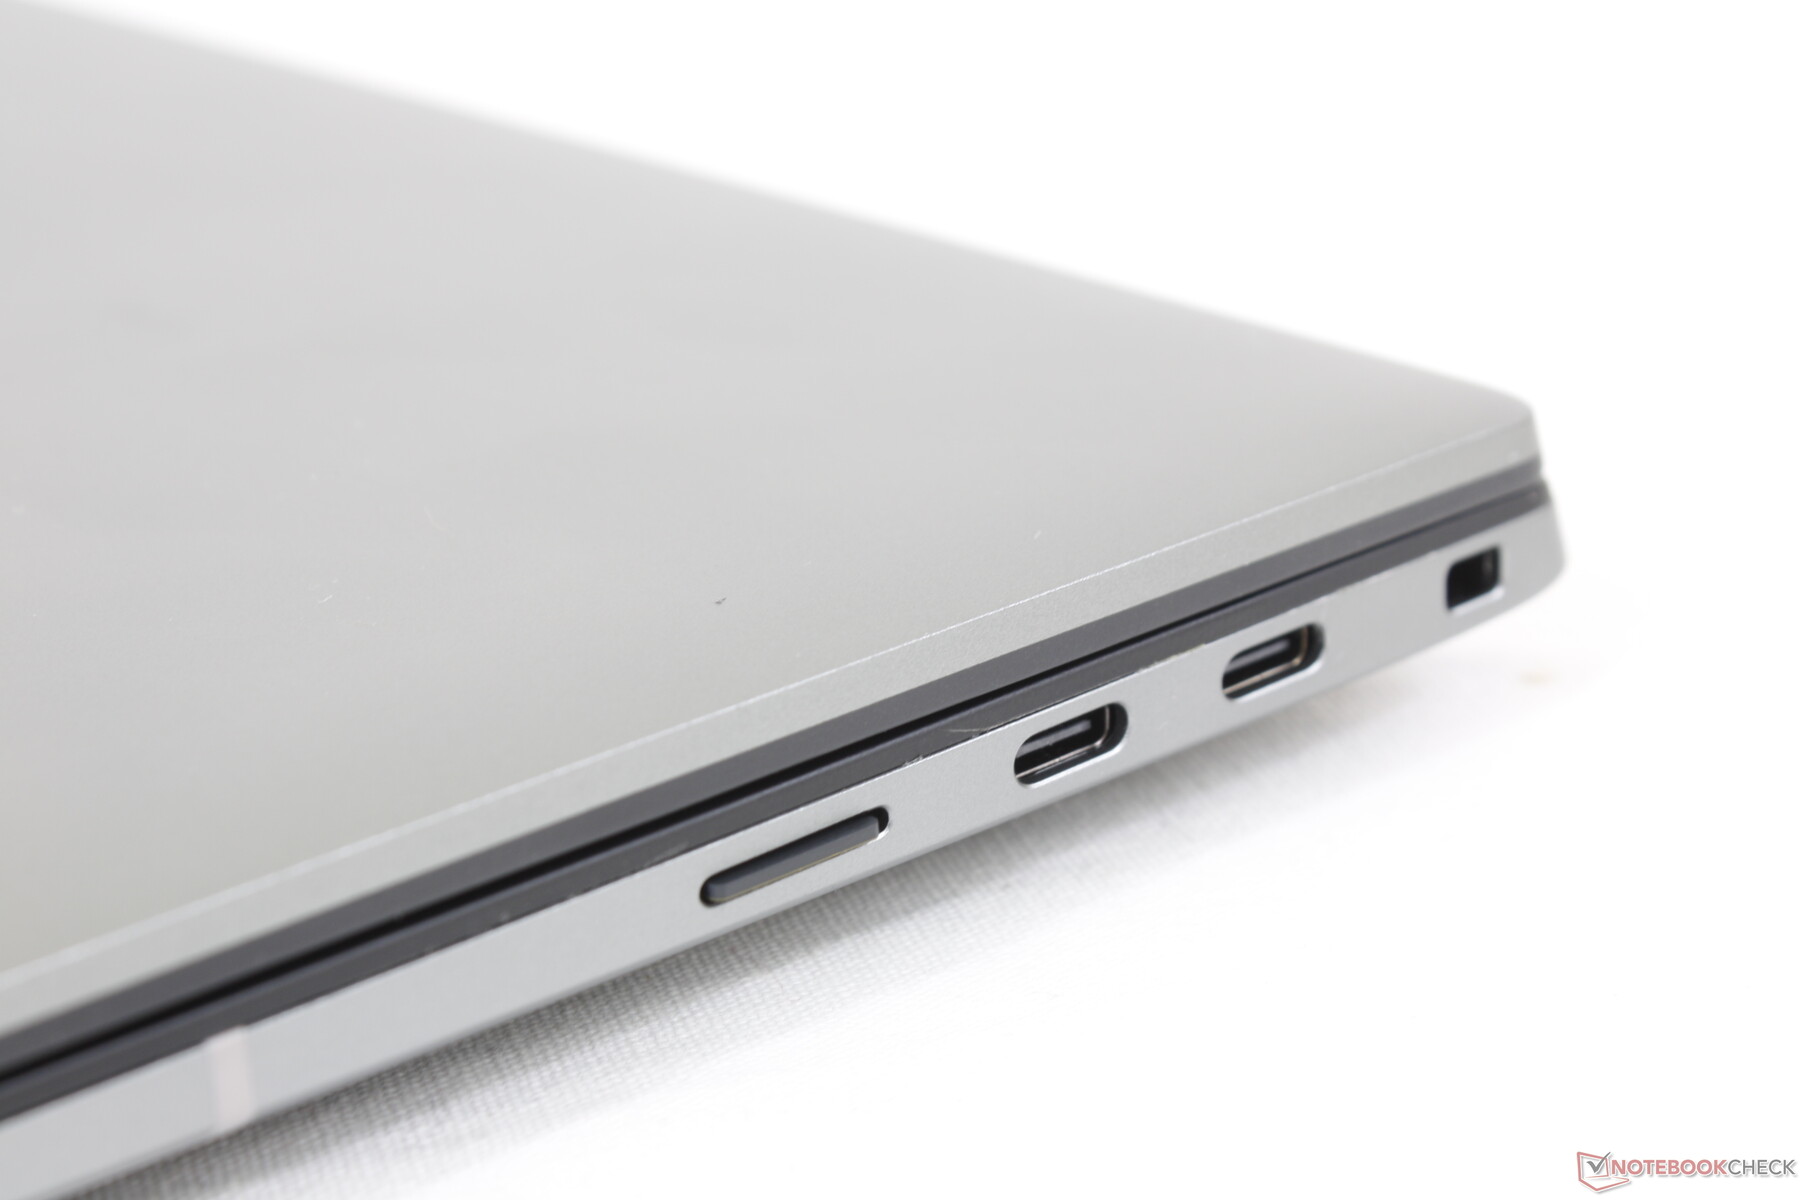
Anschlüsse — Nur USB-C
Leider sind die Anschlussmöglichkeiten auf USB-C beschränkt, während die meisten anderen Workstations deutlich mehr Optionen bieten. Nutzer der Precision 5470 müssen daher fast zwangsläufig auf Adapter und/oder Docking Stations zurückgreifen.
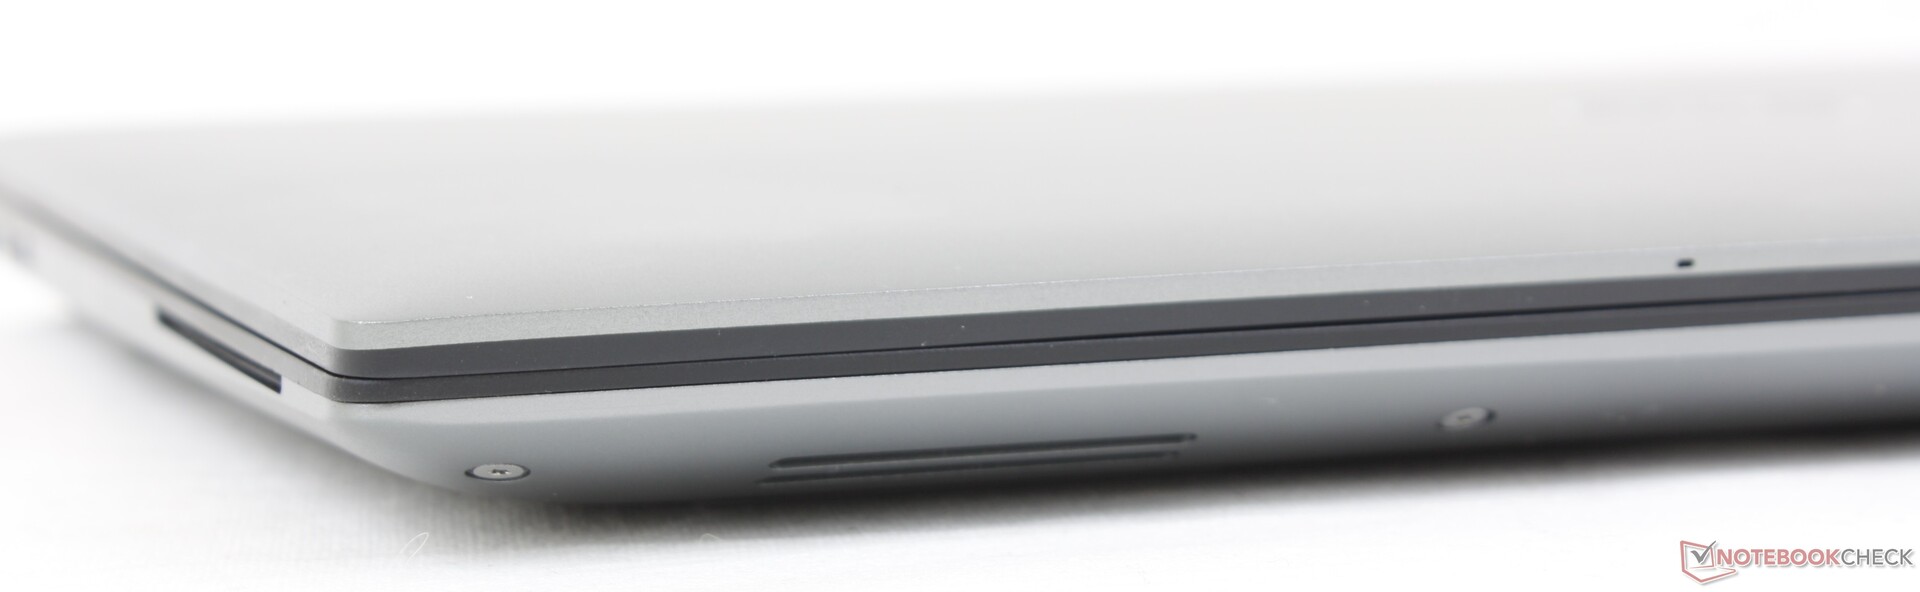
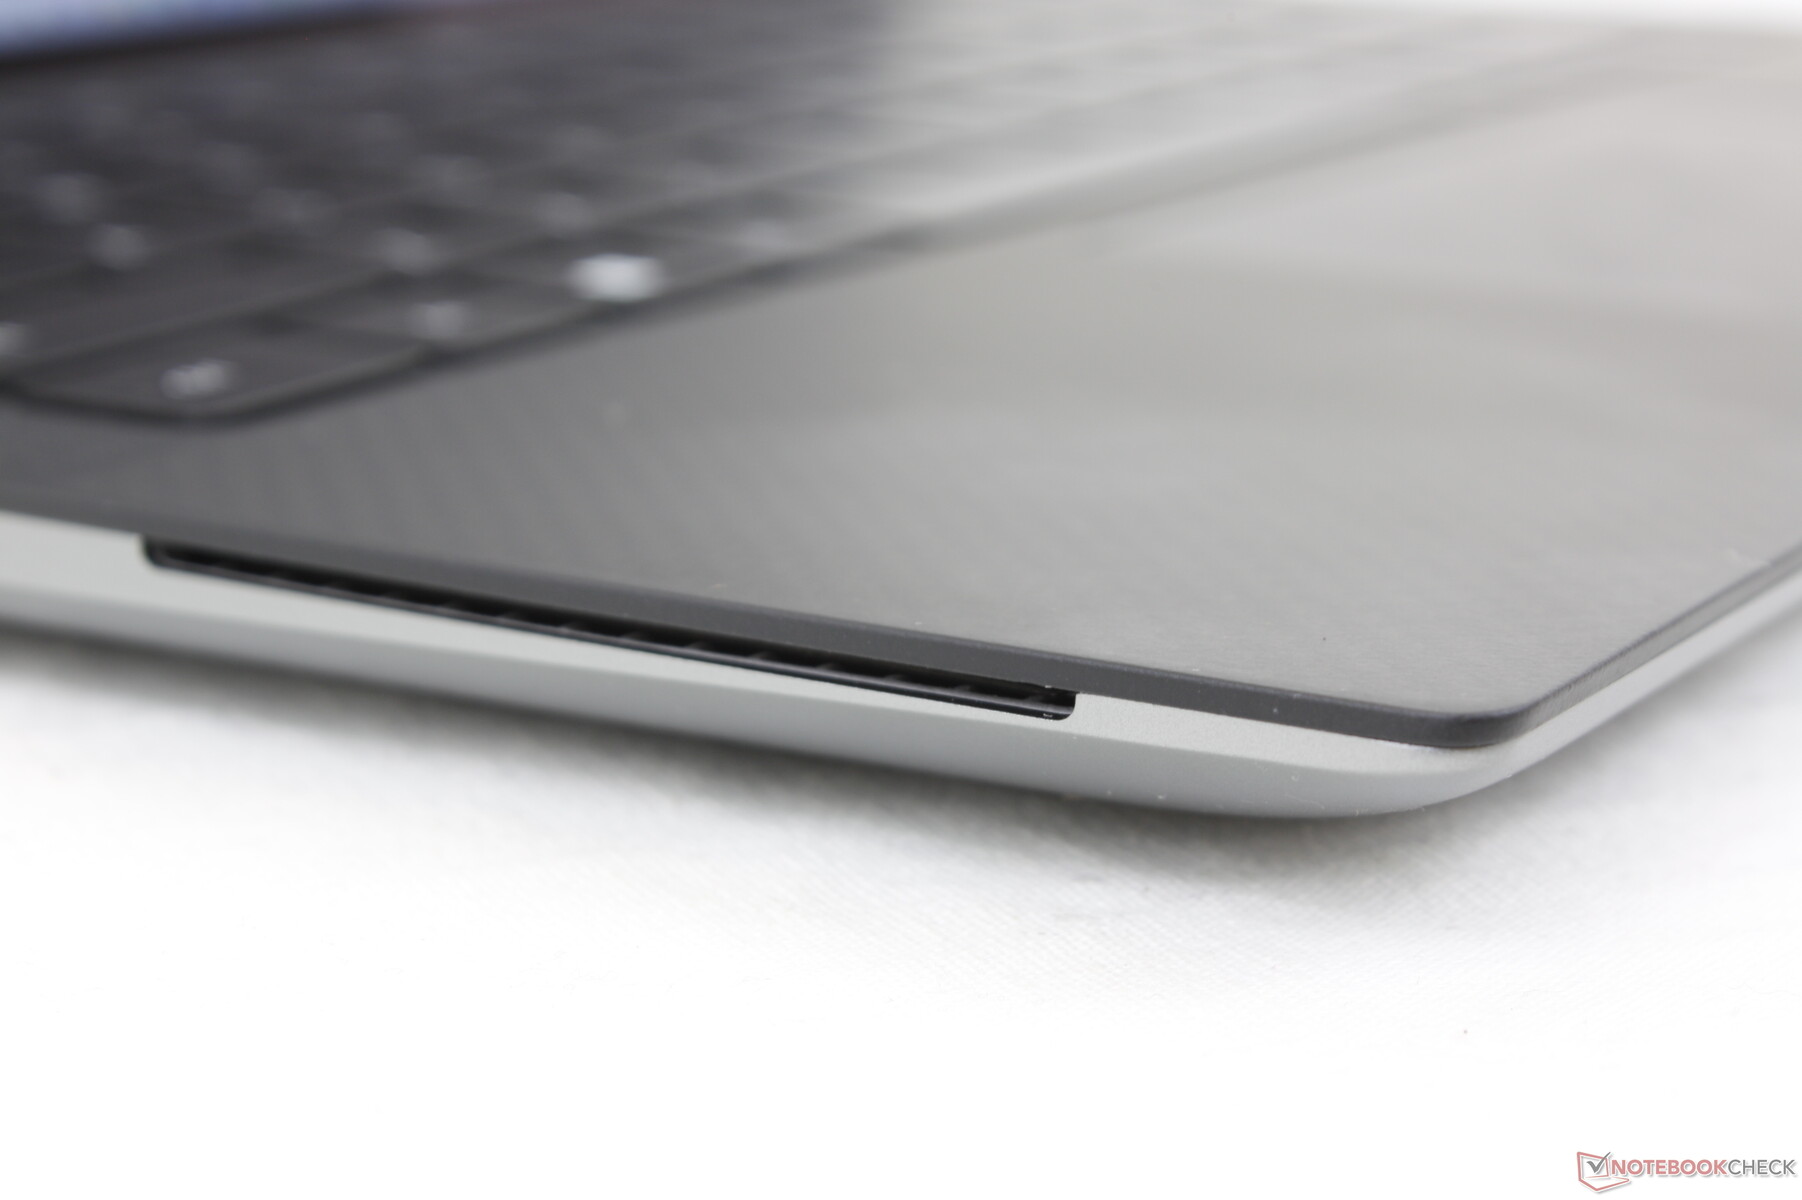
SD Card Reader
Die Transferraten des internen Kartenlesers sind mit annähernd 230 MB/s sehr schnell. Je nach Dateigröße kann es auch mal langsamer vonstatten gehen, das Kopieren von insgesamt 1 GB an Bildern von unserer UHS-II-Testkarte (jeweils 4 MB) ist etwas langsamer und dauert rund 13 Sekunden.
| SD Card Reader | |
| average JPG Copy Test (av. of 3 runs) | |
| Dell Precision 5000 5560 (AV Pro V60) | |
| Lenovo ThinkPad P15v G2 21A9000XGE | |
| Dell Precision 5000 5470 (AV Pro V60) | |
| Lenovo ThinkPad P14s G2 AMD (AV PRO V60) | |
| maximum AS SSD Seq Read Test (1GB) | |
| Lenovo ThinkPad P15v G2 21A9000XGE | |
| Dell Precision 5000 5470 (AV Pro V60) | |
| Dell Precision 5000 5560 (AV Pro V60) | |
| Lenovo ThinkPad P14s G2 AMD (AV PRO V60) | |
Kommunikation
Das Wifi-Modul Intel AX211 sorgt für Wi-Fi 6E und Bluetooth 5.2. Obwohl wir keine Verbindungsprobleme feststellen konnten, sind die Übertragungsraten etwas schwächer und schwankender als erwartet.
| Networking | |
| iperf3 transmit AX12 | |
| Lenovo ThinkPad P15v G2 21A9000XGE | |
| HP ZBook Firefly 14 G8 2C9Q2EA | |
| HP ZBook Firefly 14 G7 | |
| Dell Precision 5000 5560 | |
| Lenovo ThinkPad P14s G2 AMD | |
| iperf3 receive AX12 | |
| HP ZBook Firefly 14 G8 2C9Q2EA | |
| Lenovo ThinkPad P15v G2 21A9000XGE | |
| Dell Precision 5000 5560 | |
| HP ZBook Firefly 14 G7 | |
| Lenovo ThinkPad P14s G2 AMD | |
| iperf3 receive AXE11000 6GHz | |
| Dell Precision 5000 5470 | |
| iperf3 transmit AXE11000 6GHz | |
| Dell Precision 5000 5470 | |
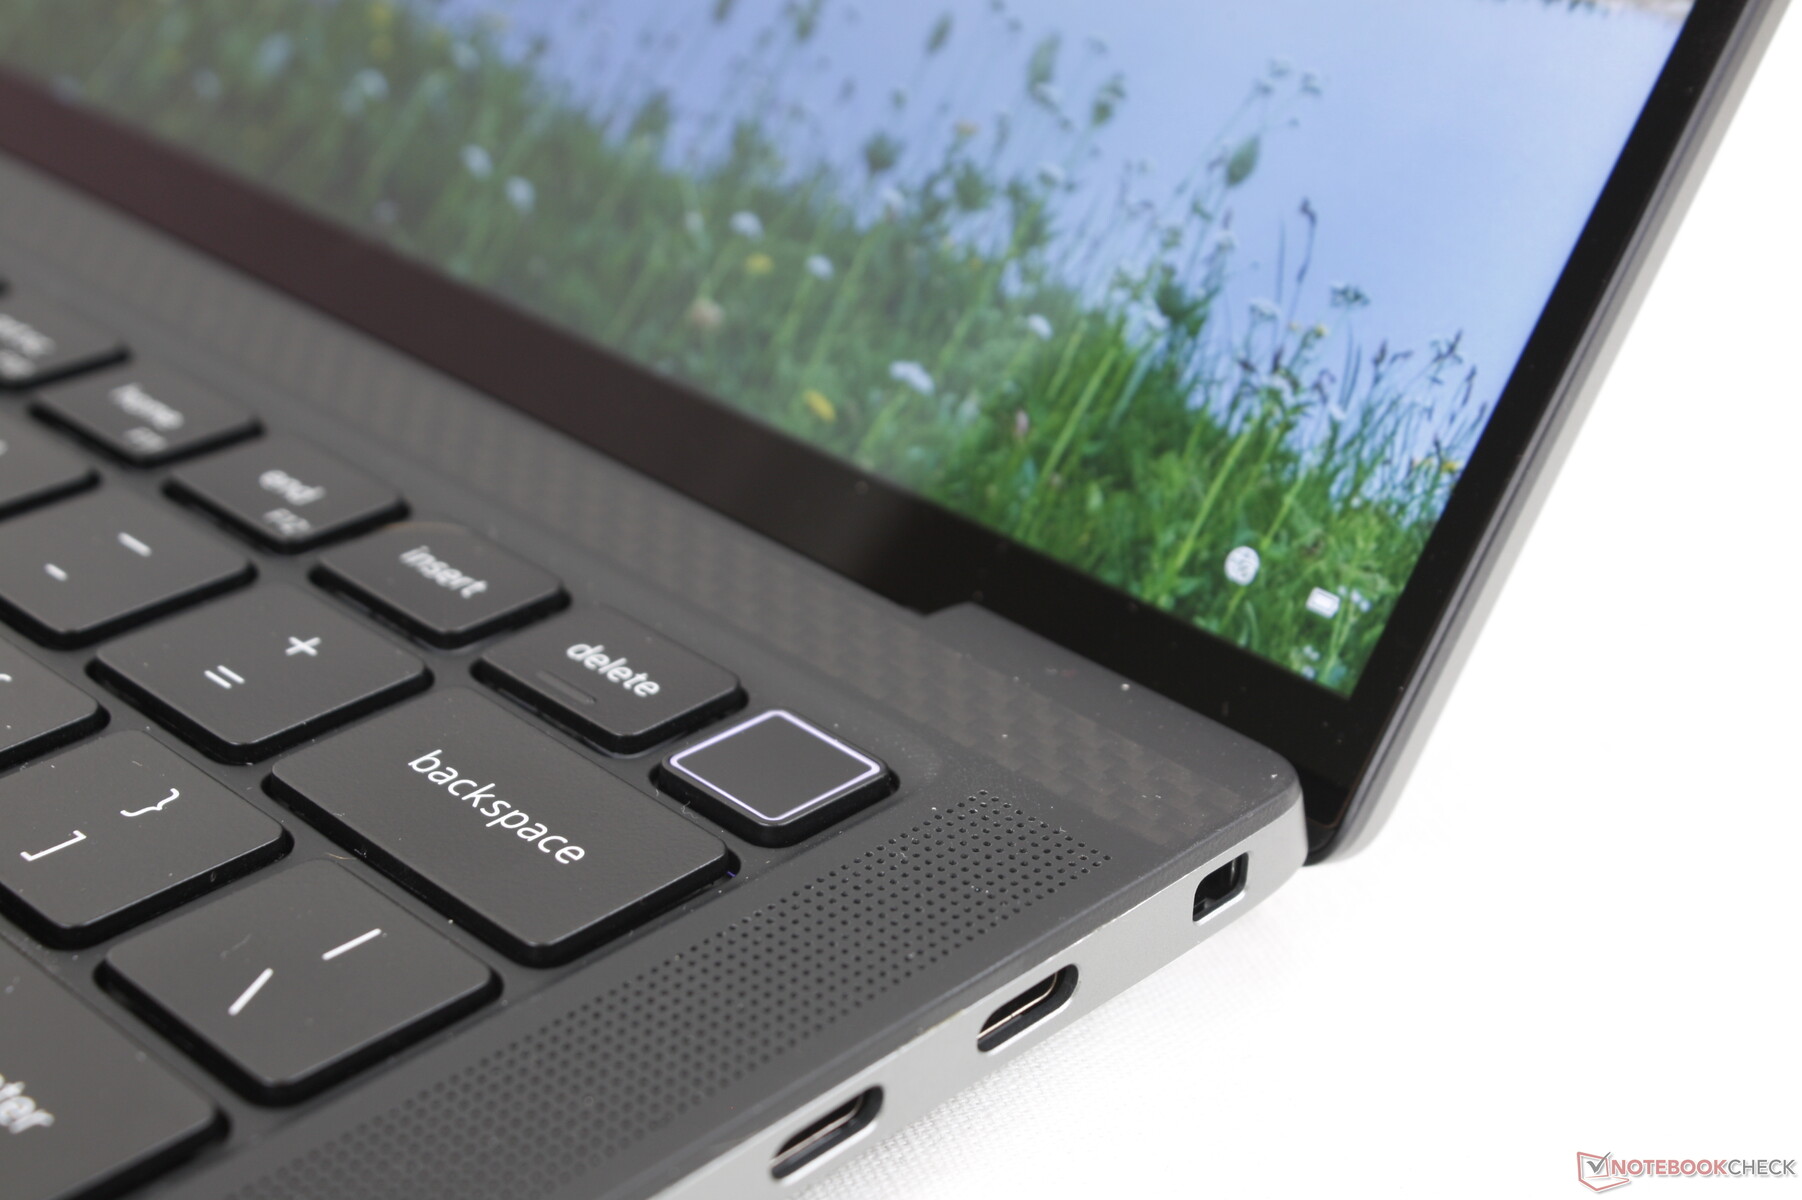
Webcam
Die Webcam ist leider auf nur 1 MP bzw. 720p beschränkt, während viele andere Laptops bereits auf Modelle mit 2 MP oder gar 5 MP umgeschwenkt sind, beispielsweise viele High-End-HP-Laptops. Die Bildqualität wirkt eher vermatscht, ähnlich wie die Webcamqualität der XPS-13-Serie.
IR wird für Windows Hello unterstützt, leider gibt es keinen Shutter, um die Webcam sicher am Aufnehmen zu hindern.


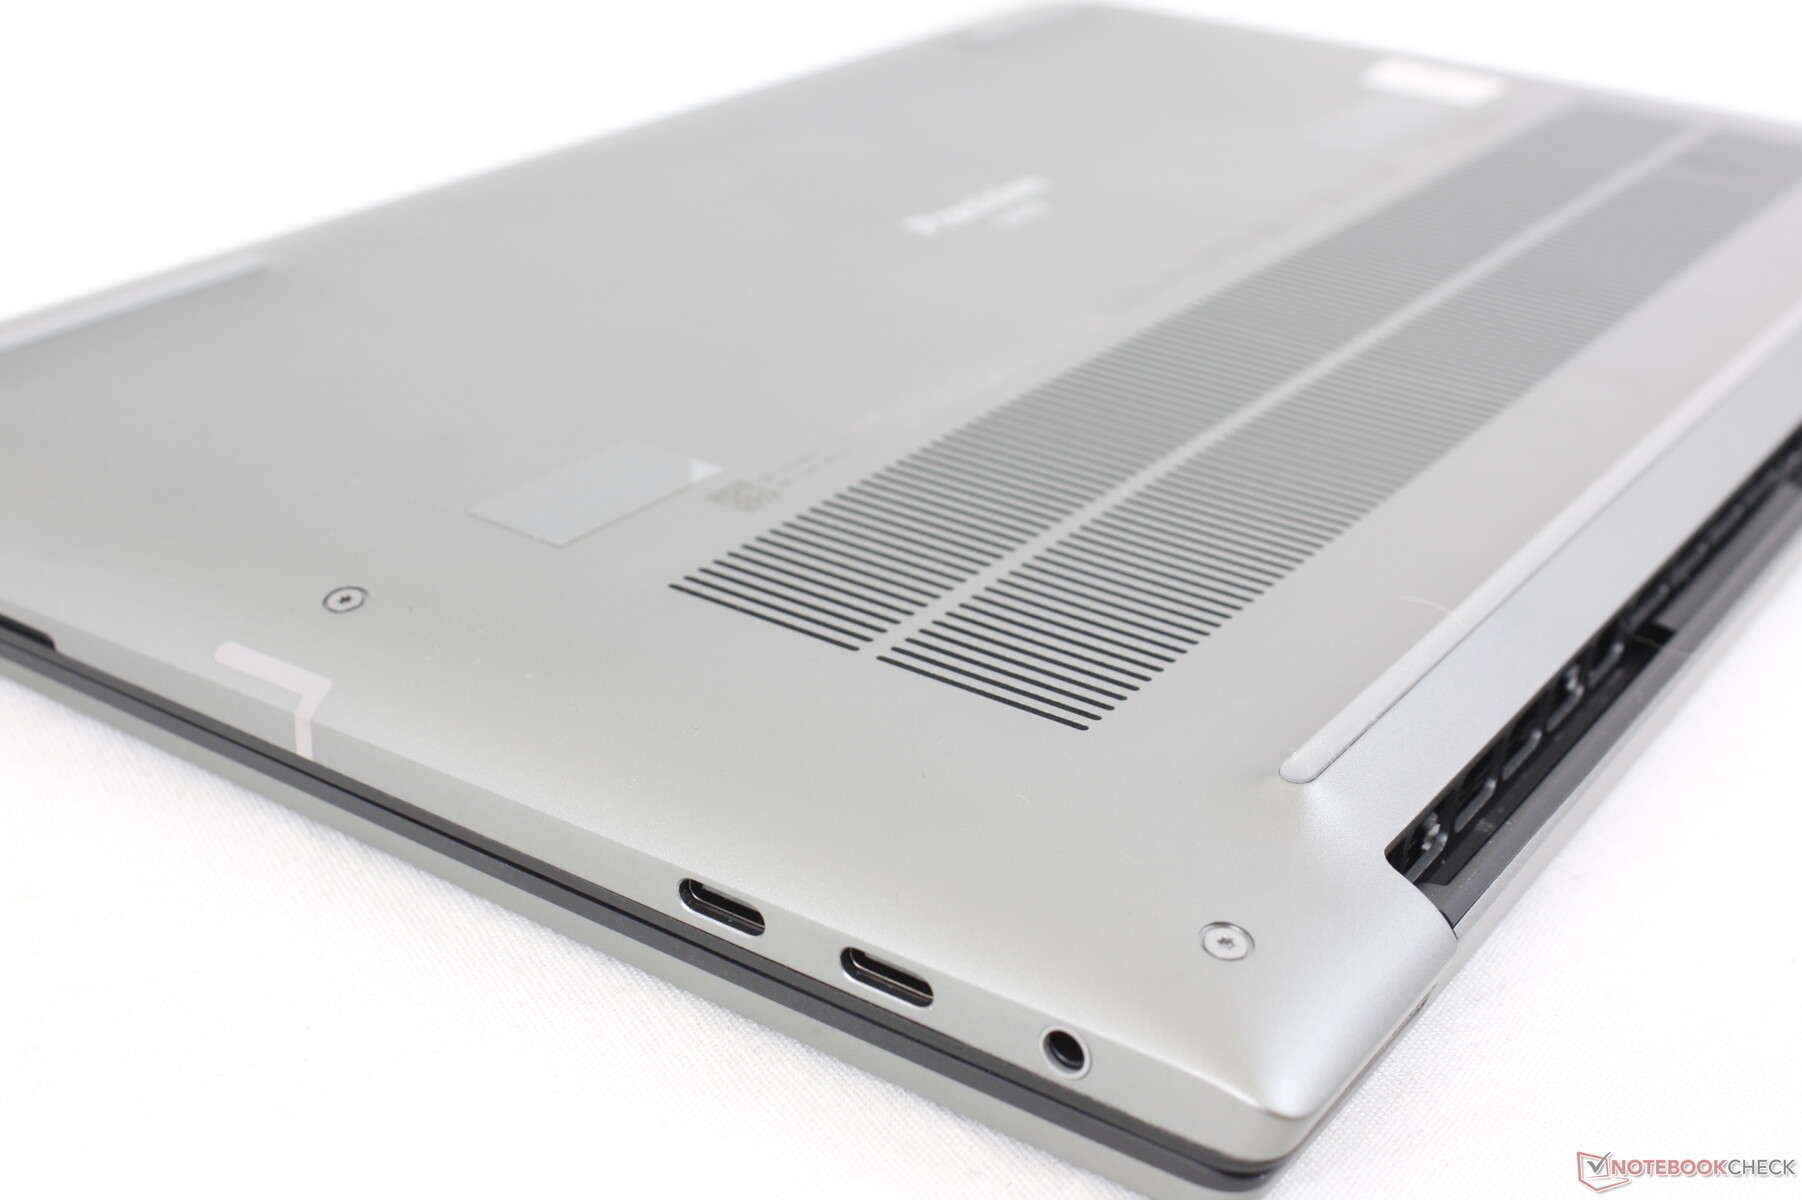
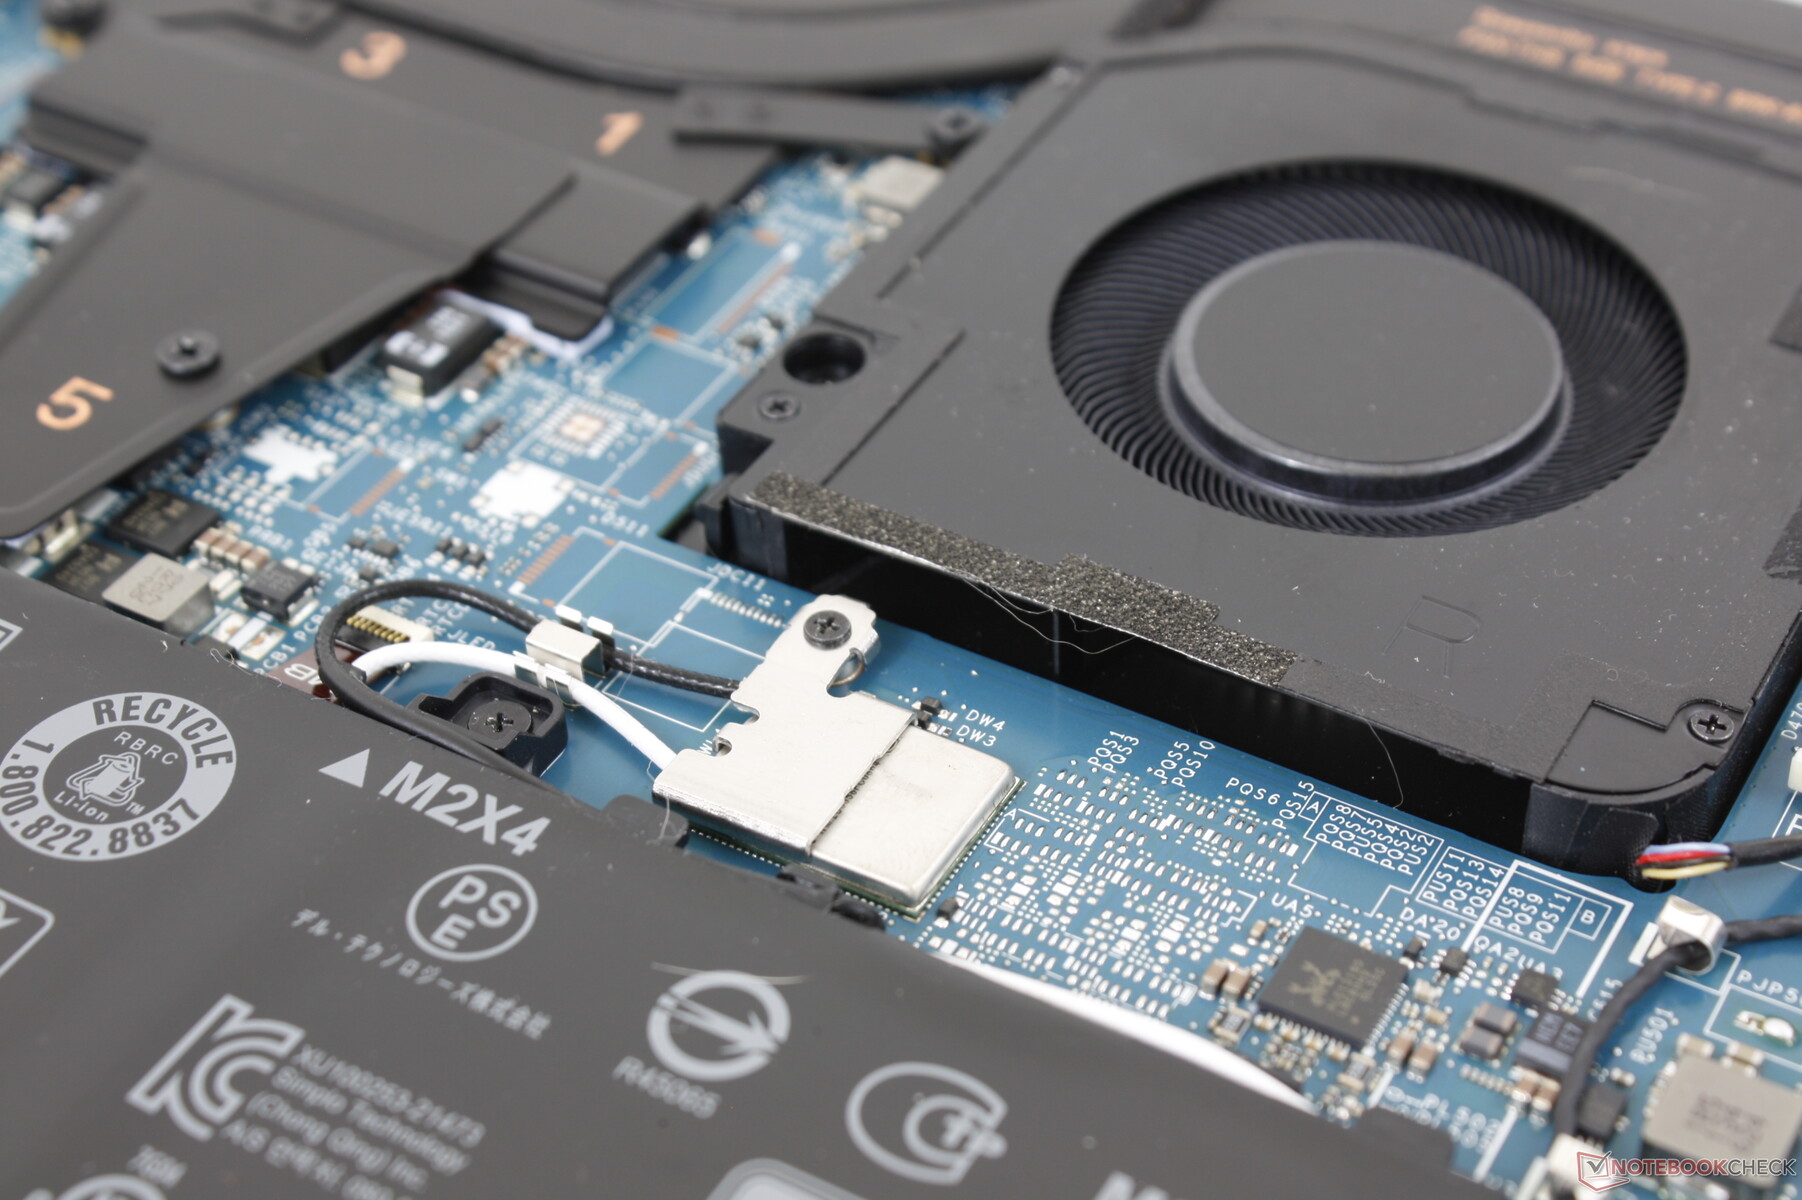
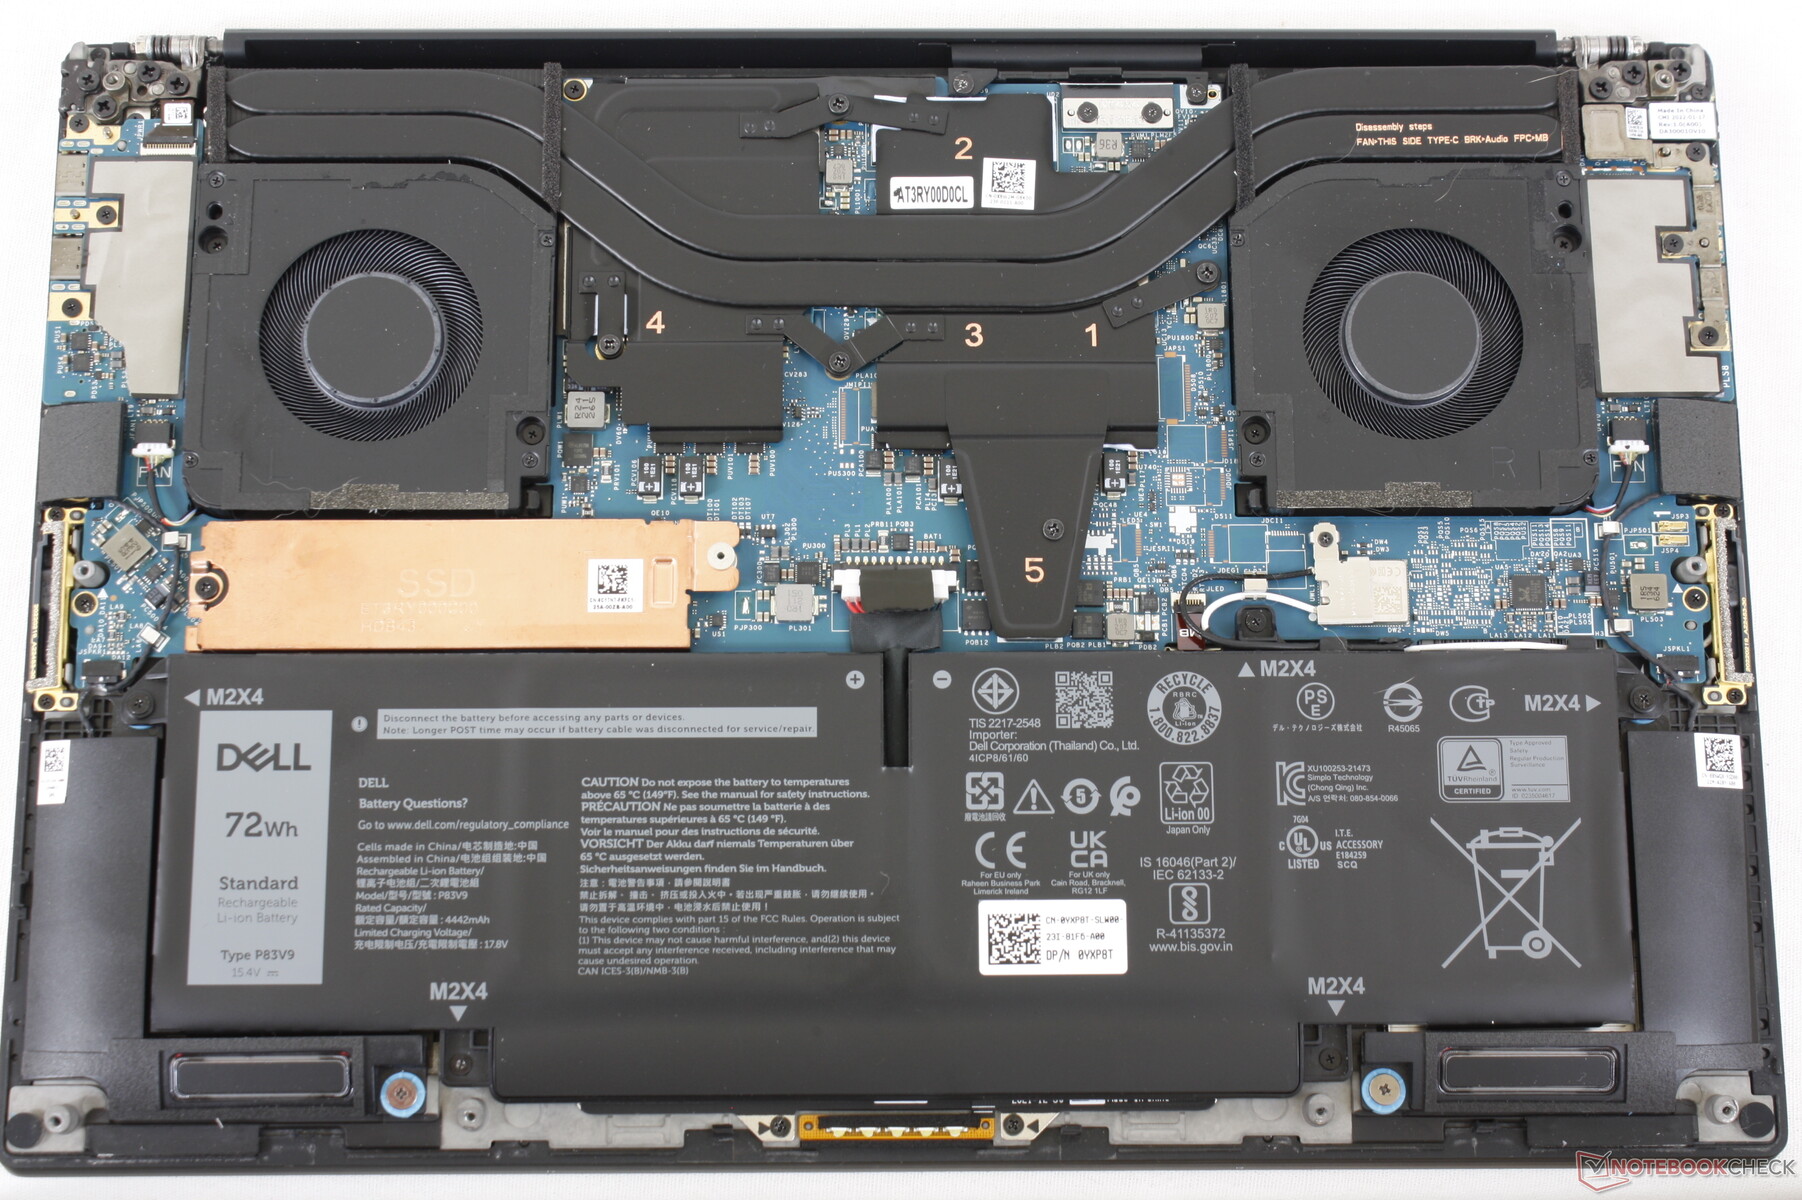
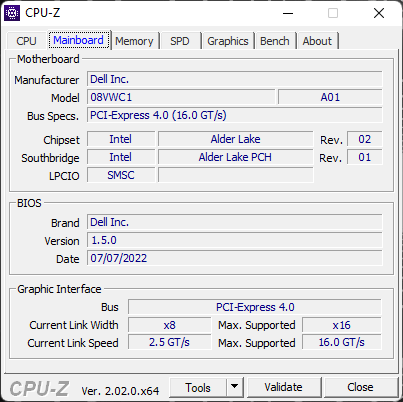
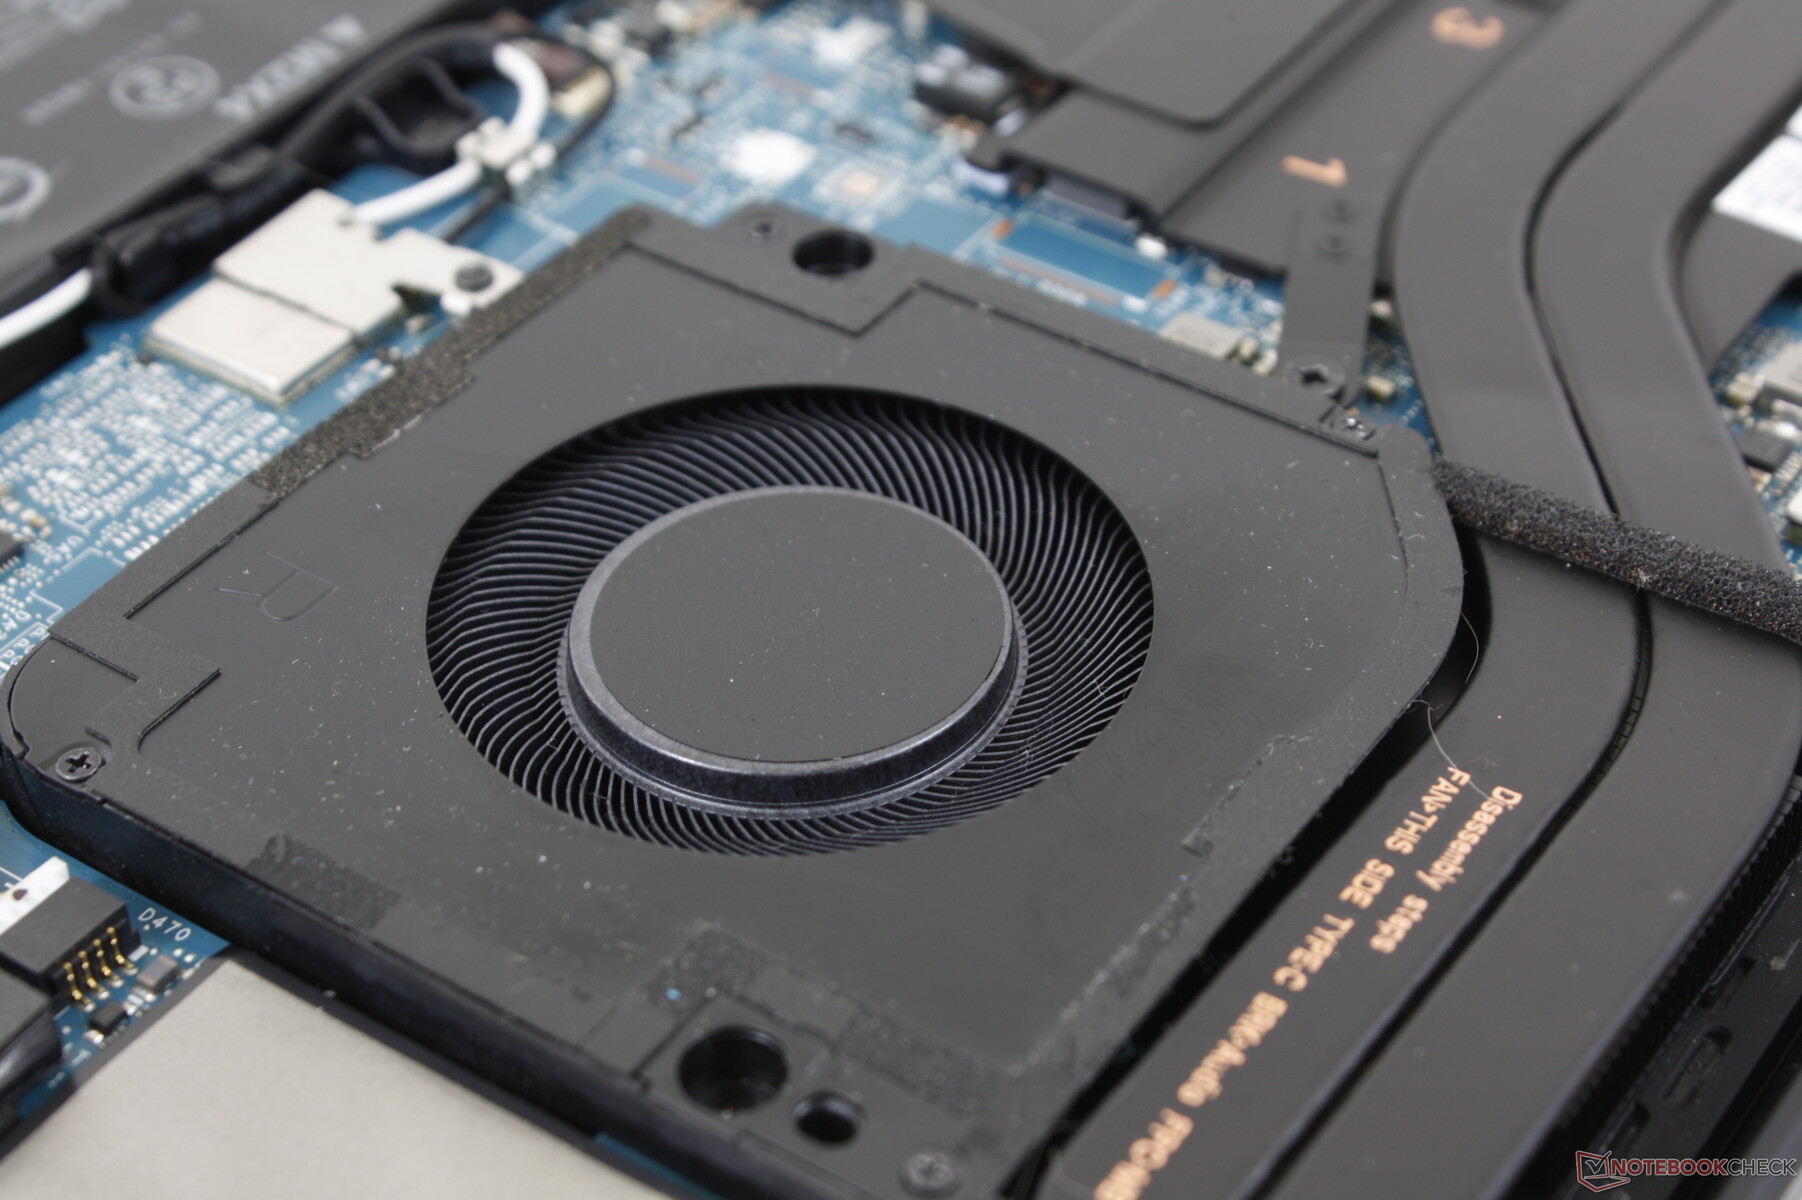
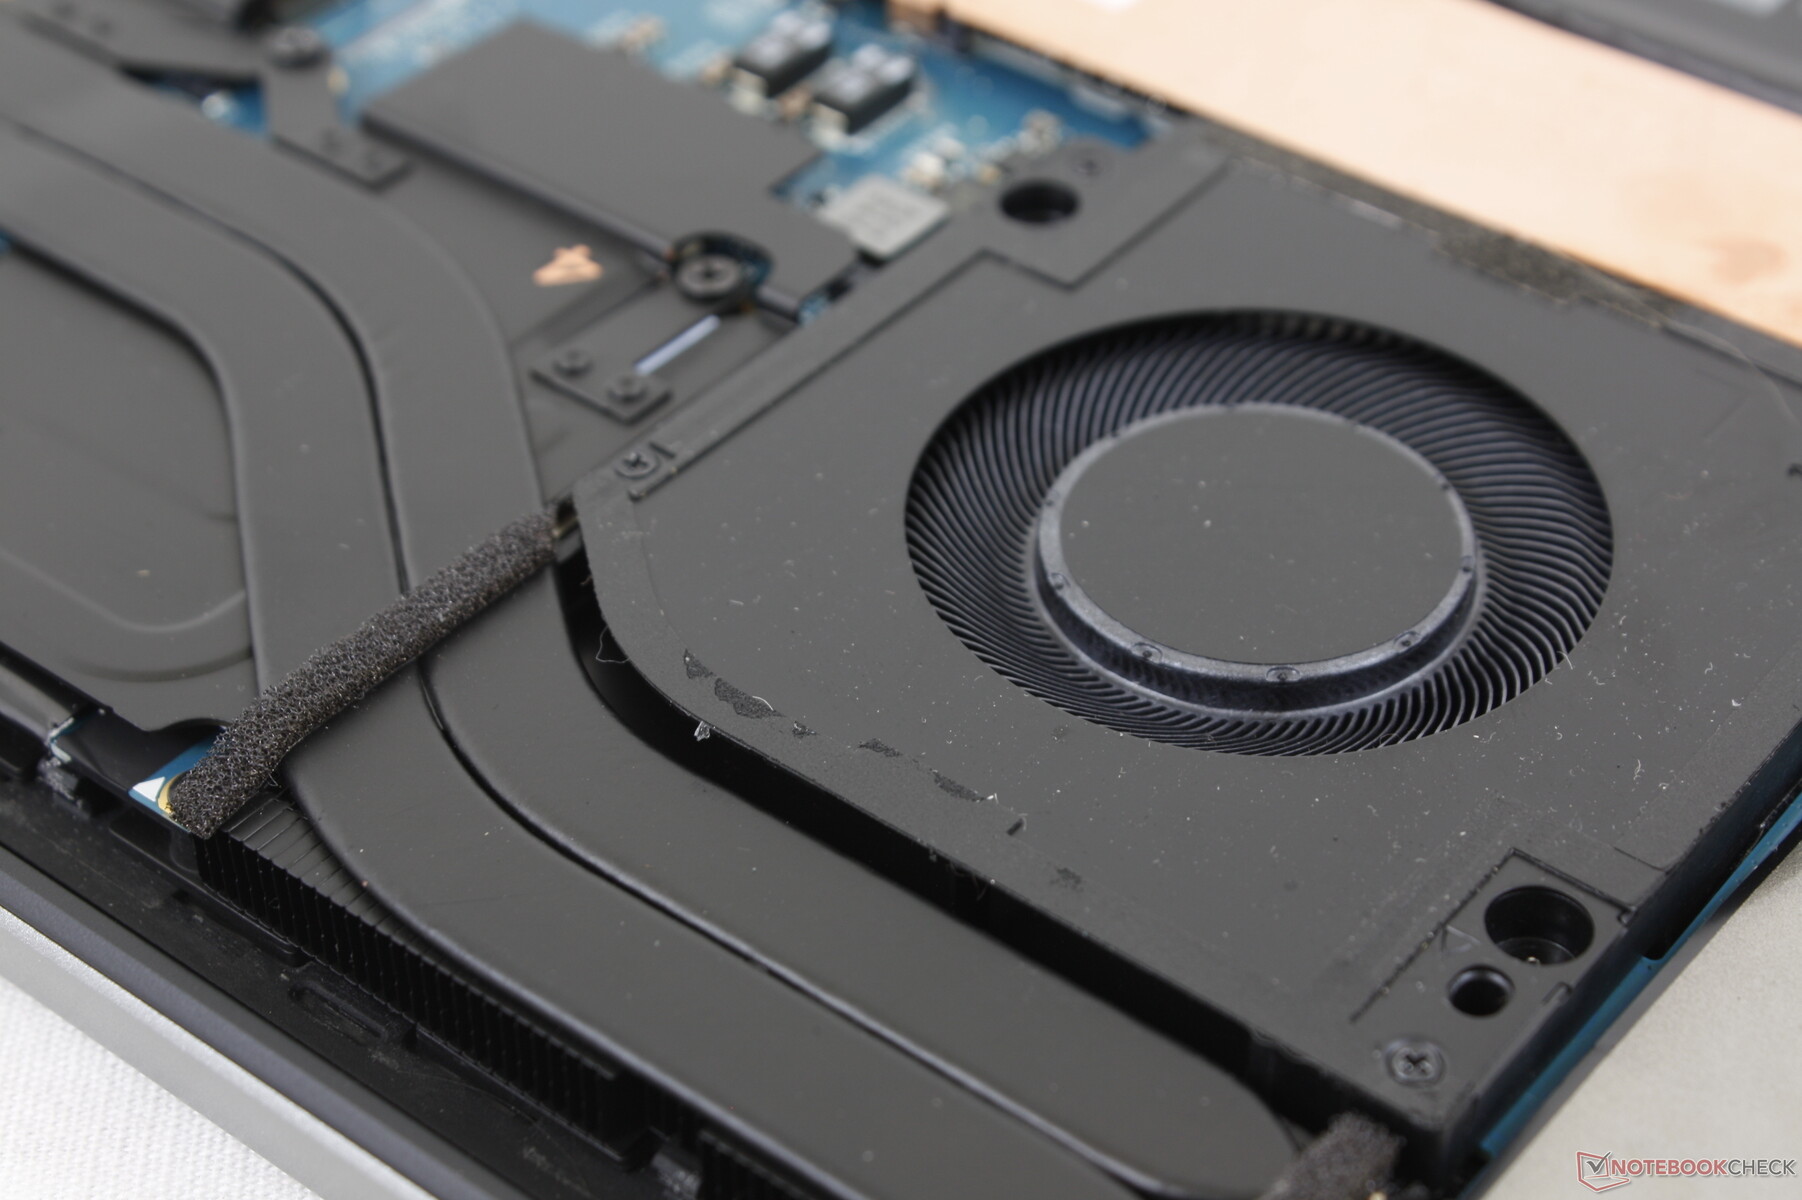
Wartung
Die Unterseite wird von acht T5-Torx-Schrauben gesichert und lässt sich leicht abnehmen. Allerdings gibt es nicht viel zum Upgraden, da der RAM und das WLAN-Modul fest verlötet sind.
Garantie
In unserem Original-US-Test ärgert sich unser Autor noch über die nur 1-jährige Garantiezeit. In Deutschland gewährt Dell jedoch 3 Jahre Dell ProSupport, wie es sich für eine Workstation gehört.
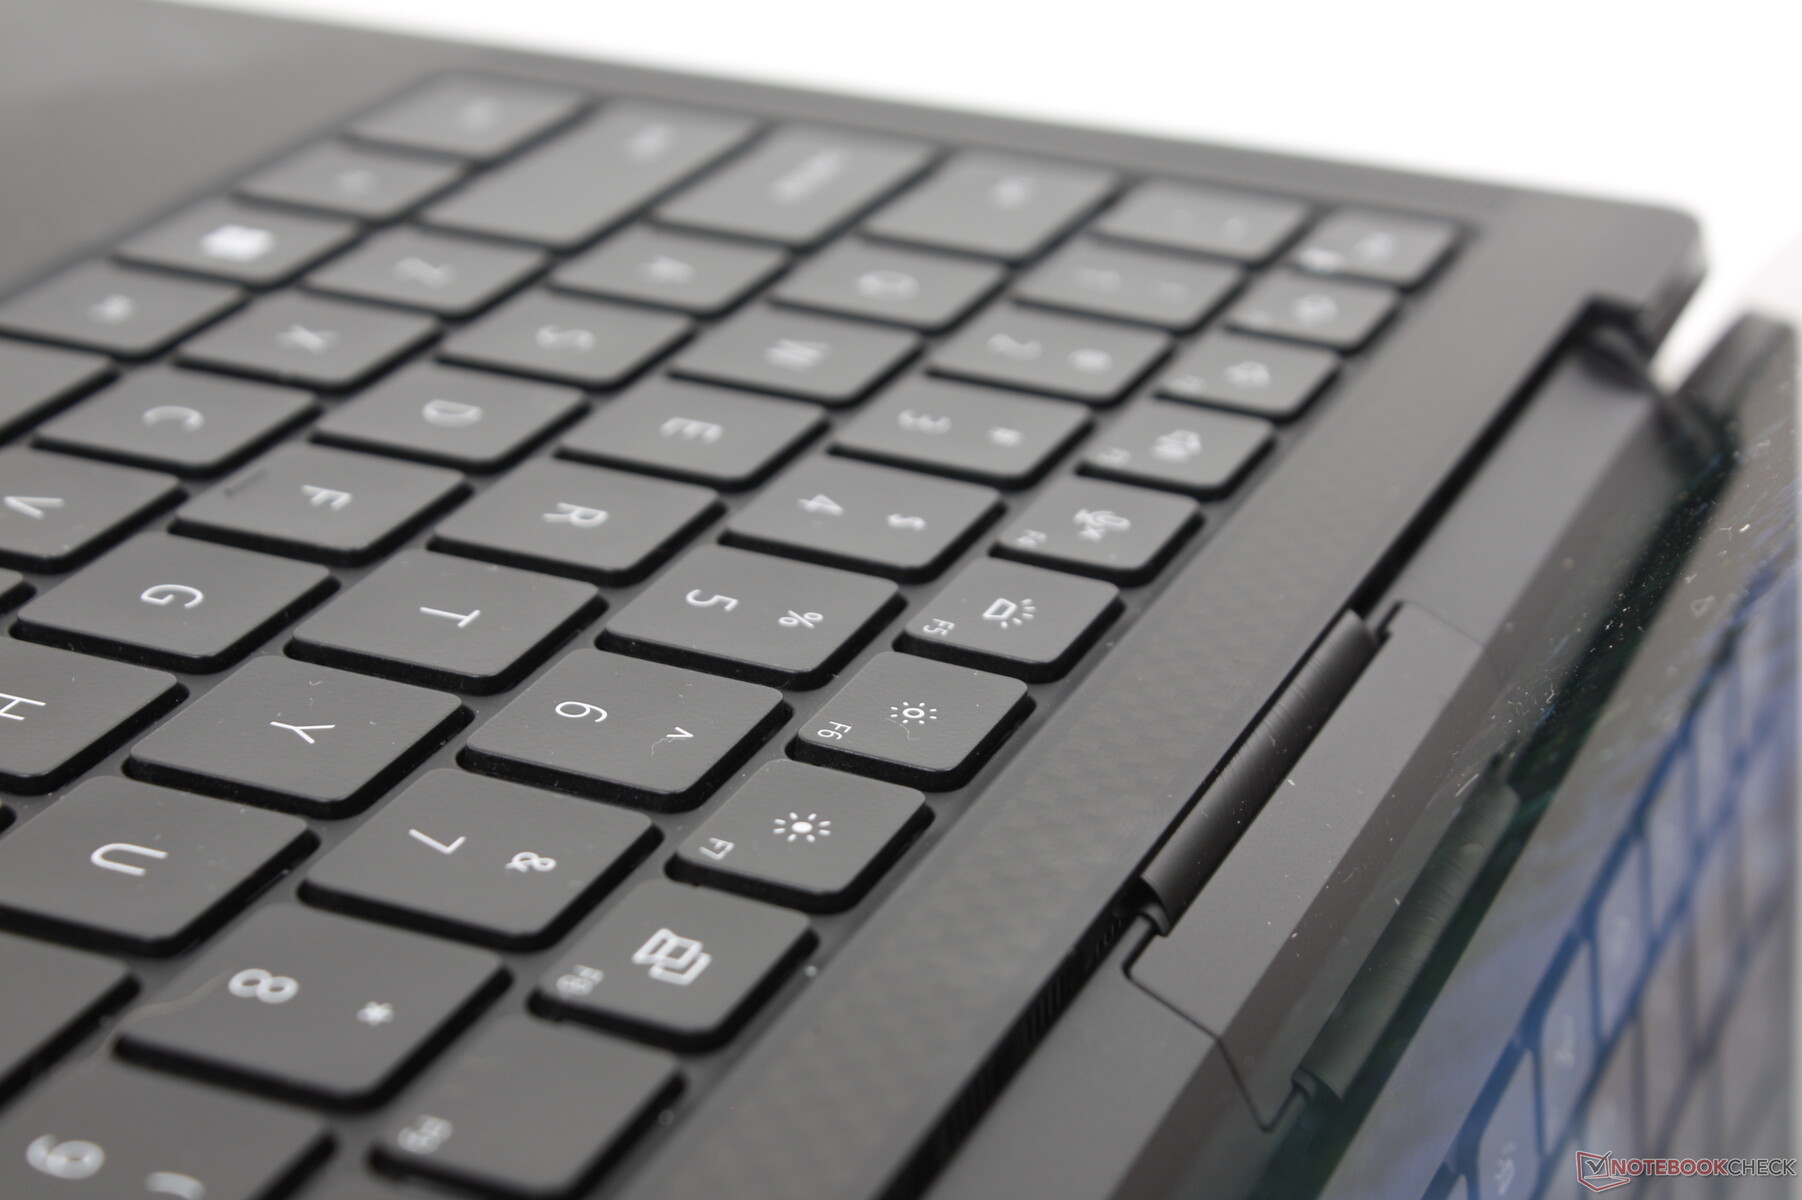
Eingabegeräte
Tastatur
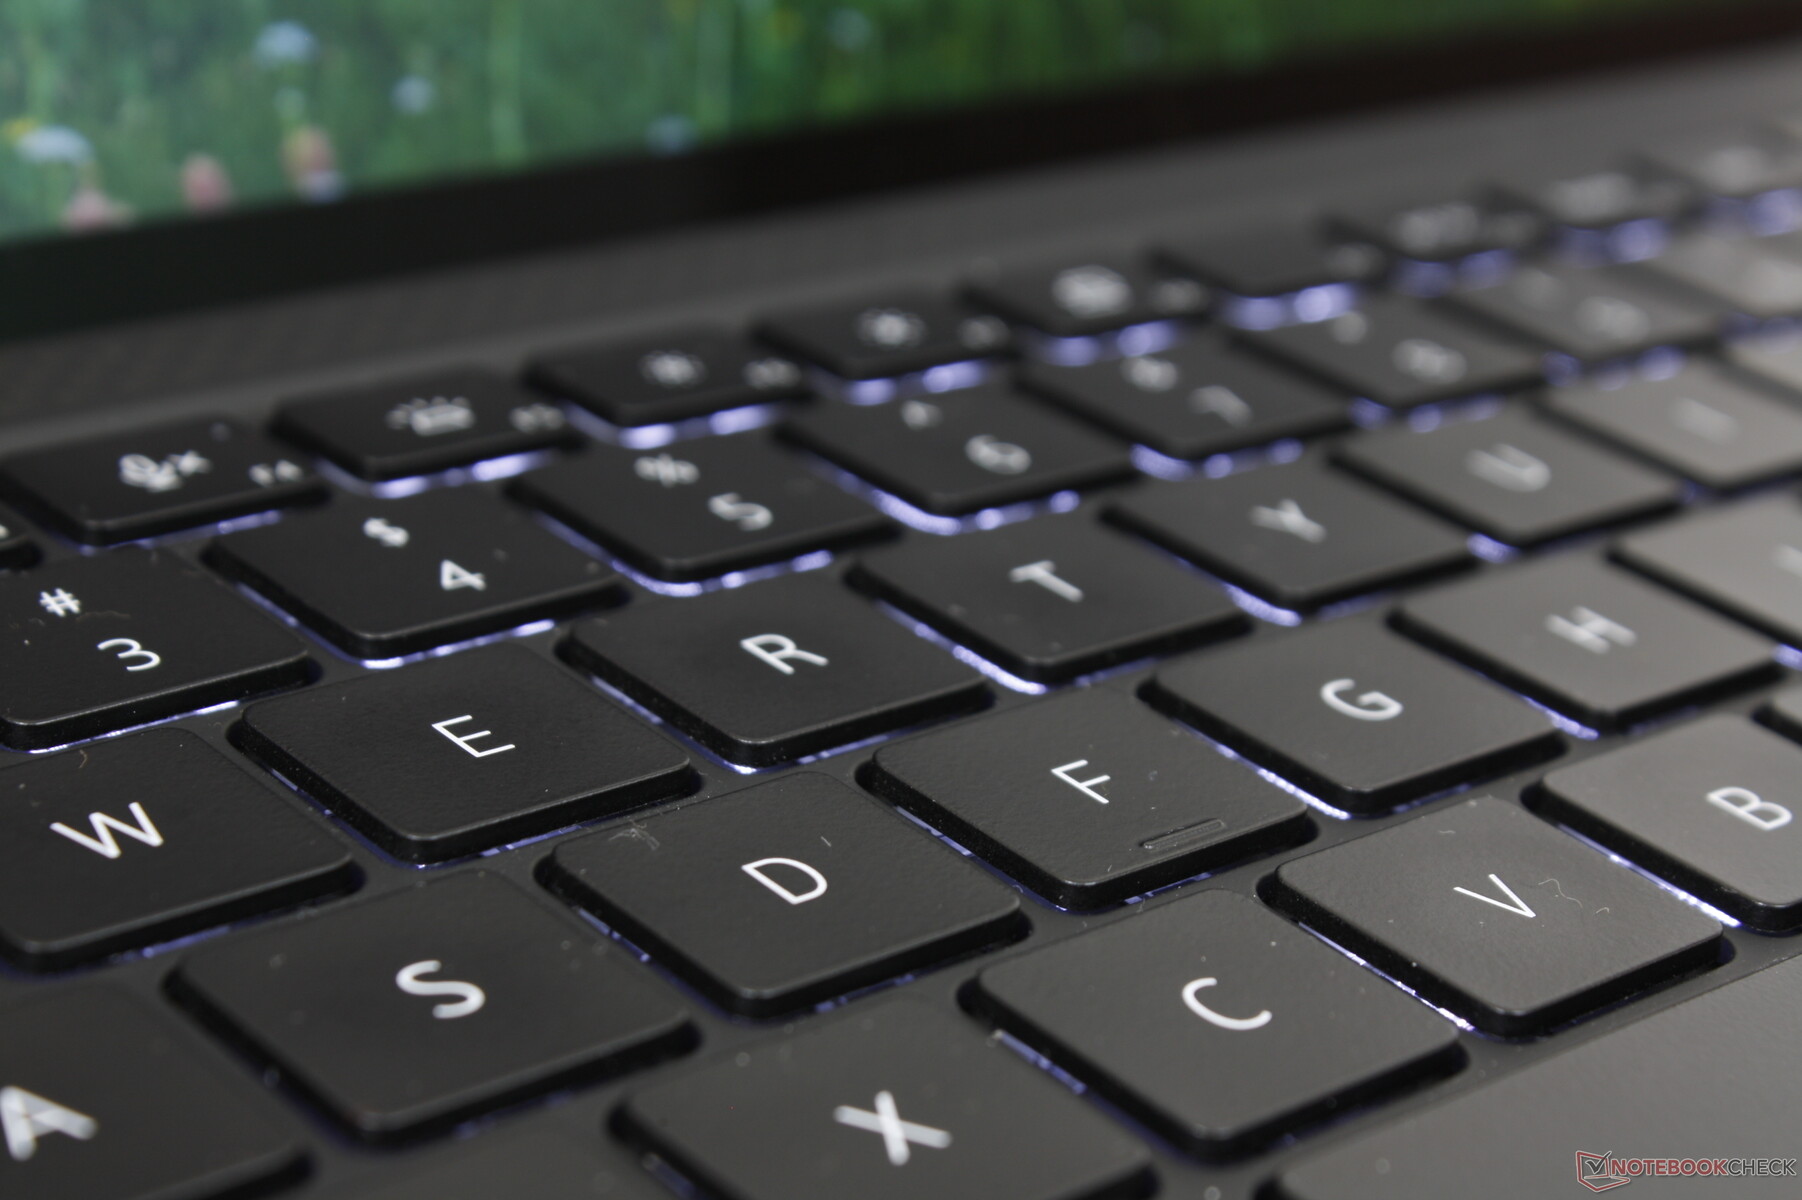
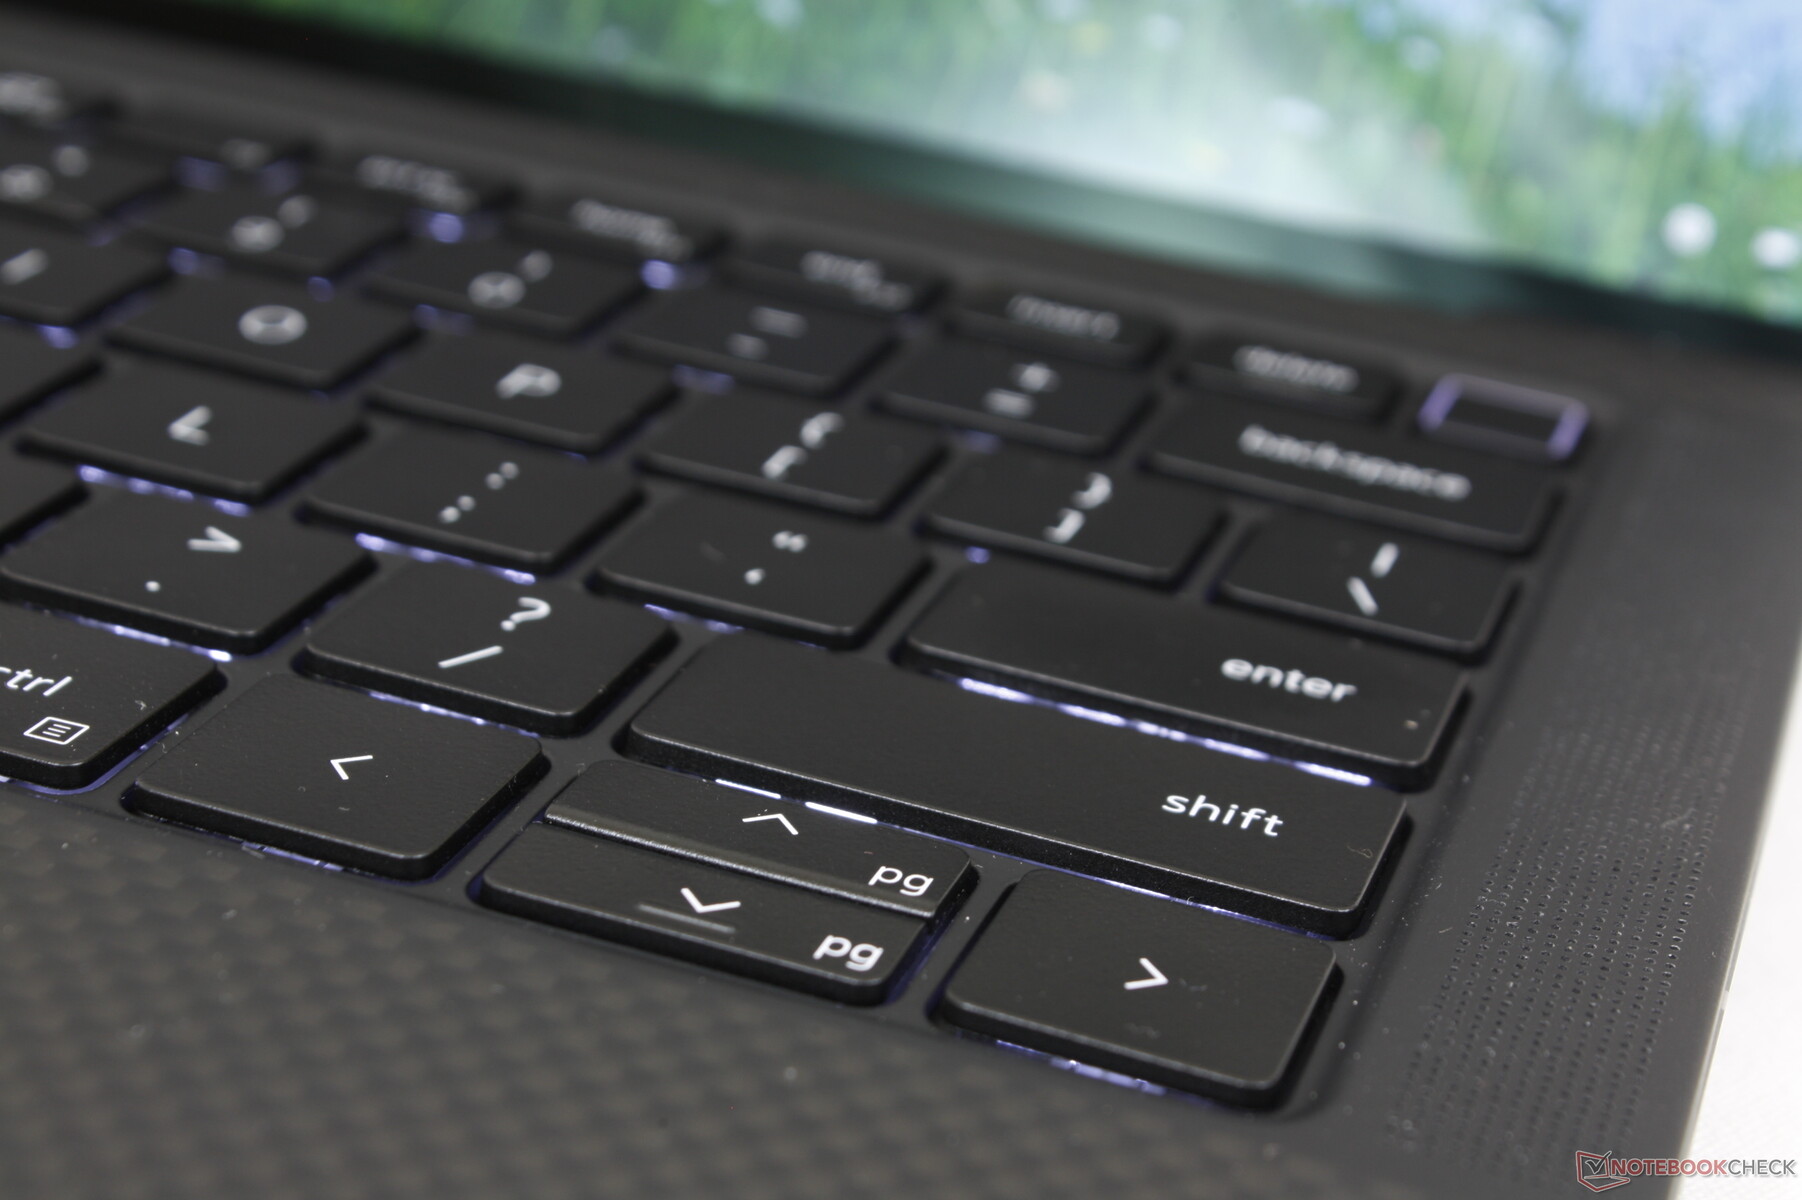
Das Notebook erbt die Tastatur des älteren XPS 13 9300 oder 9310. Wer bereits auf einem XPS 13 getippt hat, weiß was man vom Precision 5470 erwarten kann. Das Tastenfeedback ist gleichmäßig mit moderatem Hub, aber die Tasten eines HP EliteBook oder Firefly wirken nochmals einen Tick knackiger beim Drücken.
Touchpad
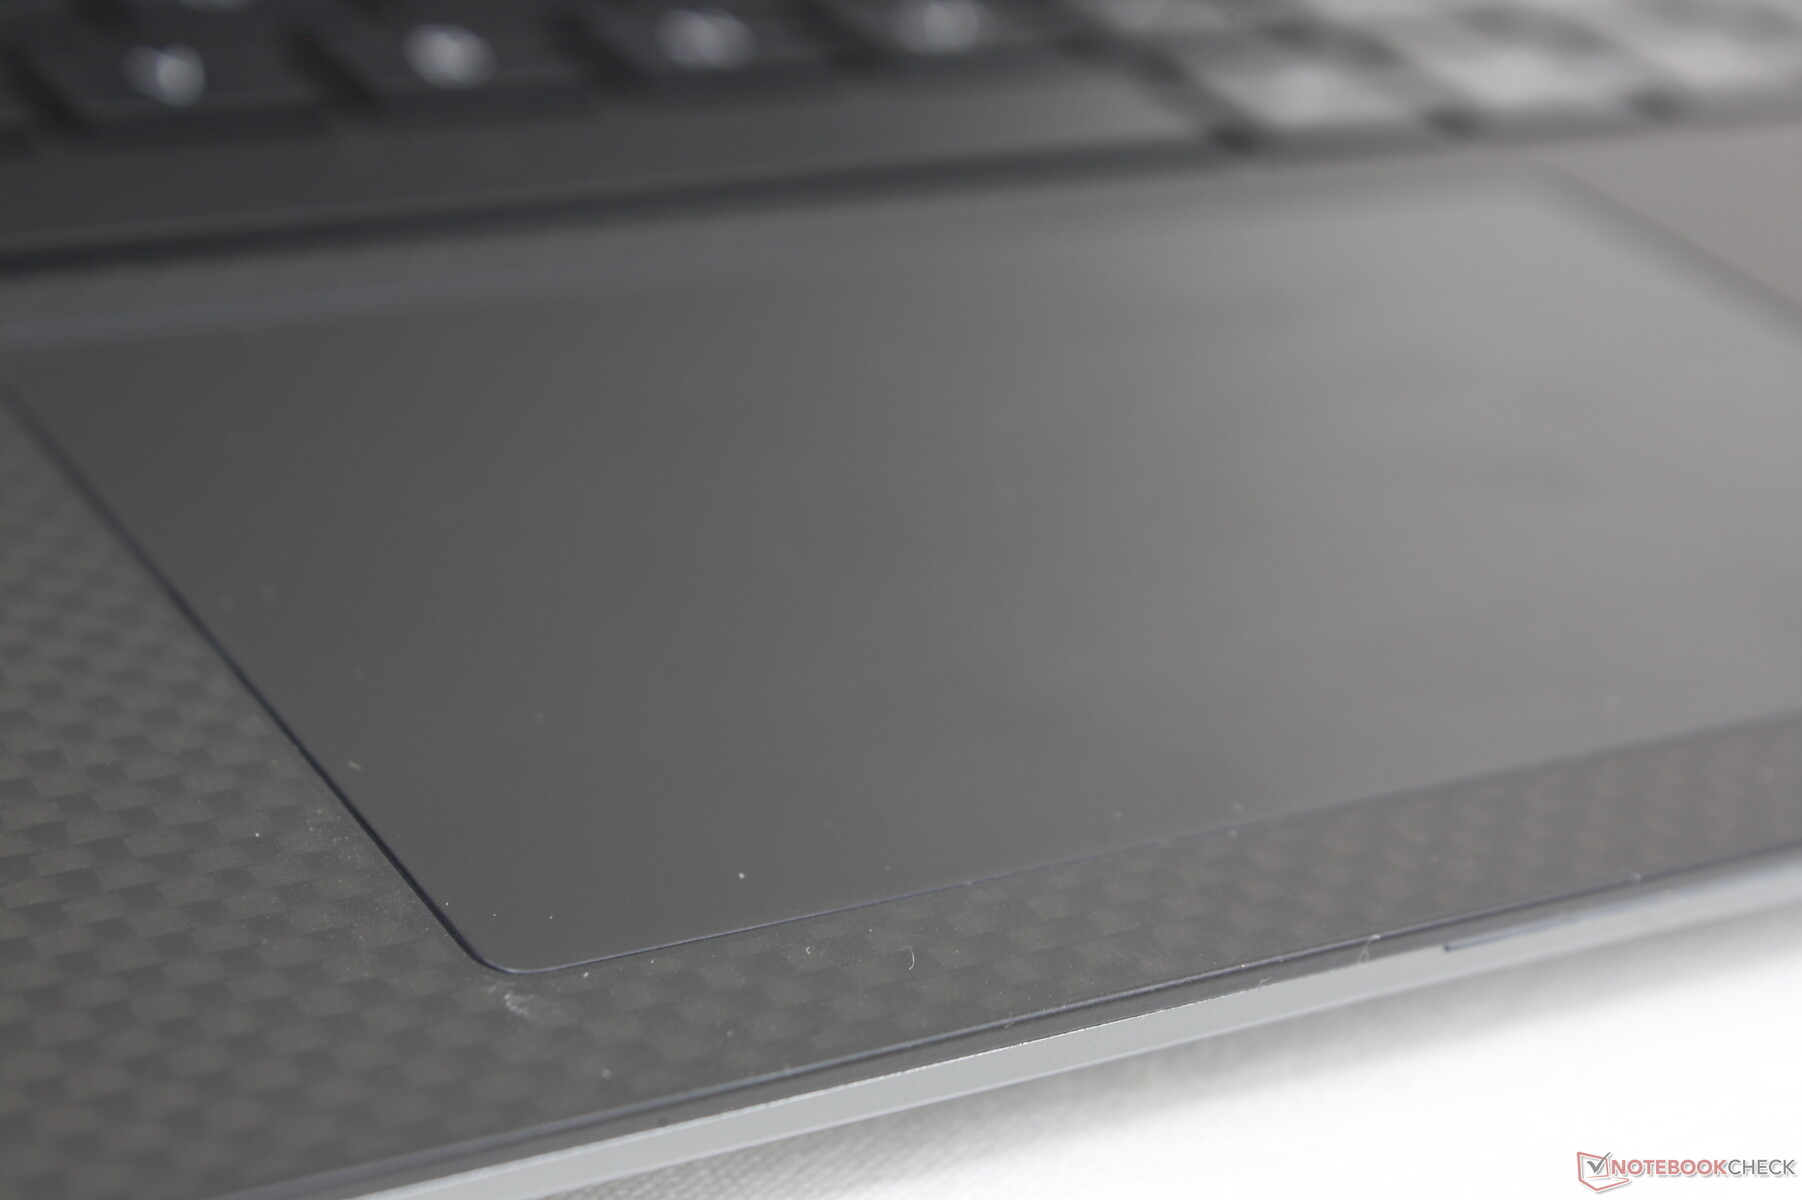
Die Klickoberfläche entspricht beinahe der Größe im XPS 13 9300 (10,8 x 6,7 cm vs. 11,2 x 6,5 cm). Gleitbewegungen funktionieren flüssig und stocken nur minimal bei langsameren Bewegungen. Das Klick-Feedback ist relativ weich und leiser als auf den meisten anderen Laptops.

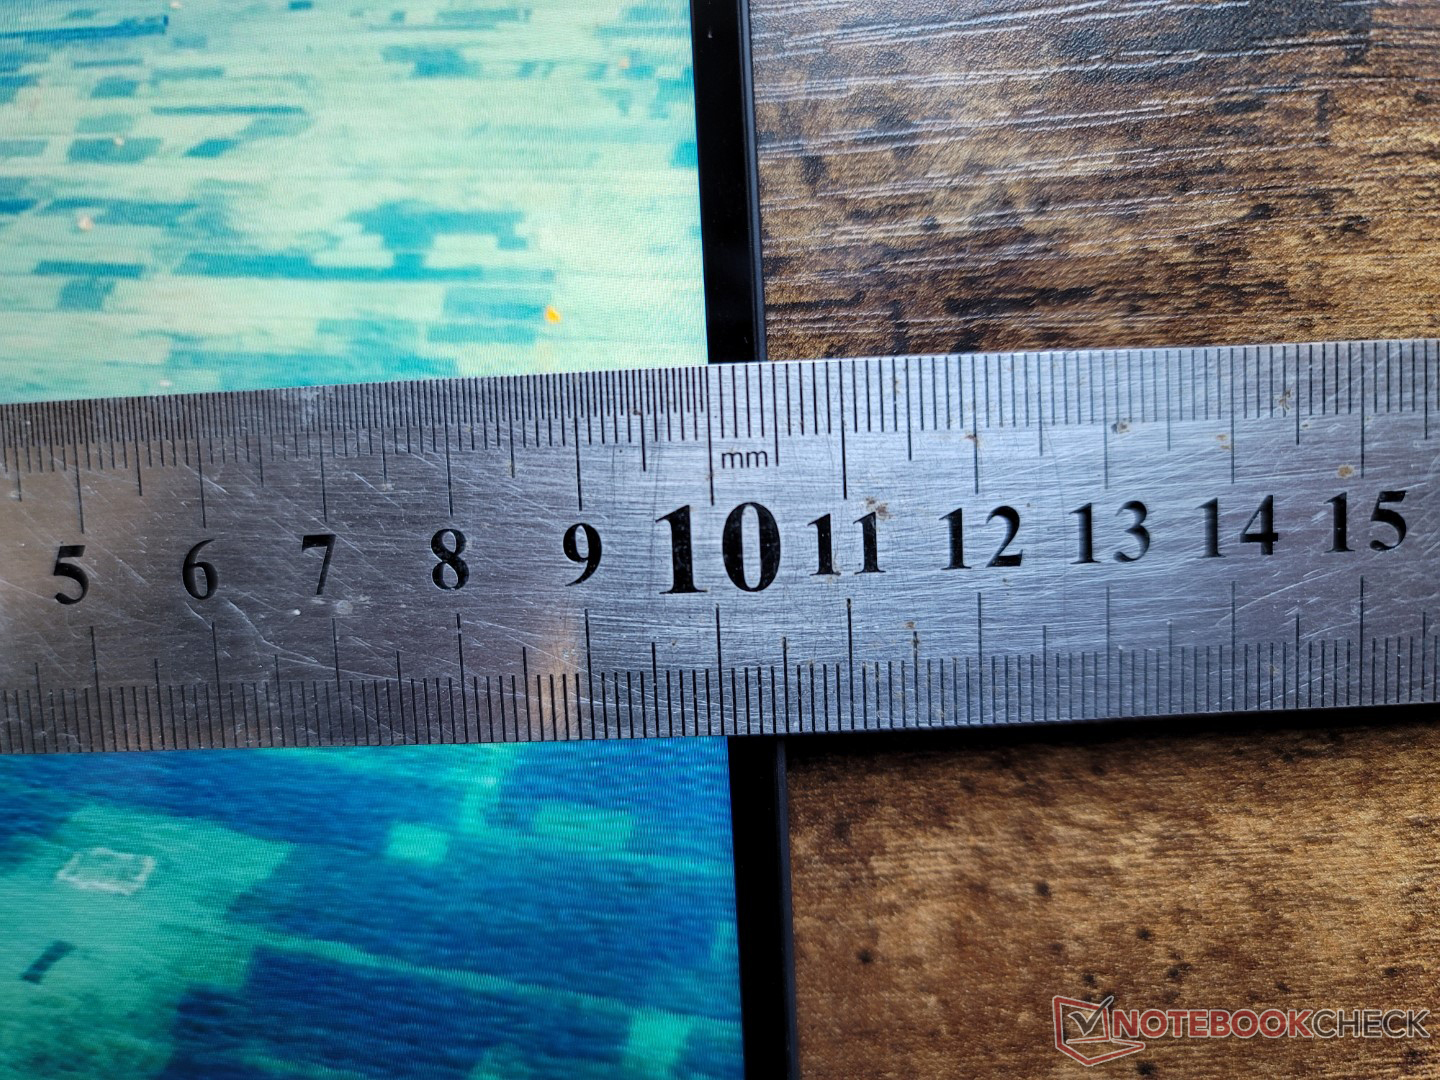
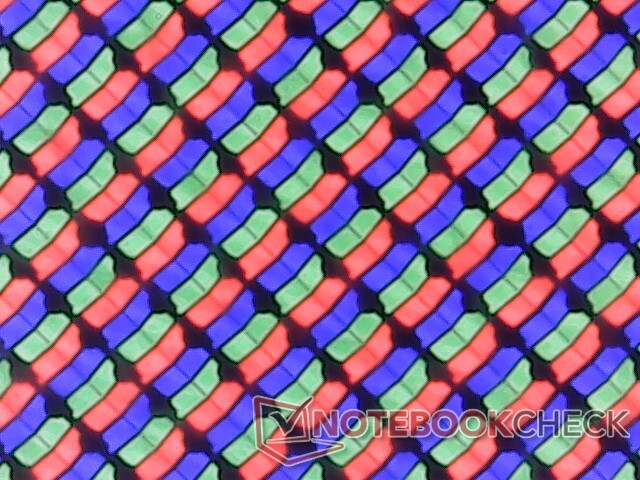
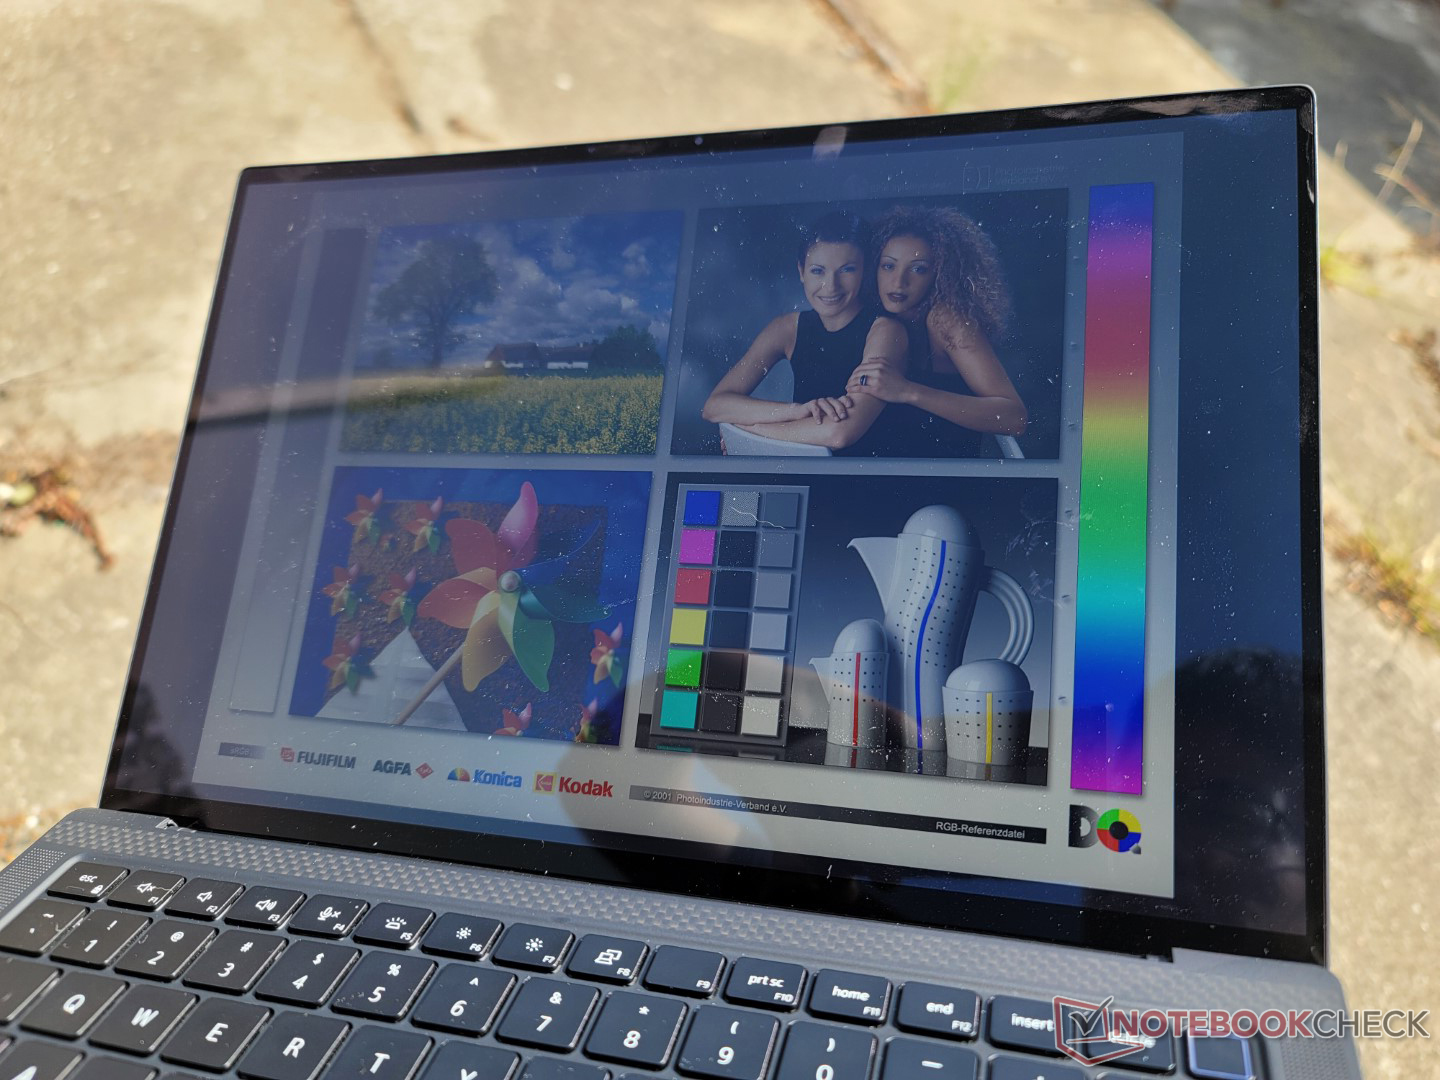
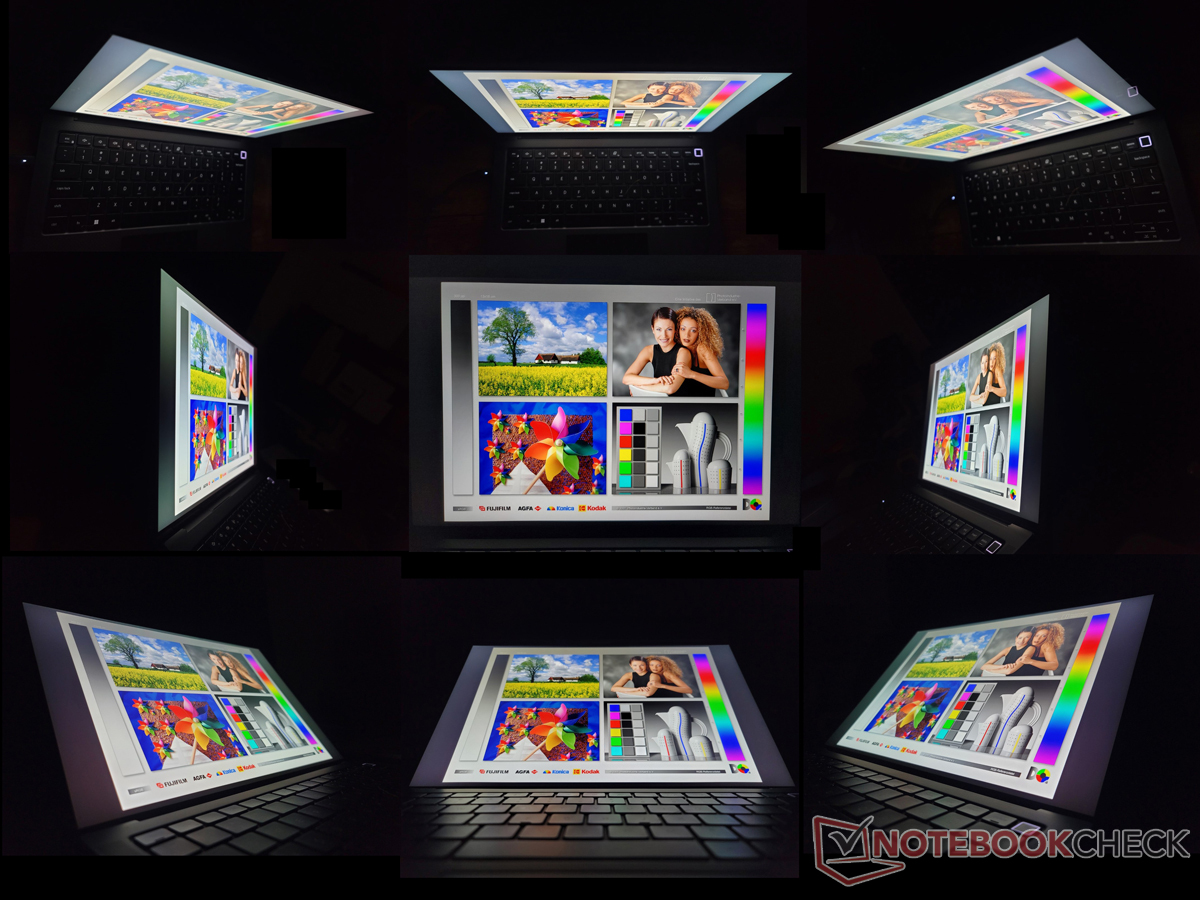
Display — Identisch zum Latitude 9430 2-in-1
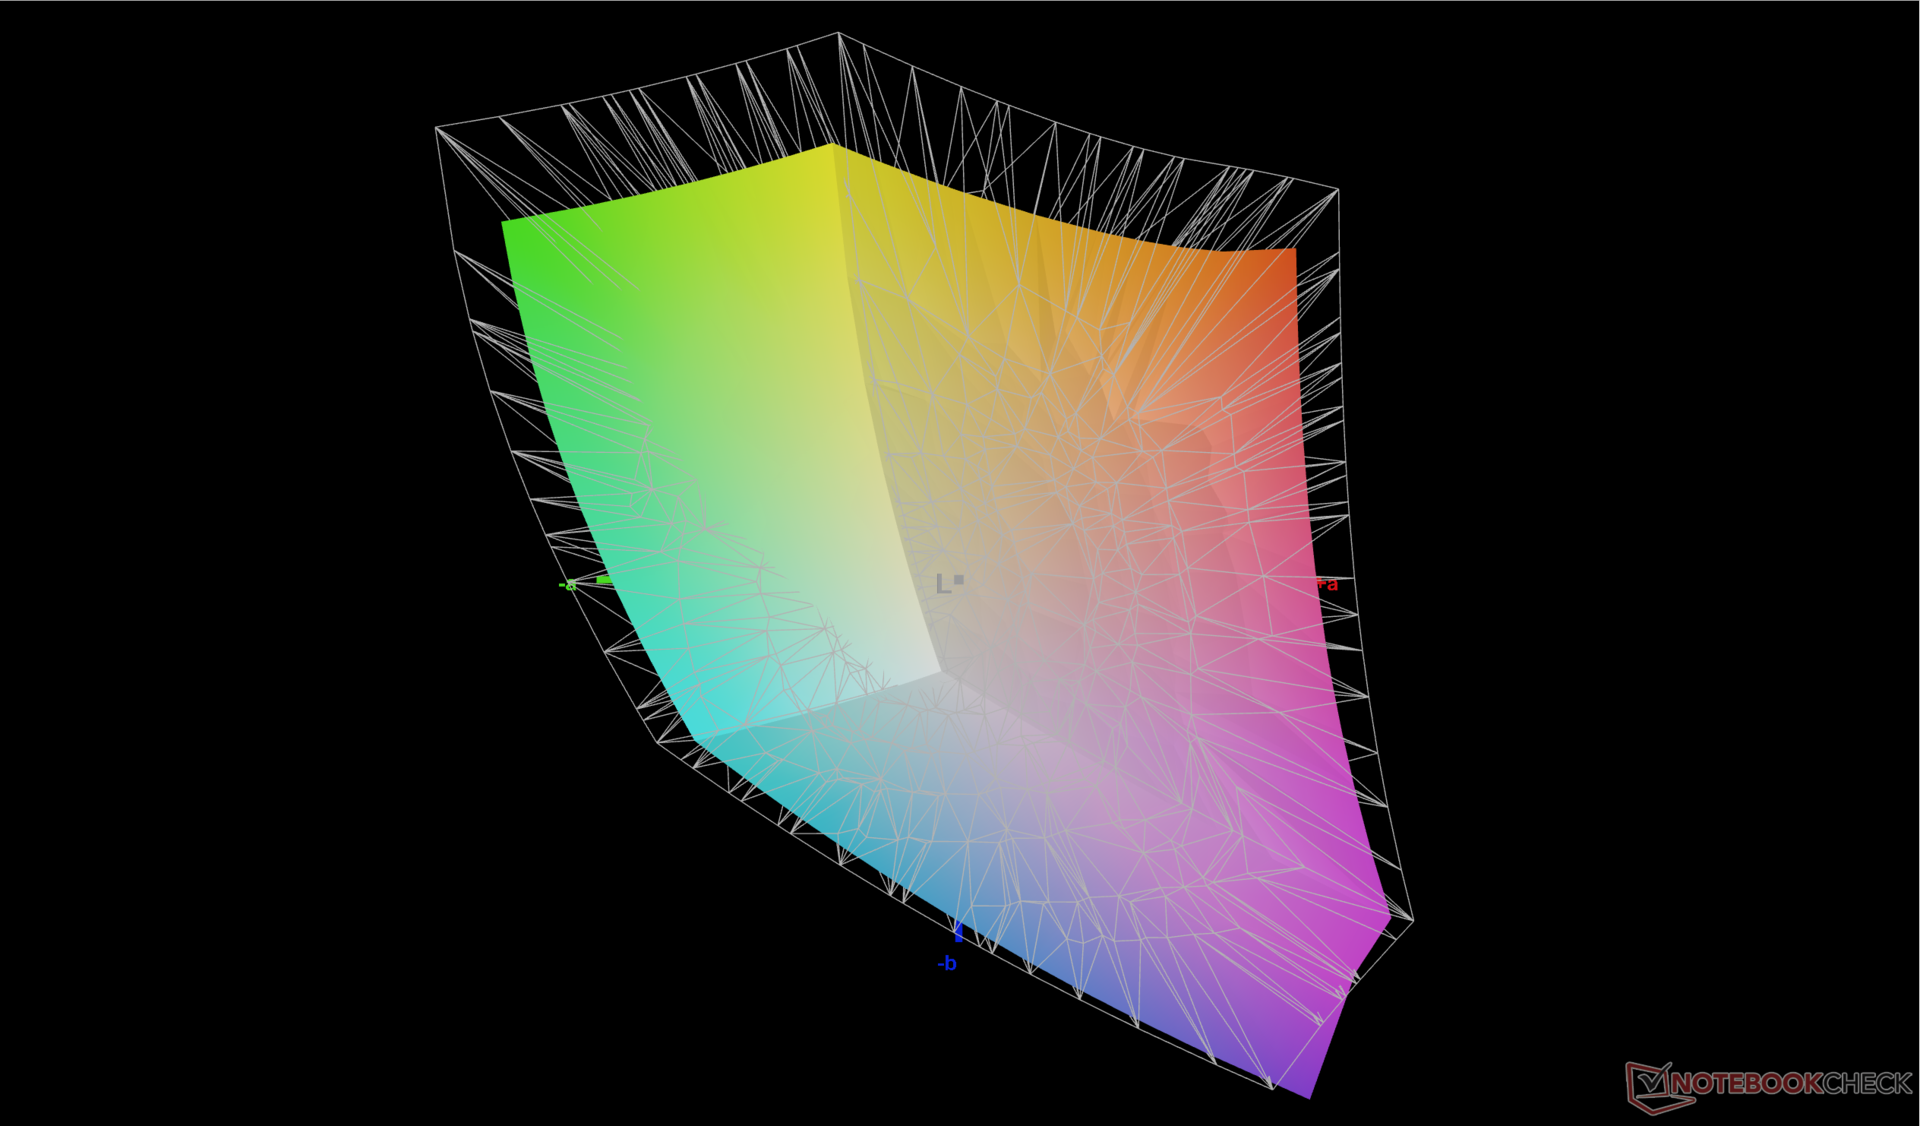
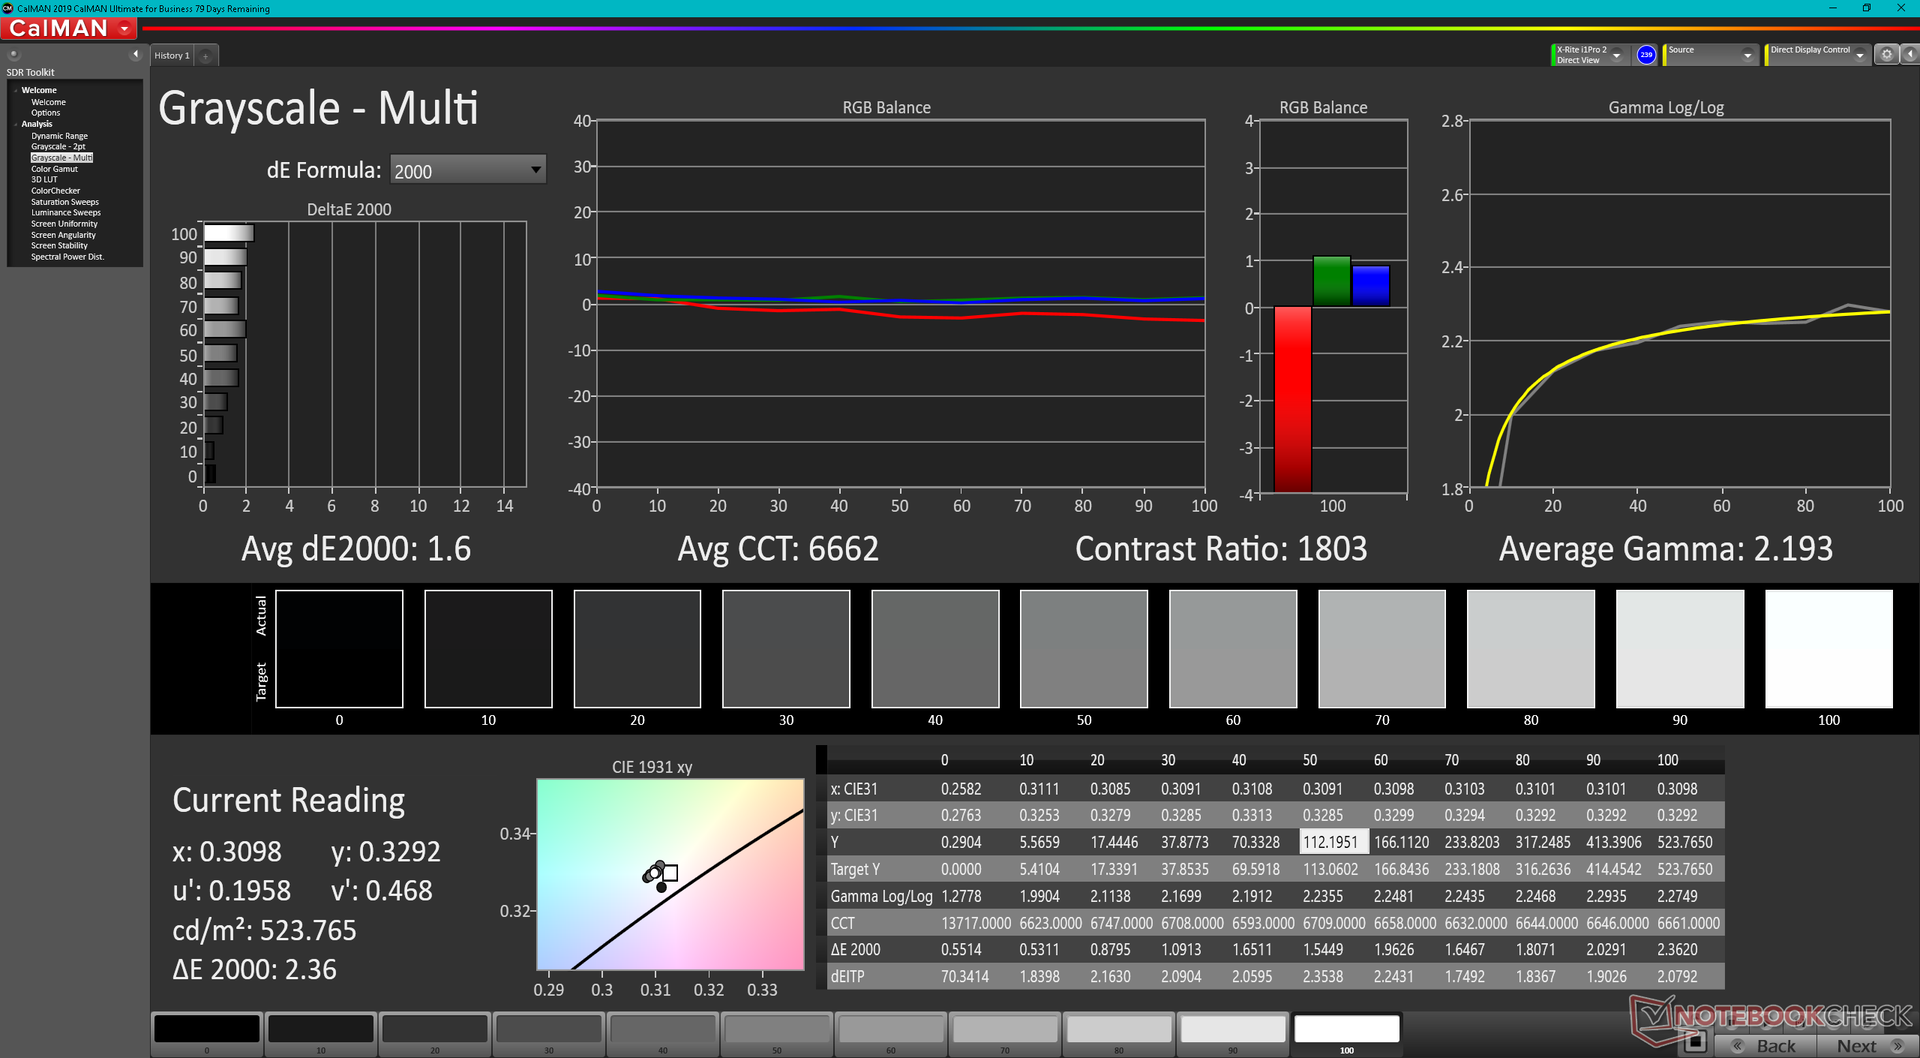
Beim Precision 5470 kommt der gleiche, hochwertige AU-Optronics-B140QAN-IPS-Touchscreen zum Einsatz wie im Latitude 9430 2-in-1. Folglich teilen sich beide Modelle die gleichen Reaktionszeiten, Farbabdeckungen, Kontrastwerte und Helligkeit. Das Display eignet sich somit sehr gut für alle, die eine vollständige sRGB-Abdeckung und gute Schwarzwerte zu schätzen wissen, doch unglücklicherweise leidet das Panel unter wahrnehmbaren Ghosting, was bei Anwendungen und Videos mit schnellen Darstellungen und Bewegungen für Probleme sorgen kann.
Es gibt keine weiteren Displayoptionen, weder in Sachen OLED, höherer AdobeRGB- oder P3-Abdeckung oder höheren Bildwiederholraten. Nutzer sind bei allen Konfigurationen auf IPS und 60 Hz festgelegt.
| |||||||||||||||||||||||||
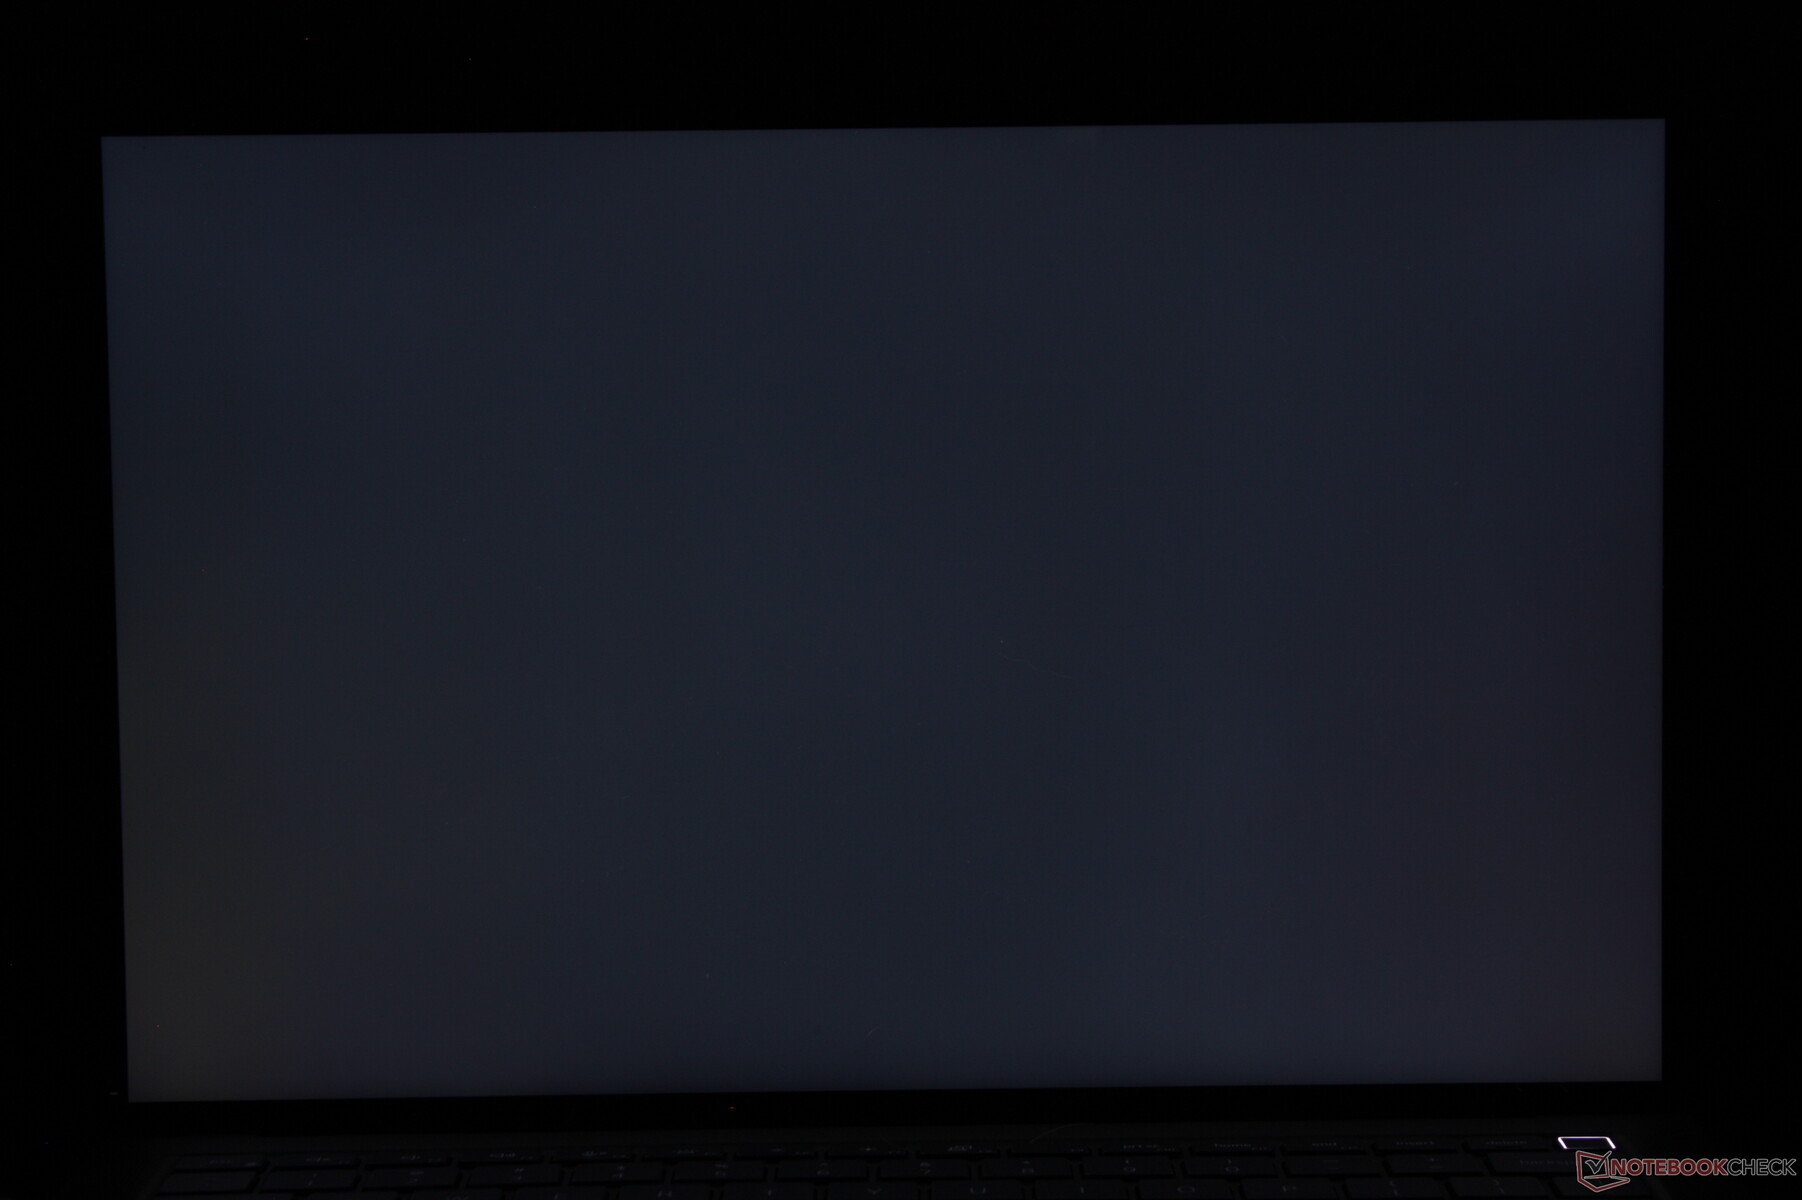
Ausleuchtung: 94 %
Helligkeit Akku: 537 cd/m²
Kontrast: 1627:1 (Schwarzwert: 0.33 cd/m²)
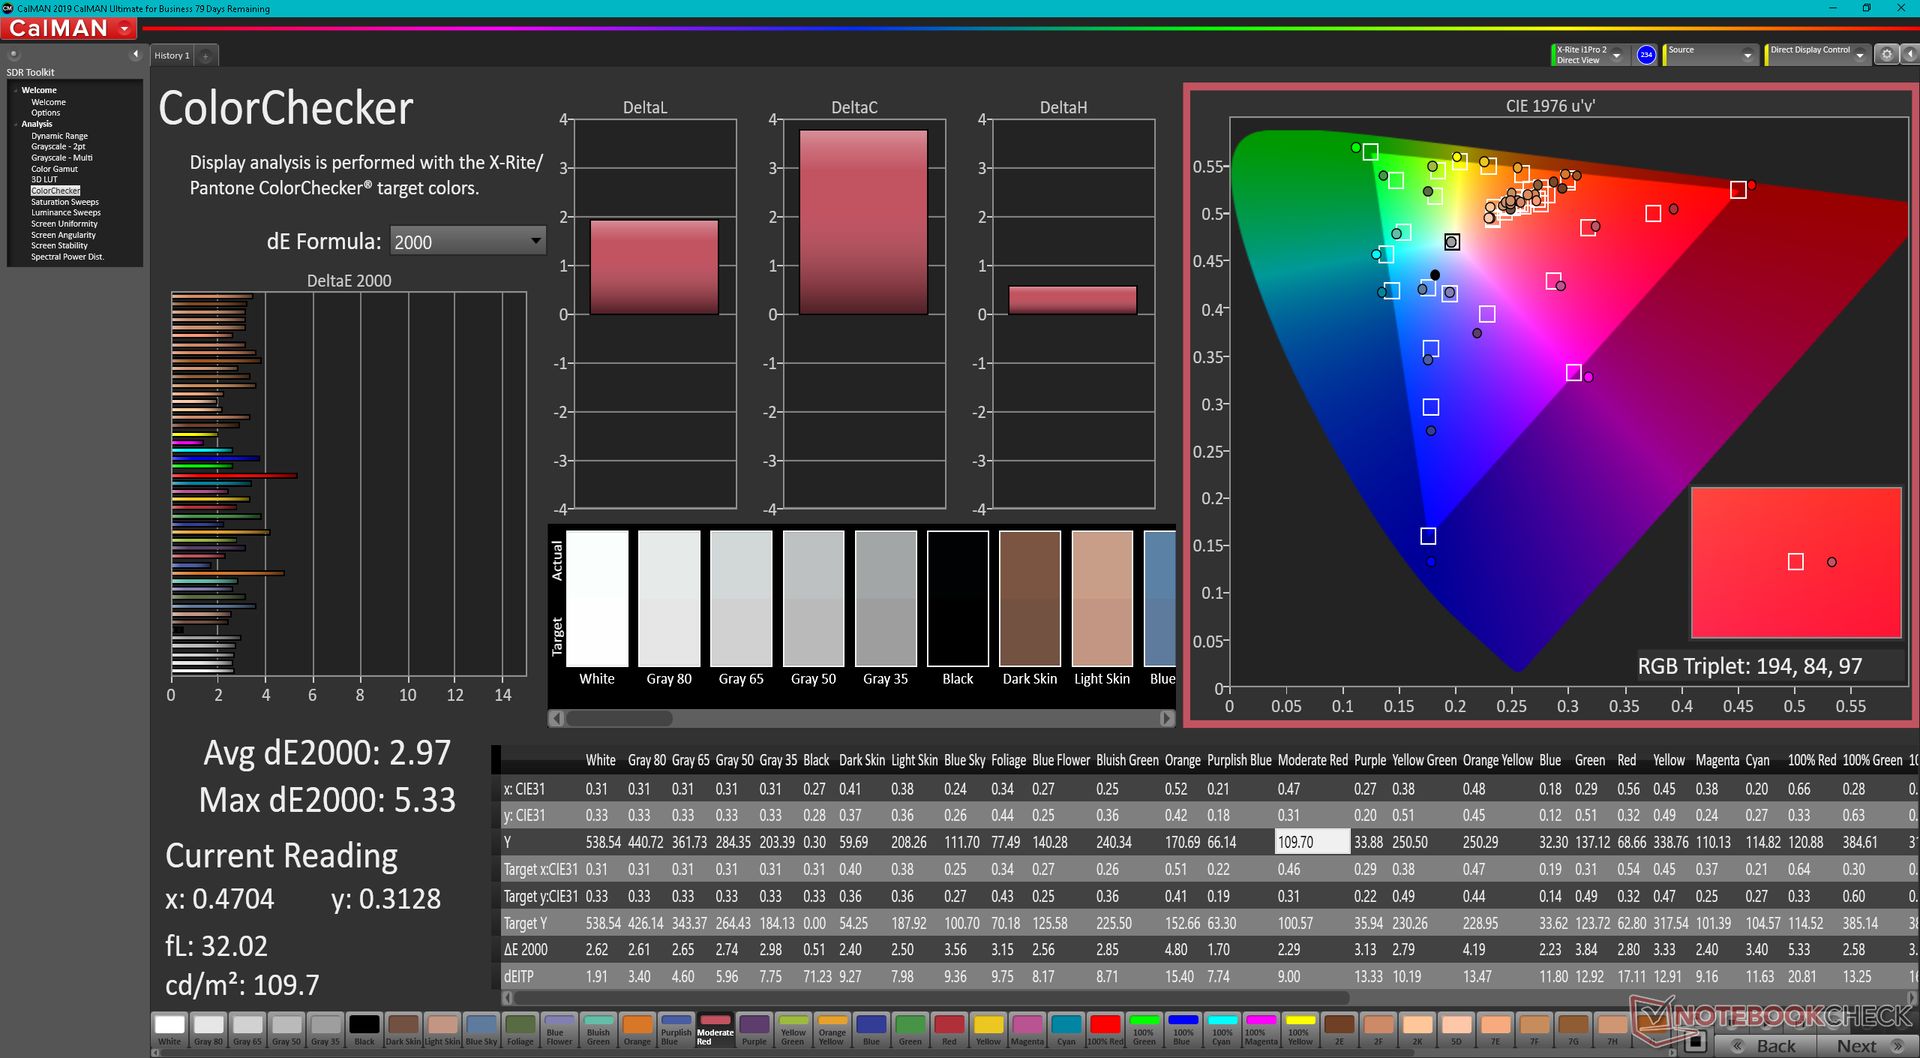
ΔE ColorChecker Calman: 2.97 | ∀{0.5-29.43 Ø4.73}
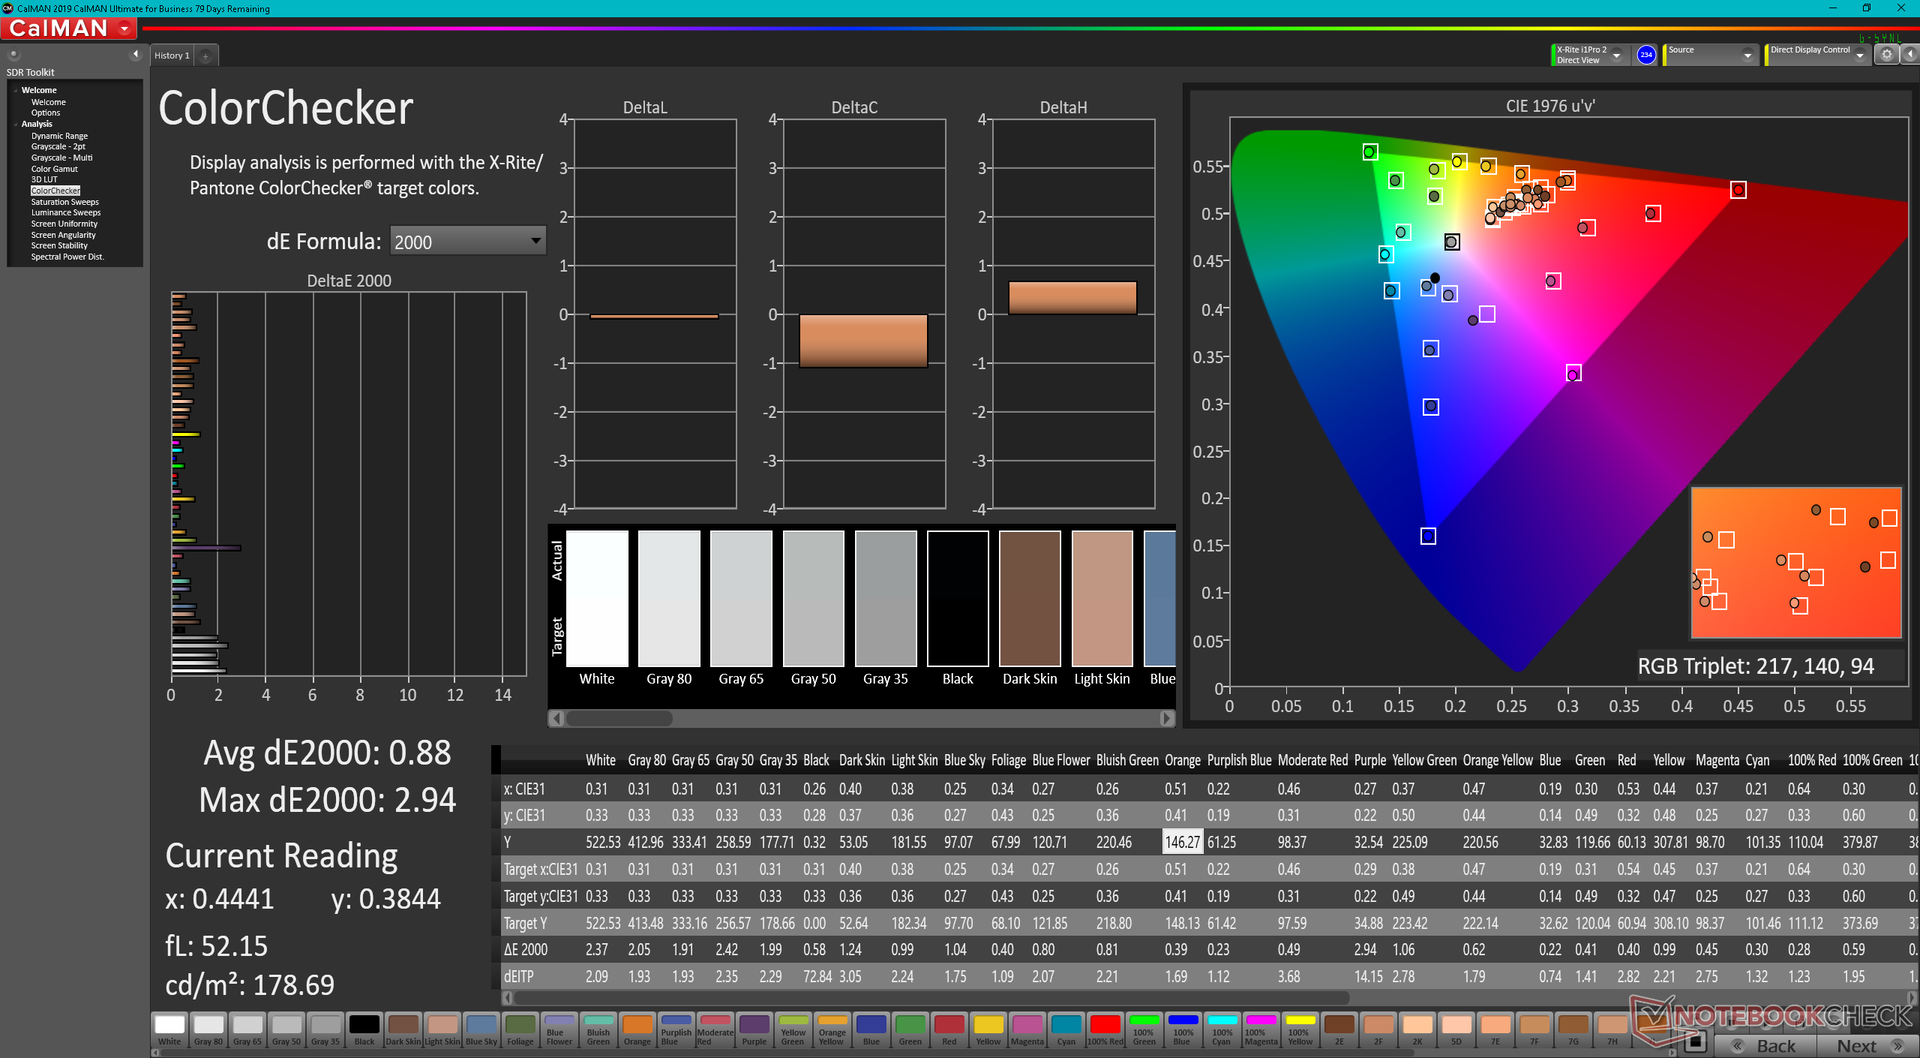
calibrated: 0.88
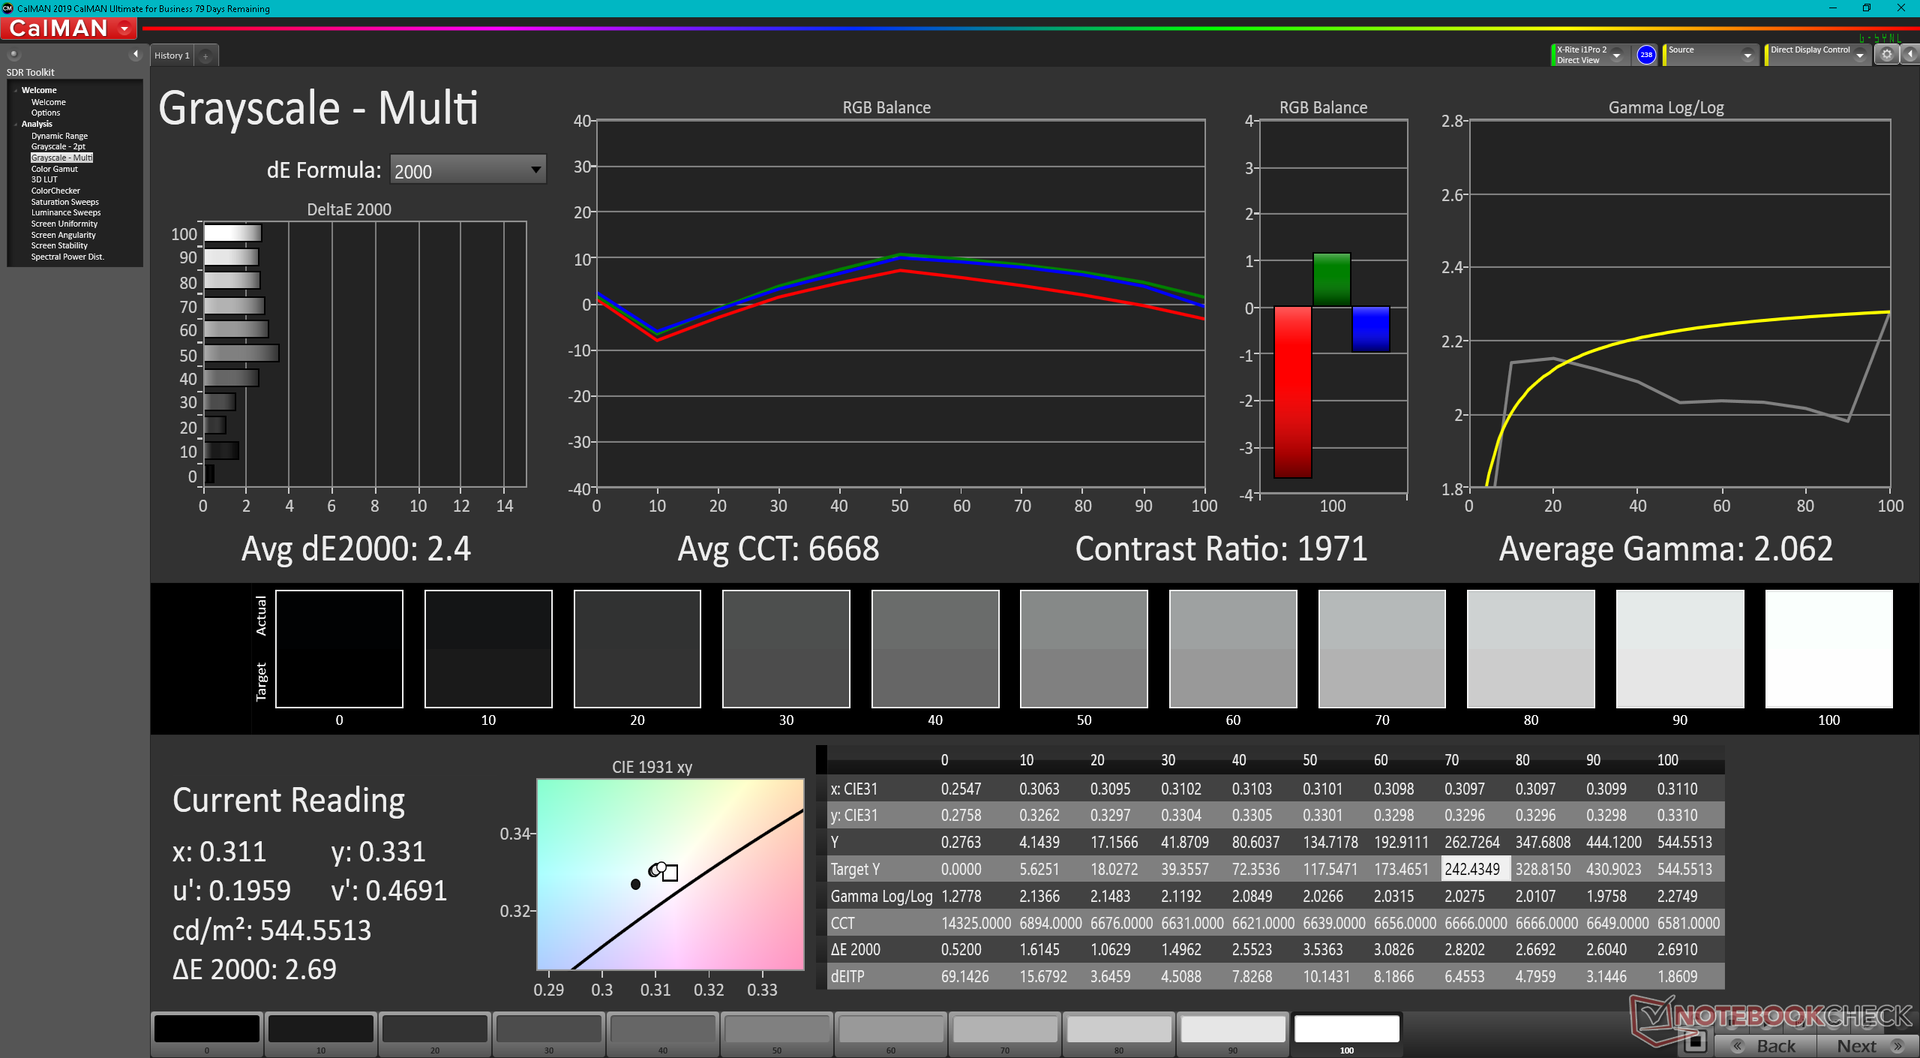
ΔE Greyscale Calman: 2.4 | ∀{0.09-98 Ø4.97}
78.7% AdobeRGB 1998 (Argyll 3D)
100% sRGB (Argyll 3D)
79.3% Display P3 (Argyll 3D)
Gamma: 2.06
CCT: 6668 K
| Dell Precision 5000 5470 AU Optronics B140QAN, IPS, 2560x1600, 14" | Lenovo ThinkPad P15v G2 21A9000XGE N156HCA-EAC, IPS LED, 1920x1080, 15.6" | Dell Precision 5000 5560 Sharp LQ156R1, IPS, 3840x2400, 15.6" | Lenovo ThinkPad P14s G2 AMD MNE001EA1-5, IPS LED, 3840x2160, 14" | HP ZBook Firefly 14 G8 2C9Q2EA AU Optronics AUO068B, IPS, 1920x1080, 14" | HP ZBook Firefly 14 G7 InfoVision IVO8C78 (X140NVFC R0), IPS, 1920x1080, 14" | |
|---|---|---|---|---|---|---|
| Display | -41% | 16% | 10% | -7% | -4% | |
| Display P3 Coverage (%) | 79.3 | 43.7 -45% | 94.9 20% | 96.8 22% | 70 -12% | 73.8 -7% |
| sRGB Coverage (%) | 100 | 65.1 -35% | 100 0% | 99.9 0% | 99.5 0% | 99 -1% |
| AdobeRGB 1998 Coverage (%) | 78.7 | 45.3 -42% | 100 27% | 85.8 9% | 71.4 -9% | 75.5 -4% |
| Response Times | 11% | 8% | 8% | -7% | -19% | |
| Response Time Grey 50% / Grey 80% * (ms) | 52.4 ? | 48 ? 8% | 47.2 ? 10% | 52 ? 1% | 64.4 ? -23% | 54.8 ? -5% |
| Response Time Black / White * (ms) | 32.4 ? | 28 ? 14% | 30.4 ? 6% | 28 ? 14% | 29.2 ? 10% | 43.2 ? -33% |
| PWM Frequency (Hz) | 284.1 ? | |||||
| Bildschirm | -116% | -24% | -19% | -10% | -27% | |
| Helligkeit Bildmitte (cd/m²) | 537 | 305 -43% | 501.5 -7% | 512 -5% | 461 -14% | 934 74% |
| Brightness (cd/m²) | 518 | 281 -46% | 467 -10% | 487 -6% | 439 -15% | 937 81% |
| Brightness Distribution (%) | 94 | 88 -6% | 83 -12% | 90 -4% | 89 -5% | 87 -7% |
| Schwarzwert * (cd/m²) | 0.33 | 0.32 3% | 0.44 -33% | 0.35 -6% | 0.24 27% | 0.37 -12% |
| Kontrast (:1) | 1627 | 953 -41% | 1140 -30% | 1463 -10% | 1921 18% | 2524 55% |
| Delta E Colorchecker * | 2.97 | 5.9 -99% | 4.73 -59% | 3.1 -4% | 2.6 12% | 4.7 -58% |
| Colorchecker dE 2000 max. * | 5.33 | 20.1 -277% | 8.45 -59% | 8.4 -58% | 5.8 -9% | 10.5 -97% |
| Colorchecker dE 2000 calibrated * | 0.88 | 4.5 -411% | 0.51 42% | 0.4 55% | 1.1 -25% | 1.6 -82% |
| Delta E Graustufen * | 2.4 | 5.3 -121% | 3.6 -50% | 5.5 -129% | 4.4 -83% | 7.1 -196% |
| Gamma | 2.06 107% | 2.1 105% | 2.08 106% | 2.22 99% | 2.29 96% | 2.31 95% |
| CCT | 6668 97% | 6307 103% | 6447 101% | 6373 102% | 6478 100% | 6348 102% |
| Farbraum (Prozent von AdobeRGB 1998) (%) | 65.2 | 68.5 | ||||
| Color Space (Percent of sRGB) (%) | 99.4 | 98.9 | ||||
| Durchschnitt gesamt (Programm / Settings) | -49% /
-82% | 0% /
-11% | -0% /
-9% | -8% /
-9% | -17% /
-21% |
* ... kleinere Werte sind besser
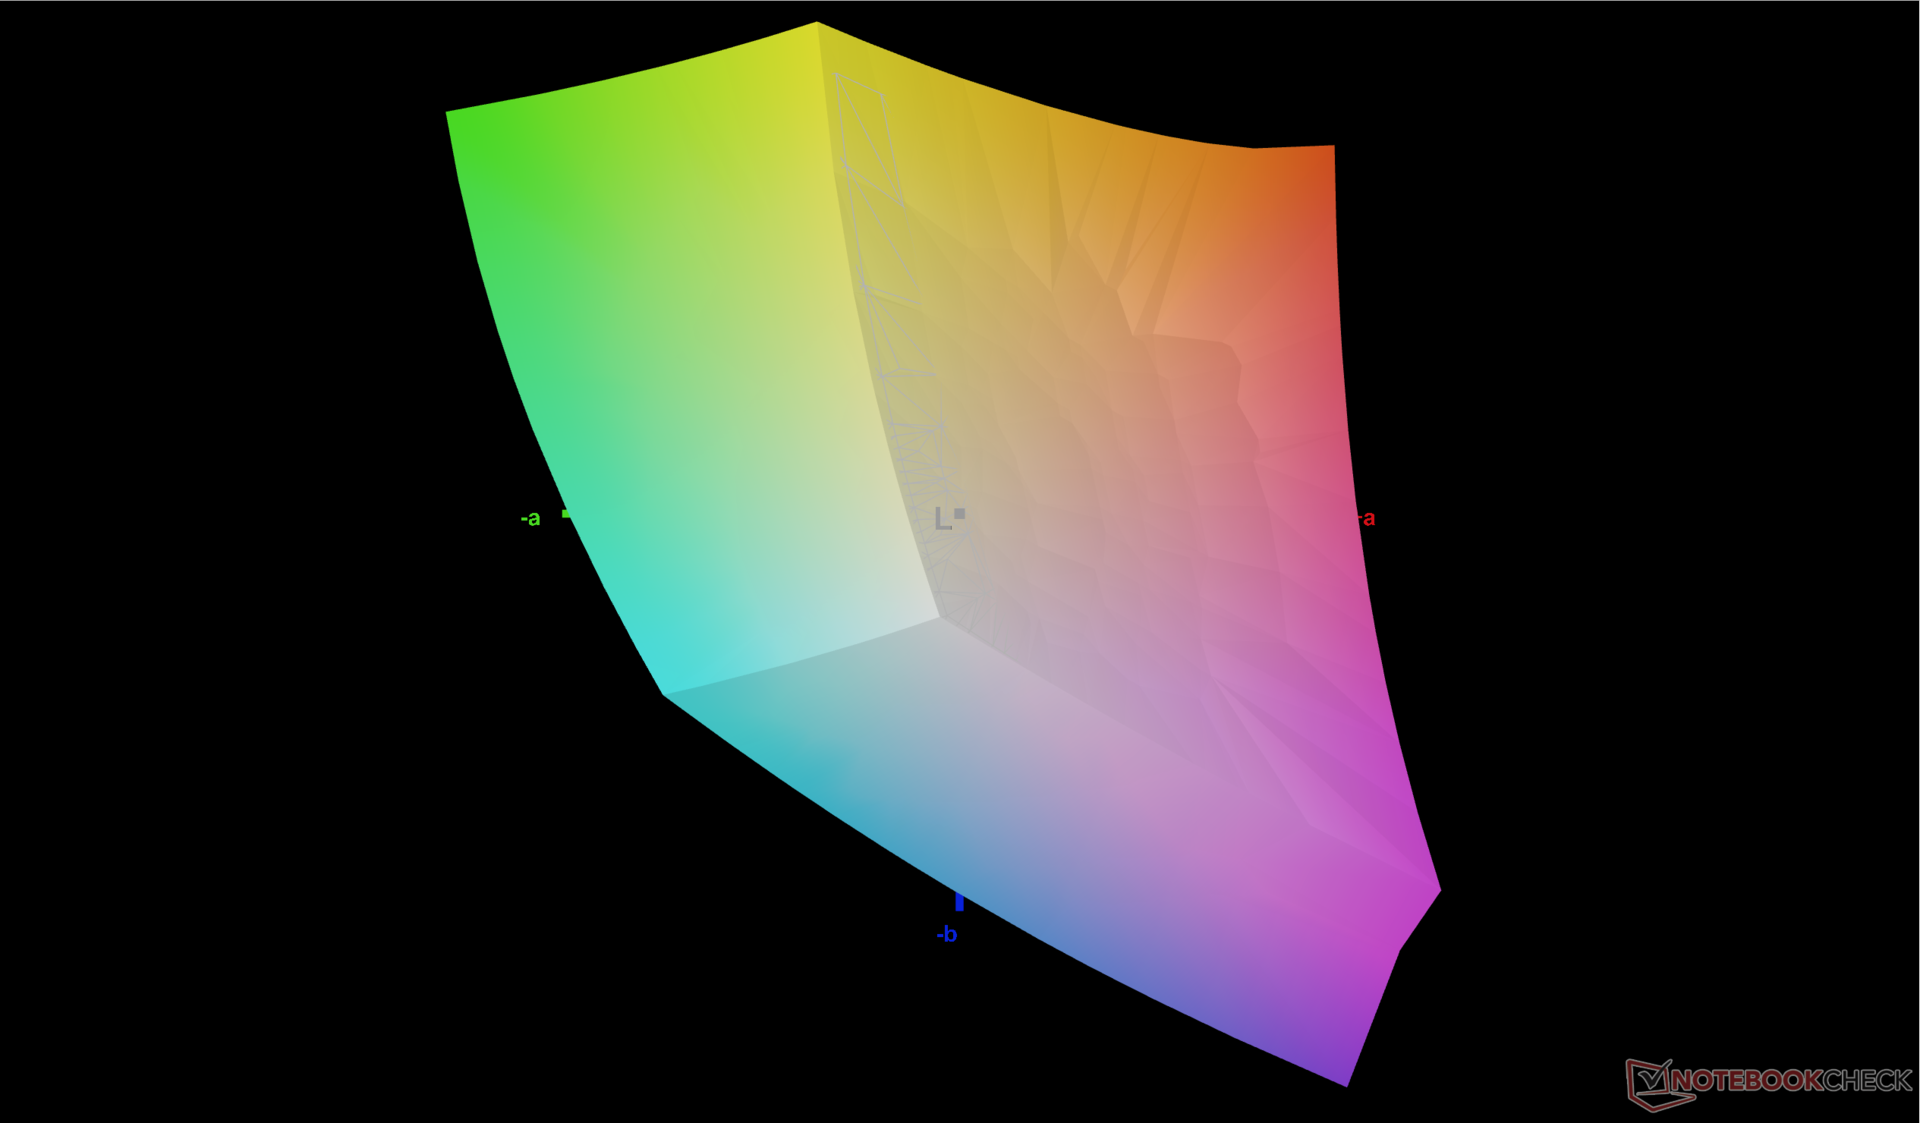
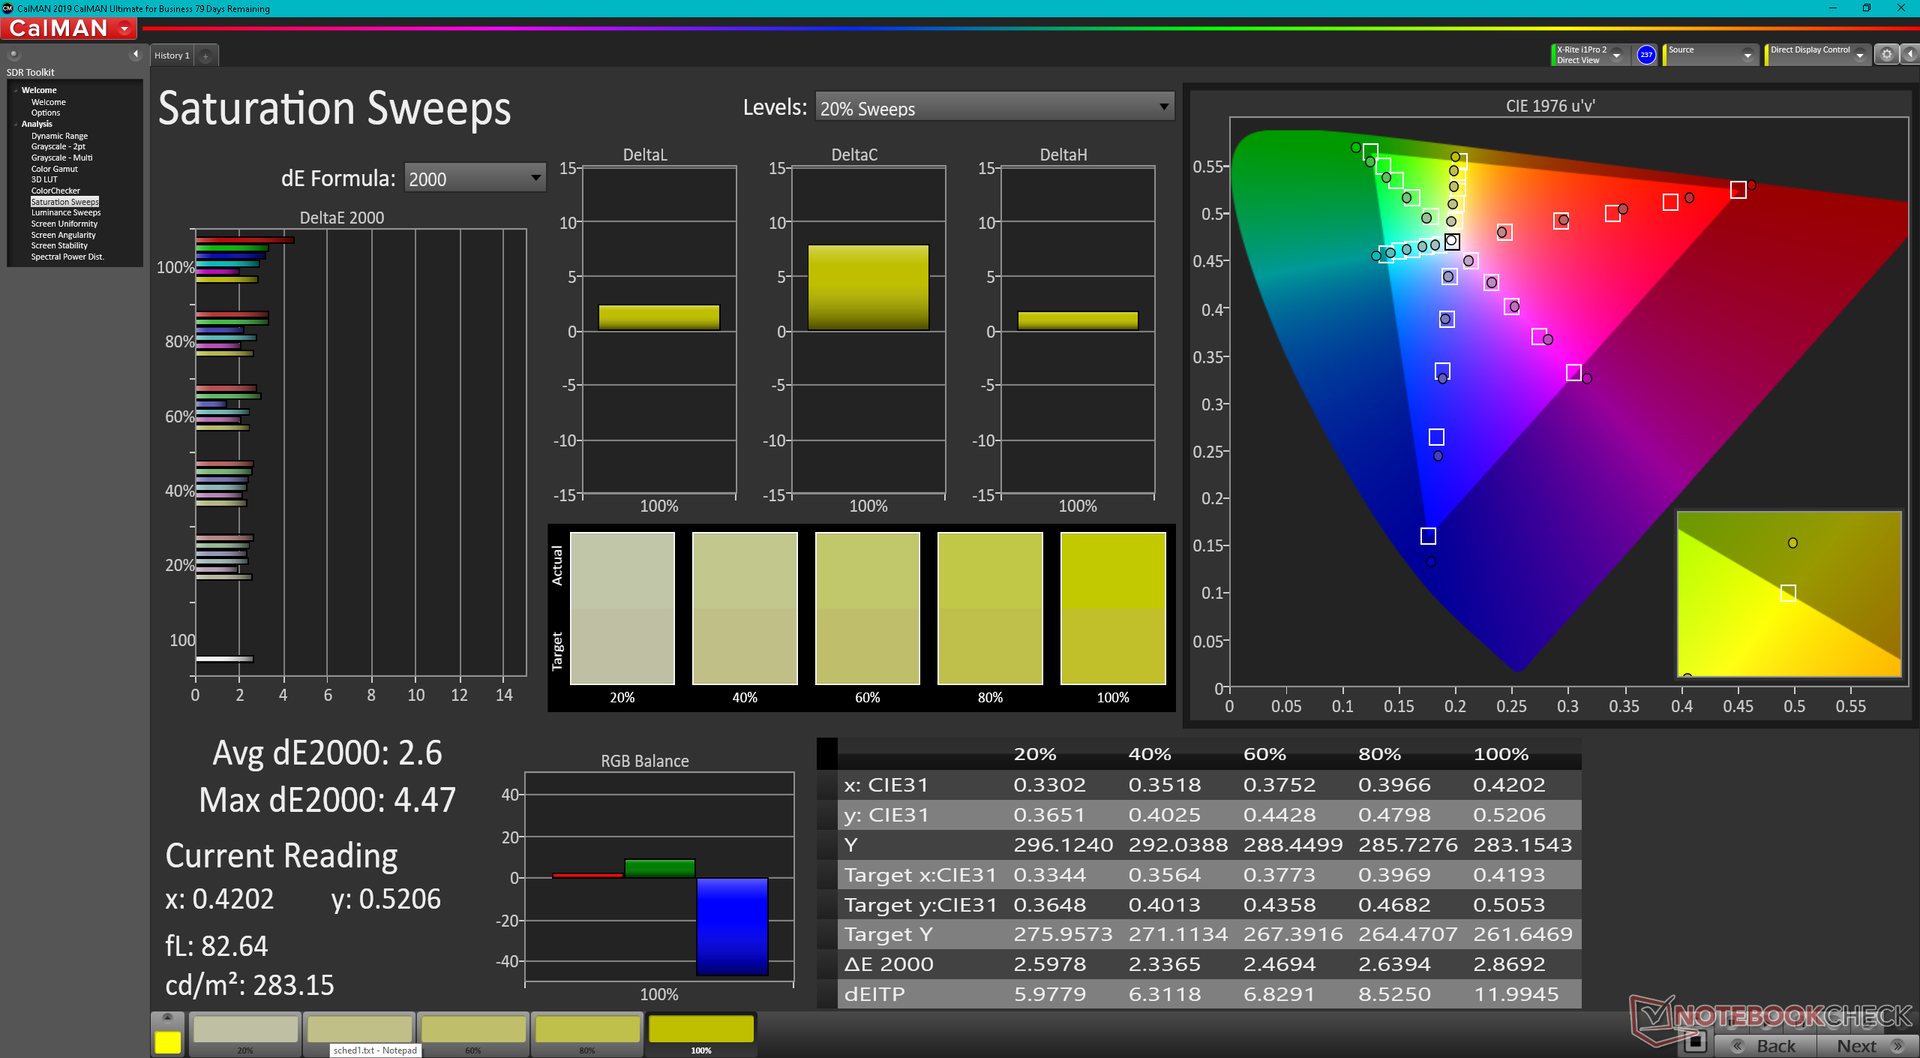
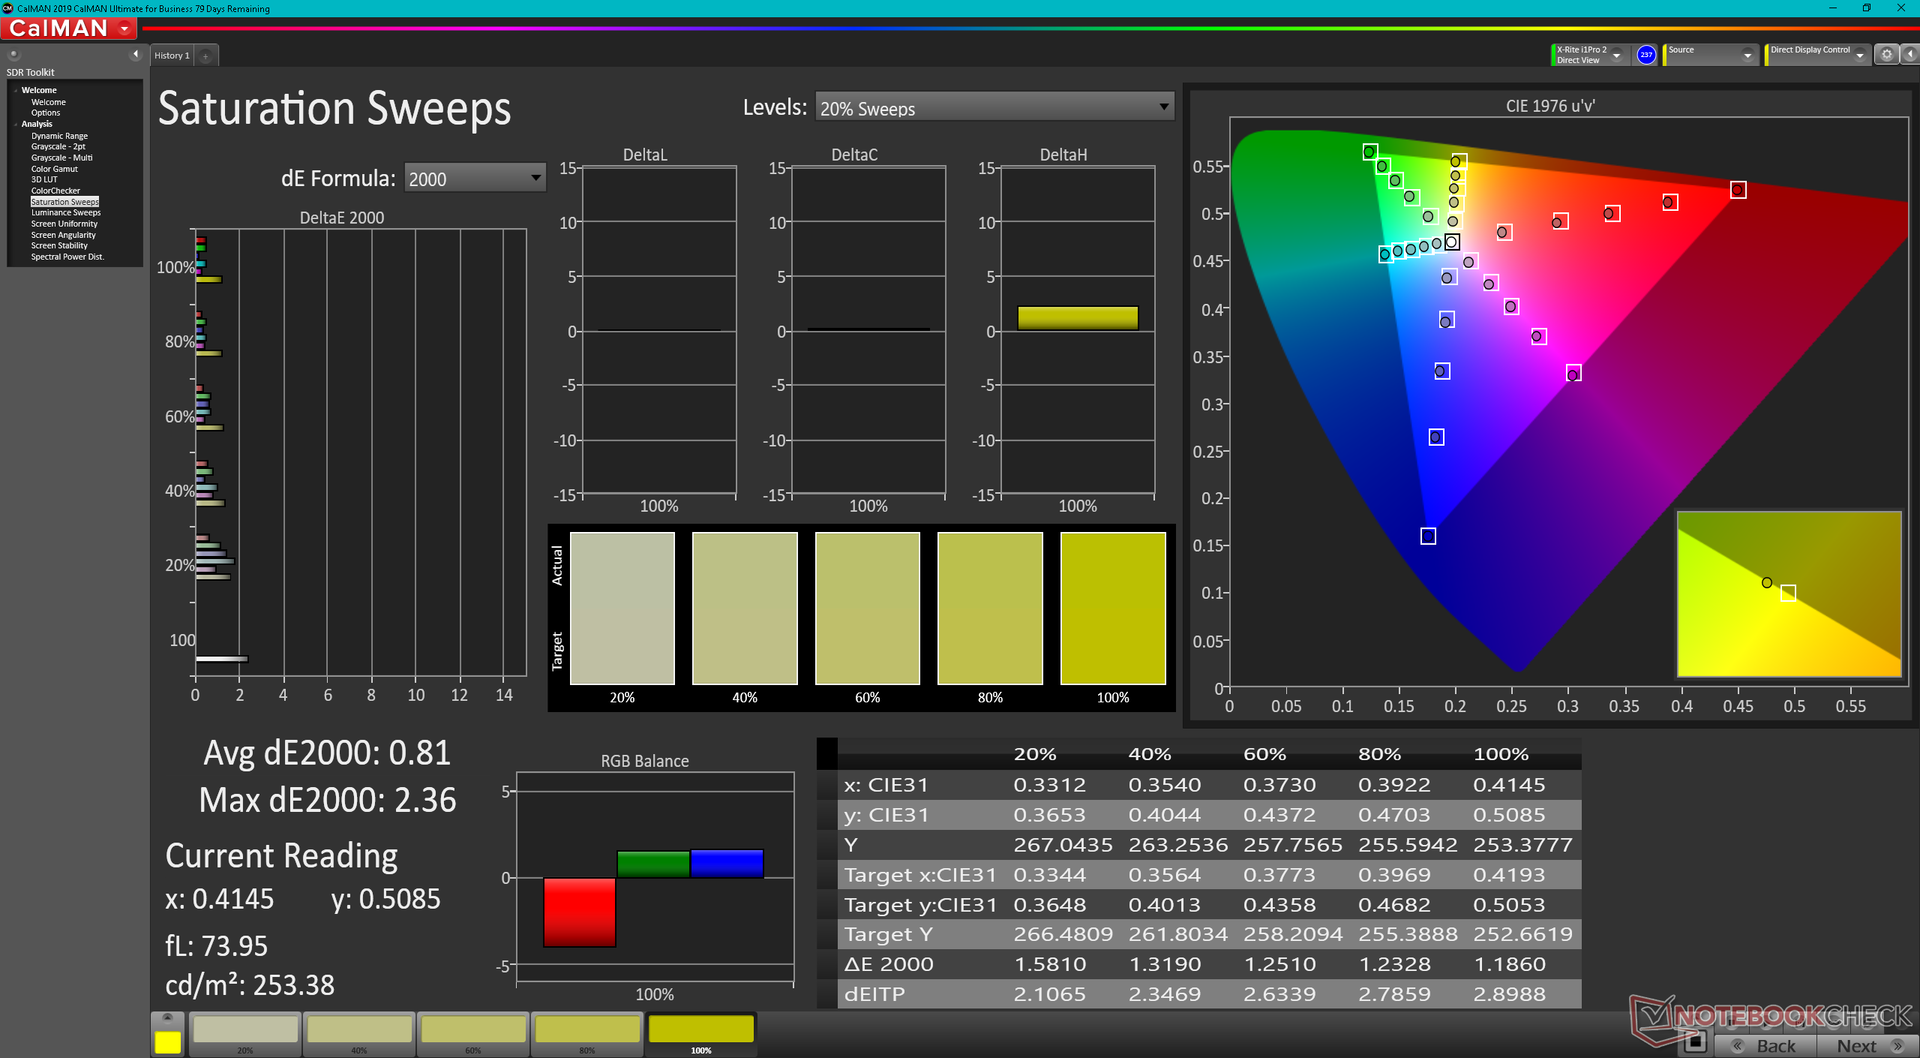
Bereits ab Werk ist das Display gut im sRGB-Farbraum kalibriert, die durchschnittlichen DeltaE-Werte der Graustufen und Farben betragen nur 2,4 und 2,97. Mit unserem X-Rite-Farbmessgerät konnten wir die Werte nochmals auf jeweils <2 drücken, wie unserer CalMan-Ergebnisse unten zeigen.
Reaktionszeiten (Response Times) des Displays
| ↔ Reaktionszeiten Schwarz zu Weiß | ||
|---|---|---|
| 32.4 ms ... steigend ↗ und fallend ↘ kombiniert | ↗ 15.6 ms steigend | 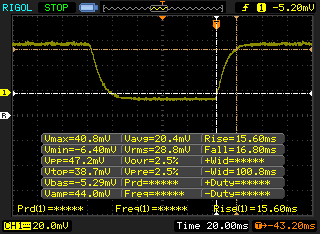 |
| ↘ 16.8 ms fallend | ||
| Die gemessenen Reaktionszeiten sind langsam und dadurch für viele Spieler wahrscheinlich zu langsam. Im Vergleich rangierten die bei uns getesteten Geräte von 0.1 (Minimum) zu 240 (Maximum) ms. » 88 % aller Screens waren schneller als der getestete. Daher sind die gemessenen Reaktionszeiten schlechter als der Durchschnitt aller vermessenen Geräte (19.9 ms). | ||
| ↔ Reaktionszeiten 50% Grau zu 80% Grau | ||
| 52.4 ms ... steigend ↗ und fallend ↘ kombiniert | ↗ 24.4 ms steigend | 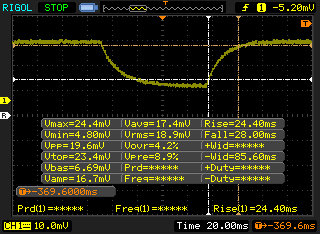 |
| ↘ 28 ms fallend | ||
| Die gemessenen Reaktionszeiten sind langsam und dadurch für viele Spieler wahrscheinlich zu langsam. Im Vergleich rangierten die bei uns getesteten Geräte von 0.165 (Minimum) zu 636 (Maximum) ms. » 89 % aller Screens waren schneller als der getestete. Daher sind die gemessenen Reaktionszeiten schlechter als der Durchschnitt aller vermessenen Geräte (31.1 ms). | ||
Bildschirm-Flackern / PWM (Pulse-Width Modulation)
| Flackern / PWM nicht festgestellt | 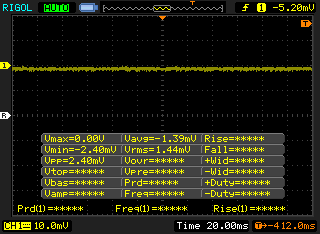 | ||
Im Vergleich: 52 % aller getesteten Geräte nutzten kein PWM um die Helligkeit zu reduzieren. Wenn PWM eingesetzt wurde, dann bei einer Frequenz von durchschnittlich 7794 (Minimum 5, Maximum 343500) Hz. | |||
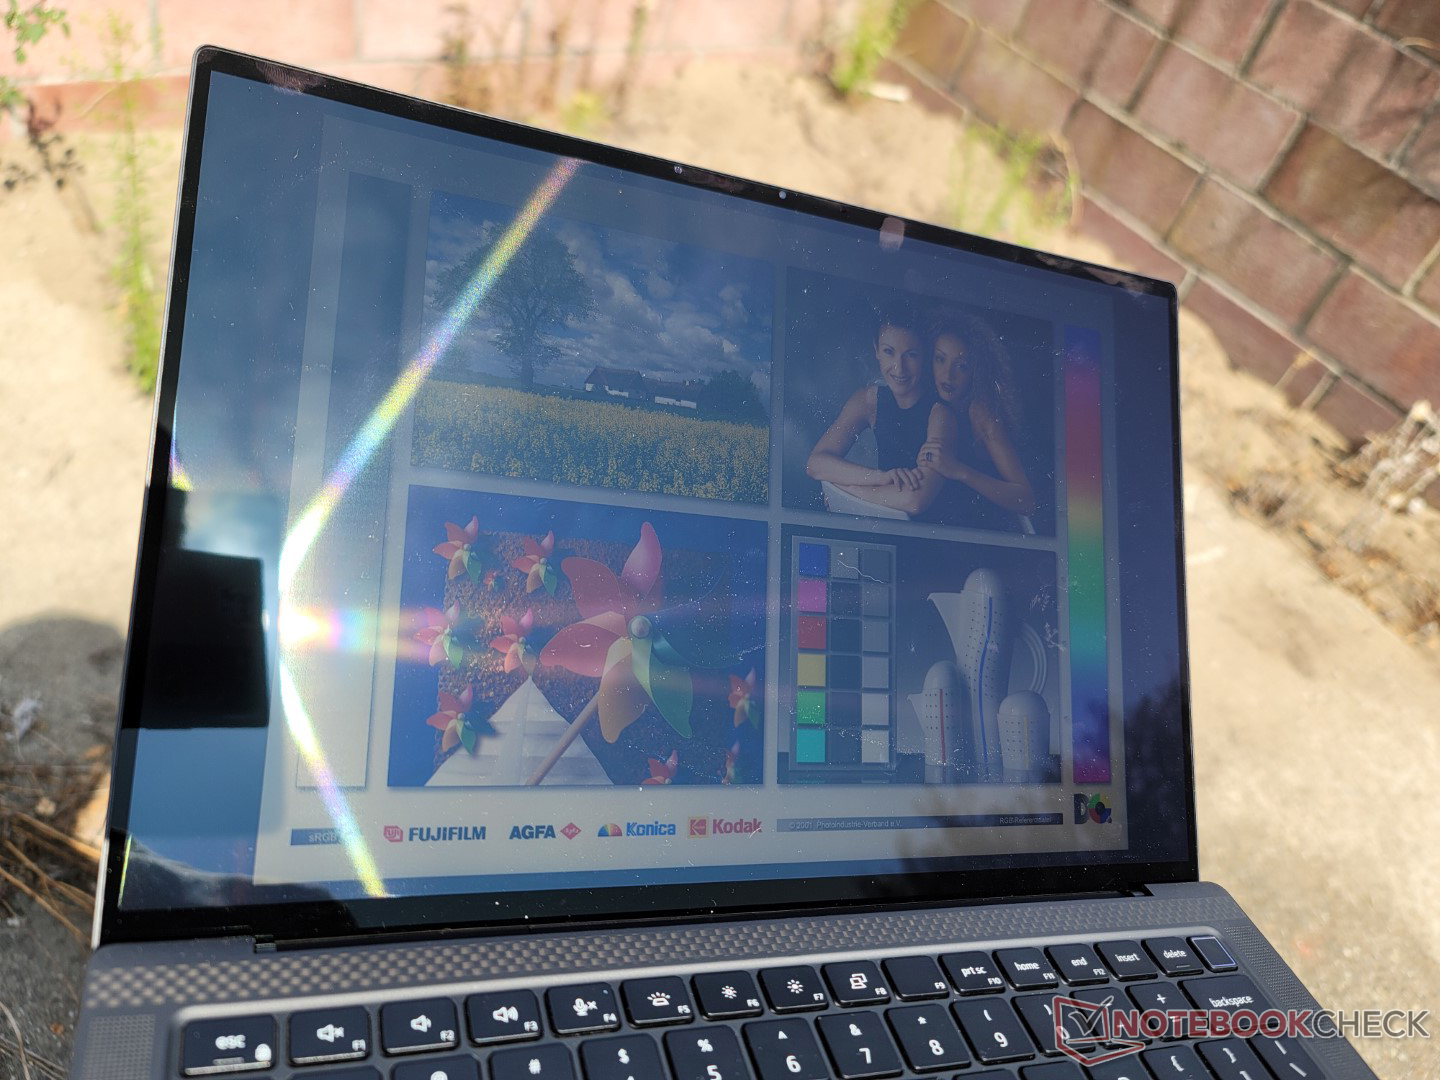
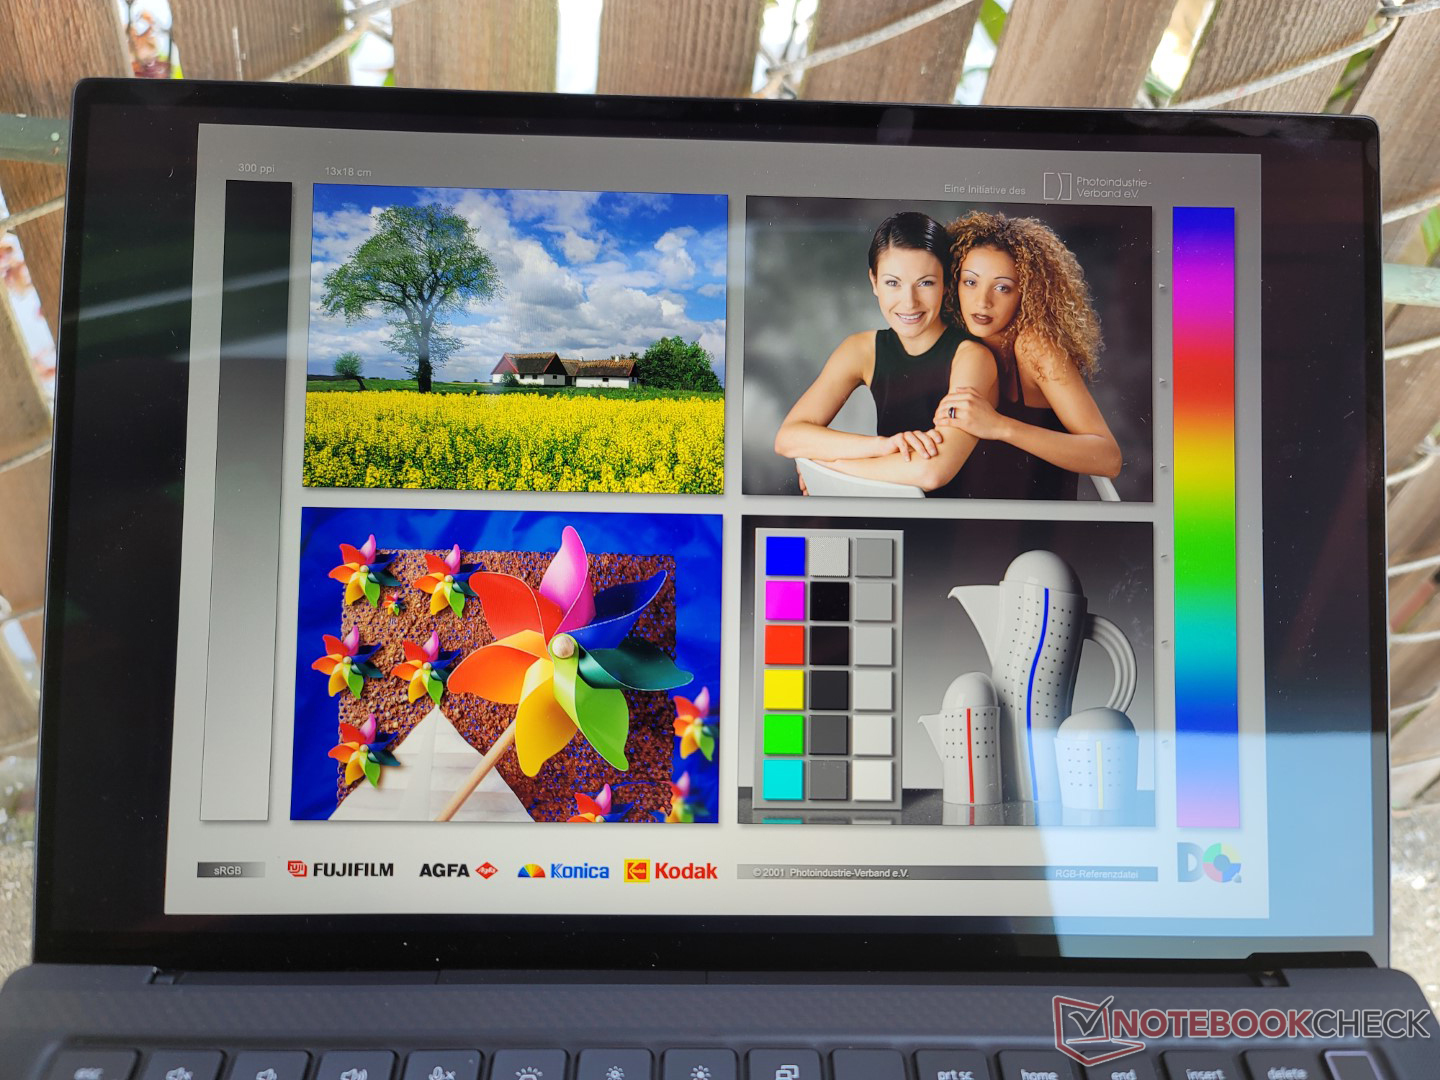
Für eine gute Sichtbarkeit im Freien sorgt das Display selbst, immerhin ist es heller als viele Consumer-Ultrabooks. Allerdings bieten viele HP-EliteBook- oder ZBook-Modelle Panel-Optionen mit 1.000 Nits für nochmals spürbar mehr Außennutzbarkeit an. Dell muss derartige Optionen erst noch für die Precision-Serie anbieten.
Leistung — Core i9 H und dedizierte GPU
Testbedingungen
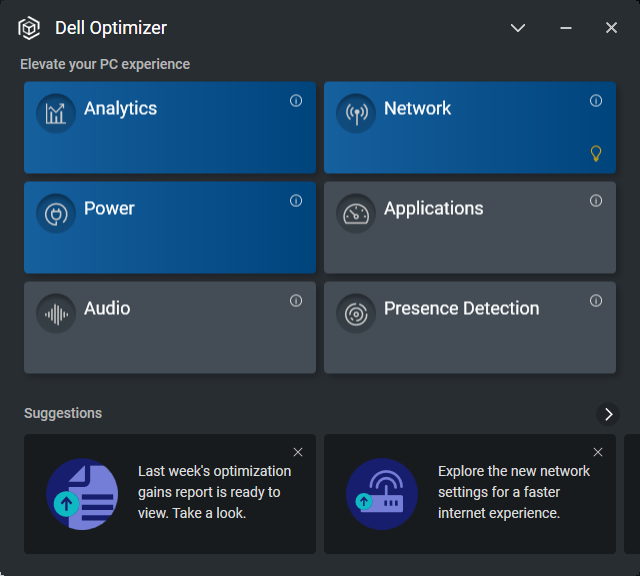
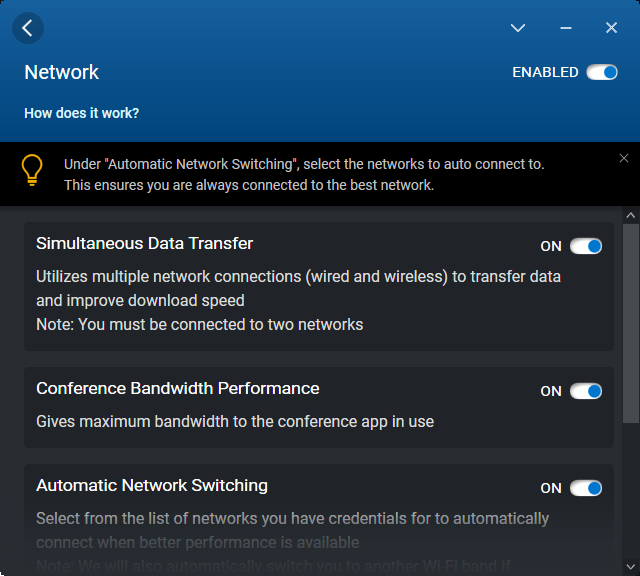
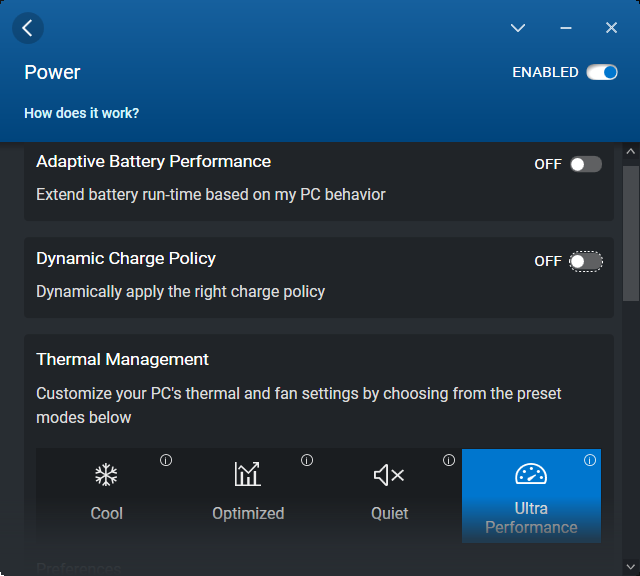
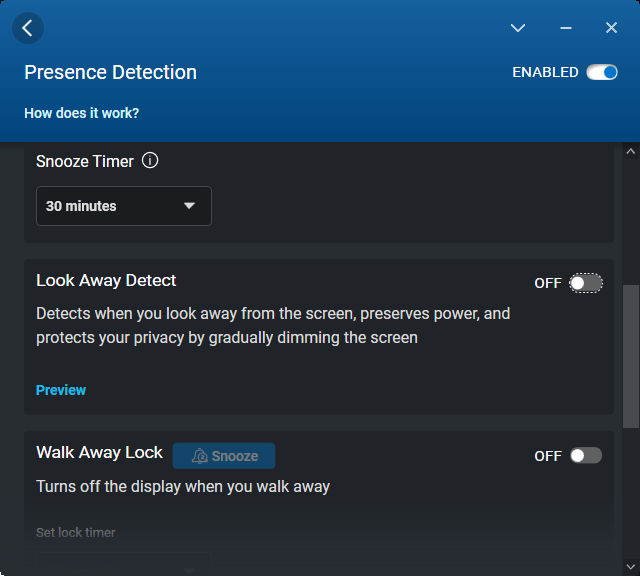
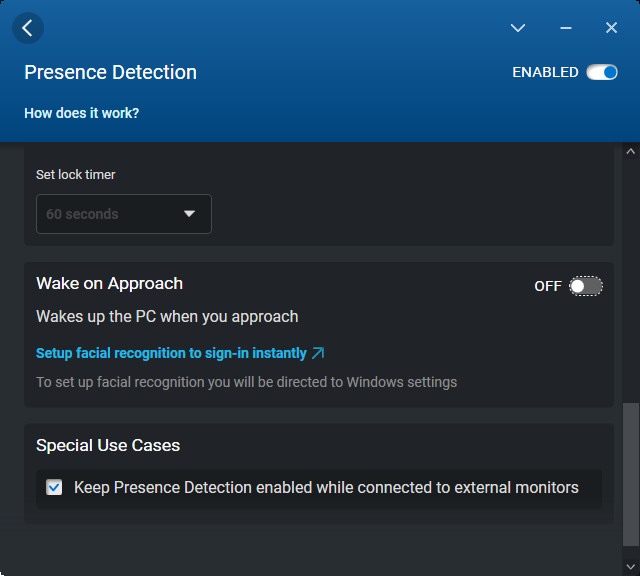
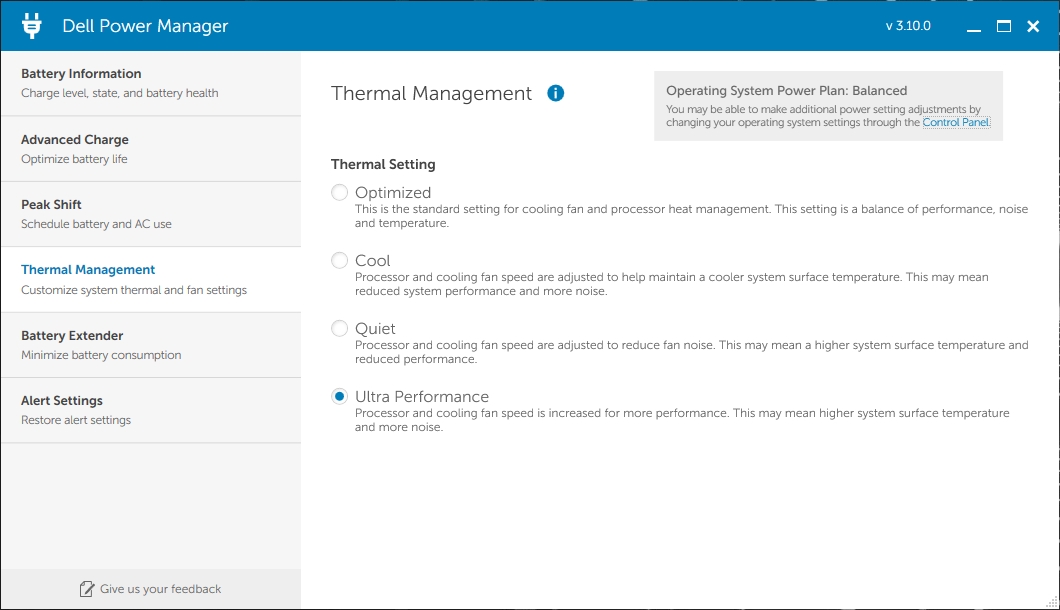
Vor der Durchführung der Benchmarks haben wir unseren Testlaptop über die Software Dell Optimizer in den Ultra-Performance-Modus versetzt. Zusätzlich haben wir die Grafikkarte über die Nvidia Systemsteuerung aktiviert. Die gleichen Leistungseinstellungen können übrigens sowohl über den Dell Power Manager als auch den Dell Optimizer vorgenommen werden. Glücklicherweise ändern die Einstellungen in dem einen Programm auch gleich die Einstellungen in der anderen Software.
Prozessor
Die CPU-Leistung ist ein geteiltes Schwert: Verglichen mit anderen 14-Zoll-Business-Laptops oder -Workstations, bietet das Precision 5470 eine signifikant höhere Leistung, die sich sogar mit der wesentlich größerer Workstations messen kann, beispielsweise dem MSI WE76 oder dem HP ZBook Fury 17 G8. Es handelt sich hier eben um eine CPU, welche für deutlich dickere Laptops konzipiert und nun in ein 14-Zoll-Gehäuse gepresst wurde. Verglichen mit Laptops mit dem gleichen Core i9-12900H CPU, rechnet die CPU in unserem Precision allerdings im Schnitt 15 bis 20 Prozent langsamer.
Ein weiterer Nachteil der starken CPU ist ihre instabile Taktrate. Im CineBench-R15-xT-Loop beispielsweise variieren die Ergebnisse zwischen 1.500 und 2.100 Punkten (s. Graph weiter unten), was auf stark schwankende Taktraten hindeutet. Der gleiche Test produziert auf einem HP ZBook Fury 17 G8 oder MSI Creator Z17 recht konstante Ergebnisse, beide Laptops verwenden ebenfalls einen Core i9.
Cinebench R15 Multi Loop
Cinebench R23: Multi Core | Single Core
Cinebench R15: CPU Multi 64Bit | CPU Single 64Bit
Blender: v2.79 BMW27 CPU
7-Zip 18.03: 7z b 4 | 7z b 4 -mmt1
Geekbench 5.5: Multi-Core | Single-Core
HWBOT x265 Benchmark v2.2: 4k Preset
LibreOffice : 20 Documents To PDF
R Benchmark 2.5: Overall mean
Cinebench R23: Multi Core | Single Core
Cinebench R15: CPU Multi 64Bit | CPU Single 64Bit
Blender: v2.79 BMW27 CPU
7-Zip 18.03: 7z b 4 | 7z b 4 -mmt1
Geekbench 5.5: Multi-Core | Single-Core
HWBOT x265 Benchmark v2.2: 4k Preset
LibreOffice : 20 Documents To PDF
R Benchmark 2.5: Overall mean
* ... kleinere Werte sind besser
AIDA64: FP32 Ray-Trace | FPU Julia | CPU SHA3 | CPU Queen | FPU SinJulia | FPU Mandel | CPU AES | CPU ZLib | FP64 Ray-Trace | CPU PhotoWorxx
| Performance Rating | |
| Durchschnittliche Intel Core i9-12900H | |
| Dell Precision 5000 5470 | |
| Lenovo ThinkPad P14s G2 AMD | |
| Lenovo ThinkPad P15v G2 21A9000XGE | |
| HP ZBook Firefly 14 G8 2C9Q2EA | |
| HP ZBook Firefly 14 G7 | |
| AIDA64 / FP32 Ray-Trace | |
| Dell Precision 5000 5470 | |
| Lenovo ThinkPad P15v G2 21A9000XGE | |
| Durchschnittliche Intel Core i9-12900H (4074 - 18289, n=29) | |
| Lenovo ThinkPad P14s G2 AMD | |
| HP ZBook Firefly 14 G8 2C9Q2EA | |
| HP ZBook Firefly 14 G7 | |
| AIDA64 / FPU Julia | |
| Lenovo ThinkPad P14s G2 AMD | |
| Dell Precision 5000 5470 | |
| Durchschnittliche Intel Core i9-12900H (22307 - 93236, n=29) | |
| Lenovo ThinkPad P15v G2 21A9000XGE | |
| HP ZBook Firefly 14 G8 2C9Q2EA | |
| HP ZBook Firefly 14 G7 | |
| AIDA64 / CPU SHA3 | |
| Lenovo ThinkPad P15v G2 21A9000XGE | |
| Durchschnittliche Intel Core i9-12900H (1378 - 4215, n=29) | |
| Dell Precision 5000 5470 | |
| Lenovo ThinkPad P14s G2 AMD | |
| HP ZBook Firefly 14 G8 2C9Q2EA | |
| HP ZBook Firefly 14 G7 | |
| AIDA64 / CPU Queen | |
| Dell Precision 5000 5470 | |
| Durchschnittliche Intel Core i9-12900H (78172 - 111241, n=28) | |
| Lenovo ThinkPad P15v G2 21A9000XGE | |
| Lenovo ThinkPad P14s G2 AMD | |
| HP ZBook Firefly 14 G7 | |
| HP ZBook Firefly 14 G8 2C9Q2EA | |
| AIDA64 / FPU SinJulia | |
| Lenovo ThinkPad P14s G2 AMD | |
| Durchschnittliche Intel Core i9-12900H (5709 - 10410, n=29) | |
| Lenovo ThinkPad P15v G2 21A9000XGE | |
| Dell Precision 5000 5470 | |
| HP ZBook Firefly 14 G8 2C9Q2EA | |
| HP ZBook Firefly 14 G7 | |
| AIDA64 / FPU Mandel | |
| Lenovo ThinkPad P14s G2 AMD | |
| Dell Precision 5000 5470 | |
| Lenovo ThinkPad P15v G2 21A9000XGE | |
| Durchschnittliche Intel Core i9-12900H (11257 - 45581, n=29) | |
| HP ZBook Firefly 14 G8 2C9Q2EA | |
| HP ZBook Firefly 14 G7 | |
| AIDA64 / CPU AES | |
| Lenovo ThinkPad P14s G2 AMD | |
| Durchschnittliche Intel Core i9-12900H (31935 - 151546, n=29) | |
| Lenovo ThinkPad P15v G2 21A9000XGE | |
| HP ZBook Firefly 14 G8 2C9Q2EA | |
| Dell Precision 5000 5470 | |
| HP ZBook Firefly 14 G7 | |
| AIDA64 / CPU ZLib | |
| Durchschnittliche Intel Core i9-12900H (449 - 1193, n=29) | |
| Lenovo ThinkPad P15v G2 21A9000XGE | |
| Lenovo ThinkPad P14s G2 AMD | |
| Dell Precision 5000 5470 | |
| HP ZBook Firefly 14 G8 2C9Q2EA | |
| HP ZBook Firefly 14 G7 | |
| AIDA64 / FP64 Ray-Trace | |
| Dell Precision 5000 5470 | |
| Lenovo ThinkPad P15v G2 21A9000XGE | |
| Durchschnittliche Intel Core i9-12900H (2235 - 10511, n=29) | |
| Lenovo ThinkPad P14s G2 AMD | |
| HP ZBook Firefly 14 G8 2C9Q2EA | |
| HP ZBook Firefly 14 G7 | |
| AIDA64 / CPU PhotoWorxx | |
| Dell Precision 5000 5470 | |
| Durchschnittliche Intel Core i9-12900H (20960 - 48269, n=30) | |
| HP ZBook Firefly 14 G8 2C9Q2EA | |
| HP ZBook Firefly 14 G7 | |
| Lenovo ThinkPad P14s G2 AMD | |
| Lenovo ThinkPad P15v G2 21A9000XGE | |
Systemleistung
Im Vergleich mit anderen mobilen Workstations fallen die PCMark-10-Ergebnisse höher als erwartet aus. Wir führen dies einerseits auf den Core i9 H und andererseits auf die PCIe4-x4-SSD zurück, beides relativ ungewöhnliche Optionen in einer 14-Zoll-Workstation.

CrossMark: Overall | Productivity | Creativity | Responsiveness
| PCMark 10 / Score | |
| Dell Precision 5000 5470 | |
| Durchschnittliche Intel Core i9-12900H, NVIDIA RTX A1000 Laptop GPU (n=1) | |
| Dell Precision 5000 5560 | |
| Lenovo ThinkPad P15v G2 21A9000XGE | |
| Lenovo ThinkPad P14s G2 AMD | |
| HP ZBook Firefly 14 G8 2C9Q2EA | |
| HP ZBook Firefly 14 G7 | |
| PCMark 10 / Essentials | |
| Dell Precision 5000 5470 | |
| Durchschnittliche Intel Core i9-12900H, NVIDIA RTX A1000 Laptop GPU (n=1) | |
| Dell Precision 5000 5560 | |
| Lenovo ThinkPad P15v G2 21A9000XGE | |
| Lenovo ThinkPad P14s G2 AMD | |
| HP ZBook Firefly 14 G8 2C9Q2EA | |
| HP ZBook Firefly 14 G7 | |
| PCMark 10 / Productivity | |
| Dell Precision 5000 5560 | |
| Lenovo ThinkPad P14s G2 AMD | |
| Dell Precision 5000 5470 | |
| Durchschnittliche Intel Core i9-12900H, NVIDIA RTX A1000 Laptop GPU (n=1) | |
| HP ZBook Firefly 14 G8 2C9Q2EA | |
| Lenovo ThinkPad P15v G2 21A9000XGE | |
| HP ZBook Firefly 14 G7 | |
| PCMark 10 / Digital Content Creation | |
| Dell Precision 5000 5470 | |
| Durchschnittliche Intel Core i9-12900H, NVIDIA RTX A1000 Laptop GPU (n=1) | |
| Dell Precision 5000 5560 | |
| Lenovo ThinkPad P15v G2 21A9000XGE | |
| Lenovo ThinkPad P14s G2 AMD | |
| HP ZBook Firefly 14 G8 2C9Q2EA | |
| HP ZBook Firefly 14 G7 | |
| CrossMark / Overall | |
| Dell Precision 5000 5470 | |
| Durchschnittliche Intel Core i9-12900H, NVIDIA RTX A1000 Laptop GPU (n=1) | |
| Lenovo ThinkPad P15v G2 21A9000XGE | |
| CrossMark / Productivity | |
| Dell Precision 5000 5470 | |
| Durchschnittliche Intel Core i9-12900H, NVIDIA RTX A1000 Laptop GPU (n=1) | |
| Lenovo ThinkPad P15v G2 21A9000XGE | |
| CrossMark / Creativity | |
| Dell Precision 5000 5470 | |
| Durchschnittliche Intel Core i9-12900H, NVIDIA RTX A1000 Laptop GPU (n=1) | |
| Lenovo ThinkPad P15v G2 21A9000XGE | |
| CrossMark / Responsiveness | |
| Dell Precision 5000 5470 | |
| Durchschnittliche Intel Core i9-12900H, NVIDIA RTX A1000 Laptop GPU (n=1) | |
| Lenovo ThinkPad P15v G2 21A9000XGE | |
| PCMark 10 Score | 6870 Punkte | |
Hilfe | ||
| AIDA64 / Memory Copy | |
| Dell Precision 5000 5470 | |
| Durchschnittliche Intel Core i9-12900H (34438 - 74264, n=29) | |
| Lenovo ThinkPad P14s G2 AMD | |
| HP ZBook Firefly 14 G8 2C9Q2EA | |
| HP ZBook Firefly 14 G7 | |
| Lenovo ThinkPad P15v G2 21A9000XGE | |
| AIDA64 / Memory Read | |
| Dell Precision 5000 5470 | |
| Durchschnittliche Intel Core i9-12900H (36365 - 74642, n=29) | |
| Lenovo ThinkPad P14s G2 AMD | |
| HP ZBook Firefly 14 G8 2C9Q2EA | |
| HP ZBook Firefly 14 G7 | |
| Lenovo ThinkPad P15v G2 21A9000XGE | |
| AIDA64 / Memory Write | |
| Dell Precision 5000 5470 | |
| Durchschnittliche Intel Core i9-12900H (32276 - 67858, n=29) | |
| HP ZBook Firefly 14 G8 2C9Q2EA | |
| Lenovo ThinkPad P14s G2 AMD | |
| HP ZBook Firefly 14 G7 | |
| Lenovo ThinkPad P15v G2 21A9000XGE | |
| AIDA64 / Memory Latency | |
| Dell Precision 5000 5470 | |
| Lenovo ThinkPad P14s G2 AMD | |
| Lenovo ThinkPad P15v G2 21A9000XGE | |
| Durchschnittliche Intel Core i9-12900H (74.7 - 118.1, n=28) | |
| HP ZBook Firefly 14 G7 | |
| HP ZBook Firefly 14 G8 2C9Q2EA | |
* ... kleinere Werte sind besser
DPC Latency
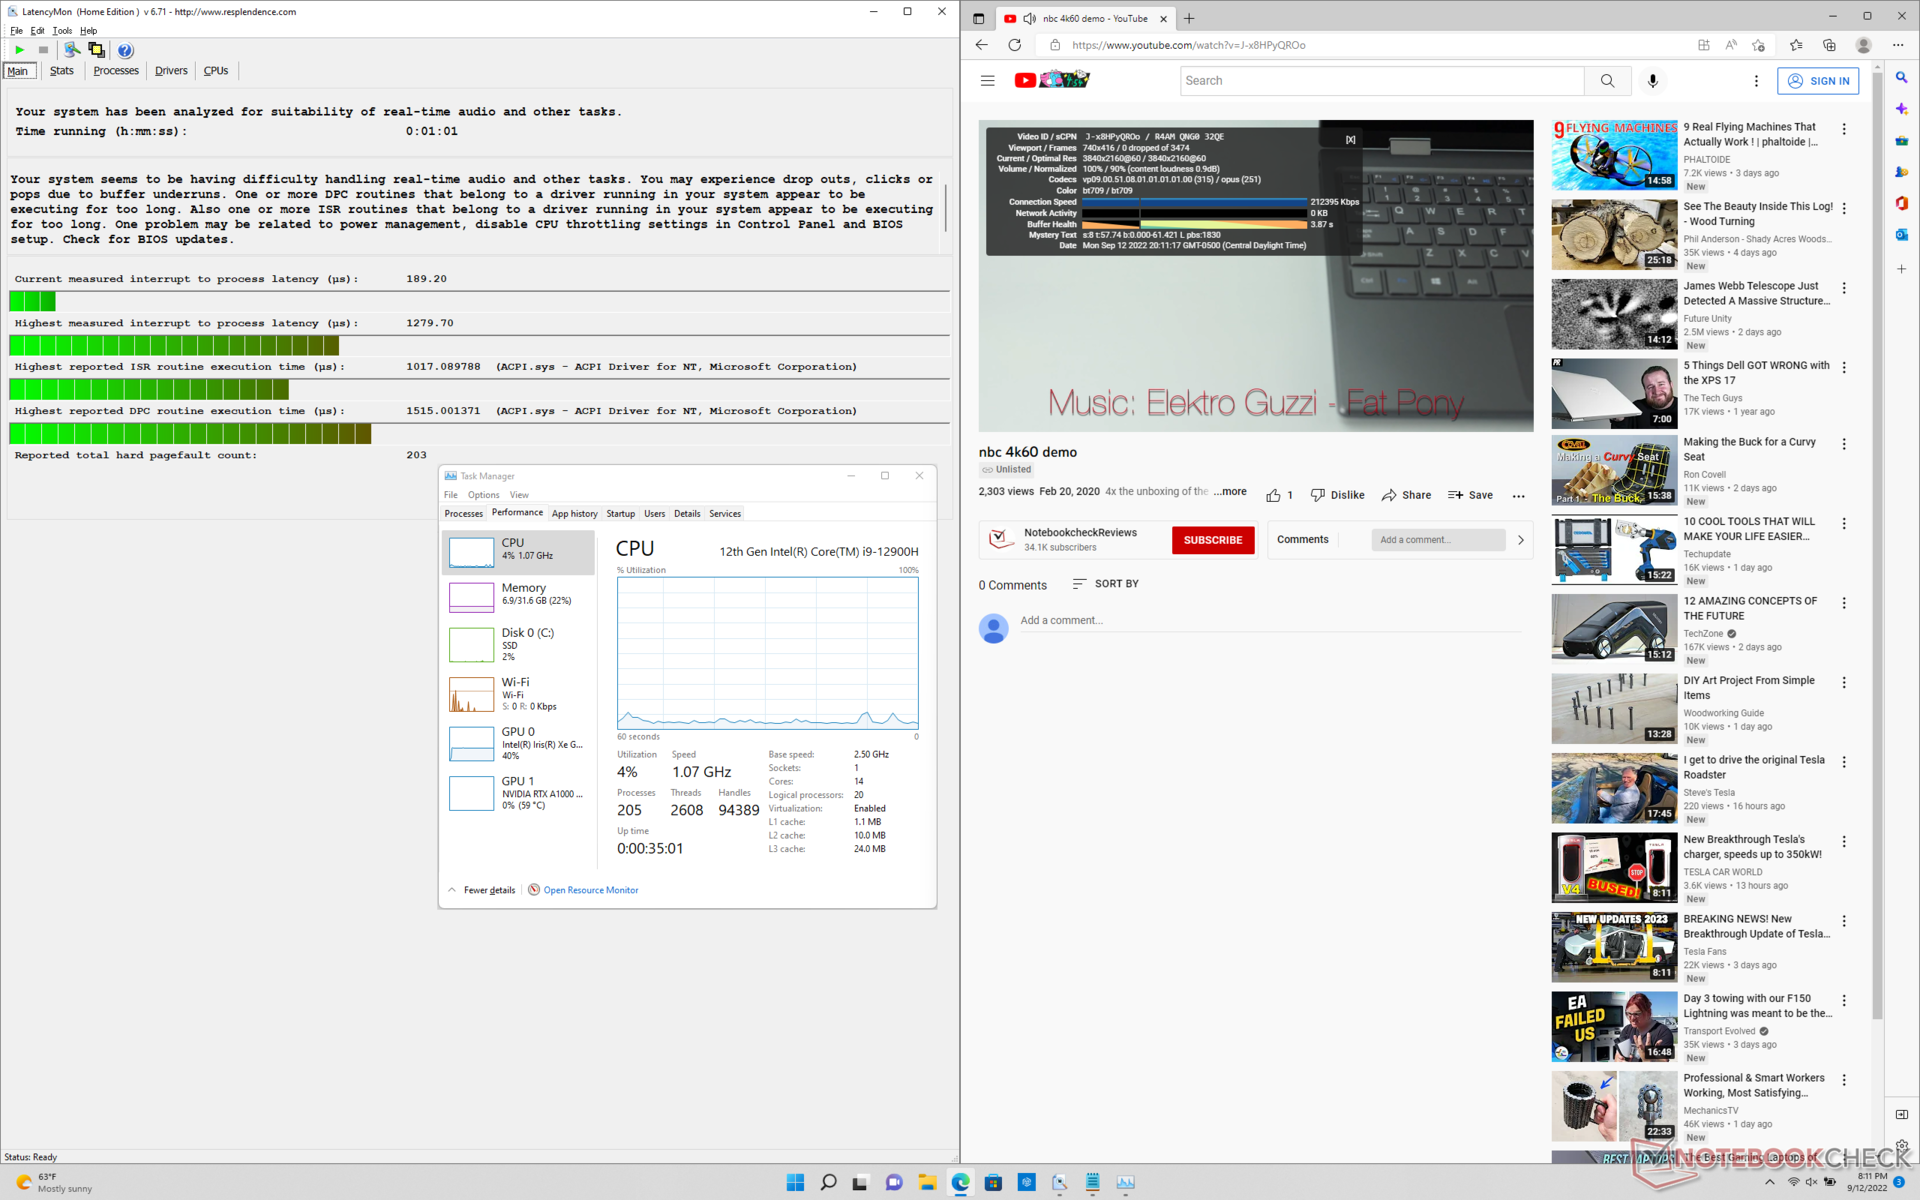
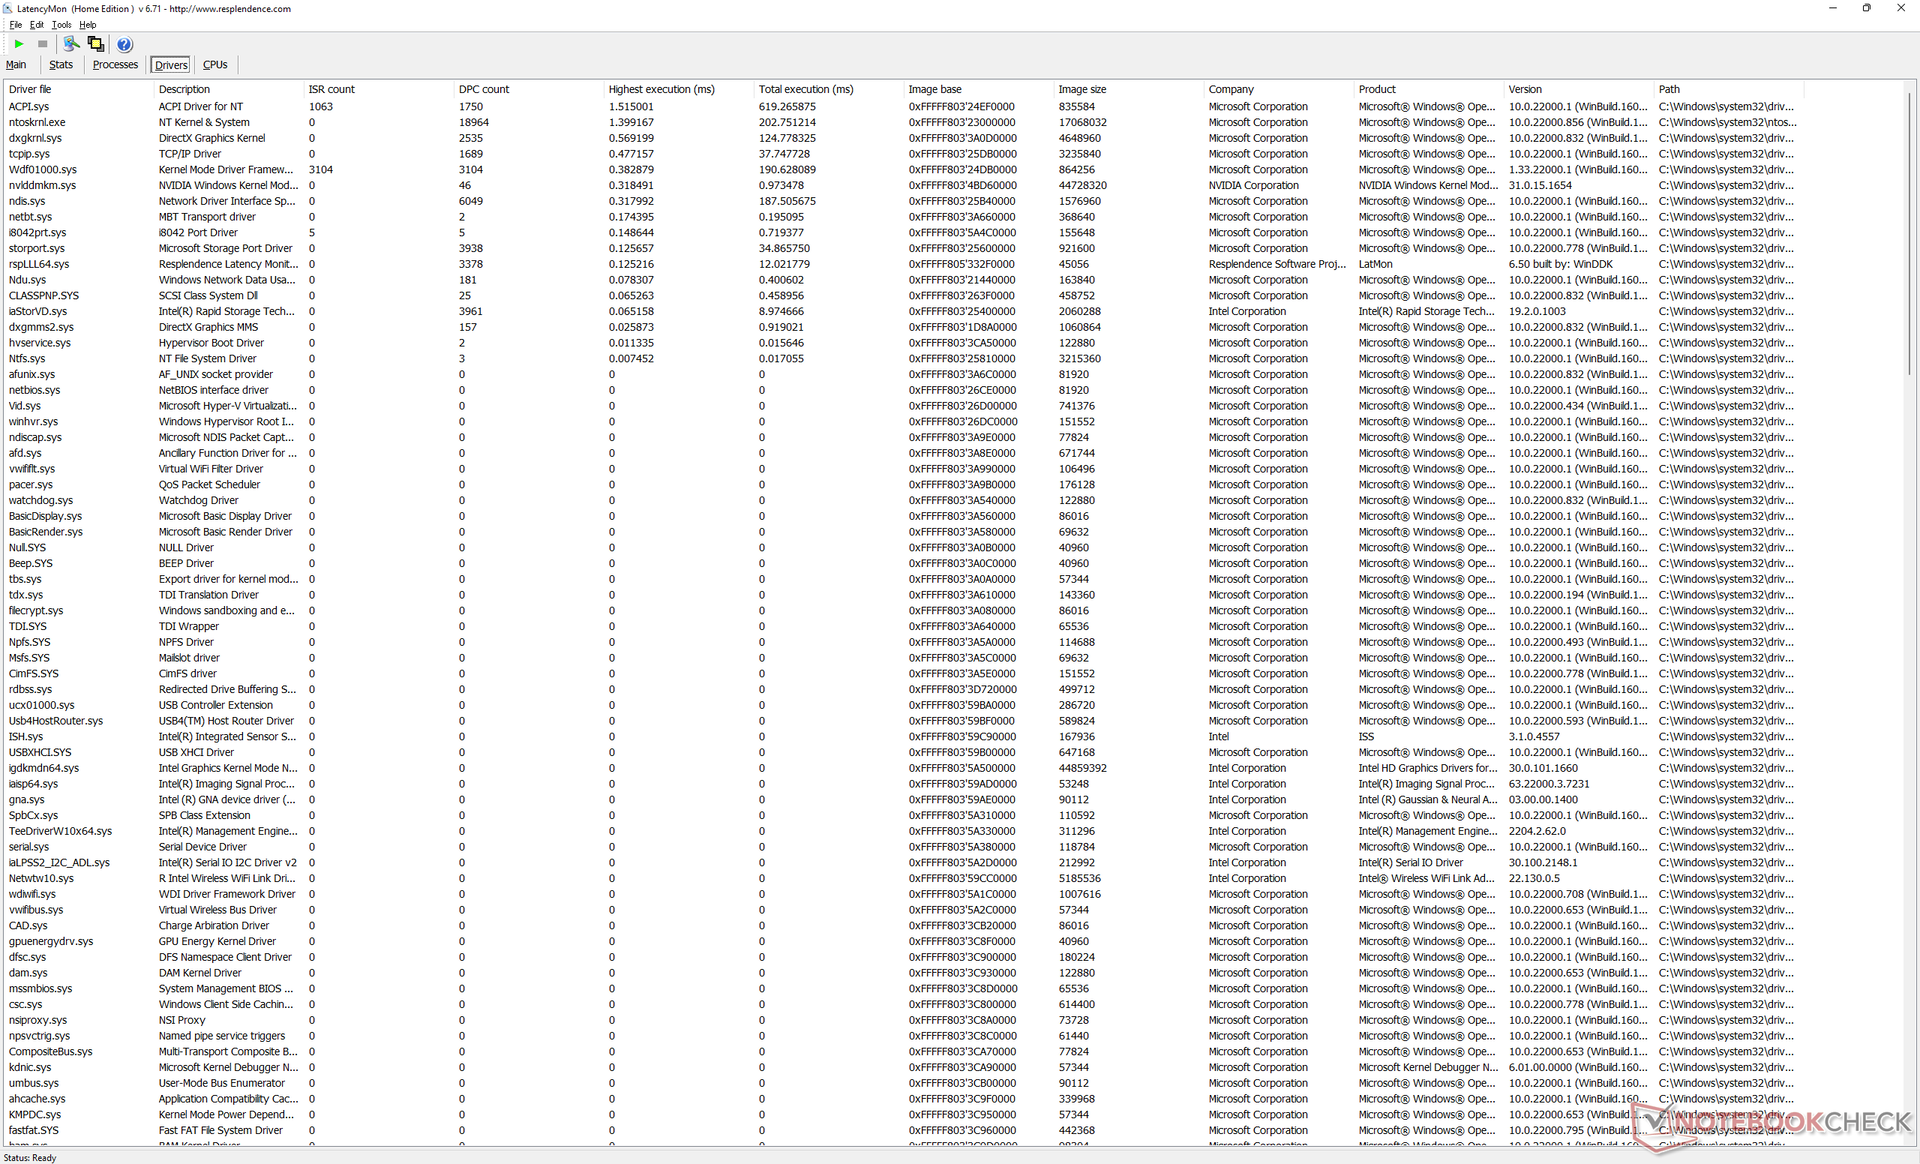
LatencyMon entdeckt leichte DPC-Probleme beim Öffnen mehrerer Browsertabs auf unserer Homepage. Gerade für eine Workstation kommt dies etwas enttäuschend. Dennoch läuft unser einminütiges 4K/60-fps-YouTubevideo flüssig und ohne Dropped Frames ab.
| DPC Latencies / LatencyMon - interrupt to process latency (max), Web, Youtube, Prime95 | |
| Lenovo ThinkPad P15v G2 21A9000XGE | |
| HP ZBook Firefly 14 G8 2C9Q2EA | |
| Lenovo ThinkPad P14s G2 AMD | |
| HP ZBook Firefly 14 G7 | |
| Dell Precision 5000 5470 | |
| Dell Precision 5000 5560 | |
* ... kleinere Werte sind besser
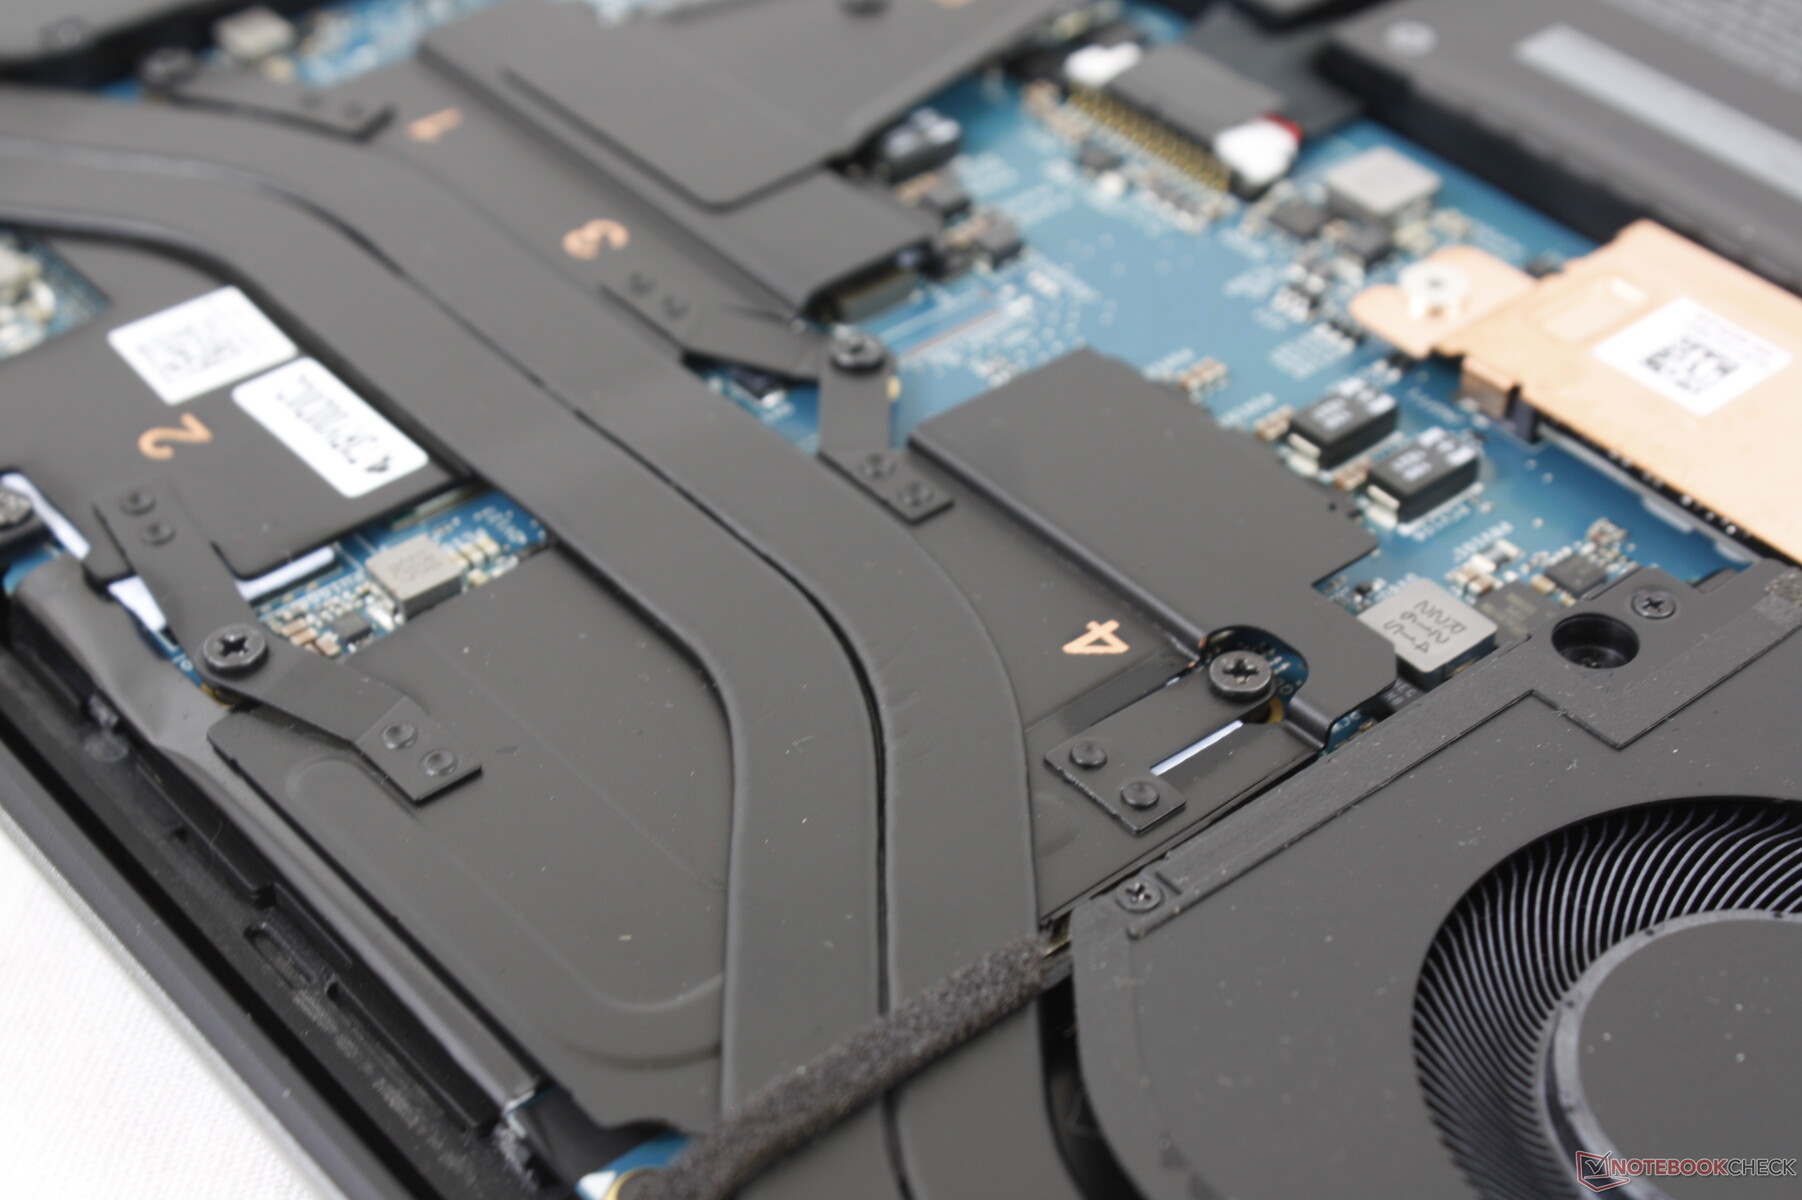
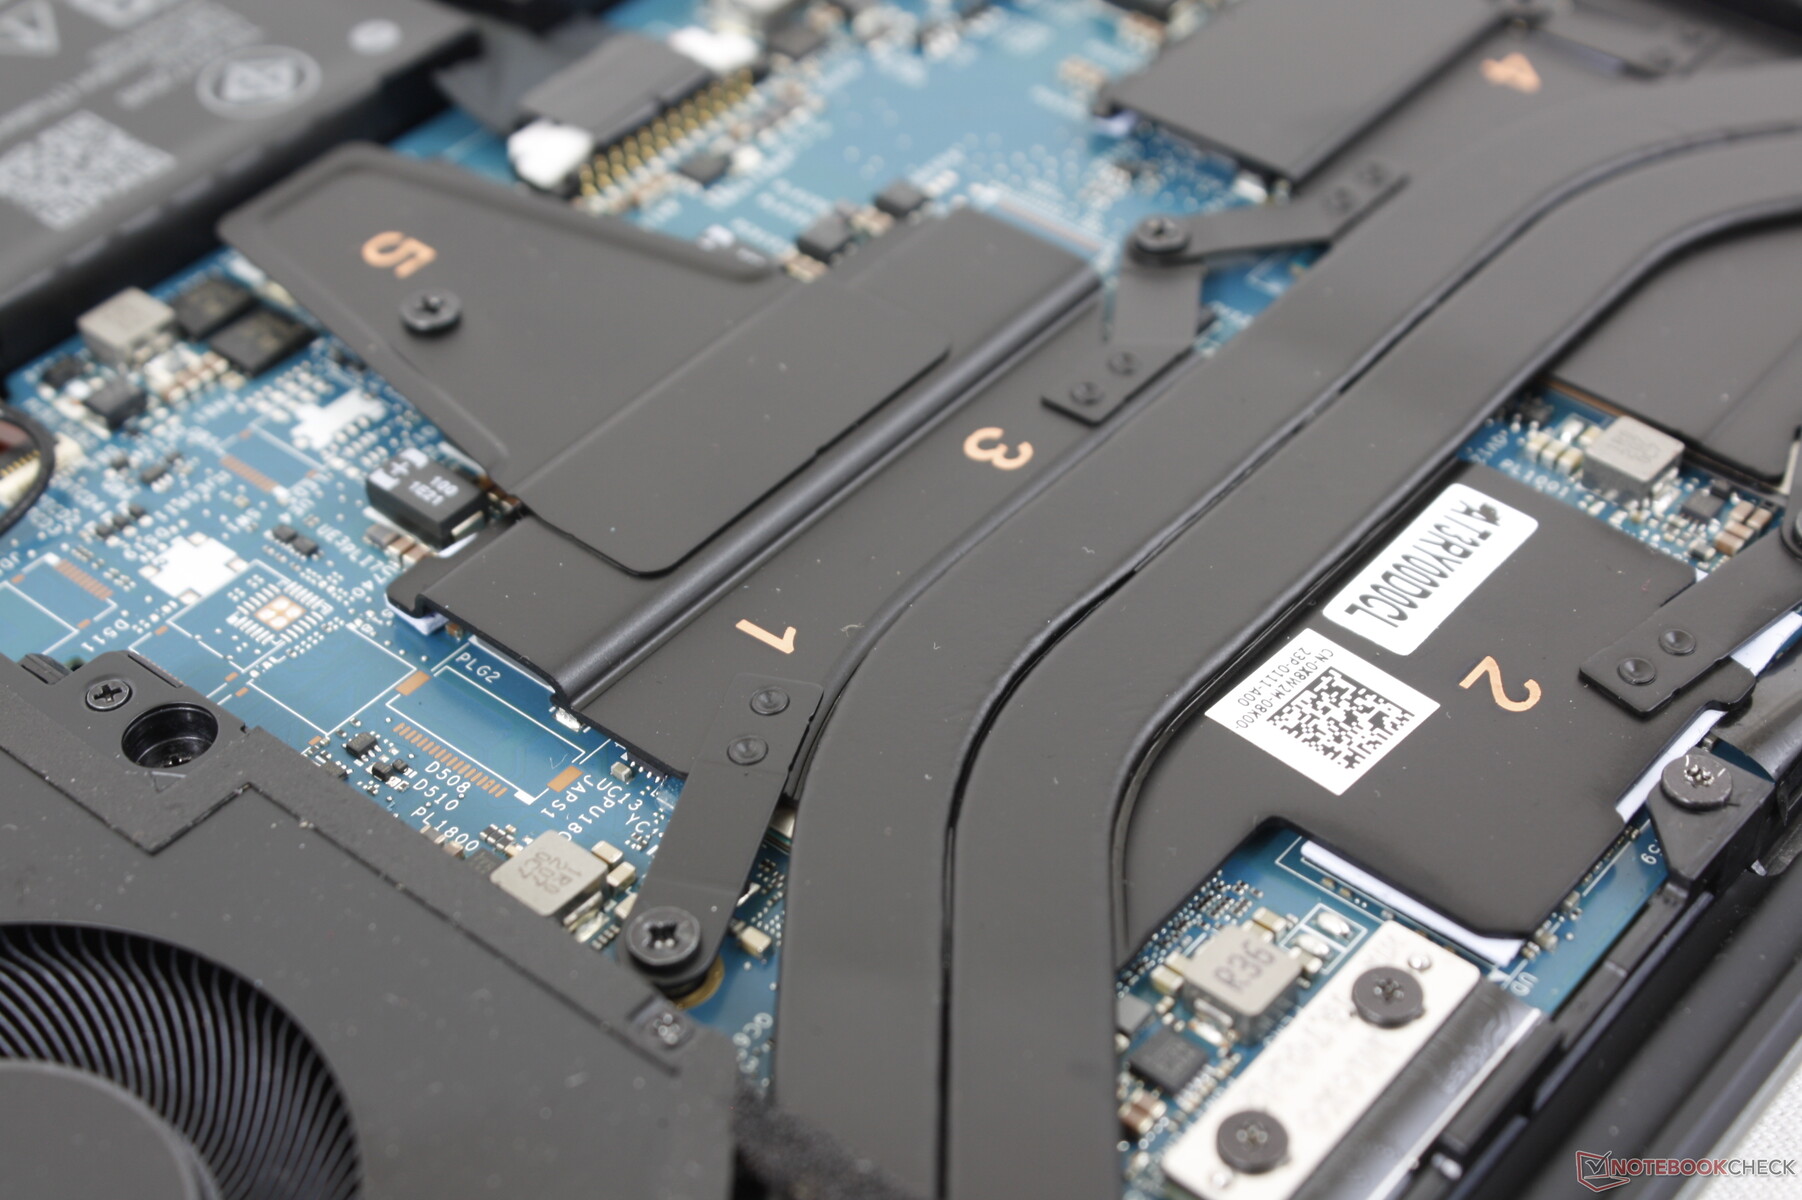
Massenspeicher
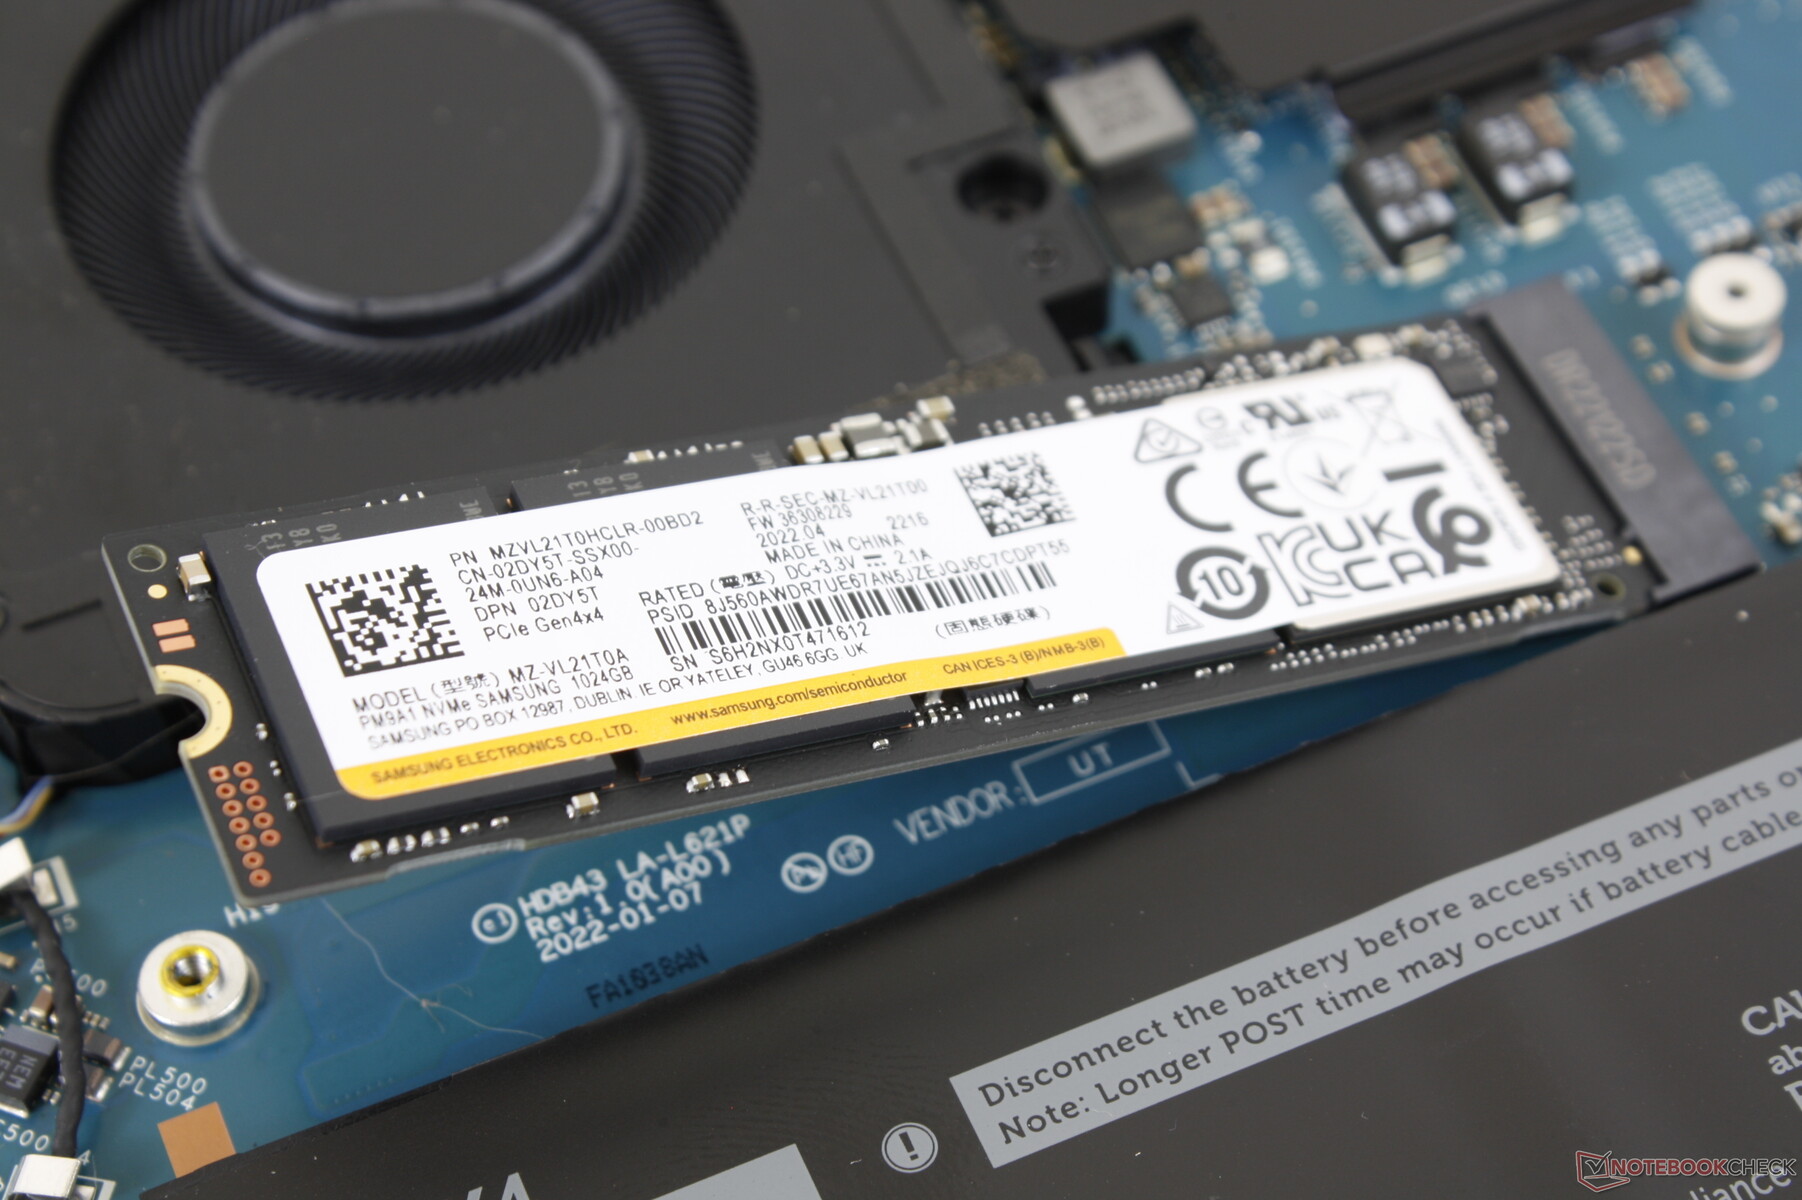
Dell bietet SSD-Optionen von 256 GB bis hin zu 4 TB, sowohl PCIe3 als auch PCIe4 an, jeweils mit optionaler Selbstverschlüsselung. Unsere PCIe4-SSD Samsung PM9A1 verfügt über einen eigenen Kupfer-Heatspreader, was eine bessere Aufrechterhaltung der Leistung über längere Zeiträume hinweg erlaubt, im Gegensatz zu Laptops ohne SSD-Heatspreader wie dem Latitude 7330.

| Drive Performance Rating - Percent | |
| Dell Precision 5000 5560 | |
| Dell Precision 5000 5470 | |
| Lenovo ThinkPad P14s G2 AMD | |
| HP ZBook Firefly 14 G8 2C9Q2EA | |
| HP ZBook Firefly 14 G7 | |
| Lenovo ThinkPad P15v G2 21A9000XGE | |
* ... kleinere Werte sind besser
Disk Throttling: DiskSpd Read Loop, Queue Depth 8
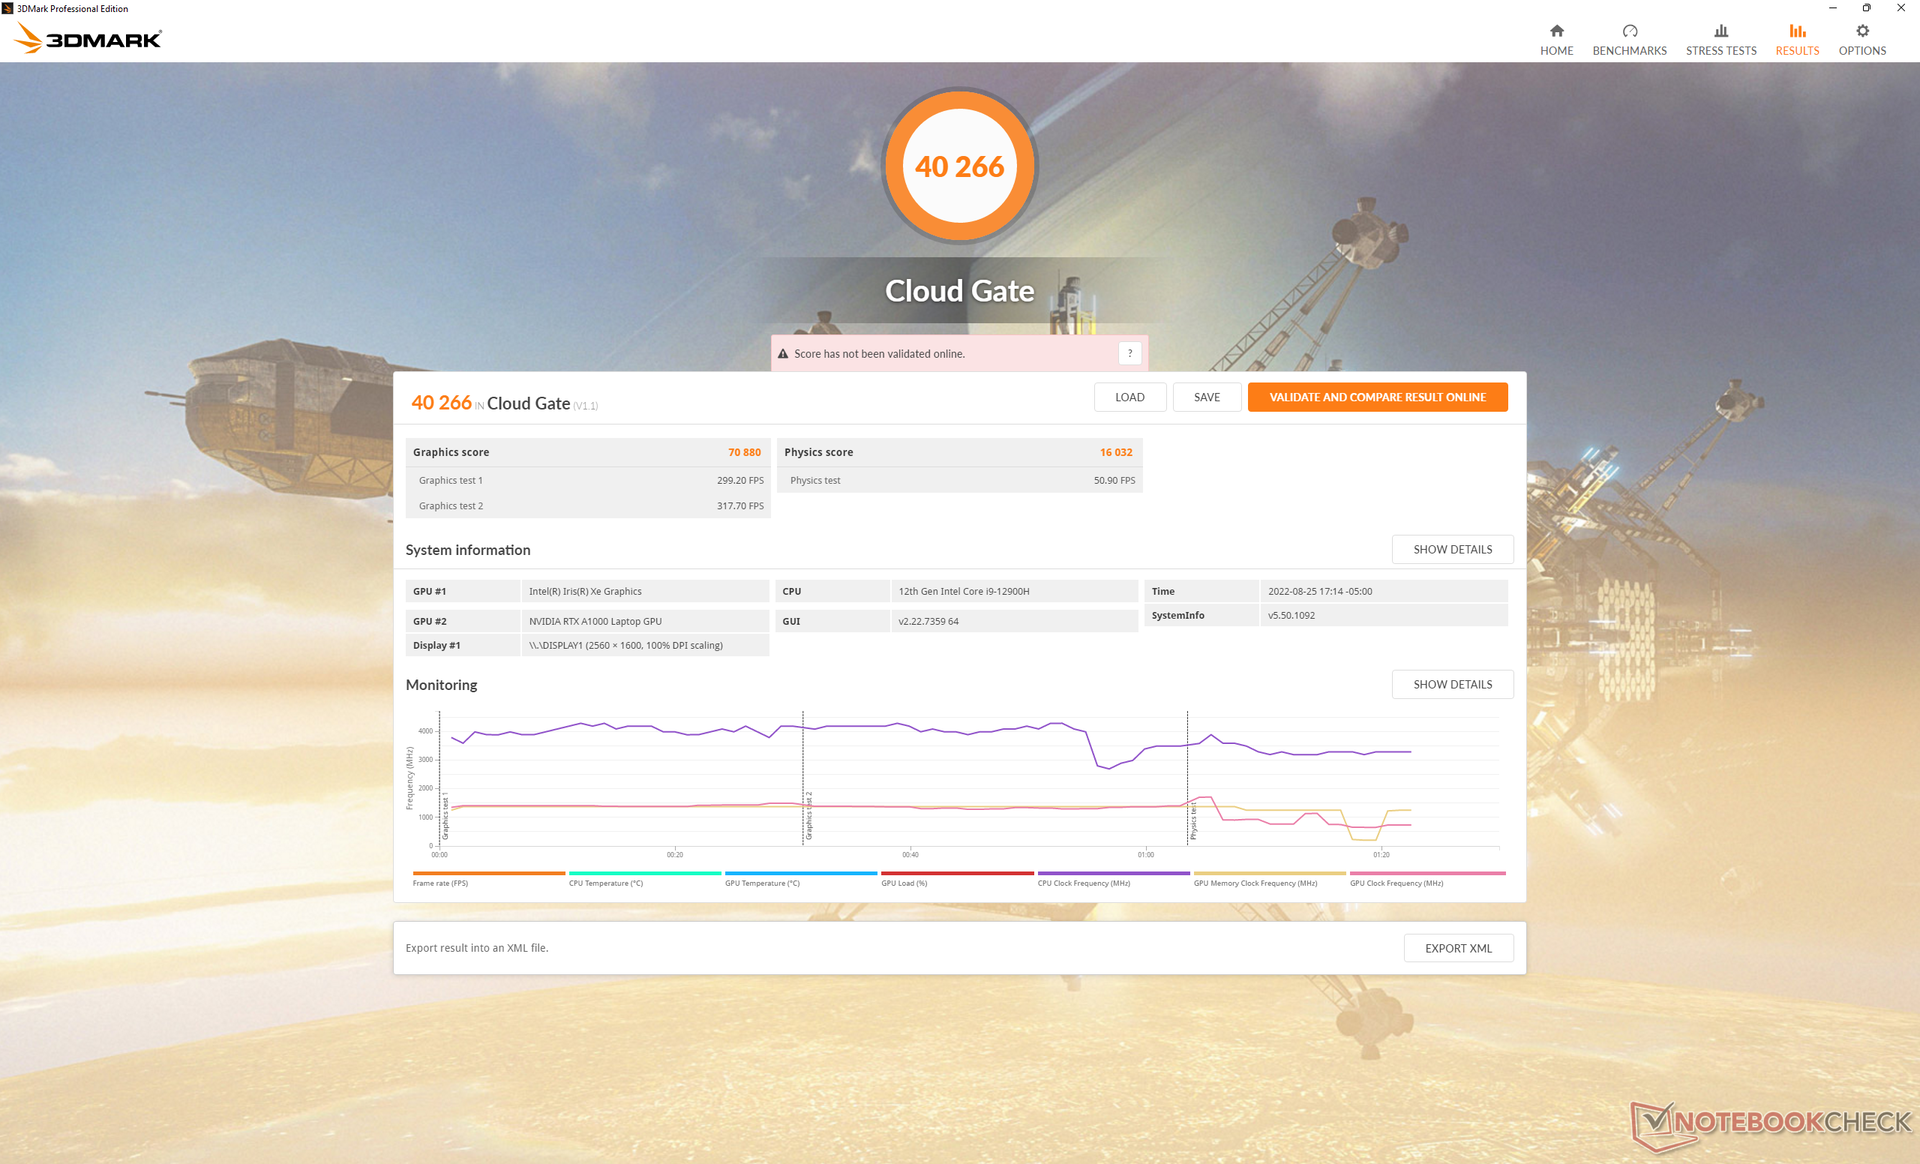
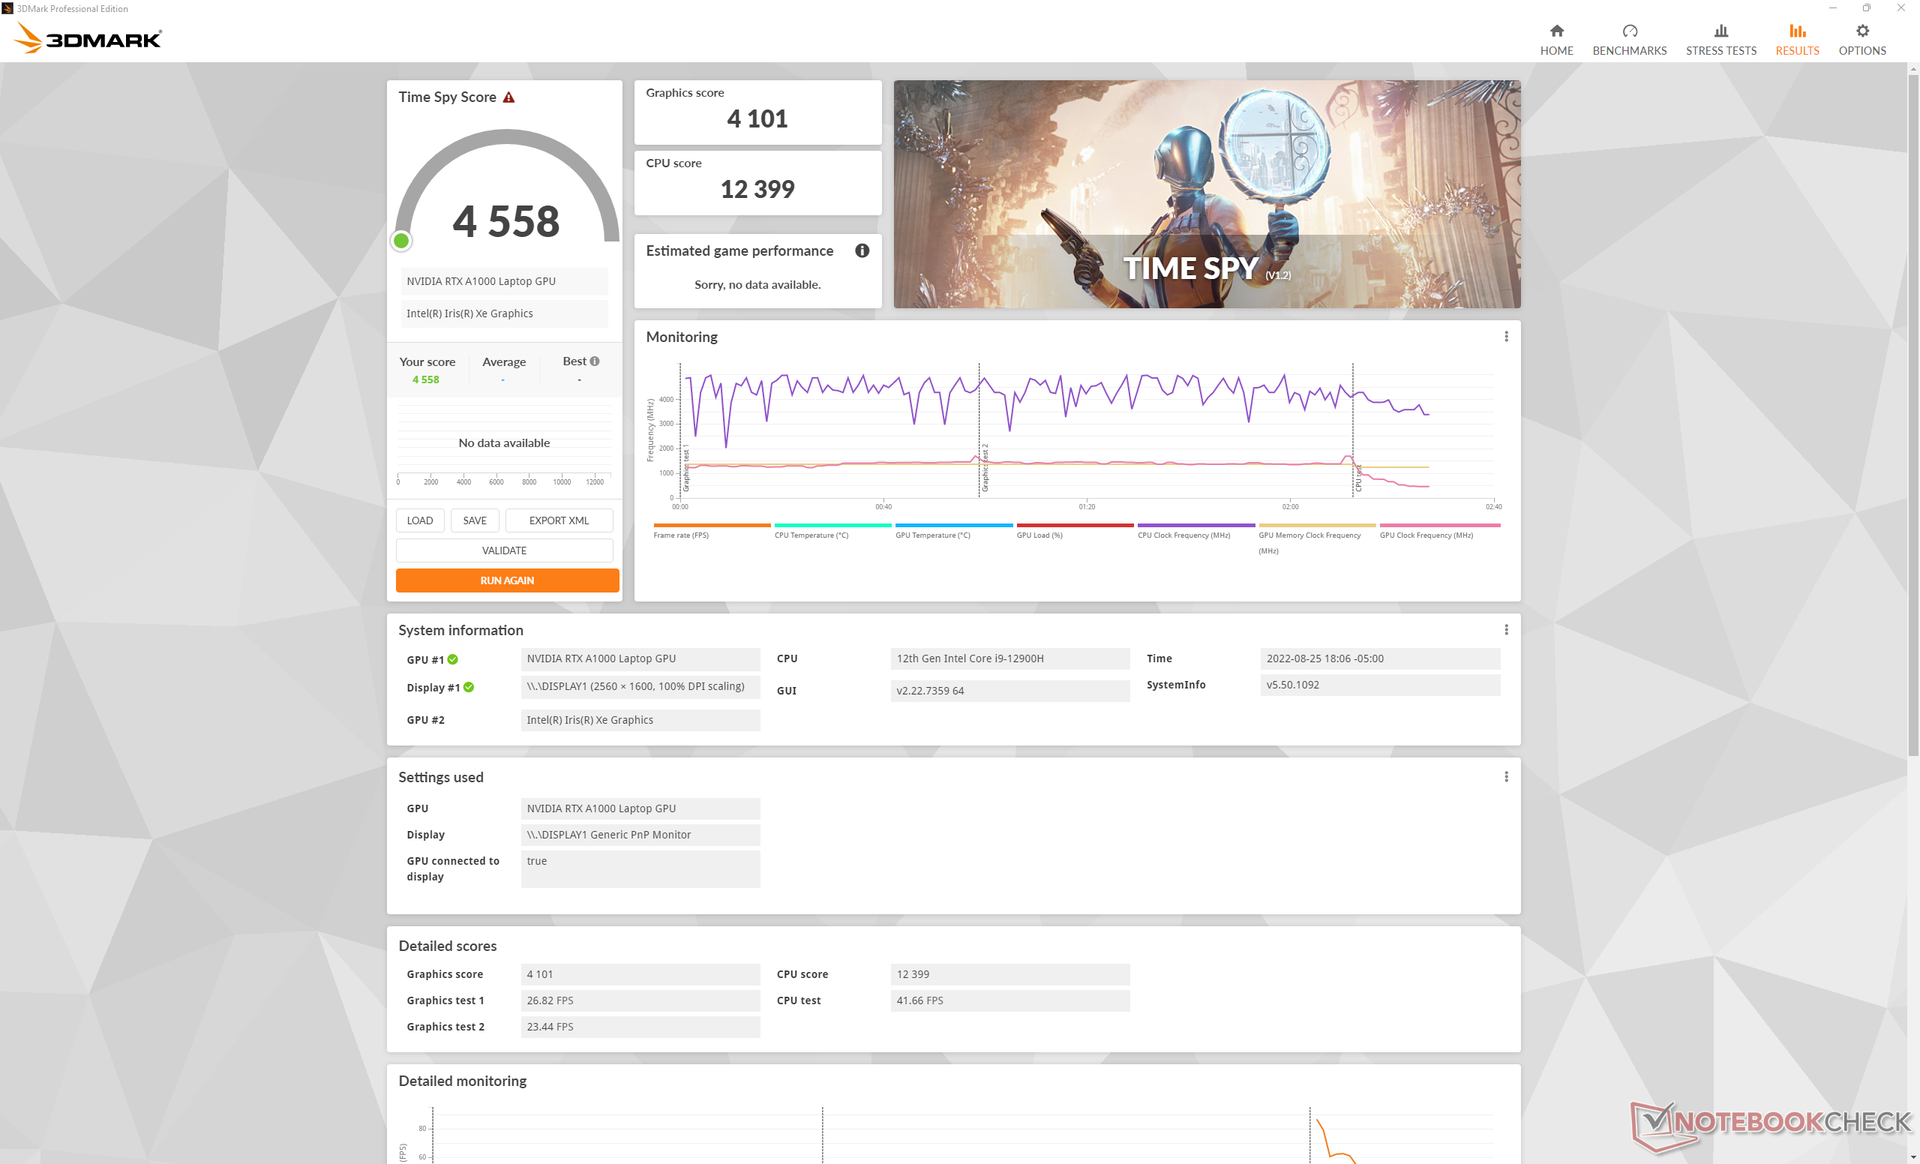
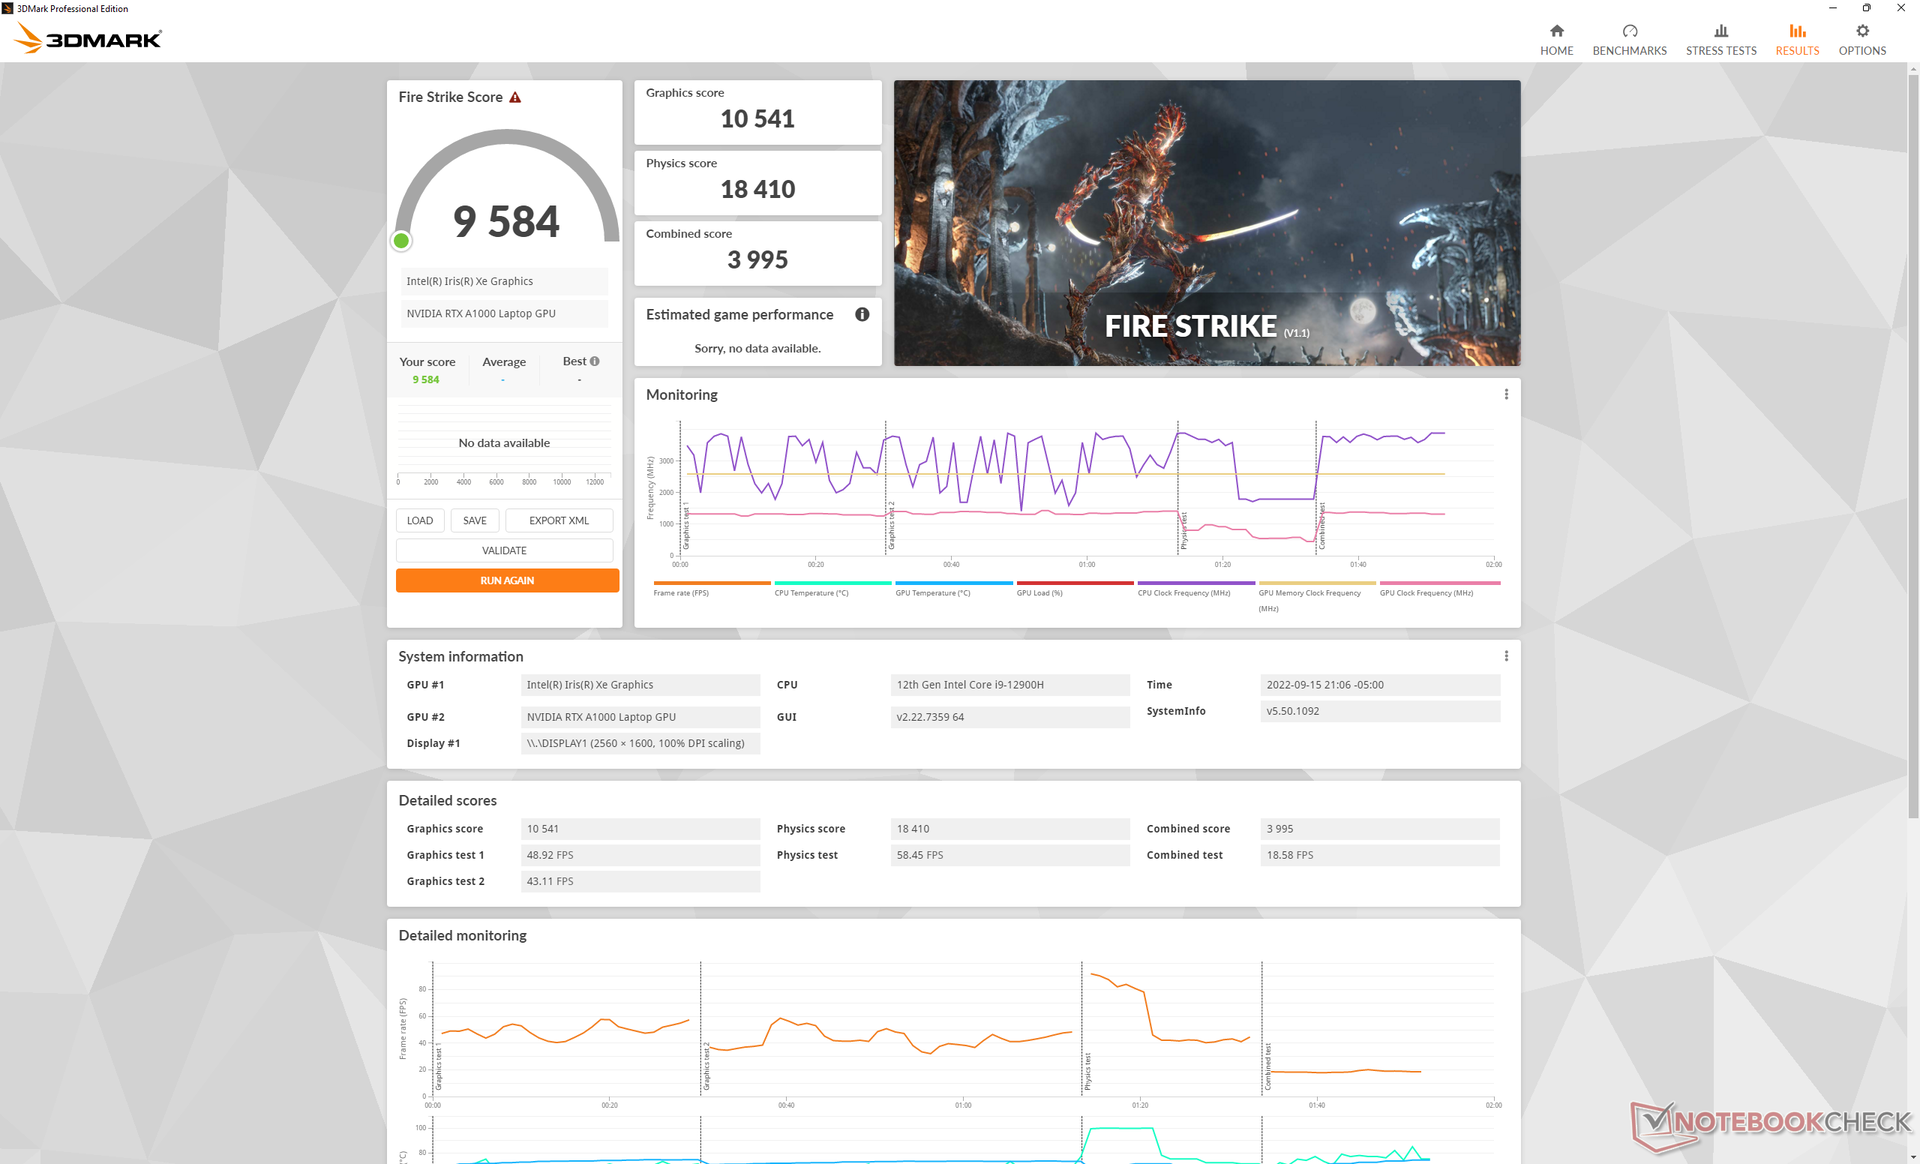
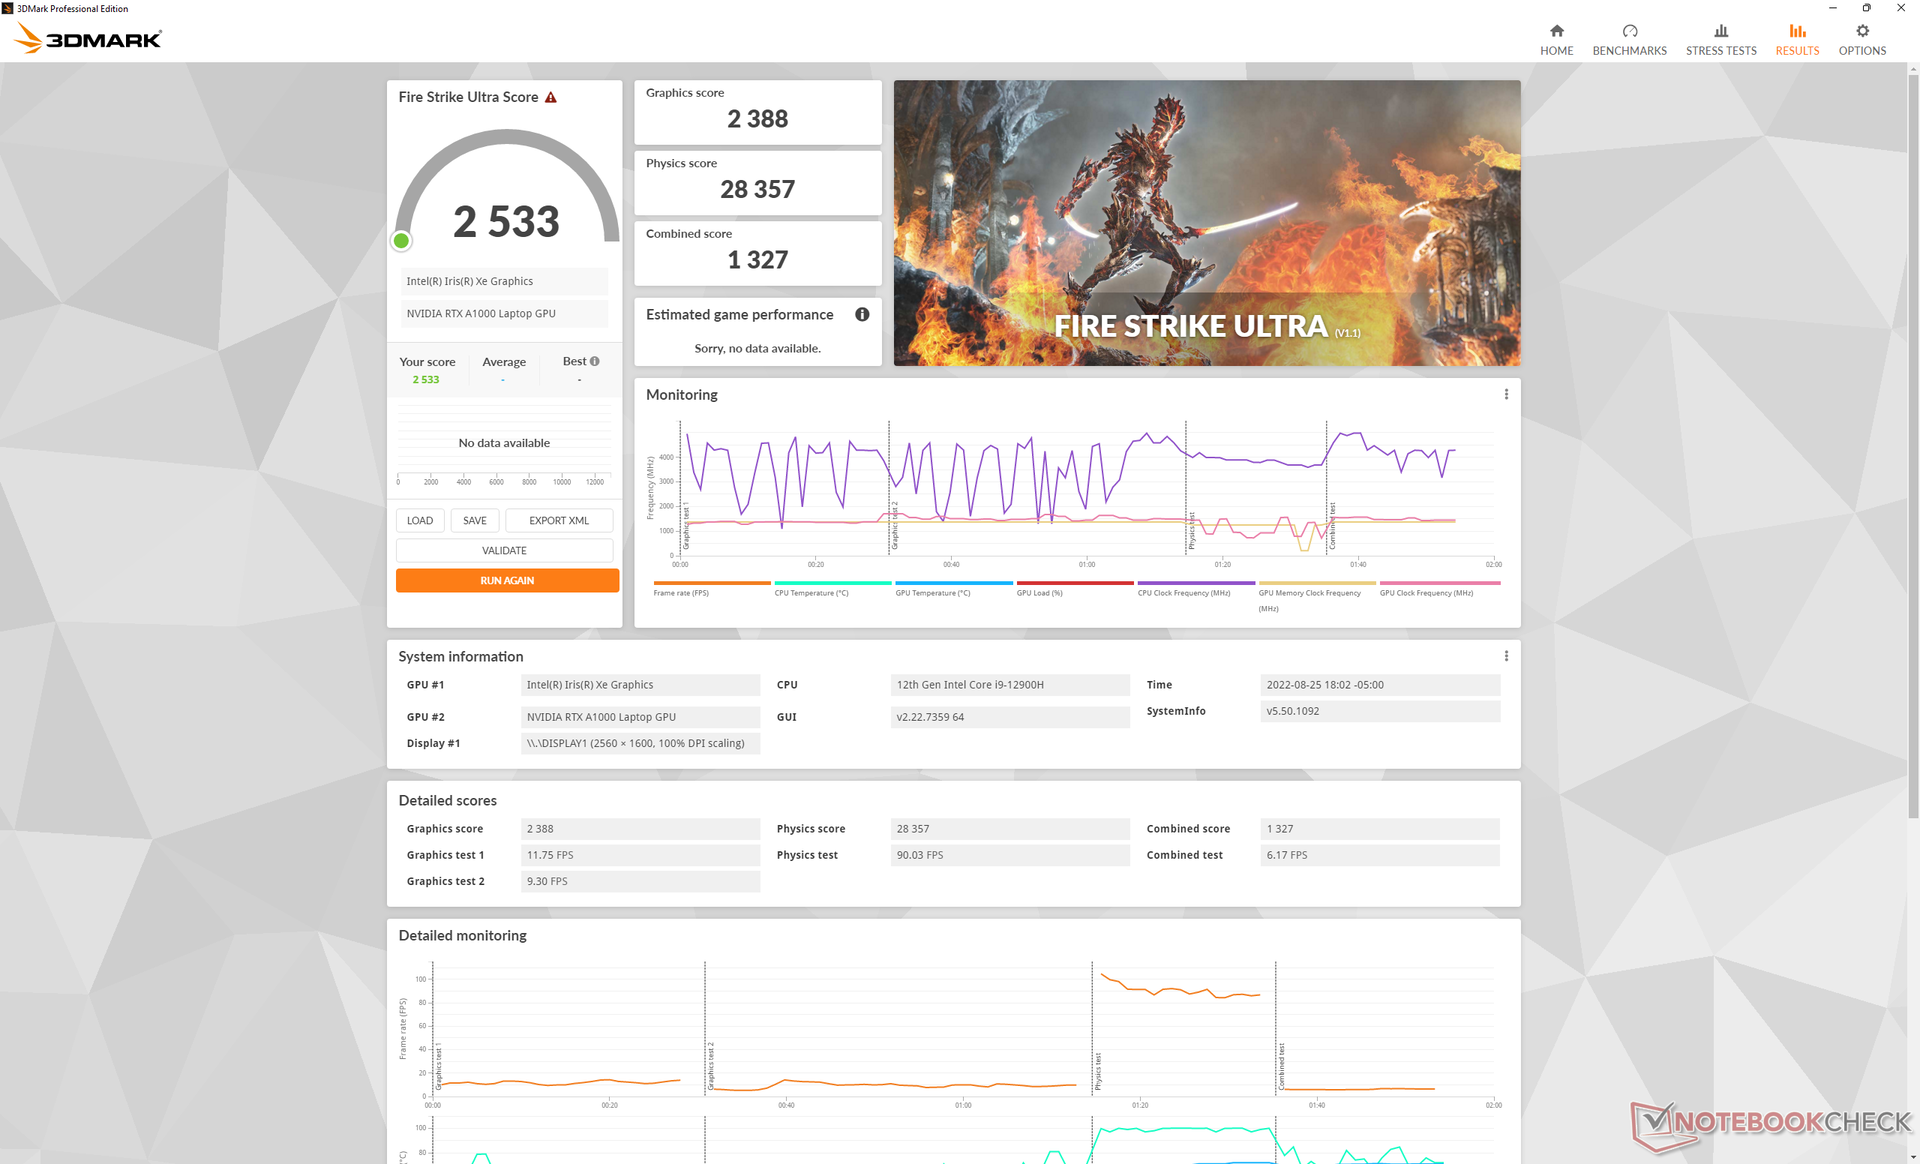
Grafikleistung — RTX A1000 mit 40 W
Die allgemeine Grafikleistung ist etwa 10 bis 20 Prozent schneller als mit dem NVIDIA T1200 aus dem letzten Jahr. Noch interessanter ist jedoch, dass die RTX A1000 nur etwa 10 bis 15 Prozent langsamer als die RTX A2000 im Precision 5560 agiert, mit Ausnahme von Ray-Tracing-Anwendungen, in denen die A2000 mehr als doppelt so schnell sein kann. Wer mit Ray-Tracing-Anwendungen zu tun hat, sollte die RTX A1000 eher vermeiden.
Im Balanced- anstelle des Ultra-Performance-Modus reduziert sich die CPU-Leistung um 33 Prozent, während die GPU-Leistung weniger stark beeinflusst wird.
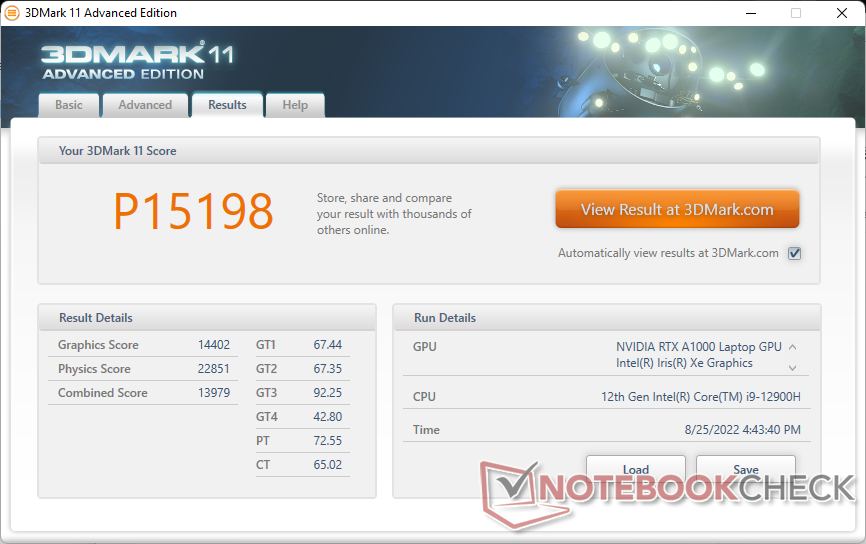

| 3DMark 11 Performance | 15198 Punkte | |
| 3DMark Cloud Gate Standard Score | 40266 Punkte | |
| 3DMark Fire Strike Score | 10123 Punkte | |
| 3DMark Time Spy Score | 4558 Punkte | |
Hilfe | ||
| Cyberpunk 2077 1.6 | |
| 1920x1080 Low Preset | |
| Dell Precision 5000 5470 | |
| Durchschnittliche NVIDIA RTX A1000 Laptop GPU (n=1) | |
| 1920x1080 Medium Preset | |
| Dell Precision 5000 5470 | |
| Durchschnittliche NVIDIA RTX A1000 Laptop GPU (n=1) | |
| 1920x1080 High Preset | |
| Dell Precision 5000 5470 | |
| Durchschnittliche NVIDIA RTX A1000 Laptop GPU (n=1) | |
| 1920x1080 Ultra Preset | |
| Dell Precision 5000 5470 | |
| Durchschnittliche NVIDIA RTX A1000 Laptop GPU (n=1) | |
Witcher 3 FPS Chart
| min. | mittel | hoch | max. | QHD | |
|---|---|---|---|---|---|
| GTA V (2015) | 168 | 159.8 | 113.7 | 58.9 | |
| The Witcher 3 (2015) | 244.1 | 147.5 | 82.1 | 42.7 | |
| Dota 2 Reborn (2015) | 160.8 | 147.9 | 112.3 | 132.1 | |
| Final Fantasy XV Benchmark (2018) | 105.3 | 59.1 | 43 | ||
| X-Plane 11.11 (2018) | 118.7 | 94.8 | 76.3 | ||
| Strange Brigade (2018) | 242 | 106.2 | 84.7 | 72.8 | |
| Metro Exodus (2019) | 111 | 53.3 | 39.3 | 31.2 | 23.6 |
| Borderlands 3 (2019) | 110.4 | 68.4 | 42.6 | 31.3 | 18.8 |
| Gears Tactics (2020) | 161.5 | 106.5 | 63.9 | 46.8 | 31.1 |
| Horizon Zero Dawn (2020) | 82 | 68 | 58 | 48 | 38 |
| Watch Dogs Legion (2020) | 75 | 62 | 54 | 26 | 17 |
| Dirt 5 (2020) | 135 | 62.4 | 48.5 | 37.2 | 25.8 |
| Assassin´s Creed Valhalla (2020) | 103 | 50 | 33 | 25 | 22 |
| Hitman 3 (2021) | 171.9 | 83.7 | 71.3 | 66.1 | 41 |
| F1 2021 (2021) | 195 | 127 | 103 | 54 | 34 |
| Far Cry 6 (2021) | 103 | 64 | 54 | ||
| Guardians of the Galaxy (2021) | 92 | 64 | 64 | 61 | 37 |
| God of War (2022) | 60.2 | 49.1 | 40.9 | 25.8 | 20.5 |
| Cyberpunk 2077 1.6 (2022) | 61.3 | 50.4 | 36.7 | 29 | |
| F1 22 (2022) | 112 | 107 | 76 | 22 | 13 |
Emissionen
Systemlautstärke — Laut unter Last
Das Precision 5470 agiert unter Last lauter als das Precision 5560. Beispielsweise kommt man in Witcher 3 im Ultra-Performance-Modus auf knapp unter 49 dB(A), verglichen mit den nur 40 dB(A) auf dem 15,6-Zoll-Precision. Insgesamt ist das Precision 5470 klar eine der lautesten Workstations in ihrer bislang kleinen 14-Zoll-Kategorie.
Das System wird mit nur 40.3 dB(A) deutlich leiser, wenn man es im Balanced-Modus betreibt. Dabei geht wie erwähnt etwas CPU-Leistung verloren, aber die ruhigeren Lüfter dürften, je nach Umgebung, den Tausch wert sein.
Im Ultra-Performance-Modus fahren die internen Lüfter periodisch hoch, ohne erkennbaren Grund und selbst im Leerlauf auf dem Desktop. Auch darum empfehlen wir den Balanced- oder Quiet-Modus, sofern man gerade keine besonders anspruchsvollen Aufgaben zu erledigen hat.
Lautstärkediagramm
| Idle |
| 23.3 / 23.3 / 23.3 dB(A) |
| Last |
| 48.5 / 50.4 dB(A) |
 | ||
30 dB leise 40 dB(A) deutlich hörbar 50 dB(A) störend |
||
min: | ||
| Dell Precision 5000 5470 RTX A1000 Laptop GPU, i9-12900H, Samsung PM9A1 MZVL21T0HCLR | Lenovo ThinkPad P15v G2 21A9000XGE T1200 Laptop GPU, i7-11800H, Toshiba XG6 KXG6AZNV512G | Dell Precision 5000 5560 RTX A2000 Laptop GPU, i7-11850H, Samsung PM9A1 MZVL22T0HBLB | Lenovo ThinkPad P14s G2 AMD Vega 8, R7 PRO 5850U, SK Hynix PC711 1TB HFS001TDE9X081N | HP ZBook Firefly 14 G8 2C9Q2EA T500 Laptop GPU, i7-1165G7, Toshiba XG6 KXG60ZNV1T02 | HP ZBook Firefly 14 G7 Quadro P520, i7-10610U, Toshiba XG6 KXG60ZNV512G | |
|---|---|---|---|---|---|---|
| Geräuschentwicklung | 3% | 11% | 8% | -4% | -4% | |
| aus / Umgebung * (dB) | 23 | 25.21 -10% | 23.4 -2% | 24.04 -5% | 28.7 -25% | 29.7 -29% |
| Idle min * (dB) | 23.3 | 25.21 -8% | 23.6 -1% | 24.04 -3% | 28.7 -23% | 29.7 -27% |
| Idle avg * (dB) | 23.3 | 25.21 -8% | 23.6 -1% | 24.04 -3% | 28.7 -23% | 29.7 -27% |
| Idle max * (dB) | 23.3 | 25.21 -8% | 23.6 -1% | 24.04 -3% | 28.7 -23% | 30.4 -30% |
| Last avg * (dB) | 48.5 | 39.09 19% | 25.8 47% | 28.19 42% | 34 30% | 33.1 32% |
| Witcher 3 ultra * (dB) | 48.6 | 36.6 25% | 40.1 17% | 40.1 17% | 35.3 27% | |
| Last max * (dB) | 50.4 | 43.53 14% | 41.4 18% | 40.77 19% | 40.1 20% | 37.9 25% |
* ... kleinere Werte sind besser
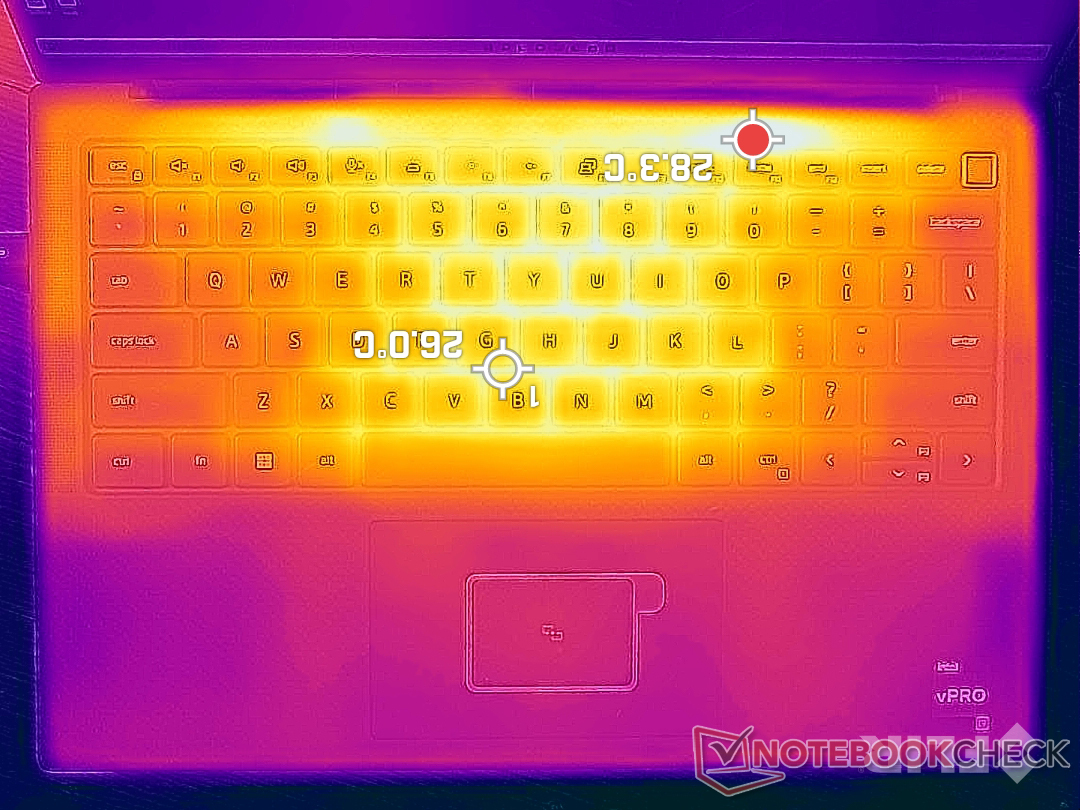
Temperatur
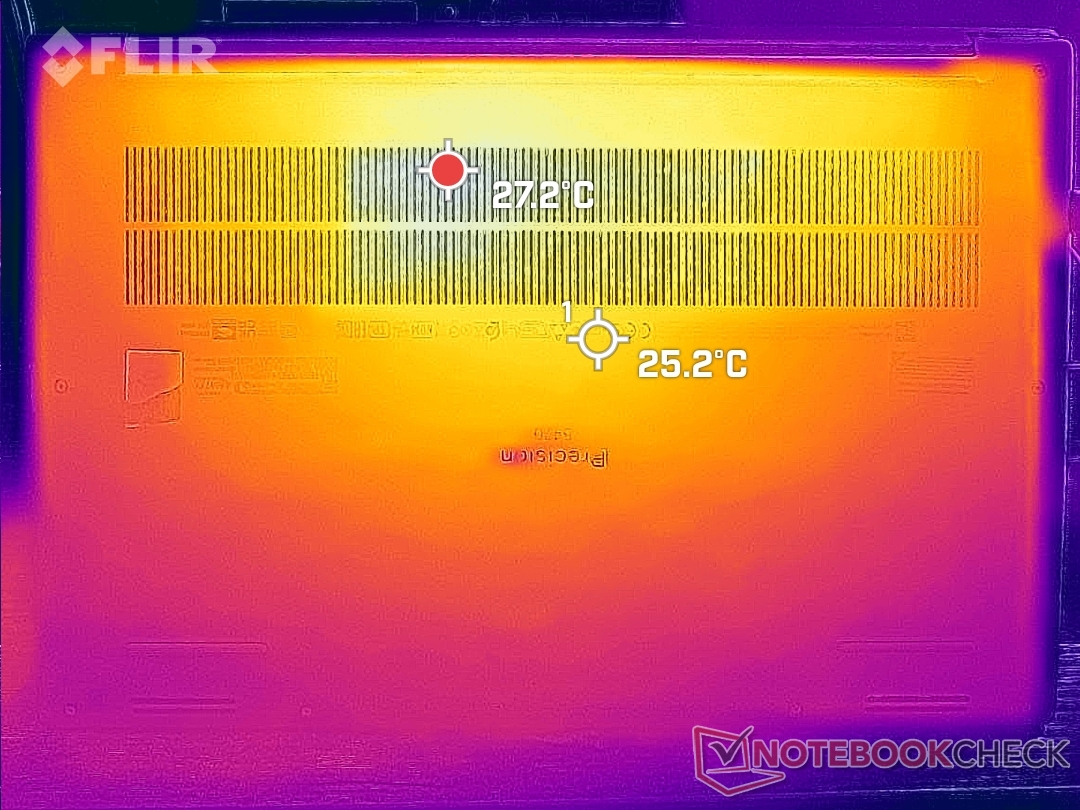
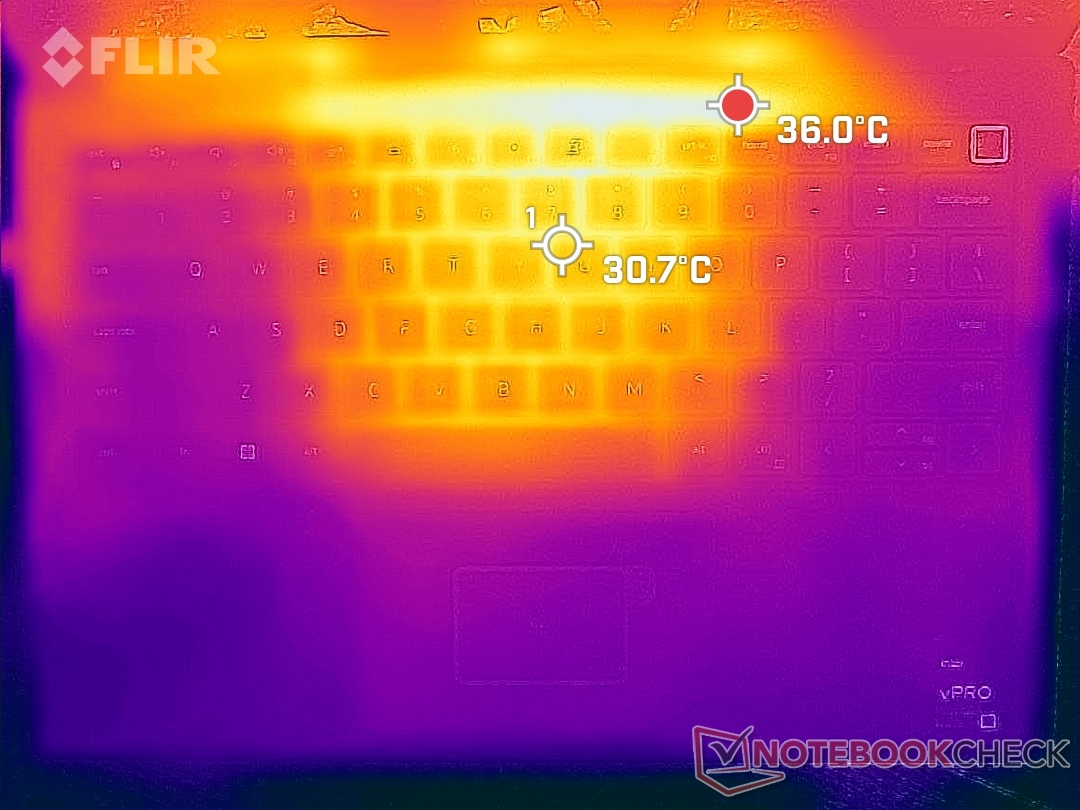
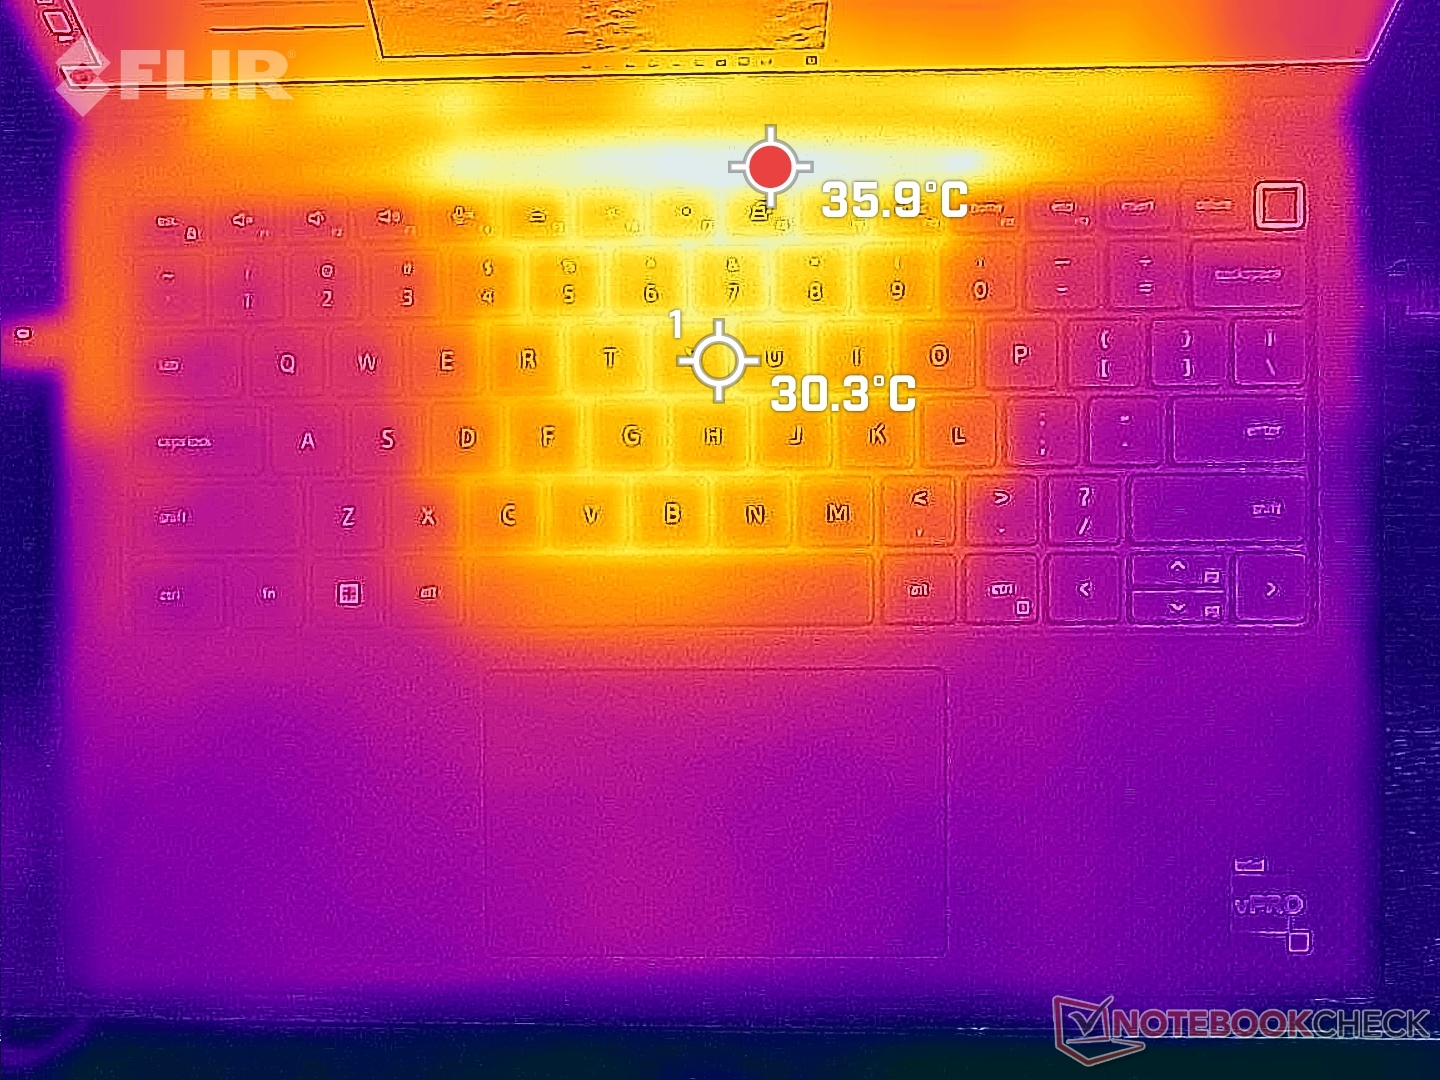
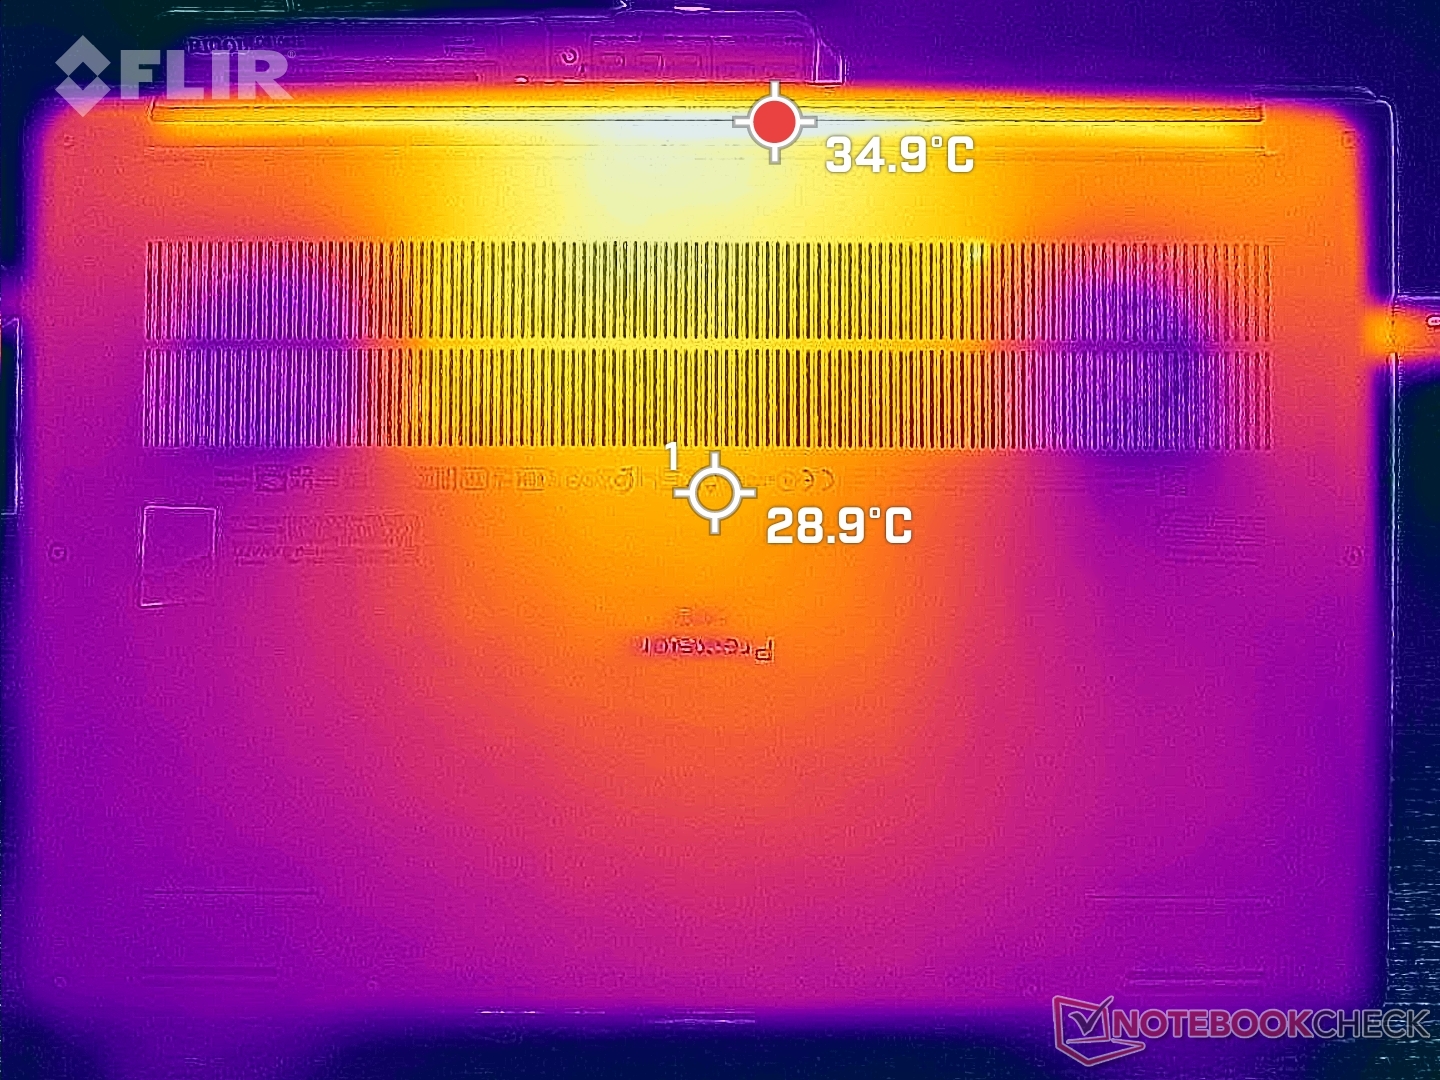
In Anbetracht der hitzigen Core-H-CPU, der dedizierten Nvidia-Grafik und dem kleinen Gehäuse sind die Temperaturen niedriger als erwartet. Alternative 14-Zoll-Workstations wie das ZBook Firefly 14 G8 oder das ThinkPad P14s G2 werden trotz langsamerer CPU deutlich wärmer und erreichen Hot Spots von 49 °C, verglichen mit den 42 °C auf unserem Precision. Allerdings kann die Tastaturmitte mit ebenfalls bis zu 42 °C recht warm werden.
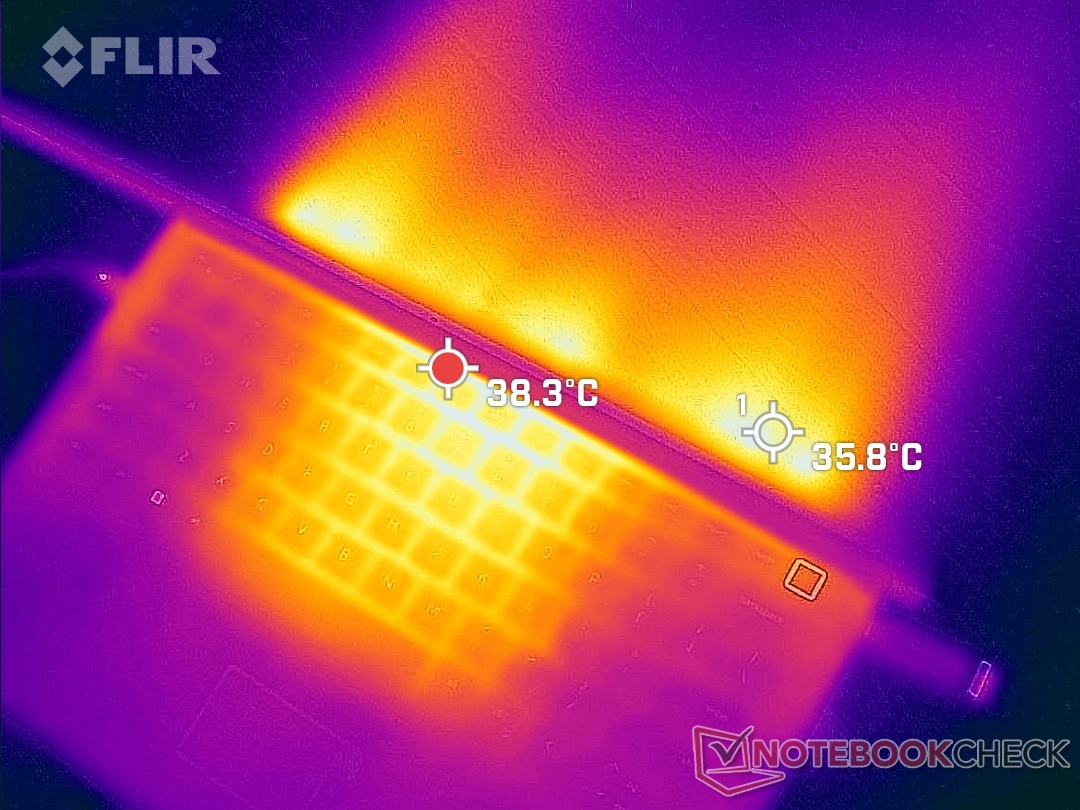
(±) Die maximale Temperatur auf der Oberseite ist 41.8 °C. Im Vergleich liegt der Klassendurchschnitt bei 38.2 °C (von 22.2 bis 69.8 °C für die Klasse Workstation).
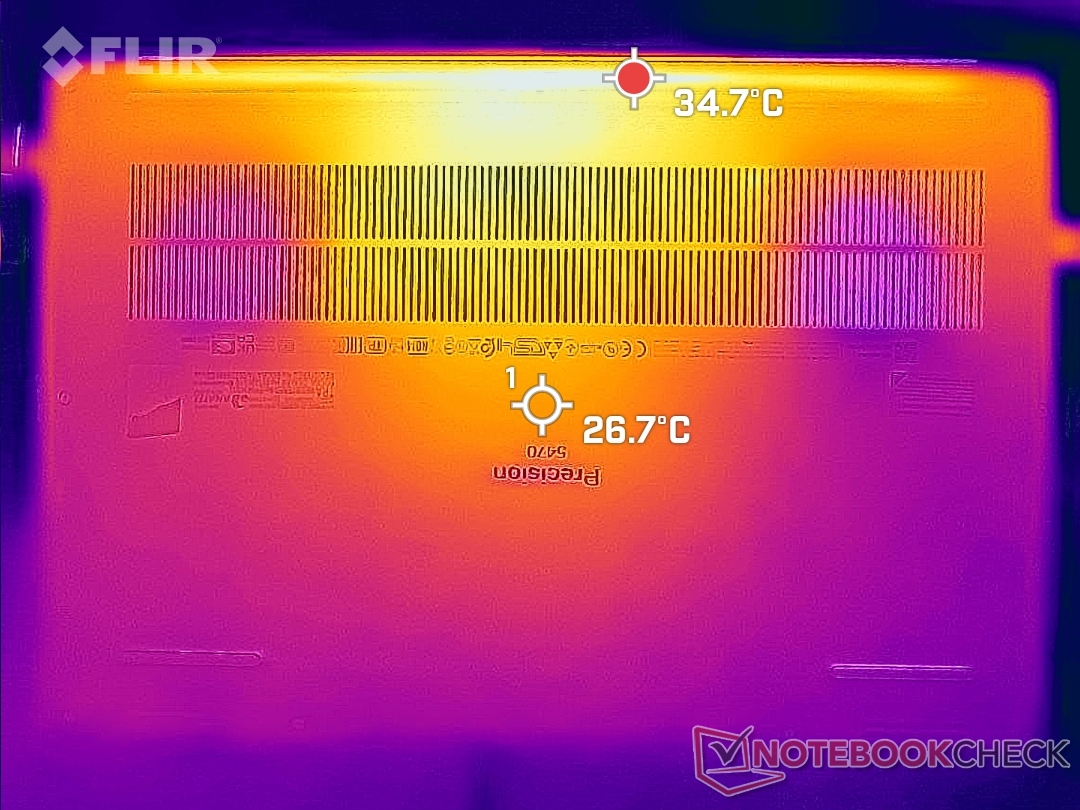
(+) Auf der Unterseite messen wir eine maximalen Wert von 36 °C (im Vergleich zum Durchschnitt von 41.1 °C).
(+) Ohne Last messen wir eine durchschnittliche Temperatur von 31 °C auf der Oberseite. Der Klassendurchschnitt erreicht 32 °C.
(±) Beim längeren Spielen von The Witcher 3 erhitzt sich das Gerät durchschnittlich auf 32.2 °C. Der Durchschnitt der Klasse ist derzeit 32 °C.
(+) Die Handballen und der Touchpad-Bereich sind mit gemessenen 27.6 °C kühler als die typische Hauttemperatur und fühlen sich dadurch kühl an.
(±) Die durchschnittliche Handballen-Temperatur anderer getesteter Geräte war 27.8 °C (+0.2 °C).
| Dell Precision 5000 5470 Intel Core i9-12900H, NVIDIA RTX A1000 Laptop GPU | Lenovo ThinkPad P15v G2 21A9000XGE Intel Core i7-11800H, NVIDIA T1200 Laptop GPU | Dell Precision 5000 5560 Intel Core i7-11850H, NVIDIA RTX A2000 Laptop GPU | Lenovo ThinkPad P14s G2 AMD AMD Ryzen 7 PRO 5850U, AMD Radeon RX Vega 8 (Ryzen 4000/5000) | HP ZBook Firefly 14 G8 2C9Q2EA Intel Core i7-1165G7, NVIDIA T500 Laptop GPU | HP ZBook Firefly 14 G7 Intel Core i7-10610U, NVIDIA Quadro P520 | |
|---|---|---|---|---|---|---|
| Hitze | -9% | -10% | 1% | 5% | -7% | |
| Last oben max * (°C) | 41.8 | 53.8 -29% | 48.2 -15% | 42.8 -2% | 42.6 -2% | 52.3 -25% |
| Last unten max * (°C) | 36 | 52.1 -45% | 42.6 -18% | 47.5 -32% | 49.4 -37% | 60.9 -69% |
| Idle oben max * (°C) | 34.6 | 27.6 20% | 34.8 -1% | 27 22% | 24.2 30% | 23.1 33% |
| Idle unten max * (°C) | 33.6 | 27.7 18% | 35.2 -5% | 28.3 16% | 24.6 27% | 23 32% |
* ... kleinere Werte sind besser
Stresstest — Schwankende CPU-Taktraten
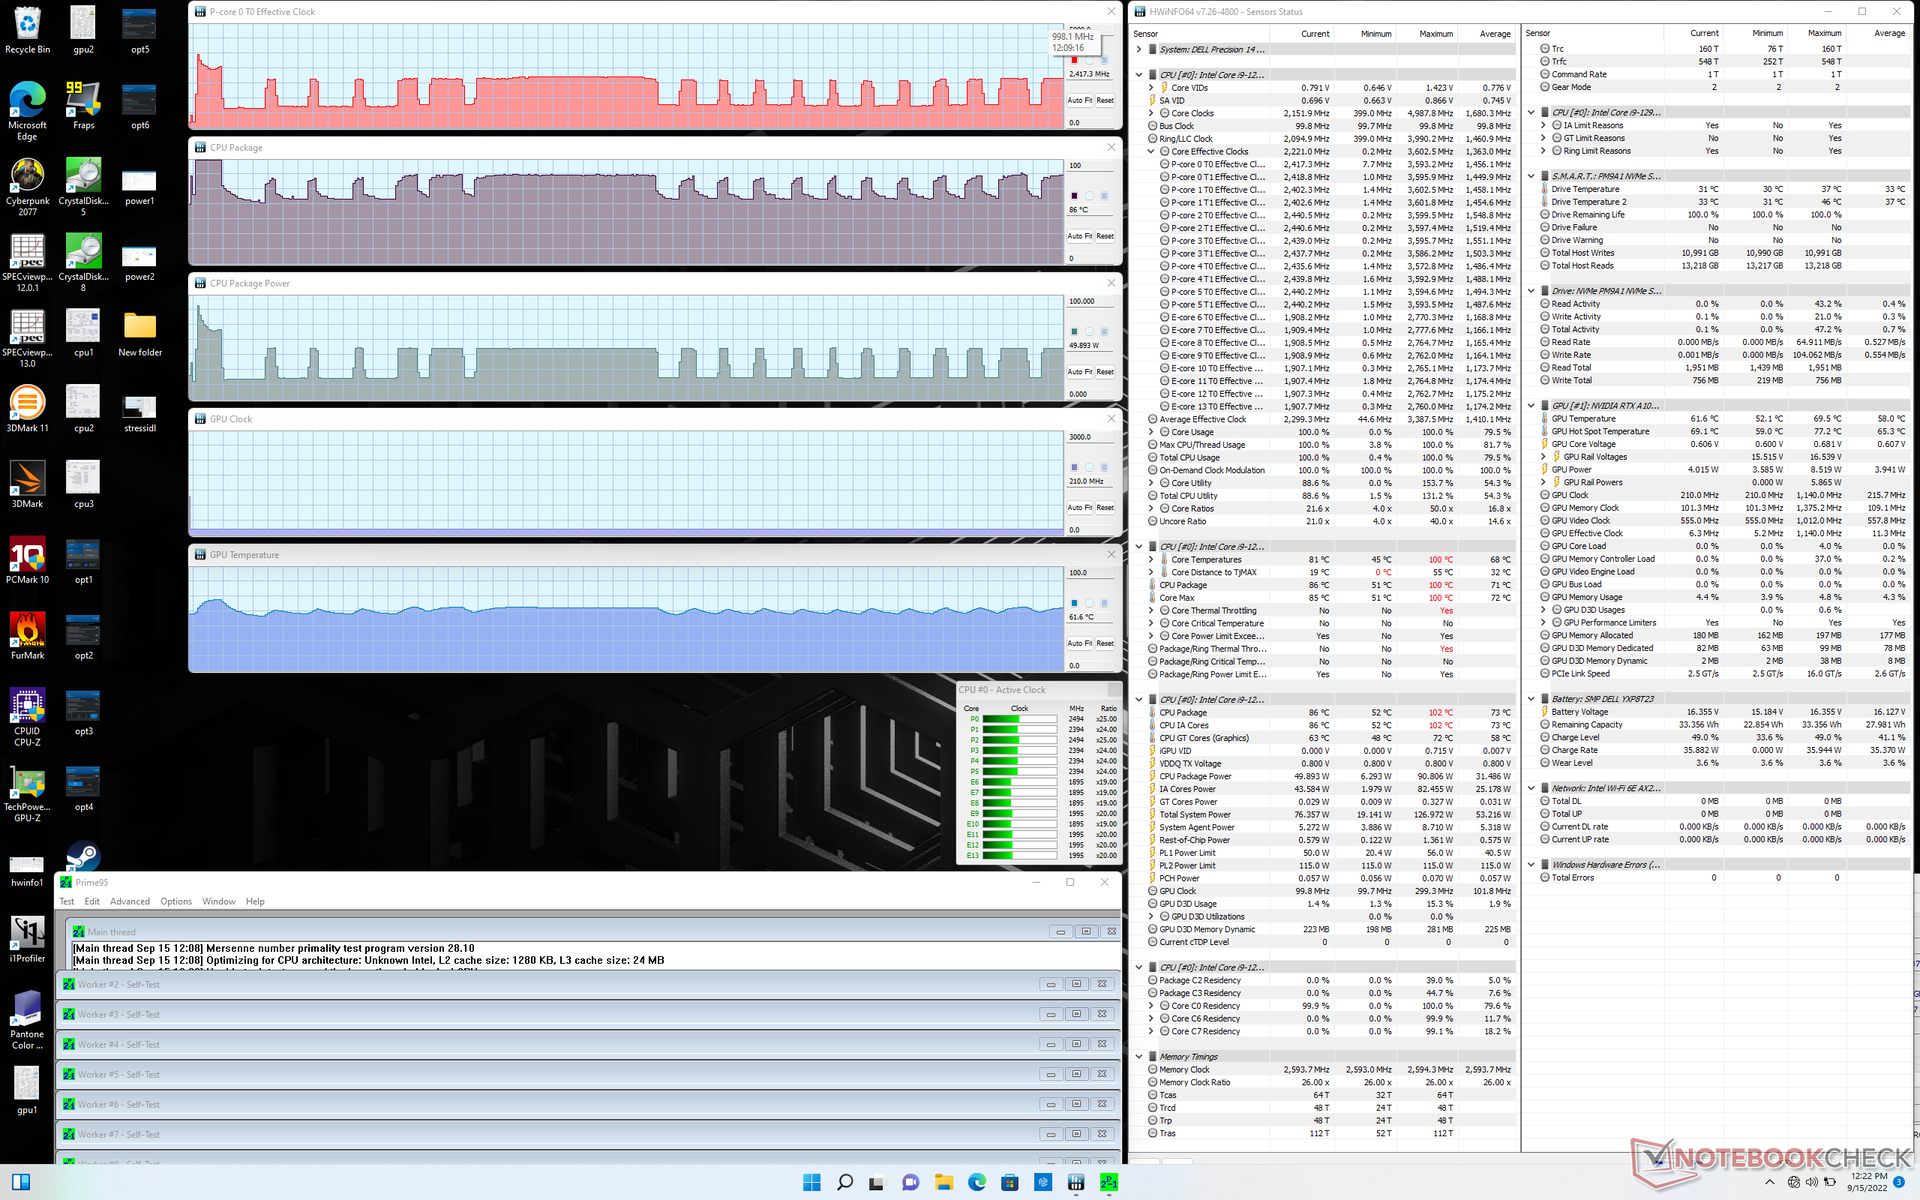
Unter Prime95 maximieren sich die CPU-Taktraten, die Leistungsaufnahme und die Kerntemperaturen kurzzeitig auf 3,6 GHz, 91 W und 101 °C. Nach wenigen Sekunden schwanken die gleichen Werte dann zwischen 1,0 und 2,4 GHz, 20 bis 50 W und 61 bis 82 °C. Dieses inkonsistente Verhalten spiegelt die Ergebnisse unseres CineBency-R15-xT-Loop-Tests wider und zeigt, dass das Precision 5470 keine konstanten Turbo-Boost-Takraten über längere Zeit halten kann. Einen Core i9-12900H mit seinem vollen Potential in einem so kleinen Gehäuse laufen zu lassen, bleibt also vorerst ein Wunschtraum.
Unter Witcher 3 stabilisieren sich CPU und GPU bei 82 und 71 °C, verglichen mit den 69 und 75 °C auf dem Precision 5560.
Im Akkumodus reduziert sich vor allem die CPU-Leistung. Ein neuer Fire-Strike-Durchgang erbrachte nur noch Physics- und Graphics-Scores von 21.067 und 10.542 Punkten, anstelle der 27.514 und 10.914 Punkte an der Steckdose.
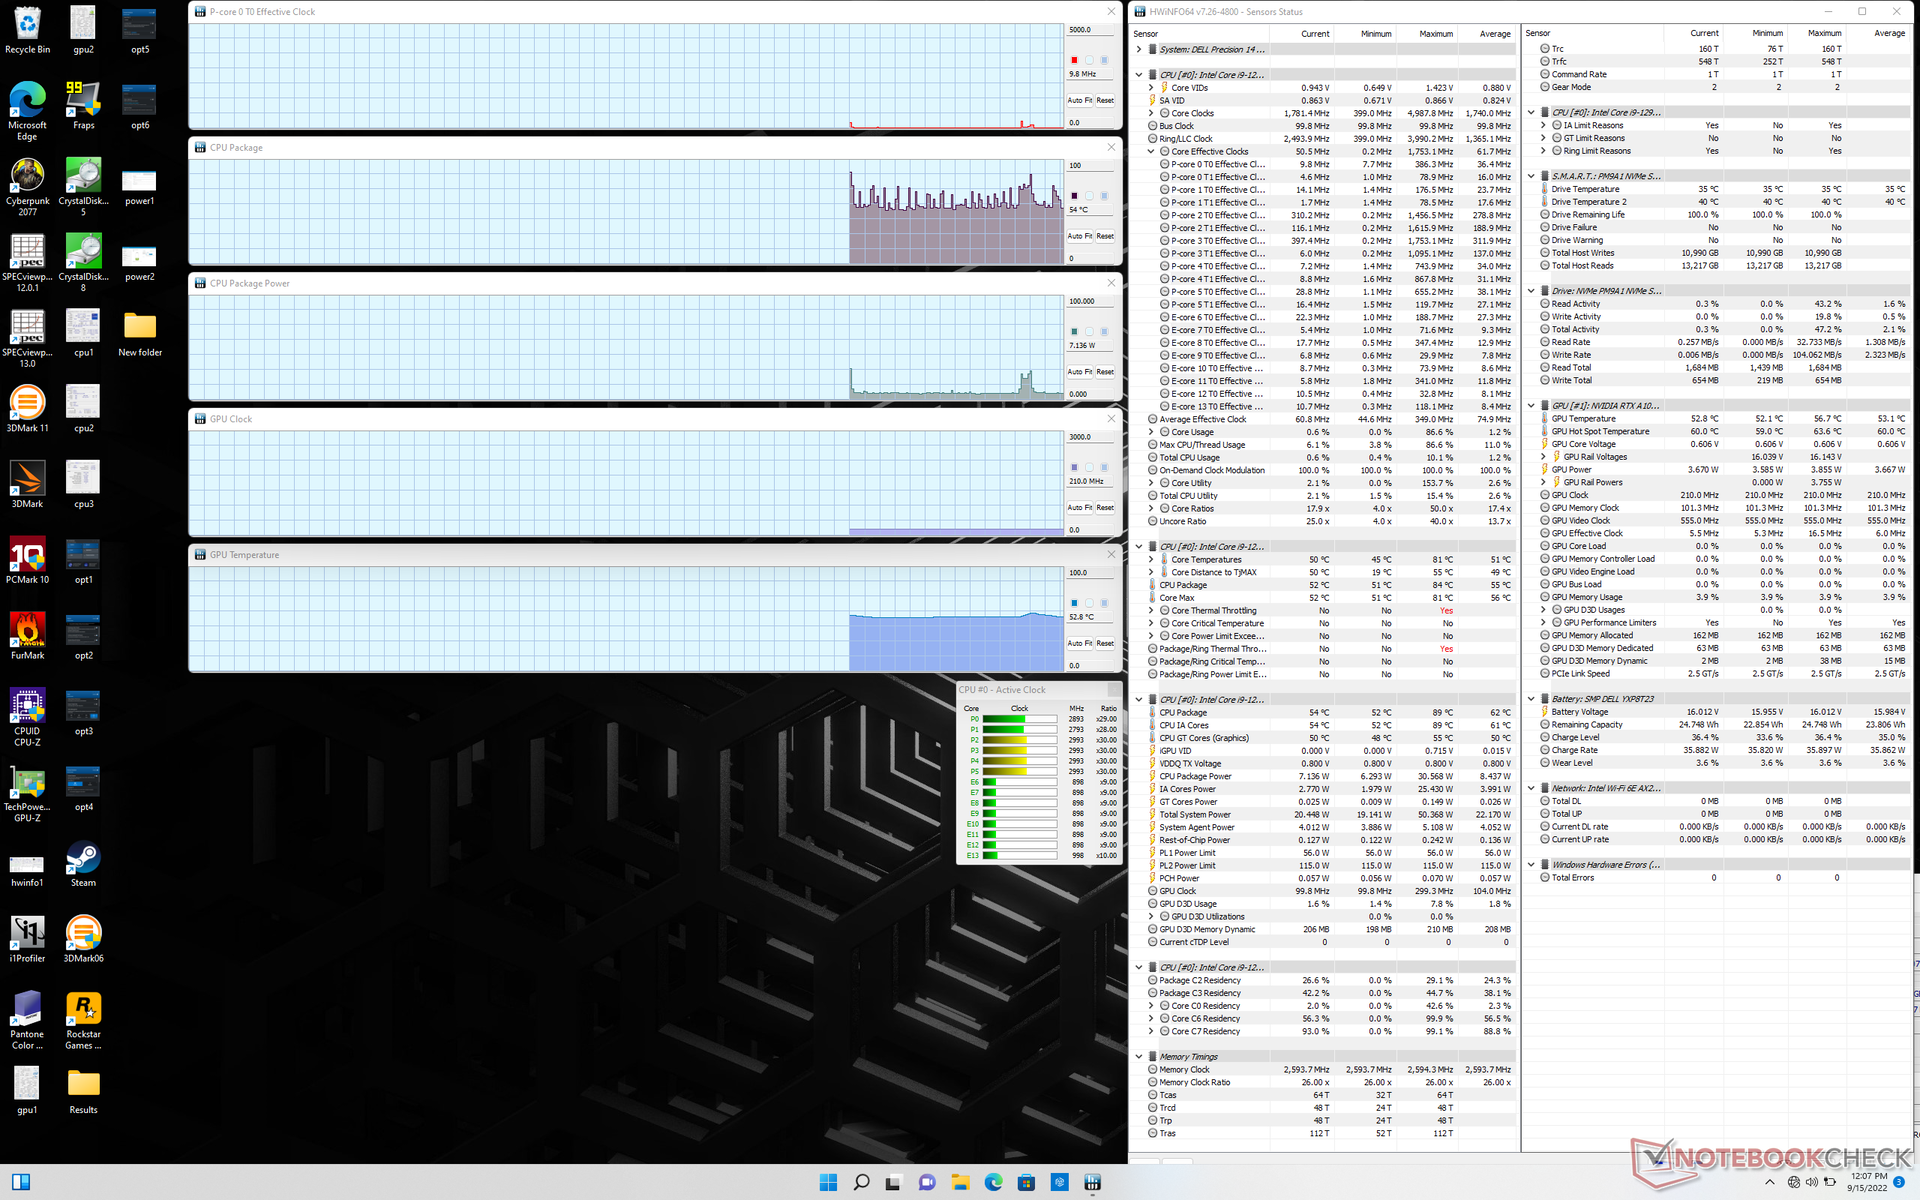
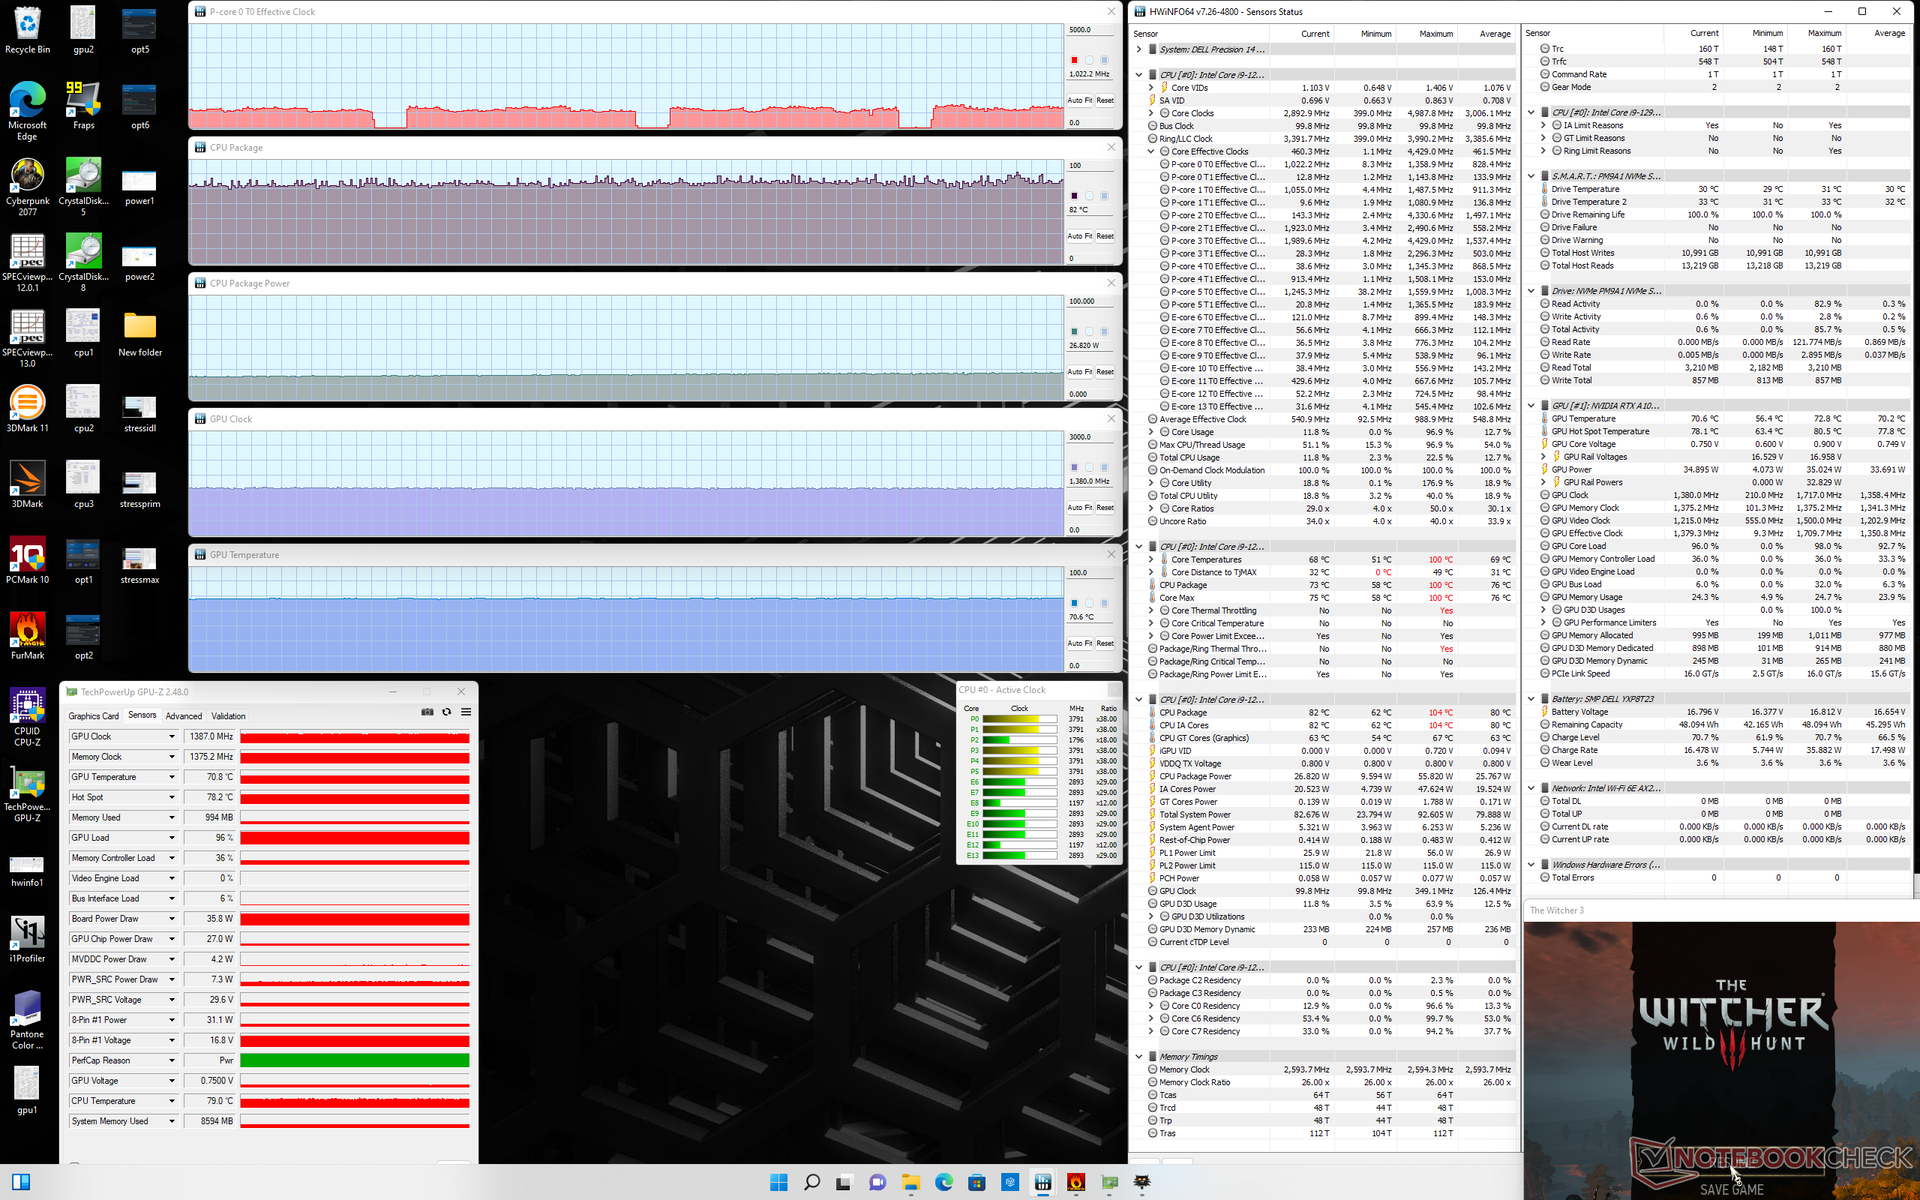
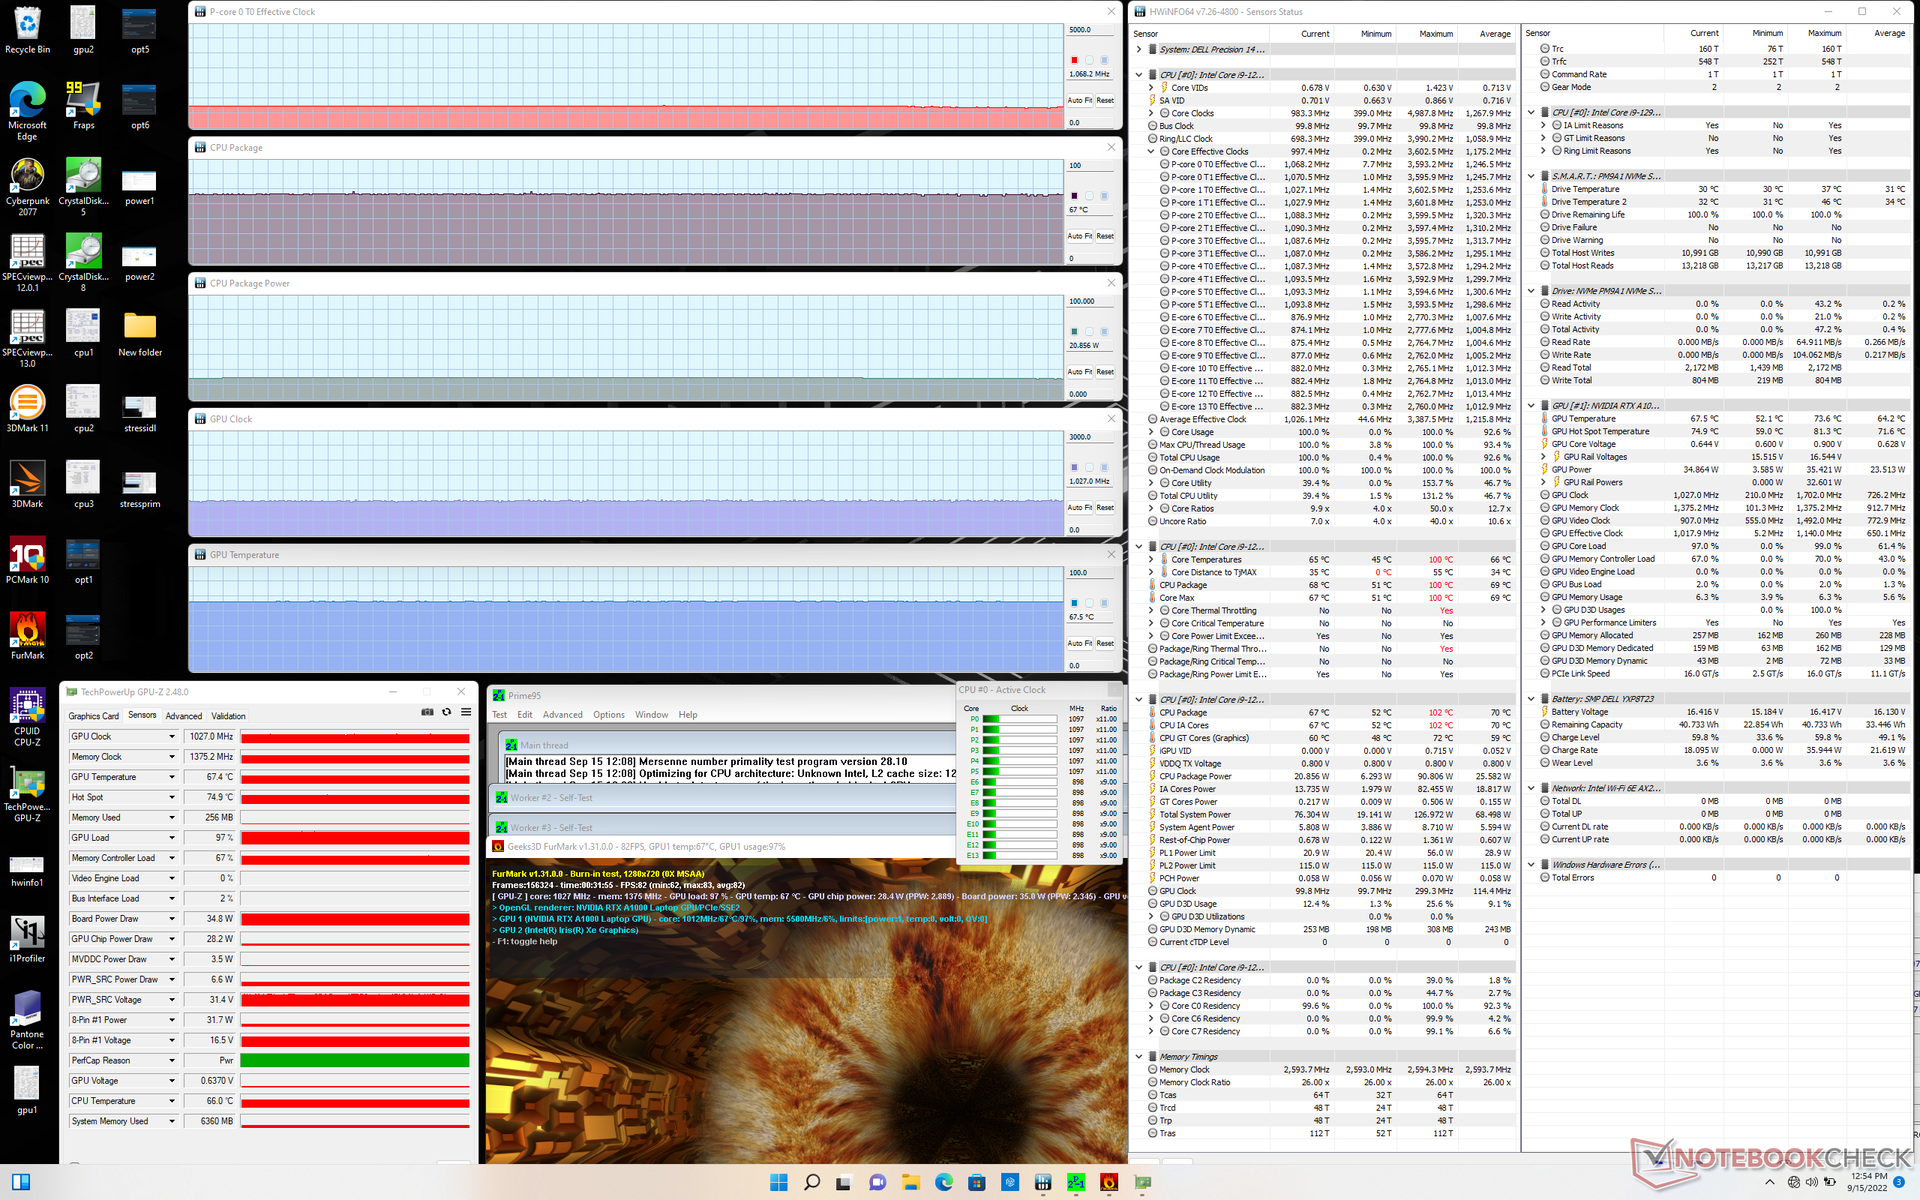
| CPU Clock (GHz) | GPU Clock (MHz) | Average CPU Temperature (°C) | Average GPU Temperature (°C) | |
| System Idle | -- | -- | 54 | 53 |
| Prime95 Stress | 1.0 - 2.4 | -- | 61 - 80 | ~61 |
| Prime95 + FurMark Stress | 1.1 | 1027 | 67 | 68 |
| Witcher 3 Stress | 1.0 | 1387 | 82 | 71 |
Speakers
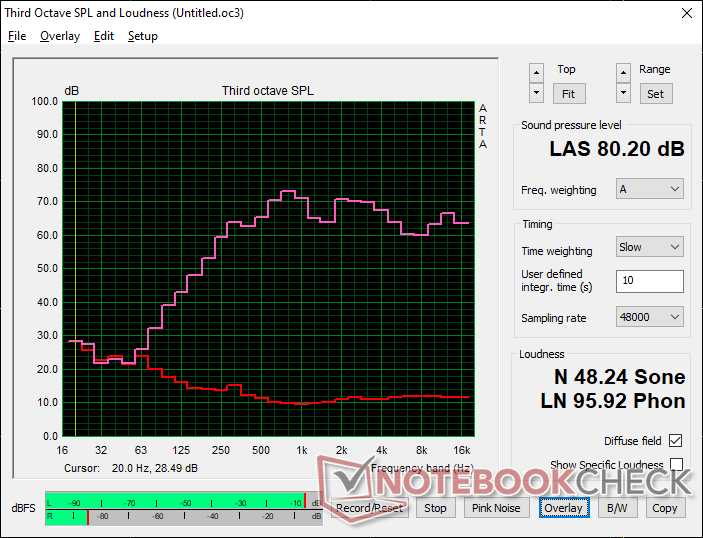
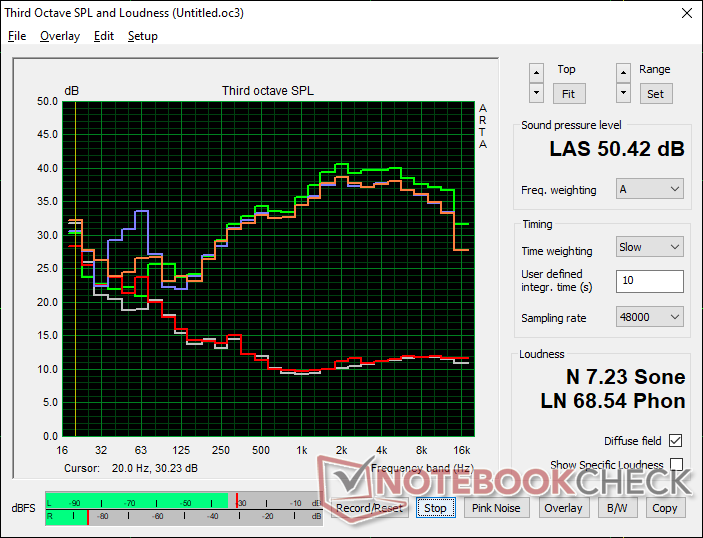
Dell Precision 5000 5470 Audio Analyse
(±) | Mittelmäßig laut spielende Lautsprecher (80.2 dB)
Bass 100 - 315 Hz
(±) | abgesenkter Bass - 12.9% geringer als der Median
(±) | durchschnittlich lineare Bass-Wiedergabe (10.1% Delta zum Vorgänger)
Mitteltöne 400 - 2000 Hz
(+) | ausgeglichene Mitten, vom Median nur 4.2% abweichend
(+) | lineare Mitten (6.5% Delta zum Vorgänger)
Hochtöne 2 - 16 kHz
(+) | ausgeglichene Hochtöne, vom Median nur 3.4% abweichend
(+) | sehr lineare Hochtöne (3.9% Delta zum Vorgänger)
Gesamt im hörbaren Bereich 100 - 16.000 Hz
(+) | hörbarer Bereich ist sehr linear (12.9% Abstand zum Median
Im Vergleich zu allen Geräten derselben Klasse
» 21% aller getesteten Geräte dieser Klasse waren besser, 6% vergleichbar, 72% schlechter
» Das beste Gerät hat einen Delta-Wert von 7%, durchschnittlich ist 17%, das schlechteste Gerät hat 35%
Im Vergleich zu allen Geräten im Test
» 12% aller getesteten Geräte waren besser, 3% vergleichbar, 85% schlechter
» Das beste Gerät hat einen Delta-Wert von 4%, durchschnittlich ist 24%, das schlechteste Gerät hat 134%
Apple MacBook Pro 16 2021 M1 Pro Audio Analyse
(+) | Die Lautsprecher können relativ laut spielen (84.7 dB)
Bass 100 - 315 Hz
(+) | guter Bass - nur 3.8% Abweichung vom Median
(+) | lineare Bass-Wiedergabe (5.2% Delta zum Vorgänger)
Mitteltöne 400 - 2000 Hz
(+) | ausgeglichene Mitten, vom Median nur 1.3% abweichend
(+) | lineare Mitten (2.1% Delta zum Vorgänger)
Hochtöne 2 - 16 kHz
(+) | ausgeglichene Hochtöne, vom Median nur 1.9% abweichend
(+) | sehr lineare Hochtöne (2.7% Delta zum Vorgänger)
Gesamt im hörbaren Bereich 100 - 16.000 Hz
(+) | hörbarer Bereich ist sehr linear (4.6% Abstand zum Median
Im Vergleich zu allen Geräten derselben Klasse
» 0% aller getesteten Geräte dieser Klasse waren besser, 0% vergleichbar, 100% schlechter
» Das beste Gerät hat einen Delta-Wert von 5%, durchschnittlich ist 17%, das schlechteste Gerät hat 45%
Im Vergleich zu allen Geräten im Test
» 0% aller getesteten Geräte waren besser, 0% vergleichbar, 100% schlechter
» Das beste Gerät hat einen Delta-Wert von 4%, durchschnittlich ist 24%, das schlechteste Gerät hat 134%
Energiemanagement
Energieverbrauch — Eine anspruchsvolle, kleine Machine
Im Leerlauf auf dem Desktop bei minimierter Helligkeit und dem niedrigsten Leistungsprofil schluckt etwa 4,3 W, während bei maximaler Helligkeit und höchstem Leistungsprofil mit aktivierter dGPU beinahe 19 W benötigt. Unter anspruchsvolleren Lasten wie zum Beispiel Gaming verlangt das kleine System genauso viel Energie wie das größere Precision 5560 mit schnellerer RTX A2000 aber langsameren Core i7-11850H. Insgesamt ist unser Testmodell anspruchsvoller als andere 14-Zoll-Workstations, was angesichts der schnelleren Hardware kaum überrascht.
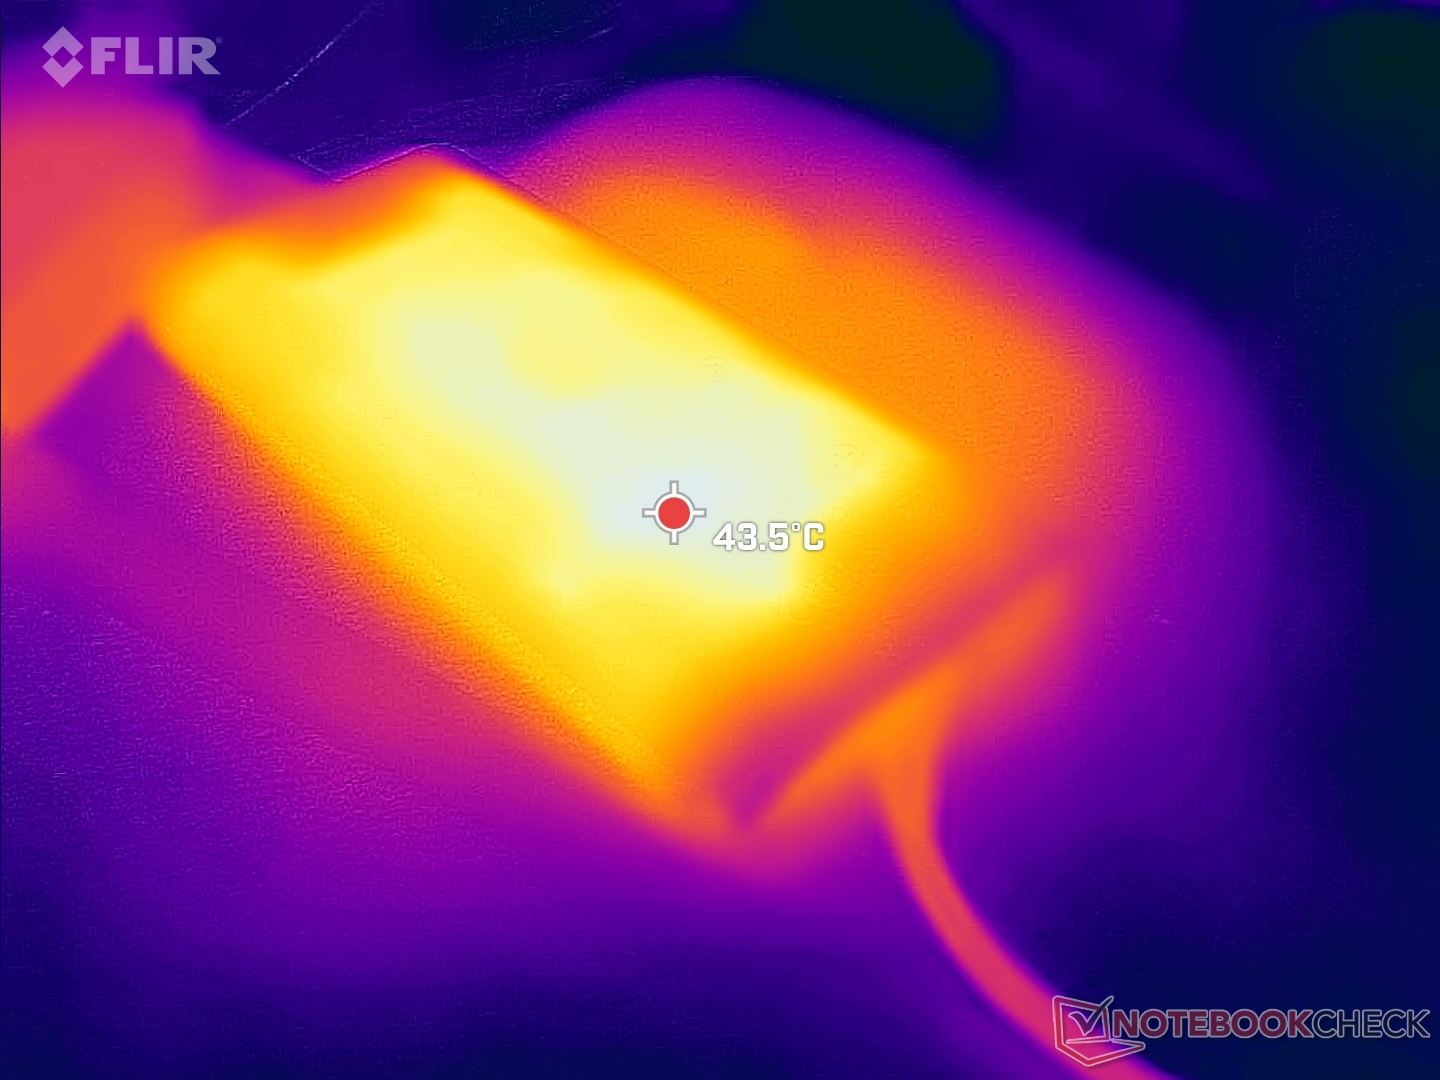
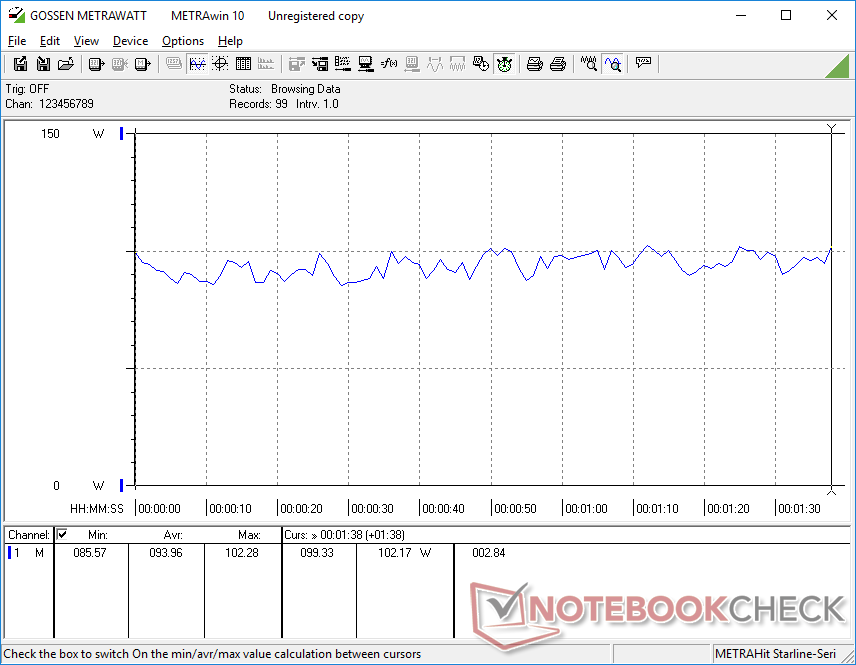
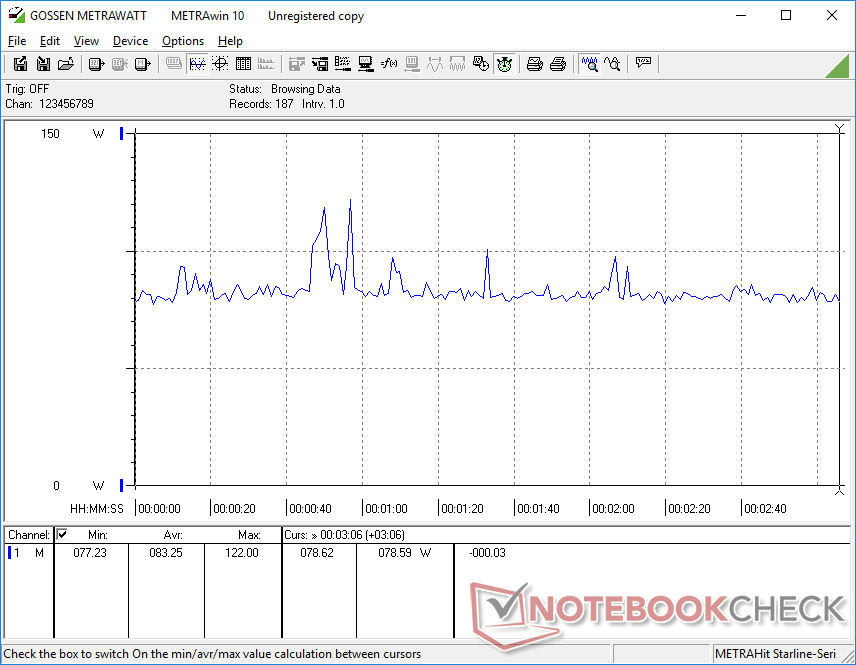
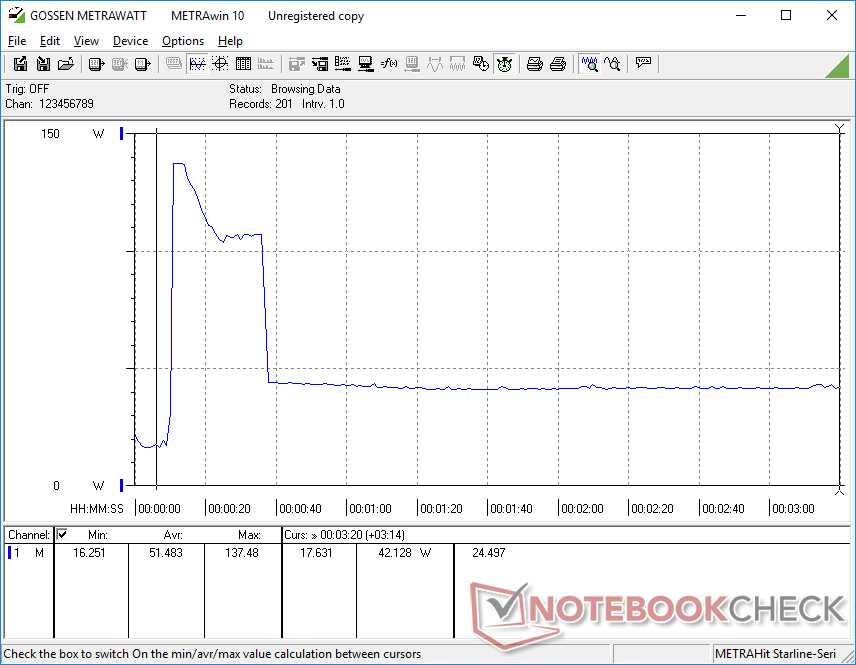
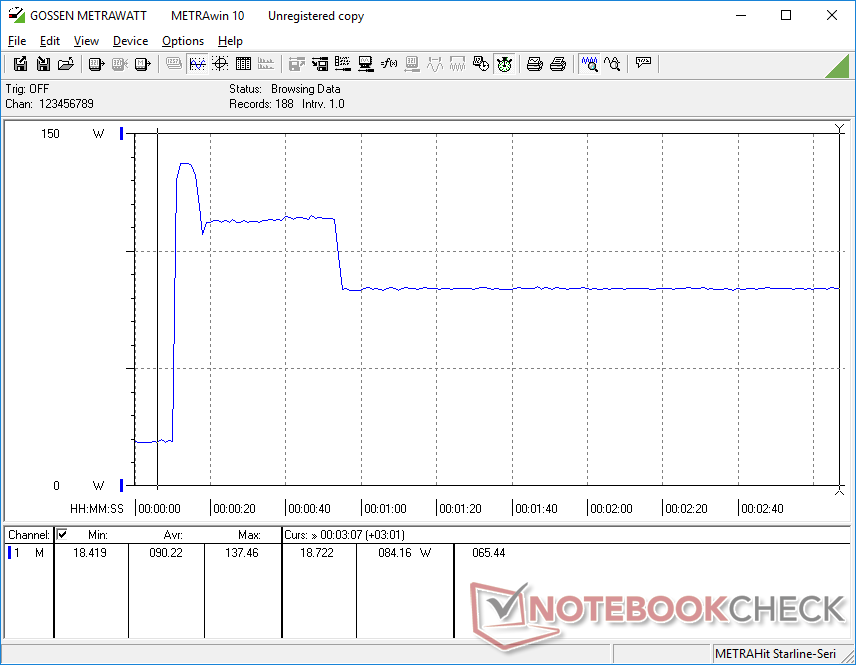
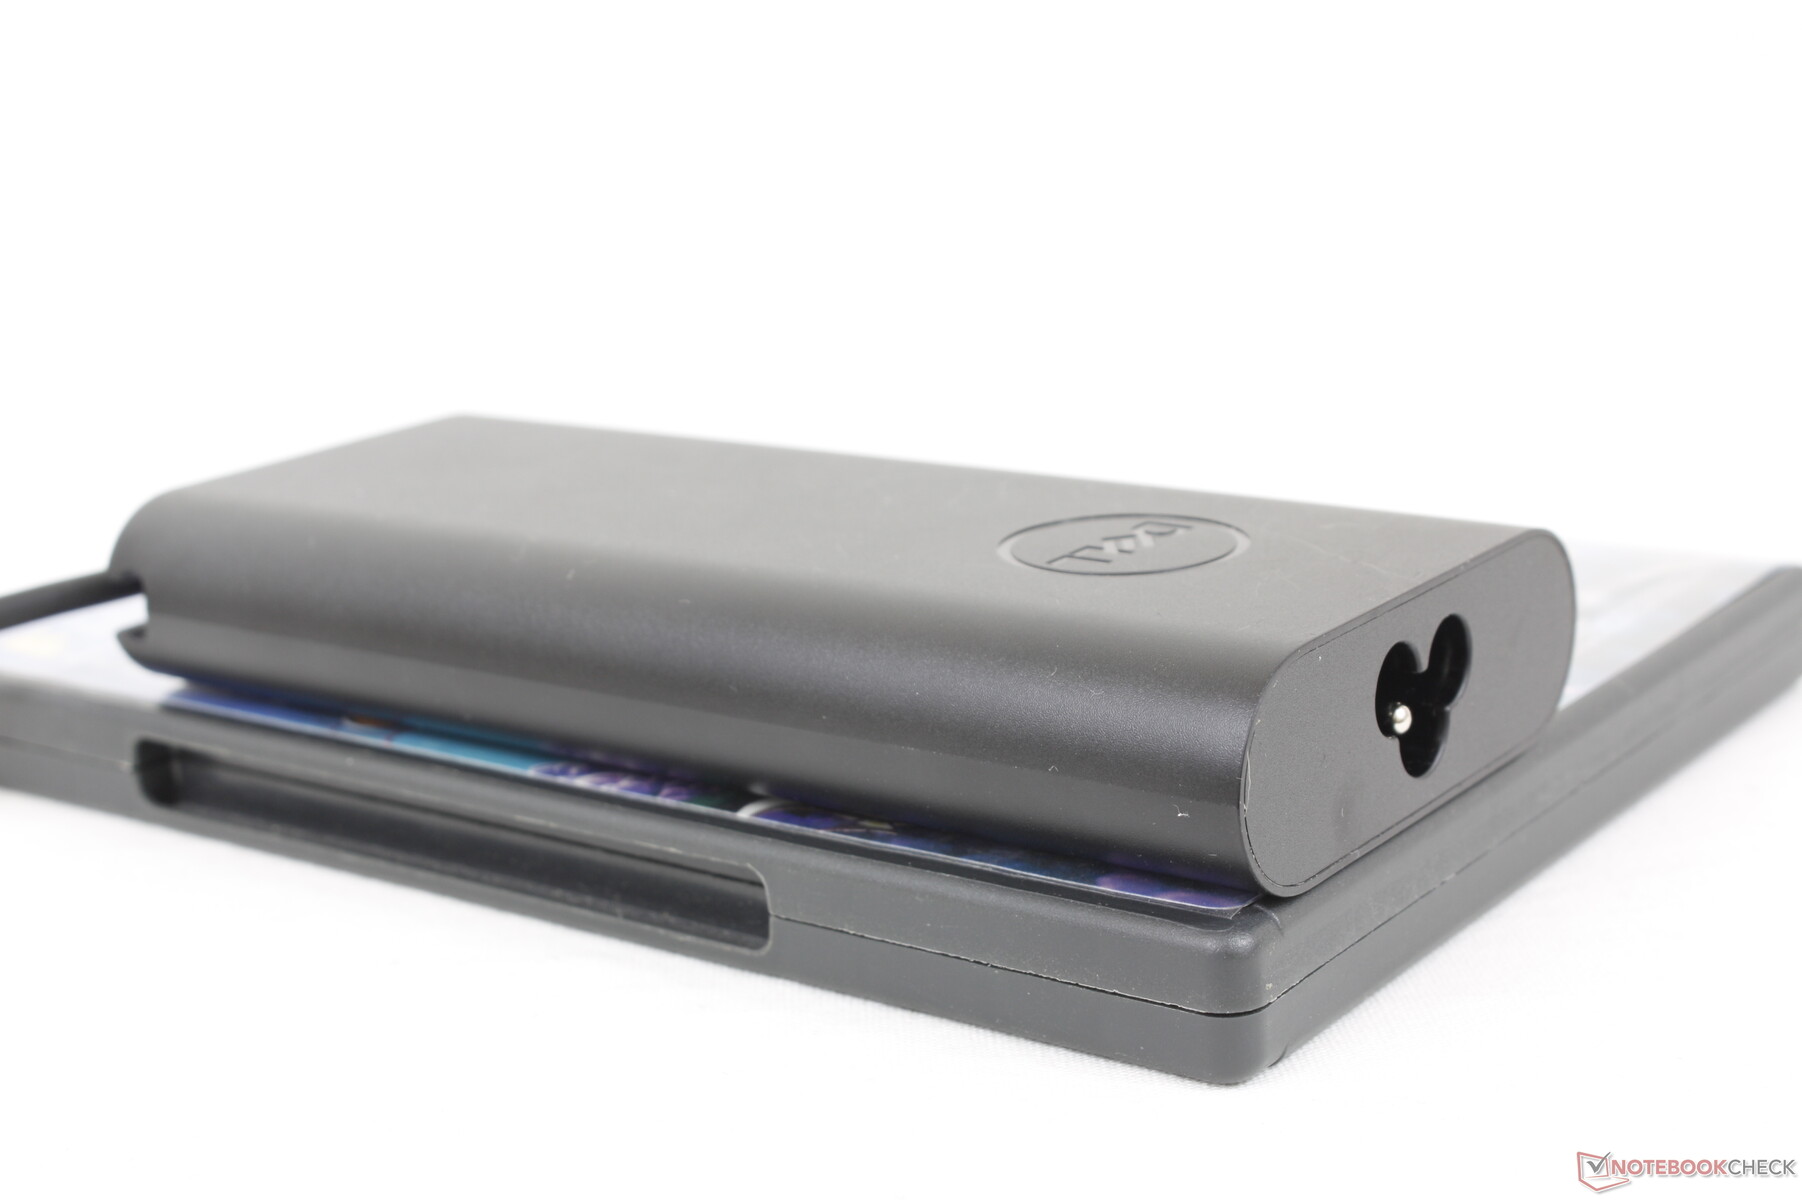
Wir messen einen Maximalverbrauch von annähernd 138 W aus dem kleinen bis mittelgroßen (~14,3 x 6,5 x 2,2 cm) 130-W-USB-C-Netzteil unter Prime95. Wie die unteren Screenshots zeigen, ist dieser Wert nur temporär, was vor allem an den schnell greifenden, thermischen Einschränkungen des Kühlsystems liegt. Die Form der Verbrauchskurve passt zu unseren Beobachtungen der Taktraten und Leistungsaufnahme weiter oben.
Konfigurationen mit integrierter Xe-Grafik anstelle dedizierter RTX A1000 werden mit einem kleineren 90-W-USB-C-Netzteil ausgeliefert.
| Aus / Standby | |
| Idle | |
| Last |
|
Legende:
min: | |
| Dell Precision 5000 5470 i9-12900H, RTX A1000 Laptop GPU, Samsung PM9A1 MZVL21T0HCLR, IPS, 2560x1600, 14" | Lenovo ThinkPad P15v G2 21A9000XGE i7-11800H, T1200 Laptop GPU, Toshiba XG6 KXG6AZNV512G, IPS LED, 1920x1080, 15.6" | Dell Precision 5000 5560 i7-11850H, RTX A2000 Laptop GPU, Samsung PM9A1 MZVL22T0HBLB, IPS, 3840x2400, 15.6" | Lenovo ThinkPad P14s G2 AMD R7 PRO 5850U, Vega 8, SK Hynix PC711 1TB HFS001TDE9X081N, IPS LED, 3840x2160, 14" | HP ZBook Firefly 14 G8 2C9Q2EA i7-1165G7, T500 Laptop GPU, Toshiba XG6 KXG60ZNV1T02, IPS, 1920x1080, 14" | HP ZBook Firefly 14 G7 i7-10610U, Quadro P520, Toshiba XG6 KXG60ZNV512G, IPS, 1920x1080, 14" | |
|---|---|---|---|---|---|---|
| Stromverbrauch | 1% | -22% | 35% | 40% | 30% | |
| Idle min * (Watt) | 4.3 | 5.96 -39% | 6.2 -44% | 4.49 -4% | 3.1 28% | 3.3 23% |
| Idle avg * (Watt) | 8.9 | 8.37 6% | 13.9 -56% | 9.62 -8% | 4.7 47% | 9.3 -4% |
| Idle max * (Watt) | 18.9 | 9.05 52% | 23.8 -26% | 10.24 46% | 8.6 54% | 12.1 36% |
| Last avg * (Watt) | 94 | 91.82 2% | 95.7 -2% | 31.56 66% | 64.8 31% | 59.4 37% |
| Witcher 3 ultra * (Watt) | 83.2 | 102 -23% | 87 -5% | 43.7 47% | 59.6 28% | 52.7 37% |
| Last max * (Watt) | 137.5 | 126.38 8% | 132.6 4% | 52.37 62% | 68.5 50% | 69.4 50% |
* ... kleinere Werte sind besser
Energieverbrauch Witcher 3 / Stresstest
Energieverbrauch mit externem Monitor
Aukkulaufzeit
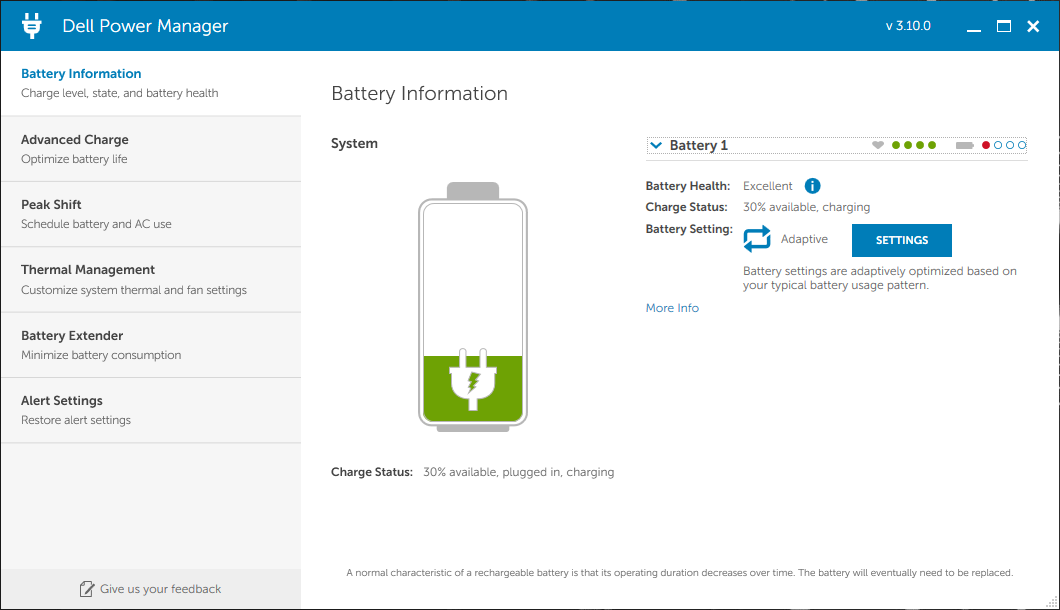
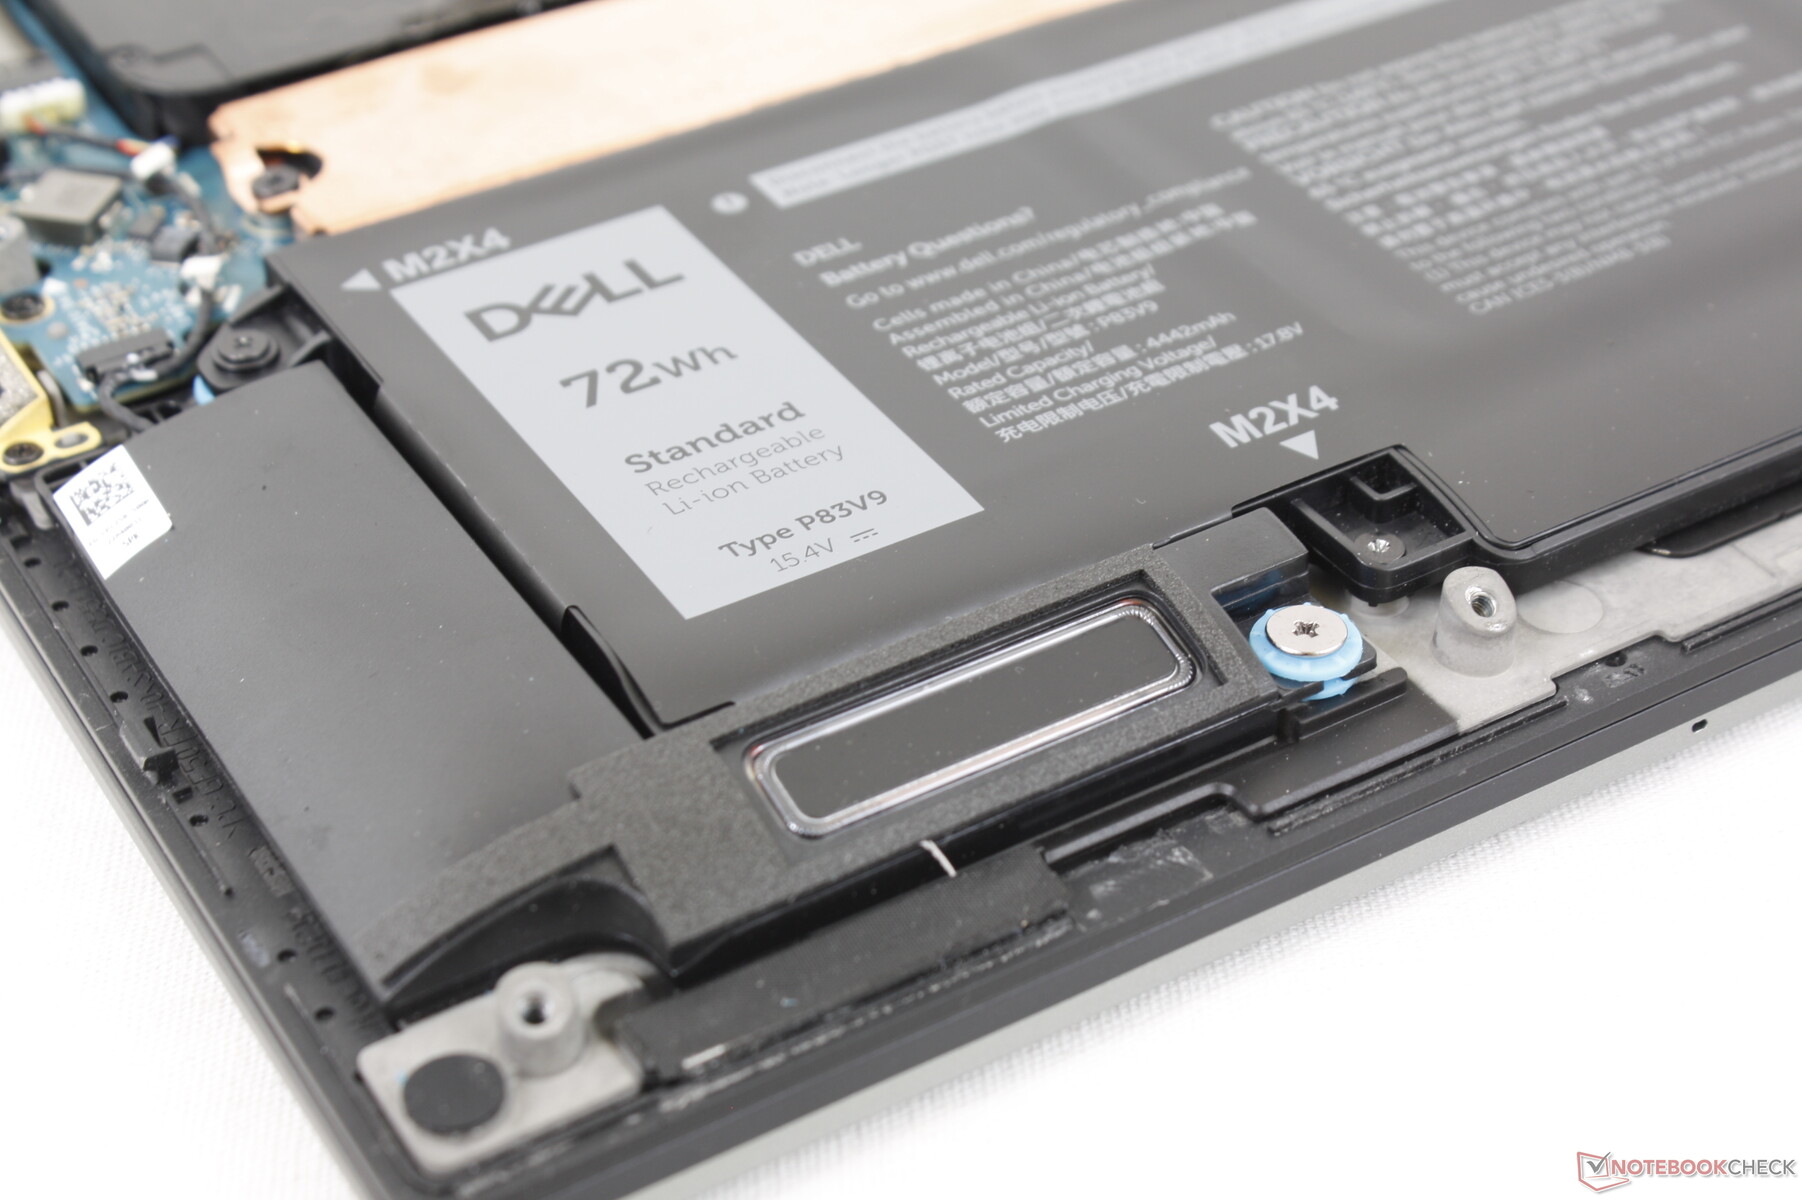
Die Akkukapazität ist mit 72 Wh für einen ultradünnen 14-Zoll-Laptop recht groß. Die gemessene WLAN-Laufzeit ist mit knapp über 9,5 Stunden ein paar Stunden kürzer als auf dem HP ZBook Firefly 14 G8 mit langsamerer Core-U-CPU.
Eine komplette Aufladung von 0 bis 100 Prozent dauert etwa zwei Stunden.
| Dell Precision 5000 5470 i9-12900H, RTX A1000 Laptop GPU, 72 Wh | Lenovo ThinkPad P15v G2 21A9000XGE i7-11800H, T1200 Laptop GPU, 68 Wh | Dell Precision 5000 5560 i7-11850H, RTX A2000 Laptop GPU, 86 Wh | Lenovo ThinkPad P14s G2 AMD R7 PRO 5850U, Vega 8, 50 Wh | HP ZBook Firefly 14 G8 2C9Q2EA i7-1165G7, T500 Laptop GPU, 53 Wh | HP ZBook Firefly 14 G7 i7-10610U, Quadro P520, 53 Wh | |
|---|---|---|---|---|---|---|
| Akkulaufzeit | -8% | 4% | 7% | 162% | 21% | |
| Idle (h) | 14.7 | 17.2 17% | 12 -18% | |||
| WLAN (h) | 9.6 | 7.5 -22% | 6.3 -34% | 8.3 -14% | 12.8 33% | 10.1 5% |
| Last (h) | 1.1 | 0.9 -18% | 1.8 64% | 1.4 27% | 4.3 291% | 1.5 36% |
| H.264 (h) | 8 | 10.6 | 12.5 |
Pro
Contra
Fazit — Mega-Powerful ohne die Mega-Größe
Das Precision 5470 lässt sich am besten als dünne und leichte Workstation mit einem Prozessor für dicke und schwere Gaming-Laptops beschreiben. Es wird sich so schnell wohl keine andere, derart kompakte 14-Zoll-Workstation mit dem gleichen Core i9-12900H und sogar noch einer dedizierten Nvidia RTX finden. Wer nach der maximalen Leistung in einem möglichst kleinen und leichten Gehäuse strebt, wird mit dem Precision 5470 womöglich zufrieden sein.
Das Precision 5470 ist schneller und stärker als es das kleine Gehäuse erahnen lässt. Das ist genau die Workstation wenn es um die höchst mögliche Leistung in einem kleinen 14-Zoll-Gehäuse geht.
Leider ist das System in Sachen Leistung schon etwas zu ambitioniert. Sein Core i9-12900H ist schwächer als in anderen Systemen mit der gleichen CPU. Verglichen mit anderen 14-Zoll-Workstations ist es noch immer schnell, aber es hätte noch schneller sein können. Wir haben allerdings Bedenken, wieviel schneller die Konfiguration mit Core i9-12900HK verglichen mit unserem Core i9-12900H wirklich sein kann, in Anbetracht der jetzt schon extrem schwankenden Taktraten im Test. Außerdem zeigt die RTX A1000 trotz der "RTX"-Bezeichnung Schwächen in Ray-Tracing-Anwendungen, ähnlich der GeForce RTX 3050, auf der die RTX A1000 basiert.
Die Core-H-CPU der 12. Generation ist zudem direkt für die hohe Lüfterlautstärke und den hohen Energieverbrauch des Precision 5470 verantwortlich. Es schaut zwar wie ein normaler 14-Zoll-Laptop aus, aber es hört sich zeitweise eher wie ein Gaming-Laptop an. Dieser Nachteil ist bei kleinen Hochleistungslaptops leider normal.
Preise und Verfügbarkeit
Das Precision 5470 ist mittlerweile fast überall erhältlich. Auf Amazon bekommt man es für annähernd 4.000 Euro, bei Cyberport kostet es 3.625 Euro.
Dell Precision 5000 5470
- 16.09.2022 v7 (old)
Allen Ngo
Preisvergleich

