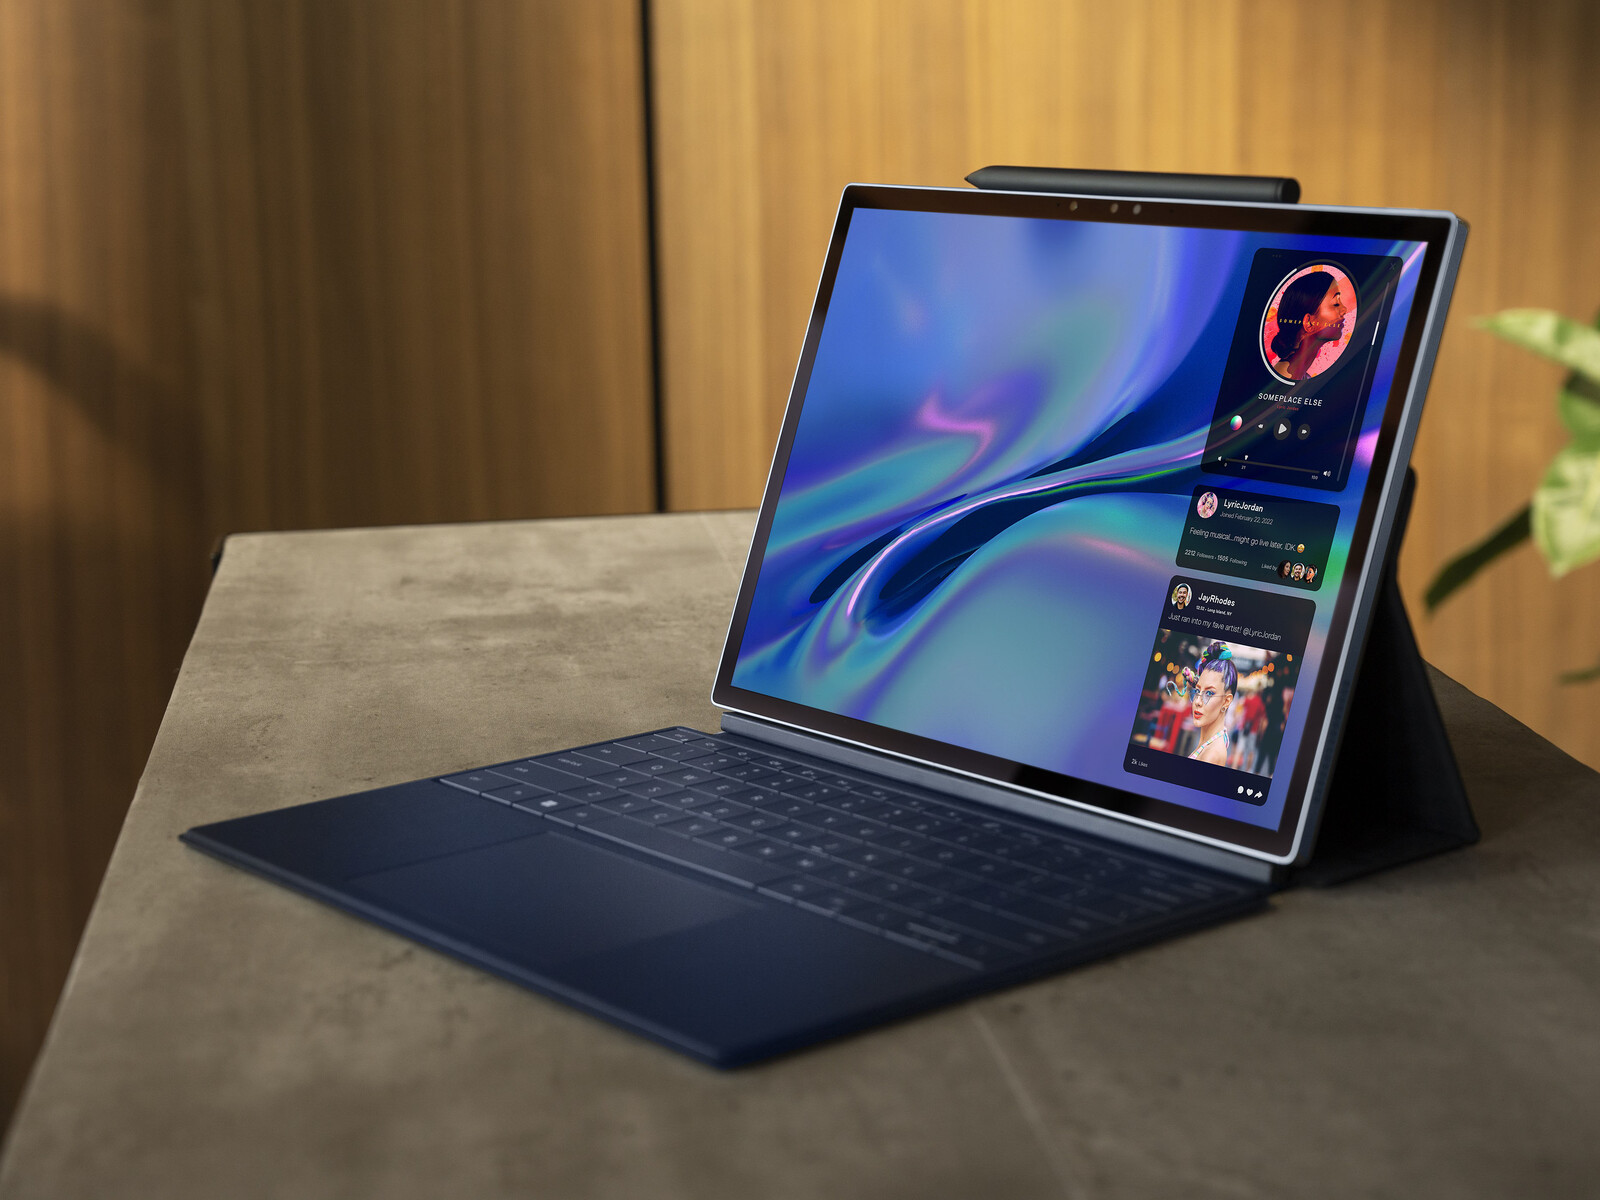
Dell XPS 13 9315 2-in-1-Convertible im Test - Dells Surface Pro 8 ↺

Dell hat auf der CES 2022 drei völlig eigenständige XPS-13-Modelle vorgestellt: das XPS 13 9320 Plus, das XPS 13 9315 und das XPS 13 9315 als 2-in-1. Nachdem wir die beiden Clamshell-Modelle bereits getestet haben, nehmen wir uns nun auch das 2-in-1-Gerät vor, welches das erste Detachable der XPS-Reihe seit fast einem Jahrzehnt ist.
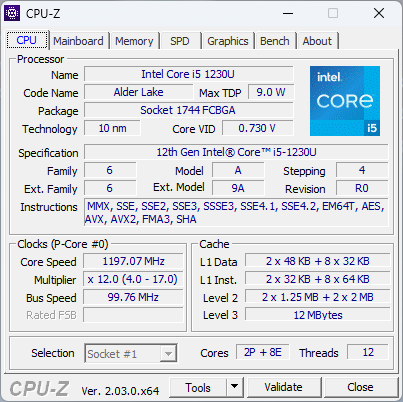
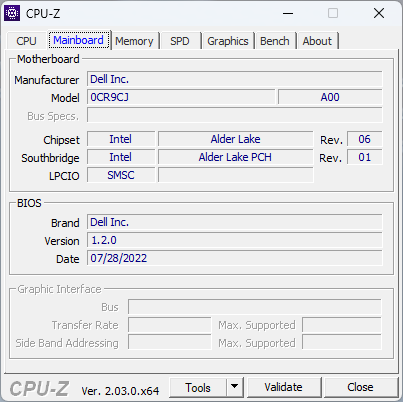
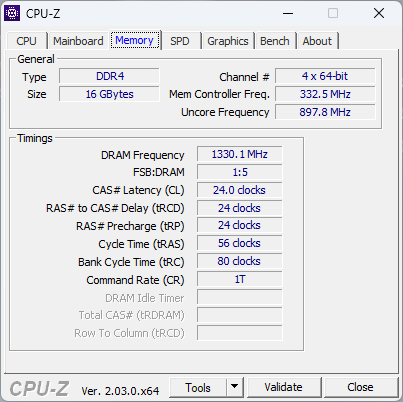
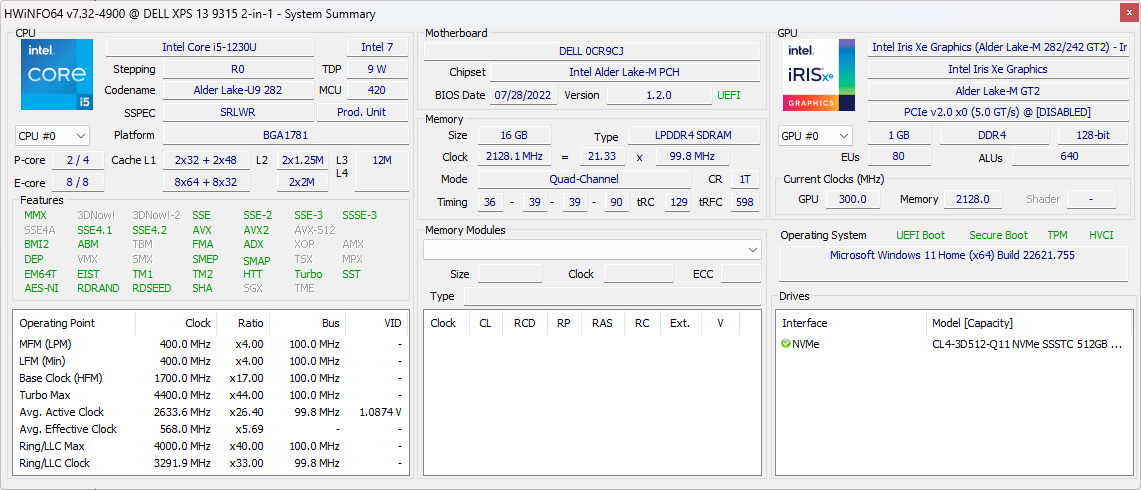
Unser Testgerät kommt in einer Konfiguration mit Alder Lake Core i5-1230U Intel Prozessor, 16 GB LPDDR4x RAM und 512-GB-NVMe-SSD. 1.600 Euro muss man dafür hergeben. Alternativ-Modelle besitzen eine Core i7-1250U CPU, 5G-eSIM sowie verschiedene RAM- und SSD-Kapazitäten. Allen Modellen gleich ist das 3:2-IPS-Touchdisplay in 3K-Auflösung (2.880 x 1.920).
Andere Windows Tablets und Detachables dienen als direkte Konkurrenz, allen voran das Microsoft Surface Pro 8 und zu einem gewissen Maße das teurere HP Elite x2.
Weitere Dell Testberichte:
mögliche Konkurrenten im Vergleich
Bew. | Datum | Modell | Gewicht | Dicke | Größe | Auflösung | Preis ab |
|---|---|---|---|---|---|---|---|
| 90.1 % v7 (old) | 11 / 2022 | Dell XPS 13 9315 2-in-1 Core i5-1230U i5-1230U, Iris Xe G7 80EUs | 764 g | 7.4 mm | 13.00" | 2880x1920 | |
| 87.3 % v7 (old) | 09 / 2022 | Dell XPS 13 Plus 9320 i7-1280P OLED i7-1280P, Iris Xe G7 96EUs | 1.3 kg | 15.28 mm | 13.40" | 3456x2160 | |
| 89.1 % v7 (old) | 11 / 2021 | Microsoft Surface Pro 8, i7-1185G7 i7-1185G7, Iris Xe G7 96EUs | 891 g | 8.5 mm | 13.00" | 2880x1920 | |
| 90.3 % v7 (old) | 08 / 2022 | HP Spectre x360 13.5 14t-ef000 i7-1255U, Iris Xe G7 96EUs | 1.4 kg | 17 mm | 13.50" | 3000x2000 | |
| 86.1 % v7 (old) | 10 / 2021 | Lenovo ThinkBook Plus Gen2 Core i5 i5-1130G7, Iris Xe G7 80EUs | 1.2 kg | 13.9 mm | 13.30" | 2560x1600 | |
| 92.3 % v7 (old) | 07 / 2022 | Apple MacBook Air M2 Entry M2, M2 8-Core GPU | 1.2 kg | 11.3 mm | 13.60" | 2560x1664 |
Gehäuse — XPS 13 2-in-1 ist leichter als das Surface Pro 8
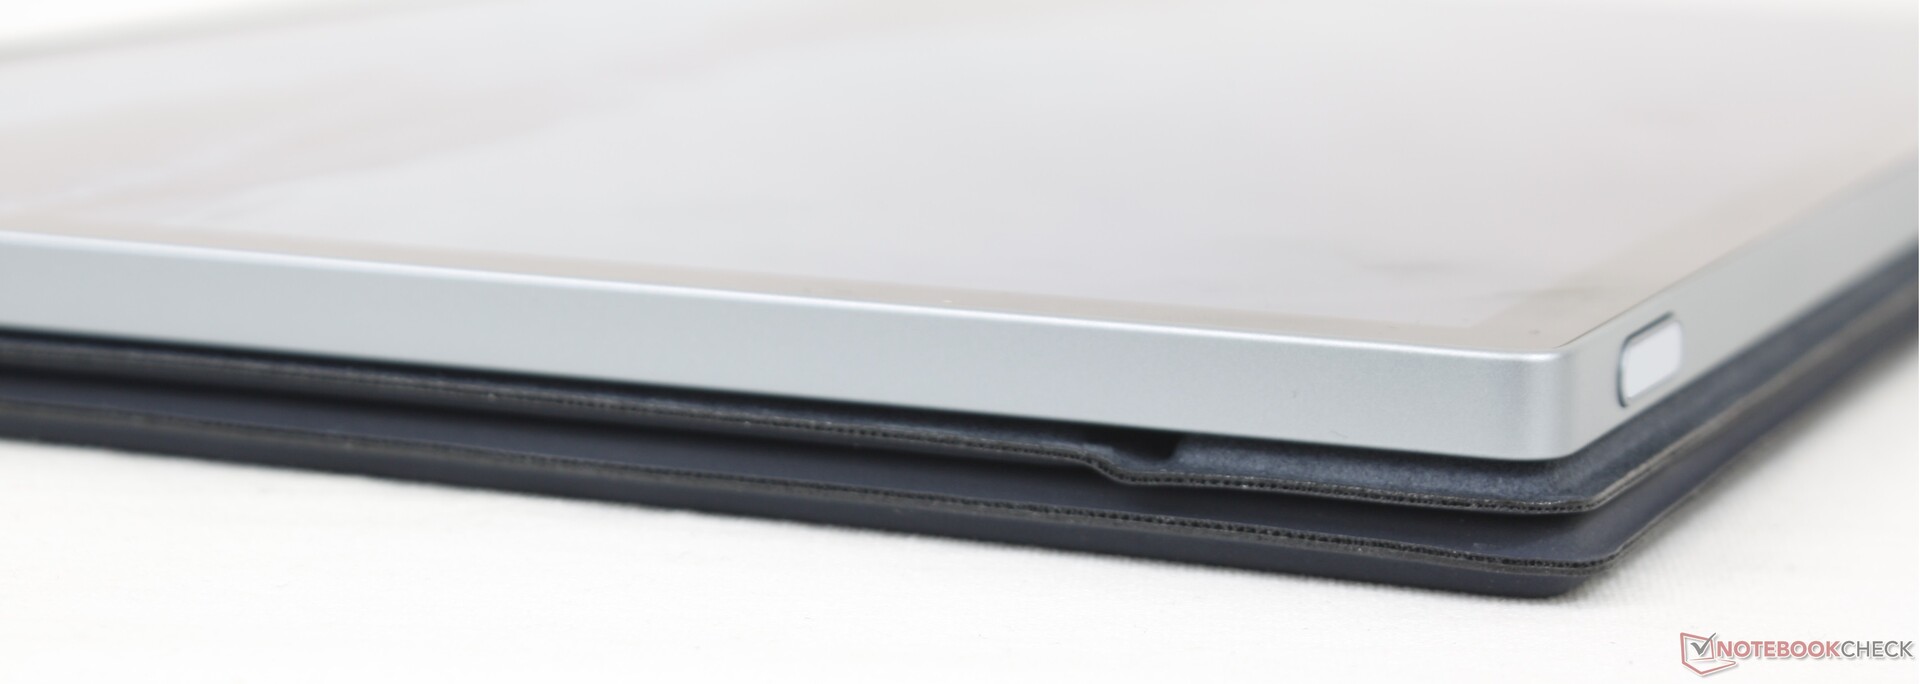
Der hintere Teil und die Seiten des Gehäuses bestehen aus Aluminium, während die Front aus Edge-to-Edge-Gorilla-Glass gefertigt ist. Es ist robust und weist ein hochwertiges sowie mattes Finish auf, wie man es erwarten würde, mit einer Farbe und Textur, die zum XPS 13 9300 und der XPS-15-Serie gleich ist. Das Gehäuse verzieht sich nur leicht, wenn man den Versuch unternimmt, es zu verwinden, aber lediglich in einem Maße, das keinen Grund zur Besorgnis liefert.
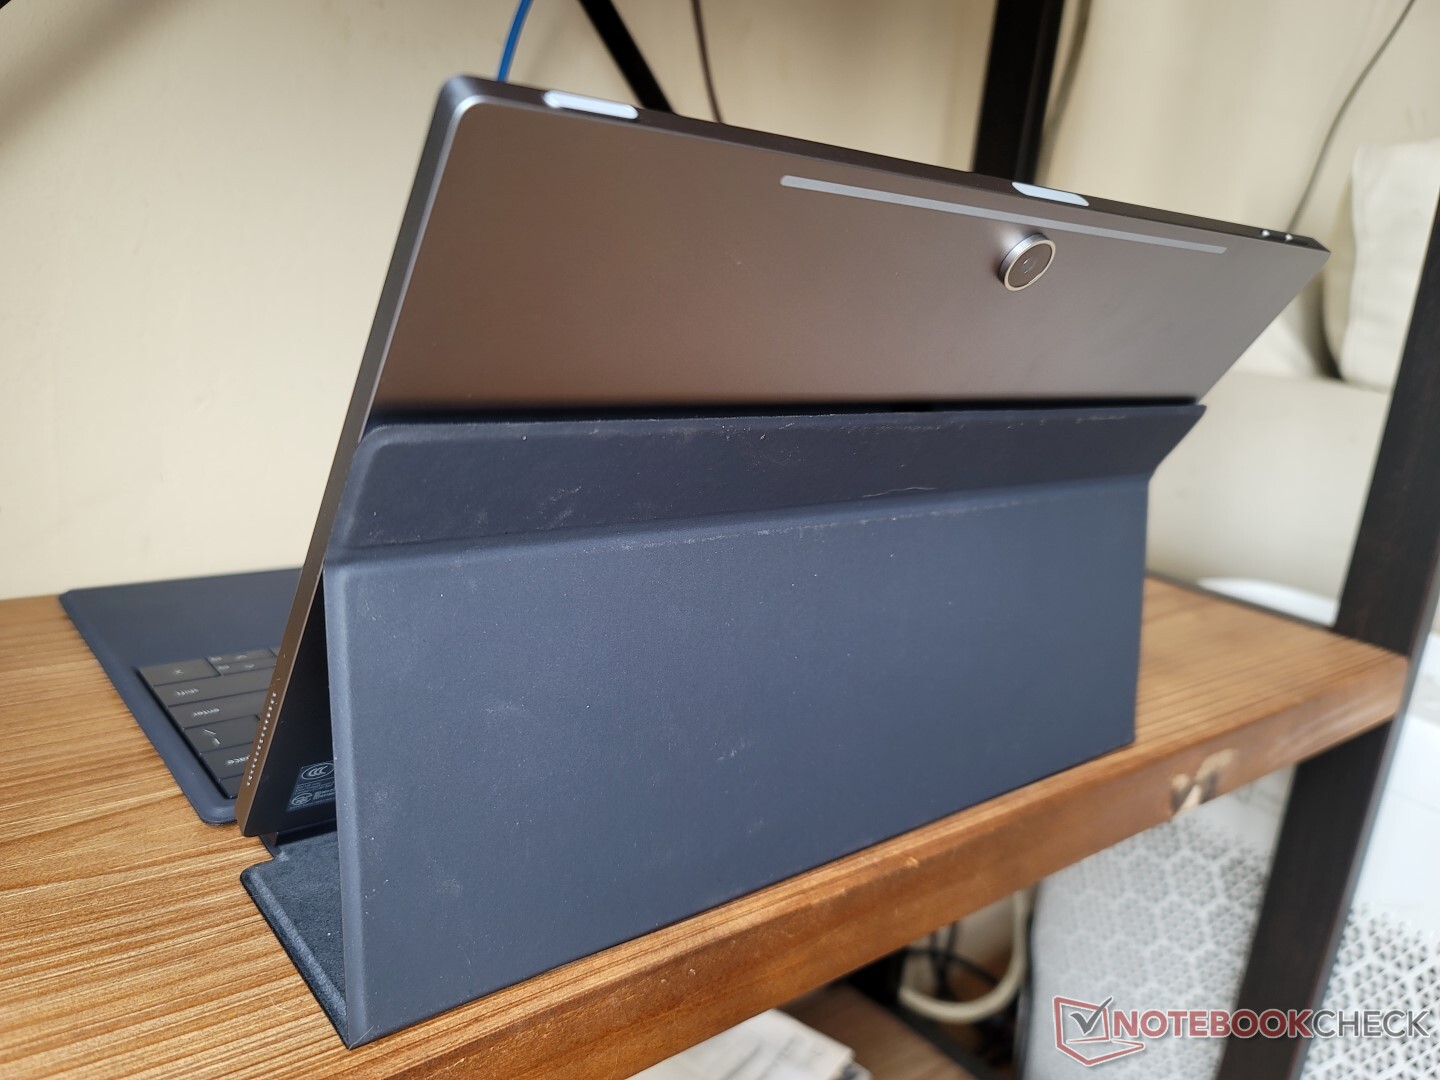
Wenn man die Mitte der Rückseite gezieltem Druck aussetzt, so gibt diese leicht und auch hörbar nach. Das liegt wohl am kleinen Luftzwischenraum, ausgehend von der Außenhülle bis hin zu den inneren Komponenten, was aber, wie gesagt, kein Anlass zur Sorge ist.
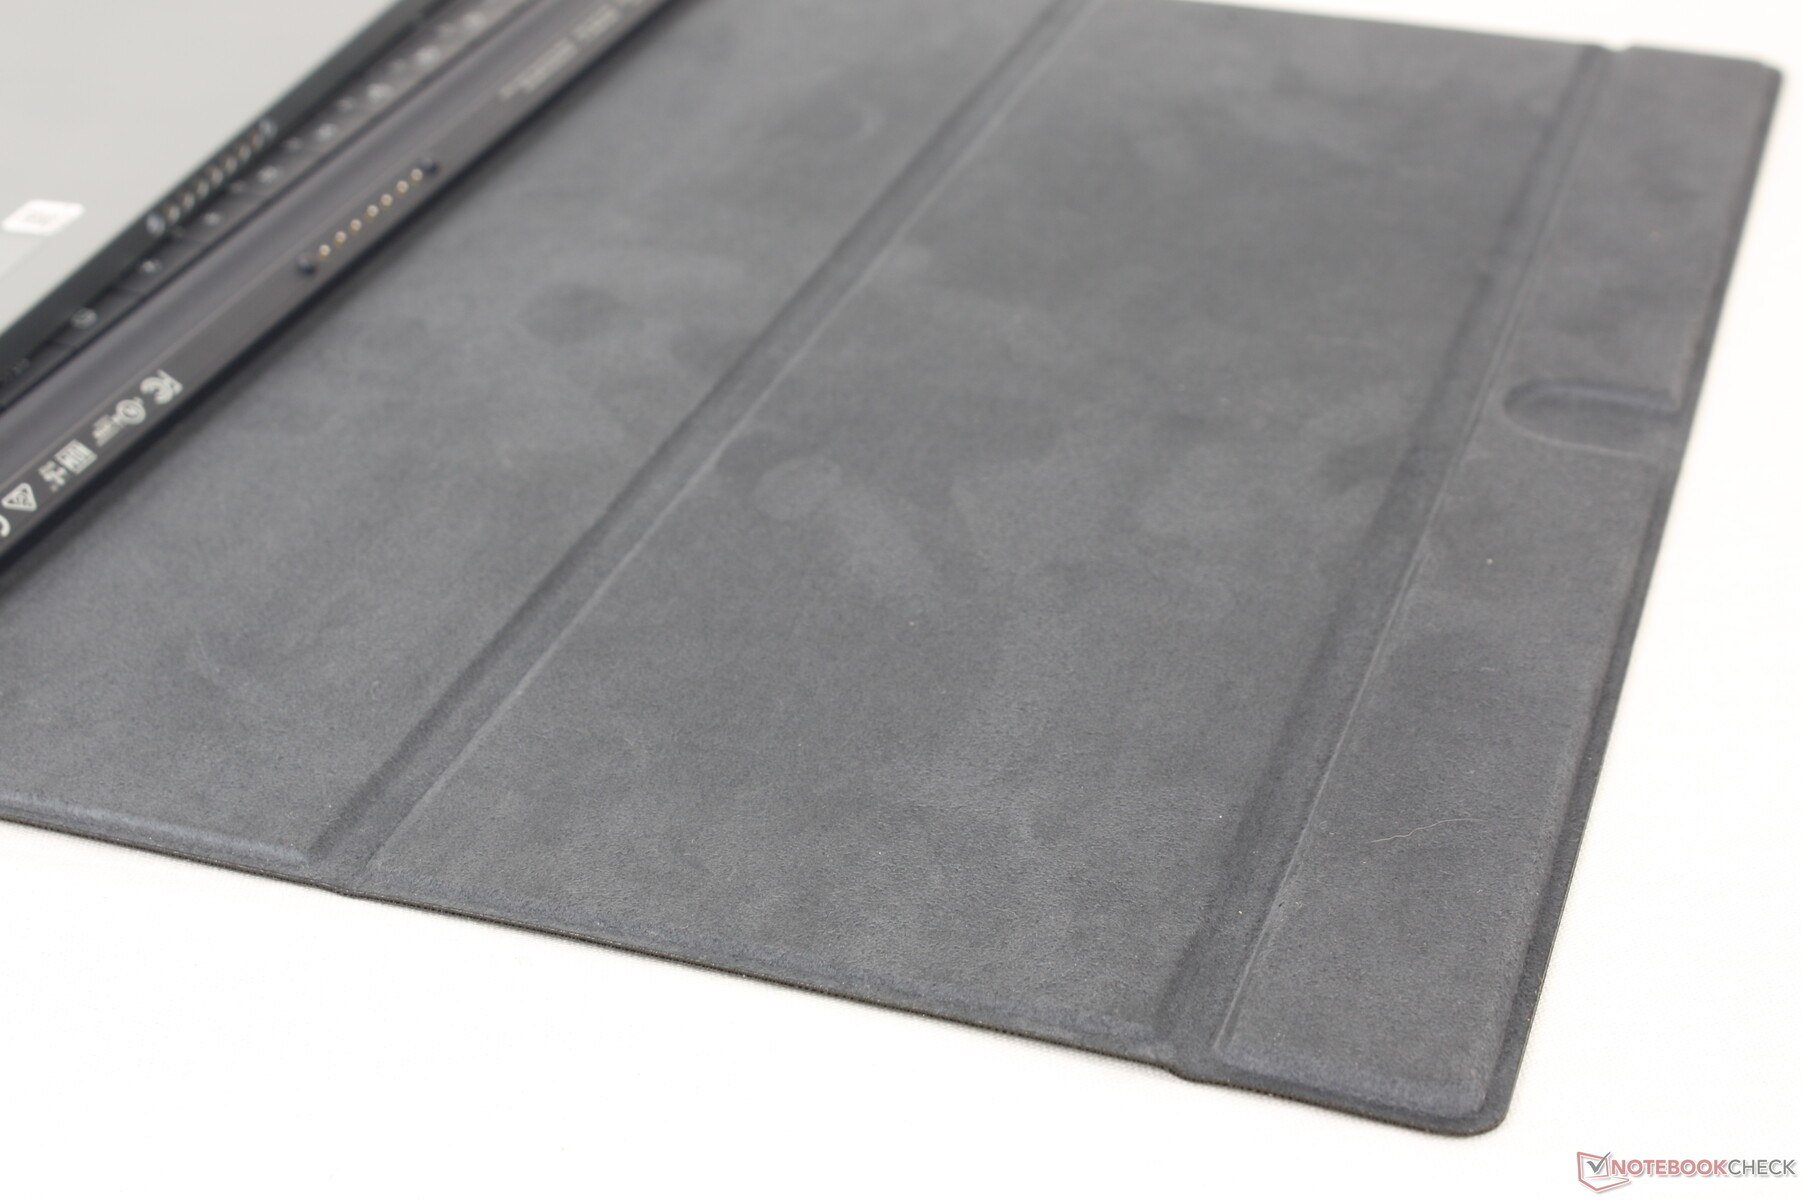
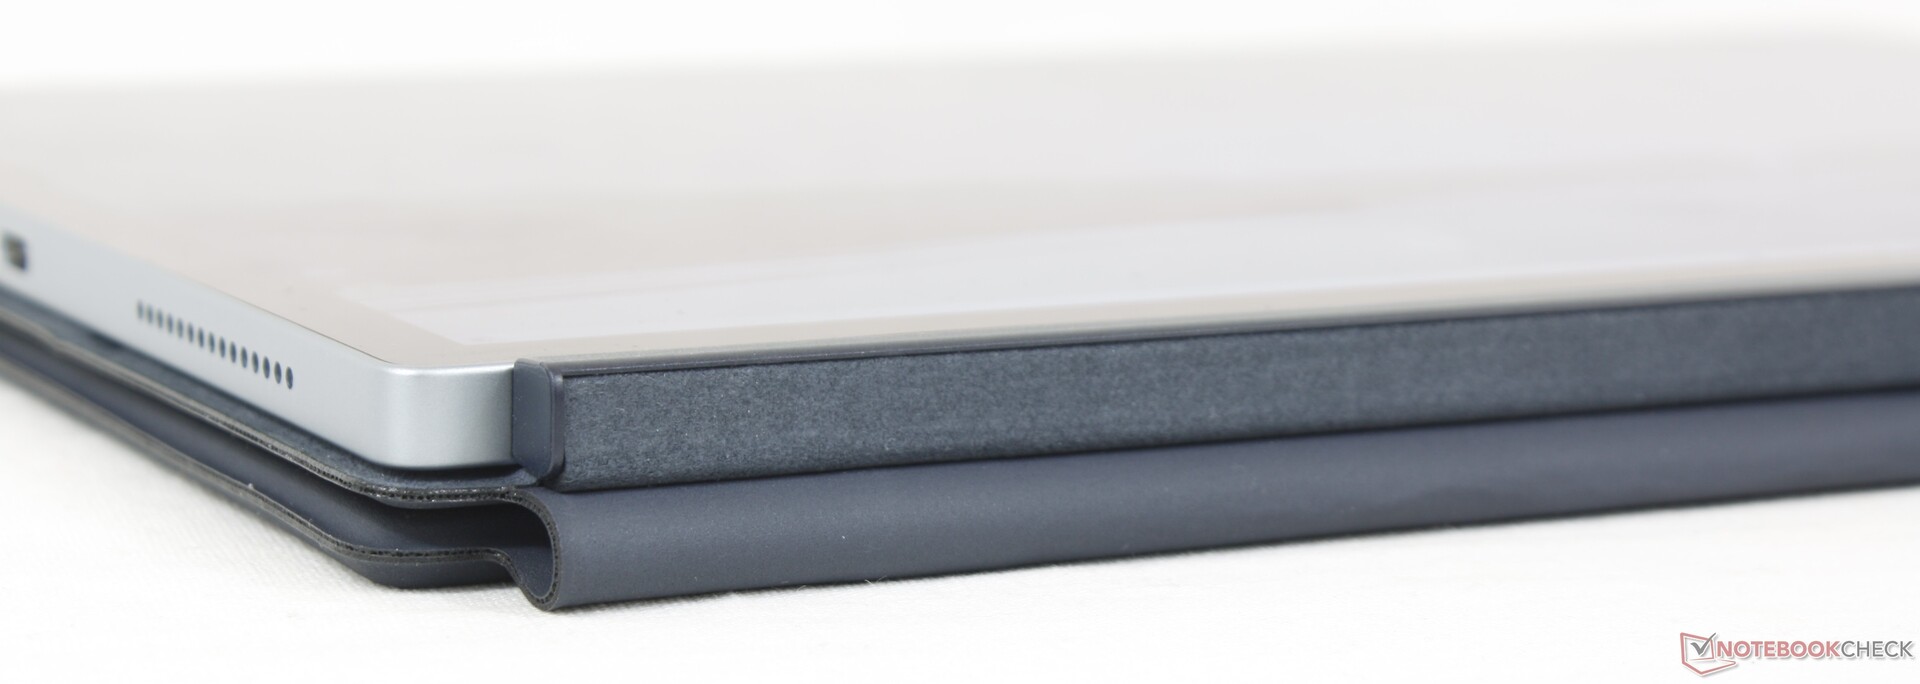
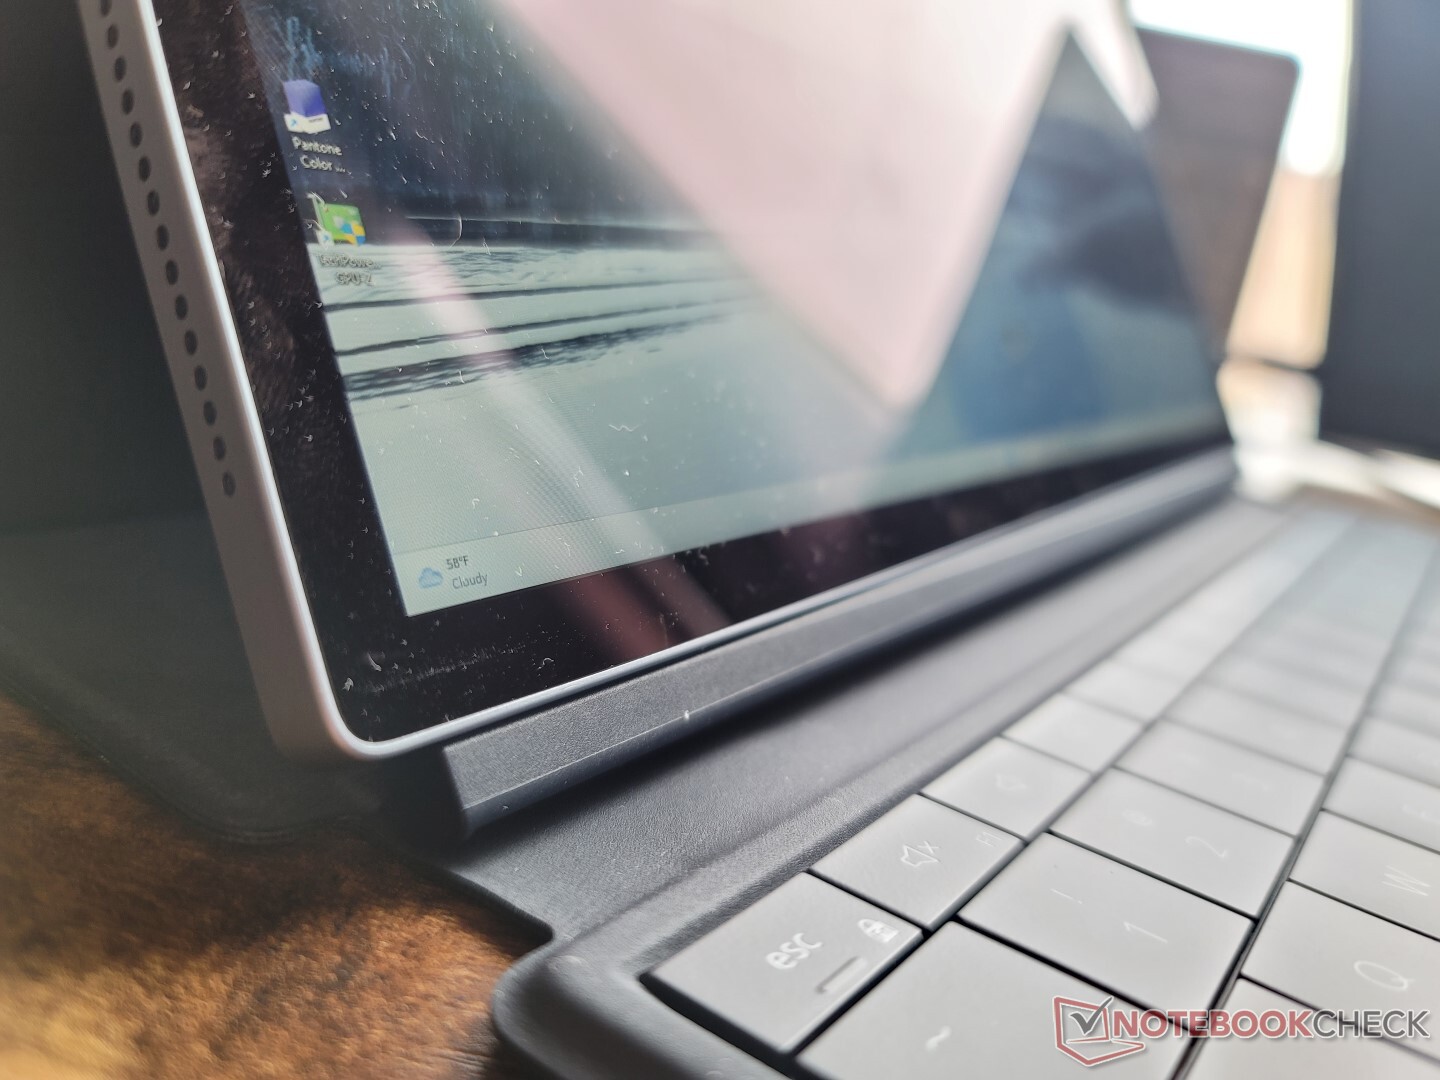
Die Oberfläche des magnetisch anhaftenden Tastatur-Docks (oder Folios) besteht aus einem weichen Material, ähnlich wie das Alcantara des Surface-Pro-8-Tastatur-Covers. Dennoch unterscheidet sich Dells Lösung maßgeblich von der Mircrosoft Variante, weil es auch ein Back Cover ist, während das Type Cover vom Surface Pro lediglich eine Tastatur mit Touchpad darstellt. Dieses Back Cover bietet zusätzlichen Schutz gegen Schrammen und Kratzer, mit dem Nachteil eines höheren Gewichtes.
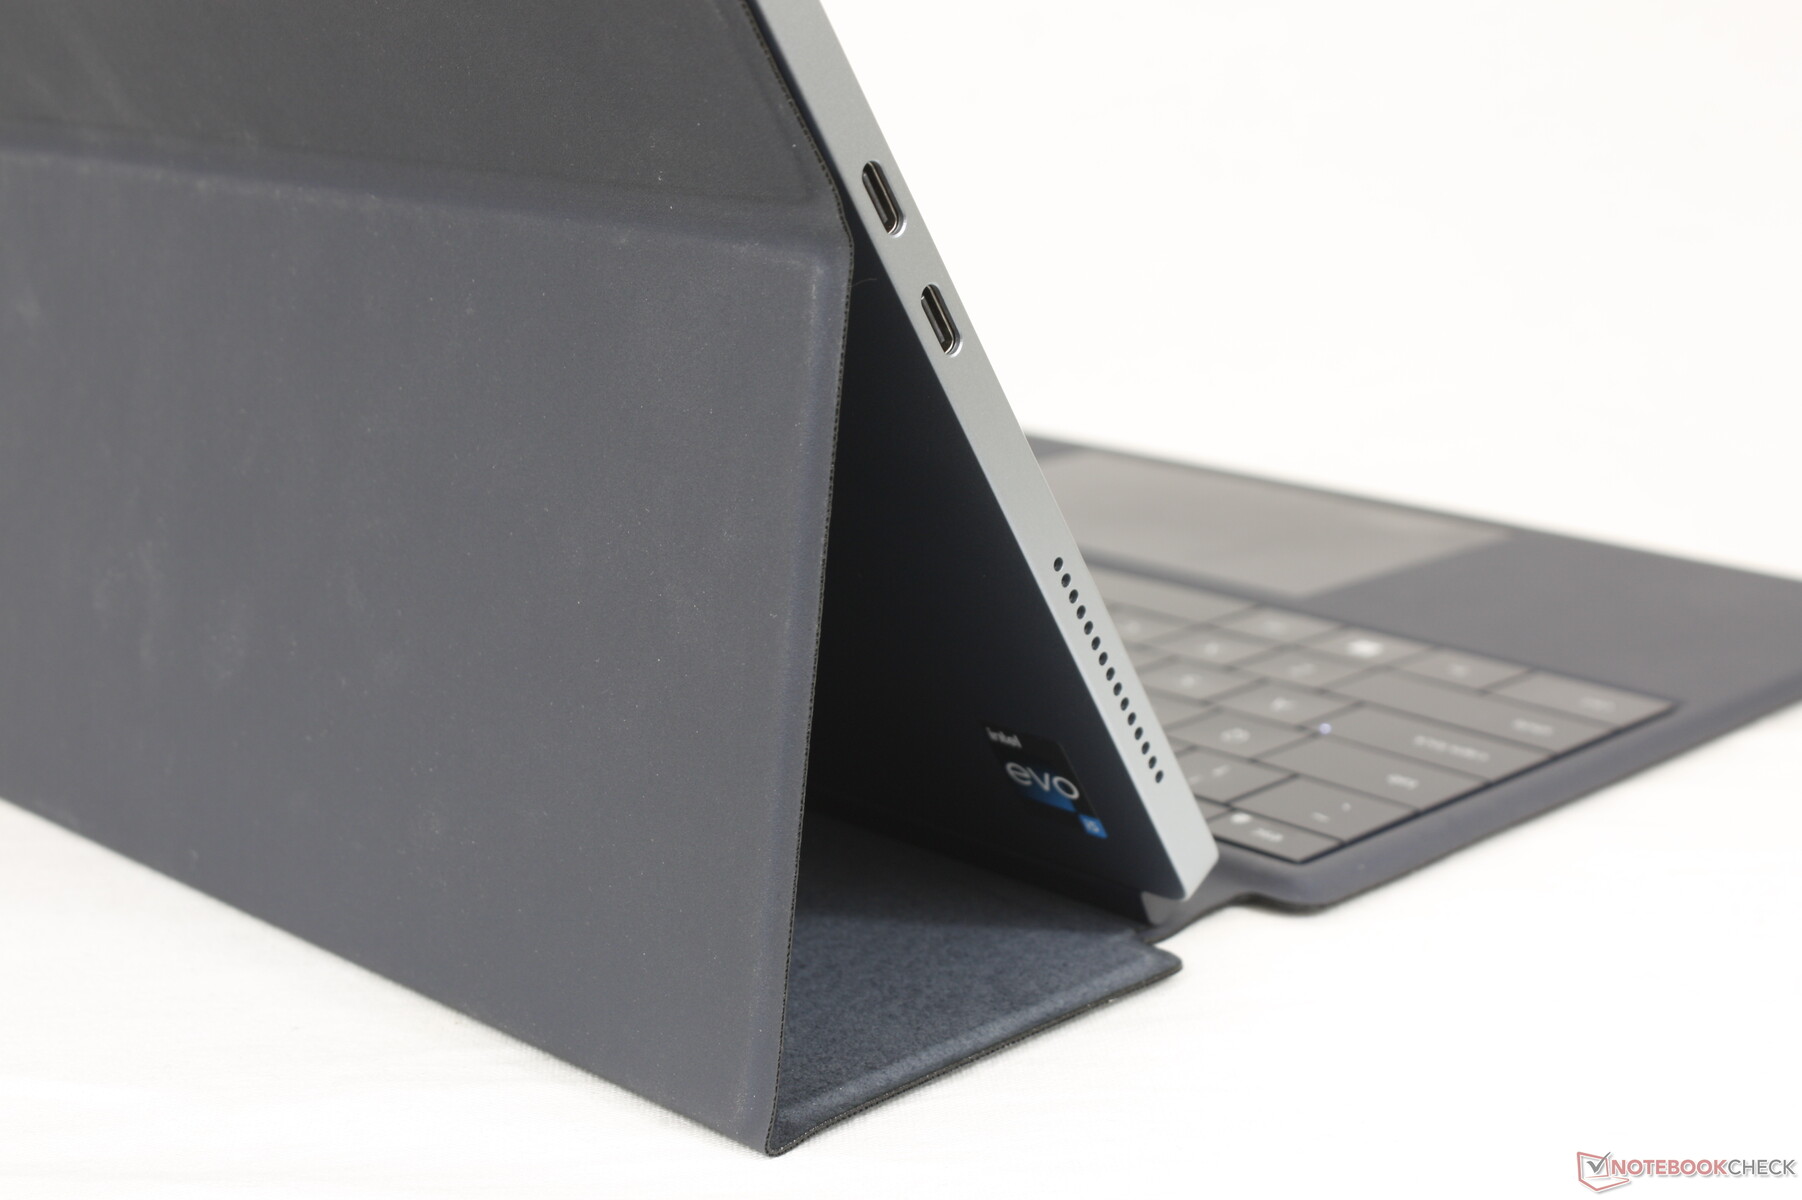
Die Justierung des Dell Tablets im Laptop-Modus kann lediglich in Winkeln von 100, 115 und 125 Grad vorgenommen werden, während das Scharnier am Surface Pro 8 deutlich mehr Aufstellungswinkel zulässt. Anders ausgedrückt ist das XPS 13 9315 2-in-1 unabdingbar auf das optionale Folio-Dock angewiesen, um es aufstellen zu können, während das Surface Pro 8 über einen praktischeren eingebauten Kickstand verfügt.
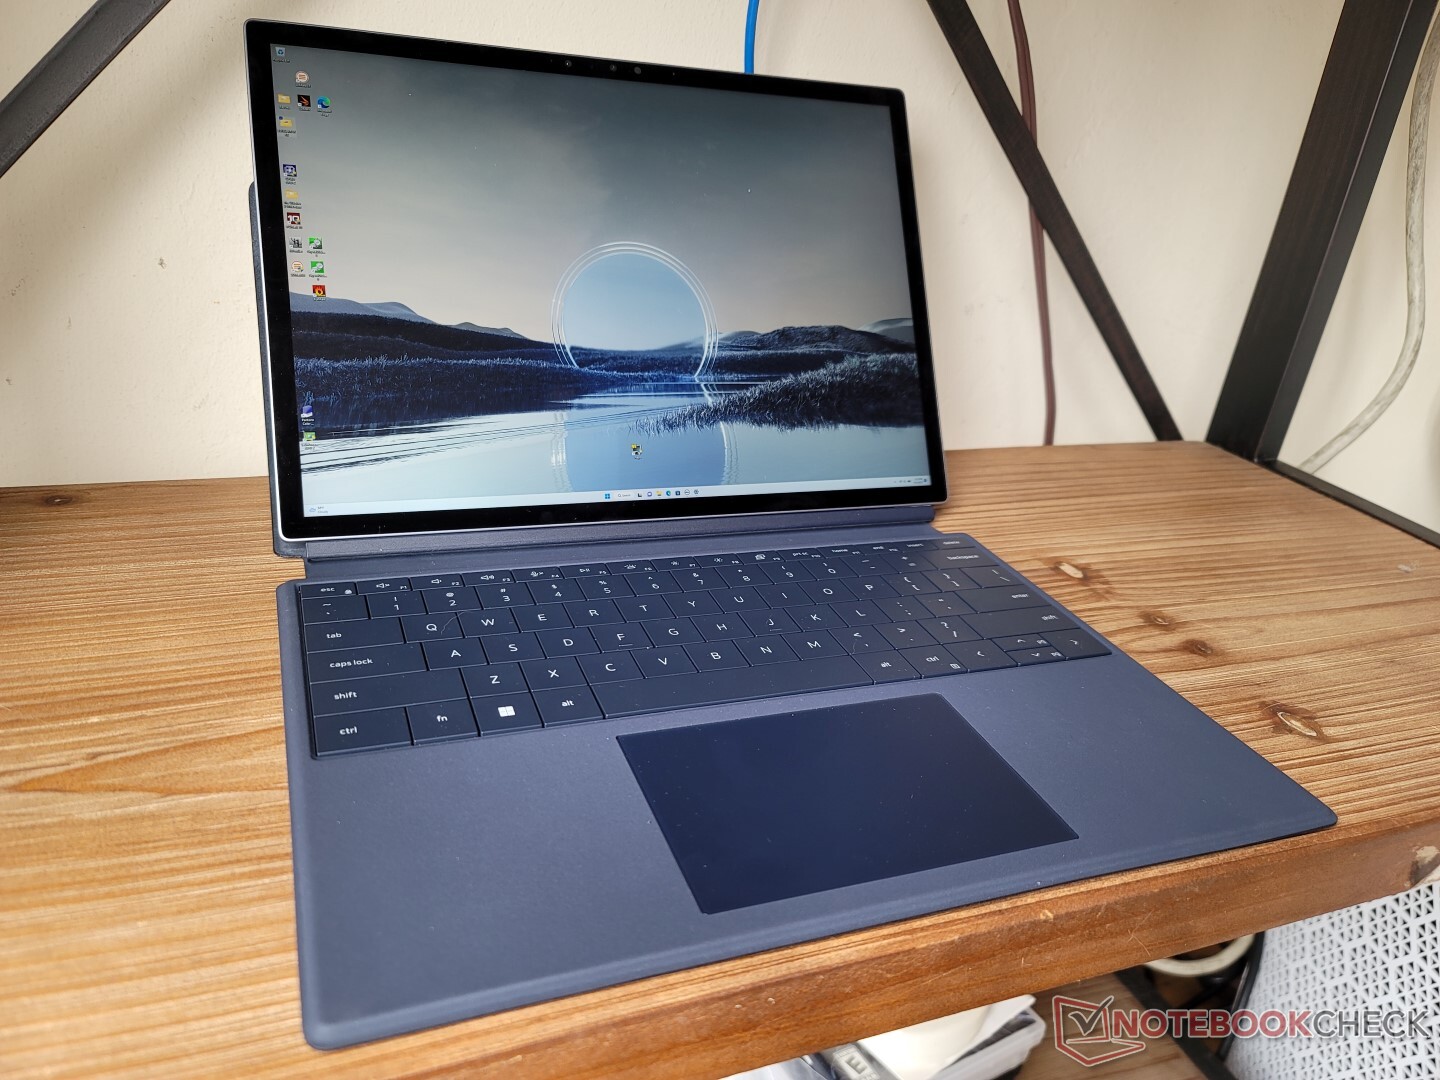
Das Tablet für sich ist mit 764 Gramm sehr leicht, auch im Vergleich zum fast 900 Gramm wiegenden Surface Pro 8. Die Gewichtseinsparung ist hauptsächlich durch das lüfterlose Design zu begründen, während das Microsoft Gerät einen Lüfter zur besseren Kühlmöglichkeit verwendet. Zusammen mit dem Cover beträgt das Gewicht 1.305 Gramm, das vielen 13,5-Zoll-Laptops wie dem HP Spectre x360 13.5 nahekommt.
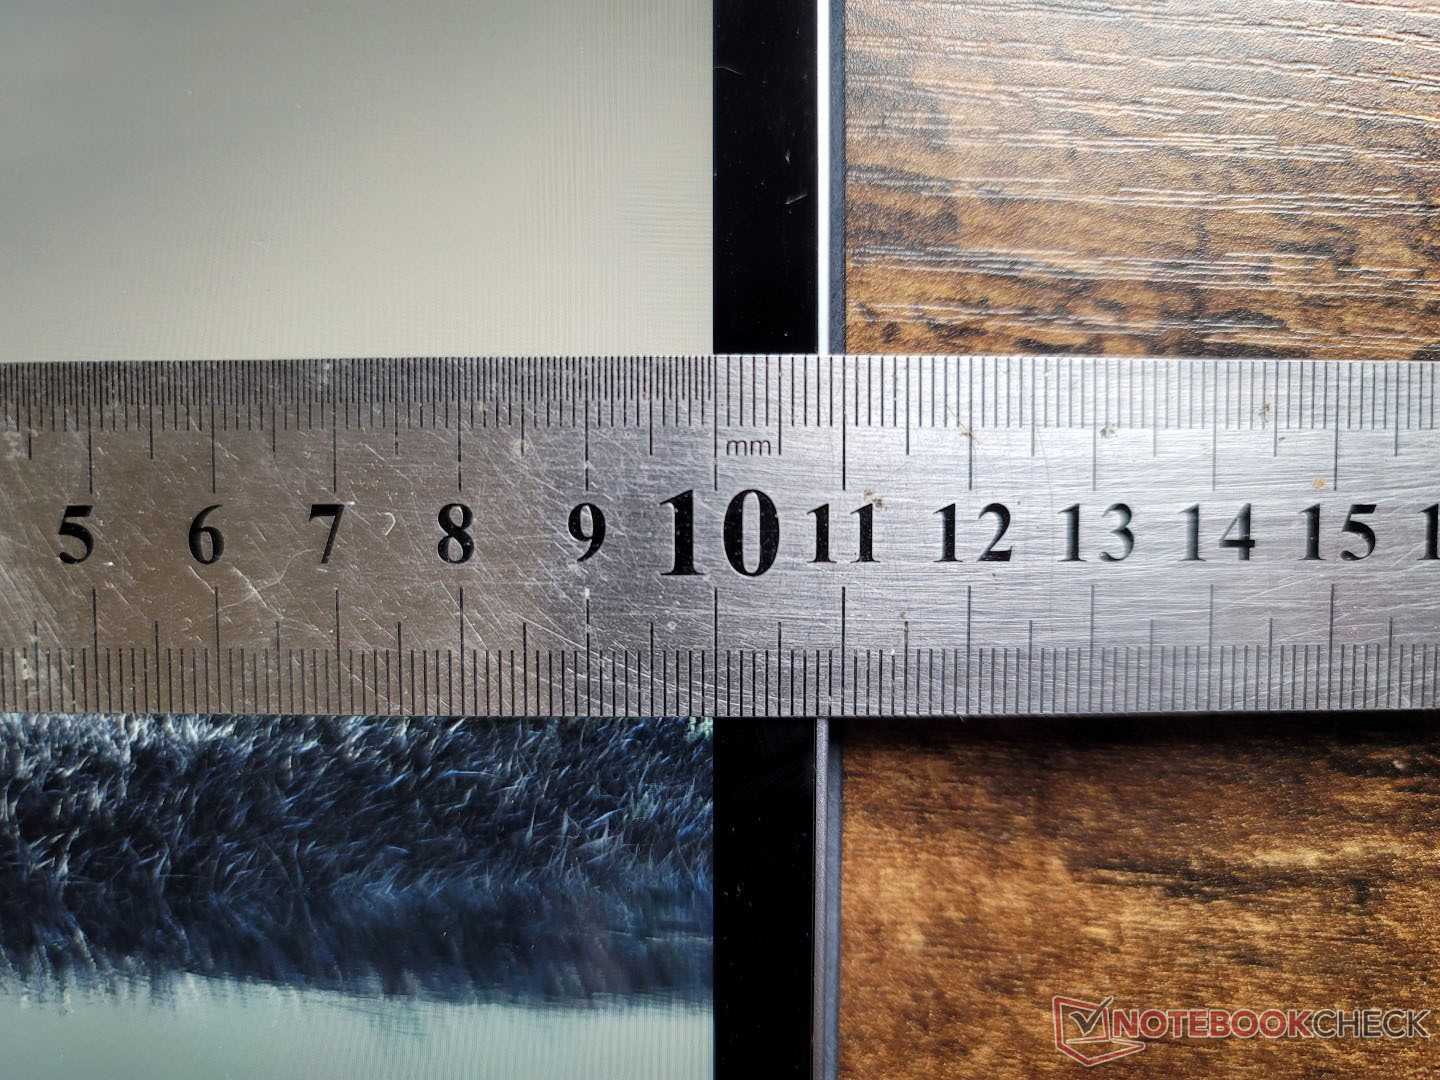
Ausgerüstet mit 5G wird das XPS 13 9315 2-in-1 um 0,4 mm Millimeter dicker (7,8 vs. 7,4 mm). Alle Modelle bleiben aber immer noch um eine Haaresbreite dünner als das Surface Pro 8, während Länge und Breite fast gleich ausfallen.


Konnektivität — XPS 13 2-in1 kommt ohne Audio-Buchse
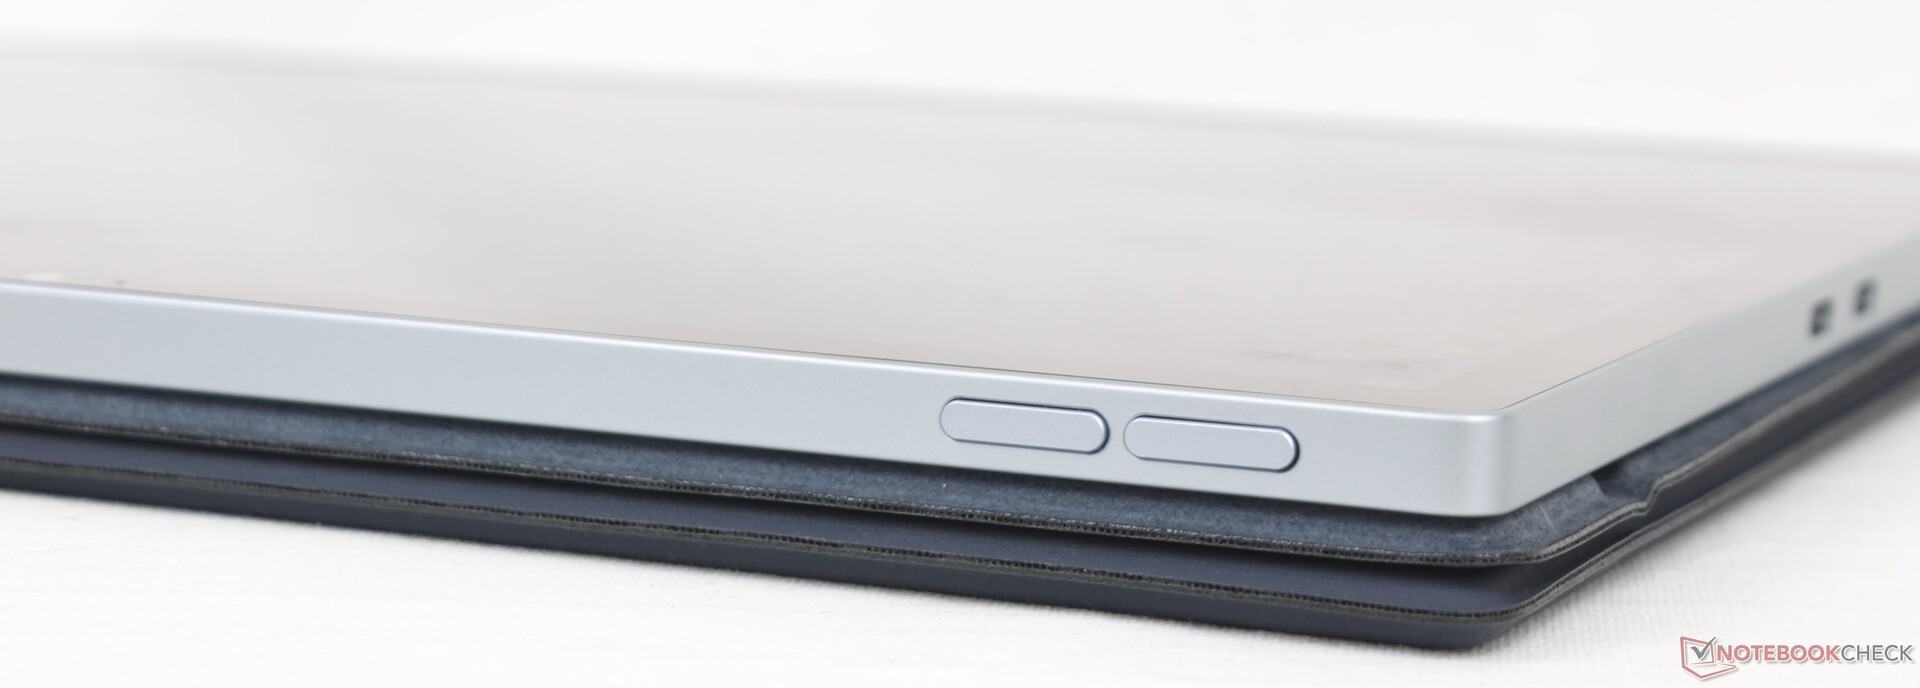
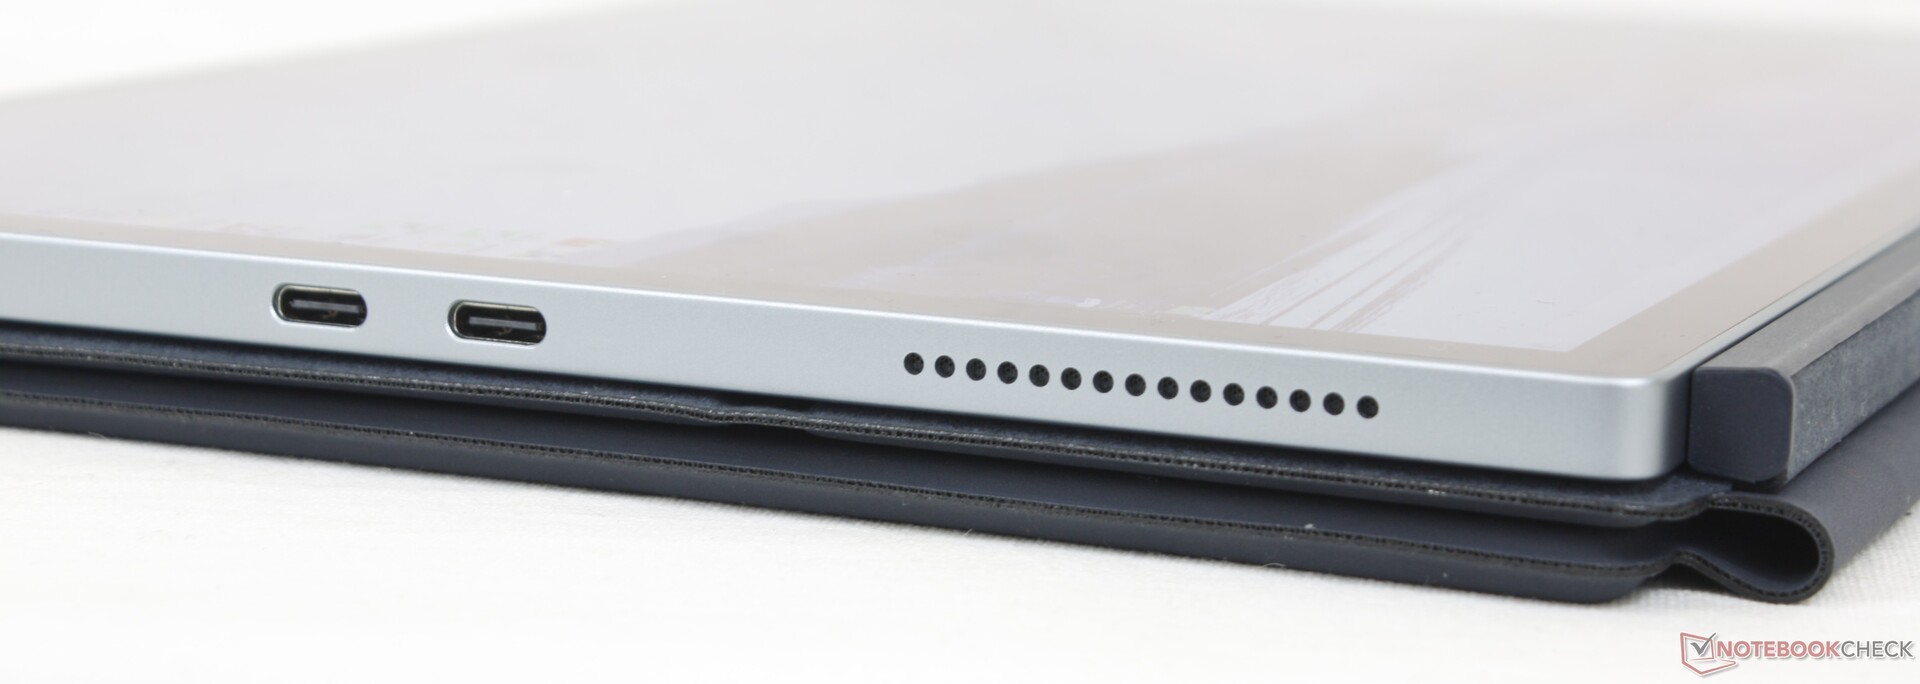
Es existieren lediglich zwei USB-C-Anschlüsse mit Thunderbolt-4-Kompatiblität auf der linken Geräteseite. User müssen auf Docking-Möglichkeiten und Adapter zurückgreifen, um den beiden Anschlüssen eine erhöhte Nutzbarkeit zu entlocken. Zu beachten ist zudem, dass nicht einmal eine Audio-Buchse vorhanden ist, anders als beim Surface Pro 8.
Kommunikation
Standardmäßig wird ein Intel-1675-AX211-Wi-Fi-6E-Modul mit Bluetooth 5.2 eingesetzt. Die Übertragungsraten sind schnell und beständig, als wir es mit unserem 6-GHz-Netzwerk verbanden, jedoch sind die durchschnittlichen Empfangsgeschwindigkeiten etwas langsamer, als wir es erwarteten.
| Networking | |
| Dell XPS 13 9315 2-in-1 Core i5-1230U | |
| iperf3 transmit AXE11000 6GHz | |
| iperf3 receive AXE11000 6GHz | |
| Microsoft Surface Pro 8, i7-1185G7 | |
| iperf3 transmit AX12 | |
| iperf3 receive AX12 | |
| HP Spectre x360 13.5 14t-ef000 | |
| iperf3 transmit AXE11000 6GHz | |
| iperf3 receive AXE11000 6GHz | |
| Lenovo ThinkBook Plus Gen2 Core i5 | |
| iperf3 transmit AX12 | |
| iperf3 receive AX12 | |
| Apple MacBook Air M2 Entry | |
| iperf3 transmit AXE11000 | |
| iperf3 receive AXE11000 | |
Webcam
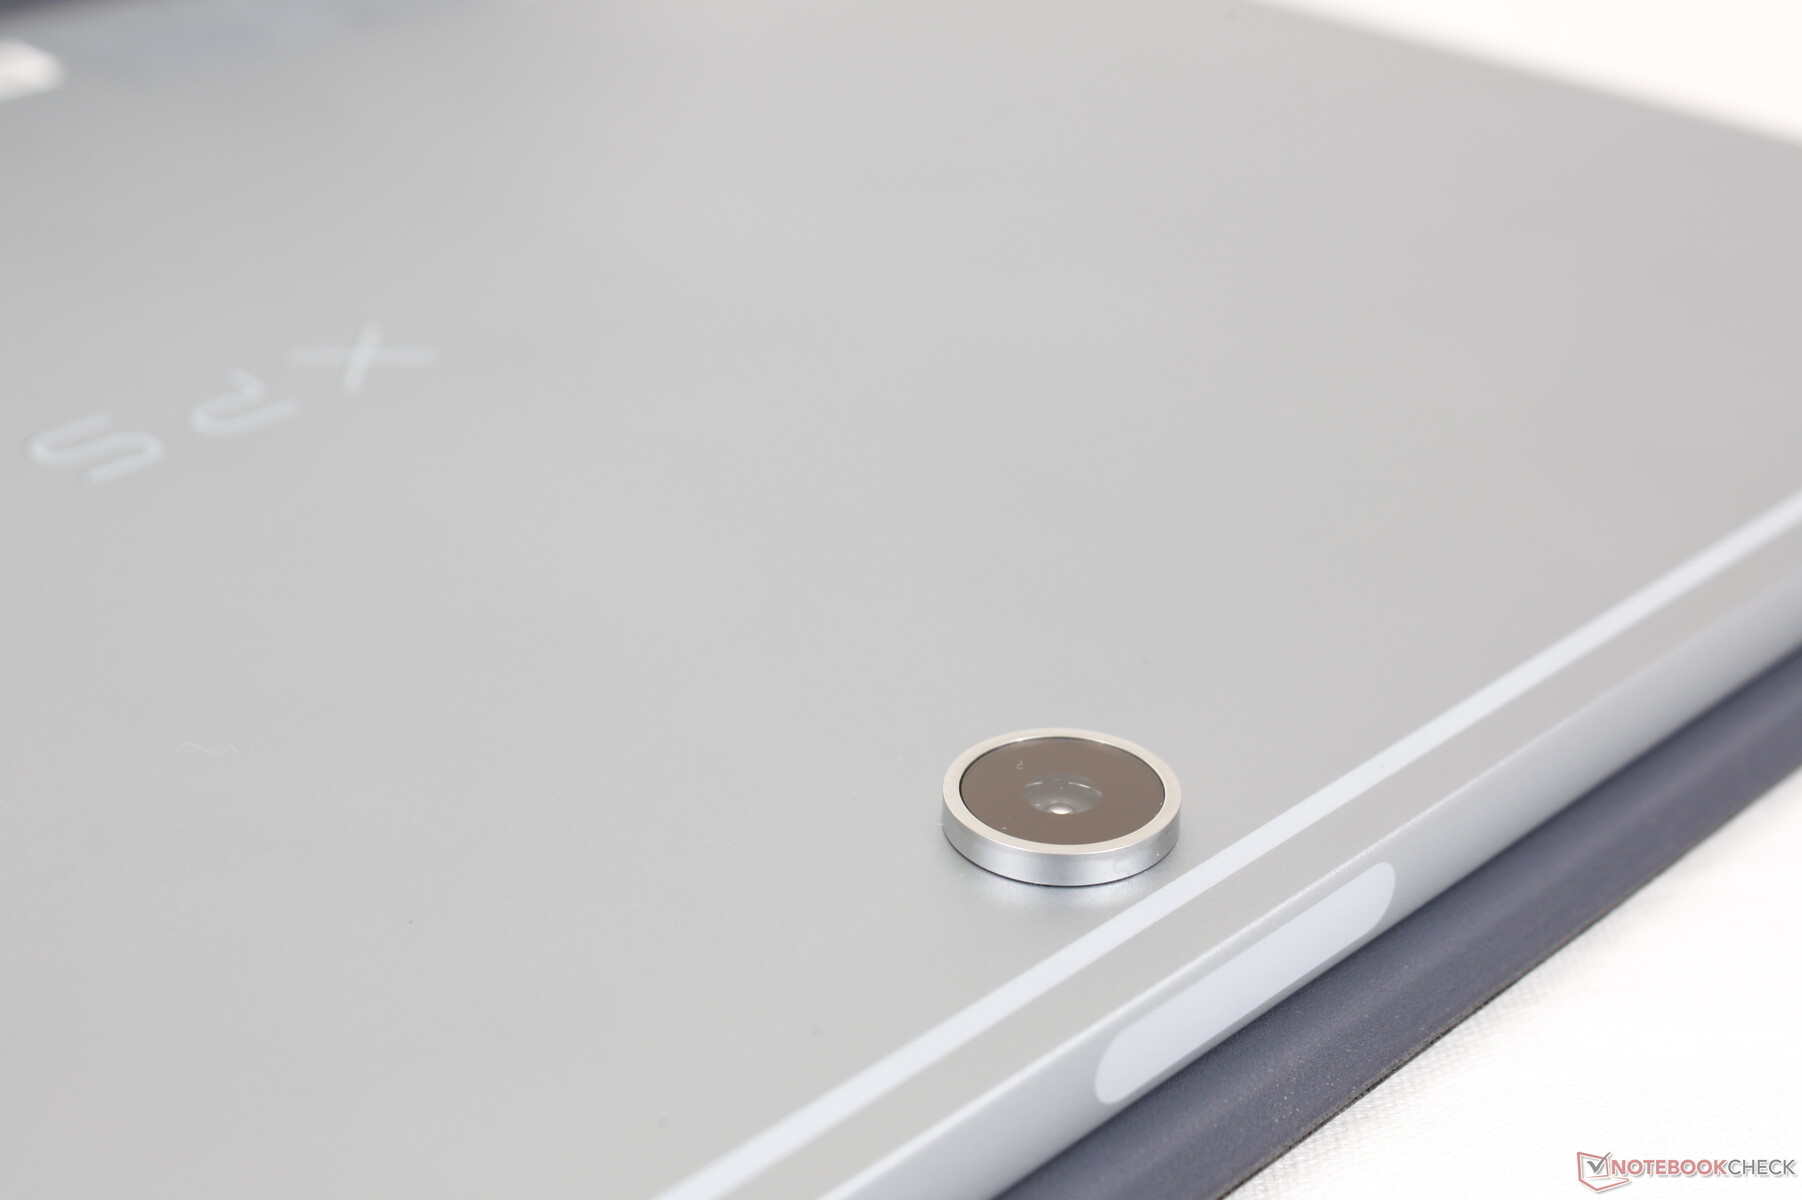
Die Rückkamera besitzt 11 MP, was - vielleicht per Zufall - genau 1 MP mehr ist als bei der Kamera des Surface Pro 8. Die Bildqualität ist um einiges schärfer als jede Laptop-Webcam, auch wenn die Farbgenauigkeit weiterhin zu wünschen übrig lässt.
IR ist für die Unterstützung von Windows Hello mit dabei. Eine Kamerablende für mehr Privacy gibt es leider nicht.


Zubehör und Garantie
In der Verpackung finden wir zwei nützliche USB-C-Adapter auf USB-A und 3,5-mm-Audio vor. Im Gegensatz zu Microsofts Surface-Pro-Tablets ist die abnehmbare Tastatureinheit im Wert von 235 Euro in Europa im Kaufpreis enthalten, während der magnetisch haftende Active-Pen, der speziell für das XPS 13 2-in-1 entwickelt wurde, separat für etwa 130 Euro verkauft.
Standardmäßig gewährt Dell in Deutschland eine Ein-Jahres-Garantie mit Premium-Support. Erweitert werden kann sie auf bis zu vier Jahre (+350 Euro).
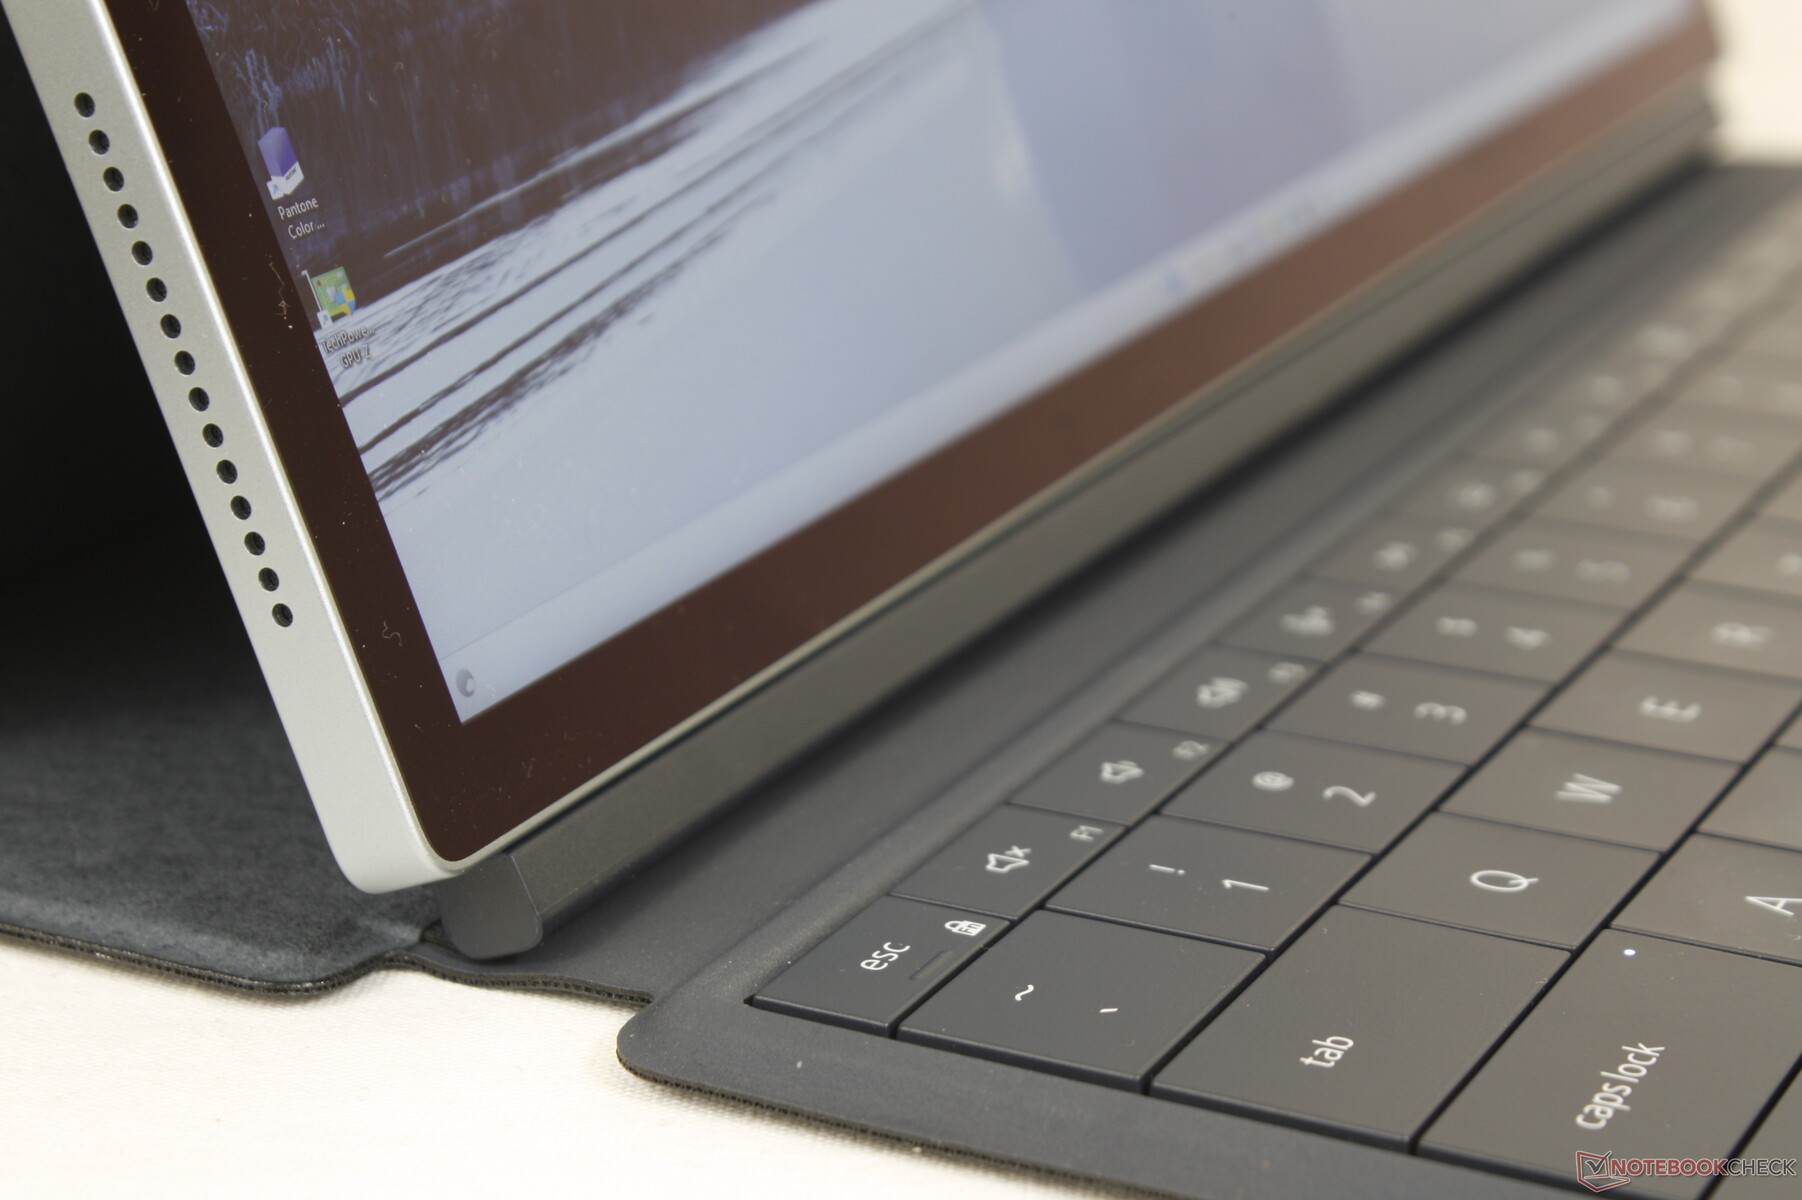
Eingabegeräte — Eine der angenehmsten abnehmbaren Tastaturen
Tastatur
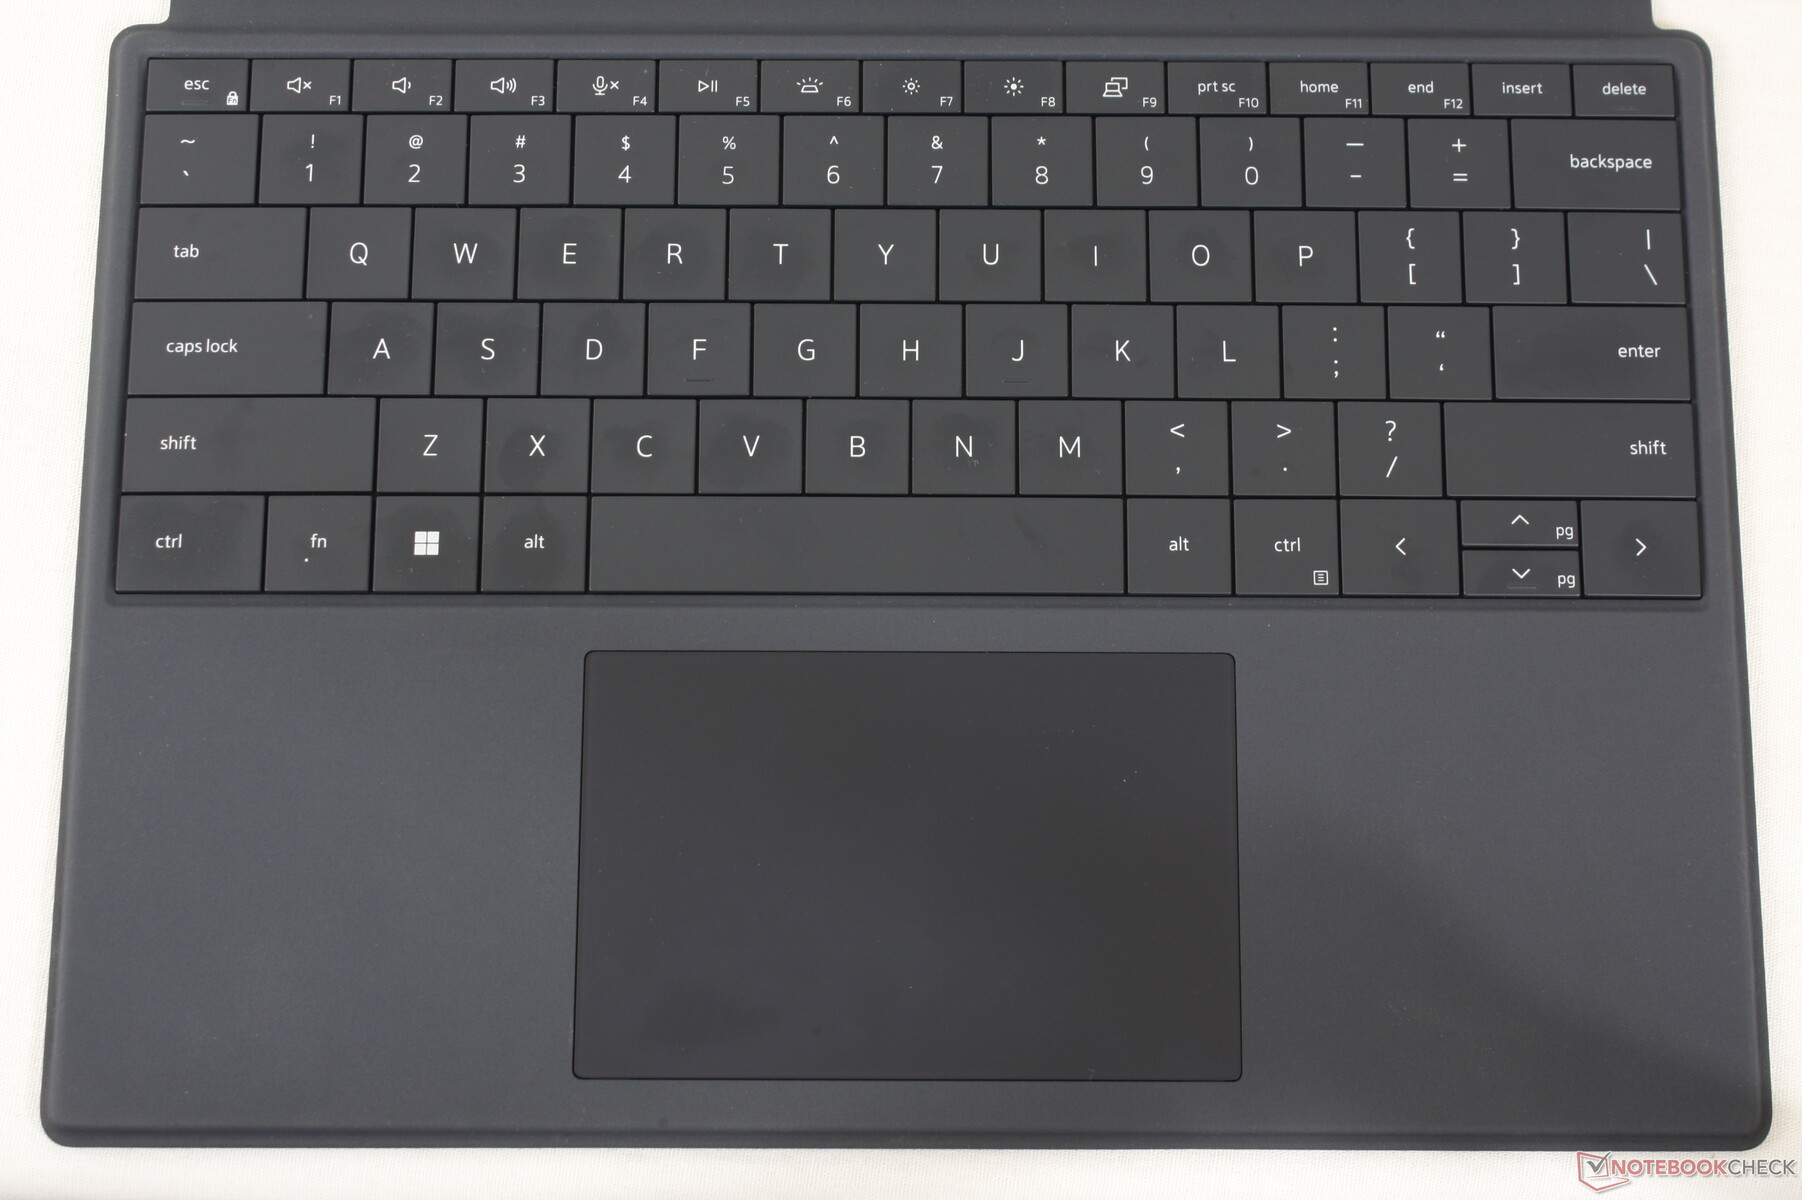
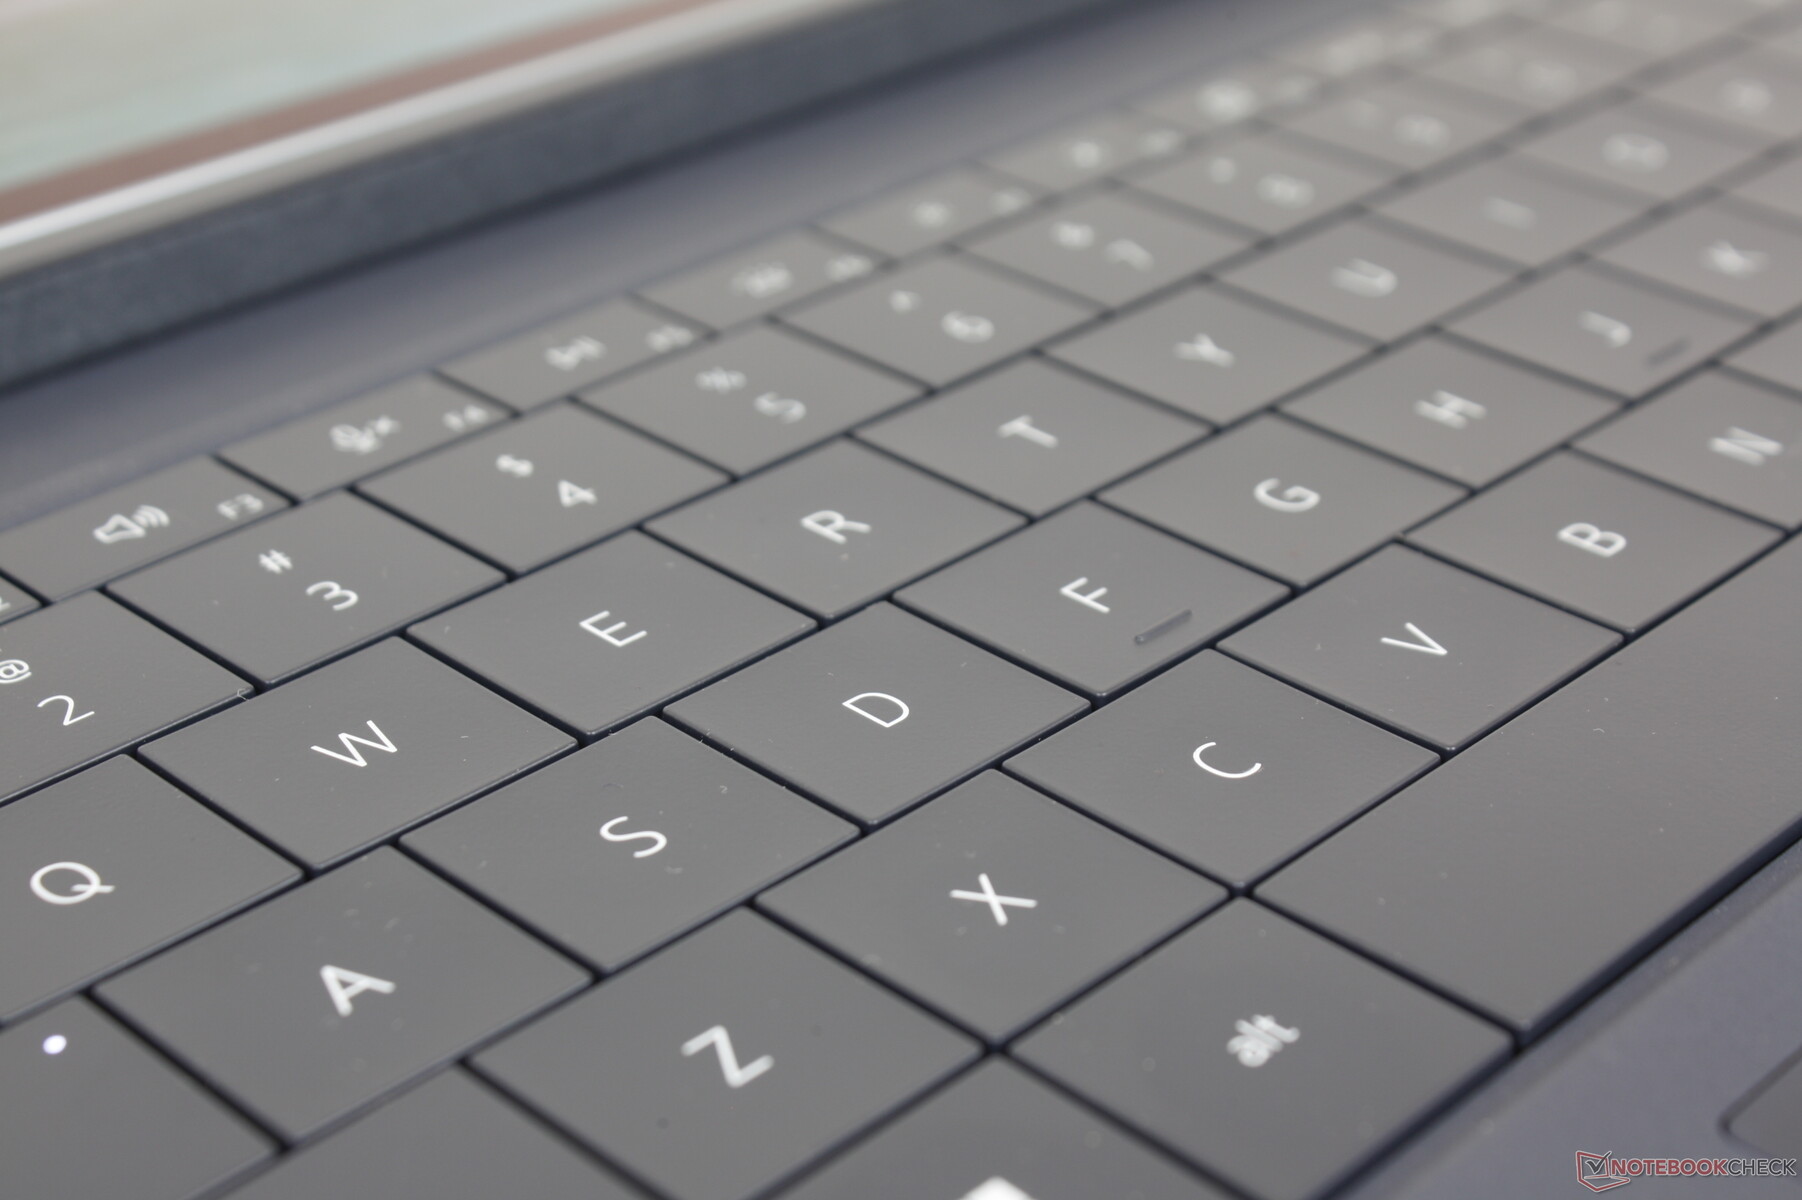
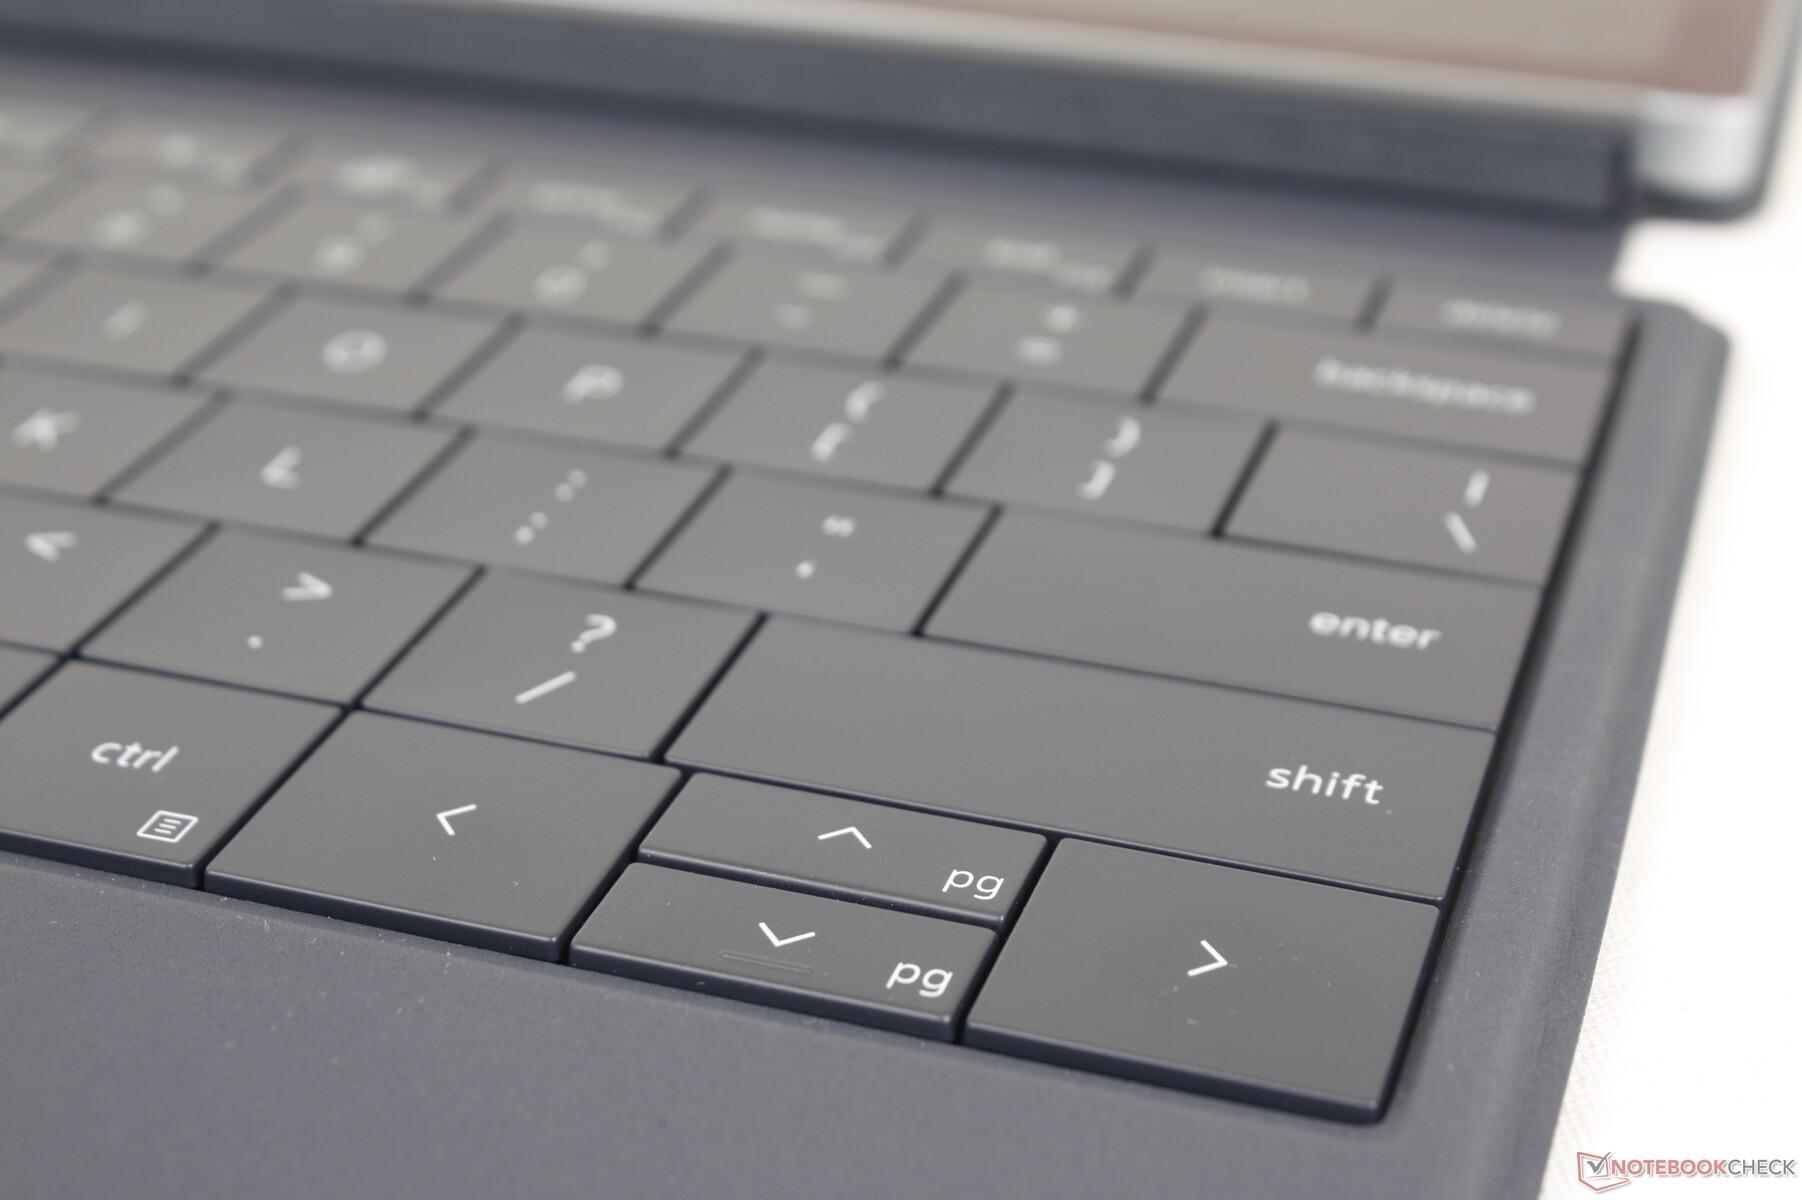
Die Tastatur ist im Grunde ein Ebenbild der im XPS 13 Plus 9320 verbauten, weshalb sie sich nahezu gleich in Bezug auf Hubweg und Feedback anfühlt. Manche mögen den Tastenhub von 1 mm als zu gering empfinden, aber der Gesamteindruck ist deutlich besser, als was wir von einer abnehmbaren Tastatur erwartet haben. Denn viele Geräte in dieser Kategorie sind bekannt für ihr schwaches Feedback, ihren billigen Eindruck und ihr schwammiges Gefühl. Die Tastatur des XPS 13 9315 2-in-1 kommt unter den Detachables noch am ehesten einer richtigen Ultrabook-Tastatur gleich.
Das Layout ist allerdings nicht so wie beim XPS 13 Plus 9320: Die Tastatur von Letzterem ist etwas breiter und beinhaltet den Einschaltknopf als auch eine kapazitive Funktions-Tastenreihe. Die Schriftart und die weiße Hintergrundbeleuchtung sind jedoch praktisch identisch.
Touchpad
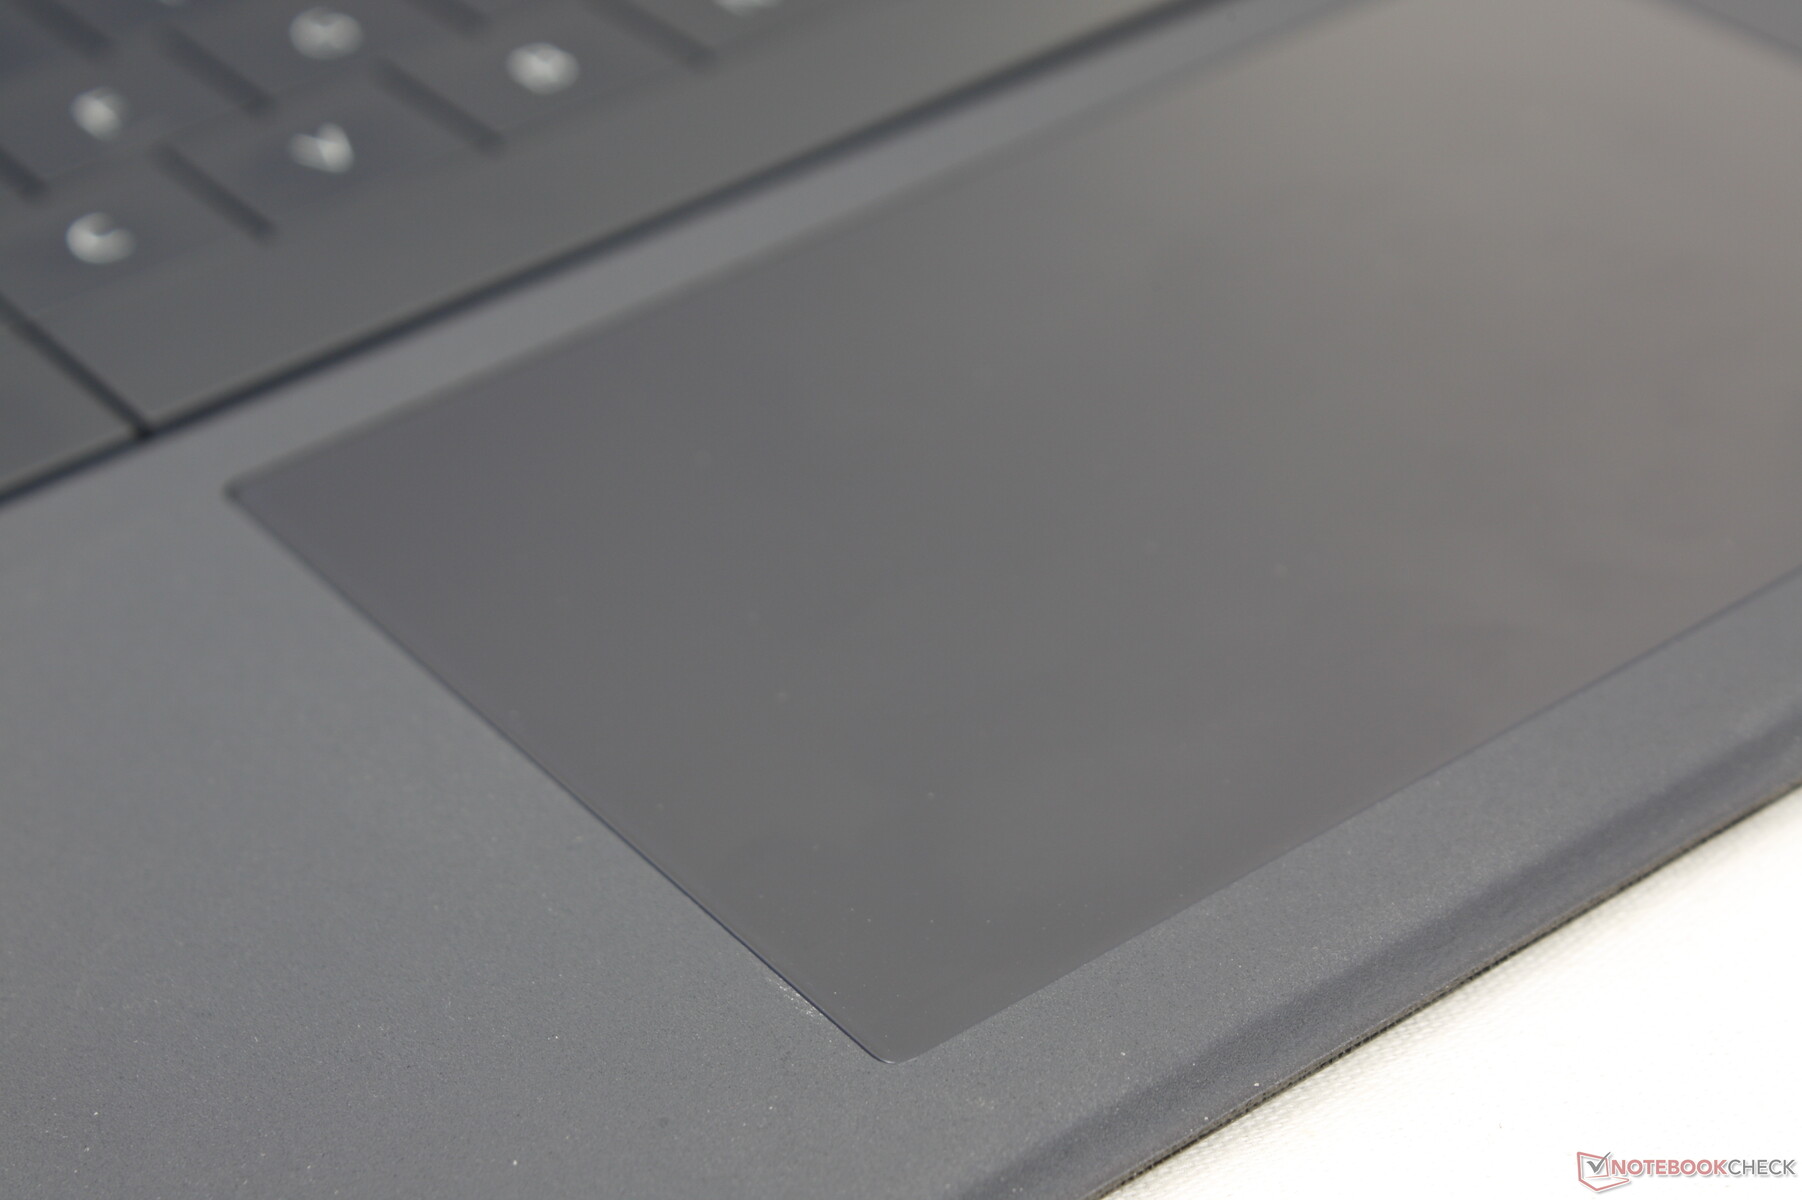
Das Clickpad fällt größer aus als das der Surface Pro Serie (11,4 x 7,5 vs. 10,2 x 5,3 cm), sodass Scrollen und Multi-Touch-Gesten einfacher von den Fingern gehen. Die Oberfläche ist komplett glatt und bremst selbst bei langsamem Darübergleiten ausgesprochen wenig. Allerdings ist das Feedback der Klicks deutlich schwächer als bei den meisten Laptops, sodass es sich beim XPS 13 9315 Clamshell deutlich satter anfühlt.
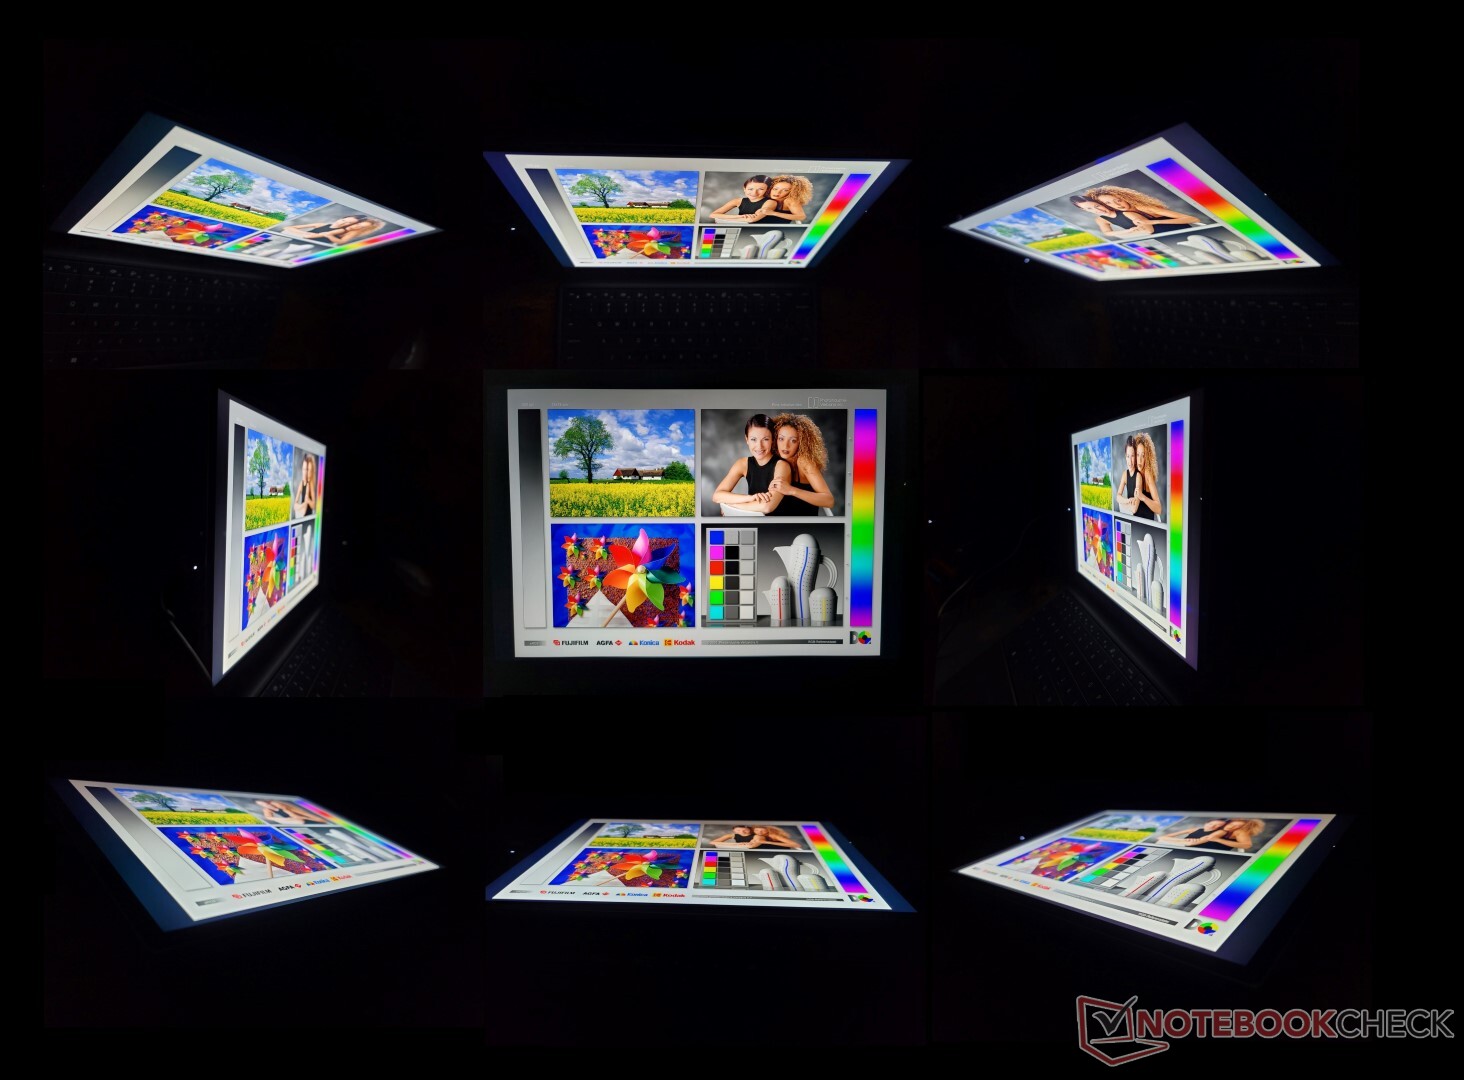
Display — XPS 13 2-in-1 auf 60 Hz beschränkt
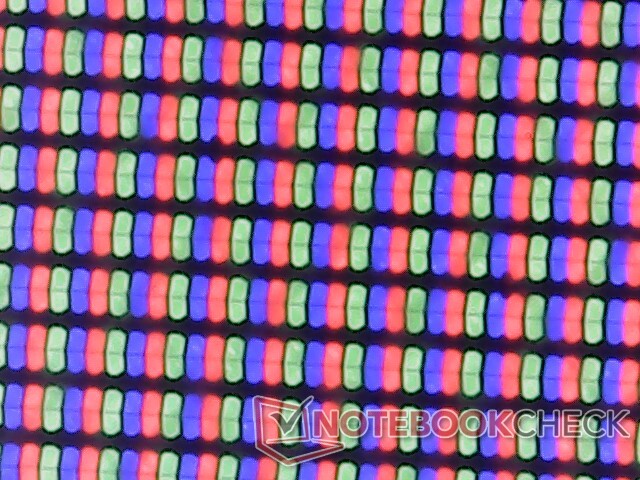
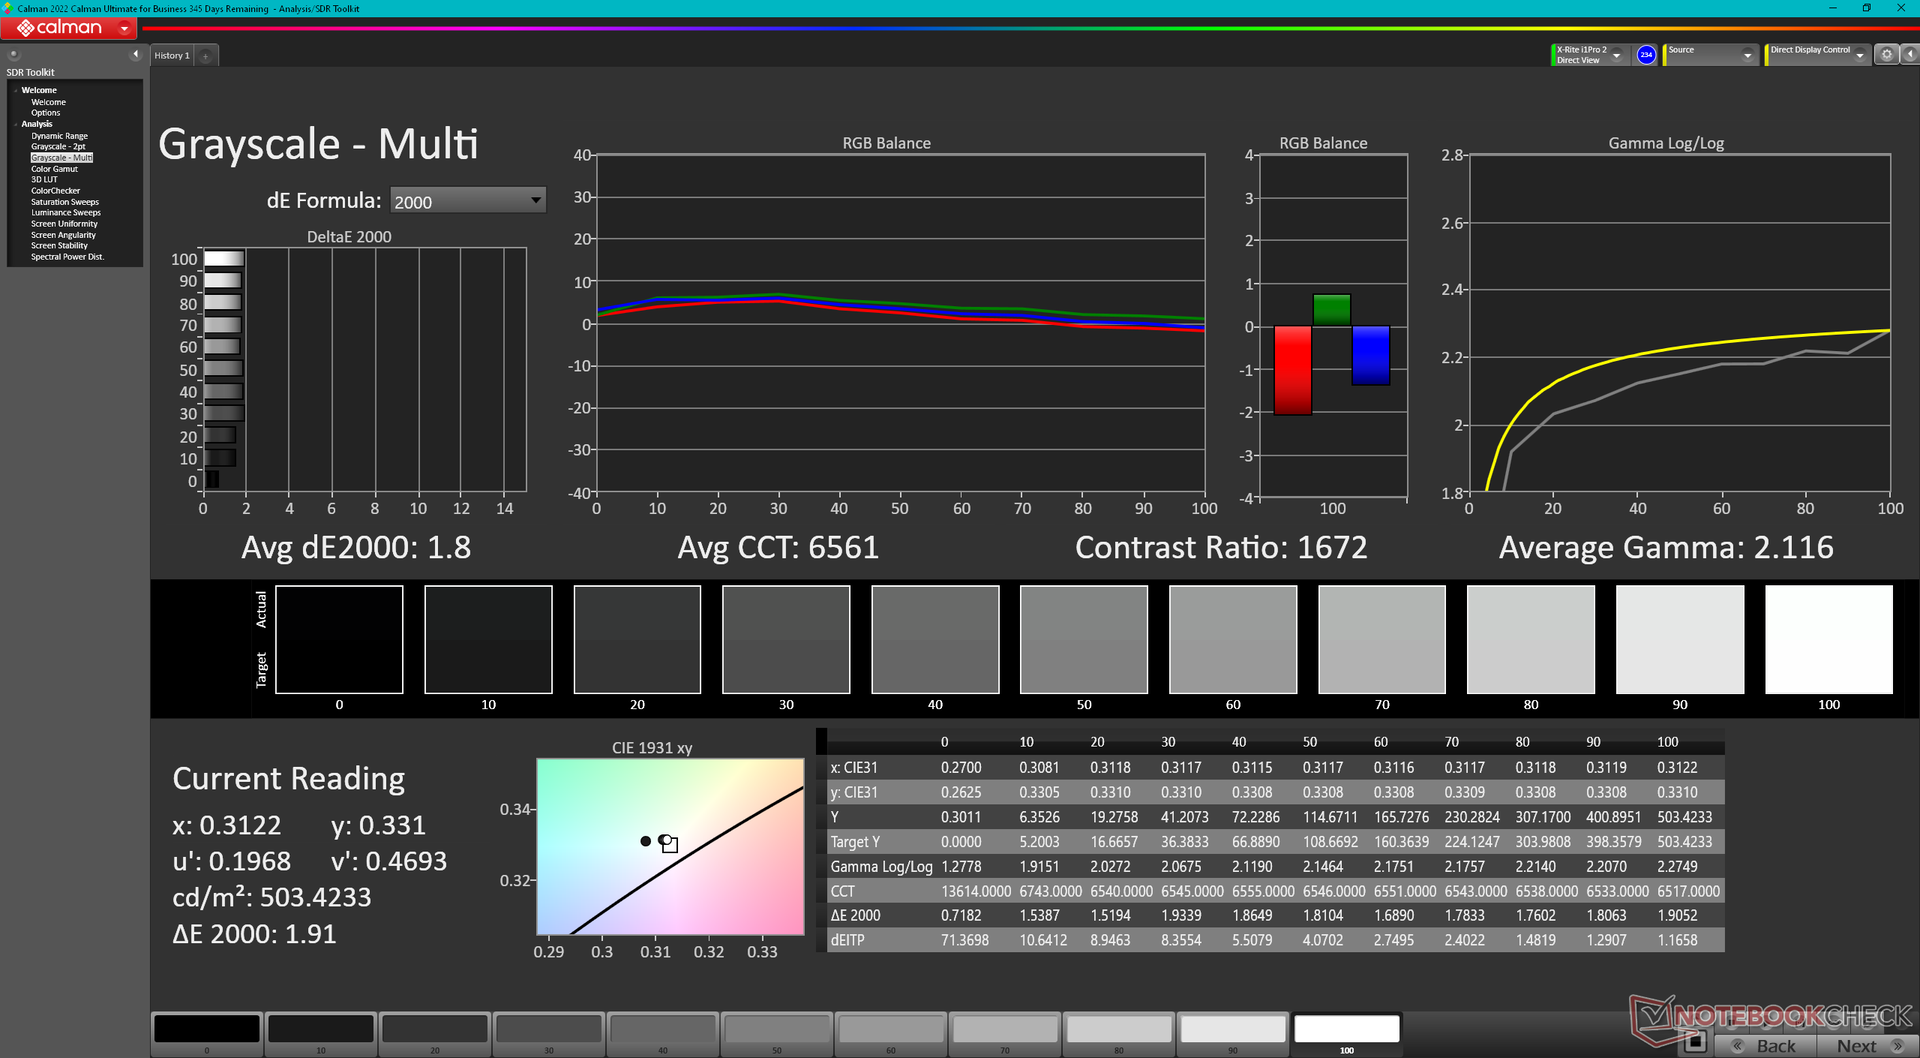
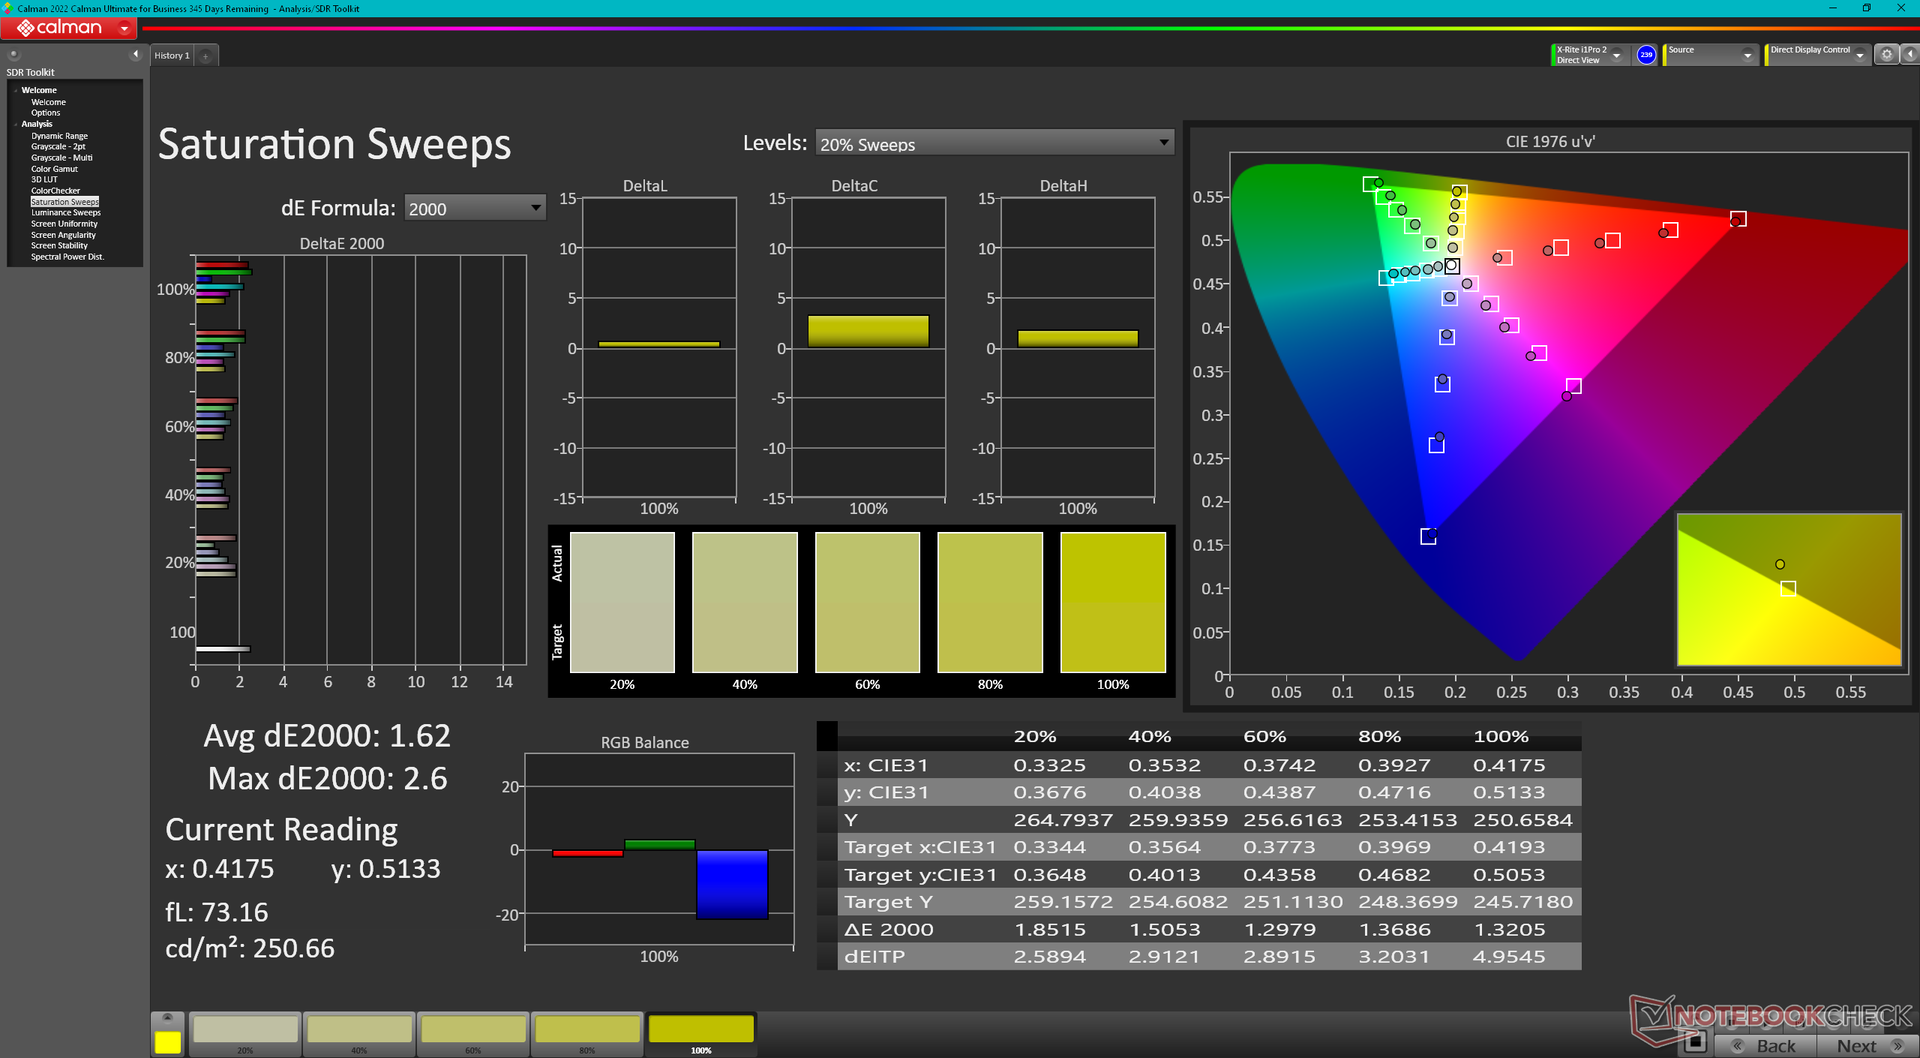
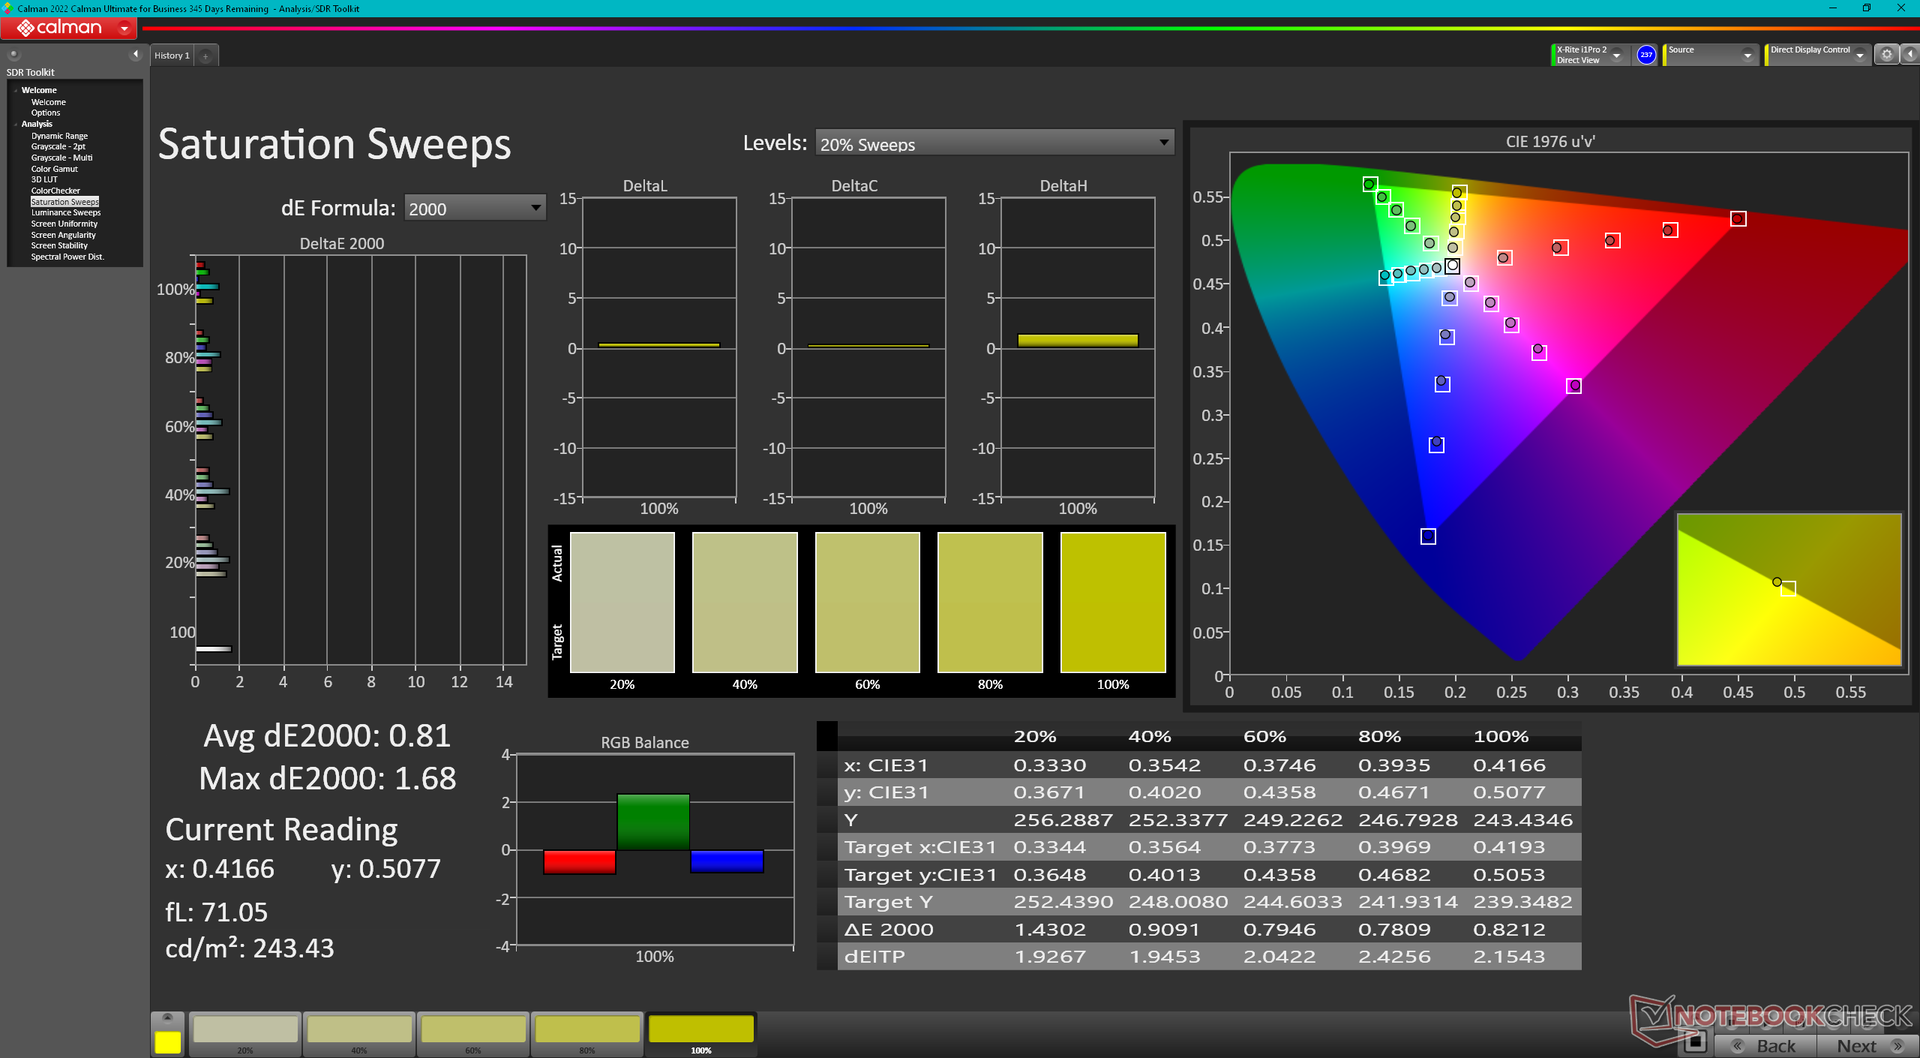
Dell bewirbt das Display mit 500 Nits und voller sRGB-Abdeckung, was wir durch unsere unabhängigen Messungen bestätigen können. Der Kontrast ist mit circa 1.500:1 ebenfalls sehr gut für ein IPS-Panel, während im Gegensatz zum Microsoft-Equivalent kein PWM-Flackern festgestellt wurde. Der erste visuelle Eindruck ist für ein High-End-Windows-Tablet angemessen.
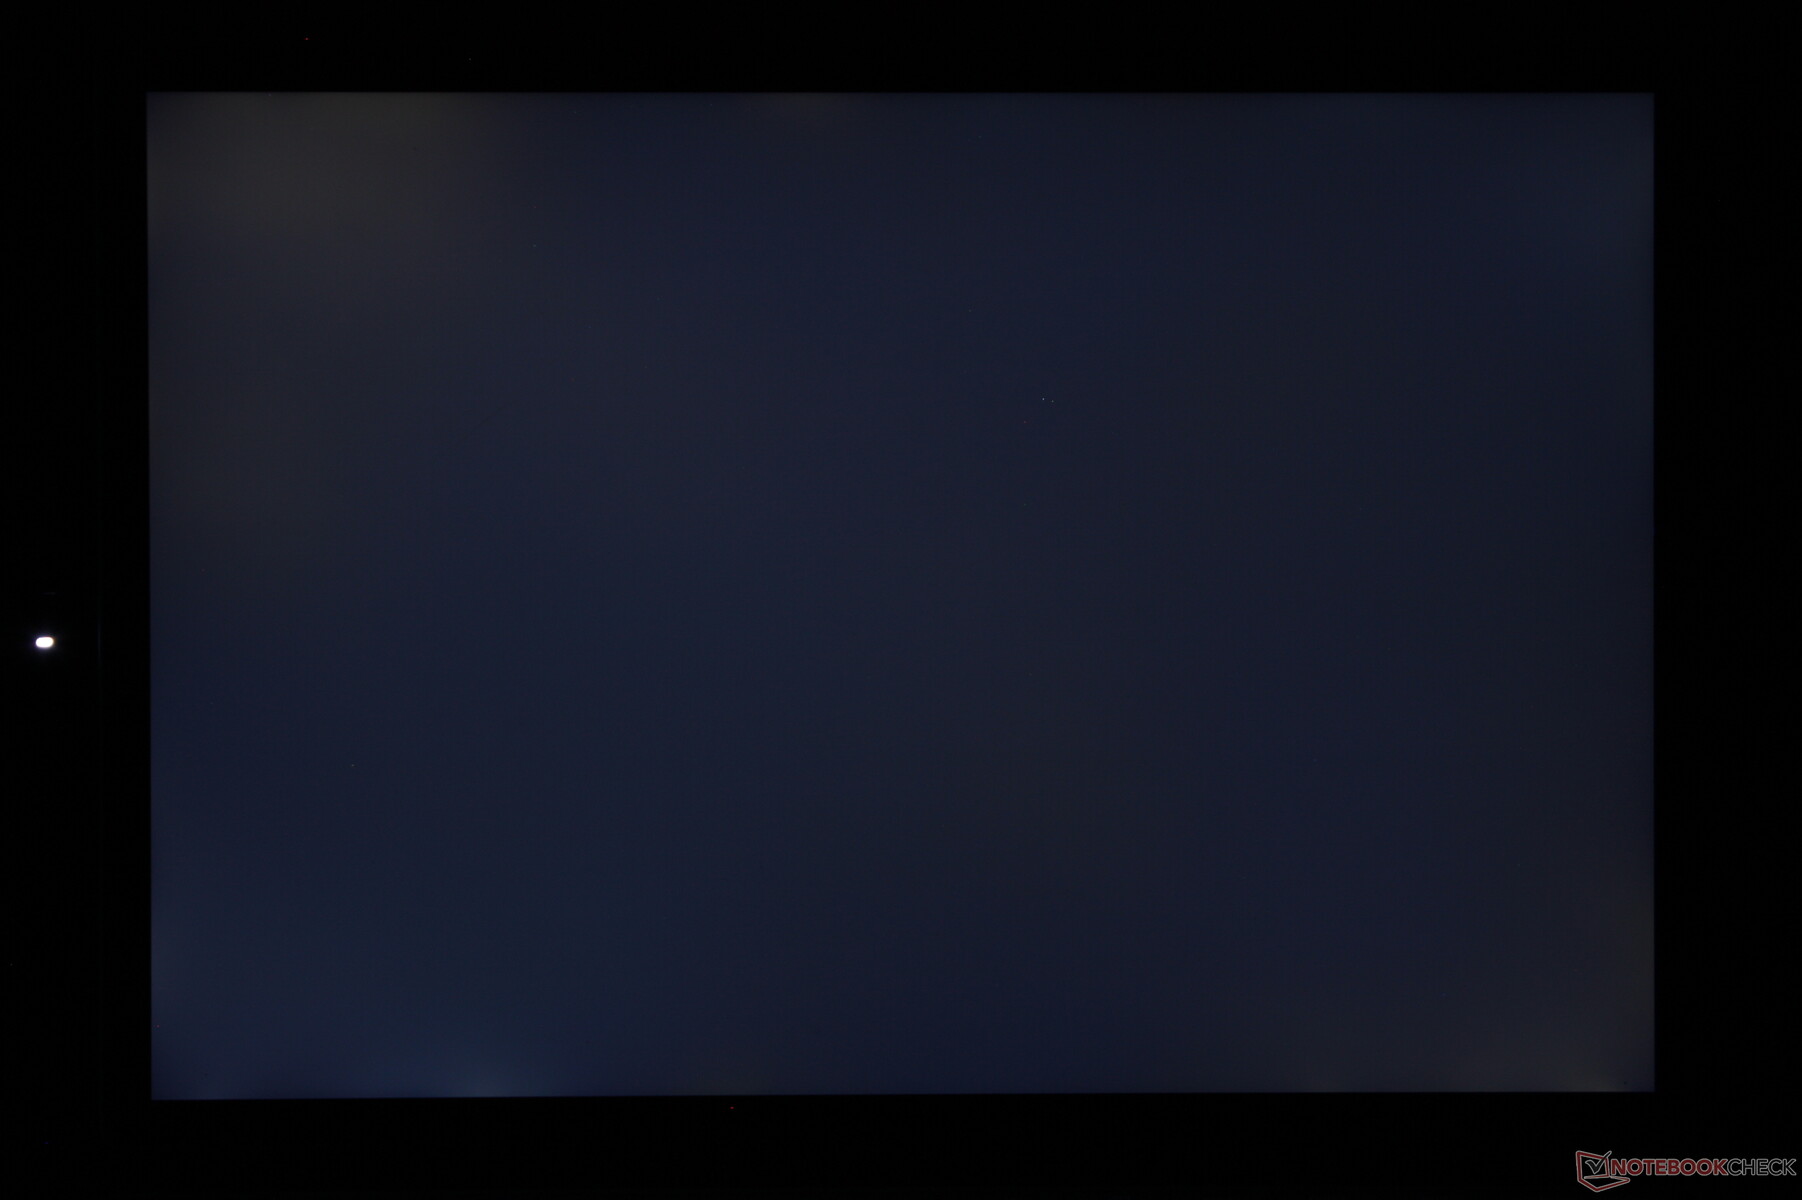
Zwei erwähnenswerte Nachteile bemerkten wir: Erstens sind die Reaktionszeiten relativ langsam, was zu sichtbarem Ghosting beim Bewegen des Mauszeigers oder beim Scrolling auf Webseiten führt. Zweitens könnte die Ausleuchtung besser ausfallen, da das Panel oben links 50 Nits heller ist als unten rechts. Das ist nichts Herausragendes, aber eine OLED-Option hätte beide Nachteile mit Leichtigkeit beheben können.
In künftigen Modellen würden wir gerne Panels mit höheren Bildwiederholraten und vielleicht mit einer Abdeckung des gesamten DCI-P3-Farbraumes sehen. Das Surface Pro 8 kommt etwa mit einer Refresh-Rate von 120 Hz, um das Ansprechverhalten des UI zu optimieren. Für ein OLED-Display muss der Kunde weiterhin auf traditionelle Laptops wie das Dell XPS 13 Plus 9320 oder Asus VivoBook zurückgreifen.
| |||||||||||||||||||||||||
Ausleuchtung: 87 %
Helligkeit Akku: 507 cd/m²
Kontrast: 1491:1 (Schwarzwert: 0.34 cd/m²)
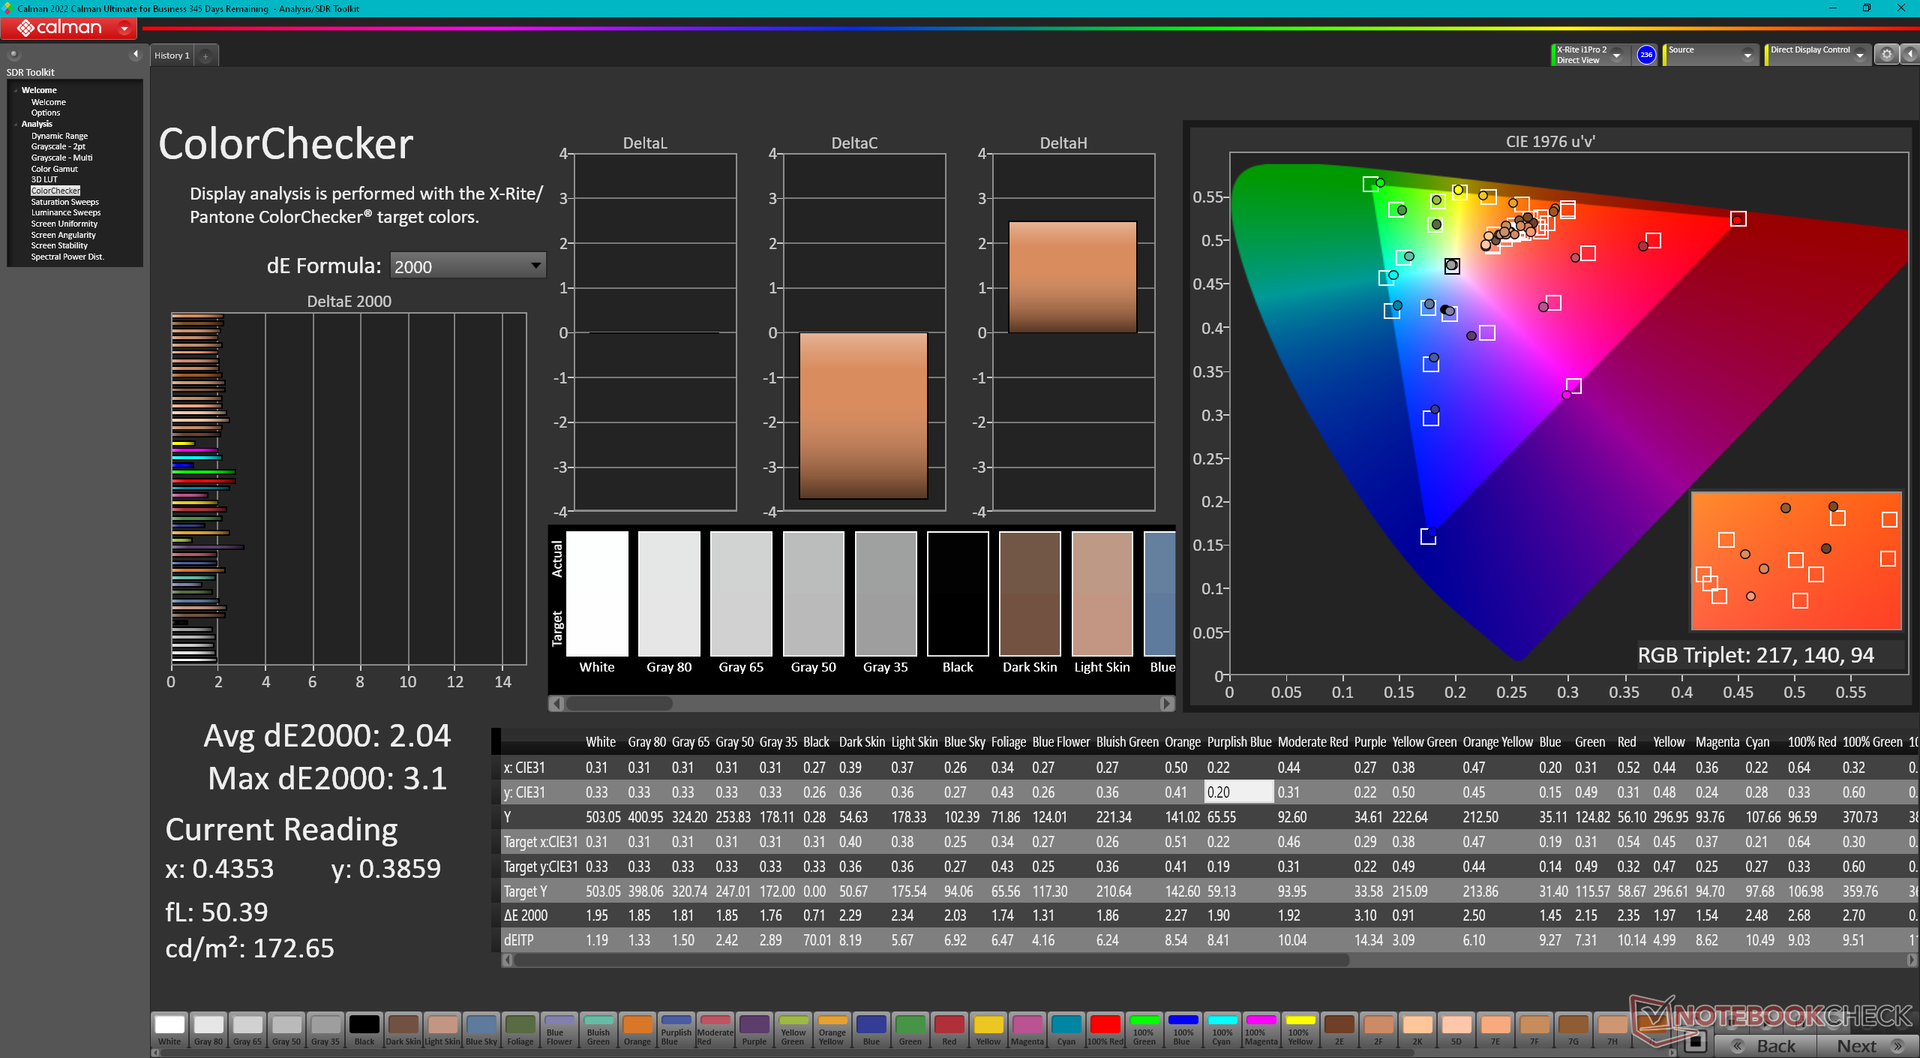
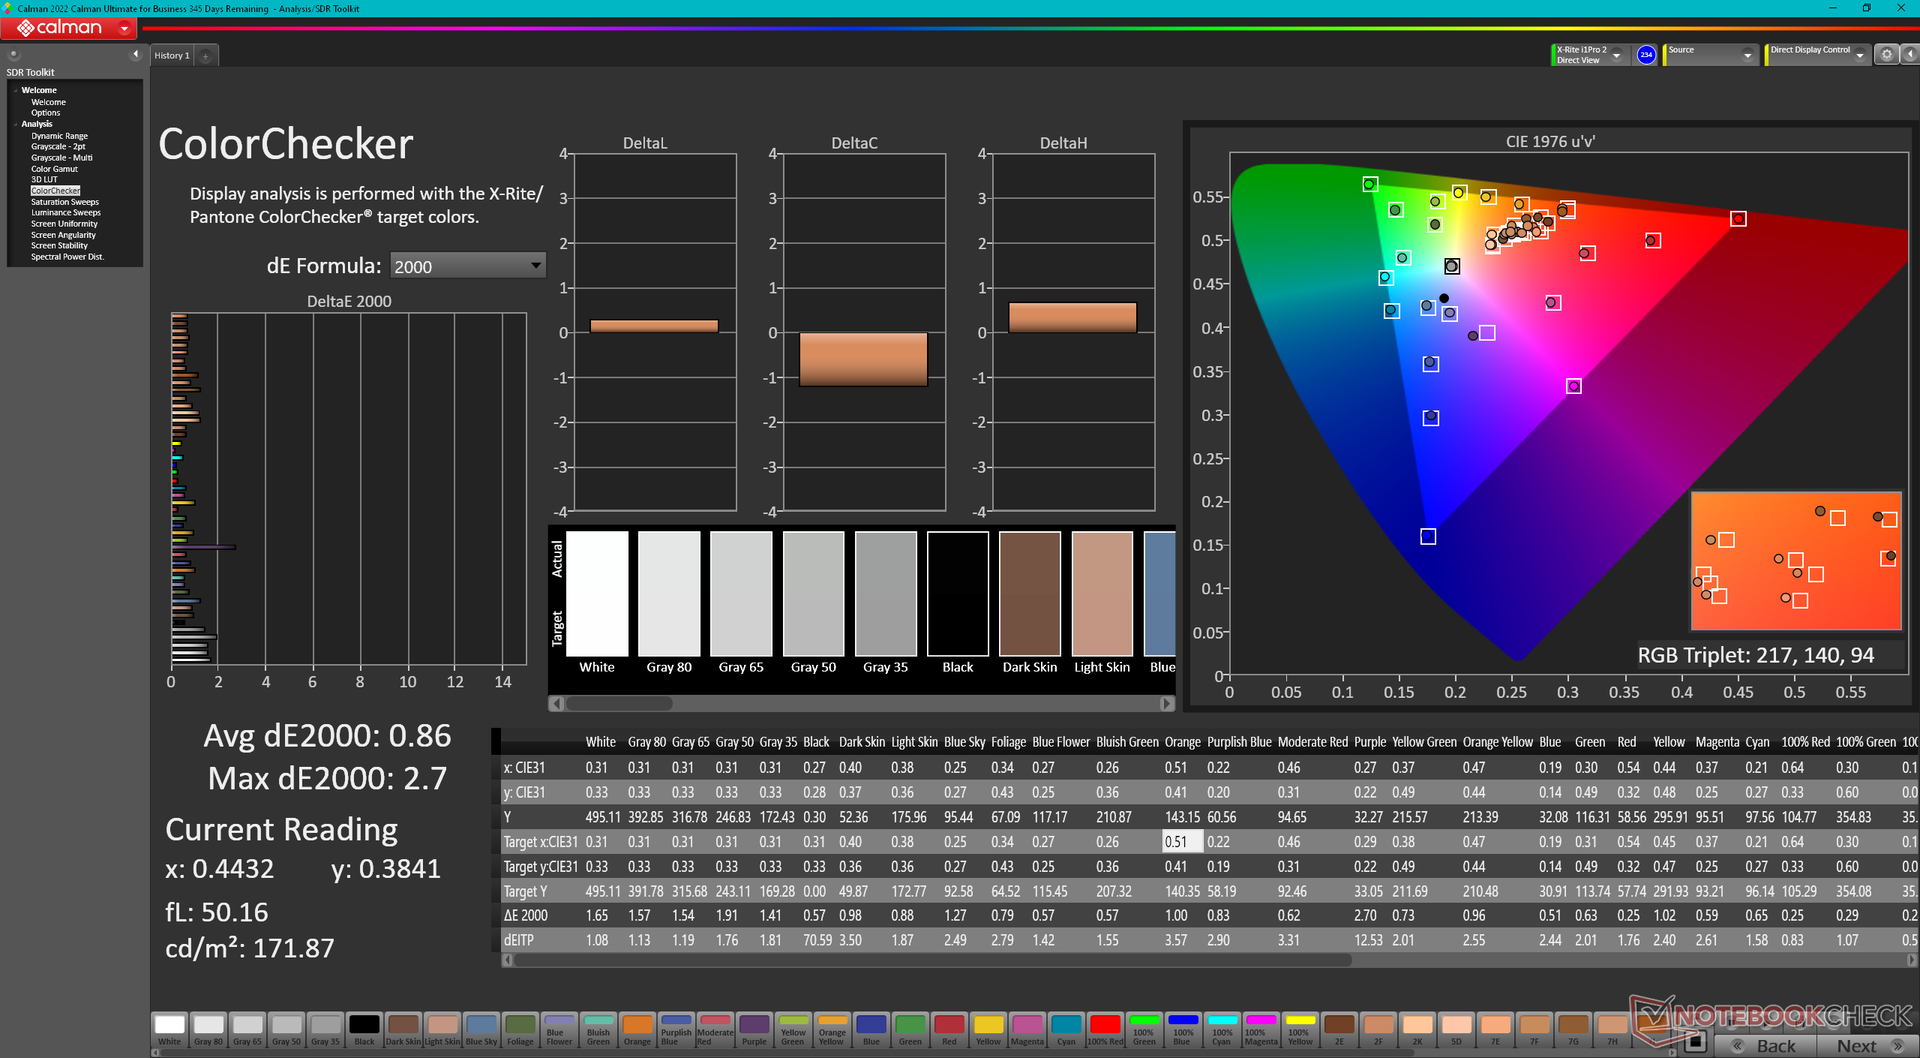
ΔE ColorChecker Calman: 2.04 | ∀{0.5-29.43 Ø4.73}
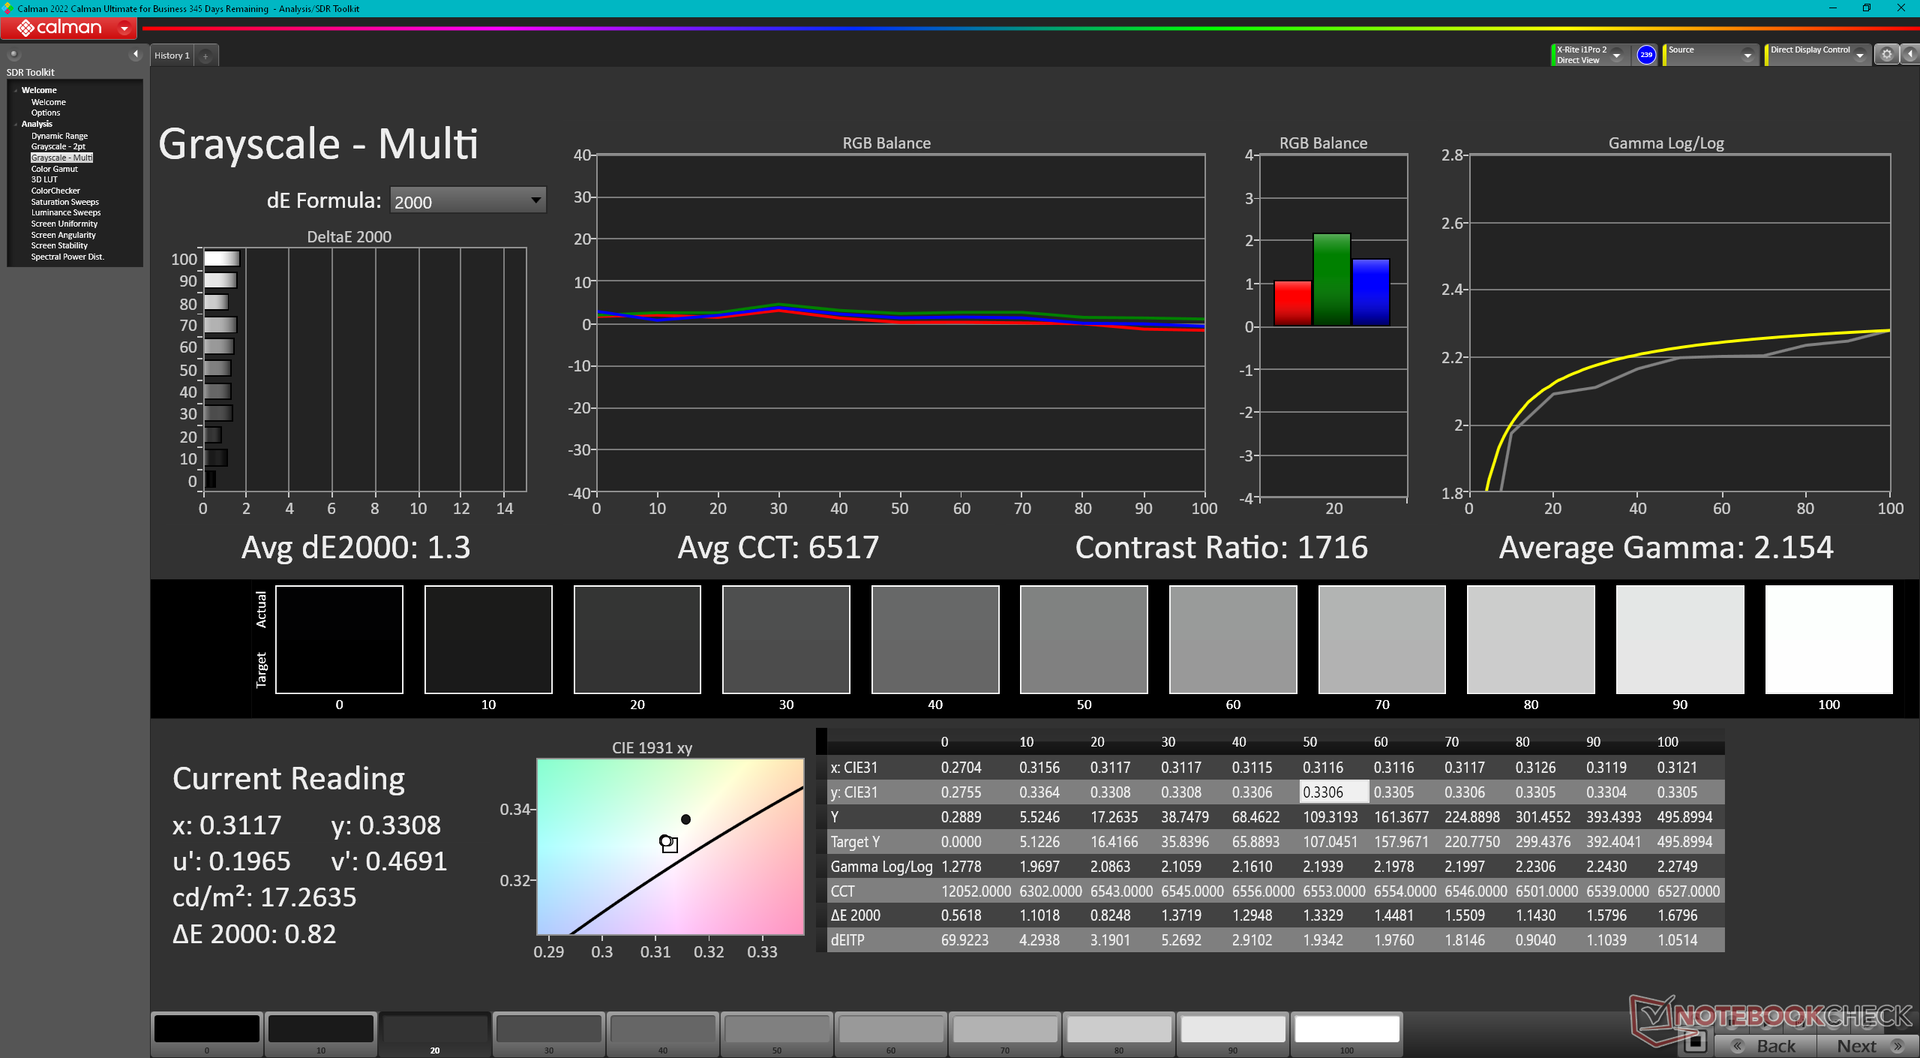
calibrated: 0.86
ΔE Greyscale Calman: 1.8 | ∀{0.09-98 Ø4.97}
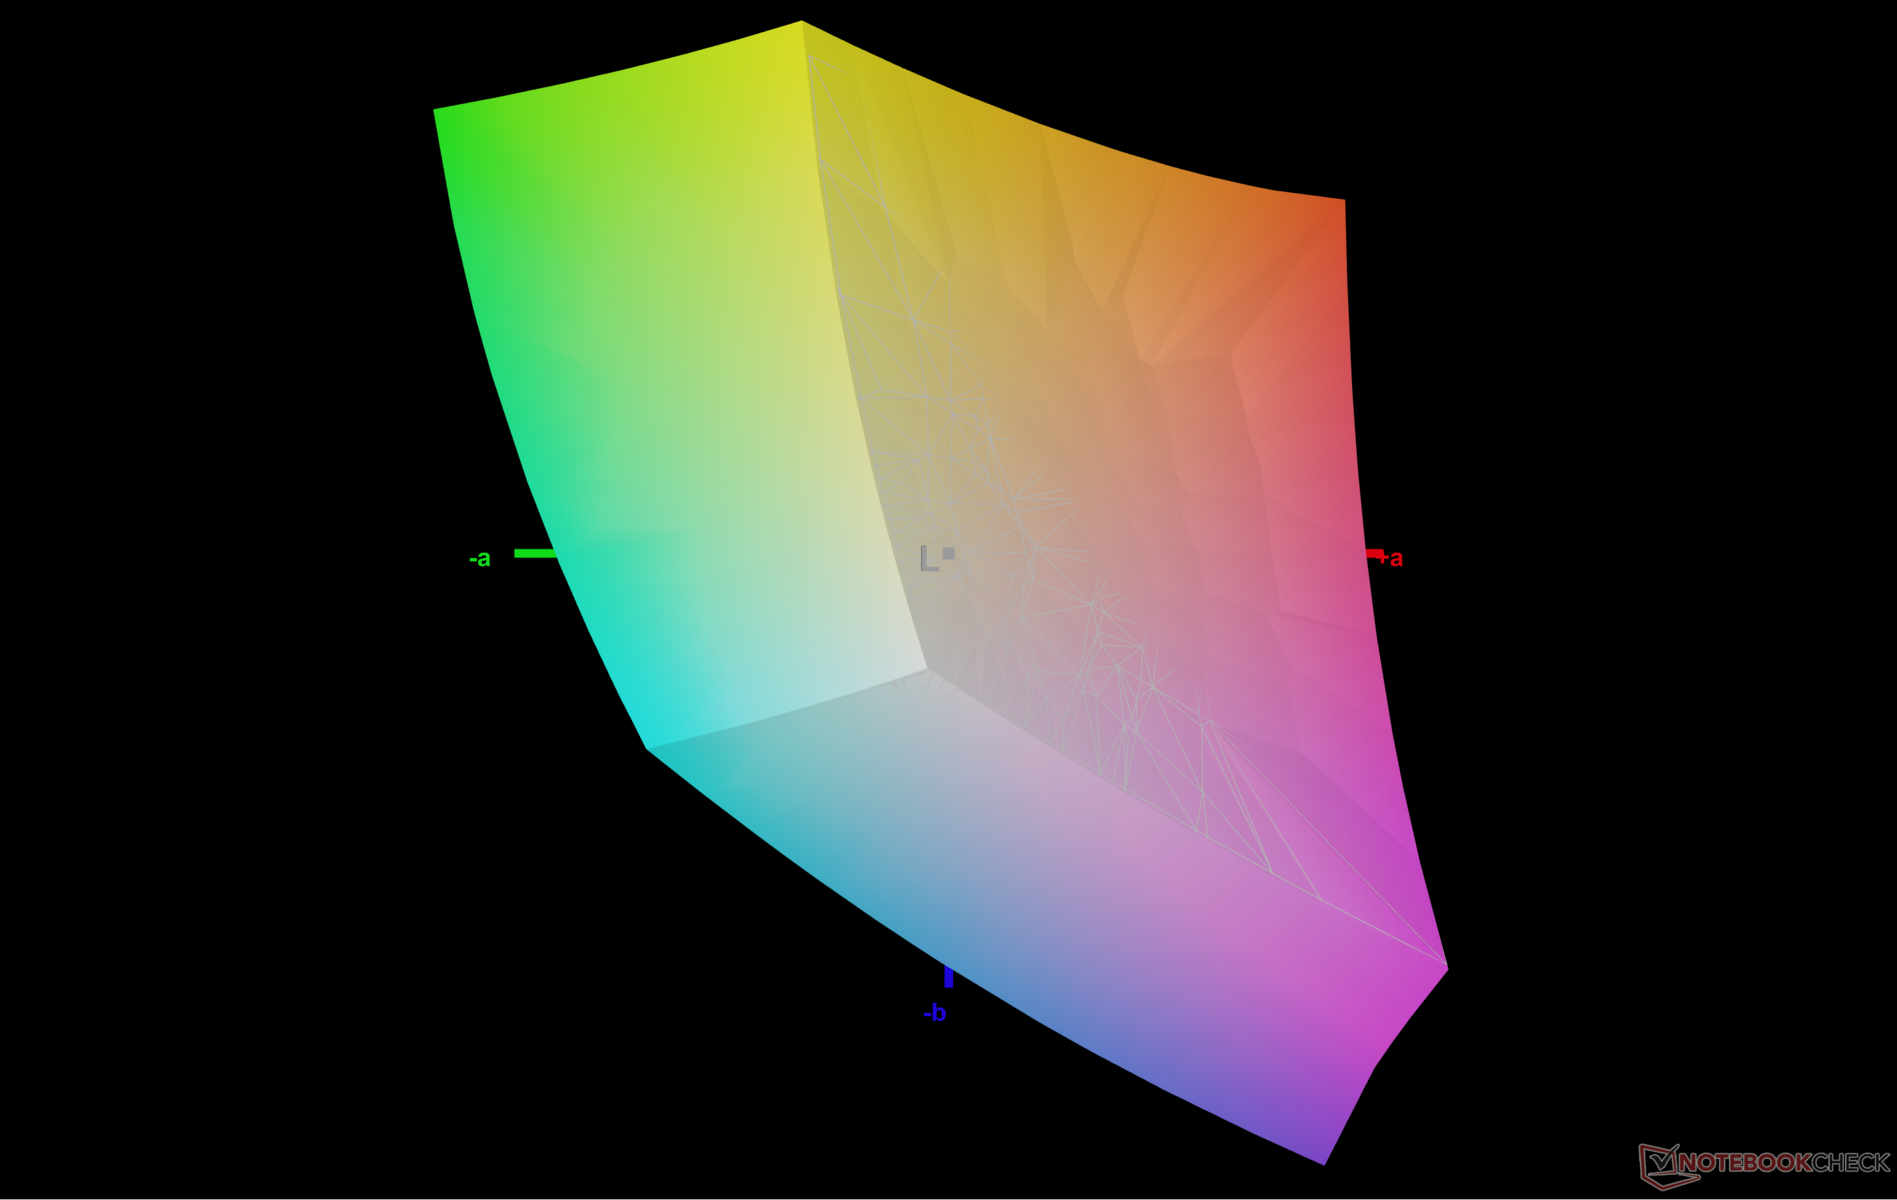
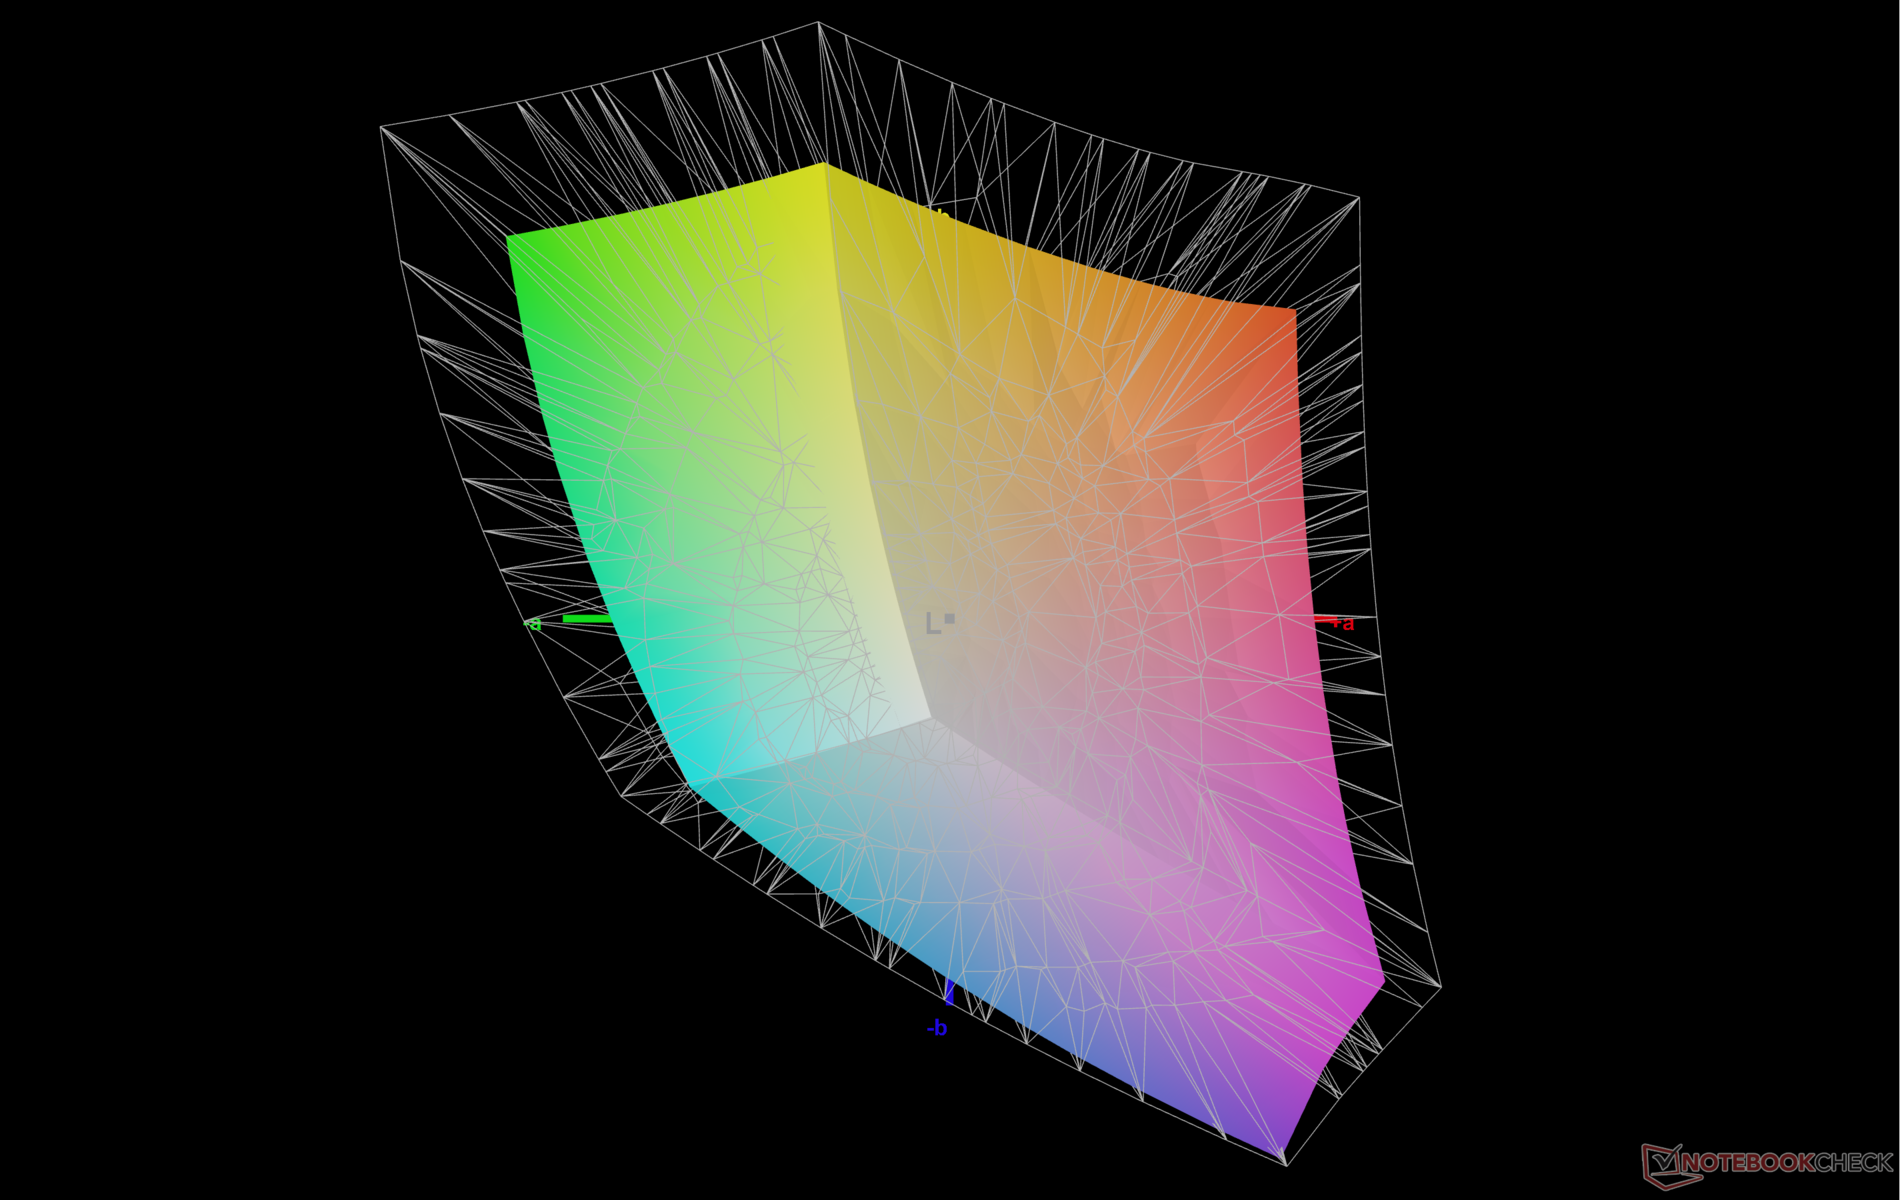
72.6% AdobeRGB 1998 (Argyll 3D)
99.8% sRGB (Argyll 3D)
70.7% Display P3 (Argyll 3D)
Gamma: 2.12
CCT: 6561 K
| Dell XPS 13 9315 2-in-1 Core i5-1230U BOE NE13A1M, IPS, 2880x1920, 13" | Dell XPS 13 Plus 9320 i7-1280P OLED Samsung 134XK04, OLED, 3456x2160, 13.4" | Microsoft Surface Pro 8, i7-1185G7 LP129WT212166, IPS, 2880x1920, 13" | HP Spectre x360 13.5 14t-ef000 SDC4160, OLED, 3000x2000, 13.5" | Lenovo ThinkBook Plus Gen2 Core i5 CSOT T3 MND307DA1-5 (LCD), IPS, E-Ink, 2560x1600, 13.3" | Apple MacBook Air M2 Entry IPS, 2560x1664, 13.6" | |
|---|---|---|---|---|---|---|
| Display | 26% | 6% | 22% | -1% | 20% | |
| Display P3 Coverage (%) | 70.7 | 99.5 41% | 78.2 11% | 99.9 41% | 70.1 -1% | 98.4 39% |
| sRGB Coverage (%) | 99.8 | 100 0% | 100 0% | 100 0% | 98 -2% | 99.9 0% |
| AdobeRGB 1998 Coverage (%) | 72.6 | 98.4 36% | 77.6 7% | 90.8 25% | 72.2 -1% | 87.6 21% |
| Response Times | 93% | 1% | 94% | -5% | 13% | |
| Response Time Grey 50% / Grey 80% * (ms) | 44 ? | 2.6 ? 94% | 46.4 ? -5% | 1.9 ? 96% | 42.8 ? 3% | 32.9 ? 25% |
| Response Time Black / White * (ms) | 24.8 ? | 2.1 ? 92% | 23.2 ? 6% | 2.16 ? 91% | 28 ? -13% | 24.9 ? -0% |
| PWM Frequency (Hz) | 59.5 | 29760 ? | 60.2 ? | |||
| Bildschirm | -27% | -19% | -29% | -36% | 5% | |
| Helligkeit Bildmitte (cd/m²) | 507 | 371.8 -27% | 444 -12% | 351.7 -31% | 404 -20% | 526 4% |
| Brightness (cd/m²) | 486 | 374 -23% | 451 -7% | 351 -28% | 388 -20% | 486 0% |
| Brightness Distribution (%) | 87 | 98 13% | 91 5% | 87 0% | 94 8% | 87 0% |
| Schwarzwert * (cd/m²) | 0.34 | 0.43 -26% | 0.24 29% | 0.38 -12% | ||
| Kontrast (:1) | 1491 | 1033 -31% | 1683 13% | 1384 -7% | ||
| Delta E Colorchecker * | 2.04 | 2.37 -16% | 2 2% | 1.78 13% | 3.1 -52% | 1.3 36% |
| Colorchecker dE 2000 max. * | 3.1 | 6.1 -97% | 3.2 -3% | 6.14 -98% | 6.9 -123% | 2.7 13% |
| Colorchecker dE 2000 calibrated * | 0.86 | 1.7 -98% | 1.3 -51% | 0.7 19% | ||
| Delta E Graustufen * | 1.8 | 2 -11% | 1.8 -0% | 2.3 -28% | 3.7 -106% | 2 -11% |
| Gamma | 2.12 104% | 2.29 96% | 2.11 104% | 2.11 104% | 2.26 97% | 2.25 98% |
| CCT | 6561 99% | 6261 104% | 6417 101% | 6683 97% | 5936 110% | 6858 95% |
| Durchschnitt gesamt (Programm / Settings) | 31% /
9% | -4% /
-11% | 29% /
7% | -14% /
-24% | 13% /
9% |
* ... kleinere Werte sind besser
Das Display ist bereits ab Werk gut kalibriert, mit guten DeltaE-Werten von im Schnitt 1,8 und 2,04 bei den Graustufen respektive Farben. Unsere Kalibrierung mit einem X-Rite-Colorimeter verbesserte diese Werte weiter auf 1,3 und 0,86. Durch den Endverbraucher ist dies jedoch nicht notwendigerweise erforderlich. Unser kalibriertes Farbprofil kann wie immer neben der Ausleuchtungsgrafik heruntergeladen werden.
Reaktionszeiten (Response Times) des Displays
| ↔ Reaktionszeiten Schwarz zu Weiß | ||
|---|---|---|
| 24.8 ms ... steigend ↗ und fallend ↘ kombiniert | ↗ 11.6 ms steigend | 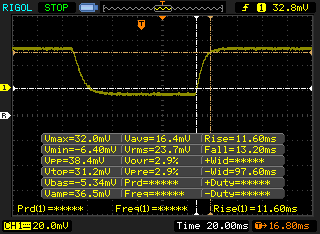 |
| ↘ 13.2 ms fallend | ||
| Die gemessenen Reaktionszeiten sind gut, für anspruchsvolle Spieler könnten der Bildschirm jedoch zu langsam sein. Im Vergleich rangierten die bei uns getesteten Geräte von 0.1 (Minimum) zu 240 (Maximum) ms. » 58 % aller Screens waren schneller als der getestete. Daher sind die gemessenen Reaktionszeiten schlechter als der Durchschnitt aller vermessenen Geräte (19.9 ms). | ||
| ↔ Reaktionszeiten 50% Grau zu 80% Grau | ||
| 44 ms ... steigend ↗ und fallend ↘ kombiniert | ↗ 23.6 ms steigend | 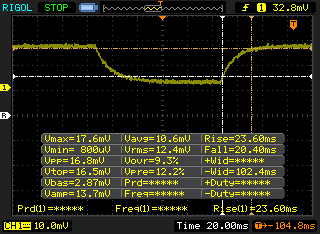 |
| ↘ 20.4 ms fallend | ||
| Die gemessenen Reaktionszeiten sind langsam und dadurch für viele Spieler wahrscheinlich zu langsam. Im Vergleich rangierten die bei uns getesteten Geräte von 0.165 (Minimum) zu 636 (Maximum) ms. » 73 % aller Screens waren schneller als der getestete. Daher sind die gemessenen Reaktionszeiten schlechter als der Durchschnitt aller vermessenen Geräte (31.1 ms). | ||
Bildschirm-Flackern / PWM (Pulse-Width Modulation)
| Flackern / PWM nicht festgestellt |  | ||
Im Vergleich: 52 % aller getesteten Geräte nutzten kein PWM um die Helligkeit zu reduzieren. Wenn PWM eingesetzt wurde, dann bei einer Frequenz von durchschnittlich 7791 (Minimum 5, Maximum 343500) Hz. | |||
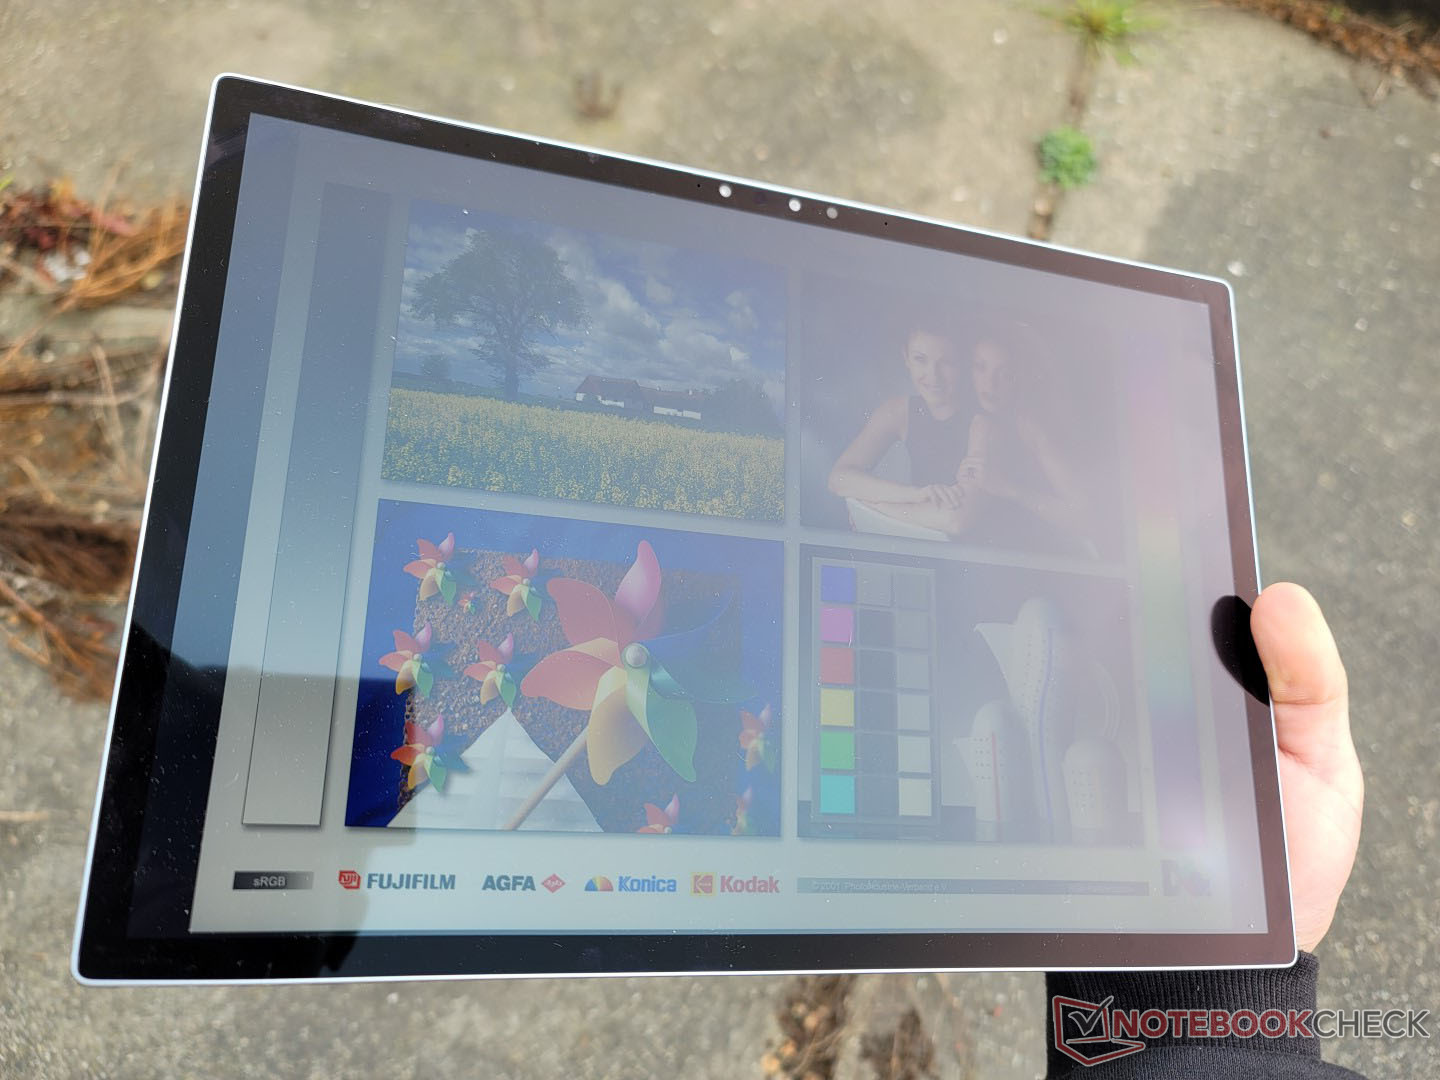
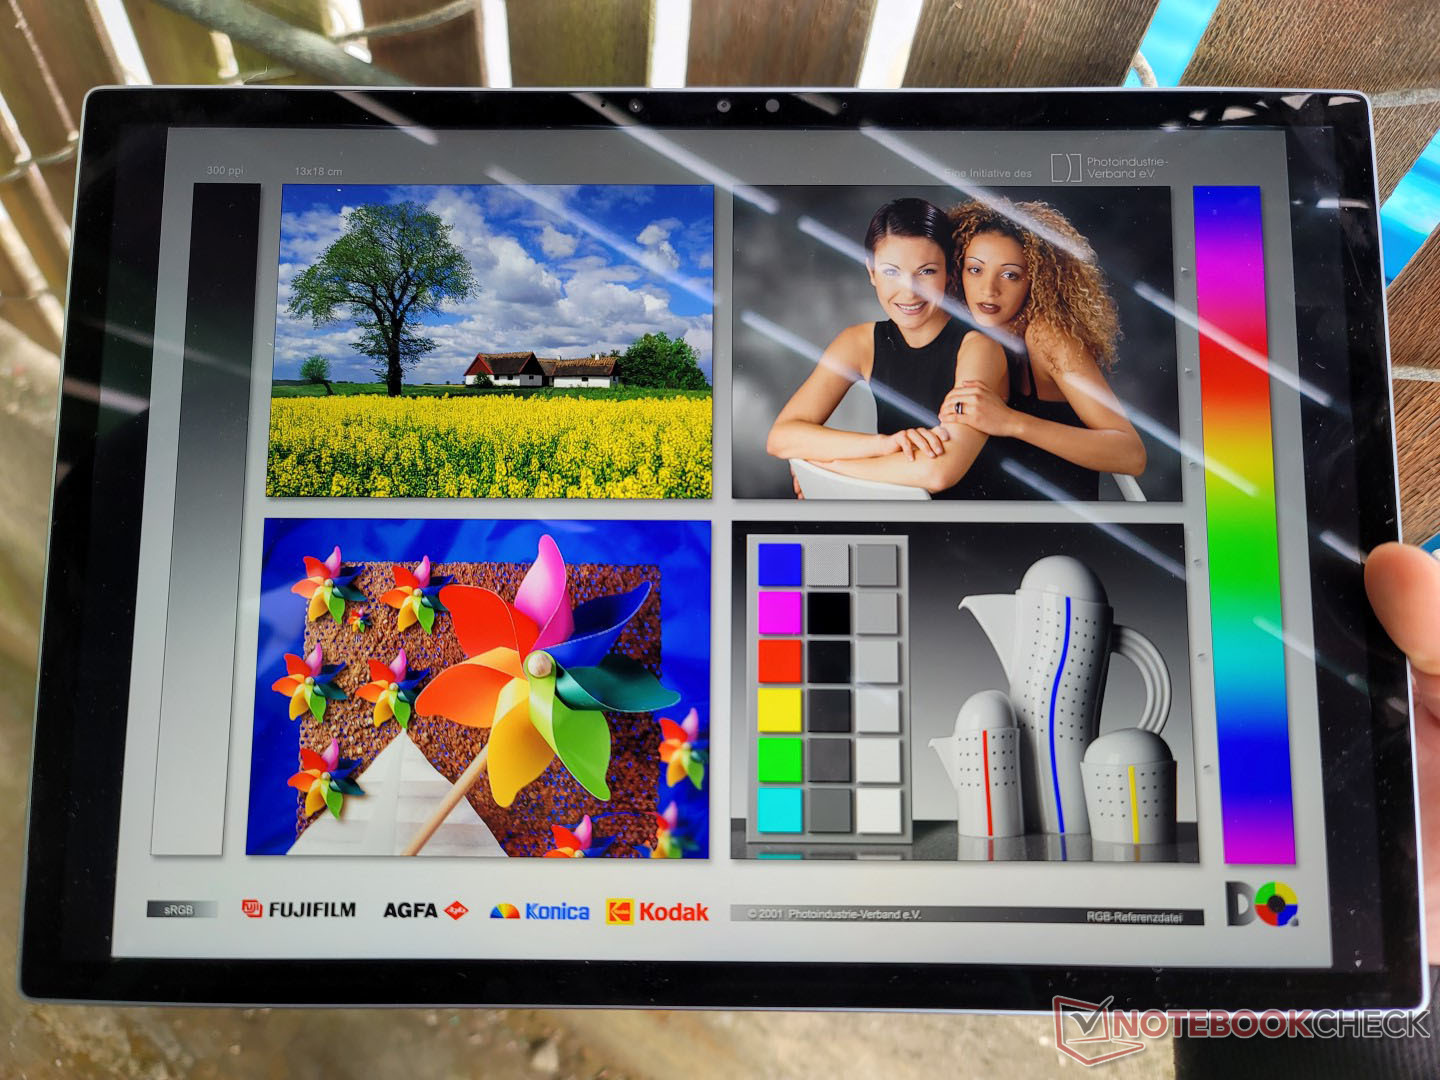
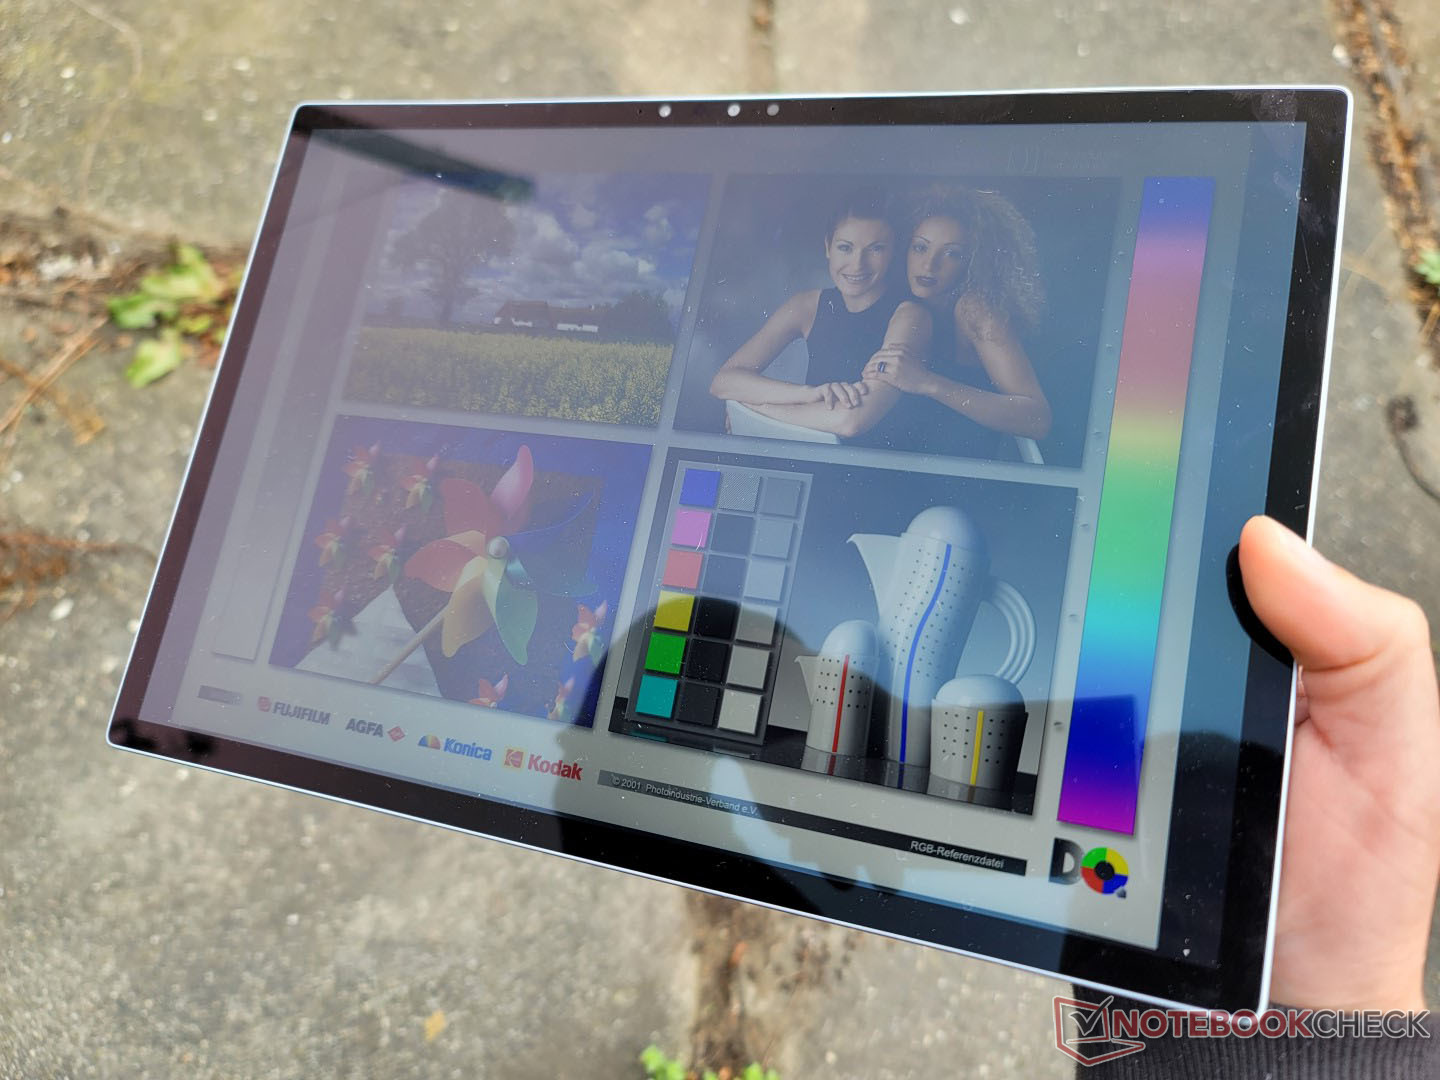
Spiegelungen sind immer vorhanden und praktisch unvermeidbar durch den Glossy Touchscreen. Das Display ist immerhin hell genug, um Spiegelungen auf ein Minimum zu reduzieren, während man draußen im Schatten arbeitet. Bei hellerem Umgebungslicht nehmen Farben und Ablesbarkeit rapide ab. Manche HP-Elite-x2-Modelle besitzen eine 1.000 Nits helle Display-Option, welche doppelt so hell ist als das Dell und dadurch eine leichtere Ablesbarkeit im Außeneinsatz ermöglicht.
Leistung — CPU top, GPU meh beim Dell Detachable
Testbedingungen
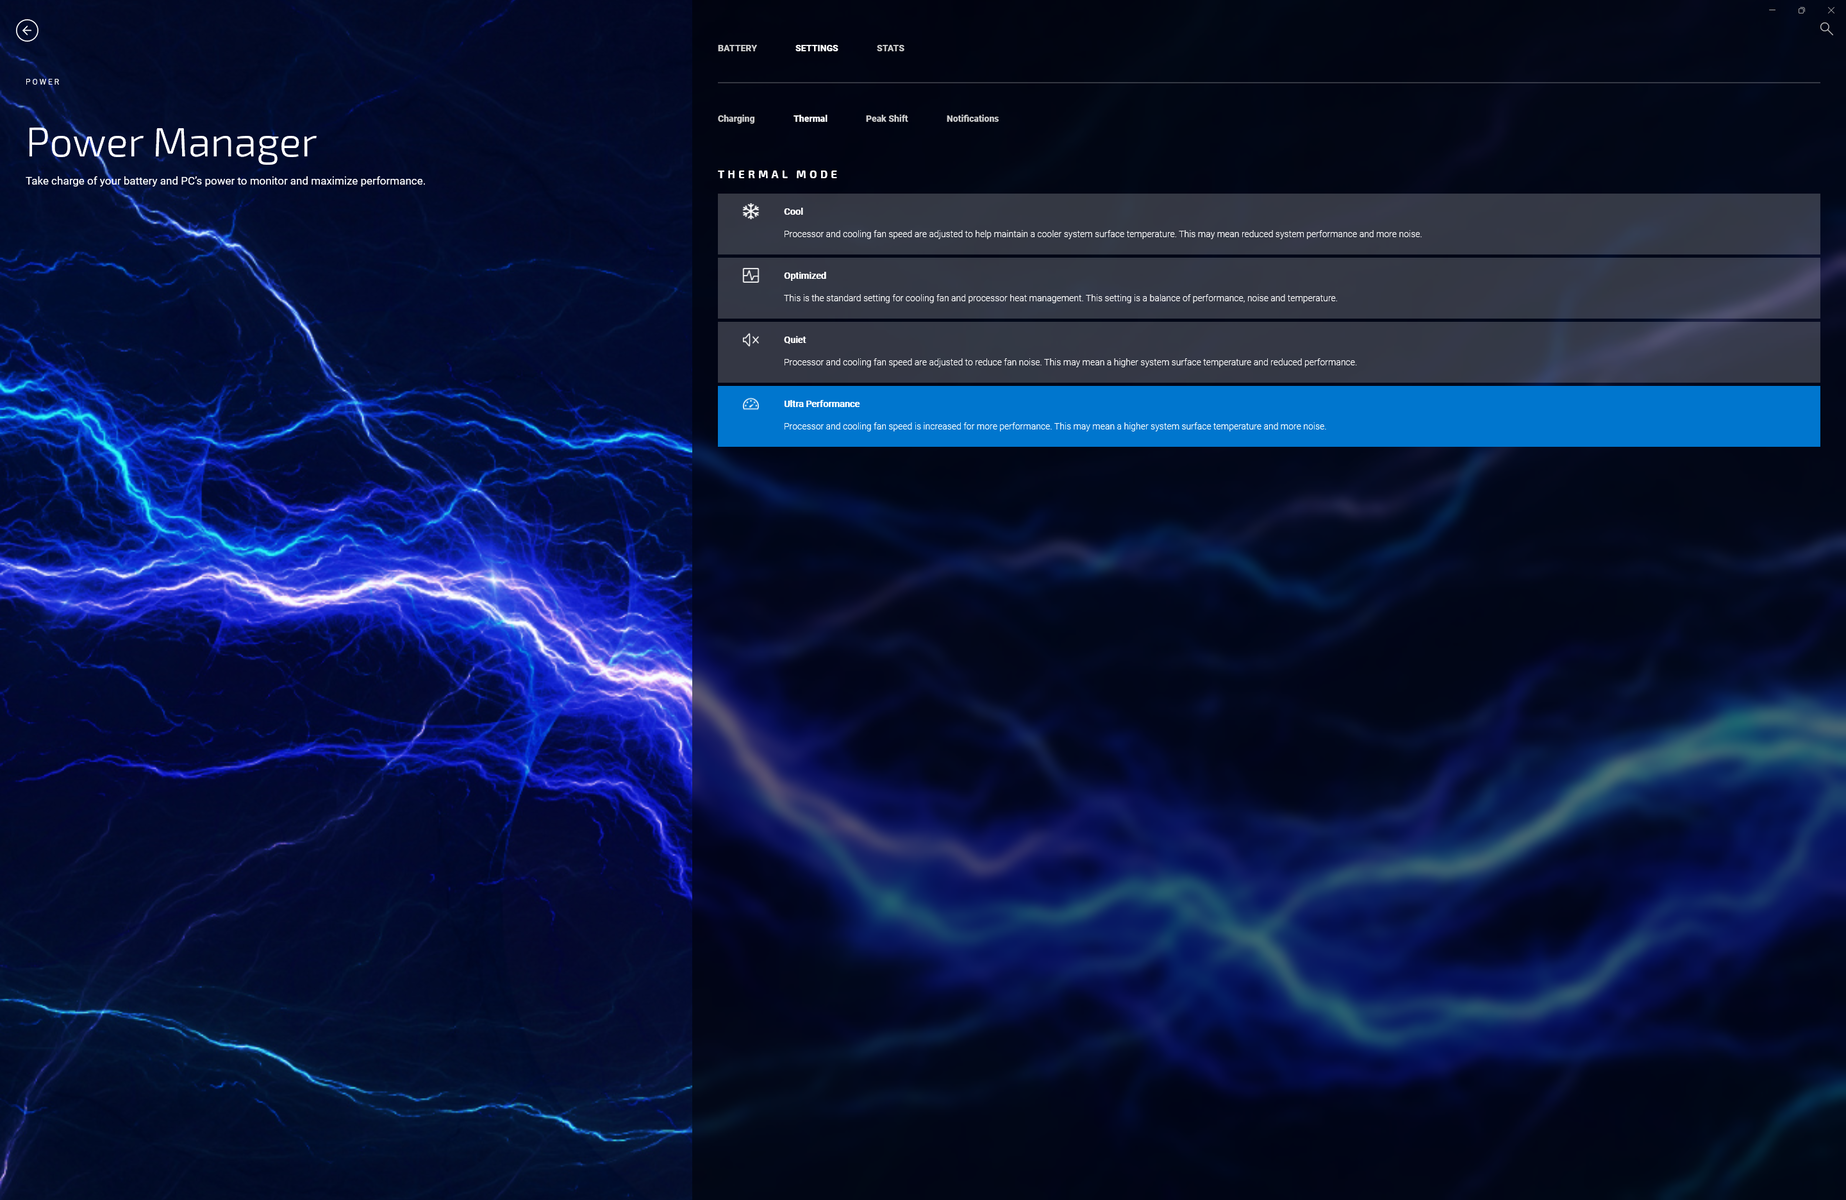
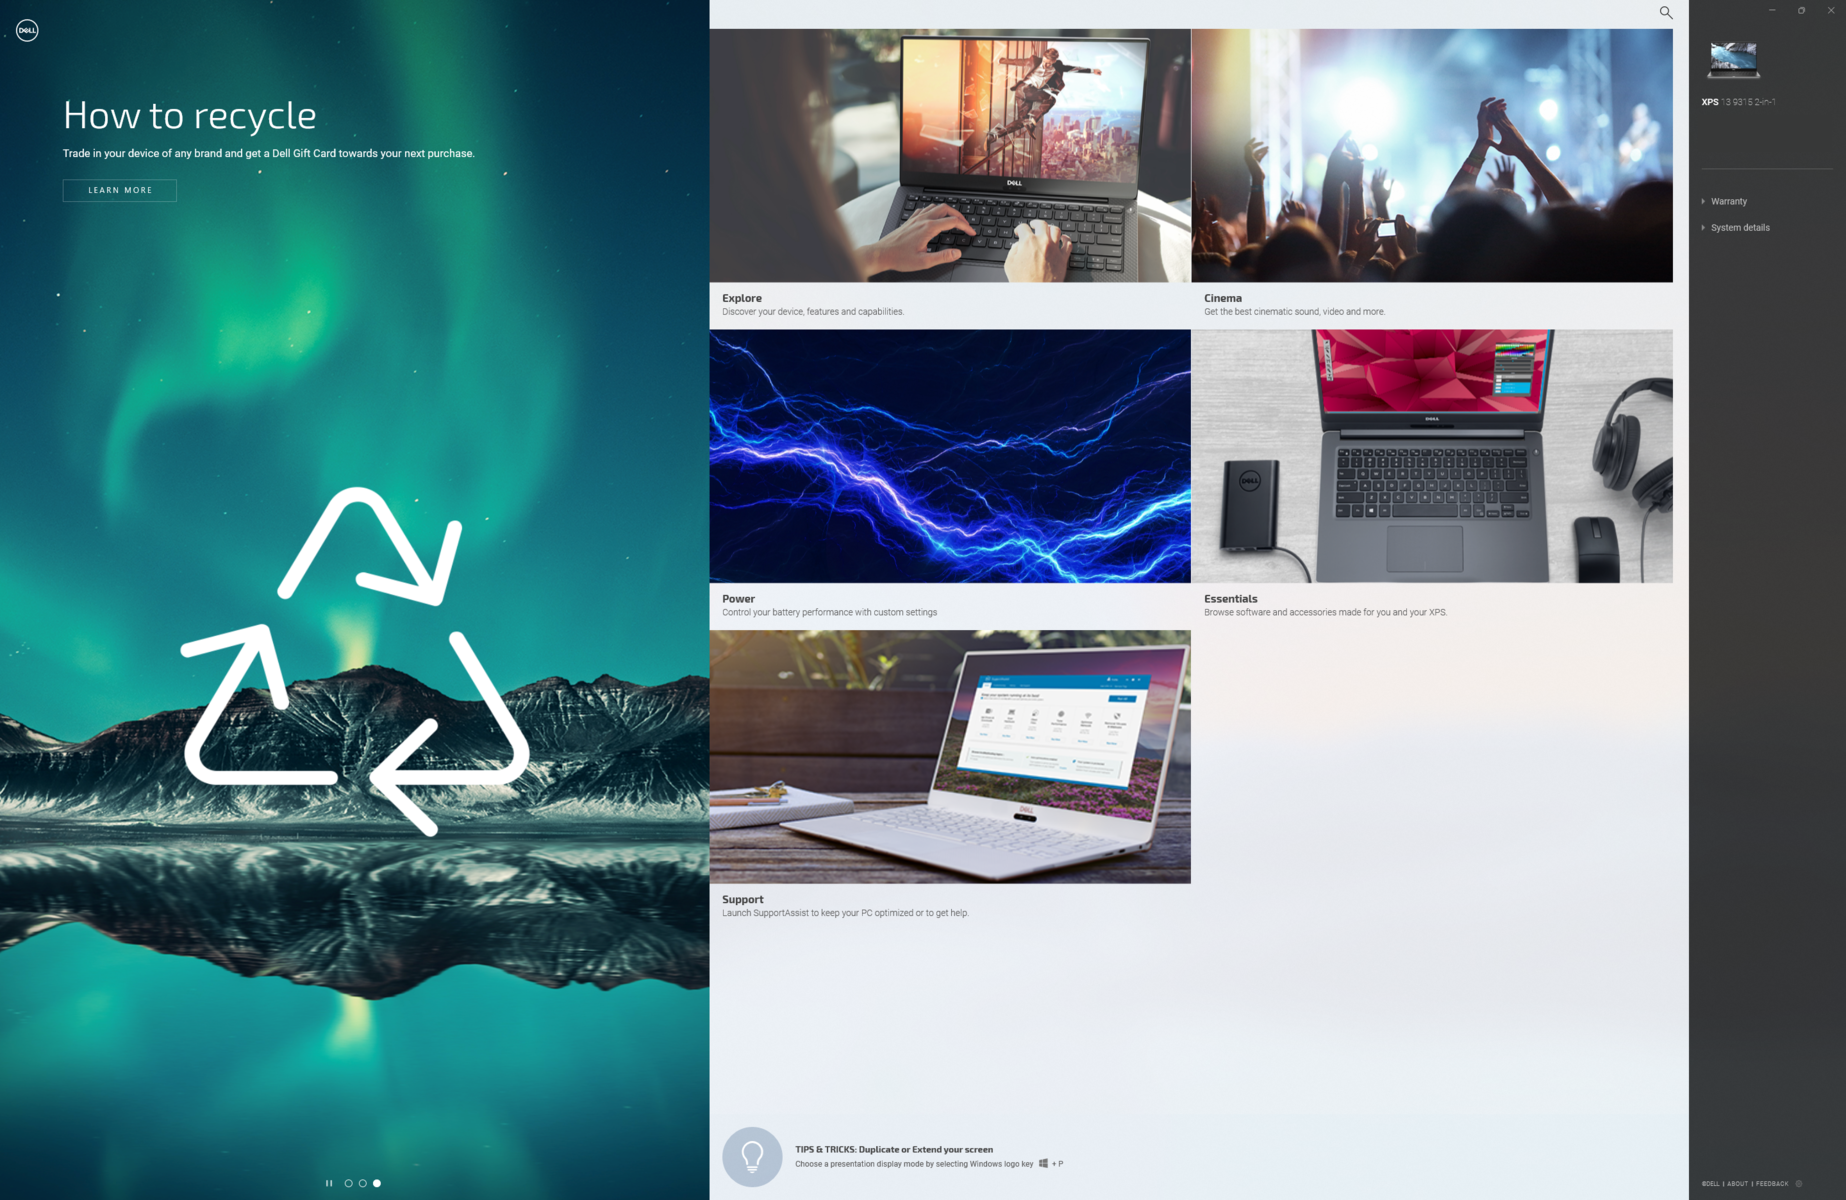
Wir haben unser Testgerät in den Modus "Ultra Performance" und "Beste Leistung" mittels Dell Power Manager, respektive in Windows gesetzt, bevor wir die unten aufgeführten Benchmarks starteten. Nutzer sollten sich mit der My Dell Software vertraut machen, da sie das Ladeverhalten, die Systemleistung, Nachrichten und mehr regelt - wie folgende Screenshots darlegen.
Prozessor
Das XPS 13 9315 2-in-1 beherbergt die gleiche Core i5-1230U CPU wie die Clamshell-Version des XPS 13 9315. Man könnte meinen, dass das Clamshell-Modell etwas schneller arbeite als das 2-in-1-Gerät, doch ist das Gegenteil der Fall. Unsere unten angeführten Benchmark-Resultate zeigen Dells XPS 13 9315 2-in-1 dauerhaft vor dem XPS 13 9315 Clamshell, mit einer um 70 % schnelleren Multi-Thread-Leistung. Die Ergebnisse übertreffen auch die des Core i7-1185G7 im Surface Pro 8.
Die Wahl eines Core i7-1250U dürfte die Leistung lediglich um 5 % erhöhen, was sich beim HP Envy x360 13 bereits gezeigt hat. Für eine deutlich höhere Leistung sollte man das XPS 13 Plus 9320 mit P-Serien-CPU in Betracht ziehen.
Die Langzeit-Leistung ist beim XPS 13 9315 2-in-1 aufgrund des lüfterlosen Designs jedoch begrenzt. Bei der CineBench-R15-Schleife etwa werden die anfänglichen 1.252 Punkte mit der Zeit graduell auf 750 Punkte reduziert, was einem Performance-Verlust von 40 % entspricht. Nichtsdestoweniger ist die Leistung, auch nach Einbezug von Throttling, noch immer um circa 50 % Prozent höher als bei der gleichen CPU im XPS 13 9315 Clamshell.
Cinebench R15 Multi Dauertest
Cinebench R23: Multi Core | Single Core
Cinebench R15: CPU Multi 64Bit | CPU Single 64Bit
Blender: v2.79 BMW27 CPU
7-Zip 18.03: 7z b 4 | 7z b 4 -mmt1
Geekbench 5.5: Multi-Core | Single-Core
HWBOT x265 Benchmark v2.2: 4k Preset
LibreOffice : 20 Documents To PDF
R Benchmark 2.5: Overall mean
| HWBOT x265 Benchmark v2.2 / 4k Preset | |
| Dell XPS 13 Plus 9320 i7-1280P OLED | |
| HP Spectre x360 13.5 14t-ef000 | |
| Dell XPS 13 9315 2-in-1 Core i5-1230U | |
| Microsoft Surface Pro 8, i7-1185G7 | |
* ... kleinere Werte sind besser
AIDA64: FP32 Ray-Trace | FPU Julia | CPU SHA3 | CPU Queen | FPU SinJulia | FPU Mandel | CPU AES | CPU ZLib | FP64 Ray-Trace | CPU PhotoWorxx
| Performance Rating | |
| Dell XPS 13 Plus 9320 i7-1280P OLED | |
| HP Spectre x360 13.5 14t-ef000 | |
| Microsoft Surface Pro 8, i7-1185G7 | |
| Dell XPS 13 9315 2-in-1 Core i5-1230U | |
| Lenovo ThinkBook Plus Gen2 Core i5 | |
| Durchschnittliche Intel Core i5-1230U | |
| AIDA64 / FP32 Ray-Trace | |
| Dell XPS 13 Plus 9320 i7-1280P OLED | |
| HP Spectre x360 13.5 14t-ef000 | |
| Microsoft Surface Pro 8, i7-1185G7 | |
| Dell XPS 13 9315 2-in-1 Core i5-1230U | |
| Lenovo ThinkBook Plus Gen2 Core i5 | |
| Durchschnittliche Intel Core i5-1230U (2344 - 6360, n=3) | |
| AIDA64 / FPU Julia | |
| Dell XPS 13 Plus 9320 i7-1280P OLED | |
| HP Spectre x360 13.5 14t-ef000 | |
| Dell XPS 13 9315 2-in-1 Core i5-1230U | |
| Microsoft Surface Pro 8, i7-1185G7 | |
| Lenovo ThinkBook Plus Gen2 Core i5 | |
| Durchschnittliche Intel Core i5-1230U (11867 - 31714, n=3) | |
| AIDA64 / CPU SHA3 | |
| Dell XPS 13 Plus 9320 i7-1280P OLED | |
| HP Spectre x360 13.5 14t-ef000 | |
| Microsoft Surface Pro 8, i7-1185G7 | |
| Dell XPS 13 9315 2-in-1 Core i5-1230U | |
| Lenovo ThinkBook Plus Gen2 Core i5 | |
| Durchschnittliche Intel Core i5-1230U (772 - 1711, n=3) | |
| AIDA64 / CPU Queen | |
| Dell XPS 13 Plus 9320 i7-1280P OLED | |
| HP Spectre x360 13.5 14t-ef000 | |
| Dell XPS 13 9315 2-in-1 Core i5-1230U | |
| Microsoft Surface Pro 8, i7-1185G7 | |
| Durchschnittliche Intel Core i5-1230U (30824 - 52533, n=3) | |
| Lenovo ThinkBook Plus Gen2 Core i5 | |
| AIDA64 / FPU SinJulia | |
| Dell XPS 13 Plus 9320 i7-1280P OLED | |
| Microsoft Surface Pro 8, i7-1185G7 | |
| HP Spectre x360 13.5 14t-ef000 | |
| Dell XPS 13 9315 2-in-1 Core i5-1230U | |
| Lenovo ThinkBook Plus Gen2 Core i5 | |
| Durchschnittliche Intel Core i5-1230U (2269 - 3947, n=3) | |
| AIDA64 / FPU Mandel | |
| Dell XPS 13 Plus 9320 i7-1280P OLED | |
| HP Spectre x360 13.5 14t-ef000 | |
| Microsoft Surface Pro 8, i7-1185G7 | |
| Dell XPS 13 9315 2-in-1 Core i5-1230U | |
| Lenovo ThinkBook Plus Gen2 Core i5 | |
| Durchschnittliche Intel Core i5-1230U (6379 - 15896, n=3) | |
| AIDA64 / CPU AES | |
| HP Spectre x360 13.5 14t-ef000 | |
| Lenovo ThinkBook Plus Gen2 Core i5 | |
| Dell XPS 13 Plus 9320 i7-1280P OLED | |
| Microsoft Surface Pro 8, i7-1185G7 | |
| Dell XPS 13 9315 2-in-1 Core i5-1230U | |
| Durchschnittliche Intel Core i5-1230U (18011 - 31941, n=3) | |
| AIDA64 / CPU ZLib | |
| Dell XPS 13 Plus 9320 i7-1280P OLED | |
| HP Spectre x360 13.5 14t-ef000 | |
| Dell XPS 13 9315 2-in-1 Core i5-1230U | |
| Durchschnittliche Intel Core i5-1230U (229 - 495, n=3) | |
| Lenovo ThinkBook Plus Gen2 Core i5 | |
| Microsoft Surface Pro 8, i7-1185G7 | |
| AIDA64 / FP64 Ray-Trace | |
| Dell XPS 13 Plus 9320 i7-1280P OLED | |
| HP Spectre x360 13.5 14t-ef000 | |
| Microsoft Surface Pro 8, i7-1185G7 | |
| Dell XPS 13 9315 2-in-1 Core i5-1230U | |
| Lenovo ThinkBook Plus Gen2 Core i5 | |
| Durchschnittliche Intel Core i5-1230U (1328 - 3305, n=3) | |
| AIDA64 / CPU PhotoWorxx | |
| Dell XPS 13 Plus 9320 i7-1280P OLED | |
| HP Spectre x360 13.5 14t-ef000 | |
| Lenovo ThinkBook Plus Gen2 Core i5 | |
| Microsoft Surface Pro 8, i7-1185G7 | |
| Dell XPS 13 9315 2-in-1 Core i5-1230U | |
| Durchschnittliche Intel Core i5-1230U (17516 - 37042, n=3) | |
System Performance
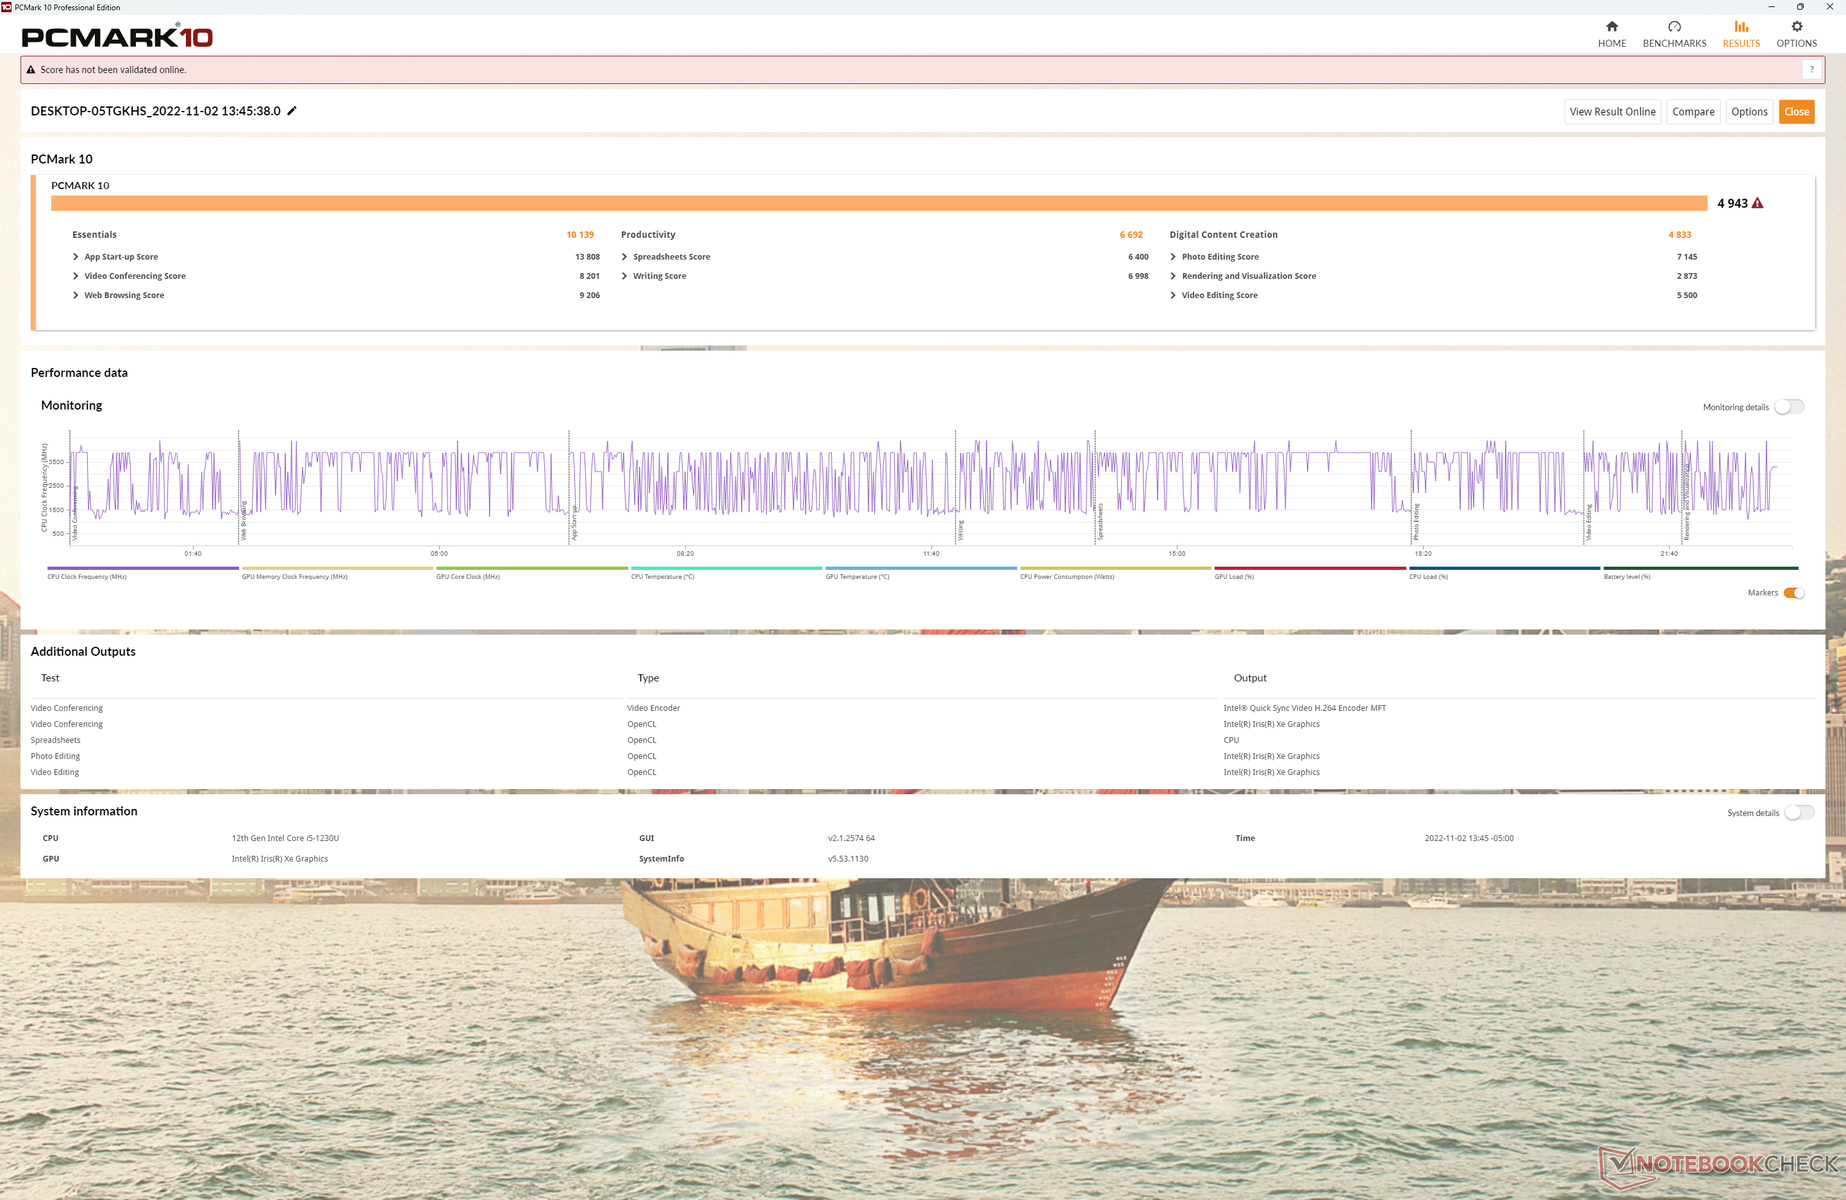
Die PCMark-10-Ergebnisse sind mit denen des Surface Pro 8 vergleichbar, mit Ausnahme im Digital Content Creation Subtest, in welchem vorwiegend die GPU-Performance zählt. Das deckt sich mit den restlichen, weiter unten vorzufinden GPU-Testresultaten, bei denen das XPS 13 9315 2-in-1 eine geringere Leistung als für die Kategorie üblich aufweist.
CrossMark: Overall | Productivity | Creativity | Responsiveness
| PCMark 10 / Score | |
| Dell XPS 13 Plus 9320 i7-1280P OLED | |
| HP Spectre x360 13.5 14t-ef000 | |
| Microsoft Surface Pro 8, i7-1185G7 | |
| Dell XPS 13 9315 2-in-1 Core i5-1230U | |
| Durchschnittliche Intel Core i5-1230U, Intel Iris Xe Graphics G7 80EUs (4001 - 4943, n=3) | |
| Lenovo ThinkBook Plus Gen2 Core i5 | |
| PCMark 10 / Essentials | |
| HP Spectre x360 13.5 14t-ef000 | |
| Dell XPS 13 Plus 9320 i7-1280P OLED | |
| Lenovo ThinkBook Plus Gen2 Core i5 | |
| Dell XPS 13 9315 2-in-1 Core i5-1230U | |
| Microsoft Surface Pro 8, i7-1185G7 | |
| Durchschnittliche Intel Core i5-1230U, Intel Iris Xe Graphics G7 80EUs (8348 - 10139, n=3) | |
| PCMark 10 / Productivity | |
| HP Spectre x360 13.5 14t-ef000 | |
| Dell XPS 13 Plus 9320 i7-1280P OLED | |
| Dell XPS 13 9315 2-in-1 Core i5-1230U | |
| Microsoft Surface Pro 8, i7-1185G7 | |
| Durchschnittliche Intel Core i5-1230U, Intel Iris Xe Graphics G7 80EUs (5735 - 6692, n=3) | |
| Lenovo ThinkBook Plus Gen2 Core i5 | |
| PCMark 10 / Digital Content Creation | |
| Dell XPS 13 Plus 9320 i7-1280P OLED | |
| Microsoft Surface Pro 8, i7-1185G7 | |
| HP Spectre x360 13.5 14t-ef000 | |
| Dell XPS 13 9315 2-in-1 Core i5-1230U | |
| Durchschnittliche Intel Core i5-1230U, Intel Iris Xe Graphics G7 80EUs (3632 - 4833, n=3) | |
| Lenovo ThinkBook Plus Gen2 Core i5 | |
| CrossMark / Overall | |
| Dell XPS 13 Plus 9320 i7-1280P OLED | |
| HP Spectre x360 13.5 14t-ef000 | |
| Apple MacBook Air M2 Entry | |
| Microsoft Surface Pro 8, i7-1185G7 | |
| Dell XPS 13 9315 2-in-1 Core i5-1230U | |
| Durchschnittliche Intel Core i5-1230U, Intel Iris Xe Graphics G7 80EUs (1117 - 1383, n=3) | |
| CrossMark / Productivity | |
| Dell XPS 13 Plus 9320 i7-1280P OLED | |
| HP Spectre x360 13.5 14t-ef000 | |
| Microsoft Surface Pro 8, i7-1185G7 | |
| Apple MacBook Air M2 Entry | |
| Dell XPS 13 9315 2-in-1 Core i5-1230U | |
| Durchschnittliche Intel Core i5-1230U, Intel Iris Xe Graphics G7 80EUs (1187 - 1356, n=3) | |
| CrossMark / Creativity | |
| Dell XPS 13 Plus 9320 i7-1280P OLED | |
| Apple MacBook Air M2 Entry | |
| HP Spectre x360 13.5 14t-ef000 | |
| Microsoft Surface Pro 8, i7-1185G7 | |
| Dell XPS 13 9315 2-in-1 Core i5-1230U | |
| Durchschnittliche Intel Core i5-1230U, Intel Iris Xe Graphics G7 80EUs (1095 - 1469, n=3) | |
| CrossMark / Responsiveness | |
| Dell XPS 13 Plus 9320 i7-1280P OLED | |
| HP Spectre x360 13.5 14t-ef000 | |
| Dell XPS 13 9315 2-in-1 Core i5-1230U | |
| Durchschnittliche Intel Core i5-1230U, Intel Iris Xe Graphics G7 80EUs (990 - 1224, n=3) | |
| Microsoft Surface Pro 8, i7-1185G7 | |
| Apple MacBook Air M2 Entry | |
| PCMark 10 Score | 4943 Punkte | |
Hilfe | ||
| AIDA64 / Memory Copy | |
| Dell XPS 13 Plus 9320 i7-1280P OLED | |
| HP Spectre x360 13.5 14t-ef000 | |
| Dell XPS 13 9315 2-in-1 Core i5-1230U | |
| Microsoft Surface Pro 8, i7-1185G7 | |
| Lenovo ThinkBook Plus Gen2 Core i5 | |
| Durchschnittliche Intel Core i5-1230U (32539 - 60944, n=3) | |
| AIDA64 / Memory Read | |
| Dell XPS 13 Plus 9320 i7-1280P OLED | |
| Lenovo ThinkBook Plus Gen2 Core i5 | |
| HP Spectre x360 13.5 14t-ef000 | |
| Microsoft Surface Pro 8, i7-1185G7 | |
| Dell XPS 13 9315 2-in-1 Core i5-1230U | |
| Durchschnittliche Intel Core i5-1230U (31342 - 60435, n=3) | |
| AIDA64 / Memory Write | |
| Dell XPS 13 9315 2-in-1 Core i5-1230U | |
| Lenovo ThinkBook Plus Gen2 Core i5 | |
| HP Spectre x360 13.5 14t-ef000 | |
| Dell XPS 13 Plus 9320 i7-1280P OLED | |
| Microsoft Surface Pro 8, i7-1185G7 | |
| Durchschnittliche Intel Core i5-1230U (33224 - 65665, n=3) | |
| AIDA64 / Memory Latency | |
| Dell XPS 13 9315 2-in-1 Core i5-1230U | |
| Dell XPS 13 Plus 9320 i7-1280P OLED | |
| Microsoft Surface Pro 8, i7-1185G7 | |
| HP Spectre x360 13.5 14t-ef000 | |
| Lenovo ThinkBook Plus Gen2 Core i5 | |
| Durchschnittliche Intel Core i5-1230U (104.3 - 105.3, n=3) | |
* ... kleinere Werte sind besser
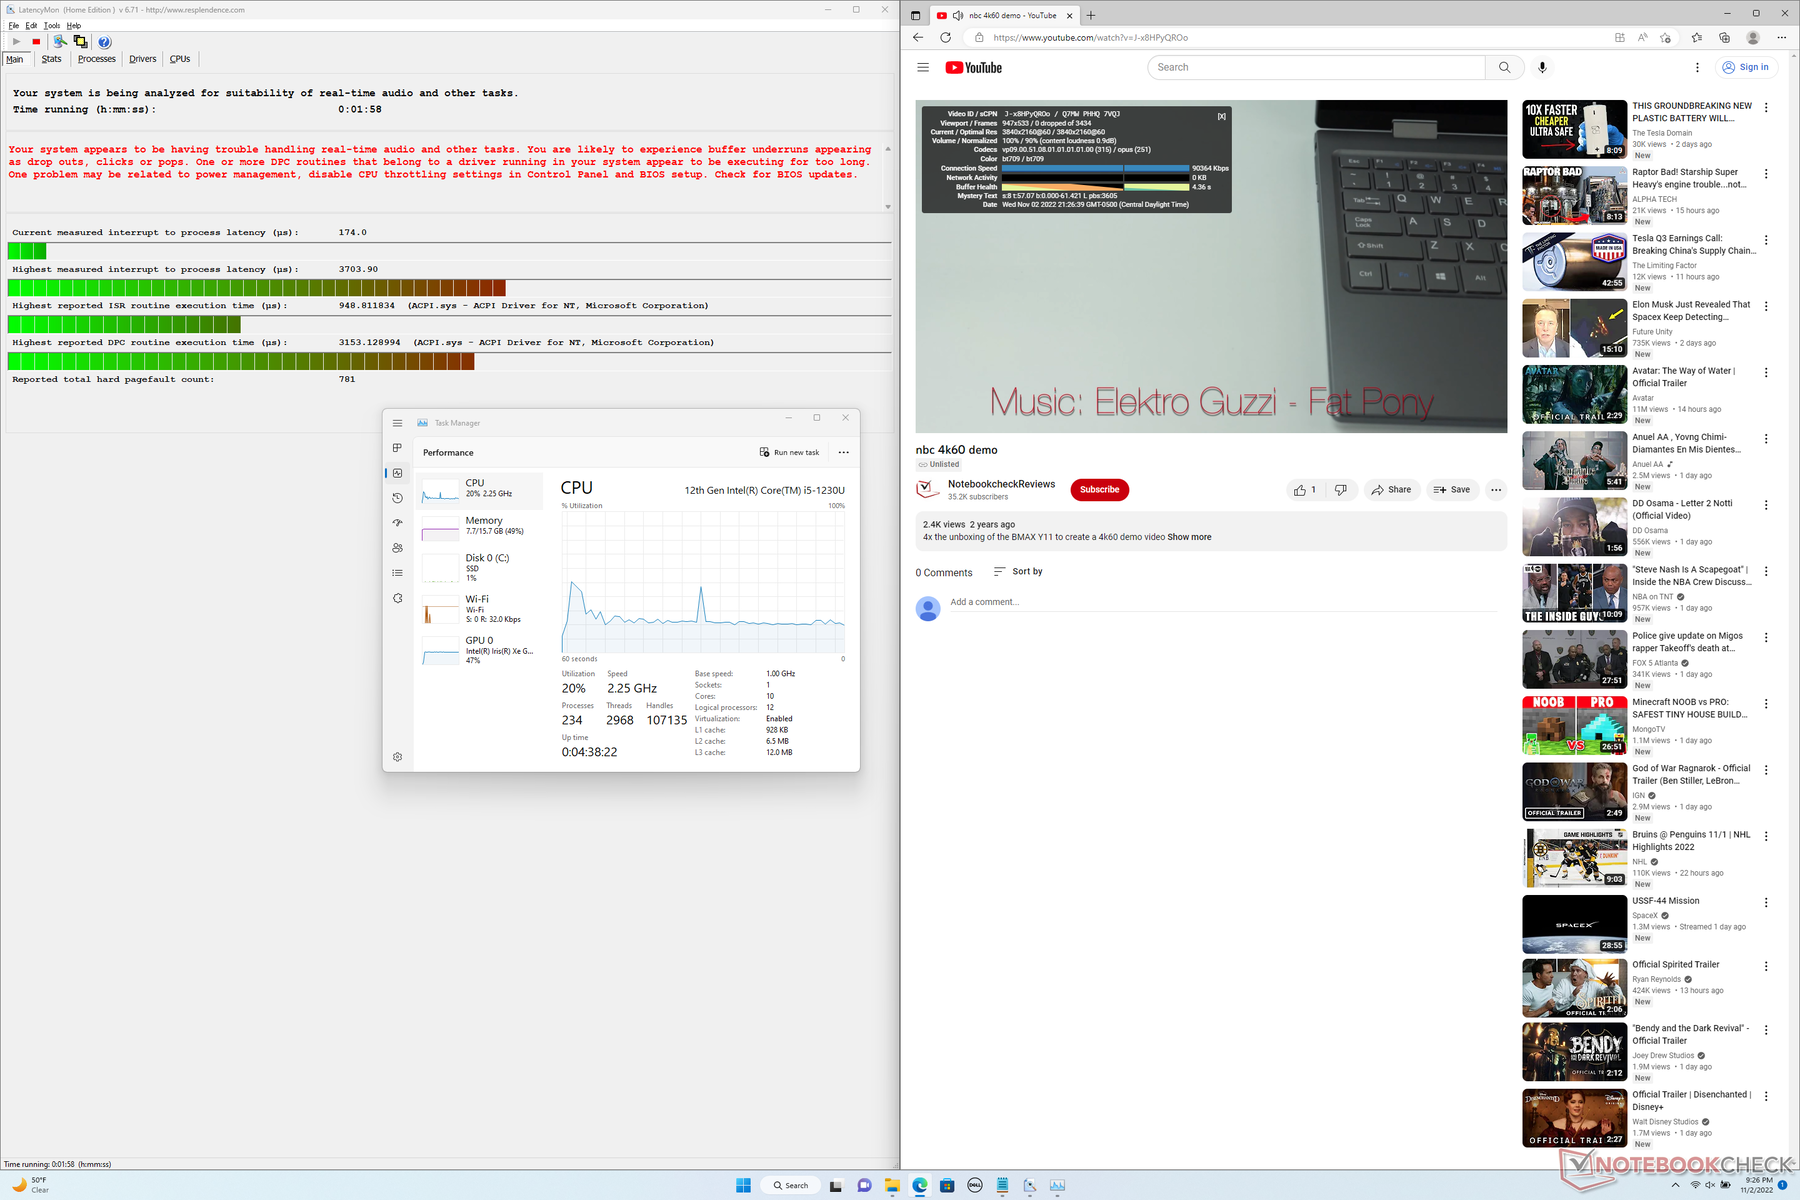
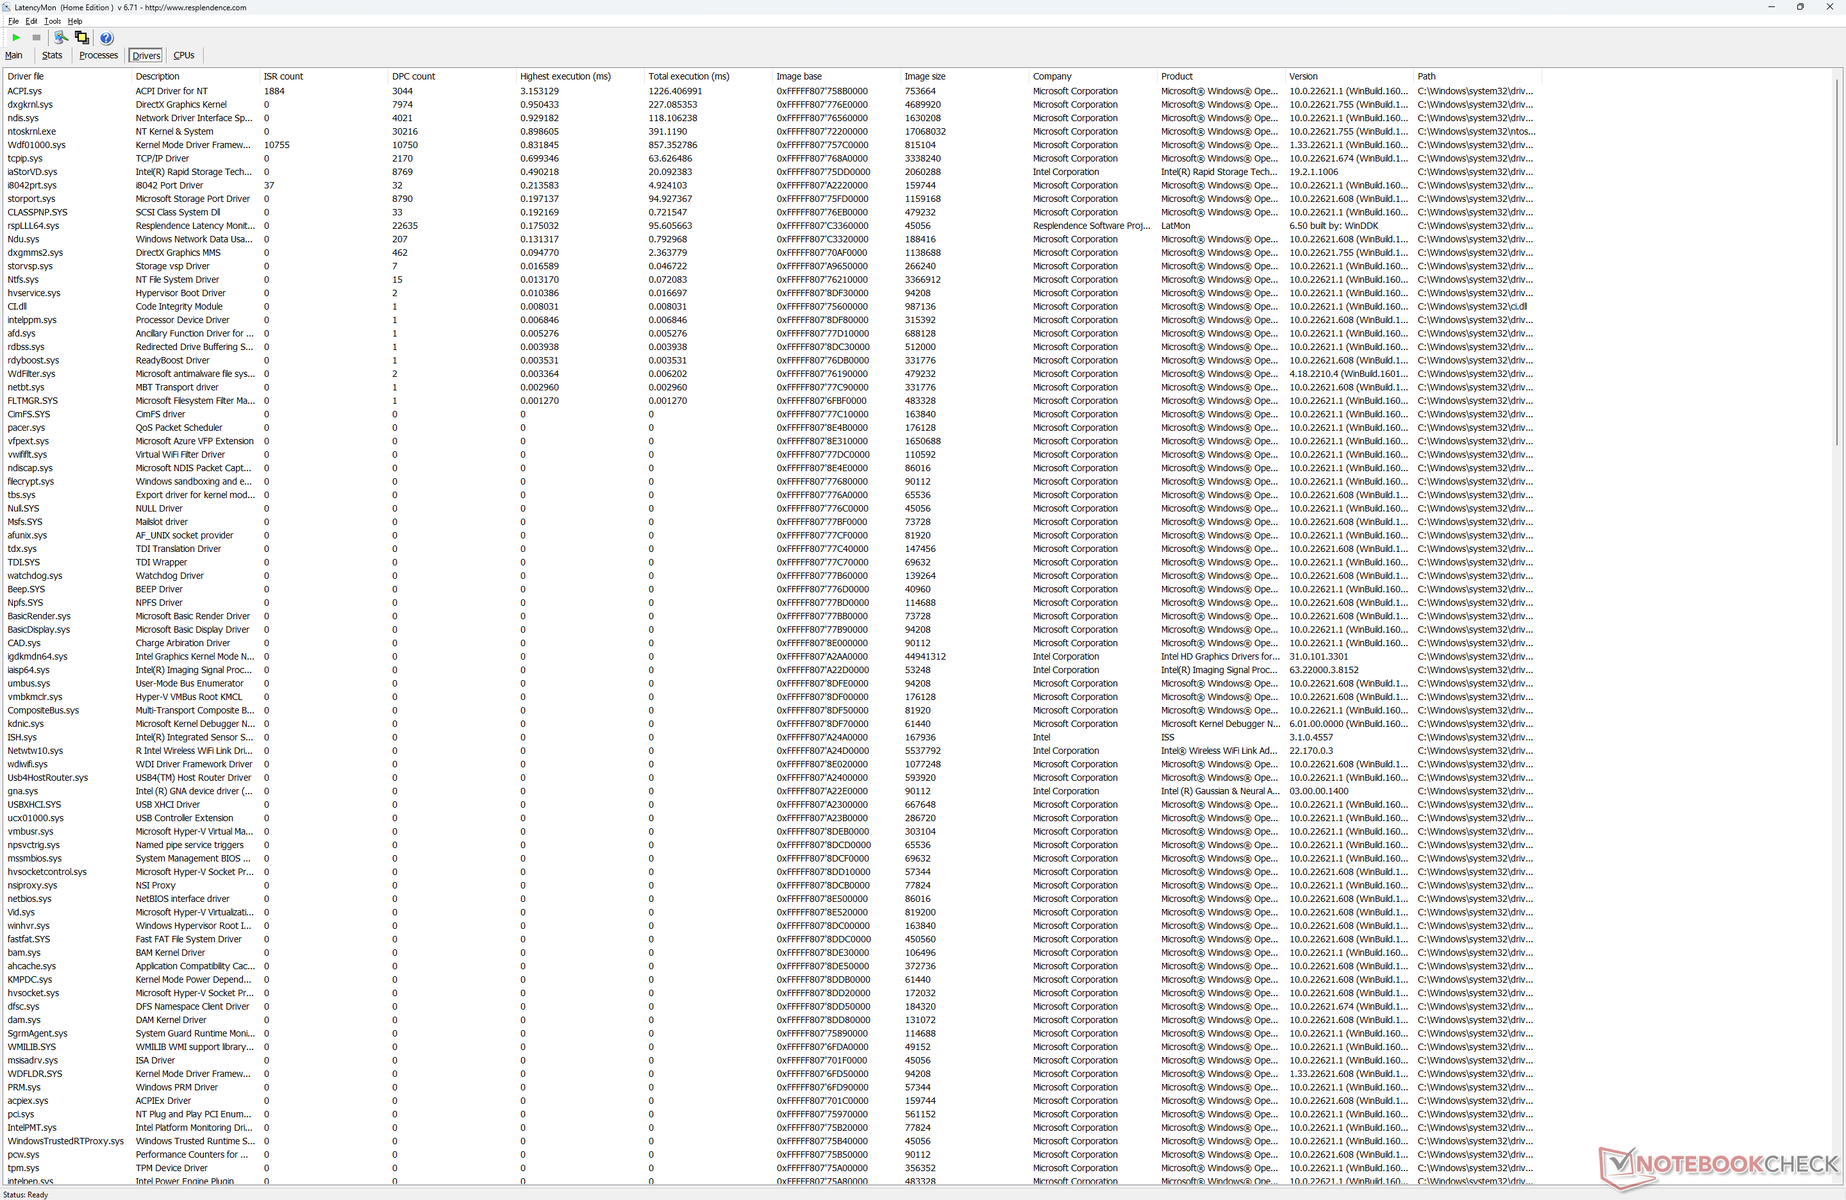
DPC-Latenzen
LatencyMon meldet DPC-Probleme beim Öffnen mehrerer Tabs unserer Website. Die 4K-Videowiedergabe bei 60 fps ist hingegen perfekt mit keinen ausgelassenen Bildern.
| DPC Latencies / LatencyMon - interrupt to process latency (max), Web, Youtube, Prime95 | |
| Dell XPS 13 9315 2-in-1 Core i5-1230U | |
| Lenovo ThinkBook Plus Gen2 Core i5 | |
| HP Spectre x360 13.5 14t-ef000 | |
| Microsoft Surface Pro 8, i7-1185G7 | |
| Dell XPS 13 Plus 9320 i7-1280P OLED | |
* ... kleinere Werte sind besser
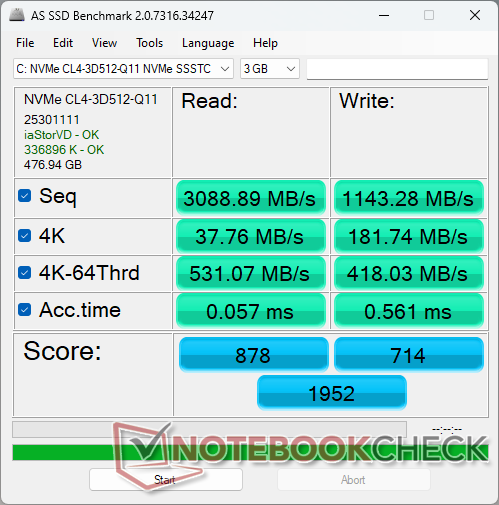
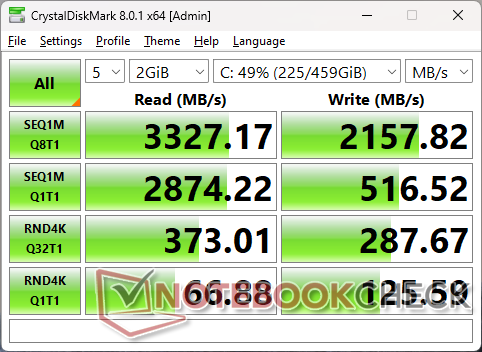
Massenspeicher — PCIe-4.0-SSD mit PCIe-3.0-Speeds
Dell bietet SSD-Optionen im PCIe-4x4-Standard mit 256 GB, 512 GB und 1 TB Speicherplatz. Leider befindet sich die Geschwindigkeit eher auf PCIe-3x4-Niveau vieler anderer Geräte. Benchmarks wie CrystalDiskMark und DiskSpd zeigen maximale Lese- und Schreibraten von "nur" 3.300 MB/s bzw. 2.200 MB/s, verglichen mit 7.000 MB/s oder mehr bei der Samsung 980 Pro PCIe-4x4-Serie. Dennoch ist der Bereich um 3.000 MB/s mehr als ausreichend, wenn man den Formfaktor und die U-Serien-CPU bedenkt.

* ... kleinere Werte sind besser
Dauerleistung Lesen: DiskSpd Read Loop, Queue Depth 8
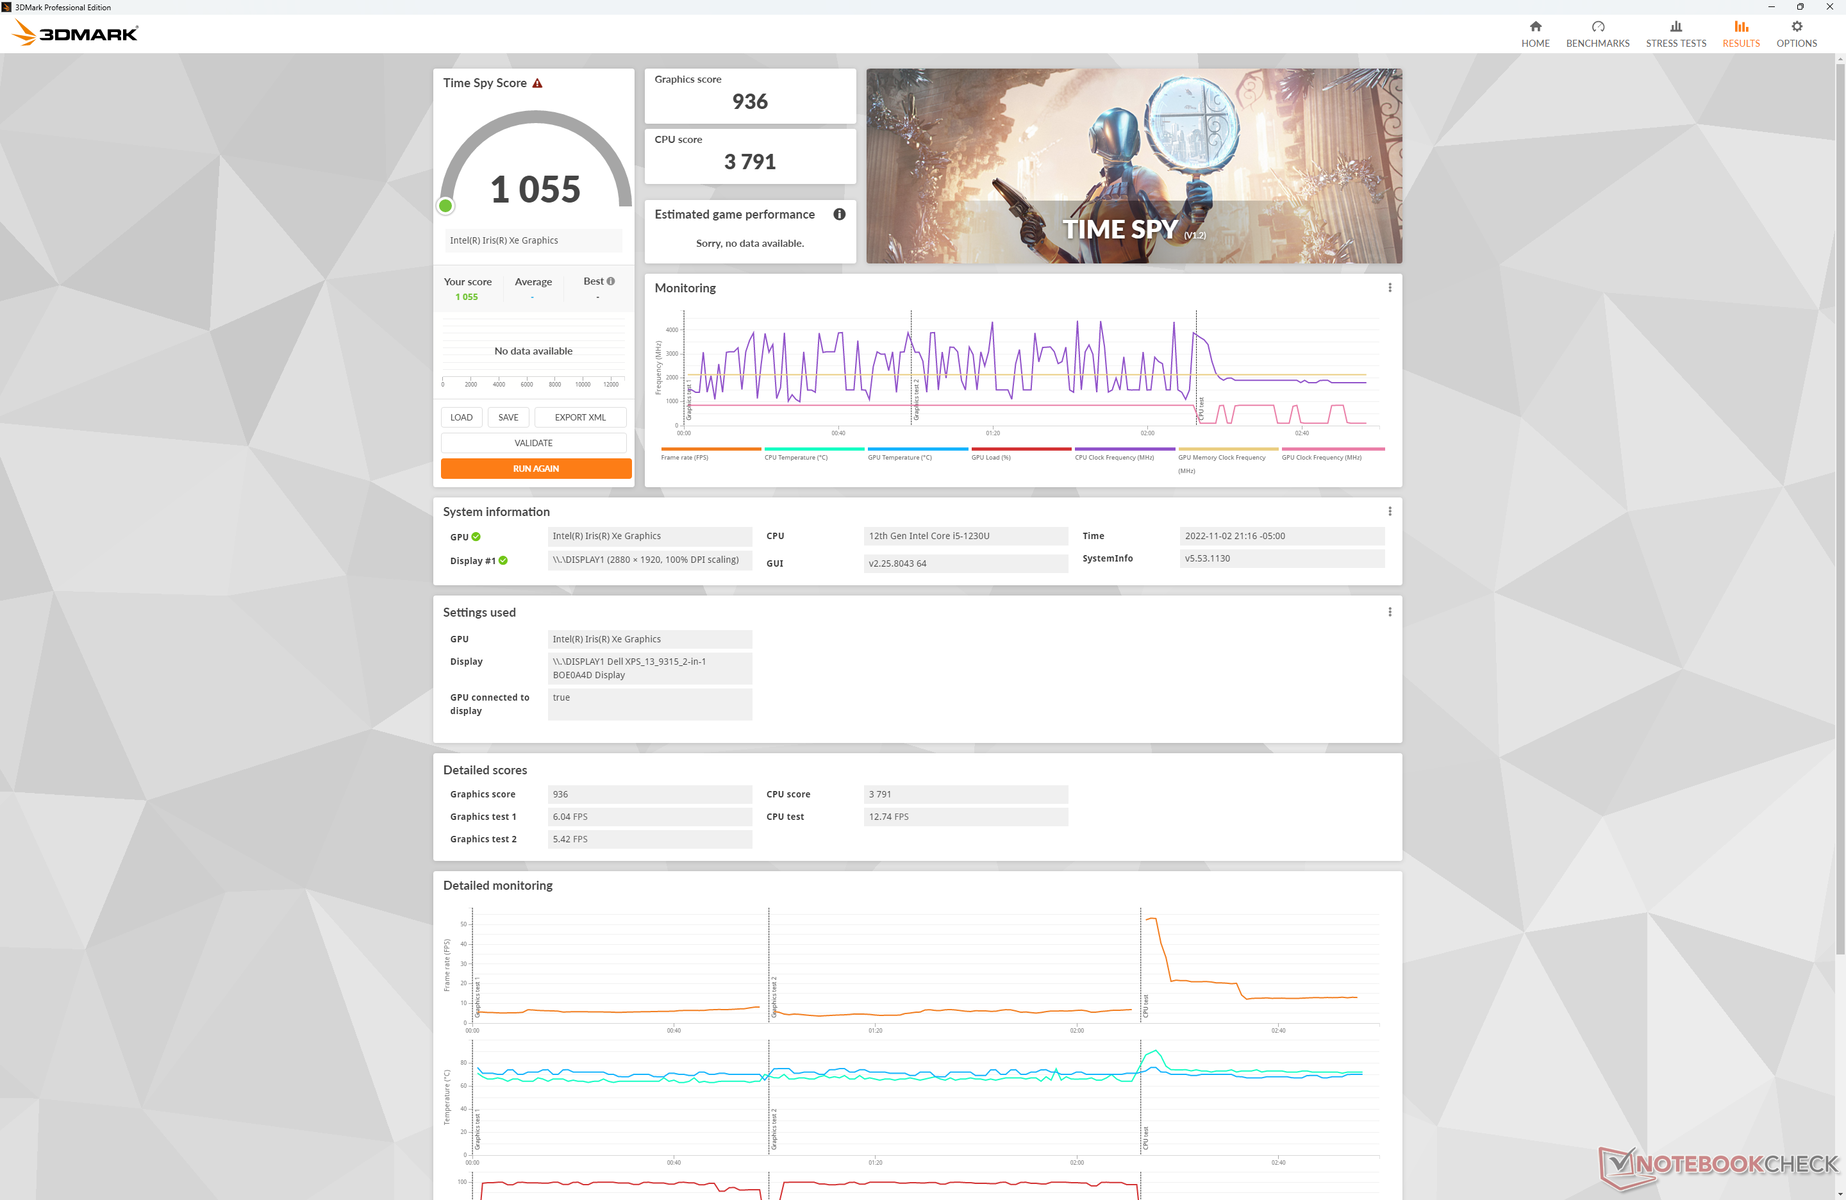
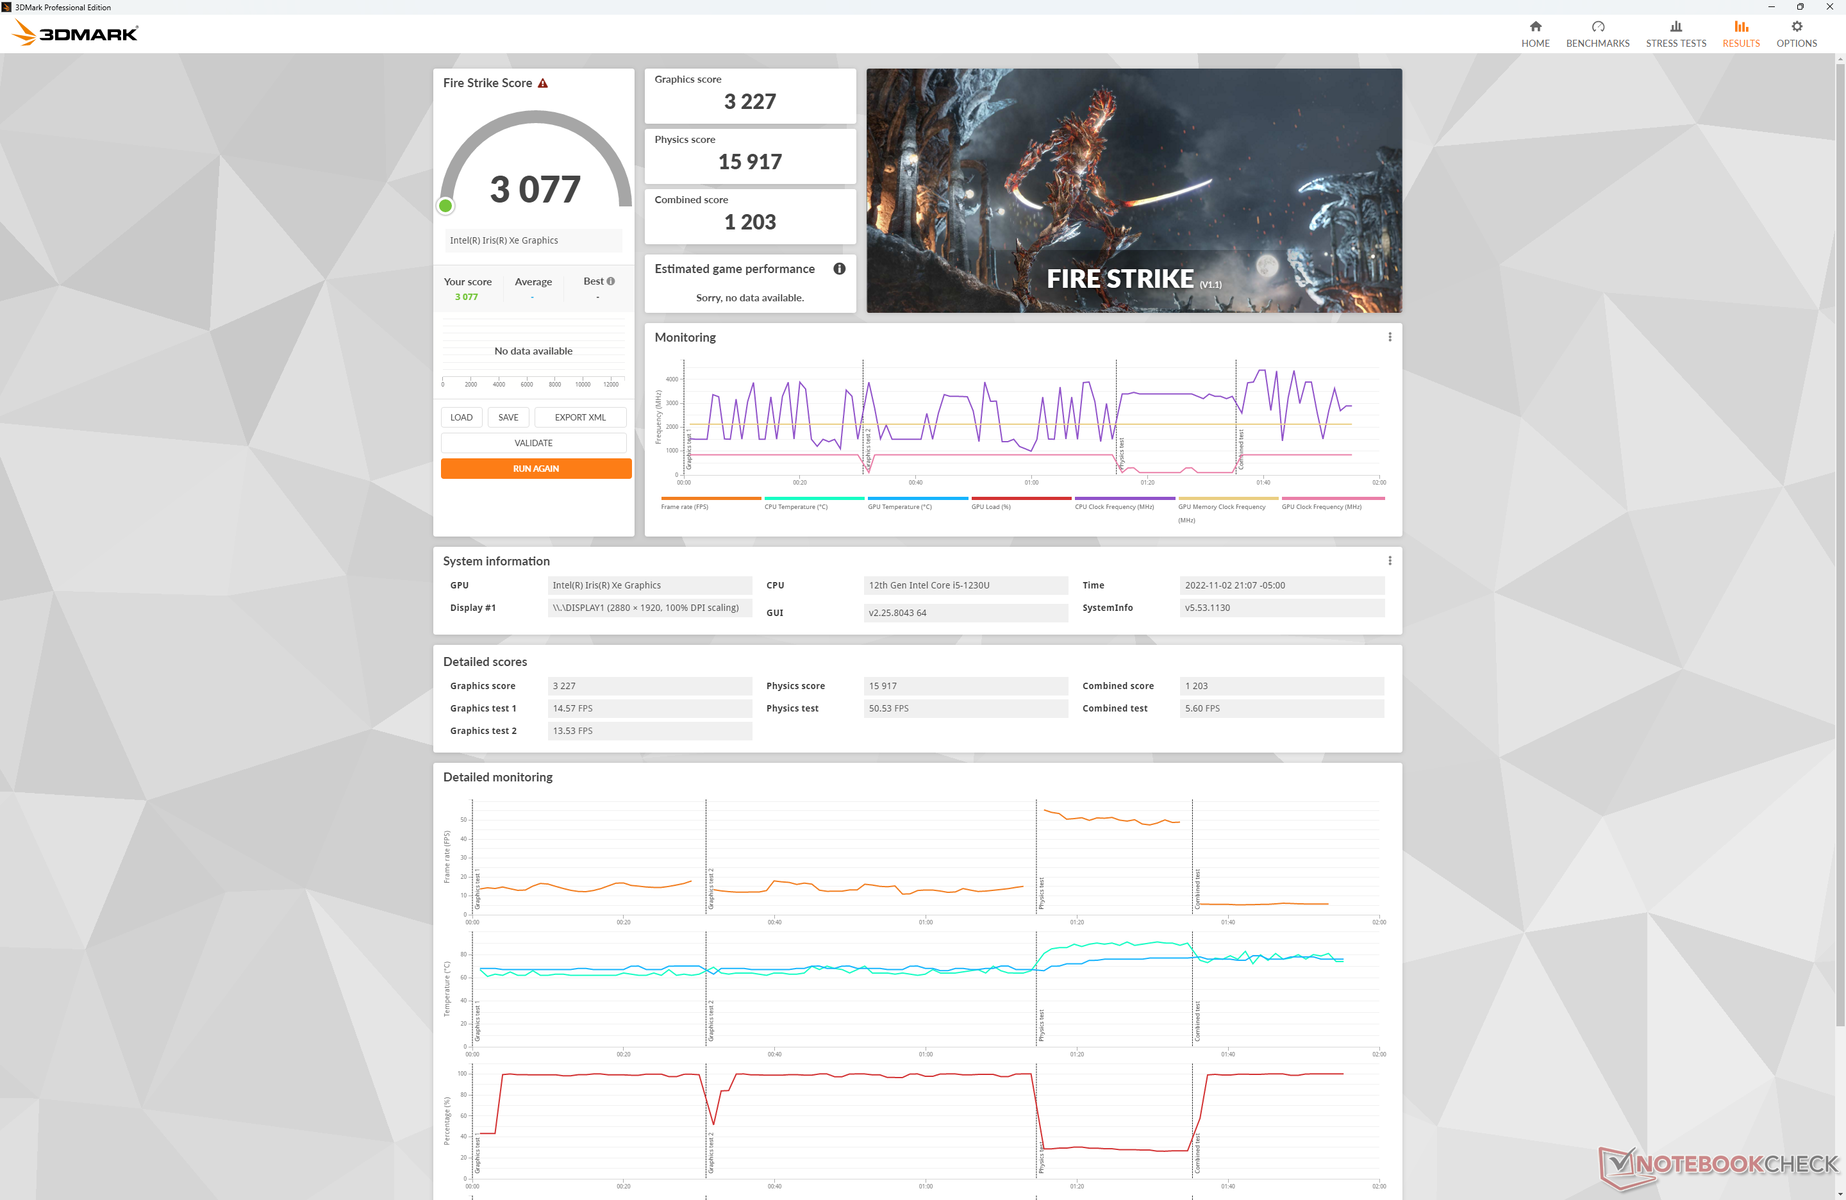
Grafikkarte
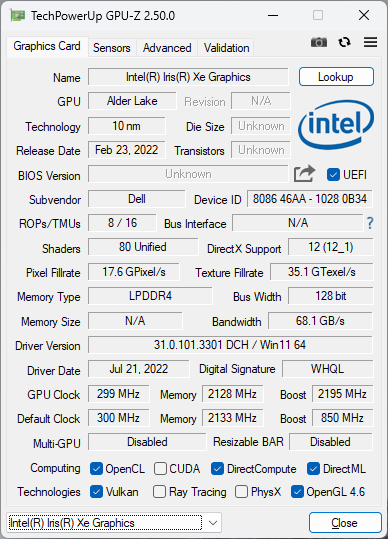
Während sich die CPU-Leistung besser als erwartet zeigt, tut es ihr die GPU nicht gleich. Die 3DMark-Ergebnisse fallen um circa 10 bis 20 Prozent niedriger aus als die durchschnittlichen Ergebnisse einer Iris Xe 80 EUs - vergleichbar mit dem ThinkBook Plus Gen 2 aus dem letzten Jahr. Gaming ist nur bei niedrigsten Detailstufen möglich.
Wenn man sich für ein Modell mit Core i7-1250U samt integrierter Iris Xe 96 EUs entscheidet, kann man einen Leistungsgewinn von circa 36 Prozent erwarten, wie wir etwa beim HP Envy x360 13 beobachteten. Es existieren Modelle mit nur 8 statt 16 GB RAM, was wir nicht empfehlen, da die Grafikleistung dadurch noch mehr abfallen würde.
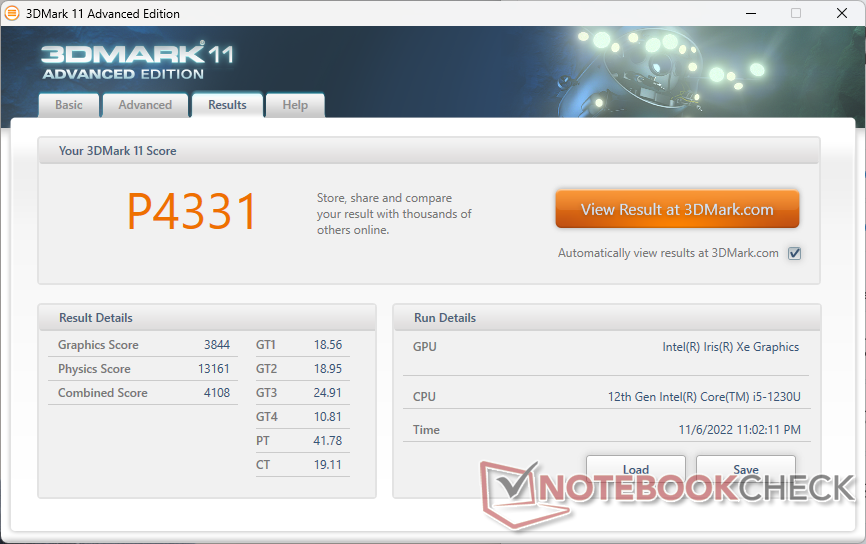

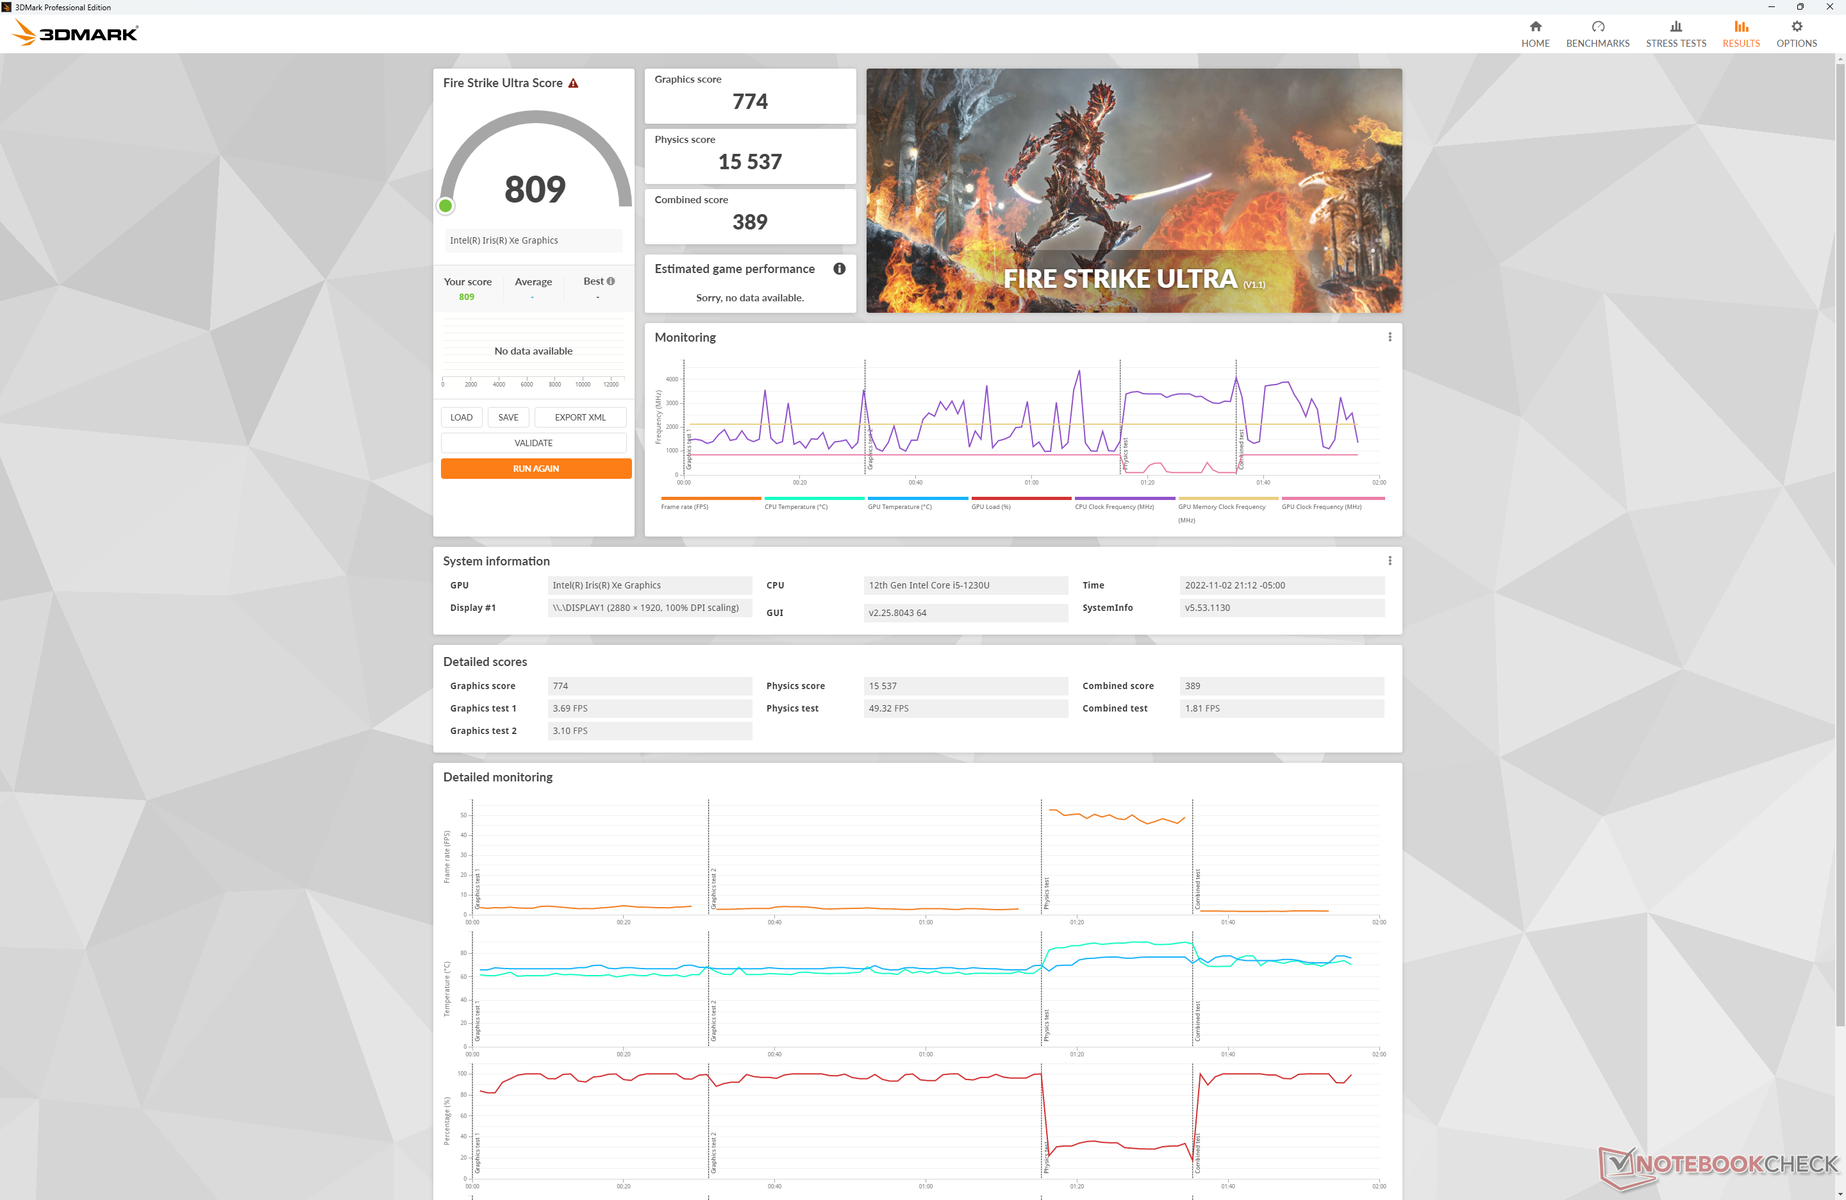
| 3DMark 11 Performance | 4331 Punkte | |
| 3DMark Cloud Gate Standard Score | 15910 Punkte | |
| 3DMark Fire Strike Score | 3077 Punkte | |
| 3DMark Time Spy Score | 1055 Punkte | |
Hilfe | ||
* ... kleinere Werte sind besser
| Final Fantasy XV Benchmark - 1280x720 Lite Quality | |
| Microsoft Surface Pro 8, i7-1185G7 | |
| Dell XPS 13 Plus 9320 i7-1280P OLED | |
| HP Spectre x360 13.5 14t-ef000 | |
| Durchschnittliche Intel Iris Xe Graphics G7 80EUs (8.32 - 45.6, n=107) | |
| Dell XPS 13 9315 2-in-1 Core i5-1230U | |
Die Bildraten bleiben bei Witcher 3 recht stabil, was von geringen Hintergrundprozessen rührt. Nur ein einziges Mal kommt es zu einem Einbruch auf 36 fps, um kurz darauf wieder das Normal zu erreichen. Glücklicherweise handelte es sich dabei eher um einen Einzelfall als um ein wiederkehrendes Muster.
Witcher 3 FPS-Diagramm
| min. | mittel | hoch | max. | |
|---|---|---|---|---|
| GTA V (2015) | 60.9 | 38.4 | 11.7 | 6.06 |
| The Witcher 3 (2015) | 57.7 | 38.9 | 19.9 | 8.5 |
| Dota 2 Reborn (2015) | 101.2 | 75.8 | 37.6 | 34.2 |
| Final Fantasy XV Benchmark (2018) | 27 | |||
| X-Plane 11.11 (2018) | 31.2 | 25.1 | 22 |
Emissionen — Passiv gekühltes Windows-Tablet von Dell
Geräuschemissionen
Im Gegensatz zum Surface Pro 8 besitzt das XPS 13 9315 2-in-1 keinen Lüfter, auch nicht mit Core-i7-CPU. Daher existiert keine Geräuschkulisse, auch nicht durch elektronische Störgeräusche.
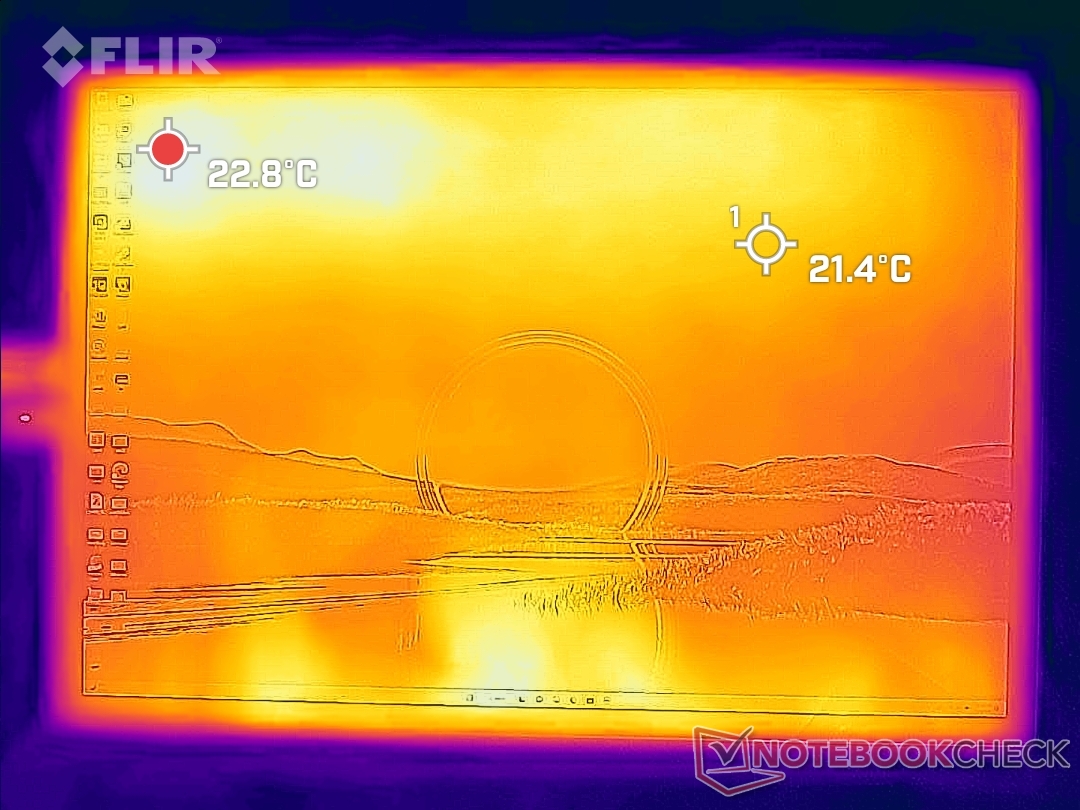
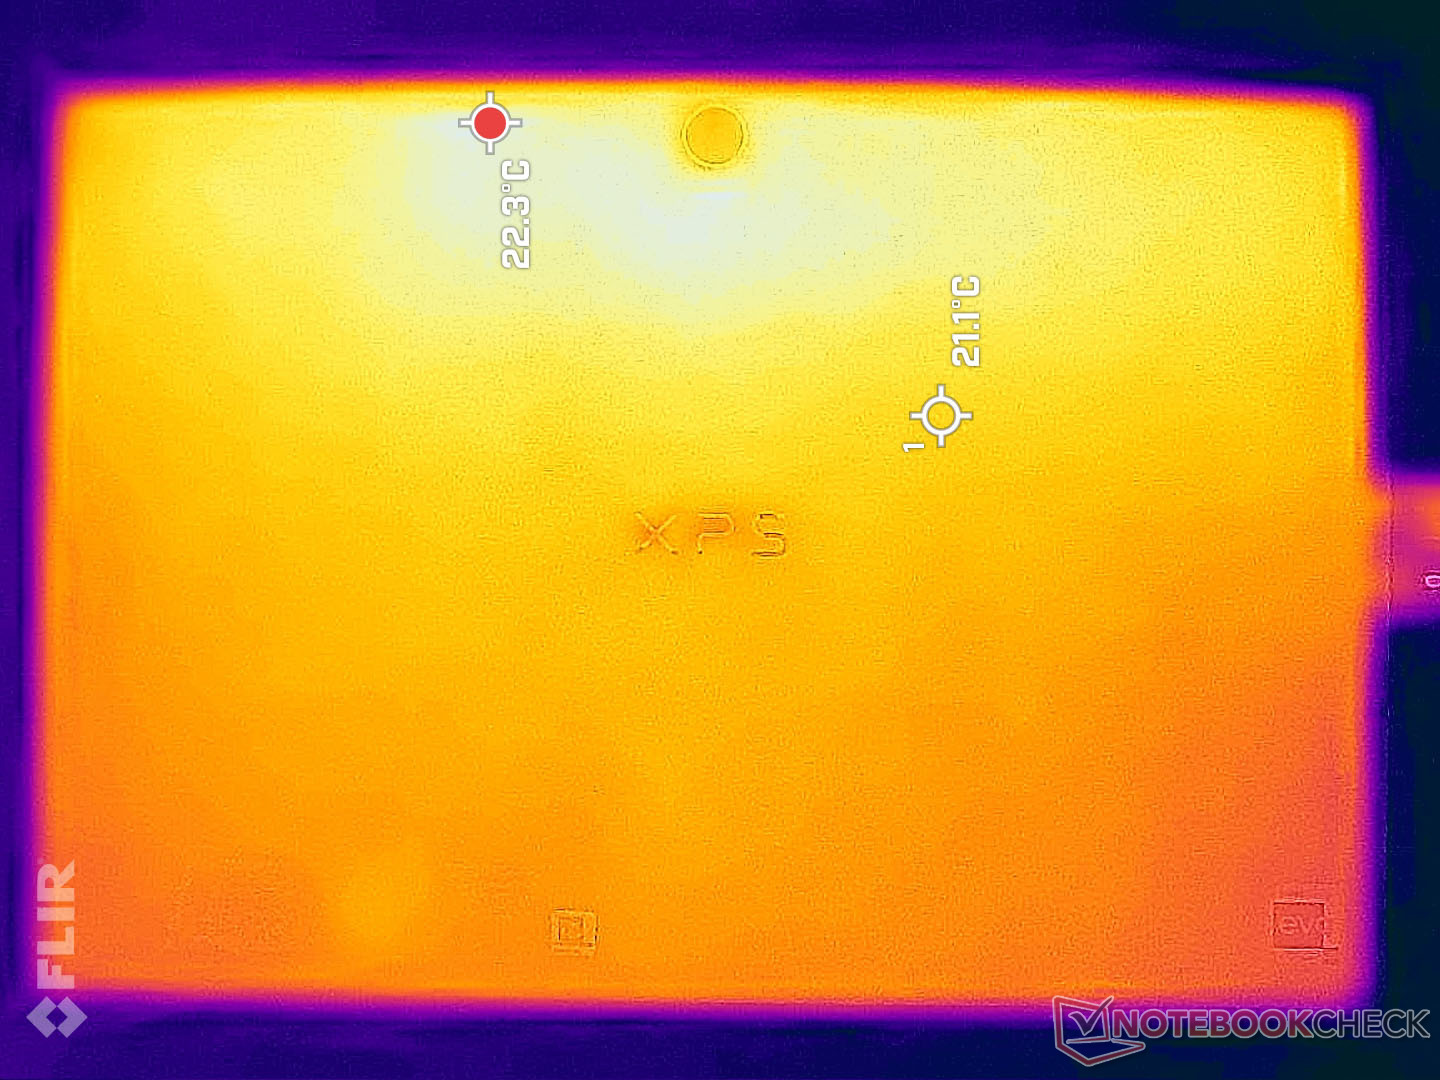
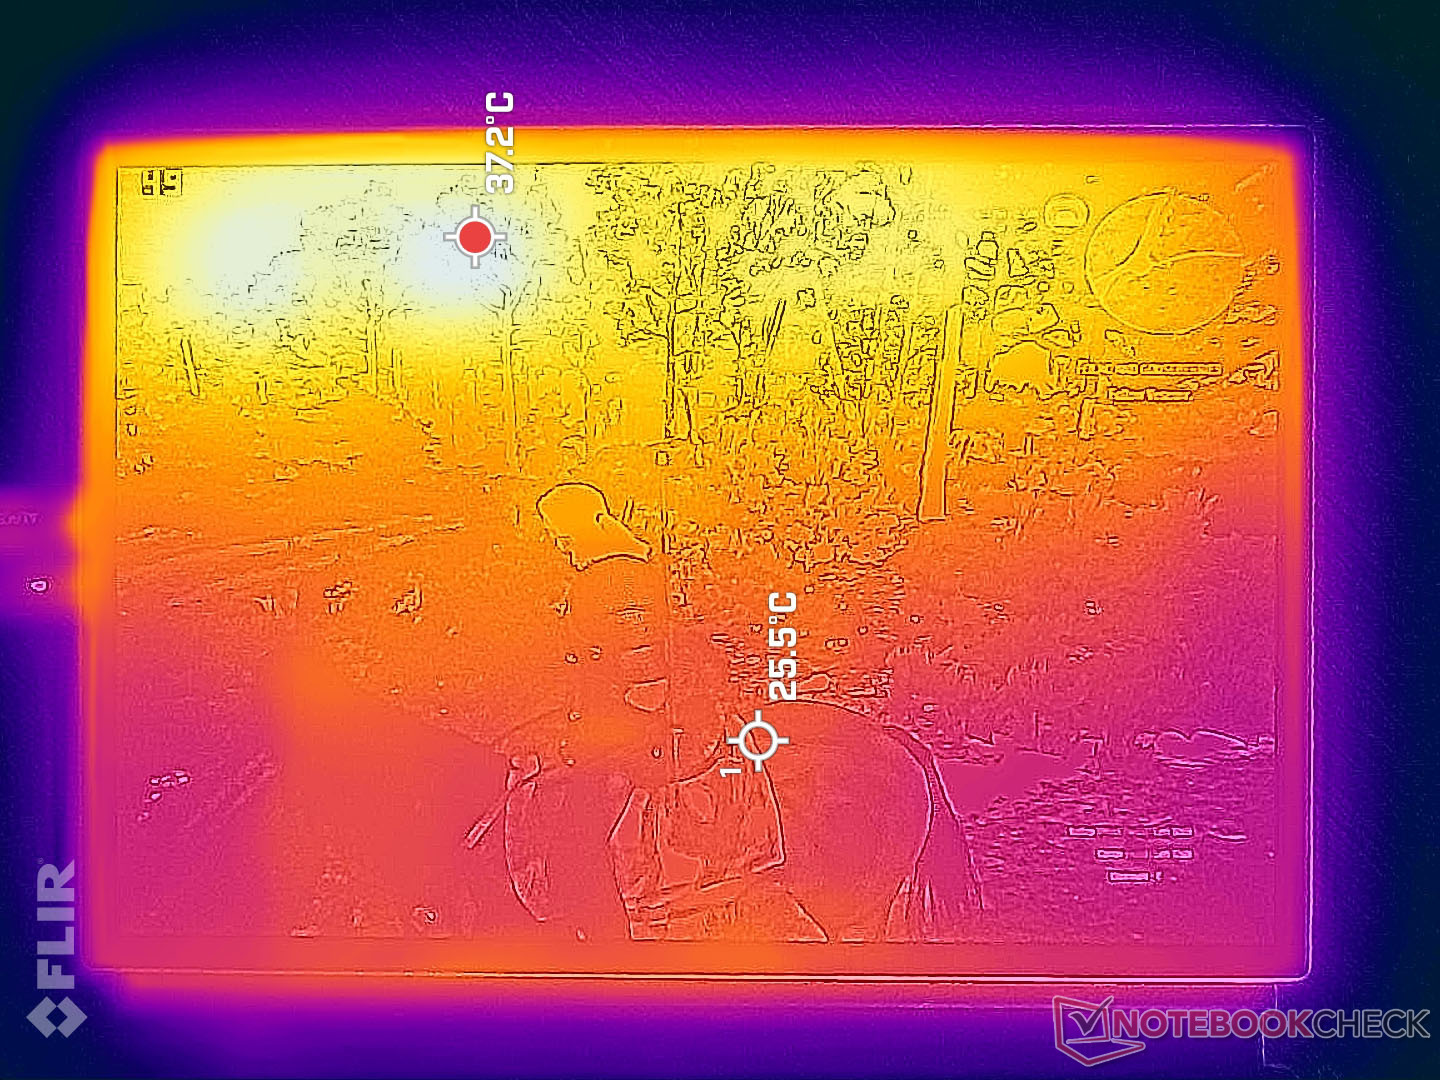
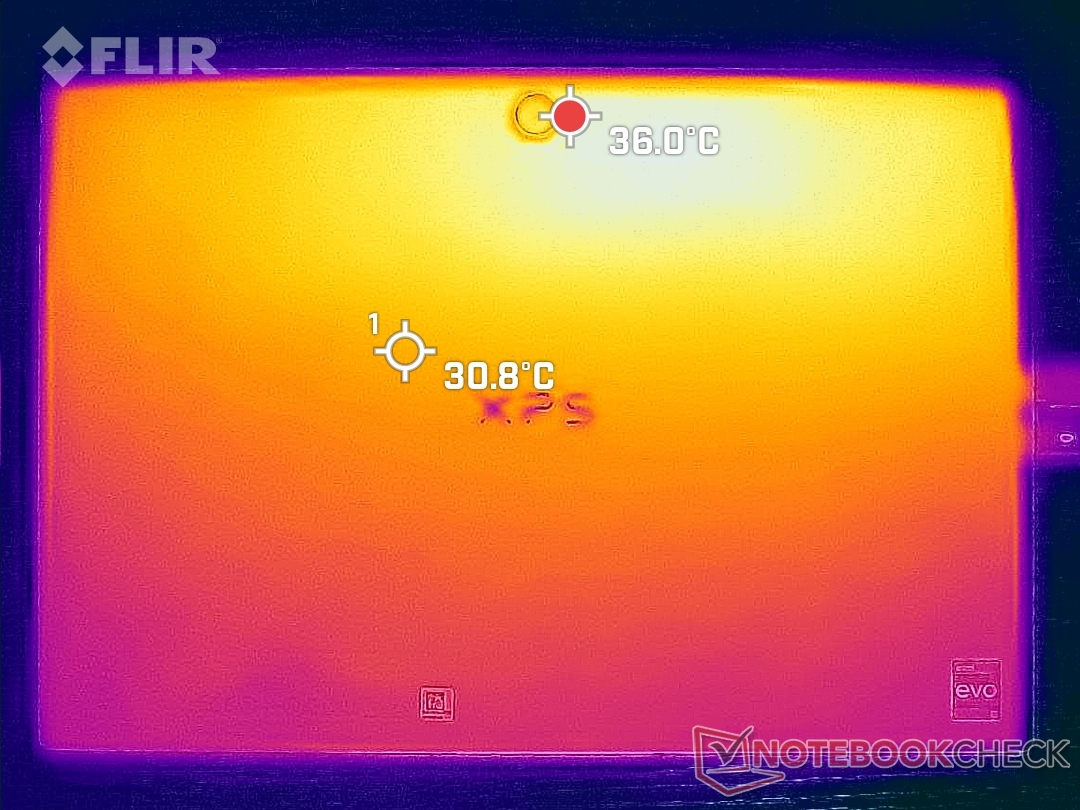
Temperatur
Die Oberflächen werden generell bei der oberen Gerätehälfte wärmer, die untere Hälfte bleibt merkbar kühler. Maximal messen wir 42 °C an der Rückseite sowie 39 °C an der Vorderseite, während die meisten Bereiche um die 30 °C kühl bleiben. In keiner Position, in der man das Gerät hält, wird es unangenehm warm. Die Wärmeentwicklungen des Surface Pro 8 werden deutlich stärker mit Temperaturen von 43 bis 48 °C der gesamten Vorder- und Rückseite.
(±) Die maximale Temperatur auf der Oberseite ist 41.8 °C. Im Vergleich liegt der Klassendurchschnitt bei 35.4 °C (von 19.6 bis 60 °C für die Klasse Convertible).
(+) Auf der Unterseite messen wir eine maximalen Wert von 38.2 °C (im Vergleich zum Durchschnitt von 36.9 °C).
(+) Ohne Last messen wir eine durchschnittliche Temperatur von 25.5 °C auf der Oberseite. Der Klassendurchschnitt erreicht 30.3 °C.
(+) Die Handballen und der Touchpad-Bereich sind mit gemessenen 29.8 °C kühler als die typische Hauttemperatur und fühlen sich dadurch kühl an.
(±) Die durchschnittliche Handballen-Temperatur anderer getesteter Geräte war 28 °C (-1.8 °C).
| Dell XPS 13 9315 2-in-1 Core i5-1230U Intel Core i5-1230U, Intel Iris Xe Graphics G7 80EUs | Microsoft Surface Pro 8, i7-1185G7 Intel Core i7-1185G7, Intel Iris Xe Graphics G7 96EUs | HP Spectre x360 13.5 14t-ef000 Intel Core i7-1255U, Intel Iris Xe Graphics G7 96EUs | Lenovo ThinkBook Plus Gen2 Core i5 Intel Core i5-1130G7, Intel Iris Xe Graphics G7 80EUs | Apple MacBook Air M2 Entry Apple M2, Apple M2 8-Core GPU | |
|---|---|---|---|---|---|
| Hitze | -2% | 14% | -11% | 1% | |
| Last oben max * (°C) | 41.8 | 45 -8% | 36.4 13% | 42 -0% | 44.5 -6% |
| Last unten max * (°C) | 38.2 | 47.2 -24% | 37 3% | 44.5 -16% | 44.4 -16% |
| Idle oben max * (°C) | 27.4 | 24.1 12% | 20.8 24% | 29.8 -9% | 23.9 13% |
| Idle unten max * (°C) | 27.2 | 23.4 14% | 22.6 17% | 31.9 -17% | 23.6 13% |
* ... kleinere Werte sind besser
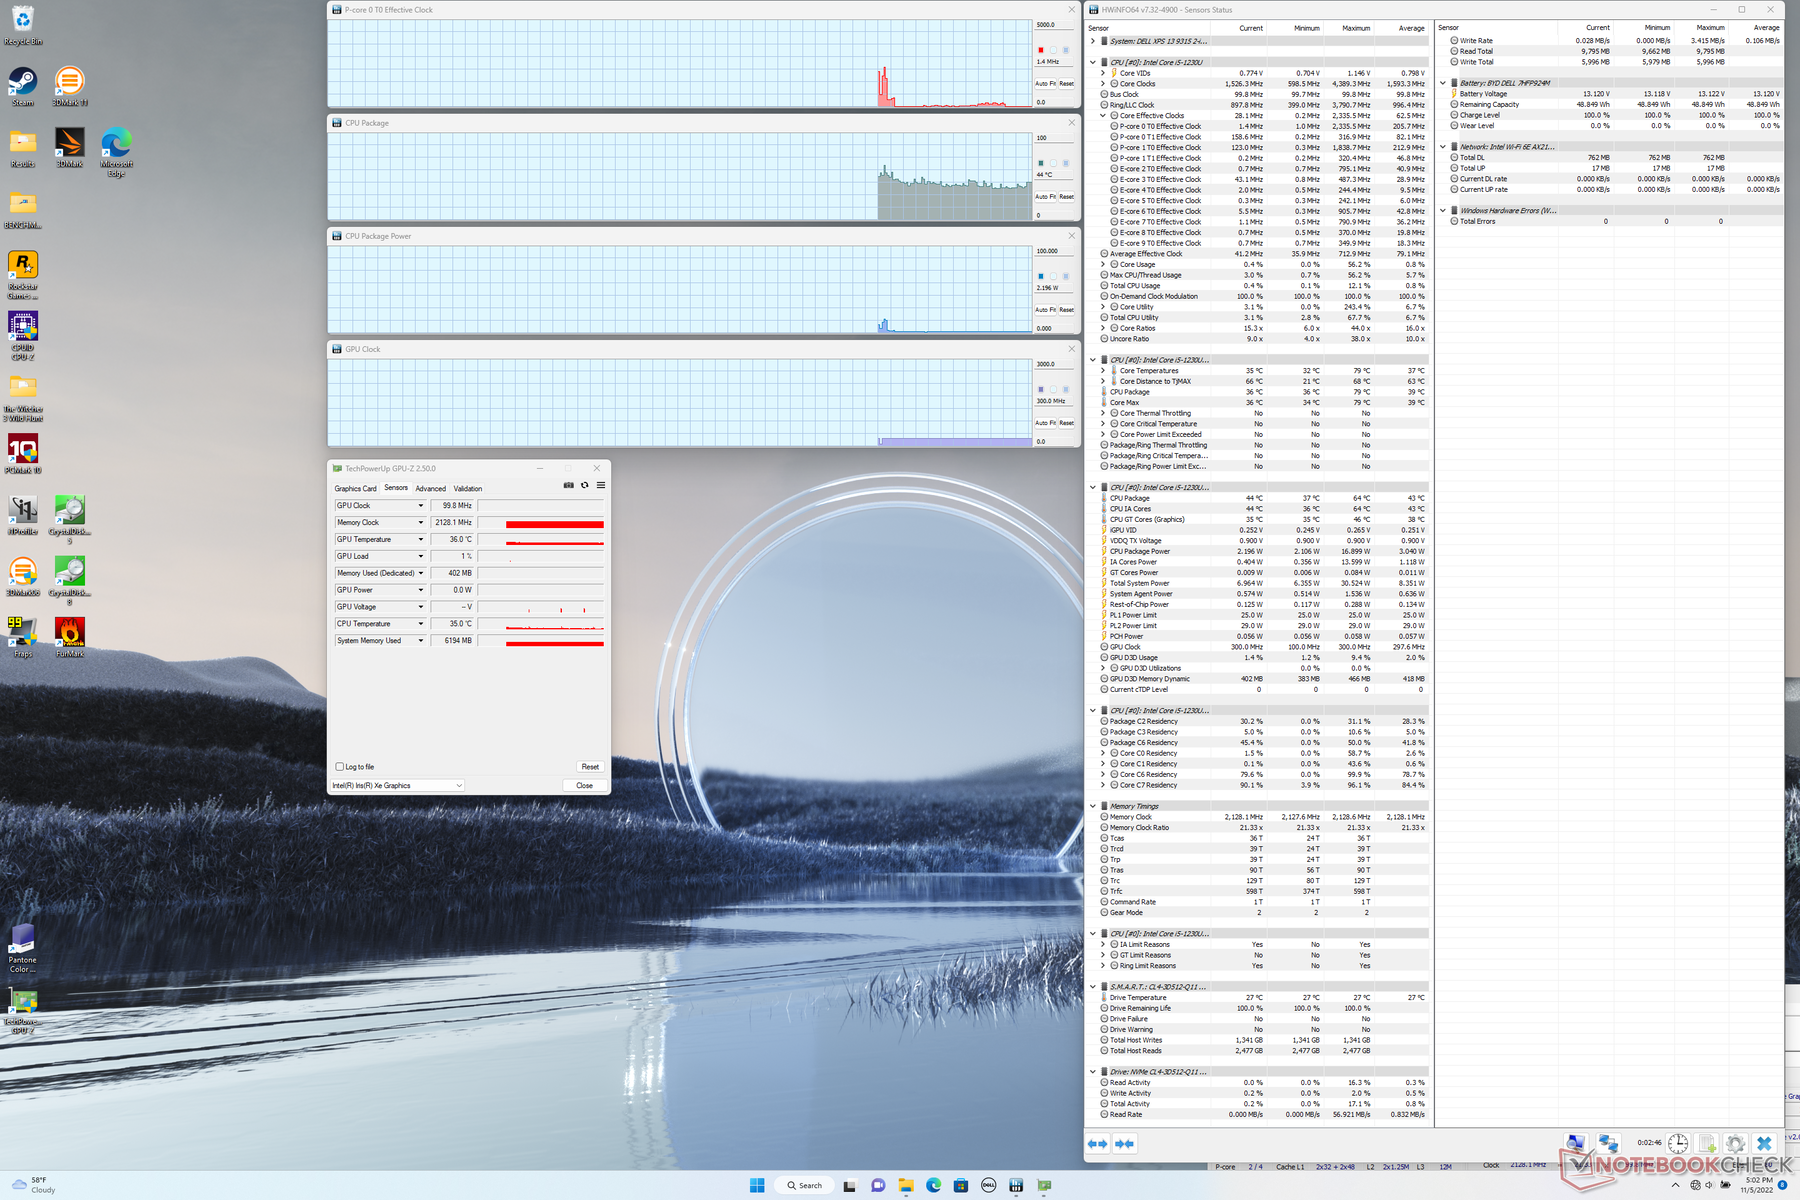
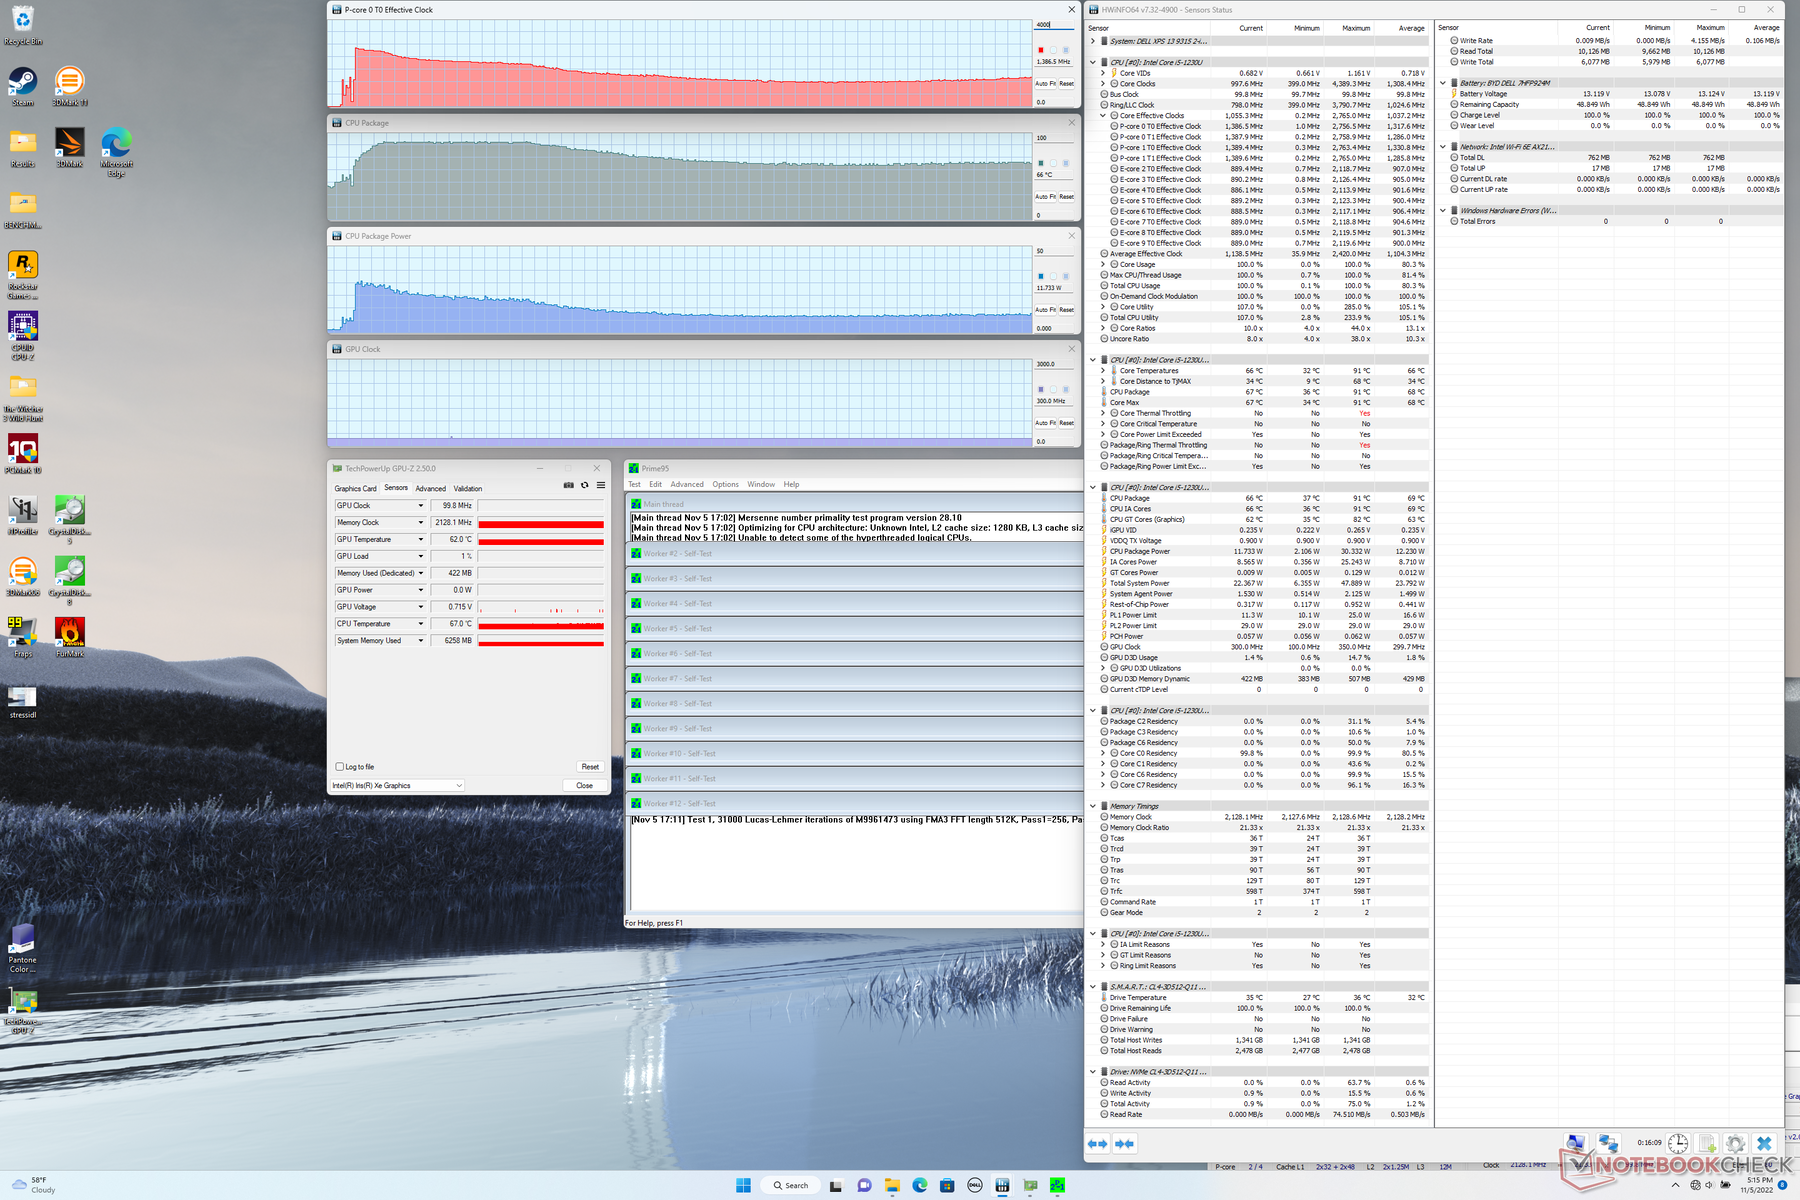
Stresstest
Bei reinem Prime95-Stress boosted die CPU für etwa 20 Sekunden auf 2,7 GHz @29 W, bis die Kerntemperatur 90 °C erreicht. Danach fallen die Taktraten und die Leistungsaufnahme graduell auf 1,4 GHz bzw. 12 W, sodass deutlich kühlere 66 °C erreicht werden. Das war aufgrund des lüfterlosen Designs und des Tablet-Formfaktors nicht unerwartet. Beim luftgekühlten Surface Pro 8 sehen wir hingegen eine CPU-Leistung von 26 W bei gleichen 65 °C.
Der GPU-Takt pendelt sich bei Witcher 3 auf 750 MHz ein, verglichen mit 1.147 MHz des deutlich schnelleren XPS 14 9320 Core i7 Clamshell.
Die CPU-Leistung wird im Akkubetrieb nicht künstlich gedrosselt, sodass 3DMark 11 dabei nahezu gleiche Ergebnisse liefert.


| CPU Clock (GHz) | GPU Clock (MHz) | Average CPU Temperature (°C) | |
| System Idle | -- | -- | 44 |
| Prime95, Stress | 1,4 | -- | 66 |
| Prime95 + FurMark, Stress | 1,0 | 450 | 67 |
| Witcher 3, Stress | ~1,5 | 750 | 68 |
Lautsprecher
Die internen Lautsprecher werden für ein Tablet brauchbar laut, klingen aber weniger ausgeglichen als bei der Konkurrenz. Das Gehäuse vibriert bei höheren Lautstärken nicht, was beim Surface Pro 8 hingegen der Fall ist. Die Stereo-Lautsprecher befinden sich an den Tablet-Seiten und sind demnach nicht direkt zum Nutzer gerichtet. Wenn man das Tablet mit den Händen hält, kann dies jedoch die Lautsprecher verdecken und den Klang dadurch negativ beeinflussen.
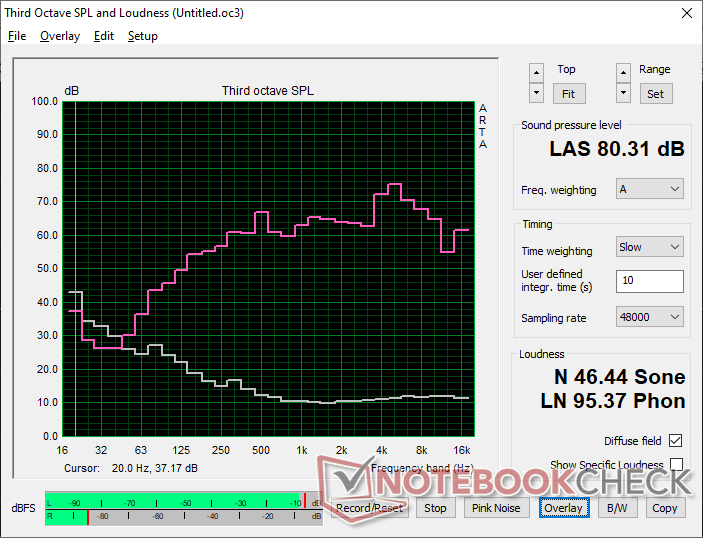
Dell XPS 13 9315 2-in-1 Core i5-1230U Audio Analyse
(±) | Mittelmäßig laut spielende Lautsprecher (80.3 dB)
Bass 100 - 315 Hz
(±) | abgesenkter Bass - 8.9% geringer als der Median
(+) | lineare Bass-Wiedergabe (5.7% Delta zum Vorgänger)
Mitteltöne 400 - 2000 Hz
(+) | ausgeglichene Mitten, vom Median nur 2.2% abweichend
(+) | lineare Mitten (5.2% Delta zum Vorgänger)
Hochtöne 2 - 16 kHz
(±) | zu hohe Hochtöne, vom Median nur 5.5% abweichend
(+) | sehr lineare Hochtöne (6.8% Delta zum Vorgänger)
Gesamt im hörbaren Bereich 100 - 16.000 Hz
(+) | hörbarer Bereich ist sehr linear (11.9% Abstand zum Median
Im Vergleich zu allen Geräten derselben Klasse
» 11% aller getesteten Geräte dieser Klasse waren besser, 3% vergleichbar, 85% schlechter
» Das beste Gerät hat einen Delta-Wert von 6%, durchschnittlich ist 20%, das schlechteste Gerät hat 57%
Im Vergleich zu allen Geräten im Test
» 9% aller getesteten Geräte waren besser, 2% vergleichbar, 89% schlechter
» Das beste Gerät hat einen Delta-Wert von 4%, durchschnittlich ist 24%, das schlechteste Gerät hat 134%
Apple MacBook Pro 16 2021 M1 Pro Audio Analyse
(+) | Die Lautsprecher können relativ laut spielen (84.7 dB)
Bass 100 - 315 Hz
(+) | guter Bass - nur 3.8% Abweichung vom Median
(+) | lineare Bass-Wiedergabe (5.2% Delta zum Vorgänger)
Mitteltöne 400 - 2000 Hz
(+) | ausgeglichene Mitten, vom Median nur 1.3% abweichend
(+) | lineare Mitten (2.1% Delta zum Vorgänger)
Hochtöne 2 - 16 kHz
(+) | ausgeglichene Hochtöne, vom Median nur 1.9% abweichend
(+) | sehr lineare Hochtöne (2.7% Delta zum Vorgänger)
Gesamt im hörbaren Bereich 100 - 16.000 Hz
(+) | hörbarer Bereich ist sehr linear (4.6% Abstand zum Median
Im Vergleich zu allen Geräten derselben Klasse
» 0% aller getesteten Geräte dieser Klasse waren besser, 0% vergleichbar, 100% schlechter
» Das beste Gerät hat einen Delta-Wert von 5%, durchschnittlich ist 17%, das schlechteste Gerät hat 45%
Im Vergleich zu allen Geräten im Test
» 0% aller getesteten Geräte waren besser, 0% vergleichbar, 100% schlechter
» Das beste Gerät hat einen Delta-Wert von 4%, durchschnittlich ist 24%, das schlechteste Gerät hat 134%
Energieverwaltung— Sehr effizientes Dell XPS 13 2-in-1
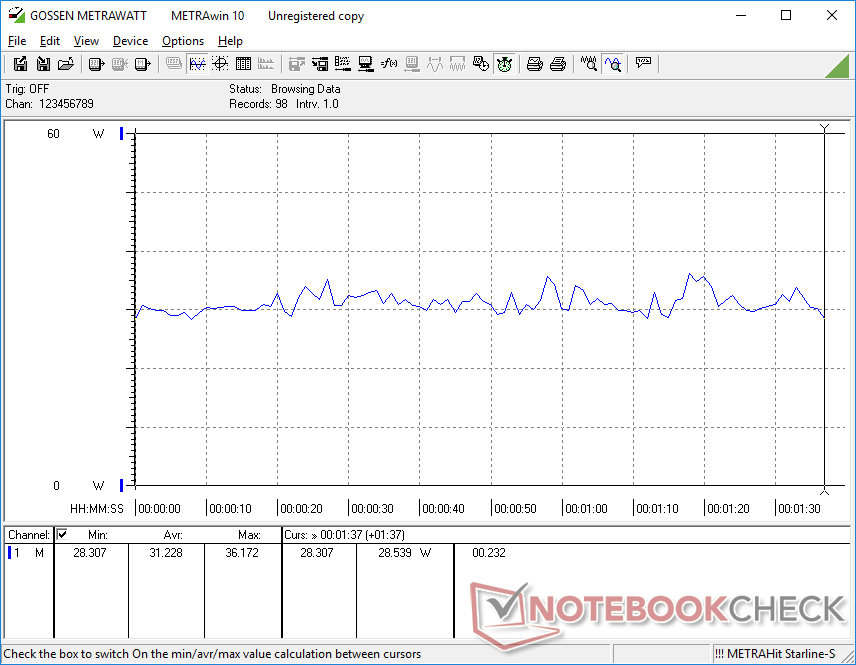
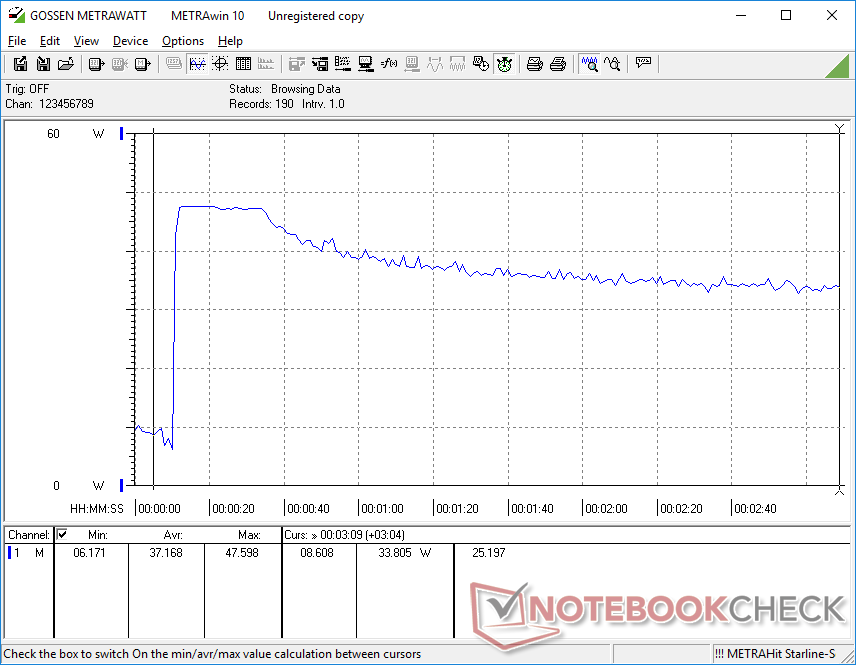
Leistungsaufnahme
Der Leerlauf bei niedrigster Helligkeit benötigt nur 5 W, und die maximale Helligkeitsstufe fordert zusätzliche 3 W. Die Ergebnisse ähneln stark denen des ThinkBook Plus Gen 2 mit gleicher Core-i5-1230U-CPU. Das Surface Pro 8 mit Core i7 zieht unter hohen Lasten über 50 Prozent mehr an Leistung, da es eine deutlich höhere Grafikleistung als unser Dell Testgerät mit Core i5 aufweist.
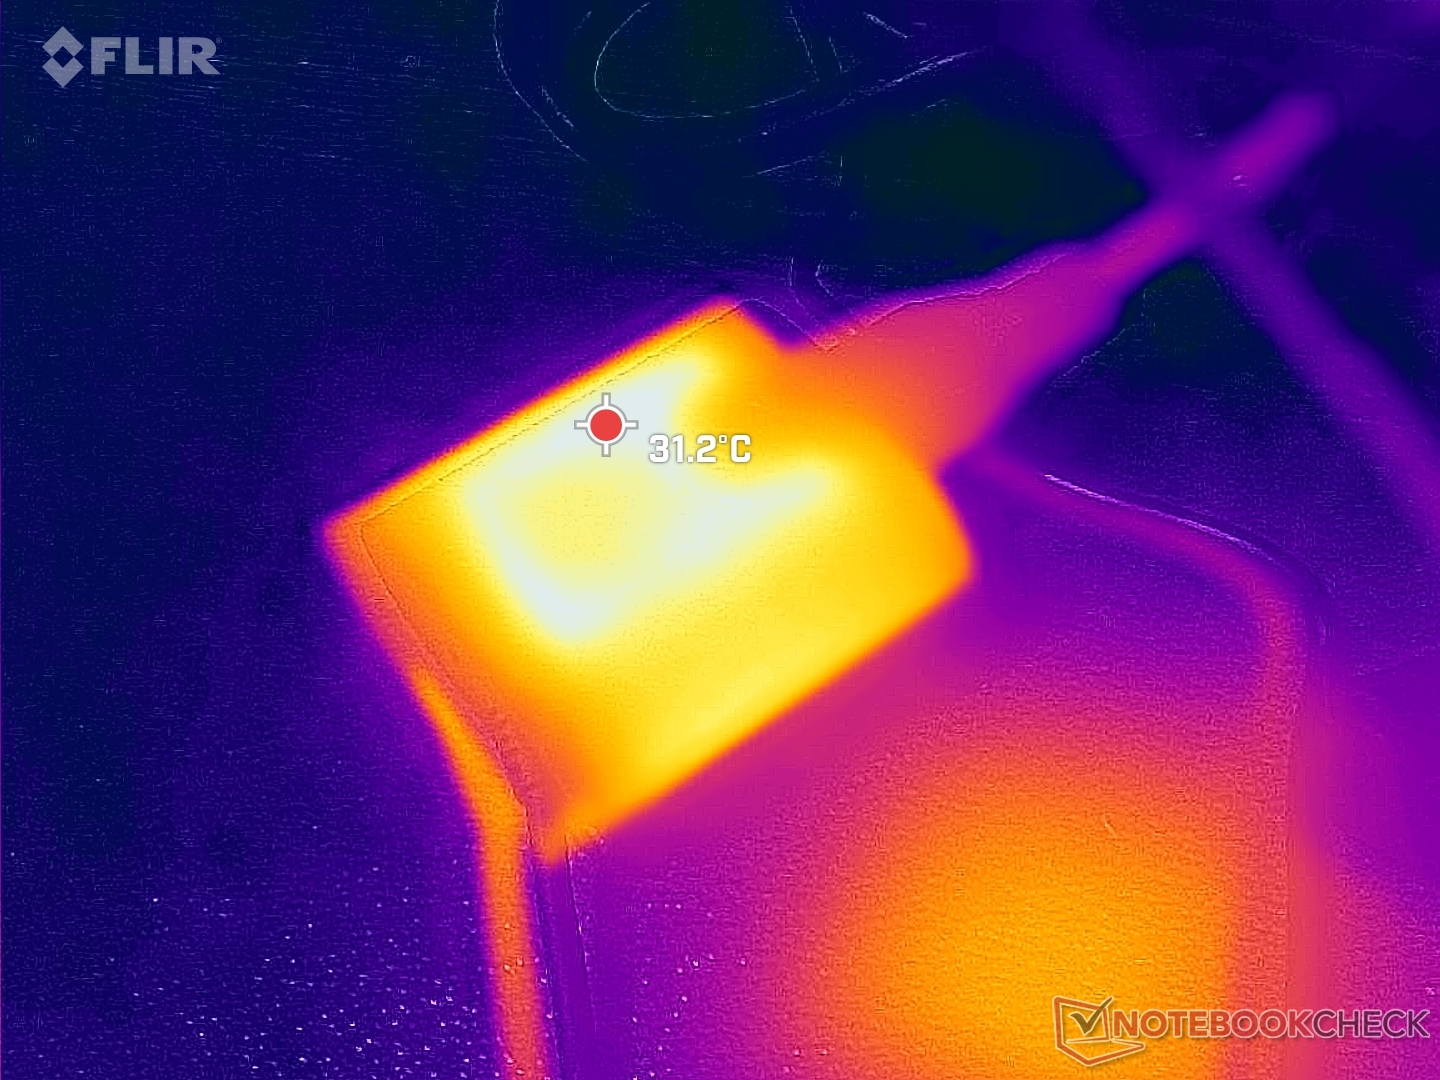
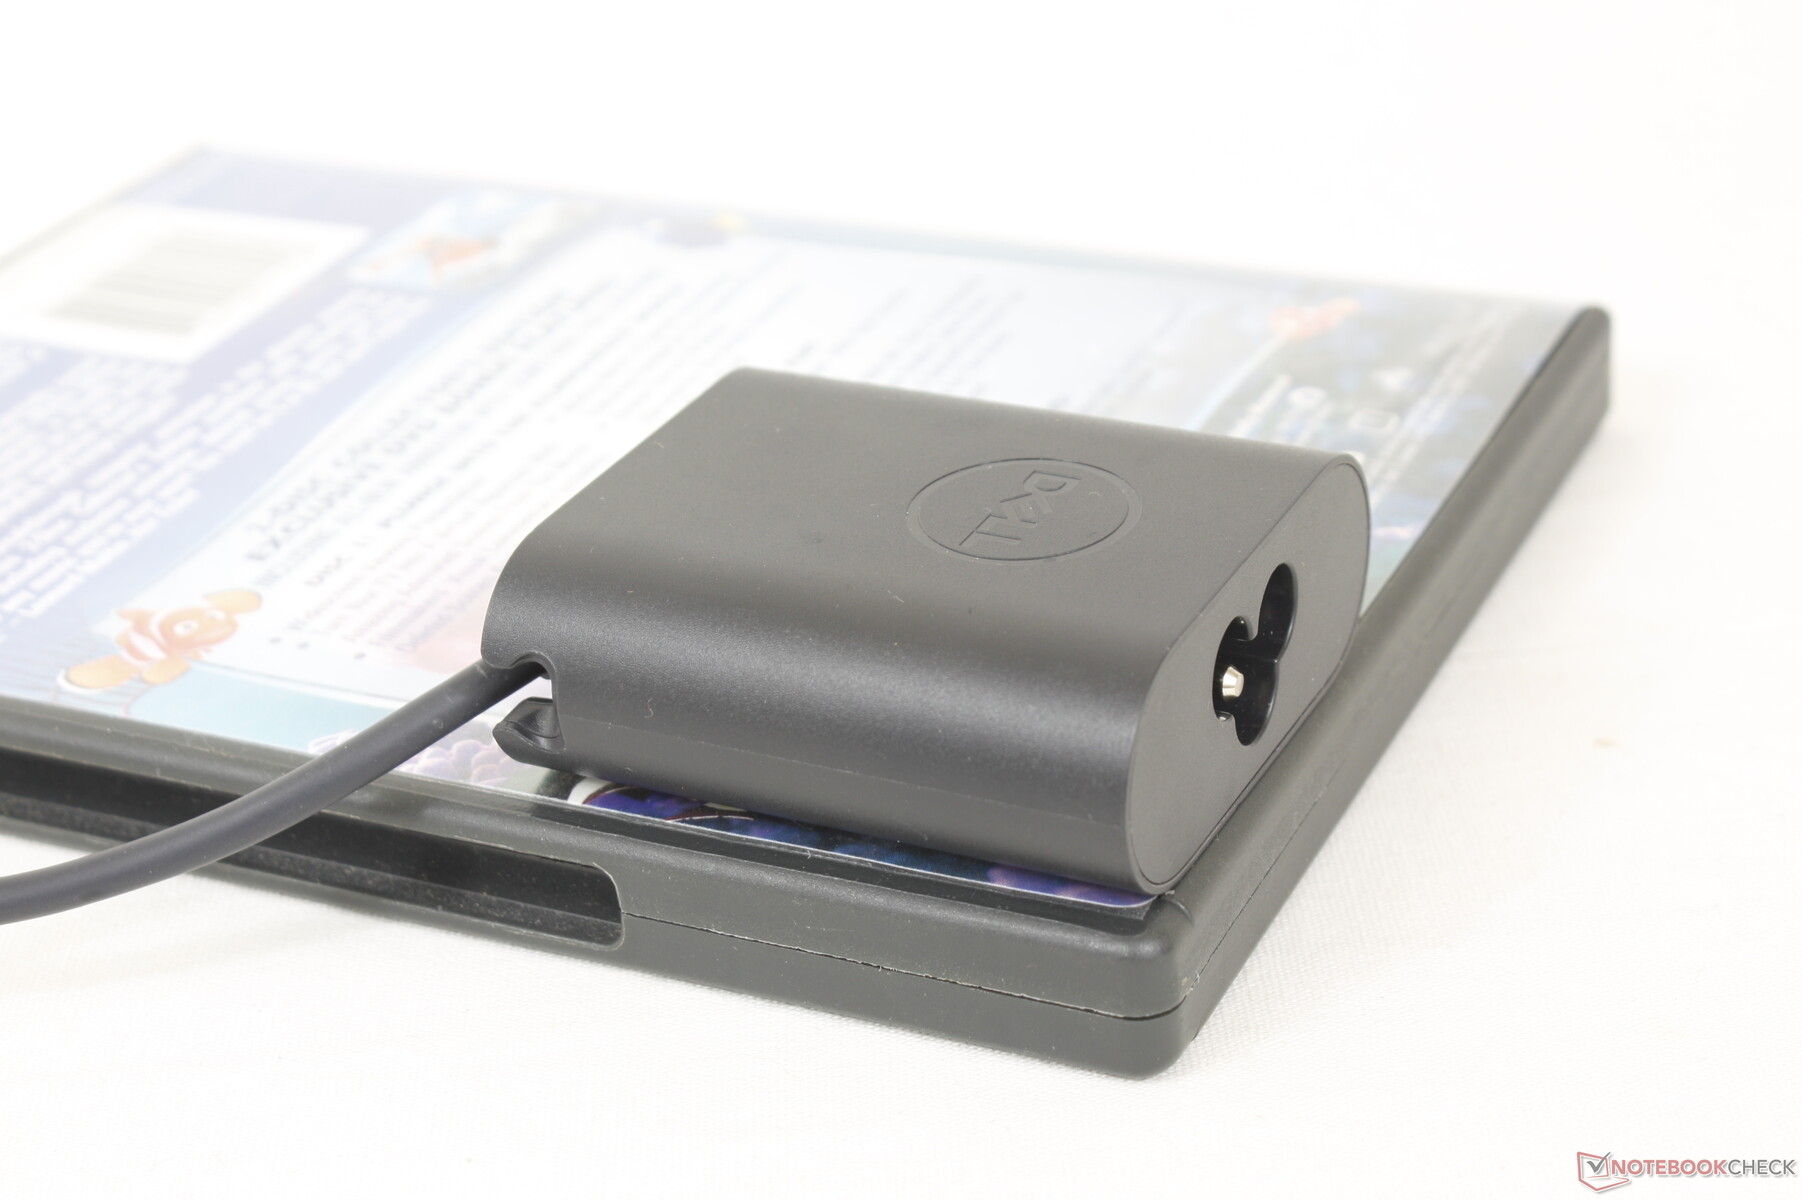
Wir konnten eine maximale Leistungsaufnahme von 48 W beim kleinen (~6 x 5,5 x 2,2 cm) 45-W-USB-C-Netzteil ermitteln. Dieser Wert tritt nur kurzzeitig auf, bis der CPU-Turbo begrenzt wird, wie in der folgenden Grafik zu entnehmen ist.


| Aus / Standby | |
| Idle | |
| Last |
|
Legende:
min: | |
| Dell XPS 13 9315 2-in-1 Core i5-1230U i5-1230U, Iris Xe G7 80EUs, , IPS, 2880x1920, 13" | Dell XPS 13 Plus 9320 i7-1280P OLED i7-1280P, Iris Xe G7 96EUs, WDC PC SN810 512GB, OLED, 3456x2160, 13.4" | Microsoft Surface Pro 8, i7-1185G7 i7-1185G7, Iris Xe G7 96EUs, Toshiba KBG40ZNS256G NVMe, IPS, 2880x1920, 13" | HP Spectre x360 13.5 14t-ef000 i7-1255U, Iris Xe G7 96EUs, Micron 3400 1TB MTFDKBA1T0TFH, OLED, 3000x2000, 13.5" | Lenovo ThinkBook Plus Gen2 Core i5 i5-1130G7, Iris Xe G7 80EUs, Samsung PM9A1 MZVL2512HCJQ, IPS, E-Ink, 2560x1600, 13.3" | Apple MacBook Air M2 Entry M2, M2 8-Core GPU, Apple SSD AP0256Z, IPS, 2560x1664, 13.6" | |
|---|---|---|---|---|---|---|
| Stromverbrauch | -46% | -23% | -19% | -5% | 13% | |
| Idle min * (Watt) | 5.2 | 6.5 -25% | 3.9 25% | 4 23% | 5 4% | 1.87 64% |
| Idle avg * (Watt) | 7.9 | 7.8 1% | 8.5 -8% | 4.9 38% | 7.9 -0% | 9.2 -16% |
| Idle max * (Watt) | 8 | 13 -63% | 9.8 -23% | 12.5 -56% | 8.3 -4% | 9.3 -16% |
| Last avg * (Watt) | 31.2 | 56.6 -81% | 48 -54% | 48.1 -54% | 30.9 1% | 28.5 9% |
| Witcher 3 ultra * (Watt) | 28.2 | 49.2 -74% | 41.5 -47% | 35.8 -27% | 25.2 11% | 27.4 3% |
| Last max * (Watt) | 47.6 | 63 -32% | 63 -32% | 65.2 -37% | 66.8 -40% | 31 35% |
* ... kleinere Werte sind besser
Energieaufnahme Witcher 3 / Stresstest
Energieaufnahme mit externem Monitor
Akkulaufzeit
Der 49,5-Wh-Akku ist nur etwas kleiner als die 51,5-Wh- und 53-Wh-Akkus im Surface Pro 8 respektive dem ThinkBook Plus Gen 2. Die Laufzeiten sind dafür herausragend mit nahezu neun Stunden realem Surfen, verglichen mit ~8 Stunden der zuvor genannten Microsoft- und Lenovo Alternativen.
Das vollständige Aufladen des Akkus dauert etwa 2 bis 2,5 Stunden.
| Dell XPS 13 9315 2-in-1 Core i5-1230U i5-1230U, Iris Xe G7 80EUs, 49.5 Wh | Dell XPS 13 Plus 9320 i7-1280P OLED i7-1280P, Iris Xe G7 96EUs, 55 Wh | Microsoft Surface Pro 8, i7-1185G7 i7-1185G7, Iris Xe G7 96EUs, 51.5 Wh | HP Spectre x360 13.5 14t-ef000 i7-1255U, Iris Xe G7 96EUs, 66 Wh | Lenovo ThinkBook Plus Gen2 Core i5 i5-1130G7, Iris Xe G7 80EUs, 53 Wh | Apple MacBook Air M2 Entry M2, M2 8-Core GPU, 52.6 Wh | |
|---|---|---|---|---|---|---|
| Akkulaufzeit | -36% | -28% | 16% | -16% | 45% | |
| Idle (h) | 13.6 | 20.4 50% | ||||
| WLAN (h) | 9 | 5.8 -36% | 7.6 -16% | 8 -11% | 7.6 -16% | 15.2 69% |
| Last (h) | 2 | 1.2 -40% | 2.2 10% | 2.4 20% | ||
| H.264 (h) | 10.1 | 16.5 |
Pro
Contra
Fazit — Dell XPS Tablet oder Microsoft Surface Pro?
Das XPS 13 9315 2-in-1 ist der bisher schärfste Konkurrent zur Microsoft-Surface-Pro-Serie. Manches meistert es besser als das Microsoft Modell, einiges wurde hingegen schlechter umgesetzt. Die abnehmbare Tastatur-Einheit liefert einen festeren Tastenanschlag, ein größeres Clickpad und einen besseren Schutz gegen Kratzer. Zudem ist das Tablet dünner und leichter als das Surface Pro 8, ohne drastisch an Prozessorleistung einzubüßen. Der Core i5-1230U im Dell Laptop arbeitet trotz lüfterlosem Design sogar auf demselben Niveau wie der Core i7-1185G7 im Surface Pro 8. Der Hersteller verspricht für die nahe Zukunft 5G-eSIM-Modelle, während solche beim Surface Pro 8 zum Zeitpunkt der Veröffentlichung dieses Tests nicht existieren.
Dennoch existieren so einige Gründe, das Microsoft Tablet statt das Dell zu wählen. Zum einen kommt das Surface Pro 8 mit einer 3,5-mm-Audio-Buchse, die einige Anwender dankbar annehmen. Die Grafikleistung ist ebenso deutlich höher, da die GPU im Dell drosselt und daher sogar schlechter abschneidet als die gleiche GPU in anderen Laptops. Die fehlende Option auf ein 120-Hz-Display merkt man wohl am deutlichsten, da es das Dell im Vergleich schwerfälliger und weniger responsiv erscheinen lässt. In der Vergangenheit wäre die Begrenzung auf 60 Hz kein großes Problem gewesen, aber es wird immer mehr zum Handicap, da hohe Refresh-Rates in Laptops, Monitoren und Smartphones zum Standard werden.
Ein Surface Pro ohne den Surface-Pro-Namen. Das XPS 13 9315 2-in-1 übertrifft das Microsoft Surface Pro Type Cover in Bezug auf Tipp-Komfort, aber der 60-Hz-Touchscreen sieht neben den 120 Hz des Surface Pro 8 alt aus.
Falls man viel schreibt und E-Mails versendet, könnte das XPS 13 9315 2-in-1 die bessere Option darstellen, da es über ein besseres Tastatur-Dock verfügt. Wenn man jedoch häufiger den Touchscreen im Tablet-Modus verwendet, dann kommt man an der höheren Bildwiederholrate und Ansprechverhalten des Surface Pro Displays kaum herum. Falls Dell in Zukunft zusätzliche Display-Optionen anbieten sollte, wäre das XPS 13 9315 2-in-1 für viele Anwendungsfelder eine deutlich sicherere Empfehlung.
Preis und Verfügbarkeit
Dells XPS 13 9315 2-in-1 wird am 14. November in großer Stückzahl verfügbar. Bei Amazon lässt sich bisher lediglich das XPS 13 9320 Clamshell-Modell für 1.499 Euro erwerben. Die beste Anlaufstelle ist momentan Dells eigener Online-Shop, in welchem unser Testmodell 1.419 Euro kostet, sogar inklusive dem teuren Tastatur-Cover, aber ohne Eingabestift.
Dell XPS 13 9315 2-in-1 Core i5-1230U
- 08.11.2022 v7 (old)
Allen Ngo
Preisvergleich

